Cape Girardeau, MO Map & Demographics
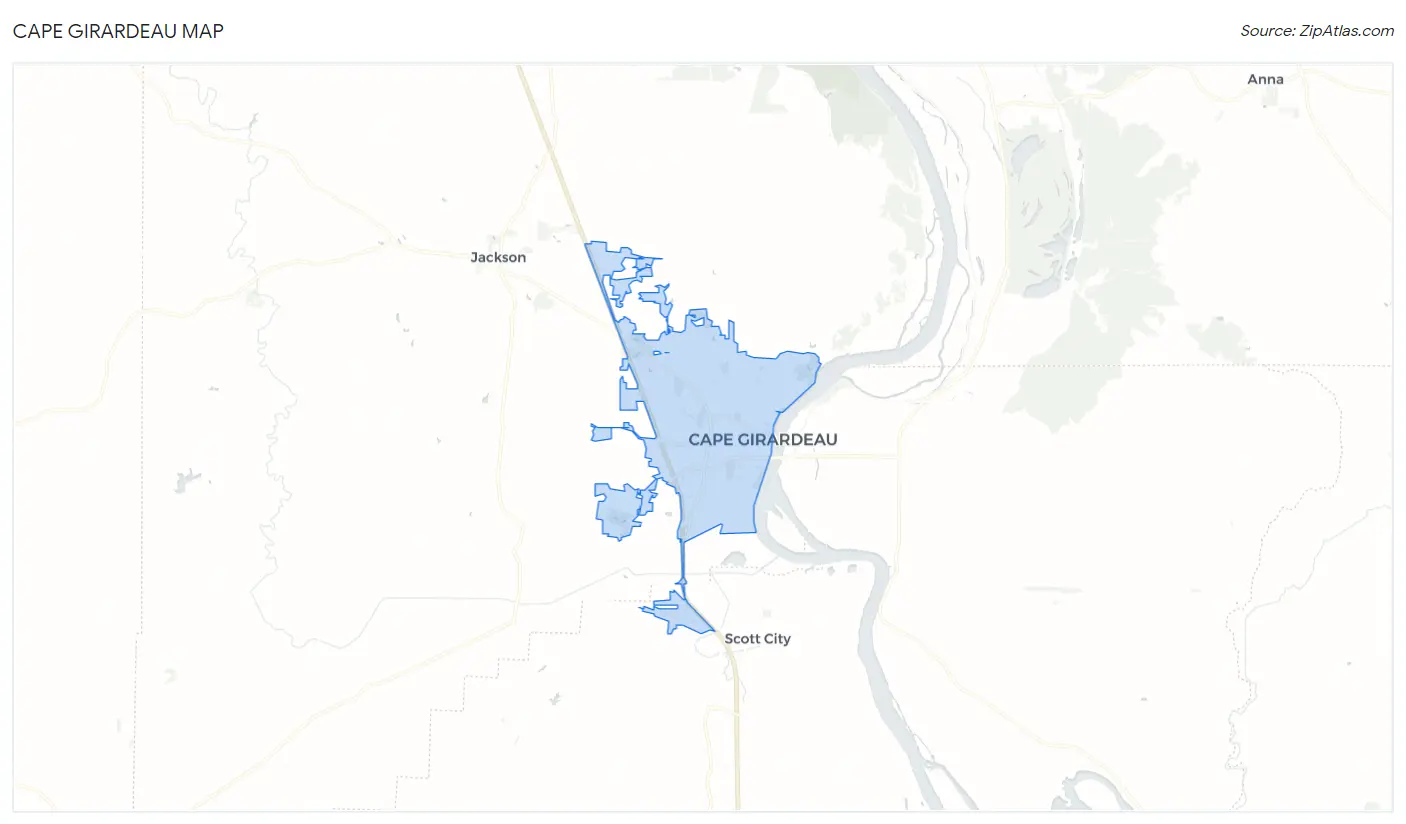
Cape Girardeau Map
Cape Girardeau Overview
$29,907
PER CAPITA INCOME
$74,882
AVG FAMILY INCOME
$51,671
AVG HOUSEHOLD INCOME
21.8%
WAGE / INCOME GAP [ % ]
78.2¢/ $1
WAGE / INCOME GAP [ $ ]
$10,367
FAMILY INCOME DEFICIT
0.47
INEQUALITY / GINI INDEX
39,795
TOTAL POPULATION
19,043
MALE POPULATION
20,752
FEMALE POPULATION
91.76
MALES / 100 FEMALES
108.97
FEMALES / 100 MALES
33.6
MEDIAN AGE
3.0
AVG FAMILY SIZE
2.3
AVG HOUSEHOLD SIZE
20,541
LABOR FORCE [ PEOPLE ]
61.5%
PERCENT IN LABOR FORCE
3.4%
UNEMPLOYMENT RATE
Cape Girardeau Area Codes
Income in Cape Girardeau
Income Overview in Cape Girardeau
Per Capita Income in Cape Girardeau is $29,907, while median incomes of families and households are $74,882 and $51,671 respectively.
| Characteristic | Number | Measure |
| Per Capita Income | 39,795 | $29,907 |
| Median Family Income | 8,127 | $74,882 |
| Mean Family Income | 8,127 | $93,828 |
| Median Household Income | 15,865 | $51,671 |
| Mean Household Income | 15,865 | $72,307 |
| Income Deficit | 8,127 | $10,367 |
| Wage / Income Gap (%) | 39,795 | 21.82% |
| Wage / Income Gap ($) | 39,795 | 78.18¢ per $1 |
| Gini / Inequality Index | 39,795 | 0.47 |
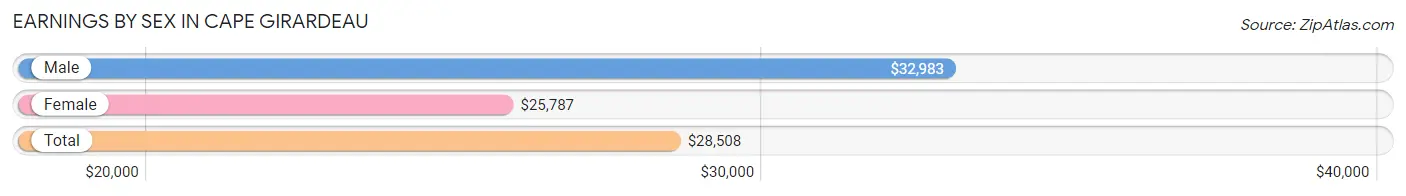
Earnings by Sex in Cape Girardeau
Average Earnings in Cape Girardeau are $28,508, $32,983 for men and $25,787 for women, a difference of 21.8%.
| Sex | Number | Average Earnings |
| Male | 10,461 (48.4%) | $32,983 |
| Female | 11,130 (51.5%) | $25,787 |
| Total | 21,591 (100.0%) | $28,508 |
Earnings by Sex by Income Bracket in Cape Girardeau
The most common earnings brackets in Cape Girardeau are $100,000+ for men (1,250 | 11.9%) and $25,000 to $29,999 for women (996 | 8.9%).
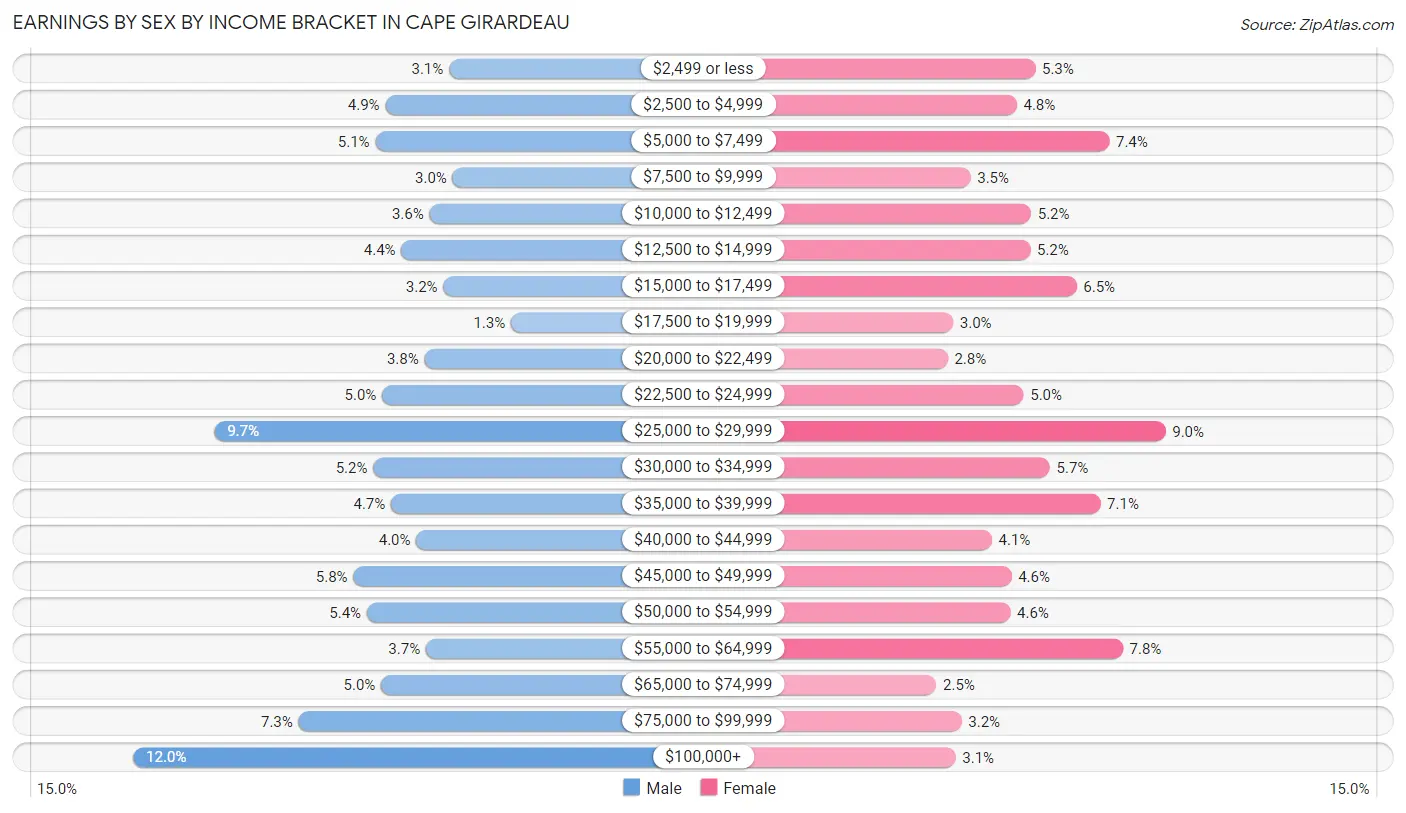
| Income | Male | Female |
| $2,499 or less | 321 (3.1%) | 589 (5.3%) |
| $2,500 to $4,999 | 508 (4.9%) | 531 (4.8%) |
| $5,000 to $7,499 | 538 (5.1%) | 820 (7.4%) |
| $7,500 to $9,999 | 311 (3.0%) | 386 (3.5%) |
| $10,000 to $12,499 | 379 (3.6%) | 575 (5.2%) |
| $12,500 to $14,999 | 461 (4.4%) | 573 (5.1%) |
| $15,000 to $17,499 | 338 (3.2%) | 718 (6.5%) |
| $17,500 to $19,999 | 139 (1.3%) | 332 (3.0%) |
| $20,000 to $22,499 | 393 (3.8%) | 315 (2.8%) |
| $22,500 to $24,999 | 518 (5.0%) | 552 (5.0%) |
| $25,000 to $29,999 | 1,012 (9.7%) | 996 (8.9%) |
| $30,000 to $34,999 | 544 (5.2%) | 634 (5.7%) |
| $35,000 to $39,999 | 492 (4.7%) | 792 (7.1%) |
| $40,000 to $44,999 | 417 (4.0%) | 453 (4.1%) |
| $45,000 to $49,999 | 603 (5.8%) | 514 (4.6%) |
| $50,000 to $54,999 | 563 (5.4%) | 511 (4.6%) |
| $55,000 to $64,999 | 389 (3.7%) | 863 (7.7%) |
| $65,000 to $74,999 | 521 (5.0%) | 279 (2.5%) |
| $75,000 to $99,999 | 764 (7.3%) | 358 (3.2%) |
| $100,000+ | 1,250 (11.9%) | 339 (3.0%) |
| Total | 10,461 (100.0%) | 11,130 (100.0%) |
Earnings by Sex by Educational Attainment in Cape Girardeau
Average earnings in Cape Girardeau are $45,782 for men and $33,814 for women, a difference of 26.1%. Men with an educational attainment of graduate degree enjoy the highest average annual earnings of $58,902, while those with less than high school education earn the least with $26,210. Women with an educational attainment of graduate degree earn the most with the average annual earnings of $49,314, while those with less than high school education have the smallest earnings of $11,783.
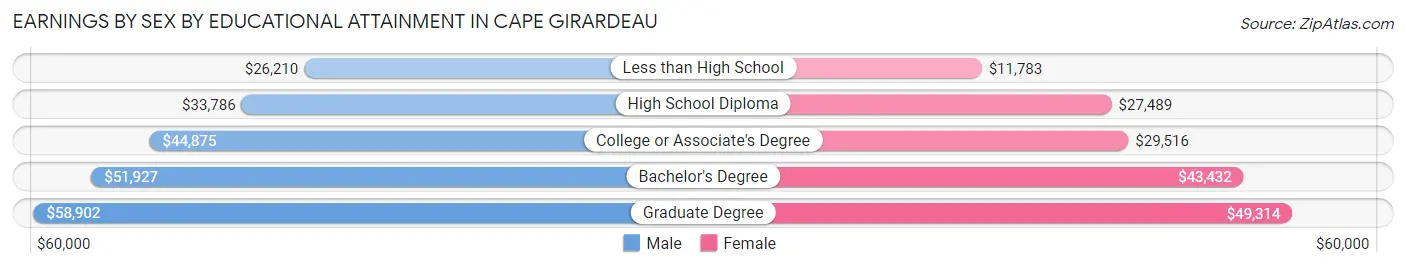
| Educational Attainment | Male Income | Female Income |
| Less than High School | $26,210 | $11,783 |
| High School Diploma | $33,786 | $27,489 |
| College or Associate's Degree | $44,875 | $29,516 |
| Bachelor's Degree | $51,927 | $43,432 |
| Graduate Degree | $58,902 | $49,314 |
| Total | $45,782 | $33,814 |
Family Income in Cape Girardeau
Family Income Brackets in Cape Girardeau
According to the Cape Girardeau family income data, there are 1,682 families falling into the $100,000 to $149,999 income range, which is the most common income bracket and makes up 20.7% of all families. Conversely, the $10,000 to $14,999 income bracket is the least frequent group with only 211 families (2.6%) belonging to this category.
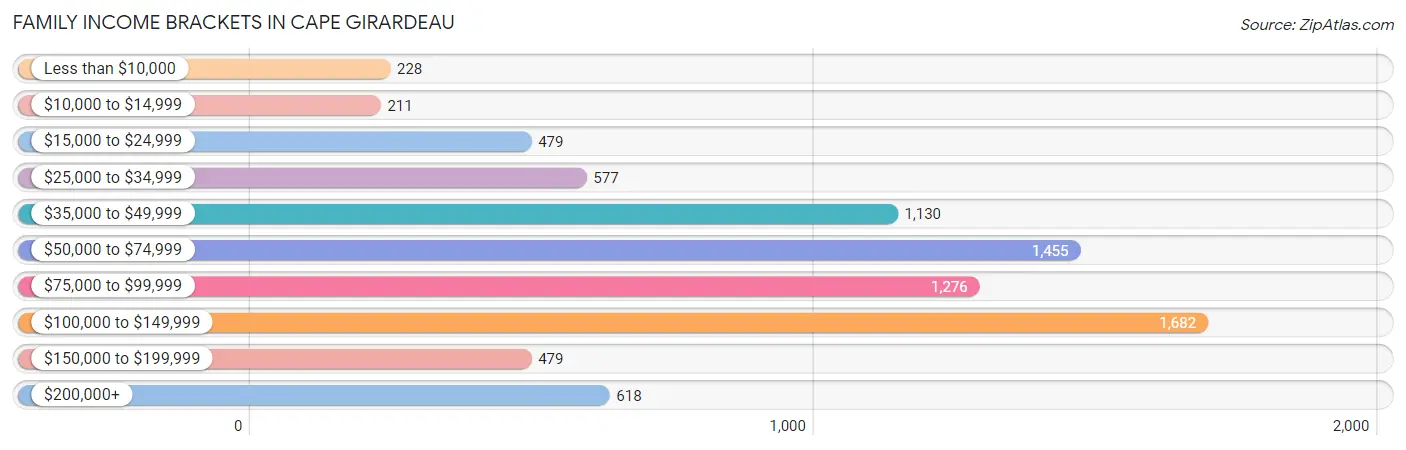
| Income Bracket | # Families | % Families |
| Less than $10,000 | 228 | 2.8% |
| $10,000 to $14,999 | 211 | 2.6% |
| $15,000 to $24,999 | 479 | 5.9% |
| $25,000 to $34,999 | 577 | 7.1% |
| $35,000 to $49,999 | 1,130 | 13.9% |
| $50,000 to $74,999 | 1,455 | 17.9% |
| $75,000 to $99,999 | 1,276 | 15.7% |
| $100,000 to $149,999 | 1,682 | 20.7% |
| $150,000 to $199,999 | 479 | 5.9% |
| $200,000+ | 618 | 7.6% |
Family Income by Famaliy Size in Cape Girardeau
4-person families (1,446 | 17.8%) account for the highest median family income in Cape Girardeau with $96,216 per family, while 2-person families (4,344 | 53.4%) have the highest median income of $34,472 per family member.
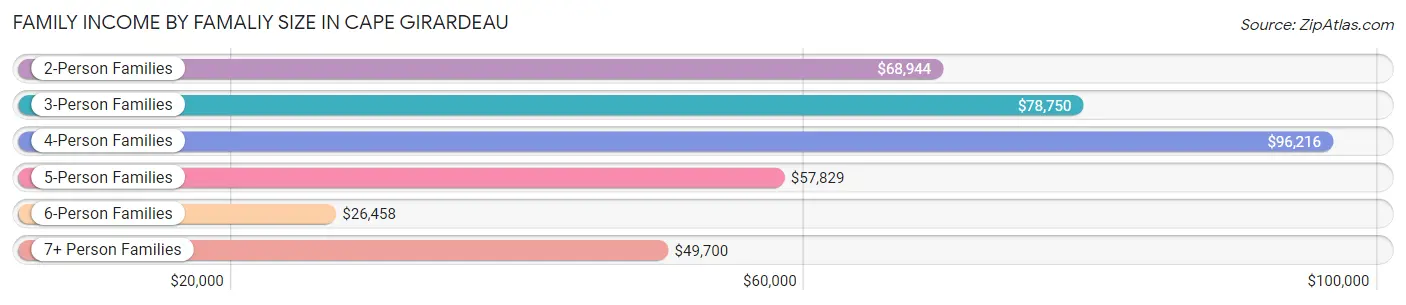
| Income Bracket | # Families | Median Income |
| 2-Person Families | 4,344 (53.4%) | $68,944 |
| 3-Person Families | 1,771 (21.8%) | $78,750 |
| 4-Person Families | 1,446 (17.8%) | $96,216 |
| 5-Person Families | 386 (4.8%) | $57,829 |
| 6-Person Families | 136 (1.7%) | $26,458 |
| 7+ Person Families | 44 (0.5%) | $49,700 |
| Total | 8,127 (100.0%) | $74,882 |
Family Income by Number of Earners in Cape Girardeau
The median family income in Cape Girardeau is $74,882, with families comprising 3+ earners (714) having the highest median family income of $120,641, while families with 1 earner (2,288) have the lowest median family income of $45,813, accounting for 8.8% and 28.1% of families, respectively.
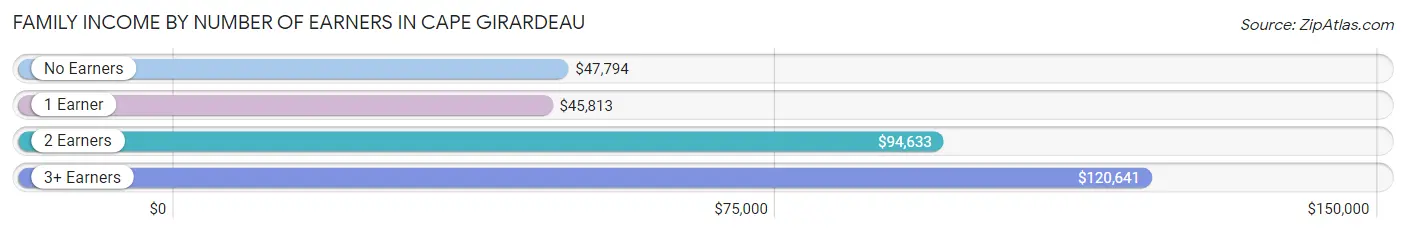
| Number of Earners | # Families | Median Income |
| No Earners | 1,346 (16.6%) | $47,794 |
| 1 Earner | 2,288 (28.1%) | $45,813 |
| 2 Earners | 3,779 (46.5%) | $94,633 |
| 3+ Earners | 714 (8.8%) | $120,641 |
| Total | 8,127 (100.0%) | $74,882 |
Household Income in Cape Girardeau
Household Income Brackets in Cape Girardeau
With 2,729 households falling in the category, the $50,000 to $74,999 income range is the most frequent in Cape Girardeau, accounting for 17.2% of all households. In contrast, only 539 households (3.4%) fall into the $150,000 to $199,999 income bracket, making it the least populous group.
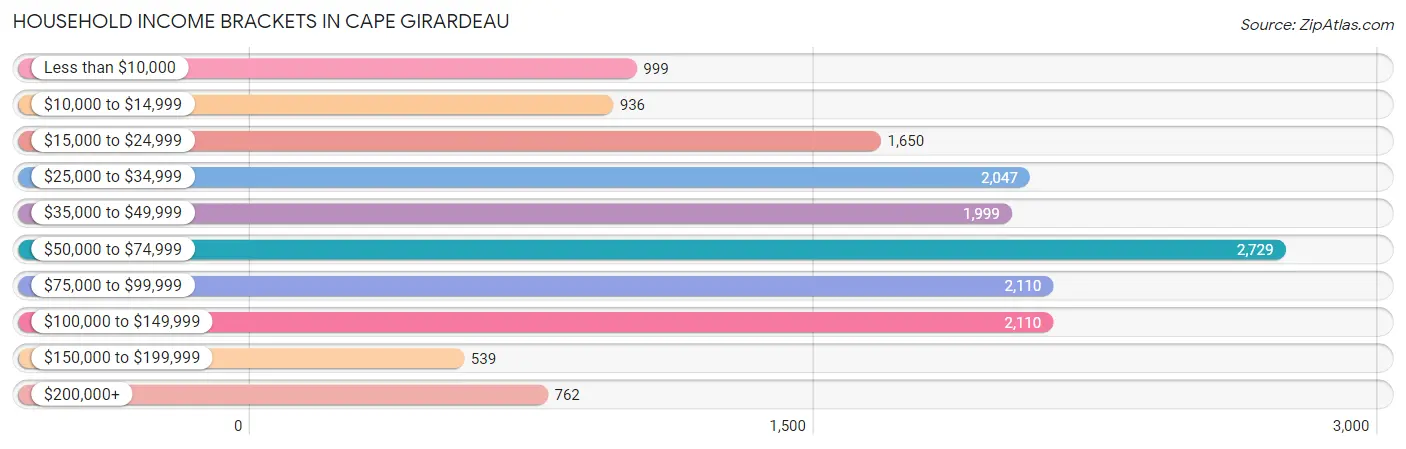
| Income Bracket | # Households | % Households |
| Less than $10,000 | 999 | 6.3% |
| $10,000 to $14,999 | 936 | 5.9% |
| $15,000 to $24,999 | 1,650 | 10.4% |
| $25,000 to $34,999 | 2,047 | 12.9% |
| $35,000 to $49,999 | 1,999 | 12.6% |
| $50,000 to $74,999 | 2,729 | 17.2% |
| $75,000 to $99,999 | 2,110 | 13.3% |
| $100,000 to $149,999 | 2,110 | 13.3% |
| $150,000 to $199,999 | 539 | 3.4% |
| $200,000+ | 762 | 4.8% |
Household Income by Householder Age in Cape Girardeau
The median household income in Cape Girardeau is $51,671, with the highest median household income of $68,098 found in the 45 to 64 years age bracket for the primary householder. A total of 4,556 households (28.7%) fall into this category. Meanwhile, the 15 to 24 years age bracket for the primary householder has the lowest median household income of $27,735, with 1,841 households (11.6%) in this group.
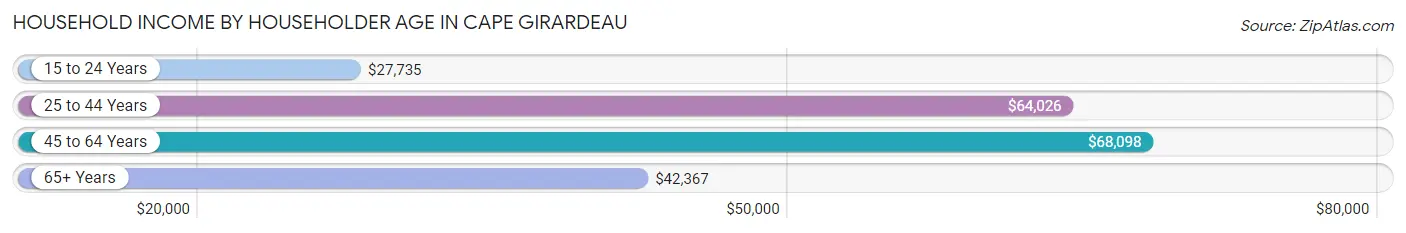
| Income Bracket | # Households | Median Income |
| 15 to 24 Years | 1,841 (11.6%) | $27,735 |
| 25 to 44 Years | 4,937 (31.1%) | $64,026 |
| 45 to 64 Years | 4,556 (28.7%) | $68,098 |
| 65+ Years | 4,531 (28.6%) | $42,367 |
| Total | 15,865 (100.0%) | $51,671 |
Poverty in Cape Girardeau
Income Below Poverty by Sex and Age in Cape Girardeau
With 21.6% poverty level for males and 21.7% for females among the residents of Cape Girardeau, 18 to 24 year old males and 12 to 14 year old females are the most vulnerable to poverty, with 1,275 males (41.6%) and 339 females (50.2%) in their respective age groups living below the poverty level.
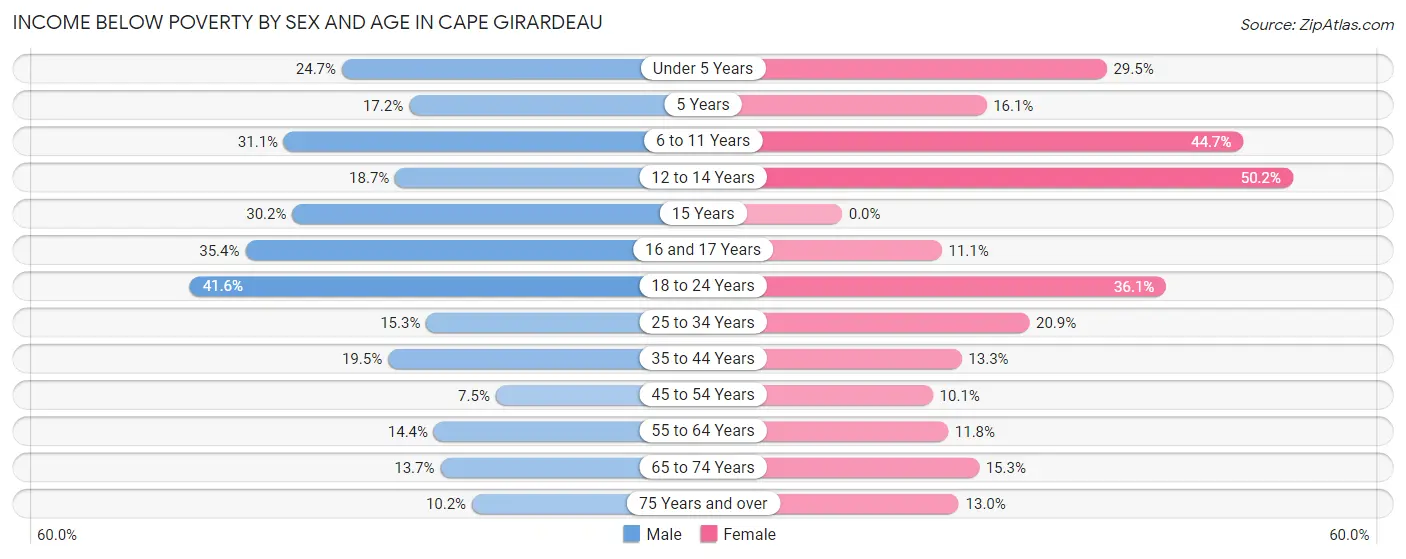
| Age Bracket | Male | Female |
| Under 5 Years | 260 (24.7%) | 298 (29.5%) |
| 5 Years | 11 (17.2%) | 23 (16.1%) |
| 6 to 11 Years | 464 (31.1%) | 452 (44.7%) |
| 12 to 14 Years | 74 (18.7%) | 339 (50.2%) |
| 15 Years | 64 (30.2%) | 0 (0.0%) |
| 16 and 17 Years | 102 (35.4%) | 45 (11.1%) |
| 18 to 24 Years | 1,275 (41.6%) | 1,214 (36.1%) |
| 25 to 34 Years | 373 (15.3%) | 508 (20.8%) |
| 35 to 44 Years | 426 (19.5%) | 263 (13.3%) |
| 45 to 54 Years | 124 (7.5%) | 184 (10.1%) |
| 55 to 64 Years | 297 (14.4%) | 251 (11.8%) |
| 65 to 74 Years | 224 (13.7%) | 311 (15.2%) |
| 75 Years and over | 113 (10.2%) | 247 (13.0%) |
| Total | 3,807 (21.6%) | 4,135 (21.7%) |
Income Above Poverty by Sex and Age in Cape Girardeau
According to the poverty statistics in Cape Girardeau, males aged 45 to 54 years and females aged 15 years are the age groups that are most secure financially, with 92.5% of males and 100.0% of females in these age groups living above the poverty line.
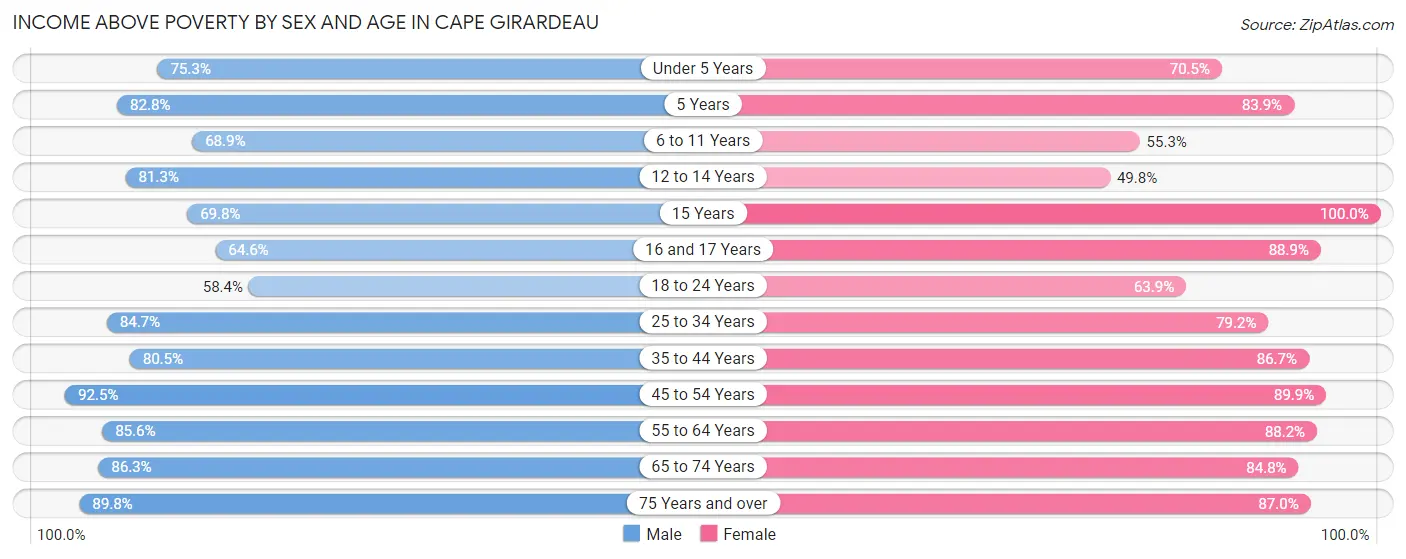
| Age Bracket | Male | Female |
| Under 5 Years | 794 (75.3%) | 713 (70.5%) |
| 5 Years | 53 (82.8%) | 120 (83.9%) |
| 6 to 11 Years | 1,027 (68.9%) | 559 (55.3%) |
| 12 to 14 Years | 321 (81.3%) | 336 (49.8%) |
| 15 Years | 148 (69.8%) | 153 (100.0%) |
| 16 and 17 Years | 186 (64.6%) | 360 (88.9%) |
| 18 to 24 Years | 1,789 (58.4%) | 2,147 (63.9%) |
| 25 to 34 Years | 2,069 (84.7%) | 1,929 (79.1%) |
| 35 to 44 Years | 1,755 (80.5%) | 1,712 (86.7%) |
| 45 to 54 Years | 1,523 (92.5%) | 1,634 (89.9%) |
| 55 to 64 Years | 1,763 (85.6%) | 1,874 (88.2%) |
| 65 to 74 Years | 1,411 (86.3%) | 1,728 (84.8%) |
| 75 Years and over | 997 (89.8%) | 1,652 (87.0%) |
| Total | 13,836 (78.4%) | 14,917 (78.3%) |
Income Below Poverty Among Married-Couple Families in Cape Girardeau
The poverty statistics for married-couple families in Cape Girardeau show that 7.5% or 466 of the total 6,245 families live below the poverty line. Families with 3 or 4 children have the highest poverty rate of 41.6%, comprising of 136 families. On the other hand, families with no children have the lowest poverty rate of 3.3%, which includes 128 families.
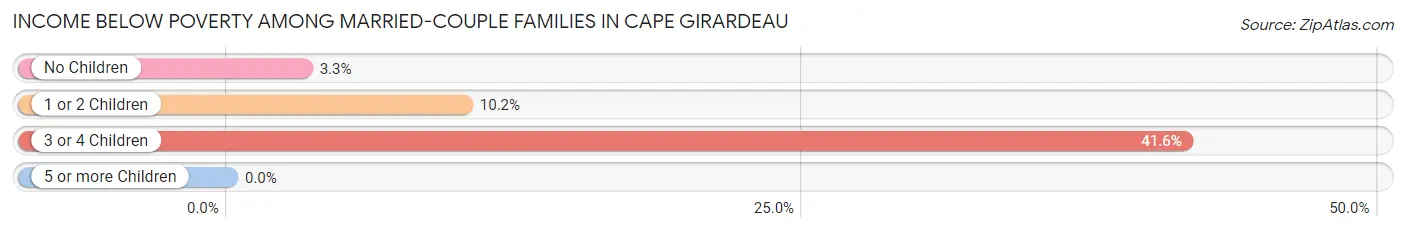
| Children | Above Poverty | Below Poverty |
| No Children | 3,814 (96.8%) | 128 (3.3%) |
| 1 or 2 Children | 1,774 (89.8%) | 202 (10.2%) |
| 3 or 4 Children | 191 (58.4%) | 136 (41.6%) |
| 5 or more Children | 0 (0.0%) | 0 (0.0%) |
| Total | 5,779 (92.5%) | 466 (7.5%) |
Income Below Poverty Among Single-Parent Households in Cape Girardeau
According to the poverty data in Cape Girardeau, 16.1% or 56 single-father households and 27.3% or 419 single-mother households are living below the poverty line. Among single-father households, those with 5 or more children have the highest poverty rate, with 16 households (100.0%) experiencing poverty. Likewise, among single-mother households, those with 5 or more children have the highest poverty rate, with 11 households (78.6%) falling below the poverty line.
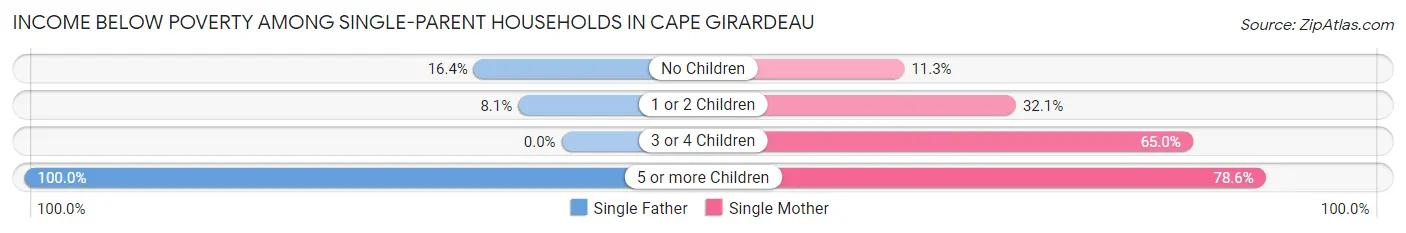
| Children | Single Father | Single Mother |
| No Children | 26 (16.4%) | 83 (11.3%) |
| 1 or 2 Children | 14 (8.1%) | 182 (32.1%) |
| 3 or 4 Children | 0 (0.0%) | 143 (65.0%) |
| 5 or more Children | 16 (100.0%) | 11 (78.6%) |
| Total | 56 (16.1%) | 419 (27.3%) |
Income Below Poverty Among Married-Couple vs Single-Parent Households in Cape Girardeau
The poverty data for Cape Girardeau shows that 466 of the married-couple family households (7.5%) and 475 of the single-parent households (25.2%) are living below the poverty level. Within the married-couple family households, those with 3 or 4 children have the highest poverty rate, with 136 households (41.6%) falling below the poverty line. Among the single-parent households, those with 5 or more children have the highest poverty rate, with 27 household (90.0%) living below poverty.
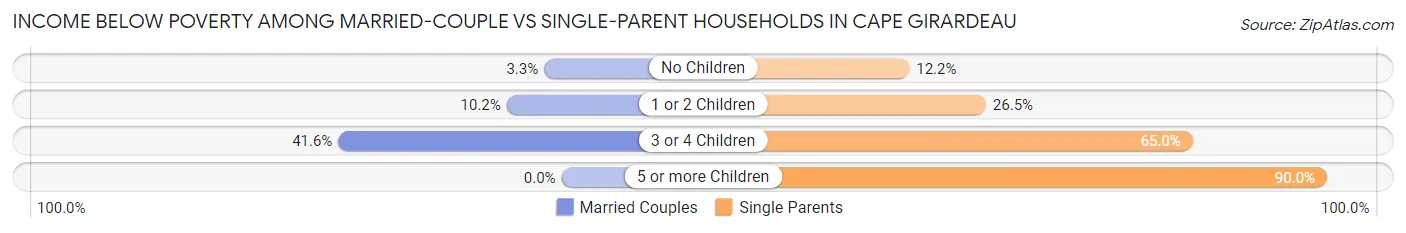
| Children | Married-Couple Families | Single-Parent Households |
| No Children | 128 (3.3%) | 109 (12.2%) |
| 1 or 2 Children | 202 (10.2%) | 196 (26.5%) |
| 3 or 4 Children | 136 (41.6%) | 143 (65.0%) |
| 5 or more Children | 0 (0.0%) | 27 (90.0%) |
| Total | 466 (7.5%) | 475 (25.2%) |
Race in Cape Girardeau
The most populous races in Cape Girardeau are White / Caucasian (30,929 | 77.7%), Black / African American (5,473 | 13.8%), and Two or more Races (1,870 | 4.7%).
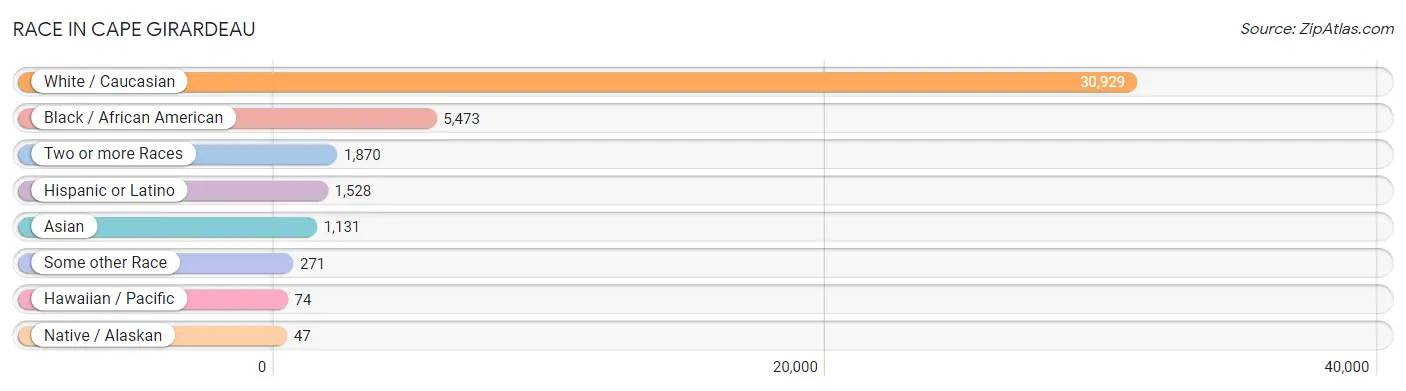
| Race | # Population | % Population |
| Asian | 1,131 | 2.8% |
| Black / African American | 5,473 | 13.8% |
| Hawaiian / Pacific | 74 | 0.2% |
| Hispanic or Latino | 1,528 | 3.8% |
| Native / Alaskan | 47 | 0.1% |
| White / Caucasian | 30,929 | 77.7% |
| Two or more Races | 1,870 | 4.7% |
| Some other Race | 271 | 0.7% |
| Total | 39,795 | 100.0% |
Ancestry in Cape Girardeau
The most populous ancestries reported in Cape Girardeau are German (8,660 | 21.8%), American (3,799 | 9.6%), Irish (3,224 | 8.1%), English (3,196 | 8.0%), and Mexican (1,049 | 2.6%), together accounting for 50.1% of all Cape Girardeau residents.
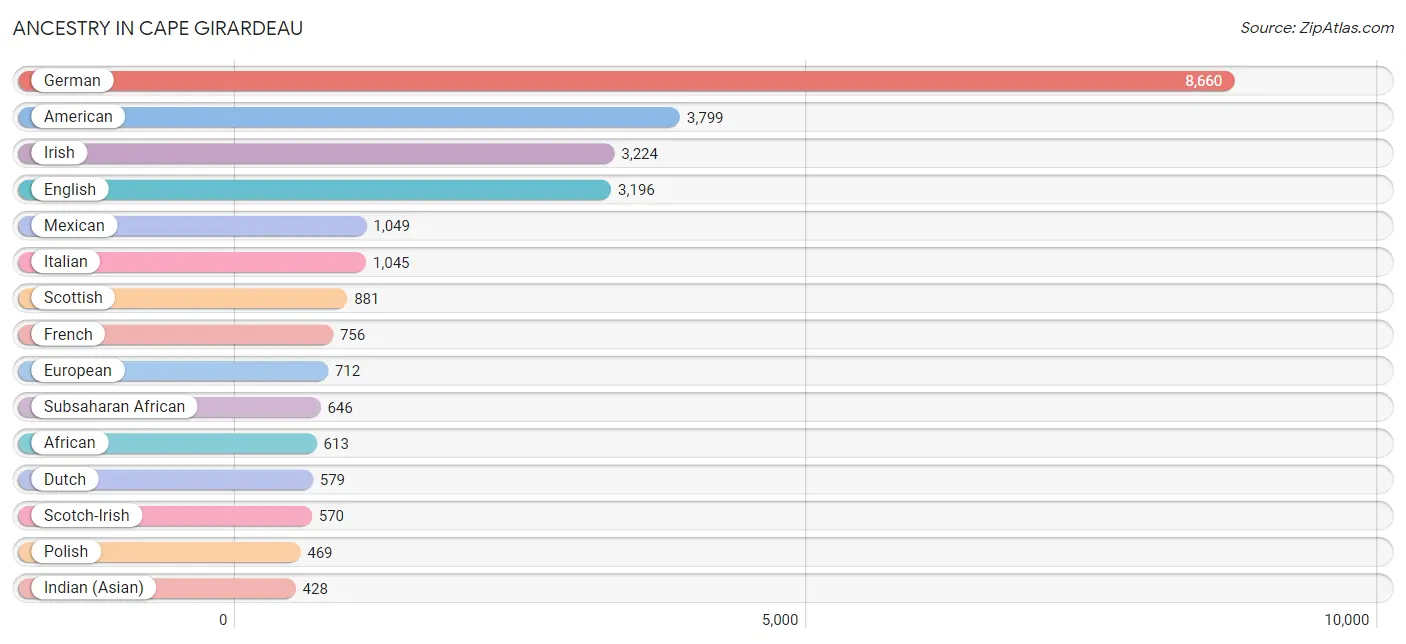
| Ancestry | # Population | % Population |
| African | 613 | 1.5% |
| American | 3,799 | 9.6% |
| Arab | 59 | 0.2% |
| Armenian | 45 | 0.1% |
| Austrian | 21 | 0.1% |
| Belgian | 9 | 0.0% |
| Bhutanese | 394 | 1.0% |
| Blackfeet | 5 | 0.0% |
| British | 196 | 0.5% |
| Bulgarian | 8 | 0.0% |
| Burmese | 130 | 0.3% |
| Central American | 160 | 0.4% |
| Central American Indian | 23 | 0.1% |
| Cherokee | 325 | 0.8% |
| Cheyenne | 2 | 0.0% |
| Choctaw | 27 | 0.1% |
| Colombian | 45 | 0.1% |
| Croatian | 13 | 0.0% |
| Cuban | 18 | 0.1% |
| Czech | 123 | 0.3% |
| Czechoslovakian | 71 | 0.2% |
| Danish | 187 | 0.5% |
| Dominican | 23 | 0.1% |
| Dutch | 579 | 1.5% |
| Eastern European | 92 | 0.2% |
| Ecuadorian | 3 | 0.0% |
| Egyptian | 30 | 0.1% |
| English | 3,196 | 8.0% |
| European | 712 | 1.8% |
| Finnish | 6 | 0.0% |
| French | 756 | 1.9% |
| French Canadian | 21 | 0.1% |
| German | 8,660 | 21.8% |
| Guatemalan | 71 | 0.2% |
| Honduran | 36 | 0.1% |
| Indian (Asian) | 428 | 1.1% |
| Indonesian | 20 | 0.1% |
| Inupiat | 10 | 0.0% |
| Iranian | 78 | 0.2% |
| Irish | 3,224 | 8.1% |
| Italian | 1,045 | 2.6% |
| Jordanian | 29 | 0.1% |
| Korean | 32 | 0.1% |
| Latvian | 17 | 0.0% |
| Lithuanian | 5 | 0.0% |
| Macedonian | 6 | 0.0% |
| Malaysian | 33 | 0.1% |
| Mexican | 1,049 | 2.6% |
| Native Hawaiian | 61 | 0.2% |
| Nigerian | 33 | 0.1% |
| Northern European | 17 | 0.0% |
| Norwegian | 139 | 0.4% |
| Panamanian | 16 | 0.0% |
| Polish | 469 | 1.2% |
| Pueblo | 2 | 0.0% |
| Puerto Rican | 115 | 0.3% |
| Romanian | 28 | 0.1% |
| Russian | 237 | 0.6% |
| Salvadoran | 37 | 0.1% |
| Scandinavian | 61 | 0.2% |
| Scotch-Irish | 570 | 1.4% |
| Scottish | 881 | 2.2% |
| Serbian | 9 | 0.0% |
| Sioux | 18 | 0.1% |
| Slovak | 30 | 0.1% |
| South American | 48 | 0.1% |
| Spaniard | 9 | 0.0% |
| Sri Lankan | 81 | 0.2% |
| Subsaharan African | 646 | 1.6% |
| Swedish | 135 | 0.3% |
| Swiss | 80 | 0.2% |
| Thai | 254 | 0.6% |
| Ukrainian | 48 | 0.1% |
| Welsh | 301 | 0.8% | View All 74 Rows |
Immigrants in Cape Girardeau
The most numerous immigrant groups reported in Cape Girardeau came from Asia (856 | 2.1%), Eastern Asia (542 | 1.4%), China (404 | 1.0%), Europe (297 | 0.7%), and Latin America (296 | 0.7%), together accounting for 6.0% of all Cape Girardeau residents.
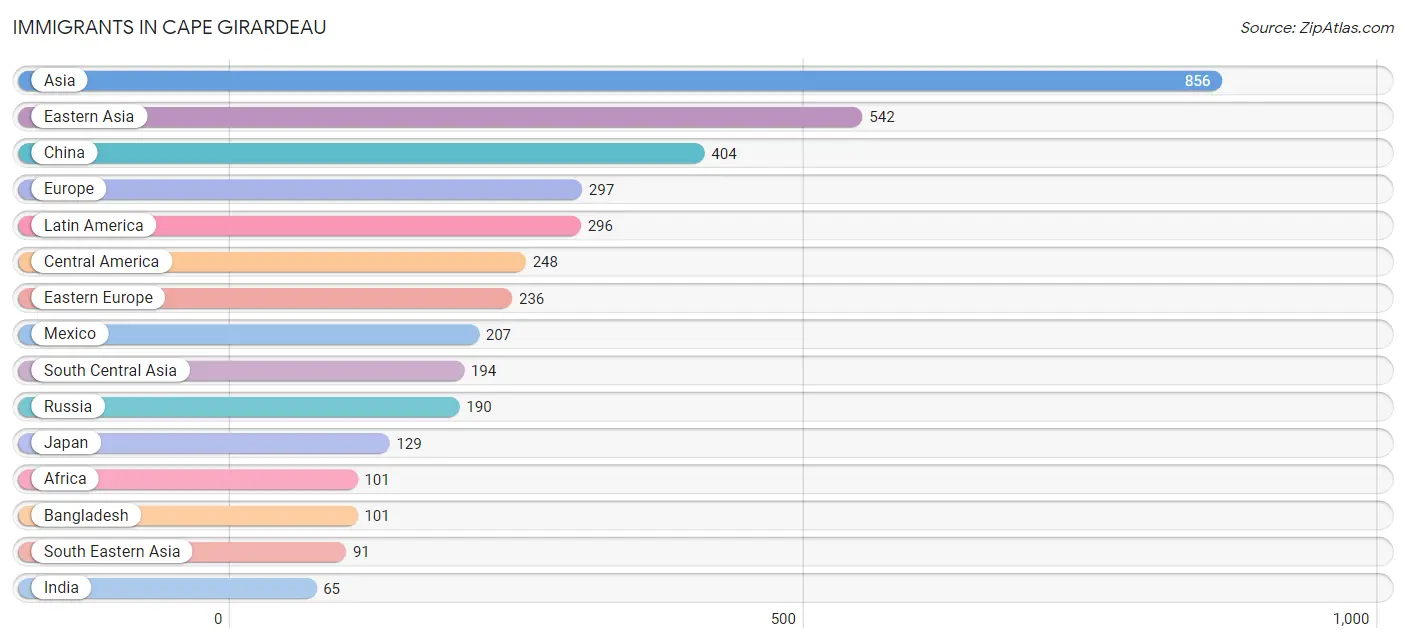
| Immigration Origin | # Population | % Population |
| Africa | 101 | 0.3% |
| Asia | 856 | 2.1% |
| Bangladesh | 101 | 0.3% |
| Belarus | 5 | 0.0% |
| Central America | 248 | 0.6% |
| China | 404 | 1.0% |
| Colombia | 45 | 0.1% |
| Eastern Asia | 542 | 1.4% |
| Eastern Europe | 236 | 0.6% |
| Ecuador | 3 | 0.0% |
| Egypt | 38 | 0.1% |
| El Salvador | 15 | 0.0% |
| England | 6 | 0.0% |
| Europe | 297 | 0.7% |
| France | 8 | 0.0% |
| Germany | 29 | 0.1% |
| Ghana | 15 | 0.0% |
| Guatemala | 26 | 0.1% |
| India | 65 | 0.2% |
| Japan | 129 | 0.3% |
| Jordan | 15 | 0.0% |
| Korea | 9 | 0.0% |
| Kuwait | 14 | 0.0% |
| Latin America | 296 | 0.7% |
| Mexico | 207 | 0.5% |
| Micronesia | 13 | 0.0% |
| Nepal | 28 | 0.1% |
| Nigeria | 37 | 0.1% |
| Northern Africa | 40 | 0.1% |
| Northern Europe | 24 | 0.1% |
| Oceania | 13 | 0.0% |
| Philippines | 18 | 0.1% |
| Russia | 190 | 0.5% |
| South America | 48 | 0.1% |
| South Central Asia | 194 | 0.5% |
| South Eastern Asia | 91 | 0.2% |
| Sudan | 2 | 0.0% |
| Sweden | 18 | 0.1% |
| Ukraine | 35 | 0.1% |
| Vietnam | 53 | 0.1% |
| Western Africa | 52 | 0.1% |
| Western Asia | 29 | 0.1% |
| Western Europe | 37 | 0.1% | View All 43 Rows |
Sex and Age in Cape Girardeau
Sex and Age in Cape Girardeau
The most populous age groups in Cape Girardeau are 20 to 24 Years (3,034 | 15.9%) for men and 20 to 24 Years (3,232 | 15.6%) for women.
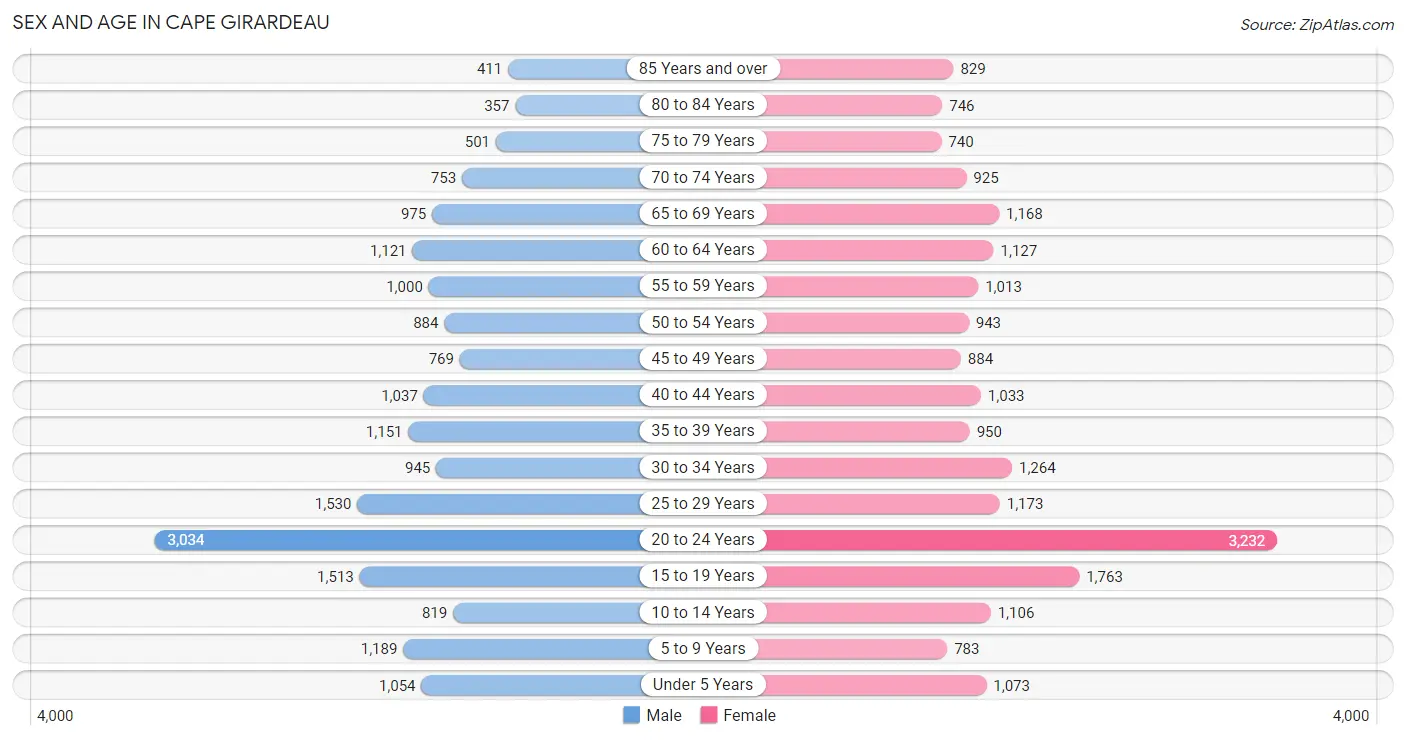
| Age Bracket | Male | Female |
| Under 5 Years | 1,054 (5.5%) | 1,073 (5.2%) |
| 5 to 9 Years | 1,189 (6.2%) | 783 (3.8%) |
| 10 to 14 Years | 819 (4.3%) | 1,106 (5.3%) |
| 15 to 19 Years | 1,513 (8.0%) | 1,763 (8.5%) |
| 20 to 24 Years | 3,034 (15.9%) | 3,232 (15.6%) |
| 25 to 29 Years | 1,530 (8.0%) | 1,173 (5.7%) |
| 30 to 34 Years | 945 (5.0%) | 1,264 (6.1%) |
| 35 to 39 Years | 1,151 (6.0%) | 950 (4.6%) |
| 40 to 44 Years | 1,037 (5.4%) | 1,033 (5.0%) |
| 45 to 49 Years | 769 (4.0%) | 884 (4.3%) |
| 50 to 54 Years | 884 (4.6%) | 943 (4.5%) |
| 55 to 59 Years | 1,000 (5.2%) | 1,013 (4.9%) |
| 60 to 64 Years | 1,121 (5.9%) | 1,127 (5.4%) |
| 65 to 69 Years | 975 (5.1%) | 1,168 (5.6%) |
| 70 to 74 Years | 753 (4.0%) | 925 (4.5%) |
| 75 to 79 Years | 501 (2.6%) | 740 (3.6%) |
| 80 to 84 Years | 357 (1.9%) | 746 (3.6%) |
| 85 Years and over | 411 (2.2%) | 829 (4.0%) |
| Total | 19,043 (100.0%) | 20,752 (100.0%) |
Families and Households in Cape Girardeau
Median Family Size in Cape Girardeau
The median family size in Cape Girardeau is 3.02 persons per family, with single female/mother families (1,534 | 18.9%) accounting for the largest median family size of 3.53 persons per family. On the other hand, single male/father families (348 | 4.3%) represent the smallest median family size with 2.84 persons per family.
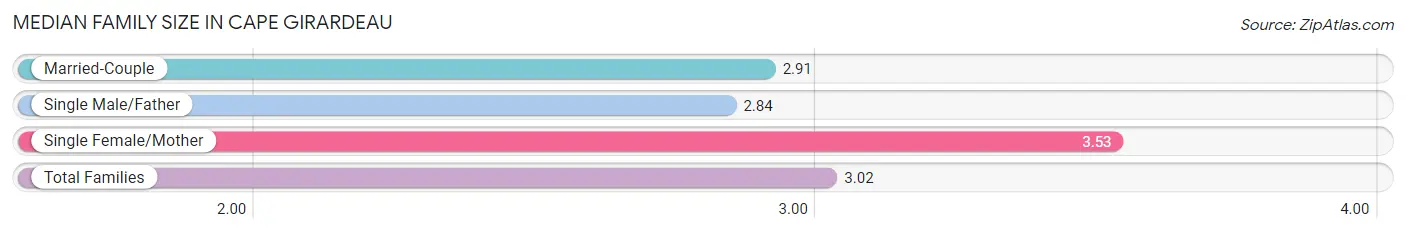
| Family Type | # Families | Family Size |
| Married-Couple | 6,245 (76.8%) | 2.91 |
| Single Male/Father | 348 (4.3%) | 2.84 |
| Single Female/Mother | 1,534 (18.9%) | 3.53 |
| Total Families | 8,127 (100.0%) | 3.02 |
Median Household Size in Cape Girardeau
The median household size in Cape Girardeau is 2.31 persons per household, with single female/mother households (1,534 | 9.7%) accounting for the largest median household size of 3.75 persons per household. non-family households (7,738 | 48.8%) represent the smallest median household size with 1.49 persons per household.
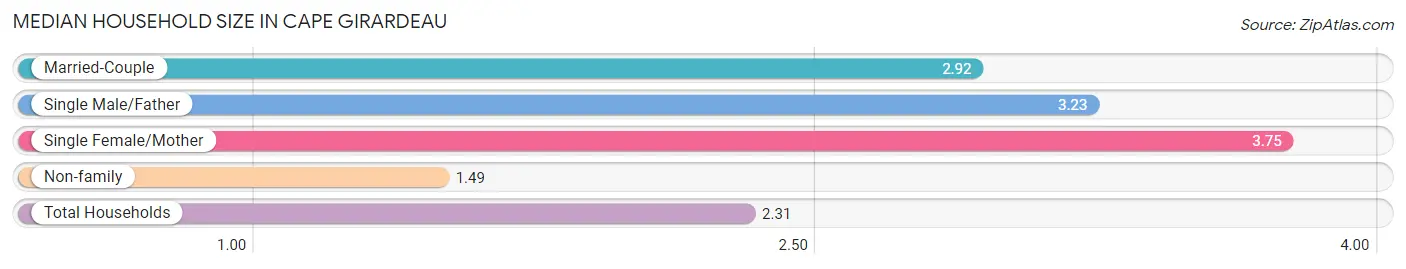
| Household Type | # Households | Household Size |
| Married-Couple | 6,245 (39.4%) | 2.92 |
| Single Male/Father | 348 (2.2%) | 3.23 |
| Single Female/Mother | 1,534 (9.7%) | 3.75 |
| Non-family | 7,738 (48.8%) | 1.49 |
| Total Households | 15,865 (100.0%) | 2.31 |
Household Size by Marriage Status in Cape Girardeau
Out of a total of 15,865 households in Cape Girardeau, 8,127 (51.2%) are family households, while 7,738 (48.8%) are nonfamily households. The most numerous type of family households are 2-person households, comprising 4,140, and the most common type of nonfamily households are 1-person households, comprising 5,821.
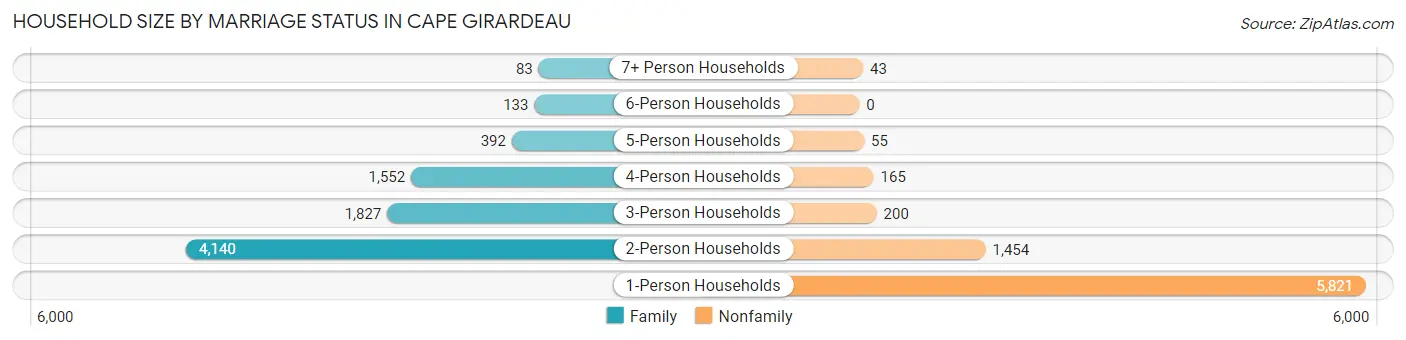
| Household Size | Family Households | Nonfamily Households |
| 1-Person Households | - | 5,821 (36.7%) |
| 2-Person Households | 4,140 (26.1%) | 1,454 (9.2%) |
| 3-Person Households | 1,827 (11.5%) | 200 (1.3%) |
| 4-Person Households | 1,552 (9.8%) | 165 (1.0%) |
| 5-Person Households | 392 (2.5%) | 55 (0.4%) |
| 6-Person Households | 133 (0.8%) | 0 (0.0%) |
| 7+ Person Households | 83 (0.5%) | 43 (0.3%) |
| Total | 8,127 (51.2%) | 7,738 (48.8%) |
Female Fertility in Cape Girardeau
Fertility by Age in Cape Girardeau
Average fertility rate in Cape Girardeau is 40.0 births per 1,000 women. Women in the age bracket of 20 to 34 years have the highest fertility rate with 65.0 births per 1,000 women. Women in the age bracket of 20 to 34 years acount for 89.3% of all women with births.
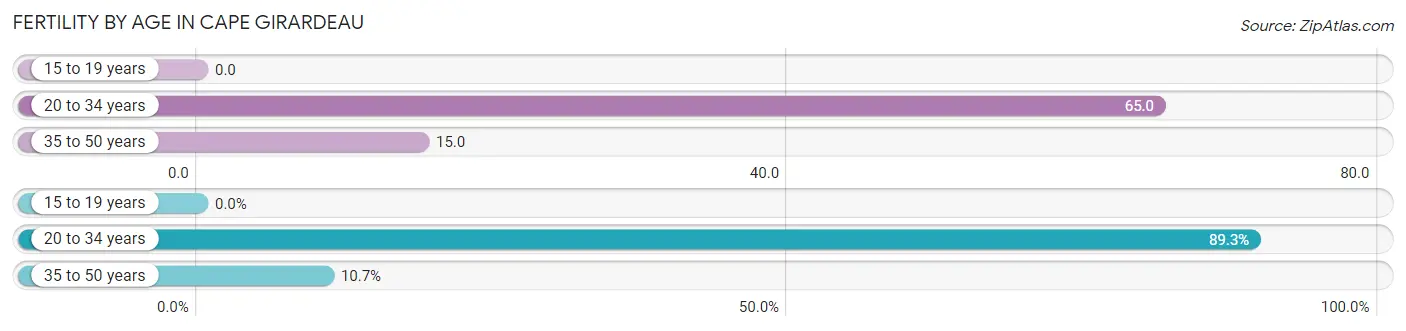
| Age Bracket | Women with Births | Births / 1,000 Women |
| 15 to 19 years | 0 (0.0%) | 0.0 |
| 20 to 34 years | 368 (89.3%) | 65.0 |
| 35 to 50 years | 44 (10.7%) | 15.0 |
| Total | 412 (100.0%) | 40.0 |
Fertility by Age by Marriage Status in Cape Girardeau
73.5% of women with births (412) in Cape Girardeau are married. The highest percentage of unmarried women with births falls into 20 to 34 years age bracket with 29.6% of them unmarried at the time of birth, while the lowest percentage of unmarried women with births belong to 35 to 50 years age bracket with 0.0% of them unmarried.
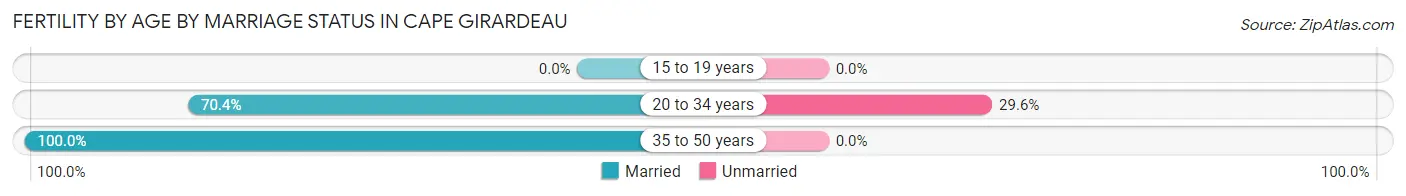
| Age Bracket | Married | Unmarried |
| 15 to 19 years | 0 (0.0%) | 0 (0.0%) |
| 20 to 34 years | 259 (70.4%) | 109 (29.6%) |
| 35 to 50 years | 44 (100.0%) | 0 (0.0%) |
| Total | 303 (73.5%) | 109 (26.5%) |
Fertility by Education in Cape Girardeau
Average fertility rate in Cape Girardeau is 40.0 births per 1,000 women. Women with the education attainment of graduate degree have the highest fertility rate of 46.0 births per 1,000 women, while women with the education attainment of high school diploma have the lowest fertility at 27.0 births per 1,000 women. Women with the education attainment of college or associate's degree represent 44.2% of all women with births.
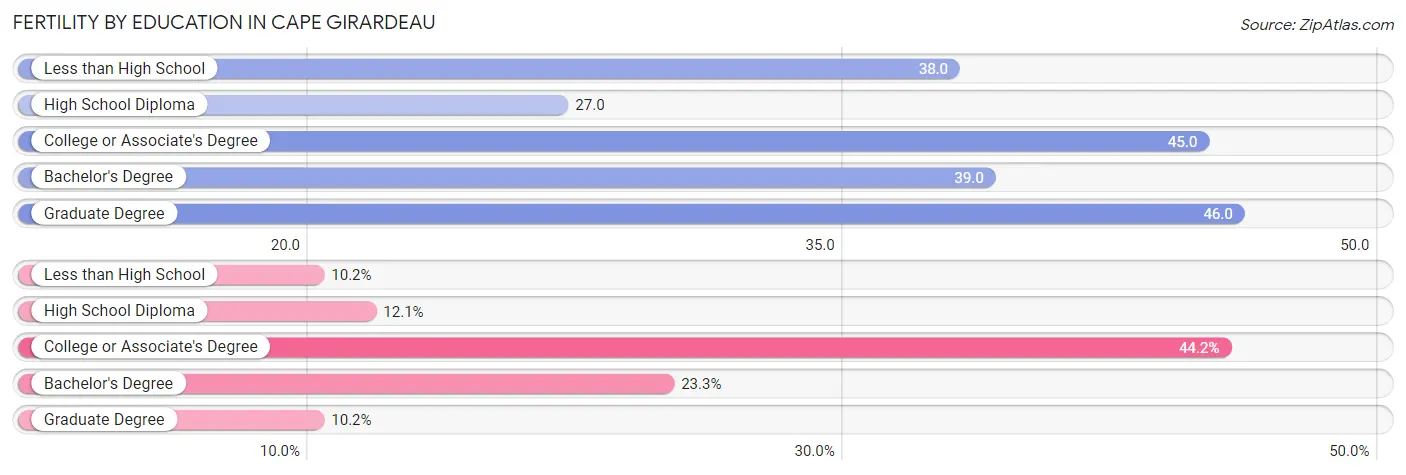
| Educational Attainment | Women with Births | Births / 1,000 Women |
| Less than High School | 42 (10.2%) | 38.0 |
| High School Diploma | 50 (12.1%) | 27.0 |
| College or Associate's Degree | 182 (44.2%) | 45.0 |
| Bachelor's Degree | 96 (23.3%) | 39.0 |
| Graduate Degree | 42 (10.2%) | 46.0 |
| Total | 412 (100.0%) | 40.0 |
Fertility by Education by Marriage Status in Cape Girardeau
26.5% of women with births in Cape Girardeau are unmarried. Women with the educational attainment of graduate degree are most likely to be married with 100.0% of them married at childbirth, while women with the educational attainment of less than high school are least likely to be married with 57.1% of them unmarried at childbirth.
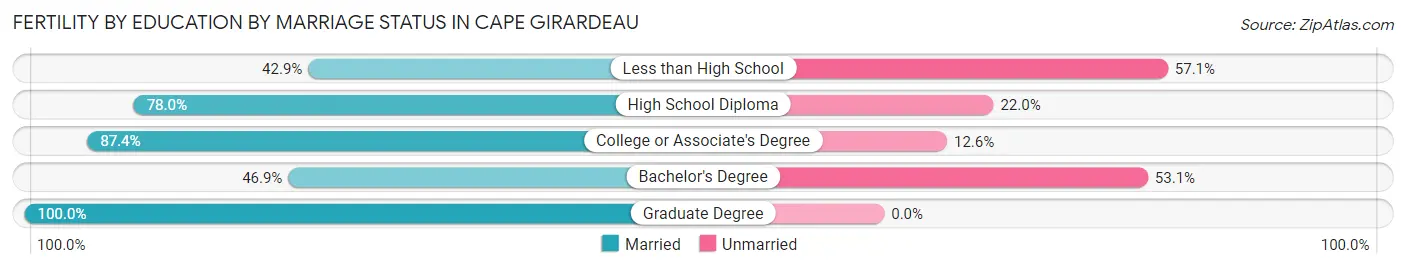
| Educational Attainment | Married | Unmarried |
| Less than High School | 18 (42.9%) | 24 (57.1%) |
| High School Diploma | 39 (78.0%) | 11 (22.0%) |
| College or Associate's Degree | 159 (87.4%) | 23 (12.6%) |
| Bachelor's Degree | 45 (46.9%) | 51 (53.1%) |
| Graduate Degree | 42 (100.0%) | 0 (0.0%) |
| Total | 303 (73.5%) | 109 (26.5%) |
Employment Characteristics in Cape Girardeau
Employment by Class of Employer in Cape Girardeau
Among the 19,301 employed individuals in Cape Girardeau, private company employees (12,593 | 65.2%), not-for-profit organizations (2,489 | 12.9%), and state government employees (1,693 | 8.8%) make up the most common classes of employment.
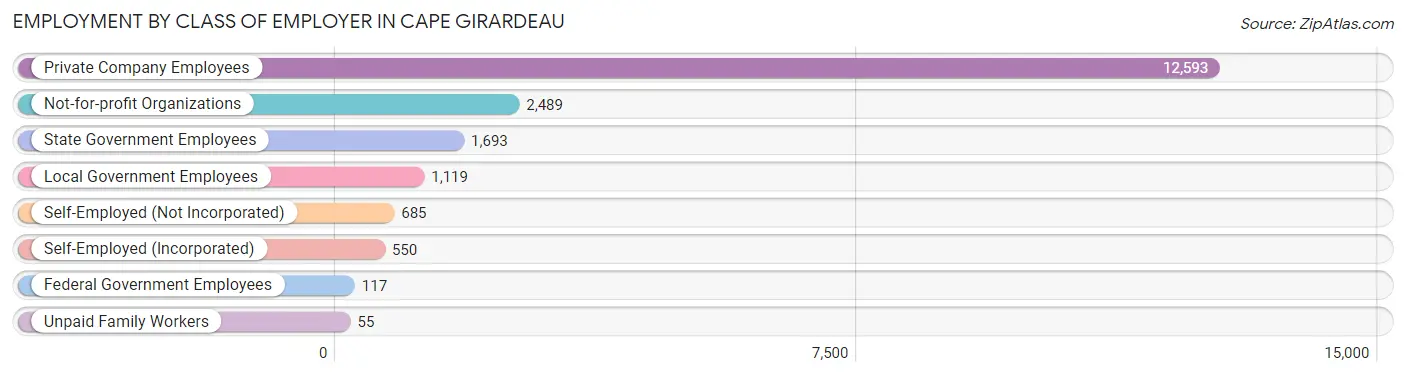
| Employer Class | # Employees | % Employees |
| Private Company Employees | 12,593 | 65.2% |
| Self-Employed (Incorporated) | 550 | 2.9% |
| Self-Employed (Not Incorporated) | 685 | 3.5% |
| Not-for-profit Organizations | 2,489 | 12.9% |
| Local Government Employees | 1,119 | 5.8% |
| State Government Employees | 1,693 | 8.8% |
| Federal Government Employees | 117 | 0.6% |
| Unpaid Family Workers | 55 | 0.3% |
| Total | 19,301 | 100.0% |
Employment Status by Age in Cape Girardeau
According to the labor force statistics for Cape Girardeau, out of the total population over 16 years of age (33,400), 61.5% or 20,541 individuals are in the labor force, with 3.4% or 698 of them unemployed. The age group with the highest labor force participation rate is 25 to 29 years, with 93.0% or 2,514 individuals in the labor force. Within the labor force, the 16 to 19 years age range has the highest percentage of unemployed individuals, with 17.2% or 180 of them being unemployed.
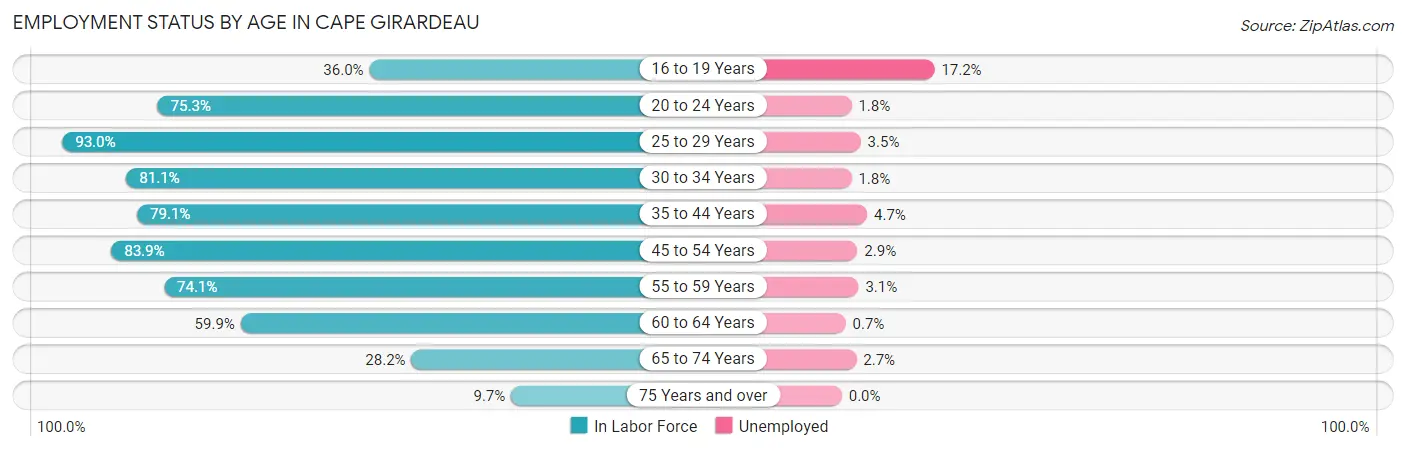
| Age Bracket | In Labor Force | Unemployed |
| 16 to 19 Years | 1,046 (36.0%) | 180 (17.2%) |
| 20 to 24 Years | 4,718 (75.3%) | 85 (1.8%) |
| 25 to 29 Years | 2,514 (93.0%) | 88 (3.5%) |
| 30 to 34 Years | 1,791 (81.1%) | 32 (1.8%) |
| 35 to 44 Years | 3,299 (79.1%) | 155 (4.7%) |
| 45 to 54 Years | 2,920 (83.9%) | 85 (2.9%) |
| 55 to 59 Years | 1,492 (74.1%) | 46 (3.1%) |
| 60 to 64 Years | 1,347 (59.9%) | 9 (0.7%) |
| 65 to 74 Years | 1,078 (28.2%) | 29 (2.7%) |
| 75 Years and over | 348 (9.7%) | 0 (0.0%) |
| Total | 20,541 (61.5%) | 698 (3.4%) |
Employment Status by Educational Attainment in Cape Girardeau
According to labor force statistics for Cape Girardeau, 79.4% of individuals (13,358) out of the total population between 25 and 64 years of age (16,824) are in the labor force, with 3.1% or 414 of them being unemployed. The group with the highest labor force participation rate are those with the educational attainment of bachelor's degree or higher, with 88.6% or 6,058 individuals in the labor force. Within the labor force, individuals with college / associate degree education have the highest percentage of unemployment, with 4.7% or 183 of them being unemployed.
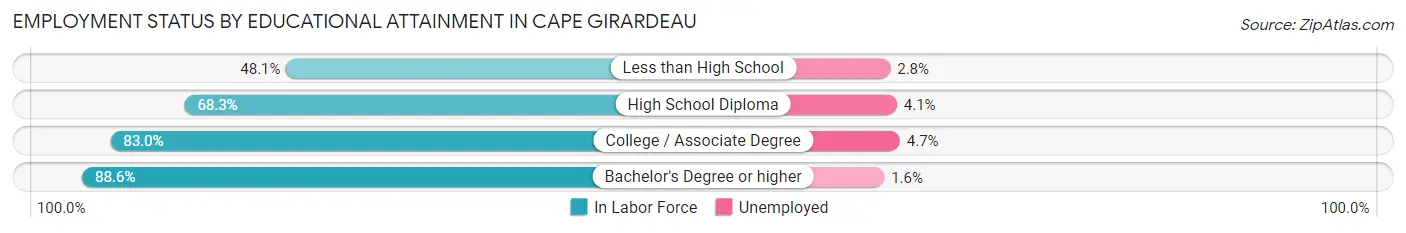
| Educational Attainment | In Labor Force | Unemployed |
| Less than High School | 499 (48.1%) | 29 (2.8%) |
| High School Diploma | 2,901 (68.3%) | 174 (4.1%) |
| College / Associate Degree | 3,903 (83.0%) | 221 (4.7%) |
| Bachelor's Degree or higher | 6,058 (88.6%) | 109 (1.6%) |
| Total | 13,358 (79.4%) | 522 (3.1%) |
Employment Occupations by Sex in Cape Girardeau
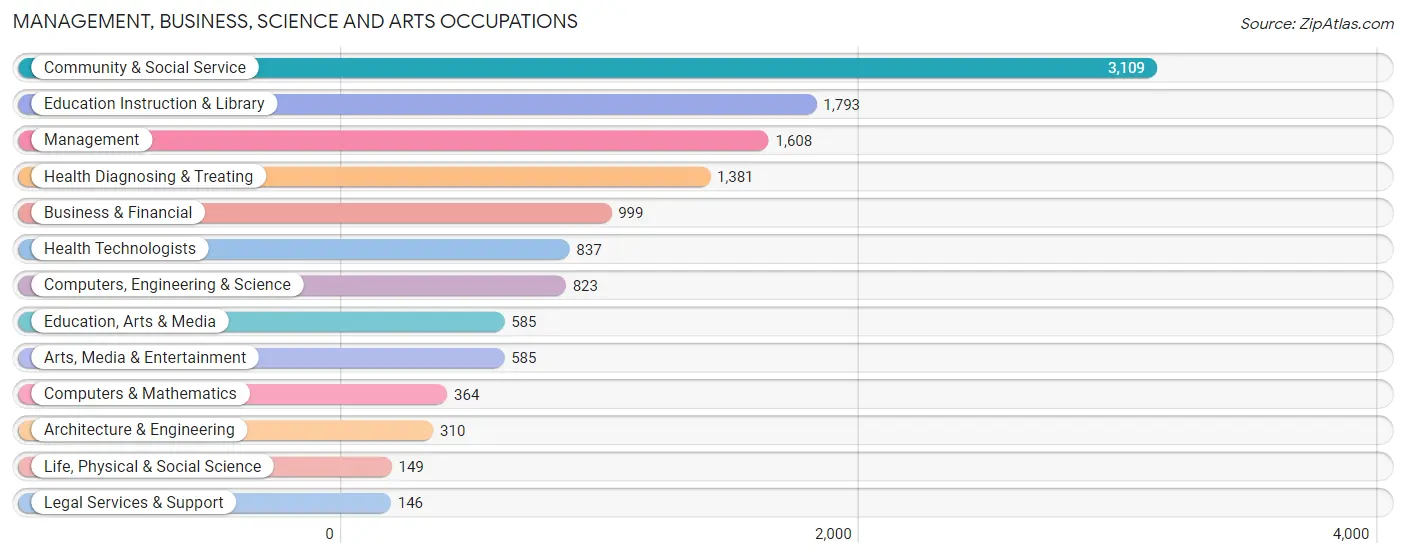
Management, Business, Science and Arts Occupations
The most common Management, Business, Science and Arts occupations in Cape Girardeau are Community & Social Service (3,109 | 15.7%), Education Instruction & Library (1,793 | 9.0%), Management (1,608 | 8.1%), Health Diagnosing & Treating (1,381 | 7.0%), and Business & Financial (999 | 5.0%).
Management, Business, Science and Arts Occupations by Sex
Within the Management, Business, Science and Arts occupations in Cape Girardeau, the most male-oriented occupations are Legal Services & Support (100.0%), Computers & Mathematics (89.3%), and Computers, Engineering & Science (72.3%), while the most female-oriented occupations are Education, Arts & Media (77.1%), Health Technologists (71.9%), and Health Diagnosing & Treating (71.8%).
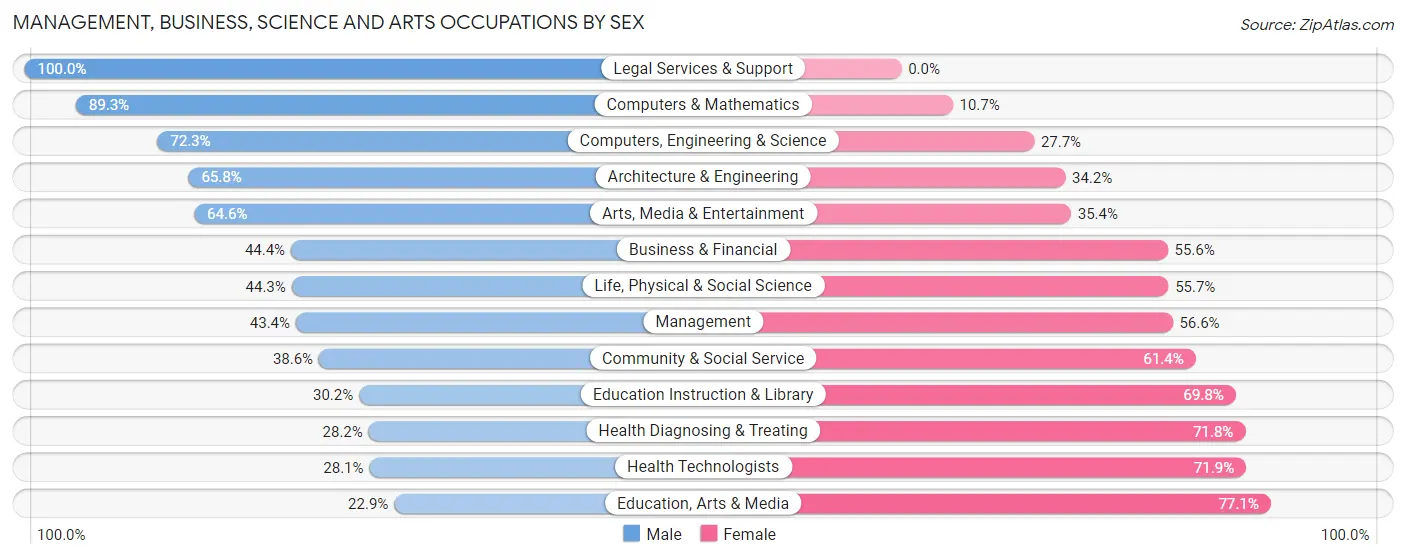
| Occupation | Male | Female |
| Management | 698 (43.4%) | 910 (56.6%) |
| Business & Financial | 444 (44.4%) | 555 (55.6%) |
| Computers, Engineering & Science | 595 (72.3%) | 228 (27.7%) |
| Computers & Mathematics | 325 (89.3%) | 39 (10.7%) |
| Architecture & Engineering | 204 (65.8%) | 106 (34.2%) |
| Life, Physical & Social Science | 66 (44.3%) | 83 (55.7%) |
| Community & Social Service | 1,200 (38.6%) | 1,909 (61.4%) |
| Education, Arts & Media | 134 (22.9%) | 451 (77.1%) |
| Legal Services & Support | 146 (100.0%) | 0 (0.0%) |
| Education Instruction & Library | 542 (30.2%) | 1,251 (69.8%) |
| Arts, Media & Entertainment | 378 (64.6%) | 207 (35.4%) |
| Health Diagnosing & Treating | 390 (28.2%) | 991 (71.8%) |
| Health Technologists | 235 (28.1%) | 602 (71.9%) |
| Total (Category) | 3,327 (42.0%) | 4,593 (58.0%) |
| Total (Overall) | 9,710 (49.0%) | 10,119 (51.0%) |
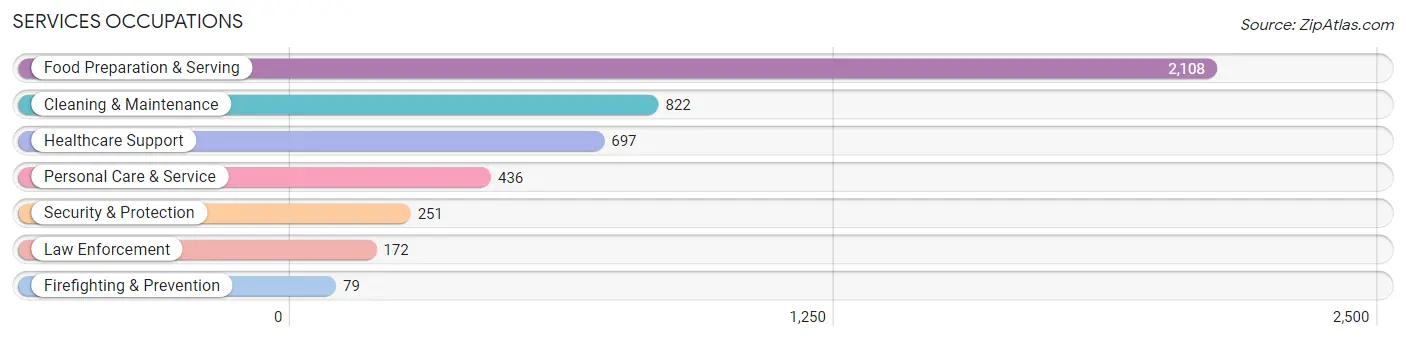
Services Occupations
The most common Services occupations in Cape Girardeau are Food Preparation & Serving (2,108 | 10.6%), Cleaning & Maintenance (822 | 4.2%), Healthcare Support (697 | 3.5%), Personal Care & Service (436 | 2.2%), and Security & Protection (251 | 1.3%).
Services Occupations by Sex
Within the Services occupations in Cape Girardeau, the most male-oriented occupations are Security & Protection (100.0%), Firefighting & Prevention (100.0%), and Law Enforcement (100.0%), while the most female-oriented occupations are Personal Care & Service (85.1%), Healthcare Support (74.6%), and Food Preparation & Serving (52.1%).
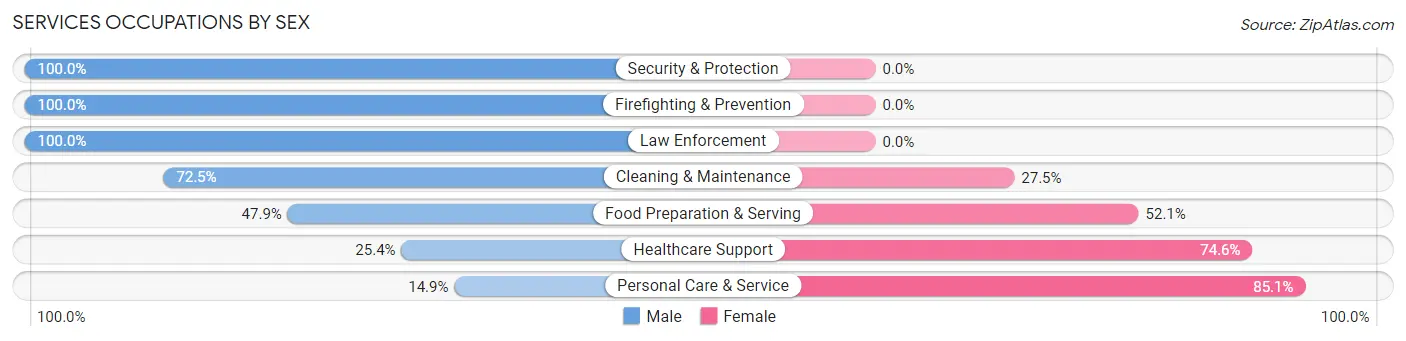
| Occupation | Male | Female |
| Healthcare Support | 177 (25.4%) | 520 (74.6%) |
| Security & Protection | 251 (100.0%) | 0 (0.0%) |
| Firefighting & Prevention | 79 (100.0%) | 0 (0.0%) |
| Law Enforcement | 172 (100.0%) | 0 (0.0%) |
| Food Preparation & Serving | 1,010 (47.9%) | 1,098 (52.1%) |
| Cleaning & Maintenance | 596 (72.5%) | 226 (27.5%) |
| Personal Care & Service | 65 (14.9%) | 371 (85.1%) |
| Total (Category) | 2,099 (48.7%) | 2,215 (51.3%) |
| Total (Overall) | 9,710 (49.0%) | 10,119 (51.0%) |
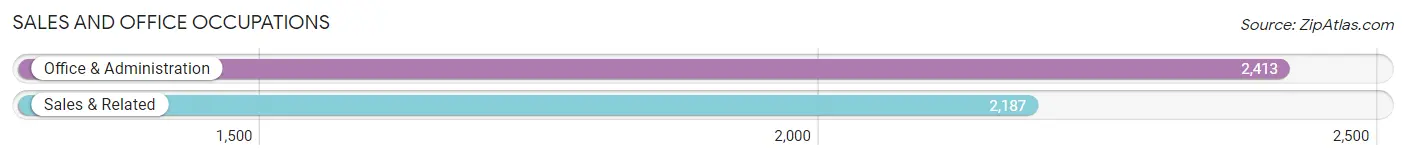
Sales and Office Occupations
The most common Sales and Office occupations in Cape Girardeau are Office & Administration (2,413 | 12.2%), and Sales & Related (2,187 | 11.0%).
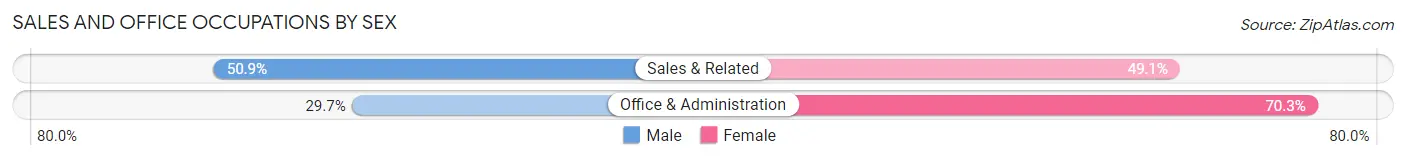
Sales and Office Occupations by Sex
| Occupation | Male | Female |
| Sales & Related | 1,113 (50.9%) | 1,074 (49.1%) |
| Office & Administration | 717 (29.7%) | 1,696 (70.3%) |
| Total (Category) | 1,830 (39.8%) | 2,770 (60.2%) |
| Total (Overall) | 9,710 (49.0%) | 10,119 (51.0%) |
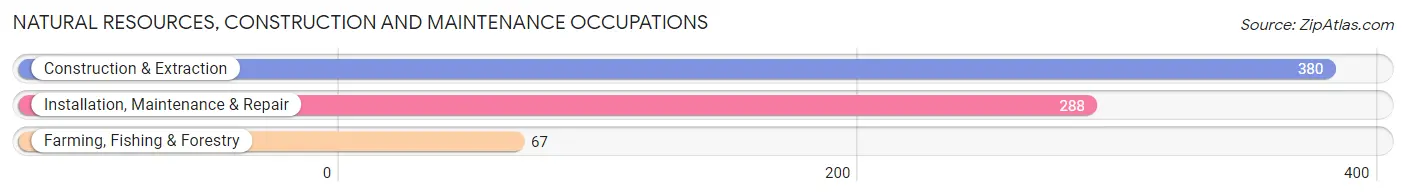
Natural Resources, Construction and Maintenance Occupations
The most common Natural Resources, Construction and Maintenance occupations in Cape Girardeau are Construction & Extraction (380 | 1.9%), Installation, Maintenance & Repair (288 | 1.5%), and Farming, Fishing & Forestry (67 | 0.3%).
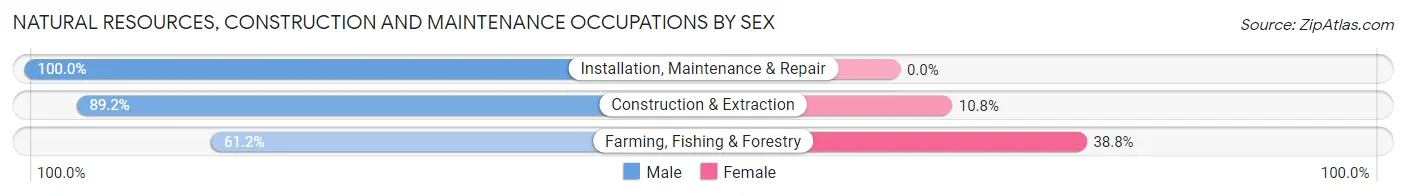
Natural Resources, Construction and Maintenance Occupations by Sex
| Occupation | Male | Female |
| Farming, Fishing & Forestry | 41 (61.2%) | 26 (38.8%) |
| Construction & Extraction | 339 (89.2%) | 41 (10.8%) |
| Installation, Maintenance & Repair | 288 (100.0%) | 0 (0.0%) |
| Total (Category) | 668 (90.9%) | 67 (9.1%) |
| Total (Overall) | 9,710 (49.0%) | 10,119 (51.0%) |
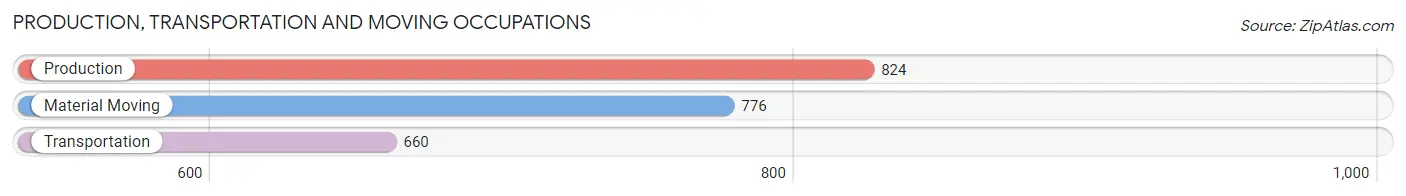
Production, Transportation and Moving Occupations
The most common Production, Transportation and Moving occupations in Cape Girardeau are Production (824 | 4.2%), Material Moving (776 | 3.9%), and Transportation (660 | 3.3%).
Production, Transportation and Moving Occupations by Sex
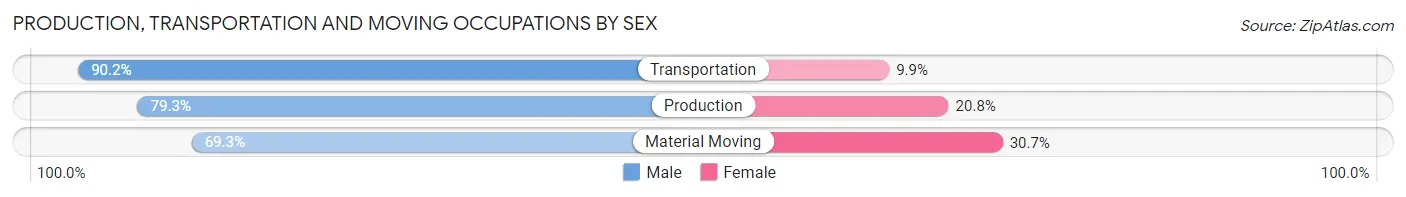
| Occupation | Male | Female |
| Production | 653 (79.2%) | 171 (20.7%) |
| Transportation | 595 (90.1%) | 65 (9.9%) |
| Material Moving | 538 (69.3%) | 238 (30.7%) |
| Total (Category) | 1,786 (79.0%) | 474 (21.0%) |
| Total (Overall) | 9,710 (49.0%) | 10,119 (51.0%) |
Employment Industries by Sex in Cape Girardeau
Employment Industries in Cape Girardeau
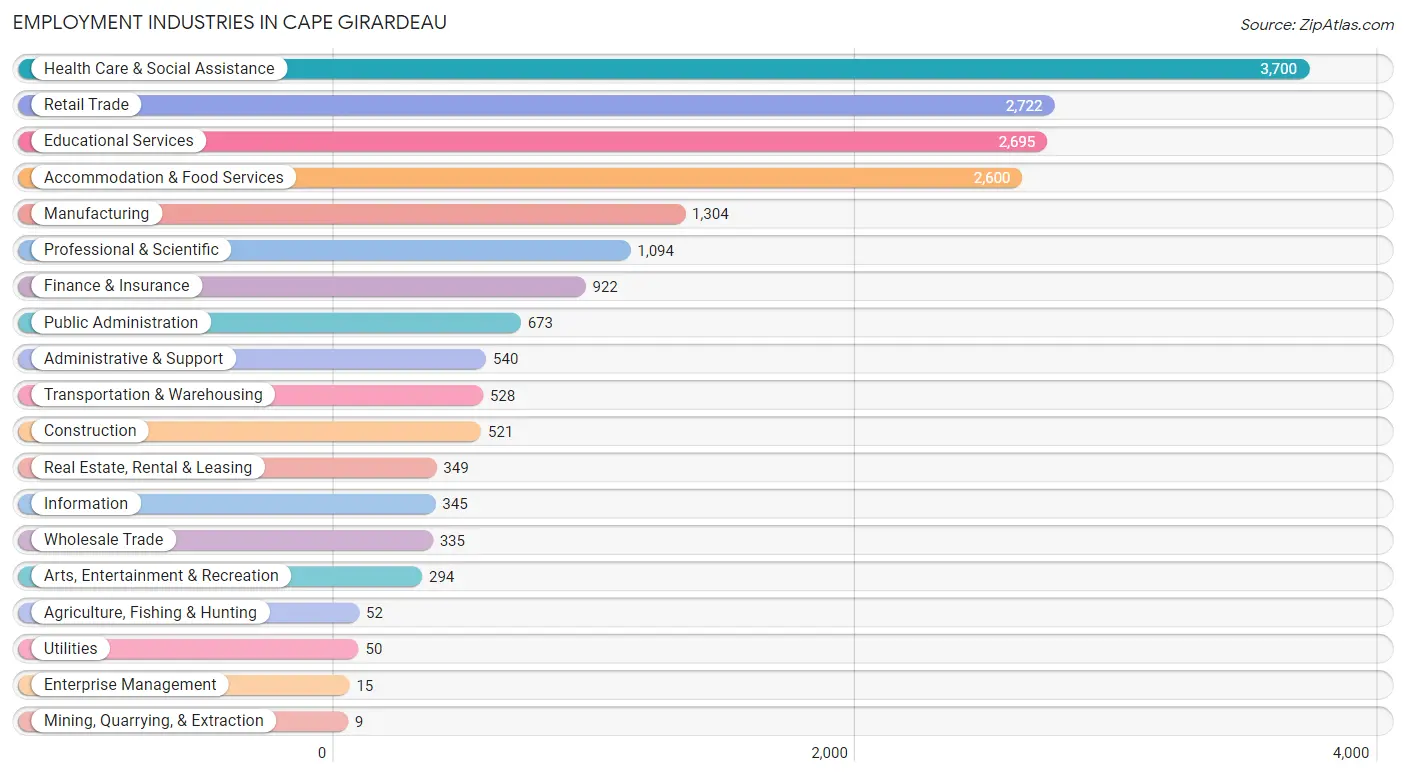
The major employment industries in Cape Girardeau include Health Care & Social Assistance (3,700 | 18.7%), Retail Trade (2,722 | 13.7%), Educational Services (2,695 | 13.6%), Accommodation & Food Services (2,600 | 13.1%), and Manufacturing (1,304 | 6.6%).
Employment Industries by Sex in Cape Girardeau
The Cape Girardeau industries that see more men than women are Mining, Quarrying, & Extraction (100.0%), Enterprise Management (100.0%), and Construction (96.7%), whereas the industries that tend to have a higher number of women are Health Care & Social Assistance (75.0%), Educational Services (62.3%), and Finance & Insurance (61.5%).
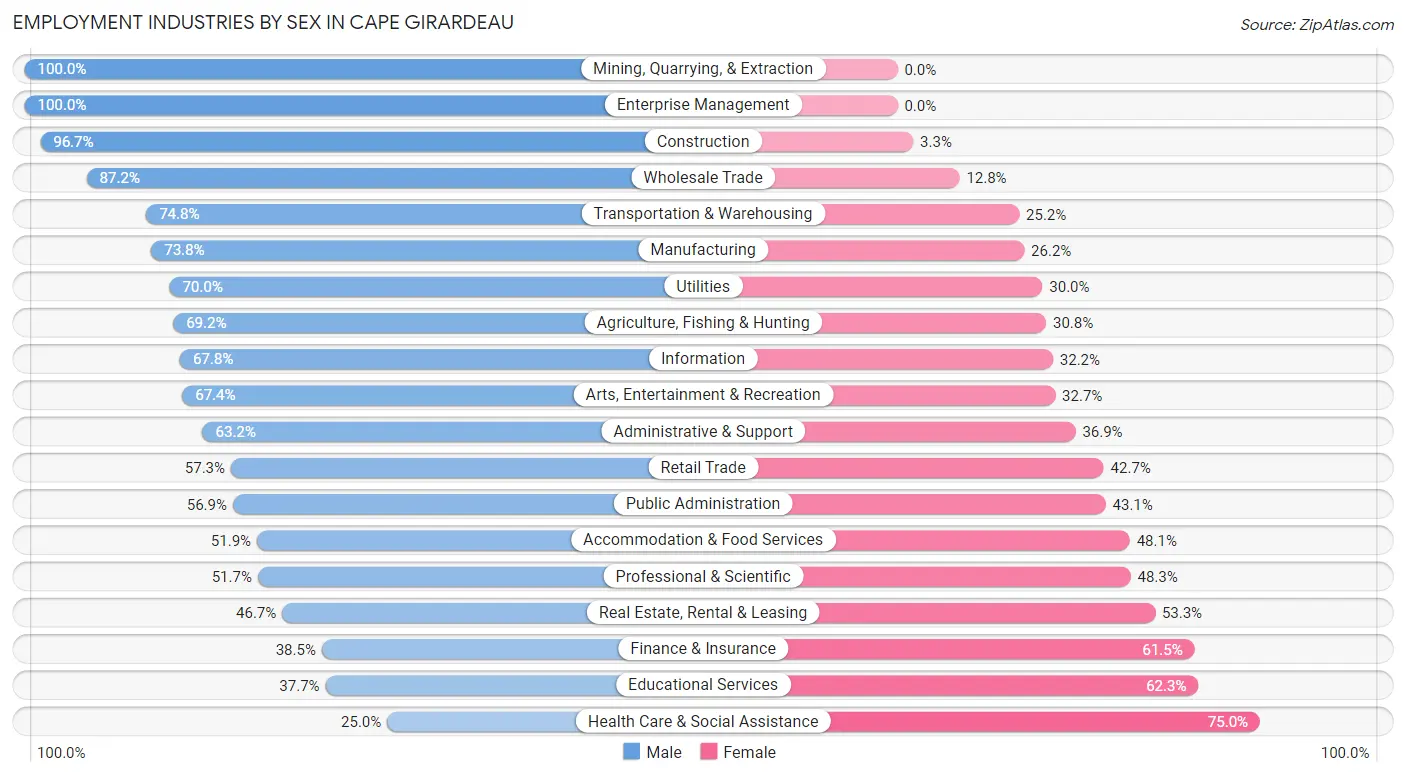
| Industry | Male | Female |
| Agriculture, Fishing & Hunting | 36 (69.2%) | 16 (30.8%) |
| Mining, Quarrying, & Extraction | 9 (100.0%) | 0 (0.0%) |
| Construction | 504 (96.7%) | 17 (3.3%) |
| Manufacturing | 962 (73.8%) | 342 (26.2%) |
| Wholesale Trade | 292 (87.2%) | 43 (12.8%) |
| Retail Trade | 1,560 (57.3%) | 1,162 (42.7%) |
| Transportation & Warehousing | 395 (74.8%) | 133 (25.2%) |
| Utilities | 35 (70.0%) | 15 (30.0%) |
| Information | 234 (67.8%) | 111 (32.2%) |
| Finance & Insurance | 355 (38.5%) | 567 (61.5%) |
| Real Estate, Rental & Leasing | 163 (46.7%) | 186 (53.3%) |
| Professional & Scientific | 566 (51.7%) | 528 (48.3%) |
| Enterprise Management | 15 (100.0%) | 0 (0.0%) |
| Administrative & Support | 341 (63.1%) | 199 (36.8%) |
| Educational Services | 1,017 (37.7%) | 1,678 (62.3%) |
| Health Care & Social Assistance | 924 (25.0%) | 2,776 (75.0%) |
| Arts, Entertainment & Recreation | 198 (67.3%) | 96 (32.7%) |
| Accommodation & Food Services | 1,350 (51.9%) | 1,250 (48.1%) |
| Public Administration | 383 (56.9%) | 290 (43.1%) |
| Total | 9,710 (49.0%) | 10,119 (51.0%) |
Education in Cape Girardeau
School Enrollment in Cape Girardeau
The most common levels of schooling among the 11,804 students in Cape Girardeau are college / undergraduate (5,937 | 50.3%), elementary school (1,777 | 15.0%), and middle school (1,548 | 13.1%).
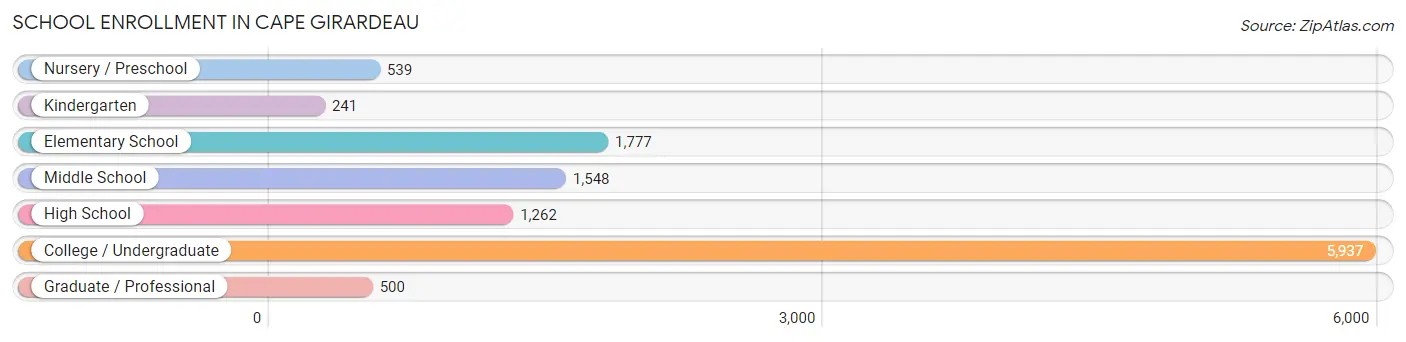
| School Level | # Students | % Students |
| Nursery / Preschool | 539 | 4.6% |
| Kindergarten | 241 | 2.0% |
| Elementary School | 1,777 | 15.0% |
| Middle School | 1,548 | 13.1% |
| High School | 1,262 | 10.7% |
| College / Undergraduate | 5,937 | 50.3% |
| Graduate / Professional | 500 | 4.2% |
| Total | 11,804 | 100.0% |
School Enrollment by Age by Funding Source in Cape Girardeau
Out of a total of 11,804 students who are enrolled in schools in Cape Girardeau, 1,452 (12.3%) attend a private institution, while the remaining 10,352 (87.7%) are enrolled in public schools. The age group of 10 to 14 year olds has the highest likelihood of being enrolled in private schools, with 482 (25.3% in the age bracket) enrolled. Conversely, the age group of 20 to 24 year olds has the lowest likelihood of being enrolled in a private school, with 3,592 (97.3% in the age bracket) attending a public institution.
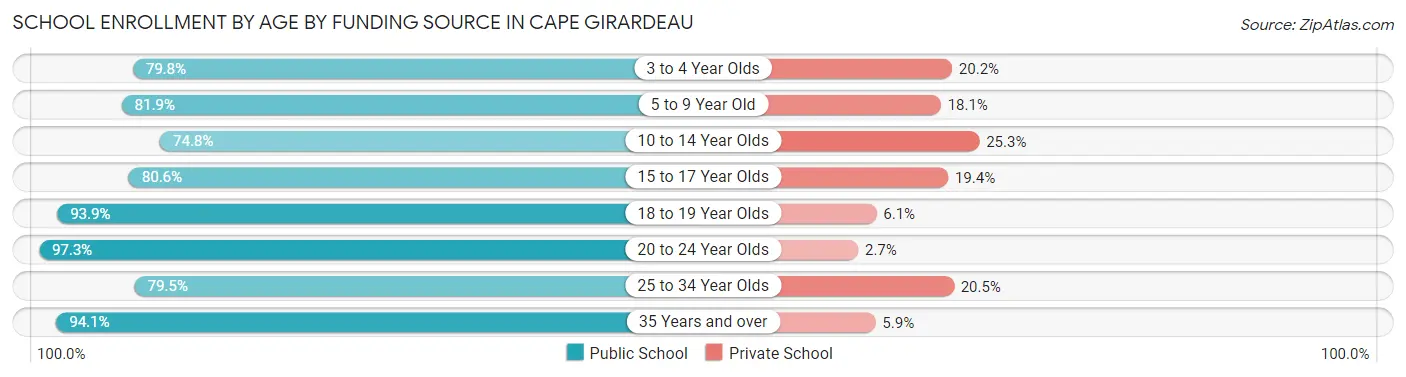
| Age Bracket | Public School | Private School |
| 3 to 4 Year Olds | 301 (79.8%) | 76 (20.2%) |
| 5 to 9 Year Old | 1,537 (81.9%) | 339 (18.1%) |
| 10 to 14 Year Olds | 1,427 (74.8%) | 482 (25.3%) |
| 15 to 17 Year Olds | 796 (80.6%) | 192 (19.4%) |
| 18 to 19 Year Olds | 1,776 (93.9%) | 115 (6.1%) |
| 20 to 24 Year Olds | 3,592 (97.3%) | 99 (2.7%) |
| 25 to 34 Year Olds | 489 (79.5%) | 126 (20.5%) |
| 35 Years and over | 430 (94.1%) | 27 (5.9%) |
| Total | 10,352 (87.7%) | 1,452 (12.3%) |
Educational Attainment by Field of Study in Cape Girardeau
Education (1,613 | 17.2%), science & technology (1,437 | 15.3%), business (1,276 | 13.6%), arts & humanities (857 | 9.1%), and communications (687 | 7.3%) are the most common fields of study among 9,405 individuals in Cape Girardeau who have obtained a bachelor's degree or higher.
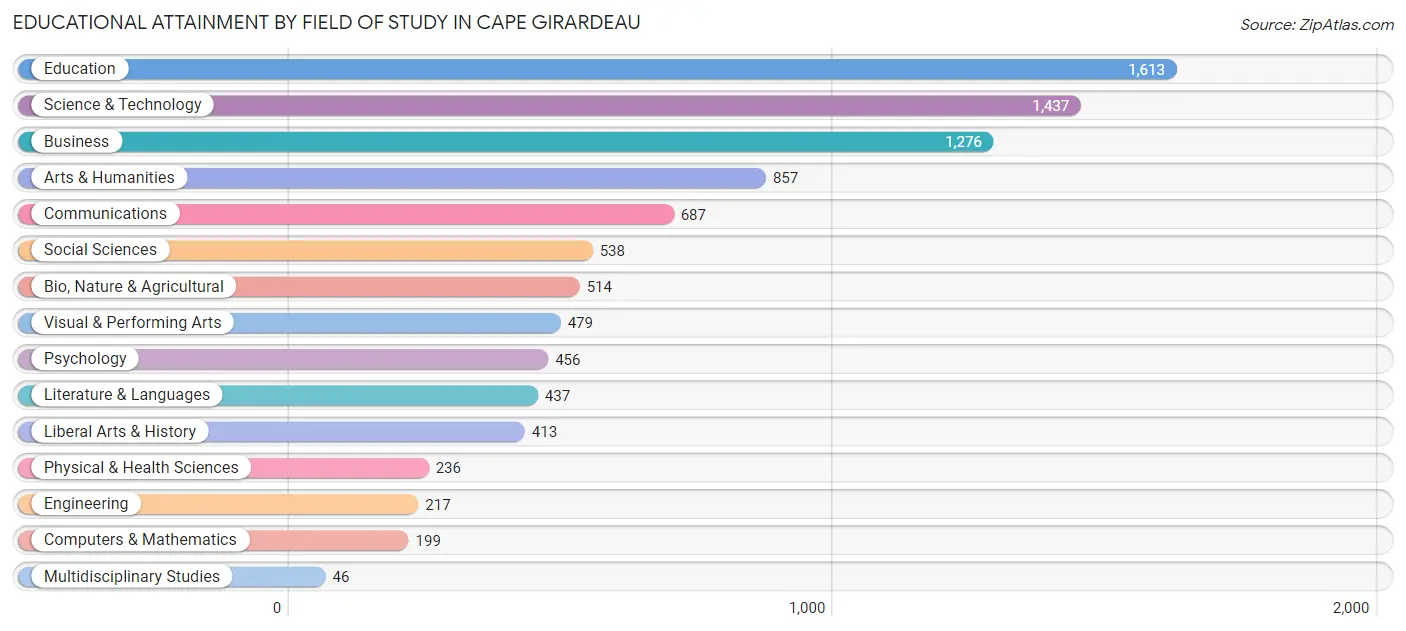
| Field of Study | # Graduates | % Graduates |
| Computers & Mathematics | 199 | 2.1% |
| Bio, Nature & Agricultural | 514 | 5.5% |
| Physical & Health Sciences | 236 | 2.5% |
| Psychology | 456 | 4.9% |
| Social Sciences | 538 | 5.7% |
| Engineering | 217 | 2.3% |
| Multidisciplinary Studies | 46 | 0.5% |
| Science & Technology | 1,437 | 15.3% |
| Business | 1,276 | 13.6% |
| Education | 1,613 | 17.2% |
| Literature & Languages | 437 | 4.6% |
| Liberal Arts & History | 413 | 4.4% |
| Visual & Performing Arts | 479 | 5.1% |
| Communications | 687 | 7.3% |
| Arts & Humanities | 857 | 9.1% |
| Total | 9,405 | 100.0% |
Transportation & Commute in Cape Girardeau
Vehicle Availability by Sex in Cape Girardeau
The most prevalent vehicle ownership categories in Cape Girardeau are males with 2 vehicles (3,734, accounting for 39.9%) and females with 2 vehicles (3,782, making up 38.4%).
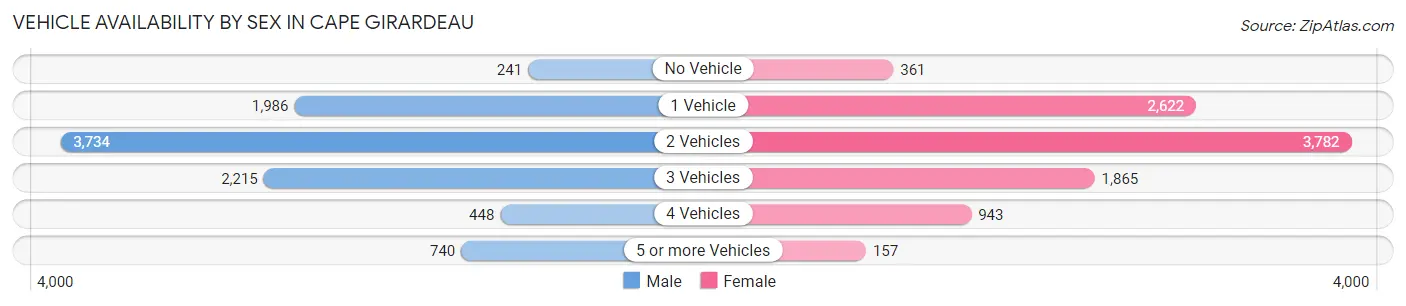
| Vehicles Available | Male | Female |
| No Vehicle | 241 (2.6%) | 361 (3.7%) |
| 1 Vehicle | 1,986 (21.2%) | 2,622 (27.0%) |
| 2 Vehicles | 3,734 (39.9%) | 3,782 (38.9%) |
| 3 Vehicles | 2,215 (23.6%) | 1,865 (19.2%) |
| 4 Vehicles | 448 (4.8%) | 943 (9.7%) |
| 5 or more Vehicles | 740 (7.9%) | 157 (1.6%) |
| Total | 9,364 (100.0%) | 9,730 (100.0%) |
Commute Time in Cape Girardeau
The most frequently occuring commute durations in Cape Girardeau are 10 to 14 minutes (5,259 commuters, 29.0%), 5 to 9 minutes (4,559 commuters, 25.1%), and 15 to 19 minutes (2,969 commuters, 16.4%).
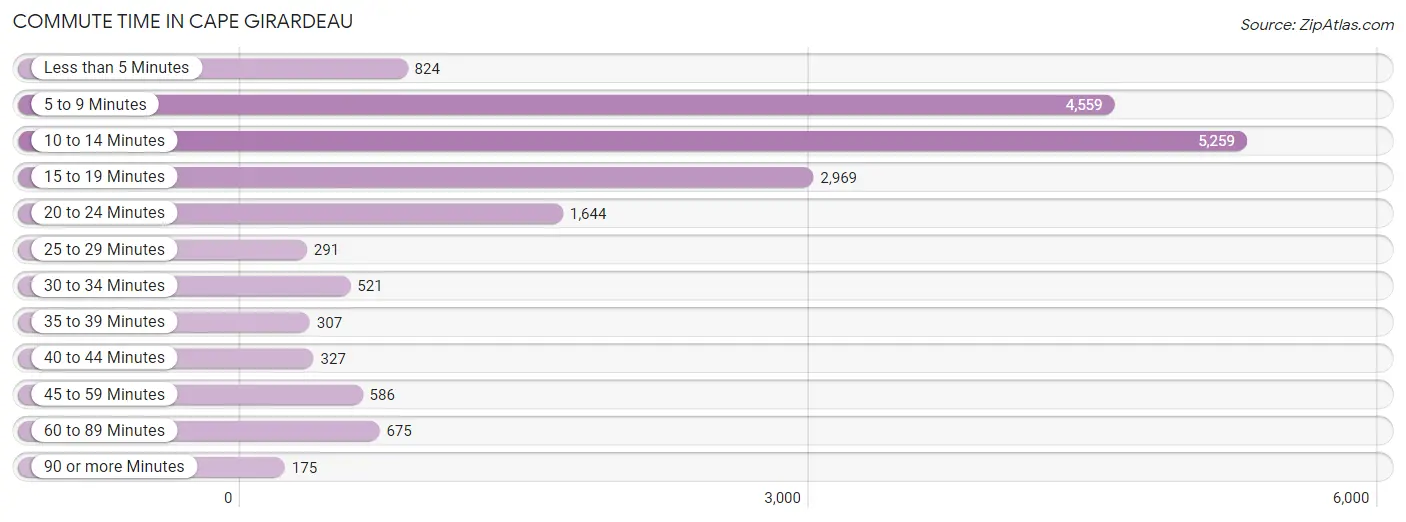
| Commute Time | # Commuters | % Commuters |
| Less than 5 Minutes | 824 | 4.5% |
| 5 to 9 Minutes | 4,559 | 25.1% |
| 10 to 14 Minutes | 5,259 | 29.0% |
| 15 to 19 Minutes | 2,969 | 16.4% |
| 20 to 24 Minutes | 1,644 | 9.1% |
| 25 to 29 Minutes | 291 | 1.6% |
| 30 to 34 Minutes | 521 | 2.9% |
| 35 to 39 Minutes | 307 | 1.7% |
| 40 to 44 Minutes | 327 | 1.8% |
| 45 to 59 Minutes | 586 | 3.2% |
| 60 to 89 Minutes | 675 | 3.7% |
| 90 or more Minutes | 175 | 1.0% |
Commute Time by Sex in Cape Girardeau
The most common commute times in Cape Girardeau are 10 to 14 minutes (2,395 commuters, 27.1%) for males and 10 to 14 minutes (2,864 commuters, 30.8%) for females.
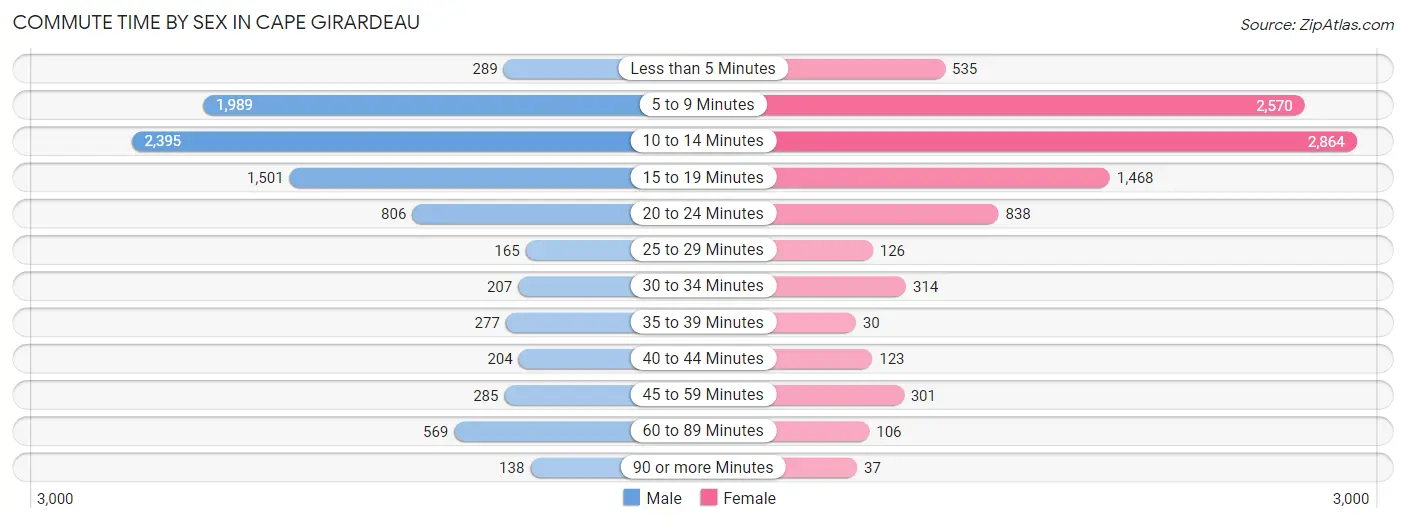
| Commute Time | Male | Female |
| Less than 5 Minutes | 289 (3.3%) | 535 (5.8%) |
| 5 to 9 Minutes | 1,989 (22.5%) | 2,570 (27.6%) |
| 10 to 14 Minutes | 2,395 (27.1%) | 2,864 (30.8%) |
| 15 to 19 Minutes | 1,501 (17.0%) | 1,468 (15.8%) |
| 20 to 24 Minutes | 806 (9.1%) | 838 (9.0%) |
| 25 to 29 Minutes | 165 (1.9%) | 126 (1.3%) |
| 30 to 34 Minutes | 207 (2.4%) | 314 (3.4%) |
| 35 to 39 Minutes | 277 (3.1%) | 30 (0.3%) |
| 40 to 44 Minutes | 204 (2.3%) | 123 (1.3%) |
| 45 to 59 Minutes | 285 (3.2%) | 301 (3.2%) |
| 60 to 89 Minutes | 569 (6.5%) | 106 (1.1%) |
| 90 or more Minutes | 138 (1.6%) | 37 (0.4%) |
Time of Departure to Work by Sex in Cape Girardeau
The most frequent times of departure to work in Cape Girardeau are 7:00 AM to 7:29 AM (1,329, 15.1%) for males and 7:30 AM to 7:59 AM (2,345, 25.2%) for females.
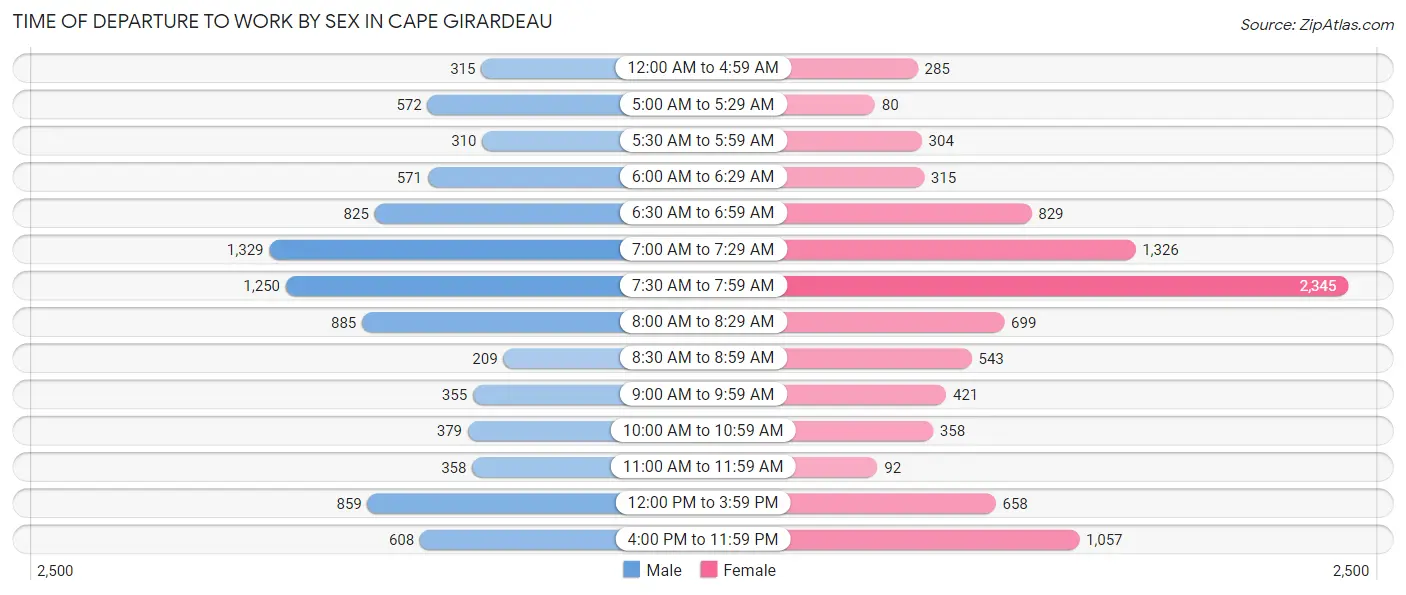
| Time of Departure | Male | Female |
| 12:00 AM to 4:59 AM | 315 (3.6%) | 285 (3.1%) |
| 5:00 AM to 5:29 AM | 572 (6.5%) | 80 (0.9%) |
| 5:30 AM to 5:59 AM | 310 (3.5%) | 304 (3.3%) |
| 6:00 AM to 6:29 AM | 571 (6.5%) | 315 (3.4%) |
| 6:30 AM to 6:59 AM | 825 (9.3%) | 829 (8.9%) |
| 7:00 AM to 7:29 AM | 1,329 (15.1%) | 1,326 (14.2%) |
| 7:30 AM to 7:59 AM | 1,250 (14.2%) | 2,345 (25.2%) |
| 8:00 AM to 8:29 AM | 885 (10.0%) | 699 (7.5%) |
| 8:30 AM to 8:59 AM | 209 (2.4%) | 543 (5.8%) |
| 9:00 AM to 9:59 AM | 355 (4.0%) | 421 (4.5%) |
| 10:00 AM to 10:59 AM | 379 (4.3%) | 358 (3.8%) |
| 11:00 AM to 11:59 AM | 358 (4.1%) | 92 (1.0%) |
| 12:00 PM to 3:59 PM | 859 (9.7%) | 658 (7.1%) |
| 4:00 PM to 11:59 PM | 608 (6.9%) | 1,057 (11.4%) |
| Total | 8,825 (100.0%) | 9,312 (100.0%) |
Housing Occupancy in Cape Girardeau
Occupancy by Ownership in Cape Girardeau
Of the total 15,865 dwellings in Cape Girardeau, owner-occupied units account for 8,544 (53.8%), while renter-occupied units make up 7,321 (46.2%).
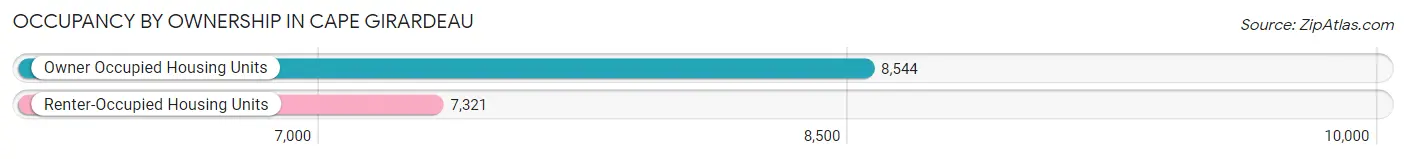
| Occupancy | # Housing Units | % Housing Units |
| Owner Occupied Housing Units | 8,544 | 53.8% |
| Renter-Occupied Housing Units | 7,321 | 46.2% |
| Total Occupied Housing Units | 15,865 | 100.0% |
Occupancy by Household Size in Cape Girardeau
| Household Size | # Housing Units | % Housing Units |
| 1-Person Household | 5,821 | 36.7% |
| 2-Person Household | 5,594 | 35.3% |
| 3-Person Household | 2,027 | 12.8% |
| 4+ Person Household | 2,423 | 15.3% |
| Total Housing Units | 15,865 | 100.0% |
Occupancy by Ownership by Household Size in Cape Girardeau
| Household Size | Owner-occupied | Renter-occupied |
| 1-Person Household | 2,551 (43.8%) | 3,270 (56.2%) |
| 2-Person Household | 3,465 (61.9%) | 2,129 (38.1%) |
| 3-Person Household | 1,217 (60.0%) | 810 (40.0%) |
| 4+ Person Household | 1,311 (54.1%) | 1,112 (45.9%) |
| Total Housing Units | 8,544 (53.8%) | 7,321 (46.2%) |
Occupancy by Educational Attainment in Cape Girardeau
| Household Size | Owner-occupied | Renter-occupied |
| Less than High School | 558 (50.7%) | 542 (49.3%) |
| High School Diploma | 2,077 (49.7%) | 2,102 (50.3%) |
| College/Associate Degree | 1,976 (43.8%) | 2,538 (56.2%) |
| Bachelor's Degree or higher | 3,933 (64.8%) | 2,139 (35.2%) |
Occupancy by Age of Householder in Cape Girardeau
| Age Bracket | # Households | % Households |
| Under 35 Years | 4,441 | 28.0% |
| 35 to 44 Years | 2,337 | 14.7% |
| 45 to 54 Years | 2,092 | 13.2% |
| 55 to 64 Years | 2,464 | 15.5% |
| 65 to 74 Years | 2,282 | 14.4% |
| 75 to 84 Years | 1,537 | 9.7% |
| 85 Years and Over | 712 | 4.5% |
| Total | 15,865 | 100.0% |
Housing Finances in Cape Girardeau
Median Income by Occupancy in Cape Girardeau
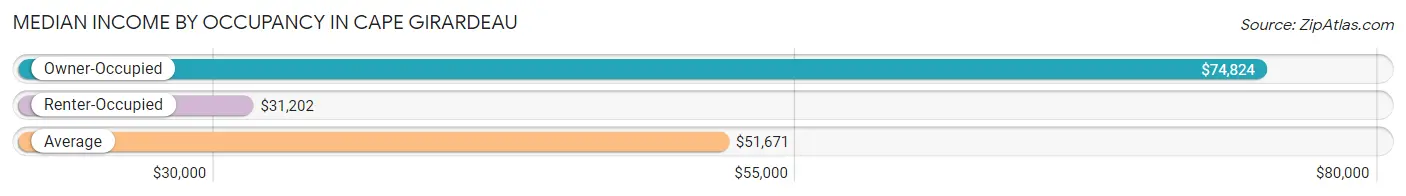
| Occupancy Type | # Households | Median Income |
| Owner-Occupied | 8,544 (53.8%) | $74,824 |
| Renter-Occupied | 7,321 (46.2%) | $31,202 |
| Average | 15,865 (100.0%) | $51,671 |
Occupancy by Householder Income Bracket in Cape Girardeau
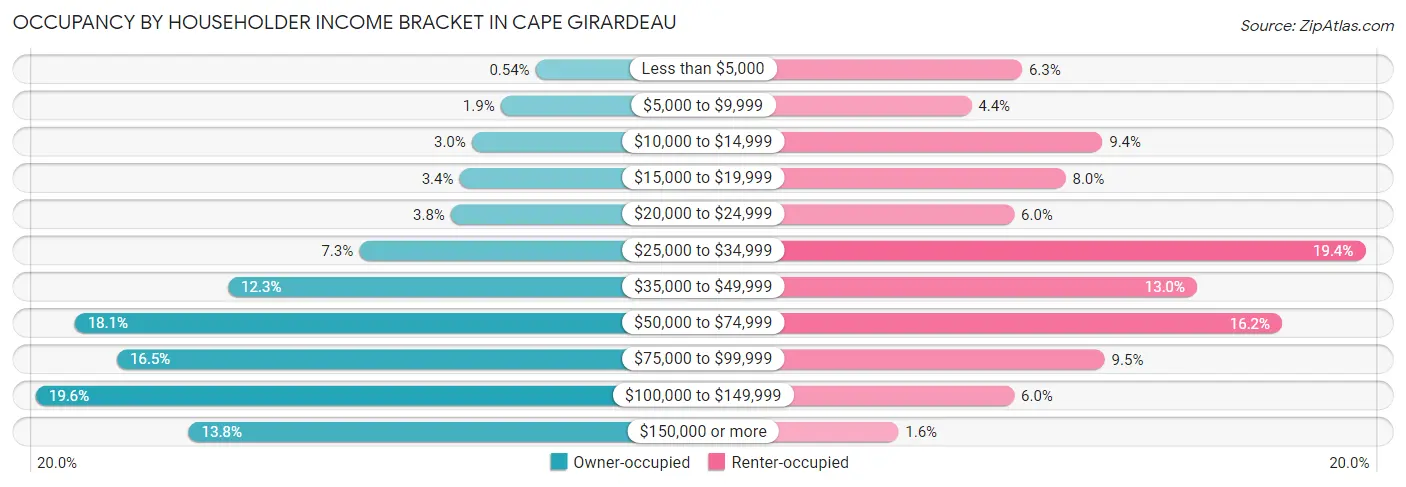
| Income Bracket | Owner-occupied | Renter-occupied |
| Less than $5,000 | 46 (0.5%) | 464 (6.3%) |
| $5,000 to $9,999 | 160 (1.9%) | 323 (4.4%) |
| $10,000 to $14,999 | 254 (3.0%) | 688 (9.4%) |
| $15,000 to $19,999 | 294 (3.4%) | 586 (8.0%) |
| $20,000 to $24,999 | 322 (3.8%) | 442 (6.0%) |
| $25,000 to $34,999 | 620 (7.3%) | 1,421 (19.4%) |
| $35,000 to $49,999 | 1,047 (12.2%) | 952 (13.0%) |
| $50,000 to $74,999 | 1,546 (18.1%) | 1,189 (16.2%) |
| $75,000 to $99,999 | 1,408 (16.5%) | 695 (9.5%) |
| $100,000 to $149,999 | 1,672 (19.6%) | 442 (6.0%) |
| $150,000 or more | 1,175 (13.8%) | 119 (1.6%) |
| Total | 8,544 (100.0%) | 7,321 (100.0%) |
Monthly Housing Cost Tiers in Cape Girardeau
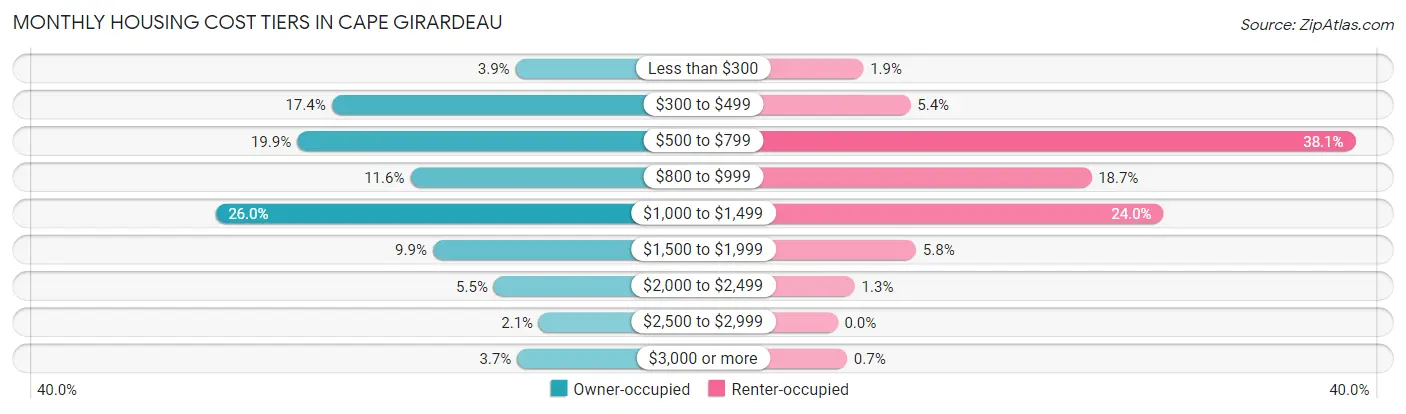
| Monthly Cost | Owner-occupied | Renter-occupied |
| Less than $300 | 329 (3.8%) | 139 (1.9%) |
| $300 to $499 | 1,487 (17.4%) | 393 (5.4%) |
| $500 to $799 | 1,704 (19.9%) | 2,792 (38.1%) |
| $800 to $999 | 991 (11.6%) | 1,368 (18.7%) |
| $1,000 to $1,499 | 2,218 (26.0%) | 1,758 (24.0%) |
| $1,500 to $1,999 | 849 (9.9%) | 423 (5.8%) |
| $2,000 to $2,499 | 466 (5.4%) | 93 (1.3%) |
| $2,500 to $2,999 | 181 (2.1%) | 0 (0.0%) |
| $3,000 or more | 319 (3.7%) | 51 (0.7%) |
| Total | 8,544 (100.0%) | 7,321 (100.0%) |
Physical Housing Characteristics in Cape Girardeau
Housing Structures in Cape Girardeau
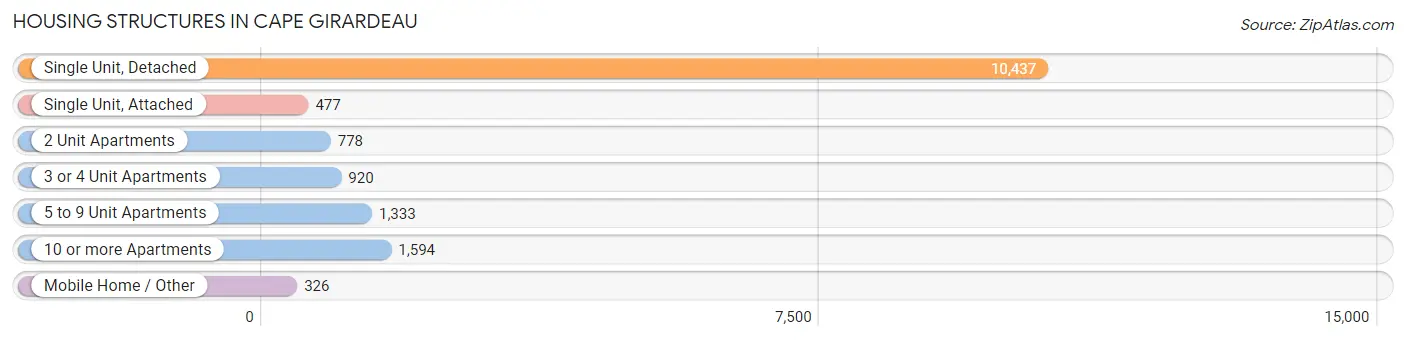
| Structure Type | # Housing Units | % Housing Units |
| Single Unit, Detached | 10,437 | 65.8% |
| Single Unit, Attached | 477 | 3.0% |
| 2 Unit Apartments | 778 | 4.9% |
| 3 or 4 Unit Apartments | 920 | 5.8% |
| 5 to 9 Unit Apartments | 1,333 | 8.4% |
| 10 or more Apartments | 1,594 | 10.1% |
| Mobile Home / Other | 326 | 2.1% |
| Total | 15,865 | 100.0% |
Housing Structures by Occupancy in Cape Girardeau
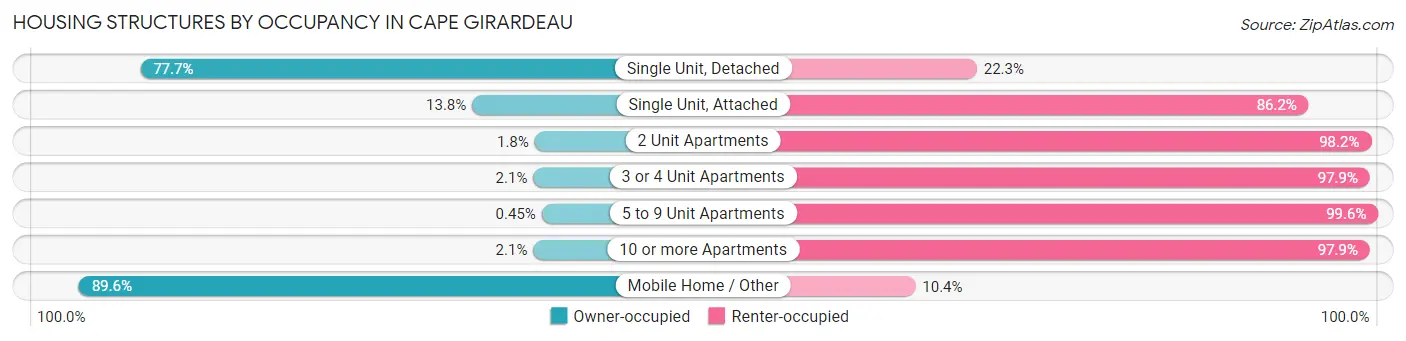
| Structure Type | Owner-occupied | Renter-occupied |
| Single Unit, Detached | 8,114 (77.7%) | 2,323 (22.3%) |
| Single Unit, Attached | 66 (13.8%) | 411 (86.2%) |
| 2 Unit Apartments | 14 (1.8%) | 764 (98.2%) |
| 3 or 4 Unit Apartments | 19 (2.1%) | 901 (97.9%) |
| 5 to 9 Unit Apartments | 6 (0.4%) | 1,327 (99.6%) |
| 10 or more Apartments | 33 (2.1%) | 1,561 (97.9%) |
| Mobile Home / Other | 292 (89.6%) | 34 (10.4%) |
| Total | 8,544 (53.8%) | 7,321 (46.2%) |
Housing Structures by Number of Rooms in Cape Girardeau
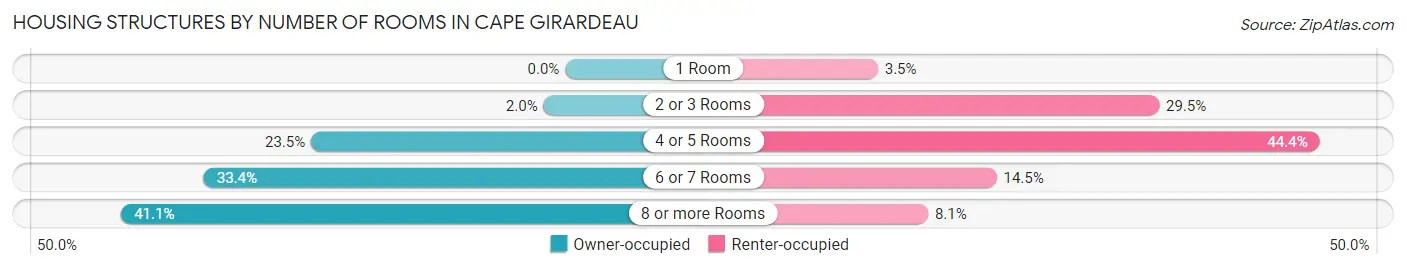
| Number of Rooms | Owner-occupied | Renter-occupied |
| 1 Room | 0 (0.0%) | 256 (3.5%) |
| 2 or 3 Rooms | 172 (2.0%) | 2,161 (29.5%) |
| 4 or 5 Rooms | 2,009 (23.5%) | 3,247 (44.4%) |
| 6 or 7 Rooms | 2,855 (33.4%) | 1,061 (14.5%) |
| 8 or more Rooms | 3,508 (41.1%) | 596 (8.1%) |
| Total | 8,544 (100.0%) | 7,321 (100.0%) |
Housing Structure by Heating Type in Cape Girardeau
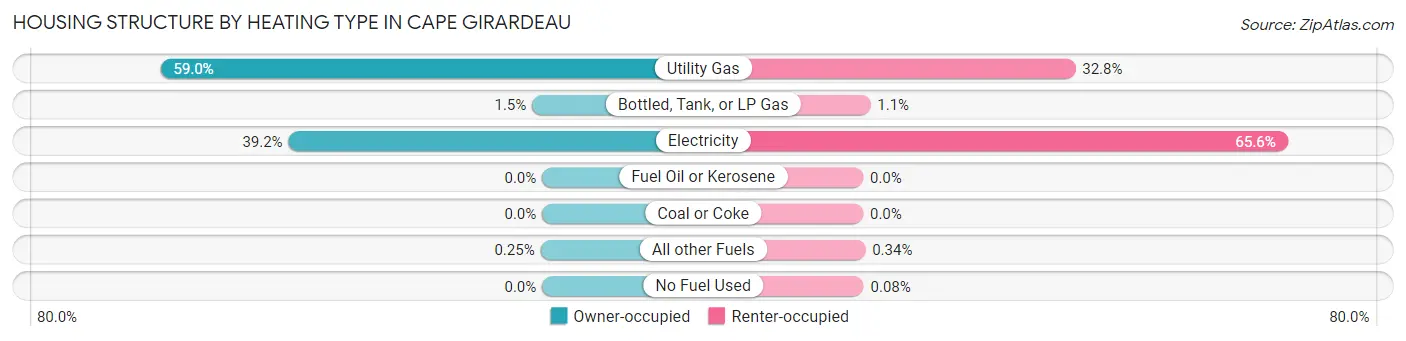
| Heating Type | Owner-occupied | Renter-occupied |
| Utility Gas | 5,041 (59.0%) | 2,402 (32.8%) |
| Bottled, Tank, or LP Gas | 132 (1.5%) | 83 (1.1%) |
| Electricity | 3,350 (39.2%) | 4,805 (65.6%) |
| Fuel Oil or Kerosene | 0 (0.0%) | 0 (0.0%) |
| Coal or Coke | 0 (0.0%) | 0 (0.0%) |
| All other Fuels | 21 (0.3%) | 25 (0.3%) |
| No Fuel Used | 0 (0.0%) | 6 (0.1%) |
| Total | 8,544 (100.0%) | 7,321 (100.0%) |
Household Vehicle Usage in Cape Girardeau
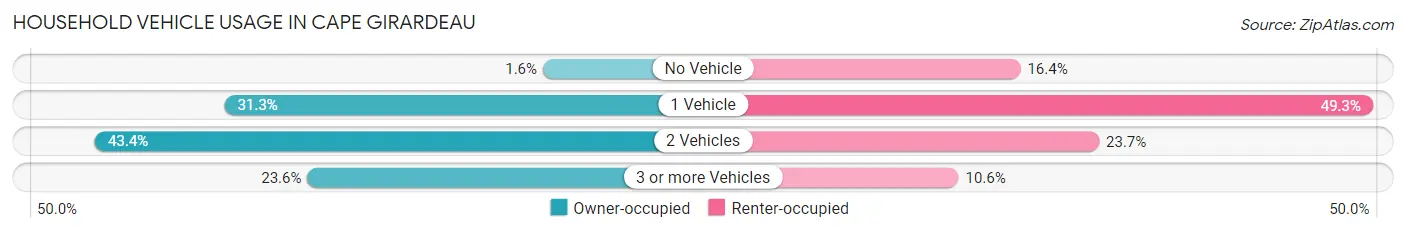
| Vehicles per Household | Owner-occupied | Renter-occupied |
| No Vehicle | 138 (1.6%) | 1,200 (16.4%) |
| 1 Vehicle | 2,678 (31.3%) | 3,607 (49.3%) |
| 2 Vehicles | 3,711 (43.4%) | 1,737 (23.7%) |
| 3 or more Vehicles | 2,017 (23.6%) | 777 (10.6%) |
| Total | 8,544 (100.0%) | 7,321 (100.0%) |
Real Estate & Mortgages in Cape Girardeau
Real Estate and Mortgage Overview in Cape Girardeau
| Characteristic | Without Mortgage | With Mortgage |
| Housing Units | 3,289 | 5,255 |
| Median Property Value | $164,200 | $185,800 |
| Median Household Income | $50,388 | $980 |
| Monthly Housing Costs | $487 | $319 |
| Real Estate Taxes | $1,281 | $99 |
Property Value by Mortgage Status in Cape Girardeau
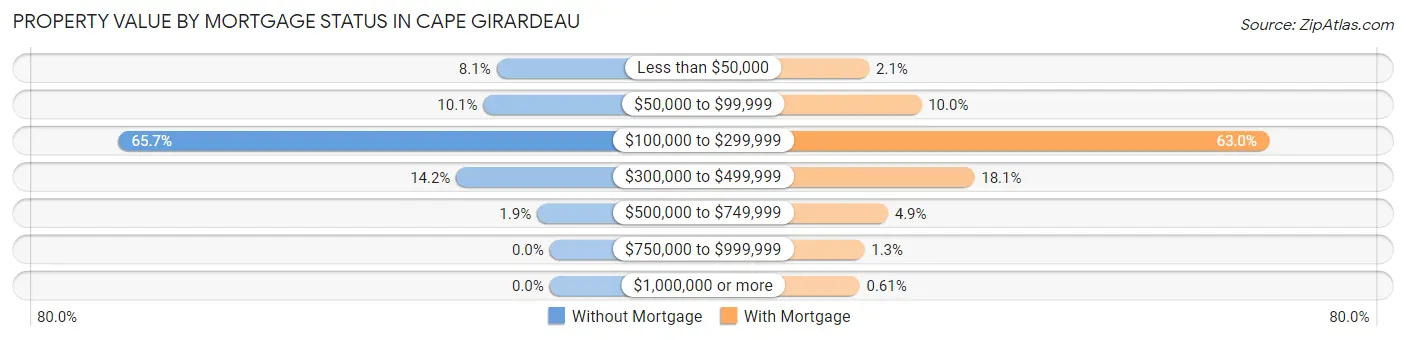
| Property Value | Without Mortgage | With Mortgage |
| Less than $50,000 | 266 (8.1%) | 109 (2.1%) |
| $50,000 to $99,999 | 332 (10.1%) | 526 (10.0%) |
| $100,000 to $299,999 | 2,160 (65.7%) | 3,309 (63.0%) |
| $300,000 to $499,999 | 468 (14.2%) | 951 (18.1%) |
| $500,000 to $749,999 | 63 (1.9%) | 258 (4.9%) |
| $750,000 to $999,999 | 0 (0.0%) | 70 (1.3%) |
| $1,000,000 or more | 0 (0.0%) | 32 (0.6%) |
| Total | 3,289 (100.0%) | 5,255 (100.0%) |
Household Income by Mortgage Status in Cape Girardeau
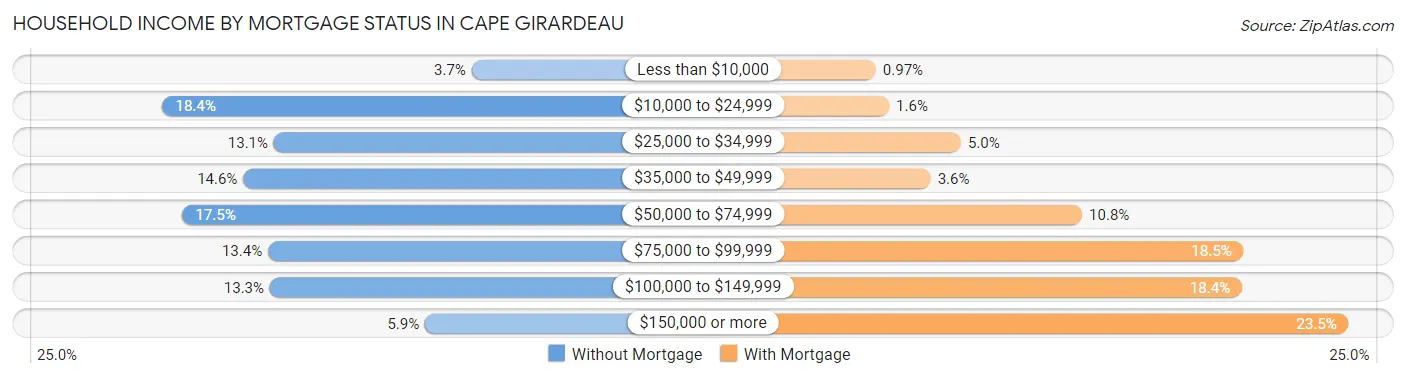
| Household Income | Without Mortgage | With Mortgage |
| Less than $10,000 | 122 (3.7%) | 51 (1.0%) |
| $10,000 to $24,999 | 606 (18.4%) | 84 (1.6%) |
| $25,000 to $34,999 | 432 (13.1%) | 264 (5.0%) |
| $35,000 to $49,999 | 480 (14.6%) | 188 (3.6%) |
| $50,000 to $74,999 | 575 (17.5%) | 567 (10.8%) |
| $75,000 to $99,999 | 441 (13.4%) | 971 (18.5%) |
| $100,000 to $149,999 | 438 (13.3%) | 967 (18.4%) |
| $150,000 or more | 195 (5.9%) | 1,234 (23.5%) |
| Total | 3,289 (100.0%) | 5,255 (100.0%) |
Property Value to Household Income Ratio in Cape Girardeau
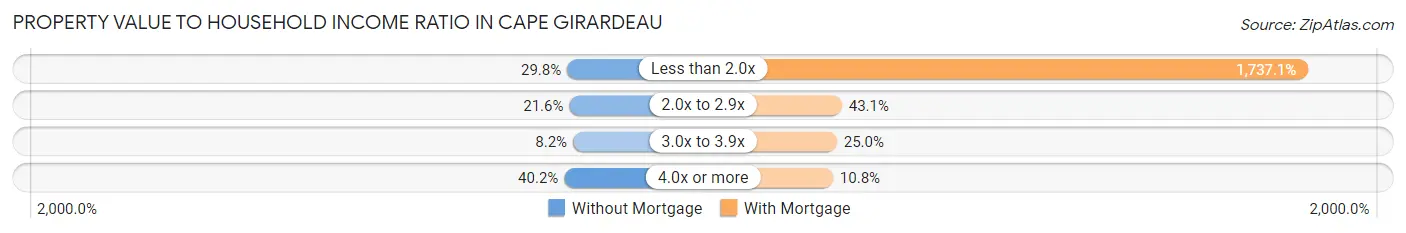
| Value-to-Income Ratio | Without Mortgage | With Mortgage |
| Less than 2.0x | 980 (29.8%) | 91,284 (1,737.1%) |
| 2.0x to 2.9x | 709 (21.6%) | 2,267 (43.1%) |
| 3.0x to 3.9x | 271 (8.2%) | 1,311 (24.9%) |
| 4.0x or more | 1,323 (40.2%) | 567 (10.8%) |
| Total | 3,289 (100.0%) | 5,255 (100.0%) |
Real Estate Taxes by Mortgage Status in Cape Girardeau
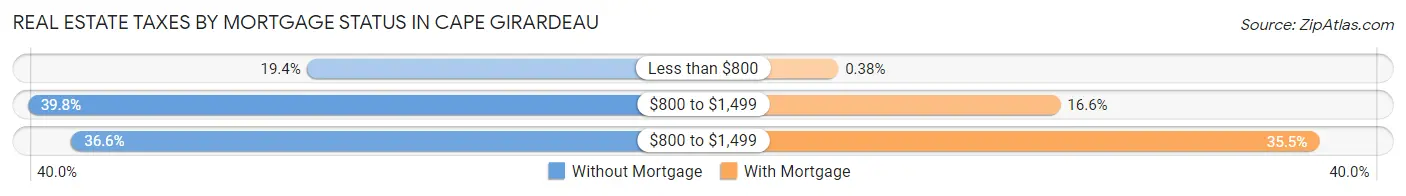
| Property Taxes | Without Mortgage | With Mortgage |
| Less than $800 | 638 (19.4%) | 20 (0.4%) |
| $800 to $1,499 | 1,308 (39.8%) | 873 (16.6%) |
| $800 to $1,499 | 1,203 (36.6%) | 1,866 (35.5%) |
| Total | 3,289 (100.0%) | 5,255 (100.0%) |
Health & Disability in Cape Girardeau
Health Insurance Coverage by Age in Cape Girardeau
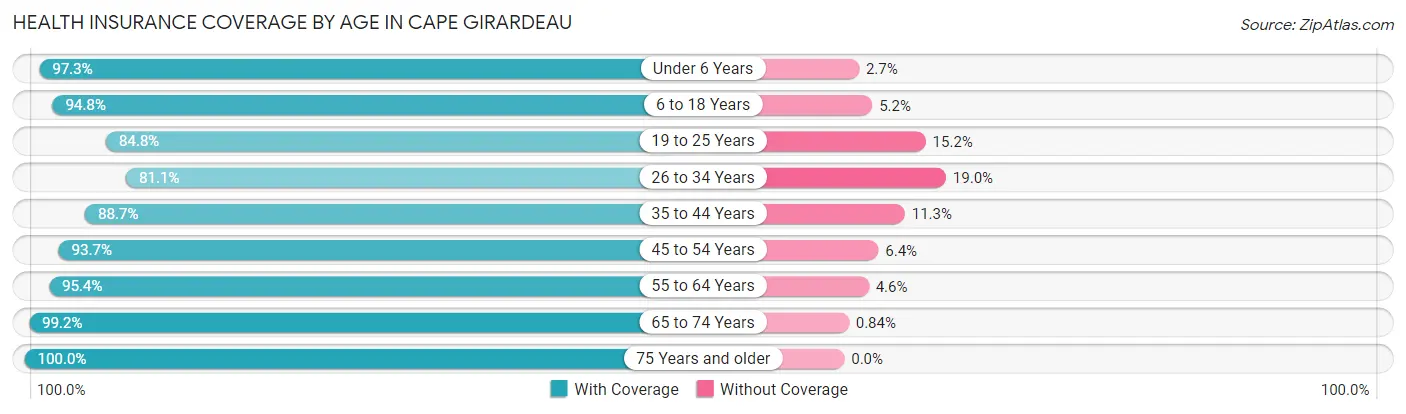
| Age Bracket | With Coverage | Without Coverage |
| Under 6 Years | 2,270 (97.3%) | 64 (2.7%) |
| 6 to 18 Years | 5,509 (94.8%) | 303 (5.2%) |
| 19 to 25 Years | 6,726 (84.8%) | 1,203 (15.2%) |
| 26 to 34 Years | 3,532 (81.0%) | 826 (19.0%) |
| 35 to 44 Years | 3,677 (88.7%) | 468 (11.3%) |
| 45 to 54 Years | 3,245 (93.6%) | 220 (6.4%) |
| 55 to 64 Years | 3,994 (95.4%) | 191 (4.6%) |
| 65 to 74 Years | 3,643 (99.2%) | 31 (0.8%) |
| 75 Years and older | 3,009 (100.0%) | 0 (0.0%) |
| Total | 35,605 (91.5%) | 3,306 (8.5%) |
Health Insurance Coverage by Citizenship Status in Cape Girardeau
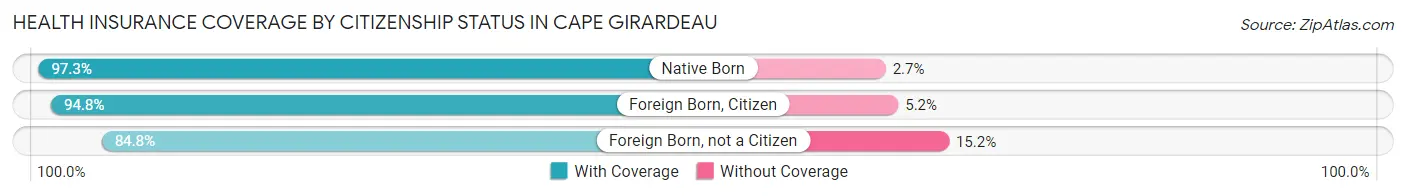
| Citizenship Status | With Coverage | Without Coverage |
| Native Born | 2,270 (97.3%) | 64 (2.7%) |
| Foreign Born, Citizen | 5,509 (94.8%) | 303 (5.2%) |
| Foreign Born, not a Citizen | 6,726 (84.8%) | 1,203 (15.2%) |
Health Insurance Coverage by Household Income in Cape Girardeau
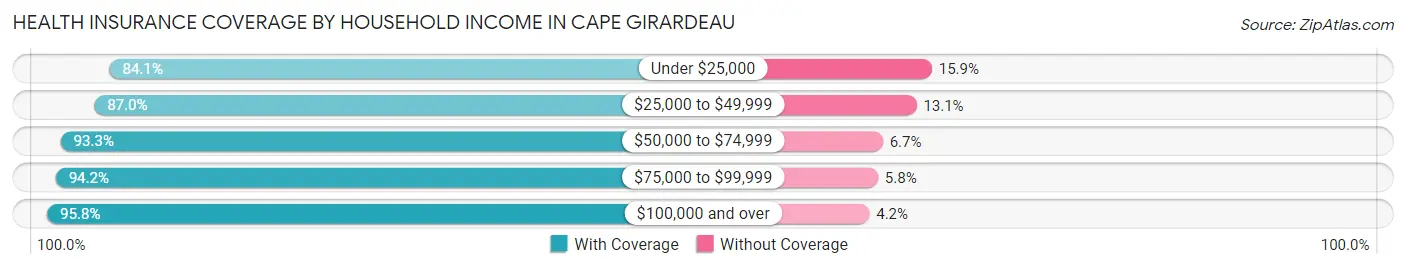
| Household Income | With Coverage | Without Coverage |
| Under $25,000 | 5,122 (84.1%) | 970 (15.9%) |
| $25,000 to $49,999 | 7,402 (87.0%) | 1,111 (13.1%) |
| $50,000 to $74,999 | 6,060 (93.3%) | 437 (6.7%) |
| $75,000 to $99,999 | 4,929 (94.2%) | 305 (5.8%) |
| $100,000 and over | 9,870 (95.8%) | 434 (4.2%) |
Public vs Private Health Insurance Coverage by Age in Cape Girardeau
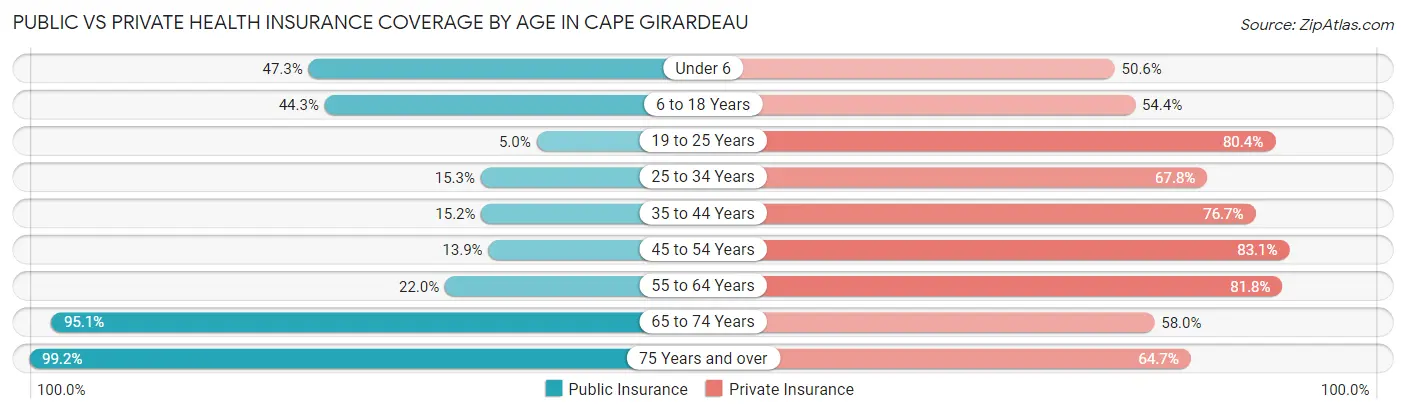
| Age Bracket | Public Insurance | Private Insurance |
| Under 6 | 1,104 (47.3%) | 1,182 (50.6%) |
| 6 to 18 Years | 2,574 (44.3%) | 3,163 (54.4%) |
| 19 to 25 Years | 394 (5.0%) | 6,375 (80.4%) |
| 25 to 34 Years | 668 (15.3%) | 2,955 (67.8%) |
| 35 to 44 Years | 631 (15.2%) | 3,181 (76.7%) |
| 45 to 54 Years | 482 (13.9%) | 2,878 (83.1%) |
| 55 to 64 Years | 919 (22.0%) | 3,422 (81.8%) |
| 65 to 74 Years | 3,494 (95.1%) | 2,131 (58.0%) |
| 75 Years and over | 2,984 (99.2%) | 1,948 (64.7%) |
| Total | 13,250 (34.1%) | 27,235 (70.0%) |
Disability Status by Sex by Age in Cape Girardeau
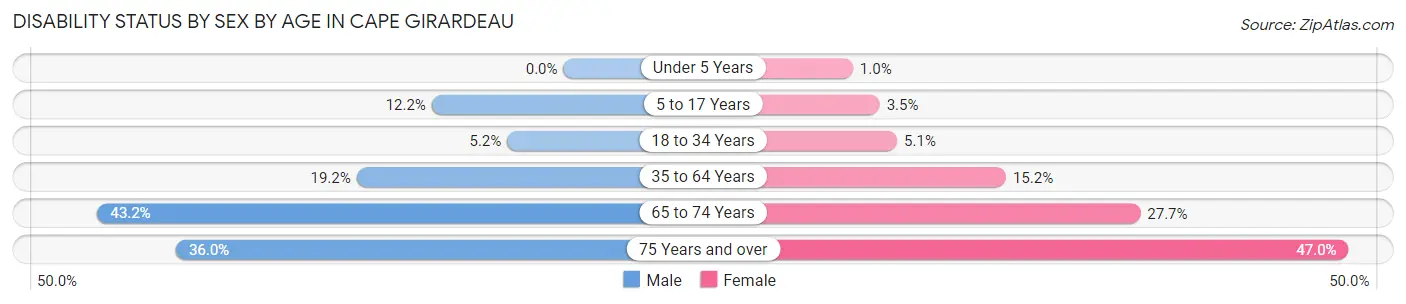
| Age Bracket | Male | Female |
| Under 5 Years | 0 (0.0%) | 11 (1.0%) |
| 5 to 17 Years | 305 (12.2%) | 86 (3.5%) |
| 18 to 34 Years | 339 (5.2%) | 353 (5.1%) |
| 35 to 64 Years | 1,128 (19.2%) | 902 (15.2%) |
| 65 to 74 Years | 707 (43.2%) | 565 (27.7%) |
| 75 Years and over | 399 (35.9%) | 893 (47.0%) |
Disability Class by Sex by Age in Cape Girardeau
Disability Class: Hearing Difficulty
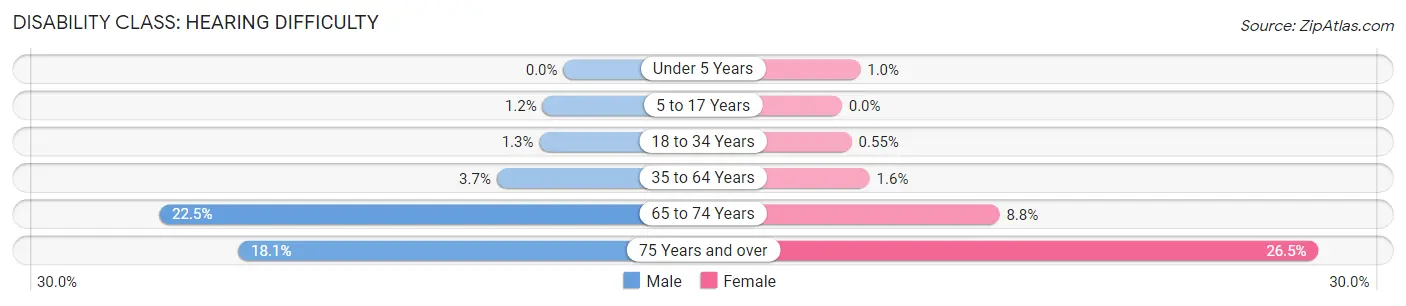
| Age Bracket | Male | Female |
| Under 5 Years | 0 (0.0%) | 11 (1.0%) |
| 5 to 17 Years | 29 (1.2%) | 0 (0.0%) |
| 18 to 34 Years | 87 (1.3%) | 38 (0.5%) |
| 35 to 64 Years | 218 (3.7%) | 92 (1.5%) |
| 65 to 74 Years | 368 (22.5%) | 179 (8.8%) |
| 75 Years and over | 201 (18.1%) | 504 (26.5%) |
Disability Class: Vision Difficulty
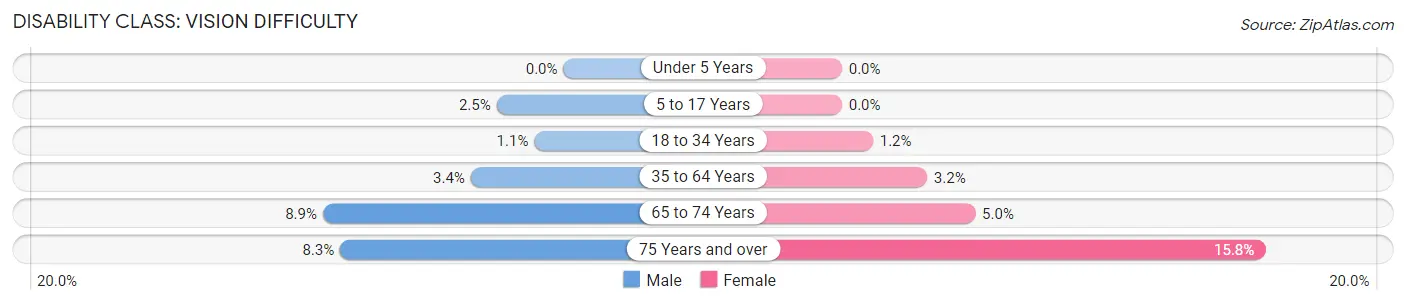
| Age Bracket | Male | Female |
| Under 5 Years | 0 (0.0%) | 0 (0.0%) |
| 5 to 17 Years | 62 (2.5%) | 0 (0.0%) |
| 18 to 34 Years | 70 (1.1%) | 79 (1.1%) |
| 35 to 64 Years | 202 (3.4%) | 187 (3.2%) |
| 65 to 74 Years | 146 (8.9%) | 101 (5.0%) |
| 75 Years and over | 92 (8.3%) | 299 (15.8%) |
Disability Class: Cognitive Difficulty
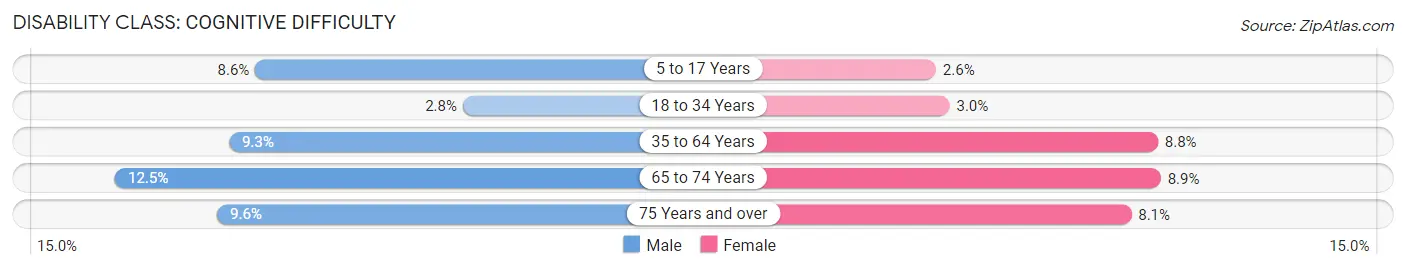
| Age Bracket | Male | Female |
| 5 to 17 Years | 214 (8.6%) | 64 (2.6%) |
| 18 to 34 Years | 182 (2.8%) | 206 (3.0%) |
| 35 to 64 Years | 547 (9.3%) | 521 (8.8%) |
| 65 to 74 Years | 204 (12.5%) | 181 (8.9%) |
| 75 Years and over | 107 (9.6%) | 153 (8.1%) |
Disability Class: Ambulatory Difficulty
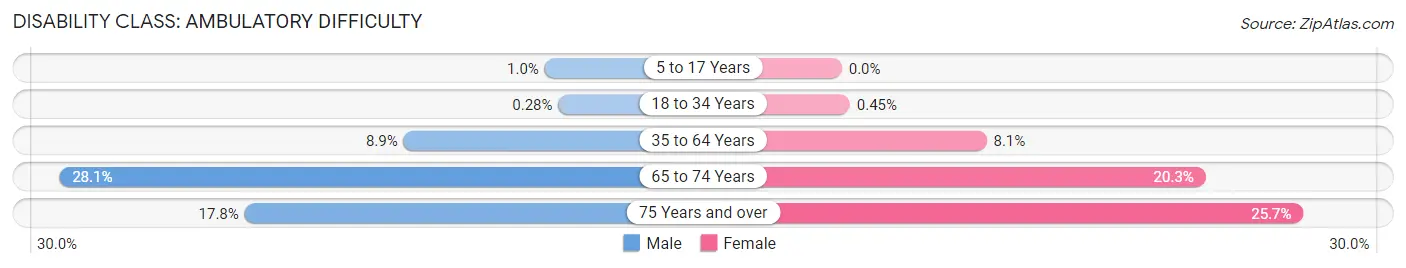
| Age Bracket | Male | Female |
| 5 to 17 Years | 26 (1.0%) | 0 (0.0%) |
| 18 to 34 Years | 18 (0.3%) | 31 (0.4%) |
| 35 to 64 Years | 523 (8.9%) | 477 (8.1%) |
| 65 to 74 Years | 459 (28.1%) | 413 (20.3%) |
| 75 Years and over | 197 (17.7%) | 488 (25.7%) |
Disability Class: Self-Care Difficulty
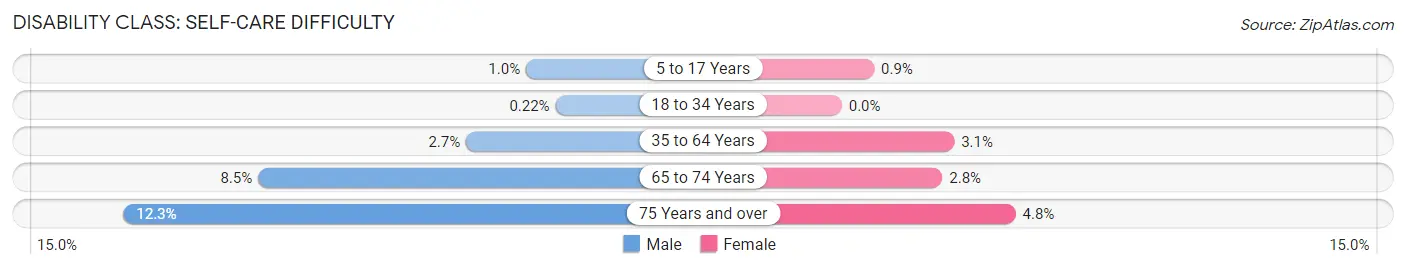
| Age Bracket | Male | Female |
| 5 to 17 Years | 26 (1.0%) | 22 (0.9%) |
| 18 to 34 Years | 14 (0.2%) | 0 (0.0%) |
| 35 to 64 Years | 159 (2.7%) | 185 (3.1%) |
| 65 to 74 Years | 139 (8.5%) | 57 (2.8%) |
| 75 Years and over | 136 (12.2%) | 92 (4.8%) |
Technology Access in Cape Girardeau
Computing Device Access in Cape Girardeau
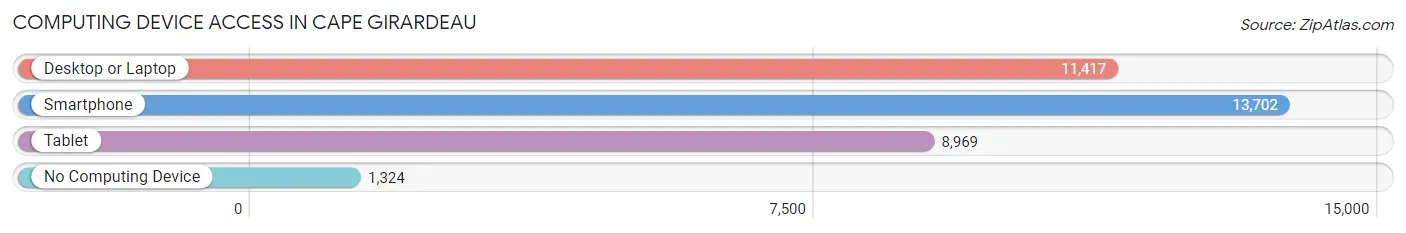
| Device Type | # Households | % Households |
| Desktop or Laptop | 11,417 | 72.0% |
| Smartphone | 13,702 | 86.4% |
| Tablet | 8,969 | 56.5% |
| No Computing Device | 1,324 | 8.4% |
| Total | 15,865 | 100.0% |
Internet Access in Cape Girardeau
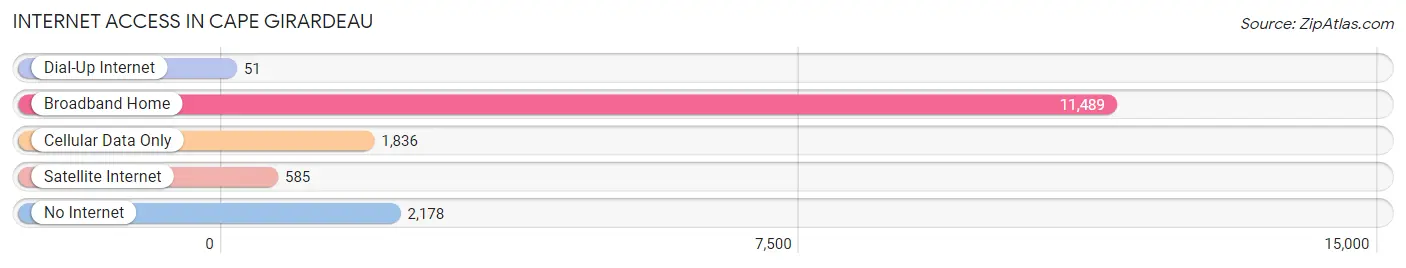
| Internet Type | # Households | % Households |
| Dial-Up Internet | 51 | 0.3% |
| Broadband Home | 11,489 | 72.4% |
| Cellular Data Only | 1,836 | 11.6% |
| Satellite Internet | 585 | 3.7% |
| No Internet | 2,178 | 13.7% |
| Total | 15,865 | 100.0% |
Cape Girardeau Summary
Cape Girardeau, Missouri is a city located in the southeastern corner of the state, along the Mississippi River. It is the county seat of Cape Girardeau County and the largest city in the region. The city has a population of approximately 37,000 people and is the principal city of the Cape Girardeau Metropolitan Statistical Area, which includes all of Cape Girardeau and Bollinger counties.
History
Cape Girardeau was founded in 1793 by French settlers, who named it after the nearby cape. The city was originally part of the Louisiana Territory, and was later part of the Missouri Territory. In 1812, the city was incorporated as a town, and in 1843, it was incorporated as a city.
During the Civil War, the city was the site of several battles, including the Battle of Cape Girardeau. After the war, the city experienced a period of growth and prosperity, and by the early 20th century, it had become a major transportation hub, with several railroads and the Mississippi River providing access to the rest of the country.
Geography
Cape Girardeau is located in the southeastern corner of Missouri, along the Mississippi River. The city is situated on a bluff overlooking the river, and is surrounded by rolling hills and forests. The city has a total area of 16.3 square miles, of which 15.9 square miles is land and 0.4 square miles is water.
Economy
Cape Girardeau’s economy is largely based on healthcare, education, and manufacturing. The city is home to several major employers, including Southeast Missouri State University, Saint Francis Medical Center, and Procter & Gamble. The city also has a thriving tourism industry, with several attractions, including the Cape Splash Family Aquatic Center, the Cape Girardeau Conservation Nature Center, and the Cape Girardeau Historic District.
Demographics
As of the 2010 census, the population of Cape Girardeau was 37,941. The racial makeup of the city was 79.2% White, 15.3% African American, 0.4% Native American, 1.2% Asian, 0.1% Pacific Islander, 1.2% from other races, and 2.6% from two or more races. Hispanic or Latino of any race were 3.3% of the population.
The median income for a household in the city was $37,837, and the median income for a family was $48,919. The per capita income for the city was $20,945. About 14.2% of families and 19.2% of the population were below the poverty line, including 28.2% of those under age 18 and 8.7% of those age 65 or over.
Common Questions
What is Per Capita Income in Cape Girardeau?
Per Capita income in Cape Girardeau is $29,907.
What is the Median Family Income in Cape Girardeau?
Median Family Income in Cape Girardeau is $74,882.
What is the Median Household income in Cape Girardeau?
Median Household Income in Cape Girardeau is $51,671.
What is Income or Wage Gap in Cape Girardeau?
Income or Wage Gap in Cape Girardeau is 21.8%.
Women in Cape Girardeau earn 78.2 cents for every dollar earned by a man.
What is Family Income Deficit in Cape Girardeau?
Family Income Deficit in Cape Girardeau is $10,367.
Families that are below poverty line in Cape Girardeau earn $10,367 less on average than the poverty threshold level.
What is Inequality or Gini Index in Cape Girardeau?
Inequality or Gini Index in Cape Girardeau is 0.47.
What is the Total Population of Cape Girardeau?
Total Population of Cape Girardeau is 39,795.
What is the Total Male Population of Cape Girardeau?
Total Male Population of Cape Girardeau is 19,043.
What is the Total Female Population of Cape Girardeau?
Total Female Population of Cape Girardeau is 20,752.
What is the Ratio of Males per 100 Females in Cape Girardeau?
There are 91.76 Males per 100 Females in Cape Girardeau.
What is the Ratio of Females per 100 Males in Cape Girardeau?
There are 108.97 Females per 100 Males in Cape Girardeau.
What is the Median Population Age in Cape Girardeau?
Median Population Age in Cape Girardeau is 33.6 Years.
What is the Average Family Size in Cape Girardeau
Average Family Size in Cape Girardeau is 3.0 People.
What is the Average Household Size in Cape Girardeau
Average Household Size in Cape Girardeau is 2.3 People.
How Large is the Labor Force in Cape Girardeau?
There are 20,541 People in the Labor Forcein in Cape Girardeau.
What is the Percentage of People in the Labor Force in Cape Girardeau?
61.5% of People are in the Labor Force in Cape Girardeau.
What is the Unemployment Rate in Cape Girardeau?
Unemployment Rate in Cape Girardeau is 3.4%.