Ferguson, MO Map & Demographics
Ferguson Map
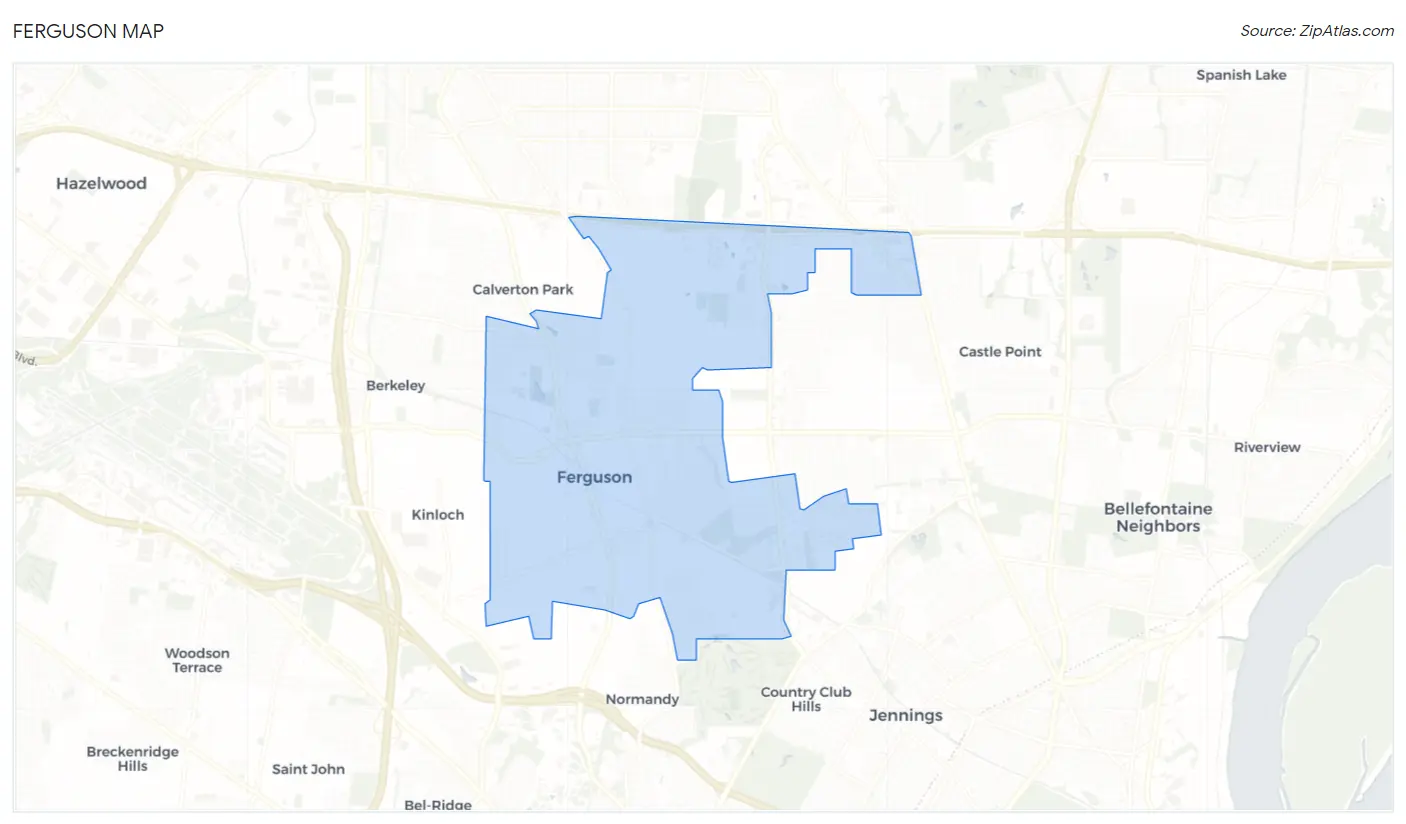
Ferguson Overview
$26,963
PER CAPITA INCOME
$58,144
AVG FAMILY INCOME
$47,410
AVG HOUSEHOLD INCOME
0.9%
WAGE / INCOME GAP [ % ]
99.1¢/ $1
WAGE / INCOME GAP [ $ ]
$10,500
FAMILY INCOME DEFICIT
0.42
INEQUALITY / GINI INDEX
18,546
TOTAL POPULATION
8,584
MALE POPULATION
9,962
FEMALE POPULATION
86.17
MALES / 100 FEMALES
116.05
FEMALES / 100 MALES
34.7
MEDIAN AGE
3.2
AVG FAMILY SIZE
2.3
AVG HOUSEHOLD SIZE
9,079
LABOR FORCE [ PEOPLE ]
62.1%
PERCENT IN LABOR FORCE
5.3%
UNEMPLOYMENT RATE
Ferguson Area Codes
Income in Ferguson
Income Overview in Ferguson
Per Capita Income in Ferguson is $26,963, while median incomes of families and households are $58,144 and $47,410 respectively.
| Characteristic | Number | Measure |
| Per Capita Income | 18,546 | $26,963 |
| Median Family Income | 4,443 | $58,144 |
| Mean Family Income | 4,443 | $73,721 |
| Median Household Income | 7,913 | $47,410 |
| Mean Household Income | 7,913 | $61,101 |
| Income Deficit | 4,443 | $10,500 |
| Wage / Income Gap (%) | 18,546 | 0.92% |
| Wage / Income Gap ($) | 18,546 | 99.08¢ per $1 |
| Gini / Inequality Index | 18,546 | 0.42 |
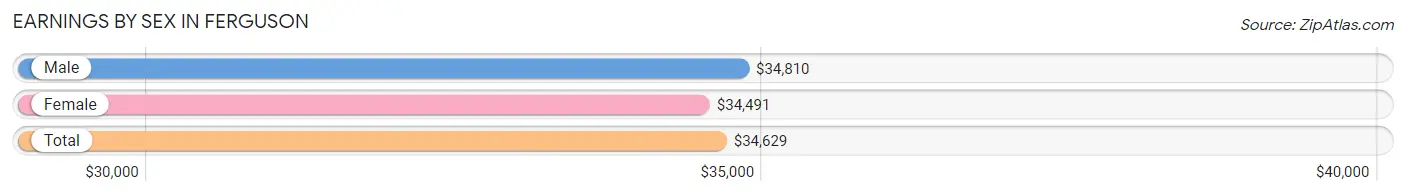
Earnings by Sex in Ferguson
Average Earnings in Ferguson are $34,629, $34,810 for men and $34,491 for women, a difference of 0.9%.
| Sex | Number | Average Earnings |
| Male | 4,347 (45.0%) | $34,810 |
| Female | 5,318 (55.0%) | $34,491 |
| Total | 9,665 (100.0%) | $34,629 |
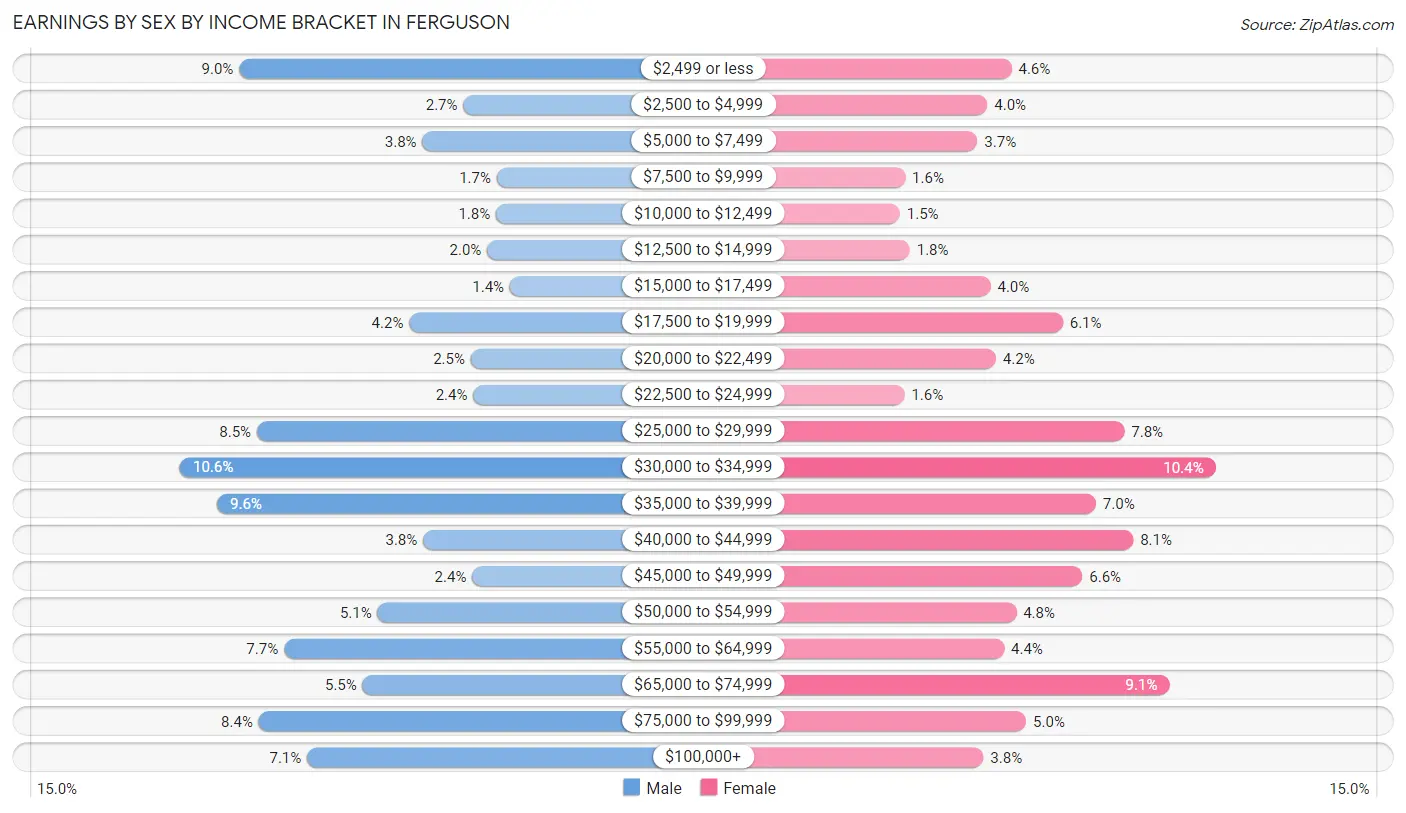
Earnings by Sex by Income Bracket in Ferguson
The most common earnings brackets in Ferguson are $30,000 to $34,999 for men (462 | 10.6%) and $30,000 to $34,999 for women (551 | 10.4%).
| Income | Male | Female |
| $2,499 or less | 390 (9.0%) | 246 (4.6%) |
| $2,500 to $4,999 | 116 (2.7%) | 210 (4.0%) |
| $5,000 to $7,499 | 166 (3.8%) | 195 (3.7%) |
| $7,500 to $9,999 | 75 (1.7%) | 87 (1.6%) |
| $10,000 to $12,499 | 76 (1.8%) | 79 (1.5%) |
| $12,500 to $14,999 | 87 (2.0%) | 94 (1.8%) |
| $15,000 to $17,499 | 59 (1.4%) | 215 (4.0%) |
| $17,500 to $19,999 | 182 (4.2%) | 323 (6.1%) |
| $20,000 to $22,499 | 107 (2.5%) | 223 (4.2%) |
| $22,500 to $24,999 | 104 (2.4%) | 86 (1.6%) |
| $25,000 to $29,999 | 368 (8.5%) | 415 (7.8%) |
| $30,000 to $34,999 | 462 (10.6%) | 551 (10.4%) |
| $35,000 to $39,999 | 417 (9.6%) | 372 (7.0%) |
| $40,000 to $44,999 | 165 (3.8%) | 428 (8.1%) |
| $45,000 to $49,999 | 105 (2.4%) | 352 (6.6%) |
| $50,000 to $54,999 | 221 (5.1%) | 253 (4.8%) |
| $55,000 to $64,999 | 335 (7.7%) | 235 (4.4%) |
| $65,000 to $74,999 | 239 (5.5%) | 482 (9.1%) |
| $75,000 to $99,999 | 366 (8.4%) | 268 (5.0%) |
| $100,000+ | 307 (7.1%) | 204 (3.8%) |
| Total | 4,347 (100.0%) | 5,318 (100.0%) |
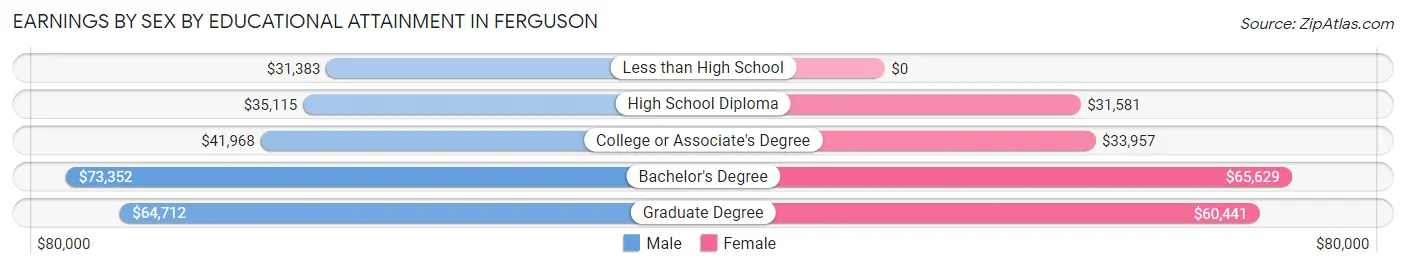
Earnings by Sex by Educational Attainment in Ferguson
Average earnings in Ferguson are $36,484 for men and $38,067 for women, a difference of 4.2%. Men with an educational attainment of bachelor's degree enjoy the highest average annual earnings of $73,352, while those with less than high school education earn the least with $31,383. Women with an educational attainment of bachelor's degree earn the most with the average annual earnings of $65,629, while those with high school diploma education have the smallest earnings of $31,581.
| Educational Attainment | Male Income | Female Income |
| Less than High School | $31,383 | $0 |
| High School Diploma | $35,115 | $31,581 |
| College or Associate's Degree | $41,968 | $33,957 |
| Bachelor's Degree | $73,352 | $65,629 |
| Graduate Degree | $64,712 | $60,441 |
| Total | $36,484 | $38,067 |
Family Income in Ferguson
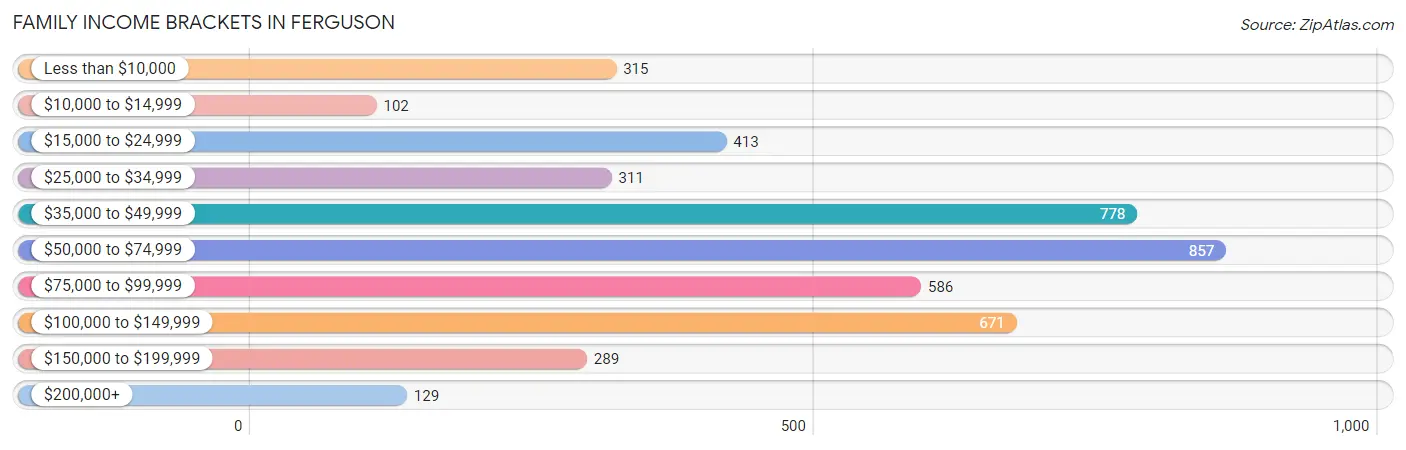
Family Income Brackets in Ferguson
According to the Ferguson family income data, there are 857 families falling into the $50,000 to $74,999 income range, which is the most common income bracket and makes up 19.3% of all families. Conversely, the $10,000 to $14,999 income bracket is the least frequent group with only 102 families (2.3%) belonging to this category.
| Income Bracket | # Families | % Families |
| Less than $10,000 | 315 | 7.1% |
| $10,000 to $14,999 | 102 | 2.3% |
| $15,000 to $24,999 | 413 | 9.3% |
| $25,000 to $34,999 | 311 | 7.0% |
| $35,000 to $49,999 | 778 | 17.5% |
| $50,000 to $74,999 | 857 | 19.3% |
| $75,000 to $99,999 | 586 | 13.2% |
| $100,000 to $149,999 | 671 | 15.1% |
| $150,000 to $199,999 | 289 | 6.5% |
| $200,000+ | 129 | 2.9% |
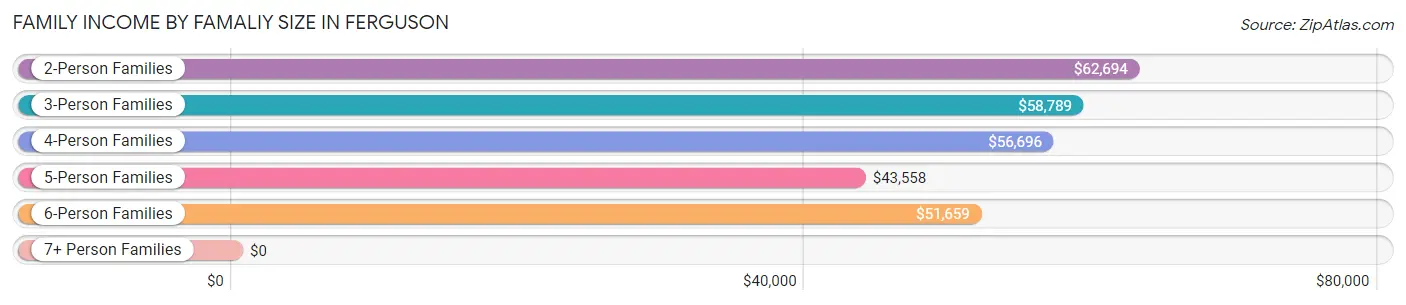
Family Income by Famaliy Size in Ferguson
2-person families (1,971 | 44.4%) account for the highest median family income in Ferguson with $62,694 per family, while 2-person families (1,971 | 44.4%) have the highest median income of $31,347 per family member.
| Income Bracket | # Families | Median Income |
| 2-Person Families | 1,971 (44.4%) | $62,694 |
| 3-Person Families | 1,392 (31.3%) | $58,789 |
| 4-Person Families | 671 (15.1%) | $56,696 |
| 5-Person Families | 240 (5.4%) | $43,558 |
| 6-Person Families | 127 (2.9%) | $51,659 |
| 7+ Person Families | 42 (0.9%) | $0 |
| Total | 4,443 (100.0%) | $58,144 |
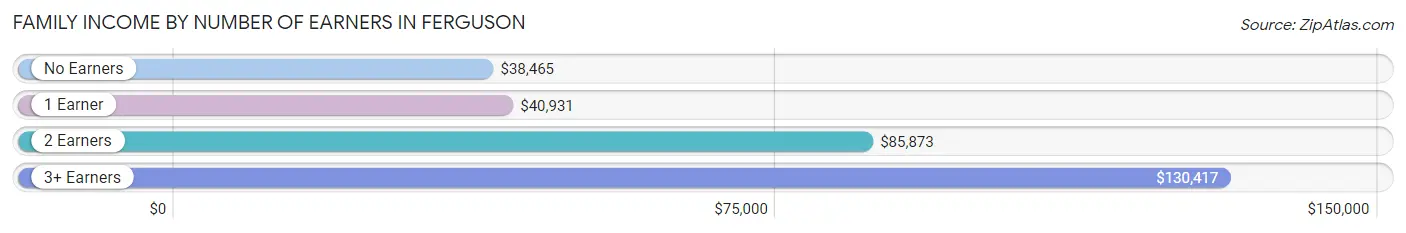
Family Income by Number of Earners in Ferguson
The median family income in Ferguson is $58,144, with families comprising 3+ earners (443) having the highest median family income of $130,417, while families with no earners (516) have the lowest median family income of $38,465, accounting for 10.0% and 11.6% of families, respectively.
| Number of Earners | # Families | Median Income |
| No Earners | 516 (11.6%) | $38,465 |
| 1 Earner | 2,049 (46.1%) | $40,931 |
| 2 Earners | 1,435 (32.3%) | $85,873 |
| 3+ Earners | 443 (10.0%) | $130,417 |
| Total | 4,443 (100.0%) | $58,144 |
Household Income in Ferguson
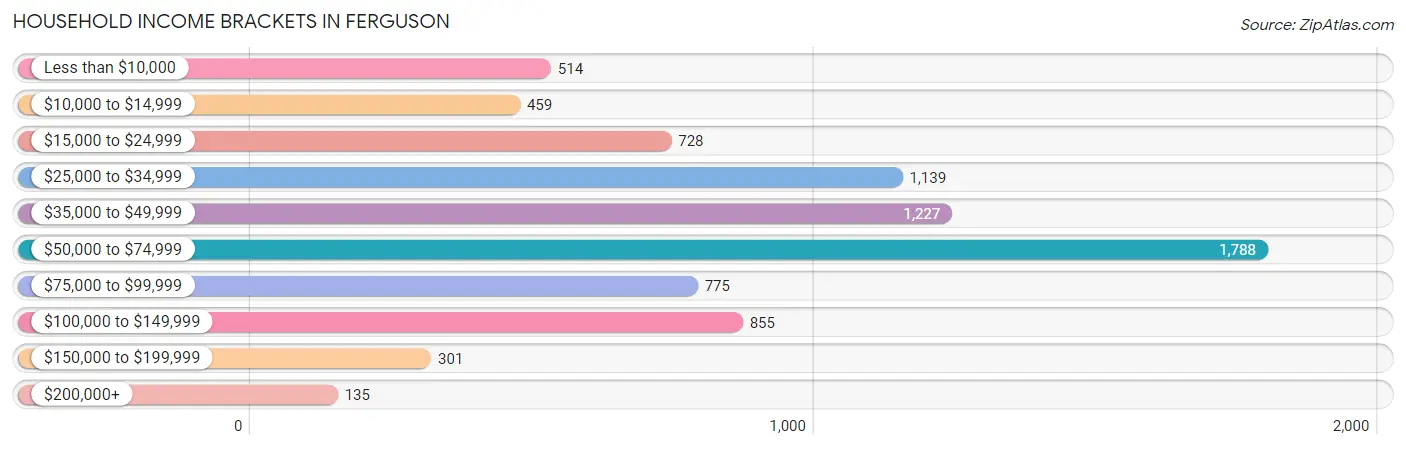
Household Income Brackets in Ferguson
With 1,788 households falling in the category, the $50,000 to $74,999 income range is the most frequent in Ferguson, accounting for 22.6% of all households. In contrast, only 135 households (1.7%) fall into the $200,000+ income bracket, making it the least populous group.
| Income Bracket | # Households | % Households |
| Less than $10,000 | 514 | 6.5% |
| $10,000 to $14,999 | 459 | 5.8% |
| $15,000 to $24,999 | 728 | 9.2% |
| $25,000 to $34,999 | 1,139 | 14.4% |
| $35,000 to $49,999 | 1,227 | 15.5% |
| $50,000 to $74,999 | 1,788 | 22.6% |
| $75,000 to $99,999 | 775 | 9.8% |
| $100,000 to $149,999 | 855 | 10.8% |
| $150,000 to $199,999 | 301 | 3.8% |
| $200,000+ | 135 | 1.7% |
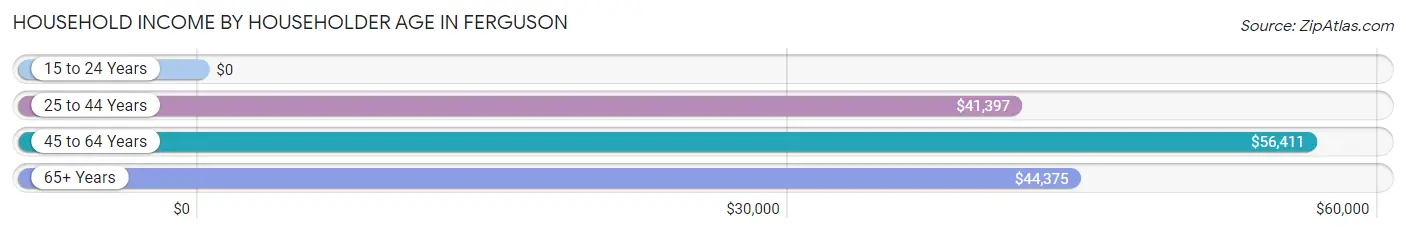
Household Income by Householder Age in Ferguson
The median household income in Ferguson is $47,410, with the highest median household income of $56,411 found in the 45 to 64 years age bracket for the primary householder. A total of 2,658 households (33.6%) fall into this category. Meanwhile, the 15 to 24 years age bracket for the primary householder has the lowest median household income of $0, with 114 households (1.4%) in this group.
| Income Bracket | # Households | Median Income |
| 15 to 24 Years | 114 (1.4%) | $0 |
| 25 to 44 Years | 3,285 (41.5%) | $41,397 |
| 45 to 64 Years | 2,658 (33.6%) | $56,411 |
| 65+ Years | 1,856 (23.5%) | $44,375 |
| Total | 7,913 (100.0%) | $47,410 |
Poverty in Ferguson
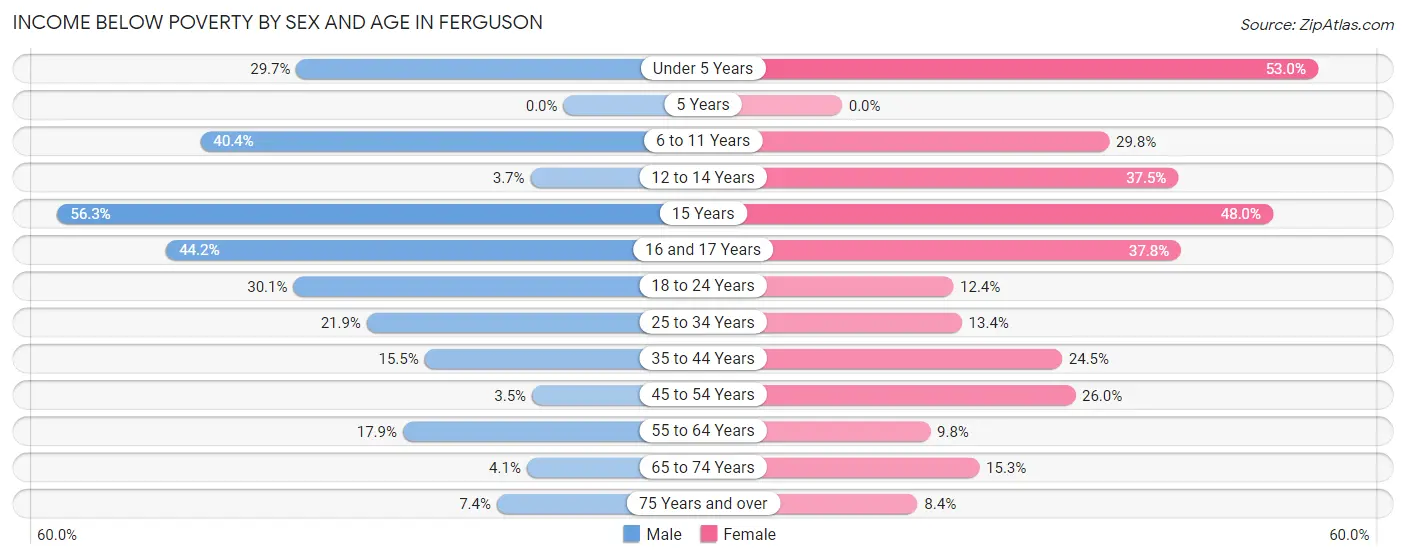
Income Below Poverty by Sex and Age in Ferguson
With 20.1% poverty level for males and 21.9% for females among the residents of Ferguson, 15 year old males and under 5 year old females are the most vulnerable to poverty, with 40 males (56.3%) and 451 females (53.0%) in their respective age groups living below the poverty level.
| Age Bracket | Male | Female |
| Under 5 Years | 262 (29.7%) | 451 (53.0%) |
| 5 Years | 0 (0.0%) | 0 (0.0%) |
| 6 to 11 Years | 232 (40.4%) | 175 (29.8%) |
| 12 to 14 Years | 12 (3.7%) | 121 (37.5%) |
| 15 Years | 40 (56.3%) | 12 (48.0%) |
| 16 and 17 Years | 153 (44.2%) | 153 (37.8%) |
| 18 to 24 Years | 314 (30.1%) | 76 (12.4%) |
| 25 to 34 Years | 318 (21.9%) | 220 (13.4%) |
| 35 to 44 Years | 150 (15.5%) | 351 (24.5%) |
| 45 to 54 Years | 30 (3.5%) | 271 (26.0%) |
| 55 to 64 Years | 150 (17.9%) | 132 (9.8%) |
| 65 to 74 Years | 33 (4.1%) | 113 (15.3%) |
| 75 Years and over | 18 (7.4%) | 55 (8.4%) |
| Total | 1,712 (20.1%) | 2,130 (21.9%) |
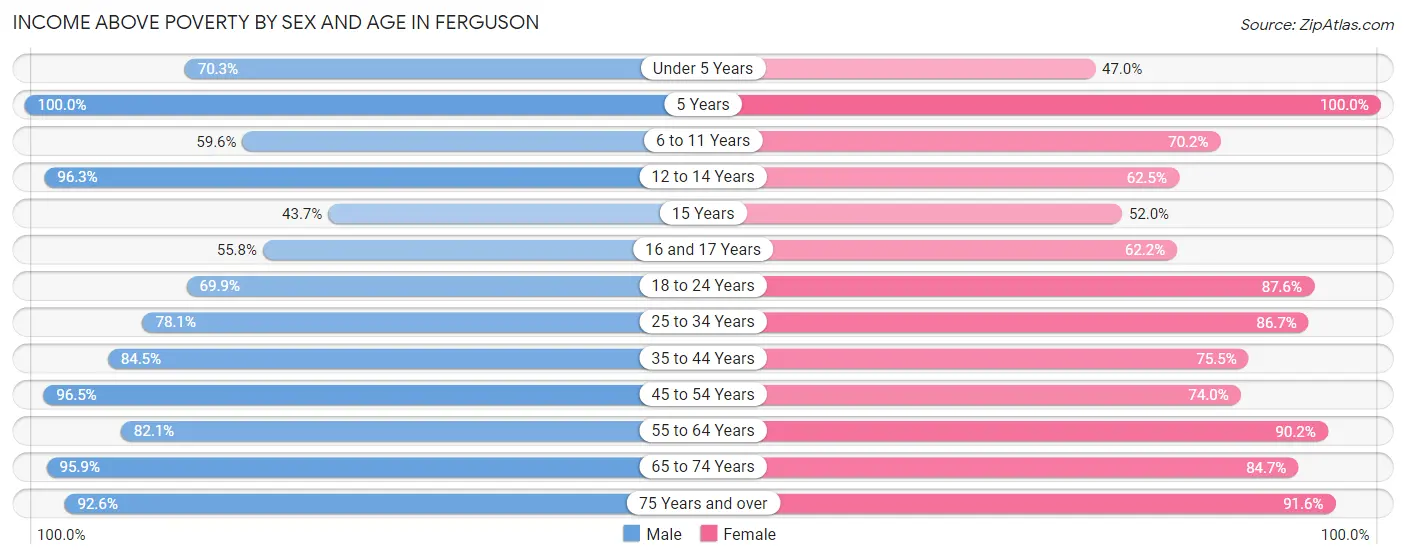
Income Above Poverty by Sex and Age in Ferguson
According to the poverty statistics in Ferguson, males aged 5 years and females aged 5 years are the age groups that are most secure financially, with 100.0% of males and 100.0% of females in these age groups living above the poverty line.
| Age Bracket | Male | Female |
| Under 5 Years | 619 (70.3%) | 400 (47.0%) |
| 5 Years | 105 (100.0%) | 45 (100.0%) |
| 6 to 11 Years | 342 (59.6%) | 413 (70.2%) |
| 12 to 14 Years | 315 (96.3%) | 202 (62.5%) |
| 15 Years | 31 (43.7%) | 13 (52.0%) |
| 16 and 17 Years | 193 (55.8%) | 252 (62.2%) |
| 18 to 24 Years | 730 (69.9%) | 537 (87.6%) |
| 25 to 34 Years | 1,134 (78.1%) | 1,428 (86.7%) |
| 35 to 44 Years | 820 (84.5%) | 1,081 (75.5%) |
| 45 to 54 Years | 826 (96.5%) | 772 (74.0%) |
| 55 to 64 Years | 689 (82.1%) | 1,211 (90.2%) |
| 65 to 74 Years | 776 (95.9%) | 626 (84.7%) |
| 75 Years and over | 225 (92.6%) | 598 (91.6%) |
| Total | 6,805 (79.9%) | 7,578 (78.1%) |
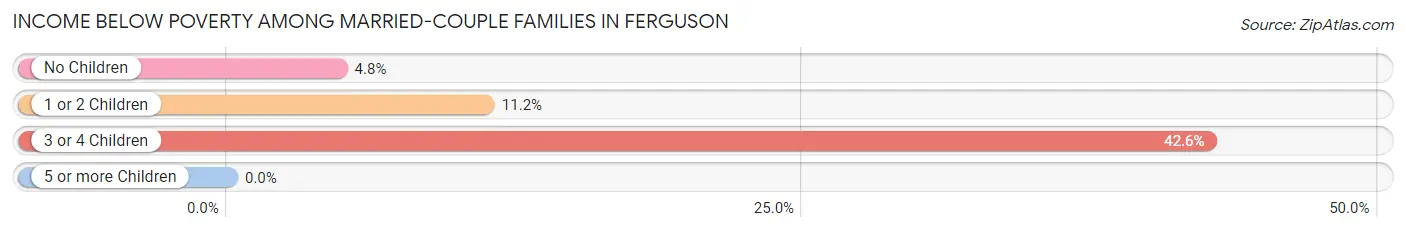
Income Below Poverty Among Married-Couple Families in Ferguson
The poverty statistics for married-couple families in Ferguson show that 9.1% or 186 of the total 2,047 families live below the poverty line. Families with 3 or 4 children have the highest poverty rate of 42.6%, comprising of 66 families. On the other hand, families with no children have the lowest poverty rate of 4.8%, which includes 68 families.
| Children | Above Poverty | Below Poverty |
| No Children | 1,359 (95.2%) | 68 (4.8%) |
| 1 or 2 Children | 413 (88.8%) | 52 (11.2%) |
| 3 or 4 Children | 89 (57.4%) | 66 (42.6%) |
| 5 or more Children | 0 (0.0%) | 0 (0.0%) |
| Total | 1,861 (90.9%) | 186 (9.1%) |
Income Below Poverty Among Single-Parent Households in Ferguson
According to the poverty data in Ferguson, 24.9% or 154 single-father households and 25.8% or 459 single-mother households are living below the poverty line. Among single-father households, those with no children have the highest poverty rate, with 104 households (65.4%) experiencing poverty. Likewise, among single-mother households, those with 1 or 2 children have the highest poverty rate, with 328 households (39.6%) falling below the poverty line.
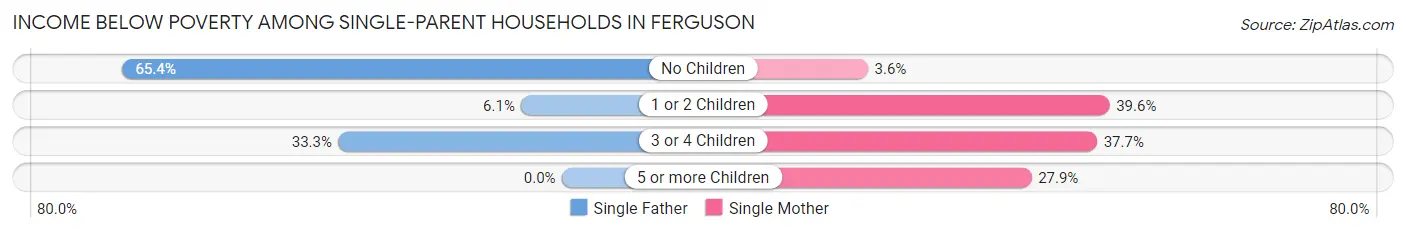
| Children | Single Father | Single Mother |
| No Children | 104 (65.4%) | 23 (3.6%) |
| 1 or 2 Children | 23 (6.1%) | 328 (39.6%) |
| 3 or 4 Children | 27 (33.3%) | 89 (37.7%) |
| 5 or more Children | 0 (0.0%) | 19 (27.9%) |
| Total | 154 (24.9%) | 459 (25.8%) |
Income Below Poverty Among Married-Couple vs Single-Parent Households in Ferguson
The poverty data for Ferguson shows that 186 of the married-couple family households (9.1%) and 613 of the single-parent households (25.6%) are living below the poverty level. Within the married-couple family households, those with 3 or 4 children have the highest poverty rate, with 66 households (42.6%) falling below the poverty line. Among the single-parent households, those with 3 or 4 children have the highest poverty rate, with 116 household (36.6%) living below poverty.
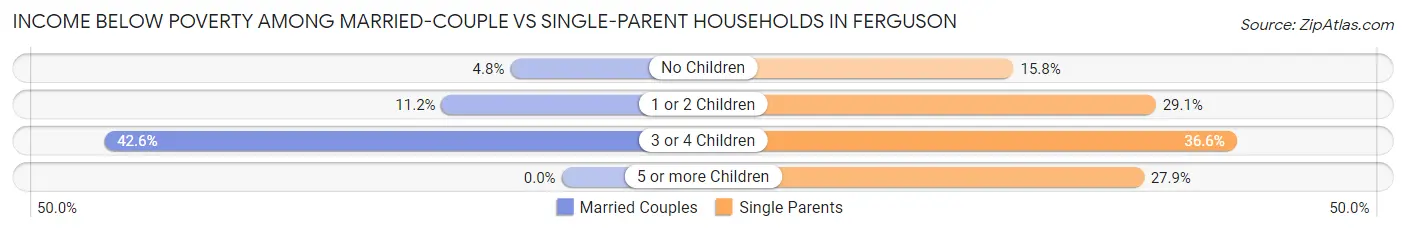
| Children | Married-Couple Families | Single-Parent Households |
| No Children | 68 (4.8%) | 127 (15.8%) |
| 1 or 2 Children | 52 (11.2%) | 351 (29.1%) |
| 3 or 4 Children | 66 (42.6%) | 116 (36.6%) |
| 5 or more Children | 0 (0.0%) | 19 (27.9%) |
| Total | 186 (9.1%) | 613 (25.6%) |
Race in Ferguson
The most populous races in Ferguson are Black / African American (13,292 | 71.7%), White / Caucasian (4,207 | 22.7%), and Two or more Races (701 | 3.8%).
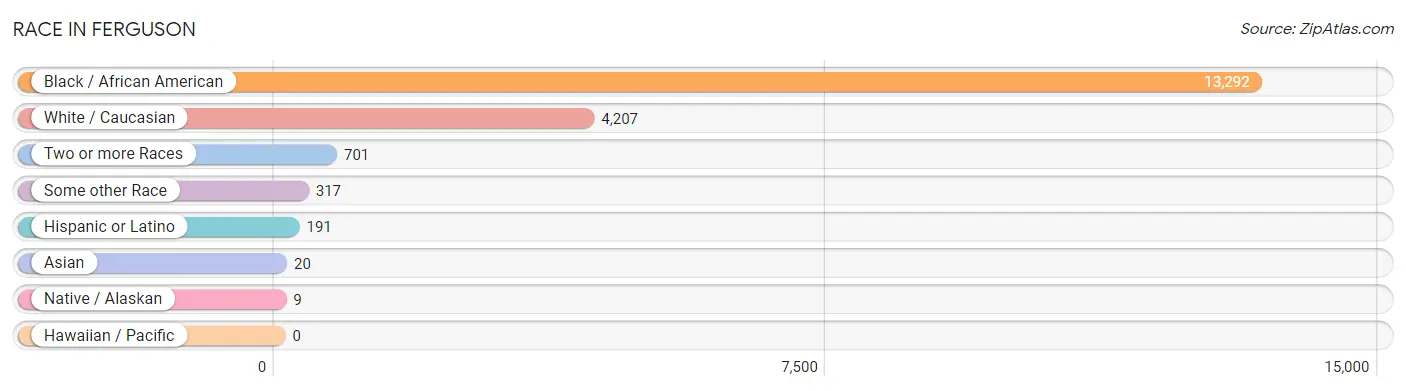
| Race | # Population | % Population |
| Asian | 20 | 0.1% |
| Black / African American | 13,292 | 71.7% |
| Hawaiian / Pacific | 0 | 0.0% |
| Hispanic or Latino | 191 | 1.0% |
| Native / Alaskan | 9 | 0.1% |
| White / Caucasian | 4,207 | 22.7% |
| Two or more Races | 701 | 3.8% |
| Some other Race | 317 | 1.7% |
| Total | 18,546 | 100.0% |
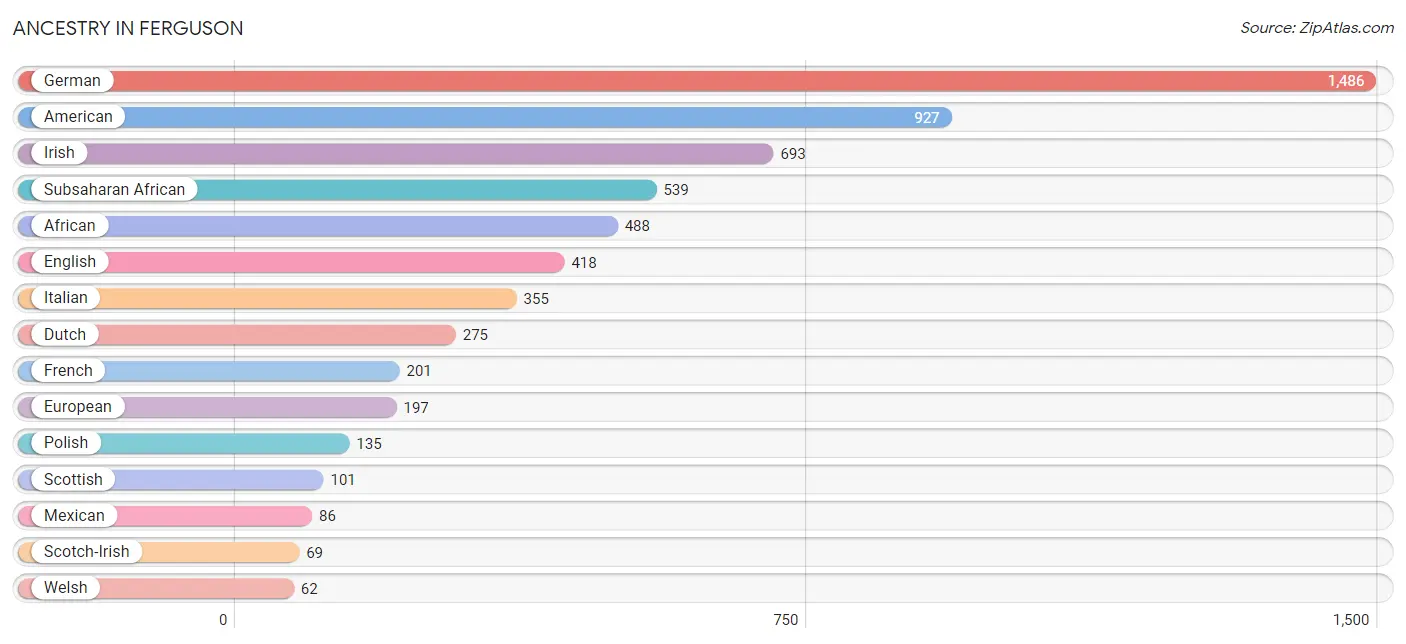
Ancestry in Ferguson
The most populous ancestries reported in Ferguson are German (1,486 | 8.0%), American (927 | 5.0%), Irish (693 | 3.7%), Subsaharan African (539 | 2.9%), and African (488 | 2.6%), together accounting for 22.3% of all Ferguson residents.
| Ancestry | # Population | % Population |
| African | 488 | 2.6% |
| American | 927 | 5.0% |
| Arab | 17 | 0.1% |
| Austrian | 26 | 0.1% |
| Blackfeet | 10 | 0.1% |
| British | 4 | 0.0% |
| Burmese | 3 | 0.0% |
| Central American | 21 | 0.1% |
| Cherokee | 46 | 0.3% |
| Chickasaw | 8 | 0.0% |
| Croatian | 14 | 0.1% |
| Czechoslovakian | 4 | 0.0% |
| Danish | 22 | 0.1% |
| Dutch | 275 | 1.5% |
| Eastern European | 27 | 0.2% |
| English | 418 | 2.2% |
| European | 197 | 1.1% |
| French | 201 | 1.1% |
| French Canadian | 21 | 0.1% |
| German | 1,486 | 8.0% |
| Greek | 33 | 0.2% |
| Guyanese | 4 | 0.0% |
| Hungarian | 24 | 0.1% |
| Indian (Asian) | 16 | 0.1% |
| Irish | 693 | 3.7% |
| Italian | 355 | 1.9% |
| Lebanese | 17 | 0.1% |
| Mexican | 86 | 0.5% |
| Nigerian | 51 | 0.3% |
| Northern European | 19 | 0.1% |
| Polish | 135 | 0.7% |
| Puerto Rican | 31 | 0.2% |
| Salvadoran | 21 | 0.1% |
| Scandinavian | 12 | 0.1% |
| Scotch-Irish | 69 | 0.4% |
| Scottish | 101 | 0.5% |
| Slovak | 24 | 0.1% |
| Spaniard | 19 | 0.1% |
| Sri Lankan | 1 | 0.0% |
| Subsaharan African | 539 | 2.9% |
| Swedish | 45 | 0.2% |
| Swiss | 12 | 0.1% |
| U.S. Virgin Islander | 12 | 0.1% |
| Welsh | 62 | 0.3% |
| Yugoslavian | 3 | 0.0% | View All 45 Rows |
Immigrants in Ferguson
The most numerous immigrant groups reported in Ferguson came from Europe (65 | 0.4%), Northern Europe (59 | 0.3%), Africa (51 | 0.3%), Nigeria (51 | 0.3%), and Western Africa (51 | 0.3%), together accounting for 1.5% of all Ferguson residents.
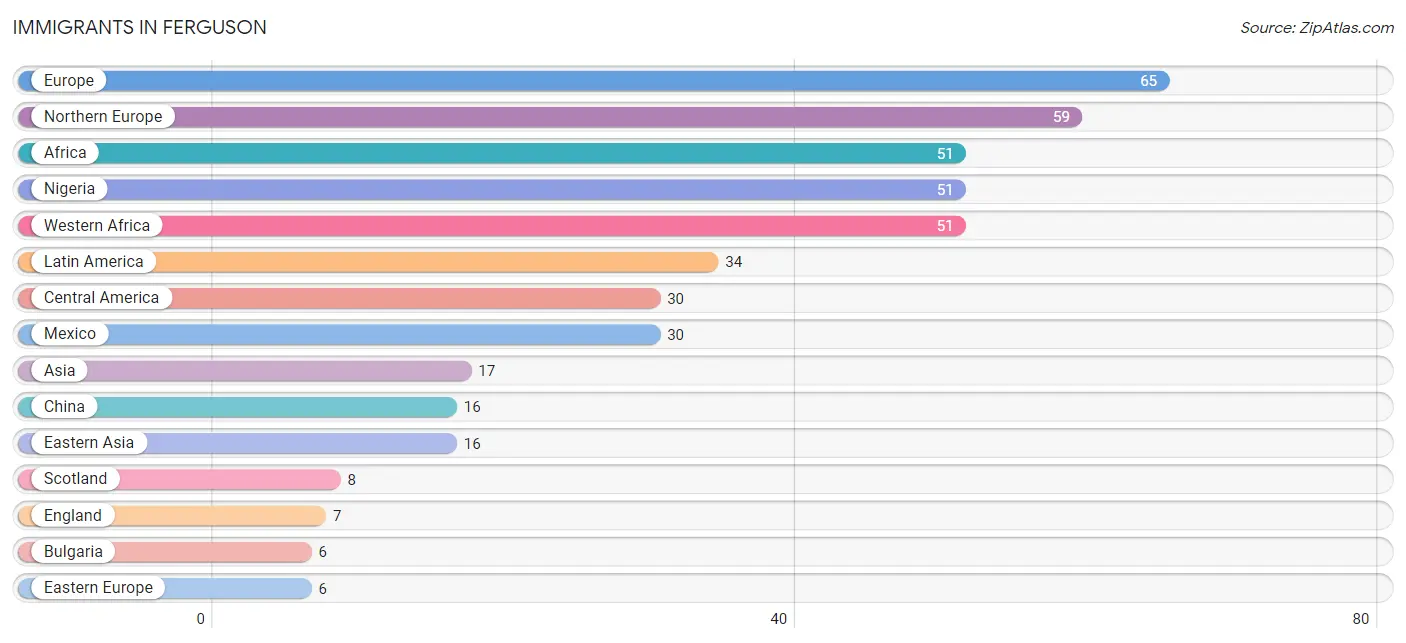
| Immigration Origin | # Population | % Population |
| Africa | 51 | 0.3% |
| Asia | 17 | 0.1% |
| Bulgaria | 6 | 0.0% |
| Central America | 30 | 0.2% |
| China | 16 | 0.1% |
| Eastern Asia | 16 | 0.1% |
| Eastern Europe | 6 | 0.0% |
| England | 7 | 0.0% |
| Europe | 65 | 0.4% |
| Guyana | 4 | 0.0% |
| Latin America | 34 | 0.2% |
| Mexico | 30 | 0.2% |
| Nigeria | 51 | 0.3% |
| Northern Europe | 59 | 0.3% |
| Scotland | 8 | 0.0% |
| South America | 4 | 0.0% |
| South Eastern Asia | 1 | 0.0% |
| Vietnam | 1 | 0.0% |
| Western Africa | 51 | 0.3% | View All 19 Rows |
Sex and Age in Ferguson
Sex and Age in Ferguson
The most populous age groups in Ferguson are 30 to 34 Years (909 | 10.6%) for men and 30 to 34 Years (970 | 9.7%) for women.
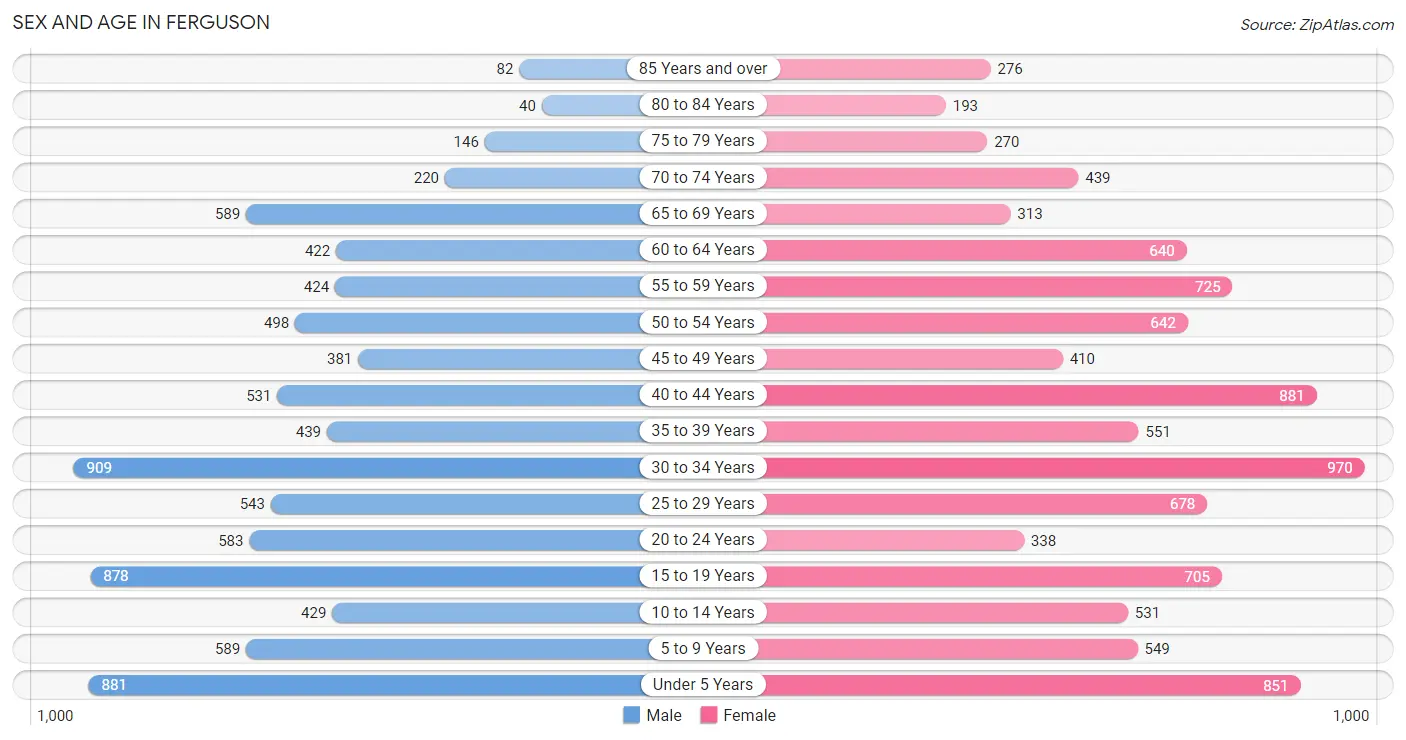
| Age Bracket | Male | Female |
| Under 5 Years | 881 (10.3%) | 851 (8.5%) |
| 5 to 9 Years | 589 (6.9%) | 549 (5.5%) |
| 10 to 14 Years | 429 (5.0%) | 531 (5.3%) |
| 15 to 19 Years | 878 (10.2%) | 705 (7.1%) |
| 20 to 24 Years | 583 (6.8%) | 338 (3.4%) |
| 25 to 29 Years | 543 (6.3%) | 678 (6.8%) |
| 30 to 34 Years | 909 (10.6%) | 970 (9.7%) |
| 35 to 39 Years | 439 (5.1%) | 551 (5.5%) |
| 40 to 44 Years | 531 (6.2%) | 881 (8.8%) |
| 45 to 49 Years | 381 (4.4%) | 410 (4.1%) |
| 50 to 54 Years | 498 (5.8%) | 642 (6.4%) |
| 55 to 59 Years | 424 (4.9%) | 725 (7.3%) |
| 60 to 64 Years | 422 (4.9%) | 640 (6.4%) |
| 65 to 69 Years | 589 (6.9%) | 313 (3.1%) |
| 70 to 74 Years | 220 (2.6%) | 439 (4.4%) |
| 75 to 79 Years | 146 (1.7%) | 270 (2.7%) |
| 80 to 84 Years | 40 (0.5%) | 193 (1.9%) |
| 85 Years and over | 82 (1.0%) | 276 (2.8%) |
| Total | 8,584 (100.0%) | 9,962 (100.0%) |
Families and Households in Ferguson
Median Family Size in Ferguson
The median family size in Ferguson is 3.16 persons per family, with single female/mother families (1,777 | 40.0%) accounting for the largest median family size of 3.4 persons per family. On the other hand, married-couple families (2,047 | 46.1%) represent the smallest median family size with 2.99 persons per family.
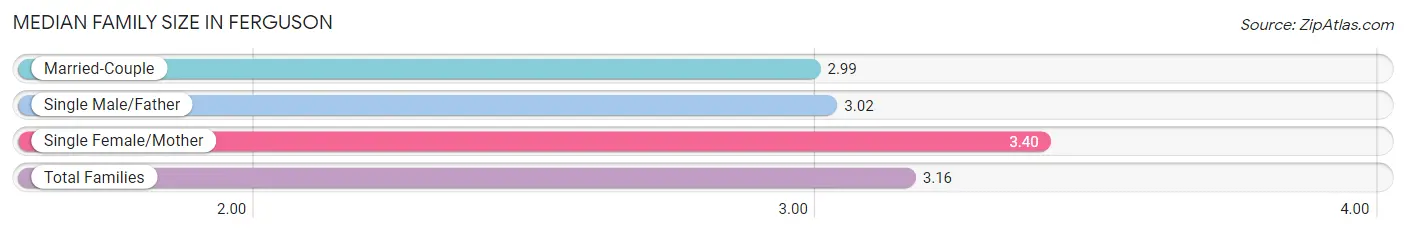
| Family Type | # Families | Family Size |
| Married-Couple | 2,047 (46.1%) | 2.99 |
| Single Male/Father | 619 (13.9%) | 3.02 |
| Single Female/Mother | 1,777 (40.0%) | 3.40 |
| Total Families | 4,443 (100.0%) | 3.16 |
Median Household Size in Ferguson
The median household size in Ferguson is 2.32 persons per household, with single female/mother households (1,777 | 22.5%) accounting for the largest median household size of 3.53 persons per household. non-family households (3,470 | 43.9%) represent the smallest median household size with 1.09 persons per household.
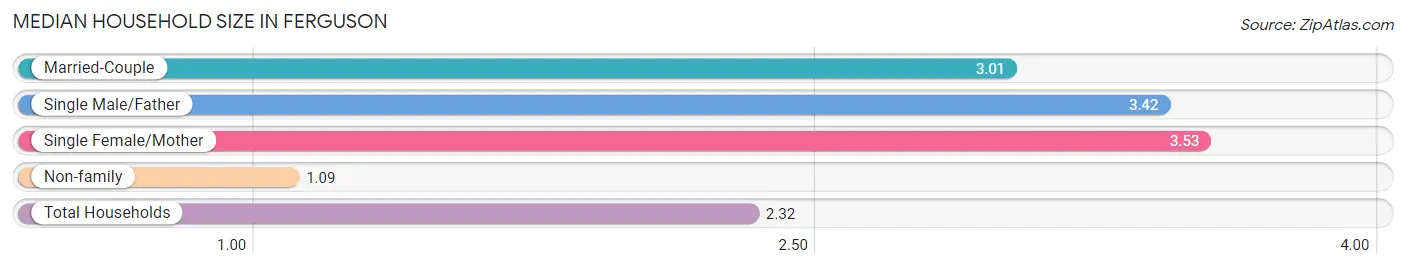
| Household Type | # Households | Household Size |
| Married-Couple | 2,047 (25.9%) | 3.01 |
| Single Male/Father | 619 (7.8%) | 3.42 |
| Single Female/Mother | 1,777 (22.5%) | 3.53 |
| Non-family | 3,470 (43.9%) | 1.09 |
| Total Households | 7,913 (100.0%) | 2.32 |
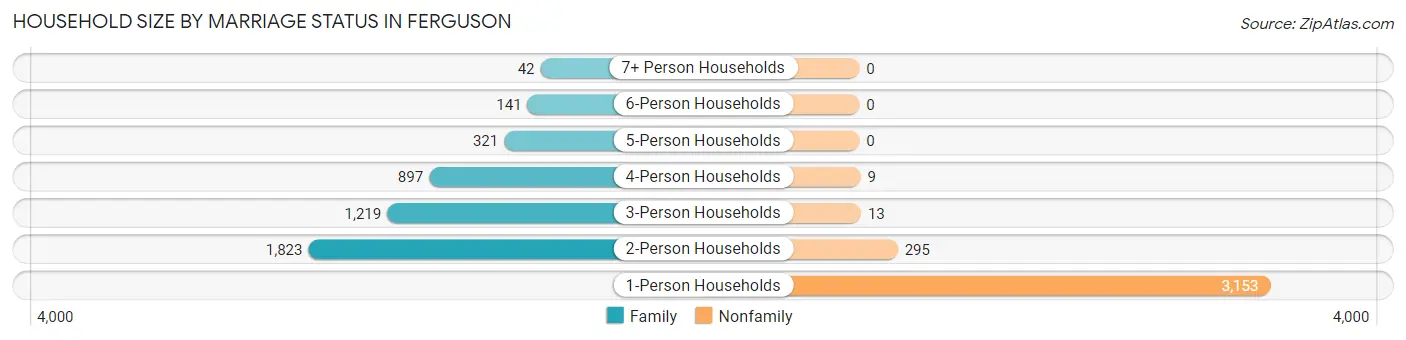
Household Size by Marriage Status in Ferguson
Out of a total of 7,913 households in Ferguson, 4,443 (56.1%) are family households, while 3,470 (43.9%) are nonfamily households. The most numerous type of family households are 2-person households, comprising 1,823, and the most common type of nonfamily households are 1-person households, comprising 3,153.
| Household Size | Family Households | Nonfamily Households |
| 1-Person Households | - | 3,153 (39.9%) |
| 2-Person Households | 1,823 (23.0%) | 295 (3.7%) |
| 3-Person Households | 1,219 (15.4%) | 13 (0.2%) |
| 4-Person Households | 897 (11.3%) | 9 (0.1%) |
| 5-Person Households | 321 (4.1%) | 0 (0.0%) |
| 6-Person Households | 141 (1.8%) | 0 (0.0%) |
| 7+ Person Households | 42 (0.5%) | 0 (0.0%) |
| Total | 4,443 (56.1%) | 3,470 (43.9%) |
Female Fertility in Ferguson
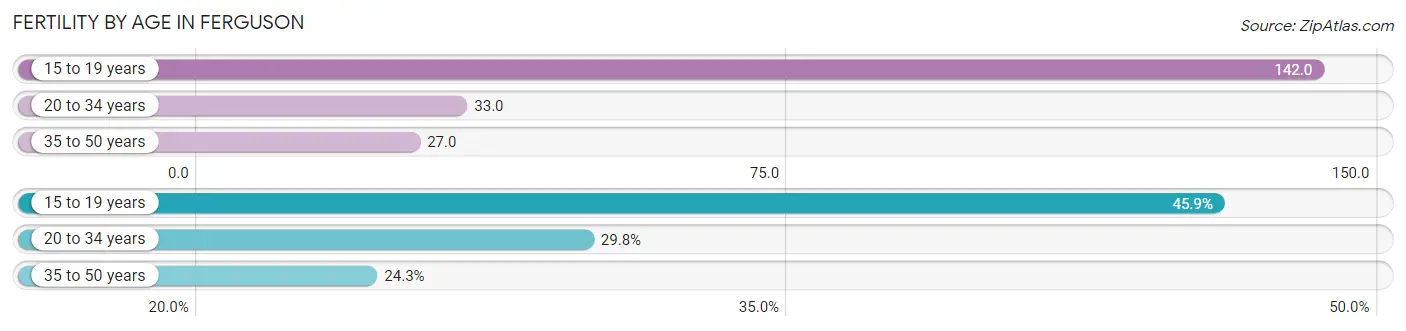
Fertility by Age in Ferguson
Average fertility rate in Ferguson is 47.0 births per 1,000 women. Women in the age bracket of 15 to 19 years have the highest fertility rate with 142.0 births per 1,000 women. Women in the age bracket of 15 to 19 years acount for 45.9% of all women with births.
| Age Bracket | Women with Births | Births / 1,000 Women |
| 15 to 19 years | 100 (45.9%) | 142.0 |
| 20 to 34 years | 65 (29.8%) | 33.0 |
| 35 to 50 years | 53 (24.3%) | 27.0 |
| Total | 218 (100.0%) | 47.0 |
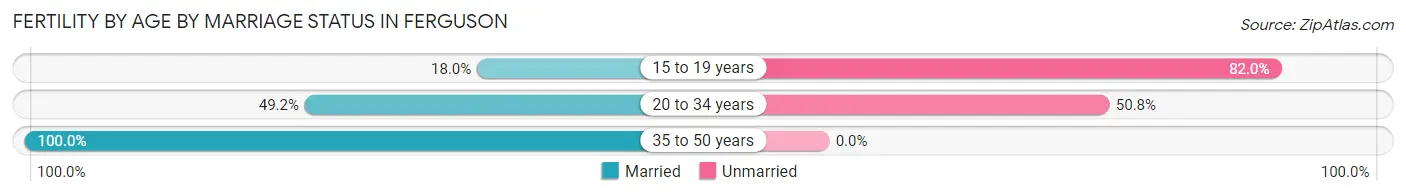
Fertility by Age by Marriage Status in Ferguson
47.2% of women with births (218) in Ferguson are married. The highest percentage of unmarried women with births falls into 15 to 19 years age bracket with 82.0% of them unmarried at the time of birth, while the lowest percentage of unmarried women with births belong to 35 to 50 years age bracket with 0.0% of them unmarried.
| Age Bracket | Married | Unmarried |
| 15 to 19 years | 18 (18.0%) | 82 (82.0%) |
| 20 to 34 years | 32 (49.2%) | 33 (50.8%) |
| 35 to 50 years | 53 (100.0%) | 0 (0.0%) |
| Total | 103 (47.2%) | 115 (52.7%) |
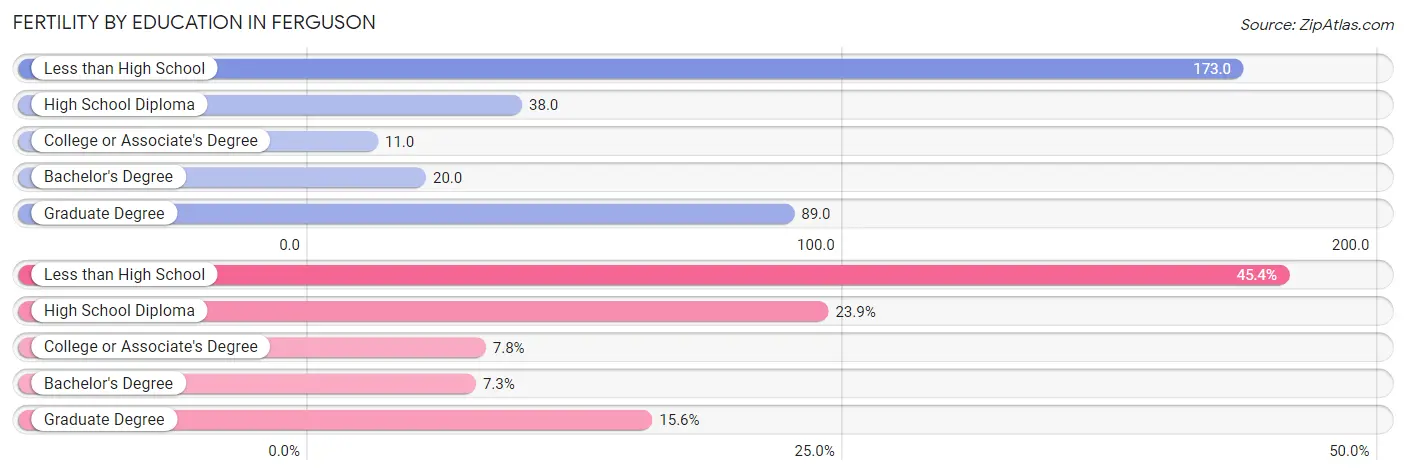
Fertility by Education in Ferguson
Average fertility rate in Ferguson is 47.0 births per 1,000 women. Women with the education attainment of less than high school have the highest fertility rate of 173.0 births per 1,000 women, while women with the education attainment of college or associate's degree have the lowest fertility at 11.0 births per 1,000 women. Women with the education attainment of less than high school represent 45.4% of all women with births.
| Educational Attainment | Women with Births | Births / 1,000 Women |
| Less than High School | 99 (45.4%) | 173.0 |
| High School Diploma | 52 (23.8%) | 38.0 |
| College or Associate's Degree | 17 (7.8%) | 11.0 |
| Bachelor's Degree | 16 (7.3%) | 20.0 |
| Graduate Degree | 34 (15.6%) | 89.0 |
| Total | 218 (100.0%) | 47.0 |
Fertility by Education by Marriage Status in Ferguson
52.7% of women with births in Ferguson are unmarried. Women with the educational attainment of college or associate's degree are most likely to be married with 100.0% of them married at childbirth, while women with the educational attainment of high school diploma are least likely to be married with 100.0% of them unmarried at childbirth.
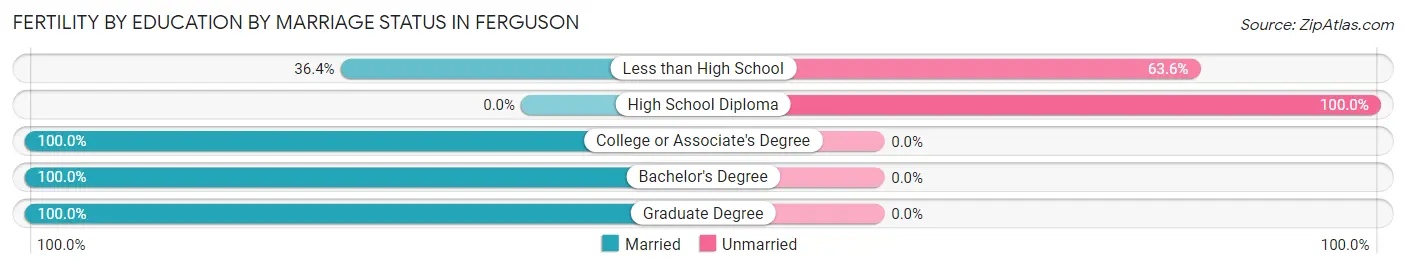
| Educational Attainment | Married | Unmarried |
| Less than High School | 36 (36.4%) | 63 (63.6%) |
| High School Diploma | 0 (0.0%) | 52 (100.0%) |
| College or Associate's Degree | 17 (100.0%) | 0 (0.0%) |
| Bachelor's Degree | 16 (100.0%) | 0 (0.0%) |
| Graduate Degree | 34 (100.0%) | 0 (0.0%) |
| Total | 103 (47.2%) | 115 (52.7%) |
Employment Characteristics in Ferguson
Employment by Class of Employer in Ferguson
Among the 8,232 employed individuals in Ferguson, private company employees (6,230 | 75.7%), not-for-profit organizations (651 | 7.9%), and local government employees (498 | 6.0%) make up the most common classes of employment.
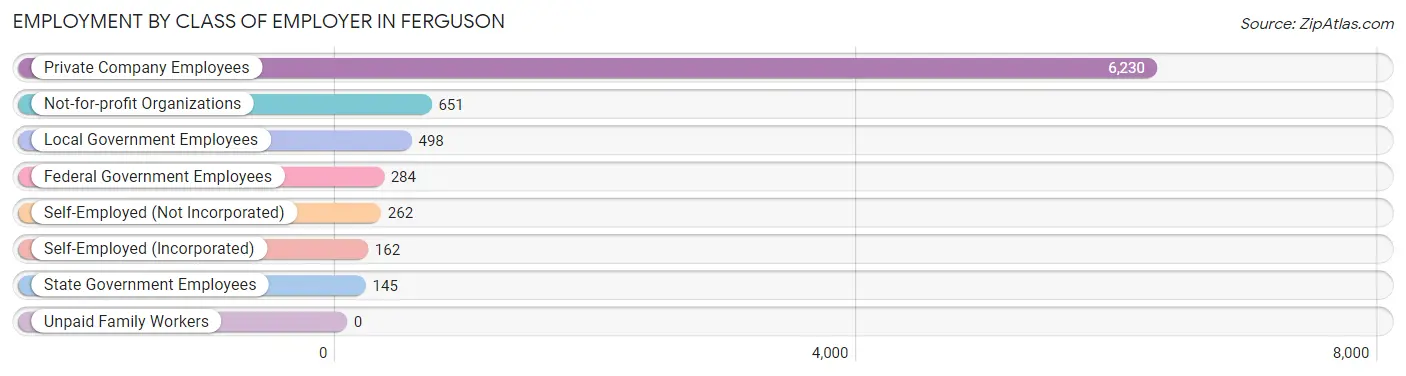
| Employer Class | # Employees | % Employees |
| Private Company Employees | 6,230 | 75.7% |
| Self-Employed (Incorporated) | 162 | 2.0% |
| Self-Employed (Not Incorporated) | 262 | 3.2% |
| Not-for-profit Organizations | 651 | 7.9% |
| Local Government Employees | 498 | 6.0% |
| State Government Employees | 145 | 1.8% |
| Federal Government Employees | 284 | 3.5% |
| Unpaid Family Workers | 0 | 0.0% |
| Total | 8,232 | 100.0% |
Employment Status by Age in Ferguson
According to the labor force statistics for Ferguson, out of the total population over 16 years of age (14,620), 62.1% or 9,079 individuals are in the labor force, with 5.3% or 481 of them unemployed. The age group with the highest labor force participation rate is 35 to 44 years, with 89.8% or 2,157 individuals in the labor force. Within the labor force, the 16 to 19 years age range has the highest percentage of unemployed individuals, with 16.8% or 86 of them being unemployed.
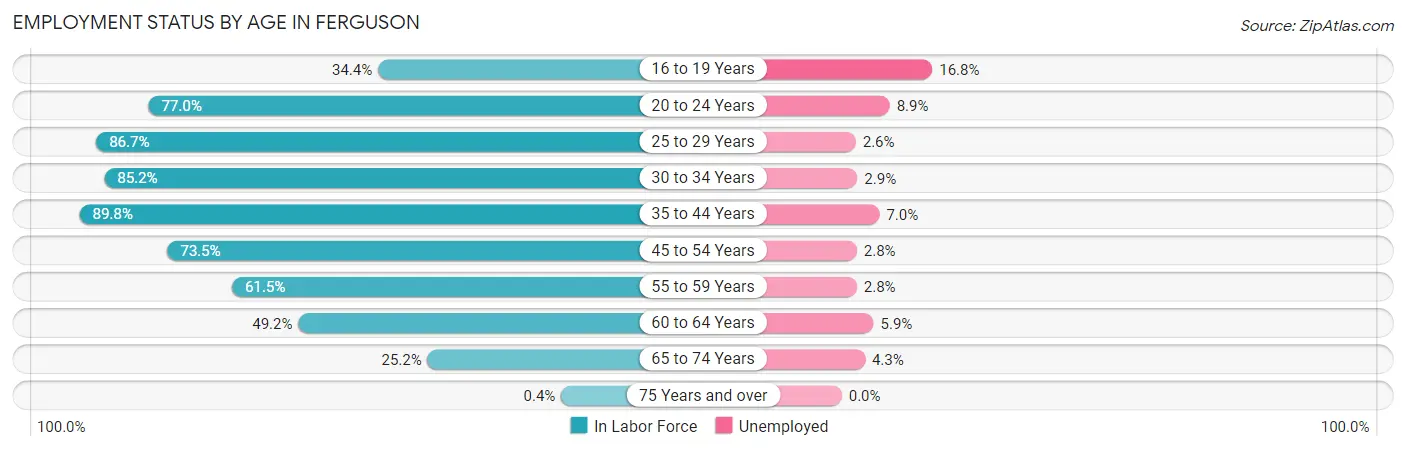
| Age Bracket | In Labor Force | Unemployed |
| 16 to 19 Years | 512 (34.4%) | 86 (16.8%) |
| 20 to 24 Years | 709 (77.0%) | 63 (8.9%) |
| 25 to 29 Years | 1,059 (86.7%) | 28 (2.6%) |
| 30 to 34 Years | 1,601 (85.2%) | 46 (2.9%) |
| 35 to 44 Years | 2,157 (89.8%) | 151 (7.0%) |
| 45 to 54 Years | 1,419 (73.5%) | 40 (2.8%) |
| 55 to 59 Years | 707 (61.5%) | 20 (2.8%) |
| 60 to 64 Years | 523 (49.2%) | 31 (5.9%) |
| 65 to 74 Years | 393 (25.2%) | 17 (4.3%) |
| 75 Years and over | 4 (0.4%) | 0 (0.0%) |
| Total | 9,079 (62.1%) | 481 (5.3%) |
Employment Status by Educational Attainment in Ferguson
According to labor force statistics for Ferguson, 77.4% of individuals (7,464) out of the total population between 25 and 64 years of age (9,644) are in the labor force, with 4.2% or 313 of them being unemployed. The group with the highest labor force participation rate are those with the educational attainment of bachelor's degree or higher, with 90.2% or 1,956 individuals in the labor force. Within the labor force, individuals with less than high school education have the highest percentage of unemployment, with 21.9% or 104 of them being unemployed.
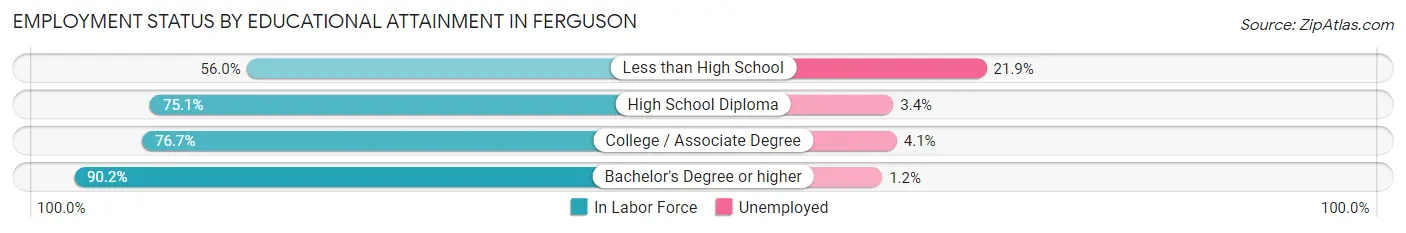
| Educational Attainment | In Labor Force | Unemployed |
| Less than High School | 475 (56.0%) | 186 (21.9%) |
| High School Diploma | 2,442 (75.1%) | 111 (3.4%) |
| College / Associate Degree | 2,589 (76.7%) | 138 (4.1%) |
| Bachelor's Degree or higher | 1,956 (90.2%) | 26 (1.2%) |
| Total | 7,464 (77.4%) | 405 (4.2%) |
Employment Occupations by Sex in Ferguson
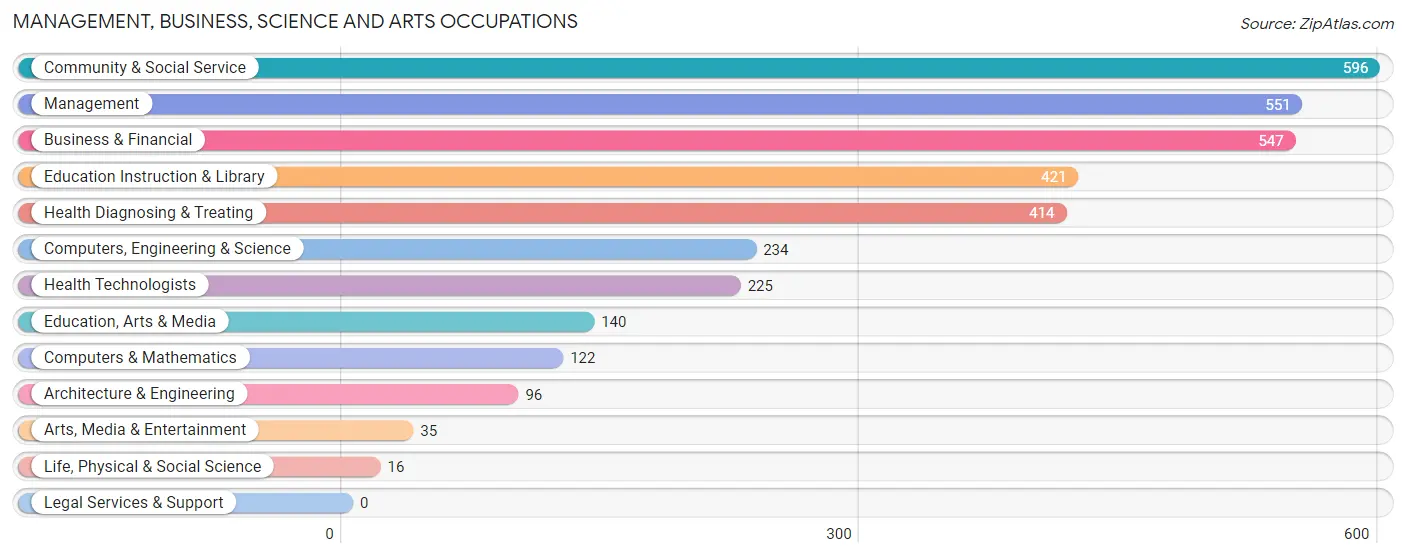
Management, Business, Science and Arts Occupations
The most common Management, Business, Science and Arts occupations in Ferguson are Community & Social Service (596 | 6.9%), Management (551 | 6.4%), Business & Financial (547 | 6.4%), Education Instruction & Library (421 | 4.9%), and Health Diagnosing & Treating (414 | 4.8%).
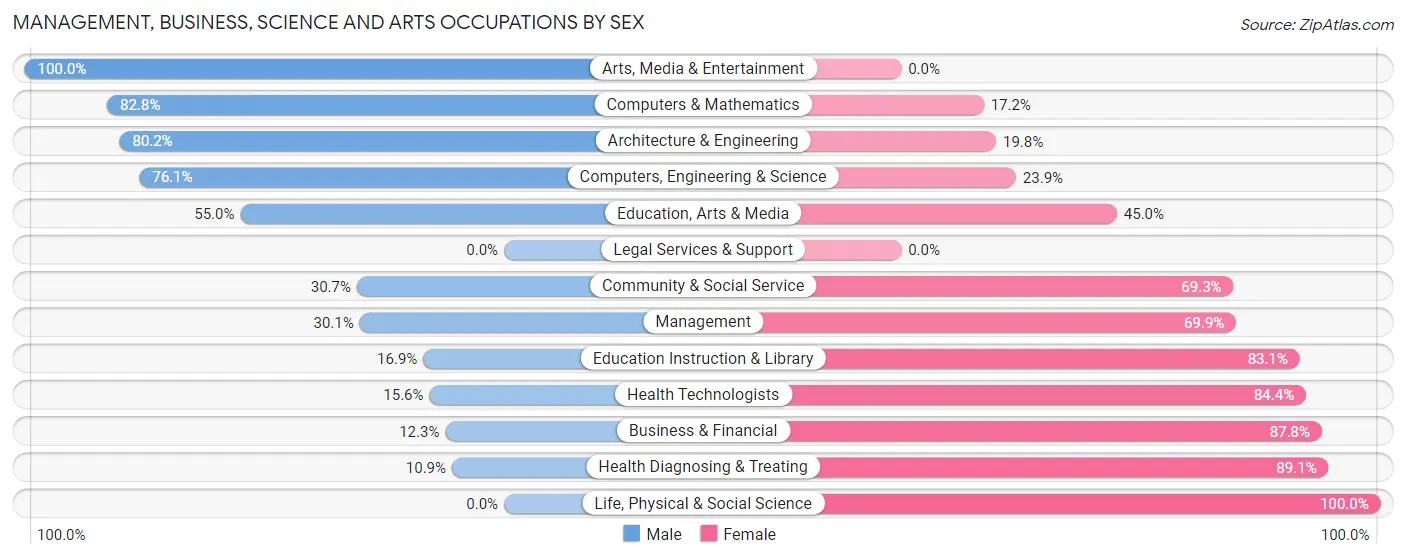
Management, Business, Science and Arts Occupations by Sex
Within the Management, Business, Science and Arts occupations in Ferguson, the most male-oriented occupations are Arts, Media & Entertainment (100.0%), Computers & Mathematics (82.8%), and Architecture & Engineering (80.2%), while the most female-oriented occupations are Life, Physical & Social Science (100.0%), Health Diagnosing & Treating (89.1%), and Business & Financial (87.7%).
| Occupation | Male | Female |
| Management | 166 (30.1%) | 385 (69.9%) |
| Business & Financial | 67 (12.2%) | 480 (87.7%) |
| Computers, Engineering & Science | 178 (76.1%) | 56 (23.9%) |
| Computers & Mathematics | 101 (82.8%) | 21 (17.2%) |
| Architecture & Engineering | 77 (80.2%) | 19 (19.8%) |
| Life, Physical & Social Science | 0 (0.0%) | 16 (100.0%) |
| Community & Social Service | 183 (30.7%) | 413 (69.3%) |
| Education, Arts & Media | 77 (55.0%) | 63 (45.0%) |
| Legal Services & Support | 0 (0.0%) | 0 (0.0%) |
| Education Instruction & Library | 71 (16.9%) | 350 (83.1%) |
| Arts, Media & Entertainment | 35 (100.0%) | 0 (0.0%) |
| Health Diagnosing & Treating | 45 (10.9%) | 369 (89.1%) |
| Health Technologists | 35 (15.6%) | 190 (84.4%) |
| Total (Category) | 639 (27.3%) | 1,703 (72.7%) |
| Total (Overall) | 3,880 (45.1%) | 4,722 (54.9%) |
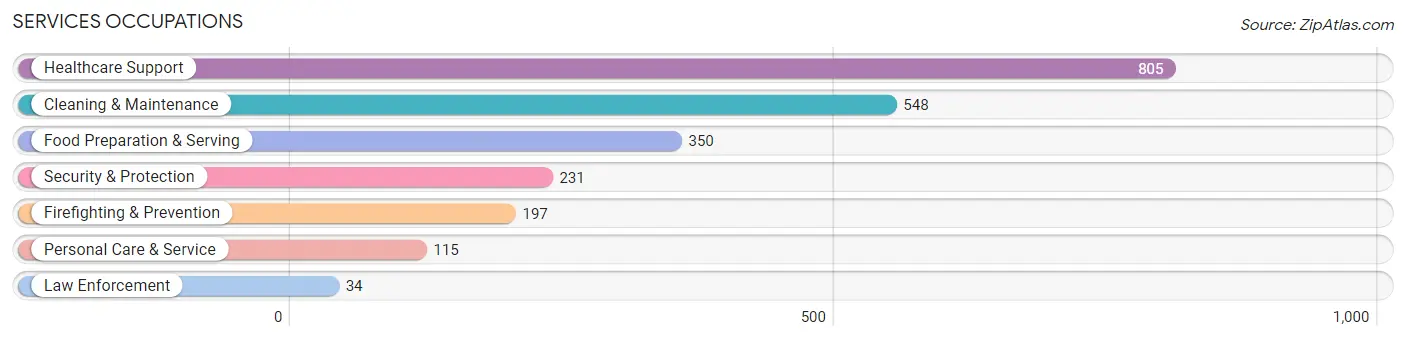
Services Occupations
The most common Services occupations in Ferguson are Healthcare Support (805 | 9.4%), Cleaning & Maintenance (548 | 6.4%), Food Preparation & Serving (350 | 4.1%), Security & Protection (231 | 2.7%), and Firefighting & Prevention (197 | 2.3%).
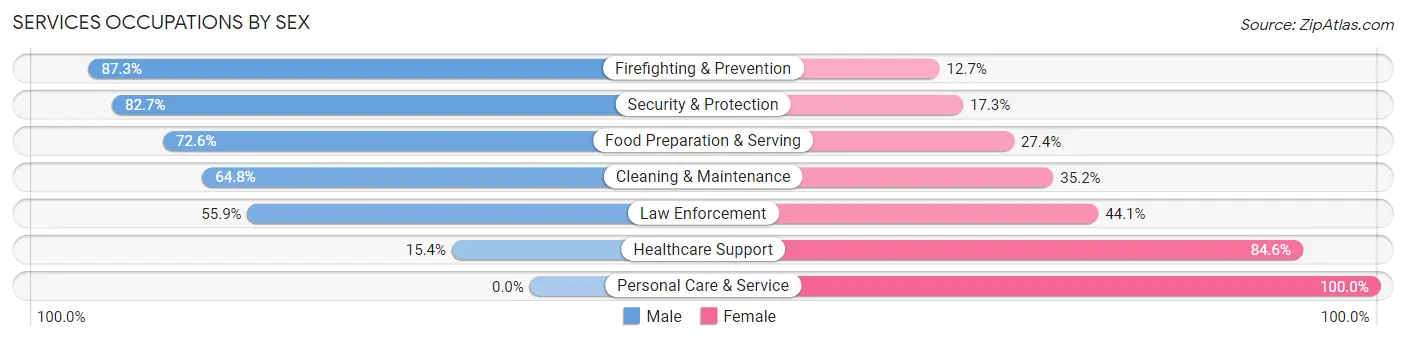
Services Occupations by Sex
Within the Services occupations in Ferguson, the most male-oriented occupations are Firefighting & Prevention (87.3%), Security & Protection (82.7%), and Food Preparation & Serving (72.6%), while the most female-oriented occupations are Personal Care & Service (100.0%), Healthcare Support (84.6%), and Law Enforcement (44.1%).
| Occupation | Male | Female |
| Healthcare Support | 124 (15.4%) | 681 (84.6%) |
| Security & Protection | 191 (82.7%) | 40 (17.3%) |
| Firefighting & Prevention | 172 (87.3%) | 25 (12.7%) |
| Law Enforcement | 19 (55.9%) | 15 (44.1%) |
| Food Preparation & Serving | 254 (72.6%) | 96 (27.4%) |
| Cleaning & Maintenance | 355 (64.8%) | 193 (35.2%) |
| Personal Care & Service | 0 (0.0%) | 115 (100.0%) |
| Total (Category) | 924 (45.1%) | 1,125 (54.9%) |
| Total (Overall) | 3,880 (45.1%) | 4,722 (54.9%) |
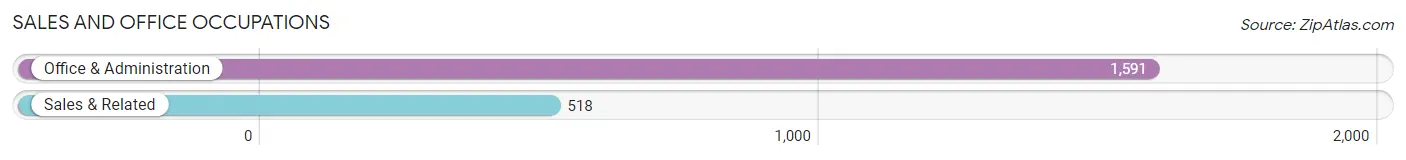
Sales and Office Occupations
The most common Sales and Office occupations in Ferguson are Office & Administration (1,591 | 18.5%), and Sales & Related (518 | 6.0%).
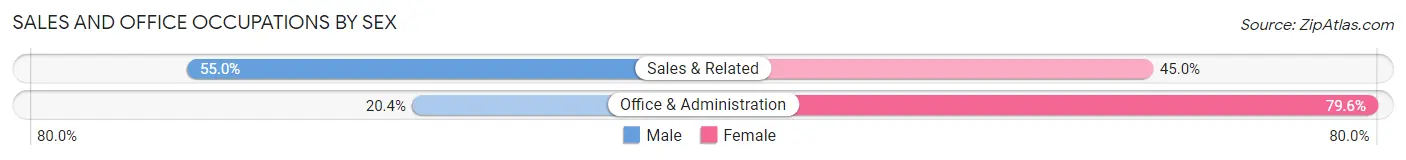
Sales and Office Occupations by Sex
| Occupation | Male | Female |
| Sales & Related | 285 (55.0%) | 233 (45.0%) |
| Office & Administration | 325 (20.4%) | 1,266 (79.6%) |
| Total (Category) | 610 (28.9%) | 1,499 (71.1%) |
| Total (Overall) | 3,880 (45.1%) | 4,722 (54.9%) |
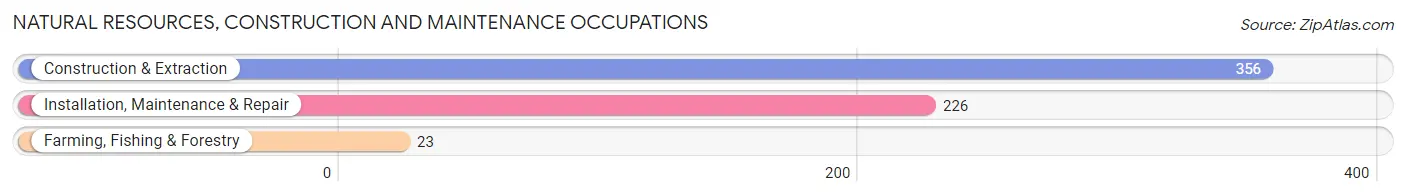
Natural Resources, Construction and Maintenance Occupations
The most common Natural Resources, Construction and Maintenance occupations in Ferguson are Construction & Extraction (356 | 4.1%), Installation, Maintenance & Repair (226 | 2.6%), and Farming, Fishing & Forestry (23 | 0.3%).
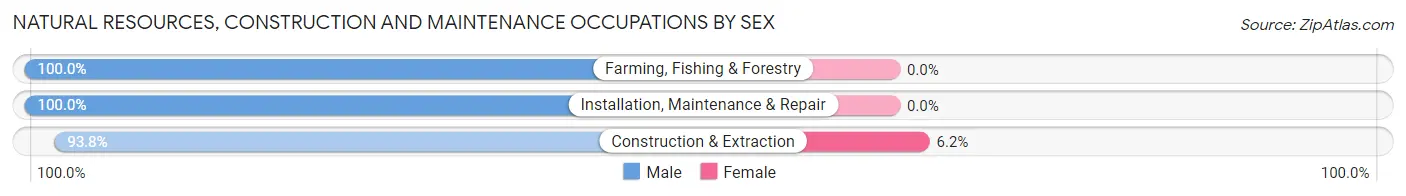
Natural Resources, Construction and Maintenance Occupations by Sex
| Occupation | Male | Female |
| Farming, Fishing & Forestry | 23 (100.0%) | 0 (0.0%) |
| Construction & Extraction | 334 (93.8%) | 22 (6.2%) |
| Installation, Maintenance & Repair | 226 (100.0%) | 0 (0.0%) |
| Total (Category) | 583 (96.4%) | 22 (3.6%) |
| Total (Overall) | 3,880 (45.1%) | 4,722 (54.9%) |
Production, Transportation and Moving Occupations
The most common Production, Transportation and Moving occupations in Ferguson are Material Moving (865 | 10.1%), Production (368 | 4.3%), and Transportation (264 | 3.1%).
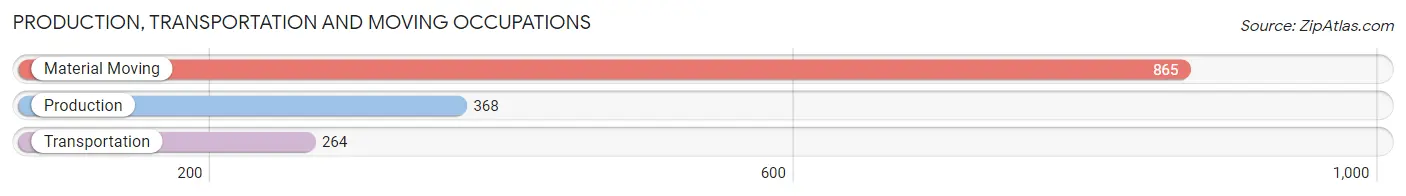
Production, Transportation and Moving Occupations by Sex
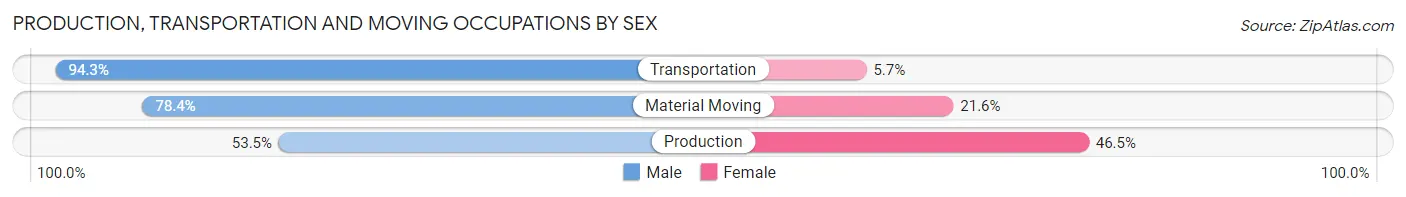
| Occupation | Male | Female |
| Production | 197 (53.5%) | 171 (46.5%) |
| Transportation | 249 (94.3%) | 15 (5.7%) |
| Material Moving | 678 (78.4%) | 187 (21.6%) |
| Total (Category) | 1,124 (75.1%) | 373 (24.9%) |
| Total (Overall) | 3,880 (45.1%) | 4,722 (54.9%) |
Employment Industries by Sex in Ferguson
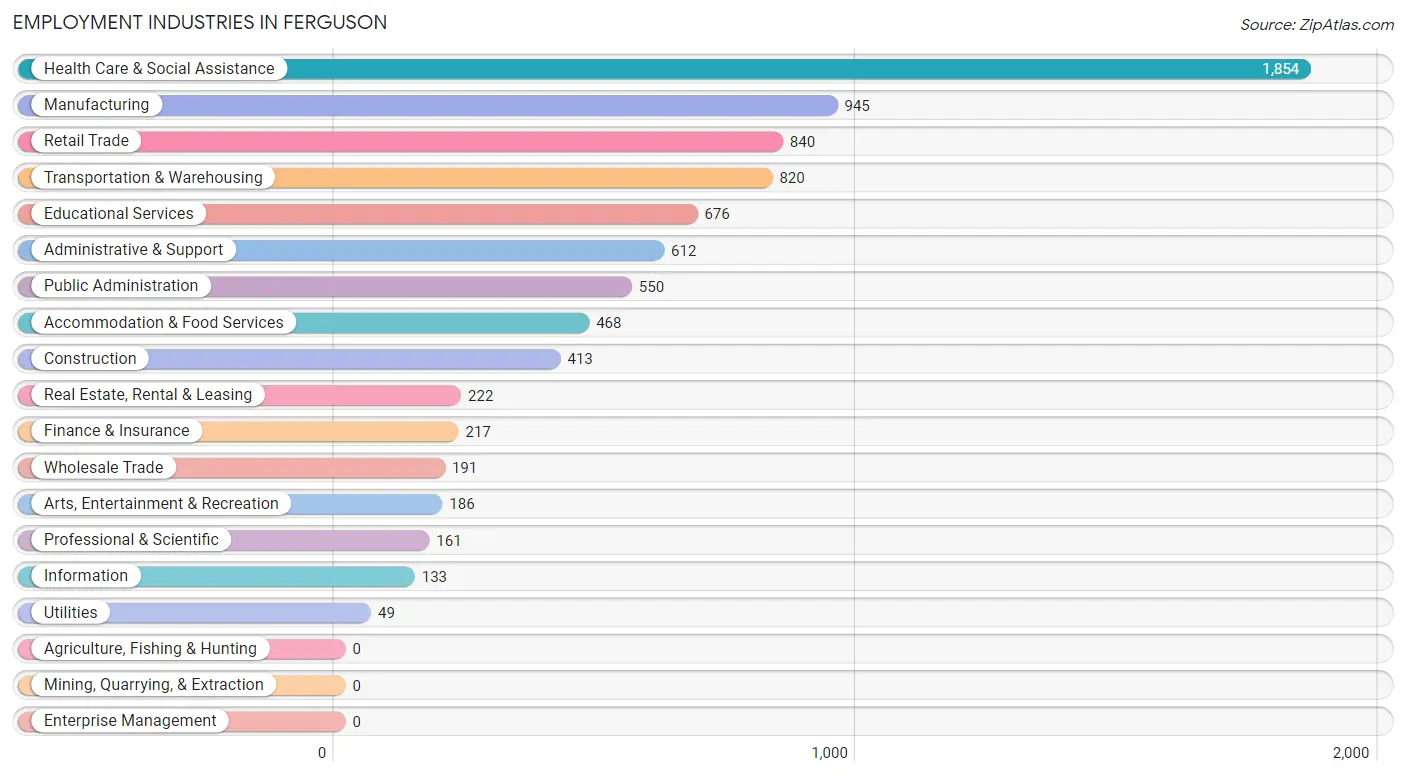
Employment Industries in Ferguson
The major employment industries in Ferguson include Health Care & Social Assistance (1,854 | 21.5%), Manufacturing (945 | 11.0%), Retail Trade (840 | 9.8%), Transportation & Warehousing (820 | 9.5%), and Educational Services (676 | 7.9%).
Employment Industries by Sex in Ferguson
The Ferguson industries that see more men than women are Wholesale Trade (97.9%), Construction (86.9%), and Transportation & Warehousing (80.7%), whereas the industries that tend to have a higher number of women are Finance & Insurance (83.4%), Public Administration (82.9%), and Health Care & Social Assistance (80.7%).
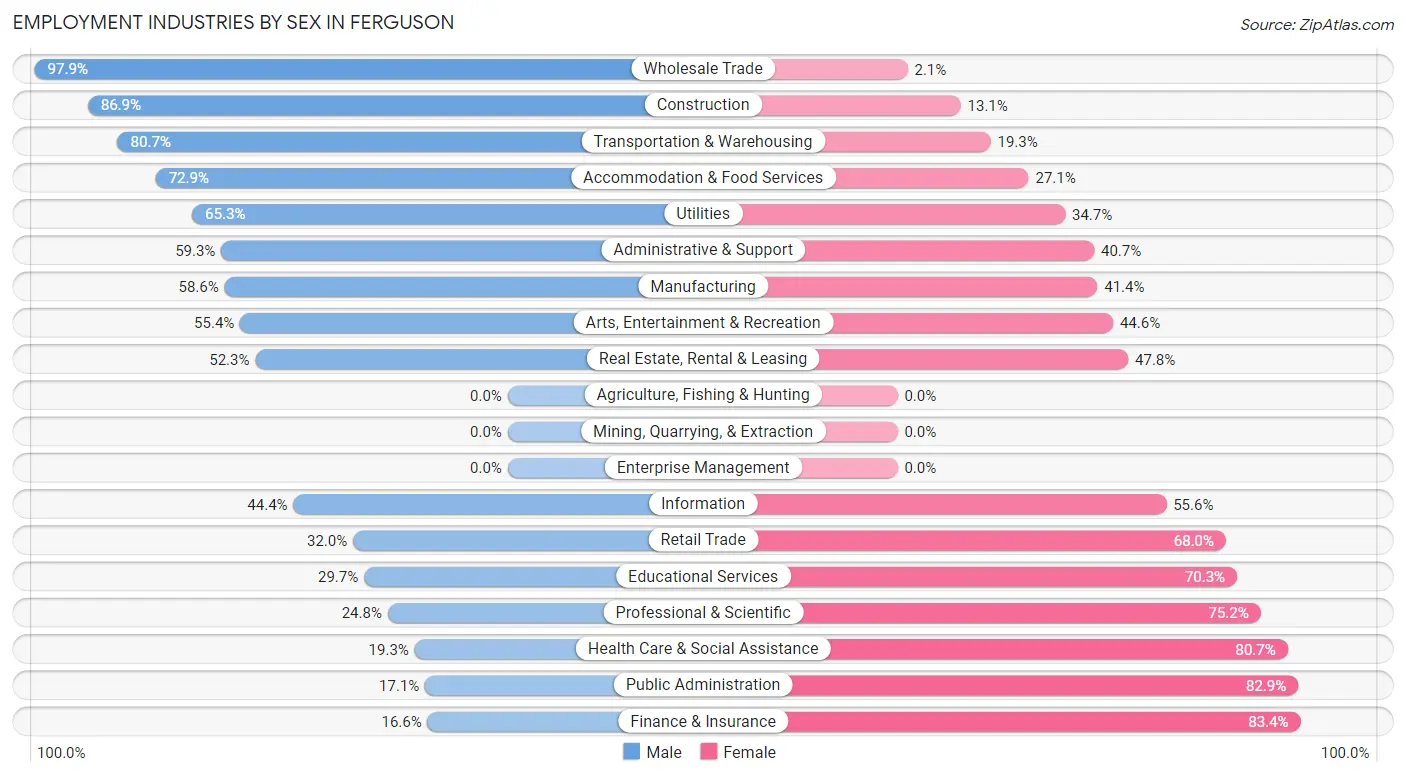
| Industry | Male | Female |
| Agriculture, Fishing & Hunting | 0 (0.0%) | 0 (0.0%) |
| Mining, Quarrying, & Extraction | 0 (0.0%) | 0 (0.0%) |
| Construction | 359 (86.9%) | 54 (13.1%) |
| Manufacturing | 554 (58.6%) | 391 (41.4%) |
| Wholesale Trade | 187 (97.9%) | 4 (2.1%) |
| Retail Trade | 269 (32.0%) | 571 (68.0%) |
| Transportation & Warehousing | 662 (80.7%) | 158 (19.3%) |
| Utilities | 32 (65.3%) | 17 (34.7%) |
| Information | 59 (44.4%) | 74 (55.6%) |
| Finance & Insurance | 36 (16.6%) | 181 (83.4%) |
| Real Estate, Rental & Leasing | 116 (52.2%) | 106 (47.7%) |
| Professional & Scientific | 40 (24.8%) | 121 (75.2%) |
| Enterprise Management | 0 (0.0%) | 0 (0.0%) |
| Administrative & Support | 363 (59.3%) | 249 (40.7%) |
| Educational Services | 201 (29.7%) | 475 (70.3%) |
| Health Care & Social Assistance | 357 (19.3%) | 1,497 (80.7%) |
| Arts, Entertainment & Recreation | 103 (55.4%) | 83 (44.6%) |
| Accommodation & Food Services | 341 (72.9%) | 127 (27.1%) |
| Public Administration | 94 (17.1%) | 456 (82.9%) |
| Total | 3,880 (45.1%) | 4,722 (54.9%) |
Education in Ferguson
School Enrollment in Ferguson
The most common levels of schooling among the 4,023 students in Ferguson are high school (955 | 23.7%), middle school (856 | 21.3%), and elementary school (854 | 21.2%).
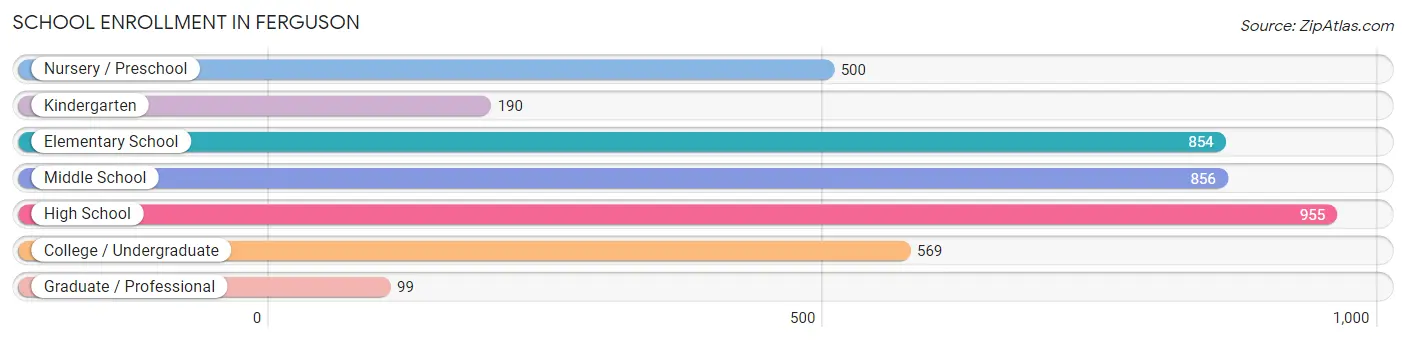
| School Level | # Students | % Students |
| Nursery / Preschool | 500 | 12.4% |
| Kindergarten | 190 | 4.7% |
| Elementary School | 854 | 21.2% |
| Middle School | 856 | 21.3% |
| High School | 955 | 23.7% |
| College / Undergraduate | 569 | 14.1% |
| Graduate / Professional | 99 | 2.5% |
| Total | 4,023 | 100.0% |
School Enrollment by Age by Funding Source in Ferguson
Out of a total of 4,023 students who are enrolled in schools in Ferguson, 583 (14.5%) attend a private institution, while the remaining 3,440 (85.5%) are enrolled in public schools. The age group of 25 to 34 year olds has the highest likelihood of being enrolled in private schools, with 149 (55.6% in the age bracket) enrolled. Conversely, the age group of 35 years and over has the lowest likelihood of being enrolled in a private school, with 93 (93.9% in the age bracket) attending a public institution.
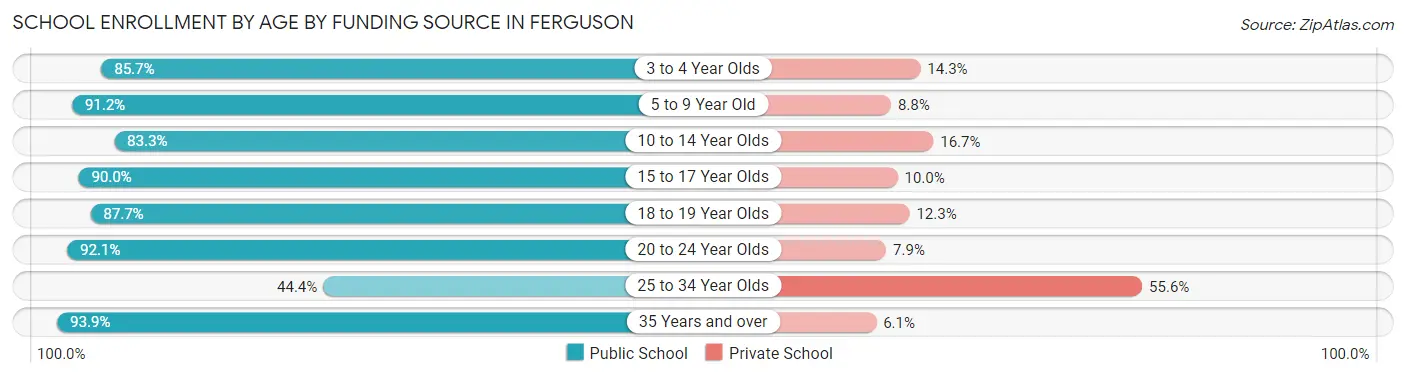
| Age Bracket | Public School | Private School |
| 3 to 4 Year Olds | 390 (85.7%) | 65 (14.3%) |
| 5 to 9 Year Old | 993 (91.2%) | 96 (8.8%) |
| 10 to 14 Year Olds | 714 (83.3%) | 143 (16.7%) |
| 15 to 17 Year Olds | 762 (90.0%) | 85 (10.0%) |
| 18 to 19 Year Olds | 136 (87.7%) | 19 (12.3%) |
| 20 to 24 Year Olds | 233 (92.1%) | 20 (7.9%) |
| 25 to 34 Year Olds | 119 (44.4%) | 149 (55.6%) |
| 35 Years and over | 93 (93.9%) | 6 (6.1%) |
| Total | 3,440 (85.5%) | 583 (14.5%) |
Educational Attainment by Field of Study in Ferguson
Business (727 | 25.8%), education (311 | 11.0%), communications (272 | 9.6%), science & technology (214 | 7.6%), and social sciences (195 | 6.9%) are the most common fields of study among 2,822 individuals in Ferguson who have obtained a bachelor's degree or higher.
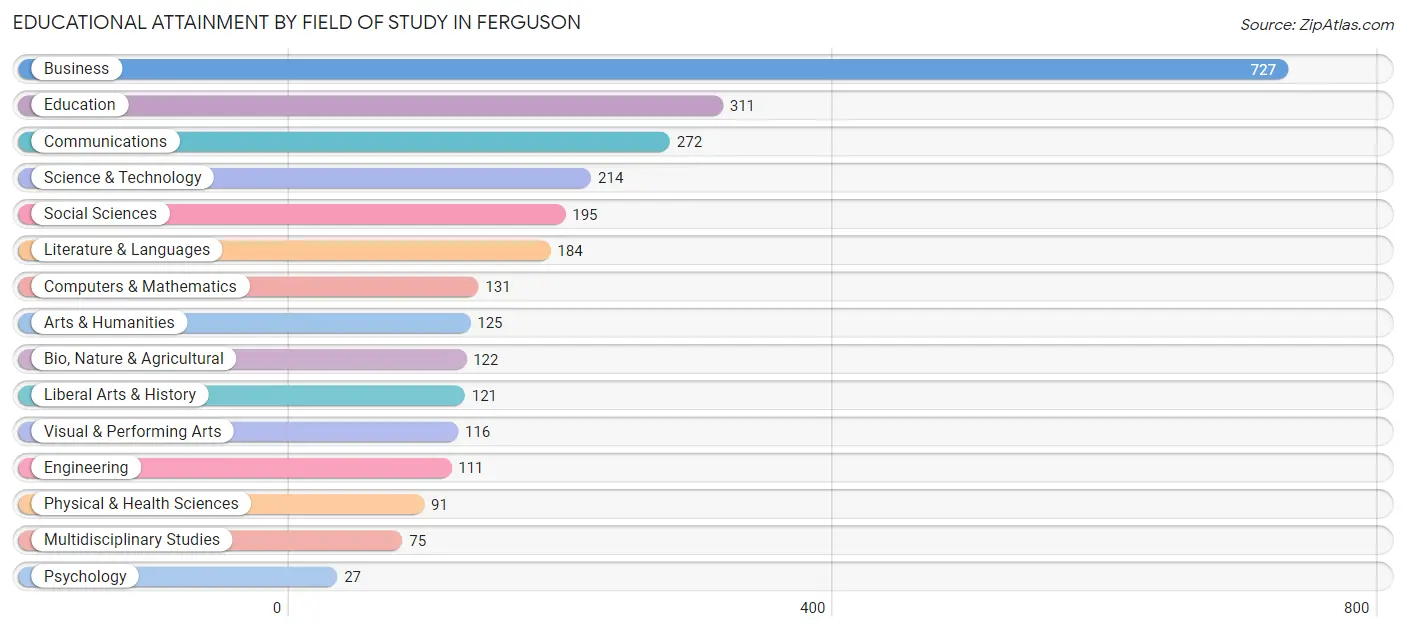
| Field of Study | # Graduates | % Graduates |
| Computers & Mathematics | 131 | 4.6% |
| Bio, Nature & Agricultural | 122 | 4.3% |
| Physical & Health Sciences | 91 | 3.2% |
| Psychology | 27 | 1.0% |
| Social Sciences | 195 | 6.9% |
| Engineering | 111 | 3.9% |
| Multidisciplinary Studies | 75 | 2.7% |
| Science & Technology | 214 | 7.6% |
| Business | 727 | 25.8% |
| Education | 311 | 11.0% |
| Literature & Languages | 184 | 6.5% |
| Liberal Arts & History | 121 | 4.3% |
| Visual & Performing Arts | 116 | 4.1% |
| Communications | 272 | 9.6% |
| Arts & Humanities | 125 | 4.4% |
| Total | 2,822 | 100.0% |
Transportation & Commute in Ferguson
Vehicle Availability by Sex in Ferguson
The most prevalent vehicle ownership categories in Ferguson are males with 2 vehicles (1,316, accounting for 34.6%) and females with 2 vehicles (1,688, making up 29.7%).
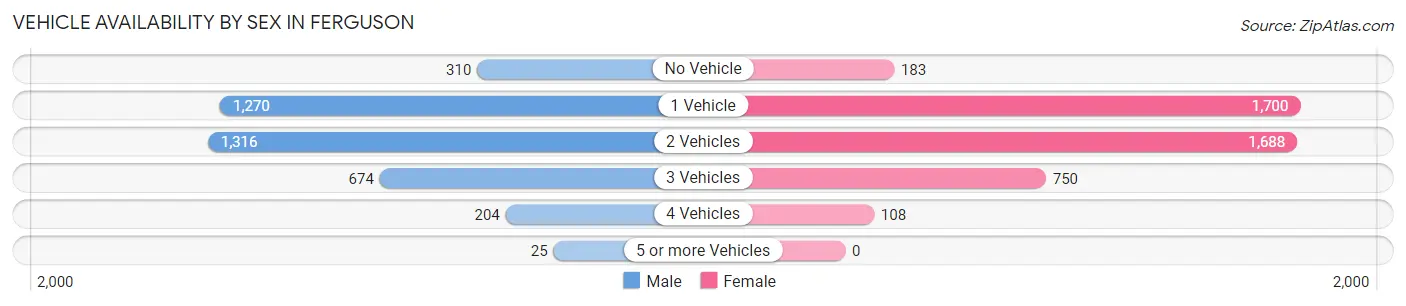
| Vehicles Available | Male | Female |
| No Vehicle | 310 (8.2%) | 183 (4.1%) |
| 1 Vehicle | 1,270 (33.4%) | 1,700 (38.4%) |
| 2 Vehicles | 1,316 (34.6%) | 1,688 (38.1%) |
| 3 Vehicles | 674 (17.7%) | 750 (16.9%) |
| 4 Vehicles | 204 (5.4%) | 108 (2.4%) |
| 5 or more Vehicles | 25 (0.7%) | 0 (0.0%) |
| Total | 3,799 (100.0%) | 4,429 (100.0%) |
Commute Time in Ferguson
The most frequently occuring commute durations in Ferguson are 15 to 19 minutes (1,542 commuters, 21.2%), 30 to 34 minutes (1,398 commuters, 19.2%), and 20 to 24 minutes (1,174 commuters, 16.2%).
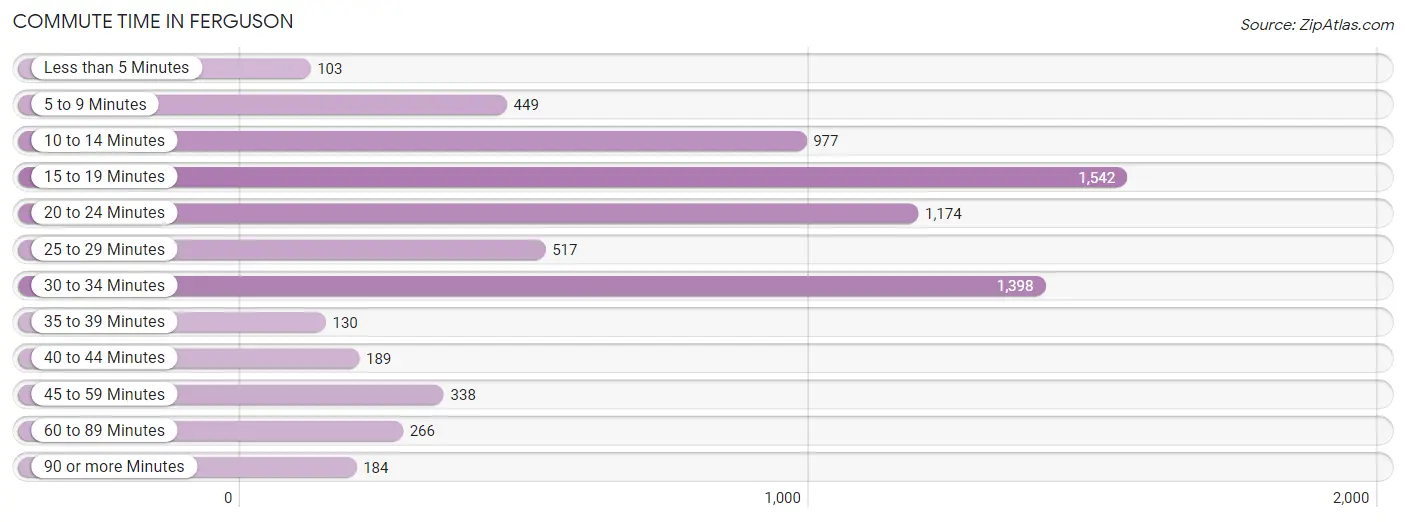
| Commute Time | # Commuters | % Commuters |
| Less than 5 Minutes | 103 | 1.4% |
| 5 to 9 Minutes | 449 | 6.2% |
| 10 to 14 Minutes | 977 | 13.4% |
| 15 to 19 Minutes | 1,542 | 21.2% |
| 20 to 24 Minutes | 1,174 | 16.2% |
| 25 to 29 Minutes | 517 | 7.1% |
| 30 to 34 Minutes | 1,398 | 19.2% |
| 35 to 39 Minutes | 130 | 1.8% |
| 40 to 44 Minutes | 189 | 2.6% |
| 45 to 59 Minutes | 338 | 4.6% |
| 60 to 89 Minutes | 266 | 3.7% |
| 90 or more Minutes | 184 | 2.5% |
Commute Time by Sex in Ferguson
The most common commute times in Ferguson are 30 to 34 minutes (937 commuters, 27.1%) for males and 15 to 19 minutes (782 commuters, 20.5%) for females.
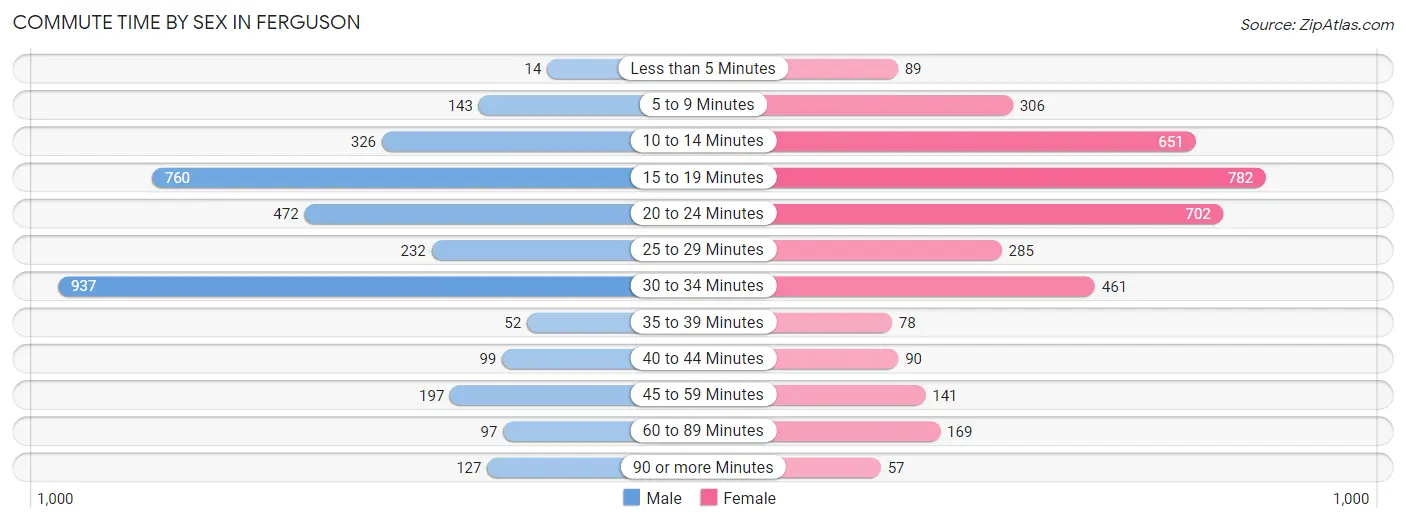
| Commute Time | Male | Female |
| Less than 5 Minutes | 14 (0.4%) | 89 (2.3%) |
| 5 to 9 Minutes | 143 (4.1%) | 306 (8.0%) |
| 10 to 14 Minutes | 326 (9.4%) | 651 (17.1%) |
| 15 to 19 Minutes | 760 (22.0%) | 782 (20.5%) |
| 20 to 24 Minutes | 472 (13.7%) | 702 (18.4%) |
| 25 to 29 Minutes | 232 (6.7%) | 285 (7.5%) |
| 30 to 34 Minutes | 937 (27.1%) | 461 (12.1%) |
| 35 to 39 Minutes | 52 (1.5%) | 78 (2.1%) |
| 40 to 44 Minutes | 99 (2.9%) | 90 (2.4%) |
| 45 to 59 Minutes | 197 (5.7%) | 141 (3.7%) |
| 60 to 89 Minutes | 97 (2.8%) | 169 (4.4%) |
| 90 or more Minutes | 127 (3.7%) | 57 (1.5%) |
Time of Departure to Work by Sex in Ferguson
The most frequent times of departure to work in Ferguson are 4:00 PM to 11:59 PM (677, 19.6%) for males and 7:30 AM to 7:59 AM (768, 20.2%) for females.
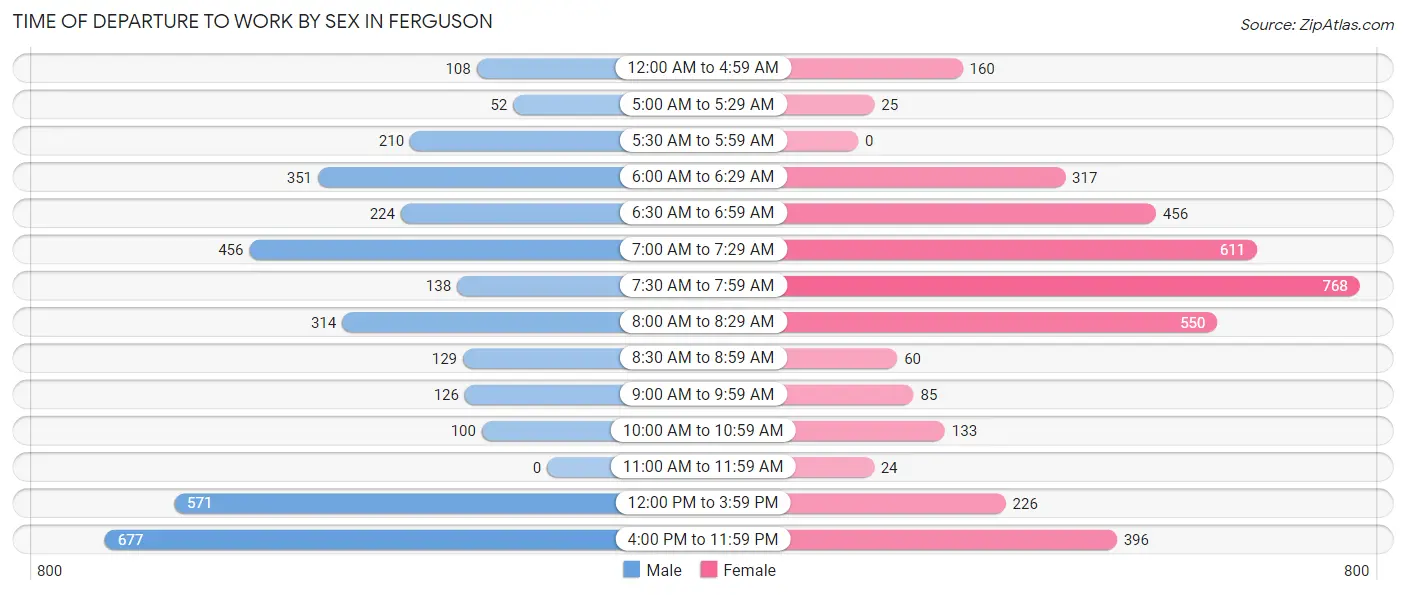
| Time of Departure | Male | Female |
| 12:00 AM to 4:59 AM | 108 (3.1%) | 160 (4.2%) |
| 5:00 AM to 5:29 AM | 52 (1.5%) | 25 (0.7%) |
| 5:30 AM to 5:59 AM | 210 (6.1%) | 0 (0.0%) |
| 6:00 AM to 6:29 AM | 351 (10.2%) | 317 (8.3%) |
| 6:30 AM to 6:59 AM | 224 (6.5%) | 456 (12.0%) |
| 7:00 AM to 7:29 AM | 456 (13.2%) | 611 (16.0%) |
| 7:30 AM to 7:59 AM | 138 (4.0%) | 768 (20.2%) |
| 8:00 AM to 8:29 AM | 314 (9.1%) | 550 (14.4%) |
| 8:30 AM to 8:59 AM | 129 (3.7%) | 60 (1.6%) |
| 9:00 AM to 9:59 AM | 126 (3.6%) | 85 (2.2%) |
| 10:00 AM to 10:59 AM | 100 (2.9%) | 133 (3.5%) |
| 11:00 AM to 11:59 AM | 0 (0.0%) | 24 (0.6%) |
| 12:00 PM to 3:59 PM | 571 (16.5%) | 226 (5.9%) |
| 4:00 PM to 11:59 PM | 677 (19.6%) | 396 (10.4%) |
| Total | 3,456 (100.0%) | 3,811 (100.0%) |
Housing Occupancy in Ferguson
Occupancy by Ownership in Ferguson
Of the total 7,913 dwellings in Ferguson, owner-occupied units account for 3,858 (48.8%), while renter-occupied units make up 4,055 (51.2%).
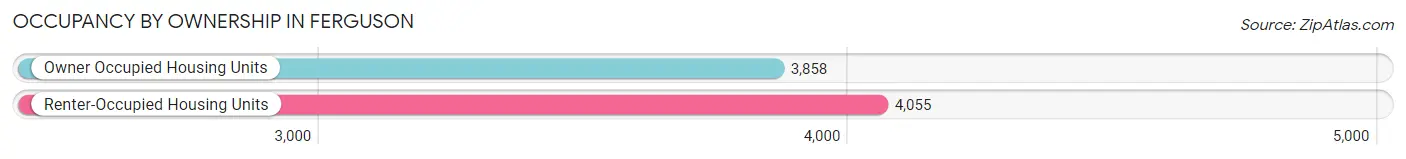
| Occupancy | # Housing Units | % Housing Units |
| Owner Occupied Housing Units | 3,858 | 48.8% |
| Renter-Occupied Housing Units | 4,055 | 51.2% |
| Total Occupied Housing Units | 7,913 | 100.0% |
Occupancy by Household Size in Ferguson
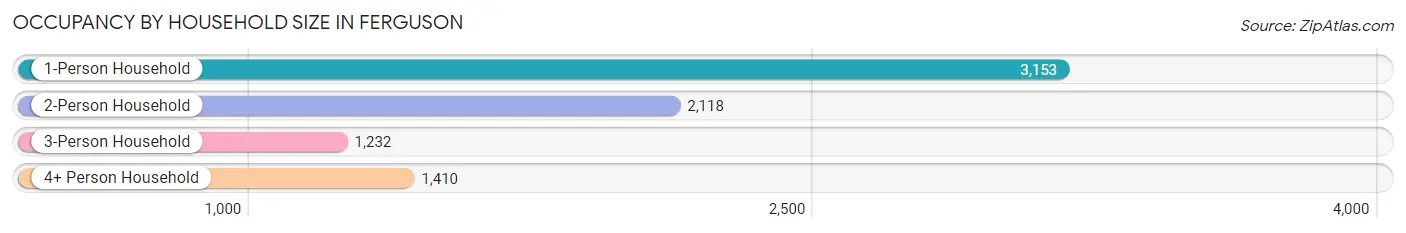
| Household Size | # Housing Units | % Housing Units |
| 1-Person Household | 3,153 | 39.9% |
| 2-Person Household | 2,118 | 26.8% |
| 3-Person Household | 1,232 | 15.6% |
| 4+ Person Household | 1,410 | 17.8% |
| Total Housing Units | 7,913 | 100.0% |
Occupancy by Ownership by Household Size in Ferguson
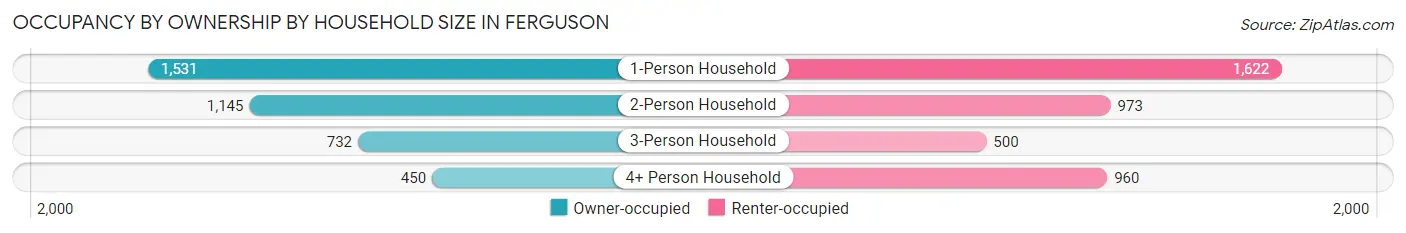
| Household Size | Owner-occupied | Renter-occupied |
| 1-Person Household | 1,531 (48.6%) | 1,622 (51.4%) |
| 2-Person Household | 1,145 (54.1%) | 973 (45.9%) |
| 3-Person Household | 732 (59.4%) | 500 (40.6%) |
| 4+ Person Household | 450 (31.9%) | 960 (68.1%) |
| Total Housing Units | 3,858 (48.8%) | 4,055 (51.2%) |
Occupancy by Educational Attainment in Ferguson
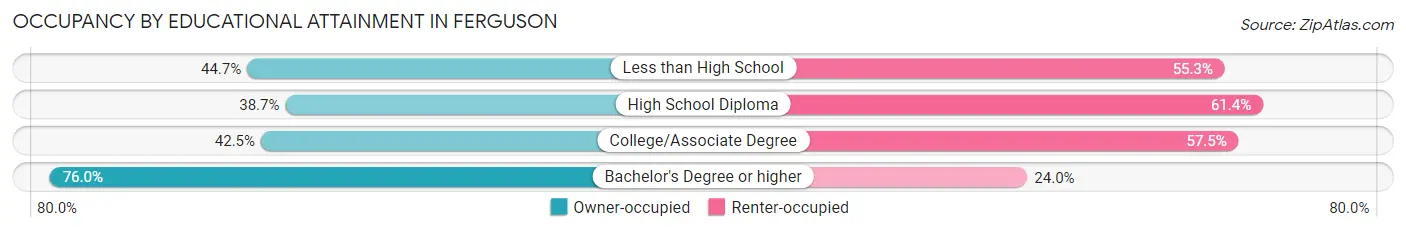
| Household Size | Owner-occupied | Renter-occupied |
| Less than High School | 360 (44.7%) | 445 (55.3%) |
| High School Diploma | 943 (38.7%) | 1,497 (61.4%) |
| College/Associate Degree | 1,262 (42.5%) | 1,705 (57.5%) |
| Bachelor's Degree or higher | 1,293 (76.0%) | 408 (24.0%) |
Occupancy by Age of Householder in Ferguson
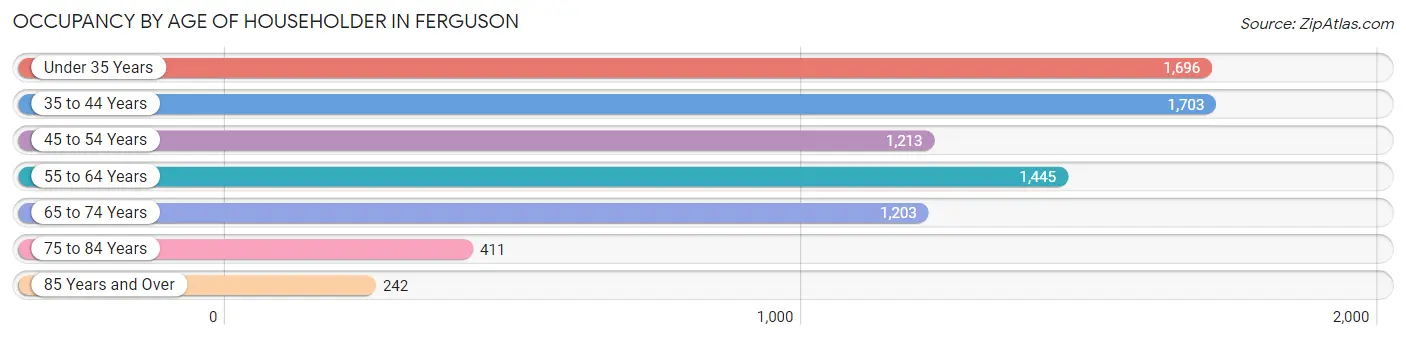
| Age Bracket | # Households | % Households |
| Under 35 Years | 1,696 | 21.4% |
| 35 to 44 Years | 1,703 | 21.5% |
| 45 to 54 Years | 1,213 | 15.3% |
| 55 to 64 Years | 1,445 | 18.3% |
| 65 to 74 Years | 1,203 | 15.2% |
| 75 to 84 Years | 411 | 5.2% |
| 85 Years and Over | 242 | 3.1% |
| Total | 7,913 | 100.0% |
Housing Finances in Ferguson
Median Income by Occupancy in Ferguson
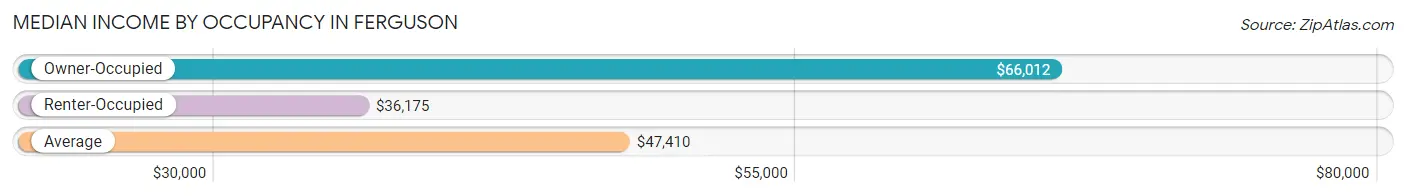
| Occupancy Type | # Households | Median Income |
| Owner-Occupied | 3,858 (48.8%) | $66,012 |
| Renter-Occupied | 4,055 (51.2%) | $36,175 |
| Average | 7,913 (100.0%) | $47,410 |
Occupancy by Householder Income Bracket in Ferguson
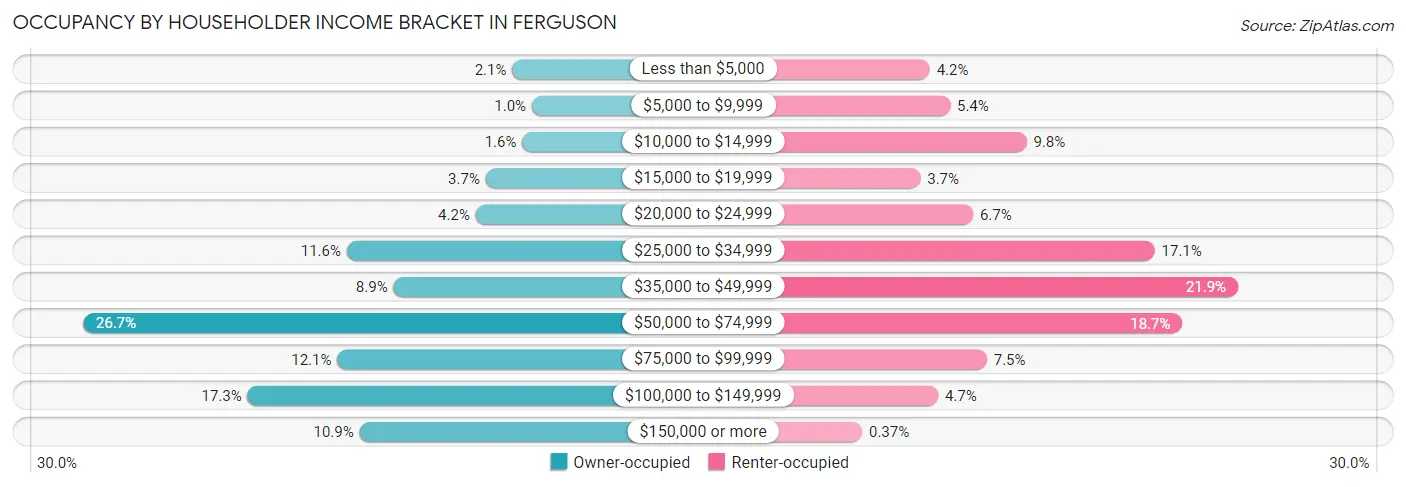
| Income Bracket | Owner-occupied | Renter-occupied |
| Less than $5,000 | 82 (2.1%) | 172 (4.2%) |
| $5,000 to $9,999 | 39 (1.0%) | 219 (5.4%) |
| $10,000 to $14,999 | 60 (1.6%) | 396 (9.8%) |
| $15,000 to $19,999 | 141 (3.6%) | 150 (3.7%) |
| $20,000 to $24,999 | 163 (4.2%) | 272 (6.7%) |
| $25,000 to $34,999 | 447 (11.6%) | 693 (17.1%) |
| $35,000 to $49,999 | 344 (8.9%) | 886 (21.8%) |
| $50,000 to $74,999 | 1,029 (26.7%) | 757 (18.7%) |
| $75,000 to $99,999 | 468 (12.1%) | 304 (7.5%) |
| $100,000 to $149,999 | 666 (17.3%) | 191 (4.7%) |
| $150,000 or more | 419 (10.9%) | 15 (0.4%) |
| Total | 3,858 (100.0%) | 4,055 (100.0%) |
Monthly Housing Cost Tiers in Ferguson
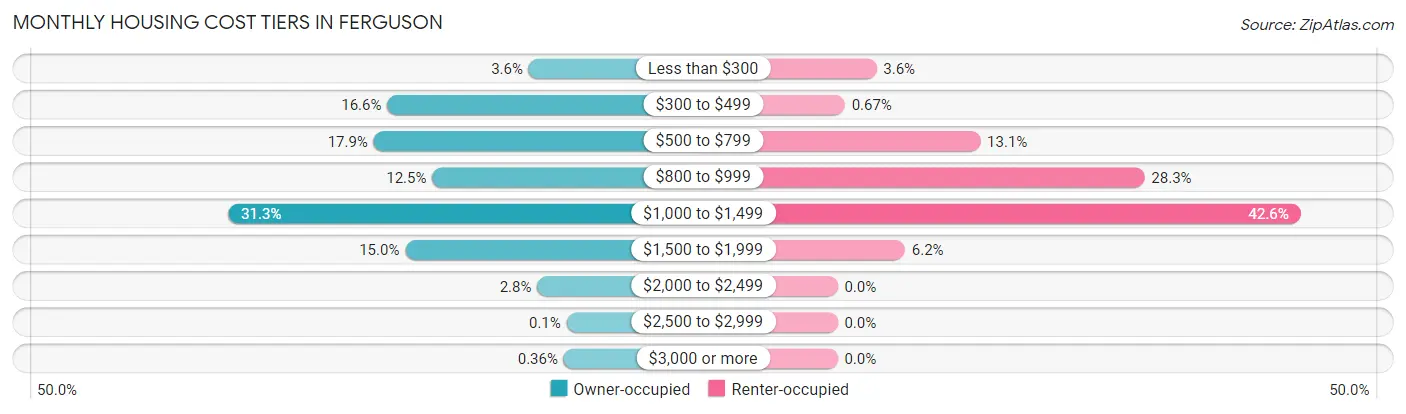
| Monthly Cost | Owner-occupied | Renter-occupied |
| Less than $300 | 138 (3.6%) | 145 (3.6%) |
| $300 to $499 | 641 (16.6%) | 27 (0.7%) |
| $500 to $799 | 689 (17.9%) | 533 (13.1%) |
| $800 to $999 | 481 (12.5%) | 1,146 (28.3%) |
| $1,000 to $1,499 | 1,206 (31.3%) | 1,729 (42.6%) |
| $1,500 to $1,999 | 577 (15.0%) | 252 (6.2%) |
| $2,000 to $2,499 | 108 (2.8%) | 0 (0.0%) |
| $2,500 to $2,999 | 4 (0.1%) | 0 (0.0%) |
| $3,000 or more | 14 (0.4%) | 0 (0.0%) |
| Total | 3,858 (100.0%) | 4,055 (100.0%) |
Physical Housing Characteristics in Ferguson
Housing Structures in Ferguson
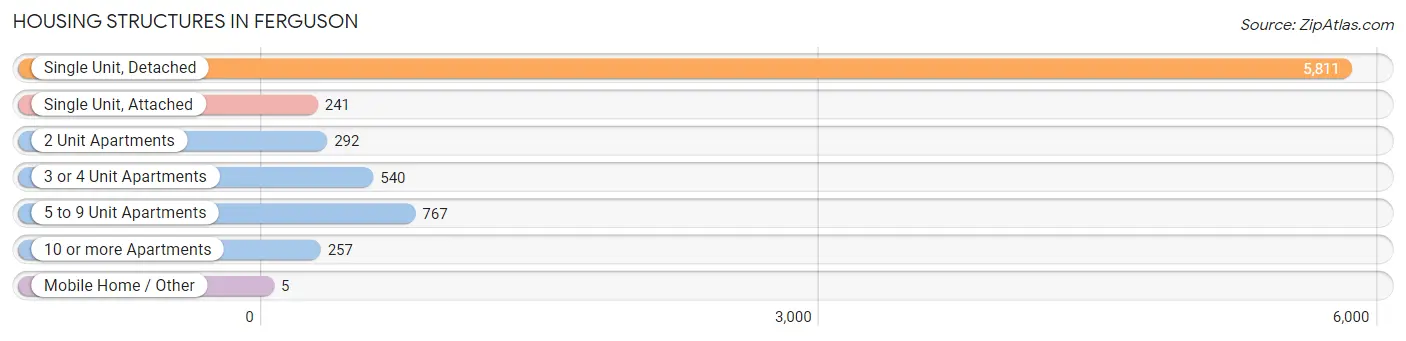
| Structure Type | # Housing Units | % Housing Units |
| Single Unit, Detached | 5,811 | 73.4% |
| Single Unit, Attached | 241 | 3.0% |
| 2 Unit Apartments | 292 | 3.7% |
| 3 or 4 Unit Apartments | 540 | 6.8% |
| 5 to 9 Unit Apartments | 767 | 9.7% |
| 10 or more Apartments | 257 | 3.3% |
| Mobile Home / Other | 5 | 0.1% |
| Total | 7,913 | 100.0% |
Housing Structures by Occupancy in Ferguson
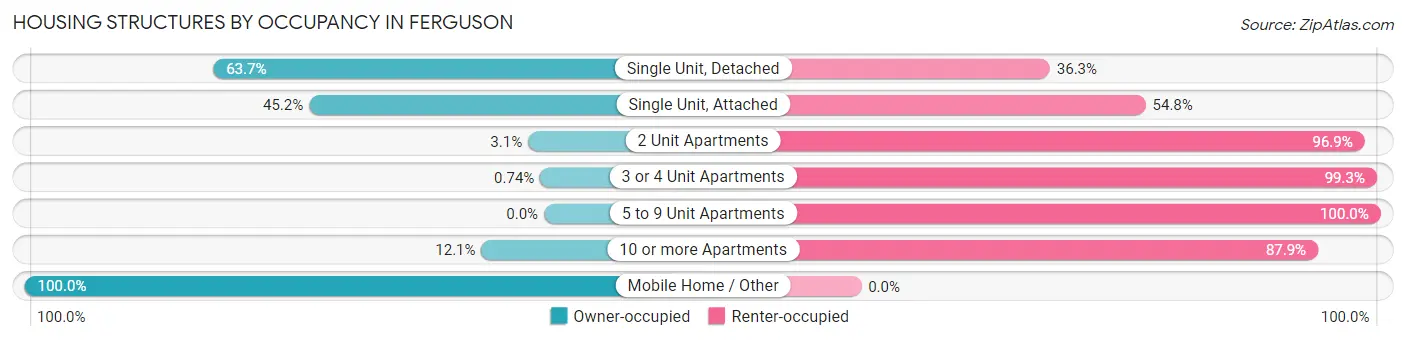
| Structure Type | Owner-occupied | Renter-occupied |
| Single Unit, Detached | 3,700 (63.7%) | 2,111 (36.3%) |
| Single Unit, Attached | 109 (45.2%) | 132 (54.8%) |
| 2 Unit Apartments | 9 (3.1%) | 283 (96.9%) |
| 3 or 4 Unit Apartments | 4 (0.7%) | 536 (99.3%) |
| 5 to 9 Unit Apartments | 0 (0.0%) | 767 (100.0%) |
| 10 or more Apartments | 31 (12.1%) | 226 (87.9%) |
| Mobile Home / Other | 5 (100.0%) | 0 (0.0%) |
| Total | 3,858 (48.8%) | 4,055 (51.2%) |
Housing Structures by Number of Rooms in Ferguson
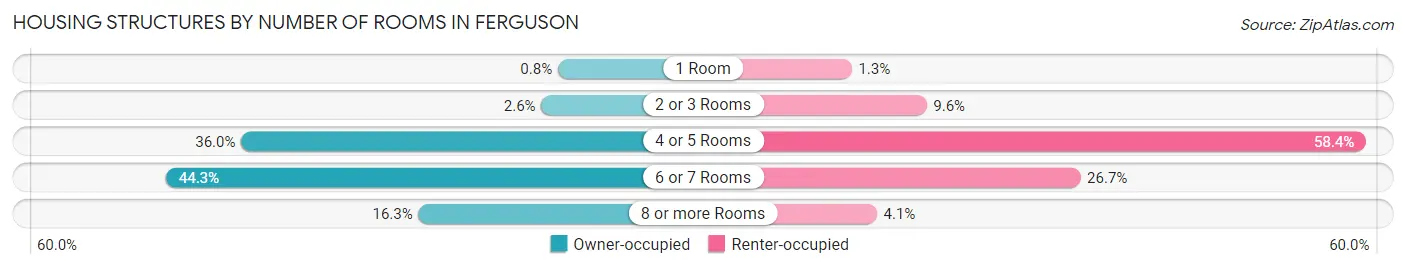
| Number of Rooms | Owner-occupied | Renter-occupied |
| 1 Room | 31 (0.8%) | 52 (1.3%) |
| 2 or 3 Rooms | 102 (2.6%) | 389 (9.6%) |
| 4 or 5 Rooms | 1,387 (35.9%) | 2,368 (58.4%) |
| 6 or 7 Rooms | 1,710 (44.3%) | 1,081 (26.7%) |
| 8 or more Rooms | 628 (16.3%) | 165 (4.1%) |
| Total | 3,858 (100.0%) | 4,055 (100.0%) |
Housing Structure by Heating Type in Ferguson
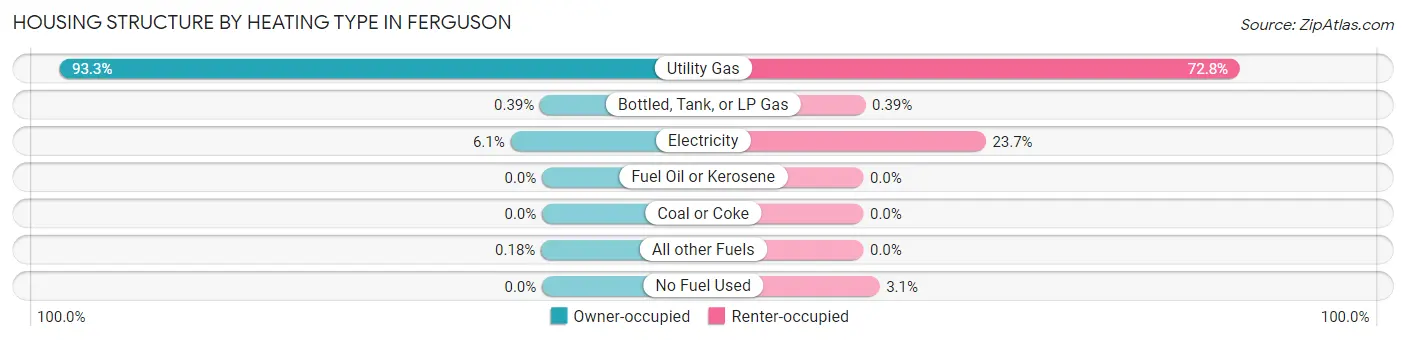
| Heating Type | Owner-occupied | Renter-occupied |
| Utility Gas | 3,601 (93.3%) | 2,953 (72.8%) |
| Bottled, Tank, or LP Gas | 15 (0.4%) | 16 (0.4%) |
| Electricity | 235 (6.1%) | 959 (23.6%) |
| Fuel Oil or Kerosene | 0 (0.0%) | 0 (0.0%) |
| Coal or Coke | 0 (0.0%) | 0 (0.0%) |
| All other Fuels | 7 (0.2%) | 0 (0.0%) |
| No Fuel Used | 0 (0.0%) | 127 (3.1%) |
| Total | 3,858 (100.0%) | 4,055 (100.0%) |
Household Vehicle Usage in Ferguson
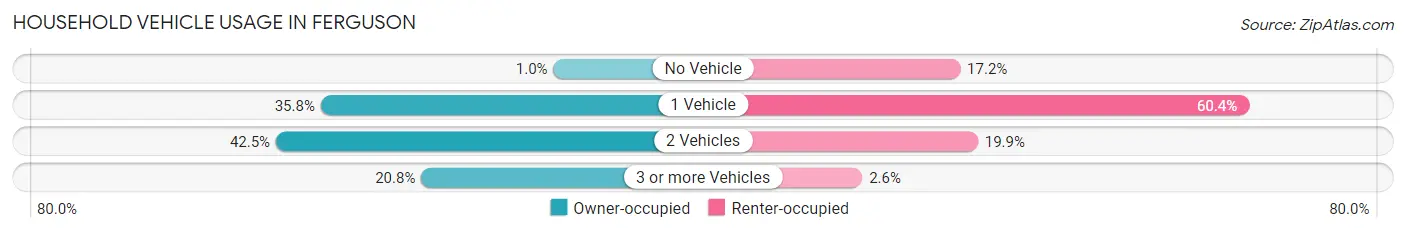
| Vehicles per Household | Owner-occupied | Renter-occupied |
| No Vehicle | 39 (1.0%) | 698 (17.2%) |
| 1 Vehicle | 1,380 (35.8%) | 2,447 (60.4%) |
| 2 Vehicles | 1,638 (42.5%) | 805 (19.9%) |
| 3 or more Vehicles | 801 (20.8%) | 105 (2.6%) |
| Total | 3,858 (100.0%) | 4,055 (100.0%) |
Real Estate & Mortgages in Ferguson
Real Estate and Mortgage Overview in Ferguson
| Characteristic | Without Mortgage | With Mortgage |
| Housing Units | 1,305 | 2,553 |
| Median Property Value | $80,200 | $99,600 |
| Median Household Income | $45,771 | $299 |
| Monthly Housing Costs | $467 | $14 |
| Real Estate Taxes | $1,470 | $14 |
Property Value by Mortgage Status in Ferguson
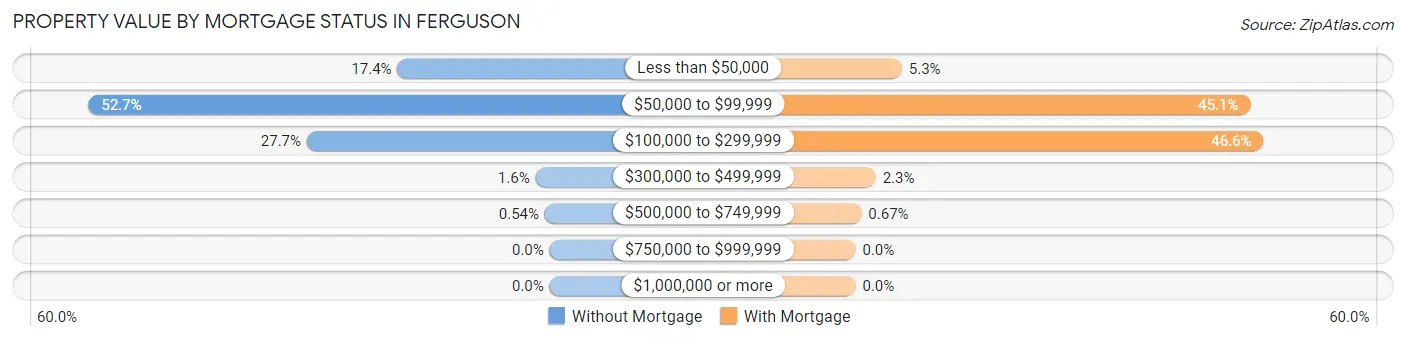
| Property Value | Without Mortgage | With Mortgage |
| Less than $50,000 | 227 (17.4%) | 135 (5.3%) |
| $50,000 to $99,999 | 688 (52.7%) | 1,152 (45.1%) |
| $100,000 to $299,999 | 362 (27.7%) | 1,190 (46.6%) |
| $300,000 to $499,999 | 21 (1.6%) | 59 (2.3%) |
| $500,000 to $749,999 | 7 (0.5%) | 17 (0.7%) |
| $750,000 to $999,999 | 0 (0.0%) | 0 (0.0%) |
| $1,000,000 or more | 0 (0.0%) | 0 (0.0%) |
| Total | 1,305 (100.0%) | 2,553 (100.0%) |
Household Income by Mortgage Status in Ferguson
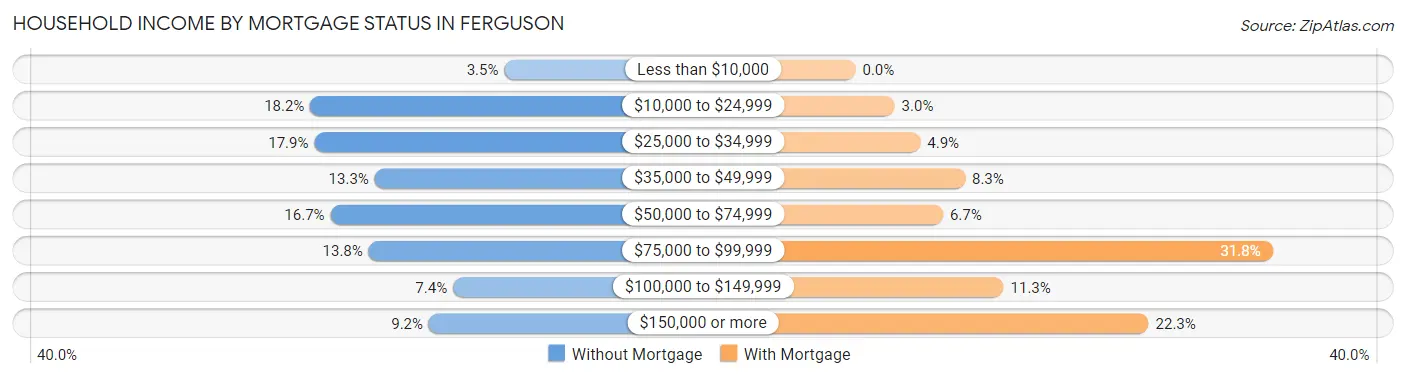
| Household Income | Without Mortgage | With Mortgage |
| Less than $10,000 | 45 (3.5%) | 0 (0.0%) |
| $10,000 to $24,999 | 238 (18.2%) | 76 (3.0%) |
| $25,000 to $34,999 | 234 (17.9%) | 126 (4.9%) |
| $35,000 to $49,999 | 174 (13.3%) | 213 (8.3%) |
| $50,000 to $74,999 | 218 (16.7%) | 170 (6.7%) |
| $75,000 to $99,999 | 180 (13.8%) | 811 (31.8%) |
| $100,000 to $149,999 | 96 (7.4%) | 288 (11.3%) |
| $150,000 or more | 120 (9.2%) | 570 (22.3%) |
| Total | 1,305 (100.0%) | 2,553 (100.0%) |
Property Value to Household Income Ratio in Ferguson
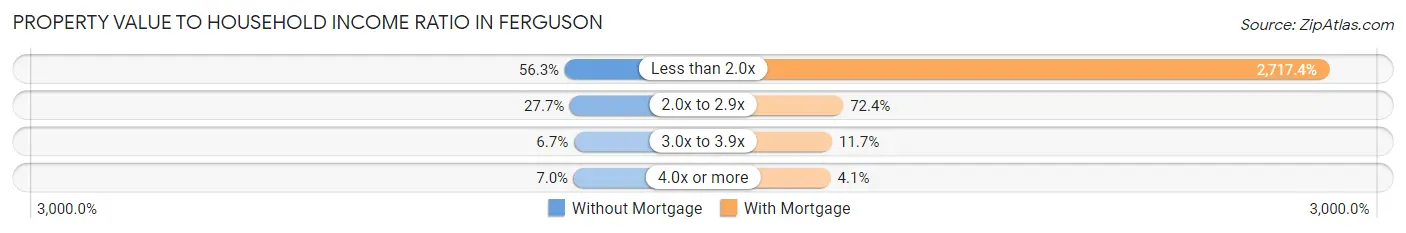
| Value-to-Income Ratio | Without Mortgage | With Mortgage |
| Less than 2.0x | 734 (56.2%) | 69,375 (2,717.4%) |
| 2.0x to 2.9x | 361 (27.7%) | 1,849 (72.4%) |
| 3.0x to 3.9x | 88 (6.7%) | 299 (11.7%) |
| 4.0x or more | 91 (7.0%) | 104 (4.1%) |
| Total | 1,305 (100.0%) | 2,553 (100.0%) |
Real Estate Taxes by Mortgage Status in Ferguson
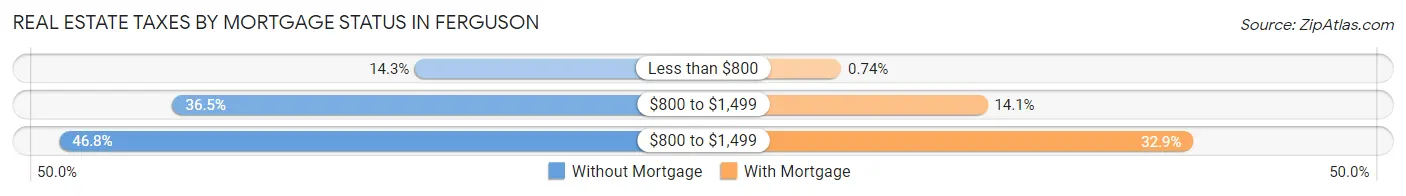
| Property Taxes | Without Mortgage | With Mortgage |
| Less than $800 | 187 (14.3%) | 19 (0.7%) |
| $800 to $1,499 | 476 (36.5%) | 360 (14.1%) |
| $800 to $1,499 | 611 (46.8%) | 840 (32.9%) |
| Total | 1,305 (100.0%) | 2,553 (100.0%) |
Health & Disability in Ferguson
Health Insurance Coverage by Age in Ferguson
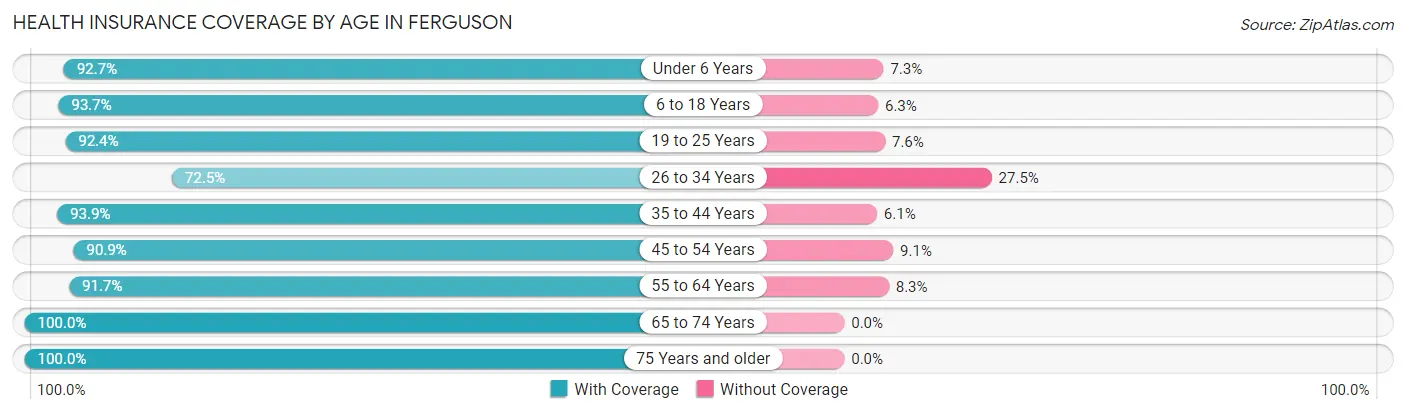
| Age Bracket | With Coverage | Without Coverage |
| Under 6 Years | 1,752 (92.7%) | 138 (7.3%) |
| 6 to 18 Years | 2,844 (93.7%) | 191 (6.3%) |
| 19 to 25 Years | 1,520 (92.4%) | 125 (7.6%) |
| 26 to 34 Years | 2,077 (72.5%) | 787 (27.5%) |
| 35 to 44 Years | 2,256 (93.9%) | 146 (6.1%) |
| 45 to 54 Years | 1,726 (90.9%) | 173 (9.1%) |
| 55 to 64 Years | 2,001 (91.7%) | 181 (8.3%) |
| 65 to 74 Years | 1,548 (100.0%) | 0 (0.0%) |
| 75 Years and older | 896 (100.0%) | 0 (0.0%) |
| Total | 16,620 (90.5%) | 1,741 (9.5%) |
Health Insurance Coverage by Citizenship Status in Ferguson
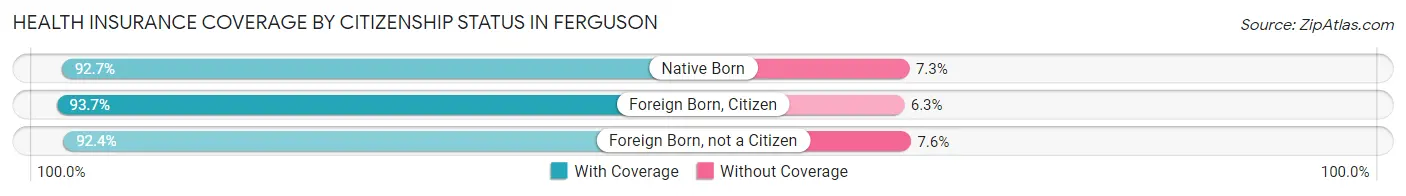
| Citizenship Status | With Coverage | Without Coverage |
| Native Born | 1,752 (92.7%) | 138 (7.3%) |
| Foreign Born, Citizen | 2,844 (93.7%) | 191 (6.3%) |
| Foreign Born, not a Citizen | 1,520 (92.4%) | 125 (7.6%) |
Health Insurance Coverage by Household Income in Ferguson
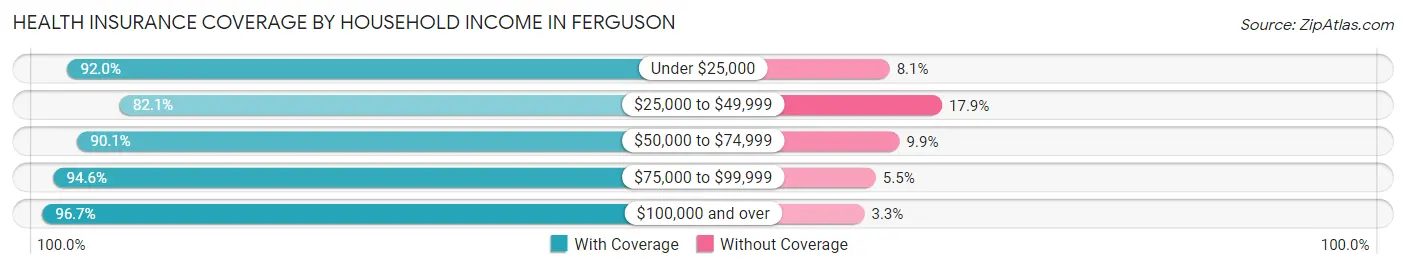
| Household Income | With Coverage | Without Coverage |
| Under $25,000 | 3,358 (91.9%) | 294 (8.1%) |
| $25,000 to $49,999 | 3,685 (82.1%) | 801 (17.9%) |
| $50,000 to $74,999 | 3,542 (90.1%) | 389 (9.9%) |
| $75,000 to $99,999 | 2,100 (94.6%) | 121 (5.4%) |
| $100,000 and over | 3,926 (96.7%) | 135 (3.3%) |
Public vs Private Health Insurance Coverage by Age in Ferguson
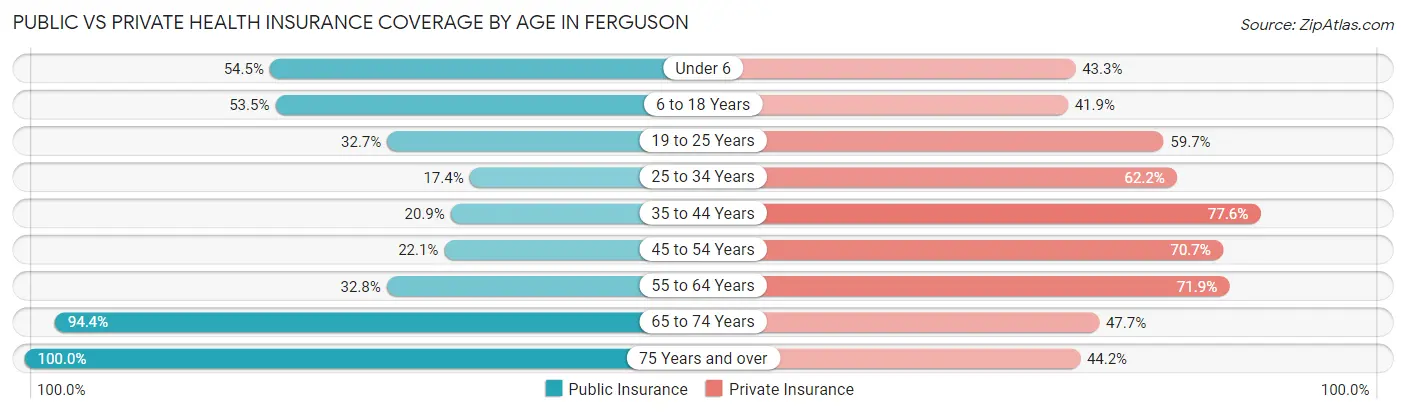
| Age Bracket | Public Insurance | Private Insurance |
| Under 6 | 1,030 (54.5%) | 819 (43.3%) |
| 6 to 18 Years | 1,623 (53.5%) | 1,273 (41.9%) |
| 19 to 25 Years | 538 (32.7%) | 982 (59.7%) |
| 25 to 34 Years | 499 (17.4%) | 1,780 (62.2%) |
| 35 to 44 Years | 503 (20.9%) | 1,865 (77.6%) |
| 45 to 54 Years | 420 (22.1%) | 1,342 (70.7%) |
| 55 to 64 Years | 716 (32.8%) | 1,568 (71.9%) |
| 65 to 74 Years | 1,461 (94.4%) | 739 (47.7%) |
| 75 Years and over | 896 (100.0%) | 396 (44.2%) |
| Total | 7,686 (41.9%) | 10,764 (58.6%) |
Disability Status by Sex by Age in Ferguson
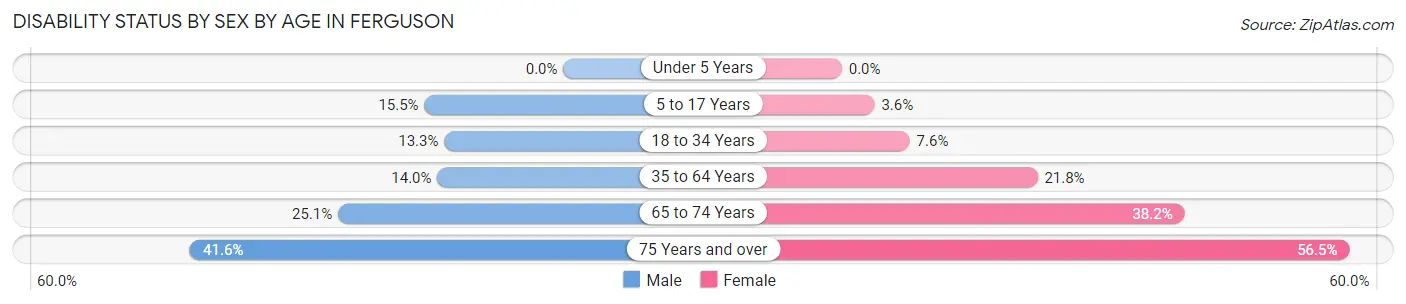
| Age Bracket | Male | Female |
| Under 5 Years | 0 (0.0%) | 0 (0.0%) |
| 5 to 17 Years | 222 (15.5%) | 55 (3.6%) |
| 18 to 34 Years | 331 (13.3%) | 171 (7.6%) |
| 35 to 64 Years | 374 (14.0%) | 832 (21.8%) |
| 65 to 74 Years | 203 (25.1%) | 282 (38.2%) |
| 75 Years and over | 101 (41.6%) | 369 (56.5%) |
Disability Class by Sex by Age in Ferguson
Disability Class: Hearing Difficulty
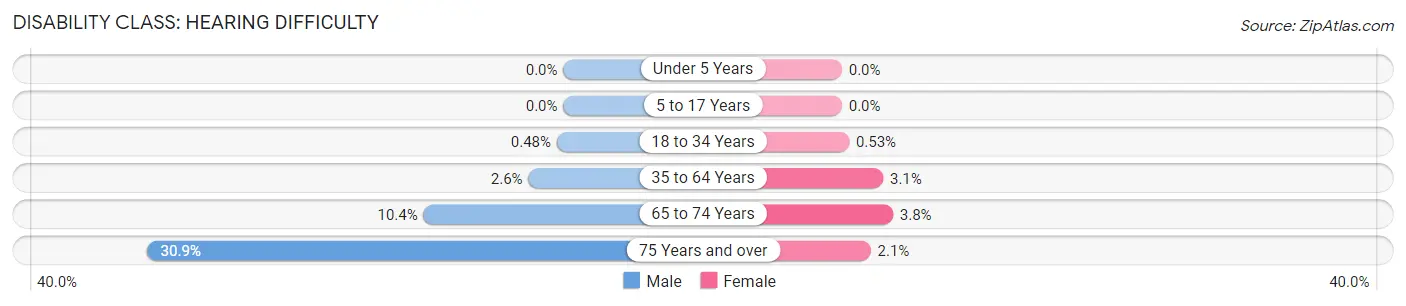
| Age Bracket | Male | Female |
| Under 5 Years | 0 (0.0%) | 0 (0.0%) |
| 5 to 17 Years | 0 (0.0%) | 0 (0.0%) |
| 18 to 34 Years | 12 (0.5%) | 12 (0.5%) |
| 35 to 64 Years | 69 (2.6%) | 117 (3.1%) |
| 65 to 74 Years | 84 (10.4%) | 28 (3.8%) |
| 75 Years and over | 75 (30.9%) | 14 (2.1%) |
Disability Class: Vision Difficulty
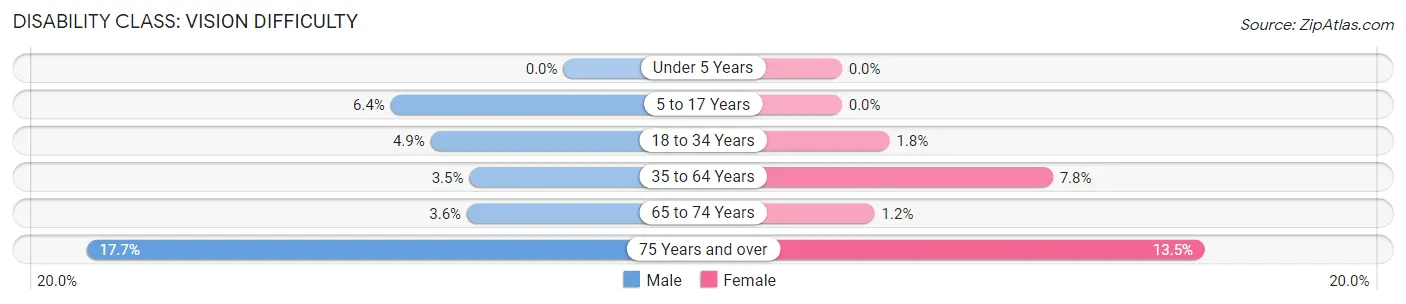
| Age Bracket | Male | Female |
| Under 5 Years | 0 (0.0%) | 0 (0.0%) |
| 5 to 17 Years | 92 (6.4%) | 0 (0.0%) |
| 18 to 34 Years | 123 (4.9%) | 40 (1.8%) |
| 35 to 64 Years | 93 (3.5%) | 299 (7.8%) |
| 65 to 74 Years | 29 (3.6%) | 9 (1.2%) |
| 75 Years and over | 43 (17.7%) | 88 (13.5%) |
Disability Class: Cognitive Difficulty
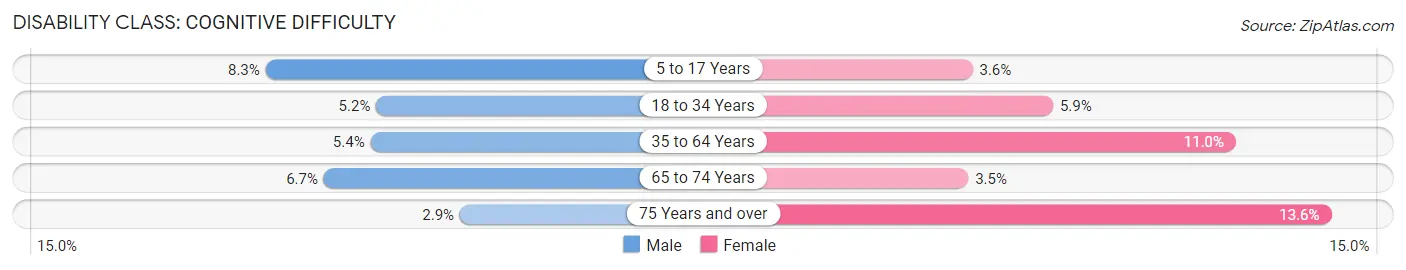
| Age Bracket | Male | Female |
| 5 to 17 Years | 119 (8.3%) | 55 (3.6%) |
| 18 to 34 Years | 130 (5.2%) | 133 (5.9%) |
| 35 to 64 Years | 143 (5.4%) | 419 (11.0%) |
| 65 to 74 Years | 54 (6.7%) | 26 (3.5%) |
| 75 Years and over | 7 (2.9%) | 89 (13.6%) |
Disability Class: Ambulatory Difficulty
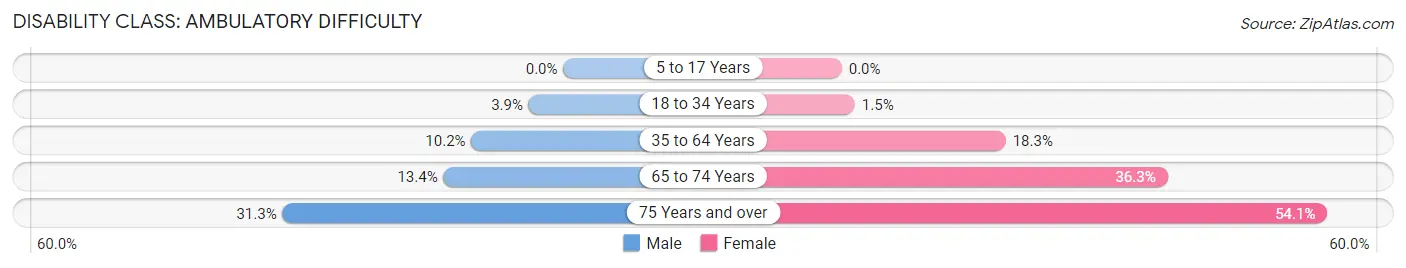
| Age Bracket | Male | Female |
| 5 to 17 Years | 0 (0.0%) | 0 (0.0%) |
| 18 to 34 Years | 96 (3.8%) | 33 (1.5%) |
| 35 to 64 Years | 273 (10.2%) | 697 (18.3%) |
| 65 to 74 Years | 108 (13.4%) | 268 (36.3%) |
| 75 Years and over | 76 (31.3%) | 353 (54.1%) |
Disability Class: Self-Care Difficulty
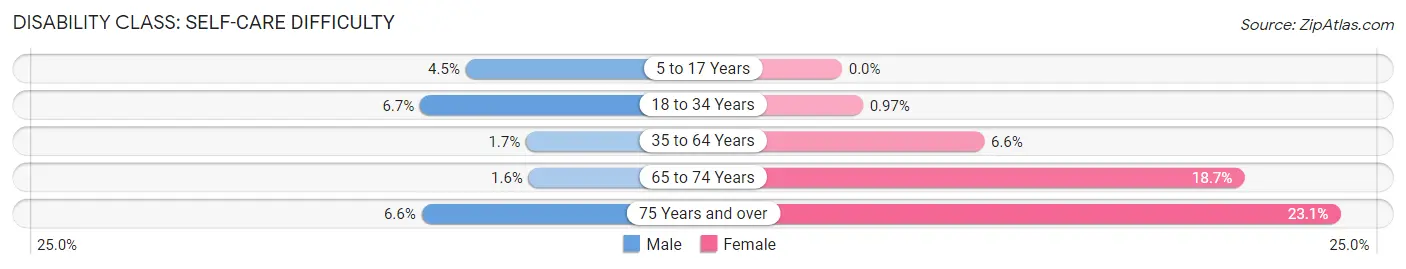
| Age Bracket | Male | Female |
| 5 to 17 Years | 65 (4.5%) | 0 (0.0%) |
| 18 to 34 Years | 166 (6.7%) | 22 (1.0%) |
| 35 to 64 Years | 46 (1.7%) | 252 (6.6%) |
| 65 to 74 Years | 13 (1.6%) | 138 (18.7%) |
| 75 Years and over | 16 (6.6%) | 151 (23.1%) |
Technology Access in Ferguson
Computing Device Access in Ferguson
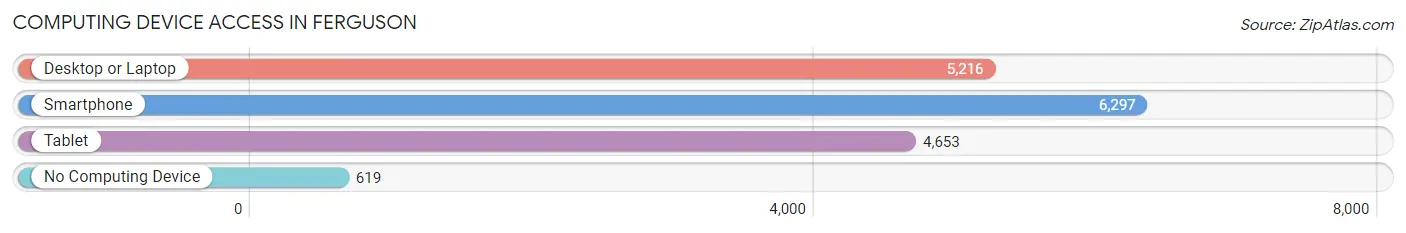
| Device Type | # Households | % Households |
| Desktop or Laptop | 5,216 | 65.9% |
| Smartphone | 6,297 | 79.6% |
| Tablet | 4,653 | 58.8% |
| No Computing Device | 619 | 7.8% |
| Total | 7,913 | 100.0% |
Internet Access in Ferguson
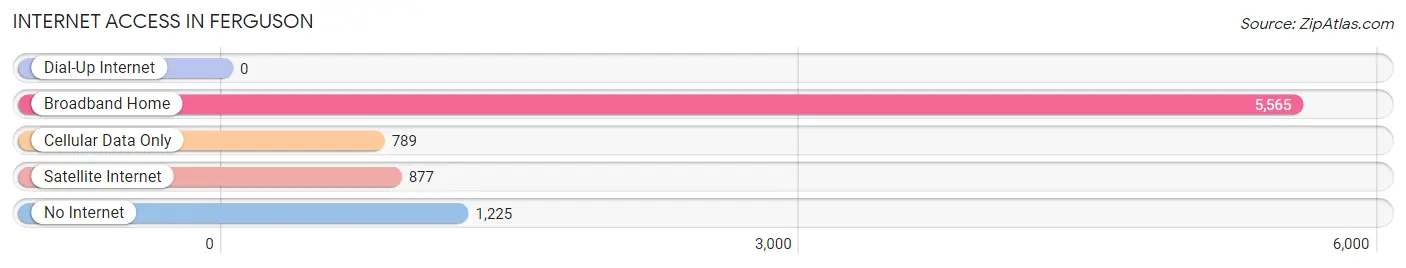
| Internet Type | # Households | % Households |
| Dial-Up Internet | 0 | 0.0% |
| Broadband Home | 5,565 | 70.3% |
| Cellular Data Only | 789 | 10.0% |
| Satellite Internet | 877 | 11.1% |
| No Internet | 1,225 | 15.5% |
| Total | 7,913 | 100.0% |
Ferguson Summary
Ferguson, Missouri is a city located in St. Louis County, Missouri, United States. It is part of the Greater St. Louis metropolitan area. The population was 21,203 at the 2010 census.
History
Ferguson was founded in 1855 by William B. Ferguson, a Scottish immigrant. The city was named after him. The city was incorporated in 1894.
Ferguson was a small farming community until the 1950s when it began to experience rapid growth due to the expansion of the St. Louis metropolitan area. The city experienced a population boom in the 1960s and 1970s, and by the 1980s it had become a predominantly African-American city.
Geography
Ferguson is located at 38°44'25" North, 90°19'45" West (38.740278, -90.329167). The city is situated on the Missouri River, and is bordered by the cities of Florissant, Hazelwood, Jennings, and St. Louis.
Ferguson has a total area of 6.2 square miles, of which 6.1 square miles is land and 0.1 square miles is water.
Economy
Ferguson's economy is largely based on retail and services. The city is home to several large retail stores, including Walmart, Target, and Home Depot. The city also has a number of restaurants, bars, and other businesses.
Ferguson is also home to several large employers, including Emerson Electric, Express Scripts, and Boeing.
Demographics
As of the 2010 census, the population of Ferguson was 21,203. The racial makeup of the city was 67.4% African American, 28.7% White, 0.3% Native American, 0.9% Asian, 0.1% Pacific Islander, 0.7% from other races, and 2.1% from two or more races. Hispanic or Latino of any race were 2.5% of the population.
The median income for a household in Ferguson was $37,813, and the median income for a family was $45,919. The per capita income for the city was $19,945. About 17.3% of families and 20.7% of the population were below the poverty line, including 33.3% of those under age 18 and 11.7% of those age 65 or over.
Common Questions
What is Per Capita Income in Ferguson?
Per Capita income in Ferguson is $26,963.
What is the Median Family Income in Ferguson?
Median Family Income in Ferguson is $58,144.
What is the Median Household income in Ferguson?
Median Household Income in Ferguson is $47,410.
What is Income or Wage Gap in Ferguson?
Income or Wage Gap in Ferguson is 0.9%.
Women in Ferguson earn 99.1 cents for every dollar earned by a man.
What is Family Income Deficit in Ferguson?
Family Income Deficit in Ferguson is $10,500.
Families that are below poverty line in Ferguson earn $10,500 less on average than the poverty threshold level.
What is Inequality or Gini Index in Ferguson?
Inequality or Gini Index in Ferguson is 0.42.
What is the Total Population of Ferguson?
Total Population of Ferguson is 18,546.
What is the Total Male Population of Ferguson?
Total Male Population of Ferguson is 8,584.
What is the Total Female Population of Ferguson?
Total Female Population of Ferguson is 9,962.
What is the Ratio of Males per 100 Females in Ferguson?
There are 86.17 Males per 100 Females in Ferguson.
What is the Ratio of Females per 100 Males in Ferguson?
There are 116.05 Females per 100 Males in Ferguson.
What is the Median Population Age in Ferguson?
Median Population Age in Ferguson is 34.7 Years.
What is the Average Family Size in Ferguson
Average Family Size in Ferguson is 3.2 People.
What is the Average Household Size in Ferguson
Average Household Size in Ferguson is 2.3 People.
How Large is the Labor Force in Ferguson?
There are 9,079 People in the Labor Forcein in Ferguson.
What is the Percentage of People in the Labor Force in Ferguson?
62.1% of People are in the Labor Force in Ferguson.
What is the Unemployment Rate in Ferguson?
Unemployment Rate in Ferguson is 5.3%.