Jefferson City, MO Map & Demographics
Jefferson City Map
Jefferson City Overview
$33,561
PER CAPITA INCOME
$89,047
AVG FAMILY INCOME
$63,649
AVG HOUSEHOLD INCOME
28.5%
WAGE / INCOME GAP [ % ]
71.5¢/ $1
WAGE / INCOME GAP [ $ ]
$10,357
FAMILY INCOME DEFICIT
0.43
INEQUALITY / GINI INDEX
42,644
TOTAL POPULATION
21,922
MALE POPULATION
20,722
FEMALE POPULATION
105.79
MALES / 100 FEMALES
94.53
FEMALES / 100 MALES
38.5
MEDIAN AGE
3.0
AVG FAMILY SIZE
2.3
AVG HOUSEHOLD SIZE
21,344
LABOR FORCE [ PEOPLE ]
61.0%
PERCENT IN LABOR FORCE
2.9%
UNEMPLOYMENT RATE
Jefferson City Area Codes
Income in Jefferson City
Income Overview in Jefferson City
Per Capita Income in Jefferson City is $33,561, while median incomes of families and households are $89,047 and $63,649 respectively.
| Characteristic | Number | Measure |
| Per Capita Income | 42,644 | $33,561 |
| Median Family Income | 9,451 | $89,047 |
| Mean Family Income | 9,451 | $103,265 |
| Median Household Income | 16,852 | $63,649 |
| Mean Household Income | 16,852 | $81,091 |
| Income Deficit | 9,451 | $10,357 |
| Wage / Income Gap (%) | 42,644 | 28.45% |
| Wage / Income Gap ($) | 42,644 | 71.55¢ per $1 |
| Gini / Inequality Index | 42,644 | 0.43 |
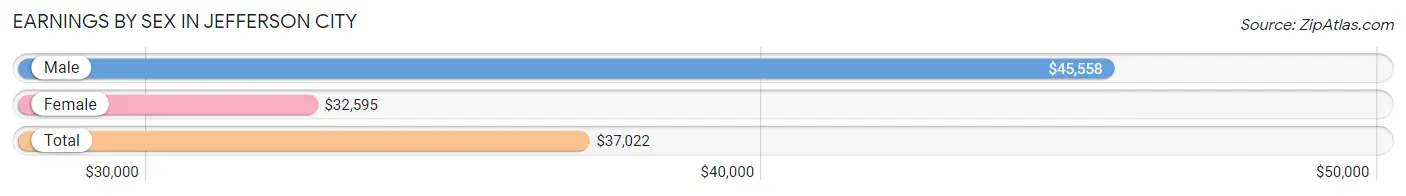
Earnings by Sex in Jefferson City
Average Earnings in Jefferson City are $37,022, $45,558 for men and $32,595 for women, a difference of 28.4%.
| Sex | Number | Average Earnings |
| Male | 12,145 (52.4%) | $45,558 |
| Female | 11,020 (47.6%) | $32,595 |
| Total | 23,165 (100.0%) | $37,022 |
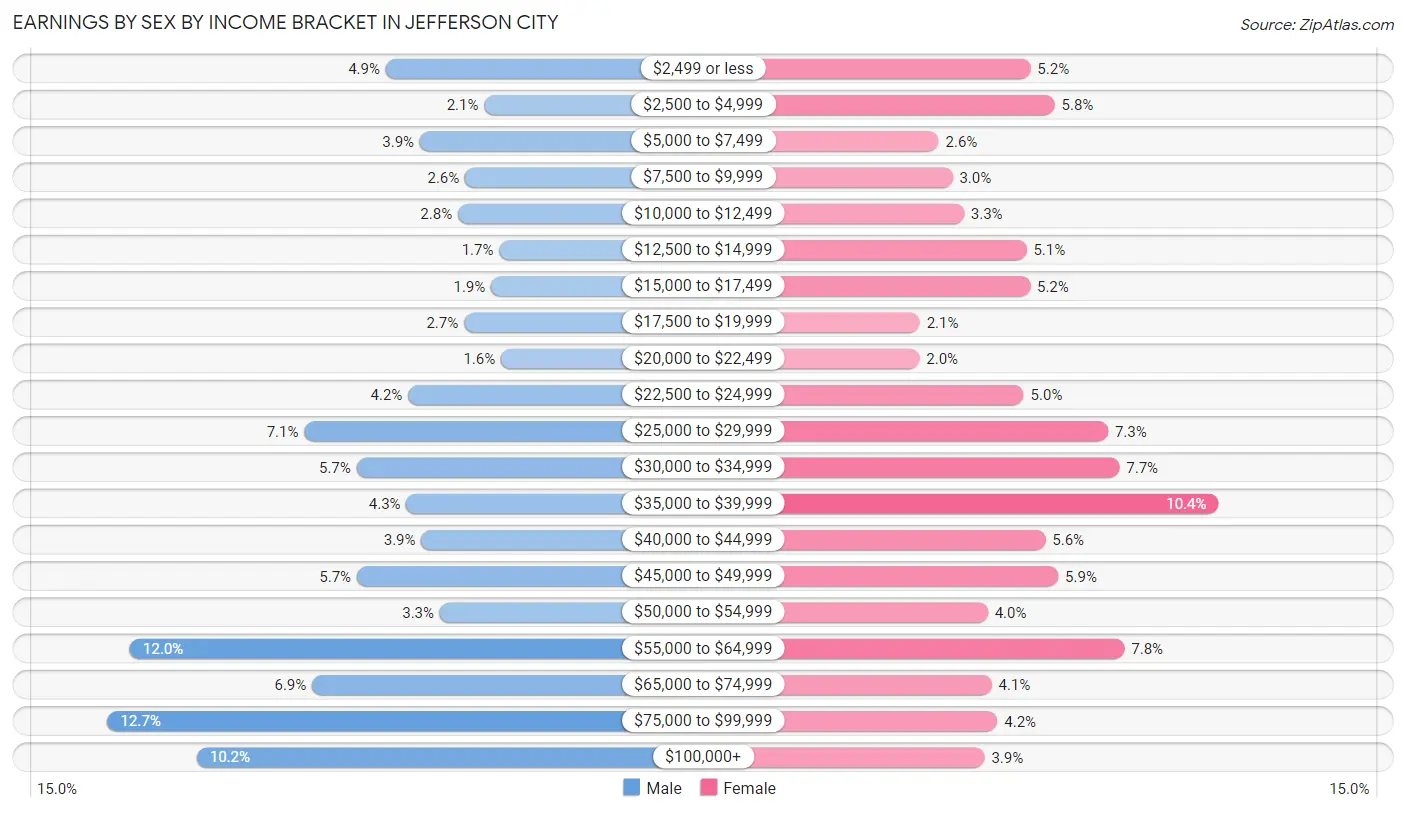
Earnings by Sex by Income Bracket in Jefferson City
The most common earnings brackets in Jefferson City are $75,000 to $99,999 for men (1,539 | 12.7%) and $35,000 to $39,999 for women (1,150 | 10.4%).
| Income | Male | Female |
| $2,499 or less | 589 (4.9%) | 569 (5.2%) |
| $2,500 to $4,999 | 253 (2.1%) | 644 (5.8%) |
| $5,000 to $7,499 | 472 (3.9%) | 284 (2.6%) |
| $7,500 to $9,999 | 318 (2.6%) | 327 (3.0%) |
| $10,000 to $12,499 | 342 (2.8%) | 363 (3.3%) |
| $12,500 to $14,999 | 201 (1.7%) | 557 (5.1%) |
| $15,000 to $17,499 | 230 (1.9%) | 568 (5.1%) |
| $17,500 to $19,999 | 322 (2.6%) | 226 (2.1%) |
| $20,000 to $22,499 | 196 (1.6%) | 225 (2.0%) |
| $22,500 to $24,999 | 512 (4.2%) | 548 (5.0%) |
| $25,000 to $29,999 | 867 (7.1%) | 809 (7.3%) |
| $30,000 to $34,999 | 689 (5.7%) | 844 (7.7%) |
| $35,000 to $39,999 | 518 (4.3%) | 1,150 (10.4%) |
| $40,000 to $44,999 | 468 (3.8%) | 615 (5.6%) |
| $45,000 to $49,999 | 687 (5.7%) | 655 (5.9%) |
| $50,000 to $54,999 | 405 (3.3%) | 436 (4.0%) |
| $55,000 to $64,999 | 1,462 (12.0%) | 860 (7.8%) |
| $65,000 to $74,999 | 841 (6.9%) | 448 (4.1%) |
| $75,000 to $99,999 | 1,539 (12.7%) | 466 (4.2%) |
| $100,000+ | 1,234 (10.2%) | 426 (3.9%) |
| Total | 12,145 (100.0%) | 11,020 (100.0%) |
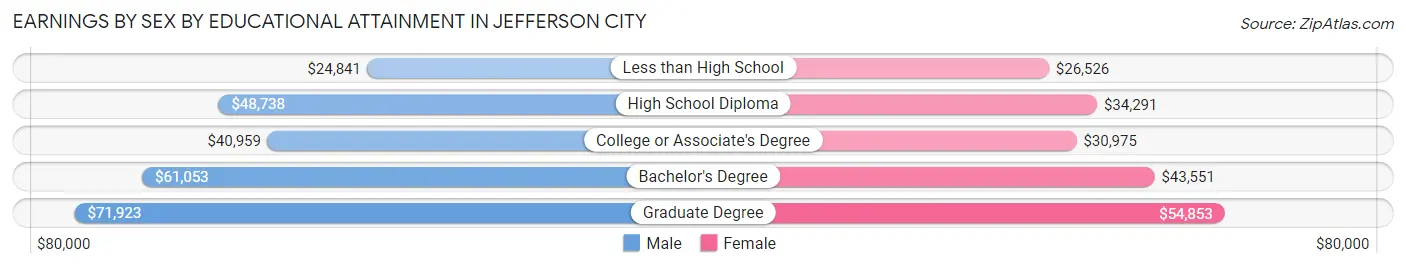
Earnings by Sex by Educational Attainment in Jefferson City
Average earnings in Jefferson City are $51,121 for men and $37,019 for women, a difference of 27.6%. Men with an educational attainment of graduate degree enjoy the highest average annual earnings of $71,923, while those with less than high school education earn the least with $24,841. Women with an educational attainment of graduate degree earn the most with the average annual earnings of $54,853, while those with less than high school education have the smallest earnings of $26,526.
| Educational Attainment | Male Income | Female Income |
| Less than High School | $24,841 | $26,526 |
| High School Diploma | $48,738 | $34,291 |
| College or Associate's Degree | $40,959 | $30,975 |
| Bachelor's Degree | $61,053 | $43,551 |
| Graduate Degree | $71,923 | $54,853 |
| Total | $51,121 | $37,019 |
Family Income in Jefferson City
Family Income Brackets in Jefferson City
According to the Jefferson City family income data, there are 1,994 families falling into the $100,000 to $149,999 income range, which is the most common income bracket and makes up 21.1% of all families. Conversely, the less than $10,000 income bracket is the least frequent group with only 293 families (3.1%) belonging to this category.
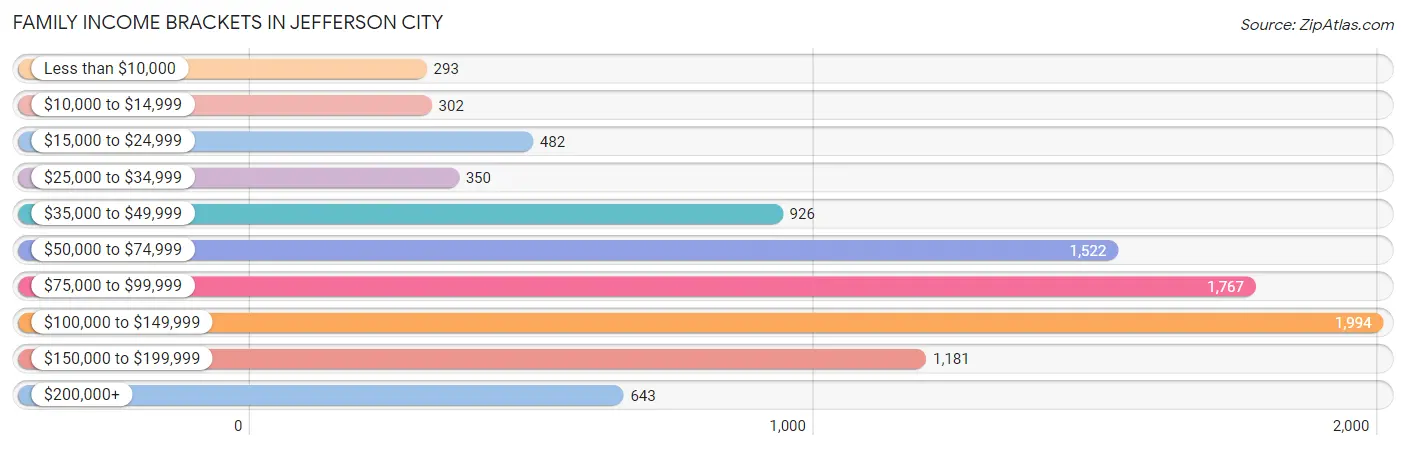
| Income Bracket | # Families | % Families |
| Less than $10,000 | 293 | 3.1% |
| $10,000 to $14,999 | 302 | 3.2% |
| $15,000 to $24,999 | 482 | 5.1% |
| $25,000 to $34,999 | 350 | 3.7% |
| $35,000 to $49,999 | 926 | 9.8% |
| $50,000 to $74,999 | 1,522 | 16.1% |
| $75,000 to $99,999 | 1,767 | 18.7% |
| $100,000 to $149,999 | 1,994 | 21.1% |
| $150,000 to $199,999 | 1,181 | 12.5% |
| $200,000+ | 643 | 6.8% |
Family Income by Famaliy Size in Jefferson City
4-person families (1,304 | 13.8%) account for the highest median family income in Jefferson City with $113,542 per family, while 2-person families (5,074 | 53.7%) have the highest median income of $43,750 per family member.
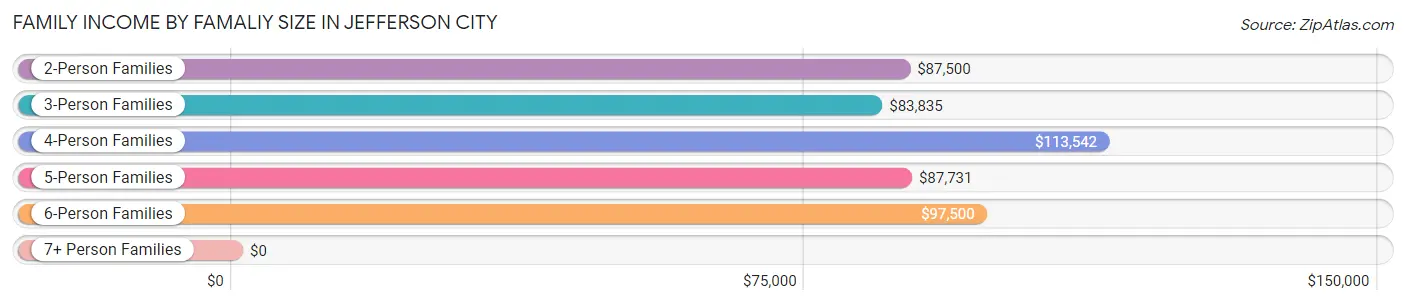
| Income Bracket | # Families | Median Income |
| 2-Person Families | 5,074 (53.7%) | $87,500 |
| 3-Person Families | 2,183 (23.1%) | $83,835 |
| 4-Person Families | 1,304 (13.8%) | $113,542 |
| 5-Person Families | 721 (7.6%) | $87,731 |
| 6-Person Families | 158 (1.7%) | $97,500 |
| 7+ Person Families | 11 (0.1%) | $0 |
| Total | 9,451 (100.0%) | $89,047 |
Family Income by Number of Earners in Jefferson City
The median family income in Jefferson City is $89,047, with families comprising 3+ earners (1,028) having the highest median family income of $145,195, while families with 1 earner (2,665) have the lowest median family income of $46,065, accounting for 10.9% and 28.2% of families, respectively.
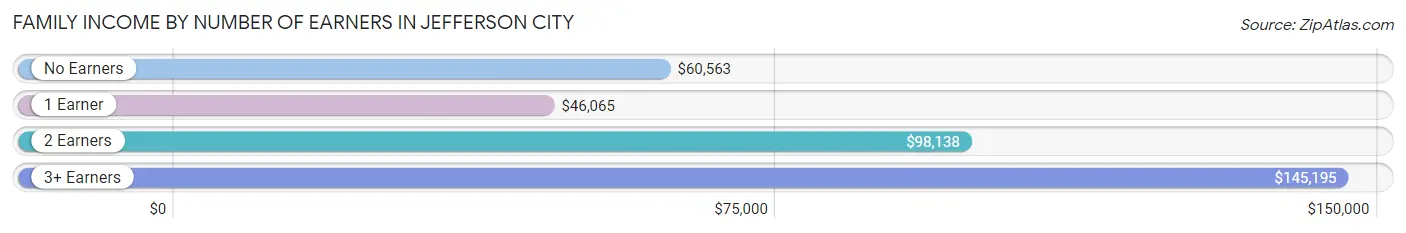
| Number of Earners | # Families | Median Income |
| No Earners | 1,344 (14.2%) | $60,563 |
| 1 Earner | 2,665 (28.2%) | $46,065 |
| 2 Earners | 4,414 (46.7%) | $98,138 |
| 3+ Earners | 1,028 (10.9%) | $145,195 |
| Total | 9,451 (100.0%) | $89,047 |
Household Income in Jefferson City
Household Income Brackets in Jefferson City
With 3,236 households falling in the category, the $50,000 to $74,999 income range is the most frequent in Jefferson City, accounting for 19.2% of all households. In contrast, only 640 households (3.8%) fall into the $10,000 to $14,999 income bracket, making it the least populous group.
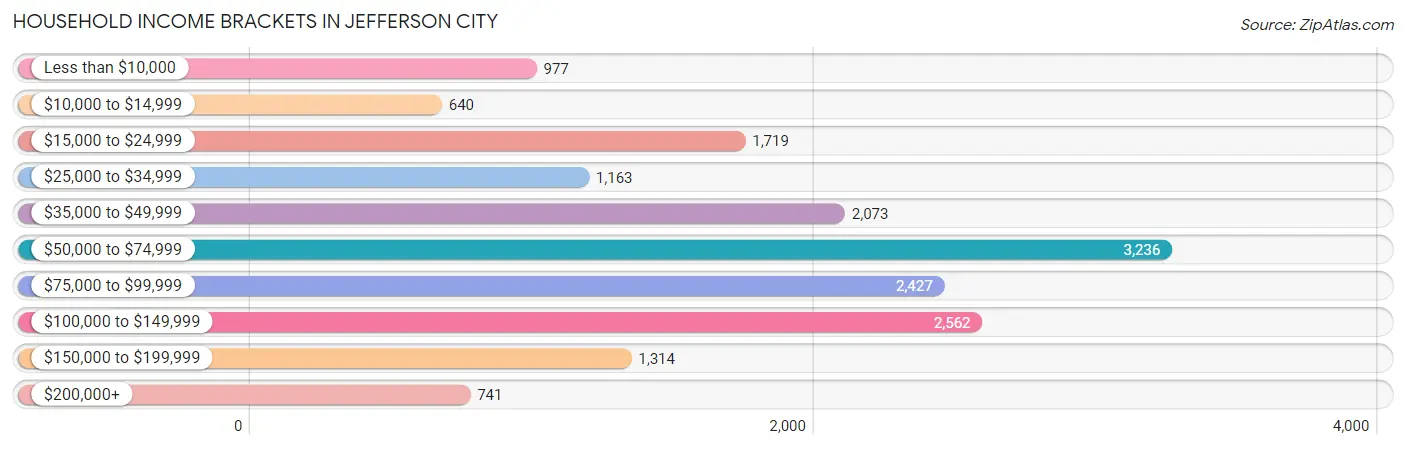
| Income Bracket | # Households | % Households |
| Less than $10,000 | 977 | 5.8% |
| $10,000 to $14,999 | 640 | 3.8% |
| $15,000 to $24,999 | 1,719 | 10.2% |
| $25,000 to $34,999 | 1,163 | 6.9% |
| $35,000 to $49,999 | 2,073 | 12.3% |
| $50,000 to $74,999 | 3,236 | 19.2% |
| $75,000 to $99,999 | 2,427 | 14.4% |
| $100,000 to $149,999 | 2,562 | 15.2% |
| $150,000 to $199,999 | 1,314 | 7.8% |
| $200,000+ | 741 | 4.4% |
Household Income by Householder Age in Jefferson City
The median household income in Jefferson City is $63,649, with the highest median household income of $78,218 found in the 45 to 64 years age bracket for the primary householder. A total of 5,900 households (35.0%) fall into this category. Meanwhile, the 15 to 24 years age bracket for the primary householder has the lowest median household income of $0, with 678 households (4.0%) in this group.
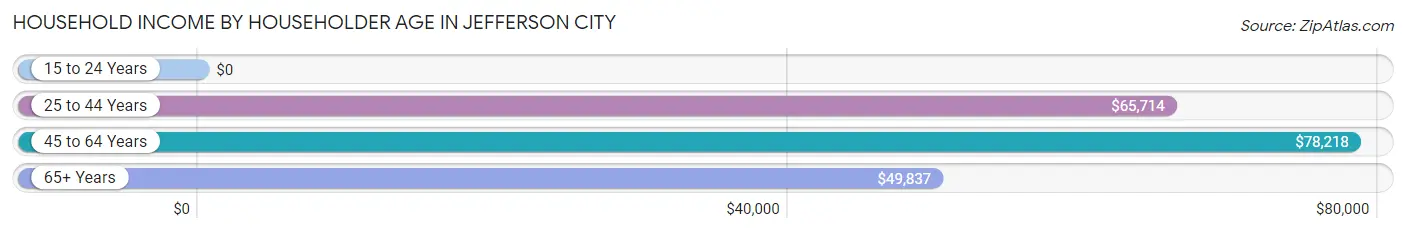
| Income Bracket | # Households | Median Income |
| 15 to 24 Years | 678 (4.0%) | $0 |
| 25 to 44 Years | 5,818 (34.5%) | $65,714 |
| 45 to 64 Years | 5,900 (35.0%) | $78,218 |
| 65+ Years | 4,456 (26.4%) | $49,837 |
| Total | 16,852 (100.0%) | $63,649 |
Poverty in Jefferson City
Income Below Poverty by Sex and Age in Jefferson City
With 9.5% poverty level for males and 14.9% for females among the residents of Jefferson City, 16 and 17 year old males and 12 to 14 year old females are the most vulnerable to poverty, with 135 males (31.6%) and 229 females (31.5%) in their respective age groups living below the poverty level.
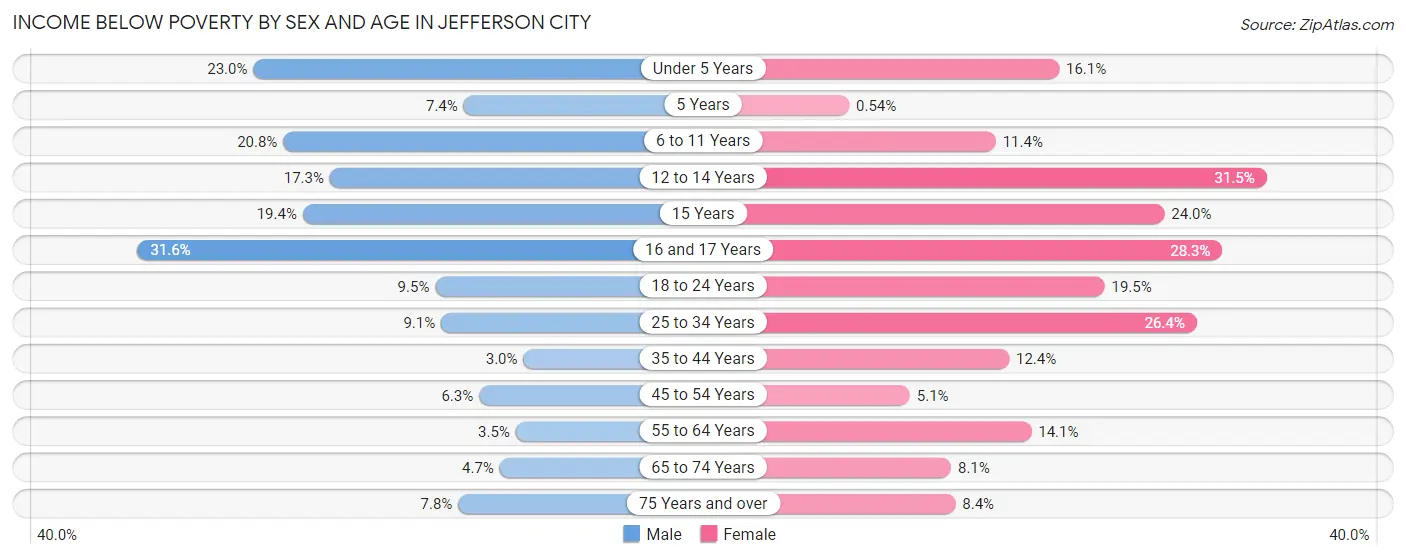
| Age Bracket | Male | Female |
| Under 5 Years | 299 (23.0%) | 214 (16.1%) |
| 5 Years | 22 (7.4%) | 1 (0.5%) |
| 6 to 11 Years | 277 (20.8%) | 161 (11.4%) |
| 12 to 14 Years | 86 (17.3%) | 229 (31.5%) |
| 15 Years | 48 (19.4%) | 40 (23.9%) |
| 16 and 17 Years | 135 (31.6%) | 152 (28.2%) |
| 18 to 24 Years | 164 (9.5%) | 289 (19.5%) |
| 25 to 34 Years | 235 (9.1%) | 773 (26.4%) |
| 35 to 44 Years | 75 (3.0%) | 321 (12.4%) |
| 45 to 54 Years | 145 (6.3%) | 108 (5.1%) |
| 55 to 64 Years | 82 (3.5%) | 383 (14.1%) |
| 65 to 74 Years | 76 (4.7%) | 162 (8.1%) |
| 75 Years and over | 79 (7.8%) | 146 (8.4%) |
| Total | 1,723 (9.5%) | 2,979 (14.9%) |
Income Above Poverty by Sex and Age in Jefferson City
According to the poverty statistics in Jefferson City, males aged 35 to 44 years and females aged 5 years are the age groups that are most secure financially, with 97.0% of males and 99.5% of females in these age groups living above the poverty line.
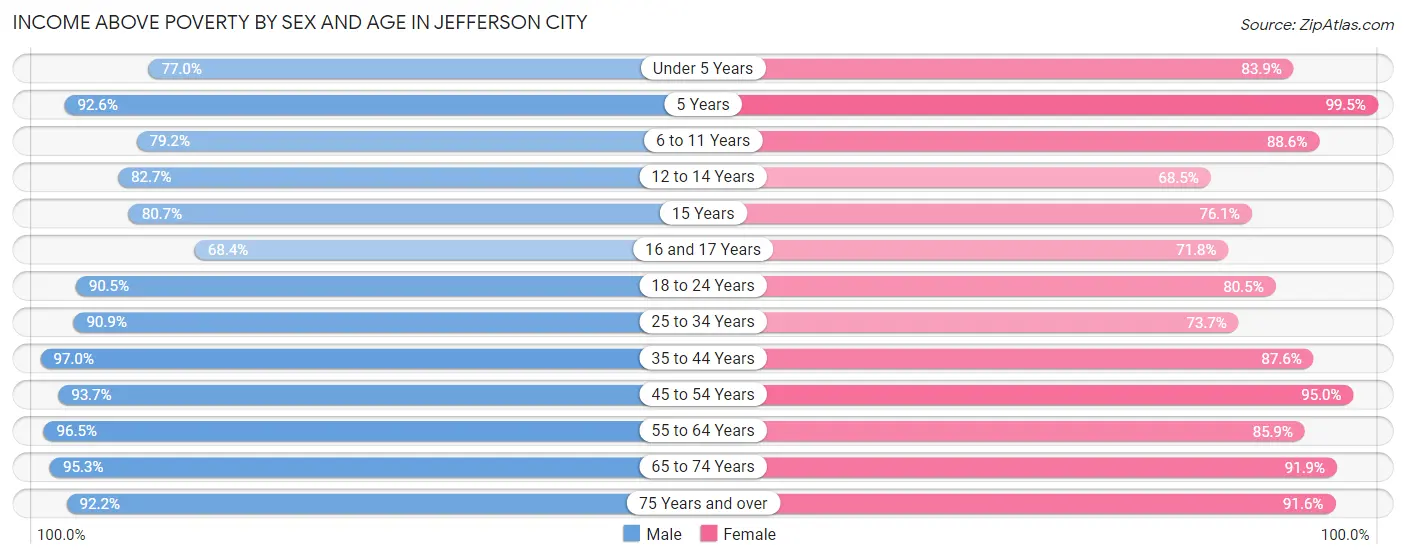
| Age Bracket | Male | Female |
| Under 5 Years | 1,000 (77.0%) | 1,113 (83.9%) |
| 5 Years | 275 (92.6%) | 184 (99.5%) |
| 6 to 11 Years | 1,055 (79.2%) | 1,247 (88.6%) |
| 12 to 14 Years | 410 (82.7%) | 497 (68.5%) |
| 15 Years | 200 (80.6%) | 127 (76.0%) |
| 16 and 17 Years | 292 (68.4%) | 386 (71.8%) |
| 18 to 24 Years | 1,560 (90.5%) | 1,192 (80.5%) |
| 25 to 34 Years | 2,354 (90.9%) | 2,161 (73.7%) |
| 35 to 44 Years | 2,452 (97.0%) | 2,263 (87.6%) |
| 45 to 54 Years | 2,172 (93.7%) | 2,032 (95.0%) |
| 55 to 64 Years | 2,233 (96.5%) | 2,339 (85.9%) |
| 65 to 74 Years | 1,531 (95.3%) | 1,835 (91.9%) |
| 75 Years and over | 933 (92.2%) | 1,586 (91.6%) |
| Total | 16,467 (90.5%) | 16,962 (85.1%) |
Income Below Poverty Among Married-Couple Families in Jefferson City
The poverty statistics for married-couple families in Jefferson City show that 2.4% or 170 of the total 7,033 families live below the poverty line. Families with 1 or 2 children have the highest poverty rate of 5.3%, comprising of 106 families. On the other hand, families with 3 or 4 children have the lowest poverty rate of 0.0%, which includes 0 families.
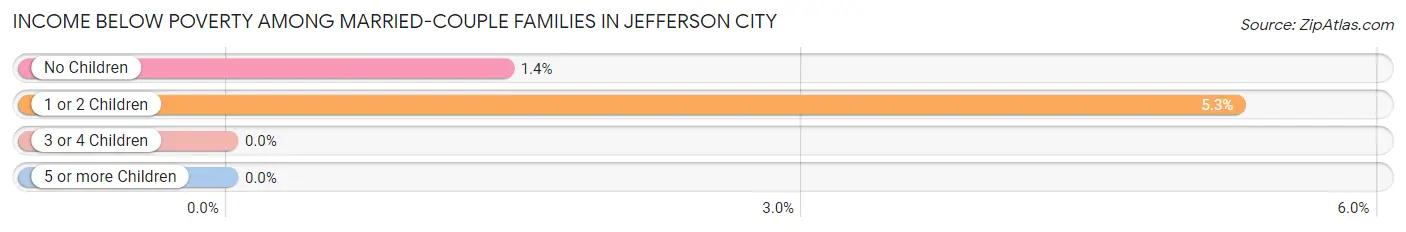
| Children | Above Poverty | Below Poverty |
| No Children | 4,380 (98.6%) | 64 (1.4%) |
| 1 or 2 Children | 1,908 (94.7%) | 106 (5.3%) |
| 3 or 4 Children | 573 (100.0%) | 0 (0.0%) |
| 5 or more Children | 2 (100.0%) | 0 (0.0%) |
| Total | 6,863 (97.6%) | 170 (2.4%) |
Income Below Poverty Among Single-Parent Households in Jefferson City
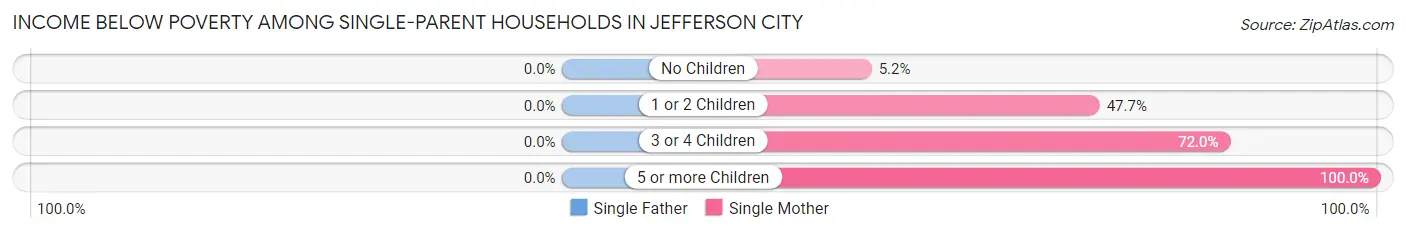
| Children | Single Father | Single Mother |
| No Children | 0 (0.0%) | 25 (5.2%) |
| 1 or 2 Children | 0 (0.0%) | 620 (47.7%) |
| 3 or 4 Children | 0 (0.0%) | 126 (72.0%) |
| 5 or more Children | 0 (0.0%) | 9 (100.0%) |
| Total | 0 (0.0%) | 780 (39.8%) |
Income Below Poverty Among Married-Couple vs Single-Parent Households in Jefferson City
The poverty data for Jefferson City shows that 170 of the married-couple family households (2.4%) and 780 of the single-parent households (32.3%) are living below the poverty level. Within the married-couple family households, those with 1 or 2 children have the highest poverty rate, with 106 households (5.3%) falling below the poverty line. Among the single-parent households, those with 5 or more children have the highest poverty rate, with 9 household (100.0%) living below poverty.
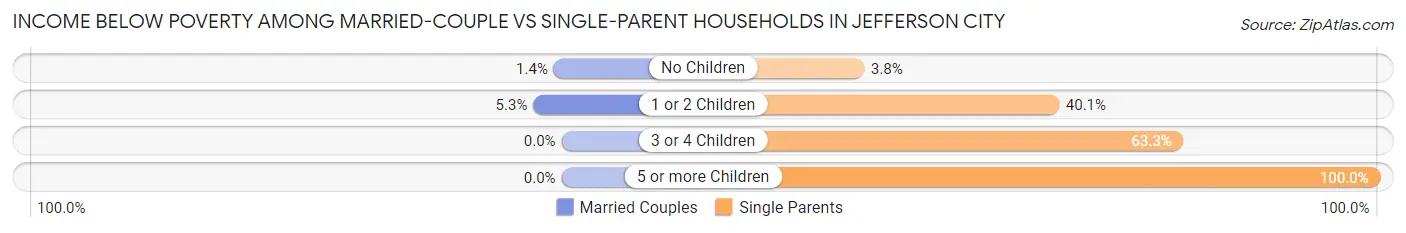
| Children | Married-Couple Families | Single-Parent Households |
| No Children | 64 (1.4%) | 25 (3.8%) |
| 1 or 2 Children | 106 (5.3%) | 620 (40.1%) |
| 3 or 4 Children | 0 (0.0%) | 126 (63.3%) |
| 5 or more Children | 0 (0.0%) | 9 (100.0%) |
| Total | 170 (2.4%) | 780 (32.3%) |
Race in Jefferson City
The most populous races in Jefferson City are White / Caucasian (31,587 | 74.1%), Black / African American (7,788 | 18.3%), and Two or more Races (1,588 | 3.7%).
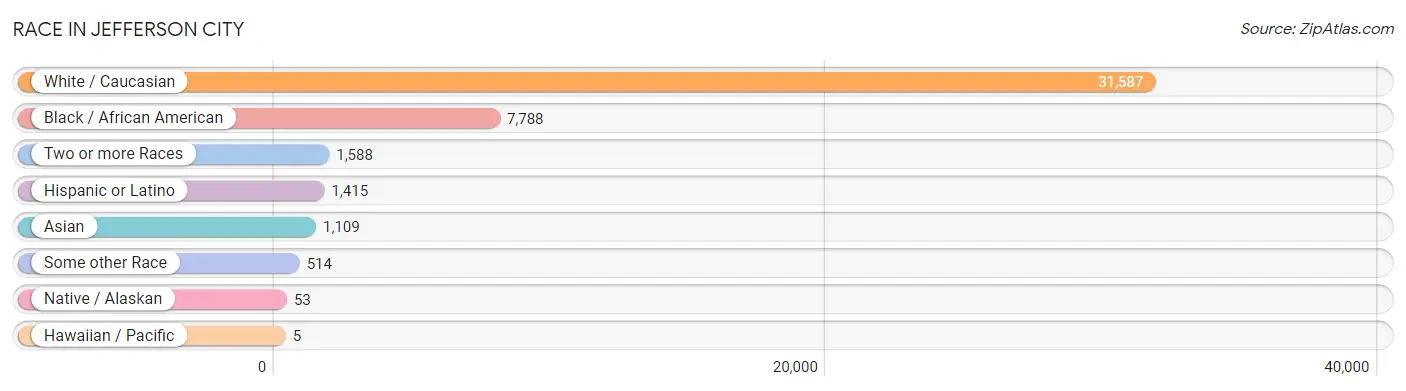
| Race | # Population | % Population |
| Asian | 1,109 | 2.6% |
| Black / African American | 7,788 | 18.3% |
| Hawaiian / Pacific | 5 | 0.0% |
| Hispanic or Latino | 1,415 | 3.3% |
| Native / Alaskan | 53 | 0.1% |
| White / Caucasian | 31,587 | 74.1% |
| Two or more Races | 1,588 | 3.7% |
| Some other Race | 514 | 1.2% |
| Total | 42,644 | 100.0% |
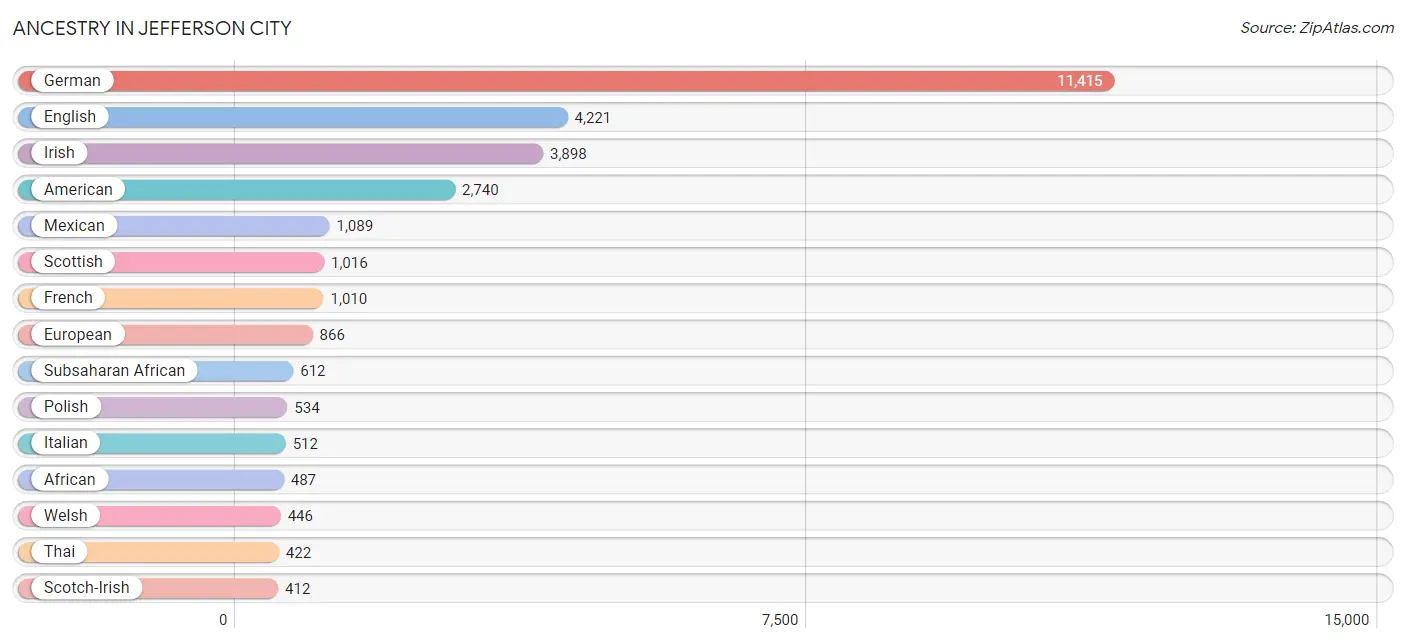
Ancestry in Jefferson City
The most populous ancestries reported in Jefferson City are German (11,415 | 26.8%), English (4,221 | 9.9%), Irish (3,898 | 9.1%), American (2,740 | 6.4%), and Mexican (1,089 | 2.5%), together accounting for 54.8% of all Jefferson City residents.
| Ancestry | # Population | % Population |
| African | 487 | 1.1% |
| American | 2,740 | 6.4% |
| Apache | 23 | 0.1% |
| Arab | 128 | 0.3% |
| Austrian | 50 | 0.1% |
| Bhutanese | 27 | 0.1% |
| Blackfeet | 26 | 0.1% |
| Brazilian | 3 | 0.0% |
| British | 211 | 0.5% |
| British West Indian | 23 | 0.1% |
| Burmese | 8 | 0.0% |
| Canadian | 36 | 0.1% |
| Celtic | 15 | 0.0% |
| Central American | 107 | 0.3% |
| Cherokee | 100 | 0.2% |
| Chilean | 21 | 0.1% |
| Choctaw | 4 | 0.0% |
| Croatian | 61 | 0.1% |
| Czech | 87 | 0.2% |
| Danish | 52 | 0.1% |
| Dutch | 386 | 0.9% |
| Eastern European | 153 | 0.4% |
| English | 4,221 | 9.9% |
| European | 866 | 2.0% |
| Filipino | 206 | 0.5% |
| French | 1,010 | 2.4% |
| French American Indian | 11 | 0.0% |
| French Canadian | 17 | 0.0% |
| German | 11,415 | 26.8% |
| Guatemalan | 2 | 0.0% |
| Haitian | 41 | 0.1% |
| Honduran | 9 | 0.0% |
| Hungarian | 104 | 0.2% |
| Indian (Asian) | 58 | 0.1% |
| Iranian | 60 | 0.1% |
| Irish | 3,898 | 9.1% |
| Israeli | 72 | 0.2% |
| Italian | 512 | 1.2% |
| Jamaican | 223 | 0.5% |
| Korean | 218 | 0.5% |
| Lebanese | 61 | 0.1% |
| Lithuanian | 24 | 0.1% |
| Mexican | 1,089 | 2.5% |
| Moroccan | 11 | 0.0% |
| Native Hawaiian | 5 | 0.0% |
| Nicaraguan | 67 | 0.2% |
| Nigerian | 58 | 0.1% |
| Northern European | 40 | 0.1% |
| Norwegian | 369 | 0.9% |
| Pakistani | 35 | 0.1% |
| Palestinian | 28 | 0.1% |
| Polish | 534 | 1.3% |
| Portuguese | 28 | 0.1% |
| Potawatomi | 44 | 0.1% |
| Puerto Rican | 153 | 0.4% |
| Romanian | 44 | 0.1% |
| Russian | 98 | 0.2% |
| Salvadoran | 29 | 0.1% |
| Samoan | 29 | 0.1% |
| Scandinavian | 99 | 0.2% |
| Scotch-Irish | 412 | 1.0% |
| Scottish | 1,016 | 2.4% |
| Seminole | 4 | 0.0% |
| Serbian | 9 | 0.0% |
| Sioux | 4 | 0.0% |
| Slovak | 33 | 0.1% |
| South American | 21 | 0.1% |
| South American Indian | 3 | 0.0% |
| Spaniard | 30 | 0.1% |
| Sri Lankan | 144 | 0.3% |
| Subsaharan African | 612 | 1.4% |
| Sudanese | 55 | 0.1% |
| Swedish | 360 | 0.8% |
| Swiss | 152 | 0.4% |
| Syrian | 1 | 0.0% |
| Thai | 422 | 1.0% |
| Ukrainian | 40 | 0.1% |
| Welsh | 446 | 1.1% |
| West Indian | 22 | 0.1% | View All 79 Rows |
Immigrants in Jefferson City
The most numerous immigrant groups reported in Jefferson City came from Asia (774 | 1.8%), Latin America (541 | 1.3%), South Central Asia (403 | 0.9%), Central America (337 | 0.8%), and India (335 | 0.8%), together accounting for 5.6% of all Jefferson City residents.
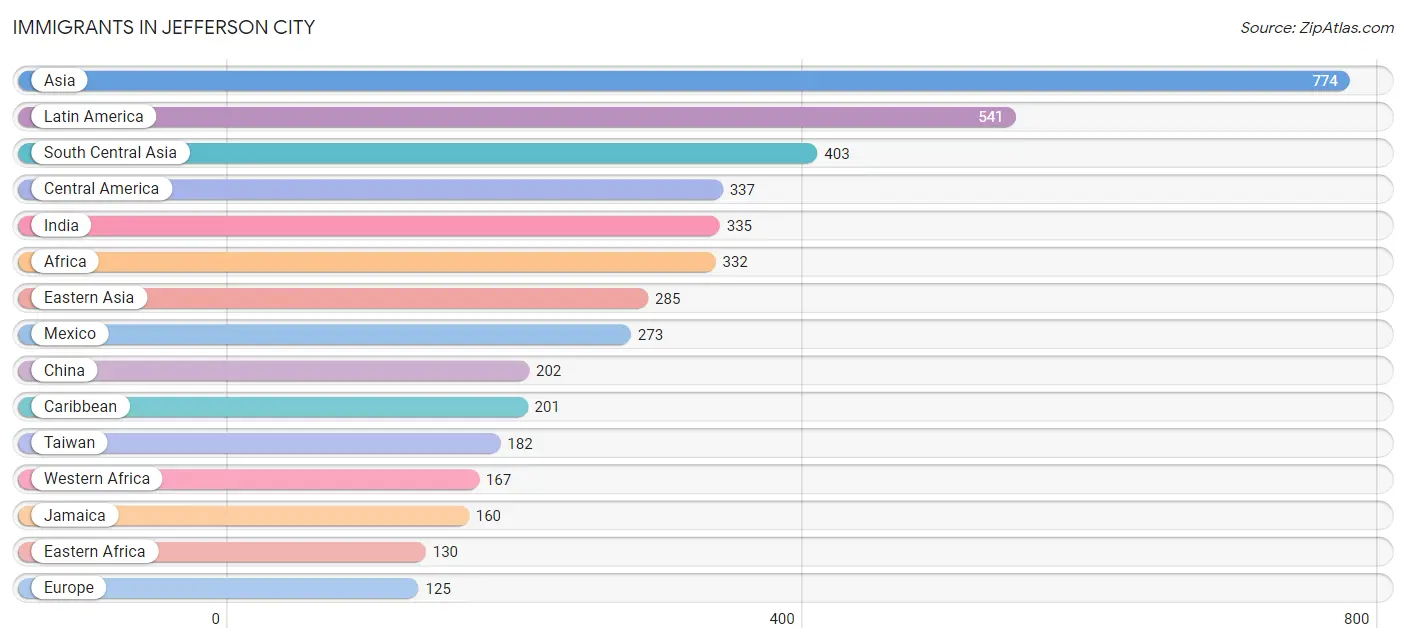
| Immigration Origin | # Population | % Population |
| Africa | 332 | 0.8% |
| Asia | 774 | 1.8% |
| Bahamas | 18 | 0.0% |
| Brazil | 3 | 0.0% |
| Canada | 15 | 0.0% |
| Caribbean | 201 | 0.5% |
| Central America | 337 | 0.8% |
| China | 202 | 0.5% |
| Eastern Africa | 130 | 0.3% |
| Eastern Asia | 285 | 0.7% |
| Eastern Europe | 35 | 0.1% |
| El Salvador | 15 | 0.0% |
| England | 5 | 0.0% |
| Ethiopia | 9 | 0.0% |
| Europe | 125 | 0.3% |
| Germany | 85 | 0.2% |
| Ghana | 116 | 0.3% |
| Hungary | 3 | 0.0% |
| India | 335 | 0.8% |
| Iran | 27 | 0.1% |
| Jamaica | 160 | 0.4% |
| Japan | 45 | 0.1% |
| Kenya | 121 | 0.3% |
| Korea | 38 | 0.1% |
| Latin America | 541 | 1.3% |
| Malaysia | 30 | 0.1% |
| Mexico | 273 | 0.6% |
| Middle Africa | 35 | 0.1% |
| Nepal | 41 | 0.1% |
| Nicaragua | 49 | 0.1% |
| Nigeria | 30 | 0.1% |
| Northern Europe | 5 | 0.0% |
| Russia | 28 | 0.1% |
| Sierra Leone | 21 | 0.1% |
| South America | 3 | 0.0% |
| South Central Asia | 403 | 0.9% |
| South Eastern Asia | 86 | 0.2% |
| Taiwan | 182 | 0.4% |
| Ukraine | 4 | 0.0% |
| Vietnam | 56 | 0.1% |
| Western Africa | 167 | 0.4% |
| Western Europe | 85 | 0.2% | View All 42 Rows |
Sex and Age in Jefferson City
Sex and Age in Jefferson City
The most populous age groups in Jefferson City are 40 to 44 Years (1,886 | 8.6%) for men and 25 to 29 Years (1,582 | 7.6%) for women.
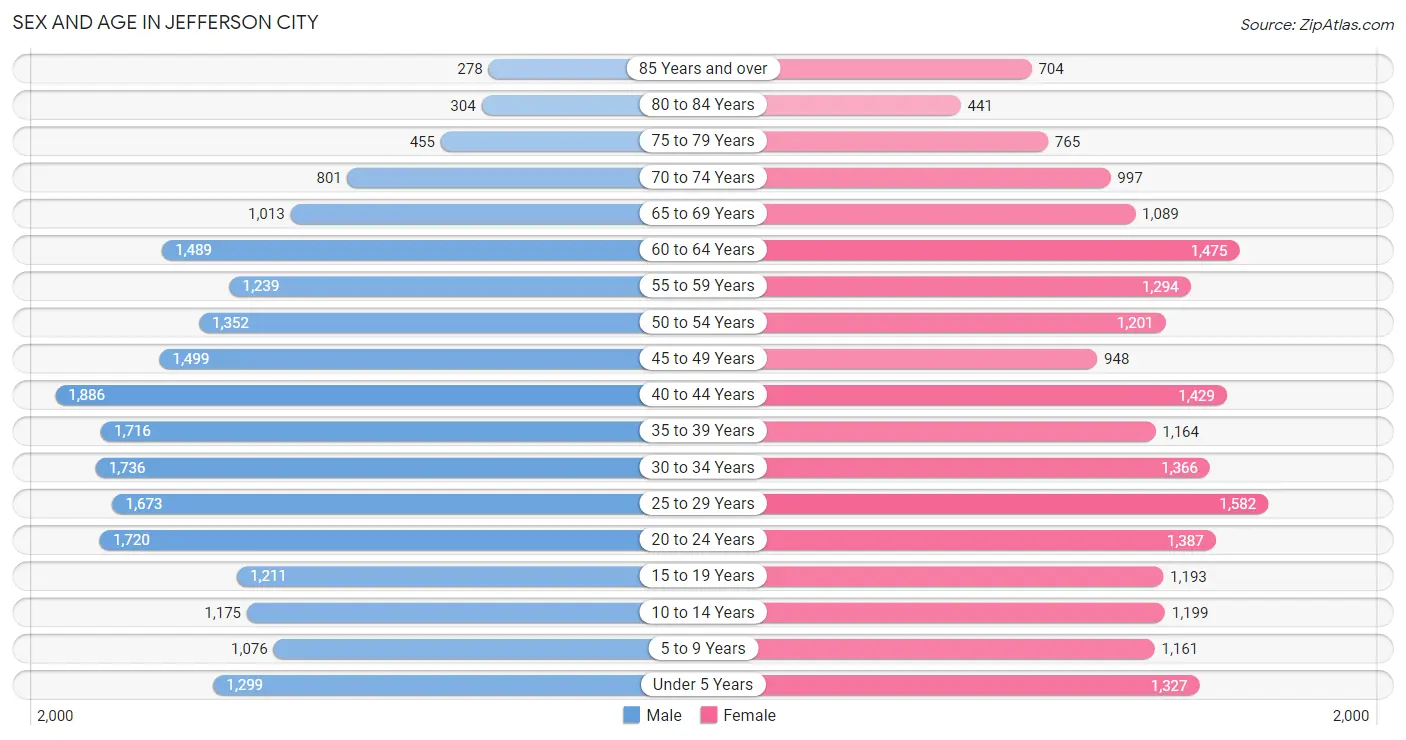
| Age Bracket | Male | Female |
| Under 5 Years | 1,299 (5.9%) | 1,327 (6.4%) |
| 5 to 9 Years | 1,076 (4.9%) | 1,161 (5.6%) |
| 10 to 14 Years | 1,175 (5.4%) | 1,199 (5.8%) |
| 15 to 19 Years | 1,211 (5.5%) | 1,193 (5.8%) |
| 20 to 24 Years | 1,720 (7.9%) | 1,387 (6.7%) |
| 25 to 29 Years | 1,673 (7.6%) | 1,582 (7.6%) |
| 30 to 34 Years | 1,736 (7.9%) | 1,366 (6.6%) |
| 35 to 39 Years | 1,716 (7.8%) | 1,164 (5.6%) |
| 40 to 44 Years | 1,886 (8.6%) | 1,429 (6.9%) |
| 45 to 49 Years | 1,499 (6.8%) | 948 (4.6%) |
| 50 to 54 Years | 1,352 (6.2%) | 1,201 (5.8%) |
| 55 to 59 Years | 1,239 (5.7%) | 1,294 (6.2%) |
| 60 to 64 Years | 1,489 (6.8%) | 1,475 (7.1%) |
| 65 to 69 Years | 1,013 (4.6%) | 1,089 (5.3%) |
| 70 to 74 Years | 801 (3.6%) | 997 (4.8%) |
| 75 to 79 Years | 455 (2.1%) | 765 (3.7%) |
| 80 to 84 Years | 304 (1.4%) | 441 (2.1%) |
| 85 Years and over | 278 (1.3%) | 704 (3.4%) |
| Total | 21,922 (100.0%) | 20,722 (100.0%) |
Families and Households in Jefferson City
Median Family Size in Jefferson City
The median family size in Jefferson City is 3.03 persons per family, with single male/father families (456 | 4.8%) accounting for the largest median family size of 3.11 persons per family. On the other hand, single female/mother families (1,962 | 20.8%) represent the smallest median family size with 2.83 persons per family.
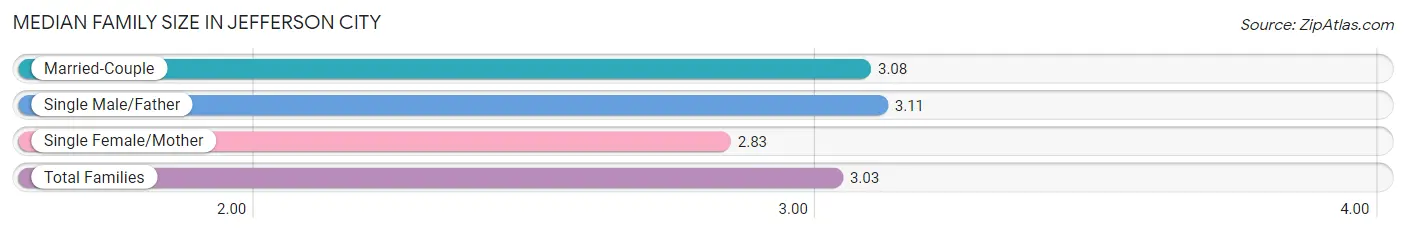
| Family Type | # Families | Family Size |
| Married-Couple | 7,033 (74.4%) | 3.08 |
| Single Male/Father | 456 (4.8%) | 3.11 |
| Single Female/Mother | 1,962 (20.8%) | 2.83 |
| Total Families | 9,451 (100.0%) | 3.03 |
Median Household Size in Jefferson City
The median household size in Jefferson City is 2.26 persons per household, with single male/father households (456 | 2.7%) accounting for the largest median household size of 3.54 persons per household. non-family households (7,401 | 43.9%) represent the smallest median household size with 1.16 persons per household.
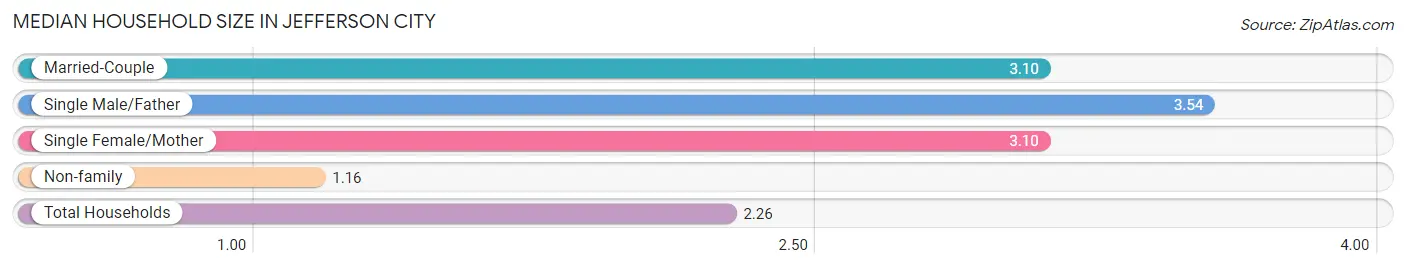
| Household Type | # Households | Household Size |
| Married-Couple | 7,033 (41.7%) | 3.10 |
| Single Male/Father | 456 (2.7%) | 3.54 |
| Single Female/Mother | 1,962 (11.6%) | 3.10 |
| Non-family | 7,401 (43.9%) | 1.16 |
| Total Households | 16,852 (100.0%) | 2.26 |
Household Size by Marriage Status in Jefferson City
Out of a total of 16,852 households in Jefferson City, 9,451 (56.1%) are family households, while 7,401 (43.9%) are nonfamily households. The most numerous type of family households are 2-person households, comprising 4,733, and the most common type of nonfamily households are 1-person households, comprising 6,533.
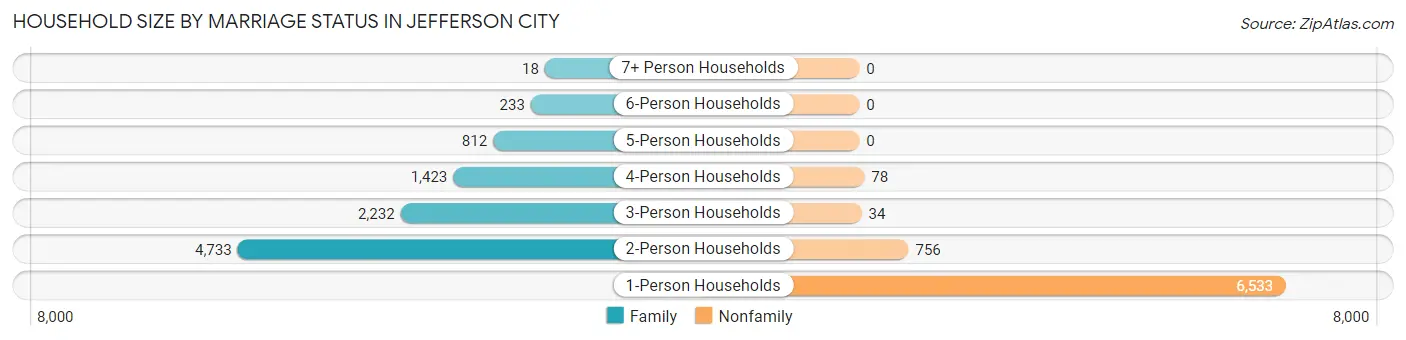
| Household Size | Family Households | Nonfamily Households |
| 1-Person Households | - | 6,533 (38.8%) |
| 2-Person Households | 4,733 (28.1%) | 756 (4.5%) |
| 3-Person Households | 2,232 (13.2%) | 34 (0.2%) |
| 4-Person Households | 1,423 (8.4%) | 78 (0.5%) |
| 5-Person Households | 812 (4.8%) | 0 (0.0%) |
| 6-Person Households | 233 (1.4%) | 0 (0.0%) |
| 7+ Person Households | 18 (0.1%) | 0 (0.0%) |
| Total | 9,451 (56.1%) | 7,401 (43.9%) |
Female Fertility in Jefferson City
Fertility by Age in Jefferson City
Average fertility rate in Jefferson City is 53.0 births per 1,000 women. Women in the age bracket of 20 to 34 years have the highest fertility rate with 85.0 births per 1,000 women. Women in the age bracket of 20 to 34 years acount for 76.1% of all women with births.
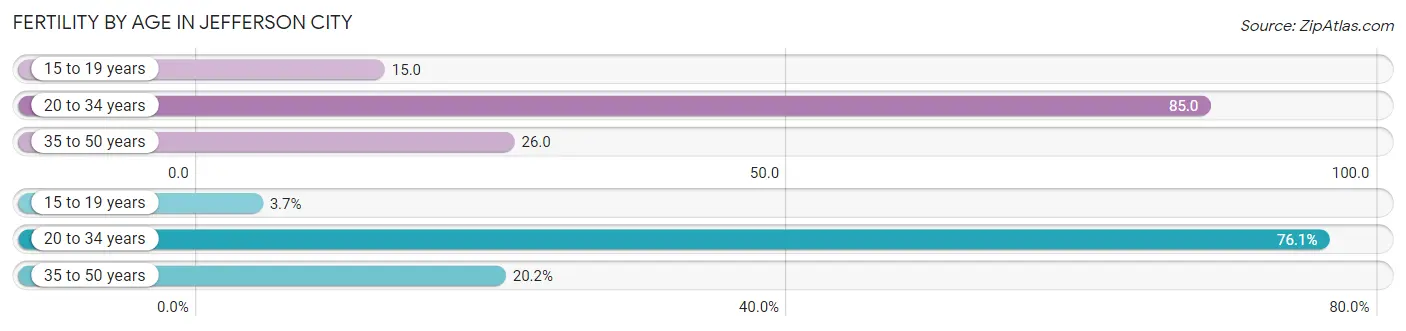
| Age Bracket | Women with Births | Births / 1,000 Women |
| 15 to 19 years | 18 (3.7%) | 15.0 |
| 20 to 34 years | 369 (76.1%) | 85.0 |
| 35 to 50 years | 98 (20.2%) | 26.0 |
| Total | 485 (100.0%) | 53.0 |
Fertility by Age by Marriage Status in Jefferson City
63.9% of women with births (485) in Jefferson City are married. The highest percentage of unmarried women with births falls into 15 to 19 years age bracket with 100.0% of them unmarried at the time of birth, while the lowest percentage of unmarried women with births belong to 35 to 50 years age bracket with 21.4% of them unmarried.
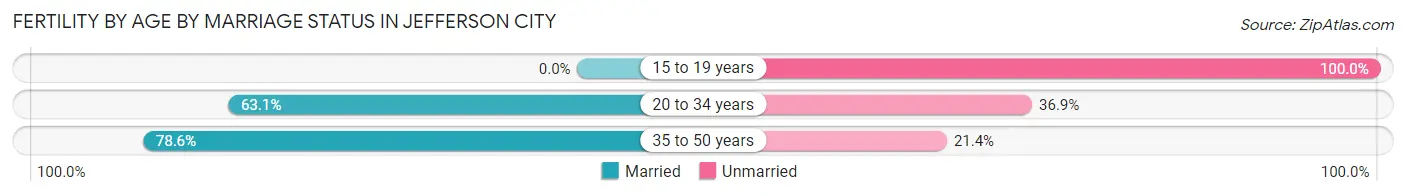
| Age Bracket | Married | Unmarried |
| 15 to 19 years | 0 (0.0%) | 18 (100.0%) |
| 20 to 34 years | 233 (63.1%) | 136 (36.9%) |
| 35 to 50 years | 77 (78.6%) | 21 (21.4%) |
| Total | 310 (63.9%) | 175 (36.1%) |
Fertility by Education in Jefferson City
Average fertility rate in Jefferson City is 53.0 births per 1,000 women. Women with the education attainment of bachelor's degree have the highest fertility rate of 76.0 births per 1,000 women, while women with the education attainment of less than high school have the lowest fertility at 9.0 births per 1,000 women. Women with the education attainment of college or associate's degree represent 43.3% of all women with births.
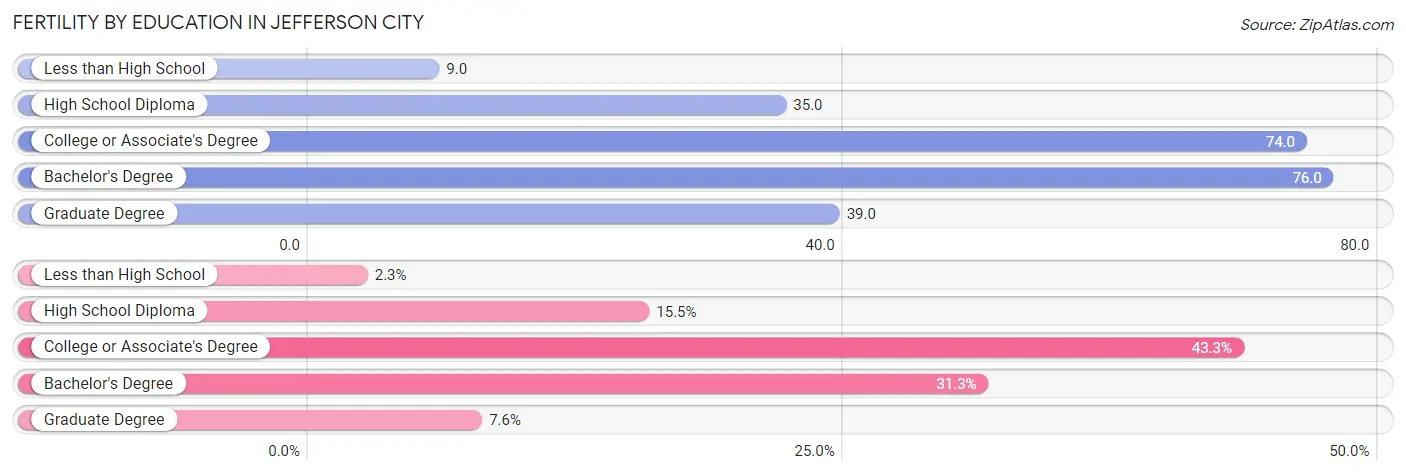
| Educational Attainment | Women with Births | Births / 1,000 Women |
| Less than High School | 11 (2.3%) | 9.0 |
| High School Diploma | 75 (15.5%) | 35.0 |
| College or Associate's Degree | 210 (43.3%) | 74.0 |
| Bachelor's Degree | 152 (31.3%) | 76.0 |
| Graduate Degree | 37 (7.6%) | 39.0 |
| Total | 485 (100.0%) | 53.0 |
Fertility by Education by Marriage Status in Jefferson City
36.1% of women with births in Jefferson City are unmarried. Women with the educational attainment of graduate degree are most likely to be married with 100.0% of them married at childbirth, while women with the educational attainment of less than high school are least likely to be married with 100.0% of them unmarried at childbirth.
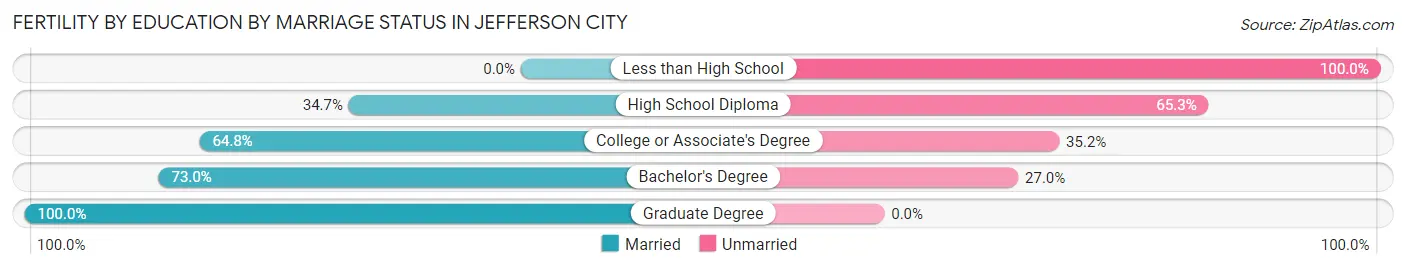
| Educational Attainment | Married | Unmarried |
| Less than High School | 0 (0.0%) | 11 (100.0%) |
| High School Diploma | 26 (34.7%) | 49 (65.3%) |
| College or Associate's Degree | 136 (64.8%) | 74 (35.2%) |
| Bachelor's Degree | 111 (73.0%) | 41 (27.0%) |
| Graduate Degree | 37 (100.0%) | 0 (0.0%) |
| Total | 310 (63.9%) | 175 (36.1%) |
Employment Characteristics in Jefferson City
Employment by Class of Employer in Jefferson City
Among the 20,631 employed individuals in Jefferson City, private company employees (12,165 | 59.0%), state government employees (3,446 | 16.7%), and not-for-profit organizations (1,917 | 9.3%) make up the most common classes of employment.
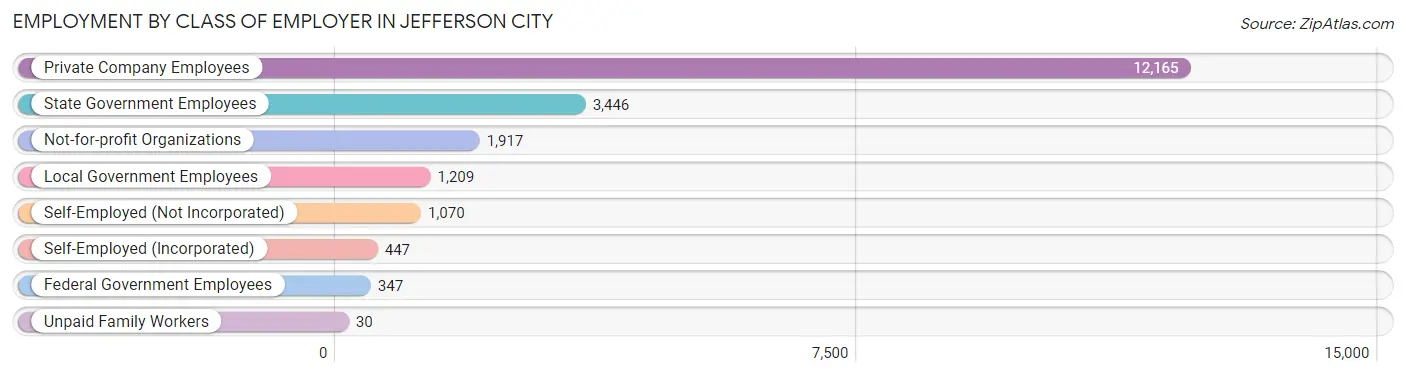
| Employer Class | # Employees | % Employees |
| Private Company Employees | 12,165 | 59.0% |
| Self-Employed (Incorporated) | 447 | 2.2% |
| Self-Employed (Not Incorporated) | 1,070 | 5.2% |
| Not-for-profit Organizations | 1,917 | 9.3% |
| Local Government Employees | 1,209 | 5.9% |
| State Government Employees | 3,446 | 16.7% |
| Federal Government Employees | 347 | 1.7% |
| Unpaid Family Workers | 30 | 0.2% |
| Total | 20,631 | 100.0% |
Employment Status by Age in Jefferson City
According to the labor force statistics for Jefferson City, out of the total population over 16 years of age (34,990), 61.0% or 21,344 individuals are in the labor force, with 2.9% or 619 of them unemployed. The age group with the highest labor force participation rate is 25 to 29 years, with 82.6% or 2,689 individuals in the labor force. Within the labor force, the 16 to 19 years age range has the highest percentage of unemployed individuals, with 9.1% or 79 of them being unemployed.
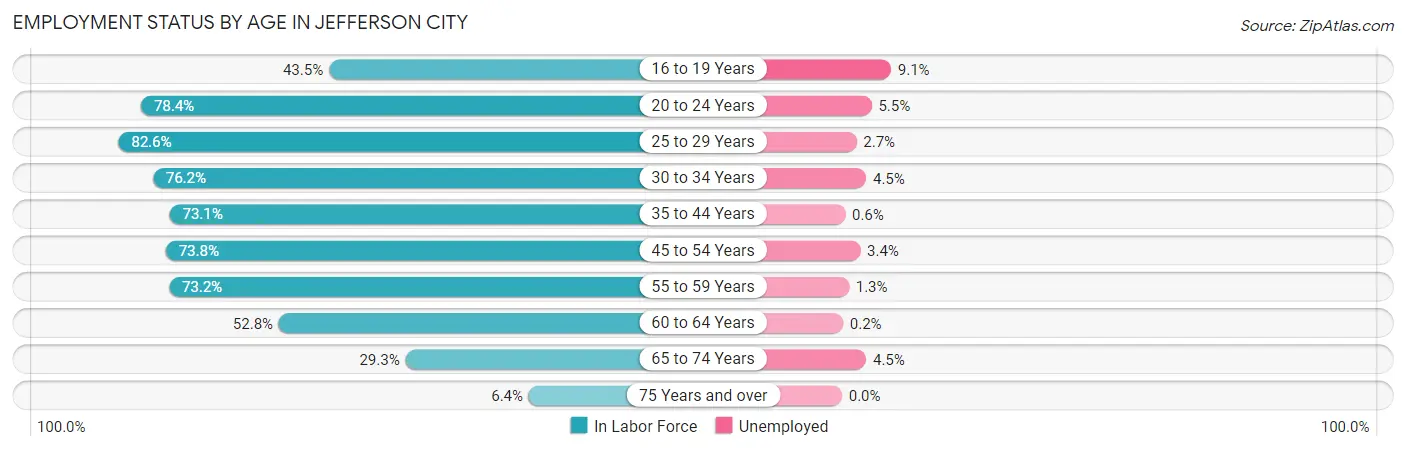
| Age Bracket | In Labor Force | Unemployed |
| 16 to 19 Years | 864 (43.5%) | 79 (9.1%) |
| 20 to 24 Years | 2,436 (78.4%) | 134 (5.5%) |
| 25 to 29 Years | 2,689 (82.6%) | 73 (2.7%) |
| 30 to 34 Years | 2,364 (76.2%) | 106 (4.5%) |
| 35 to 44 Years | 4,529 (73.1%) | 27 (0.6%) |
| 45 to 54 Years | 3,690 (73.8%) | 125 (3.4%) |
| 55 to 59 Years | 1,854 (73.2%) | 24 (1.3%) |
| 60 to 64 Years | 1,565 (52.8%) | 3 (0.2%) |
| 65 to 74 Years | 1,143 (29.3%) | 51 (4.5%) |
| 75 Years and over | 189 (6.4%) | 0 (0.0%) |
| Total | 21,344 (61.0%) | 619 (2.9%) |
Employment Status by Educational Attainment in Jefferson City
According to labor force statistics for Jefferson City, 72.4% of individuals (16,687) out of the total population between 25 and 64 years of age (23,049) are in the labor force, with 2.2% or 367 of them being unemployed. The group with the highest labor force participation rate are those with the educational attainment of bachelor's degree or higher, with 87.5% or 6,889 individuals in the labor force. Within the labor force, individuals with high school diploma education have the highest percentage of unemployment, with 2.9% or 121 of them being unemployed.
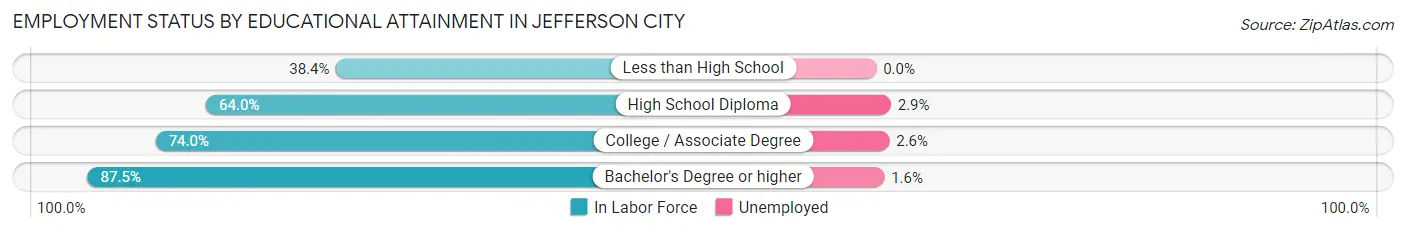
| Educational Attainment | In Labor Force | Unemployed |
| Less than High School | 839 (38.4%) | 0 (0.0%) |
| High School Diploma | 4,171 (64.0%) | 189 (2.9%) |
| College / Associate Degree | 4,792 (74.0%) | 168 (2.6%) |
| Bachelor's Degree or higher | 6,889 (87.5%) | 126 (1.6%) |
| Total | 16,687 (72.4%) | 507 (2.2%) |
Employment Occupations by Sex in Jefferson City
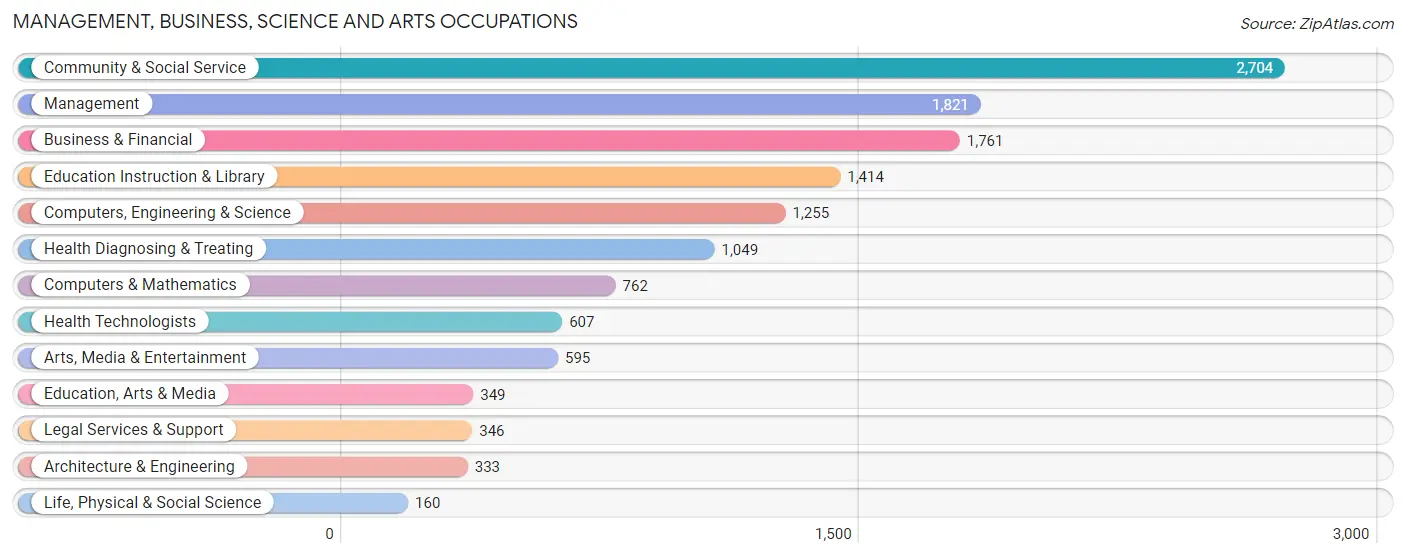
Management, Business, Science and Arts Occupations
The most common Management, Business, Science and Arts occupations in Jefferson City are Community & Social Service (2,704 | 13.1%), Management (1,821 | 8.8%), Business & Financial (1,761 | 8.5%), Education Instruction & Library (1,414 | 6.8%), and Computers, Engineering & Science (1,255 | 6.1%).
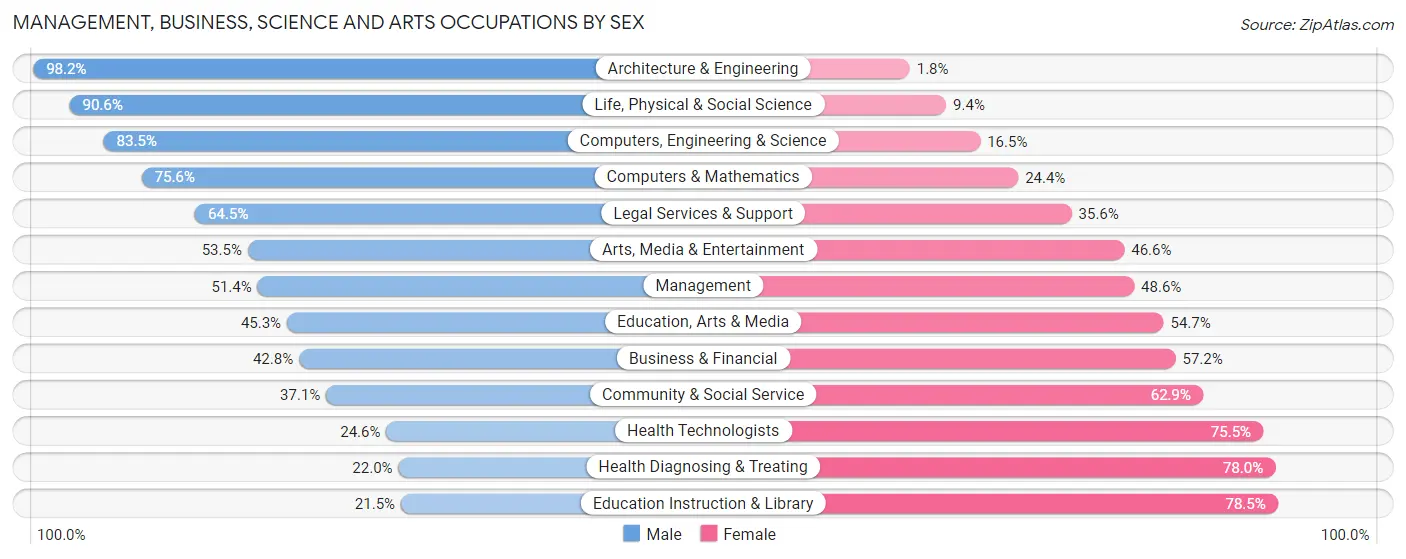
Management, Business, Science and Arts Occupations by Sex
Within the Management, Business, Science and Arts occupations in Jefferson City, the most male-oriented occupations are Architecture & Engineering (98.2%), Life, Physical & Social Science (90.6%), and Computers, Engineering & Science (83.5%), while the most female-oriented occupations are Education Instruction & Library (78.5%), Health Diagnosing & Treating (78.0%), and Health Technologists (75.4%).
| Occupation | Male | Female |
| Management | 936 (51.4%) | 885 (48.6%) |
| Business & Financial | 753 (42.8%) | 1,008 (57.2%) |
| Computers, Engineering & Science | 1,048 (83.5%) | 207 (16.5%) |
| Computers & Mathematics | 576 (75.6%) | 186 (24.4%) |
| Architecture & Engineering | 327 (98.2%) | 6 (1.8%) |
| Life, Physical & Social Science | 145 (90.6%) | 15 (9.4%) |
| Community & Social Service | 1,003 (37.1%) | 1,701 (62.9%) |
| Education, Arts & Media | 158 (45.3%) | 191 (54.7%) |
| Legal Services & Support | 223 (64.4%) | 123 (35.5%) |
| Education Instruction & Library | 304 (21.5%) | 1,110 (78.5%) |
| Arts, Media & Entertainment | 318 (53.4%) | 277 (46.6%) |
| Health Diagnosing & Treating | 231 (22.0%) | 818 (78.0%) |
| Health Technologists | 149 (24.5%) | 458 (75.4%) |
| Total (Category) | 3,971 (46.2%) | 4,619 (53.8%) |
| Total (Overall) | 10,469 (50.7%) | 10,191 (49.3%) |
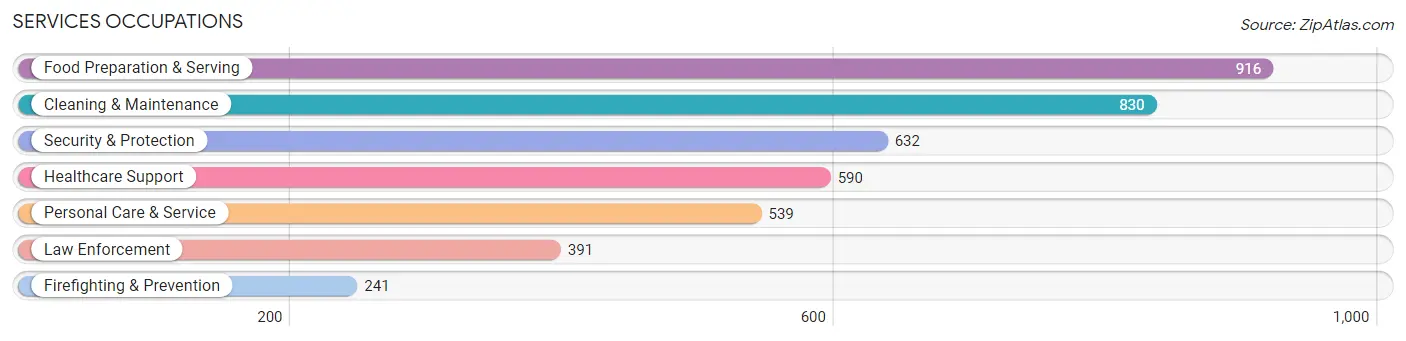
Services Occupations
The most common Services occupations in Jefferson City are Food Preparation & Serving (916 | 4.4%), Cleaning & Maintenance (830 | 4.0%), Security & Protection (632 | 3.1%), Healthcare Support (590 | 2.9%), and Personal Care & Service (539 | 2.6%).
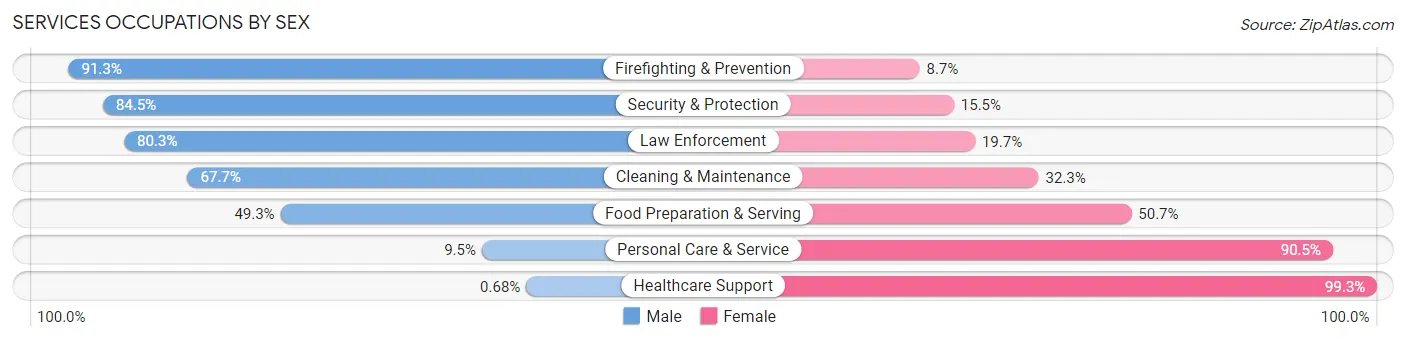
Services Occupations by Sex
Within the Services occupations in Jefferson City, the most male-oriented occupations are Firefighting & Prevention (91.3%), Security & Protection (84.5%), and Law Enforcement (80.3%), while the most female-oriented occupations are Healthcare Support (99.3%), Personal Care & Service (90.5%), and Food Preparation & Serving (50.7%).
| Occupation | Male | Female |
| Healthcare Support | 4 (0.7%) | 586 (99.3%) |
| Security & Protection | 534 (84.5%) | 98 (15.5%) |
| Firefighting & Prevention | 220 (91.3%) | 21 (8.7%) |
| Law Enforcement | 314 (80.3%) | 77 (19.7%) |
| Food Preparation & Serving | 452 (49.3%) | 464 (50.7%) |
| Cleaning & Maintenance | 562 (67.7%) | 268 (32.3%) |
| Personal Care & Service | 51 (9.5%) | 488 (90.5%) |
| Total (Category) | 1,603 (45.7%) | 1,904 (54.3%) |
| Total (Overall) | 10,469 (50.7%) | 10,191 (49.3%) |
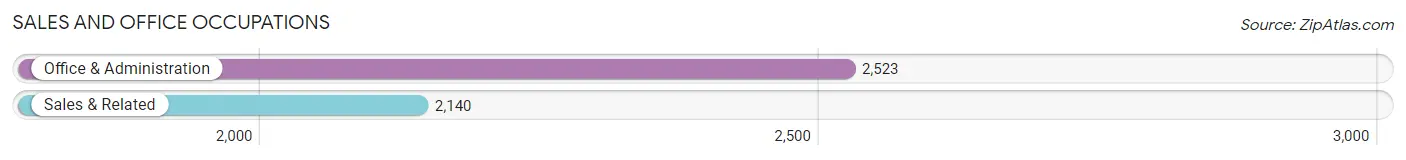
Sales and Office Occupations
The most common Sales and Office occupations in Jefferson City are Office & Administration (2,523 | 12.2%), and Sales & Related (2,140 | 10.4%).
Sales and Office Occupations by Sex
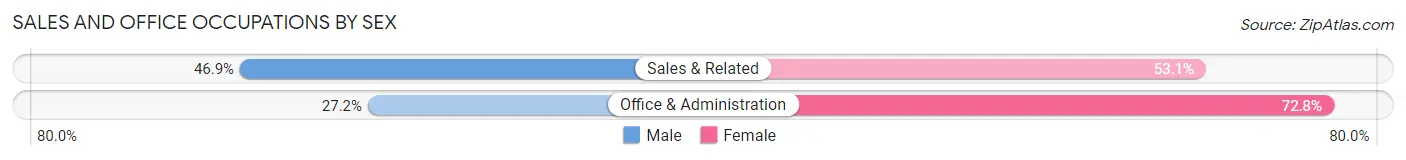
| Occupation | Male | Female |
| Sales & Related | 1,003 (46.9%) | 1,137 (53.1%) |
| Office & Administration | 686 (27.2%) | 1,837 (72.8%) |
| Total (Category) | 1,689 (36.2%) | 2,974 (63.8%) |
| Total (Overall) | 10,469 (50.7%) | 10,191 (49.3%) |
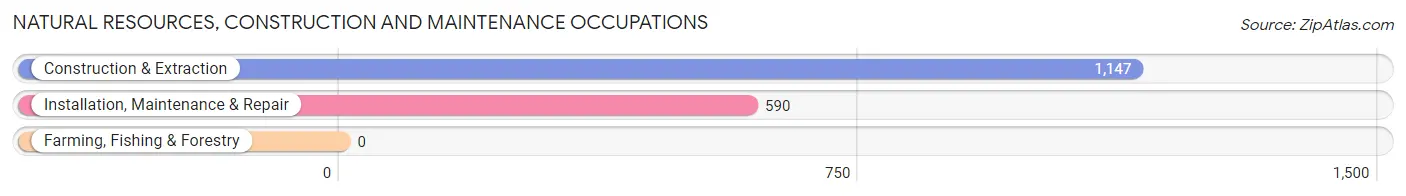
Natural Resources, Construction and Maintenance Occupations
The most common Natural Resources, Construction and Maintenance occupations in Jefferson City are Construction & Extraction (1,147 | 5.6%), and Installation, Maintenance & Repair (590 | 2.9%).
Natural Resources, Construction and Maintenance Occupations by Sex
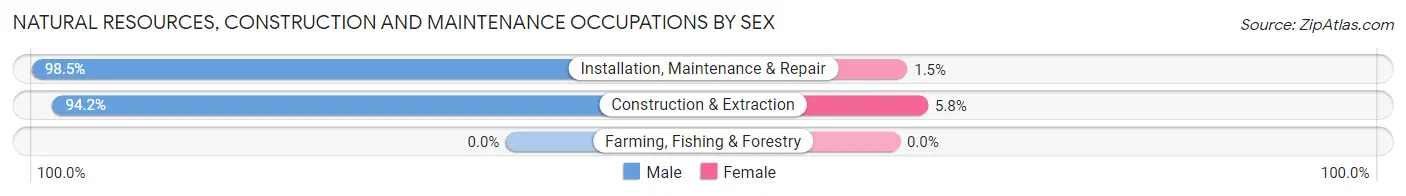
| Occupation | Male | Female |
| Farming, Fishing & Forestry | 0 (0.0%) | 0 (0.0%) |
| Construction & Extraction | 1,080 (94.2%) | 67 (5.8%) |
| Installation, Maintenance & Repair | 581 (98.5%) | 9 (1.5%) |
| Total (Category) | 1,661 (95.6%) | 76 (4.4%) |
| Total (Overall) | 10,469 (50.7%) | 10,191 (49.3%) |
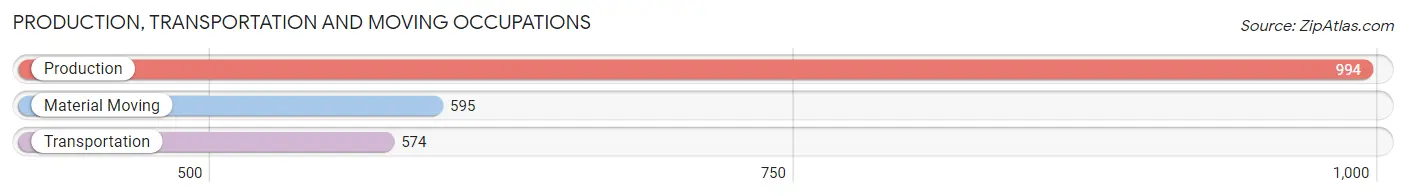
Production, Transportation and Moving Occupations
The most common Production, Transportation and Moving occupations in Jefferson City are Production (994 | 4.8%), Material Moving (595 | 2.9%), and Transportation (574 | 2.8%).
Production, Transportation and Moving Occupations by Sex
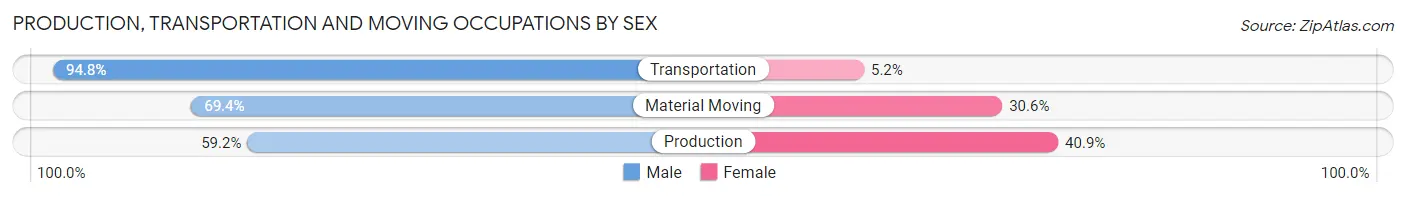
| Occupation | Male | Female |
| Production | 588 (59.2%) | 406 (40.8%) |
| Transportation | 544 (94.8%) | 30 (5.2%) |
| Material Moving | 413 (69.4%) | 182 (30.6%) |
| Total (Category) | 1,545 (71.4%) | 618 (28.6%) |
| Total (Overall) | 10,469 (50.7%) | 10,191 (49.3%) |
Employment Industries by Sex in Jefferson City
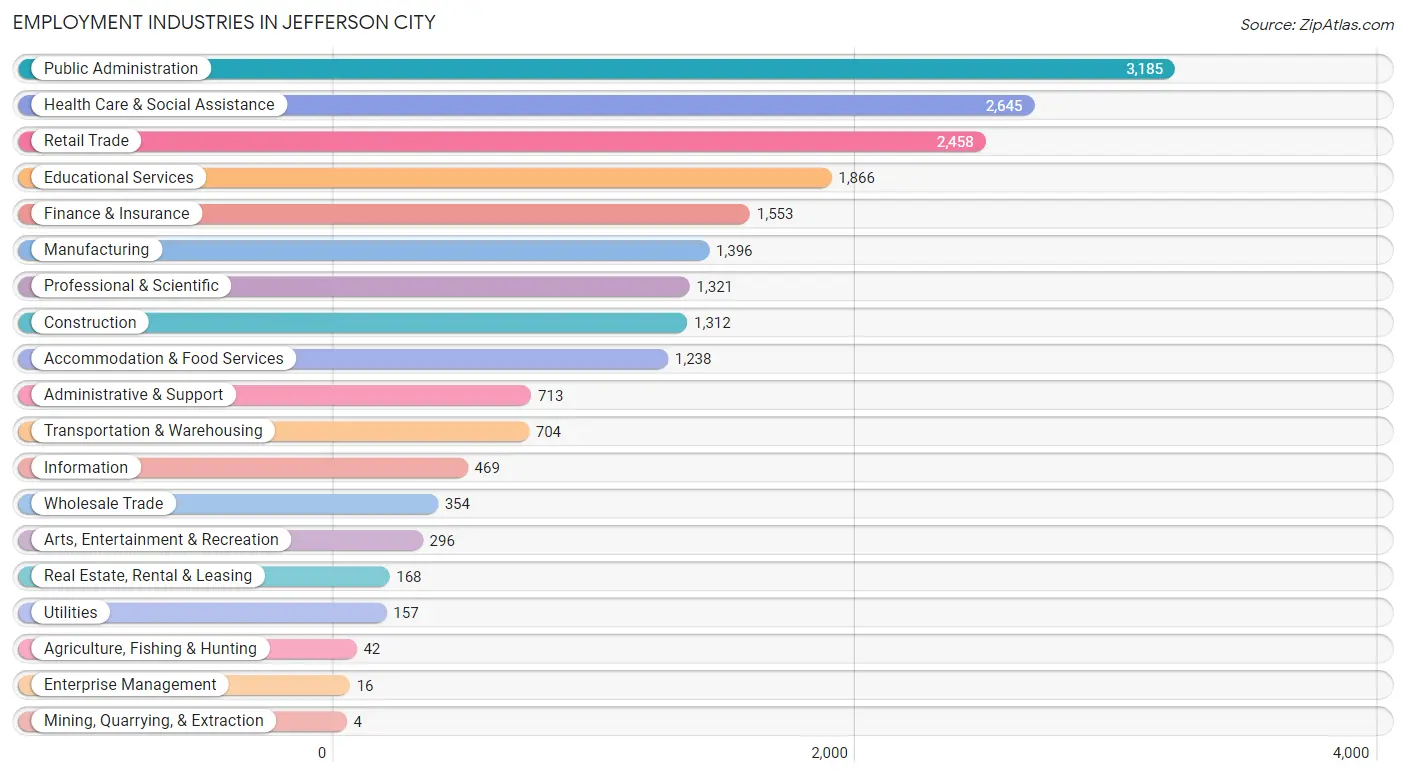
Employment Industries in Jefferson City
The major employment industries in Jefferson City include Public Administration (3,185 | 15.4%), Health Care & Social Assistance (2,645 | 12.8%), Retail Trade (2,458 | 11.9%), Educational Services (1,866 | 9.0%), and Finance & Insurance (1,553 | 7.5%).
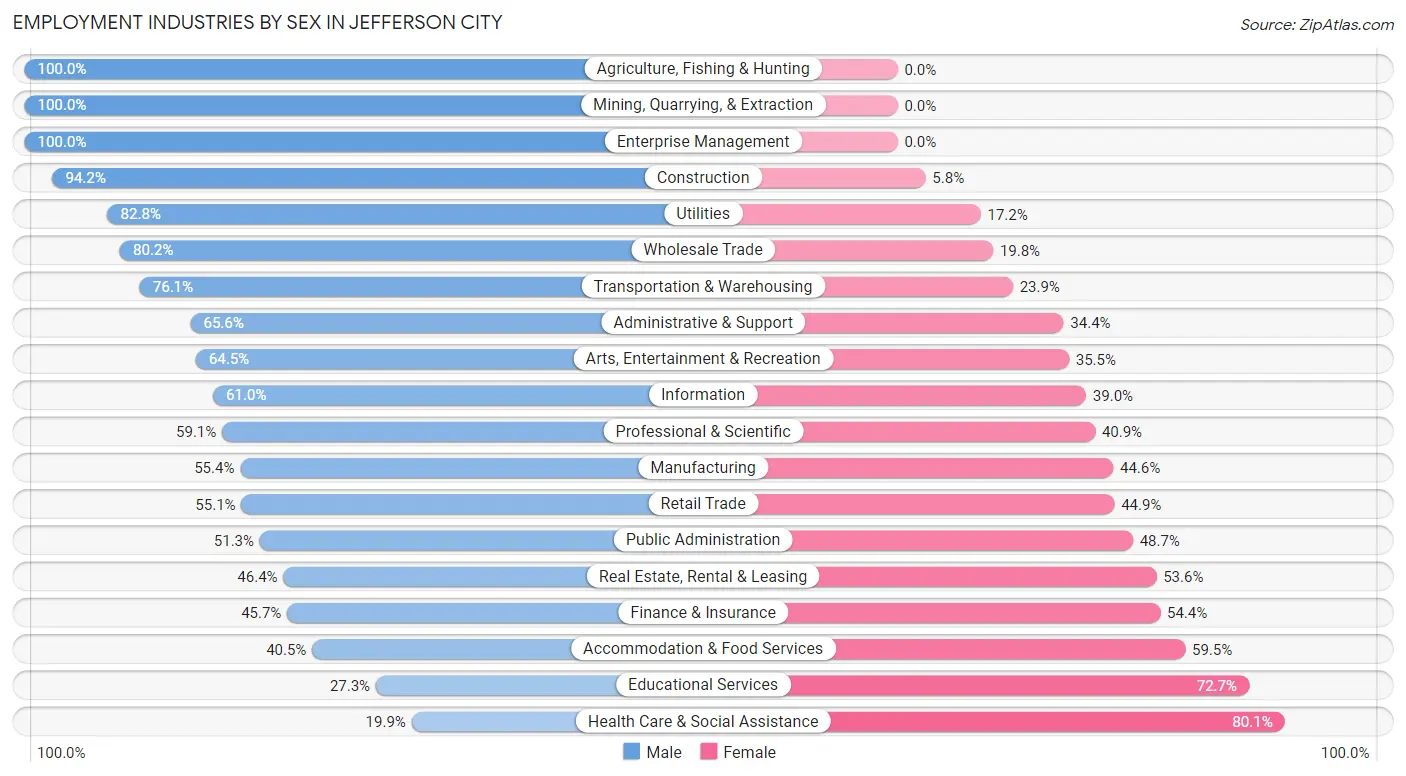
Employment Industries by Sex in Jefferson City
The Jefferson City industries that see more men than women are Agriculture, Fishing & Hunting (100.0%), Mining, Quarrying, & Extraction (100.0%), and Enterprise Management (100.0%), whereas the industries that tend to have a higher number of women are Health Care & Social Assistance (80.1%), Educational Services (72.7%), and Accommodation & Food Services (59.5%).
| Industry | Male | Female |
| Agriculture, Fishing & Hunting | 42 (100.0%) | 0 (0.0%) |
| Mining, Quarrying, & Extraction | 4 (100.0%) | 0 (0.0%) |
| Construction | 1,236 (94.2%) | 76 (5.8%) |
| Manufacturing | 773 (55.4%) | 623 (44.6%) |
| Wholesale Trade | 284 (80.2%) | 70 (19.8%) |
| Retail Trade | 1,355 (55.1%) | 1,103 (44.9%) |
| Transportation & Warehousing | 536 (76.1%) | 168 (23.9%) |
| Utilities | 130 (82.8%) | 27 (17.2%) |
| Information | 286 (61.0%) | 183 (39.0%) |
| Finance & Insurance | 709 (45.7%) | 844 (54.3%) |
| Real Estate, Rental & Leasing | 78 (46.4%) | 90 (53.6%) |
| Professional & Scientific | 781 (59.1%) | 540 (40.9%) |
| Enterprise Management | 16 (100.0%) | 0 (0.0%) |
| Administrative & Support | 468 (65.6%) | 245 (34.4%) |
| Educational Services | 509 (27.3%) | 1,357 (72.7%) |
| Health Care & Social Assistance | 526 (19.9%) | 2,119 (80.1%) |
| Arts, Entertainment & Recreation | 191 (64.5%) | 105 (35.5%) |
| Accommodation & Food Services | 501 (40.5%) | 737 (59.5%) |
| Public Administration | 1,634 (51.3%) | 1,551 (48.7%) |
| Total | 10,469 (50.7%) | 10,191 (49.3%) |
Education in Jefferson City
School Enrollment in Jefferson City
The most common levels of schooling among the 9,286 students in Jefferson City are high school (2,101 | 22.6%), college / undergraduate (2,055 | 22.1%), and middle school (1,907 | 20.5%).
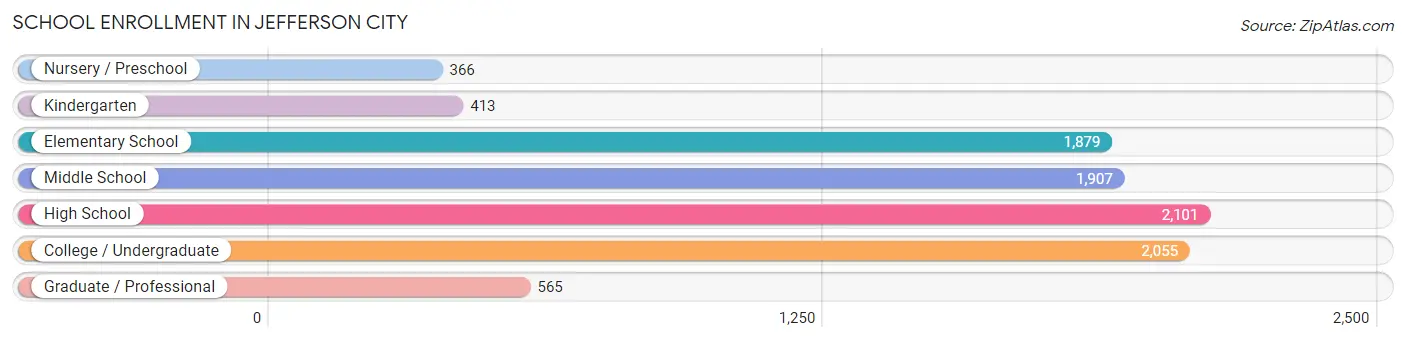
| School Level | # Students | % Students |
| Nursery / Preschool | 366 | 3.9% |
| Kindergarten | 413 | 4.4% |
| Elementary School | 1,879 | 20.2% |
| Middle School | 1,907 | 20.5% |
| High School | 2,101 | 22.6% |
| College / Undergraduate | 2,055 | 22.1% |
| Graduate / Professional | 565 | 6.1% |
| Total | 9,286 | 100.0% |
School Enrollment by Age by Funding Source in Jefferson City
Out of a total of 9,286 students who are enrolled in schools in Jefferson City, 2,591 (27.9%) attend a private institution, while the remaining 6,695 (72.1%) are enrolled in public schools. The age group of 35 years and over has the highest likelihood of being enrolled in private schools, with 500 (72.7% in the age bracket) enrolled. Conversely, the age group of 20 to 24 year olds has the lowest likelihood of being enrolled in a private school, with 1,042 (84.9% in the age bracket) attending a public institution.
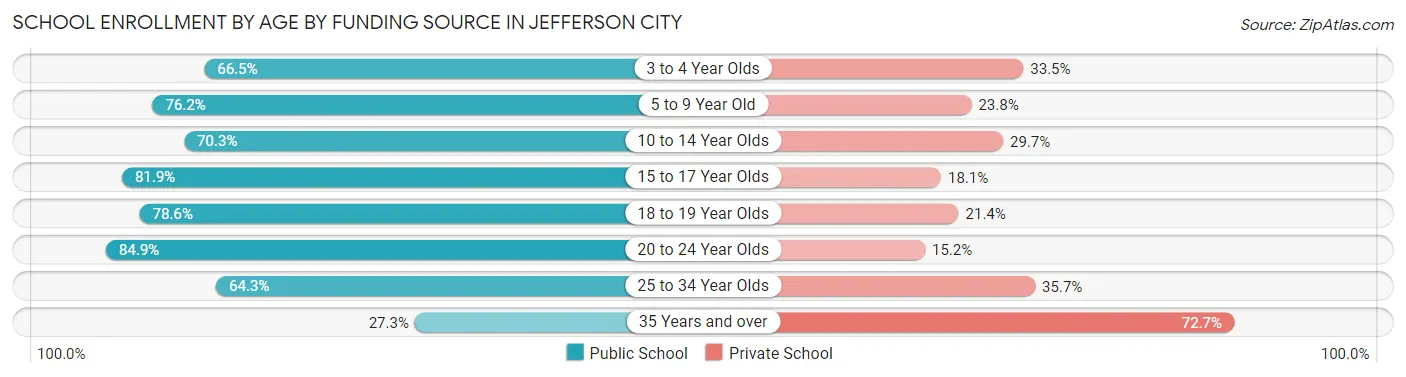
| Age Bracket | Public School | Private School |
| 3 to 4 Year Olds | 165 (66.5%) | 83 (33.5%) |
| 5 to 9 Year Old | 1,590 (76.2%) | 497 (23.8%) |
| 10 to 14 Year Olds | 1,636 (70.3%) | 691 (29.7%) |
| 15 to 17 Year Olds | 1,133 (81.9%) | 251 (18.1%) |
| 18 to 19 Year Olds | 492 (78.6%) | 134 (21.4%) |
| 20 to 24 Year Olds | 1,042 (84.9%) | 186 (15.1%) |
| 25 to 34 Year Olds | 449 (64.3%) | 249 (35.7%) |
| 35 Years and over | 188 (27.3%) | 500 (72.7%) |
| Total | 6,695 (72.1%) | 2,591 (27.9%) |
Educational Attainment by Field of Study in Jefferson City
Business (3,086 | 26.7%), education (1,667 | 14.4%), science & technology (930 | 8.1%), bio, nature & agricultural (774 | 6.7%), and arts & humanities (765 | 6.6%) are the most common fields of study among 11,543 individuals in Jefferson City who have obtained a bachelor's degree or higher.
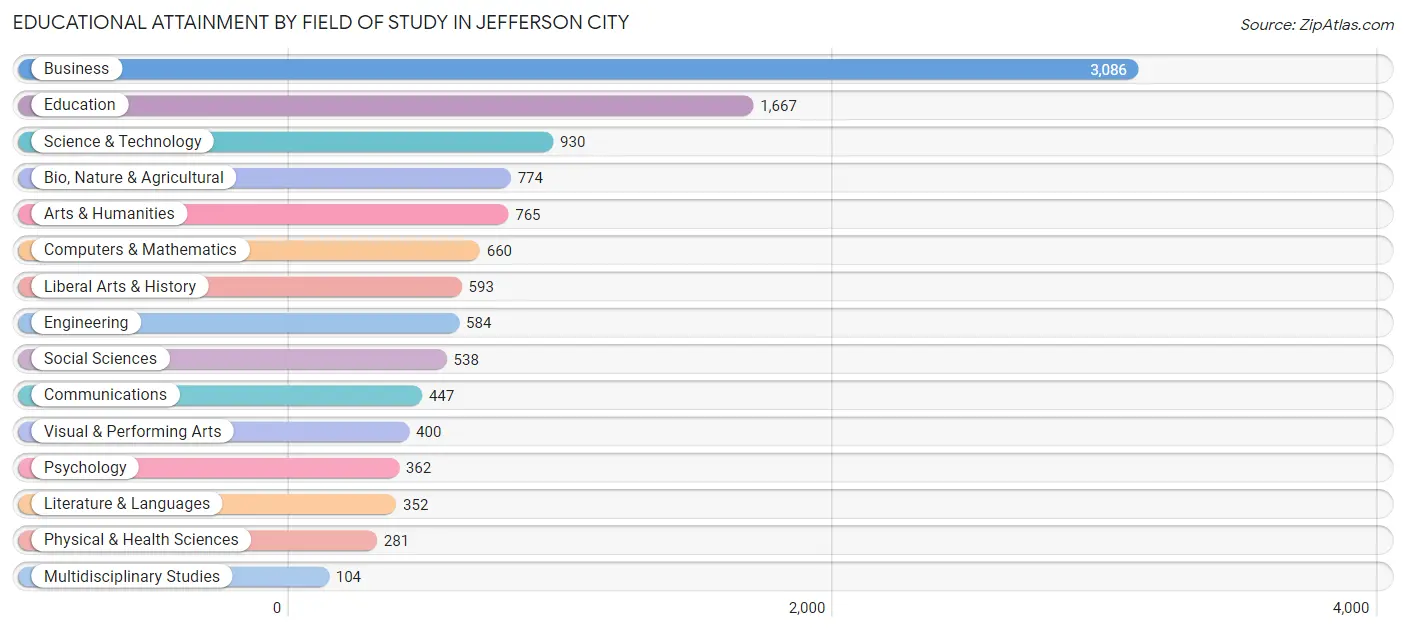
| Field of Study | # Graduates | % Graduates |
| Computers & Mathematics | 660 | 5.7% |
| Bio, Nature & Agricultural | 774 | 6.7% |
| Physical & Health Sciences | 281 | 2.4% |
| Psychology | 362 | 3.1% |
| Social Sciences | 538 | 4.7% |
| Engineering | 584 | 5.1% |
| Multidisciplinary Studies | 104 | 0.9% |
| Science & Technology | 930 | 8.1% |
| Business | 3,086 | 26.7% |
| Education | 1,667 | 14.4% |
| Literature & Languages | 352 | 3.0% |
| Liberal Arts & History | 593 | 5.1% |
| Visual & Performing Arts | 400 | 3.5% |
| Communications | 447 | 3.9% |
| Arts & Humanities | 765 | 6.6% |
| Total | 11,543 | 100.0% |
Transportation & Commute in Jefferson City
Vehicle Availability by Sex in Jefferson City
The most prevalent vehicle ownership categories in Jefferson City are males with 2 vehicles (4,520, accounting for 43.9%) and females with 2 vehicles (3,738, making up 44.8%).
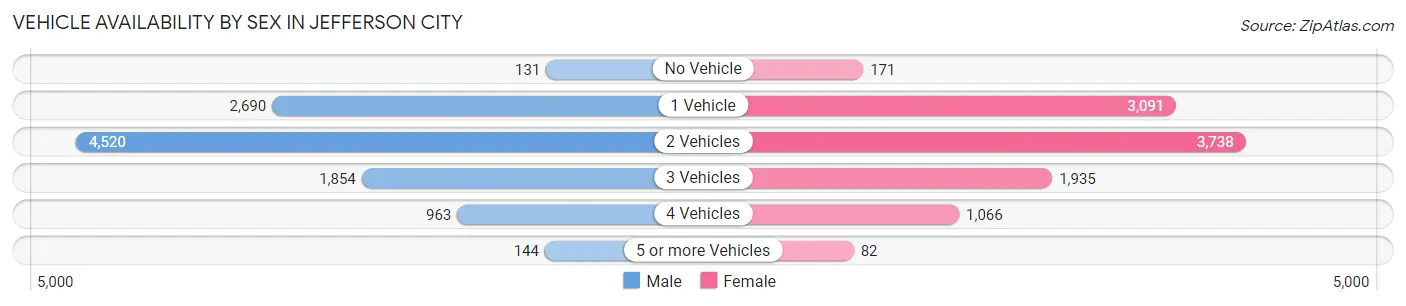
| Vehicles Available | Male | Female |
| No Vehicle | 131 (1.3%) | 171 (1.7%) |
| 1 Vehicle | 2,690 (26.1%) | 3,091 (30.7%) |
| 2 Vehicles | 4,520 (43.9%) | 3,738 (37.1%) |
| 3 Vehicles | 1,854 (18.0%) | 1,935 (19.2%) |
| 4 Vehicles | 963 (9.3%) | 1,066 (10.6%) |
| 5 or more Vehicles | 144 (1.4%) | 82 (0.8%) |
| Total | 10,302 (100.0%) | 10,083 (100.0%) |
Commute Time in Jefferson City
The most frequently occuring commute durations in Jefferson City are 10 to 14 minutes (5,678 commuters, 29.5%), 5 to 9 minutes (4,168 commuters, 21.6%), and 15 to 19 minutes (3,924 commuters, 20.4%).
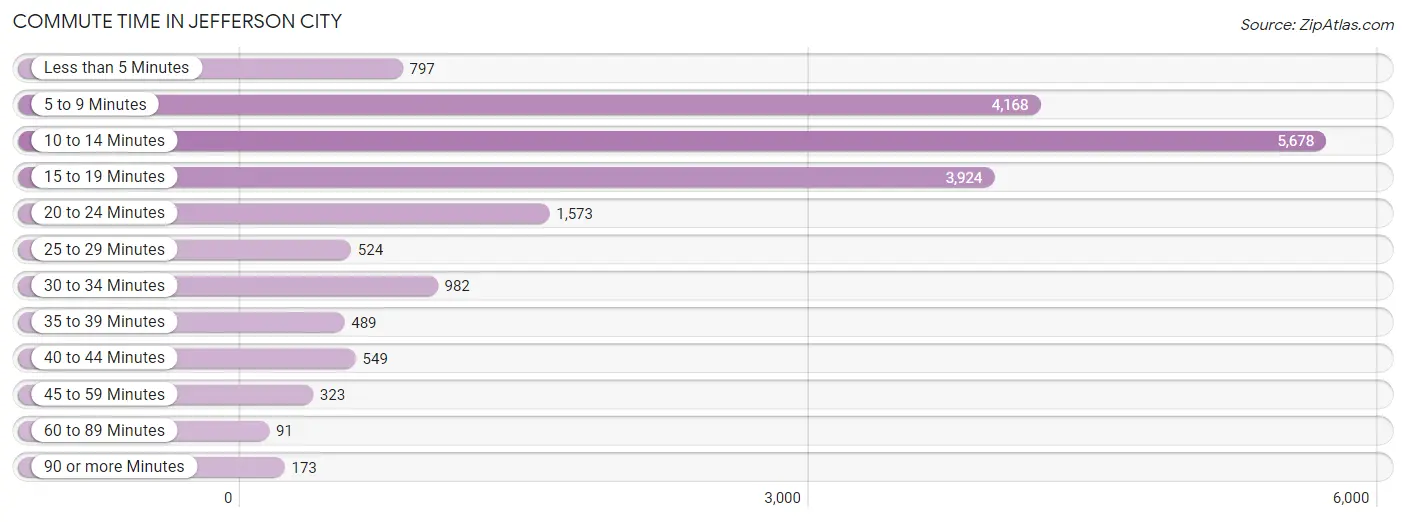
| Commute Time | # Commuters | % Commuters |
| Less than 5 Minutes | 797 | 4.1% |
| 5 to 9 Minutes | 4,168 | 21.6% |
| 10 to 14 Minutes | 5,678 | 29.5% |
| 15 to 19 Minutes | 3,924 | 20.4% |
| 20 to 24 Minutes | 1,573 | 8.2% |
| 25 to 29 Minutes | 524 | 2.7% |
| 30 to 34 Minutes | 982 | 5.1% |
| 35 to 39 Minutes | 489 | 2.5% |
| 40 to 44 Minutes | 549 | 2.9% |
| 45 to 59 Minutes | 323 | 1.7% |
| 60 to 89 Minutes | 91 | 0.5% |
| 90 or more Minutes | 173 | 0.9% |
Commute Time by Sex in Jefferson City
The most common commute times in Jefferson City are 10 to 14 minutes (2,774 commuters, 28.1%) for males and 10 to 14 minutes (2,904 commuters, 30.9%) for females.
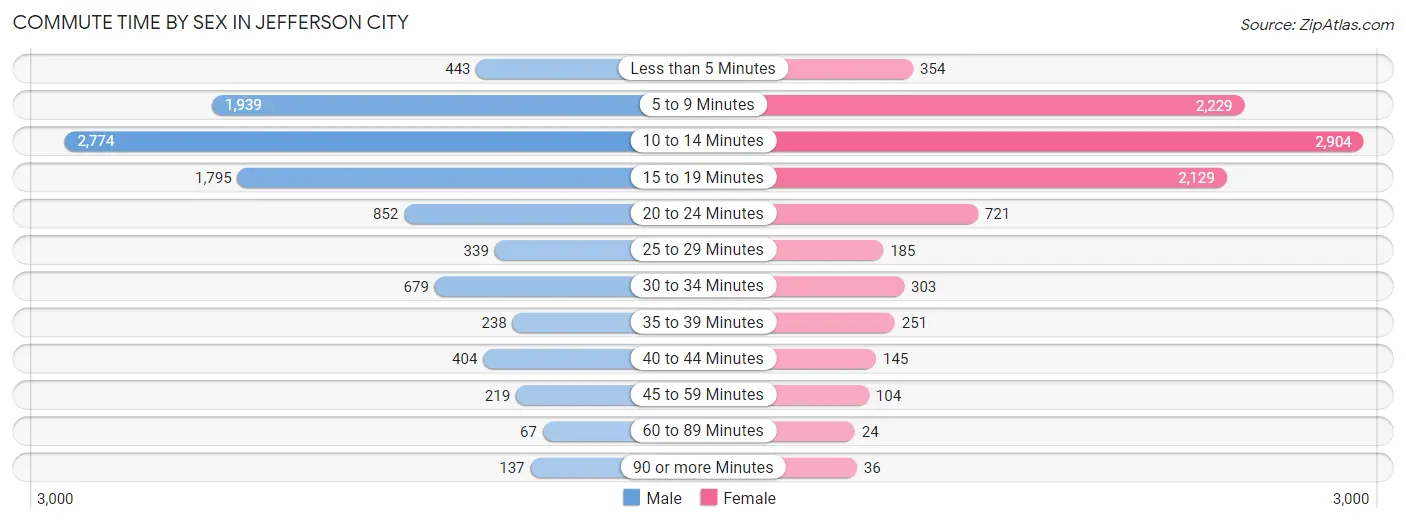
| Commute Time | Male | Female |
| Less than 5 Minutes | 443 (4.5%) | 354 (3.8%) |
| 5 to 9 Minutes | 1,939 (19.6%) | 2,229 (23.7%) |
| 10 to 14 Minutes | 2,774 (28.1%) | 2,904 (30.9%) |
| 15 to 19 Minutes | 1,795 (18.2%) | 2,129 (22.7%) |
| 20 to 24 Minutes | 852 (8.6%) | 721 (7.7%) |
| 25 to 29 Minutes | 339 (3.4%) | 185 (2.0%) |
| 30 to 34 Minutes | 679 (6.9%) | 303 (3.2%) |
| 35 to 39 Minutes | 238 (2.4%) | 251 (2.7%) |
| 40 to 44 Minutes | 404 (4.1%) | 145 (1.5%) |
| 45 to 59 Minutes | 219 (2.2%) | 104 (1.1%) |
| 60 to 89 Minutes | 67 (0.7%) | 24 (0.3%) |
| 90 or more Minutes | 137 (1.4%) | 36 (0.4%) |
Time of Departure to Work by Sex in Jefferson City
The most frequent times of departure to work in Jefferson City are 7:00 AM to 7:29 AM (2,313, 23.4%) for males and 7:30 AM to 7:59 AM (1,769, 18.9%) for females.
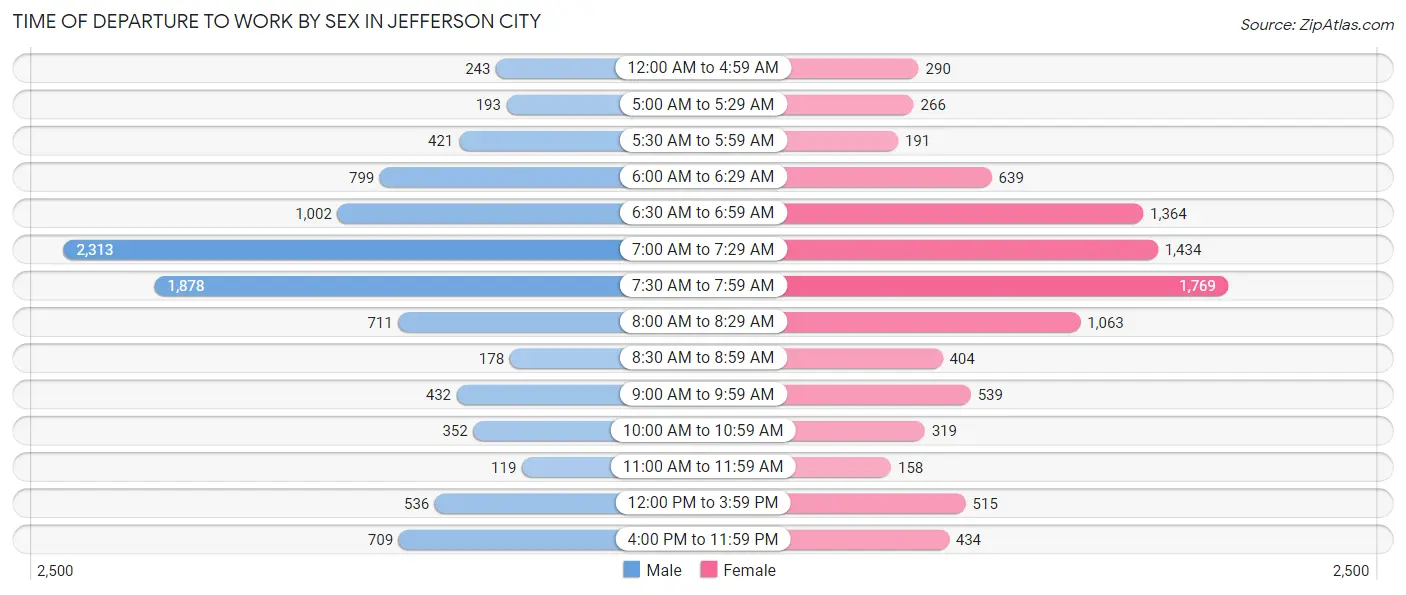
| Time of Departure | Male | Female |
| 12:00 AM to 4:59 AM | 243 (2.5%) | 290 (3.1%) |
| 5:00 AM to 5:29 AM | 193 (1.9%) | 266 (2.8%) |
| 5:30 AM to 5:59 AM | 421 (4.3%) | 191 (2.0%) |
| 6:00 AM to 6:29 AM | 799 (8.1%) | 639 (6.8%) |
| 6:30 AM to 6:59 AM | 1,002 (10.1%) | 1,364 (14.5%) |
| 7:00 AM to 7:29 AM | 2,313 (23.4%) | 1,434 (15.3%) |
| 7:30 AM to 7:59 AM | 1,878 (19.0%) | 1,769 (18.9%) |
| 8:00 AM to 8:29 AM | 711 (7.2%) | 1,063 (11.3%) |
| 8:30 AM to 8:59 AM | 178 (1.8%) | 404 (4.3%) |
| 9:00 AM to 9:59 AM | 432 (4.4%) | 539 (5.7%) |
| 10:00 AM to 10:59 AM | 352 (3.6%) | 319 (3.4%) |
| 11:00 AM to 11:59 AM | 119 (1.2%) | 158 (1.7%) |
| 12:00 PM to 3:59 PM | 536 (5.4%) | 515 (5.5%) |
| 4:00 PM to 11:59 PM | 709 (7.2%) | 434 (4.6%) |
| Total | 9,886 (100.0%) | 9,385 (100.0%) |
Housing Occupancy in Jefferson City
Occupancy by Ownership in Jefferson City
Of the total 16,852 dwellings in Jefferson City, owner-occupied units account for 9,982 (59.2%), while renter-occupied units make up 6,870 (40.8%).
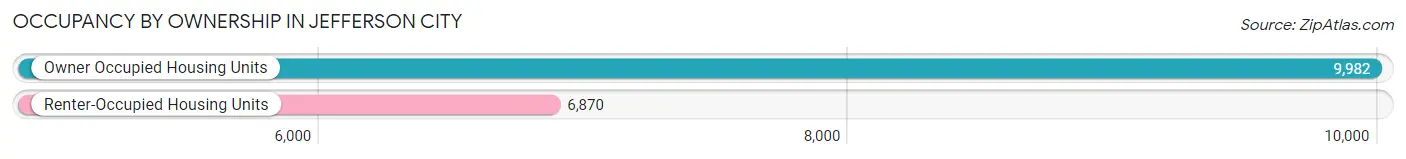
| Occupancy | # Housing Units | % Housing Units |
| Owner Occupied Housing Units | 9,982 | 59.2% |
| Renter-Occupied Housing Units | 6,870 | 40.8% |
| Total Occupied Housing Units | 16,852 | 100.0% |
Occupancy by Household Size in Jefferson City
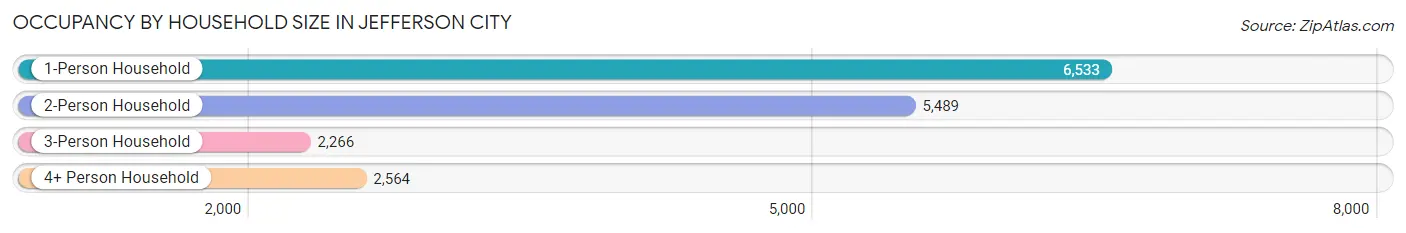
| Household Size | # Housing Units | % Housing Units |
| 1-Person Household | 6,533 | 38.8% |
| 2-Person Household | 5,489 | 32.6% |
| 3-Person Household | 2,266 | 13.5% |
| 4+ Person Household | 2,564 | 15.2% |
| Total Housing Units | 16,852 | 100.0% |
Occupancy by Ownership by Household Size in Jefferson City
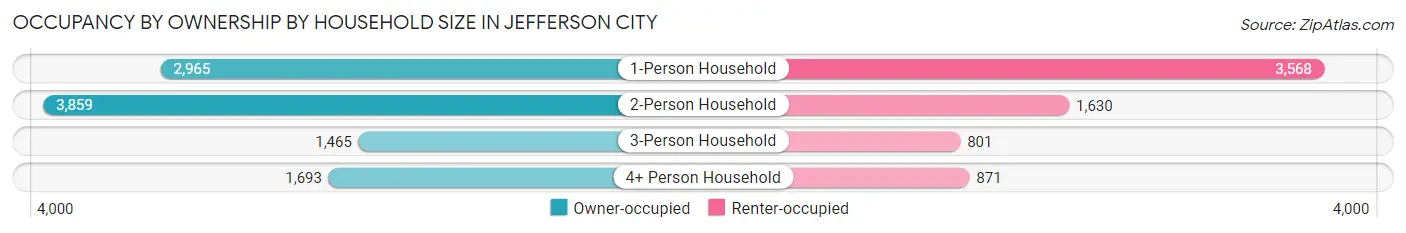
| Household Size | Owner-occupied | Renter-occupied |
| 1-Person Household | 2,965 (45.4%) | 3,568 (54.6%) |
| 2-Person Household | 3,859 (70.3%) | 1,630 (29.7%) |
| 3-Person Household | 1,465 (64.6%) | 801 (35.3%) |
| 4+ Person Household | 1,693 (66.0%) | 871 (34.0%) |
| Total Housing Units | 9,982 (59.2%) | 6,870 (40.8%) |
Occupancy by Educational Attainment in Jefferson City
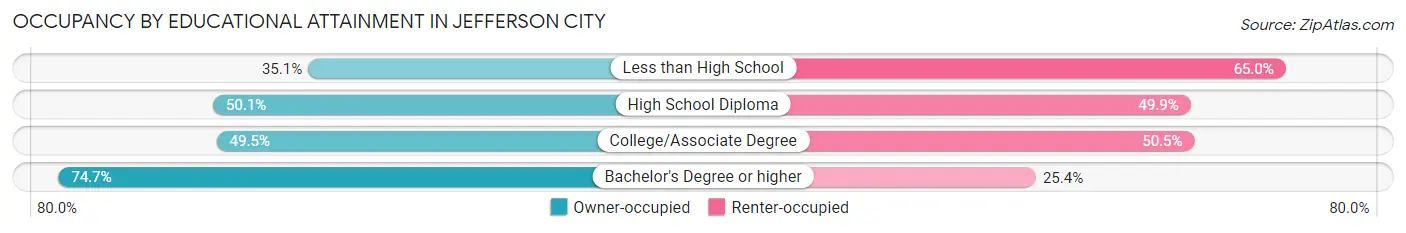
| Household Size | Owner-occupied | Renter-occupied |
| Less than High School | 360 (35.0%) | 667 (64.9%) |
| High School Diploma | 2,057 (50.1%) | 2,046 (49.9%) |
| College/Associate Degree | 2,340 (49.5%) | 2,383 (50.5%) |
| Bachelor's Degree or higher | 5,225 (74.7%) | 1,774 (25.4%) |
Occupancy by Age of Householder in Jefferson City
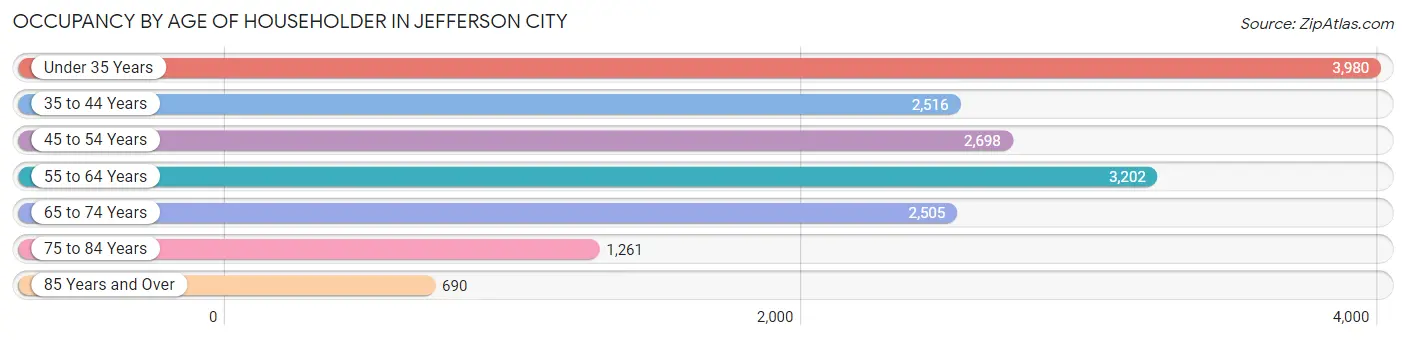
| Age Bracket | # Households | % Households |
| Under 35 Years | 3,980 | 23.6% |
| 35 to 44 Years | 2,516 | 14.9% |
| 45 to 54 Years | 2,698 | 16.0% |
| 55 to 64 Years | 3,202 | 19.0% |
| 65 to 74 Years | 2,505 | 14.9% |
| 75 to 84 Years | 1,261 | 7.5% |
| 85 Years and Over | 690 | 4.1% |
| Total | 16,852 | 100.0% |
Housing Finances in Jefferson City
Median Income by Occupancy in Jefferson City
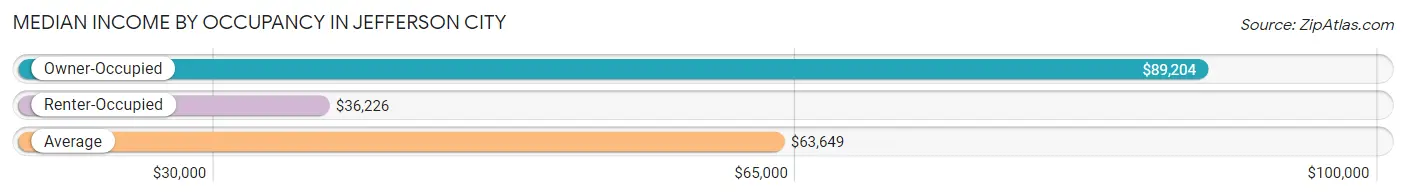
| Occupancy Type | # Households | Median Income |
| Owner-Occupied | 9,982 (59.2%) | $89,204 |
| Renter-Occupied | 6,870 (40.8%) | $36,226 |
| Average | 16,852 (100.0%) | $63,649 |
Occupancy by Householder Income Bracket in Jefferson City
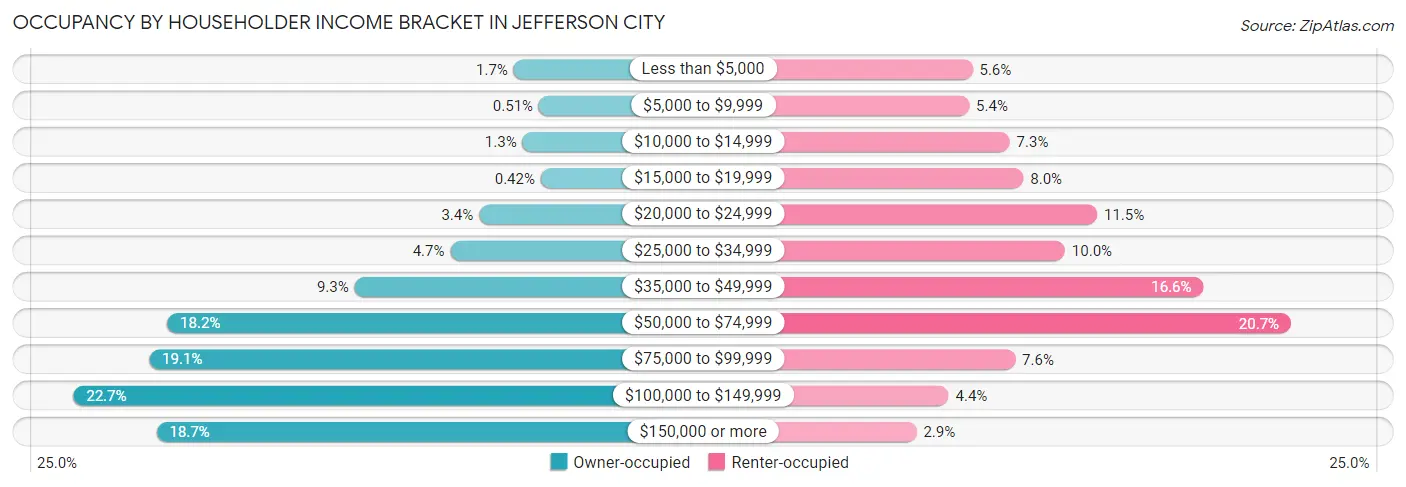
| Income Bracket | Owner-occupied | Renter-occupied |
| Less than $5,000 | 171 (1.7%) | 383 (5.6%) |
| $5,000 to $9,999 | 51 (0.5%) | 372 (5.4%) |
| $10,000 to $14,999 | 129 (1.3%) | 504 (7.3%) |
| $15,000 to $19,999 | 42 (0.4%) | 549 (8.0%) |
| $20,000 to $24,999 | 335 (3.4%) | 790 (11.5%) |
| $25,000 to $34,999 | 472 (4.7%) | 685 (10.0%) |
| $35,000 to $49,999 | 927 (9.3%) | 1,138 (16.6%) |
| $50,000 to $74,999 | 1,818 (18.2%) | 1,424 (20.7%) |
| $75,000 to $99,999 | 1,904 (19.1%) | 522 (7.6%) |
| $100,000 to $149,999 | 2,264 (22.7%) | 304 (4.4%) |
| $150,000 or more | 1,869 (18.7%) | 199 (2.9%) |
| Total | 9,982 (100.0%) | 6,870 (100.0%) |
Monthly Housing Cost Tiers in Jefferson City
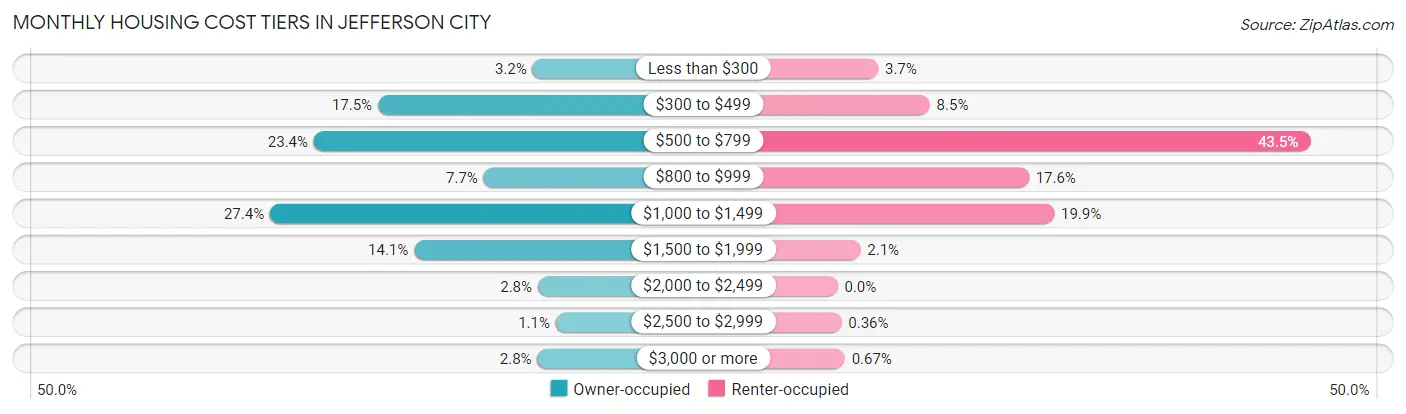
| Monthly Cost | Owner-occupied | Renter-occupied |
| Less than $300 | 322 (3.2%) | 257 (3.7%) |
| $300 to $499 | 1,744 (17.5%) | 583 (8.5%) |
| $500 to $799 | 2,333 (23.4%) | 2,990 (43.5%) |
| $800 to $999 | 773 (7.7%) | 1,210 (17.6%) |
| $1,000 to $1,499 | 2,736 (27.4%) | 1,370 (19.9%) |
| $1,500 to $1,999 | 1,411 (14.1%) | 145 (2.1%) |
| $2,000 to $2,499 | 275 (2.8%) | 0 (0.0%) |
| $2,500 to $2,999 | 110 (1.1%) | 25 (0.4%) |
| $3,000 or more | 278 (2.8%) | 46 (0.7%) |
| Total | 9,982 (100.0%) | 6,870 (100.0%) |
Physical Housing Characteristics in Jefferson City
Housing Structures in Jefferson City

| Structure Type | # Housing Units | % Housing Units |
| Single Unit, Detached | 11,004 | 65.3% |
| Single Unit, Attached | 517 | 3.1% |
| 2 Unit Apartments | 1,000 | 5.9% |
| 3 or 4 Unit Apartments | 1,423 | 8.4% |
| 5 to 9 Unit Apartments | 944 | 5.6% |
| 10 or more Apartments | 1,749 | 10.4% |
| Mobile Home / Other | 215 | 1.3% |
| Total | 16,852 | 100.0% |
Housing Structures by Occupancy in Jefferson City
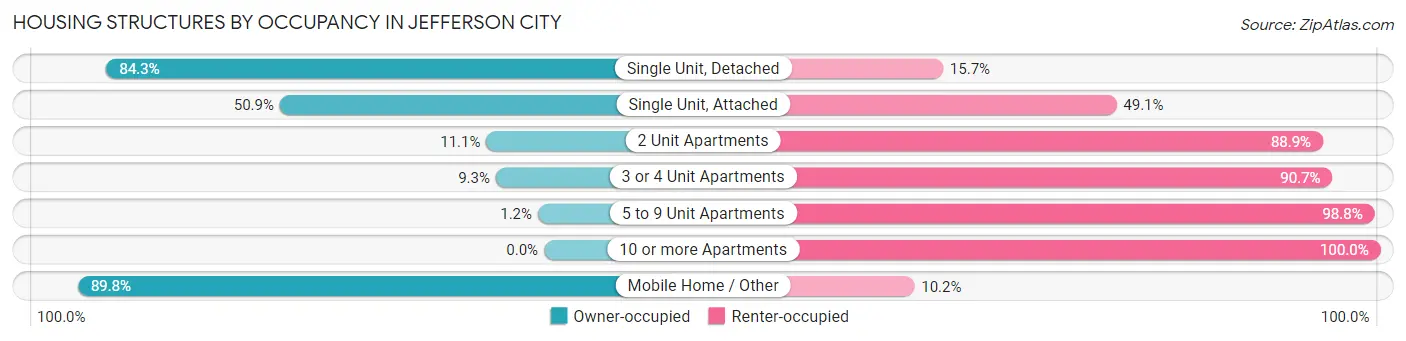
| Structure Type | Owner-occupied | Renter-occupied |
| Single Unit, Detached | 9,272 (84.3%) | 1,732 (15.7%) |
| Single Unit, Attached | 263 (50.9%) | 254 (49.1%) |
| 2 Unit Apartments | 111 (11.1%) | 889 (88.9%) |
| 3 or 4 Unit Apartments | 132 (9.3%) | 1,291 (90.7%) |
| 5 to 9 Unit Apartments | 11 (1.2%) | 933 (98.8%) |
| 10 or more Apartments | 0 (0.0%) | 1,749 (100.0%) |
| Mobile Home / Other | 193 (89.8%) | 22 (10.2%) |
| Total | 9,982 (59.2%) | 6,870 (40.8%) |
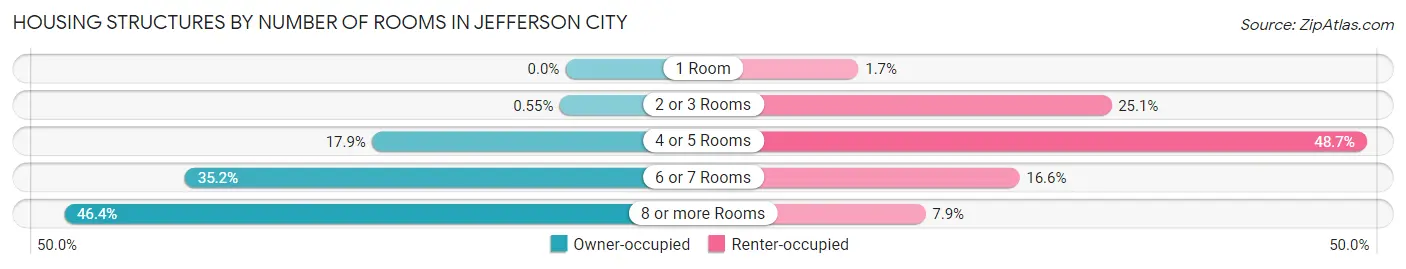
Housing Structures by Number of Rooms in Jefferson City
| Number of Rooms | Owner-occupied | Renter-occupied |
| 1 Room | 0 (0.0%) | 117 (1.7%) |
| 2 or 3 Rooms | 55 (0.5%) | 1,724 (25.1%) |
| 4 or 5 Rooms | 1,787 (17.9%) | 3,346 (48.7%) |
| 6 or 7 Rooms | 3,512 (35.2%) | 1,140 (16.6%) |
| 8 or more Rooms | 4,628 (46.4%) | 543 (7.9%) |
| Total | 9,982 (100.0%) | 6,870 (100.0%) |
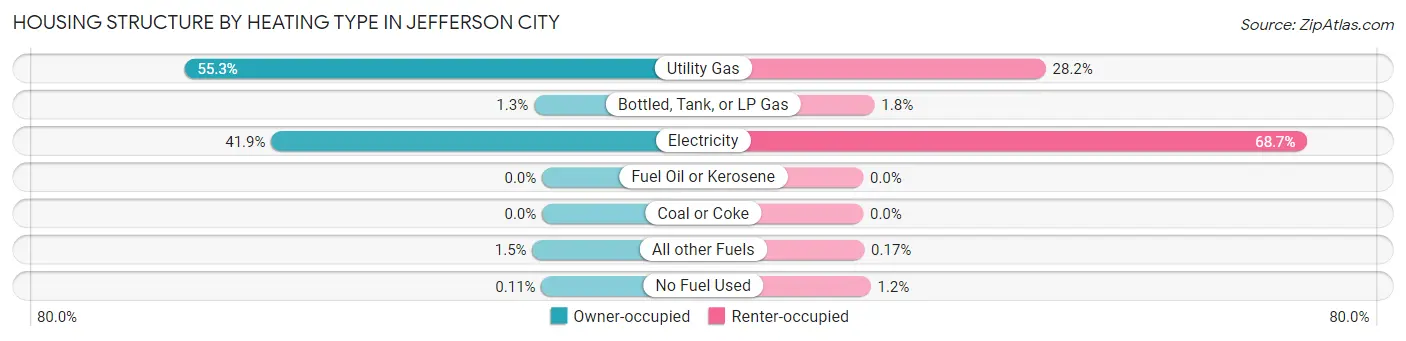
Housing Structure by Heating Type in Jefferson City
| Heating Type | Owner-occupied | Renter-occupied |
| Utility Gas | 5,519 (55.3%) | 1,939 (28.2%) |
| Bottled, Tank, or LP Gas | 125 (1.3%) | 121 (1.8%) |
| Electricity | 4,178 (41.9%) | 4,718 (68.7%) |
| Fuel Oil or Kerosene | 0 (0.0%) | 0 (0.0%) |
| Coal or Coke | 0 (0.0%) | 0 (0.0%) |
| All other Fuels | 149 (1.5%) | 12 (0.2%) |
| No Fuel Used | 11 (0.1%) | 80 (1.2%) |
| Total | 9,982 (100.0%) | 6,870 (100.0%) |
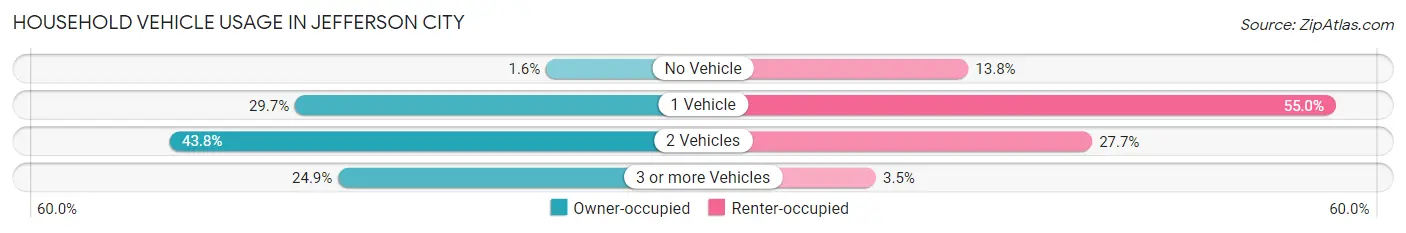
Household Vehicle Usage in Jefferson City
| Vehicles per Household | Owner-occupied | Renter-occupied |
| No Vehicle | 158 (1.6%) | 950 (13.8%) |
| 1 Vehicle | 2,966 (29.7%) | 3,777 (55.0%) |
| 2 Vehicles | 4,374 (43.8%) | 1,903 (27.7%) |
| 3 or more Vehicles | 2,484 (24.9%) | 240 (3.5%) |
| Total | 9,982 (100.0%) | 6,870 (100.0%) |
Real Estate & Mortgages in Jefferson City
Real Estate and Mortgage Overview in Jefferson City
| Characteristic | Without Mortgage | With Mortgage |
| Housing Units | 4,031 | 5,951 |
| Median Property Value | $196,900 | $184,900 |
| Median Household Income | $69,688 | $1,244 |
| Monthly Housing Costs | $498 | $278 |
| Real Estate Taxes | $1,788 | $94 |
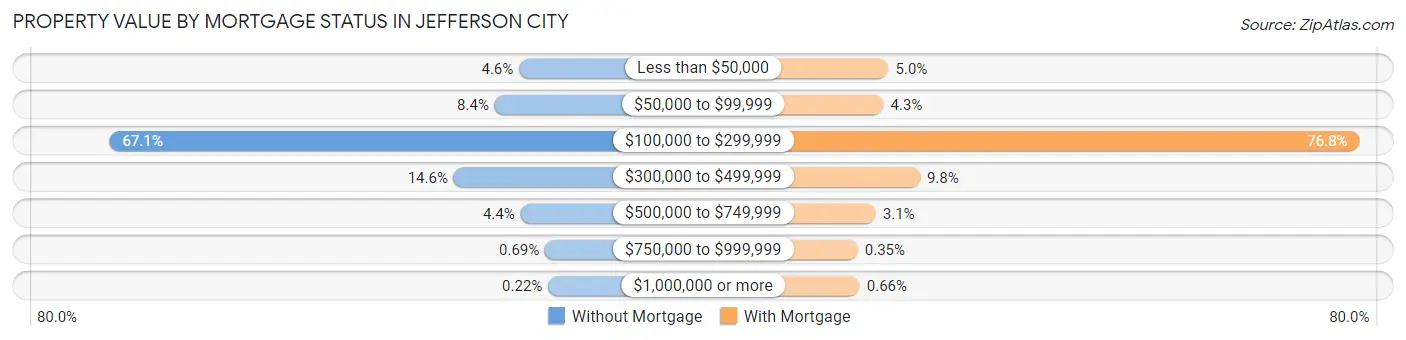
Property Value by Mortgage Status in Jefferson City
| Property Value | Without Mortgage | With Mortgage |
| Less than $50,000 | 187 (4.6%) | 300 (5.0%) |
| $50,000 to $99,999 | 337 (8.4%) | 254 (4.3%) |
| $100,000 to $299,999 | 2,703 (67.1%) | 4,569 (76.8%) |
| $300,000 to $499,999 | 589 (14.6%) | 584 (9.8%) |
| $500,000 to $749,999 | 178 (4.4%) | 184 (3.1%) |
| $750,000 to $999,999 | 28 (0.7%) | 21 (0.4%) |
| $1,000,000 or more | 9 (0.2%) | 39 (0.7%) |
| Total | 4,031 (100.0%) | 5,951 (100.0%) |
Household Income by Mortgage Status in Jefferson City
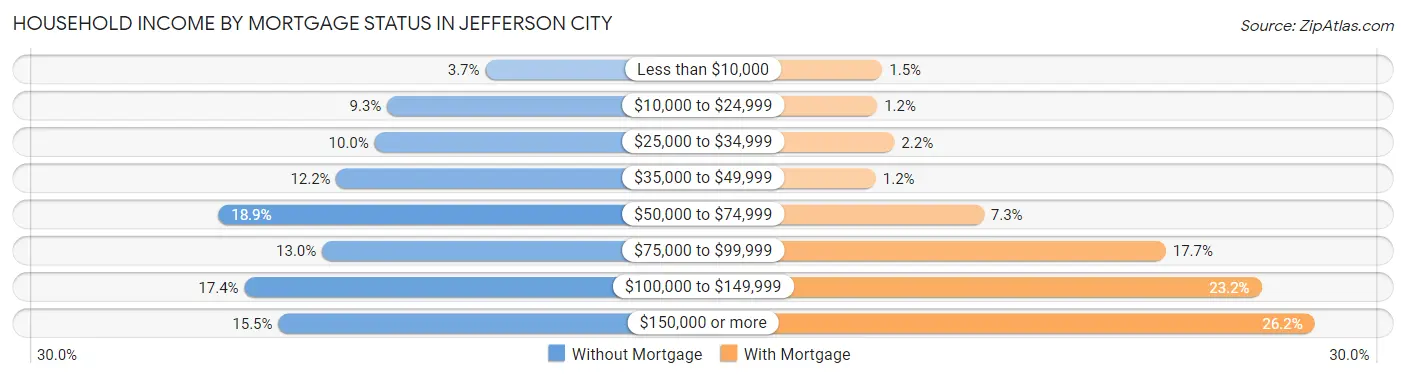
| Household Income | Without Mortgage | With Mortgage |
| Less than $10,000 | 148 (3.7%) | 91 (1.5%) |
| $10,000 to $24,999 | 374 (9.3%) | 74 (1.2%) |
| $25,000 to $34,999 | 403 (10.0%) | 132 (2.2%) |
| $35,000 to $49,999 | 491 (12.2%) | 69 (1.2%) |
| $50,000 to $74,999 | 763 (18.9%) | 436 (7.3%) |
| $75,000 to $99,999 | 524 (13.0%) | 1,055 (17.7%) |
| $100,000 to $149,999 | 703 (17.4%) | 1,380 (23.2%) |
| $150,000 or more | 625 (15.5%) | 1,561 (26.2%) |
| Total | 4,031 (100.0%) | 5,951 (100.0%) |
Property Value to Household Income Ratio in Jefferson City
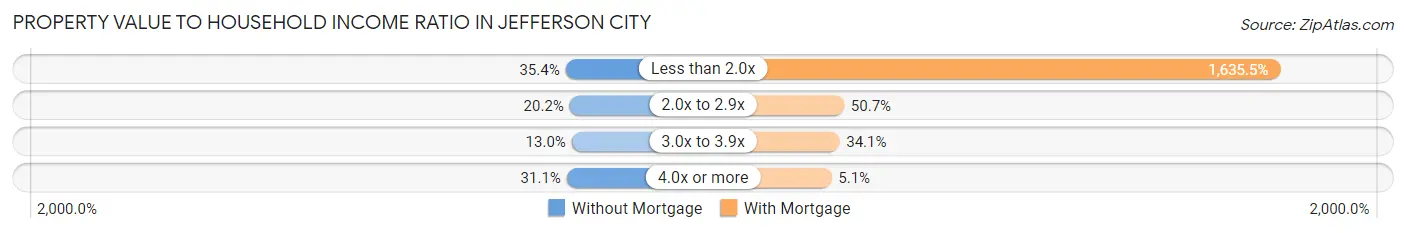
| Value-to-Income Ratio | Without Mortgage | With Mortgage |
| Less than 2.0x | 1,426 (35.4%) | 97,330 (1,635.5%) |
| 2.0x to 2.9x | 814 (20.2%) | 3,019 (50.7%) |
| 3.0x to 3.9x | 523 (13.0%) | 2,029 (34.1%) |
| 4.0x or more | 1,255 (31.1%) | 303 (5.1%) |
| Total | 4,031 (100.0%) | 5,951 (100.0%) |
Real Estate Taxes by Mortgage Status in Jefferson City
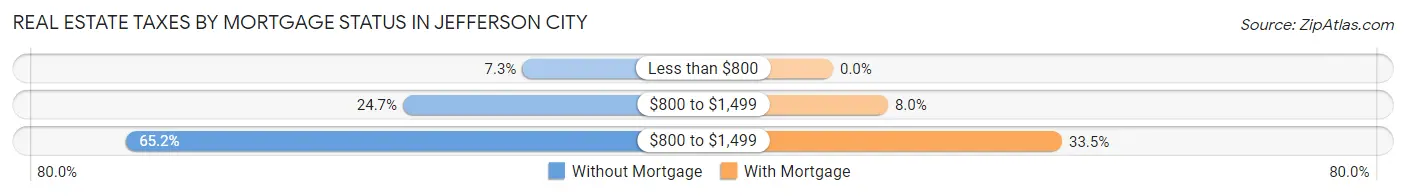
| Property Taxes | Without Mortgage | With Mortgage |
| Less than $800 | 294 (7.3%) | 0 (0.0%) |
| $800 to $1,499 | 997 (24.7%) | 478 (8.0%) |
| $800 to $1,499 | 2,626 (65.1%) | 1,991 (33.5%) |
| Total | 4,031 (100.0%) | 5,951 (100.0%) |
Health & Disability in Jefferson City
Health Insurance Coverage by Age in Jefferson City
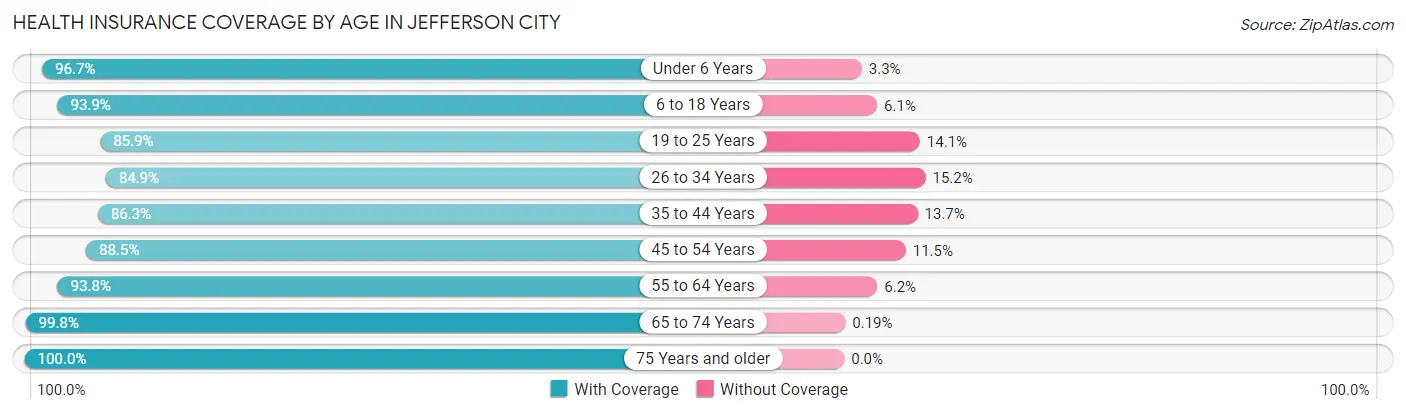
| Age Bracket | With Coverage | Without Coverage |
| Under 6 Years | 3,006 (96.7%) | 102 (3.3%) |
| 6 to 18 Years | 5,654 (93.9%) | 369 (6.1%) |
| 19 to 25 Years | 3,296 (85.9%) | 541 (14.1%) |
| 26 to 34 Years | 4,319 (84.9%) | 771 (15.1%) |
| 35 to 44 Years | 4,413 (86.3%) | 698 (13.7%) |
| 45 to 54 Years | 3,946 (88.5%) | 511 (11.5%) |
| 55 to 64 Years | 4,705 (93.8%) | 309 (6.2%) |
| 65 to 74 Years | 3,597 (99.8%) | 7 (0.2%) |
| 75 Years and older | 2,744 (100.0%) | 0 (0.0%) |
| Total | 35,680 (91.5%) | 3,308 (8.5%) |
Health Insurance Coverage by Citizenship Status in Jefferson City
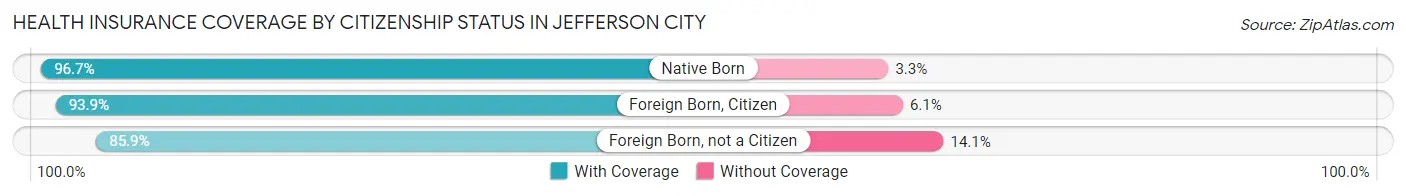
| Citizenship Status | With Coverage | Without Coverage |
| Native Born | 3,006 (96.7%) | 102 (3.3%) |
| Foreign Born, Citizen | 5,654 (93.9%) | 369 (6.1%) |
| Foreign Born, not a Citizen | 3,296 (85.9%) | 541 (14.1%) |
Health Insurance Coverage by Household Income in Jefferson City
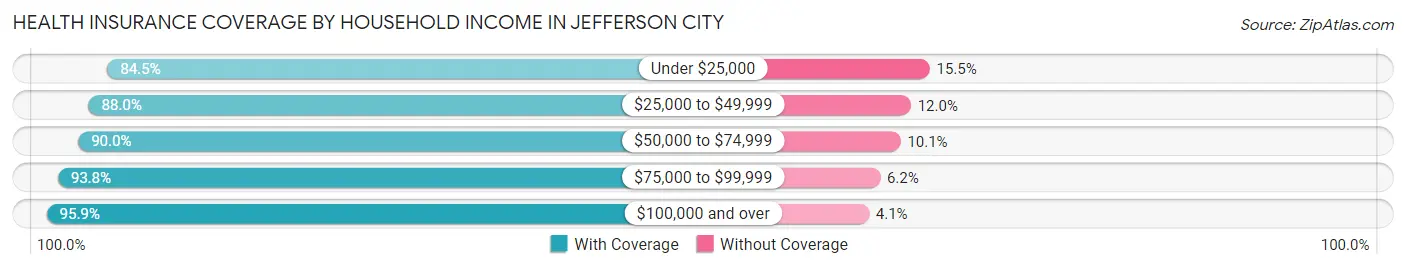
| Household Income | With Coverage | Without Coverage |
| Under $25,000 | 4,132 (84.5%) | 758 (15.5%) |
| $25,000 to $49,999 | 4,688 (88.0%) | 638 (12.0%) |
| $50,000 to $74,999 | 6,482 (89.9%) | 724 (10.1%) |
| $75,000 to $99,999 | 6,139 (93.8%) | 407 (6.2%) |
| $100,000 and over | 13,480 (95.9%) | 581 (4.1%) |
Public vs Private Health Insurance Coverage by Age in Jefferson City
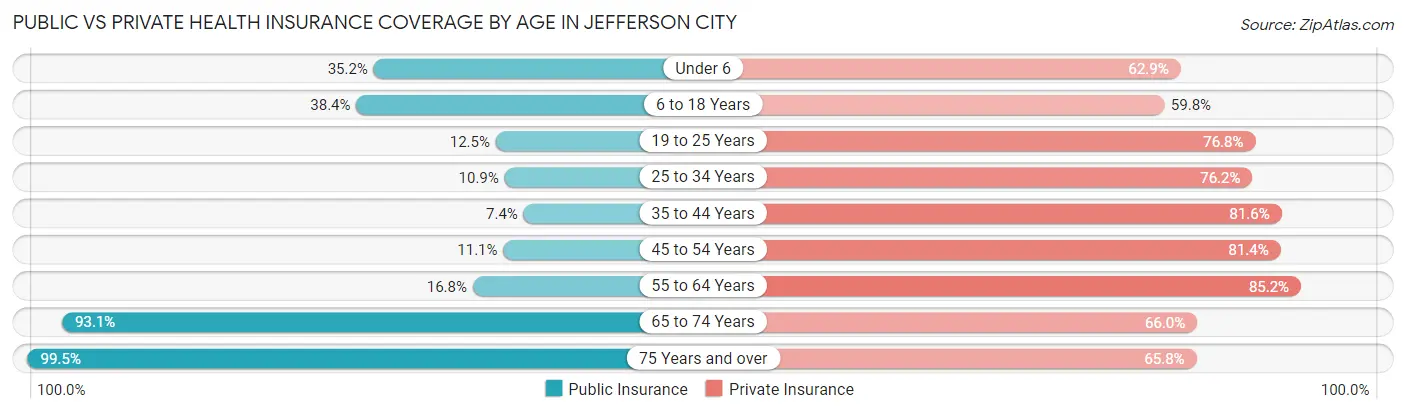
| Age Bracket | Public Insurance | Private Insurance |
| Under 6 | 1,094 (35.2%) | 1,954 (62.9%) |
| 6 to 18 Years | 2,314 (38.4%) | 3,601 (59.8%) |
| 19 to 25 Years | 481 (12.5%) | 2,945 (76.7%) |
| 25 to 34 Years | 555 (10.9%) | 3,878 (76.2%) |
| 35 to 44 Years | 376 (7.4%) | 4,171 (81.6%) |
| 45 to 54 Years | 496 (11.1%) | 3,630 (81.4%) |
| 55 to 64 Years | 843 (16.8%) | 4,273 (85.2%) |
| 65 to 74 Years | 3,354 (93.1%) | 2,377 (65.9%) |
| 75 Years and over | 2,729 (99.5%) | 1,806 (65.8%) |
| Total | 12,242 (31.4%) | 28,635 (73.5%) |
Disability Status by Sex by Age in Jefferson City
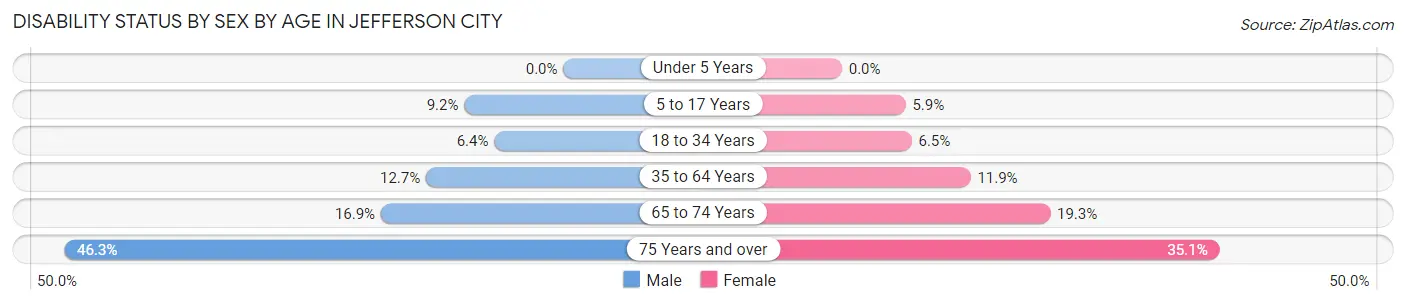
| Age Bracket | Male | Female |
| Under 5 Years | 0 (0.0%) | 0 (0.0%) |
| 5 to 17 Years | 269 (9.2%) | 181 (5.9%) |
| 18 to 34 Years | 301 (6.4%) | 307 (6.5%) |
| 35 to 64 Years | 909 (12.7%) | 889 (11.9%) |
| 65 to 74 Years | 272 (16.9%) | 386 (19.3%) |
| 75 Years and over | 469 (46.3%) | 607 (35.0%) |
Disability Class by Sex by Age in Jefferson City
Disability Class: Hearing Difficulty
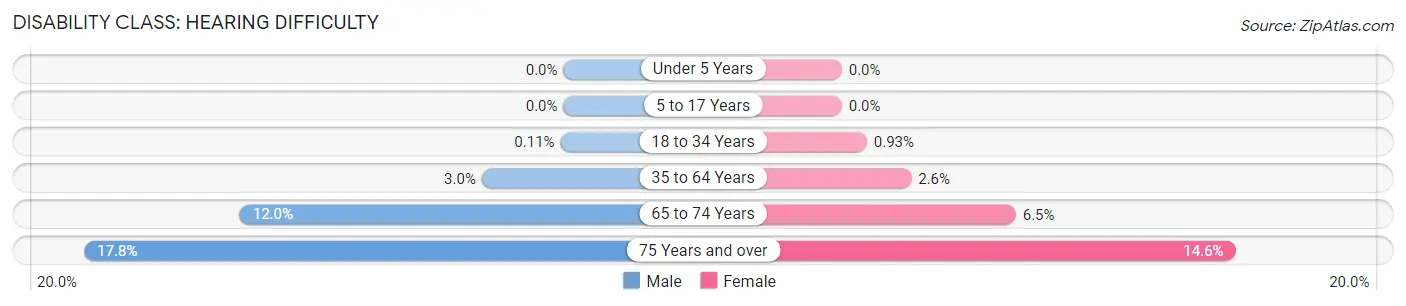
| Age Bracket | Male | Female |
| Under 5 Years | 0 (0.0%) | 0 (0.0%) |
| 5 to 17 Years | 0 (0.0%) | 0 (0.0%) |
| 18 to 34 Years | 5 (0.1%) | 44 (0.9%) |
| 35 to 64 Years | 216 (3.0%) | 192 (2.6%) |
| 65 to 74 Years | 193 (12.0%) | 129 (6.5%) |
| 75 Years and over | 180 (17.8%) | 253 (14.6%) |
Disability Class: Vision Difficulty
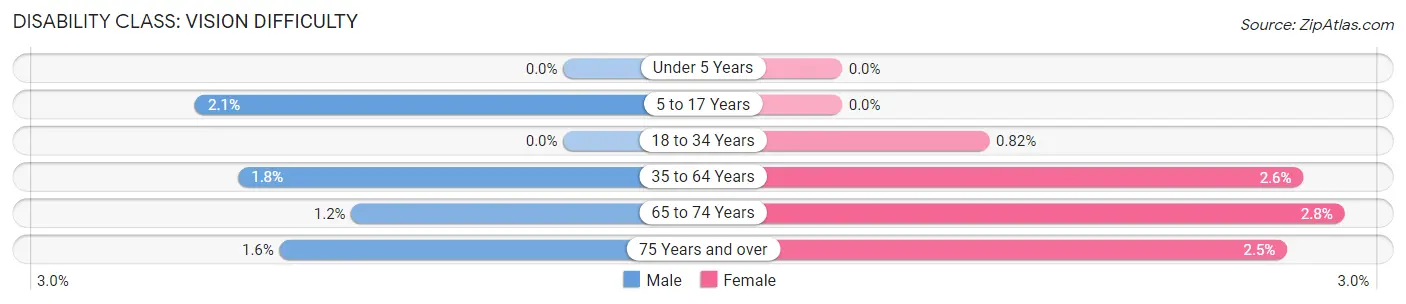
| Age Bracket | Male | Female |
| Under 5 Years | 0 (0.0%) | 0 (0.0%) |
| 5 to 17 Years | 60 (2.1%) | 0 (0.0%) |
| 18 to 34 Years | 0 (0.0%) | 39 (0.8%) |
| 35 to 64 Years | 129 (1.8%) | 191 (2.6%) |
| 65 to 74 Years | 19 (1.2%) | 56 (2.8%) |
| 75 Years and over | 16 (1.6%) | 43 (2.5%) |
Disability Class: Cognitive Difficulty
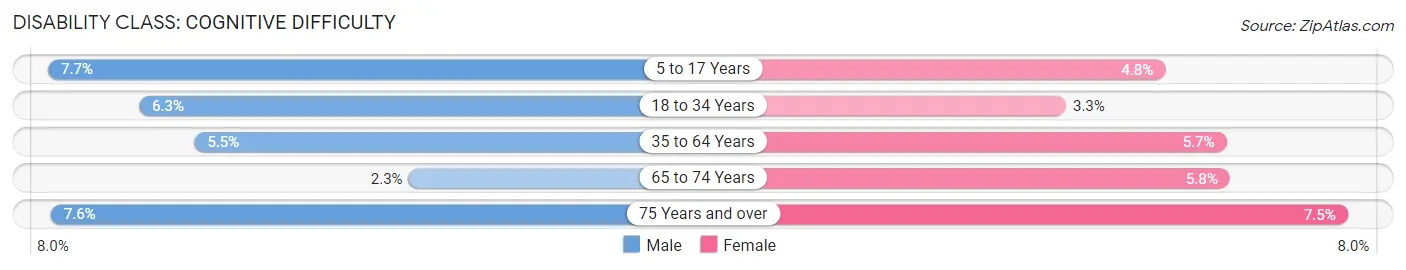
| Age Bracket | Male | Female |
| 5 to 17 Years | 224 (7.6%) | 147 (4.8%) |
| 18 to 34 Years | 296 (6.3%) | 158 (3.3%) |
| 35 to 64 Years | 391 (5.5%) | 425 (5.7%) |
| 65 to 74 Years | 37 (2.3%) | 115 (5.8%) |
| 75 Years and over | 77 (7.6%) | 130 (7.5%) |
Disability Class: Ambulatory Difficulty
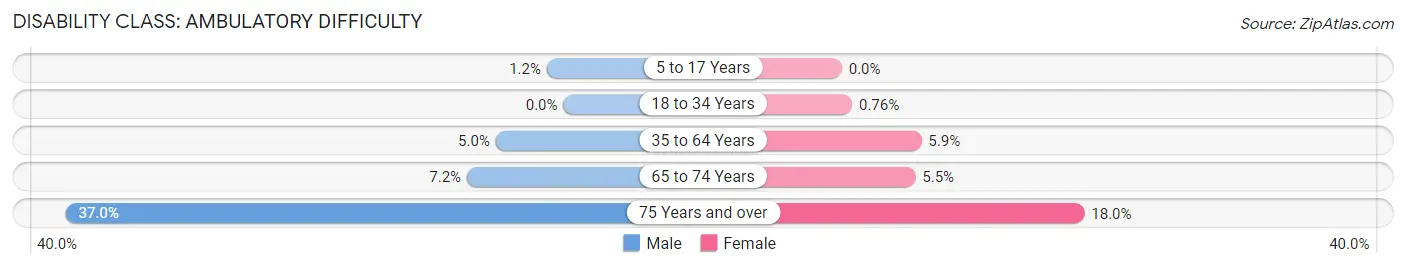
| Age Bracket | Male | Female |
| 5 to 17 Years | 36 (1.2%) | 0 (0.0%) |
| 18 to 34 Years | 0 (0.0%) | 36 (0.8%) |
| 35 to 64 Years | 358 (5.0%) | 440 (5.9%) |
| 65 to 74 Years | 115 (7.2%) | 109 (5.5%) |
| 75 Years and over | 374 (37.0%) | 312 (18.0%) |
Disability Class: Self-Care Difficulty
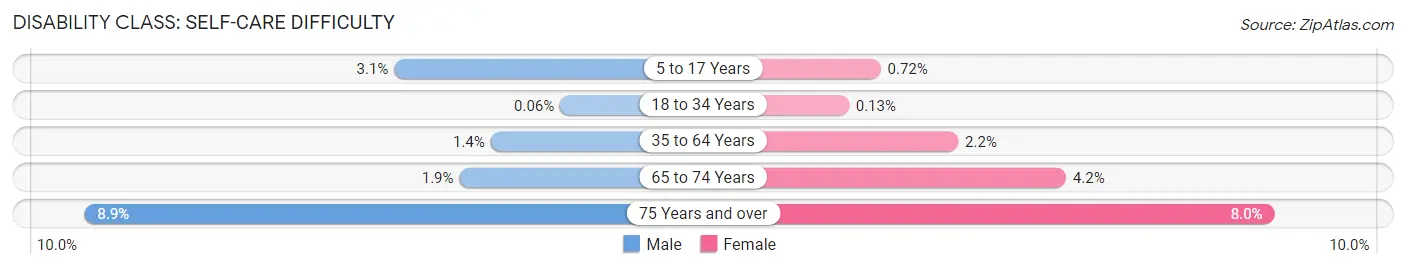
| Age Bracket | Male | Female |
| 5 to 17 Years | 92 (3.1%) | 22 (0.7%) |
| 18 to 34 Years | 3 (0.1%) | 6 (0.1%) |
| 35 to 64 Years | 96 (1.3%) | 161 (2.2%) |
| 65 to 74 Years | 31 (1.9%) | 83 (4.2%) |
| 75 Years and over | 90 (8.9%) | 139 (8.0%) |
Technology Access in Jefferson City
Computing Device Access in Jefferson City
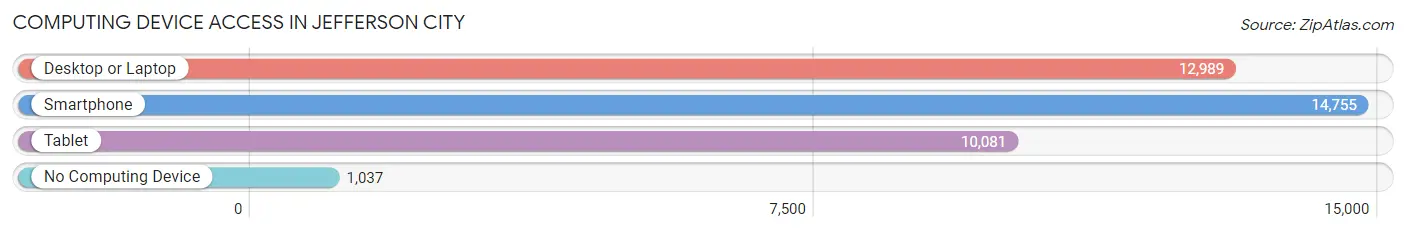
| Device Type | # Households | % Households |
| Desktop or Laptop | 12,989 | 77.1% |
| Smartphone | 14,755 | 87.6% |
| Tablet | 10,081 | 59.8% |
| No Computing Device | 1,037 | 6.1% |
| Total | 16,852 | 100.0% |
Internet Access in Jefferson City
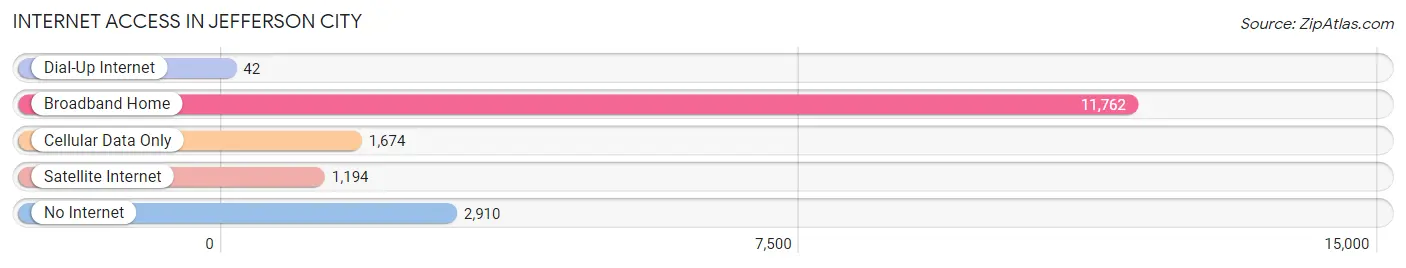
| Internet Type | # Households | % Households |
| Dial-Up Internet | 42 | 0.3% |
| Broadband Home | 11,762 | 69.8% |
| Cellular Data Only | 1,674 | 9.9% |
| Satellite Internet | 1,194 | 7.1% |
| No Internet | 2,910 | 17.3% |
| Total | 16,852 | 100.0% |
Jefferson City Summary
Jefferson City, Missouri is the capital of the state of Missouri and the county seat of Cole County. It is located on the northern edge of the Ozark Plateau on the southern bank of the Missouri River, near the geographic center of the state. The city has a population of 43,079, according to the 2019 U.S. Census, making it the 15th most populous city in the state.
History
Jefferson City was founded in 1821 by Thomas Jefferson, who named it after himself. It was chosen as the state capital in 1826, and the first state capitol building was completed in 1836. The city was incorporated in 1839 and has since grown to become the state’s political and cultural center.
Geography
Jefferson City is located in the center of the state of Missouri, on the northern edge of the Ozark Plateau. It is situated on the southern bank of the Missouri River, near the geographic center of the state. The city has a total area of 24.2 square miles, of which 23.7 square miles is land and 0.5 square miles is water.
Economy
Jefferson City’s economy is largely based on government and public services, with the state government being the largest employer in the city. Other major employers include St. Mary’s Health Center, Lincoln University, and the Missouri Department of Corrections. The city also has a growing tourism industry, with attractions such as the Missouri State Capitol, the Missouri State Museum, and the Missouri State Penitentiary.
Demographics
According to the 2019 U.S. Census, Jefferson City has a population of 43,079. The racial makeup of the city is 79.2% White, 14.2% African American, 0.5% Native American, 1.7% Asian, 0.1% Pacific Islander, 1.3% from other races, and 2.9% from two or more races. The median household income is $45,945, and the median family income is $54,945. The per capita income is $25,945.
Jefferson City is a diverse and vibrant city with a rich history and a bright future. It is home to a variety of businesses, attractions, and cultural institutions, and is a great place to live, work, and play.
Common Questions
What is Per Capita Income in Jefferson City?
Per Capita income in Jefferson City is $33,561.
What is the Median Family Income in Jefferson City?
Median Family Income in Jefferson City is $89,047.
What is the Median Household income in Jefferson City?
Median Household Income in Jefferson City is $63,649.
What is Income or Wage Gap in Jefferson City?
Income or Wage Gap in Jefferson City is 28.5%.
Women in Jefferson City earn 71.5 cents for every dollar earned by a man.
What is Family Income Deficit in Jefferson City?
Family Income Deficit in Jefferson City is $10,357.
Families that are below poverty line in Jefferson City earn $10,357 less on average than the poverty threshold level.
What is Inequality or Gini Index in Jefferson City?
Inequality or Gini Index in Jefferson City is 0.43.
What is the Total Population of Jefferson City?
Total Population of Jefferson City is 42,644.
What is the Total Male Population of Jefferson City?
Total Male Population of Jefferson City is 21,922.
What is the Total Female Population of Jefferson City?
Total Female Population of Jefferson City is 20,722.
What is the Ratio of Males per 100 Females in Jefferson City?
There are 105.79 Males per 100 Females in Jefferson City.
What is the Ratio of Females per 100 Males in Jefferson City?
There are 94.53 Females per 100 Males in Jefferson City.
What is the Median Population Age in Jefferson City?
Median Population Age in Jefferson City is 38.5 Years.
What is the Average Family Size in Jefferson City
Average Family Size in Jefferson City is 3.0 People.
What is the Average Household Size in Jefferson City
Average Household Size in Jefferson City is 2.3 People.
How Large is the Labor Force in Jefferson City?
There are 21,344 People in the Labor Forcein in Jefferson City.
What is the Percentage of People in the Labor Force in Jefferson City?
61.0% of People are in the Labor Force in Jefferson City.
What is the Unemployment Rate in Jefferson City?
Unemployment Rate in Jefferson City is 2.9%.