Fountain, MN Map & Demographics
Fountain Map
Fountain Overview
$33,380
PER CAPITA INCOME
$90,893
AVG FAMILY INCOME
$71,875
AVG HOUSEHOLD INCOME
16.2%
WAGE / INCOME GAP [ % ]
83.8¢/ $1
WAGE / INCOME GAP [ $ ]
0.36
INEQUALITY / GINI INDEX
484
TOTAL POPULATION
268
MALE POPULATION
216
FEMALE POPULATION
124.07
MALES / 100 FEMALES
80.60
FEMALES / 100 MALES
40.4
MEDIAN AGE
3.1
AVG FAMILY SIZE
2.4
AVG HOUSEHOLD SIZE
313
LABOR FORCE [ PEOPLE ]
80.1%
PERCENT IN LABOR FORCE
7.7%
UNEMPLOYMENT RATE
Fountain Zip Codes
Fountain Area Codes
Income in Fountain
Income Overview in Fountain
Per Capita Income in Fountain is $33,380, while median incomes of families and households are $90,893 and $71,875 respectively.
| Characteristic | Number | Measure |
| Per Capita Income | 484 | $33,380 |
| Median Family Income | 133 | $90,893 |
| Mean Family Income | 133 | $95,816 |
| Median Household Income | 199 | $71,875 |
| Mean Household Income | 199 | $78,331 |
| Income Deficit | 133 | $0 |
| Wage / Income Gap (%) | 484 | 16.16% |
| Wage / Income Gap ($) | 484 | 83.84¢ per $1 |
| Gini / Inequality Index | 484 | 0.36 |
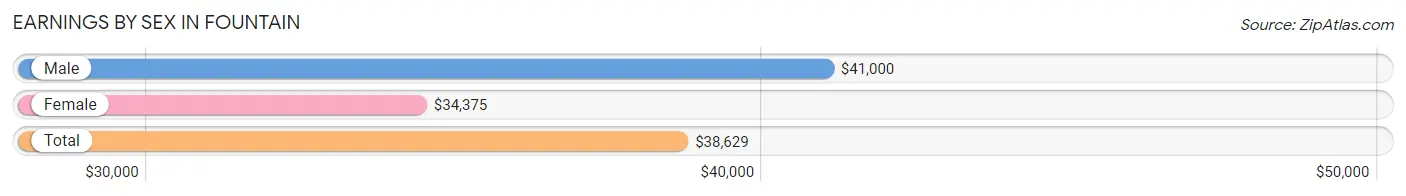
Earnings by Sex in Fountain
Average Earnings in Fountain are $38,629, $41,000 for men and $34,375 for women, a difference of 16.2%.
| Sex | Number | Average Earnings |
| Male | 170 (53.5%) | $41,000 |
| Female | 148 (46.5%) | $34,375 |
| Total | 318 (100.0%) | $38,629 |
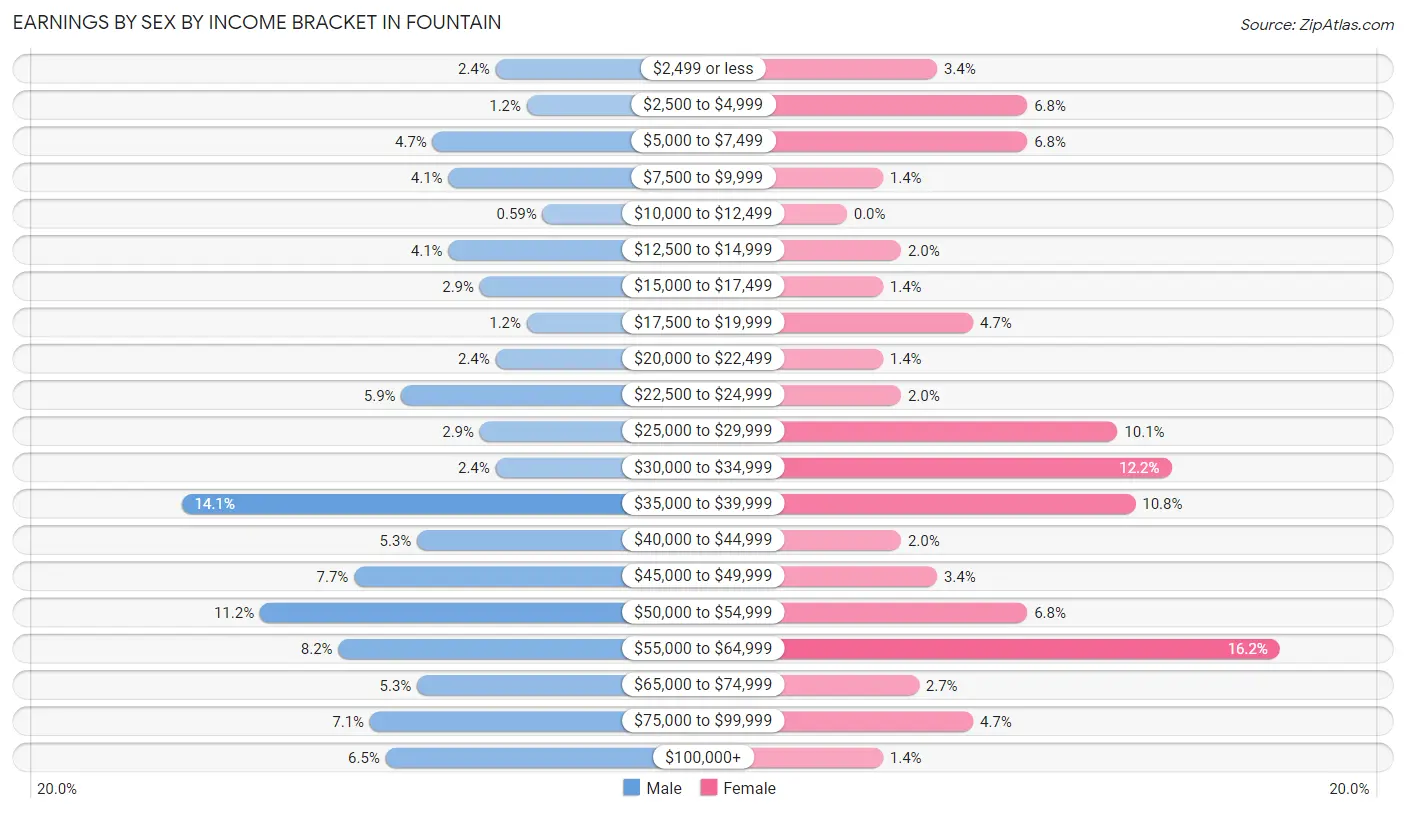
Earnings by Sex by Income Bracket in Fountain
The most common earnings brackets in Fountain are $35,000 to $39,999 for men (24 | 14.1%) and $55,000 to $64,999 for women (24 | 16.2%).
| Income | Male | Female |
| $2,499 or less | 4 (2.4%) | 5 (3.4%) |
| $2,500 to $4,999 | 2 (1.2%) | 10 (6.8%) |
| $5,000 to $7,499 | 8 (4.7%) | 10 (6.8%) |
| $7,500 to $9,999 | 7 (4.1%) | 2 (1.3%) |
| $10,000 to $12,499 | 1 (0.6%) | 0 (0.0%) |
| $12,500 to $14,999 | 7 (4.1%) | 3 (2.0%) |
| $15,000 to $17,499 | 5 (2.9%) | 2 (1.3%) |
| $17,500 to $19,999 | 2 (1.2%) | 7 (4.7%) |
| $20,000 to $22,499 | 4 (2.4%) | 2 (1.3%) |
| $22,500 to $24,999 | 10 (5.9%) | 3 (2.0%) |
| $25,000 to $29,999 | 5 (2.9%) | 15 (10.1%) |
| $30,000 to $34,999 | 4 (2.4%) | 18 (12.2%) |
| $35,000 to $39,999 | 24 (14.1%) | 16 (10.8%) |
| $40,000 to $44,999 | 9 (5.3%) | 3 (2.0%) |
| $45,000 to $49,999 | 13 (7.6%) | 5 (3.4%) |
| $50,000 to $54,999 | 19 (11.2%) | 10 (6.8%) |
| $55,000 to $64,999 | 14 (8.2%) | 24 (16.2%) |
| $65,000 to $74,999 | 9 (5.3%) | 4 (2.7%) |
| $75,000 to $99,999 | 12 (7.1%) | 7 (4.7%) |
| $100,000+ | 11 (6.5%) | 2 (1.3%) |
| Total | 170 (100.0%) | 148 (100.0%) |
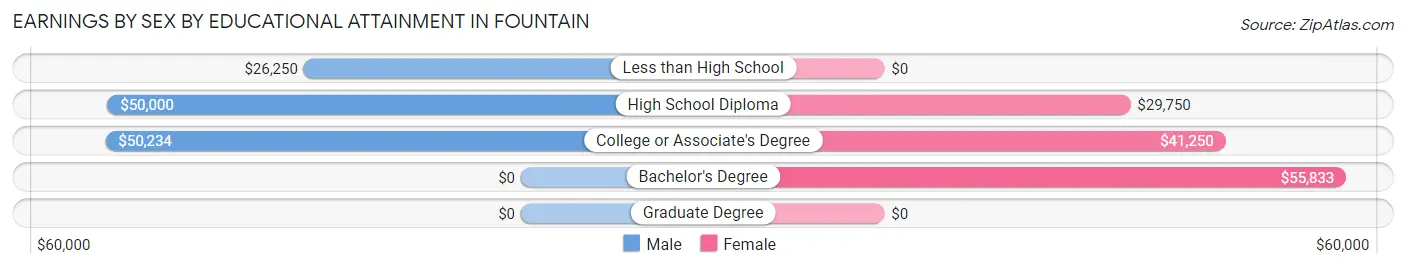
Earnings by Sex by Educational Attainment in Fountain
Average earnings in Fountain are $44,688 for men and $38,333 for women, a difference of 14.2%. Men with an educational attainment of college or associate's degree enjoy the highest average annual earnings of $50,234, while those with less than high school education earn the least with $26,250. Women with an educational attainment of bachelor's degree earn the most with the average annual earnings of $55,833, while those with high school diploma education have the smallest earnings of $29,750.
| Educational Attainment | Male Income | Female Income |
| Less than High School | $26,250 | $0 |
| High School Diploma | $50,000 | $29,750 |
| College or Associate's Degree | $50,234 | $41,250 |
| Bachelor's Degree | - | - |
| Graduate Degree | - | - |
| Total | $44,688 | $38,333 |
Family Income in Fountain
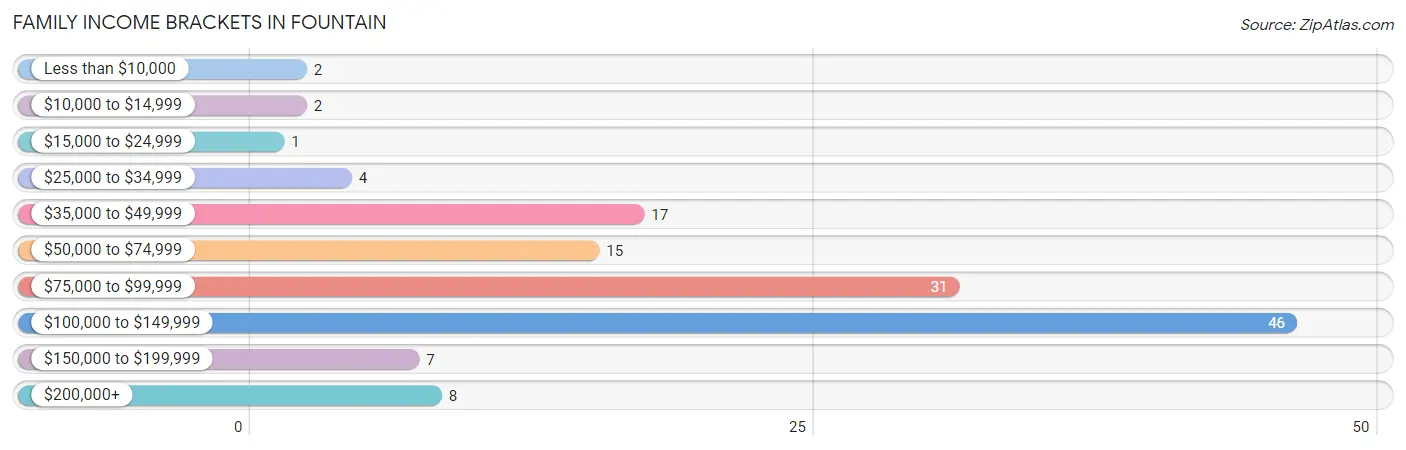
Family Income Brackets in Fountain
According to the Fountain family income data, there are 46 families falling into the $100,000 to $149,999 income range, which is the most common income bracket and makes up 34.6% of all families. Conversely, the $15,000 to $24,999 income bracket is the least frequent group with only 1 families (0.7%) belonging to this category.
| Income Bracket | # Families | % Families |
| Less than $10,000 | 2 | 1.5% |
| $10,000 to $14,999 | 2 | 1.5% |
| $15,000 to $24,999 | 1 | 0.8% |
| $25,000 to $34,999 | 4 | 3.0% |
| $35,000 to $49,999 | 17 | 12.8% |
| $50,000 to $74,999 | 15 | 11.3% |
| $75,000 to $99,999 | 31 | 23.3% |
| $100,000 to $149,999 | 46 | 34.6% |
| $150,000 to $199,999 | 7 | 5.3% |
| $200,000+ | 8 | 6.0% |
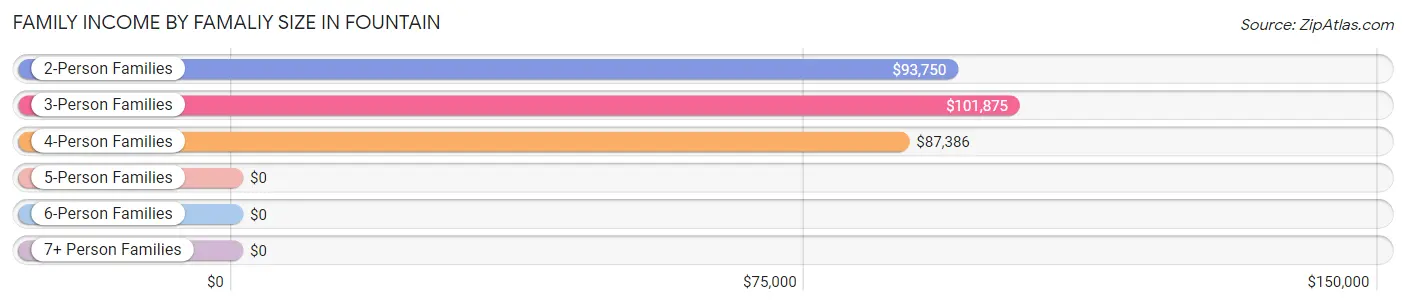
Family Income by Famaliy Size in Fountain
3-person families (15 | 11.3%) account for the highest median family income in Fountain with $101,875 per family, while 2-person families (69 | 51.9%) have the highest median income of $46,875 per family member.
| Income Bracket | # Families | Median Income |
| 2-Person Families | 69 (51.9%) | $93,750 |
| 3-Person Families | 15 (11.3%) | $101,875 |
| 4-Person Families | 39 (29.3%) | $87,386 |
| 5-Person Families | 8 (6.0%) | $0 |
| 6-Person Families | 2 (1.5%) | $0 |
| 7+ Person Families | 0 (0.0%) | $0 |
| Total | 133 (100.0%) | $90,893 |
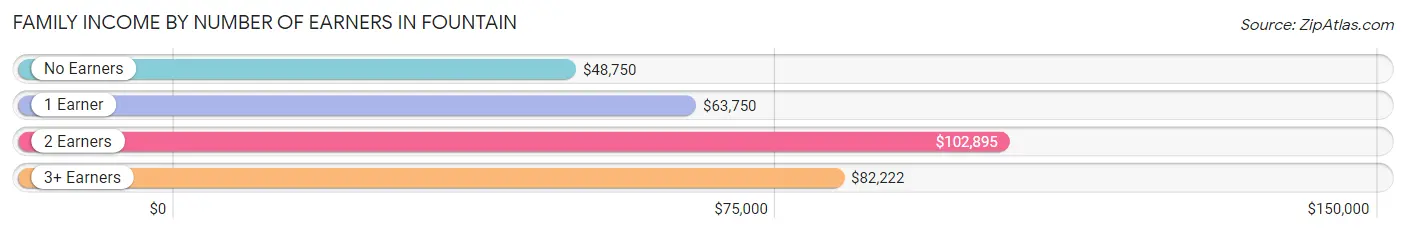
Family Income by Number of Earners in Fountain
The median family income in Fountain is $90,893, with families comprising 2 earners (72) having the highest median family income of $102,895, while families with no earners (13) have the lowest median family income of $48,750, accounting for 54.1% and 9.8% of families, respectively.
| Number of Earners | # Families | Median Income |
| No Earners | 13 (9.8%) | $48,750 |
| 1 Earner | 22 (16.5%) | $63,750 |
| 2 Earners | 72 (54.1%) | $102,895 |
| 3+ Earners | 26 (19.6%) | $82,222 |
| Total | 133 (100.0%) | $90,893 |
Household Income in Fountain
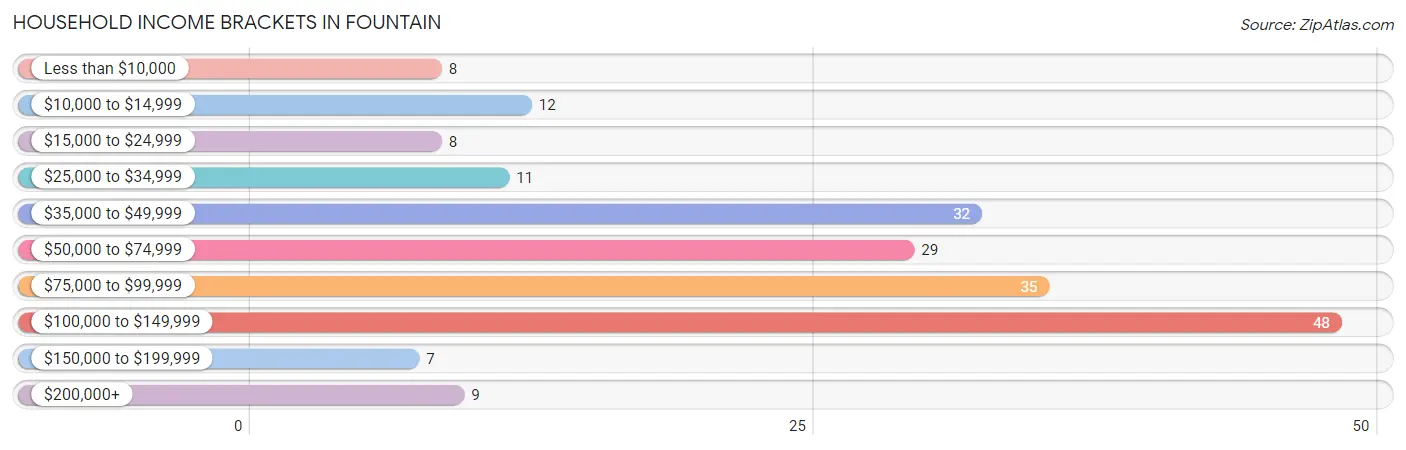
Household Income Brackets in Fountain
With 48 households falling in the category, the $100,000 to $149,999 income range is the most frequent in Fountain, accounting for 24.1% of all households. In contrast, only 7 households (3.5%) fall into the $150,000 to $199,999 income bracket, making it the least populous group.
| Income Bracket | # Households | % Households |
| Less than $10,000 | 8 | 4.0% |
| $10,000 to $14,999 | 12 | 6.0% |
| $15,000 to $24,999 | 8 | 4.0% |
| $25,000 to $34,999 | 11 | 5.5% |
| $35,000 to $49,999 | 32 | 16.1% |
| $50,000 to $74,999 | 29 | 14.6% |
| $75,000 to $99,999 | 35 | 17.6% |
| $100,000 to $149,999 | 48 | 24.1% |
| $150,000 to $199,999 | 7 | 3.5% |
| $200,000+ | 9 | 4.5% |
Household Income by Householder Age in Fountain
The median household income in Fountain is $71,875, with the highest median household income of $93,750 found in the 45 to 64 years age bracket for the primary householder. A total of 63 households (31.7%) fall into this category. Meanwhile, the 65+ years age bracket for the primary householder has the lowest median household income of $46,875, with 56 households (28.1%) in this group.
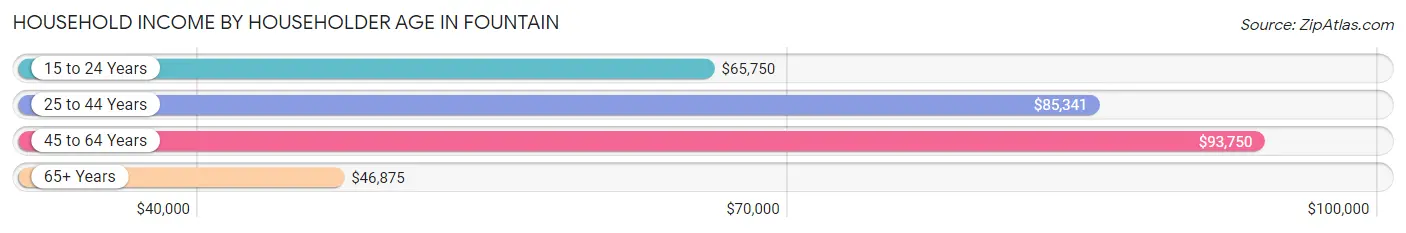
| Income Bracket | # Households | Median Income |
| 15 to 24 Years | 7 (3.5%) | $65,750 |
| 25 to 44 Years | 73 (36.7%) | $85,341 |
| 45 to 64 Years | 63 (31.7%) | $93,750 |
| 65+ Years | 56 (28.1%) | $46,875 |
| Total | 199 (100.0%) | $71,875 |
Poverty in Fountain
Income Below Poverty by Sex and Age in Fountain
With 7.1% poverty level for males and 5.1% for females among the residents of Fountain, 65 to 74 year old males and 15 year old females are the most vulnerable to poverty, with 5 males (21.7%) and 2 females (40.0%) in their respective age groups living below the poverty level.
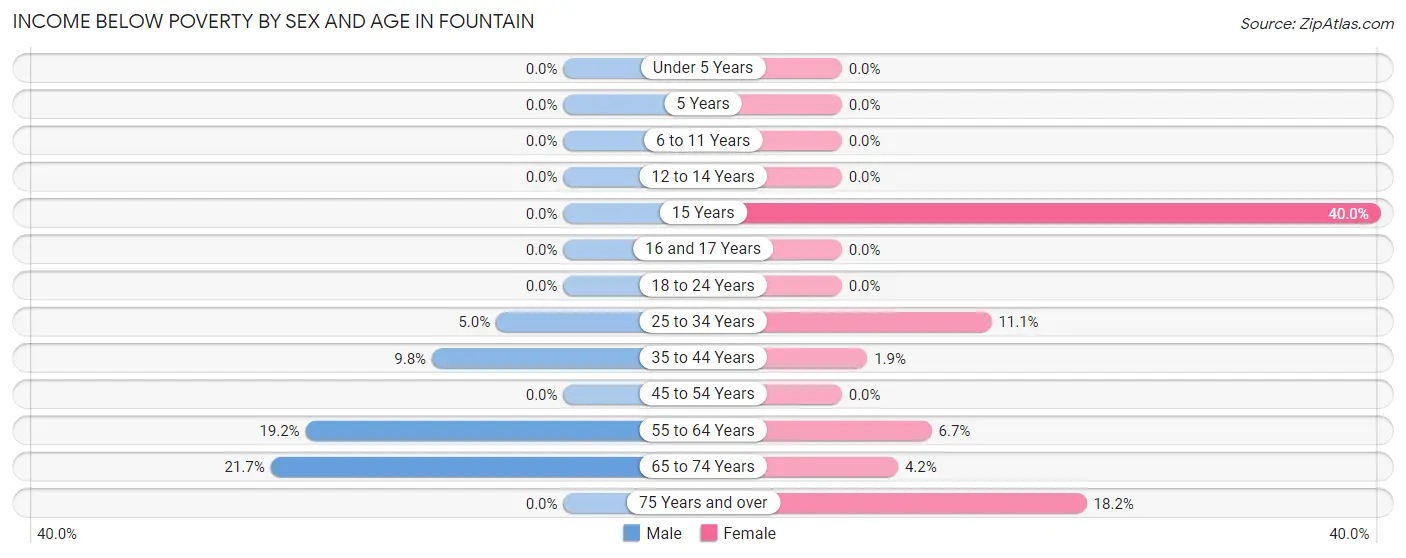
| Age Bracket | Male | Female |
| Under 5 Years | 0 (0.0%) | 0 (0.0%) |
| 5 Years | 0 (0.0%) | 0 (0.0%) |
| 6 to 11 Years | 0 (0.0%) | 0 (0.0%) |
| 12 to 14 Years | 0 (0.0%) | 0 (0.0%) |
| 15 Years | 0 (0.0%) | 2 (40.0%) |
| 16 and 17 Years | 0 (0.0%) | 0 (0.0%) |
| 18 to 24 Years | 0 (0.0%) | 0 (0.0%) |
| 25 to 34 Years | 1 (5.0%) | 2 (11.1%) |
| 35 to 44 Years | 4 (9.8%) | 1 (1.9%) |
| 45 to 54 Years | 0 (0.0%) | 0 (0.0%) |
| 55 to 64 Years | 9 (19.2%) | 3 (6.7%) |
| 65 to 74 Years | 5 (21.7%) | 1 (4.2%) |
| 75 Years and over | 0 (0.0%) | 2 (18.2%) |
| Total | 19 (7.1%) | 11 (5.1%) |
Income Above Poverty by Sex and Age in Fountain
According to the poverty statistics in Fountain, males aged under 5 years and females aged under 5 years are the age groups that are most secure financially, with 100.0% of males and 100.0% of females in these age groups living above the poverty line.
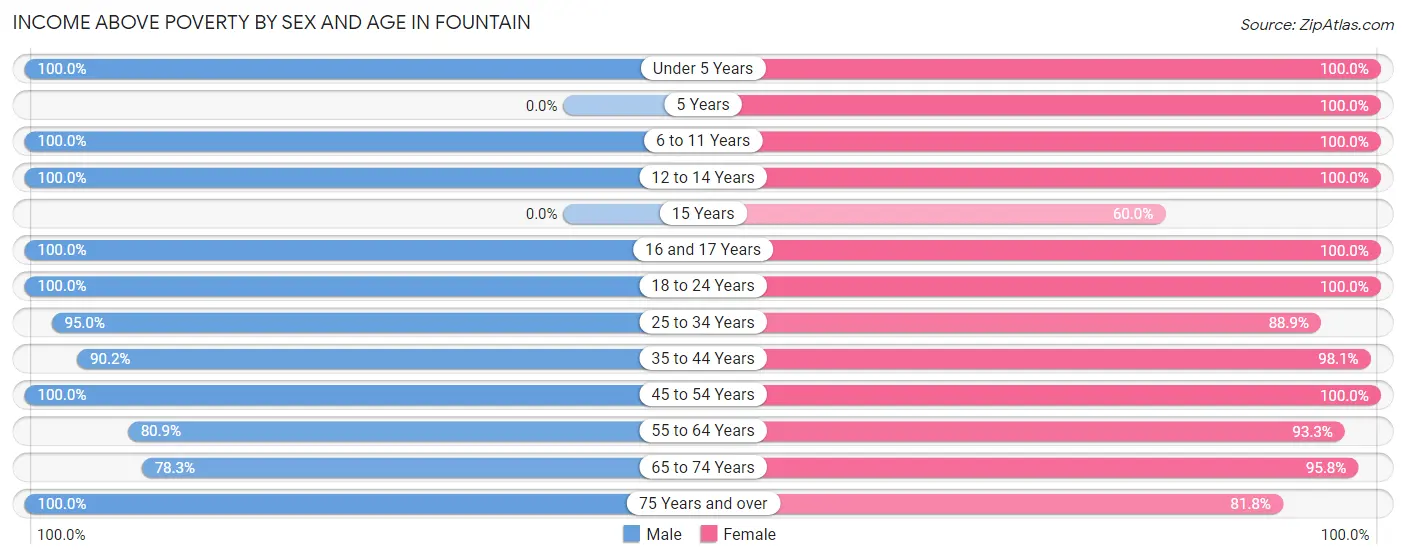
| Age Bracket | Male | Female |
| Under 5 Years | 10 (100.0%) | 10 (100.0%) |
| 5 Years | 0 (0.0%) | 1 (100.0%) |
| 6 to 11 Years | 45 (100.0%) | 6 (100.0%) |
| 12 to 14 Years | 5 (100.0%) | 11 (100.0%) |
| 15 Years | 0 (0.0%) | 3 (60.0%) |
| 16 and 17 Years | 9 (100.0%) | 5 (100.0%) |
| 18 to 24 Years | 22 (100.0%) | 25 (100.0%) |
| 25 to 34 Years | 19 (95.0%) | 16 (88.9%) |
| 35 to 44 Years | 37 (90.2%) | 52 (98.1%) |
| 45 to 54 Years | 28 (100.0%) | 2 (100.0%) |
| 55 to 64 Years | 38 (80.8%) | 42 (93.3%) |
| 65 to 74 Years | 18 (78.3%) | 23 (95.8%) |
| 75 Years and over | 18 (100.0%) | 9 (81.8%) |
| Total | 249 (92.9%) | 205 (94.9%) |
Income Below Poverty Among Married-Couple Families in Fountain
The poverty statistics for married-couple families in Fountain show that 3.2% or 4 of the total 125 families live below the poverty line. Families with 1 or 2 children have the highest poverty rate of 4.9%, comprising of 2 families. On the other hand, families with 3 or 4 children have the lowest poverty rate of 0.0%, which includes 0 families.
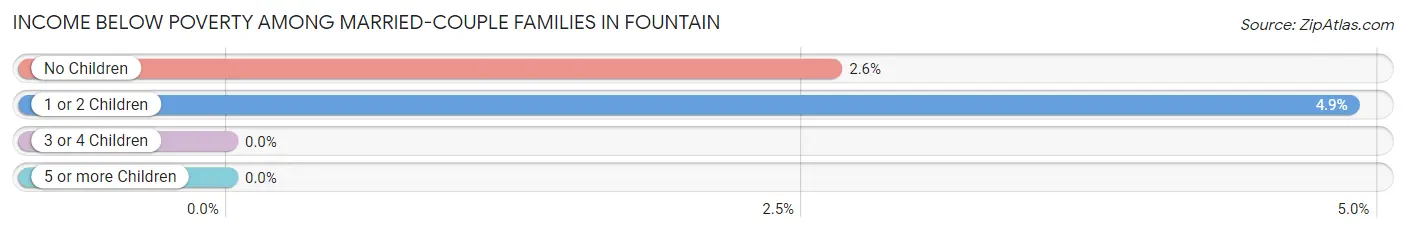
| Children | Above Poverty | Below Poverty |
| No Children | 74 (97.4%) | 2 (2.6%) |
| 1 or 2 Children | 39 (95.1%) | 2 (4.9%) |
| 3 or 4 Children | 8 (100.0%) | 0 (0.0%) |
| 5 or more Children | 0 (0.0%) | 0 (0.0%) |
| Total | 121 (96.8%) | 4 (3.2%) |
Income Below Poverty Among Single-Parent Households in Fountain
| Children | Single Father | Single Mother |
| No Children | 0 (0.0%) | 0 (0.0%) |
| 1 or 2 Children | 0 (0.0%) | 0 (0.0%) |
| 3 or 4 Children | 0 (0.0%) | 0 (0.0%) |
| 5 or more Children | 0 (0.0%) | 0 (0.0%) |
| Total | 0 (0.0%) | 0 (0.0%) |
Income Below Poverty Among Married-Couple vs Single-Parent Households in Fountain
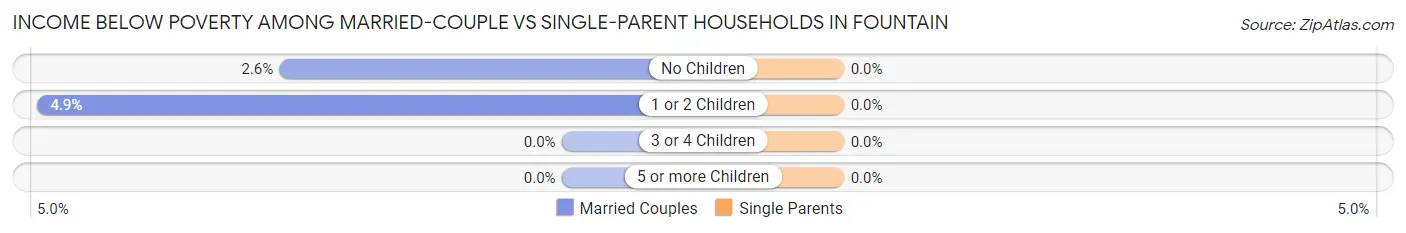
| Children | Married-Couple Families | Single-Parent Households |
| No Children | 2 (2.6%) | 0 (0.0%) |
| 1 or 2 Children | 2 (4.9%) | 0 (0.0%) |
| 3 or 4 Children | 0 (0.0%) | 0 (0.0%) |
| 5 or more Children | 0 (0.0%) | 0 (0.0%) |
| Total | 4 (3.2%) | 0 (0.0%) |
Race in Fountain
The most populous races in Fountain are White / Caucasian (463 | 95.7%), Two or more Races (15 | 3.1%), and Hispanic or Latino (4 | 0.8%).
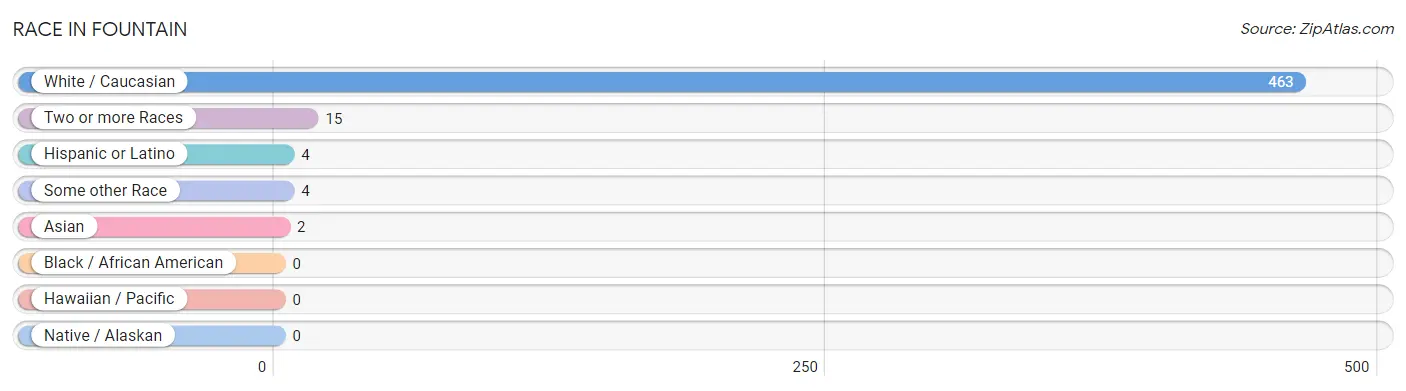
| Race | # Population | % Population |
| Asian | 2 | 0.4% |
| Black / African American | 0 | 0.0% |
| Hawaiian / Pacific | 0 | 0.0% |
| Hispanic or Latino | 4 | 0.8% |
| Native / Alaskan | 0 | 0.0% |
| White / Caucasian | 463 | 95.7% |
| Two or more Races | 15 | 3.1% |
| Some other Race | 4 | 0.8% |
| Total | 484 | 100.0% |
Ancestry in Fountain
The most populous ancestries reported in Fountain are German (209 | 43.2%), Norwegian (171 | 35.3%), Irish (57 | 11.8%), Dutch (49 | 10.1%), and American (36 | 7.4%), together accounting for 107.9% of all Fountain residents.
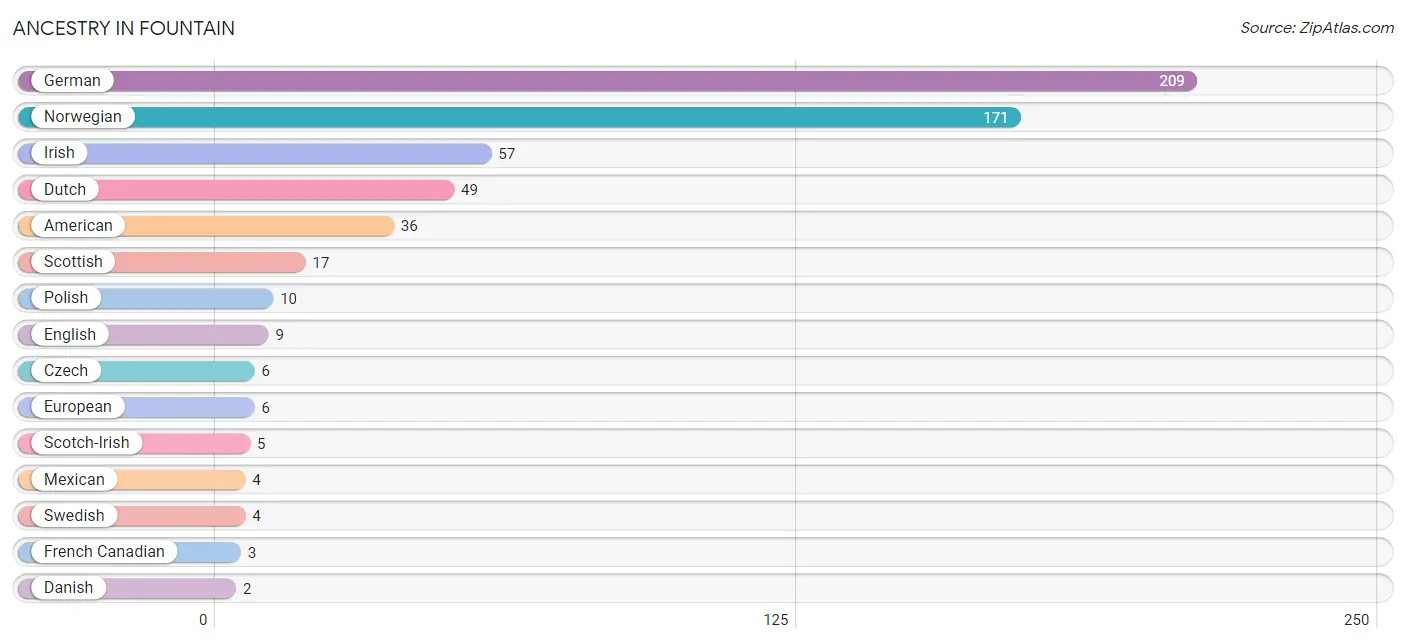
| Ancestry | # Population | % Population |
| American | 36 | 7.4% |
| Cherokee | 1 | 0.2% |
| Czech | 6 | 1.2% |
| Danish | 2 | 0.4% |
| Dutch | 49 | 10.1% |
| English | 9 | 1.9% |
| European | 6 | 1.2% |
| Finnish | 2 | 0.4% |
| French | 2 | 0.4% |
| French Canadian | 3 | 0.6% |
| German | 209 | 43.2% |
| Hungarian | 1 | 0.2% |
| Irish | 57 | 11.8% |
| Korean | 2 | 0.4% |
| Mexican | 4 | 0.8% |
| Norwegian | 171 | 35.3% |
| Polish | 10 | 2.1% |
| Russian | 1 | 0.2% |
| Scandinavian | 1 | 0.2% |
| Scotch-Irish | 5 | 1.0% |
| Scottish | 17 | 3.5% |
| Swedish | 4 | 0.8% | View All 22 Rows |
Immigrants in Fountain
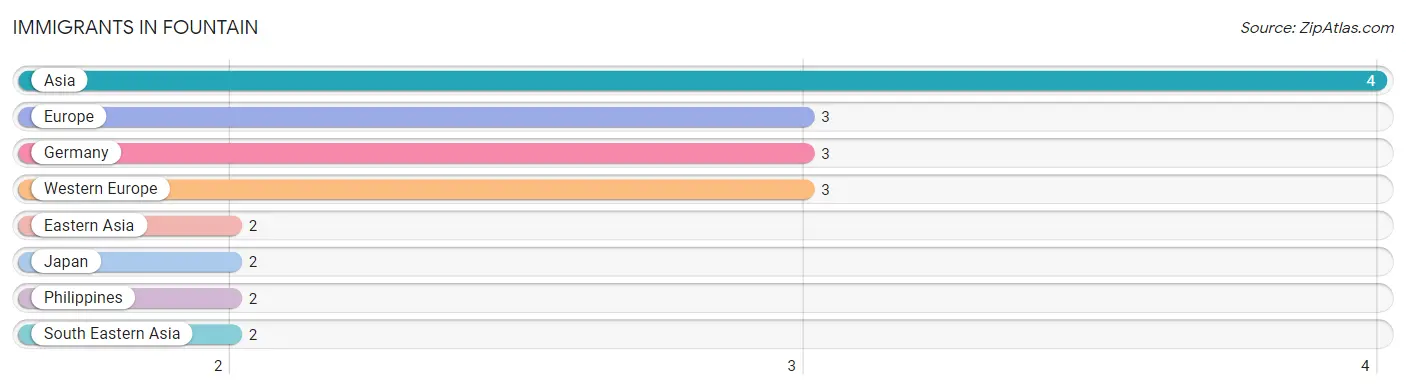
The most numerous immigrant groups reported in Fountain came from Asia (4 | 0.8%), Europe (3 | 0.6%), Germany (3 | 0.6%), Western Europe (3 | 0.6%), and Eastern Asia (2 | 0.4%), together accounting for 3.1% of all Fountain residents.
| Immigration Origin | # Population | % Population |
| Asia | 4 | 0.8% |
| Eastern Asia | 2 | 0.4% |
| Europe | 3 | 0.6% |
| Germany | 3 | 0.6% |
| Japan | 2 | 0.4% |
| Philippines | 2 | 0.4% |
| South Eastern Asia | 2 | 0.4% |
| Western Europe | 3 | 0.6% | View All 8 Rows |
Sex and Age in Fountain
Sex and Age in Fountain
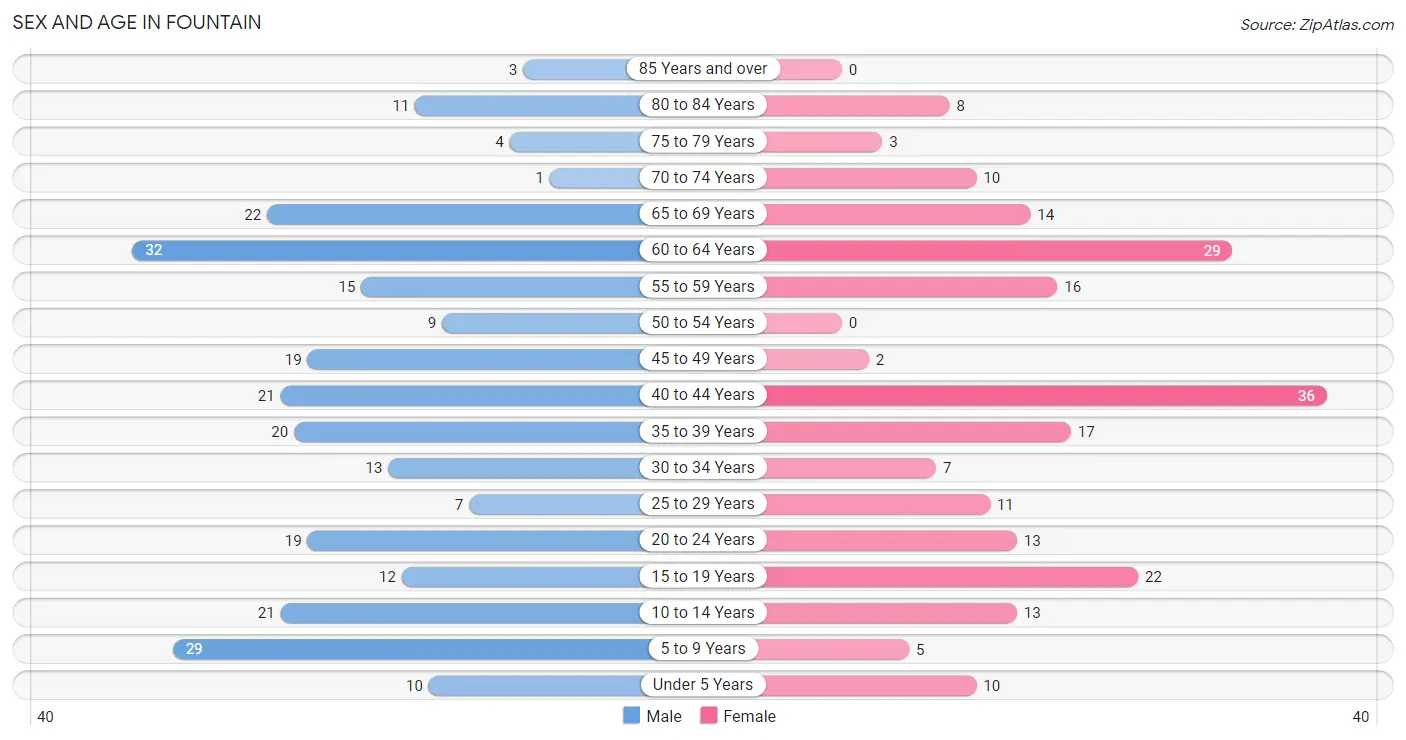
The most populous age groups in Fountain are 60 to 64 Years (32 | 11.9%) for men and 40 to 44 Years (36 | 16.7%) for women.
| Age Bracket | Male | Female |
| Under 5 Years | 10 (3.7%) | 10 (4.6%) |
| 5 to 9 Years | 29 (10.8%) | 5 (2.3%) |
| 10 to 14 Years | 21 (7.8%) | 13 (6.0%) |
| 15 to 19 Years | 12 (4.5%) | 22 (10.2%) |
| 20 to 24 Years | 19 (7.1%) | 13 (6.0%) |
| 25 to 29 Years | 7 (2.6%) | 11 (5.1%) |
| 30 to 34 Years | 13 (4.9%) | 7 (3.2%) |
| 35 to 39 Years | 20 (7.5%) | 17 (7.9%) |
| 40 to 44 Years | 21 (7.8%) | 36 (16.7%) |
| 45 to 49 Years | 19 (7.1%) | 2 (0.9%) |
| 50 to 54 Years | 9 (3.4%) | 0 (0.0%) |
| 55 to 59 Years | 15 (5.6%) | 16 (7.4%) |
| 60 to 64 Years | 32 (11.9%) | 29 (13.4%) |
| 65 to 69 Years | 22 (8.2%) | 14 (6.5%) |
| 70 to 74 Years | 1 (0.4%) | 10 (4.6%) |
| 75 to 79 Years | 4 (1.5%) | 3 (1.4%) |
| 80 to 84 Years | 11 (4.1%) | 8 (3.7%) |
| 85 Years and over | 3 (1.1%) | 0 (0.0%) |
| Total | 268 (100.0%) | 216 (100.0%) |
Families and Households in Fountain
Median Family Size in Fountain
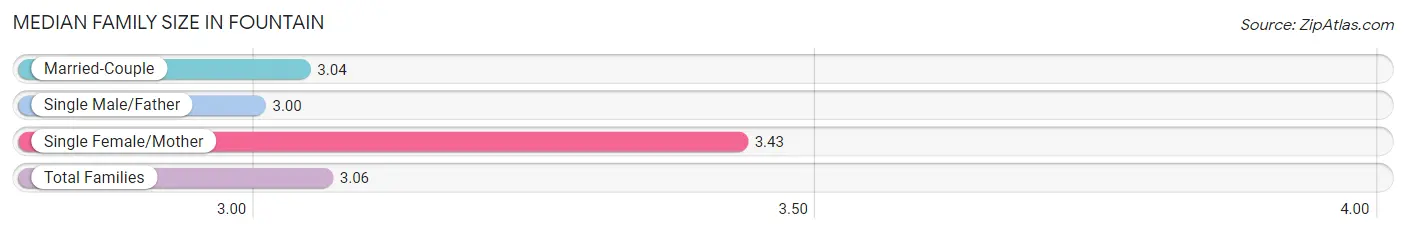
The median family size in Fountain is 3.06 persons per family, with single female/mother families (7 | 5.3%) accounting for the largest median family size of 3.43 persons per family. On the other hand, single male/father families (1 | 0.7%) represent the smallest median family size with 3.00 persons per family.
| Family Type | # Families | Family Size |
| Married-Couple | 125 (94.0%) | 3.04 |
| Single Male/Father | 1 (0.7%) | 3.00 |
| Single Female/Mother | 7 (5.3%) | 3.43 |
| Total Families | 133 (100.0%) | 3.06 |
Median Household Size in Fountain
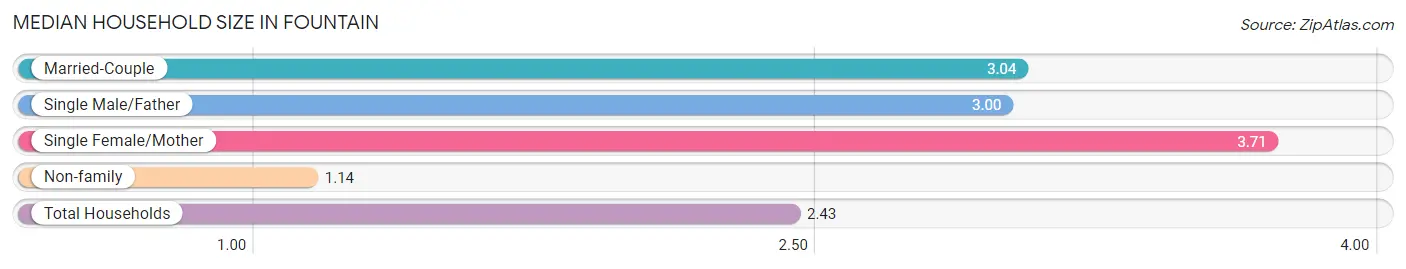
The median household size in Fountain is 2.43 persons per household, with single female/mother households (7 | 3.5%) accounting for the largest median household size of 3.71 persons per household. non-family households (66 | 33.2%) represent the smallest median household size with 1.14 persons per household.
| Household Type | # Households | Household Size |
| Married-Couple | 125 (62.8%) | 3.04 |
| Single Male/Father | 1 (0.5%) | 3.00 |
| Single Female/Mother | 7 (3.5%) | 3.71 |
| Non-family | 66 (33.2%) | 1.14 |
| Total Households | 199 (100.0%) | 2.43 |
Household Size by Marriage Status in Fountain
Out of a total of 199 households in Fountain, 133 (66.8%) are family households, while 66 (33.2%) are nonfamily households. The most numerous type of family households are 2-person households, comprising 68, and the most common type of nonfamily households are 1-person households, comprising 59.
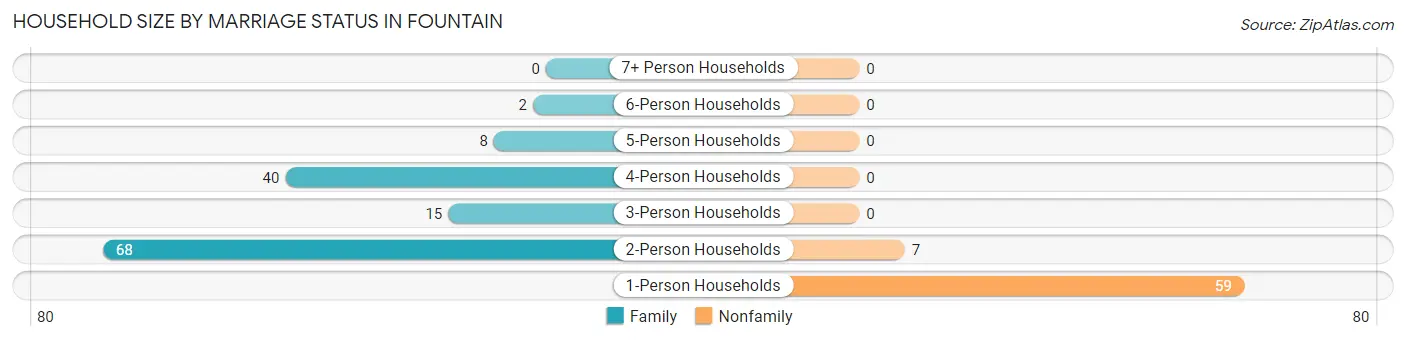
| Household Size | Family Households | Nonfamily Households |
| 1-Person Households | - | 59 (29.6%) |
| 2-Person Households | 68 (34.2%) | 7 (3.5%) |
| 3-Person Households | 15 (7.5%) | 0 (0.0%) |
| 4-Person Households | 40 (20.1%) | 0 (0.0%) |
| 5-Person Households | 8 (4.0%) | 0 (0.0%) |
| 6-Person Households | 2 (1.0%) | 0 (0.0%) |
| 7+ Person Households | 0 (0.0%) | 0 (0.0%) |
| Total | 133 (66.8%) | 66 (33.2%) |
Female Fertility in Fountain
Fertility by Age in Fountain
Average fertility rate in Fountain is 9.0 births per 1,000 women. Women in the age bracket of 20 to 34 years have the highest fertility rate with 32.0 births per 1,000 women. Women in the age bracket of 20 to 34 years acount for 100.0% of all women with births.
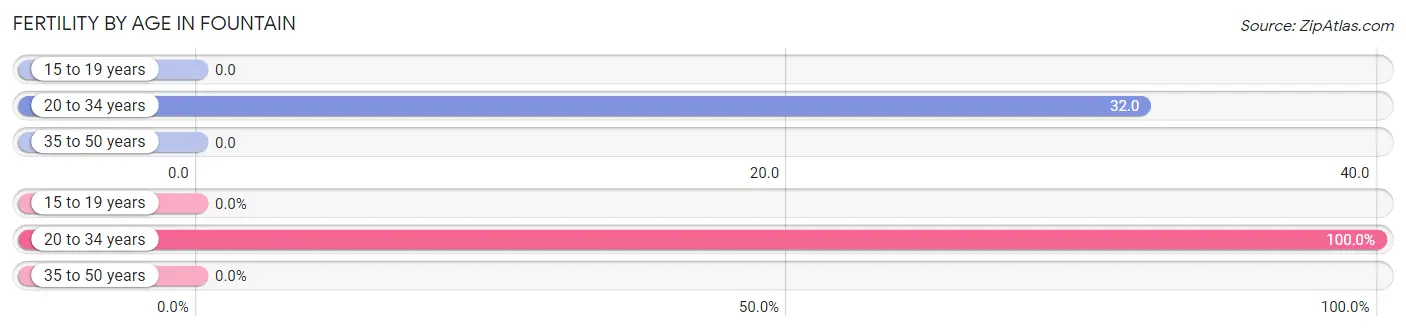
| Age Bracket | Women with Births | Births / 1,000 Women |
| 15 to 19 years | 0 (0.0%) | 0.0 |
| 20 to 34 years | 1 (100.0%) | 32.0 |
| 35 to 50 years | 0 (0.0%) | 0.0 |
| Total | 1 (100.0%) | 9.0 |
Fertility by Age by Marriage Status in Fountain
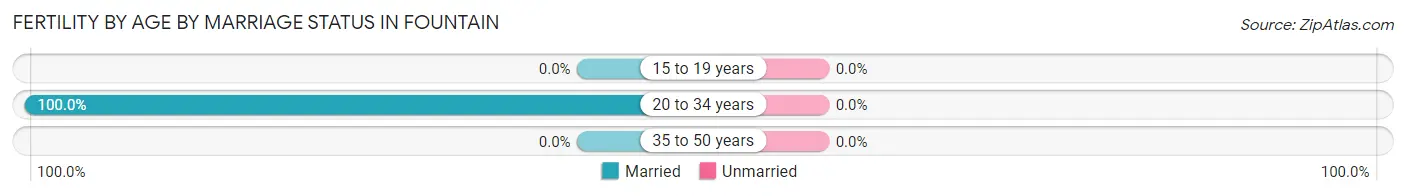
| Age Bracket | Married | Unmarried |
| 15 to 19 years | 0 (0.0%) | 0 (0.0%) |
| 20 to 34 years | 1 (100.0%) | 0 (0.0%) |
| 35 to 50 years | 0 (0.0%) | 0 (0.0%) |
| Total | 1 (100.0%) | 0 (0.0%) |
Fertility by Education in Fountain
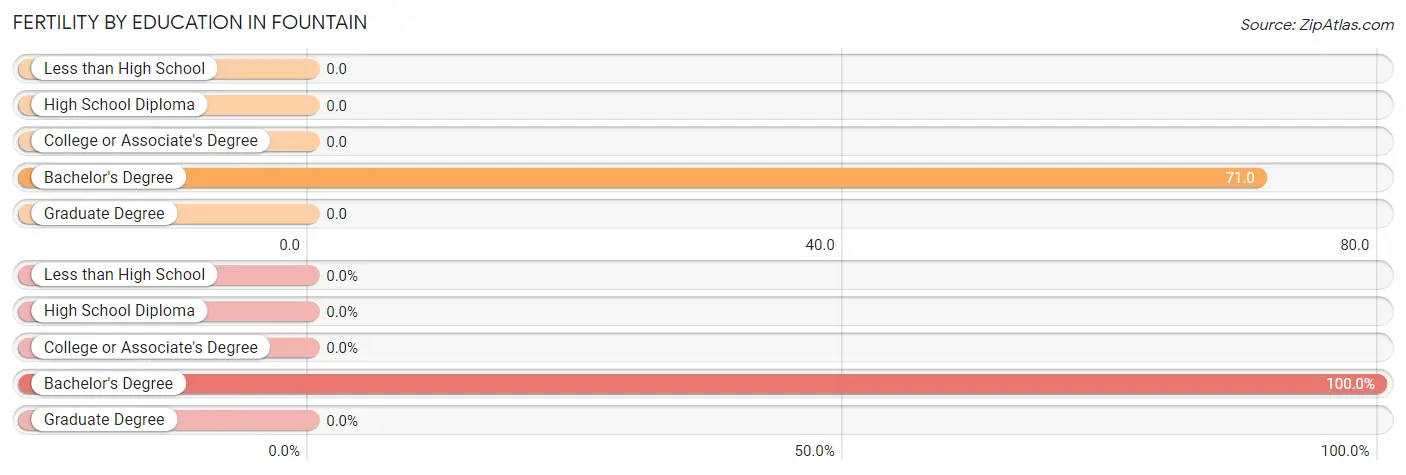
| Educational Attainment | Women with Births | Births / 1,000 Women |
| Less than High School | 0 (0.0%) | 0.0 |
| High School Diploma | 0 (0.0%) | 0.0 |
| College or Associate's Degree | 0 (0.0%) | 0.0 |
| Bachelor's Degree | 1 (100.0%) | 71.0 |
| Graduate Degree | 0 (0.0%) | 0.0 |
| Total | 1 (100.0%) | 9.0 |
Fertility by Education by Marriage Status in Fountain
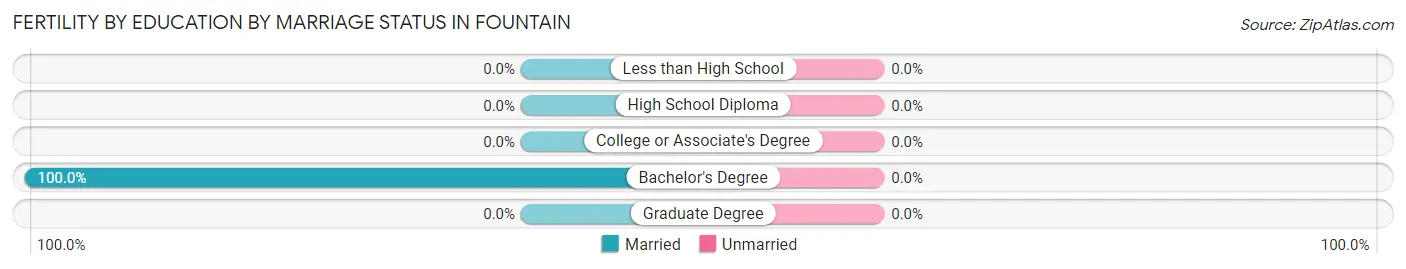
| Educational Attainment | Married | Unmarried |
| Less than High School | 0 (0.0%) | 0 (0.0%) |
| High School Diploma | 0 (0.0%) | 0 (0.0%) |
| College or Associate's Degree | 0 (0.0%) | 0 (0.0%) |
| Bachelor's Degree | 1 (100.0%) | 0 (0.0%) |
| Graduate Degree | 0 (0.0%) | 0 (0.0%) |
| Total | 1 (100.0%) | 0 (0.0%) |
Employment Characteristics in Fountain
Employment by Class of Employer in Fountain
Among the 289 employed individuals in Fountain, private company employees (163 | 56.4%), not-for-profit organizations (61 | 21.1%), and local government employees (29 | 10.0%) make up the most common classes of employment.
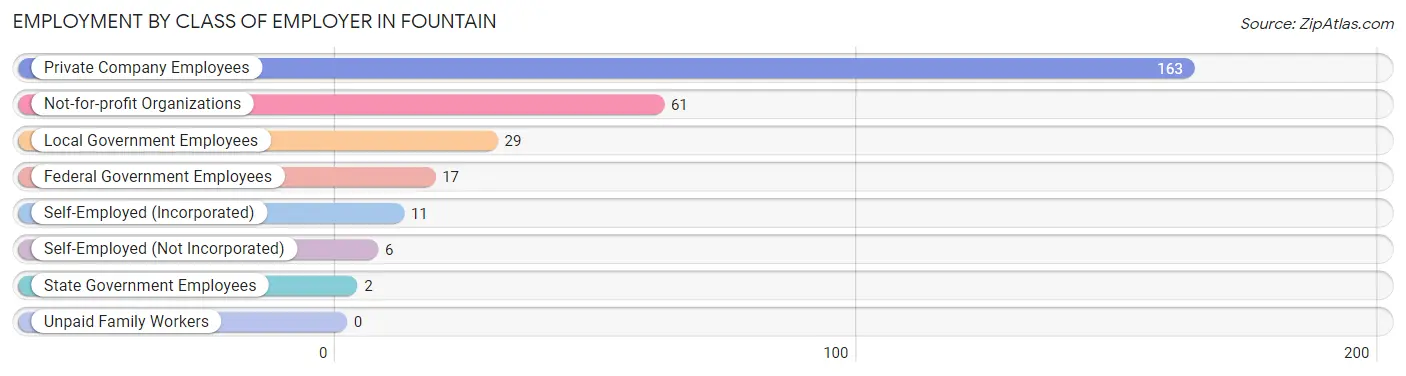
| Employer Class | # Employees | % Employees |
| Private Company Employees | 163 | 56.4% |
| Self-Employed (Incorporated) | 11 | 3.8% |
| Self-Employed (Not Incorporated) | 6 | 2.1% |
| Not-for-profit Organizations | 61 | 21.1% |
| Local Government Employees | 29 | 10.0% |
| State Government Employees | 2 | 0.7% |
| Federal Government Employees | 17 | 5.9% |
| Unpaid Family Workers | 0 | 0.0% |
| Total | 289 | 100.0% |
Employment Status by Age in Fountain
According to the labor force statistics for Fountain, out of the total population over 16 years of age (391), 80.1% or 313 individuals are in the labor force, with 7.7% or 24 of them unemployed. The age group with the highest labor force participation rate is 25 to 29 years, with 100.0% or 18 individuals in the labor force. Within the labor force, the 45 to 54 years age range has the highest percentage of unemployed individuals, with 37.9% or 11 of them being unemployed.
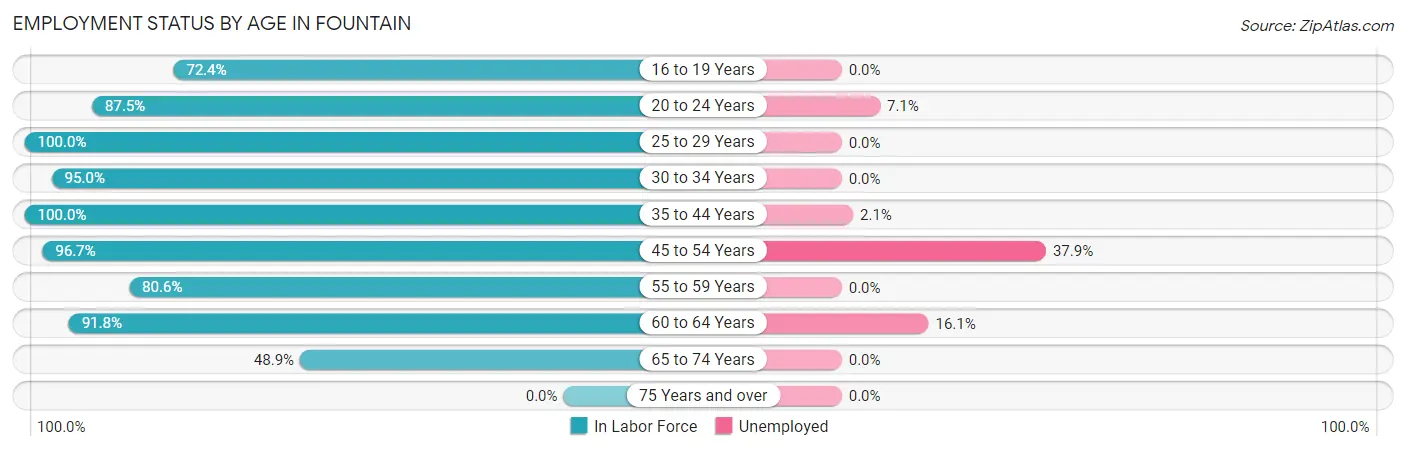
| Age Bracket | In Labor Force | Unemployed |
| 16 to 19 Years | 21 (72.4%) | 0 (0.0%) |
| 20 to 24 Years | 28 (87.5%) | 2 (7.1%) |
| 25 to 29 Years | 18 (100.0%) | 0 (0.0%) |
| 30 to 34 Years | 19 (95.0%) | 0 (0.0%) |
| 35 to 44 Years | 94 (100.0%) | 2 (2.1%) |
| 45 to 54 Years | 29 (96.7%) | 11 (37.9%) |
| 55 to 59 Years | 25 (80.6%) | 0 (0.0%) |
| 60 to 64 Years | 56 (91.8%) | 9 (16.1%) |
| 65 to 74 Years | 23 (48.9%) | 0 (0.0%) |
| 75 Years and over | 0 (0.0%) | 0 (0.0%) |
| Total | 313 (80.1%) | 24 (7.7%) |
Employment Status by Educational Attainment in Fountain
According to labor force statistics for Fountain, 94.9% of individuals (241) out of the total population between 25 and 64 years of age (254) are in the labor force, with 9.1% or 22 of them being unemployed. The group with the highest labor force participation rate are those with the educational attainment of bachelor's degree or higher, with 100.0% or 34 individuals in the labor force. Within the labor force, individuals with less than high school education have the highest percentage of unemployment, with 47.1% or 8 of them being unemployed.
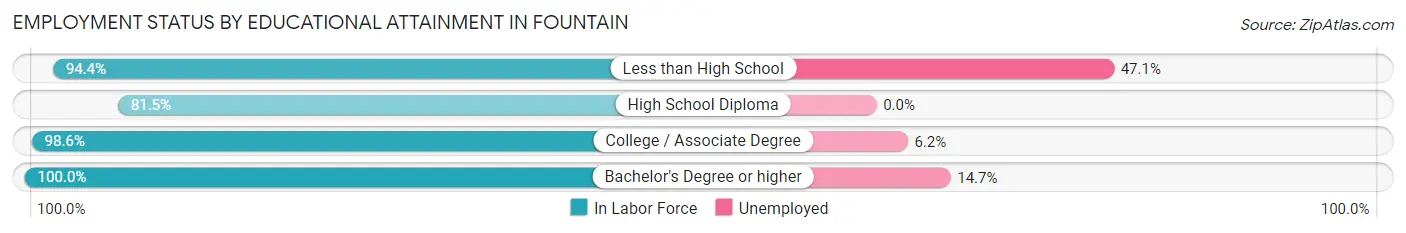
| Educational Attainment | In Labor Force | Unemployed |
| Less than High School | 17 (94.4%) | 8 (47.1%) |
| High School Diploma | 44 (81.5%) | 0 (0.0%) |
| College / Associate Degree | 146 (98.6%) | 9 (6.2%) |
| Bachelor's Degree or higher | 34 (100.0%) | 5 (14.7%) |
| Total | 241 (94.9%) | 23 (9.1%) |
Employment Occupations by Sex in Fountain
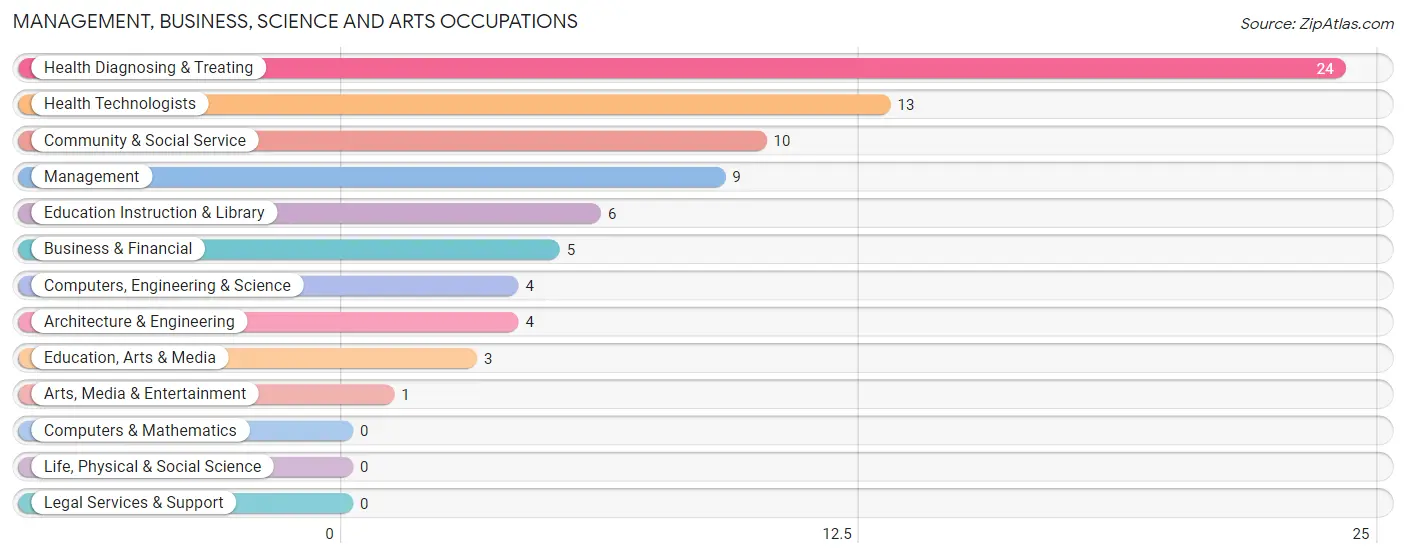
Management, Business, Science and Arts Occupations
The most common Management, Business, Science and Arts occupations in Fountain are Health Diagnosing & Treating (24 | 8.3%), Health Technologists (13 | 4.5%), Community & Social Service (10 | 3.5%), Management (9 | 3.1%), and Education Instruction & Library (6 | 2.1%).
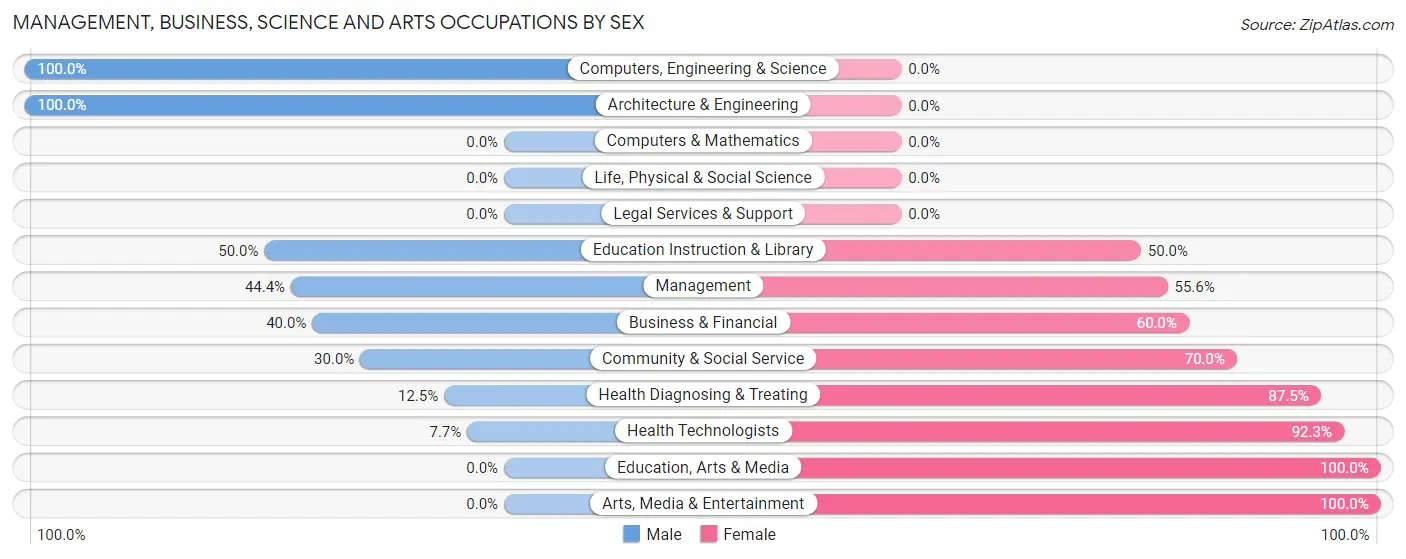
Management, Business, Science and Arts Occupations by Sex
Within the Management, Business, Science and Arts occupations in Fountain, the most male-oriented occupations are Computers, Engineering & Science (100.0%), Architecture & Engineering (100.0%), and Education Instruction & Library (50.0%), while the most female-oriented occupations are Education, Arts & Media (100.0%), Arts, Media & Entertainment (100.0%), and Health Technologists (92.3%).
| Occupation | Male | Female |
| Management | 4 (44.4%) | 5 (55.6%) |
| Business & Financial | 2 (40.0%) | 3 (60.0%) |
| Computers, Engineering & Science | 4 (100.0%) | 0 (0.0%) |
| Computers & Mathematics | 0 (0.0%) | 0 (0.0%) |
| Architecture & Engineering | 4 (100.0%) | 0 (0.0%) |
| Life, Physical & Social Science | 0 (0.0%) | 0 (0.0%) |
| Community & Social Service | 3 (30.0%) | 7 (70.0%) |
| Education, Arts & Media | 0 (0.0%) | 3 (100.0%) |
| Legal Services & Support | 0 (0.0%) | 0 (0.0%) |
| Education Instruction & Library | 3 (50.0%) | 3 (50.0%) |
| Arts, Media & Entertainment | 0 (0.0%) | 1 (100.0%) |
| Health Diagnosing & Treating | 3 (12.5%) | 21 (87.5%) |
| Health Technologists | 1 (7.7%) | 12 (92.3%) |
| Total (Category) | 16 (30.8%) | 36 (69.2%) |
| Total (Overall) | 143 (49.5%) | 146 (50.5%) |
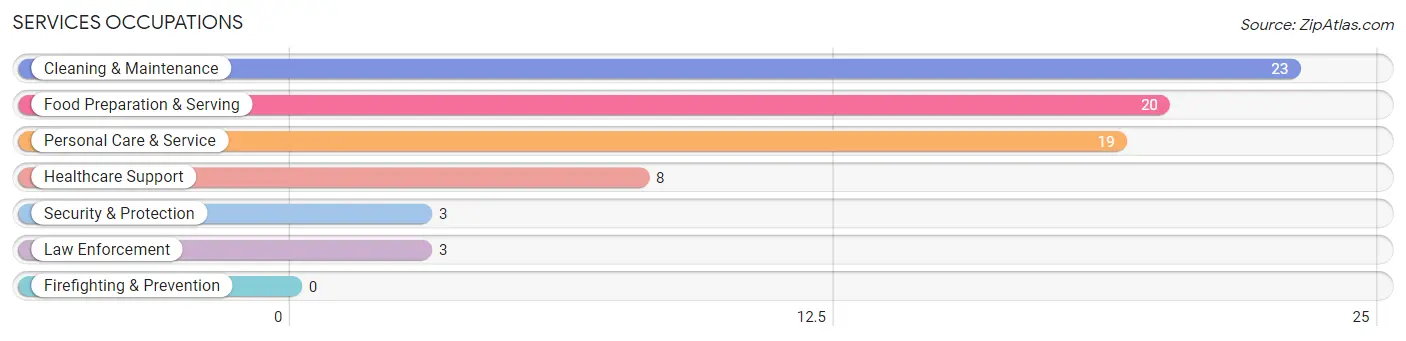
Services Occupations
The most common Services occupations in Fountain are Cleaning & Maintenance (23 | 8.0%), Food Preparation & Serving (20 | 6.9%), Personal Care & Service (19 | 6.6%), Healthcare Support (8 | 2.8%), and Security & Protection (3 | 1.0%).
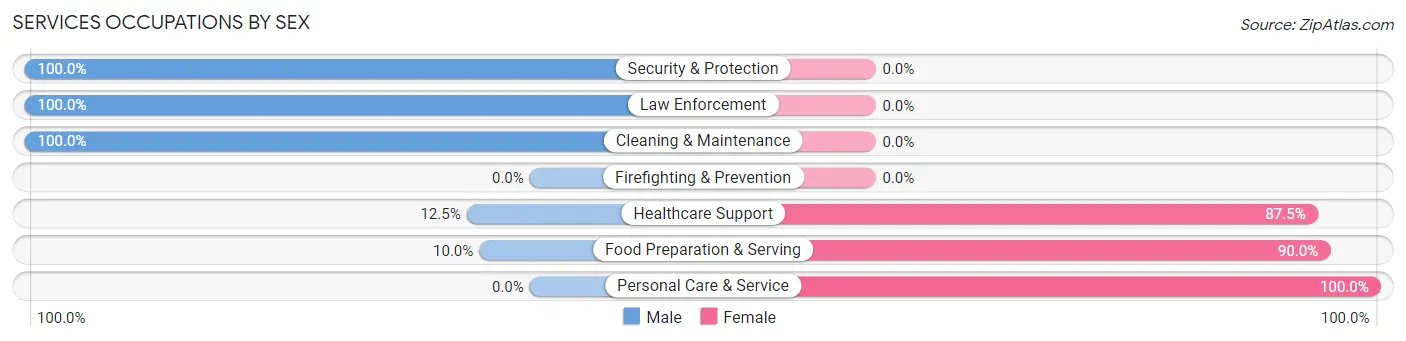
Services Occupations by Sex
Within the Services occupations in Fountain, the most male-oriented occupations are Security & Protection (100.0%), Law Enforcement (100.0%), and Cleaning & Maintenance (100.0%), while the most female-oriented occupations are Personal Care & Service (100.0%), Food Preparation & Serving (90.0%), and Healthcare Support (87.5%).
| Occupation | Male | Female |
| Healthcare Support | 1 (12.5%) | 7 (87.5%) |
| Security & Protection | 3 (100.0%) | 0 (0.0%) |
| Firefighting & Prevention | 0 (0.0%) | 0 (0.0%) |
| Law Enforcement | 3 (100.0%) | 0 (0.0%) |
| Food Preparation & Serving | 2 (10.0%) | 18 (90.0%) |
| Cleaning & Maintenance | 23 (100.0%) | 0 (0.0%) |
| Personal Care & Service | 0 (0.0%) | 19 (100.0%) |
| Total (Category) | 29 (39.7%) | 44 (60.3%) |
| Total (Overall) | 143 (49.5%) | 146 (50.5%) |
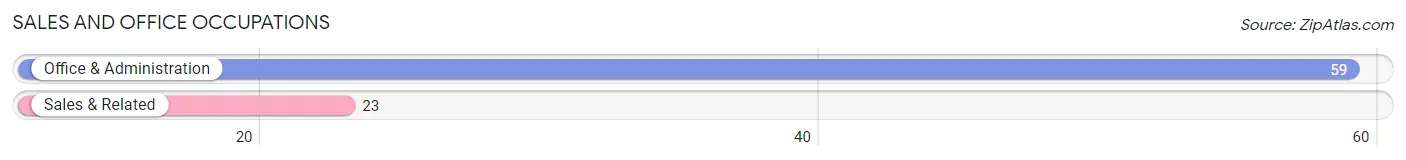
Sales and Office Occupations
The most common Sales and Office occupations in Fountain are Office & Administration (59 | 20.4%), and Sales & Related (23 | 8.0%).
Sales and Office Occupations by Sex
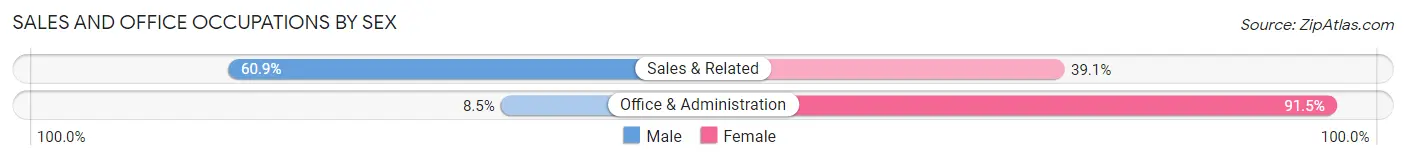
| Occupation | Male | Female |
| Sales & Related | 14 (60.9%) | 9 (39.1%) |
| Office & Administration | 5 (8.5%) | 54 (91.5%) |
| Total (Category) | 19 (23.2%) | 63 (76.8%) |
| Total (Overall) | 143 (49.5%) | 146 (50.5%) |
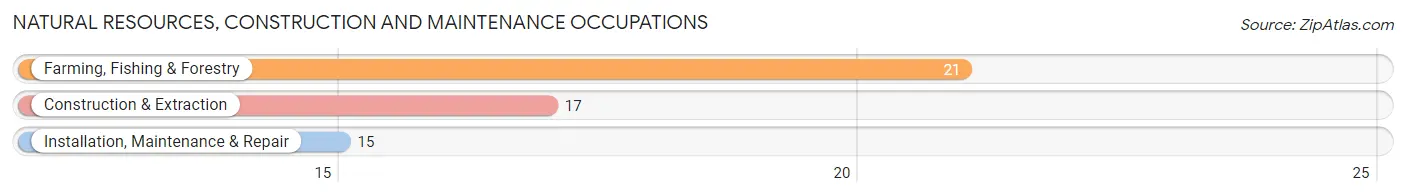
Natural Resources, Construction and Maintenance Occupations
The most common Natural Resources, Construction and Maintenance occupations in Fountain are Farming, Fishing & Forestry (21 | 7.3%), Construction & Extraction (17 | 5.9%), and Installation, Maintenance & Repair (15 | 5.2%).
Natural Resources, Construction and Maintenance Occupations by Sex
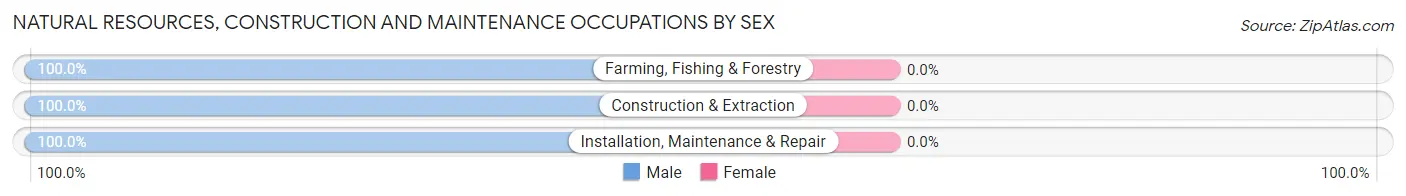
| Occupation | Male | Female |
| Farming, Fishing & Forestry | 21 (100.0%) | 0 (0.0%) |
| Construction & Extraction | 17 (100.0%) | 0 (0.0%) |
| Installation, Maintenance & Repair | 15 (100.0%) | 0 (0.0%) |
| Total (Category) | 53 (100.0%) | 0 (0.0%) |
| Total (Overall) | 143 (49.5%) | 146 (50.5%) |
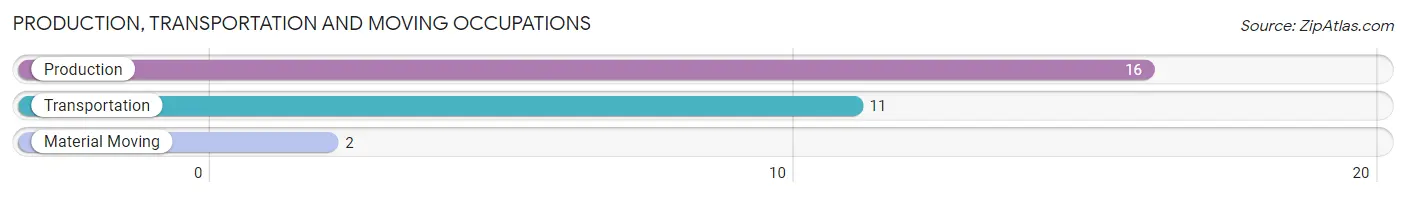
Production, Transportation and Moving Occupations
The most common Production, Transportation and Moving occupations in Fountain are Production (16 | 5.5%), Transportation (11 | 3.8%), and Material Moving (2 | 0.7%).
Production, Transportation and Moving Occupations by Sex
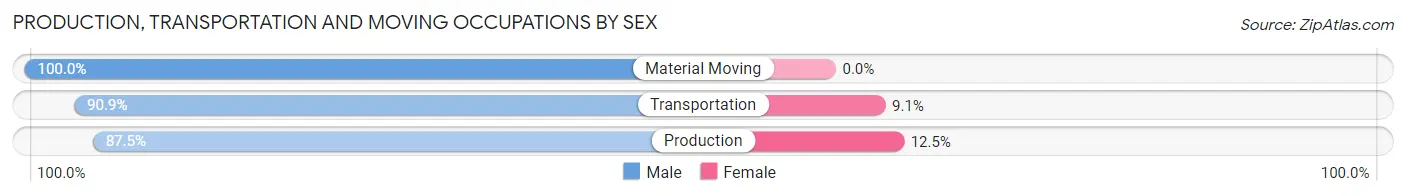
| Occupation | Male | Female |
| Production | 14 (87.5%) | 2 (12.5%) |
| Transportation | 10 (90.9%) | 1 (9.1%) |
| Material Moving | 2 (100.0%) | 0 (0.0%) |
| Total (Category) | 26 (89.7%) | 3 (10.3%) |
| Total (Overall) | 143 (49.5%) | 146 (50.5%) |
Employment Industries by Sex in Fountain
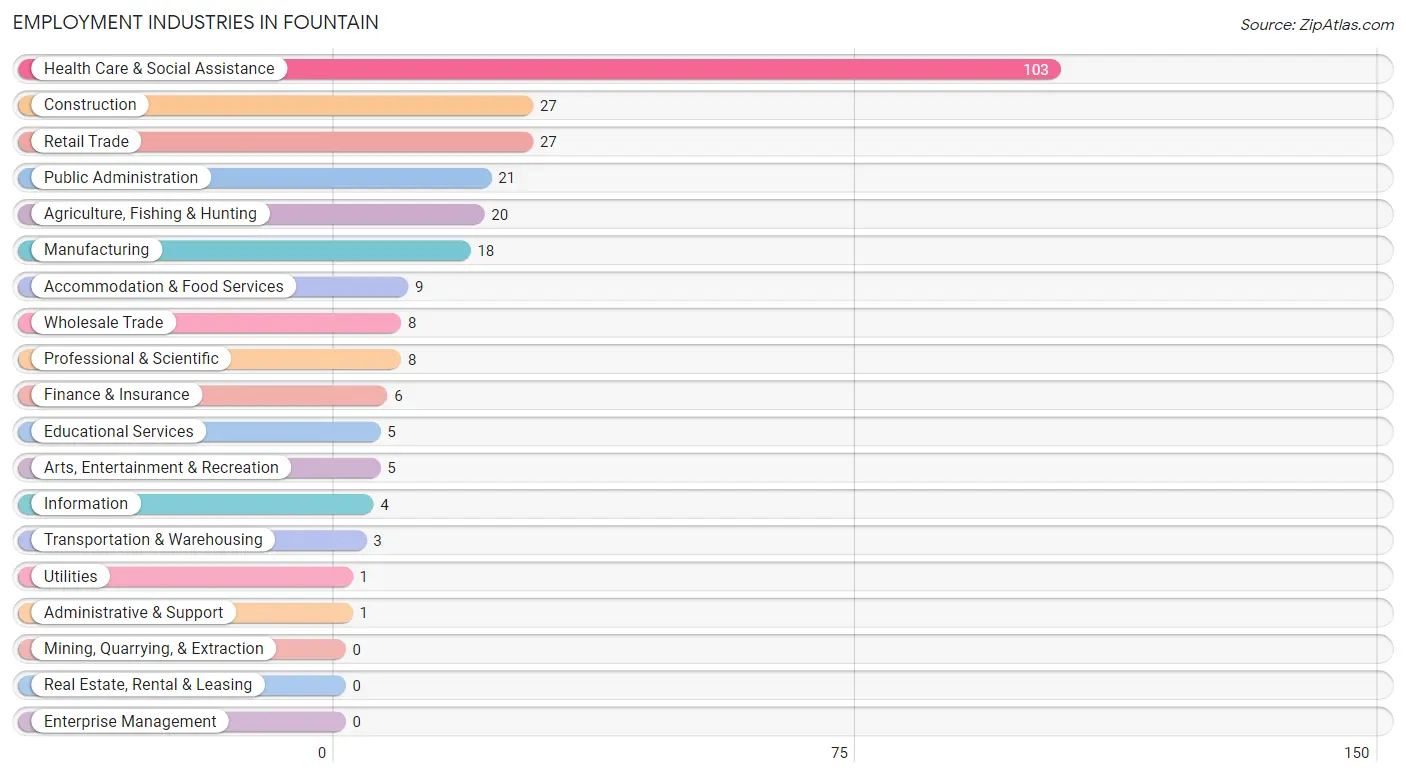
Employment Industries in Fountain
The major employment industries in Fountain include Health Care & Social Assistance (103 | 35.6%), Construction (27 | 9.3%), Retail Trade (27 | 9.3%), Public Administration (21 | 7.3%), and Agriculture, Fishing & Hunting (20 | 6.9%).
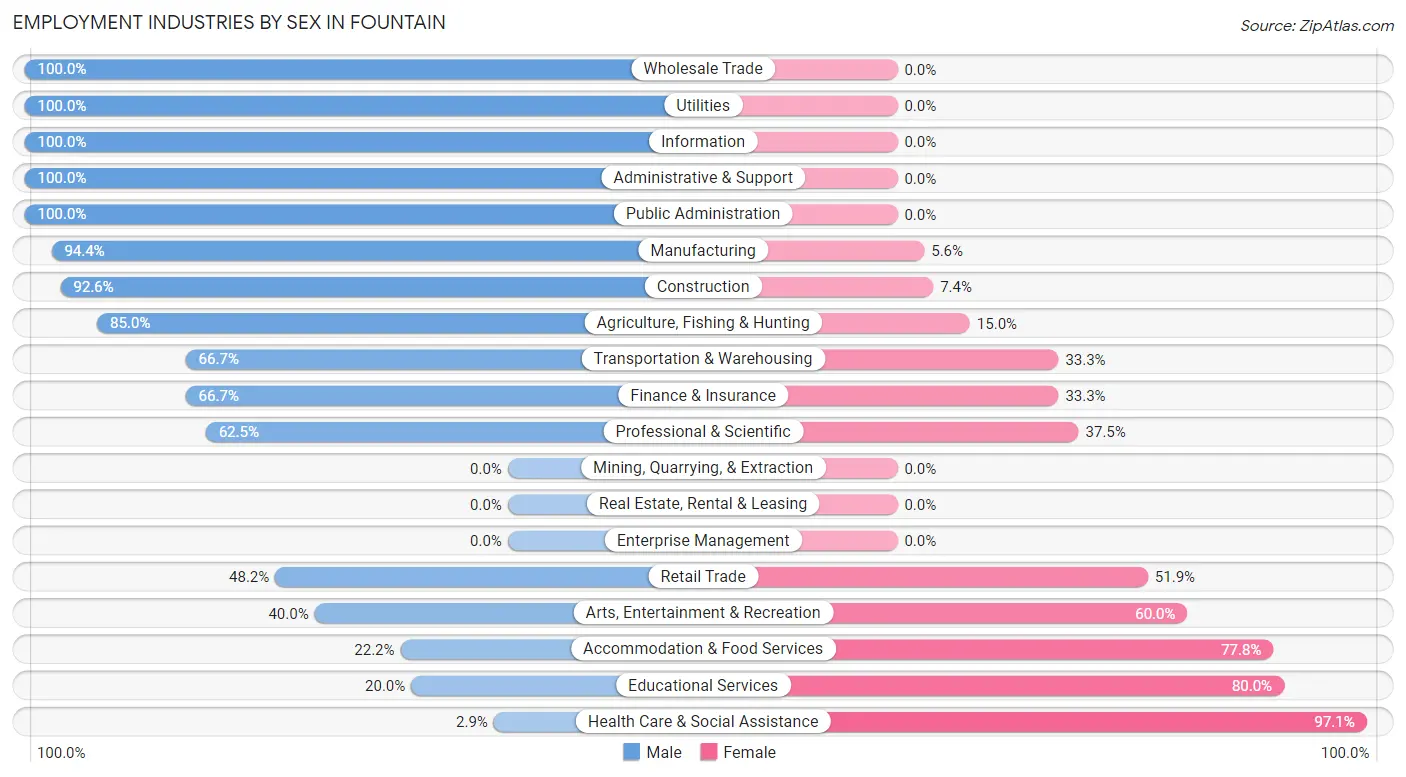
Employment Industries by Sex in Fountain
The Fountain industries that see more men than women are Wholesale Trade (100.0%), Utilities (100.0%), and Information (100.0%), whereas the industries that tend to have a higher number of women are Health Care & Social Assistance (97.1%), Educational Services (80.0%), and Accommodation & Food Services (77.8%).
| Industry | Male | Female |
| Agriculture, Fishing & Hunting | 17 (85.0%) | 3 (15.0%) |
| Mining, Quarrying, & Extraction | 0 (0.0%) | 0 (0.0%) |
| Construction | 25 (92.6%) | 2 (7.4%) |
| Manufacturing | 17 (94.4%) | 1 (5.6%) |
| Wholesale Trade | 8 (100.0%) | 0 (0.0%) |
| Retail Trade | 13 (48.1%) | 14 (51.8%) |
| Transportation & Warehousing | 2 (66.7%) | 1 (33.3%) |
| Utilities | 1 (100.0%) | 0 (0.0%) |
| Information | 4 (100.0%) | 0 (0.0%) |
| Finance & Insurance | 4 (66.7%) | 2 (33.3%) |
| Real Estate, Rental & Leasing | 0 (0.0%) | 0 (0.0%) |
| Professional & Scientific | 5 (62.5%) | 3 (37.5%) |
| Enterprise Management | 0 (0.0%) | 0 (0.0%) |
| Administrative & Support | 1 (100.0%) | 0 (0.0%) |
| Educational Services | 1 (20.0%) | 4 (80.0%) |
| Health Care & Social Assistance | 3 (2.9%) | 100 (97.1%) |
| Arts, Entertainment & Recreation | 2 (40.0%) | 3 (60.0%) |
| Accommodation & Food Services | 2 (22.2%) | 7 (77.8%) |
| Public Administration | 21 (100.0%) | 0 (0.0%) |
| Total | 143 (49.5%) | 146 (50.5%) |
Education in Fountain
School Enrollment in Fountain
The most common levels of schooling among the 122 students in Fountain are middle school (31 | 25.4%), elementary school (29 | 23.8%), and college / undergraduate (26 | 21.3%).
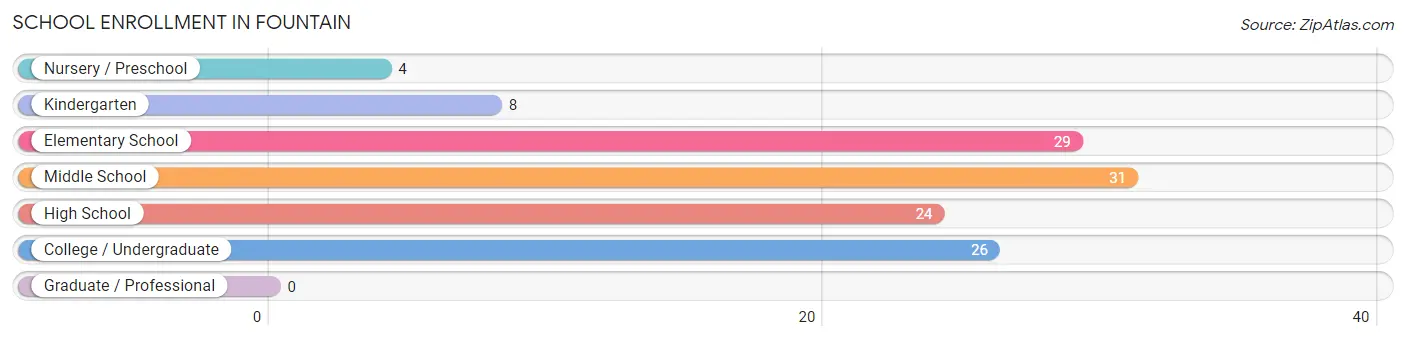
| School Level | # Students | % Students |
| Nursery / Preschool | 4 | 3.3% |
| Kindergarten | 8 | 6.6% |
| Elementary School | 29 | 23.8% |
| Middle School | 31 | 25.4% |
| High School | 24 | 19.7% |
| College / Undergraduate | 26 | 21.3% |
| Graduate / Professional | 0 | 0.0% |
| Total | 122 | 100.0% |
School Enrollment by Age by Funding Source in Fountain
Out of a total of 122 students who are enrolled in schools in Fountain, 3 (2.5%) attend a private institution, while the remaining 119 (97.5%) are enrolled in public schools. The age group of 20 to 24 year olds has the highest likelihood of being enrolled in private schools, with 2 (20.0% in the age bracket) enrolled. Conversely, the age group of 3 to 4 year olds has the lowest likelihood of being enrolled in a private school, with 4 (100.0% in the age bracket) attending a public institution.
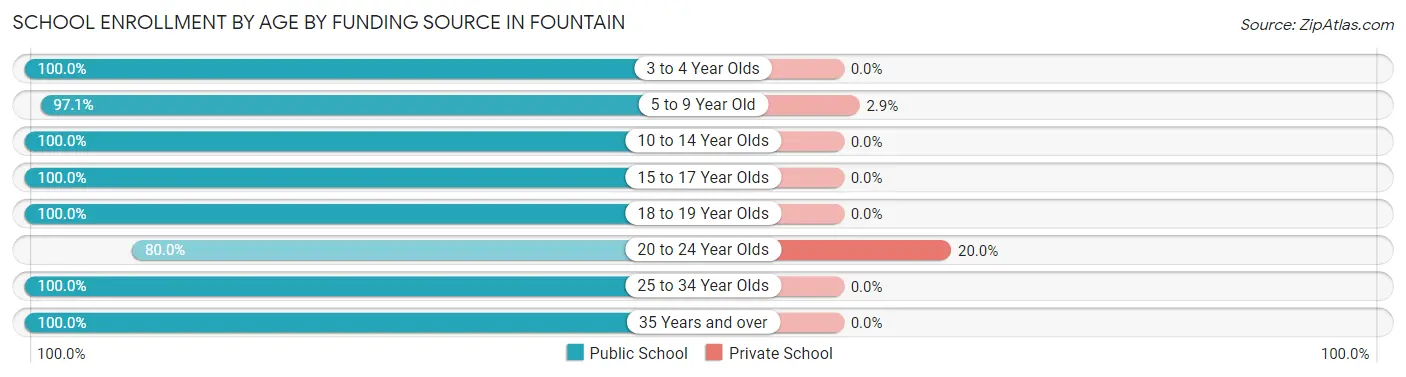
| Age Bracket | Public School | Private School |
| 3 to 4 Year Olds | 4 (100.0%) | 0 (0.0%) |
| 5 to 9 Year Old | 33 (97.1%) | 1 (2.9%) |
| 10 to 14 Year Olds | 34 (100.0%) | 0 (0.0%) |
| 15 to 17 Year Olds | 19 (100.0%) | 0 (0.0%) |
| 18 to 19 Year Olds | 5 (100.0%) | 0 (0.0%) |
| 20 to 24 Year Olds | 8 (80.0%) | 2 (20.0%) |
| 25 to 34 Year Olds | 5 (100.0%) | 0 (0.0%) |
| 35 Years and over | 11 (100.0%) | 0 (0.0%) |
| Total | 119 (97.5%) | 3 (2.5%) |
Educational Attainment by Field of Study in Fountain
Bio, nature & agricultural (14 | 26.4%), business (9 | 17.0%), liberal arts & history (8 | 15.1%), physical & health sciences (5 | 9.4%), and science & technology (5 | 9.4%) are the most common fields of study among 53 individuals in Fountain who have obtained a bachelor's degree or higher.
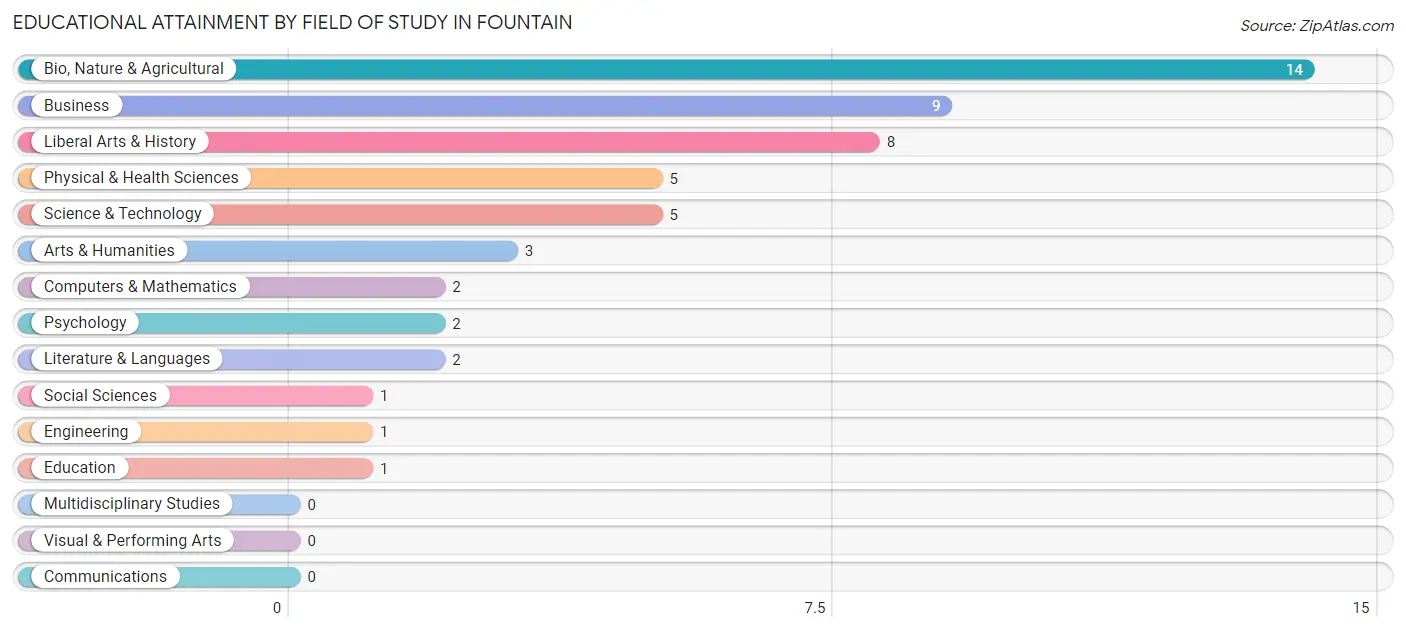
| Field of Study | # Graduates | % Graduates |
| Computers & Mathematics | 2 | 3.8% |
| Bio, Nature & Agricultural | 14 | 26.4% |
| Physical & Health Sciences | 5 | 9.4% |
| Psychology | 2 | 3.8% |
| Social Sciences | 1 | 1.9% |
| Engineering | 1 | 1.9% |
| Multidisciplinary Studies | 0 | 0.0% |
| Science & Technology | 5 | 9.4% |
| Business | 9 | 17.0% |
| Education | 1 | 1.9% |
| Literature & Languages | 2 | 3.8% |
| Liberal Arts & History | 8 | 15.1% |
| Visual & Performing Arts | 0 | 0.0% |
| Communications | 0 | 0.0% |
| Arts & Humanities | 3 | 5.7% |
| Total | 53 | 100.0% |
Transportation & Commute in Fountain
Vehicle Availability by Sex in Fountain
The most prevalent vehicle ownership categories in Fountain are males with 2 vehicles (58, accounting for 40.6%) and females with 2 vehicles (65, making up 39.7%).
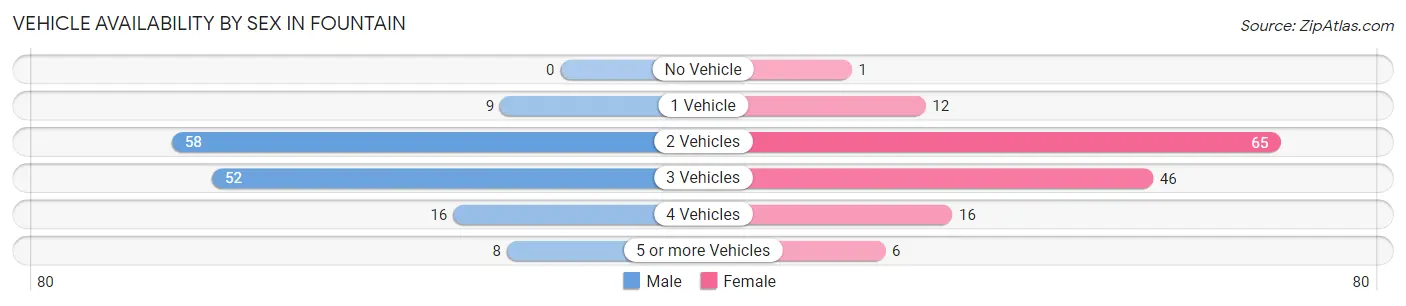
| Vehicles Available | Male | Female |
| No Vehicle | 0 (0.0%) | 1 (0.7%) |
| 1 Vehicle | 9 (6.3%) | 12 (8.2%) |
| 2 Vehicles | 58 (40.6%) | 65 (44.5%) |
| 3 Vehicles | 52 (36.4%) | 46 (31.5%) |
| 4 Vehicles | 16 (11.2%) | 16 (11.0%) |
| 5 or more Vehicles | 8 (5.6%) | 6 (4.1%) |
| Total | 143 (100.0%) | 146 (100.0%) |
Commute Time in Fountain
The most frequently occuring commute durations in Fountain are 45 to 59 minutes (49 commuters, 18.4%), 40 to 44 minutes (48 commuters, 18.0%), and 5 to 9 minutes (42 commuters, 15.8%).
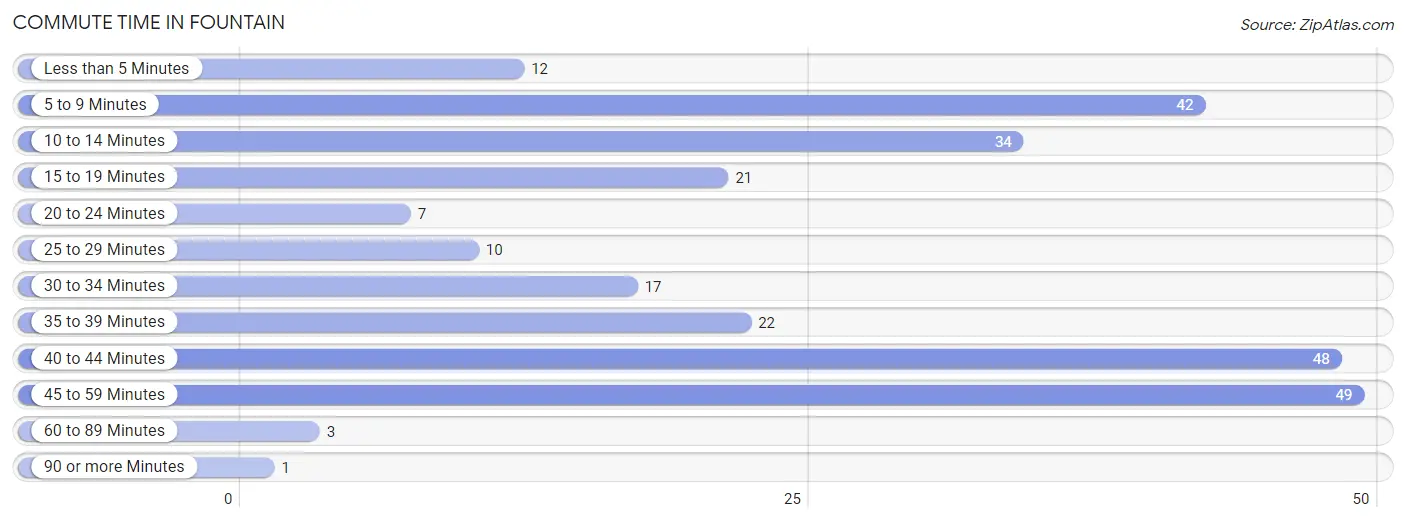
| Commute Time | # Commuters | % Commuters |
| Less than 5 Minutes | 12 | 4.5% |
| 5 to 9 Minutes | 42 | 15.8% |
| 10 to 14 Minutes | 34 | 12.8% |
| 15 to 19 Minutes | 21 | 7.9% |
| 20 to 24 Minutes | 7 | 2.6% |
| 25 to 29 Minutes | 10 | 3.8% |
| 30 to 34 Minutes | 17 | 6.4% |
| 35 to 39 Minutes | 22 | 8.3% |
| 40 to 44 Minutes | 48 | 18.0% |
| 45 to 59 Minutes | 49 | 18.4% |
| 60 to 89 Minutes | 3 | 1.1% |
| 90 or more Minutes | 1 | 0.4% |
Commute Time by Sex in Fountain
The most common commute times in Fountain are 5 to 9 minutes (36 commuters, 25.2%) for males and 40 to 44 minutes (36 commuters, 29.3%) for females.
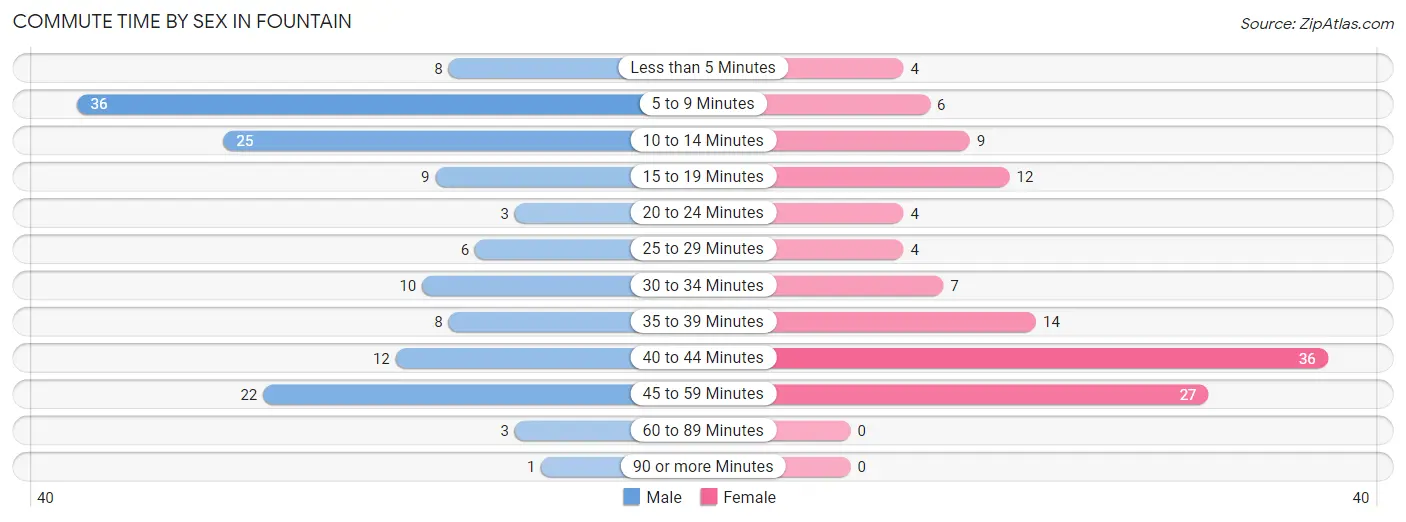
| Commute Time | Male | Female |
| Less than 5 Minutes | 8 (5.6%) | 4 (3.3%) |
| 5 to 9 Minutes | 36 (25.2%) | 6 (4.9%) |
| 10 to 14 Minutes | 25 (17.5%) | 9 (7.3%) |
| 15 to 19 Minutes | 9 (6.3%) | 12 (9.8%) |
| 20 to 24 Minutes | 3 (2.1%) | 4 (3.3%) |
| 25 to 29 Minutes | 6 (4.2%) | 4 (3.3%) |
| 30 to 34 Minutes | 10 (7.0%) | 7 (5.7%) |
| 35 to 39 Minutes | 8 (5.6%) | 14 (11.4%) |
| 40 to 44 Minutes | 12 (8.4%) | 36 (29.3%) |
| 45 to 59 Minutes | 22 (15.4%) | 27 (22.0%) |
| 60 to 89 Minutes | 3 (2.1%) | 0 (0.0%) |
| 90 or more Minutes | 1 (0.7%) | 0 (0.0%) |
Time of Departure to Work by Sex in Fountain
The most frequent times of departure to work in Fountain are 7:00 AM to 7:29 AM (40, 28.0%) for males and 5:30 AM to 5:59 AM (45, 36.6%) for females.
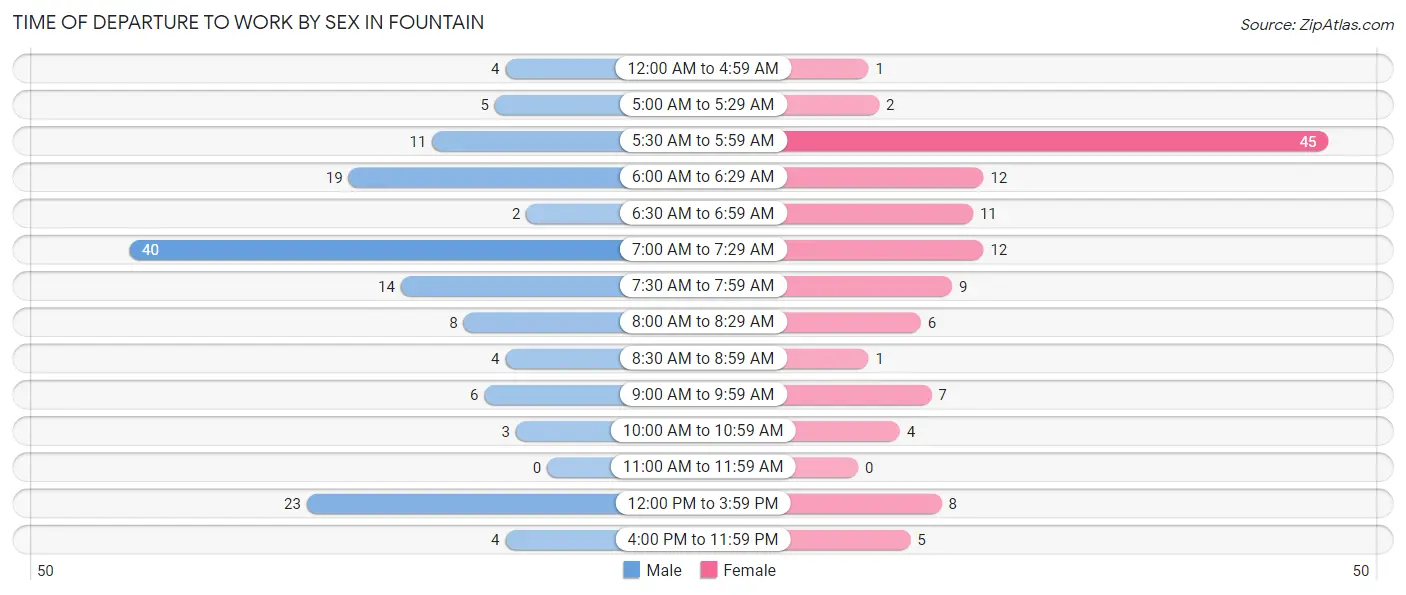
| Time of Departure | Male | Female |
| 12:00 AM to 4:59 AM | 4 (2.8%) | 1 (0.8%) |
| 5:00 AM to 5:29 AM | 5 (3.5%) | 2 (1.6%) |
| 5:30 AM to 5:59 AM | 11 (7.7%) | 45 (36.6%) |
| 6:00 AM to 6:29 AM | 19 (13.3%) | 12 (9.8%) |
| 6:30 AM to 6:59 AM | 2 (1.4%) | 11 (8.9%) |
| 7:00 AM to 7:29 AM | 40 (28.0%) | 12 (9.8%) |
| 7:30 AM to 7:59 AM | 14 (9.8%) | 9 (7.3%) |
| 8:00 AM to 8:29 AM | 8 (5.6%) | 6 (4.9%) |
| 8:30 AM to 8:59 AM | 4 (2.8%) | 1 (0.8%) |
| 9:00 AM to 9:59 AM | 6 (4.2%) | 7 (5.7%) |
| 10:00 AM to 10:59 AM | 3 (2.1%) | 4 (3.3%) |
| 11:00 AM to 11:59 AM | 0 (0.0%) | 0 (0.0%) |
| 12:00 PM to 3:59 PM | 23 (16.1%) | 8 (6.5%) |
| 4:00 PM to 11:59 PM | 4 (2.8%) | 5 (4.1%) |
| Total | 143 (100.0%) | 123 (100.0%) |
Housing Occupancy in Fountain
Occupancy by Ownership in Fountain
Of the total 199 dwellings in Fountain, owner-occupied units account for 175 (87.9%), while renter-occupied units make up 24 (12.1%).
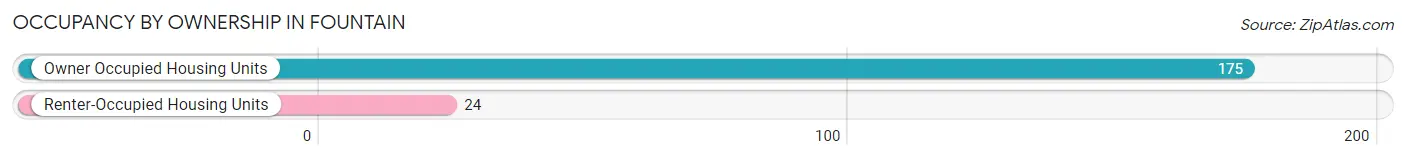
| Occupancy | # Housing Units | % Housing Units |
| Owner Occupied Housing Units | 175 | 87.9% |
| Renter-Occupied Housing Units | 24 | 12.1% |
| Total Occupied Housing Units | 199 | 100.0% |
Occupancy by Household Size in Fountain
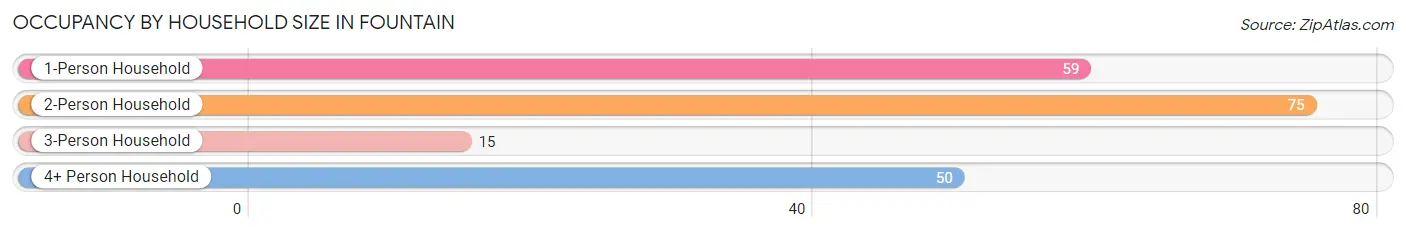
| Household Size | # Housing Units | % Housing Units |
| 1-Person Household | 59 | 29.6% |
| 2-Person Household | 75 | 37.7% |
| 3-Person Household | 15 | 7.5% |
| 4+ Person Household | 50 | 25.1% |
| Total Housing Units | 199 | 100.0% |
Occupancy by Ownership by Household Size in Fountain
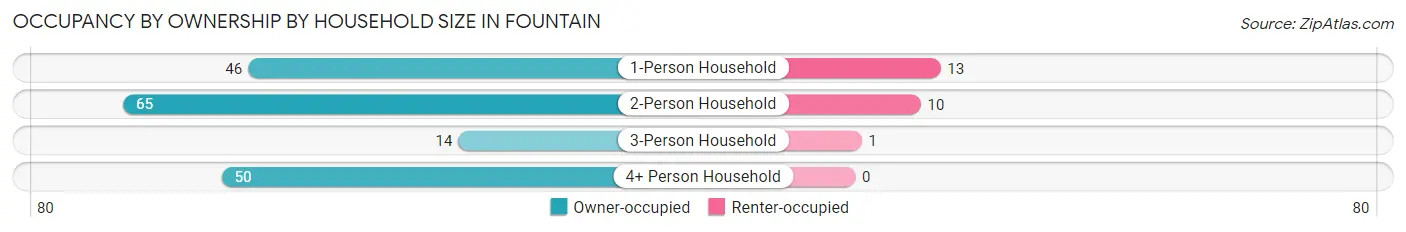
| Household Size | Owner-occupied | Renter-occupied |
| 1-Person Household | 46 (78.0%) | 13 (22.0%) |
| 2-Person Household | 65 (86.7%) | 10 (13.3%) |
| 3-Person Household | 14 (93.3%) | 1 (6.7%) |
| 4+ Person Household | 50 (100.0%) | 0 (0.0%) |
| Total Housing Units | 175 (87.9%) | 24 (12.1%) |
Occupancy by Educational Attainment in Fountain
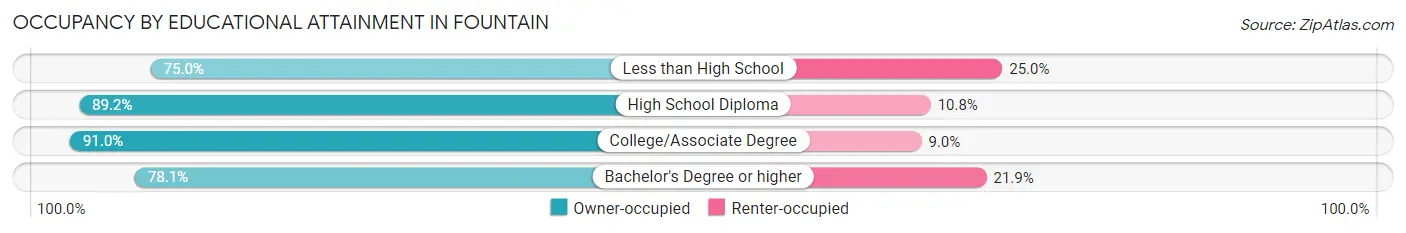
| Household Size | Owner-occupied | Renter-occupied |
| Less than High School | 3 (75.0%) | 1 (25.0%) |
| High School Diploma | 66 (89.2%) | 8 (10.8%) |
| College/Associate Degree | 81 (91.0%) | 8 (9.0%) |
| Bachelor's Degree or higher | 25 (78.1%) | 7 (21.9%) |
Occupancy by Age of Householder in Fountain
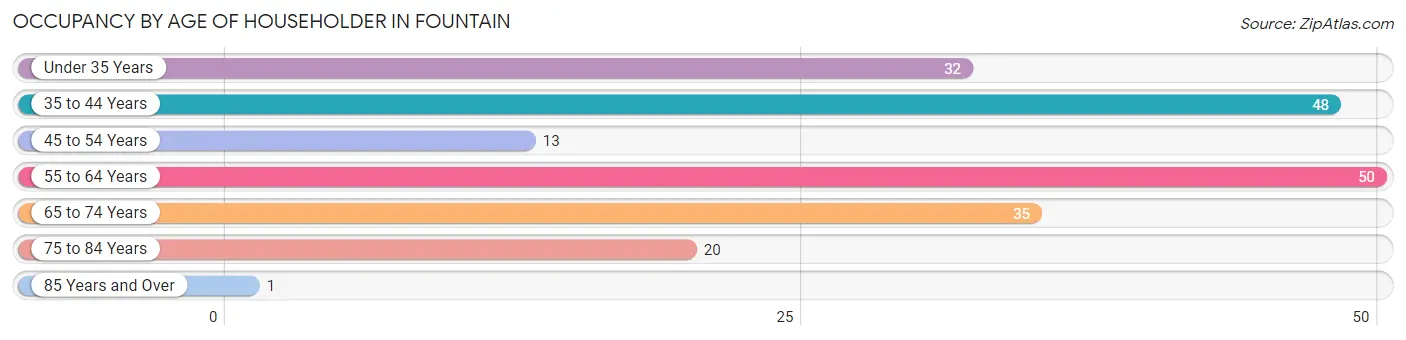
| Age Bracket | # Households | % Households |
| Under 35 Years | 32 | 16.1% |
| 35 to 44 Years | 48 | 24.1% |
| 45 to 54 Years | 13 | 6.5% |
| 55 to 64 Years | 50 | 25.1% |
| 65 to 74 Years | 35 | 17.6% |
| 75 to 84 Years | 20 | 10.1% |
| 85 Years and Over | 1 | 0.5% |
| Total | 199 | 100.0% |
Housing Finances in Fountain
Median Income by Occupancy in Fountain
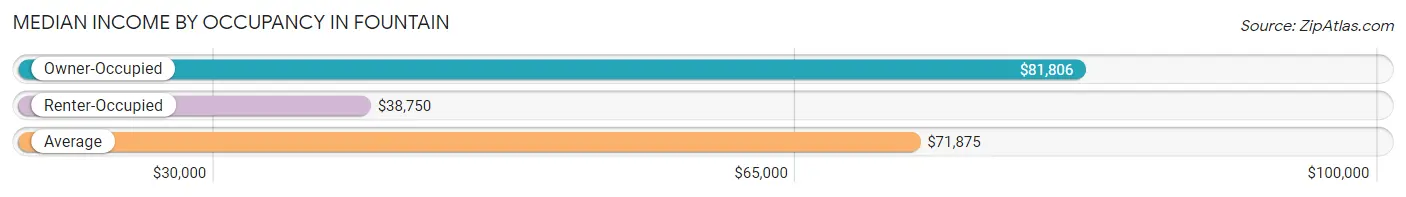
| Occupancy Type | # Households | Median Income |
| Owner-Occupied | 175 (87.9%) | $81,806 |
| Renter-Occupied | 24 (12.1%) | $38,750 |
| Average | 199 (100.0%) | $71,875 |
Occupancy by Householder Income Bracket in Fountain
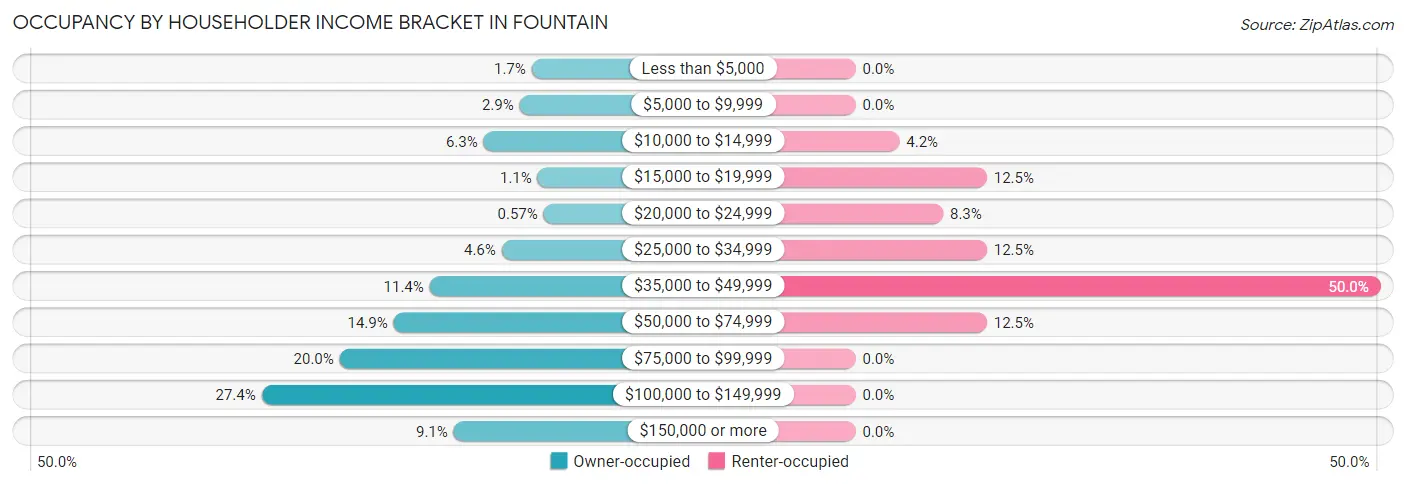
| Income Bracket | Owner-occupied | Renter-occupied |
| Less than $5,000 | 3 (1.7%) | 0 (0.0%) |
| $5,000 to $9,999 | 5 (2.9%) | 0 (0.0%) |
| $10,000 to $14,999 | 11 (6.3%) | 1 (4.2%) |
| $15,000 to $19,999 | 2 (1.1%) | 3 (12.5%) |
| $20,000 to $24,999 | 1 (0.6%) | 2 (8.3%) |
| $25,000 to $34,999 | 8 (4.6%) | 3 (12.5%) |
| $35,000 to $49,999 | 20 (11.4%) | 12 (50.0%) |
| $50,000 to $74,999 | 26 (14.9%) | 3 (12.5%) |
| $75,000 to $99,999 | 35 (20.0%) | 0 (0.0%) |
| $100,000 to $149,999 | 48 (27.4%) | 0 (0.0%) |
| $150,000 or more | 16 (9.1%) | 0 (0.0%) |
| Total | 175 (100.0%) | 24 (100.0%) |
Monthly Housing Cost Tiers in Fountain
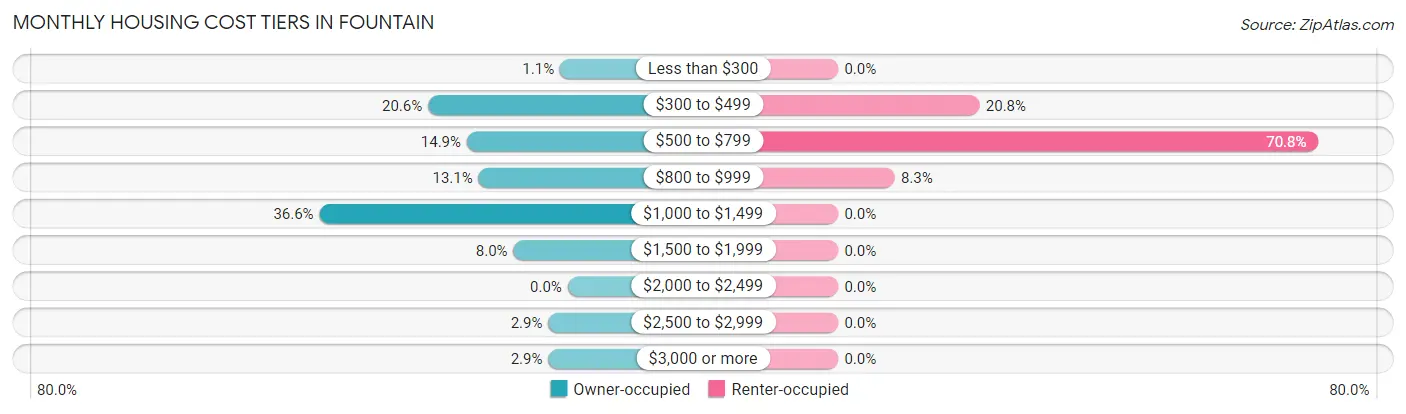
| Monthly Cost | Owner-occupied | Renter-occupied |
| Less than $300 | 2 (1.1%) | 0 (0.0%) |
| $300 to $499 | 36 (20.6%) | 5 (20.8%) |
| $500 to $799 | 26 (14.9%) | 17 (70.8%) |
| $800 to $999 | 23 (13.1%) | 2 (8.3%) |
| $1,000 to $1,499 | 64 (36.6%) | 0 (0.0%) |
| $1,500 to $1,999 | 14 (8.0%) | 0 (0.0%) |
| $2,000 to $2,499 | 0 (0.0%) | 0 (0.0%) |
| $2,500 to $2,999 | 5 (2.9%) | 0 (0.0%) |
| $3,000 or more | 5 (2.9%) | 0 (0.0%) |
| Total | 175 (100.0%) | 24 (100.0%) |
Physical Housing Characteristics in Fountain
Housing Structures in Fountain
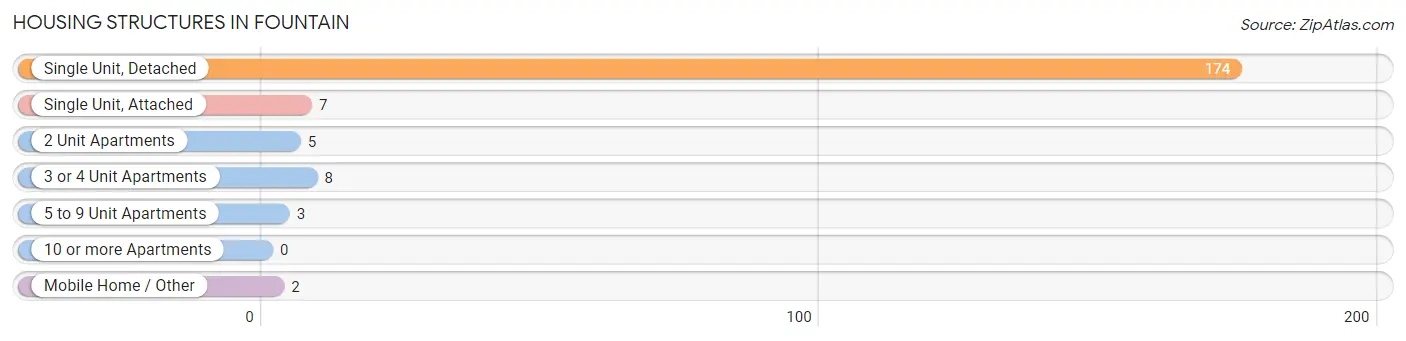
| Structure Type | # Housing Units | % Housing Units |
| Single Unit, Detached | 174 | 87.4% |
| Single Unit, Attached | 7 | 3.5% |
| 2 Unit Apartments | 5 | 2.5% |
| 3 or 4 Unit Apartments | 8 | 4.0% |
| 5 to 9 Unit Apartments | 3 | 1.5% |
| 10 or more Apartments | 0 | 0.0% |
| Mobile Home / Other | 2 | 1.0% |
| Total | 199 | 100.0% |
Housing Structures by Occupancy in Fountain
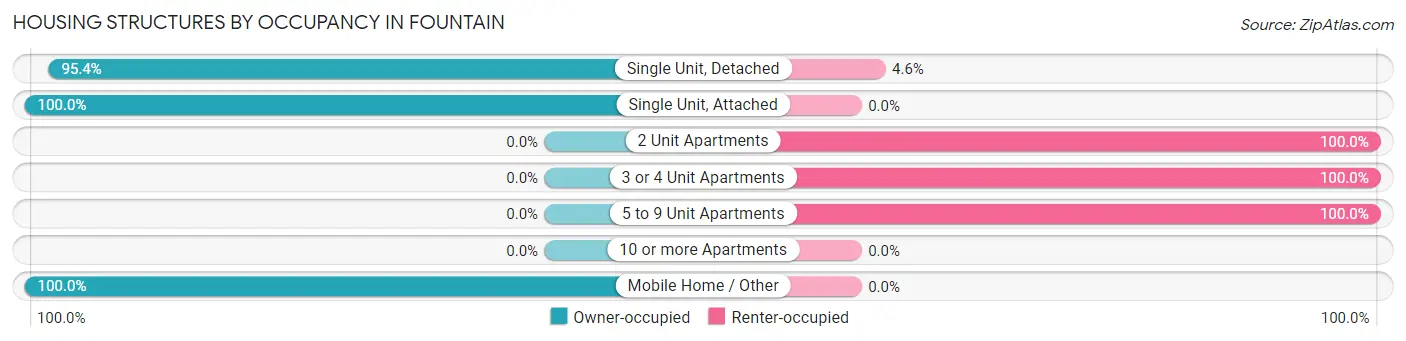
| Structure Type | Owner-occupied | Renter-occupied |
| Single Unit, Detached | 166 (95.4%) | 8 (4.6%) |
| Single Unit, Attached | 7 (100.0%) | 0 (0.0%) |
| 2 Unit Apartments | 0 (0.0%) | 5 (100.0%) |
| 3 or 4 Unit Apartments | 0 (0.0%) | 8 (100.0%) |
| 5 to 9 Unit Apartments | 0 (0.0%) | 3 (100.0%) |
| 10 or more Apartments | 0 (0.0%) | 0 (0.0%) |
| Mobile Home / Other | 2 (100.0%) | 0 (0.0%) |
| Total | 175 (87.9%) | 24 (12.1%) |
Housing Structures by Number of Rooms in Fountain
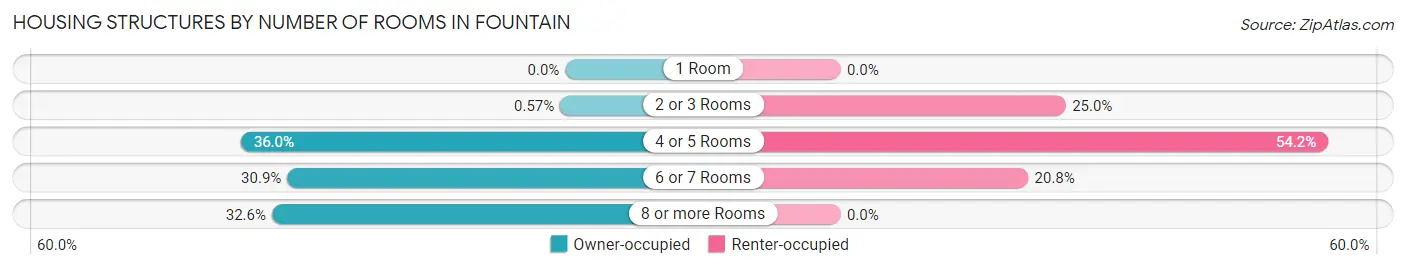
| Number of Rooms | Owner-occupied | Renter-occupied |
| 1 Room | 0 (0.0%) | 0 (0.0%) |
| 2 or 3 Rooms | 1 (0.6%) | 6 (25.0%) |
| 4 or 5 Rooms | 63 (36.0%) | 13 (54.2%) |
| 6 or 7 Rooms | 54 (30.9%) | 5 (20.8%) |
| 8 or more Rooms | 57 (32.6%) | 0 (0.0%) |
| Total | 175 (100.0%) | 24 (100.0%) |
Housing Structure by Heating Type in Fountain
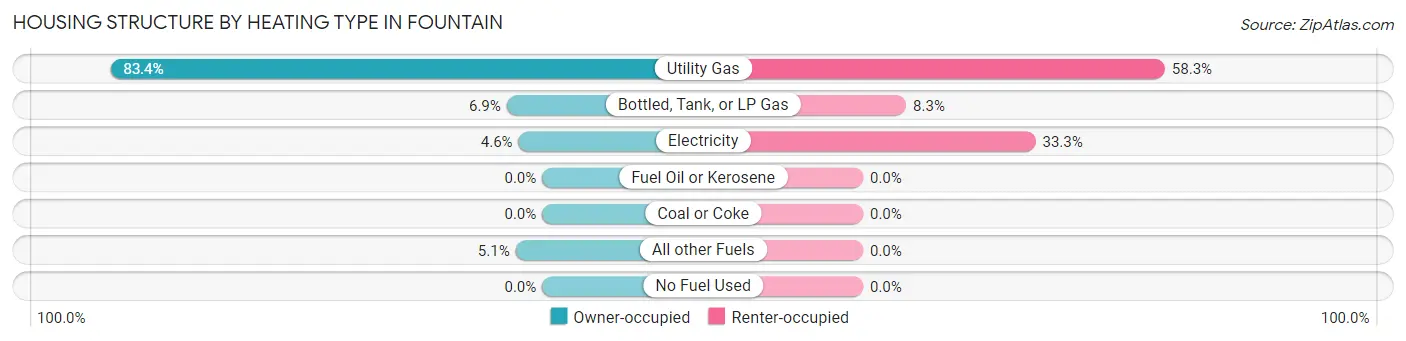
| Heating Type | Owner-occupied | Renter-occupied |
| Utility Gas | 146 (83.4%) | 14 (58.3%) |
| Bottled, Tank, or LP Gas | 12 (6.9%) | 2 (8.3%) |
| Electricity | 8 (4.6%) | 8 (33.3%) |
| Fuel Oil or Kerosene | 0 (0.0%) | 0 (0.0%) |
| Coal or Coke | 0 (0.0%) | 0 (0.0%) |
| All other Fuels | 9 (5.1%) | 0 (0.0%) |
| No Fuel Used | 0 (0.0%) | 0 (0.0%) |
| Total | 175 (100.0%) | 24 (100.0%) |
Household Vehicle Usage in Fountain
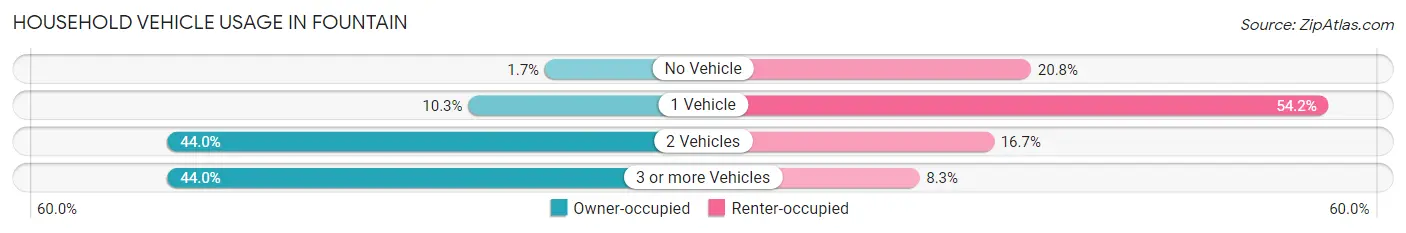
| Vehicles per Household | Owner-occupied | Renter-occupied |
| No Vehicle | 3 (1.7%) | 5 (20.8%) |
| 1 Vehicle | 18 (10.3%) | 13 (54.2%) |
| 2 Vehicles | 77 (44.0%) | 4 (16.7%) |
| 3 or more Vehicles | 77 (44.0%) | 2 (8.3%) |
| Total | 175 (100.0%) | 24 (100.0%) |
Real Estate & Mortgages in Fountain
Real Estate and Mortgage Overview in Fountain
| Characteristic | Without Mortgage | With Mortgage |
| Housing Units | 64 | 111 |
| Median Property Value | $187,500 | $152,700 |
| Median Household Income | $60,500 | $14 |
| Monthly Housing Costs | $479 | $0 |
| Real Estate Taxes | $1,435 | $4 |
Property Value by Mortgage Status in Fountain
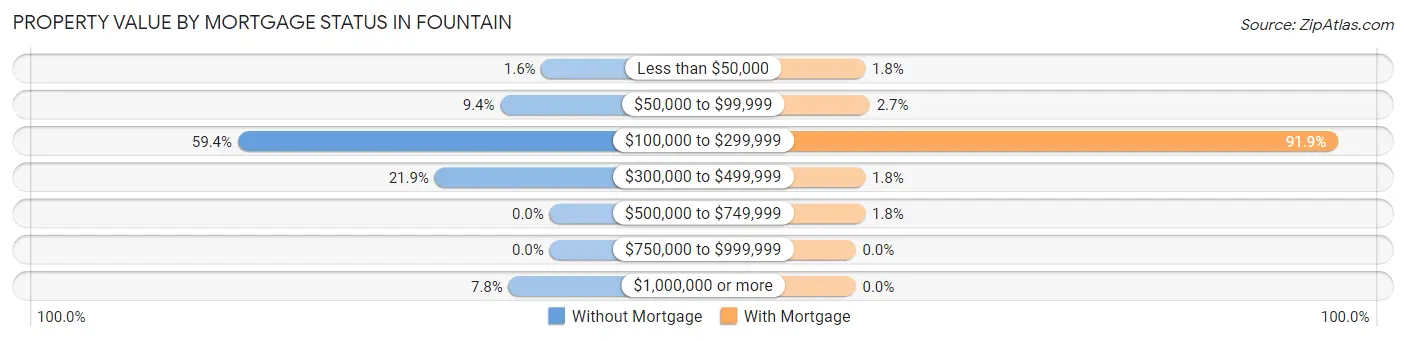
| Property Value | Without Mortgage | With Mortgage |
| Less than $50,000 | 1 (1.6%) | 2 (1.8%) |
| $50,000 to $99,999 | 6 (9.4%) | 3 (2.7%) |
| $100,000 to $299,999 | 38 (59.4%) | 102 (91.9%) |
| $300,000 to $499,999 | 14 (21.9%) | 2 (1.8%) |
| $500,000 to $749,999 | 0 (0.0%) | 2 (1.8%) |
| $750,000 to $999,999 | 0 (0.0%) | 0 (0.0%) |
| $1,000,000 or more | 5 (7.8%) | 0 (0.0%) |
| Total | 64 (100.0%) | 111 (100.0%) |
Household Income by Mortgage Status in Fountain
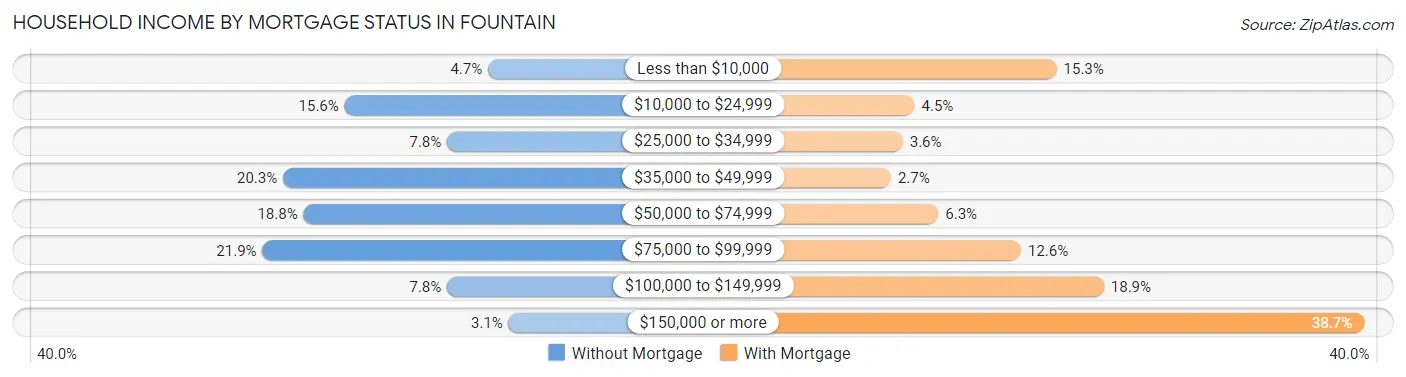
| Household Income | Without Mortgage | With Mortgage |
| Less than $10,000 | 3 (4.7%) | 17 (15.3%) |
| $10,000 to $24,999 | 10 (15.6%) | 5 (4.5%) |
| $25,000 to $34,999 | 5 (7.8%) | 4 (3.6%) |
| $35,000 to $49,999 | 13 (20.3%) | 3 (2.7%) |
| $50,000 to $74,999 | 12 (18.8%) | 7 (6.3%) |
| $75,000 to $99,999 | 14 (21.9%) | 14 (12.6%) |
| $100,000 to $149,999 | 5 (7.8%) | 21 (18.9%) |
| $150,000 or more | 2 (3.1%) | 43 (38.7%) |
| Total | 64 (100.0%) | 111 (100.0%) |
Property Value to Household Income Ratio in Fountain
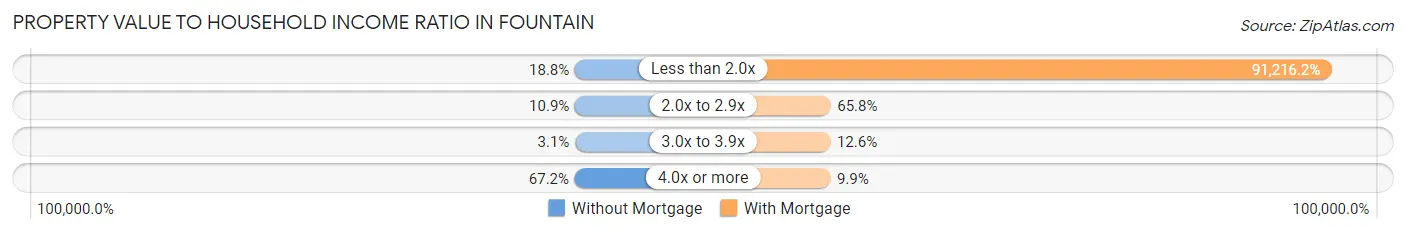
| Value-to-Income Ratio | Without Mortgage | With Mortgage |
| Less than 2.0x | 12 (18.8%) | 101,250 (91,216.2%) |
| 2.0x to 2.9x | 7 (10.9%) | 73 (65.8%) |
| 3.0x to 3.9x | 2 (3.1%) | 14 (12.6%) |
| 4.0x or more | 43 (67.2%) | 11 (9.9%) |
| Total | 64 (100.0%) | 111 (100.0%) |
Real Estate Taxes by Mortgage Status in Fountain
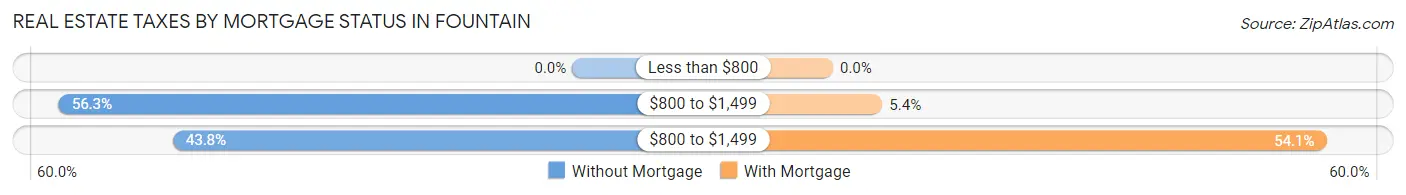
| Property Taxes | Without Mortgage | With Mortgage |
| Less than $800 | 0 (0.0%) | 0 (0.0%) |
| $800 to $1,499 | 36 (56.2%) | 6 (5.4%) |
| $800 to $1,499 | 28 (43.8%) | 60 (54.0%) |
| Total | 64 (100.0%) | 111 (100.0%) |
Health & Disability in Fountain
Health Insurance Coverage by Age in Fountain
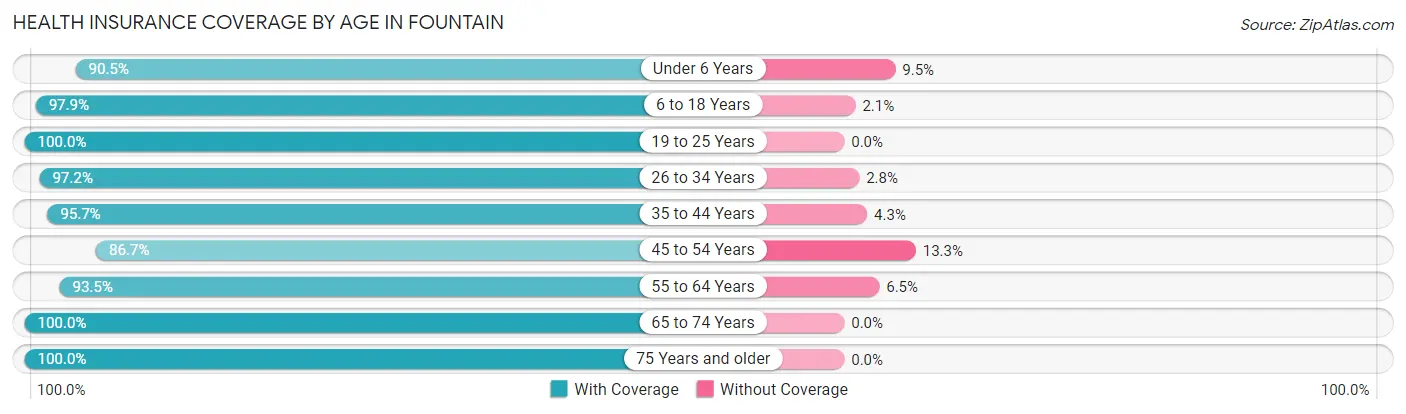
| Age Bracket | With Coverage | Without Coverage |
| Under 6 Years | 19 (90.5%) | 2 (9.5%) |
| 6 to 18 Years | 94 (97.9%) | 2 (2.1%) |
| 19 to 25 Years | 39 (100.0%) | 0 (0.0%) |
| 26 to 34 Years | 35 (97.2%) | 1 (2.8%) |
| 35 to 44 Years | 90 (95.7%) | 4 (4.3%) |
| 45 to 54 Years | 26 (86.7%) | 4 (13.3%) |
| 55 to 64 Years | 86 (93.5%) | 6 (6.5%) |
| 65 to 74 Years | 47 (100.0%) | 0 (0.0%) |
| 75 Years and older | 29 (100.0%) | 0 (0.0%) |
| Total | 465 (96.1%) | 19 (3.9%) |
Health Insurance Coverage by Citizenship Status in Fountain
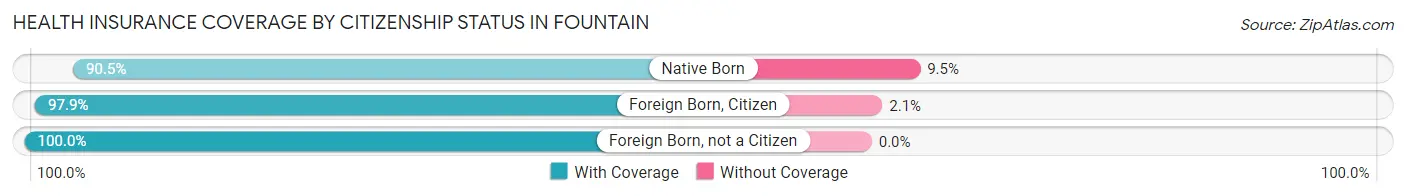
| Citizenship Status | With Coverage | Without Coverage |
| Native Born | 19 (90.5%) | 2 (9.5%) |
| Foreign Born, Citizen | 94 (97.9%) | 2 (2.1%) |
| Foreign Born, not a Citizen | 39 (100.0%) | 0 (0.0%) |
Health Insurance Coverage by Household Income in Fountain
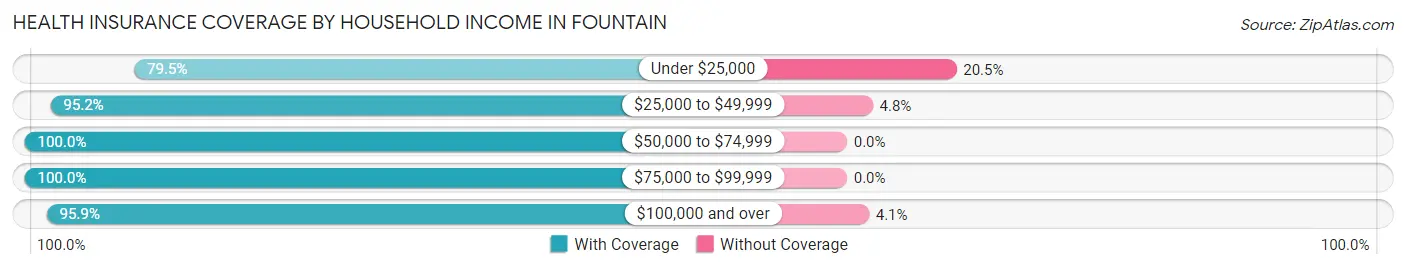
| Household Income | With Coverage | Without Coverage |
| Under $25,000 | 31 (79.5%) | 8 (20.5%) |
| $25,000 to $49,999 | 59 (95.2%) | 3 (4.8%) |
| $50,000 to $74,999 | 65 (100.0%) | 0 (0.0%) |
| $75,000 to $99,999 | 124 (100.0%) | 0 (0.0%) |
| $100,000 and over | 186 (95.9%) | 8 (4.1%) |
Public vs Private Health Insurance Coverage by Age in Fountain
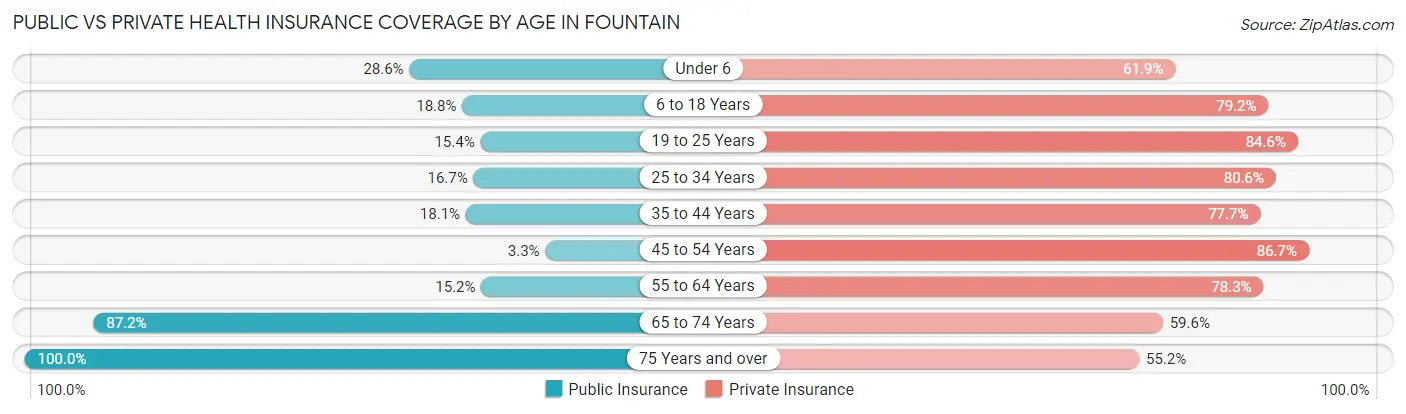
| Age Bracket | Public Insurance | Private Insurance |
| Under 6 | 6 (28.6%) | 13 (61.9%) |
| 6 to 18 Years | 18 (18.8%) | 76 (79.2%) |
| 19 to 25 Years | 6 (15.4%) | 33 (84.6%) |
| 25 to 34 Years | 6 (16.7%) | 29 (80.6%) |
| 35 to 44 Years | 17 (18.1%) | 73 (77.7%) |
| 45 to 54 Years | 1 (3.3%) | 26 (86.7%) |
| 55 to 64 Years | 14 (15.2%) | 72 (78.3%) |
| 65 to 74 Years | 41 (87.2%) | 28 (59.6%) |
| 75 Years and over | 29 (100.0%) | 16 (55.2%) |
| Total | 138 (28.5%) | 366 (75.6%) |
Disability Status by Sex by Age in Fountain
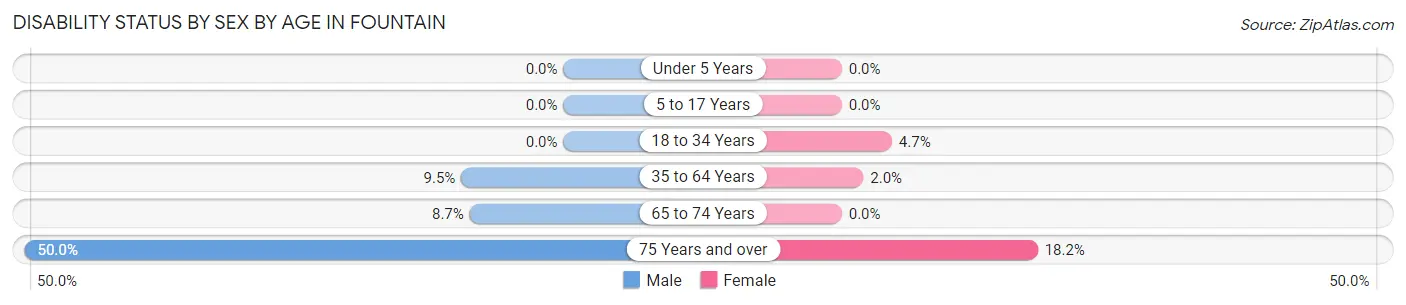
| Age Bracket | Male | Female |
| Under 5 Years | 0 (0.0%) | 0 (0.0%) |
| 5 to 17 Years | 0 (0.0%) | 0 (0.0%) |
| 18 to 34 Years | 0 (0.0%) | 2 (4.6%) |
| 35 to 64 Years | 11 (9.5%) | 2 (2.0%) |
| 65 to 74 Years | 2 (8.7%) | 0 (0.0%) |
| 75 Years and over | 9 (50.0%) | 2 (18.2%) |
Disability Class by Sex by Age in Fountain
Disability Class: Hearing Difficulty
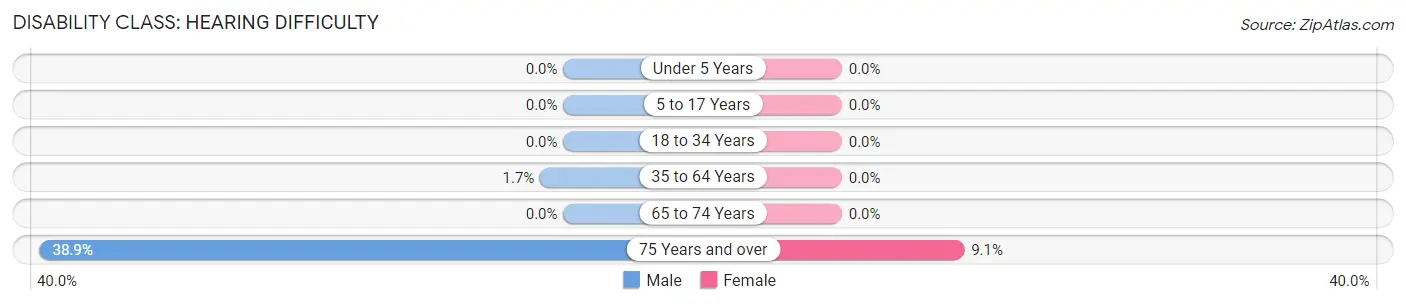
| Age Bracket | Male | Female |
| Under 5 Years | 0 (0.0%) | 0 (0.0%) |
| 5 to 17 Years | 0 (0.0%) | 0 (0.0%) |
| 18 to 34 Years | 0 (0.0%) | 0 (0.0%) |
| 35 to 64 Years | 2 (1.7%) | 0 (0.0%) |
| 65 to 74 Years | 0 (0.0%) | 0 (0.0%) |
| 75 Years and over | 7 (38.9%) | 1 (9.1%) |
Disability Class: Vision Difficulty
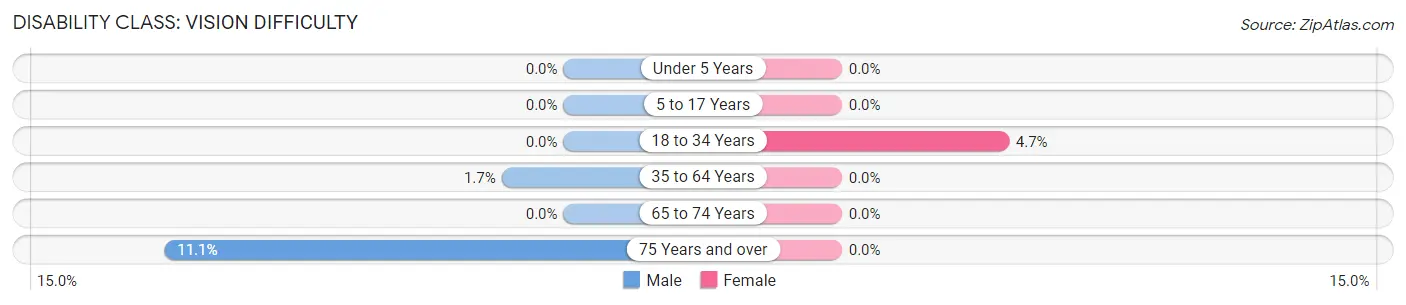
| Age Bracket | Male | Female |
| Under 5 Years | 0 (0.0%) | 0 (0.0%) |
| 5 to 17 Years | 0 (0.0%) | 0 (0.0%) |
| 18 to 34 Years | 0 (0.0%) | 2 (4.6%) |
| 35 to 64 Years | 2 (1.7%) | 0 (0.0%) |
| 65 to 74 Years | 0 (0.0%) | 0 (0.0%) |
| 75 Years and over | 2 (11.1%) | 0 (0.0%) |
Disability Class: Cognitive Difficulty
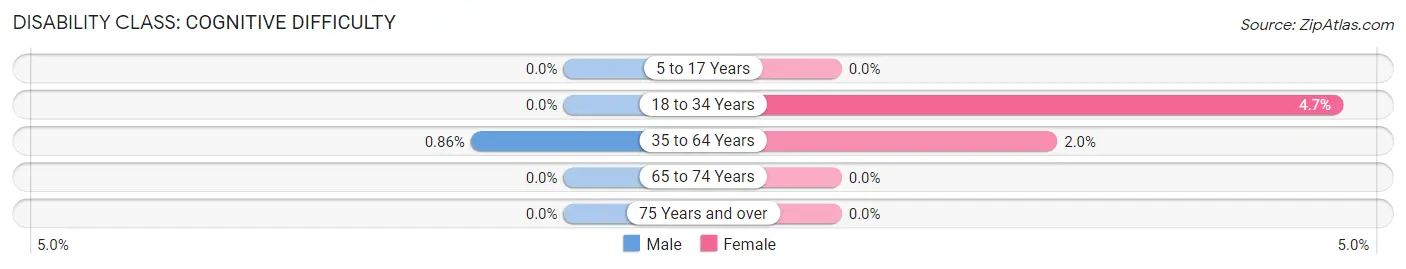
| Age Bracket | Male | Female |
| 5 to 17 Years | 0 (0.0%) | 0 (0.0%) |
| 18 to 34 Years | 0 (0.0%) | 2 (4.6%) |
| 35 to 64 Years | 1 (0.9%) | 2 (2.0%) |
| 65 to 74 Years | 0 (0.0%) | 0 (0.0%) |
| 75 Years and over | 0 (0.0%) | 0 (0.0%) |
Disability Class: Ambulatory Difficulty
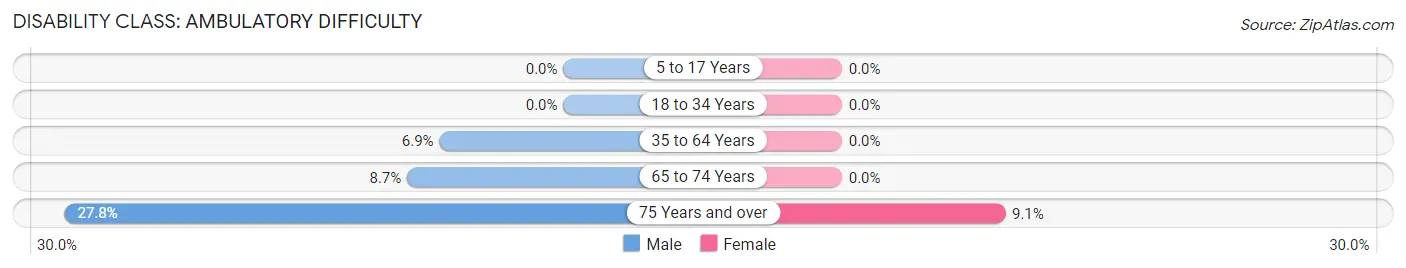
| Age Bracket | Male | Female |
| 5 to 17 Years | 0 (0.0%) | 0 (0.0%) |
| 18 to 34 Years | 0 (0.0%) | 0 (0.0%) |
| 35 to 64 Years | 8 (6.9%) | 0 (0.0%) |
| 65 to 74 Years | 2 (8.7%) | 0 (0.0%) |
| 75 Years and over | 5 (27.8%) | 1 (9.1%) |
Disability Class: Self-Care Difficulty
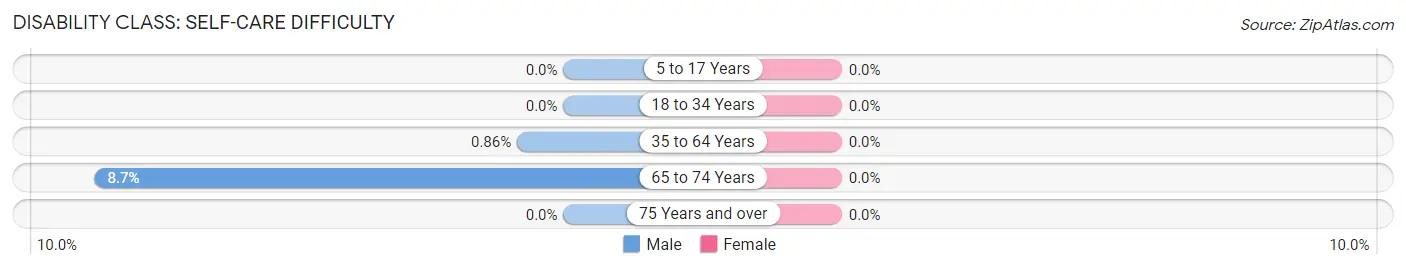
| Age Bracket | Male | Female |
| 5 to 17 Years | 0 (0.0%) | 0 (0.0%) |
| 18 to 34 Years | 0 (0.0%) | 0 (0.0%) |
| 35 to 64 Years | 1 (0.9%) | 0 (0.0%) |
| 65 to 74 Years | 2 (8.7%) | 0 (0.0%) |
| 75 Years and over | 0 (0.0%) | 0 (0.0%) |
Technology Access in Fountain
Computing Device Access in Fountain
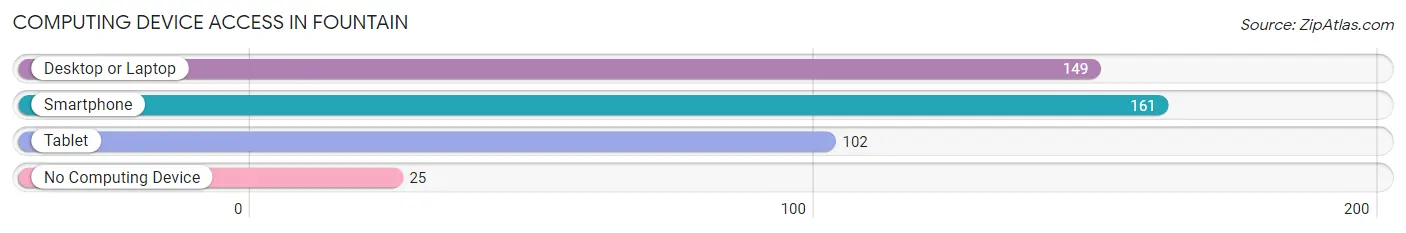
| Device Type | # Households | % Households |
| Desktop or Laptop | 149 | 74.9% |
| Smartphone | 161 | 80.9% |
| Tablet | 102 | 51.3% |
| No Computing Device | 25 | 12.6% |
| Total | 199 | 100.0% |
Internet Access in Fountain
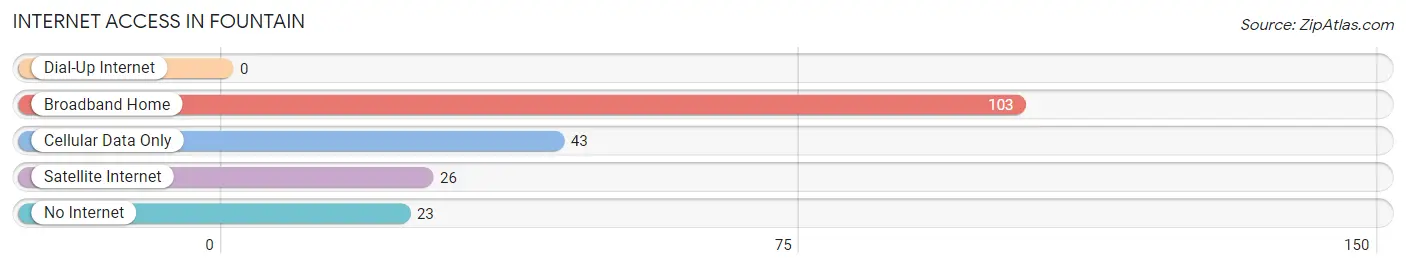
| Internet Type | # Households | % Households |
| Dial-Up Internet | 0 | 0.0% |
| Broadband Home | 103 | 51.8% |
| Cellular Data Only | 43 | 21.6% |
| Satellite Internet | 26 | 13.1% |
| No Internet | 23 | 11.6% |
| Total | 199 | 100.0% |
Fountain Summary
Fountain, Minnesota is a small city located in Fillmore County, in the southeastern corner of the state. It is situated on the banks of the Root River, and is surrounded by rolling hills and farmland. The city has a population of just over 1,000 people, and is known for its small-town charm and friendly atmosphere.
Fountain was founded in 1856 by a group of settlers from New York. The city was named after the nearby Fountain Creek, which was named for its abundance of natural springs. The settlers were attracted to the area by its fertile soil and abundant natural resources. The city quickly grew, and by the late 19th century, it had become a thriving agricultural center.
Geographically, Fountain is located in the Driftless Area of Minnesota, which is characterized by its rugged terrain and rolling hills. The city is situated on the banks of the Root River, which is a tributary of the Mississippi River. The city is surrounded by farmland, and is home to several small lakes and ponds.
The economy of Fountain is largely based on agriculture. The city is home to several large farms, and the surrounding area is known for its production of corn, soybeans, and other crops. In addition, the city is home to several small businesses, including a grocery store, a hardware store, and a few restaurants.
Demographically, Fountain is a predominantly white city, with a population that is 97.3% white. The median household income is $45,000, and the median age is 44. The city is home to a small but growing Hispanic population, which makes up 2.7% of the population.
Fountain is a small city with a big heart. It is a place where people come together to celebrate the simple things in life, and to enjoy the beauty of the surrounding countryside. It is a place where people can find a sense of community and belonging, and where they can find a place to call home.
Common Questions
What is Per Capita Income in Fountain?
Per Capita income in Fountain is $33,380.
What is the Median Family Income in Fountain?
Median Family Income in Fountain is $90,893.
What is the Median Household income in Fountain?
Median Household Income in Fountain is $71,875.
What is Income or Wage Gap in Fountain?
Income or Wage Gap in Fountain is 16.2%.
Women in Fountain earn 83.8 cents for every dollar earned by a man.
What is Inequality or Gini Index in Fountain?
Inequality or Gini Index in Fountain is 0.36.
What is the Total Population of Fountain?
Total Population of Fountain is 484.
What is the Total Male Population of Fountain?
Total Male Population of Fountain is 268.
What is the Total Female Population of Fountain?
Total Female Population of Fountain is 216.
What is the Ratio of Males per 100 Females in Fountain?
There are 124.07 Males per 100 Females in Fountain.
What is the Ratio of Females per 100 Males in Fountain?
There are 80.60 Females per 100 Males in Fountain.
What is the Median Population Age in Fountain?
Median Population Age in Fountain is 40.4 Years.
What is the Average Family Size in Fountain
Average Family Size in Fountain is 3.1 People.
What is the Average Household Size in Fountain
Average Household Size in Fountain is 2.4 People.
How Large is the Labor Force in Fountain?
There are 313 People in the Labor Forcein in Fountain.
What is the Percentage of People in the Labor Force in Fountain?
80.1% of People are in the Labor Force in Fountain.
What is the Unemployment Rate in Fountain?
Unemployment Rate in Fountain is 7.7%.