Newfolden, MN Map & Demographics
Newfolden Map
Newfolden Overview
$28,687
PER CAPITA INCOME
$73,194
AVG FAMILY INCOME
$68,750
AVG HOUSEHOLD INCOME
7.7%
WAGE / INCOME GAP [ % ]
92.3¢/ $1
WAGE / INCOME GAP [ $ ]
0.33
INEQUALITY / GINI INDEX
448
TOTAL POPULATION
199
MALE POPULATION
249
FEMALE POPULATION
79.92
MALES / 100 FEMALES
125.13
FEMALES / 100 MALES
29.0
MEDIAN AGE
3.6
AVG FAMILY SIZE
2.9
AVG HOUSEHOLD SIZE
245
LABOR FORCE [ PEOPLE ]
75.4%
PERCENT IN LABOR FORCE
1.6%
UNEMPLOYMENT RATE
Newfolden Zip Codes
Newfolden Area Codes
Income in Newfolden
Income Overview in Newfolden
Per Capita Income in Newfolden is $28,687, while median incomes of families and households are $73,194 and $68,750 respectively.
| Characteristic | Number | Measure |
| Per Capita Income | 448 | $28,687 |
| Median Family Income | 93 | $73,194 |
| Mean Family Income | 93 | $76,814 |
| Median Household Income | 153 | $68,750 |
| Mean Household Income | 153 | $75,608 |
| Income Deficit | 93 | $0 |
| Wage / Income Gap (%) | 448 | 7.72% |
| Wage / Income Gap ($) | 448 | 92.28¢ per $1 |
| Gini / Inequality Index | 448 | 0.33 |
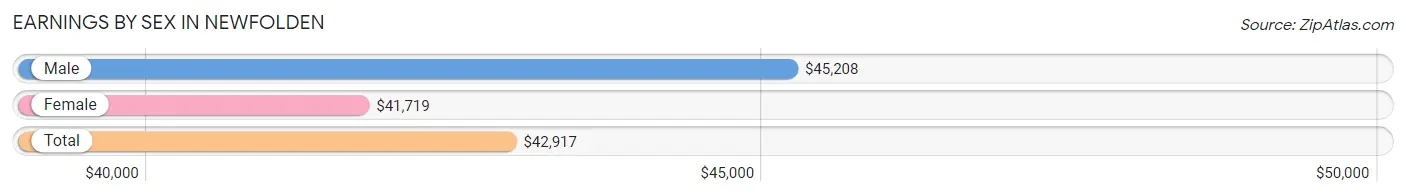
Earnings by Sex in Newfolden
Average Earnings in Newfolden are $42,917, $45,208 for men and $41,719 for women, a difference of 7.7%.
| Sex | Number | Average Earnings |
| Male | 114 (43.3%) | $45,208 |
| Female | 149 (56.7%) | $41,719 |
| Total | 263 (100.0%) | $42,917 |
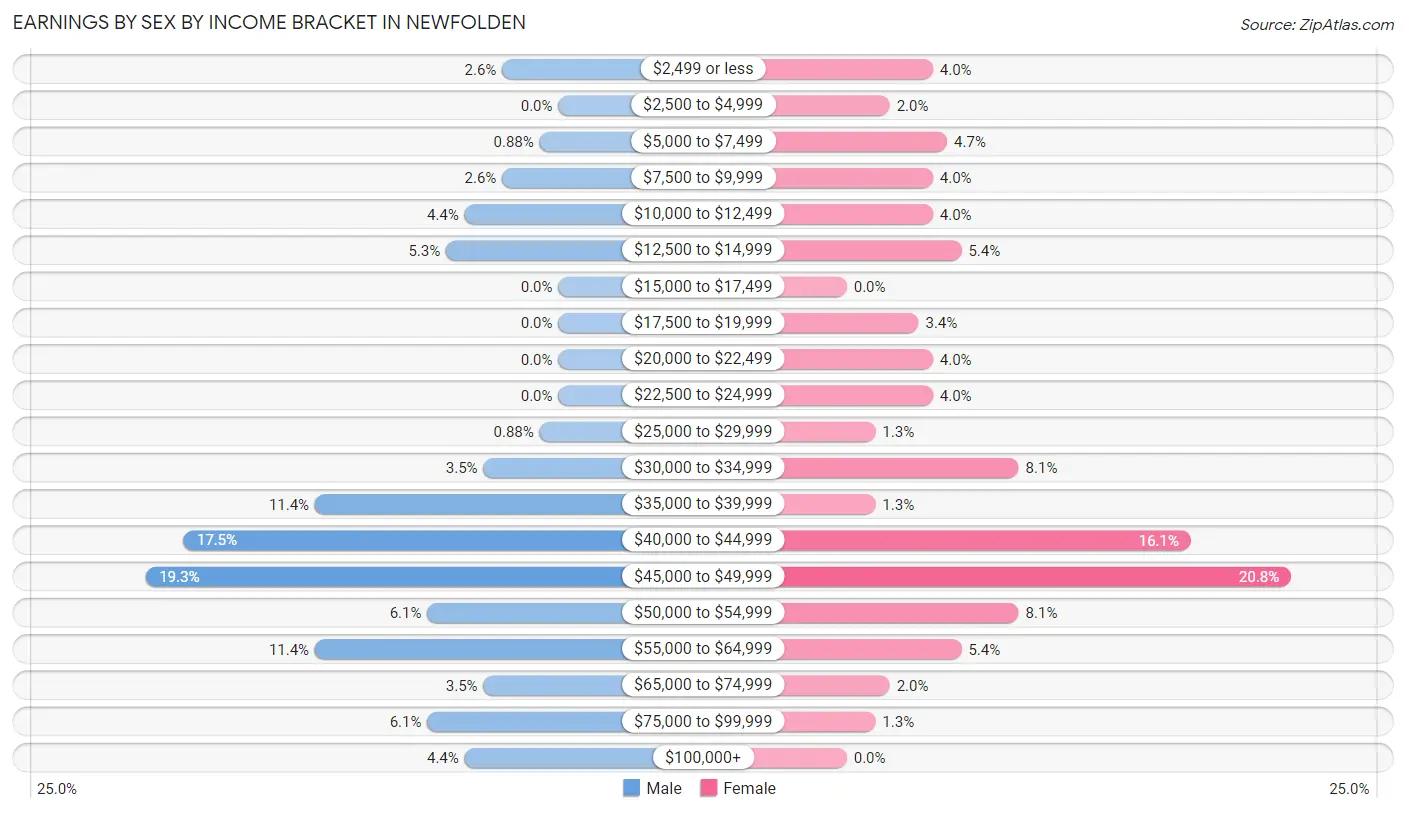
Earnings by Sex by Income Bracket in Newfolden
The most common earnings brackets in Newfolden are $45,000 to $49,999 for men (22 | 19.3%) and $45,000 to $49,999 for women (31 | 20.8%).
| Income | Male | Female |
| $2,499 or less | 3 (2.6%) | 6 (4.0%) |
| $2,500 to $4,999 | 0 (0.0%) | 3 (2.0%) |
| $5,000 to $7,499 | 1 (0.9%) | 7 (4.7%) |
| $7,500 to $9,999 | 3 (2.6%) | 6 (4.0%) |
| $10,000 to $12,499 | 5 (4.4%) | 6 (4.0%) |
| $12,500 to $14,999 | 6 (5.3%) | 8 (5.4%) |
| $15,000 to $17,499 | 0 (0.0%) | 0 (0.0%) |
| $17,500 to $19,999 | 0 (0.0%) | 5 (3.4%) |
| $20,000 to $22,499 | 0 (0.0%) | 6 (4.0%) |
| $22,500 to $24,999 | 0 (0.0%) | 6 (4.0%) |
| $25,000 to $29,999 | 1 (0.9%) | 2 (1.3%) |
| $30,000 to $34,999 | 4 (3.5%) | 12 (8.1%) |
| $35,000 to $39,999 | 13 (11.4%) | 2 (1.3%) |
| $40,000 to $44,999 | 20 (17.5%) | 24 (16.1%) |
| $45,000 to $49,999 | 22 (19.3%) | 31 (20.8%) |
| $50,000 to $54,999 | 7 (6.1%) | 12 (8.1%) |
| $55,000 to $64,999 | 13 (11.4%) | 8 (5.4%) |
| $65,000 to $74,999 | 4 (3.5%) | 3 (2.0%) |
| $75,000 to $99,999 | 7 (6.1%) | 2 (1.3%) |
| $100,000+ | 5 (4.4%) | 0 (0.0%) |
| Total | 114 (100.0%) | 149 (100.0%) |
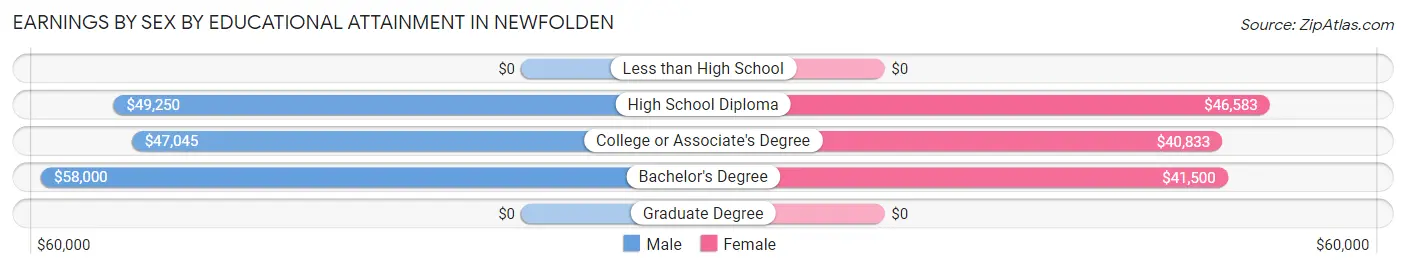
Earnings by Sex by Educational Attainment in Newfolden
Average earnings in Newfolden are $47,500 for men and $44,107 for women, a difference of 7.1%. Men with an educational attainment of bachelor's degree enjoy the highest average annual earnings of $58,000, while those with college or associate's degree education earn the least with $47,045. Women with an educational attainment of high school diploma earn the most with the average annual earnings of $46,583, while those with college or associate's degree education have the smallest earnings of $40,833.
| Educational Attainment | Male Income | Female Income |
| Less than High School | - | - |
| High School Diploma | $49,250 | $46,583 |
| College or Associate's Degree | $47,045 | $40,833 |
| Bachelor's Degree | $58,000 | $41,500 |
| Graduate Degree | - | - |
| Total | $47,500 | $44,107 |
Family Income in Newfolden
Family Income Brackets in Newfolden
According to the Newfolden family income data, there are 33 families falling into the $50,000 to $74,999 income range, which is the most common income bracket and makes up 35.5% of all families.
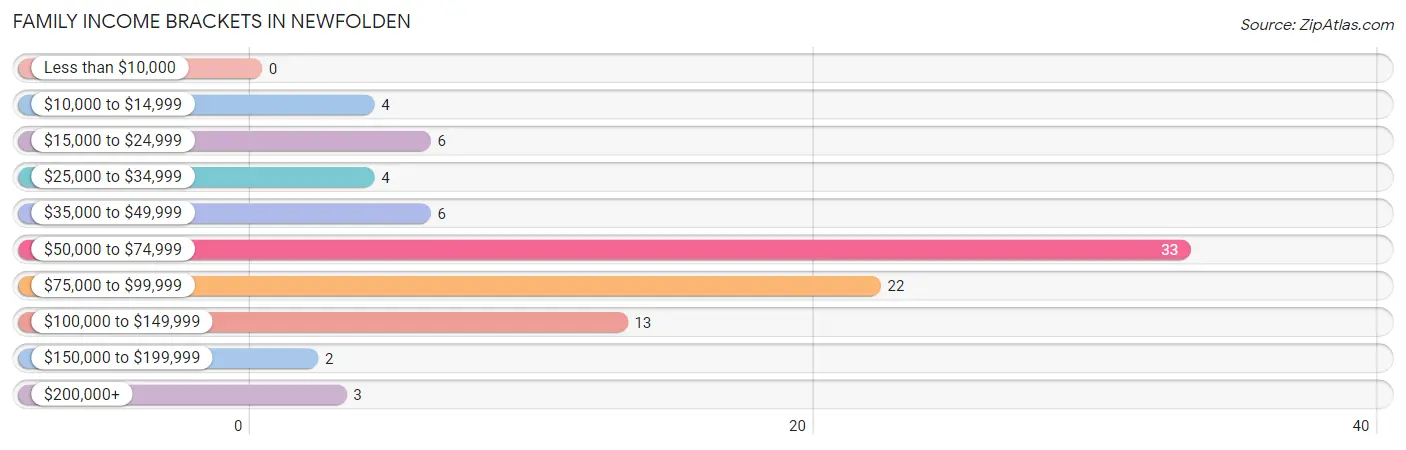
| Income Bracket | # Families | % Families |
| Less than $10,000 | 0 | 0.0% |
| $10,000 to $14,999 | 4 | 4.3% |
| $15,000 to $24,999 | 6 | 6.5% |
| $25,000 to $34,999 | 4 | 4.3% |
| $35,000 to $49,999 | 6 | 6.5% |
| $50,000 to $74,999 | 33 | 35.5% |
| $75,000 to $99,999 | 22 | 23.7% |
| $100,000 to $149,999 | 13 | 14.0% |
| $150,000 to $199,999 | 2 | 2.2% |
| $200,000+ | 3 | 3.2% |
Family Income by Famaliy Size in Newfolden
4-person families (6 | 6.5%) account for the highest median family income in Newfolden with $106,250 per family, while 2-person families (43 | 46.2%) have the highest median income of $33,542 per family member.
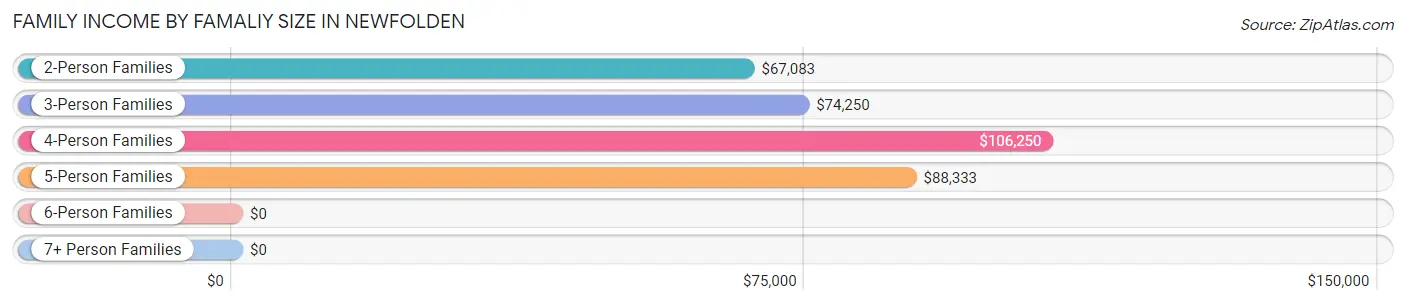
| Income Bracket | # Families | Median Income |
| 2-Person Families | 43 (46.2%) | $67,083 |
| 3-Person Families | 23 (24.7%) | $74,250 |
| 4-Person Families | 6 (6.5%) | $106,250 |
| 5-Person Families | 14 (15.0%) | $88,333 |
| 6-Person Families | 7 (7.5%) | $0 |
| 7+ Person Families | 0 (0.0%) | $0 |
| Total | 93 (100.0%) | $73,194 |
Family Income by Number of Earners in Newfolden
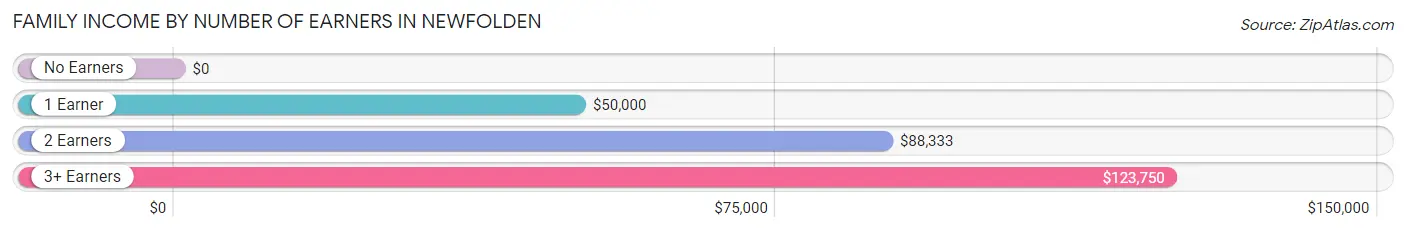
| Number of Earners | # Families | Median Income |
| No Earners | 4 (4.3%) | $0 |
| 1 Earner | 38 (40.9%) | $50,000 |
| 2 Earners | 48 (51.6%) | $88,333 |
| 3+ Earners | 3 (3.2%) | $123,750 |
| Total | 93 (100.0%) | $73,194 |
Household Income in Newfolden
Household Income Brackets in Newfolden
With 48 households falling in the category, the $50,000 to $74,999 income range is the most frequent in Newfolden, accounting for 31.4% of all households. In contrast, only 3 households (2.0%) fall into the less than $10,000 income bracket, making it the least populous group.
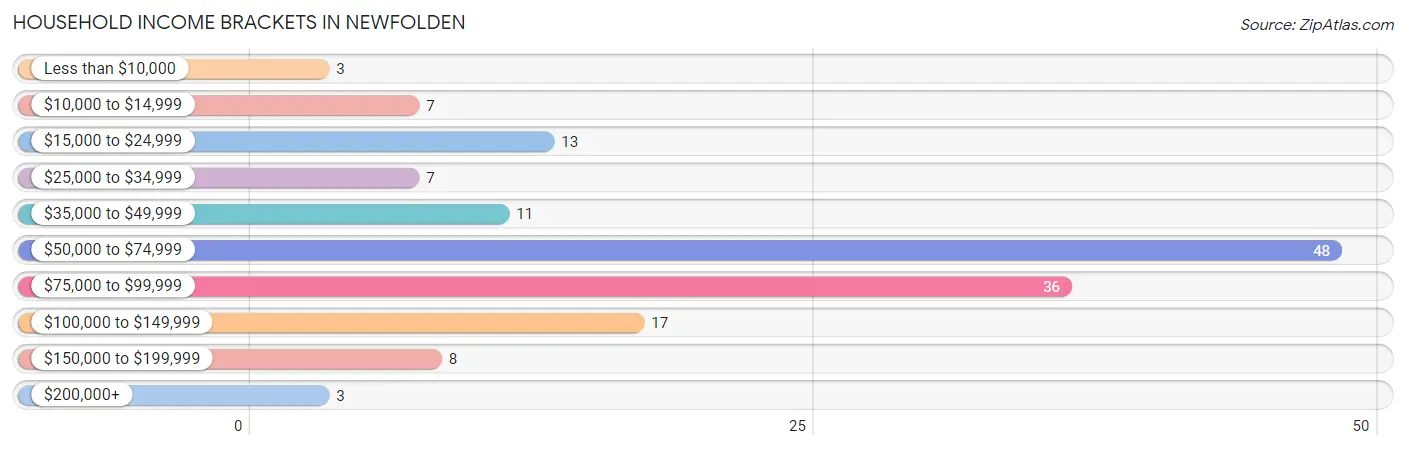
| Income Bracket | # Households | % Households |
| Less than $10,000 | 3 | 2.0% |
| $10,000 to $14,999 | 7 | 4.6% |
| $15,000 to $24,999 | 13 | 8.5% |
| $25,000 to $34,999 | 7 | 4.6% |
| $35,000 to $49,999 | 11 | 7.2% |
| $50,000 to $74,999 | 48 | 31.4% |
| $75,000 to $99,999 | 36 | 23.5% |
| $100,000 to $149,999 | 17 | 11.1% |
| $150,000 to $199,999 | 8 | 5.2% |
| $200,000+ | 3 | 2.0% |
Household Income by Householder Age in Newfolden
The median household income in Newfolden is $68,750, with the highest median household income of $95,417 found in the 15 to 24 years age bracket for the primary householder. A total of 15 households (9.8%) fall into this category. Meanwhile, the 25 to 44 years age bracket for the primary householder has the lowest median household income of $60,833, with 60 households (39.2%) in this group.
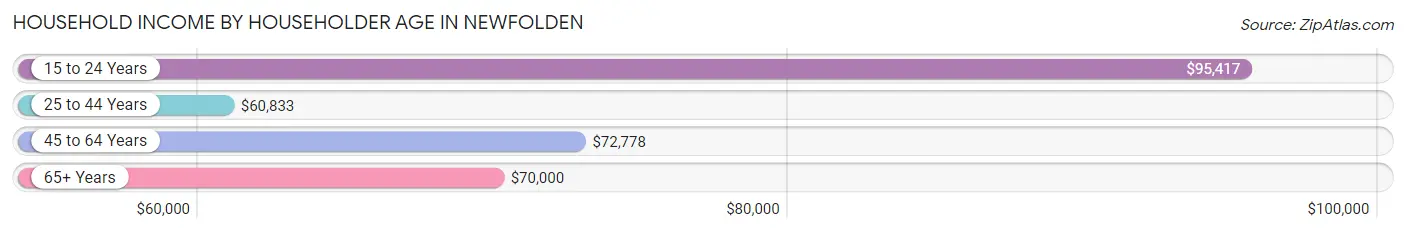
| Income Bracket | # Households | Median Income |
| 15 to 24 Years | 15 (9.8%) | $95,417 |
| 25 to 44 Years | 60 (39.2%) | $60,833 |
| 45 to 64 Years | 44 (28.8%) | $72,778 |
| 65+ Years | 34 (22.2%) | $70,000 |
| Total | 153 (100.0%) | $68,750 |
Poverty in Newfolden
Income Below Poverty by Sex and Age in Newfolden
With 12.1% poverty level for males and 14.9% for females among the residents of Newfolden, 12 to 14 year old males and 16 and 17 year old females are the most vulnerable to poverty, with 7 males (87.5%) and 8 females (72.7%) in their respective age groups living below the poverty level.
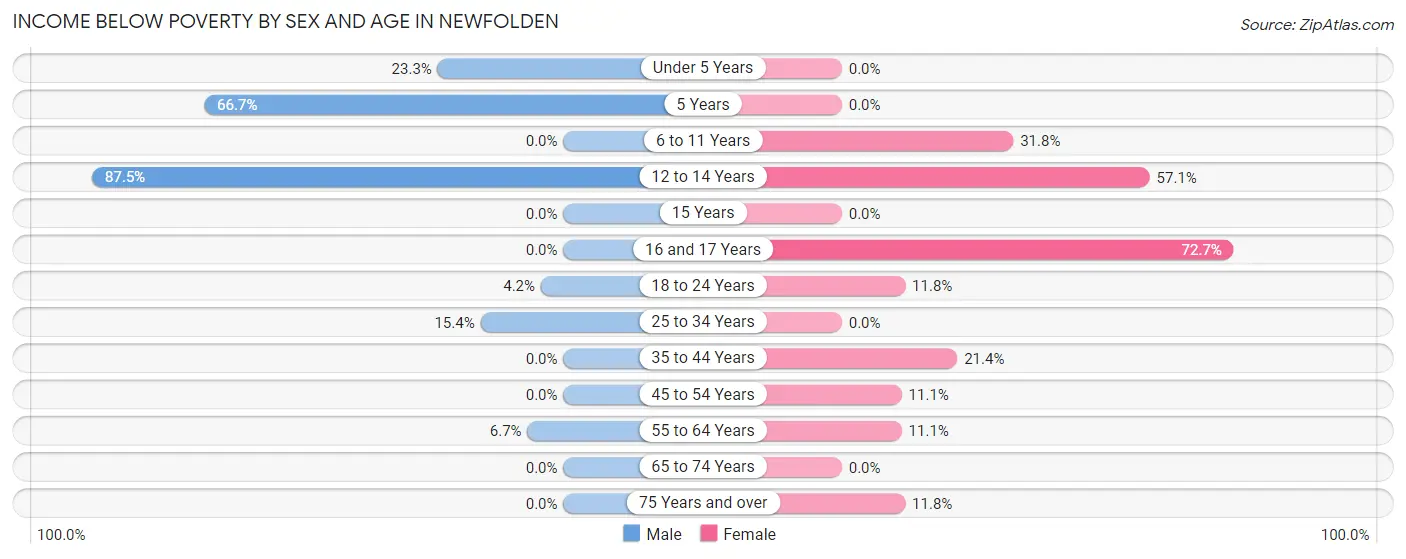
| Age Bracket | Male | Female |
| Under 5 Years | 7 (23.3%) | 0 (0.0%) |
| 5 Years | 6 (66.7%) | 0 (0.0%) |
| 6 to 11 Years | 0 (0.0%) | 7 (31.8%) |
| 12 to 14 Years | 7 (87.5%) | 4 (57.1%) |
| 15 Years | 0 (0.0%) | 0 (0.0%) |
| 16 and 17 Years | 0 (0.0%) | 8 (72.7%) |
| 18 to 24 Years | 1 (4.2%) | 4 (11.8%) |
| 25 to 34 Years | 2 (15.4%) | 0 (0.0%) |
| 35 to 44 Years | 0 (0.0%) | 6 (21.4%) |
| 45 to 54 Years | 0 (0.0%) | 4 (11.1%) |
| 55 to 64 Years | 1 (6.7%) | 2 (11.1%) |
| 65 to 74 Years | 0 (0.0%) | 0 (0.0%) |
| 75 Years and over | 0 (0.0%) | 2 (11.8%) |
| Total | 24 (12.1%) | 37 (14.9%) |
Income Above Poverty by Sex and Age in Newfolden
According to the poverty statistics in Newfolden, males aged 6 to 11 years and females aged under 5 years are the age groups that are most secure financially, with 100.0% of males and 100.0% of females in these age groups living above the poverty line.
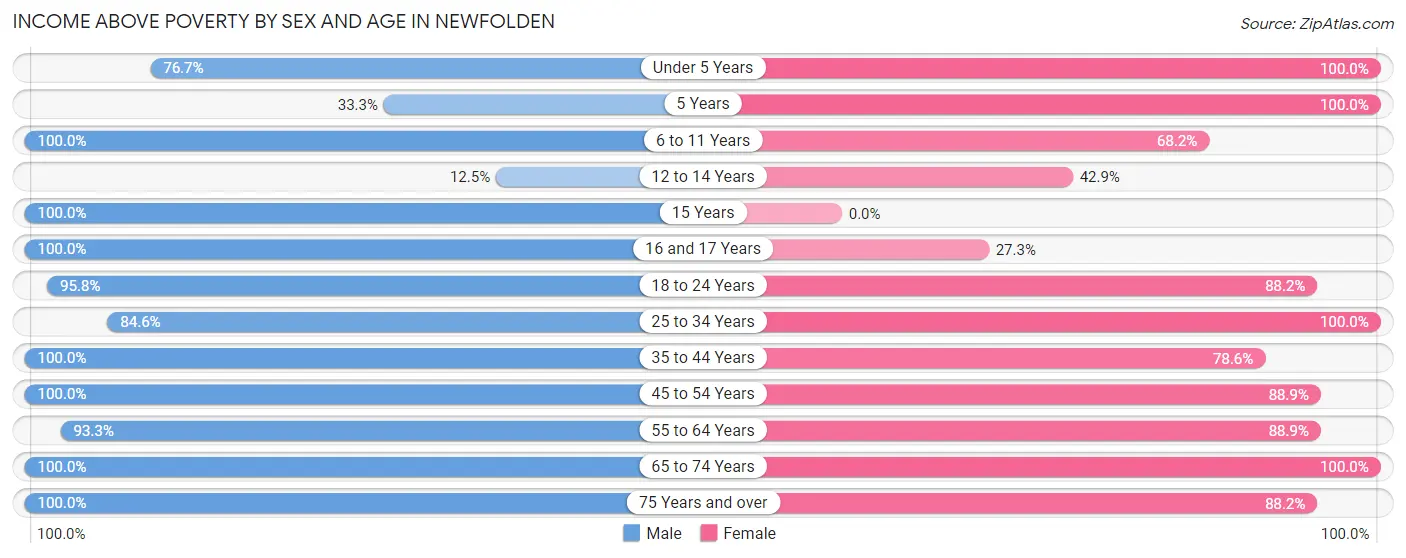
| Age Bracket | Male | Female |
| Under 5 Years | 23 (76.7%) | 22 (100.0%) |
| 5 Years | 3 (33.3%) | 4 (100.0%) |
| 6 to 11 Years | 15 (100.0%) | 15 (68.2%) |
| 12 to 14 Years | 1 (12.5%) | 3 (42.9%) |
| 15 Years | 5 (100.0%) | 0 (0.0%) |
| 16 and 17 Years | 6 (100.0%) | 3 (27.3%) |
| 18 to 24 Years | 23 (95.8%) | 30 (88.2%) |
| 25 to 34 Years | 11 (84.6%) | 40 (100.0%) |
| 35 to 44 Years | 26 (100.0%) | 22 (78.6%) |
| 45 to 54 Years | 20 (100.0%) | 32 (88.9%) |
| 55 to 64 Years | 14 (93.3%) | 16 (88.9%) |
| 65 to 74 Years | 13 (100.0%) | 10 (100.0%) |
| 75 Years and over | 14 (100.0%) | 15 (88.2%) |
| Total | 174 (87.9%) | 212 (85.1%) |
Income Below Poverty Among Married-Couple Families in Newfolden
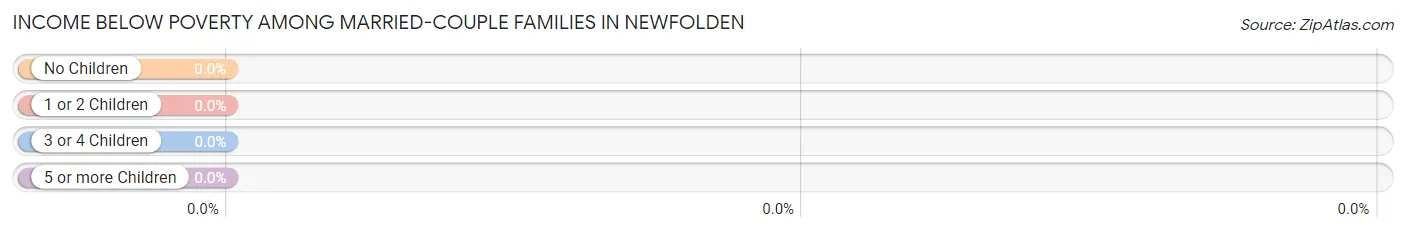
| Children | Above Poverty | Below Poverty |
| No Children | 33 (100.0%) | 0 (0.0%) |
| 1 or 2 Children | 8 (100.0%) | 0 (0.0%) |
| 3 or 4 Children | 13 (100.0%) | 0 (0.0%) |
| 5 or more Children | 0 (0.0%) | 0 (0.0%) |
| Total | 54 (100.0%) | 0 (0.0%) |
Income Below Poverty Among Single-Parent Households in Newfolden
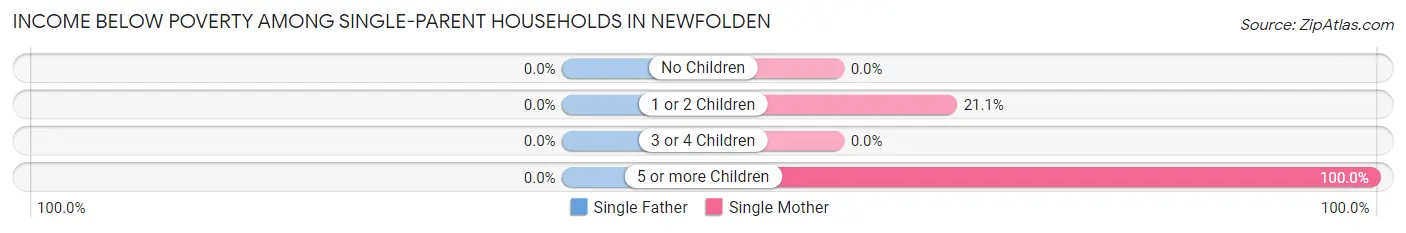
| Children | Single Father | Single Mother |
| No Children | 0 (0.0%) | 0 (0.0%) |
| 1 or 2 Children | 0 (0.0%) | 4 (21.0%) |
| 3 or 4 Children | 0 (0.0%) | 0 (0.0%) |
| 5 or more Children | 0 (0.0%) | 6 (100.0%) |
| Total | 0 (0.0%) | 10 (38.5%) |
Income Below Poverty Among Married-Couple vs Single-Parent Households in Newfolden
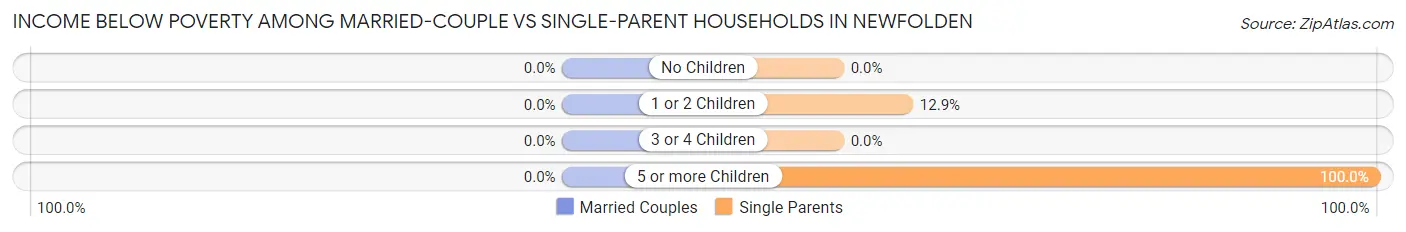
| Children | Married-Couple Families | Single-Parent Households |
| No Children | 0 (0.0%) | 0 (0.0%) |
| 1 or 2 Children | 0 (0.0%) | 4 (12.9%) |
| 3 or 4 Children | 0 (0.0%) | 0 (0.0%) |
| 5 or more Children | 0 (0.0%) | 6 (100.0%) |
| Total | 0 (0.0%) | 10 (25.6%) |
Race in Newfolden
The most populous races in Newfolden are White / Caucasian (445 | 99.3%), Hispanic or Latino (19 | 4.2%), and Two or more Races (3 | 0.7%).
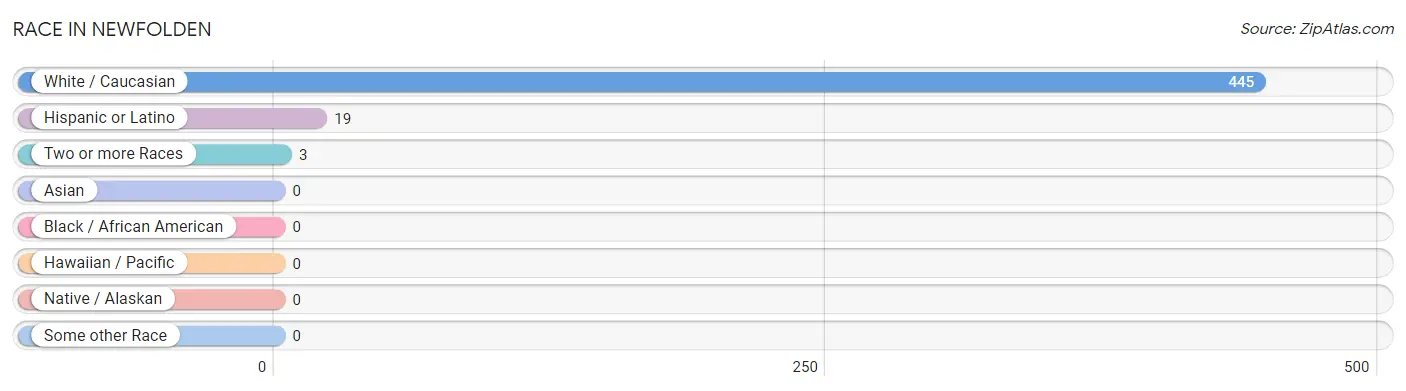
| Race | # Population | % Population |
| Asian | 0 | 0.0% |
| Black / African American | 0 | 0.0% |
| Hawaiian / Pacific | 0 | 0.0% |
| Hispanic or Latino | 19 | 4.2% |
| Native / Alaskan | 0 | 0.0% |
| White / Caucasian | 445 | 99.3% |
| Two or more Races | 3 | 0.7% |
| Some other Race | 0 | 0.0% |
| Total | 448 | 100.0% |
Ancestry in Newfolden
The most populous ancestries reported in Newfolden are Norwegian (216 | 48.2%), German (129 | 28.8%), Swedish (78 | 17.4%), Polish (32 | 7.1%), and Finnish (12 | 2.7%), together accounting for 104.2% of all Newfolden residents.
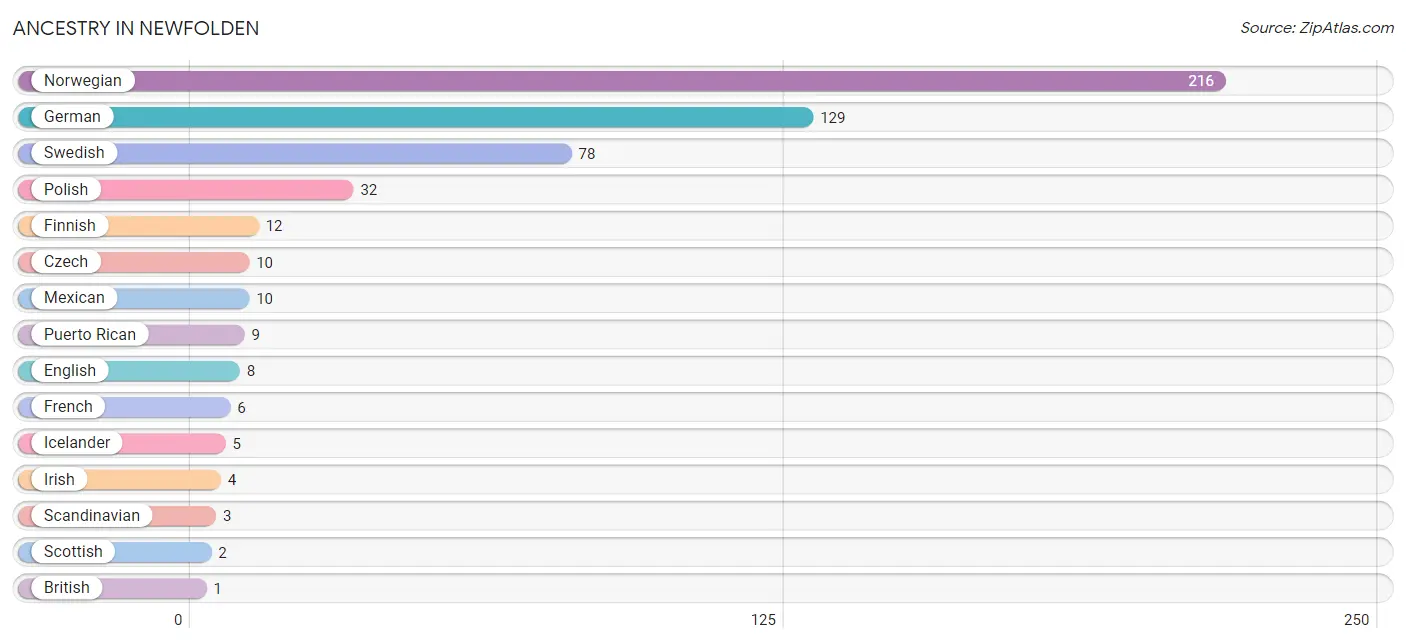
| Ancestry | # Population | % Population |
| British | 1 | 0.2% |
| Czech | 10 | 2.2% |
| Danish | 1 | 0.2% |
| Dutch | 1 | 0.2% |
| English | 8 | 1.8% |
| Finnish | 12 | 2.7% |
| French | 6 | 1.3% |
| German | 129 | 28.8% |
| Hungarian | 1 | 0.2% |
| Icelander | 5 | 1.1% |
| Irish | 4 | 0.9% |
| Mexican | 10 | 2.2% |
| Norwegian | 216 | 48.2% |
| Polish | 32 | 7.1% |
| Puerto Rican | 9 | 2.0% |
| Scandinavian | 3 | 0.7% |
| Scottish | 2 | 0.4% |
| Swedish | 78 | 17.4% | View All 18 Rows |
Immigrants in Newfolden

| Immigration Origin | # Population | % Population | View All 0 Rows |
Sex and Age in Newfolden
Sex and Age in Newfolden
The most populous age groups in Newfolden are Under 5 Years (30 | 15.1%) for men and 25 to 29 Years (31 | 12.4%) for women.
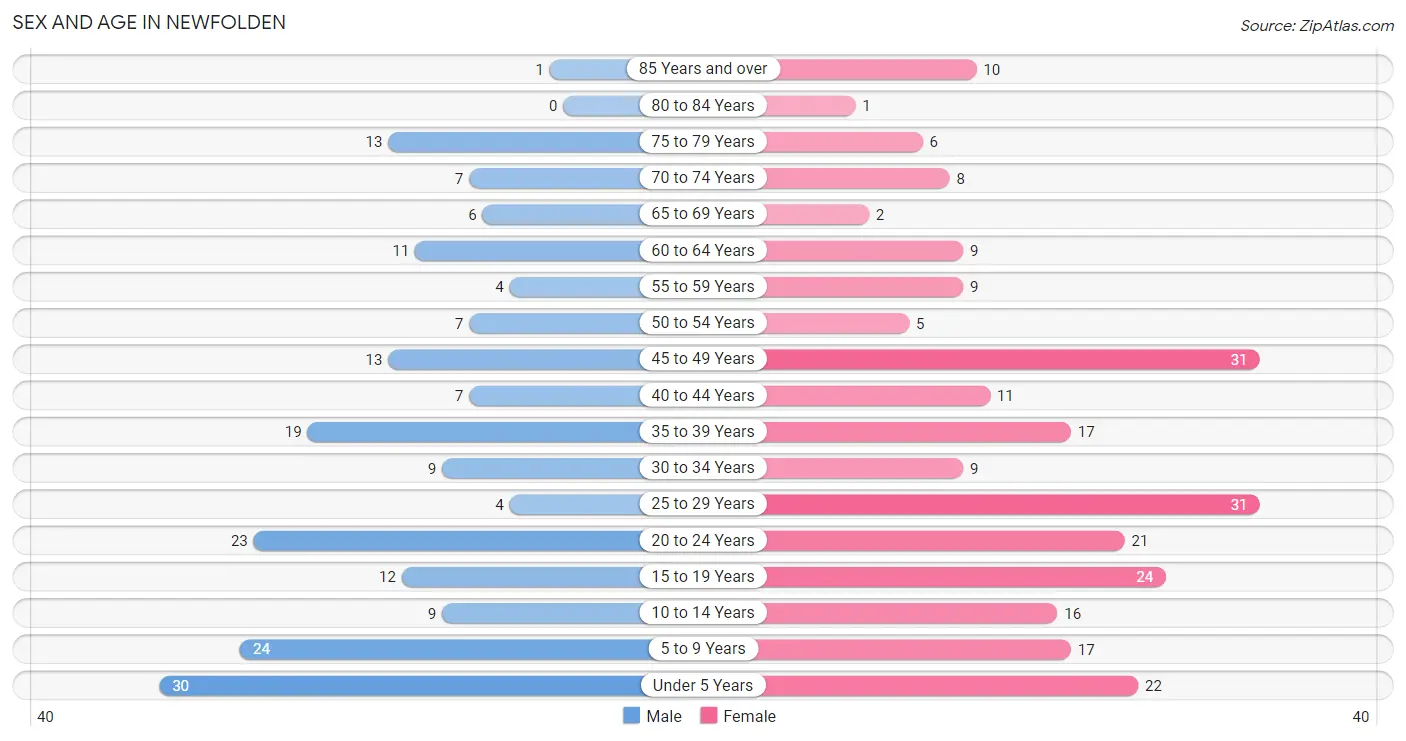
| Age Bracket | Male | Female |
| Under 5 Years | 30 (15.1%) | 22 (8.8%) |
| 5 to 9 Years | 24 (12.1%) | 17 (6.8%) |
| 10 to 14 Years | 9 (4.5%) | 16 (6.4%) |
| 15 to 19 Years | 12 (6.0%) | 24 (9.6%) |
| 20 to 24 Years | 23 (11.6%) | 21 (8.4%) |
| 25 to 29 Years | 4 (2.0%) | 31 (12.4%) |
| 30 to 34 Years | 9 (4.5%) | 9 (3.6%) |
| 35 to 39 Years | 19 (9.6%) | 17 (6.8%) |
| 40 to 44 Years | 7 (3.5%) | 11 (4.4%) |
| 45 to 49 Years | 13 (6.5%) | 31 (12.4%) |
| 50 to 54 Years | 7 (3.5%) | 5 (2.0%) |
| 55 to 59 Years | 4 (2.0%) | 9 (3.6%) |
| 60 to 64 Years | 11 (5.5%) | 9 (3.6%) |
| 65 to 69 Years | 6 (3.0%) | 2 (0.8%) |
| 70 to 74 Years | 7 (3.5%) | 8 (3.2%) |
| 75 to 79 Years | 13 (6.5%) | 6 (2.4%) |
| 80 to 84 Years | 0 (0.0%) | 1 (0.4%) |
| 85 Years and over | 1 (0.5%) | 10 (4.0%) |
| Total | 199 (100.0%) | 249 (100.0%) |
Families and Households in Newfolden
Median Family Size in Newfolden
The median family size in Newfolden is 3.60 persons per family, with married-couple families (54 | 58.1%) accounting for the largest median family size of 3.65 persons per family. On the other hand, single male/father families (13 | 14.0%) represent the smallest median family size with 3.54 persons per family.
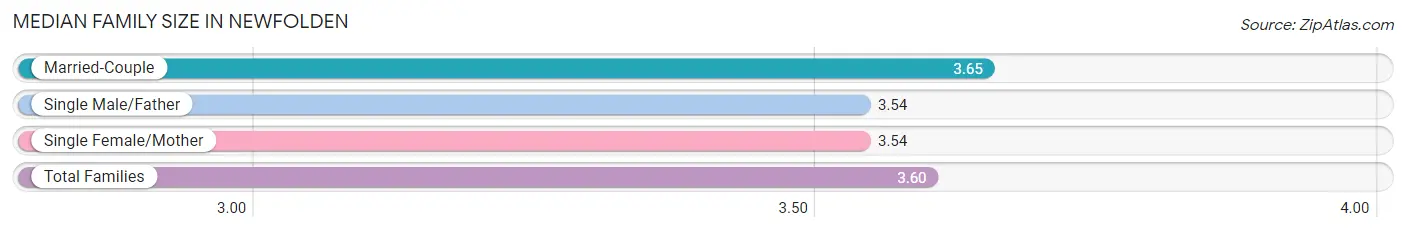
| Family Type | # Families | Family Size |
| Married-Couple | 54 (58.1%) | 3.65 |
| Single Male/Father | 13 (14.0%) | 3.54 |
| Single Female/Mother | 26 (28.0%) | 3.54 |
| Total Families | 93 (100.0%) | 3.60 |
Median Household Size in Newfolden
The median household size in Newfolden is 2.93 persons per household, with single female/mother households (26 | 17.0%) accounting for the largest median household size of 4.54 persons per household. non-family households (60 | 39.2%) represent the smallest median household size with 1.23 persons per household.
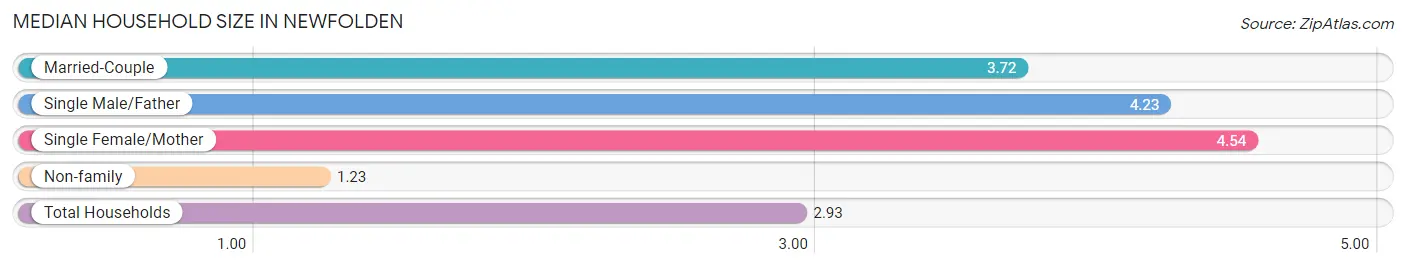
| Household Type | # Households | Household Size |
| Married-Couple | 54 (35.3%) | 3.72 |
| Single Male/Father | 13 (8.5%) | 4.23 |
| Single Female/Mother | 26 (17.0%) | 4.54 |
| Non-family | 60 (39.2%) | 1.23 |
| Total Households | 153 (100.0%) | 2.93 |
Household Size by Marriage Status in Newfolden
Out of a total of 153 households in Newfolden, 93 (60.8%) are family households, while 60 (39.2%) are nonfamily households. The most numerous type of family households are 2-person households, comprising 42, and the most common type of nonfamily households are 1-person households, comprising 46.
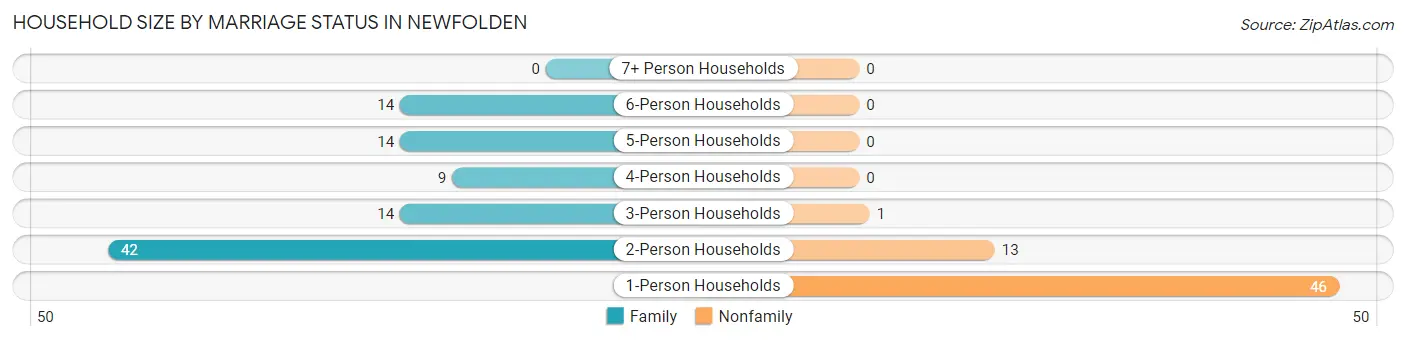
| Household Size | Family Households | Nonfamily Households |
| 1-Person Households | - | 46 (30.1%) |
| 2-Person Households | 42 (27.5%) | 13 (8.5%) |
| 3-Person Households | 14 (9.1%) | 1 (0.6%) |
| 4-Person Households | 9 (5.9%) | 0 (0.0%) |
| 5-Person Households | 14 (9.1%) | 0 (0.0%) |
| 6-Person Households | 14 (9.1%) | 0 (0.0%) |
| 7+ Person Households | 0 (0.0%) | 0 (0.0%) |
| Total | 93 (60.8%) | 60 (39.2%) |
Female Fertility in Newfolden
Fertility by Age in Newfolden
Average fertility rate in Newfolden is 56.0 births per 1,000 women. Women in the age bracket of 20 to 34 years have the highest fertility rate with 131.0 births per 1,000 women. Women in the age bracket of 20 to 34 years acount for 100.0% of all women with births.
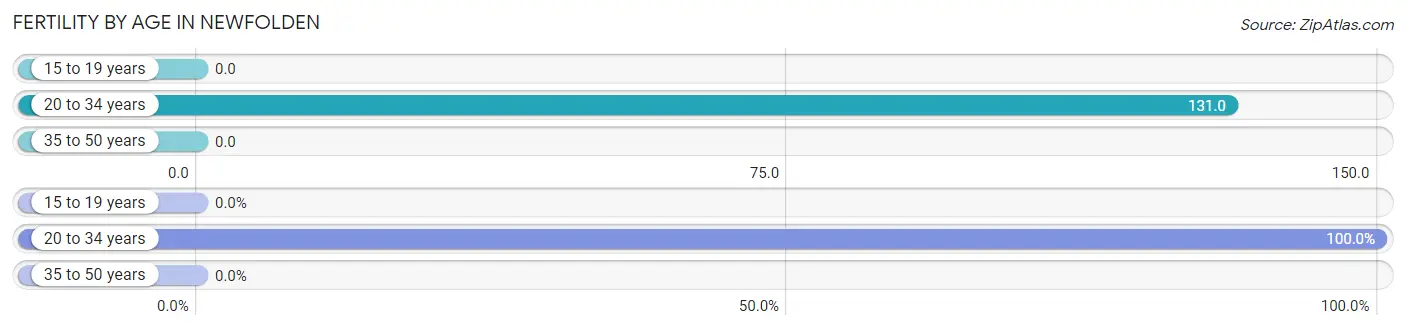
| Age Bracket | Women with Births | Births / 1,000 Women |
| 15 to 19 years | 0 (0.0%) | 0.0 |
| 20 to 34 years | 8 (100.0%) | 131.0 |
| 35 to 50 years | 0 (0.0%) | 0.0 |
| Total | 8 (100.0%) | 56.0 |
Fertility by Age by Marriage Status in Newfolden
25.0% of women with births (8) in Newfolden are married. The highest percentage of unmarried women with births falls into 20 to 34 years age bracket with 75.0% of them unmarried at the time of birth, while the lowest percentage of unmarried women with births belong to 20 to 34 years age bracket with 75.0% of them unmarried.
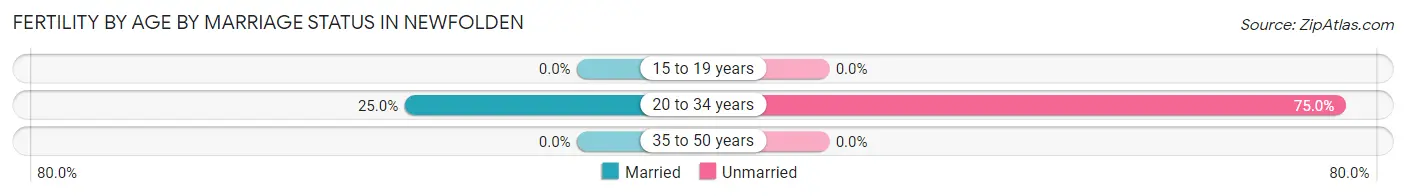
| Age Bracket | Married | Unmarried |
| 15 to 19 years | 0 (0.0%) | 0 (0.0%) |
| 20 to 34 years | 2 (25.0%) | 6 (75.0%) |
| 35 to 50 years | 0 (0.0%) | 0 (0.0%) |
| Total | 2 (25.0%) | 6 (75.0%) |
Fertility by Education in Newfolden
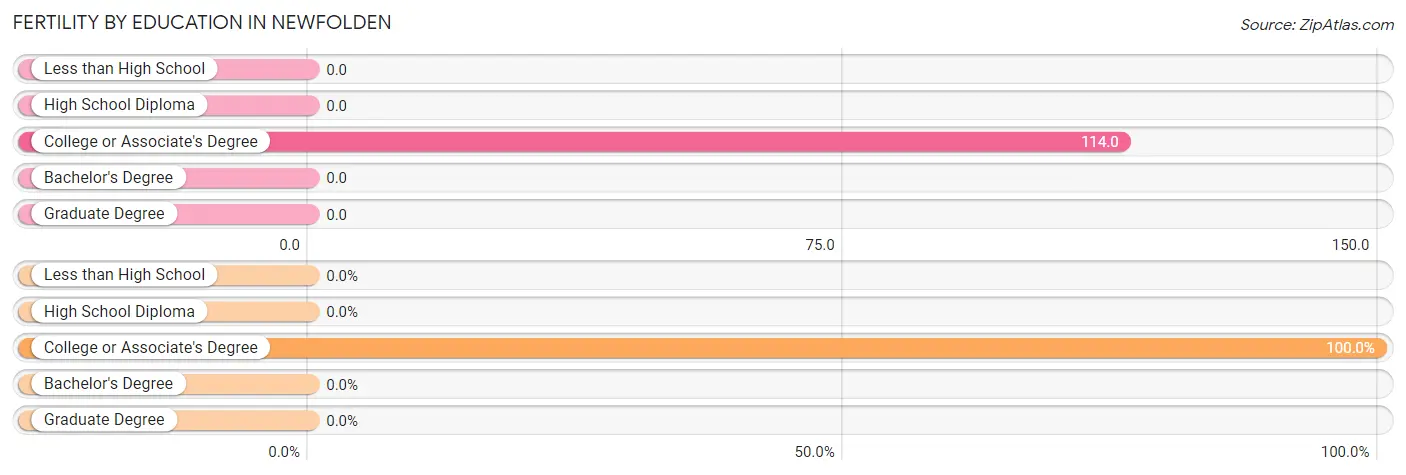
| Educational Attainment | Women with Births | Births / 1,000 Women |
| Less than High School | 0 (0.0%) | 0.0 |
| High School Diploma | 0 (0.0%) | 0.0 |
| College or Associate's Degree | 8 (100.0%) | 114.0 |
| Bachelor's Degree | 0 (0.0%) | 0.0 |
| Graduate Degree | 0 (0.0%) | 0.0 |
| Total | 8 (100.0%) | 56.0 |
Fertility by Education by Marriage Status in Newfolden
75.0% of women with births in Newfolden are unmarried. Women with the educational attainment of college or associate's degree are most likely to be married with 25.0% of them married at childbirth, while women with the educational attainment of college or associate's degree are least likely to be married with 75.0% of them unmarried at childbirth.
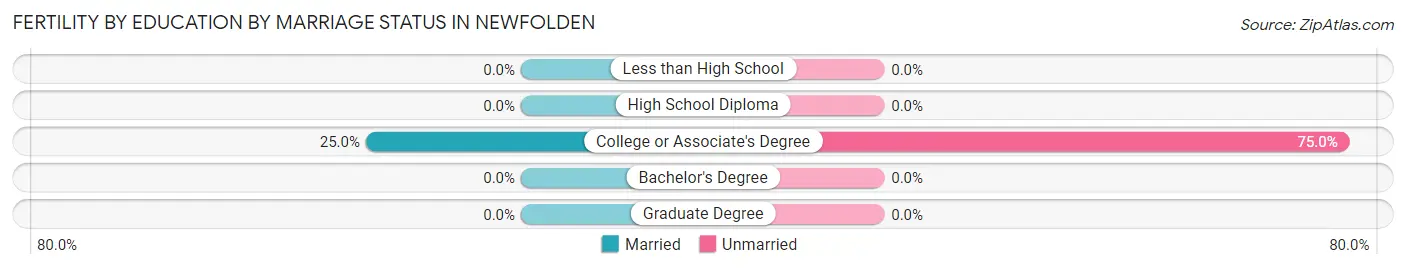
| Educational Attainment | Married | Unmarried |
| Less than High School | 0 (0.0%) | 0 (0.0%) |
| High School Diploma | 0 (0.0%) | 0 (0.0%) |
| College or Associate's Degree | 2 (25.0%) | 6 (75.0%) |
| Bachelor's Degree | 0 (0.0%) | 0 (0.0%) |
| Graduate Degree | 0 (0.0%) | 0 (0.0%) |
| Total | 2 (25.0%) | 6 (75.0%) |
Employment Characteristics in Newfolden
Employment by Class of Employer in Newfolden
Among the 224 employed individuals in Newfolden, private company employees (177 | 79.0%), local government employees (18 | 8.0%), and not-for-profit organizations (11 | 4.9%) make up the most common classes of employment.
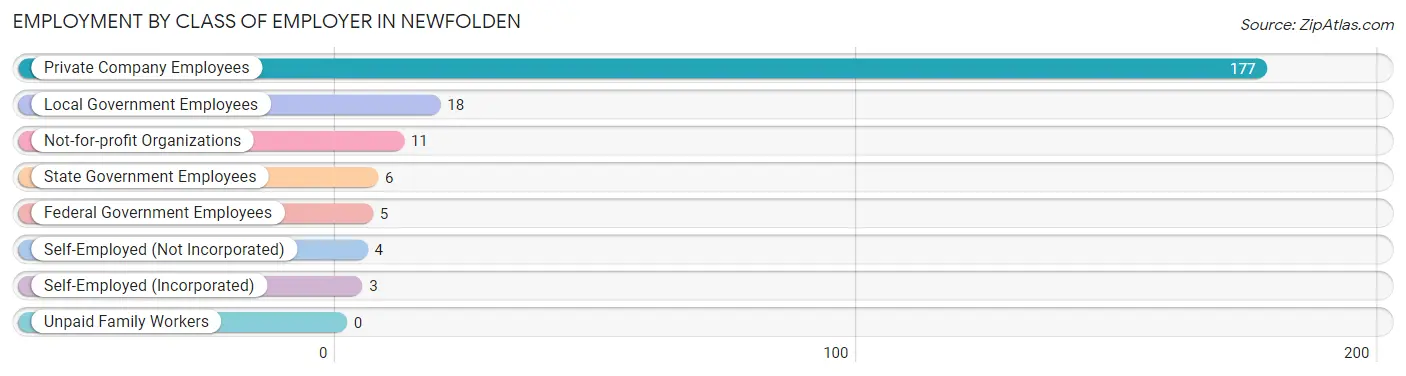
| Employer Class | # Employees | % Employees |
| Private Company Employees | 177 | 79.0% |
| Self-Employed (Incorporated) | 3 | 1.3% |
| Self-Employed (Not Incorporated) | 4 | 1.8% |
| Not-for-profit Organizations | 11 | 4.9% |
| Local Government Employees | 18 | 8.0% |
| State Government Employees | 6 | 2.7% |
| Federal Government Employees | 5 | 2.2% |
| Unpaid Family Workers | 0 | 0.0% |
| Total | 224 | 100.0% |
Employment Status by Age in Newfolden
According to the labor force statistics for Newfolden, out of the total population over 16 years of age (325), 75.4% or 245 individuals are in the labor force, with 1.6% or 4 of them unemployed. The age group with the highest labor force participation rate is 45 to 54 years, with 98.2% or 55 individuals in the labor force. Within the labor force, the 16 to 19 years age range has the highest percentage of unemployed individuals, with 25.0% or 2 of them being unemployed.
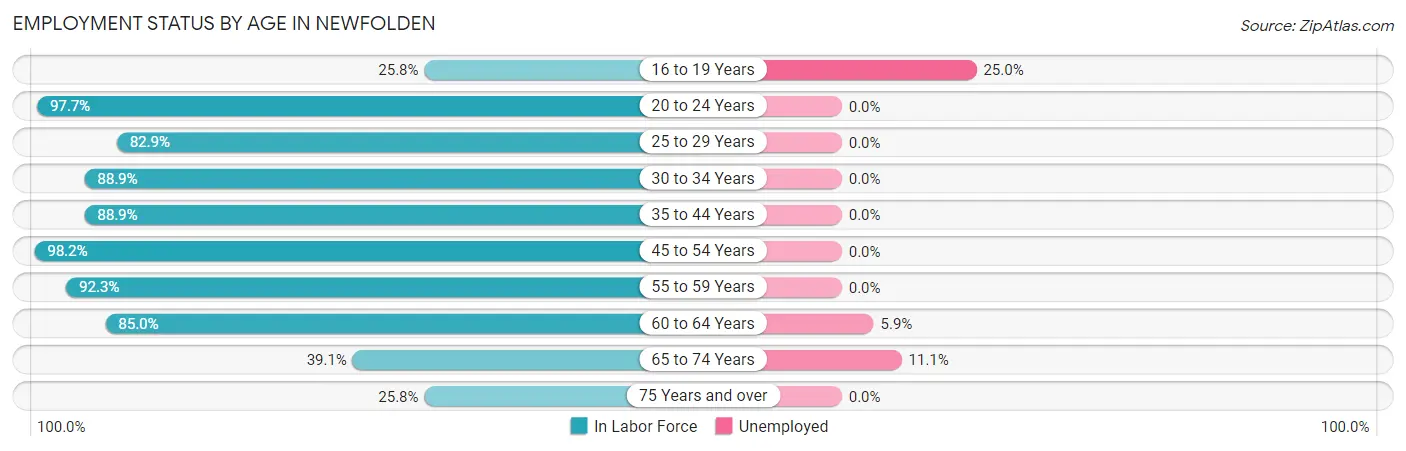
| Age Bracket | In Labor Force | Unemployed |
| 16 to 19 Years | 8 (25.8%) | 2 (25.0%) |
| 20 to 24 Years | 43 (97.7%) | 0 (0.0%) |
| 25 to 29 Years | 29 (82.9%) | 0 (0.0%) |
| 30 to 34 Years | 16 (88.9%) | 0 (0.0%) |
| 35 to 44 Years | 48 (88.9%) | 0 (0.0%) |
| 45 to 54 Years | 55 (98.2%) | 0 (0.0%) |
| 55 to 59 Years | 12 (92.3%) | 0 (0.0%) |
| 60 to 64 Years | 17 (85.0%) | 1 (5.9%) |
| 65 to 74 Years | 9 (39.1%) | 1 (11.1%) |
| 75 Years and over | 8 (25.8%) | 0 (0.0%) |
| Total | 245 (75.4%) | 4 (1.6%) |
Employment Status by Educational Attainment in Newfolden
According to labor force statistics for Newfolden, 90.3% of individuals (177) out of the total population between 25 and 64 years of age (196) are in the labor force, with 0.6% or 1 of them being unemployed. The group with the highest labor force participation rate are those with the educational attainment of high school diploma, with 98.4% or 63 individuals in the labor force. Within the labor force, individuals with college / associate degree education have the highest percentage of unemployment, with 1.2% or 1 of them being unemployed.
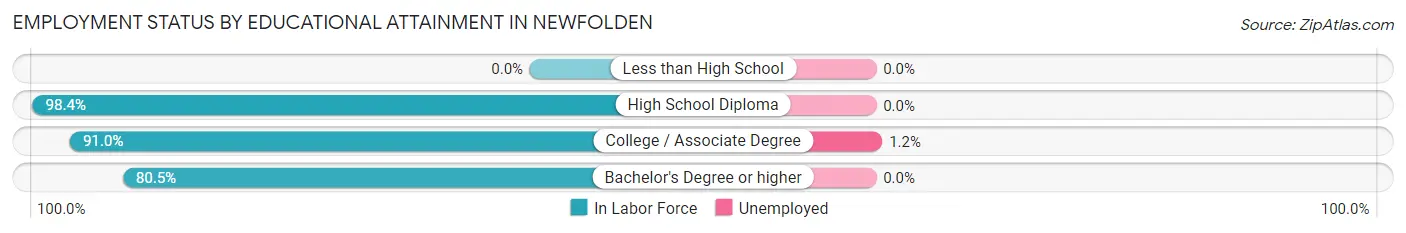
| Educational Attainment | In Labor Force | Unemployed |
| Less than High School | 0 (0.0%) | 0 (0.0%) |
| High School Diploma | 63 (98.4%) | 0 (0.0%) |
| College / Associate Degree | 81 (91.0%) | 1 (1.2%) |
| Bachelor's Degree or higher | 33 (80.5%) | 0 (0.0%) |
| Total | 177 (90.3%) | 1 (0.6%) |
Employment Occupations by Sex in Newfolden
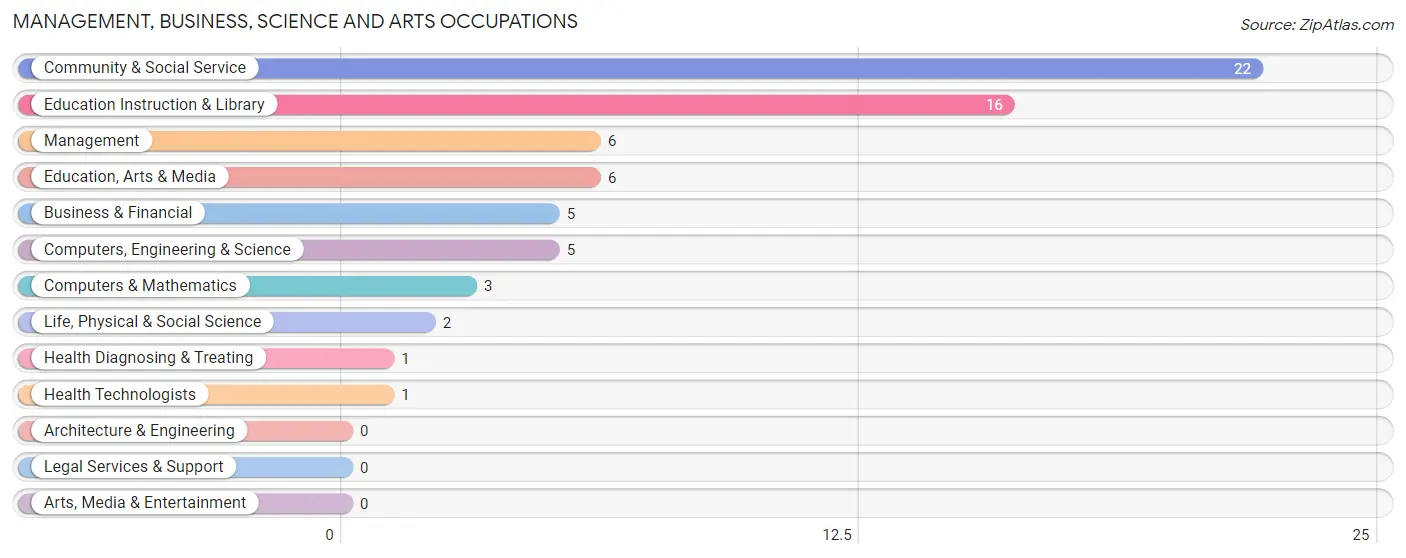
Management, Business, Science and Arts Occupations
The most common Management, Business, Science and Arts occupations in Newfolden are Community & Social Service (22 | 9.1%), Education Instruction & Library (16 | 6.6%), Management (6 | 2.5%), Education, Arts & Media (6 | 2.5%), and Business & Financial (5 | 2.1%).
Management, Business, Science and Arts Occupations by Sex
Within the Management, Business, Science and Arts occupations in Newfolden, the most male-oriented occupations are Computers & Mathematics (100.0%), Education, Arts & Media (100.0%), and Business & Financial (60.0%), while the most female-oriented occupations are Life, Physical & Social Science (100.0%), Health Diagnosing & Treating (100.0%), and Health Technologists (100.0%).
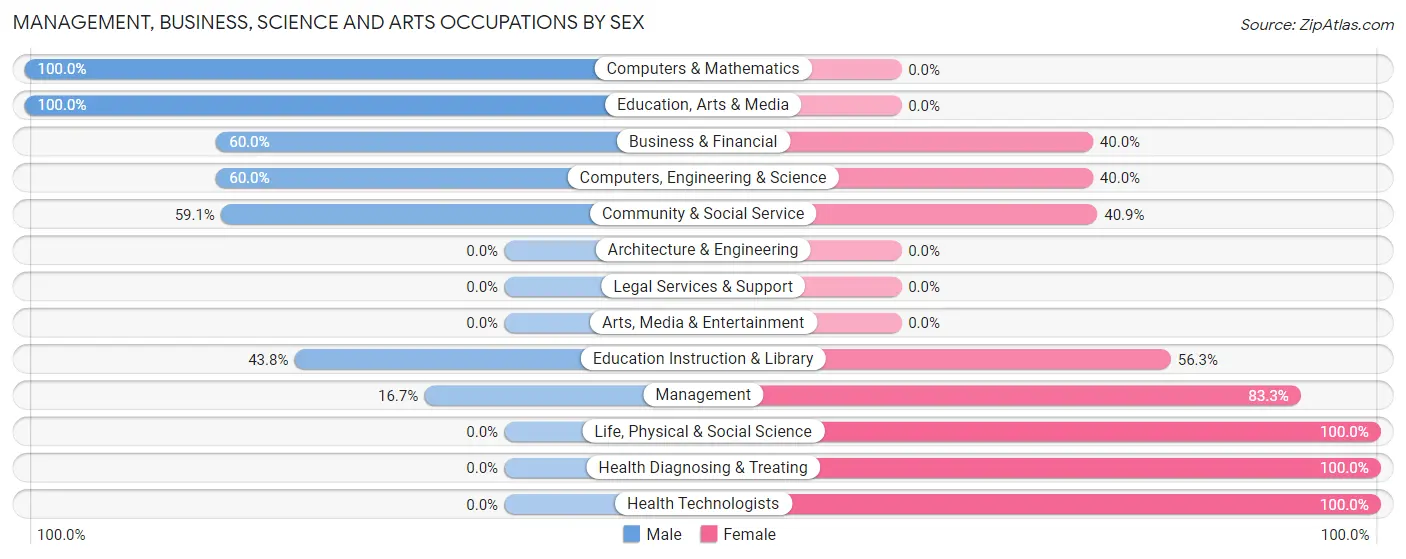
| Occupation | Male | Female |
| Management | 1 (16.7%) | 5 (83.3%) |
| Business & Financial | 3 (60.0%) | 2 (40.0%) |
| Computers, Engineering & Science | 3 (60.0%) | 2 (40.0%) |
| Computers & Mathematics | 3 (100.0%) | 0 (0.0%) |
| Architecture & Engineering | 0 (0.0%) | 0 (0.0%) |
| Life, Physical & Social Science | 0 (0.0%) | 2 (100.0%) |
| Community & Social Service | 13 (59.1%) | 9 (40.9%) |
| Education, Arts & Media | 6 (100.0%) | 0 (0.0%) |
| Legal Services & Support | 0 (0.0%) | 0 (0.0%) |
| Education Instruction & Library | 7 (43.8%) | 9 (56.2%) |
| Arts, Media & Entertainment | 0 (0.0%) | 0 (0.0%) |
| Health Diagnosing & Treating | 0 (0.0%) | 1 (100.0%) |
| Health Technologists | 0 (0.0%) | 1 (100.0%) |
| Total (Category) | 20 (51.3%) | 19 (48.7%) |
| Total (Overall) | 108 (44.8%) | 133 (55.2%) |
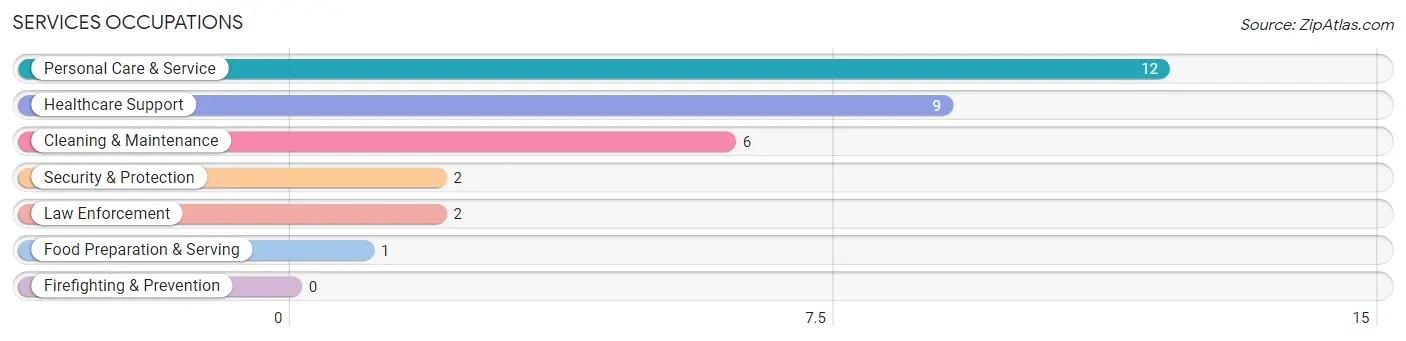
Services Occupations
The most common Services occupations in Newfolden are Personal Care & Service (12 | 5.0%), Healthcare Support (9 | 3.7%), Cleaning & Maintenance (6 | 2.5%), Security & Protection (2 | 0.8%), and Law Enforcement (2 | 0.8%).
Services Occupations by Sex
Within the Services occupations in Newfolden, the most male-oriented occupations are Security & Protection (100.0%), Law Enforcement (100.0%), and Food Preparation & Serving (100.0%), while the most female-oriented occupations are Personal Care & Service (100.0%), Healthcare Support (66.7%), and Cleaning & Maintenance (66.7%).
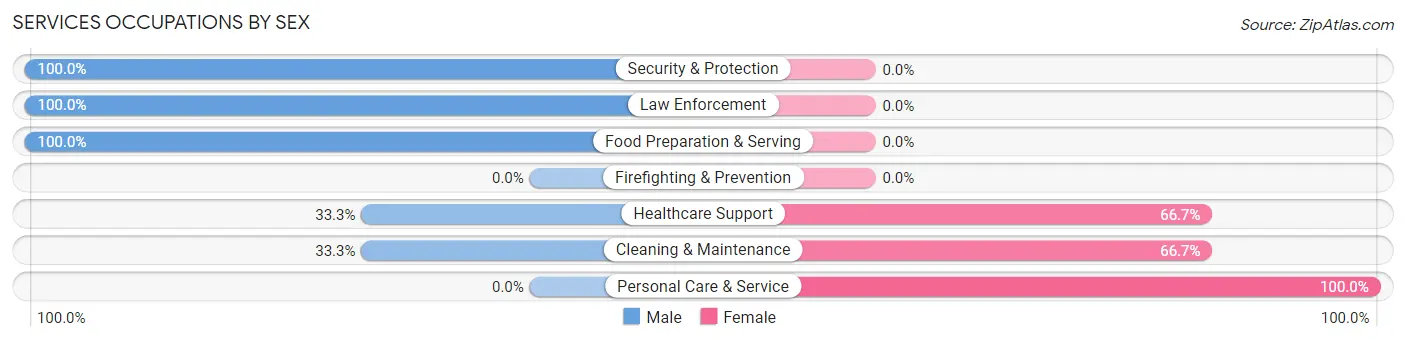
| Occupation | Male | Female |
| Healthcare Support | 3 (33.3%) | 6 (66.7%) |
| Security & Protection | 2 (100.0%) | 0 (0.0%) |
| Firefighting & Prevention | 0 (0.0%) | 0 (0.0%) |
| Law Enforcement | 2 (100.0%) | 0 (0.0%) |
| Food Preparation & Serving | 1 (100.0%) | 0 (0.0%) |
| Cleaning & Maintenance | 2 (33.3%) | 4 (66.7%) |
| Personal Care & Service | 0 (0.0%) | 12 (100.0%) |
| Total (Category) | 8 (26.7%) | 22 (73.3%) |
| Total (Overall) | 108 (44.8%) | 133 (55.2%) |
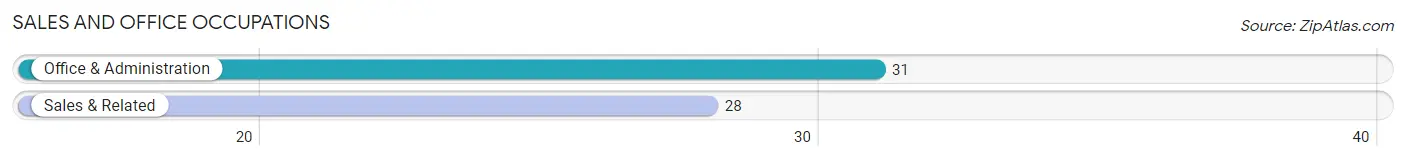
Sales and Office Occupations
The most common Sales and Office occupations in Newfolden are Office & Administration (31 | 12.9%), and Sales & Related (28 | 11.6%).
Sales and Office Occupations by Sex
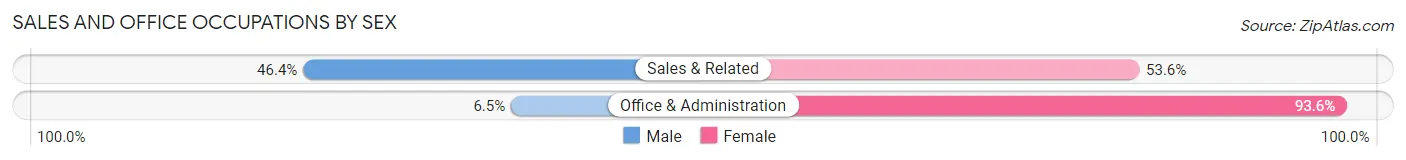
| Occupation | Male | Female |
| Sales & Related | 13 (46.4%) | 15 (53.6%) |
| Office & Administration | 2 (6.5%) | 29 (93.5%) |
| Total (Category) | 15 (25.4%) | 44 (74.6%) |
| Total (Overall) | 108 (44.8%) | 133 (55.2%) |
Natural Resources, Construction and Maintenance Occupations
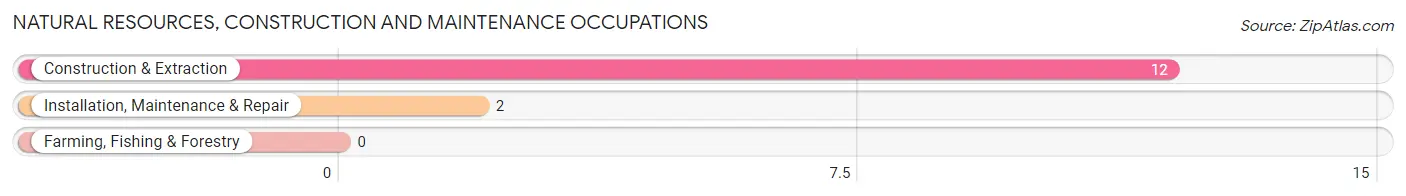
The most common Natural Resources, Construction and Maintenance occupations in Newfolden are Construction & Extraction (12 | 5.0%), and Installation, Maintenance & Repair (2 | 0.8%).
Natural Resources, Construction and Maintenance Occupations by Sex
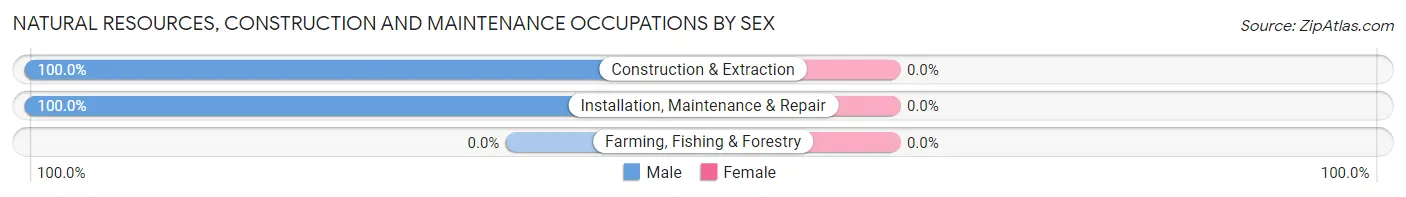
| Occupation | Male | Female |
| Farming, Fishing & Forestry | 0 (0.0%) | 0 (0.0%) |
| Construction & Extraction | 12 (100.0%) | 0 (0.0%) |
| Installation, Maintenance & Repair | 2 (100.0%) | 0 (0.0%) |
| Total (Category) | 14 (100.0%) | 0 (0.0%) |
| Total (Overall) | 108 (44.8%) | 133 (55.2%) |
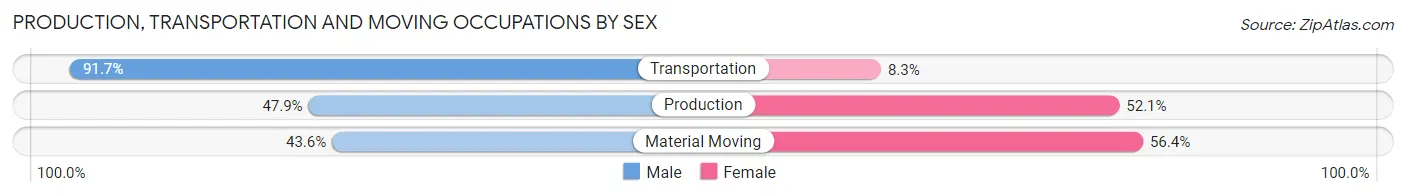
Production, Transportation and Moving Occupations
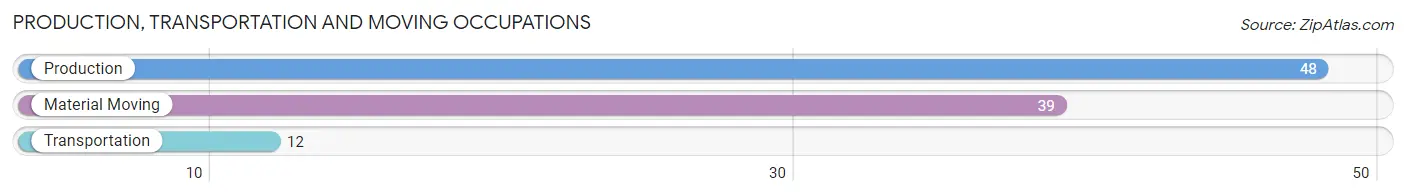
The most common Production, Transportation and Moving occupations in Newfolden are Production (48 | 19.9%), Material Moving (39 | 16.2%), and Transportation (12 | 5.0%).
Production, Transportation and Moving Occupations by Sex
| Occupation | Male | Female |
| Production | 23 (47.9%) | 25 (52.1%) |
| Transportation | 11 (91.7%) | 1 (8.3%) |
| Material Moving | 17 (43.6%) | 22 (56.4%) |
| Total (Category) | 51 (51.5%) | 48 (48.5%) |
| Total (Overall) | 108 (44.8%) | 133 (55.2%) |
Employment Industries by Sex in Newfolden
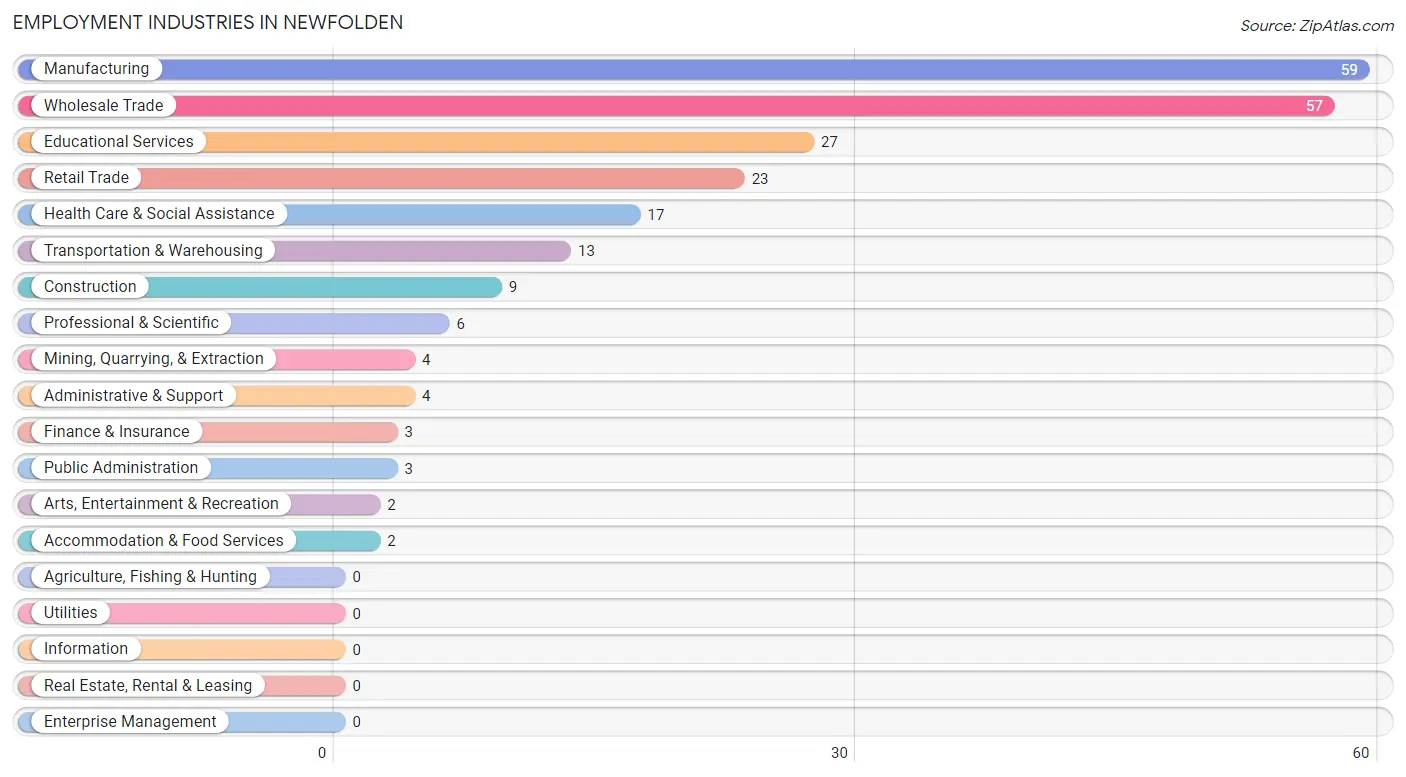
Employment Industries in Newfolden
The major employment industries in Newfolden include Manufacturing (59 | 24.5%), Wholesale Trade (57 | 23.6%), Educational Services (27 | 11.2%), Retail Trade (23 | 9.5%), and Health Care & Social Assistance (17 | 7.0%).
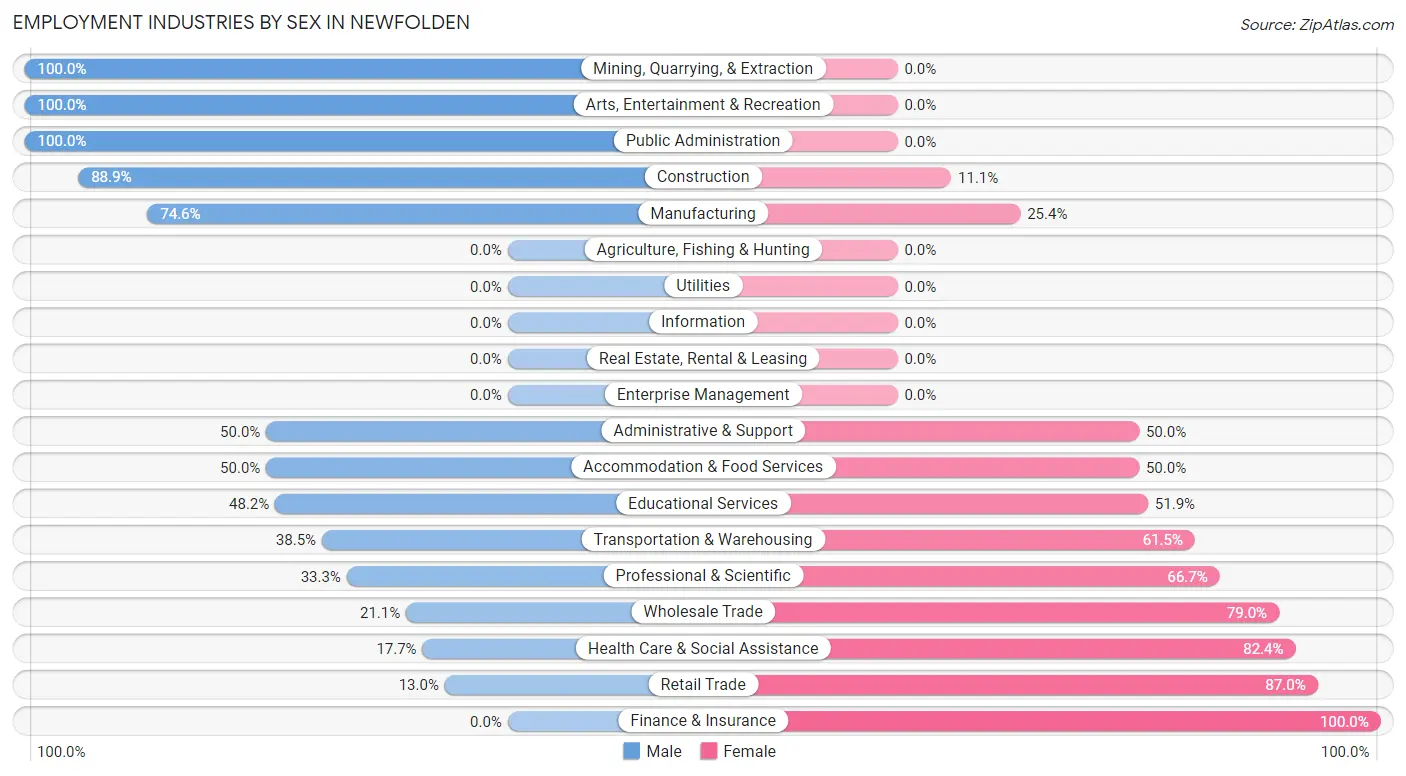
Employment Industries by Sex in Newfolden
The Newfolden industries that see more men than women are Mining, Quarrying, & Extraction (100.0%), Arts, Entertainment & Recreation (100.0%), and Public Administration (100.0%), whereas the industries that tend to have a higher number of women are Finance & Insurance (100.0%), Retail Trade (87.0%), and Health Care & Social Assistance (82.4%).
| Industry | Male | Female |
| Agriculture, Fishing & Hunting | 0 (0.0%) | 0 (0.0%) |
| Mining, Quarrying, & Extraction | 4 (100.0%) | 0 (0.0%) |
| Construction | 8 (88.9%) | 1 (11.1%) |
| Manufacturing | 44 (74.6%) | 15 (25.4%) |
| Wholesale Trade | 12 (21.0%) | 45 (78.9%) |
| Retail Trade | 3 (13.0%) | 20 (87.0%) |
| Transportation & Warehousing | 5 (38.5%) | 8 (61.5%) |
| Utilities | 0 (0.0%) | 0 (0.0%) |
| Information | 0 (0.0%) | 0 (0.0%) |
| Finance & Insurance | 0 (0.0%) | 3 (100.0%) |
| Real Estate, Rental & Leasing | 0 (0.0%) | 0 (0.0%) |
| Professional & Scientific | 2 (33.3%) | 4 (66.7%) |
| Enterprise Management | 0 (0.0%) | 0 (0.0%) |
| Administrative & Support | 2 (50.0%) | 2 (50.0%) |
| Educational Services | 13 (48.1%) | 14 (51.8%) |
| Health Care & Social Assistance | 3 (17.6%) | 14 (82.4%) |
| Arts, Entertainment & Recreation | 2 (100.0%) | 0 (0.0%) |
| Accommodation & Food Services | 1 (50.0%) | 1 (50.0%) |
| Public Administration | 3 (100.0%) | 0 (0.0%) |
| Total | 108 (44.8%) | 133 (55.2%) |
Education in Newfolden
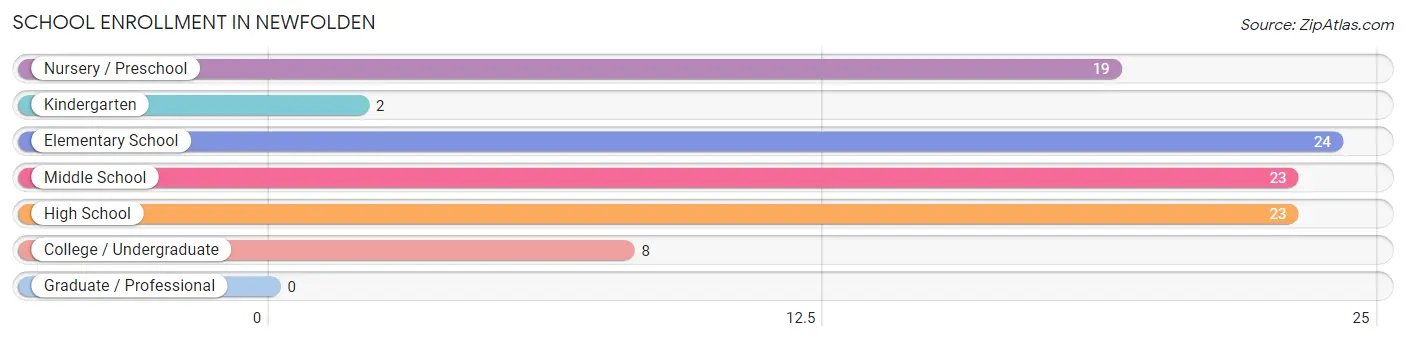
School Enrollment in Newfolden
The most common levels of schooling among the 99 students in Newfolden are elementary school (24 | 24.2%), middle school (23 | 23.2%), and high school (23 | 23.2%).
| School Level | # Students | % Students |
| Nursery / Preschool | 19 | 19.2% |
| Kindergarten | 2 | 2.0% |
| Elementary School | 24 | 24.2% |
| Middle School | 23 | 23.2% |
| High School | 23 | 23.2% |
| College / Undergraduate | 8 | 8.1% |
| Graduate / Professional | 0 | 0.0% |
| Total | 99 | 100.0% |
School Enrollment by Age by Funding Source in Newfolden
Out of a total of 99 students who are enrolled in schools in Newfolden, 15 (15.2%) attend a private institution, while the remaining 84 (84.8%) are enrolled in public schools. The age group of 35 years and over has the highest likelihood of being enrolled in private schools, with 1 (100.0% in the age bracket) enrolled. Conversely, the age group of 3 to 4 year olds has the lowest likelihood of being enrolled in a private school, with 9 (100.0% in the age bracket) attending a public institution.
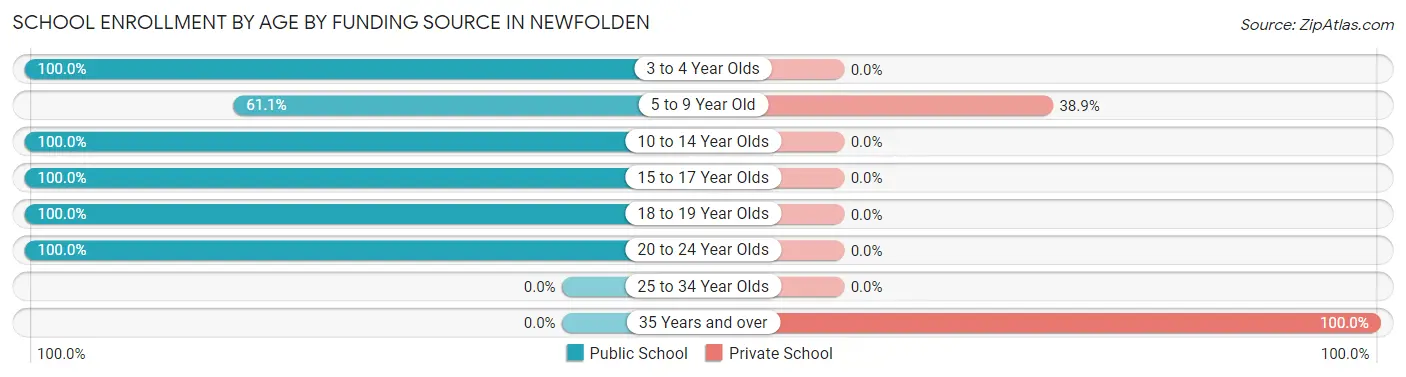
| Age Bracket | Public School | Private School |
| 3 to 4 Year Olds | 9 (100.0%) | 0 (0.0%) |
| 5 to 9 Year Old | 22 (61.1%) | 14 (38.9%) |
| 10 to 14 Year Olds | 23 (100.0%) | 0 (0.0%) |
| 15 to 17 Year Olds | 22 (100.0%) | 0 (0.0%) |
| 18 to 19 Year Olds | 4 (100.0%) | 0 (0.0%) |
| 20 to 24 Year Olds | 4 (100.0%) | 0 (0.0%) |
| 25 to 34 Year Olds | 0 (0.0%) | 0 (0.0%) |
| 35 Years and over | 0 (0.0%) | 1 (100.0%) |
| Total | 84 (84.8%) | 15 (15.2%) |
Educational Attainment by Field of Study in Newfolden
Education (27 | 45.0%), business (9 | 15.0%), arts & humanities (7 | 11.7%), bio, nature & agricultural (5 | 8.3%), and liberal arts & history (5 | 8.3%) are the most common fields of study among 60 individuals in Newfolden who have obtained a bachelor's degree or higher.
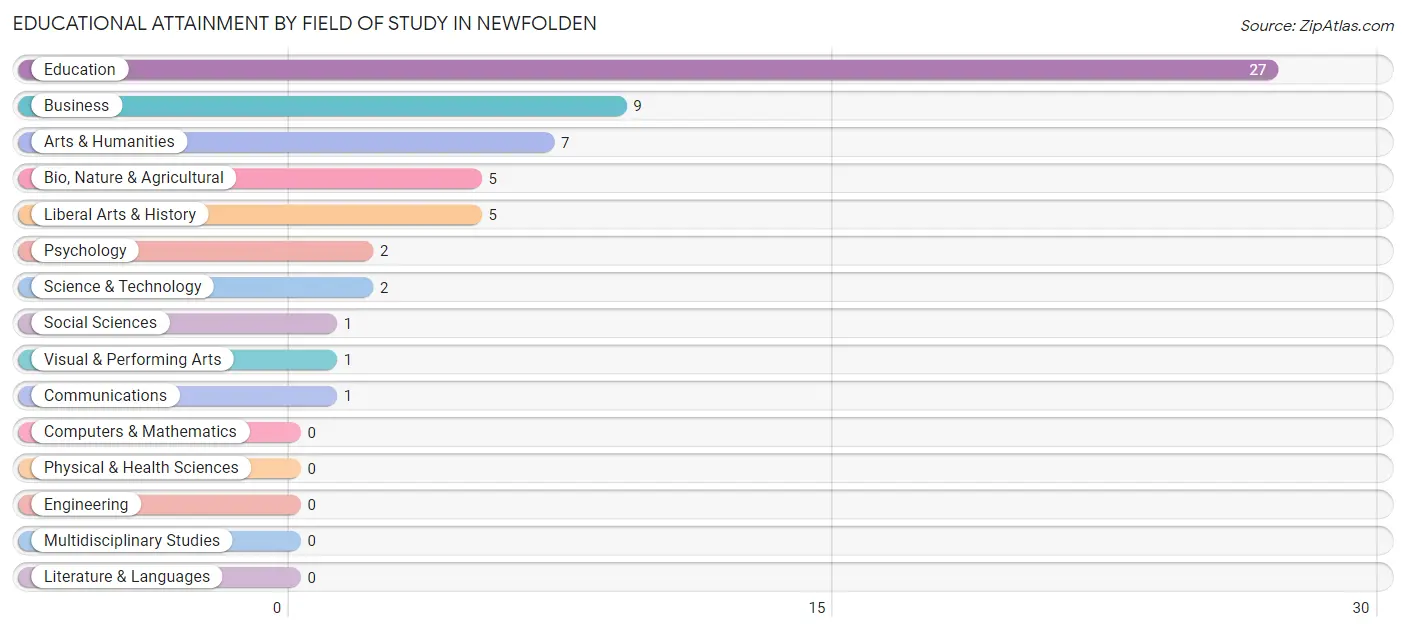
| Field of Study | # Graduates | % Graduates |
| Computers & Mathematics | 0 | 0.0% |
| Bio, Nature & Agricultural | 5 | 8.3% |
| Physical & Health Sciences | 0 | 0.0% |
| Psychology | 2 | 3.3% |
| Social Sciences | 1 | 1.7% |
| Engineering | 0 | 0.0% |
| Multidisciplinary Studies | 0 | 0.0% |
| Science & Technology | 2 | 3.3% |
| Business | 9 | 15.0% |
| Education | 27 | 45.0% |
| Literature & Languages | 0 | 0.0% |
| Liberal Arts & History | 5 | 8.3% |
| Visual & Performing Arts | 1 | 1.7% |
| Communications | 1 | 1.7% |
| Arts & Humanities | 7 | 11.7% |
| Total | 60 | 100.0% |
Transportation & Commute in Newfolden
Vehicle Availability by Sex in Newfolden
The most prevalent vehicle ownership categories in Newfolden are males with 5 or more vehicles (33, accounting for 30.8%) and females with 5 or more vehicles (26, making up 28.2%).
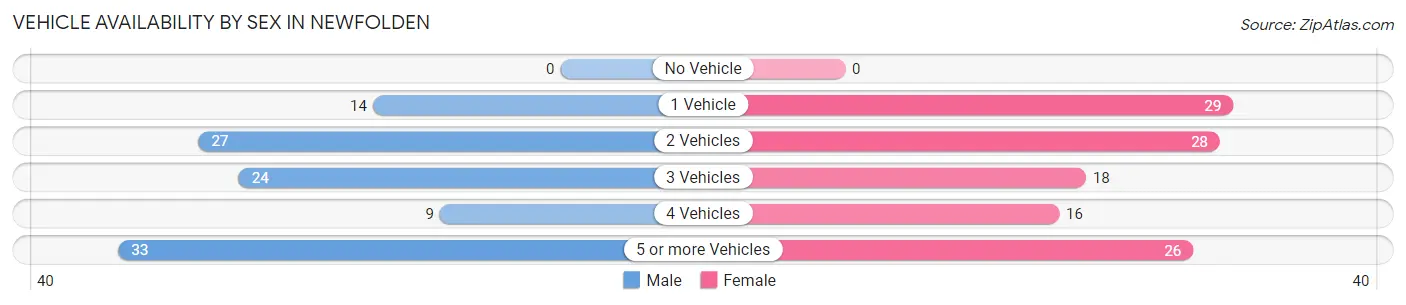
| Vehicles Available | Male | Female |
| No Vehicle | 0 (0.0%) | 0 (0.0%) |
| 1 Vehicle | 14 (13.1%) | 29 (24.8%) |
| 2 Vehicles | 27 (25.2%) | 28 (23.9%) |
| 3 Vehicles | 24 (22.4%) | 18 (15.4%) |
| 4 Vehicles | 9 (8.4%) | 16 (13.7%) |
| 5 or more Vehicles | 33 (30.8%) | 26 (22.2%) |
| Total | 107 (100.0%) | 117 (100.0%) |
Commute Time in Newfolden
The most frequently occuring commute durations in Newfolden are 20 to 24 minutes (84 commuters, 39.8%), 30 to 34 minutes (36 commuters, 17.1%), and 5 to 9 minutes (27 commuters, 12.8%).
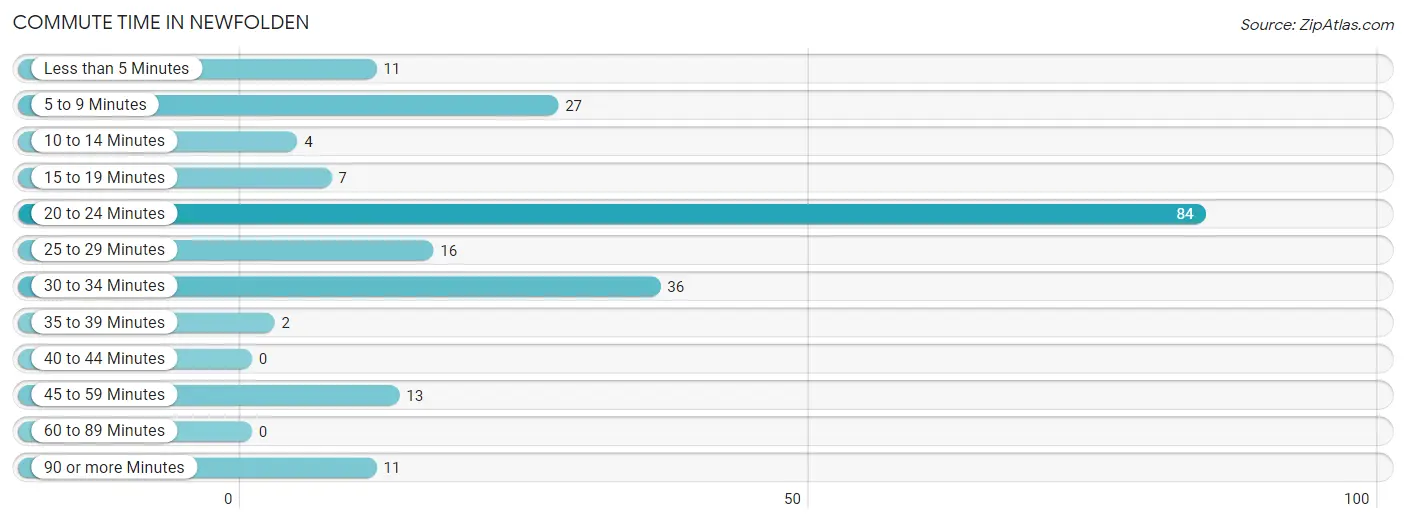
| Commute Time | # Commuters | % Commuters |
| Less than 5 Minutes | 11 | 5.2% |
| 5 to 9 Minutes | 27 | 12.8% |
| 10 to 14 Minutes | 4 | 1.9% |
| 15 to 19 Minutes | 7 | 3.3% |
| 20 to 24 Minutes | 84 | 39.8% |
| 25 to 29 Minutes | 16 | 7.6% |
| 30 to 34 Minutes | 36 | 17.1% |
| 35 to 39 Minutes | 2 | 0.9% |
| 40 to 44 Minutes | 0 | 0.0% |
| 45 to 59 Minutes | 13 | 6.2% |
| 60 to 89 Minutes | 0 | 0.0% |
| 90 or more Minutes | 11 | 5.2% |
Commute Time by Sex in Newfolden
The most common commute times in Newfolden are 20 to 24 minutes (38 commuters, 37.6%) for males and 20 to 24 minutes (46 commuters, 41.8%) for females.
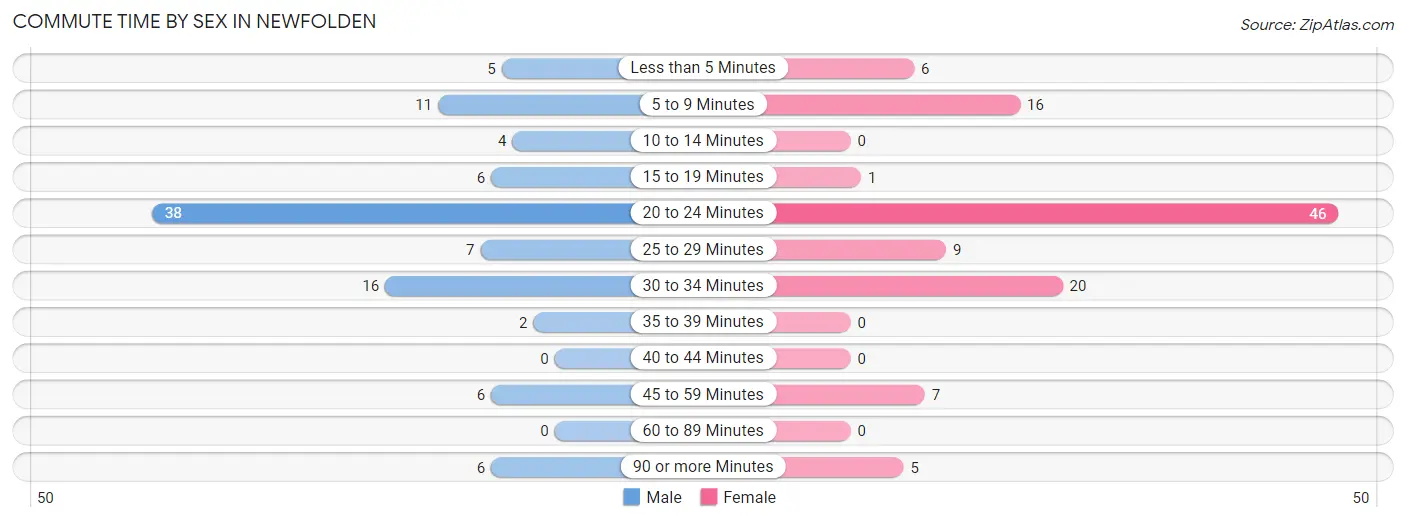
| Commute Time | Male | Female |
| Less than 5 Minutes | 5 (5.0%) | 6 (5.4%) |
| 5 to 9 Minutes | 11 (10.9%) | 16 (14.5%) |
| 10 to 14 Minutes | 4 (4.0%) | 0 (0.0%) |
| 15 to 19 Minutes | 6 (5.9%) | 1 (0.9%) |
| 20 to 24 Minutes | 38 (37.6%) | 46 (41.8%) |
| 25 to 29 Minutes | 7 (6.9%) | 9 (8.2%) |
| 30 to 34 Minutes | 16 (15.8%) | 20 (18.2%) |
| 35 to 39 Minutes | 2 (2.0%) | 0 (0.0%) |
| 40 to 44 Minutes | 0 (0.0%) | 0 (0.0%) |
| 45 to 59 Minutes | 6 (5.9%) | 7 (6.4%) |
| 60 to 89 Minutes | 0 (0.0%) | 0 (0.0%) |
| 90 or more Minutes | 6 (5.9%) | 5 (4.5%) |
Time of Departure to Work by Sex in Newfolden
The most frequent times of departure to work in Newfolden are 7:00 AM to 7:29 AM (22, 21.8%) for males and 12:00 AM to 4:59 AM (28, 25.5%) for females.
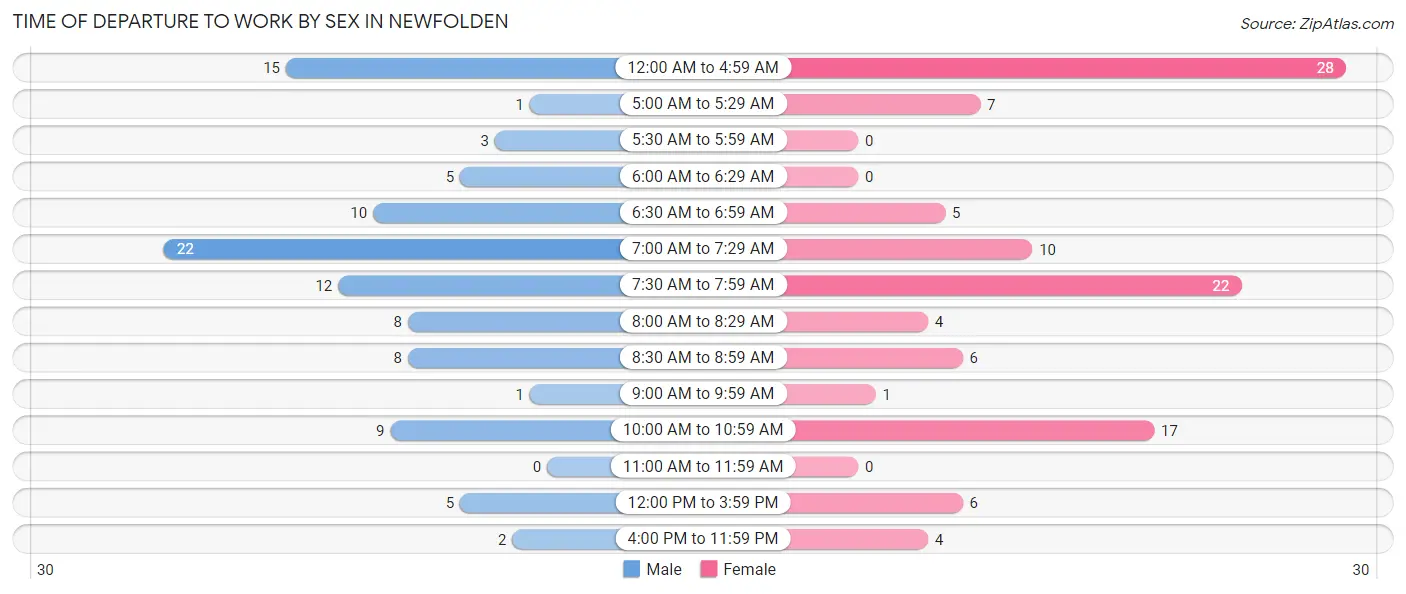
| Time of Departure | Male | Female |
| 12:00 AM to 4:59 AM | 15 (14.8%) | 28 (25.5%) |
| 5:00 AM to 5:29 AM | 1 (1.0%) | 7 (6.4%) |
| 5:30 AM to 5:59 AM | 3 (3.0%) | 0 (0.0%) |
| 6:00 AM to 6:29 AM | 5 (5.0%) | 0 (0.0%) |
| 6:30 AM to 6:59 AM | 10 (9.9%) | 5 (4.5%) |
| 7:00 AM to 7:29 AM | 22 (21.8%) | 10 (9.1%) |
| 7:30 AM to 7:59 AM | 12 (11.9%) | 22 (20.0%) |
| 8:00 AM to 8:29 AM | 8 (7.9%) | 4 (3.6%) |
| 8:30 AM to 8:59 AM | 8 (7.9%) | 6 (5.4%) |
| 9:00 AM to 9:59 AM | 1 (1.0%) | 1 (0.9%) |
| 10:00 AM to 10:59 AM | 9 (8.9%) | 17 (15.4%) |
| 11:00 AM to 11:59 AM | 0 (0.0%) | 0 (0.0%) |
| 12:00 PM to 3:59 PM | 5 (5.0%) | 6 (5.4%) |
| 4:00 PM to 11:59 PM | 2 (2.0%) | 4 (3.6%) |
| Total | 101 (100.0%) | 110 (100.0%) |
Housing Occupancy in Newfolden
Occupancy by Ownership in Newfolden
Of the total 153 dwellings in Newfolden, owner-occupied units account for 103 (67.3%), while renter-occupied units make up 50 (32.7%).
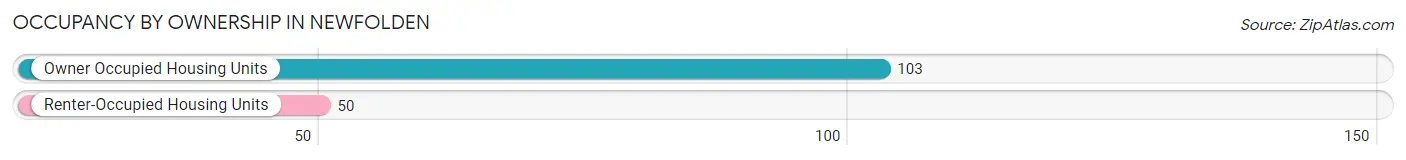
| Occupancy | # Housing Units | % Housing Units |
| Owner Occupied Housing Units | 103 | 67.3% |
| Renter-Occupied Housing Units | 50 | 32.7% |
| Total Occupied Housing Units | 153 | 100.0% |
Occupancy by Household Size in Newfolden
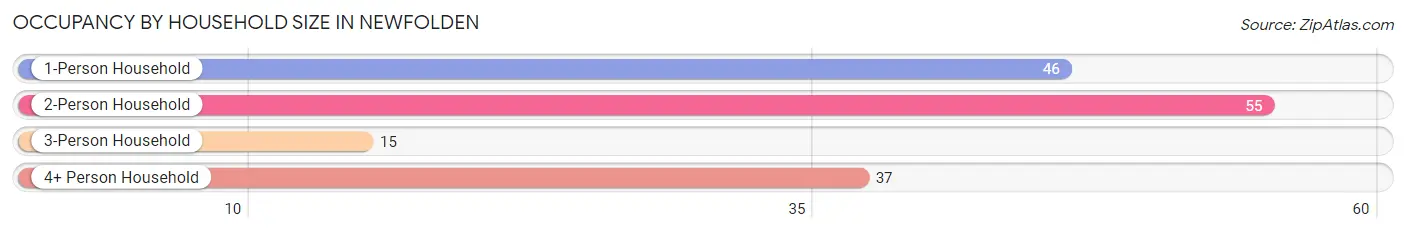
| Household Size | # Housing Units | % Housing Units |
| 1-Person Household | 46 | 30.1% |
| 2-Person Household | 55 | 35.9% |
| 3-Person Household | 15 | 9.8% |
| 4+ Person Household | 37 | 24.2% |
| Total Housing Units | 153 | 100.0% |
Occupancy by Ownership by Household Size in Newfolden
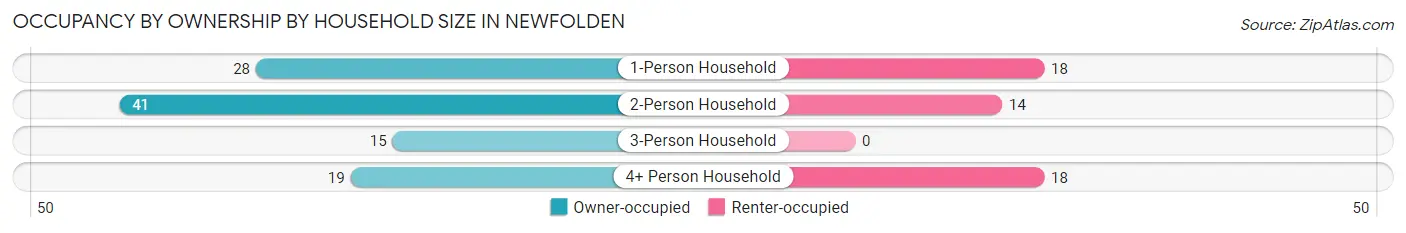
| Household Size | Owner-occupied | Renter-occupied |
| 1-Person Household | 28 (60.9%) | 18 (39.1%) |
| 2-Person Household | 41 (74.6%) | 14 (25.5%) |
| 3-Person Household | 15 (100.0%) | 0 (0.0%) |
| 4+ Person Household | 19 (51.3%) | 18 (48.6%) |
| Total Housing Units | 103 (67.3%) | 50 (32.7%) |
Occupancy by Educational Attainment in Newfolden
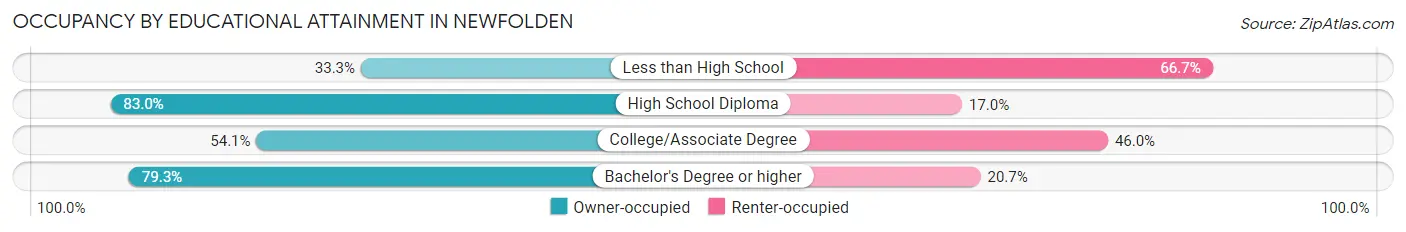
| Household Size | Owner-occupied | Renter-occupied |
| Less than High School | 1 (33.3%) | 2 (66.7%) |
| High School Diploma | 39 (83.0%) | 8 (17.0%) |
| College/Associate Degree | 40 (54.0%) | 34 (46.0%) |
| Bachelor's Degree or higher | 23 (79.3%) | 6 (20.7%) |
Occupancy by Age of Householder in Newfolden
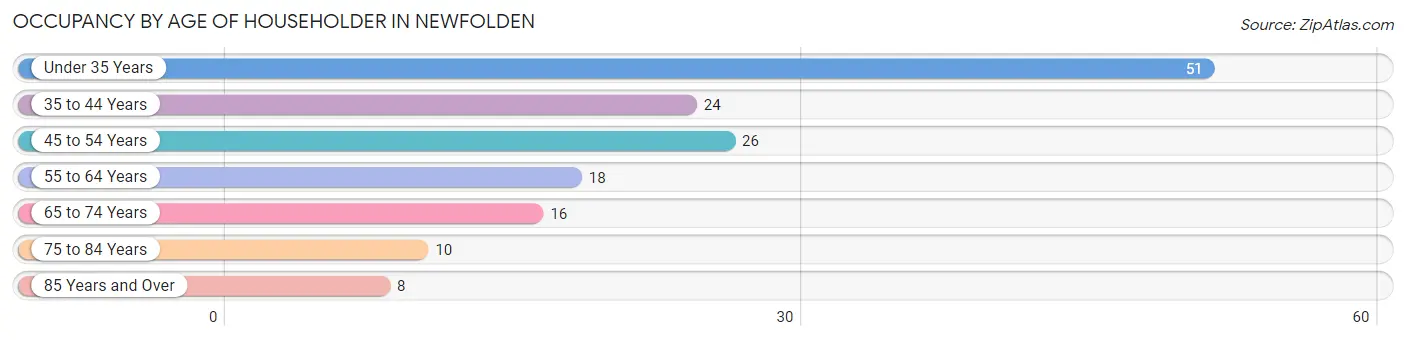
| Age Bracket | # Households | % Households |
| Under 35 Years | 51 | 33.3% |
| 35 to 44 Years | 24 | 15.7% |
| 45 to 54 Years | 26 | 17.0% |
| 55 to 64 Years | 18 | 11.8% |
| 65 to 74 Years | 16 | 10.5% |
| 75 to 84 Years | 10 | 6.5% |
| 85 Years and Over | 8 | 5.2% |
| Total | 153 | 100.0% |
Housing Finances in Newfolden
Median Income by Occupancy in Newfolden
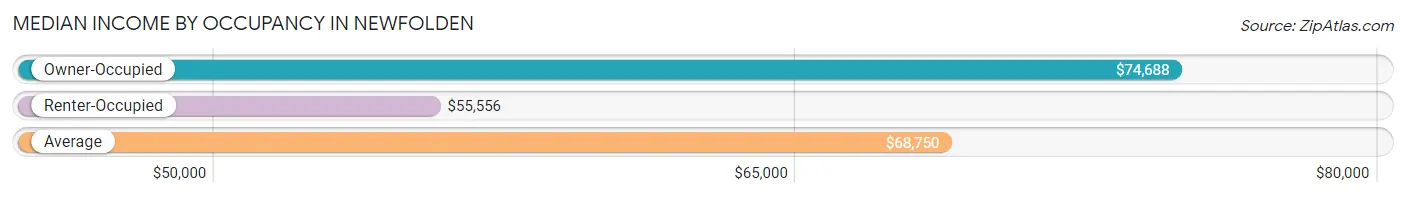
| Occupancy Type | # Households | Median Income |
| Owner-Occupied | 103 (67.3%) | $74,688 |
| Renter-Occupied | 50 (32.7%) | $55,556 |
| Average | 153 (100.0%) | $68,750 |
Occupancy by Householder Income Bracket in Newfolden
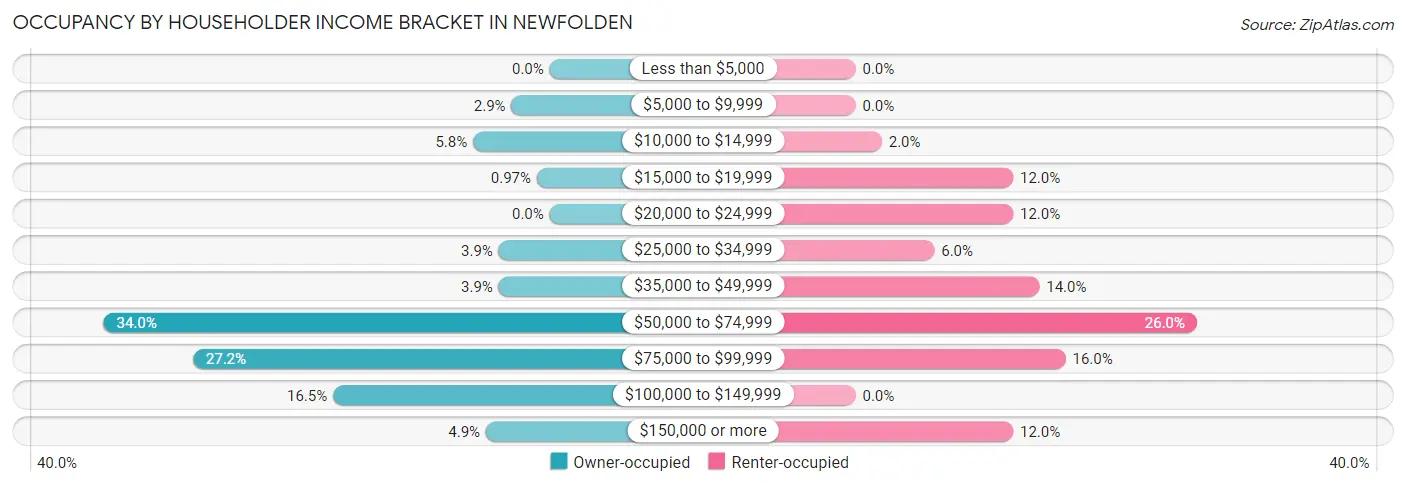
| Income Bracket | Owner-occupied | Renter-occupied |
| Less than $5,000 | 0 (0.0%) | 0 (0.0%) |
| $5,000 to $9,999 | 3 (2.9%) | 0 (0.0%) |
| $10,000 to $14,999 | 6 (5.8%) | 1 (2.0%) |
| $15,000 to $19,999 | 1 (1.0%) | 6 (12.0%) |
| $20,000 to $24,999 | 0 (0.0%) | 6 (12.0%) |
| $25,000 to $34,999 | 4 (3.9%) | 3 (6.0%) |
| $35,000 to $49,999 | 4 (3.9%) | 7 (14.0%) |
| $50,000 to $74,999 | 35 (34.0%) | 13 (26.0%) |
| $75,000 to $99,999 | 28 (27.2%) | 8 (16.0%) |
| $100,000 to $149,999 | 17 (16.5%) | 0 (0.0%) |
| $150,000 or more | 5 (4.9%) | 6 (12.0%) |
| Total | 103 (100.0%) | 50 (100.0%) |
Monthly Housing Cost Tiers in Newfolden
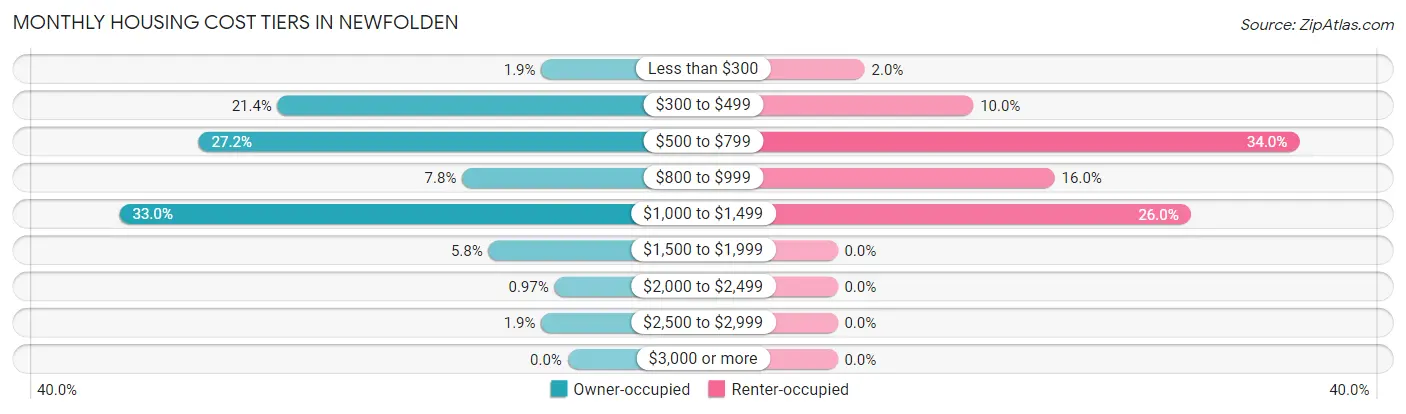
| Monthly Cost | Owner-occupied | Renter-occupied |
| Less than $300 | 2 (1.9%) | 1 (2.0%) |
| $300 to $499 | 22 (21.4%) | 5 (10.0%) |
| $500 to $799 | 28 (27.2%) | 17 (34.0%) |
| $800 to $999 | 8 (7.8%) | 8 (16.0%) |
| $1,000 to $1,499 | 34 (33.0%) | 13 (26.0%) |
| $1,500 to $1,999 | 6 (5.8%) | 0 (0.0%) |
| $2,000 to $2,499 | 1 (1.0%) | 0 (0.0%) |
| $2,500 to $2,999 | 2 (1.9%) | 0 (0.0%) |
| $3,000 or more | 0 (0.0%) | 0 (0.0%) |
| Total | 103 (100.0%) | 50 (100.0%) |
Physical Housing Characteristics in Newfolden
Housing Structures in Newfolden
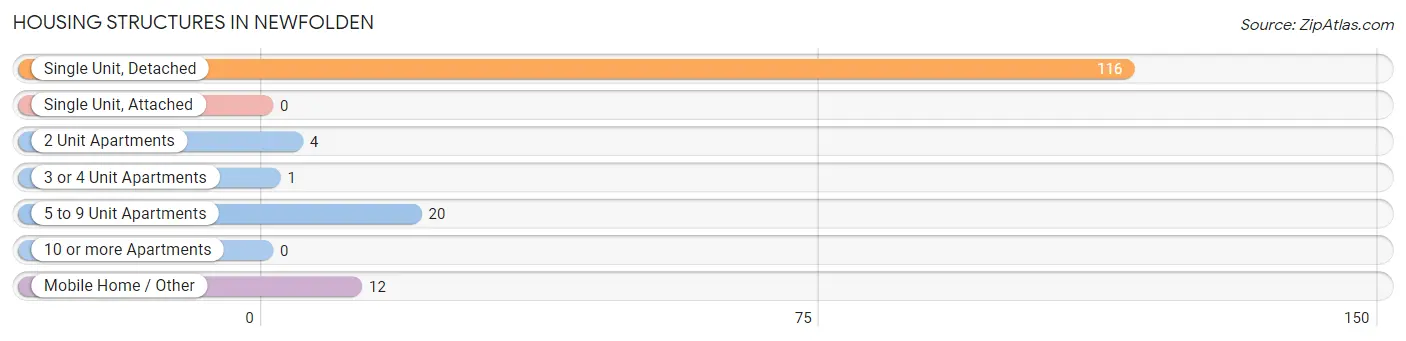
| Structure Type | # Housing Units | % Housing Units |
| Single Unit, Detached | 116 | 75.8% |
| Single Unit, Attached | 0 | 0.0% |
| 2 Unit Apartments | 4 | 2.6% |
| 3 or 4 Unit Apartments | 1 | 0.6% |
| 5 to 9 Unit Apartments | 20 | 13.1% |
| 10 or more Apartments | 0 | 0.0% |
| Mobile Home / Other | 12 | 7.8% |
| Total | 153 | 100.0% |
Housing Structures by Occupancy in Newfolden
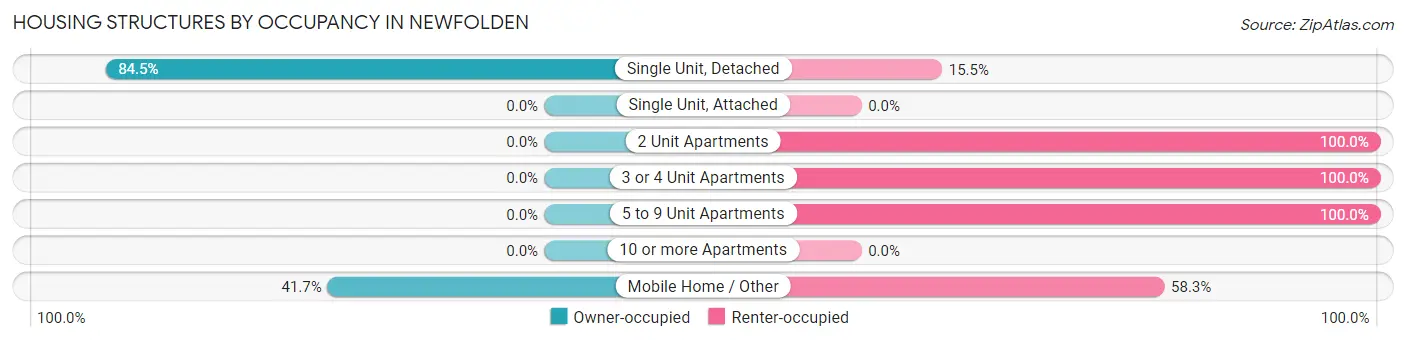
| Structure Type | Owner-occupied | Renter-occupied |
| Single Unit, Detached | 98 (84.5%) | 18 (15.5%) |
| Single Unit, Attached | 0 (0.0%) | 0 (0.0%) |
| 2 Unit Apartments | 0 (0.0%) | 4 (100.0%) |
| 3 or 4 Unit Apartments | 0 (0.0%) | 1 (100.0%) |
| 5 to 9 Unit Apartments | 0 (0.0%) | 20 (100.0%) |
| 10 or more Apartments | 0 (0.0%) | 0 (0.0%) |
| Mobile Home / Other | 5 (41.7%) | 7 (58.3%) |
| Total | 103 (67.3%) | 50 (32.7%) |
Housing Structures by Number of Rooms in Newfolden
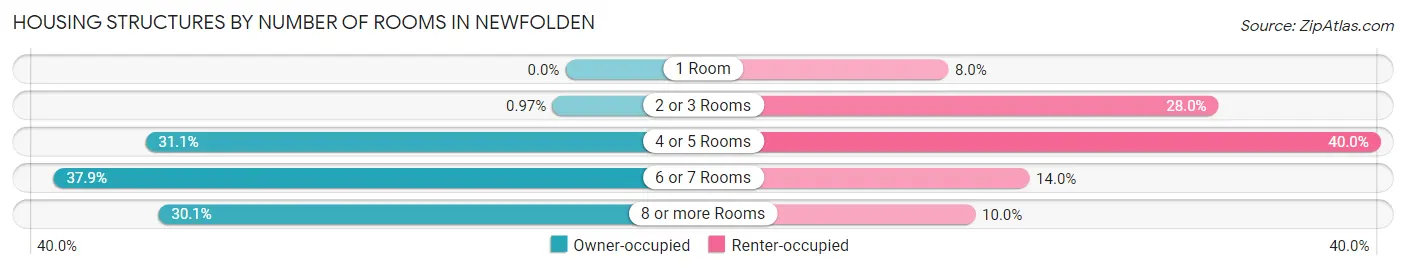
| Number of Rooms | Owner-occupied | Renter-occupied |
| 1 Room | 0 (0.0%) | 4 (8.0%) |
| 2 or 3 Rooms | 1 (1.0%) | 14 (28.0%) |
| 4 or 5 Rooms | 32 (31.1%) | 20 (40.0%) |
| 6 or 7 Rooms | 39 (37.9%) | 7 (14.0%) |
| 8 or more Rooms | 31 (30.1%) | 5 (10.0%) |
| Total | 103 (100.0%) | 50 (100.0%) |
Housing Structure by Heating Type in Newfolden
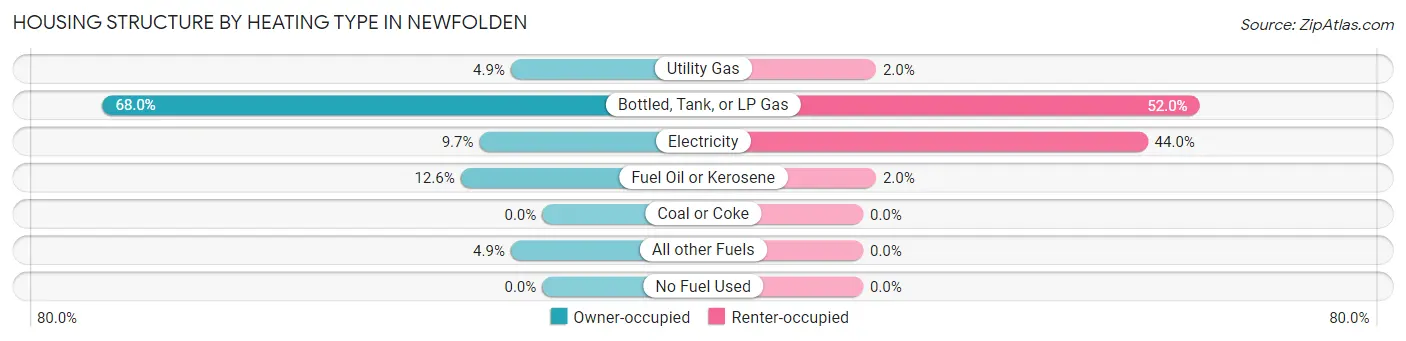
| Heating Type | Owner-occupied | Renter-occupied |
| Utility Gas | 5 (4.9%) | 1 (2.0%) |
| Bottled, Tank, or LP Gas | 70 (68.0%) | 26 (52.0%) |
| Electricity | 10 (9.7%) | 22 (44.0%) |
| Fuel Oil or Kerosene | 13 (12.6%) | 1 (2.0%) |
| Coal or Coke | 0 (0.0%) | 0 (0.0%) |
| All other Fuels | 5 (4.9%) | 0 (0.0%) |
| No Fuel Used | 0 (0.0%) | 0 (0.0%) |
| Total | 103 (100.0%) | 50 (100.0%) |
Household Vehicle Usage in Newfolden
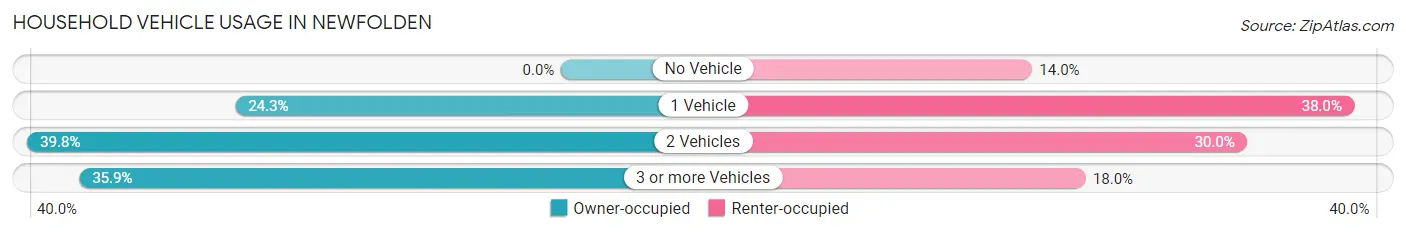
| Vehicles per Household | Owner-occupied | Renter-occupied |
| No Vehicle | 0 (0.0%) | 7 (14.0%) |
| 1 Vehicle | 25 (24.3%) | 19 (38.0%) |
| 2 Vehicles | 41 (39.8%) | 15 (30.0%) |
| 3 or more Vehicles | 37 (35.9%) | 9 (18.0%) |
| Total | 103 (100.0%) | 50 (100.0%) |
Real Estate & Mortgages in Newfolden
Real Estate and Mortgage Overview in Newfolden
| Characteristic | Without Mortgage | With Mortgage |
| Housing Units | 44 | 59 |
| Median Property Value | $106,800 | $163,300 |
| Median Household Income | $76,250 | $2 |
| Monthly Housing Costs | $475 | $0 |
| Real Estate Taxes | $840 | $1 |
Property Value by Mortgage Status in Newfolden
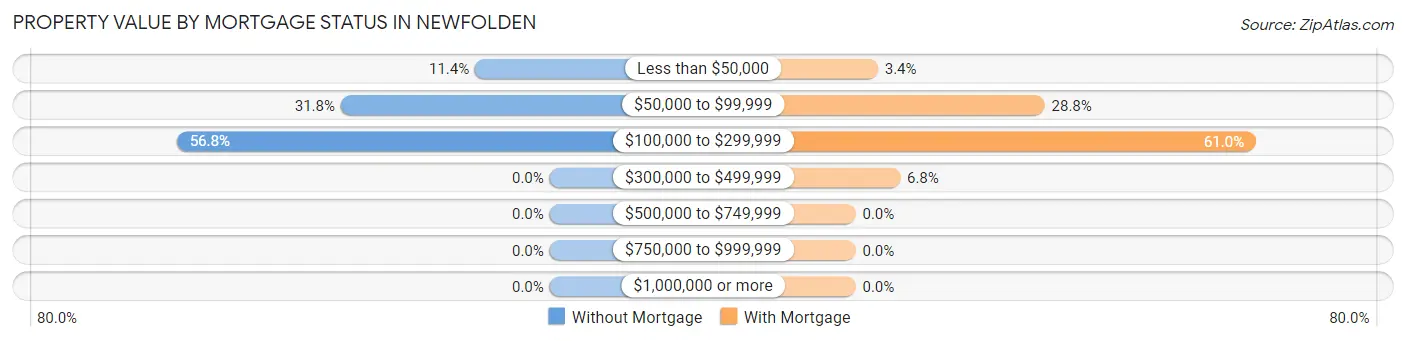
| Property Value | Without Mortgage | With Mortgage |
| Less than $50,000 | 5 (11.4%) | 2 (3.4%) |
| $50,000 to $99,999 | 14 (31.8%) | 17 (28.8%) |
| $100,000 to $299,999 | 25 (56.8%) | 36 (61.0%) |
| $300,000 to $499,999 | 0 (0.0%) | 4 (6.8%) |
| $500,000 to $749,999 | 0 (0.0%) | 0 (0.0%) |
| $750,000 to $999,999 | 0 (0.0%) | 0 (0.0%) |
| $1,000,000 or more | 0 (0.0%) | 0 (0.0%) |
| Total | 44 (100.0%) | 59 (100.0%) |
Household Income by Mortgage Status in Newfolden
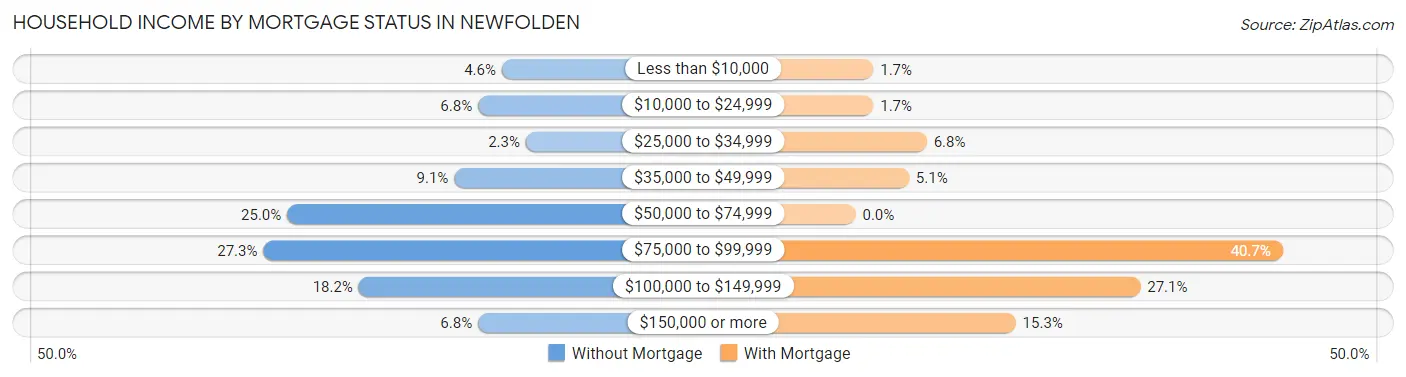
| Household Income | Without Mortgage | With Mortgage |
| Less than $10,000 | 2 (4.5%) | 1 (1.7%) |
| $10,000 to $24,999 | 3 (6.8%) | 1 (1.7%) |
| $25,000 to $34,999 | 1 (2.3%) | 4 (6.8%) |
| $35,000 to $49,999 | 4 (9.1%) | 3 (5.1%) |
| $50,000 to $74,999 | 11 (25.0%) | 0 (0.0%) |
| $75,000 to $99,999 | 12 (27.3%) | 24 (40.7%) |
| $100,000 to $149,999 | 8 (18.2%) | 16 (27.1%) |
| $150,000 or more | 3 (6.8%) | 9 (15.2%) |
| Total | 44 (100.0%) | 59 (100.0%) |
Property Value to Household Income Ratio in Newfolden
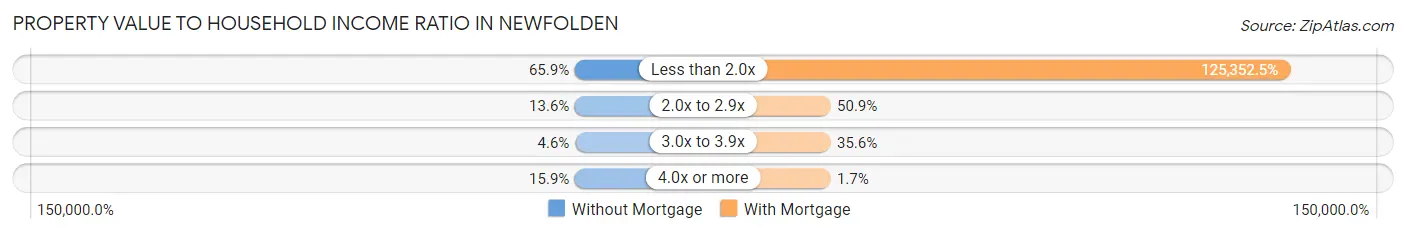
| Value-to-Income Ratio | Without Mortgage | With Mortgage |
| Less than 2.0x | 29 (65.9%) | 73,958 (125,352.5%) |
| 2.0x to 2.9x | 6 (13.6%) | 30 (50.8%) |
| 3.0x to 3.9x | 2 (4.5%) | 21 (35.6%) |
| 4.0x or more | 7 (15.9%) | 1 (1.7%) |
| Total | 44 (100.0%) | 59 (100.0%) |
Real Estate Taxes by Mortgage Status in Newfolden
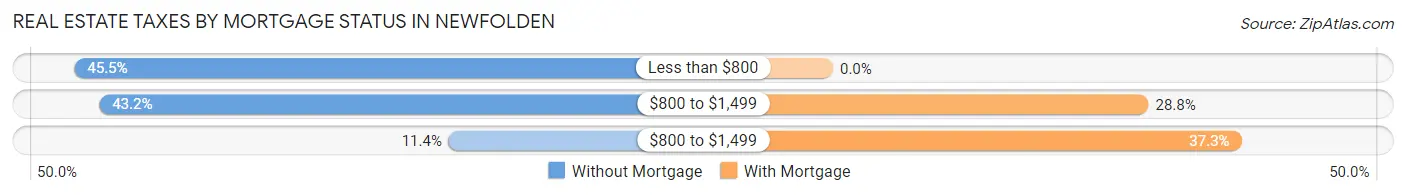
| Property Taxes | Without Mortgage | With Mortgage |
| Less than $800 | 20 (45.5%) | 0 (0.0%) |
| $800 to $1,499 | 19 (43.2%) | 17 (28.8%) |
| $800 to $1,499 | 5 (11.4%) | 22 (37.3%) |
| Total | 44 (100.0%) | 59 (100.0%) |
Health & Disability in Newfolden
Health Insurance Coverage by Age in Newfolden
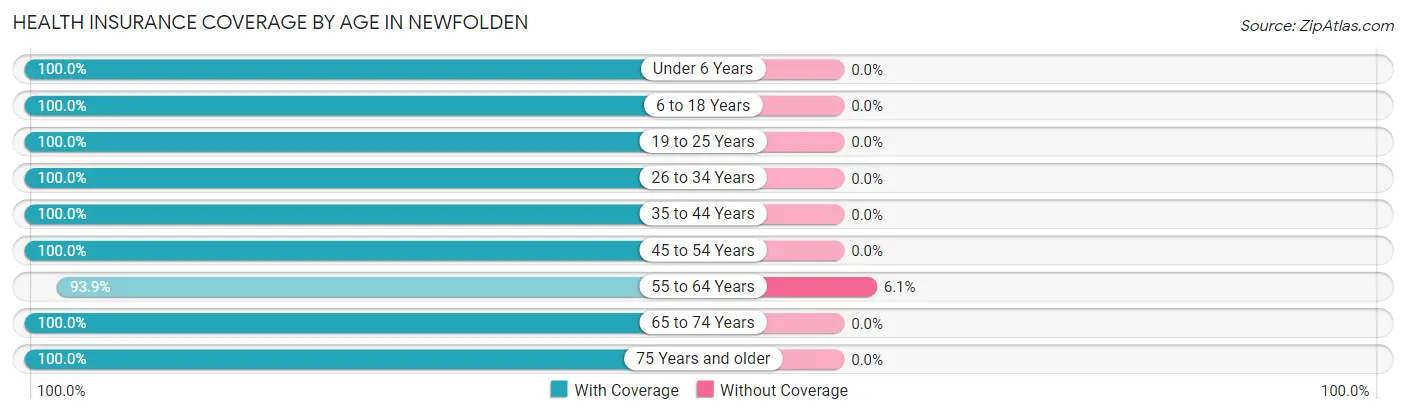
| Age Bracket | With Coverage | Without Coverage |
| Under 6 Years | 65 (100.0%) | 0 (0.0%) |
| 6 to 18 Years | 80 (100.0%) | 0 (0.0%) |
| 19 to 25 Years | 57 (100.0%) | 0 (0.0%) |
| 26 to 34 Years | 49 (100.0%) | 0 (0.0%) |
| 35 to 44 Years | 54 (100.0%) | 0 (0.0%) |
| 45 to 54 Years | 56 (100.0%) | 0 (0.0%) |
| 55 to 64 Years | 31 (93.9%) | 2 (6.1%) |
| 65 to 74 Years | 23 (100.0%) | 0 (0.0%) |
| 75 Years and older | 31 (100.0%) | 0 (0.0%) |
| Total | 446 (99.6%) | 2 (0.4%) |
Health Insurance Coverage by Citizenship Status in Newfolden
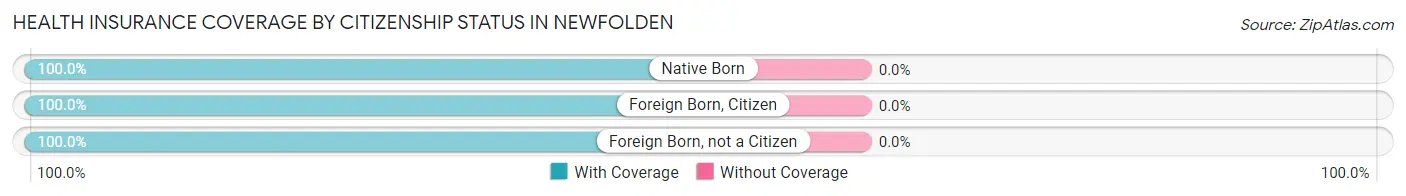
| Citizenship Status | With Coverage | Without Coverage |
| Native Born | 65 (100.0%) | 0 (0.0%) |
| Foreign Born, Citizen | 80 (100.0%) | 0 (0.0%) |
| Foreign Born, not a Citizen | 57 (100.0%) | 0 (0.0%) |
Health Insurance Coverage by Household Income in Newfolden
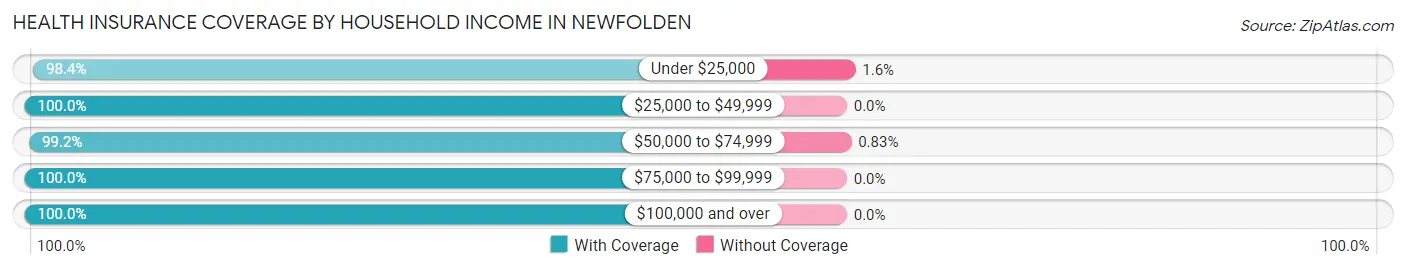
| Household Income | With Coverage | Without Coverage |
| Under $25,000 | 61 (98.4%) | 1 (1.6%) |
| $25,000 to $49,999 | 27 (100.0%) | 0 (0.0%) |
| $50,000 to $74,999 | 120 (99.2%) | 1 (0.8%) |
| $75,000 to $99,999 | 94 (100.0%) | 0 (0.0%) |
| $100,000 and over | 144 (100.0%) | 0 (0.0%) |
Public vs Private Health Insurance Coverage by Age in Newfolden
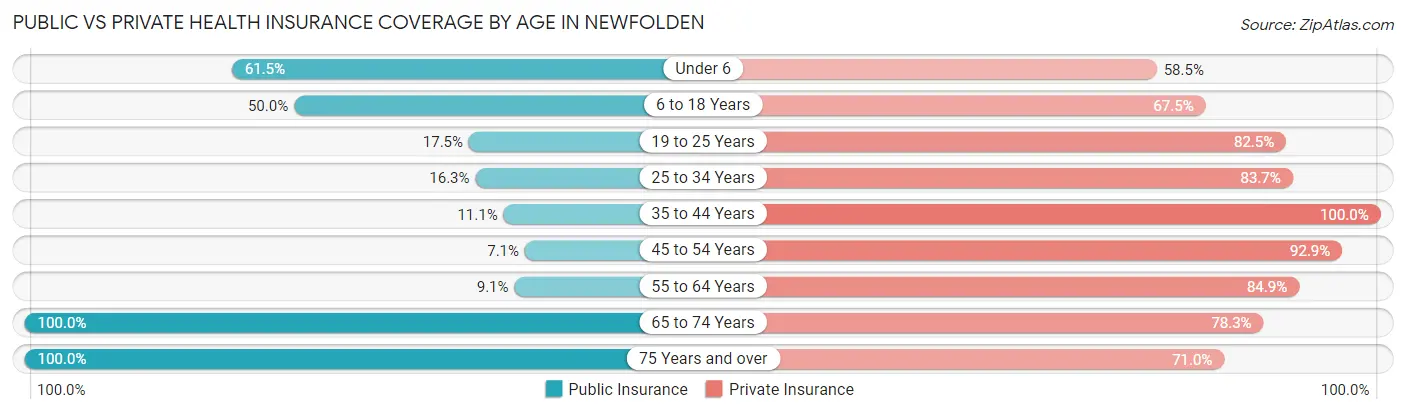
| Age Bracket | Public Insurance | Private Insurance |
| Under 6 | 40 (61.5%) | 38 (58.5%) |
| 6 to 18 Years | 40 (50.0%) | 54 (67.5%) |
| 19 to 25 Years | 10 (17.5%) | 47 (82.5%) |
| 25 to 34 Years | 8 (16.3%) | 41 (83.7%) |
| 35 to 44 Years | 6 (11.1%) | 54 (100.0%) |
| 45 to 54 Years | 4 (7.1%) | 52 (92.9%) |
| 55 to 64 Years | 3 (9.1%) | 28 (84.9%) |
| 65 to 74 Years | 23 (100.0%) | 18 (78.3%) |
| 75 Years and over | 31 (100.0%) | 22 (71.0%) |
| Total | 165 (36.8%) | 354 (79.0%) |
Disability Status by Sex by Age in Newfolden
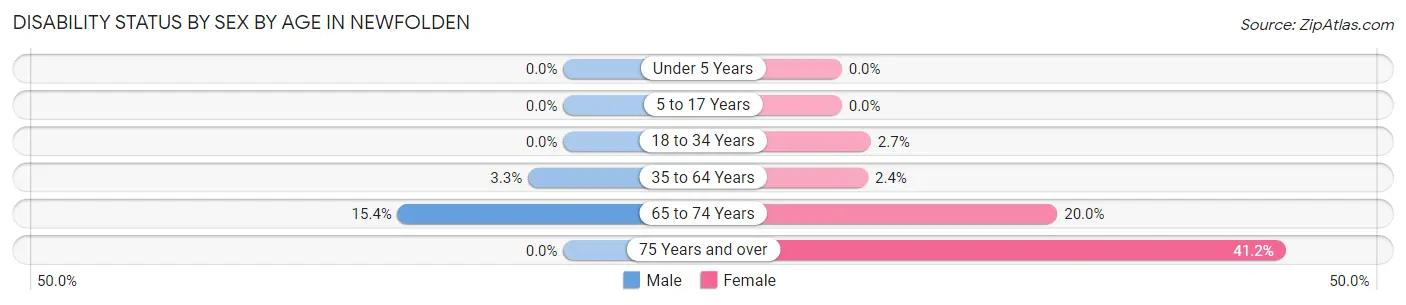
| Age Bracket | Male | Female |
| Under 5 Years | 0 (0.0%) | 0 (0.0%) |
| 5 to 17 Years | 0 (0.0%) | 0 (0.0%) |
| 18 to 34 Years | 0 (0.0%) | 2 (2.7%) |
| 35 to 64 Years | 2 (3.3%) | 2 (2.4%) |
| 65 to 74 Years | 2 (15.4%) | 2 (20.0%) |
| 75 Years and over | 0 (0.0%) | 7 (41.2%) |
Disability Class by Sex by Age in Newfolden
Disability Class: Hearing Difficulty
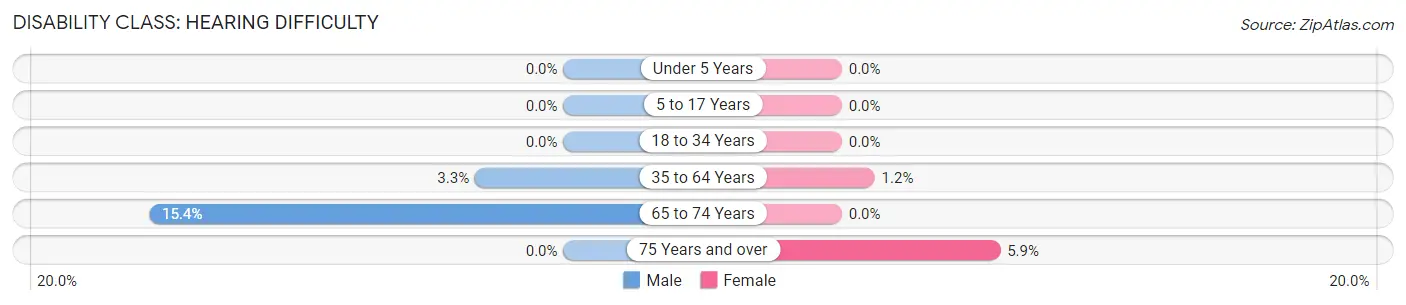
| Age Bracket | Male | Female |
| Under 5 Years | 0 (0.0%) | 0 (0.0%) |
| 5 to 17 Years | 0 (0.0%) | 0 (0.0%) |
| 18 to 34 Years | 0 (0.0%) | 0 (0.0%) |
| 35 to 64 Years | 2 (3.3%) | 1 (1.2%) |
| 65 to 74 Years | 2 (15.4%) | 0 (0.0%) |
| 75 Years and over | 0 (0.0%) | 1 (5.9%) |
Disability Class: Vision Difficulty
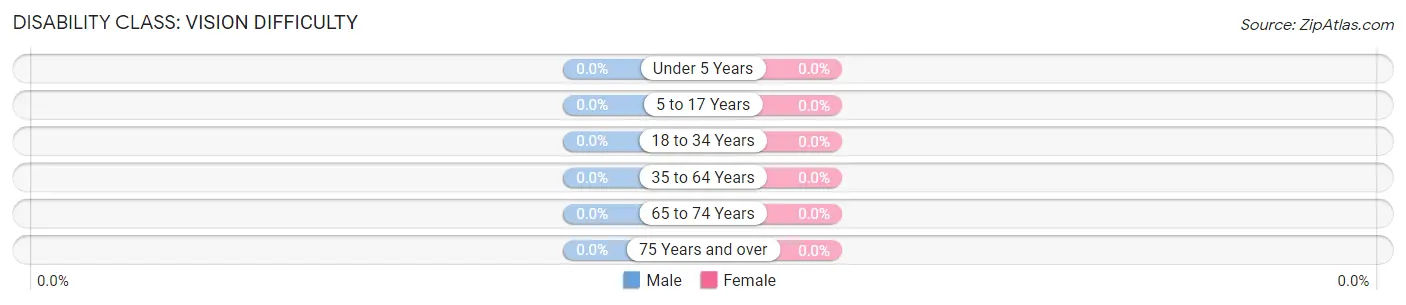
| Age Bracket | Male | Female |
| Under 5 Years | 0 (0.0%) | 0 (0.0%) |
| 5 to 17 Years | 0 (0.0%) | 0 (0.0%) |
| 18 to 34 Years | 0 (0.0%) | 0 (0.0%) |
| 35 to 64 Years | 0 (0.0%) | 0 (0.0%) |
| 65 to 74 Years | 0 (0.0%) | 0 (0.0%) |
| 75 Years and over | 0 (0.0%) | 0 (0.0%) |
Disability Class: Cognitive Difficulty
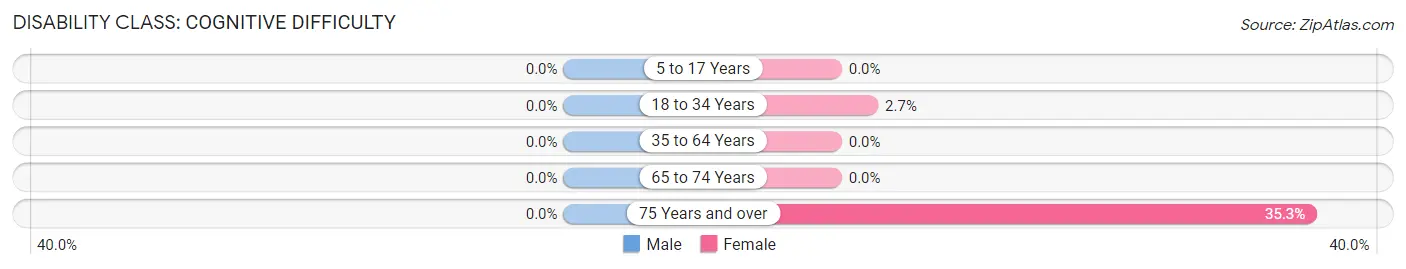
| Age Bracket | Male | Female |
| 5 to 17 Years | 0 (0.0%) | 0 (0.0%) |
| 18 to 34 Years | 0 (0.0%) | 2 (2.7%) |
| 35 to 64 Years | 0 (0.0%) | 0 (0.0%) |
| 65 to 74 Years | 0 (0.0%) | 0 (0.0%) |
| 75 Years and over | 0 (0.0%) | 6 (35.3%) |
Disability Class: Ambulatory Difficulty
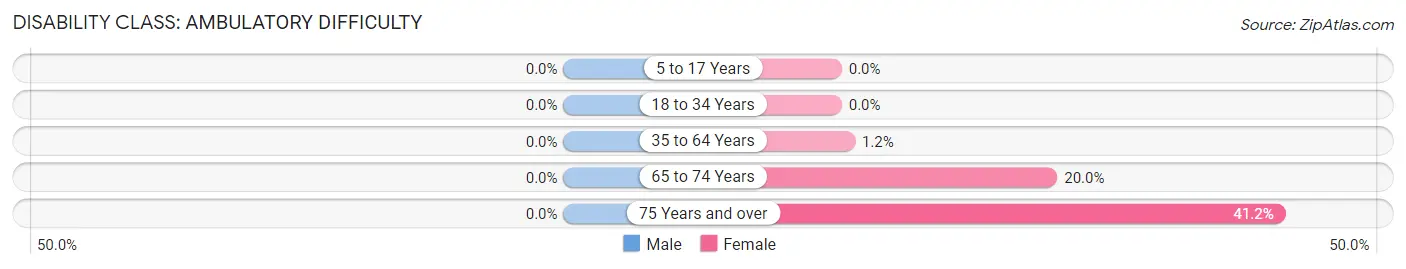
| Age Bracket | Male | Female |
| 5 to 17 Years | 0 (0.0%) | 0 (0.0%) |
| 18 to 34 Years | 0 (0.0%) | 0 (0.0%) |
| 35 to 64 Years | 0 (0.0%) | 1 (1.2%) |
| 65 to 74 Years | 0 (0.0%) | 2 (20.0%) |
| 75 Years and over | 0 (0.0%) | 7 (41.2%) |
Disability Class: Self-Care Difficulty
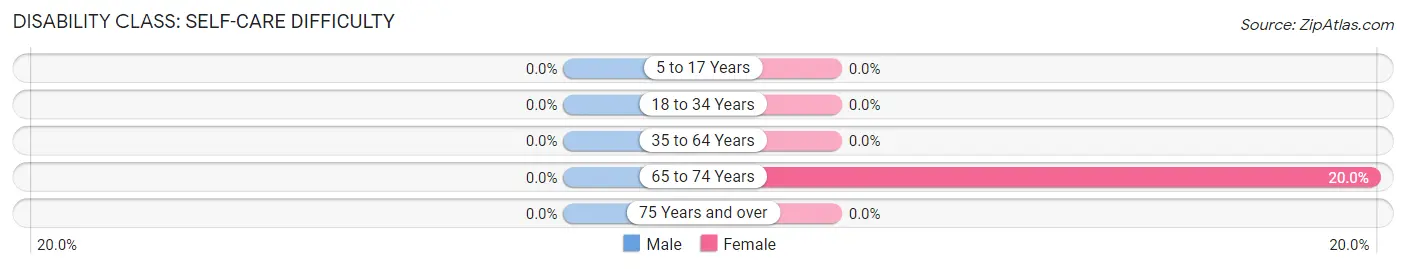
| Age Bracket | Male | Female |
| 5 to 17 Years | 0 (0.0%) | 0 (0.0%) |
| 18 to 34 Years | 0 (0.0%) | 0 (0.0%) |
| 35 to 64 Years | 0 (0.0%) | 0 (0.0%) |
| 65 to 74 Years | 0 (0.0%) | 2 (20.0%) |
| 75 Years and over | 0 (0.0%) | 0 (0.0%) |
Technology Access in Newfolden
Computing Device Access in Newfolden
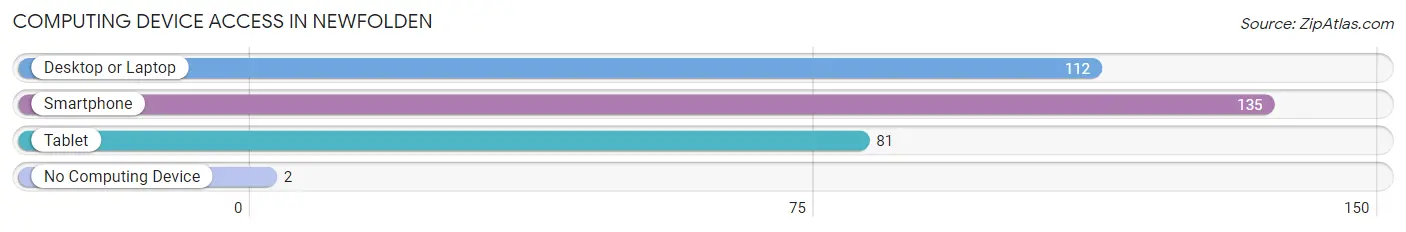
| Device Type | # Households | % Households |
| Desktop or Laptop | 112 | 73.2% |
| Smartphone | 135 | 88.2% |
| Tablet | 81 | 52.9% |
| No Computing Device | 2 | 1.3% |
| Total | 153 | 100.0% |
Internet Access in Newfolden
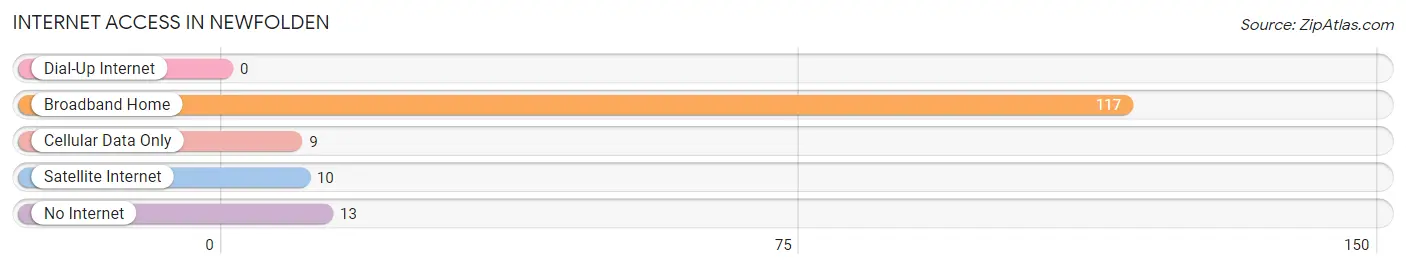
| Internet Type | # Households | % Households |
| Dial-Up Internet | 0 | 0.0% |
| Broadband Home | 117 | 76.5% |
| Cellular Data Only | 9 | 5.9% |
| Satellite Internet | 10 | 6.5% |
| No Internet | 13 | 8.5% |
| Total | 153 | 100.0% |
Newfolden Summary
Folden, Minnesota is a small city located in Marshall County, Minnesota. It is situated on the western edge of the state, near the border with North Dakota. The city has a population of approximately 1,000 people and is part of the Thief River Falls, Minnesota Metropolitan Statistical Area.
History
Folden was founded in 1883 by Norwegian immigrants who had settled in the area. The city was named after the Norwegian word for “fold”, which is a type of valley. The city was originally a farming community, and the first settlers were mostly farmers. The city was incorporated in 1887.
In the early 1900s, the city began to grow and develop. The first bank was established in 1906, and the first school was built in 1907. The city also had a post office, a hotel, and a general store.
In the 1920s, the city began to experience a period of growth and development. The city was connected to the rest of the state by a railroad line, and the first telephone service was established in 1924. The city also had a movie theater, a library, and a hospital.
In the 1950s, the city experienced a period of decline. The railroad line was abandoned, and the city’s population began to decline. The city’s economy shifted from agriculture to manufacturing, and the city’s population began to stabilize.
Geography
Folden is located in the western part of Minnesota, near the border with North Dakota. The city is situated on the Red River, which is a tributary of the Minnesota River. The city is surrounded by rolling hills and farmland.
The climate in Folden is classified as humid continental, with cold winters and warm summers. The average annual temperature is around 40 degrees Fahrenheit. The average annual precipitation is around 30 inches.
Economy
Folden’s economy is primarily based on agriculture and manufacturing. The city is home to several large farms, and the surrounding area is known for its production of corn, soybeans, and wheat. The city also has several manufacturing plants, including a paper mill and a furniture factory.
The city also has a small retail sector, with several stores and restaurants. The city is also home to a small airport, which serves the surrounding area.
Demographics
As of the 2010 census, the population of Folden was 1,000 people. The racial makeup of the city was 97.2% White, 0.7% African American, 0.3% Native American, 0.2% Asian, and 1.6% from other races. The median household income was $37,500, and the median family income was $45,000.
The city has a large Norwegian-American population, and the city celebrates its Norwegian heritage with an annual Norwegian festival. The city also has a large Catholic population, and the city is home to several Catholic churches.
Conclusion
Folden, Minnesota is a small city located in Marshall County, Minnesota. It is situated on the western edge of the state, near the border with North Dakota. The city has a population of approximately 1,000 people and is part of the Thief River Falls, Minnesota Metropolitan Statistical Area. The city’s economy is primarily based on agriculture and manufacturing, and the city has a large Norwegian-American population. The city also has a small retail sector, with several stores and restaurants. The city is also home to a small airport, which serves the surrounding area.
Common Questions
What is Per Capita Income in Newfolden?
Per Capita income in Newfolden is $28,687.
What is the Median Family Income in Newfolden?
Median Family Income in Newfolden is $73,194.
What is the Median Household income in Newfolden?
Median Household Income in Newfolden is $68,750.
What is Income or Wage Gap in Newfolden?
Income or Wage Gap in Newfolden is 7.7%.
Women in Newfolden earn 92.3 cents for every dollar earned by a man.
What is Inequality or Gini Index in Newfolden?
Inequality or Gini Index in Newfolden is 0.33.
What is the Total Population of Newfolden?
Total Population of Newfolden is 448.
What is the Total Male Population of Newfolden?
Total Male Population of Newfolden is 199.
What is the Total Female Population of Newfolden?
Total Female Population of Newfolden is 249.
What is the Ratio of Males per 100 Females in Newfolden?
There are 79.92 Males per 100 Females in Newfolden.
What is the Ratio of Females per 100 Males in Newfolden?
There are 125.13 Females per 100 Males in Newfolden.
What is the Median Population Age in Newfolden?
Median Population Age in Newfolden is 29.0 Years.
What is the Average Family Size in Newfolden
Average Family Size in Newfolden is 3.6 People.
What is the Average Household Size in Newfolden
Average Household Size in Newfolden is 2.9 People.
How Large is the Labor Force in Newfolden?
There are 245 People in the Labor Forcein in Newfolden.
What is the Percentage of People in the Labor Force in Newfolden?
75.4% of People are in the Labor Force in Newfolden.
What is the Unemployment Rate in Newfolden?
Unemployment Rate in Newfolden is 1.6%.