Evansville, MN Map & Demographics
Evansville Map
Evansville Overview
$28,213
PER CAPITA INCOME
$62,500
AVG FAMILY INCOME
$48,750
AVG HOUSEHOLD INCOME
16.6%
WAGE / INCOME GAP [ % ]
83.4¢/ $1
WAGE / INCOME GAP [ $ ]
0.44
INEQUALITY / GINI INDEX
659
TOTAL POPULATION
306
MALE POPULATION
353
FEMALE POPULATION
86.69
MALES / 100 FEMALES
115.36
FEMALES / 100 MALES
37.7
MEDIAN AGE
2.9
AVG FAMILY SIZE
2.1
AVG HOUSEHOLD SIZE
305
LABOR FORCE [ PEOPLE ]
58.4%
PERCENT IN LABOR FORCE
3.0%
UNEMPLOYMENT RATE
Evansville Zip Codes
Income in Evansville
Income Overview in Evansville
Per Capita Income in Evansville is $28,213, while median incomes of families and households are $62,500 and $48,750 respectively.
| Characteristic | Number | Measure |
| Per Capita Income | 659 | $28,213 |
| Median Family Income | 148 | $62,500 |
| Mean Family Income | 148 | $73,336 |
| Median Household Income | 293 | $48,750 |
| Mean Household Income | 293 | $61,108 |
| Income Deficit | 148 | $0 |
| Wage / Income Gap (%) | 659 | 16.59% |
| Wage / Income Gap ($) | 659 | 83.41¢ per $1 |
| Gini / Inequality Index | 659 | 0.44 |
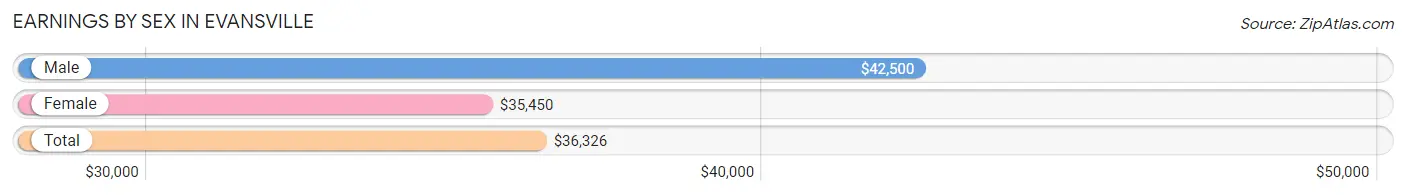
Earnings by Sex in Evansville
Average Earnings in Evansville are $36,326, $42,500 for men and $35,450 for women, a difference of 16.6%.
| Sex | Number | Average Earnings |
| Male | 164 (49.0%) | $42,500 |
| Female | 171 (51.0%) | $35,450 |
| Total | 335 (100.0%) | $36,326 |
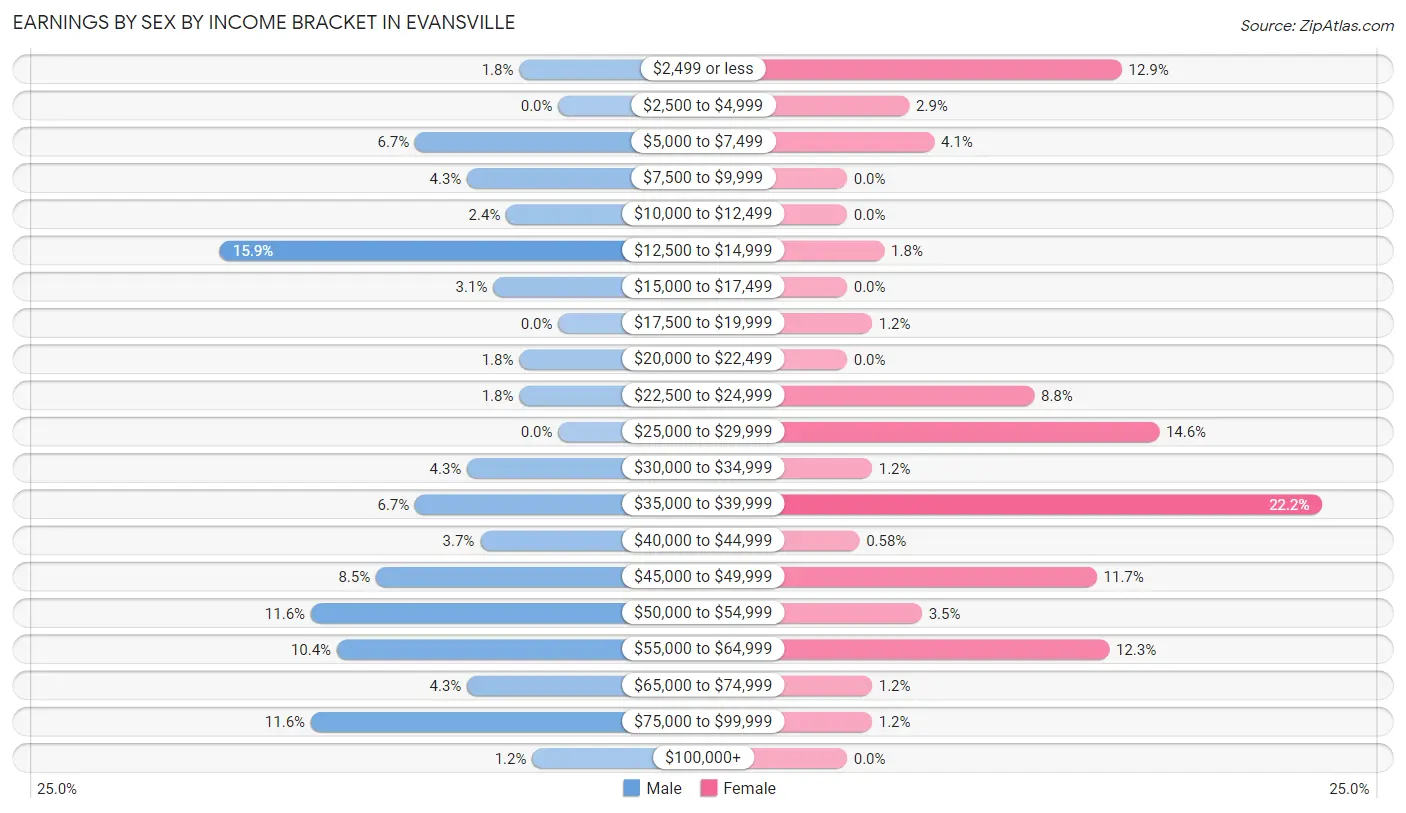
Earnings by Sex by Income Bracket in Evansville
The most common earnings brackets in Evansville are $12,500 to $14,999 for men (26 | 15.9%) and $35,000 to $39,999 for women (38 | 22.2%).
| Income | Male | Female |
| $2,499 or less | 3 (1.8%) | 22 (12.9%) |
| $2,500 to $4,999 | 0 (0.0%) | 5 (2.9%) |
| $5,000 to $7,499 | 11 (6.7%) | 7 (4.1%) |
| $7,500 to $9,999 | 7 (4.3%) | 0 (0.0%) |
| $10,000 to $12,499 | 4 (2.4%) | 0 (0.0%) |
| $12,500 to $14,999 | 26 (15.9%) | 3 (1.8%) |
| $15,000 to $17,499 | 5 (3.0%) | 0 (0.0%) |
| $17,500 to $19,999 | 0 (0.0%) | 2 (1.2%) |
| $20,000 to $22,499 | 3 (1.8%) | 0 (0.0%) |
| $22,500 to $24,999 | 3 (1.8%) | 15 (8.8%) |
| $25,000 to $29,999 | 0 (0.0%) | 25 (14.6%) |
| $30,000 to $34,999 | 7 (4.3%) | 2 (1.2%) |
| $35,000 to $39,999 | 11 (6.7%) | 38 (22.2%) |
| $40,000 to $44,999 | 6 (3.7%) | 1 (0.6%) |
| $45,000 to $49,999 | 14 (8.5%) | 20 (11.7%) |
| $50,000 to $54,999 | 19 (11.6%) | 6 (3.5%) |
| $55,000 to $64,999 | 17 (10.4%) | 21 (12.3%) |
| $65,000 to $74,999 | 7 (4.3%) | 2 (1.2%) |
| $75,000 to $99,999 | 19 (11.6%) | 2 (1.2%) |
| $100,000+ | 2 (1.2%) | 0 (0.0%) |
| Total | 164 (100.0%) | 171 (100.0%) |
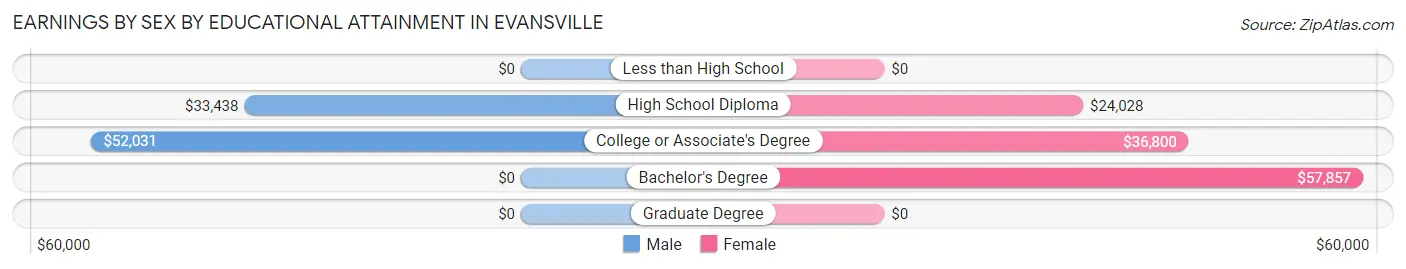
Earnings by Sex by Educational Attainment in Evansville
Average earnings in Evansville are $50,833 for men and $35,150 for women, a difference of 30.8%. Men with an educational attainment of college or associate's degree enjoy the highest average annual earnings of $52,031, while those with high school diploma education earn the least with $33,438. Women with an educational attainment of bachelor's degree earn the most with the average annual earnings of $57,857, while those with high school diploma education have the smallest earnings of $24,028.
| Educational Attainment | Male Income | Female Income |
| Less than High School | - | - |
| High School Diploma | $33,438 | $24,028 |
| College or Associate's Degree | $52,031 | $36,800 |
| Bachelor's Degree | - | - |
| Graduate Degree | - | - |
| Total | $50,833 | $35,150 |
Family Income in Evansville
Family Income Brackets in Evansville
According to the Evansville family income data, there are 43 families falling into the $100,000 to $149,999 income range, which is the most common income bracket and makes up 29.0% of all families.
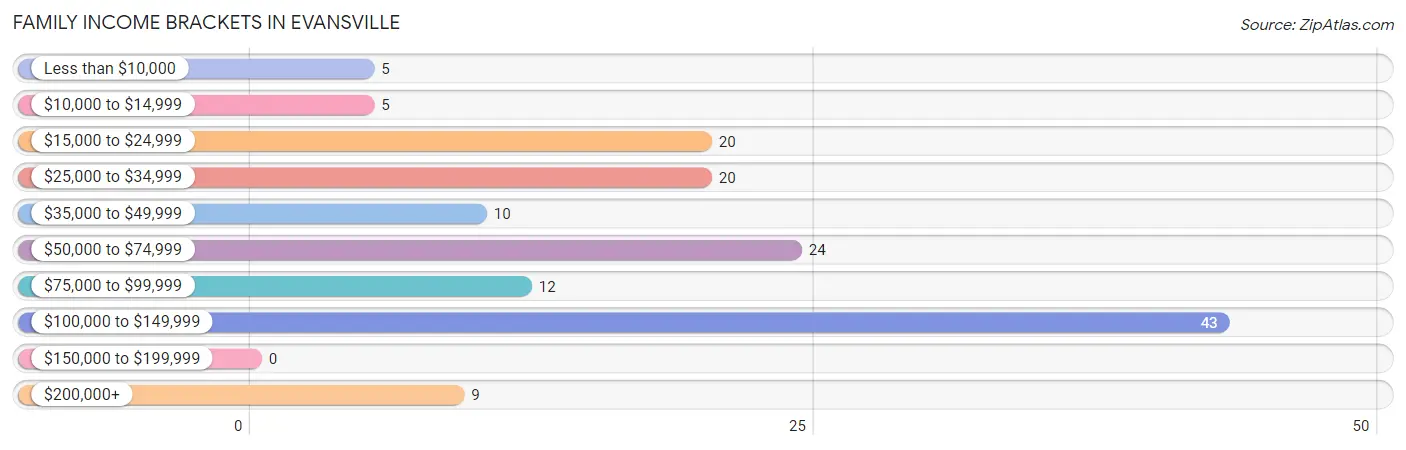
| Income Bracket | # Families | % Families |
| Less than $10,000 | 5 | 3.4% |
| $10,000 to $14,999 | 5 | 3.4% |
| $15,000 to $24,999 | 20 | 13.5% |
| $25,000 to $34,999 | 20 | 13.5% |
| $35,000 to $49,999 | 10 | 6.8% |
| $50,000 to $74,999 | 24 | 16.2% |
| $75,000 to $99,999 | 12 | 8.1% |
| $100,000 to $149,999 | 43 | 29.1% |
| $150,000 to $199,999 | 0 | 0.0% |
| $200,000+ | 9 | 6.1% |
Family Income by Famaliy Size in Evansville
4-person families (18 | 12.2%) account for the highest median family income in Evansville with $109,167 per family, while 2-person families (92 | 62.2%) have the highest median income of $30,416 per family member.
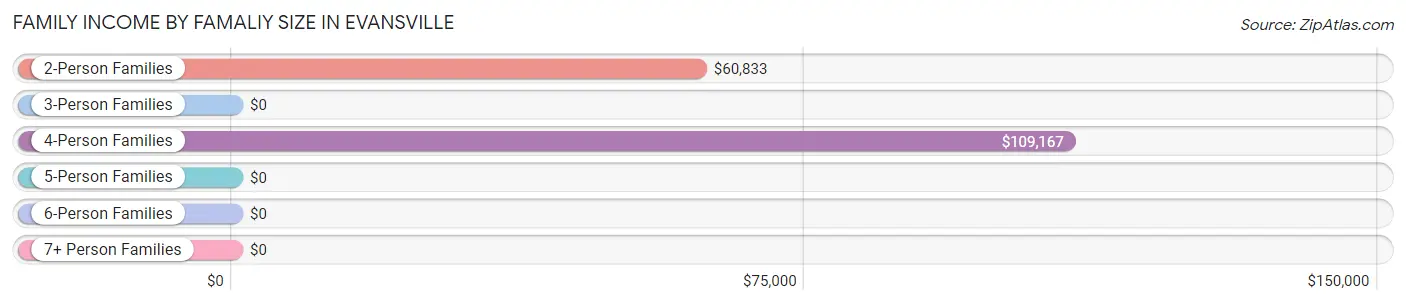
| Income Bracket | # Families | Median Income |
| 2-Person Families | 92 (62.2%) | $60,833 |
| 3-Person Families | 18 (12.2%) | $0 |
| 4-Person Families | 18 (12.2%) | $109,167 |
| 5-Person Families | 17 (11.5%) | $0 |
| 6-Person Families | 3 (2.0%) | $0 |
| 7+ Person Families | 0 (0.0%) | $0 |
| Total | 148 (100.0%) | $62,500 |
Family Income by Number of Earners in Evansville
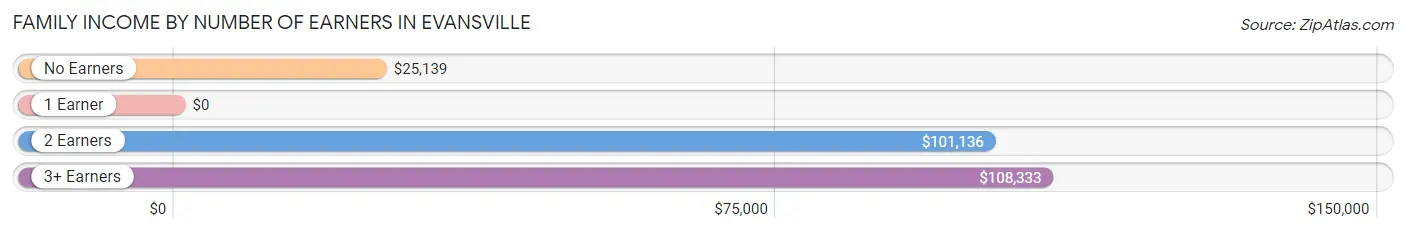
| Number of Earners | # Families | Median Income |
| No Earners | 29 (19.6%) | $25,139 |
| 1 Earner | 39 (26.4%) | $0 |
| 2 Earners | 72 (48.6%) | $101,136 |
| 3+ Earners | 8 (5.4%) | $108,333 |
| Total | 148 (100.0%) | $62,500 |
Household Income in Evansville
Household Income Brackets in Evansville
With 67 households falling in the category, the $100,000 to $149,999 income range is the most frequent in Evansville, accounting for 22.9% of all households.
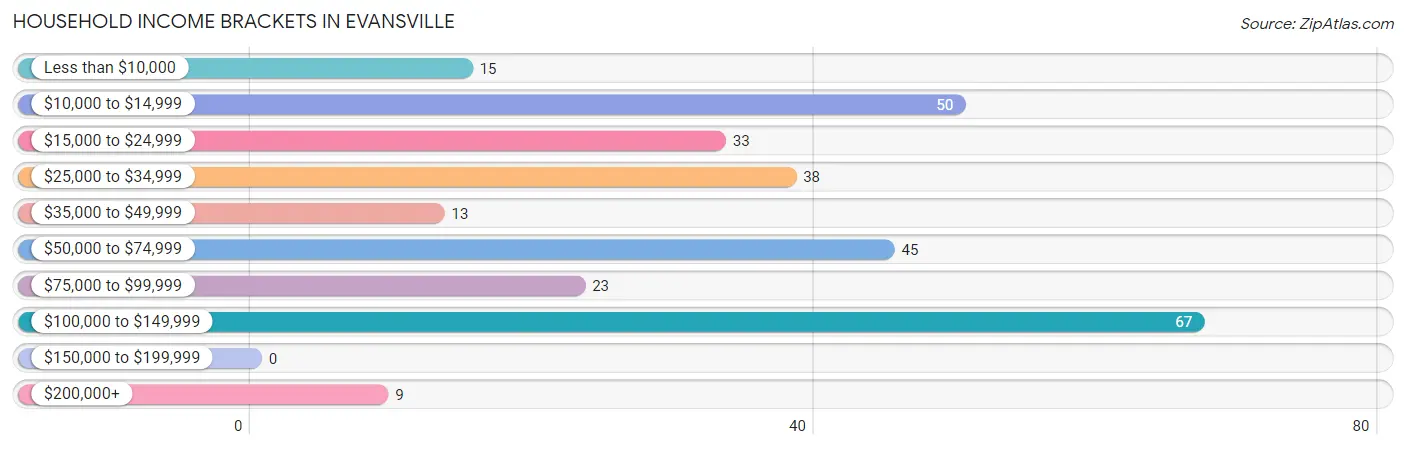
| Income Bracket | # Households | % Households |
| Less than $10,000 | 15 | 5.1% |
| $10,000 to $14,999 | 50 | 17.1% |
| $15,000 to $24,999 | 33 | 11.3% |
| $25,000 to $34,999 | 38 | 13.0% |
| $35,000 to $49,999 | 13 | 4.4% |
| $50,000 to $74,999 | 45 | 15.4% |
| $75,000 to $99,999 | 23 | 7.8% |
| $100,000 to $149,999 | 67 | 22.9% |
| $150,000 to $199,999 | 0 | 0.0% |
| $200,000+ | 9 | 3.1% |
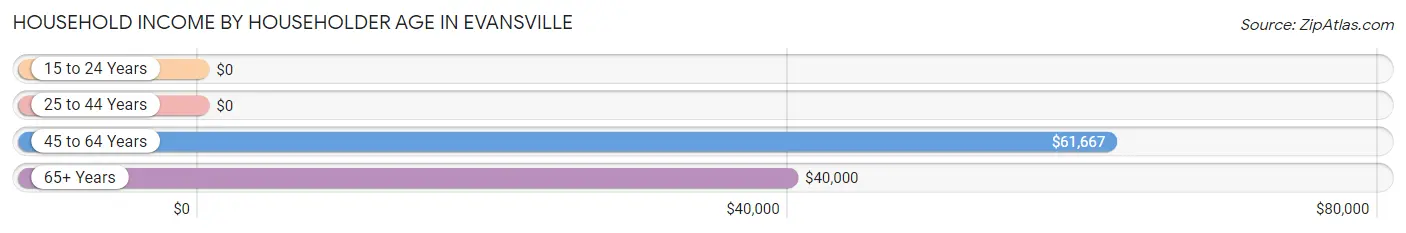
Household Income by Householder Age in Evansville
The median household income in Evansville is $48,750, with the highest median household income of $61,667 found in the 45 to 64 years age bracket for the primary householder. A total of 52 households (17.7%) fall into this category. Meanwhile, the 15 to 24 years age bracket for the primary householder has the lowest median household income of $0, with 45 households (15.4%) in this group.
| Income Bracket | # Households | Median Income |
| 15 to 24 Years | 45 (15.4%) | $0 |
| 25 to 44 Years | 76 (25.9%) | $0 |
| 45 to 64 Years | 52 (17.7%) | $61,667 |
| 65+ Years | 120 (41.0%) | $40,000 |
| Total | 293 (100.0%) | $48,750 |
Poverty in Evansville
Income Below Poverty by Sex and Age in Evansville
With 20.1% poverty level for males and 33.6% for females among the residents of Evansville, 12 to 14 year old males and 15 year old females are the most vulnerable to poverty, with 8 males (57.1%) and 16 females (100.0%) in their respective age groups living below the poverty level.
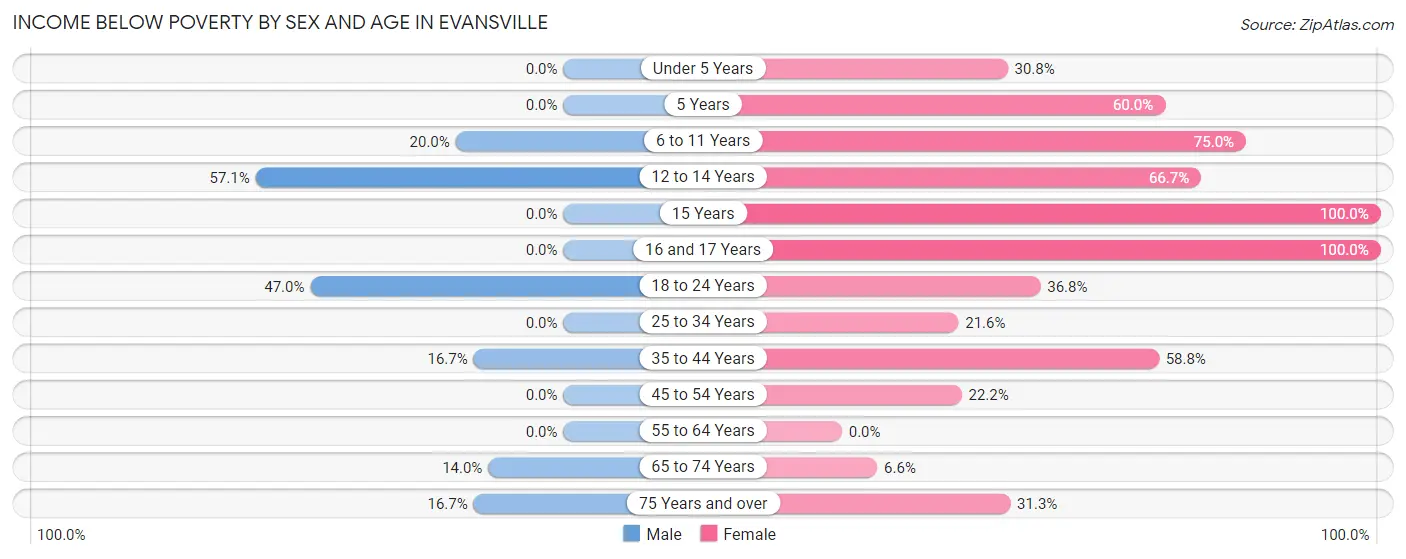
| Age Bracket | Male | Female |
| Under 5 Years | 0 (0.0%) | 8 (30.8%) |
| 5 Years | 0 (0.0%) | 3 (60.0%) |
| 6 to 11 Years | 3 (20.0%) | 6 (75.0%) |
| 12 to 14 Years | 8 (57.1%) | 20 (66.7%) |
| 15 Years | 0 (0.0%) | 16 (100.0%) |
| 16 and 17 Years | 0 (0.0%) | 3 (100.0%) |
| 18 to 24 Years | 31 (47.0%) | 14 (36.8%) |
| 25 to 34 Years | 0 (0.0%) | 8 (21.6%) |
| 35 to 44 Years | 3 (16.7%) | 20 (58.8%) |
| 45 to 54 Years | 0 (0.0%) | 4 (22.2%) |
| 55 to 64 Years | 0 (0.0%) | 0 (0.0%) |
| 65 to 74 Years | 6 (14.0%) | 4 (6.6%) |
| 75 Years and over | 5 (16.7%) | 10 (31.2%) |
| Total | 56 (20.1%) | 116 (33.6%) |
Income Above Poverty by Sex and Age in Evansville
According to the poverty statistics in Evansville, males aged under 5 years and females aged 55 to 64 years are the age groups that are most secure financially, with 100.0% of males and 100.0% of females in these age groups living above the poverty line.
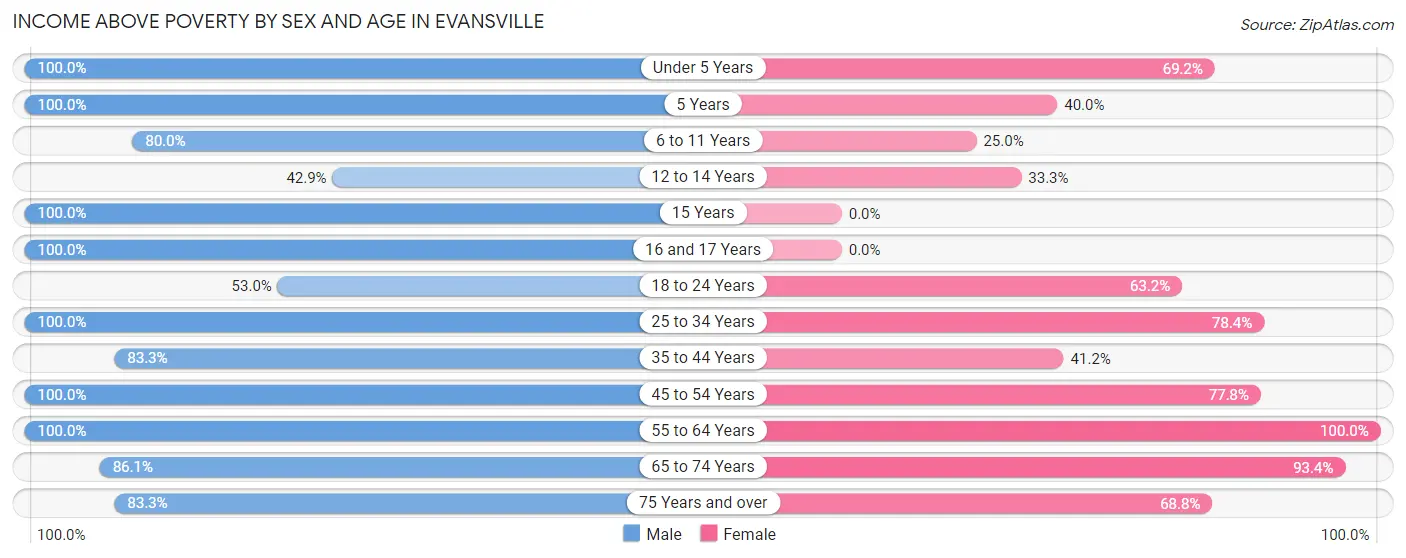
| Age Bracket | Male | Female |
| Under 5 Years | 19 (100.0%) | 18 (69.2%) |
| 5 Years | 2 (100.0%) | 2 (40.0%) |
| 6 to 11 Years | 12 (80.0%) | 2 (25.0%) |
| 12 to 14 Years | 6 (42.9%) | 10 (33.3%) |
| 15 Years | 2 (100.0%) | 0 (0.0%) |
| 16 and 17 Years | 6 (100.0%) | 0 (0.0%) |
| 18 to 24 Years | 35 (53.0%) | 24 (63.2%) |
| 25 to 34 Years | 29 (100.0%) | 29 (78.4%) |
| 35 to 44 Years | 15 (83.3%) | 14 (41.2%) |
| 45 to 54 Years | 16 (100.0%) | 14 (77.8%) |
| 55 to 64 Years | 19 (100.0%) | 37 (100.0%) |
| 65 to 74 Years | 37 (86.1%) | 57 (93.4%) |
| 75 Years and over | 25 (83.3%) | 22 (68.8%) |
| Total | 223 (79.9%) | 229 (66.4%) |
Income Below Poverty Among Married-Couple Families in Evansville
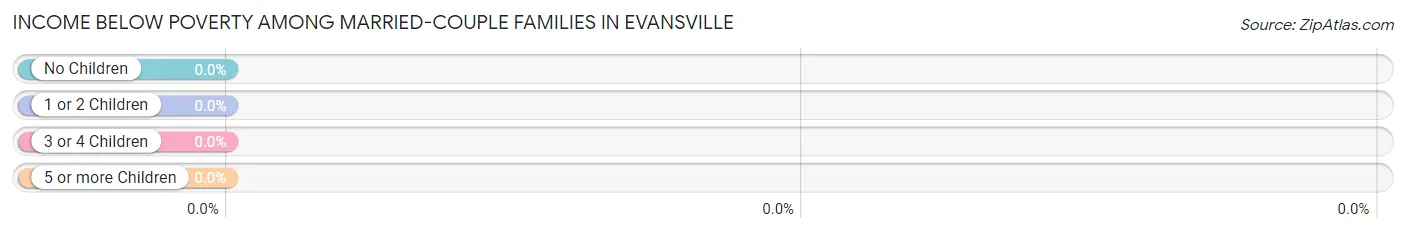
| Children | Above Poverty | Below Poverty |
| No Children | 74 (100.0%) | 0 (0.0%) |
| 1 or 2 Children | 20 (100.0%) | 0 (0.0%) |
| 3 or 4 Children | 12 (100.0%) | 0 (0.0%) |
| 5 or more Children | 0 (0.0%) | 0 (0.0%) |
| Total | 106 (100.0%) | 0 (0.0%) |
Income Below Poverty Among Single-Parent Households in Evansville
According to the poverty data in Evansville, 50.0% or 3 single-father households and 66.7% or 24 single-mother households are living below the poverty line. Among single-father households, those with 3 or 4 children have the highest poverty rate, with 3 households (100.0%) experiencing poverty. Likewise, among single-mother households, those with 3 or 4 children have the highest poverty rate, with 6 households (100.0%) falling below the poverty line.
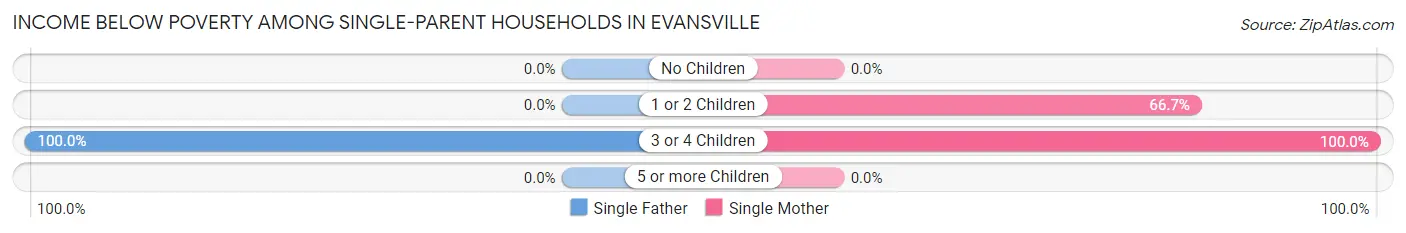
| Children | Single Father | Single Mother |
| No Children | 0 (0.0%) | 0 (0.0%) |
| 1 or 2 Children | 0 (0.0%) | 18 (66.7%) |
| 3 or 4 Children | 3 (100.0%) | 6 (100.0%) |
| 5 or more Children | 0 (0.0%) | 0 (0.0%) |
| Total | 3 (50.0%) | 24 (66.7%) |
Income Below Poverty Among Married-Couple vs Single-Parent Households in Evansville
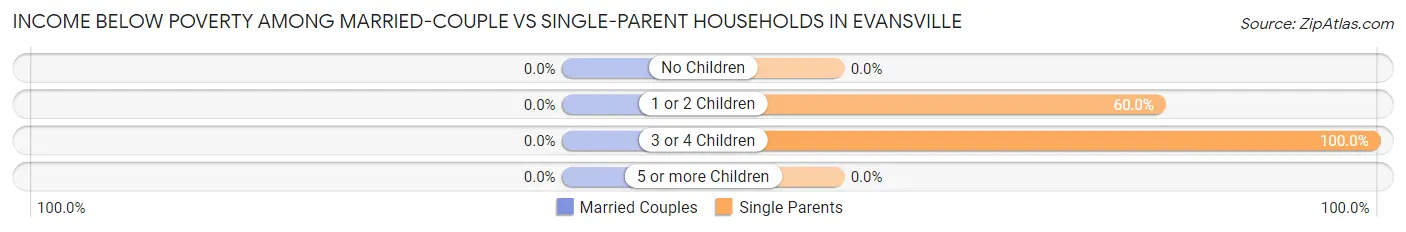
| Children | Married-Couple Families | Single-Parent Households |
| No Children | 0 (0.0%) | 0 (0.0%) |
| 1 or 2 Children | 0 (0.0%) | 18 (60.0%) |
| 3 or 4 Children | 0 (0.0%) | 9 (100.0%) |
| 5 or more Children | 0 (0.0%) | 0 (0.0%) |
| Total | 0 (0.0%) | 27 (64.3%) |
Race in Evansville
The most populous races in Evansville are White / Caucasian (645 | 97.9%), Two or more Races (13 | 2.0%), and Native / Alaskan (1 | 0.2%).
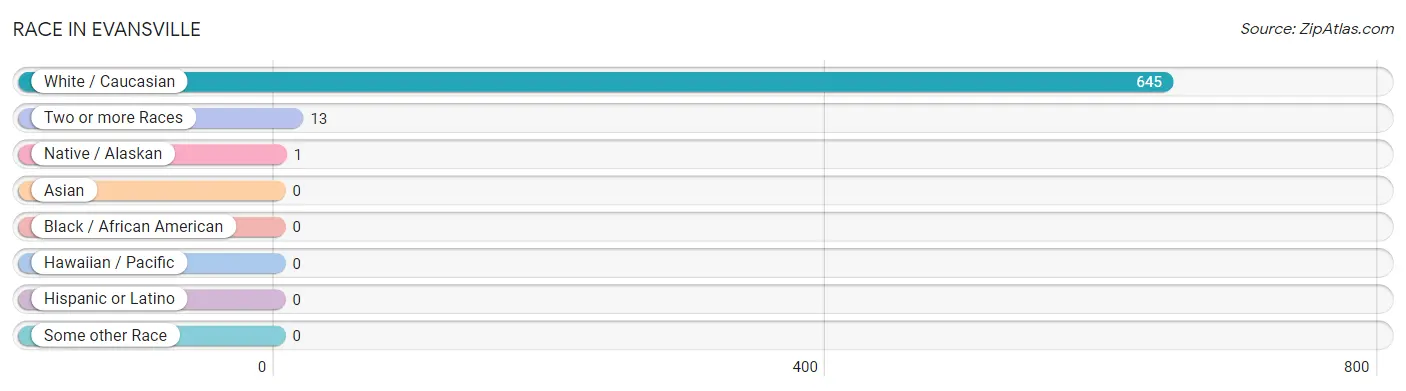
| Race | # Population | % Population |
| Asian | 0 | 0.0% |
| Black / African American | 0 | 0.0% |
| Hawaiian / Pacific | 0 | 0.0% |
| Hispanic or Latino | 0 | 0.0% |
| Native / Alaskan | 1 | 0.2% |
| White / Caucasian | 645 | 97.9% |
| Two or more Races | 13 | 2.0% |
| Some other Race | 0 | 0.0% |
| Total | 659 | 100.0% |
Ancestry in Evansville
The most populous ancestries reported in Evansville are German (248 | 37.6%), Norwegian (181 | 27.5%), Swedish (132 | 20.0%), Irish (97 | 14.7%), and Danish (43 | 6.5%), together accounting for 106.4% of all Evansville residents.
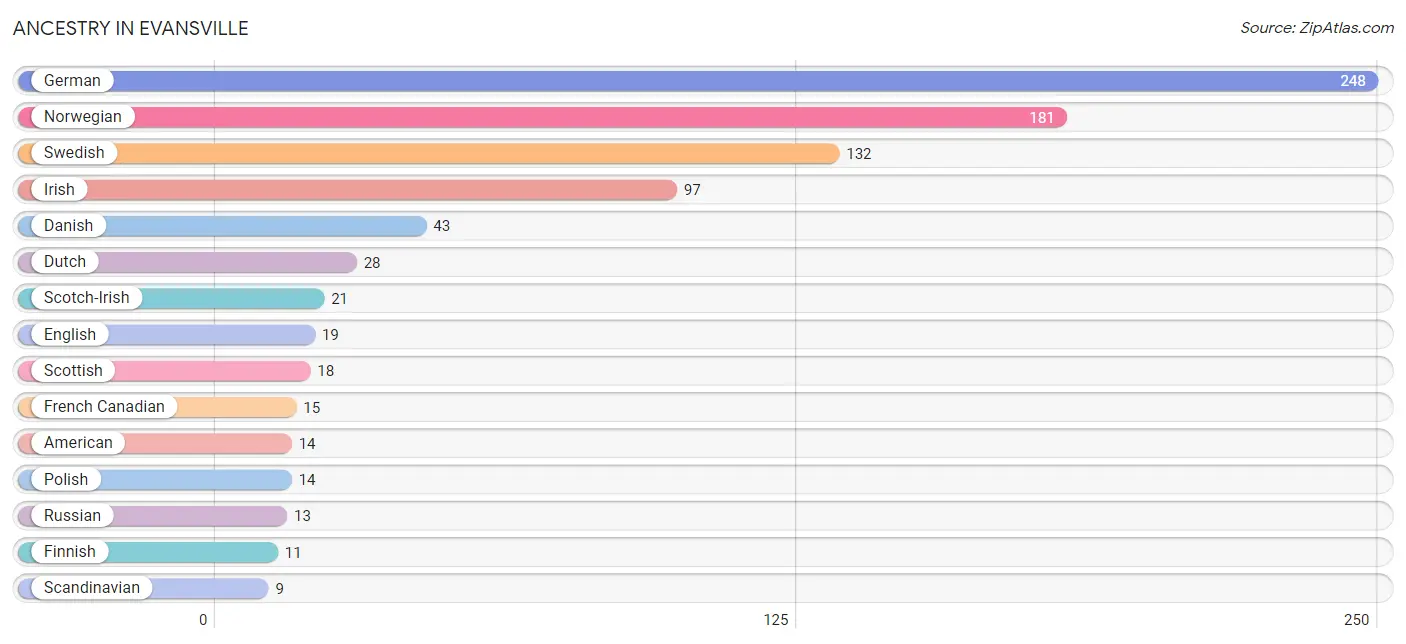
| Ancestry | # Population | % Population |
| American | 14 | 2.1% |
| Belgian | 1 | 0.2% |
| Chippewa | 2 | 0.3% |
| Czech | 4 | 0.6% |
| Danish | 43 | 6.5% |
| Dutch | 28 | 4.3% |
| Dutch West Indian | 4 | 0.6% |
| English | 19 | 2.9% |
| Finnish | 11 | 1.7% |
| French | 2 | 0.3% |
| French Canadian | 15 | 2.3% |
| German | 248 | 37.6% |
| Irish | 97 | 14.7% |
| Italian | 2 | 0.3% |
| Norwegian | 181 | 27.5% |
| Polish | 14 | 2.1% |
| Russian | 13 | 2.0% |
| Scandinavian | 9 | 1.4% |
| Scotch-Irish | 21 | 3.2% |
| Scottish | 18 | 2.7% |
| Sioux | 1 | 0.2% |
| Swedish | 132 | 20.0% |
| Welsh | 2 | 0.3% | View All 23 Rows |
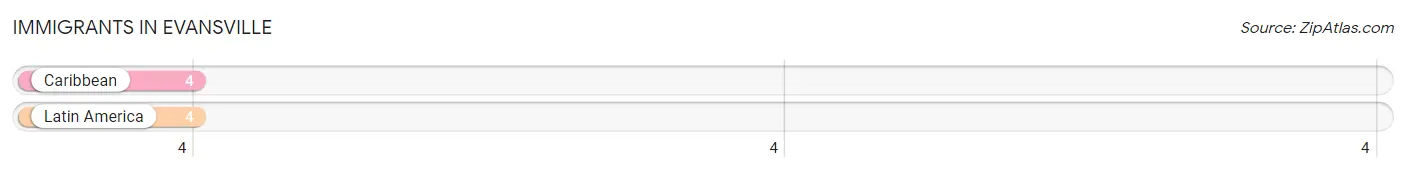
Immigrants in Evansville
The most numerous immigrant groups reported in Evansville came from Caribbean (4 | 0.6%), and Latin America (4 | 0.6%), together accounting for 1.2% of all Evansville residents.
| Immigration Origin | # Population | % Population |
| Caribbean | 4 | 0.6% |
| Latin America | 4 | 0.6% | View All 2 Rows |
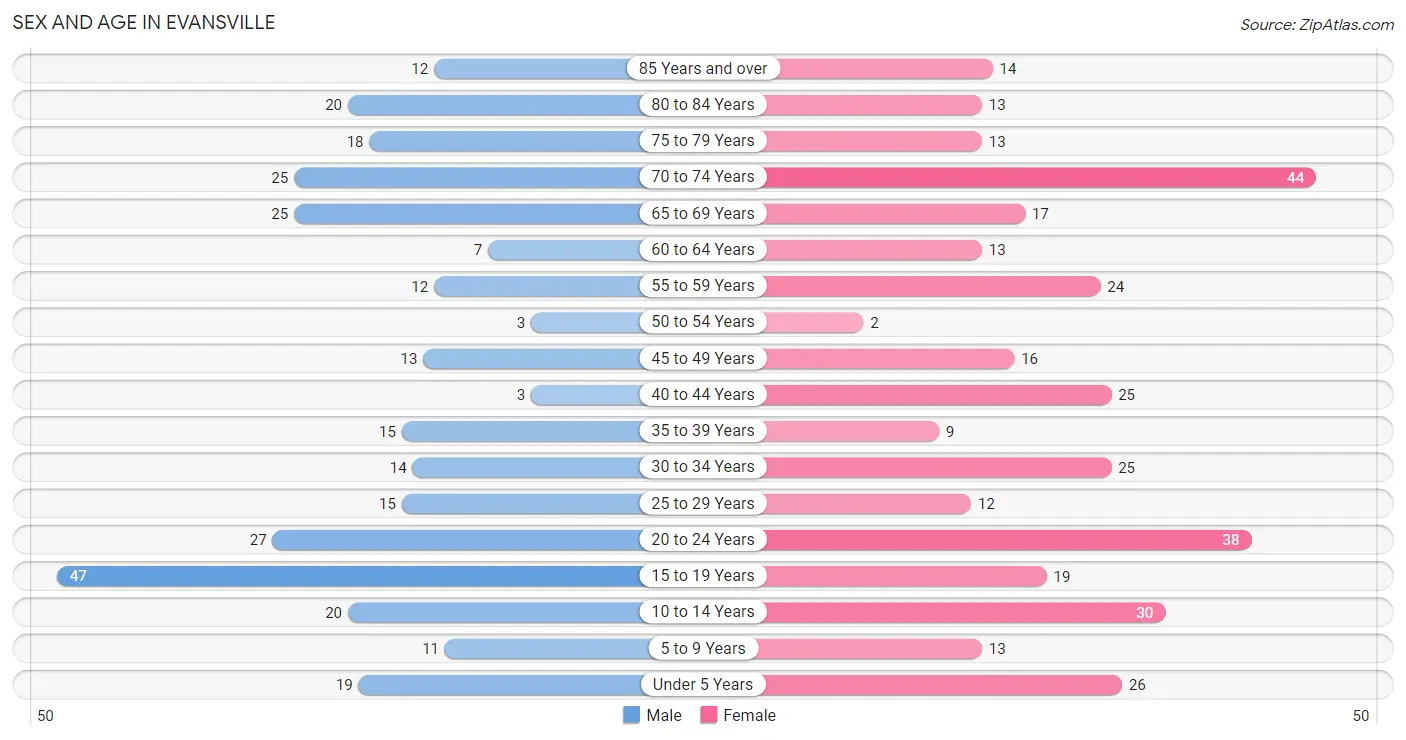
Sex and Age in Evansville
Sex and Age in Evansville
The most populous age groups in Evansville are 15 to 19 Years (47 | 15.4%) for men and 70 to 74 Years (44 | 12.5%) for women.
| Age Bracket | Male | Female |
| Under 5 Years | 19 (6.2%) | 26 (7.4%) |
| 5 to 9 Years | 11 (3.6%) | 13 (3.7%) |
| 10 to 14 Years | 20 (6.5%) | 30 (8.5%) |
| 15 to 19 Years | 47 (15.4%) | 19 (5.4%) |
| 20 to 24 Years | 27 (8.8%) | 38 (10.8%) |
| 25 to 29 Years | 15 (4.9%) | 12 (3.4%) |
| 30 to 34 Years | 14 (4.6%) | 25 (7.1%) |
| 35 to 39 Years | 15 (4.9%) | 9 (2.5%) |
| 40 to 44 Years | 3 (1.0%) | 25 (7.1%) |
| 45 to 49 Years | 13 (4.3%) | 16 (4.5%) |
| 50 to 54 Years | 3 (1.0%) | 2 (0.6%) |
| 55 to 59 Years | 12 (3.9%) | 24 (6.8%) |
| 60 to 64 Years | 7 (2.3%) | 13 (3.7%) |
| 65 to 69 Years | 25 (8.2%) | 17 (4.8%) |
| 70 to 74 Years | 25 (8.2%) | 44 (12.5%) |
| 75 to 79 Years | 18 (5.9%) | 13 (3.7%) |
| 80 to 84 Years | 20 (6.5%) | 13 (3.7%) |
| 85 Years and over | 12 (3.9%) | 14 (4.0%) |
| Total | 306 (100.0%) | 353 (100.0%) |
Families and Households in Evansville
Median Family Size in Evansville
The median family size in Evansville is 2.85 persons per family, with single male/father families (6 | 4.1%) accounting for the largest median family size of 3.17 persons per family. On the other hand, married-couple families (106 | 71.6%) represent the smallest median family size with 2.77 persons per family.
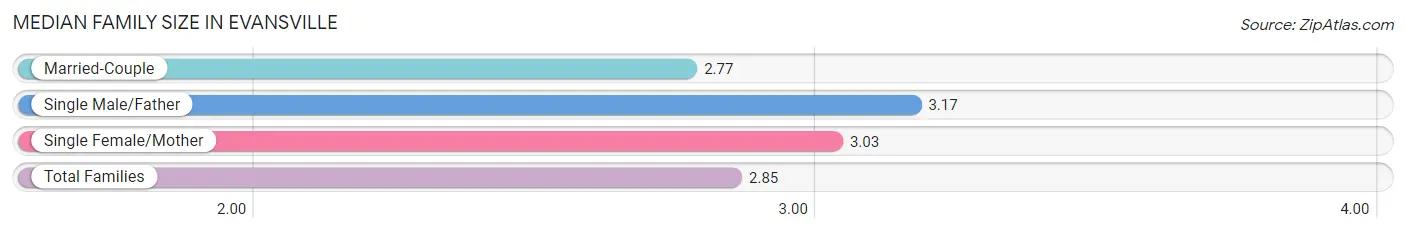
| Family Type | # Families | Family Size |
| Married-Couple | 106 (71.6%) | 2.77 |
| Single Male/Father | 6 (4.1%) | 3.17 |
| Single Female/Mother | 36 (24.3%) | 3.03 |
| Total Families | 148 (100.0%) | 2.85 |
Median Household Size in Evansville
The median household size in Evansville is 2.13 persons per household, with single male/father households (6 | 2.1%) accounting for the largest median household size of 3.67 persons per household. non-family households (145 | 49.5%) represent the smallest median household size with 1.37 persons per household.
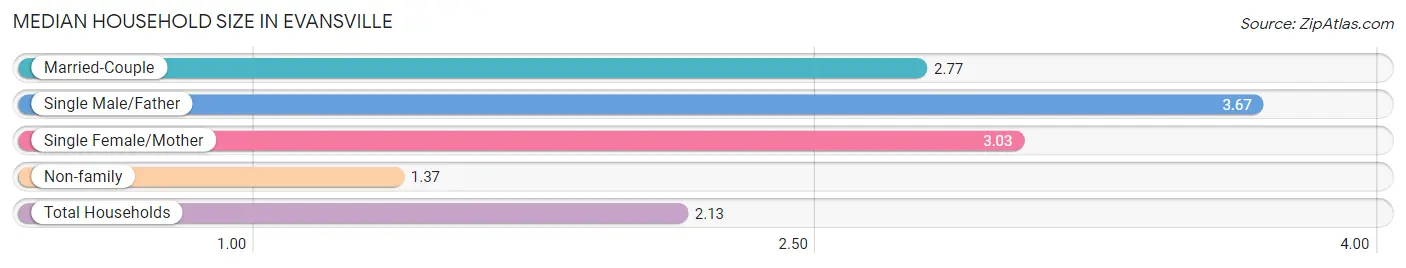
| Household Type | # Households | Household Size |
| Married-Couple | 106 (36.2%) | 2.77 |
| Single Male/Father | 6 (2.1%) | 3.67 |
| Single Female/Mother | 36 (12.3%) | 3.03 |
| Non-family | 145 (49.5%) | 1.37 |
| Total Households | 293 (100.0%) | 2.13 |
Household Size by Marriage Status in Evansville
Out of a total of 293 households in Evansville, 148 (50.5%) are family households, while 145 (49.5%) are nonfamily households. The most numerous type of family households are 2-person households, comprising 92, and the most common type of nonfamily households are 1-person households, comprising 99.
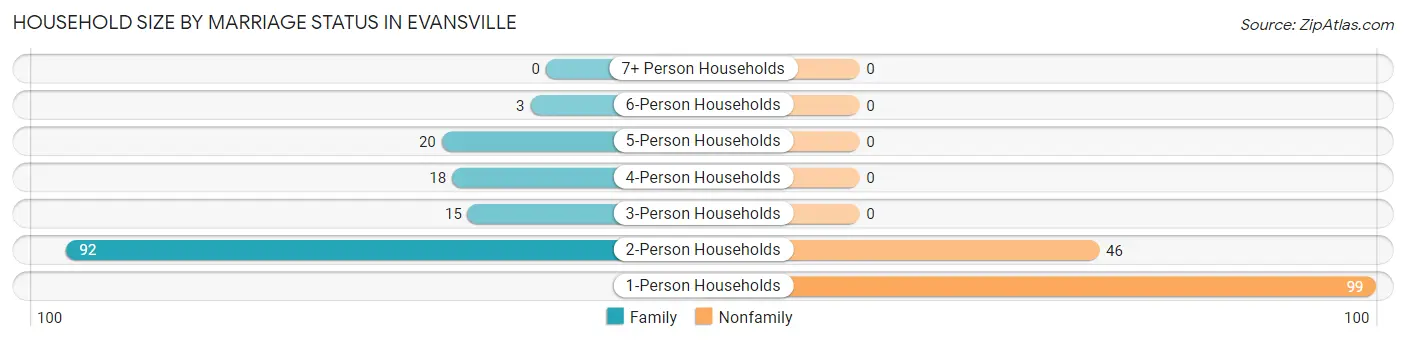
| Household Size | Family Households | Nonfamily Households |
| 1-Person Households | - | 99 (33.8%) |
| 2-Person Households | 92 (31.4%) | 46 (15.7%) |
| 3-Person Households | 15 (5.1%) | 0 (0.0%) |
| 4-Person Households | 18 (6.1%) | 0 (0.0%) |
| 5-Person Households | 20 (6.8%) | 0 (0.0%) |
| 6-Person Households | 3 (1.0%) | 0 (0.0%) |
| 7+ Person Households | 0 (0.0%) | 0 (0.0%) |
| Total | 148 (50.5%) | 145 (49.5%) |
Female Fertility in Evansville
Fertility by Age in Evansville
Average fertility rate in Evansville is 56.0 births per 1,000 women. Women in the age bracket of 20 to 34 years have the highest fertility rate with 107.0 births per 1,000 women. Women in the age bracket of 20 to 34 years acount for 100.0% of all women with births.
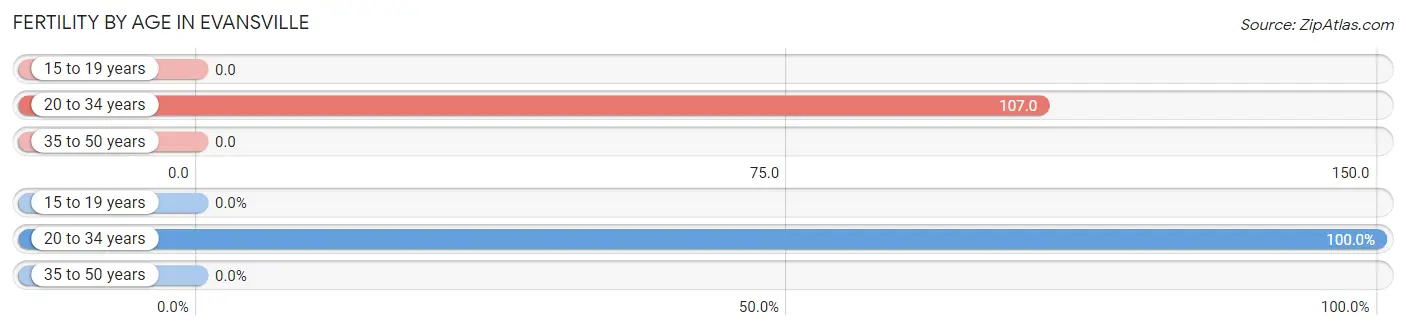
| Age Bracket | Women with Births | Births / 1,000 Women |
| 15 to 19 years | 0 (0.0%) | 0.0 |
| 20 to 34 years | 8 (100.0%) | 107.0 |
| 35 to 50 years | 0 (0.0%) | 0.0 |
| Total | 8 (100.0%) | 56.0 |
Fertility by Age by Marriage Status in Evansville
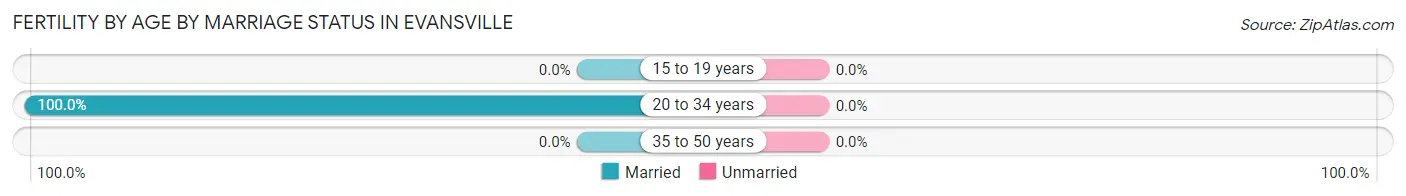
| Age Bracket | Married | Unmarried |
| 15 to 19 years | 0 (0.0%) | 0 (0.0%) |
| 20 to 34 years | 8 (100.0%) | 0 (0.0%) |
| 35 to 50 years | 0 (0.0%) | 0 (0.0%) |
| Total | 8 (100.0%) | 0 (0.0%) |
Fertility by Education in Evansville
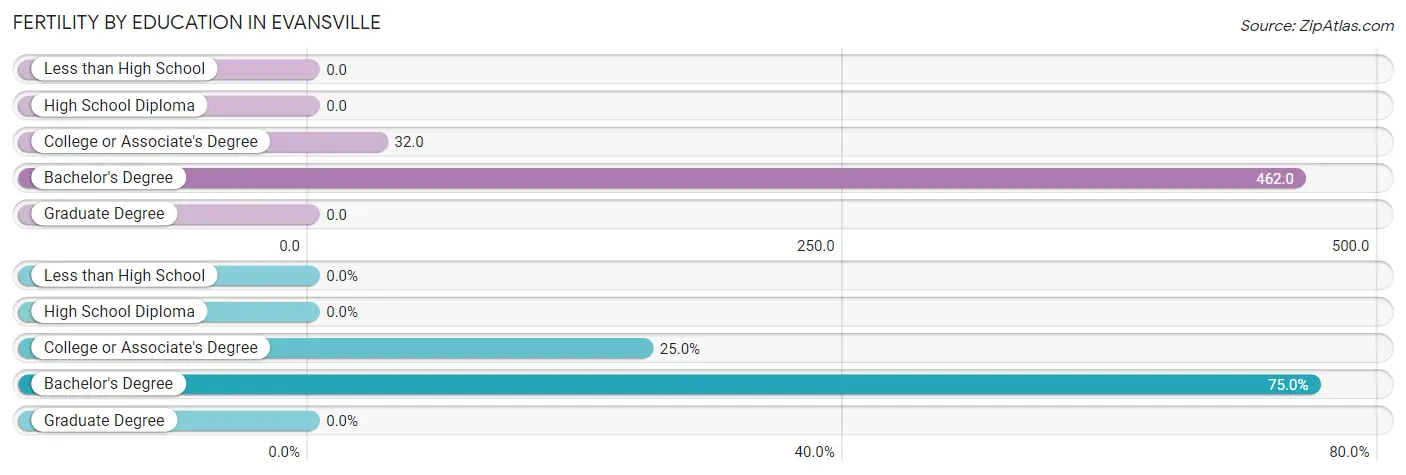
| Educational Attainment | Women with Births | Births / 1,000 Women |
| Less than High School | 0 (0.0%) | 0.0 |
| High School Diploma | 0 (0.0%) | 0.0 |
| College or Associate's Degree | 2 (25.0%) | 32.0 |
| Bachelor's Degree | 6 (75.0%) | 462.0 |
| Graduate Degree | 0 (0.0%) | 0.0 |
| Total | 8 (100.0%) | 56.0 |
Fertility by Education by Marriage Status in Evansville
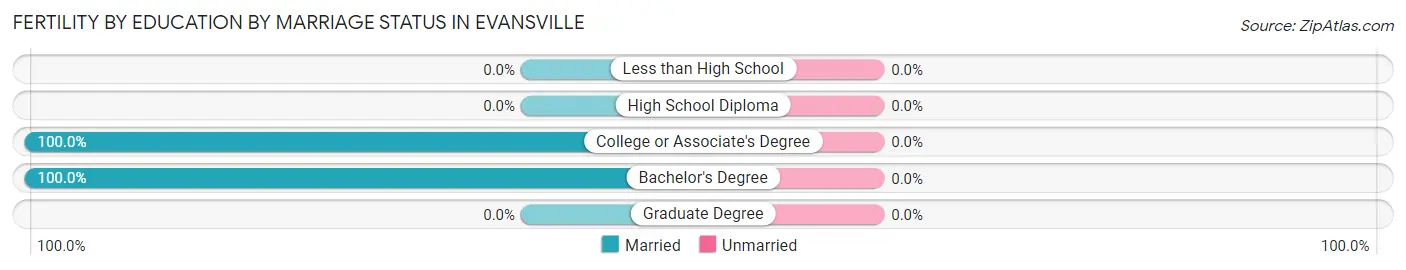
| Educational Attainment | Married | Unmarried |
| Less than High School | 0 (0.0%) | 0 (0.0%) |
| High School Diploma | 0 (0.0%) | 0 (0.0%) |
| College or Associate's Degree | 2 (100.0%) | 0 (0.0%) |
| Bachelor's Degree | 6 (100.0%) | 0 (0.0%) |
| Graduate Degree | 0 (0.0%) | 0 (0.0%) |
| Total | 8 (100.0%) | 0 (0.0%) |
Employment Characteristics in Evansville
Employment by Class of Employer in Evansville
Among the 293 employed individuals in Evansville, private company employees (211 | 72.0%), self-employed (not incorporated) (34 | 11.6%), and not-for-profit organizations (26 | 8.9%) make up the most common classes of employment.
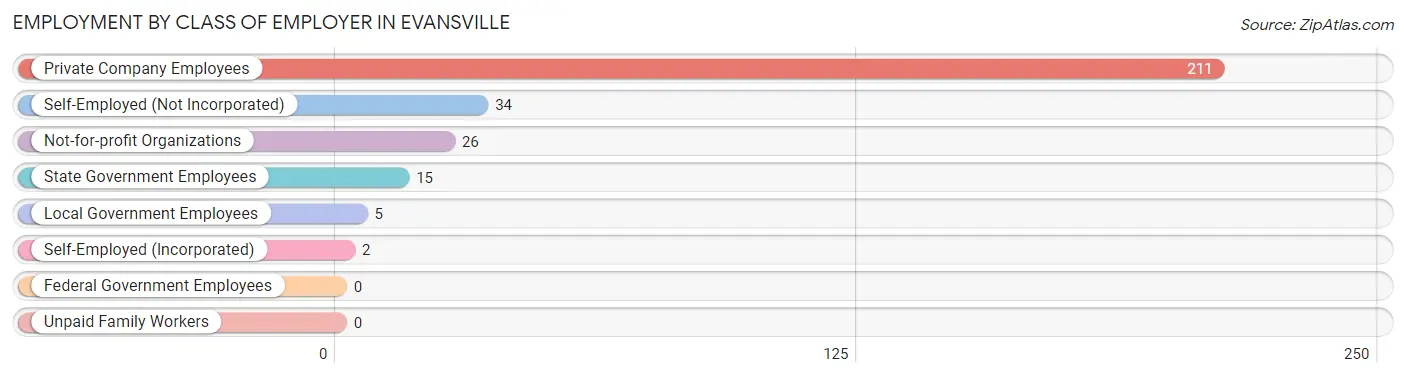
| Employer Class | # Employees | % Employees |
| Private Company Employees | 211 | 72.0% |
| Self-Employed (Incorporated) | 2 | 0.7% |
| Self-Employed (Not Incorporated) | 34 | 11.6% |
| Not-for-profit Organizations | 26 | 8.9% |
| Local Government Employees | 5 | 1.7% |
| State Government Employees | 15 | 5.1% |
| Federal Government Employees | 0 | 0.0% |
| Unpaid Family Workers | 0 | 0.0% |
| Total | 293 | 100.0% |
Employment Status by Age in Evansville
According to the labor force statistics for Evansville, out of the total population over 16 years of age (522), 58.4% or 305 individuals are in the labor force, with 3.0% or 9 of them unemployed. The age group with the highest labor force participation rate is 25 to 29 years, with 100.0% or 27 individuals in the labor force. Within the labor force, the 65 to 74 years age range has the highest percentage of unemployed individuals, with 13.6% or 3 of them being unemployed.
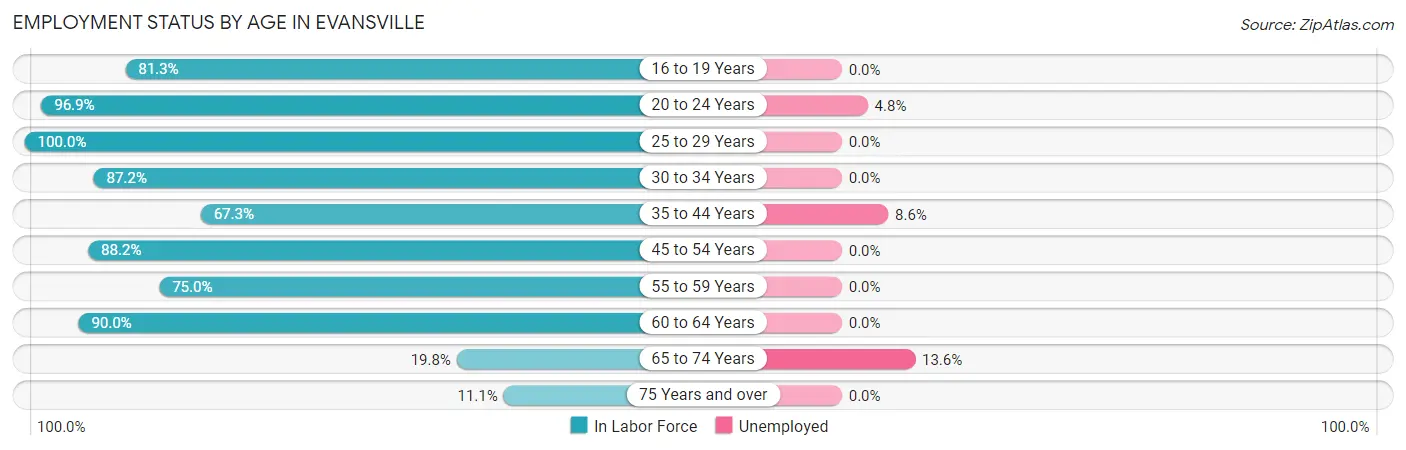
| Age Bracket | In Labor Force | Unemployed |
| 16 to 19 Years | 39 (81.3%) | 0 (0.0%) |
| 20 to 24 Years | 63 (96.9%) | 3 (4.8%) |
| 25 to 29 Years | 27 (100.0%) | 0 (0.0%) |
| 30 to 34 Years | 34 (87.2%) | 0 (0.0%) |
| 35 to 44 Years | 35 (67.3%) | 3 (8.6%) |
| 45 to 54 Years | 30 (88.2%) | 0 (0.0%) |
| 55 to 59 Years | 27 (75.0%) | 0 (0.0%) |
| 60 to 64 Years | 18 (90.0%) | 0 (0.0%) |
| 65 to 74 Years | 22 (19.8%) | 3 (13.6%) |
| 75 Years and over | 10 (11.1%) | 0 (0.0%) |
| Total | 305 (58.4%) | 9 (3.0%) |
Employment Status by Educational Attainment in Evansville
According to labor force statistics for Evansville, 82.2% of individuals (171) out of the total population between 25 and 64 years of age (208) are in the labor force, with 1.8% or 3 of them being unemployed. The group with the highest labor force participation rate are those with the educational attainment of high school diploma, with 100.0% or 65 individuals in the labor force. Within the labor force, individuals with college / associate degree education have the highest percentage of unemployment, with 4.2% or 3 of them being unemployed.
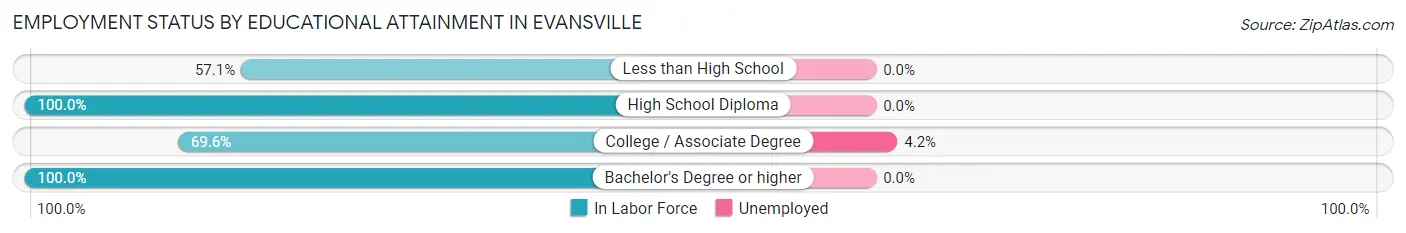
| Educational Attainment | In Labor Force | Unemployed |
| Less than High School | 8 (57.1%) | 0 (0.0%) |
| High School Diploma | 65 (100.0%) | 0 (0.0%) |
| College / Associate Degree | 71 (69.6%) | 4 (4.2%) |
| Bachelor's Degree or higher | 27 (100.0%) | 0 (0.0%) |
| Total | 171 (82.2%) | 4 (1.8%) |
Employment Occupations by Sex in Evansville
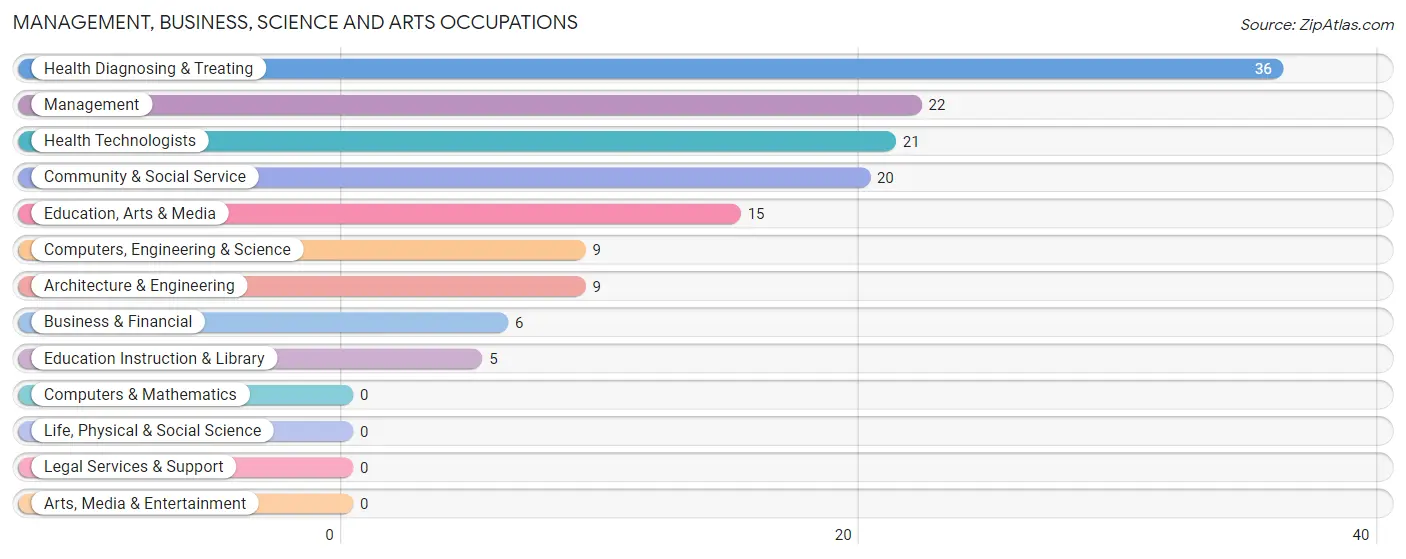
Management, Business, Science and Arts Occupations
The most common Management, Business, Science and Arts occupations in Evansville are Health Diagnosing & Treating (36 | 12.2%), Management (22 | 7.4%), Health Technologists (21 | 7.1%), Community & Social Service (20 | 6.8%), and Education, Arts & Media (15 | 5.1%).
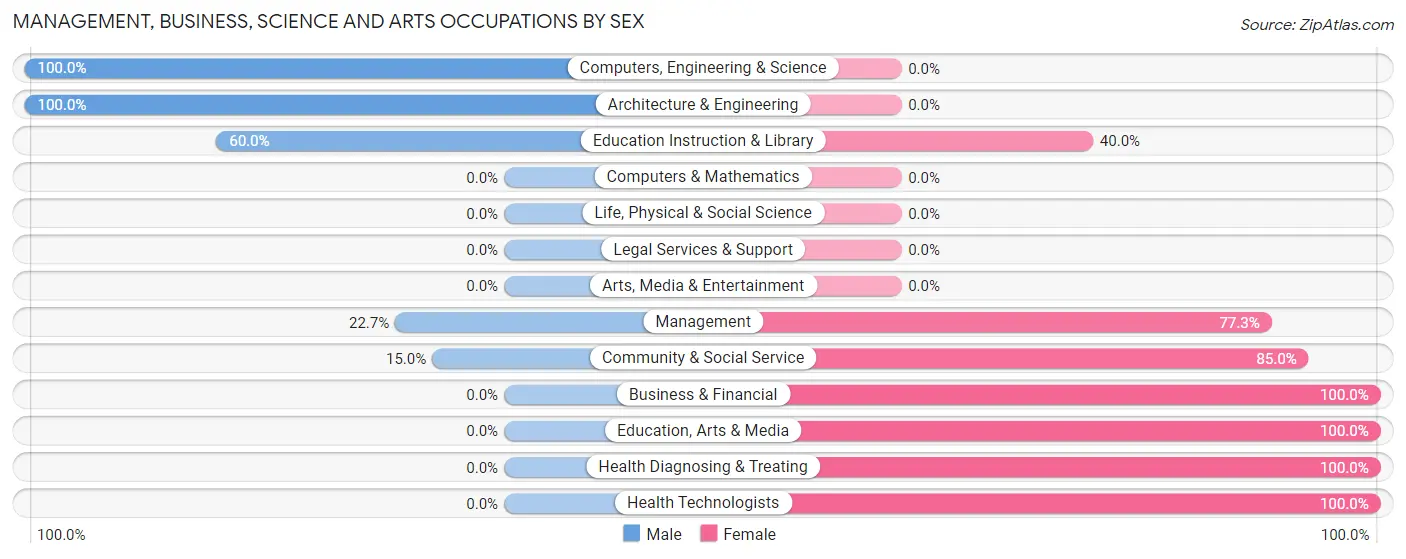
Management, Business, Science and Arts Occupations by Sex
Within the Management, Business, Science and Arts occupations in Evansville, the most male-oriented occupations are Computers, Engineering & Science (100.0%), Architecture & Engineering (100.0%), and Education Instruction & Library (60.0%), while the most female-oriented occupations are Business & Financial (100.0%), Education, Arts & Media (100.0%), and Health Diagnosing & Treating (100.0%).
| Occupation | Male | Female |
| Management | 5 (22.7%) | 17 (77.3%) |
| Business & Financial | 0 (0.0%) | 6 (100.0%) |
| Computers, Engineering & Science | 9 (100.0%) | 0 (0.0%) |
| Computers & Mathematics | 0 (0.0%) | 0 (0.0%) |
| Architecture & Engineering | 9 (100.0%) | 0 (0.0%) |
| Life, Physical & Social Science | 0 (0.0%) | 0 (0.0%) |
| Community & Social Service | 3 (15.0%) | 17 (85.0%) |
| Education, Arts & Media | 0 (0.0%) | 15 (100.0%) |
| Legal Services & Support | 0 (0.0%) | 0 (0.0%) |
| Education Instruction & Library | 3 (60.0%) | 2 (40.0%) |
| Arts, Media & Entertainment | 0 (0.0%) | 0 (0.0%) |
| Health Diagnosing & Treating | 0 (0.0%) | 36 (100.0%) |
| Health Technologists | 0 (0.0%) | 21 (100.0%) |
| Total (Category) | 17 (18.3%) | 76 (81.7%) |
| Total (Overall) | 152 (51.3%) | 144 (48.6%) |
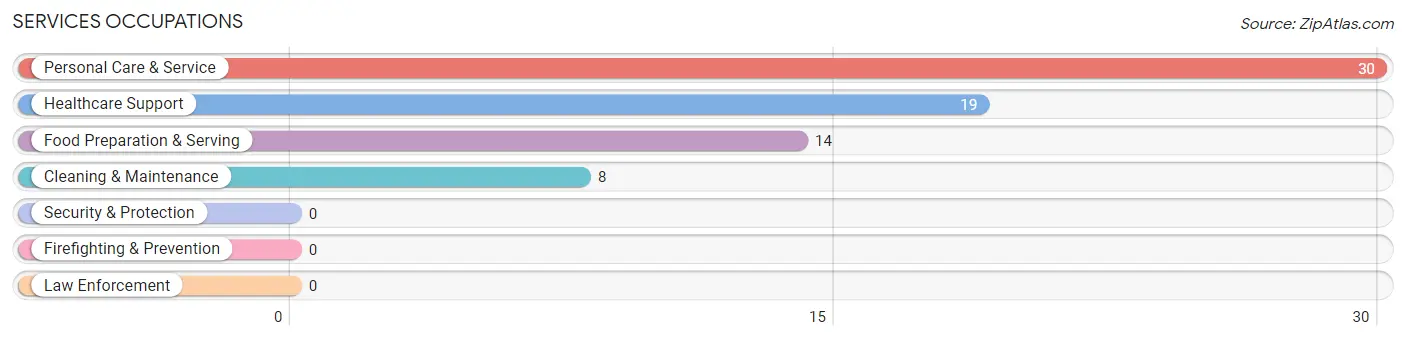
Services Occupations
The most common Services occupations in Evansville are Personal Care & Service (30 | 10.1%), Healthcare Support (19 | 6.4%), Food Preparation & Serving (14 | 4.7%), and Cleaning & Maintenance (8 | 2.7%).
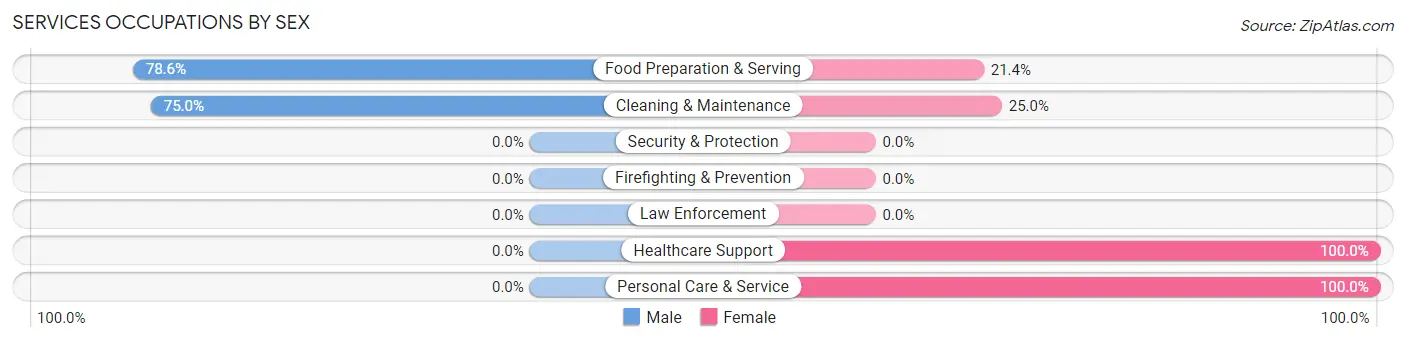
Services Occupations by Sex
Within the Services occupations in Evansville, the most male-oriented occupations are Food Preparation & Serving (78.6%), and Cleaning & Maintenance (75.0%), while the most female-oriented occupations are Healthcare Support (100.0%), Personal Care & Service (100.0%), and Cleaning & Maintenance (25.0%).
| Occupation | Male | Female |
| Healthcare Support | 0 (0.0%) | 19 (100.0%) |
| Security & Protection | 0 (0.0%) | 0 (0.0%) |
| Firefighting & Prevention | 0 (0.0%) | 0 (0.0%) |
| Law Enforcement | 0 (0.0%) | 0 (0.0%) |
| Food Preparation & Serving | 11 (78.6%) | 3 (21.4%) |
| Cleaning & Maintenance | 6 (75.0%) | 2 (25.0%) |
| Personal Care & Service | 0 (0.0%) | 30 (100.0%) |
| Total (Category) | 17 (23.9%) | 54 (76.1%) |
| Total (Overall) | 152 (51.3%) | 144 (48.6%) |
Sales and Office Occupations
The most common Sales and Office occupations in Evansville are Sales & Related (15 | 5.1%), and Office & Administration (15 | 5.1%).
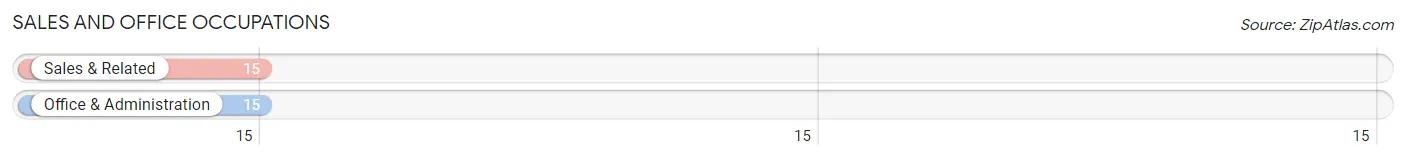
Sales and Office Occupations by Sex
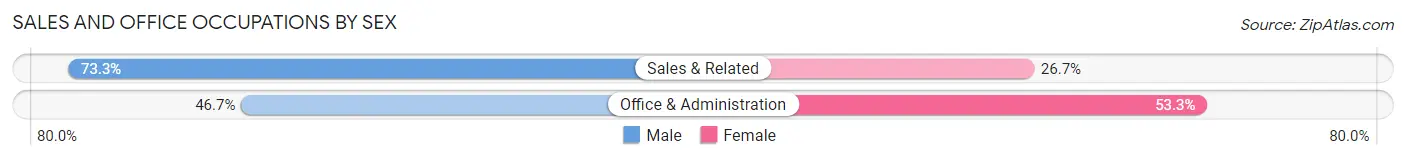
| Occupation | Male | Female |
| Sales & Related | 11 (73.3%) | 4 (26.7%) |
| Office & Administration | 7 (46.7%) | 8 (53.3%) |
| Total (Category) | 18 (60.0%) | 12 (40.0%) |
| Total (Overall) | 152 (51.3%) | 144 (48.6%) |
Natural Resources, Construction and Maintenance Occupations
The most common Natural Resources, Construction and Maintenance occupations in Evansville are Farming, Fishing & Forestry (21 | 7.1%), Construction & Extraction (16 | 5.4%), and Installation, Maintenance & Repair (14 | 4.7%).

Natural Resources, Construction and Maintenance Occupations by Sex
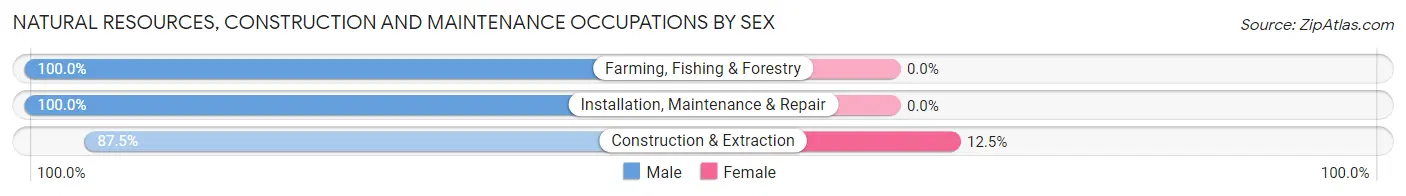
| Occupation | Male | Female |
| Farming, Fishing & Forestry | 21 (100.0%) | 0 (0.0%) |
| Construction & Extraction | 14 (87.5%) | 2 (12.5%) |
| Installation, Maintenance & Repair | 14 (100.0%) | 0 (0.0%) |
| Total (Category) | 49 (96.1%) | 2 (3.9%) |
| Total (Overall) | 152 (51.3%) | 144 (48.6%) |
Production, Transportation and Moving Occupations
The most common Production, Transportation and Moving occupations in Evansville are Production (27 | 9.1%), Transportation (22 | 7.4%), and Material Moving (2 | 0.7%).
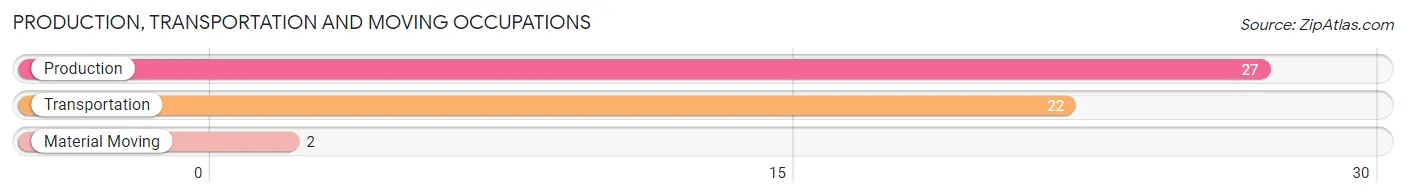
Production, Transportation and Moving Occupations by Sex
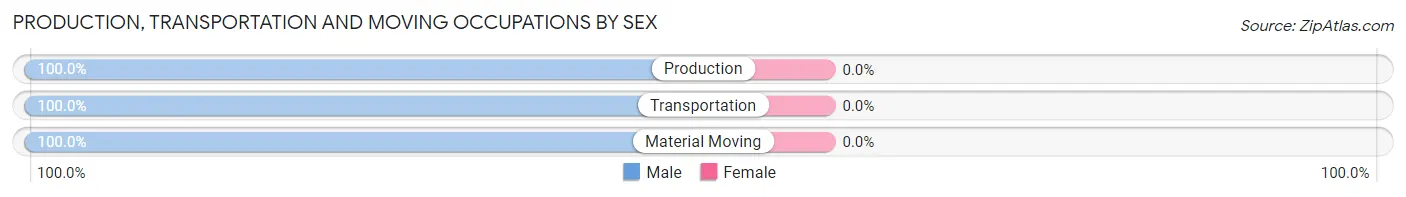
| Occupation | Male | Female |
| Production | 27 (100.0%) | 0 (0.0%) |
| Transportation | 22 (100.0%) | 0 (0.0%) |
| Material Moving | 2 (100.0%) | 0 (0.0%) |
| Total (Category) | 51 (100.0%) | 0 (0.0%) |
| Total (Overall) | 152 (51.3%) | 144 (48.6%) |
Employment Industries by Sex in Evansville
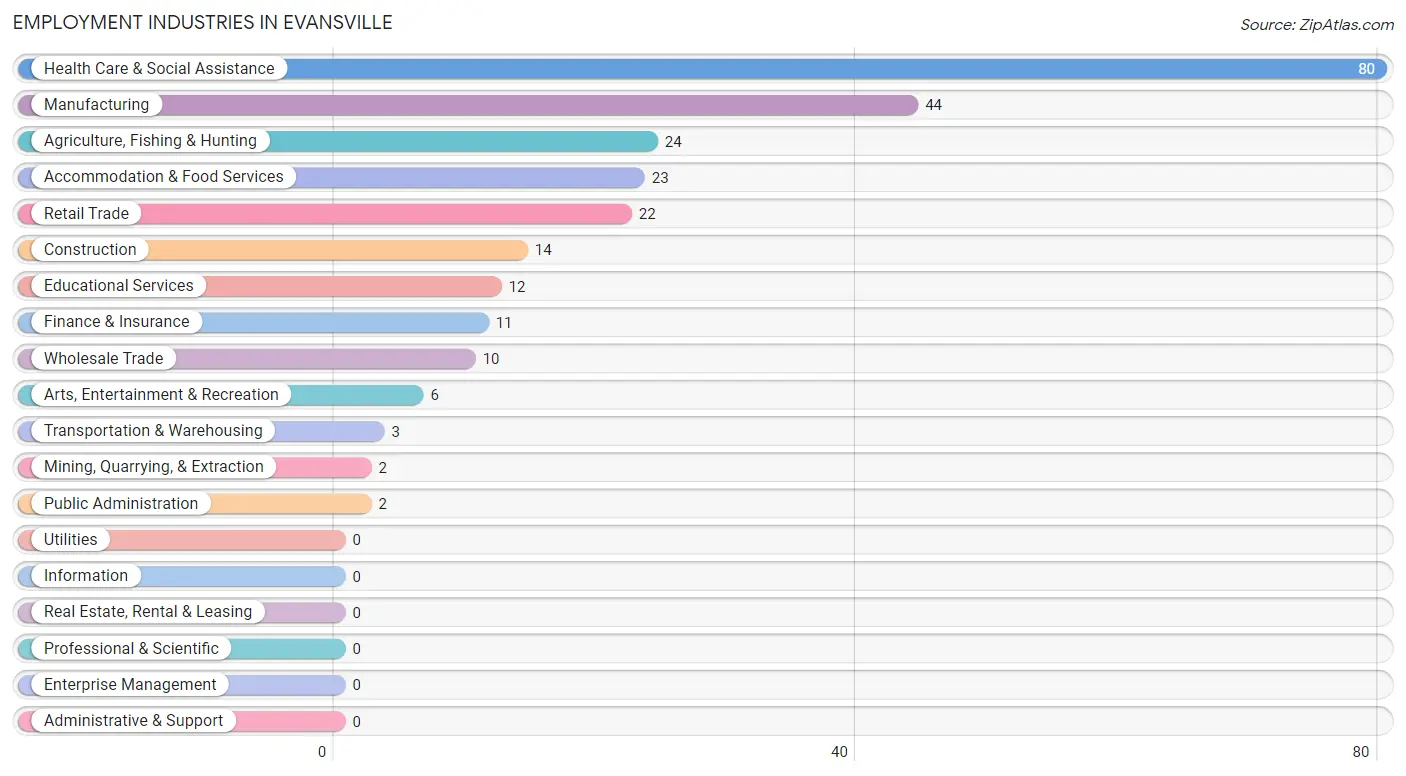
Employment Industries in Evansville
The major employment industries in Evansville include Health Care & Social Assistance (80 | 27.0%), Manufacturing (44 | 14.9%), Agriculture, Fishing & Hunting (24 | 8.1%), Accommodation & Food Services (23 | 7.8%), and Retail Trade (22 | 7.4%).
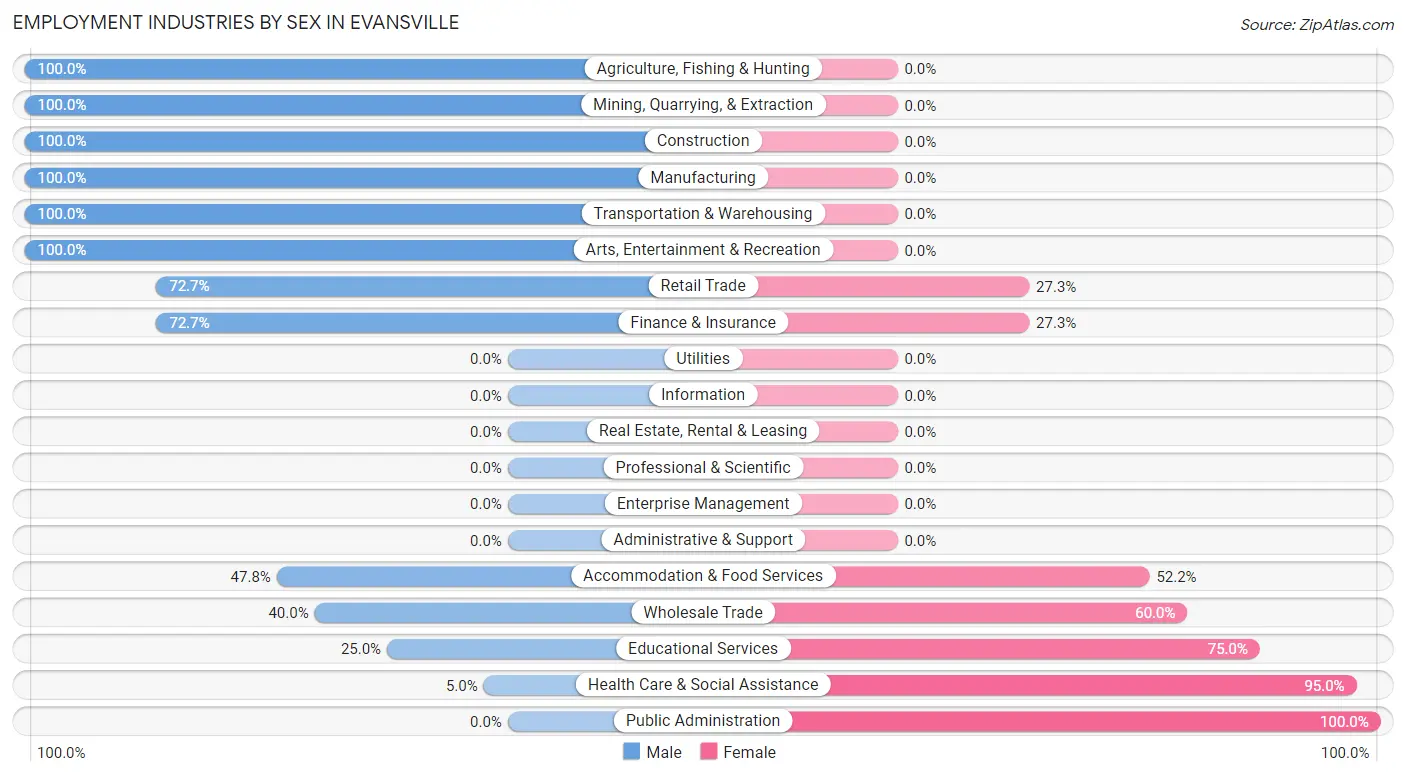
Employment Industries by Sex in Evansville
The Evansville industries that see more men than women are Agriculture, Fishing & Hunting (100.0%), Mining, Quarrying, & Extraction (100.0%), and Construction (100.0%), whereas the industries that tend to have a higher number of women are Public Administration (100.0%), Health Care & Social Assistance (95.0%), and Educational Services (75.0%).
| Industry | Male | Female |
| Agriculture, Fishing & Hunting | 24 (100.0%) | 0 (0.0%) |
| Mining, Quarrying, & Extraction | 2 (100.0%) | 0 (0.0%) |
| Construction | 14 (100.0%) | 0 (0.0%) |
| Manufacturing | 44 (100.0%) | 0 (0.0%) |
| Wholesale Trade | 4 (40.0%) | 6 (60.0%) |
| Retail Trade | 16 (72.7%) | 6 (27.3%) |
| Transportation & Warehousing | 3 (100.0%) | 0 (0.0%) |
| Utilities | 0 (0.0%) | 0 (0.0%) |
| Information | 0 (0.0%) | 0 (0.0%) |
| Finance & Insurance | 8 (72.7%) | 3 (27.3%) |
| Real Estate, Rental & Leasing | 0 (0.0%) | 0 (0.0%) |
| Professional & Scientific | 0 (0.0%) | 0 (0.0%) |
| Enterprise Management | 0 (0.0%) | 0 (0.0%) |
| Administrative & Support | 0 (0.0%) | 0 (0.0%) |
| Educational Services | 3 (25.0%) | 9 (75.0%) |
| Health Care & Social Assistance | 4 (5.0%) | 76 (95.0%) |
| Arts, Entertainment & Recreation | 6 (100.0%) | 0 (0.0%) |
| Accommodation & Food Services | 11 (47.8%) | 12 (52.2%) |
| Public Administration | 0 (0.0%) | 2 (100.0%) |
| Total | 152 (51.3%) | 144 (48.6%) |
Education in Evansville
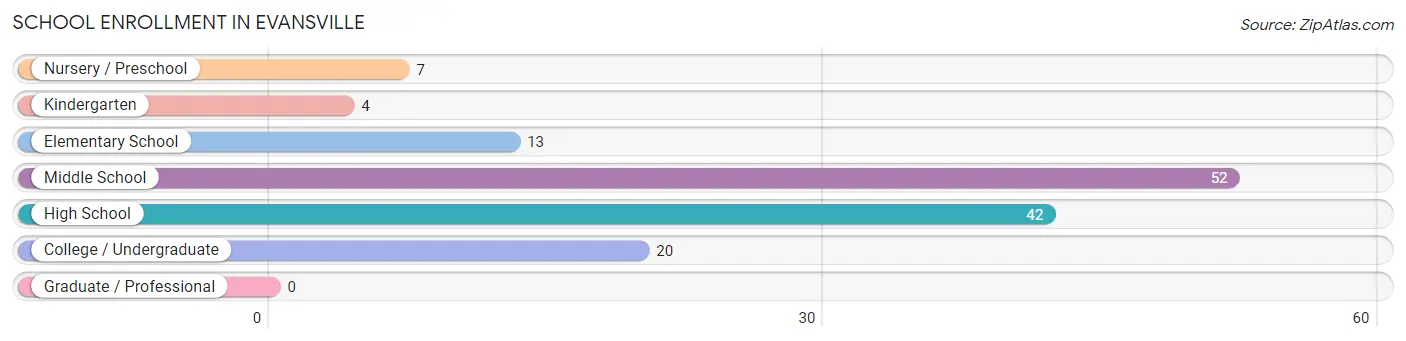
School Enrollment in Evansville
The most common levels of schooling among the 138 students in Evansville are middle school (52 | 37.7%), high school (42 | 30.4%), and college / undergraduate (20 | 14.5%).
| School Level | # Students | % Students |
| Nursery / Preschool | 7 | 5.1% |
| Kindergarten | 4 | 2.9% |
| Elementary School | 13 | 9.4% |
| Middle School | 52 | 37.7% |
| High School | 42 | 30.4% |
| College / Undergraduate | 20 | 14.5% |
| Graduate / Professional | 0 | 0.0% |
| Total | 138 | 100.0% |
School Enrollment by Age by Funding Source in Evansville
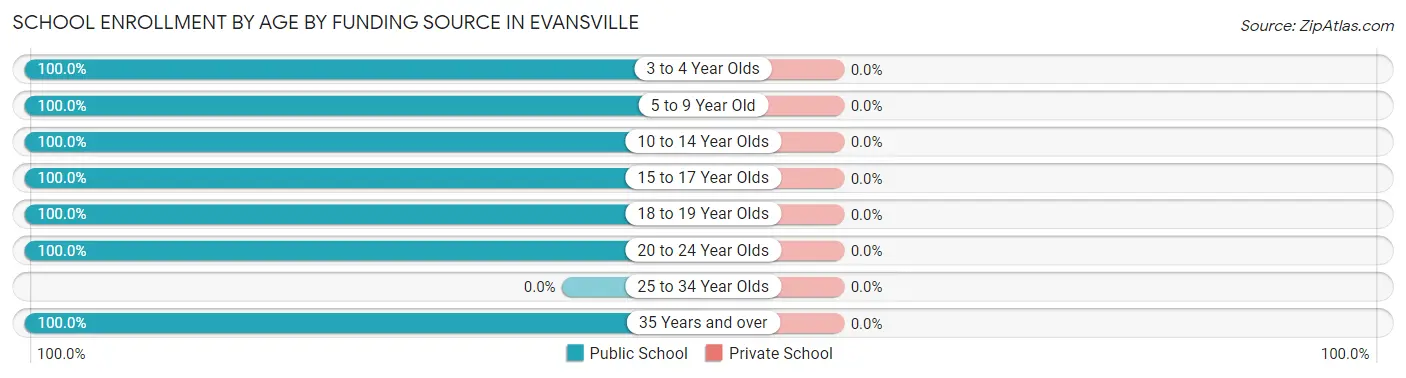
| Age Bracket | Public School | Private School |
| 3 to 4 Year Olds | 2 (100.0%) | 0 (0.0%) |
| 5 to 9 Year Old | 24 (100.0%) | 0 (0.0%) |
| 10 to 14 Year Olds | 50 (100.0%) | 0 (0.0%) |
| 15 to 17 Year Olds | 27 (100.0%) | 0 (0.0%) |
| 18 to 19 Year Olds | 10 (100.0%) | 0 (0.0%) |
| 20 to 24 Year Olds | 17 (100.0%) | 0 (0.0%) |
| 25 to 34 Year Olds | 0 (0.0%) | 0 (0.0%) |
| 35 Years and over | 8 (100.0%) | 0 (0.0%) |
| Total | 138 (100.0%) | 0 (0.0%) |
Educational Attainment by Field of Study in Evansville
Business (28 | 44.4%), education (20 | 31.8%), social sciences (7 | 11.1%), arts & humanities (6 | 9.5%), and science & technology (2 | 3.2%) are the most common fields of study among 63 individuals in Evansville who have obtained a bachelor's degree or higher.
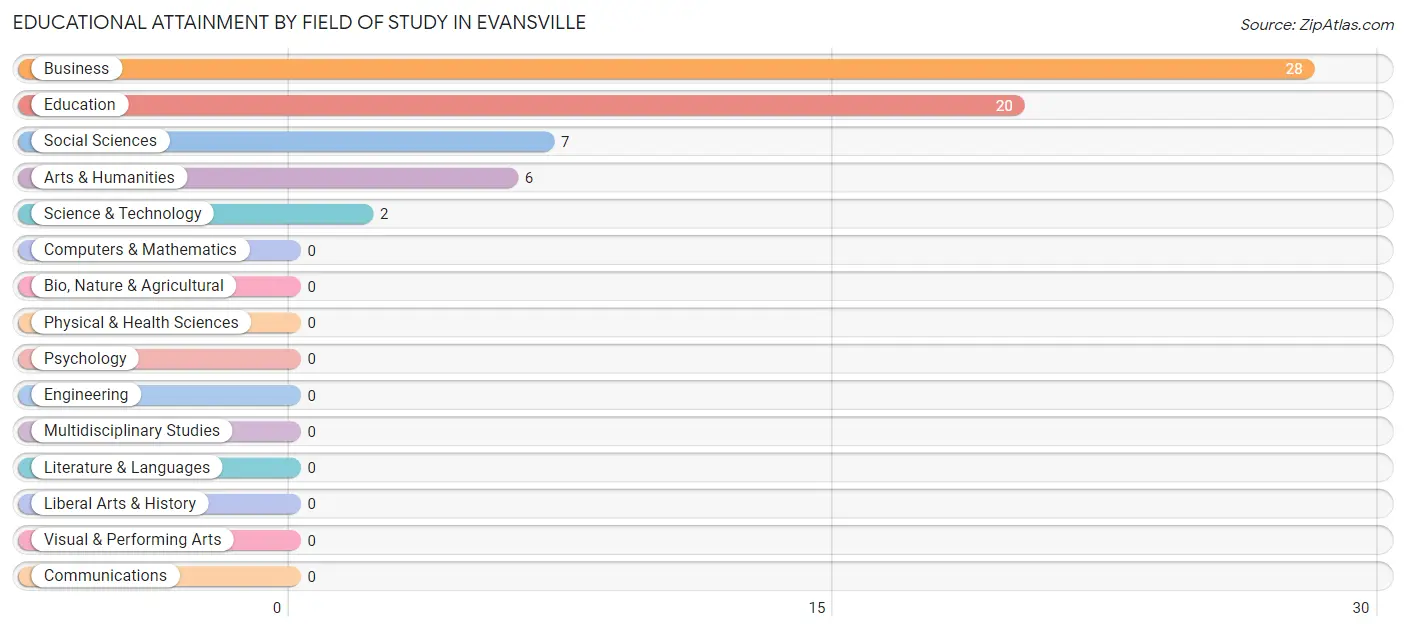
| Field of Study | # Graduates | % Graduates |
| Computers & Mathematics | 0 | 0.0% |
| Bio, Nature & Agricultural | 0 | 0.0% |
| Physical & Health Sciences | 0 | 0.0% |
| Psychology | 0 | 0.0% |
| Social Sciences | 7 | 11.1% |
| Engineering | 0 | 0.0% |
| Multidisciplinary Studies | 0 | 0.0% |
| Science & Technology | 2 | 3.2% |
| Business | 28 | 44.4% |
| Education | 20 | 31.8% |
| Literature & Languages | 0 | 0.0% |
| Liberal Arts & History | 0 | 0.0% |
| Visual & Performing Arts | 0 | 0.0% |
| Communications | 0 | 0.0% |
| Arts & Humanities | 6 | 9.5% |
| Total | 63 | 100.0% |
Transportation & Commute in Evansville
Vehicle Availability by Sex in Evansville
The most prevalent vehicle ownership categories in Evansville are males with 2 vehicles (70, accounting for 46.4%) and females with 2 vehicles (66, making up 49.3%).
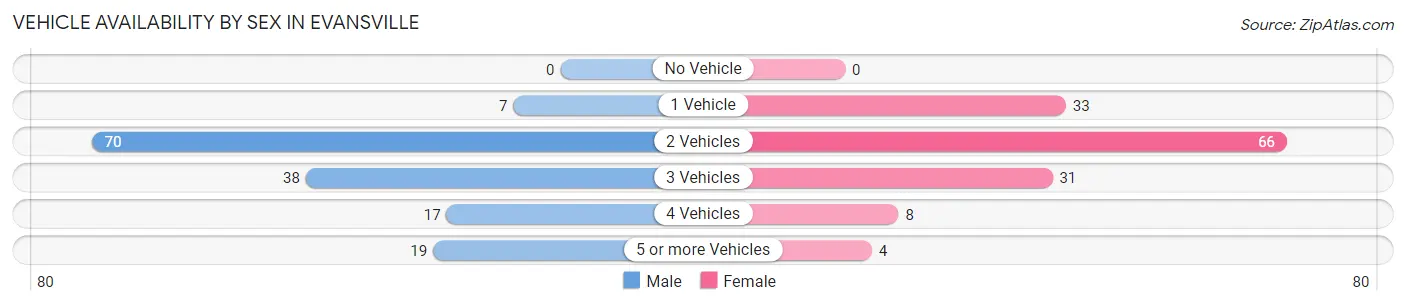
| Vehicles Available | Male | Female |
| No Vehicle | 0 (0.0%) | 0 (0.0%) |
| 1 Vehicle | 7 (4.6%) | 33 (23.2%) |
| 2 Vehicles | 70 (46.4%) | 66 (46.5%) |
| 3 Vehicles | 38 (25.2%) | 31 (21.8%) |
| 4 Vehicles | 17 (11.3%) | 8 (5.6%) |
| 5 or more Vehicles | 19 (12.6%) | 4 (2.8%) |
| Total | 151 (100.0%) | 142 (100.0%) |
Commute Time in Evansville
The most frequently occuring commute durations in Evansville are 30 to 34 minutes (58 commuters, 20.9%), 20 to 24 minutes (57 commuters, 20.5%), and 5 to 9 minutes (33 commuters, 11.9%).
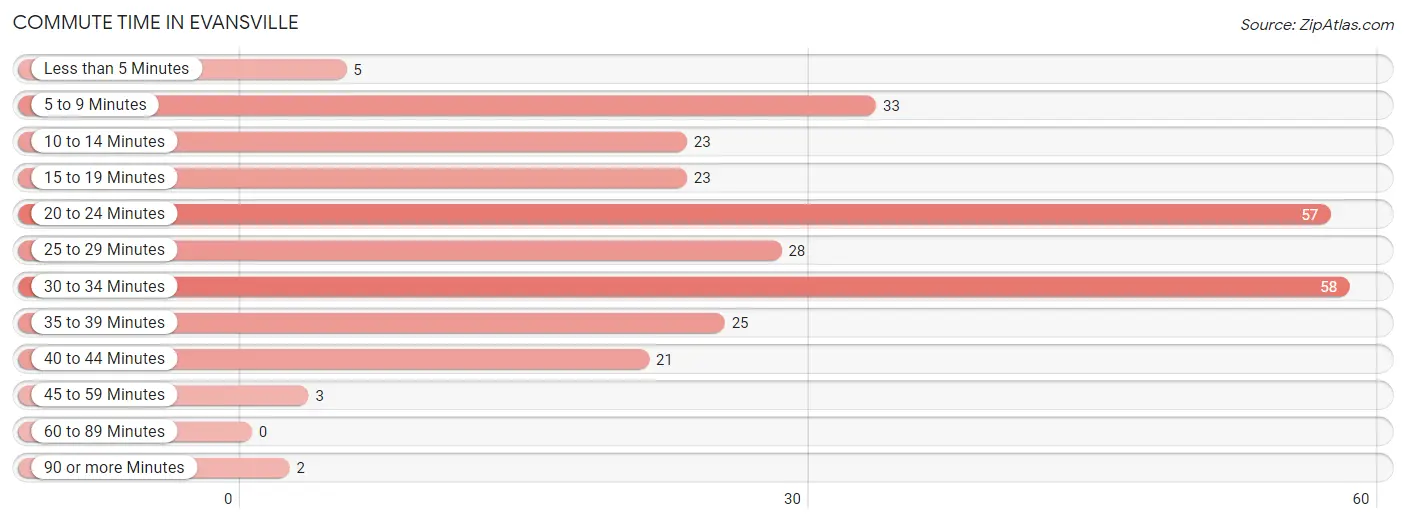
| Commute Time | # Commuters | % Commuters |
| Less than 5 Minutes | 5 | 1.8% |
| 5 to 9 Minutes | 33 | 11.9% |
| 10 to 14 Minutes | 23 | 8.3% |
| 15 to 19 Minutes | 23 | 8.3% |
| 20 to 24 Minutes | 57 | 20.5% |
| 25 to 29 Minutes | 28 | 10.1% |
| 30 to 34 Minutes | 58 | 20.9% |
| 35 to 39 Minutes | 25 | 9.0% |
| 40 to 44 Minutes | 21 | 7.5% |
| 45 to 59 Minutes | 3 | 1.1% |
| 60 to 89 Minutes | 0 | 0.0% |
| 90 or more Minutes | 2 | 0.7% |
Commute Time by Sex in Evansville
The most common commute times in Evansville are 20 to 24 minutes (30 commuters, 19.9%) for males and 30 to 34 minutes (40 commuters, 31.5%) for females.
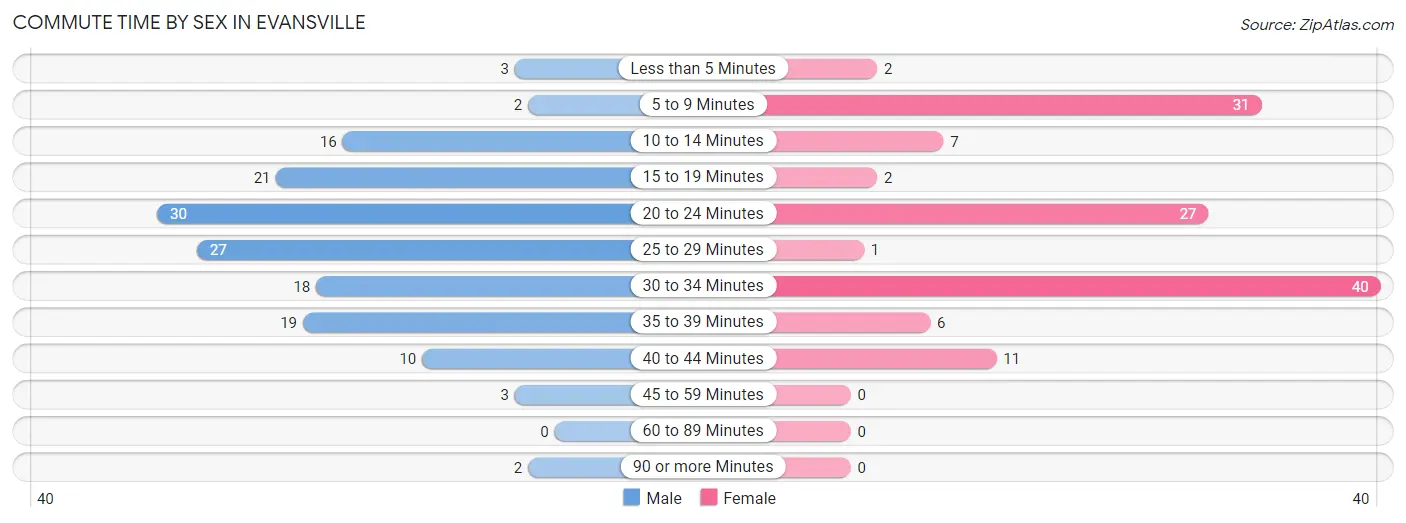
| Commute Time | Male | Female |
| Less than 5 Minutes | 3 (2.0%) | 2 (1.6%) |
| 5 to 9 Minutes | 2 (1.3%) | 31 (24.4%) |
| 10 to 14 Minutes | 16 (10.6%) | 7 (5.5%) |
| 15 to 19 Minutes | 21 (13.9%) | 2 (1.6%) |
| 20 to 24 Minutes | 30 (19.9%) | 27 (21.3%) |
| 25 to 29 Minutes | 27 (17.9%) | 1 (0.8%) |
| 30 to 34 Minutes | 18 (11.9%) | 40 (31.5%) |
| 35 to 39 Minutes | 19 (12.6%) | 6 (4.7%) |
| 40 to 44 Minutes | 10 (6.6%) | 11 (8.7%) |
| 45 to 59 Minutes | 3 (2.0%) | 0 (0.0%) |
| 60 to 89 Minutes | 0 (0.0%) | 0 (0.0%) |
| 90 or more Minutes | 2 (1.3%) | 0 (0.0%) |
Time of Departure to Work by Sex in Evansville
The most frequent times of departure to work in Evansville are 6:30 AM to 6:59 AM (36, 23.8%) for males and 5:30 AM to 5:59 AM (26, 20.5%) for females.
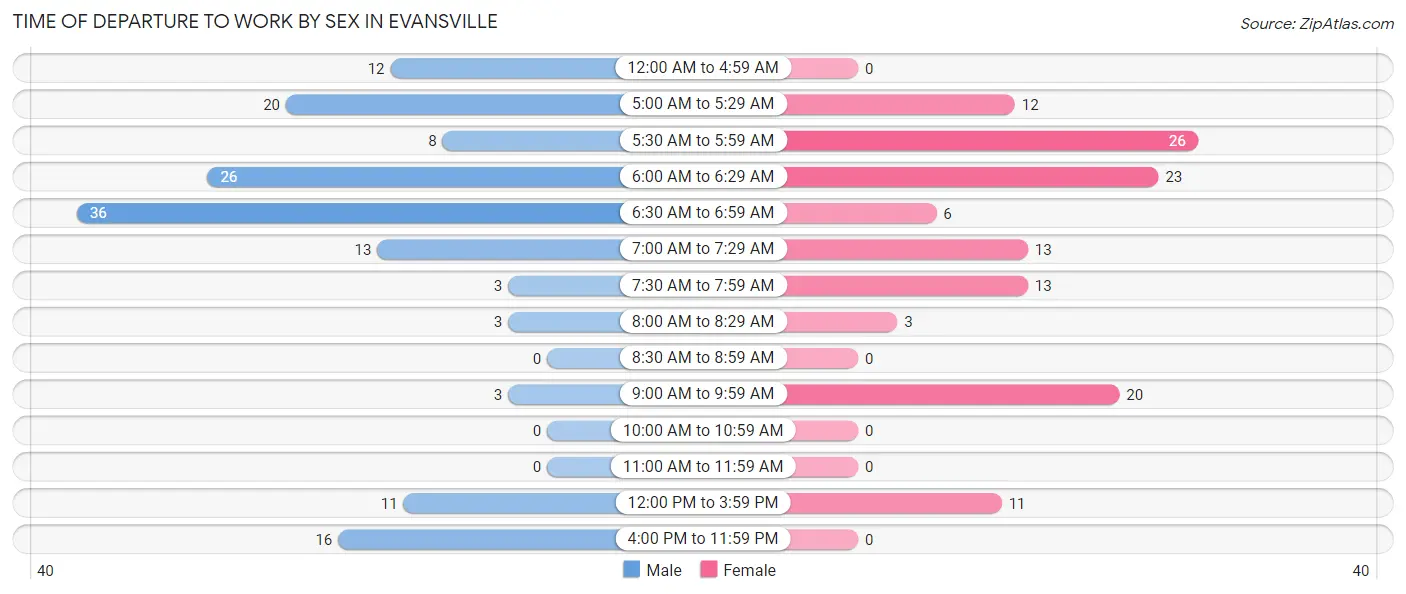
| Time of Departure | Male | Female |
| 12:00 AM to 4:59 AM | 12 (8.0%) | 0 (0.0%) |
| 5:00 AM to 5:29 AM | 20 (13.3%) | 12 (9.5%) |
| 5:30 AM to 5:59 AM | 8 (5.3%) | 26 (20.5%) |
| 6:00 AM to 6:29 AM | 26 (17.2%) | 23 (18.1%) |
| 6:30 AM to 6:59 AM | 36 (23.8%) | 6 (4.7%) |
| 7:00 AM to 7:29 AM | 13 (8.6%) | 13 (10.2%) |
| 7:30 AM to 7:59 AM | 3 (2.0%) | 13 (10.2%) |
| 8:00 AM to 8:29 AM | 3 (2.0%) | 3 (2.4%) |
| 8:30 AM to 8:59 AM | 0 (0.0%) | 0 (0.0%) |
| 9:00 AM to 9:59 AM | 3 (2.0%) | 20 (15.8%) |
| 10:00 AM to 10:59 AM | 0 (0.0%) | 0 (0.0%) |
| 11:00 AM to 11:59 AM | 0 (0.0%) | 0 (0.0%) |
| 12:00 PM to 3:59 PM | 11 (7.3%) | 11 (8.7%) |
| 4:00 PM to 11:59 PM | 16 (10.6%) | 0 (0.0%) |
| Total | 151 (100.0%) | 127 (100.0%) |
Housing Occupancy in Evansville
Occupancy by Ownership in Evansville
Of the total 293 dwellings in Evansville, owner-occupied units account for 194 (66.2%), while renter-occupied units make up 99 (33.8%).
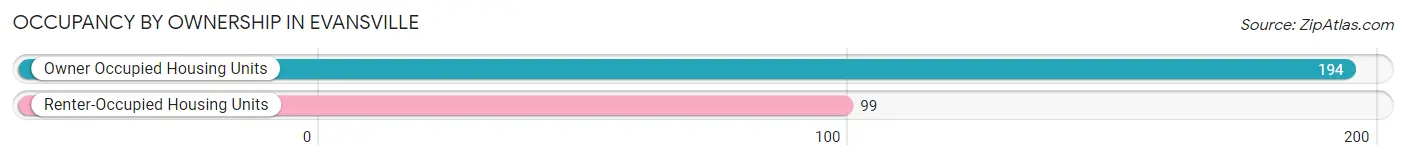
| Occupancy | # Housing Units | % Housing Units |
| Owner Occupied Housing Units | 194 | 66.2% |
| Renter-Occupied Housing Units | 99 | 33.8% |
| Total Occupied Housing Units | 293 | 100.0% |
Occupancy by Household Size in Evansville
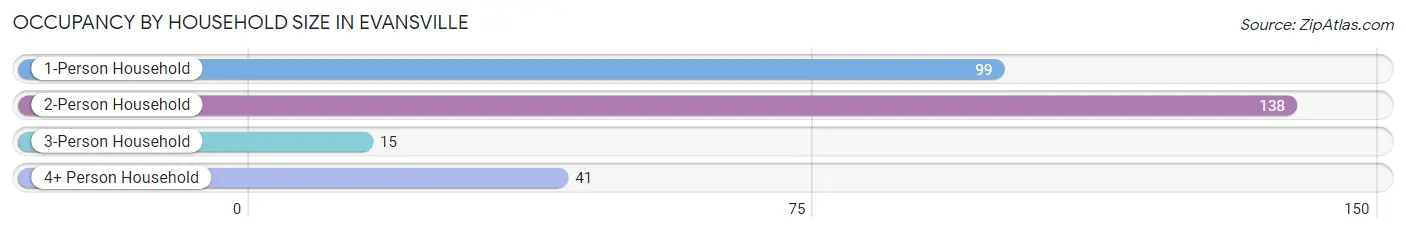
| Household Size | # Housing Units | % Housing Units |
| 1-Person Household | 99 | 33.8% |
| 2-Person Household | 138 | 47.1% |
| 3-Person Household | 15 | 5.1% |
| 4+ Person Household | 41 | 14.0% |
| Total Housing Units | 293 | 100.0% |
Occupancy by Ownership by Household Size in Evansville
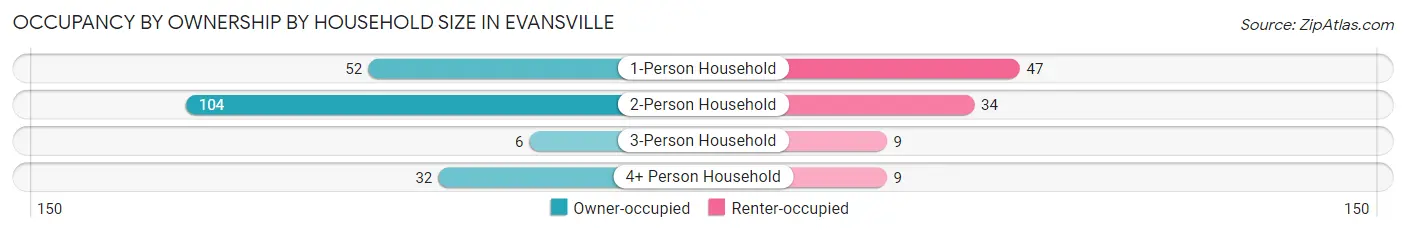
| Household Size | Owner-occupied | Renter-occupied |
| 1-Person Household | 52 (52.5%) | 47 (47.5%) |
| 2-Person Household | 104 (75.4%) | 34 (24.6%) |
| 3-Person Household | 6 (40.0%) | 9 (60.0%) |
| 4+ Person Household | 32 (78.0%) | 9 (22.0%) |
| Total Housing Units | 194 (66.2%) | 99 (33.8%) |
Occupancy by Educational Attainment in Evansville
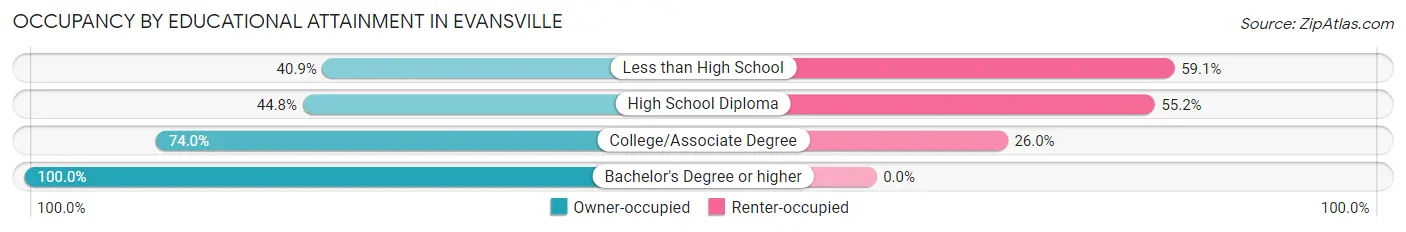
| Household Size | Owner-occupied | Renter-occupied |
| Less than High School | 9 (40.9%) | 13 (59.1%) |
| High School Diploma | 39 (44.8%) | 48 (55.2%) |
| College/Associate Degree | 108 (74.0%) | 38 (26.0%) |
| Bachelor's Degree or higher | 38 (100.0%) | 0 (0.0%) |
Occupancy by Age of Householder in Evansville
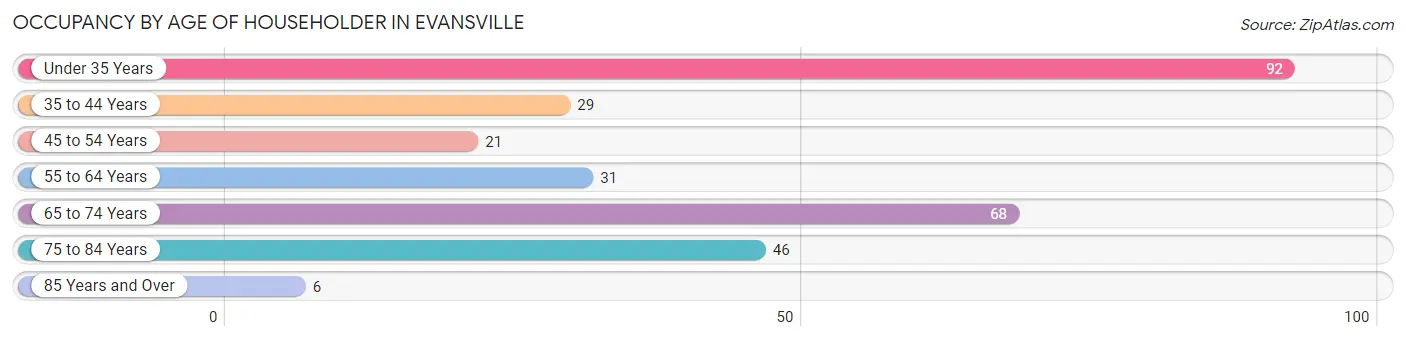
| Age Bracket | # Households | % Households |
| Under 35 Years | 92 | 31.4% |
| 35 to 44 Years | 29 | 9.9% |
| 45 to 54 Years | 21 | 7.2% |
| 55 to 64 Years | 31 | 10.6% |
| 65 to 74 Years | 68 | 23.2% |
| 75 to 84 Years | 46 | 15.7% |
| 85 Years and Over | 6 | 2.1% |
| Total | 293 | 100.0% |
Housing Finances in Evansville
Median Income by Occupancy in Evansville
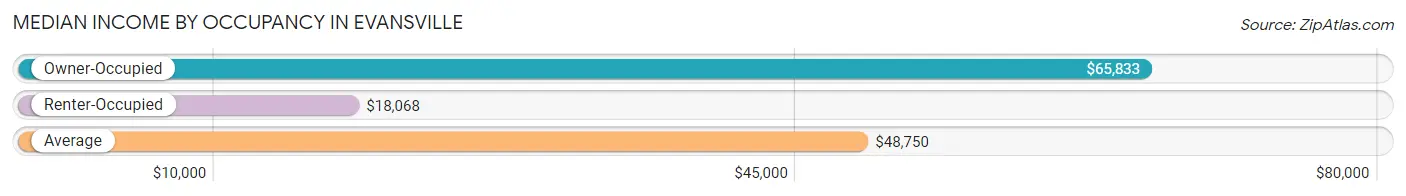
| Occupancy Type | # Households | Median Income |
| Owner-Occupied | 194 (66.2%) | $65,833 |
| Renter-Occupied | 99 (33.8%) | $18,068 |
| Average | 293 (100.0%) | $48,750 |
Occupancy by Householder Income Bracket in Evansville
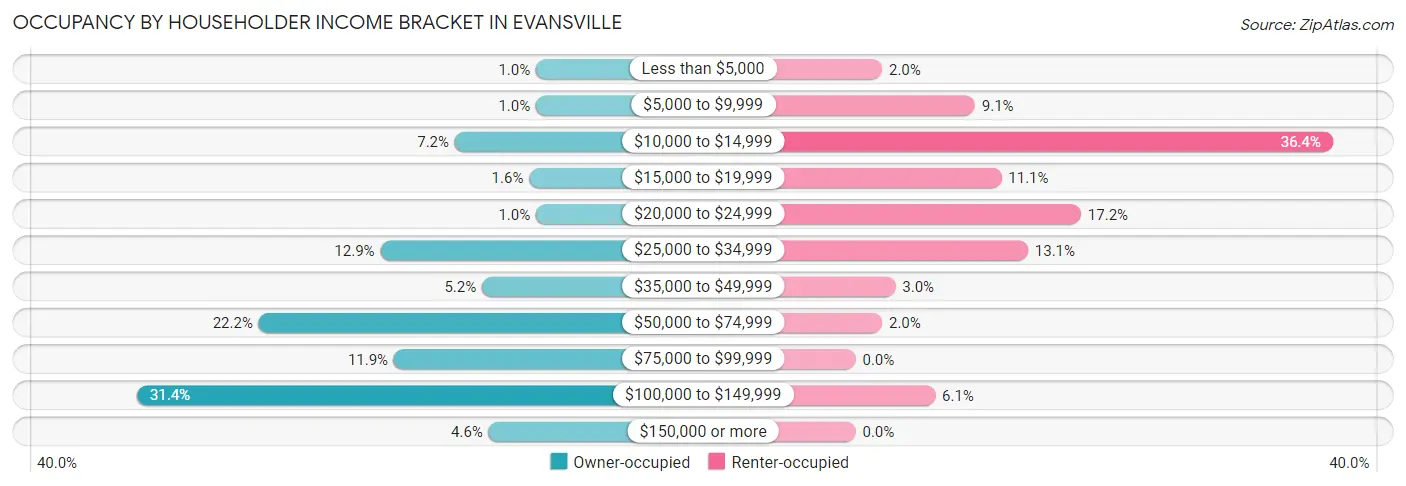
| Income Bracket | Owner-occupied | Renter-occupied |
| Less than $5,000 | 2 (1.0%) | 2 (2.0%) |
| $5,000 to $9,999 | 2 (1.0%) | 9 (9.1%) |
| $10,000 to $14,999 | 14 (7.2%) | 36 (36.4%) |
| $15,000 to $19,999 | 3 (1.5%) | 11 (11.1%) |
| $20,000 to $24,999 | 2 (1.0%) | 17 (17.2%) |
| $25,000 to $34,999 | 25 (12.9%) | 13 (13.1%) |
| $35,000 to $49,999 | 10 (5.1%) | 3 (3.0%) |
| $50,000 to $74,999 | 43 (22.2%) | 2 (2.0%) |
| $75,000 to $99,999 | 23 (11.9%) | 0 (0.0%) |
| $100,000 to $149,999 | 61 (31.4%) | 6 (6.1%) |
| $150,000 or more | 9 (4.6%) | 0 (0.0%) |
| Total | 194 (100.0%) | 99 (100.0%) |
Monthly Housing Cost Tiers in Evansville
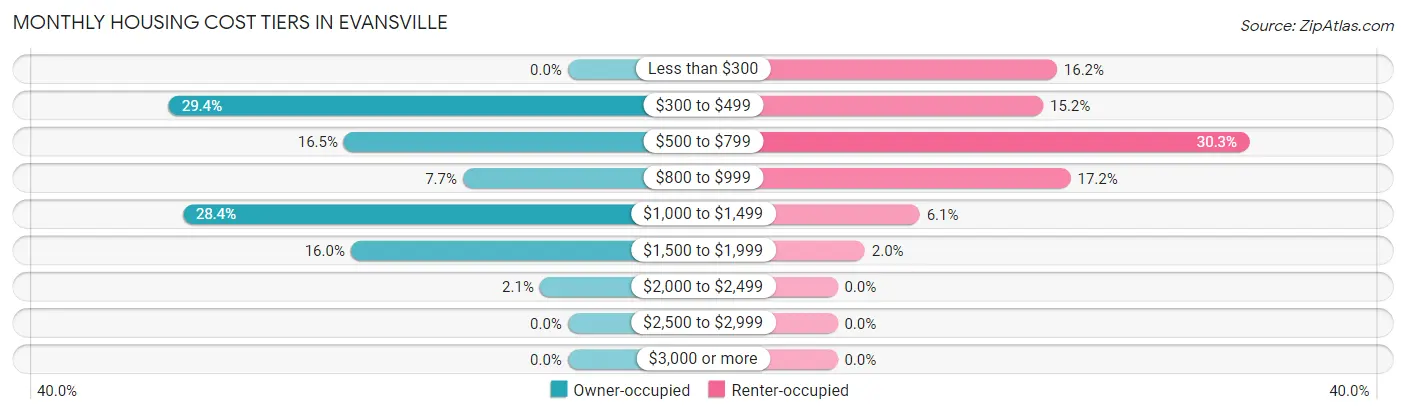
| Monthly Cost | Owner-occupied | Renter-occupied |
| Less than $300 | 0 (0.0%) | 16 (16.2%) |
| $300 to $499 | 57 (29.4%) | 15 (15.1%) |
| $500 to $799 | 32 (16.5%) | 30 (30.3%) |
| $800 to $999 | 15 (7.7%) | 17 (17.2%) |
| $1,000 to $1,499 | 55 (28.3%) | 6 (6.1%) |
| $1,500 to $1,999 | 31 (16.0%) | 2 (2.0%) |
| $2,000 to $2,499 | 4 (2.1%) | 0 (0.0%) |
| $2,500 to $2,999 | 0 (0.0%) | 0 (0.0%) |
| $3,000 or more | 0 (0.0%) | 0 (0.0%) |
| Total | 194 (100.0%) | 99 (100.0%) |
Physical Housing Characteristics in Evansville
Housing Structures in Evansville
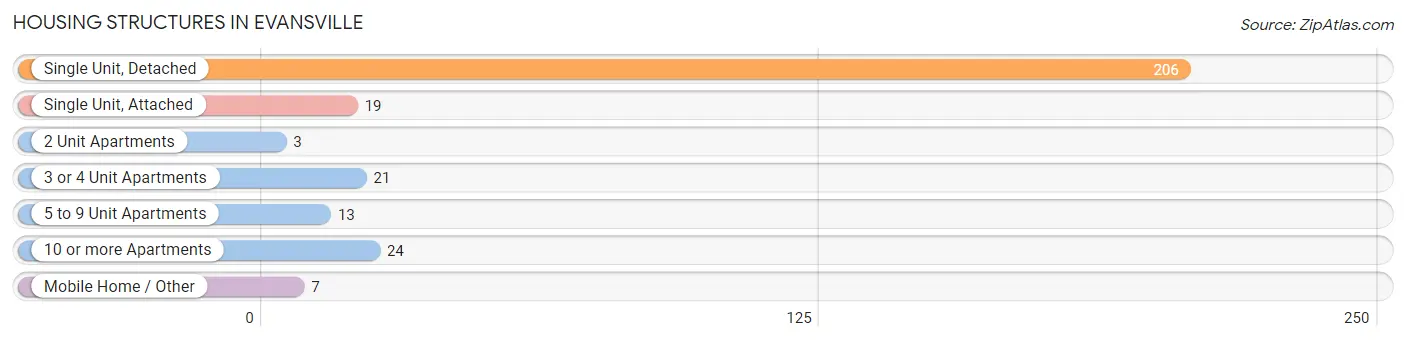
| Structure Type | # Housing Units | % Housing Units |
| Single Unit, Detached | 206 | 70.3% |
| Single Unit, Attached | 19 | 6.5% |
| 2 Unit Apartments | 3 | 1.0% |
| 3 or 4 Unit Apartments | 21 | 7.2% |
| 5 to 9 Unit Apartments | 13 | 4.4% |
| 10 or more Apartments | 24 | 8.2% |
| Mobile Home / Other | 7 | 2.4% |
| Total | 293 | 100.0% |
Housing Structures by Occupancy in Evansville
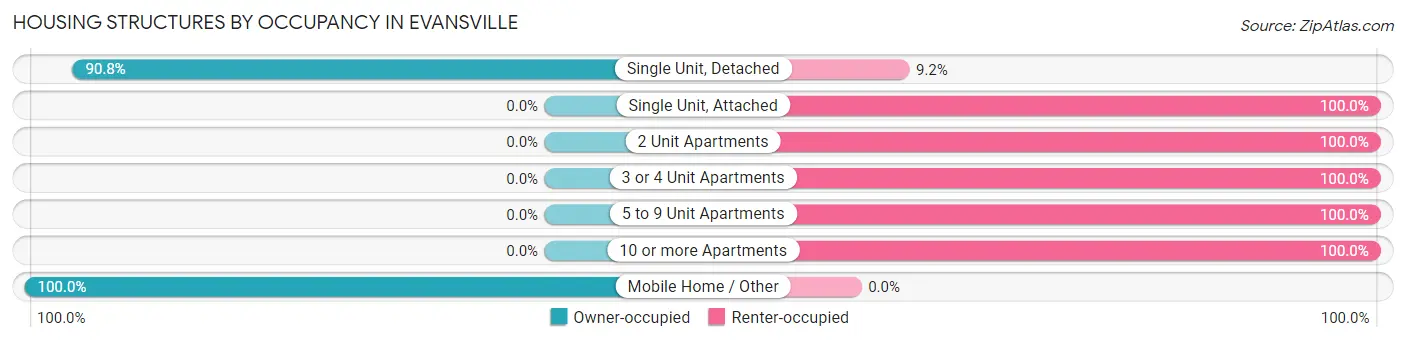
| Structure Type | Owner-occupied | Renter-occupied |
| Single Unit, Detached | 187 (90.8%) | 19 (9.2%) |
| Single Unit, Attached | 0 (0.0%) | 19 (100.0%) |
| 2 Unit Apartments | 0 (0.0%) | 3 (100.0%) |
| 3 or 4 Unit Apartments | 0 (0.0%) | 21 (100.0%) |
| 5 to 9 Unit Apartments | 0 (0.0%) | 13 (100.0%) |
| 10 or more Apartments | 0 (0.0%) | 24 (100.0%) |
| Mobile Home / Other | 7 (100.0%) | 0 (0.0%) |
| Total | 194 (66.2%) | 99 (33.8%) |
Housing Structures by Number of Rooms in Evansville
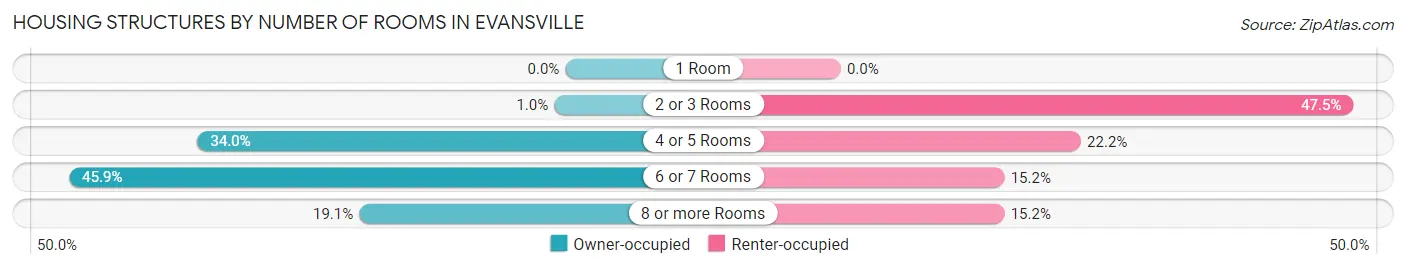
| Number of Rooms | Owner-occupied | Renter-occupied |
| 1 Room | 0 (0.0%) | 0 (0.0%) |
| 2 or 3 Rooms | 2 (1.0%) | 47 (47.5%) |
| 4 or 5 Rooms | 66 (34.0%) | 22 (22.2%) |
| 6 or 7 Rooms | 89 (45.9%) | 15 (15.1%) |
| 8 or more Rooms | 37 (19.1%) | 15 (15.1%) |
| Total | 194 (100.0%) | 99 (100.0%) |
Housing Structure by Heating Type in Evansville
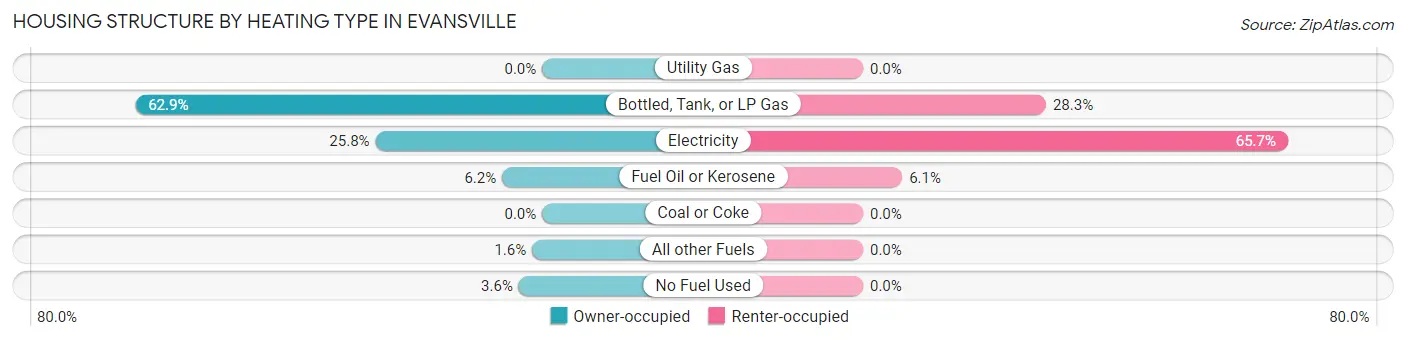
| Heating Type | Owner-occupied | Renter-occupied |
| Utility Gas | 0 (0.0%) | 0 (0.0%) |
| Bottled, Tank, or LP Gas | 122 (62.9%) | 28 (28.3%) |
| Electricity | 50 (25.8%) | 65 (65.7%) |
| Fuel Oil or Kerosene | 12 (6.2%) | 6 (6.1%) |
| Coal or Coke | 0 (0.0%) | 0 (0.0%) |
| All other Fuels | 3 (1.5%) | 0 (0.0%) |
| No Fuel Used | 7 (3.6%) | 0 (0.0%) |
| Total | 194 (100.0%) | 99 (100.0%) |
Household Vehicle Usage in Evansville
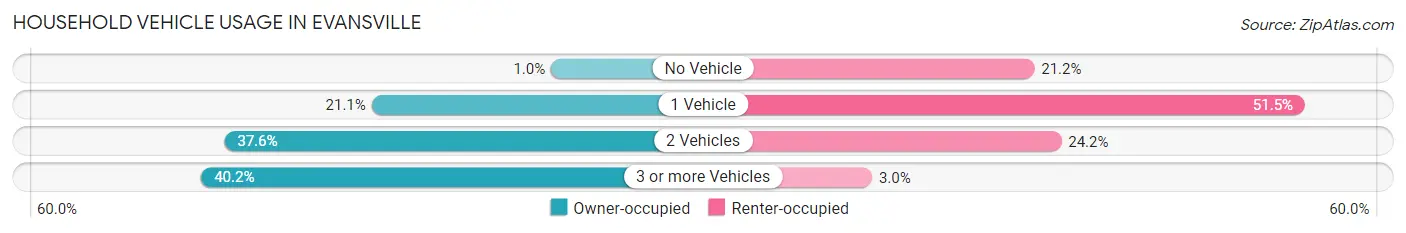
| Vehicles per Household | Owner-occupied | Renter-occupied |
| No Vehicle | 2 (1.0%) | 21 (21.2%) |
| 1 Vehicle | 41 (21.1%) | 51 (51.5%) |
| 2 Vehicles | 73 (37.6%) | 24 (24.2%) |
| 3 or more Vehicles | 78 (40.2%) | 3 (3.0%) |
| Total | 194 (100.0%) | 99 (100.0%) |
Real Estate & Mortgages in Evansville
Real Estate and Mortgage Overview in Evansville
| Characteristic | Without Mortgage | With Mortgage |
| Housing Units | 83 | 111 |
| Median Property Value | $134,800 | $139,700 |
| Median Household Income | $58,750 | $6 |
| Monthly Housing Costs | $489 | $0 |
| Real Estate Taxes | $1,655 | $2 |
Property Value by Mortgage Status in Evansville
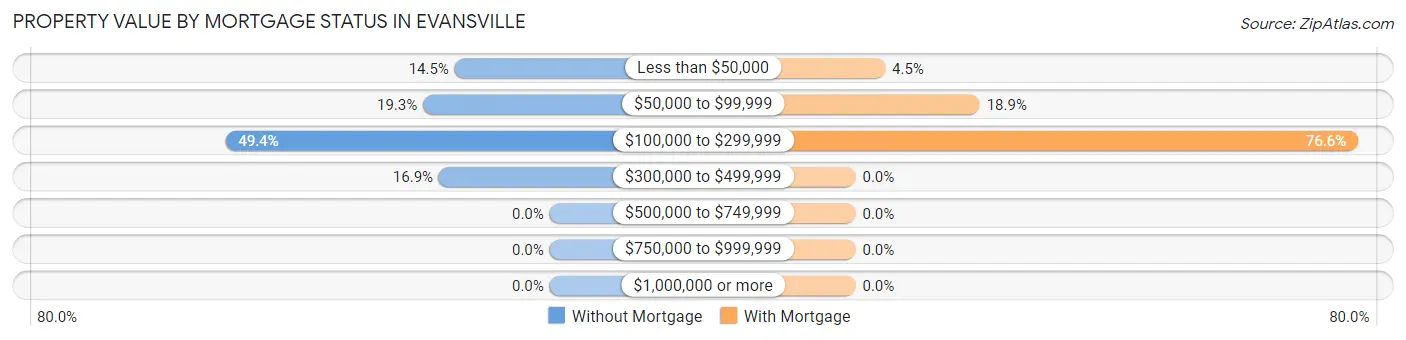
| Property Value | Without Mortgage | With Mortgage |
| Less than $50,000 | 12 (14.5%) | 5 (4.5%) |
| $50,000 to $99,999 | 16 (19.3%) | 21 (18.9%) |
| $100,000 to $299,999 | 41 (49.4%) | 85 (76.6%) |
| $300,000 to $499,999 | 14 (16.9%) | 0 (0.0%) |
| $500,000 to $749,999 | 0 (0.0%) | 0 (0.0%) |
| $750,000 to $999,999 | 0 (0.0%) | 0 (0.0%) |
| $1,000,000 or more | 0 (0.0%) | 0 (0.0%) |
| Total | 83 (100.0%) | 111 (100.0%) |
Household Income by Mortgage Status in Evansville
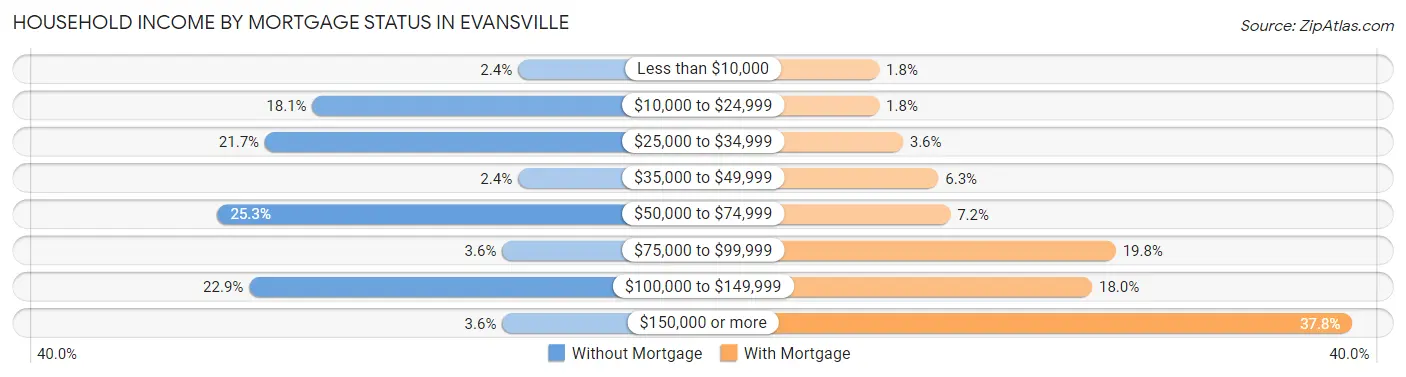
| Household Income | Without Mortgage | With Mortgage |
| Less than $10,000 | 2 (2.4%) | 2 (1.8%) |
| $10,000 to $24,999 | 15 (18.1%) | 2 (1.8%) |
| $25,000 to $34,999 | 18 (21.7%) | 4 (3.6%) |
| $35,000 to $49,999 | 2 (2.4%) | 7 (6.3%) |
| $50,000 to $74,999 | 21 (25.3%) | 8 (7.2%) |
| $75,000 to $99,999 | 3 (3.6%) | 22 (19.8%) |
| $100,000 to $149,999 | 19 (22.9%) | 20 (18.0%) |
| $150,000 or more | 3 (3.6%) | 42 (37.8%) |
| Total | 83 (100.0%) | 111 (100.0%) |
Property Value to Household Income Ratio in Evansville
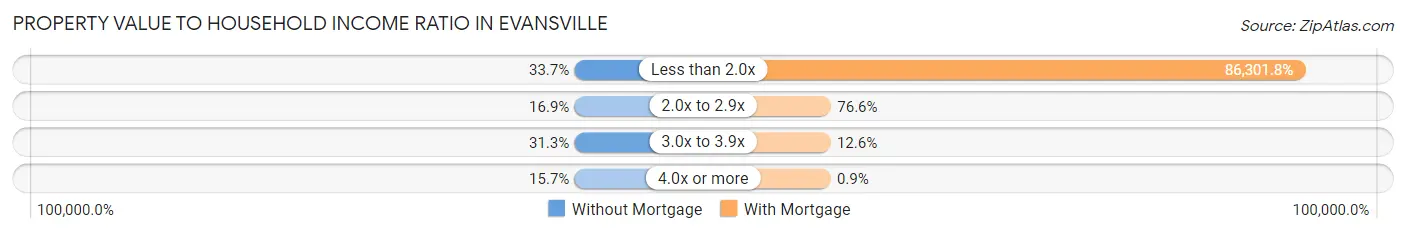
| Value-to-Income Ratio | Without Mortgage | With Mortgage |
| Less than 2.0x | 28 (33.7%) | 95,795 (86,301.8%) |
| 2.0x to 2.9x | 14 (16.9%) | 85 (76.6%) |
| 3.0x to 3.9x | 26 (31.3%) | 14 (12.6%) |
| 4.0x or more | 13 (15.7%) | 1 (0.9%) |
| Total | 83 (100.0%) | 111 (100.0%) |
Real Estate Taxes by Mortgage Status in Evansville
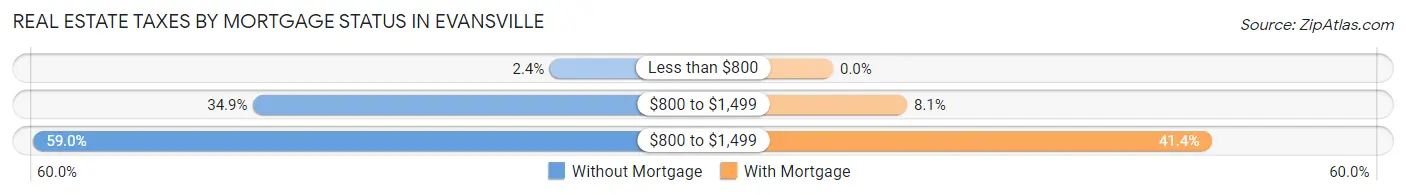
| Property Taxes | Without Mortgage | With Mortgage |
| Less than $800 | 2 (2.4%) | 0 (0.0%) |
| $800 to $1,499 | 29 (34.9%) | 9 (8.1%) |
| $800 to $1,499 | 49 (59.0%) | 46 (41.4%) |
| Total | 83 (100.0%) | 111 (100.0%) |
Health & Disability in Evansville
Health Insurance Coverage by Age in Evansville
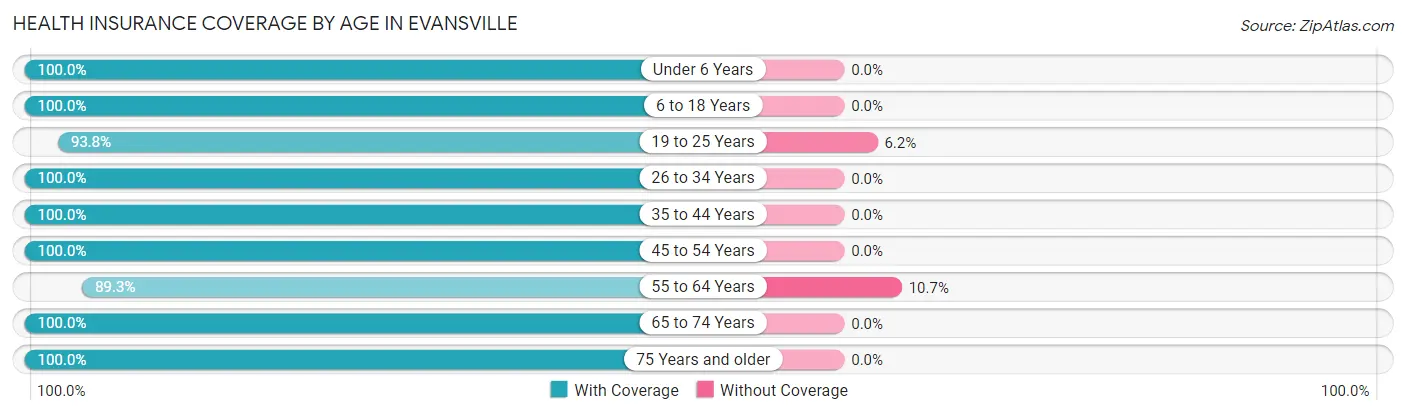
| Age Bracket | With Coverage | Without Coverage |
| Under 6 Years | 52 (100.0%) | 0 (0.0%) |
| 6 to 18 Years | 94 (100.0%) | 0 (0.0%) |
| 19 to 25 Years | 106 (93.8%) | 7 (6.2%) |
| 26 to 34 Years | 57 (100.0%) | 0 (0.0%) |
| 35 to 44 Years | 52 (100.0%) | 0 (0.0%) |
| 45 to 54 Years | 34 (100.0%) | 0 (0.0%) |
| 55 to 64 Years | 50 (89.3%) | 6 (10.7%) |
| 65 to 74 Years | 104 (100.0%) | 0 (0.0%) |
| 75 Years and older | 62 (100.0%) | 0 (0.0%) |
| Total | 611 (97.9%) | 13 (2.1%) |
Health Insurance Coverage by Citizenship Status in Evansville
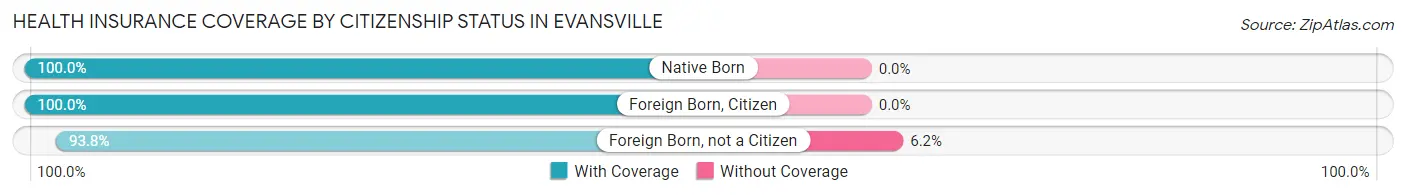
| Citizenship Status | With Coverage | Without Coverage |
| Native Born | 52 (100.0%) | 0 (0.0%) |
| Foreign Born, Citizen | 94 (100.0%) | 0 (0.0%) |
| Foreign Born, not a Citizen | 106 (93.8%) | 7 (6.2%) |
Health Insurance Coverage by Household Income in Evansville
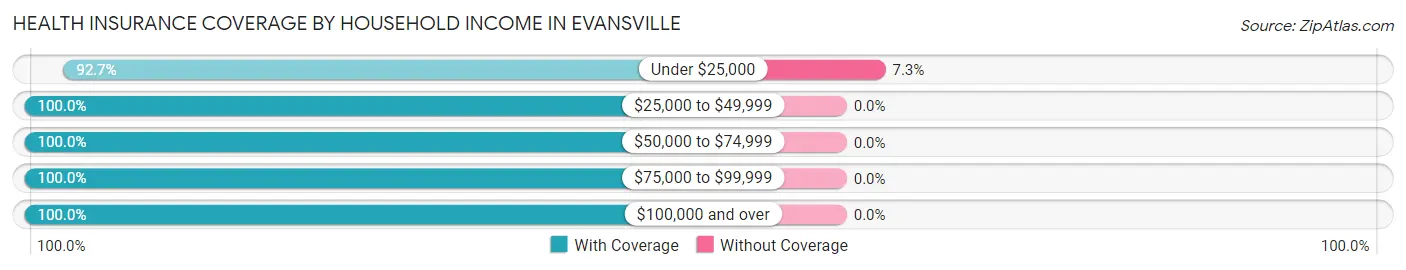
| Household Income | With Coverage | Without Coverage |
| Under $25,000 | 166 (92.7%) | 13 (7.3%) |
| $25,000 to $49,999 | 114 (100.0%) | 0 (0.0%) |
| $50,000 to $74,999 | 79 (100.0%) | 0 (0.0%) |
| $75,000 to $99,999 | 56 (100.0%) | 0 (0.0%) |
| $100,000 and over | 196 (100.0%) | 0 (0.0%) |
Public vs Private Health Insurance Coverage by Age in Evansville
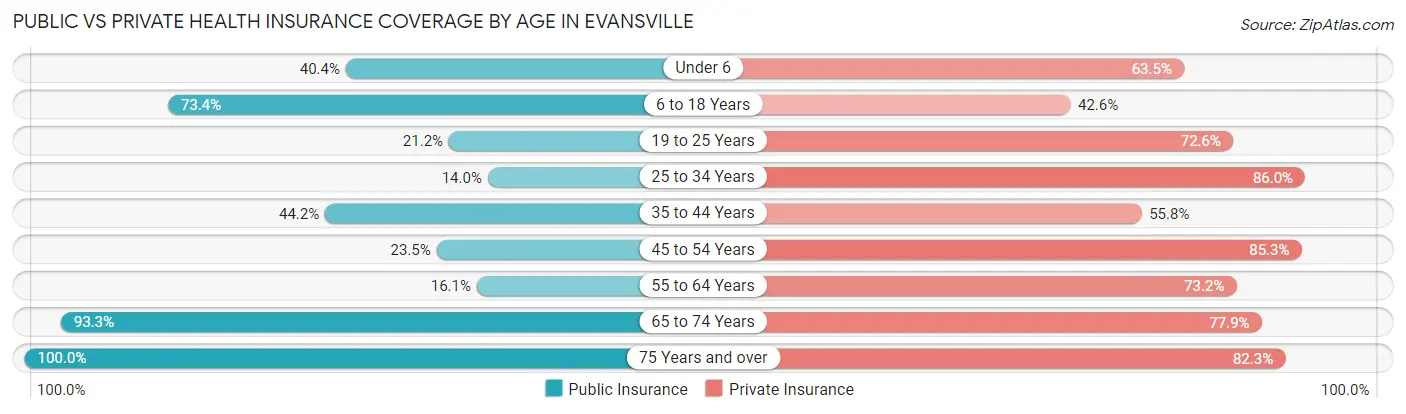
| Age Bracket | Public Insurance | Private Insurance |
| Under 6 | 21 (40.4%) | 33 (63.5%) |
| 6 to 18 Years | 69 (73.4%) | 40 (42.5%) |
| 19 to 25 Years | 24 (21.2%) | 82 (72.6%) |
| 25 to 34 Years | 8 (14.0%) | 49 (86.0%) |
| 35 to 44 Years | 23 (44.2%) | 29 (55.8%) |
| 45 to 54 Years | 8 (23.5%) | 29 (85.3%) |
| 55 to 64 Years | 9 (16.1%) | 41 (73.2%) |
| 65 to 74 Years | 97 (93.3%) | 81 (77.9%) |
| 75 Years and over | 62 (100.0%) | 51 (82.3%) |
| Total | 321 (51.4%) | 435 (69.7%) |
Disability Status by Sex by Age in Evansville
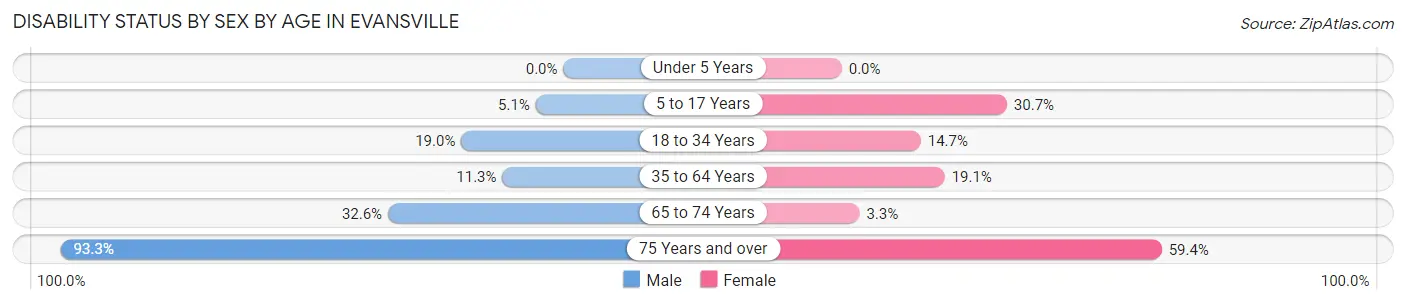
| Age Bracket | Male | Female |
| Under 5 Years | 0 (0.0%) | 0 (0.0%) |
| 5 to 17 Years | 2 (5.1%) | 19 (30.6%) |
| 18 to 34 Years | 18 (19.0%) | 11 (14.7%) |
| 35 to 64 Years | 6 (11.3%) | 17 (19.1%) |
| 65 to 74 Years | 14 (32.6%) | 2 (3.3%) |
| 75 Years and over | 28 (93.3%) | 19 (59.4%) |
Disability Class by Sex by Age in Evansville
Disability Class: Hearing Difficulty
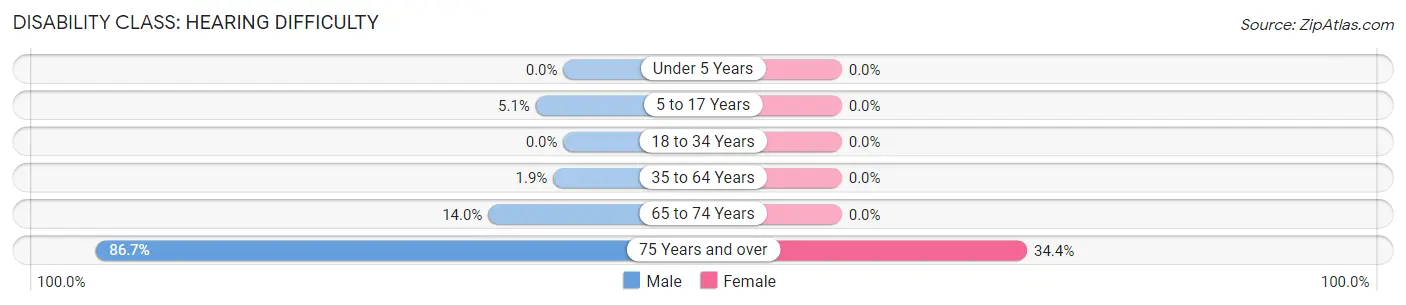
| Age Bracket | Male | Female |
| Under 5 Years | 0 (0.0%) | 0 (0.0%) |
| 5 to 17 Years | 2 (5.1%) | 0 (0.0%) |
| 18 to 34 Years | 0 (0.0%) | 0 (0.0%) |
| 35 to 64 Years | 1 (1.9%) | 0 (0.0%) |
| 65 to 74 Years | 6 (14.0%) | 0 (0.0%) |
| 75 Years and over | 26 (86.7%) | 11 (34.4%) |
Disability Class: Vision Difficulty
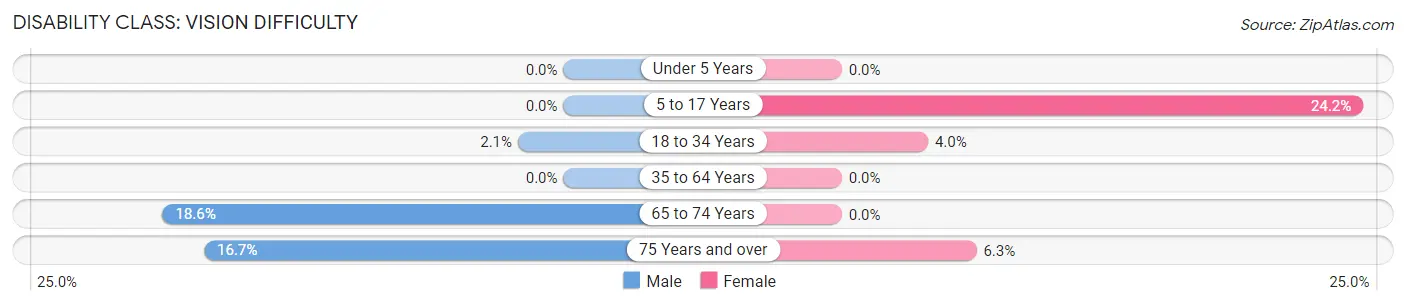
| Age Bracket | Male | Female |
| Under 5 Years | 0 (0.0%) | 0 (0.0%) |
| 5 to 17 Years | 0 (0.0%) | 15 (24.2%) |
| 18 to 34 Years | 2 (2.1%) | 3 (4.0%) |
| 35 to 64 Years | 0 (0.0%) | 0 (0.0%) |
| 65 to 74 Years | 8 (18.6%) | 0 (0.0%) |
| 75 Years and over | 5 (16.7%) | 2 (6.2%) |
Disability Class: Cognitive Difficulty
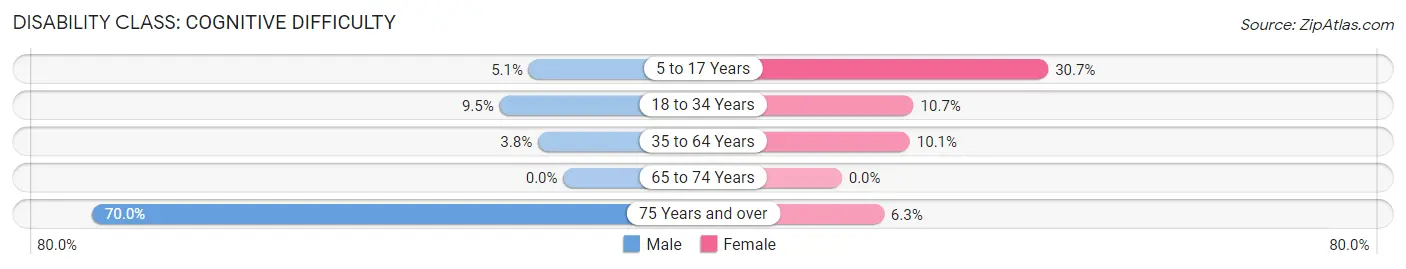
| Age Bracket | Male | Female |
| 5 to 17 Years | 2 (5.1%) | 19 (30.6%) |
| 18 to 34 Years | 9 (9.5%) | 8 (10.7%) |
| 35 to 64 Years | 2 (3.8%) | 9 (10.1%) |
| 65 to 74 Years | 0 (0.0%) | 0 (0.0%) |
| 75 Years and over | 21 (70.0%) | 2 (6.2%) |
Disability Class: Ambulatory Difficulty
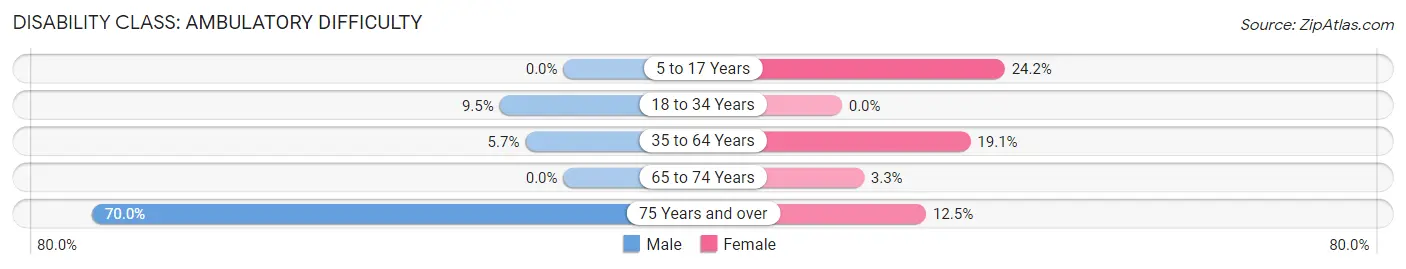
| Age Bracket | Male | Female |
| 5 to 17 Years | 0 (0.0%) | 15 (24.2%) |
| 18 to 34 Years | 9 (9.5%) | 0 (0.0%) |
| 35 to 64 Years | 3 (5.7%) | 17 (19.1%) |
| 65 to 74 Years | 0 (0.0%) | 2 (3.3%) |
| 75 Years and over | 21 (70.0%) | 4 (12.5%) |
Disability Class: Self-Care Difficulty
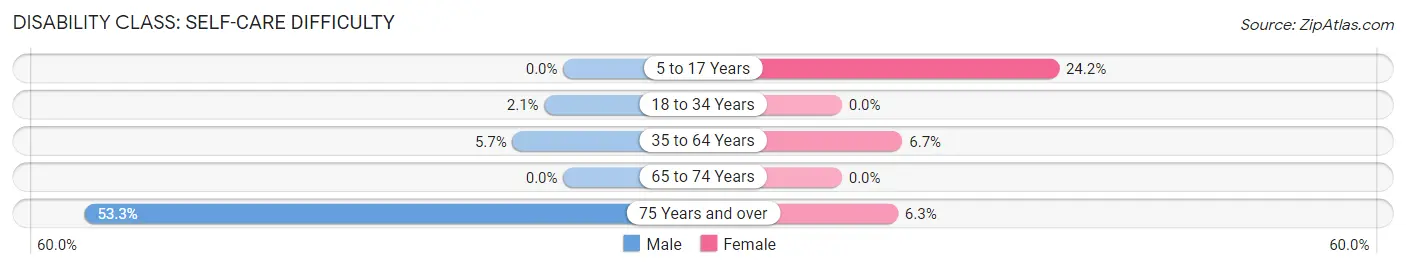
| Age Bracket | Male | Female |
| 5 to 17 Years | 0 (0.0%) | 15 (24.2%) |
| 18 to 34 Years | 2 (2.1%) | 0 (0.0%) |
| 35 to 64 Years | 3 (5.7%) | 6 (6.7%) |
| 65 to 74 Years | 0 (0.0%) | 0 (0.0%) |
| 75 Years and over | 16 (53.3%) | 2 (6.2%) |
Technology Access in Evansville
Computing Device Access in Evansville
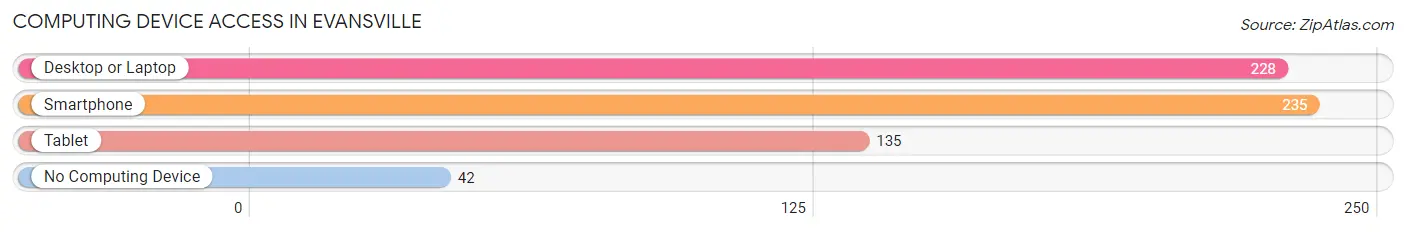
| Device Type | # Households | % Households |
| Desktop or Laptop | 228 | 77.8% |
| Smartphone | 235 | 80.2% |
| Tablet | 135 | 46.1% |
| No Computing Device | 42 | 14.3% |
| Total | 293 | 100.0% |
Internet Access in Evansville
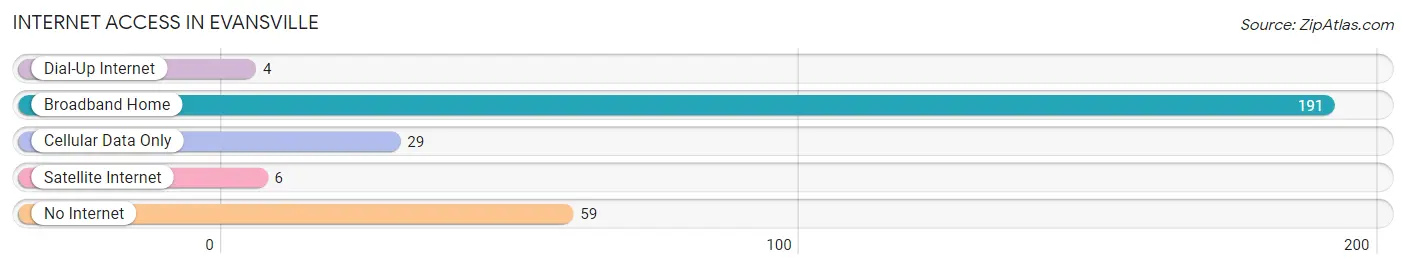
| Internet Type | # Households | % Households |
| Dial-Up Internet | 4 | 1.4% |
| Broadband Home | 191 | 65.2% |
| Cellular Data Only | 29 | 9.9% |
| Satellite Internet | 6 | 2.1% |
| No Internet | 59 | 20.1% |
| Total | 293 | 100.0% |
Evansville Summary
Evansville is a small city located in the state of Minnesota, in the United States. It is situated in the southeastern corner of the state, in the county of Douglas. The city has a population of approximately 1,000 people, and is part of the larger Minneapolis-St. Paul metropolitan area.
Geography
Evansville is located in the southeastern corner of Minnesota, in Douglas County. It is situated on the banks of the Mississippi River, and is surrounded by rolling hills and wooded areas. The city is located approximately 25 miles from the Twin Cities of Minneapolis and St. Paul. The city is also located near the cities of Alexandria and Fergus Falls.
The climate in Evansville is typical of the Midwest, with cold winters and hot summers. The average temperature in the winter is around 20 degrees Fahrenheit, while the average temperature in the summer is around 75 degrees Fahrenheit. The city receives an average of 30 inches of precipitation each year.
Economy
The economy of Evansville is largely based on agriculture and tourism. The city is home to several farms, which produce a variety of crops, including corn, soybeans, and wheat. The city also has a number of small businesses, including restaurants, retail stores, and service providers.
Tourism is also an important part of the economy of Evansville. The city is home to several parks and recreational areas, including the Evansville State Park, which offers camping, fishing, and hiking opportunities. The city also hosts a number of festivals and events throughout the year, including the annual Evansville Days celebration.
Demographics
As of the 2010 census, the population of Evansville was 1,000 people. The racial makeup of the city was 97.2% White, 0.7% African American, 0.3% Native American, 0.2% Asian, 0.1% Pacific Islander, and 1.5% from other races. The median household income in Evansville was $41,250, and the median family income was $50,000.
The population of Evansville is largely made up of families, with the majority of households consisting of married couples. The city also has a large number of retirees, as well as a growing number of young professionals. The city has a low unemployment rate, and the majority of the population is employed in the agricultural and tourism industries.
Conclusion
Evansville is a small city located in the southeastern corner of Minnesota. It is situated on the banks of the Mississippi River, and is surrounded by rolling hills and wooded areas. The city has a population of approximately 1,000 people, and is part of the larger Minneapolis-St. Paul metropolitan area. The economy of Evansville is largely based on agriculture and tourism, and the city is home to several farms, businesses, and recreational areas. The population of Evansville is largely made up of families, with the majority of households consisting of married couples. The city also has a low unemployment rate, and the majority of the population is employed in the agricultural and tourism industries.
Common Questions
What is Per Capita Income in Evansville?
Per Capita income in Evansville is $28,213.
What is the Median Family Income in Evansville?
Median Family Income in Evansville is $62,500.
What is the Median Household income in Evansville?
Median Household Income in Evansville is $48,750.
What is Income or Wage Gap in Evansville?
Income or Wage Gap in Evansville is 16.6%.
Women in Evansville earn 83.4 cents for every dollar earned by a man.
What is Inequality or Gini Index in Evansville?
Inequality or Gini Index in Evansville is 0.44.
What is the Total Population of Evansville?
Total Population of Evansville is 659.
What is the Total Male Population of Evansville?
Total Male Population of Evansville is 306.
What is the Total Female Population of Evansville?
Total Female Population of Evansville is 353.
What is the Ratio of Males per 100 Females in Evansville?
There are 86.69 Males per 100 Females in Evansville.
What is the Ratio of Females per 100 Males in Evansville?
There are 115.36 Females per 100 Males in Evansville.
What is the Median Population Age in Evansville?
Median Population Age in Evansville is 37.7 Years.
What is the Average Family Size in Evansville
Average Family Size in Evansville is 2.9 People.
What is the Average Household Size in Evansville
Average Household Size in Evansville is 2.1 People.
How Large is the Labor Force in Evansville?
There are 305 People in the Labor Forcein in Evansville.
What is the Percentage of People in the Labor Force in Evansville?
58.4% of People are in the Labor Force in Evansville.
What is the Unemployment Rate in Evansville?
Unemployment Rate in Evansville is 3.0%.