Ontonagon County, MI Map & Demographics
Ontonagon County Map
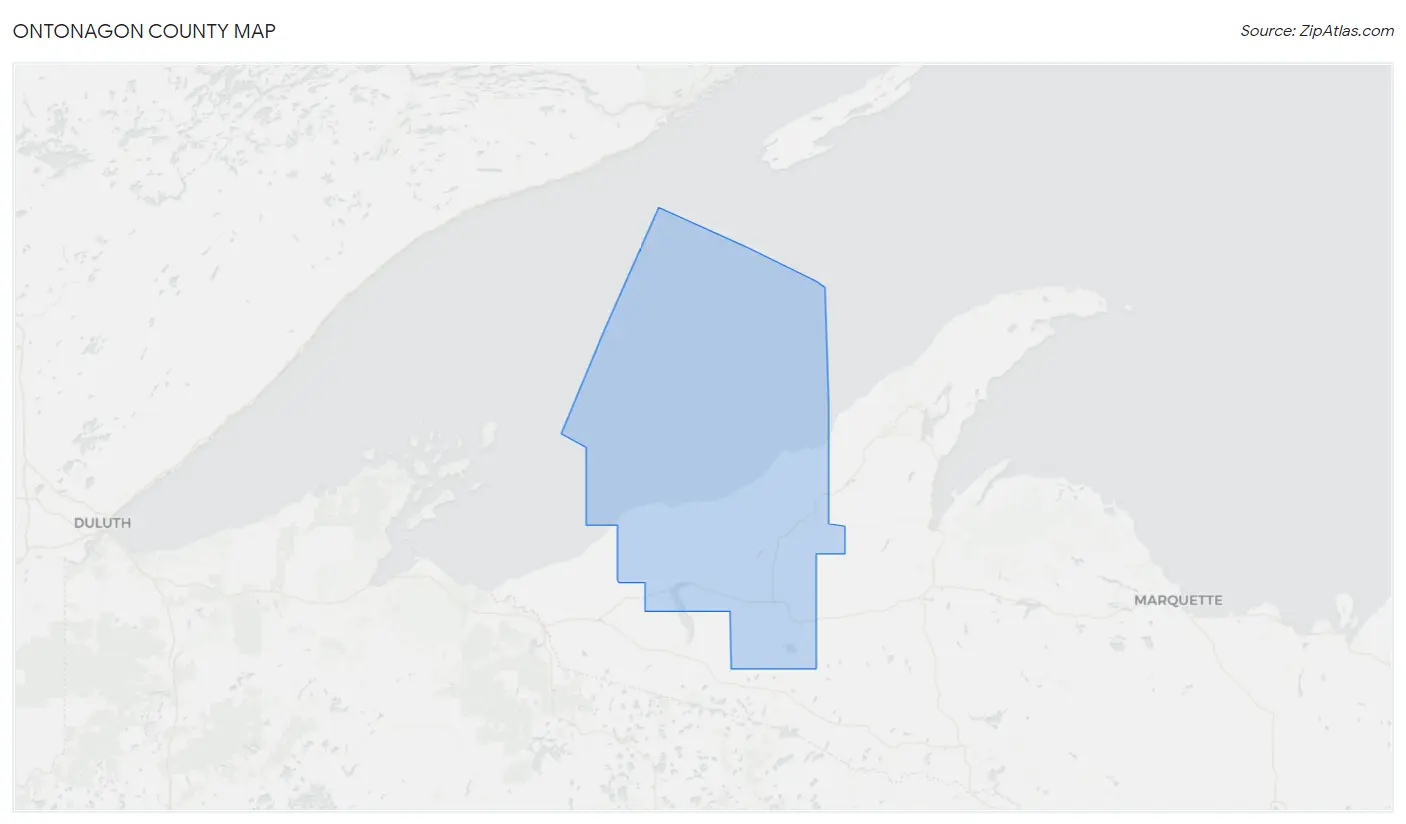
Ontonagon County Overview
$30,182
PER CAPITA INCOME
$64,191
AVG FAMILY INCOME
$48,316
AVG HOUSEHOLD INCOME
35.7%
WAGE / INCOME GAP [ % ]
64.3¢/ $1
WAGE / INCOME GAP [ $ ]
$7,205
FAMILY INCOME DEFICIT
0.41
INEQUALITY / GINI INDEX
5,862
TOTAL POPULATION
3,005
MALE POPULATION
2,857
FEMALE POPULATION
105.18
MALES / 100 FEMALES
95.07
FEMALES / 100 MALES
59.2
MEDIAN AGE
2.5
AVG FAMILY SIZE
2.0
AVG HOUSEHOLD SIZE
2,158
LABOR FORCE [ PEOPLE ]
40.9%
PERCENT IN LABOR FORCE
6.3%
UNEMPLOYMENT RATE
Ontonagon County Area Codes
Income in Ontonagon County
Income Overview in Ontonagon County
Per Capita Income in Ontonagon County is $30,182, while median incomes of families and households are $64,191 and $48,316 respectively.
| Characteristic | Number | Measure |
| Per Capita Income | 5,862 | $30,182 |
| Median Family Income | 1,749 | $64,191 |
| Mean Family Income | 1,749 | $71,297 |
| Median Household Income | 2,872 | $48,316 |
| Mean Household Income | 2,872 | $61,107 |
| Income Deficit | 1,749 | $7,205 |
| Wage / Income Gap (%) | 5,862 | 35.73% |
| Wage / Income Gap ($) | 5,862 | 64.27¢ per $1 |
| Gini / Inequality Index | 5,862 | 0.41 |
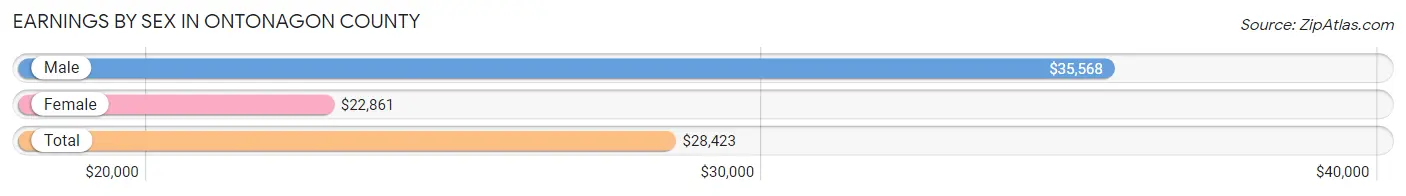
Earnings by Sex in Ontonagon County
Average Earnings in Ontonagon County are $28,423, $35,568 for men and $22,861 for women, a difference of 35.7%.
| Sex | Number | Average Earnings |
| Male | 1,281 (52.5%) | $35,568 |
| Female | 1,159 (47.5%) | $22,861 |
| Total | 2,440 (100.0%) | $28,423 |
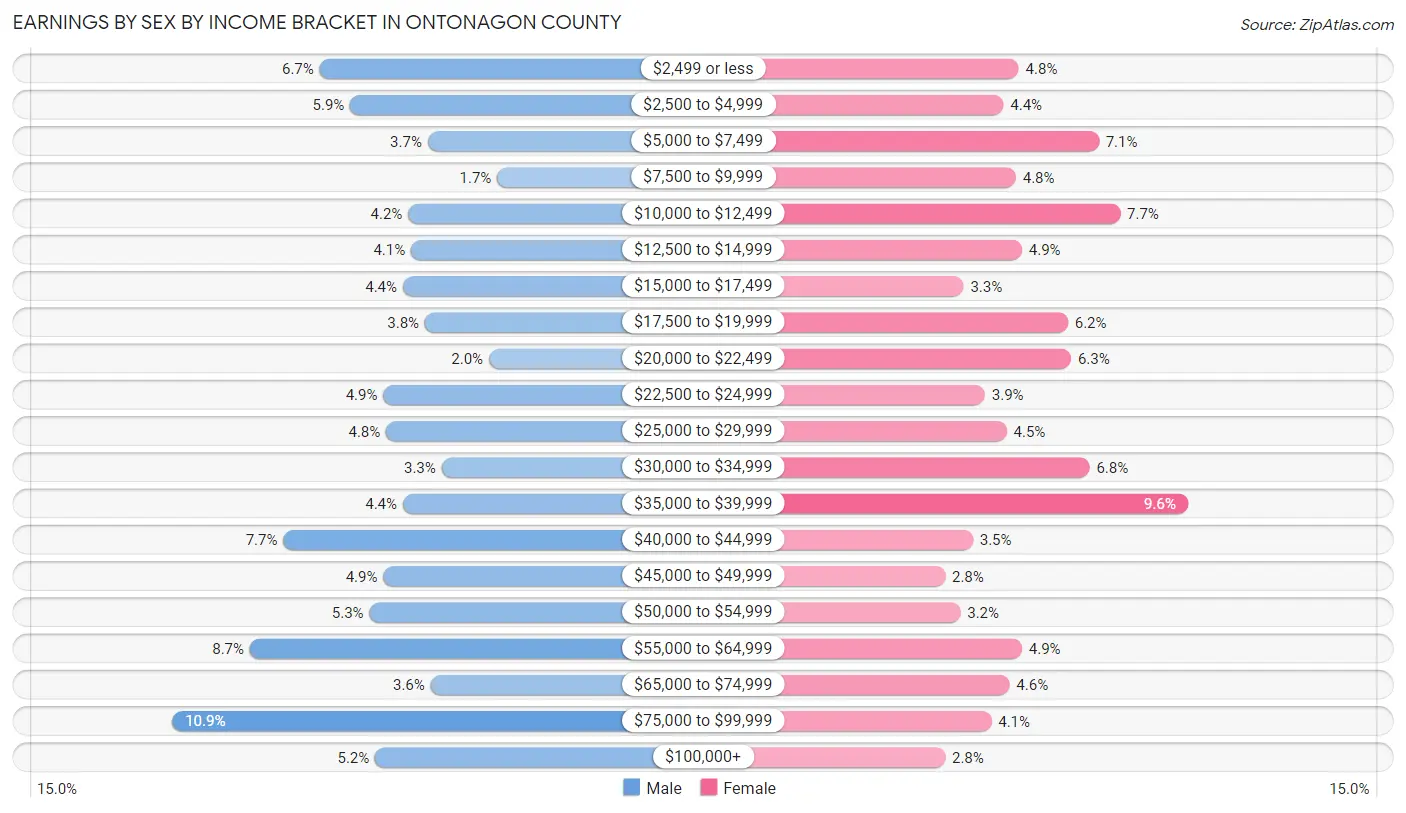
Earnings by Sex by Income Bracket in Ontonagon County
The most common earnings brackets in Ontonagon County are $75,000 to $99,999 for men (139 | 10.8%) and $35,000 to $39,999 for women (111 | 9.6%).
| Income | Male | Female |
| $2,499 or less | 86 (6.7%) | 56 (4.8%) |
| $2,500 to $4,999 | 75 (5.9%) | 51 (4.4%) |
| $5,000 to $7,499 | 47 (3.7%) | 82 (7.1%) |
| $7,500 to $9,999 | 22 (1.7%) | 55 (4.8%) |
| $10,000 to $12,499 | 54 (4.2%) | 89 (7.7%) |
| $12,500 to $14,999 | 53 (4.1%) | 57 (4.9%) |
| $15,000 to $17,499 | 56 (4.4%) | 38 (3.3%) |
| $17,500 to $19,999 | 48 (3.7%) | 72 (6.2%) |
| $20,000 to $22,499 | 25 (1.9%) | 73 (6.3%) |
| $22,500 to $24,999 | 63 (4.9%) | 45 (3.9%) |
| $25,000 to $29,999 | 62 (4.8%) | 52 (4.5%) |
| $30,000 to $34,999 | 42 (3.3%) | 79 (6.8%) |
| $35,000 to $39,999 | 56 (4.4%) | 111 (9.6%) |
| $40,000 to $44,999 | 99 (7.7%) | 41 (3.5%) |
| $45,000 to $49,999 | 63 (4.9%) | 32 (2.8%) |
| $50,000 to $54,999 | 68 (5.3%) | 37 (3.2%) |
| $55,000 to $64,999 | 111 (8.7%) | 57 (4.9%) |
| $65,000 to $74,999 | 46 (3.6%) | 53 (4.6%) |
| $75,000 to $99,999 | 139 (10.8%) | 47 (4.1%) |
| $100,000+ | 66 (5.1%) | 32 (2.8%) |
| Total | 1,281 (100.0%) | 1,159 (100.0%) |
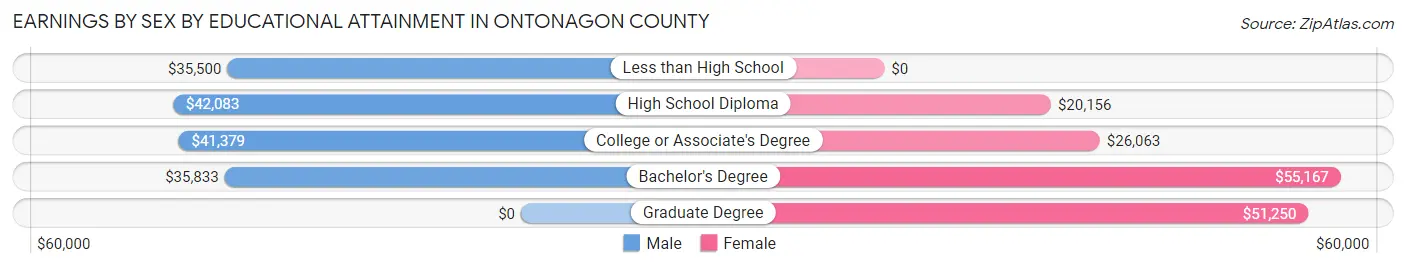
Earnings by Sex by Educational Attainment in Ontonagon County
Average earnings in Ontonagon County are $40,772 for men and $27,700 for women, a difference of 32.1%. Men with an educational attainment of high school diploma enjoy the highest average annual earnings of $42,083, while those with less than high school education earn the least with $35,500. Women with an educational attainment of bachelor's degree earn the most with the average annual earnings of $55,167, while those with high school diploma education have the smallest earnings of $20,156.
| Educational Attainment | Male Income | Female Income |
| Less than High School | $35,500 | $0 |
| High School Diploma | $42,083 | $20,156 |
| College or Associate's Degree | $41,379 | $26,063 |
| Bachelor's Degree | $35,833 | $55,167 |
| Graduate Degree | - | - |
| Total | $40,772 | $27,700 |
Family Income in Ontonagon County
Family Income Brackets in Ontonagon County
According to the Ontonagon County family income data, there are 446 families falling into the $50,000 to $74,999 income range, which is the most common income bracket and makes up 25.5% of all families. Conversely, the $200,000+ income bracket is the least frequent group with only 31 families (1.8%) belonging to this category.
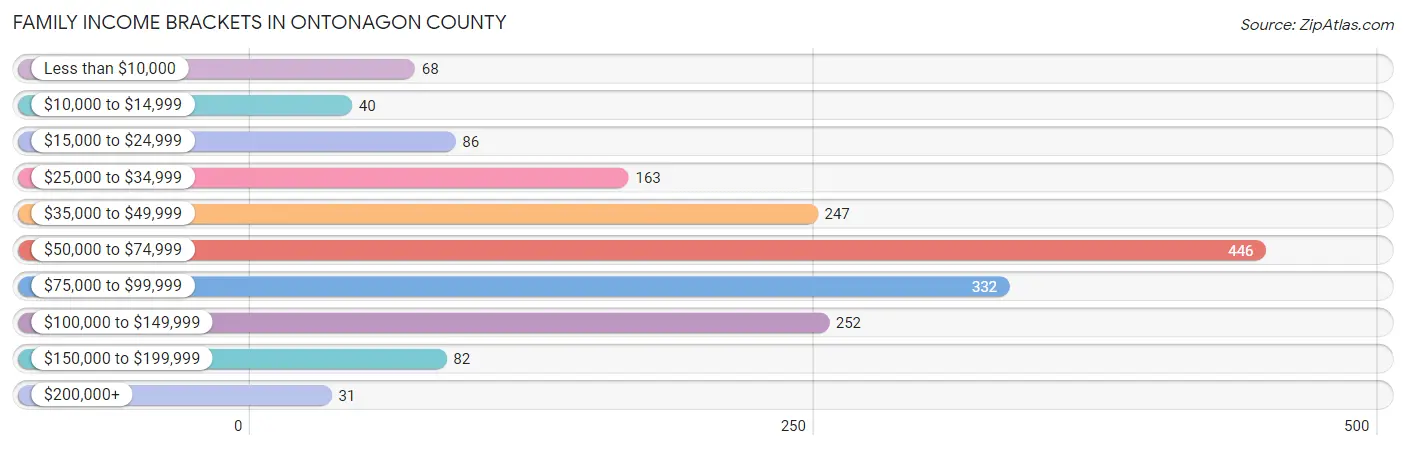
| Income Bracket | # Families | % Families |
| Less than $10,000 | 68 | 3.9% |
| $10,000 to $14,999 | 40 | 2.3% |
| $15,000 to $24,999 | 86 | 4.9% |
| $25,000 to $34,999 | 163 | 9.3% |
| $35,000 to $49,999 | 247 | 14.1% |
| $50,000 to $74,999 | 446 | 25.5% |
| $75,000 to $99,999 | 332 | 19.0% |
| $100,000 to $149,999 | 252 | 14.4% |
| $150,000 to $199,999 | 82 | 4.7% |
| $200,000+ | 31 | 1.8% |
Family Income by Famaliy Size in Ontonagon County
3-person families (221 | 12.6%) account for the highest median family income in Ontonagon County with $80,375 per family, while 2-person families (1,311 | 75.0%) have the highest median income of $29,698 per family member.
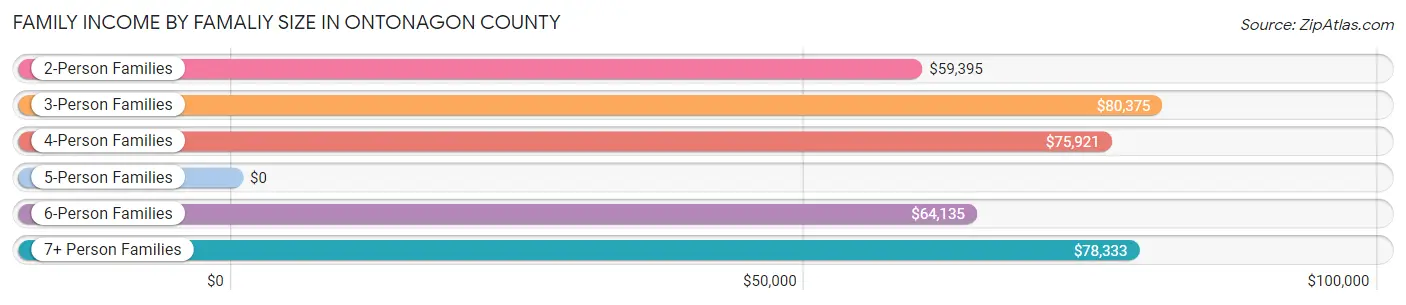
| Income Bracket | # Families | Median Income |
| 2-Person Families | 1,311 (75.0%) | $59,395 |
| 3-Person Families | 221 (12.6%) | $80,375 |
| 4-Person Families | 118 (6.8%) | $75,921 |
| 5-Person Families | 68 (3.9%) | $0 |
| 6-Person Families | 23 (1.3%) | $64,135 |
| 7+ Person Families | 8 (0.5%) | $78,333 |
| Total | 1,749 (100.0%) | $64,191 |
Family Income by Number of Earners in Ontonagon County
The median family income in Ontonagon County is $64,191, with families comprising 3+ earners (81) having the highest median family income of $102,708, while families with no earners (659) have the lowest median family income of $49,813, accounting for 4.6% and 37.7% of families, respectively.
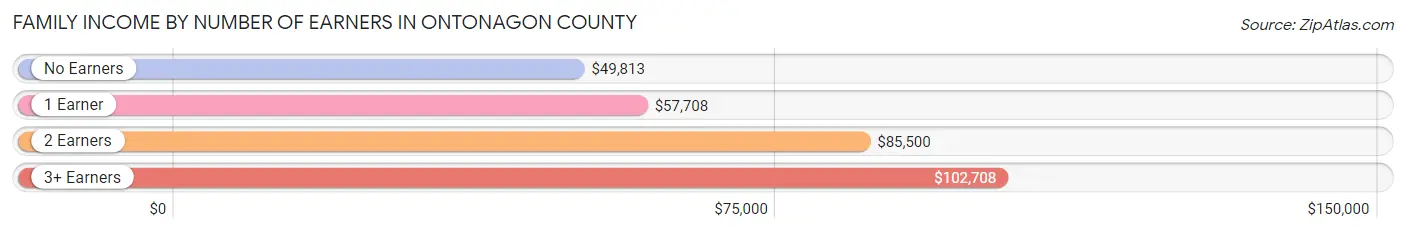
| Number of Earners | # Families | Median Income |
| No Earners | 659 (37.7%) | $49,813 |
| 1 Earner | 533 (30.5%) | $57,708 |
| 2 Earners | 476 (27.2%) | $85,500 |
| 3+ Earners | 81 (4.6%) | $102,708 |
| Total | 1,749 (100.0%) | $64,191 |
Household Income in Ontonagon County
Household Income Brackets in Ontonagon County
With 569 households falling in the category, the $50,000 to $74,999 income range is the most frequent in Ontonagon County, accounting for 19.8% of all households. In contrast, only 46 households (1.6%) fall into the $200,000+ income bracket, making it the least populous group.
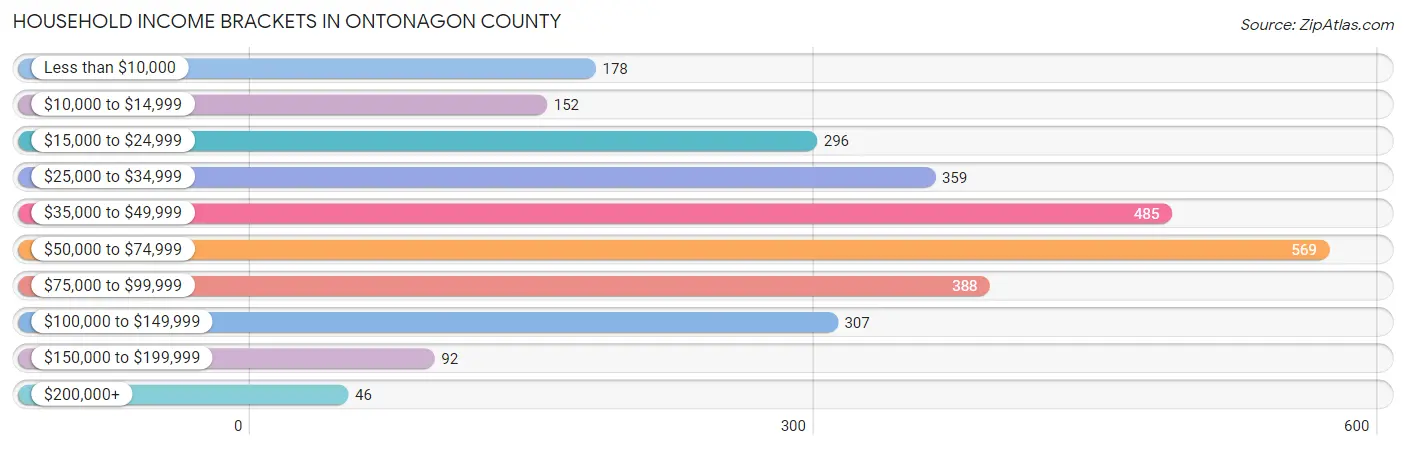
| Income Bracket | # Households | % Households |
| Less than $10,000 | 178 | 6.2% |
| $10,000 to $14,999 | 152 | 5.3% |
| $15,000 to $24,999 | 296 | 10.3% |
| $25,000 to $34,999 | 359 | 12.5% |
| $35,000 to $49,999 | 485 | 16.9% |
| $50,000 to $74,999 | 569 | 19.8% |
| $75,000 to $99,999 | 388 | 13.5% |
| $100,000 to $149,999 | 307 | 10.7% |
| $150,000 to $199,999 | 92 | 3.2% |
| $200,000+ | 46 | 1.6% |
Household Income by Householder Age in Ontonagon County
The median household income in Ontonagon County is $48,316, with the highest median household income of $57,813 found in the 25 to 44 years age bracket for the primary householder. A total of 386 households (13.4%) fall into this category. Meanwhile, the 15 to 24 years age bracket for the primary householder has the lowest median household income of $0, with 11 households (0.4%) in this group.
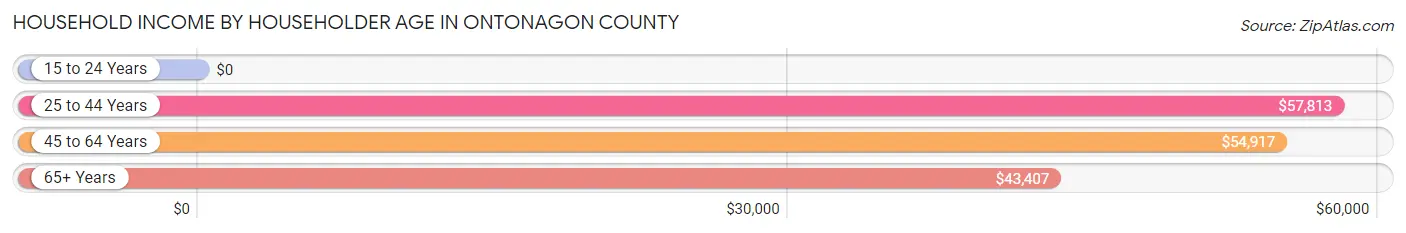
| Income Bracket | # Households | Median Income |
| 15 to 24 Years | 11 (0.4%) | $0 |
| 25 to 44 Years | 386 (13.4%) | $57,813 |
| 45 to 64 Years | 1,122 (39.1%) | $54,917 |
| 65+ Years | 1,353 (47.1%) | $43,407 |
| Total | 2,872 (100.0%) | $48,316 |
Poverty in Ontonagon County
Income Below Poverty by Sex and Age in Ontonagon County
With 10.9% poverty level for males and 16.6% for females among the residents of Ontonagon County, 12 to 14 year old males and 15 year old females are the most vulnerable to poverty, with 28 males (32.2%) and 24 females (48.0%) in their respective age groups living below the poverty level.
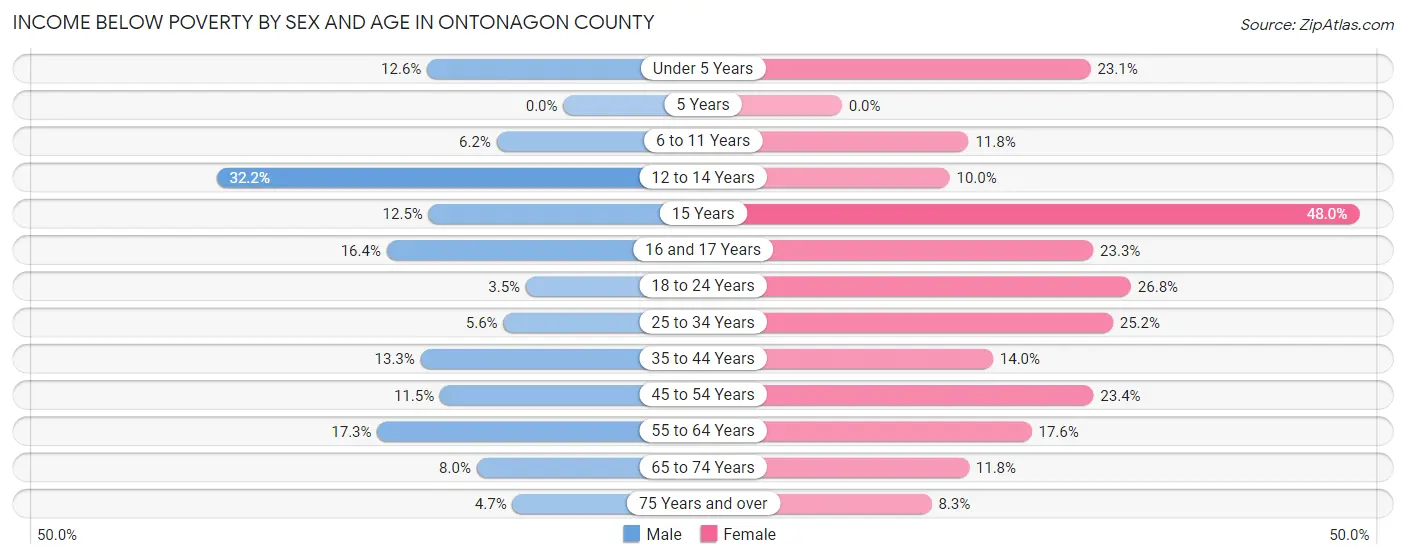
| Age Bracket | Male | Female |
| Under 5 Years | 11 (12.6%) | 15 (23.1%) |
| 5 Years | 0 (0.0%) | 0 (0.0%) |
| 6 to 11 Years | 6 (6.2%) | 14 (11.8%) |
| 12 to 14 Years | 28 (32.2%) | 6 (10.0%) |
| 15 Years | 2 (12.5%) | 24 (48.0%) |
| 16 and 17 Years | 10 (16.4%) | 7 (23.3%) |
| 18 to 24 Years | 5 (3.5%) | 44 (26.8%) |
| 25 to 34 Years | 10 (5.6%) | 42 (25.2%) |
| 35 to 44 Years | 31 (13.3%) | 30 (14.0%) |
| 45 to 54 Years | 38 (11.5%) | 78 (23.4%) |
| 55 to 64 Years | 106 (17.3%) | 106 (17.6%) |
| 65 to 74 Years | 55 (8.0%) | 68 (11.8%) |
| 75 Years and over | 20 (4.7%) | 38 (8.3%) |
| Total | 322 (10.9%) | 472 (16.6%) |
Income Above Poverty by Sex and Age in Ontonagon County
According to the poverty statistics in Ontonagon County, males aged 5 years and females aged 75 years and over are the age groups that are most secure financially, with 100.0% of males and 91.7% of females in these age groups living above the poverty line.
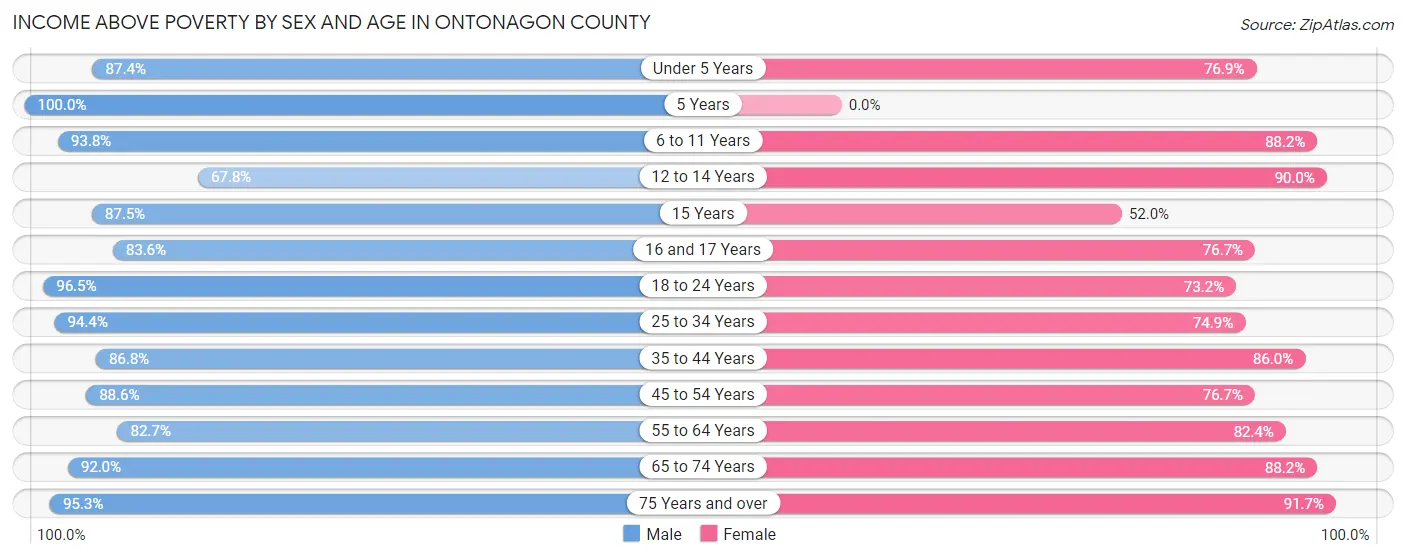
| Age Bracket | Male | Female |
| Under 5 Years | 76 (87.4%) | 50 (76.9%) |
| 5 Years | 4 (100.0%) | 0 (0.0%) |
| 6 to 11 Years | 91 (93.8%) | 105 (88.2%) |
| 12 to 14 Years | 59 (67.8%) | 54 (90.0%) |
| 15 Years | 14 (87.5%) | 26 (52.0%) |
| 16 and 17 Years | 51 (83.6%) | 23 (76.7%) |
| 18 to 24 Years | 139 (96.5%) | 120 (73.2%) |
| 25 to 34 Years | 170 (94.4%) | 125 (74.9%) |
| 35 to 44 Years | 203 (86.8%) | 184 (86.0%) |
| 45 to 54 Years | 294 (88.5%) | 256 (76.6%) |
| 55 to 64 Years | 508 (82.7%) | 496 (82.4%) |
| 65 to 74 Years | 629 (92.0%) | 509 (88.2%) |
| 75 Years and over | 404 (95.3%) | 419 (91.7%) |
| Total | 2,642 (89.1%) | 2,367 (83.4%) |
Income Below Poverty Among Married-Couple Families in Ontonagon County
The poverty statistics for married-couple families in Ontonagon County show that 8.8% or 127 of the total 1,438 families live below the poverty line. Families with 1 or 2 children have the highest poverty rate of 25.1%, comprising of 45 families. On the other hand, families with 3 or 4 children have the lowest poverty rate of 0.0%, which includes 0 families.
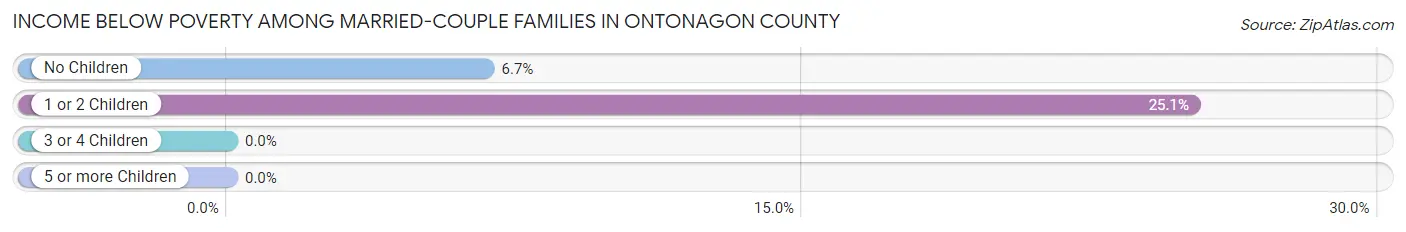
| Children | Above Poverty | Below Poverty |
| No Children | 1,141 (93.3%) | 82 (6.7%) |
| 1 or 2 Children | 134 (74.9%) | 45 (25.1%) |
| 3 or 4 Children | 30 (100.0%) | 0 (0.0%) |
| 5 or more Children | 6 (100.0%) | 0 (0.0%) |
| Total | 1,311 (91.2%) | 127 (8.8%) |
Income Below Poverty Among Single-Parent Households in Ontonagon County
According to the poverty data in Ontonagon County, 7.3% or 9 single-father households and 22.5% or 42 single-mother households are living below the poverty line. Among single-father households, those with 1 or 2 children have the highest poverty rate, with 8 households (21.6%) experiencing poverty. Likewise, among single-mother households, those with 3 or 4 children have the highest poverty rate, with 8 households (53.3%) falling below the poverty line.
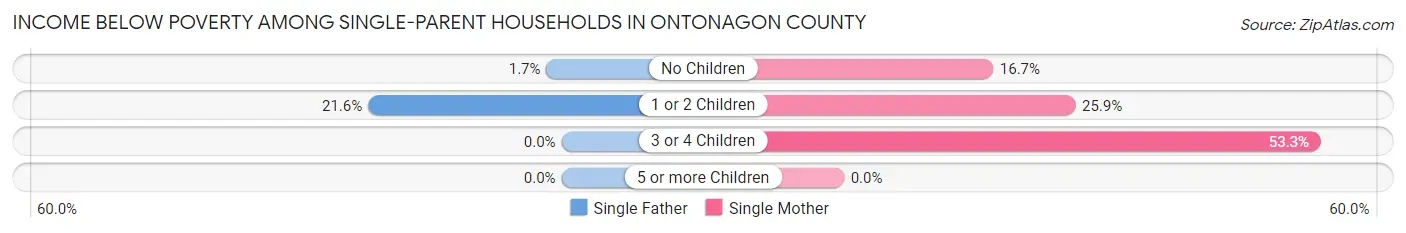
| Children | Single Father | Single Mother |
| No Children | 1 (1.7%) | 19 (16.7%) |
| 1 or 2 Children | 8 (21.6%) | 15 (25.9%) |
| 3 or 4 Children | 0 (0.0%) | 8 (53.3%) |
| 5 or more Children | 0 (0.0%) | 0 (0.0%) |
| Total | 9 (7.3%) | 42 (22.5%) |
Income Below Poverty Among Married-Couple vs Single-Parent Households in Ontonagon County
The poverty data for Ontonagon County shows that 127 of the married-couple family households (8.8%) and 51 of the single-parent households (16.4%) are living below the poverty level. Within the married-couple family households, those with 1 or 2 children have the highest poverty rate, with 45 households (25.1%) falling below the poverty line. Among the single-parent households, those with 3 or 4 children have the highest poverty rate, with 8 household (26.7%) living below poverty.
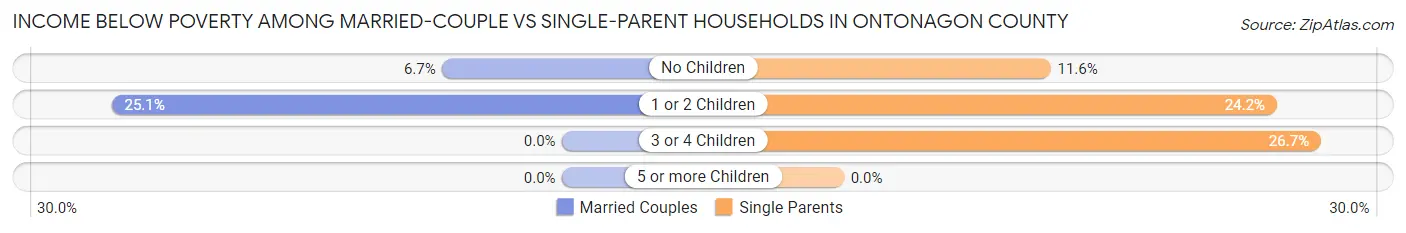
| Children | Married-Couple Families | Single-Parent Households |
| No Children | 82 (6.7%) | 20 (11.6%) |
| 1 or 2 Children | 45 (25.1%) | 23 (24.2%) |
| 3 or 4 Children | 0 (0.0%) | 8 (26.7%) |
| 5 or more Children | 0 (0.0%) | 0 (0.0%) |
| Total | 127 (8.8%) | 51 (16.4%) |
Race in Ontonagon County
The most populous races in Ontonagon County are White / Caucasian (5,539 | 94.5%), Two or more Races (194 | 3.3%), and Hispanic or Latino (92 | 1.6%).
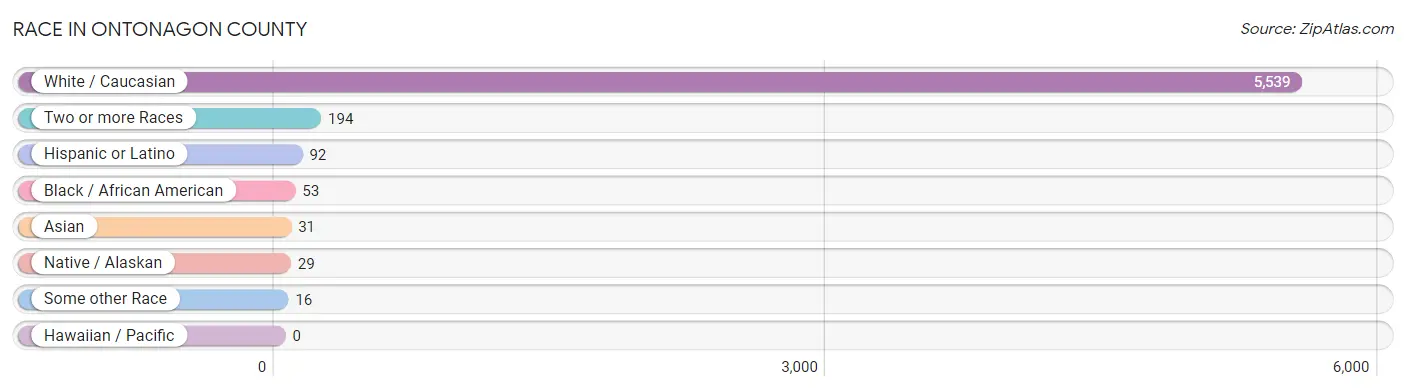
| Race | # Population | % Population |
| Asian | 31 | 0.5% |
| Black / African American | 53 | 0.9% |
| Hawaiian / Pacific | 0 | 0.0% |
| Hispanic or Latino | 92 | 1.6% |
| Native / Alaskan | 29 | 0.5% |
| White / Caucasian | 5,539 | 94.5% |
| Two or more Races | 194 | 3.3% |
| Some other Race | 16 | 0.3% |
| Total | 5,862 | 100.0% |
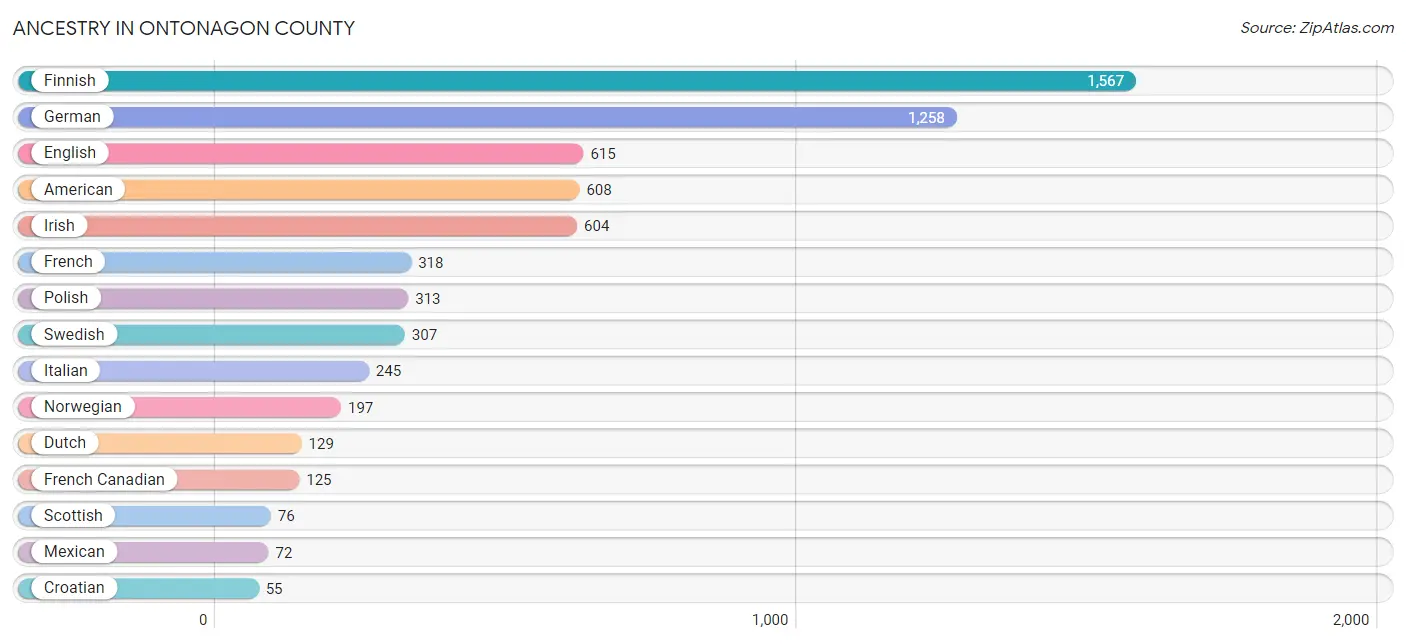
Ancestry in Ontonagon County
The most populous ancestries reported in Ontonagon County are Finnish (1,567 | 26.7%), German (1,258 | 21.5%), English (615 | 10.5%), American (608 | 10.4%), and Irish (604 | 10.3%), together accounting for 79.3% of all Ontonagon County residents.
| Ancestry | # Population | % Population |
| African | 1 | 0.0% |
| American | 608 | 10.4% |
| Apache | 1 | 0.0% |
| Arab | 1 | 0.0% |
| Armenian | 3 | 0.1% |
| Austrian | 17 | 0.3% |
| Belgian | 16 | 0.3% |
| Bhutanese | 19 | 0.3% |
| British | 15 | 0.3% |
| Burmese | 9 | 0.2% |
| Canadian | 14 | 0.2% |
| Celtic | 2 | 0.0% |
| Central American | 1 | 0.0% |
| Central American Indian | 1 | 0.0% |
| Cherokee | 4 | 0.1% |
| Chippewa | 54 | 0.9% |
| Choctaw | 1 | 0.0% |
| Creek | 1 | 0.0% |
| Croatian | 55 | 0.9% |
| Czech | 47 | 0.8% |
| Czechoslovakian | 2 | 0.0% |
| Danish | 52 | 0.9% |
| Dutch | 129 | 2.2% |
| Eastern European | 13 | 0.2% |
| English | 615 | 10.5% |
| European | 33 | 0.6% |
| Finnish | 1,567 | 26.7% |
| French | 318 | 5.4% |
| French Canadian | 125 | 2.1% |
| German | 1,258 | 21.5% |
| Greek | 18 | 0.3% |
| Guatemalan | 1 | 0.0% |
| Hungarian | 15 | 0.3% |
| Icelander | 2 | 0.0% |
| Indian (Asian) | 4 | 0.1% |
| Irish | 604 | 10.3% |
| Italian | 245 | 4.2% |
| Korean | 17 | 0.3% |
| Lebanese | 1 | 0.0% |
| Lithuanian | 28 | 0.5% |
| Mexican | 72 | 1.2% |
| Northern European | 3 | 0.1% |
| Norwegian | 197 | 3.4% |
| Ottawa | 2 | 0.0% |
| Pennsylvania German | 2 | 0.0% |
| Polish | 313 | 5.3% |
| Puerto Rican | 6 | 0.1% |
| Russian | 43 | 0.7% |
| Scandinavian | 22 | 0.4% |
| Scotch-Irish | 17 | 0.3% |
| Scottish | 76 | 1.3% |
| Serbian | 5 | 0.1% |
| Slovak | 11 | 0.2% |
| Spaniard | 11 | 0.2% |
| Subsaharan African | 1 | 0.0% |
| Swedish | 307 | 5.2% |
| Swiss | 42 | 0.7% |
| Ukrainian | 6 | 0.1% |
| Welsh | 29 | 0.5% | View All 59 Rows |
Immigrants in Ontonagon County
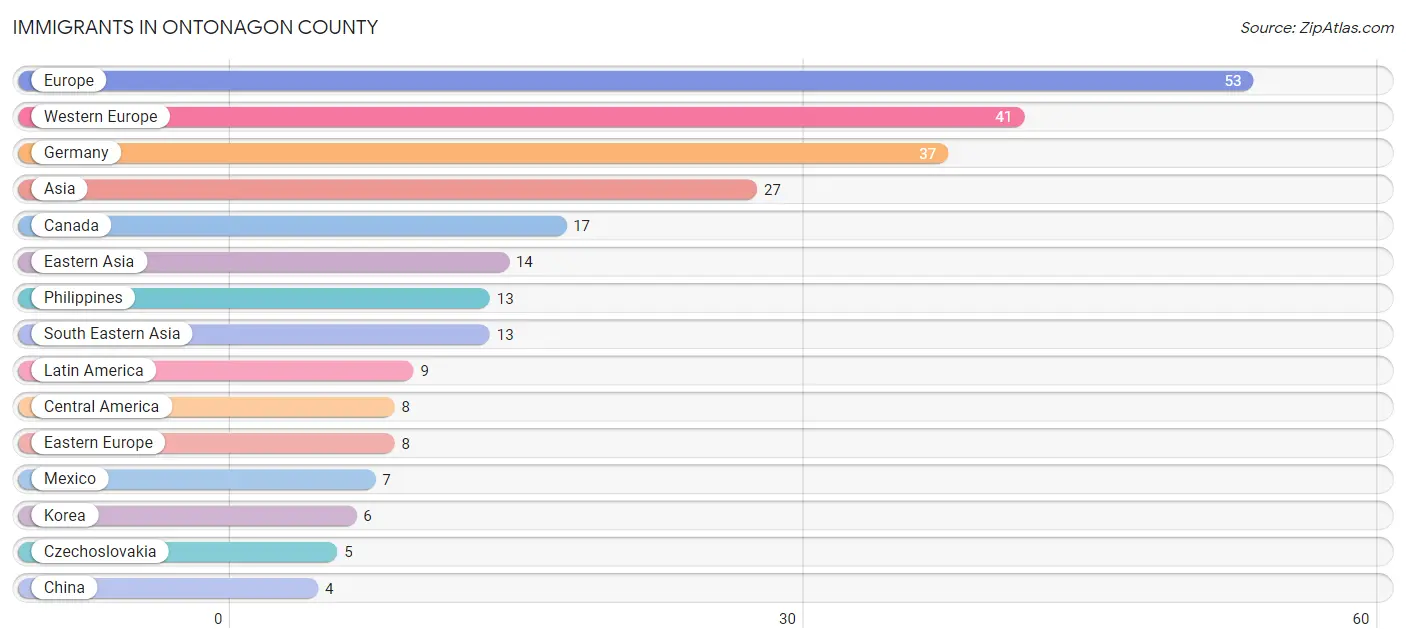
The most numerous immigrant groups reported in Ontonagon County came from Europe (53 | 0.9%), Western Europe (41 | 0.7%), Germany (37 | 0.6%), Asia (27 | 0.5%), and Canada (17 | 0.3%), together accounting for 3.0% of all Ontonagon County residents.
| Immigration Origin | # Population | % Population |
| Asia | 27 | 0.5% |
| Belgium | 2 | 0.0% |
| Canada | 17 | 0.3% |
| Caribbean | 1 | 0.0% |
| Central America | 8 | 0.1% |
| China | 4 | 0.1% |
| Cuba | 1 | 0.0% |
| Czechoslovakia | 5 | 0.1% |
| Eastern Asia | 14 | 0.2% |
| Eastern Europe | 8 | 0.1% |
| England | 3 | 0.1% |
| Europe | 53 | 0.9% |
| Germany | 37 | 0.6% |
| Guatemala | 1 | 0.0% |
| Hungary | 3 | 0.1% |
| Ireland | 1 | 0.0% |
| Japan | 4 | 0.1% |
| Korea | 6 | 0.1% |
| Latin America | 9 | 0.2% |
| Mexico | 7 | 0.1% |
| Netherlands | 2 | 0.0% |
| Northern Europe | 4 | 0.1% |
| Philippines | 13 | 0.2% |
| South Eastern Asia | 13 | 0.2% |
| Western Europe | 41 | 0.7% | View All 25 Rows |
Sex and Age in Ontonagon County
Sex and Age in Ontonagon County
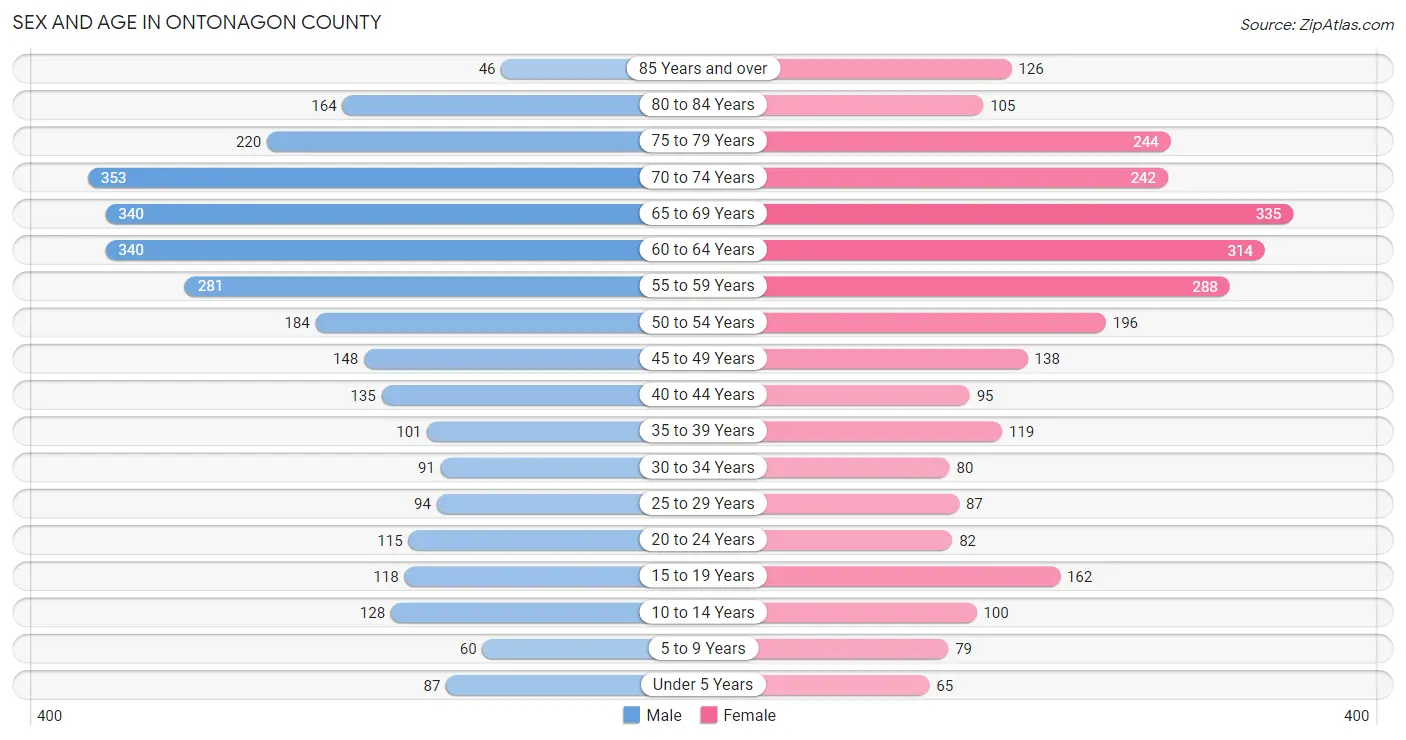
The most populous age groups in Ontonagon County are 70 to 74 Years (353 | 11.7%) for men and 65 to 69 Years (335 | 11.7%) for women.
| Age Bracket | Male | Female |
| Under 5 Years | 87 (2.9%) | 65 (2.3%) |
| 5 to 9 Years | 60 (2.0%) | 79 (2.8%) |
| 10 to 14 Years | 128 (4.3%) | 100 (3.5%) |
| 15 to 19 Years | 118 (3.9%) | 162 (5.7%) |
| 20 to 24 Years | 115 (3.8%) | 82 (2.9%) |
| 25 to 29 Years | 94 (3.1%) | 87 (3.0%) |
| 30 to 34 Years | 91 (3.0%) | 80 (2.8%) |
| 35 to 39 Years | 101 (3.4%) | 119 (4.2%) |
| 40 to 44 Years | 135 (4.5%) | 95 (3.3%) |
| 45 to 49 Years | 148 (4.9%) | 138 (4.8%) |
| 50 to 54 Years | 184 (6.1%) | 196 (6.9%) |
| 55 to 59 Years | 281 (9.3%) | 288 (10.1%) |
| 60 to 64 Years | 340 (11.3%) | 314 (11.0%) |
| 65 to 69 Years | 340 (11.3%) | 335 (11.7%) |
| 70 to 74 Years | 353 (11.7%) | 242 (8.5%) |
| 75 to 79 Years | 220 (7.3%) | 244 (8.5%) |
| 80 to 84 Years | 164 (5.5%) | 105 (3.7%) |
| 85 Years and over | 46 (1.5%) | 126 (4.4%) |
| Total | 3,005 (100.0%) | 2,857 (100.0%) |
Families and Households in Ontonagon County
Median Family Size in Ontonagon County
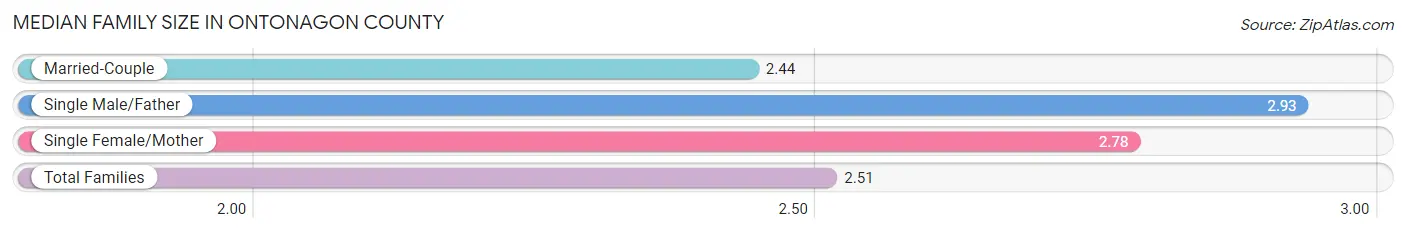
The median family size in Ontonagon County is 2.51 persons per family, with single male/father families (124 | 7.1%) accounting for the largest median family size of 2.93 persons per family. On the other hand, married-couple families (1,438 | 82.2%) represent the smallest median family size with 2.44 persons per family.
| Family Type | # Families | Family Size |
| Married-Couple | 1,438 (82.2%) | 2.44 |
| Single Male/Father | 124 (7.1%) | 2.93 |
| Single Female/Mother | 187 (10.7%) | 2.78 |
| Total Families | 1,749 (100.0%) | 2.51 |
Median Household Size in Ontonagon County
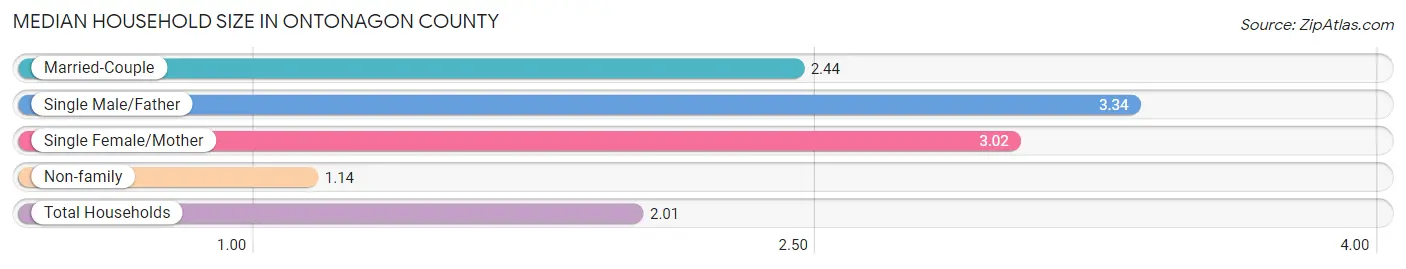
The median household size in Ontonagon County is 2.01 persons per household, with single male/father households (124 | 4.3%) accounting for the largest median household size of 3.34 persons per household. non-family households (1,123 | 39.1%) represent the smallest median household size with 1.14 persons per household.
| Household Type | # Households | Household Size |
| Married-Couple | 1,438 (50.1%) | 2.44 |
| Single Male/Father | 124 (4.3%) | 3.34 |
| Single Female/Mother | 187 (6.5%) | 3.02 |
| Non-family | 1,123 (39.1%) | 1.14 |
| Total Households | 2,872 (100.0%) | 2.01 |
Household Size by Marriage Status in Ontonagon County
Out of a total of 2,872 households in Ontonagon County, 1,749 (60.9%) are family households, while 1,123 (39.1%) are nonfamily households. The most numerous type of family households are 2-person households, comprising 1,278, and the most common type of nonfamily households are 1-person households, comprising 979.
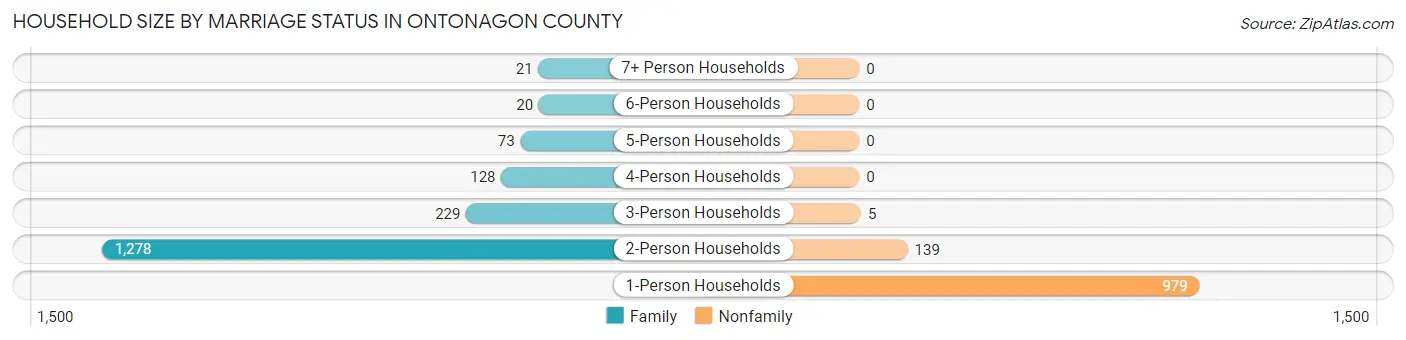
| Household Size | Family Households | Nonfamily Households |
| 1-Person Households | - | 979 (34.1%) |
| 2-Person Households | 1,278 (44.5%) | 139 (4.8%) |
| 3-Person Households | 229 (8.0%) | 5 (0.2%) |
| 4-Person Households | 128 (4.5%) | 0 (0.0%) |
| 5-Person Households | 73 (2.5%) | 0 (0.0%) |
| 6-Person Households | 20 (0.7%) | 0 (0.0%) |
| 7+ Person Households | 21 (0.7%) | 0 (0.0%) |
| Total | 1,749 (60.9%) | 1,123 (39.1%) |
Female Fertility in Ontonagon County
Fertility by Age in Ontonagon County
Average fertility rate in Ontonagon County is 34.0 births per 1,000 women. Women in the age bracket of 20 to 34 years have the highest fertility rate with 104.0 births per 1,000 women. Women in the age bracket of 20 to 34 years acount for 96.3% of all women with births.
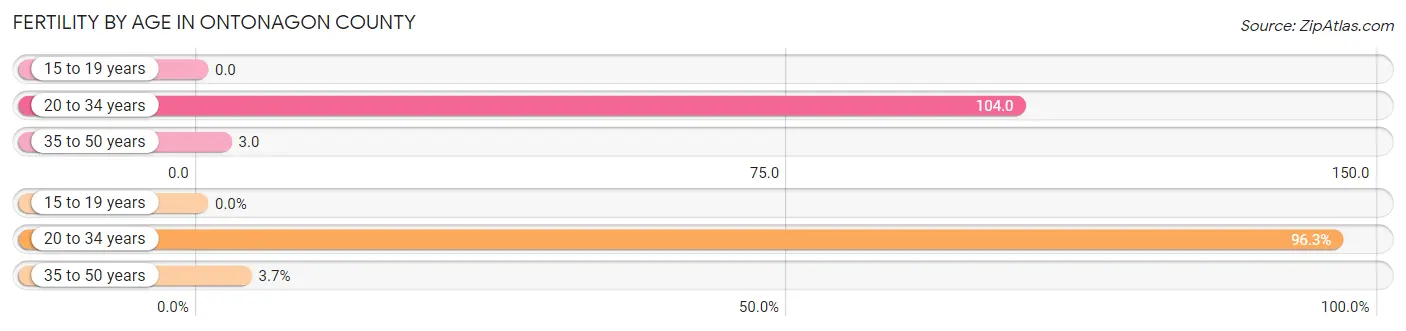
| Age Bracket | Women with Births | Births / 1,000 Women |
| 15 to 19 years | 0 (0.0%) | 0.0 |
| 20 to 34 years | 26 (96.3%) | 104.0 |
| 35 to 50 years | 1 (3.7%) | 3.0 |
| Total | 27 (100.0%) | 34.0 |
Fertility by Age by Marriage Status in Ontonagon County
14.8% of women with births (27) in Ontonagon County are married. The highest percentage of unmarried women with births falls into 20 to 34 years age bracket with 88.5% of them unmarried at the time of birth, while the lowest percentage of unmarried women with births belong to 35 to 50 years age bracket with 0.0% of them unmarried.
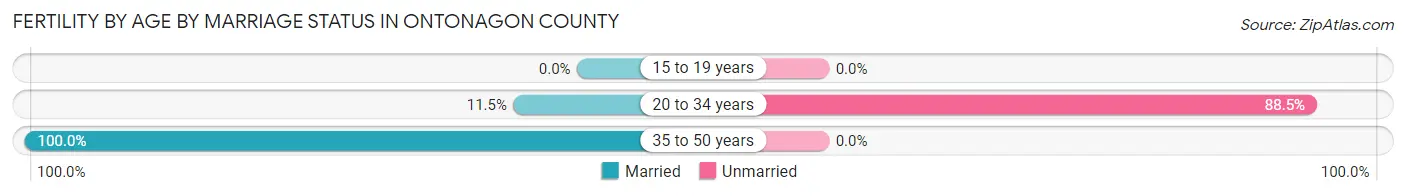
| Age Bracket | Married | Unmarried |
| 15 to 19 years | 0 (0.0%) | 0 (0.0%) |
| 20 to 34 years | 3 (11.5%) | 23 (88.5%) |
| 35 to 50 years | 1 (100.0%) | 0 (0.0%) |
| Total | 4 (14.8%) | 23 (85.2%) |
Fertility by Education in Ontonagon County
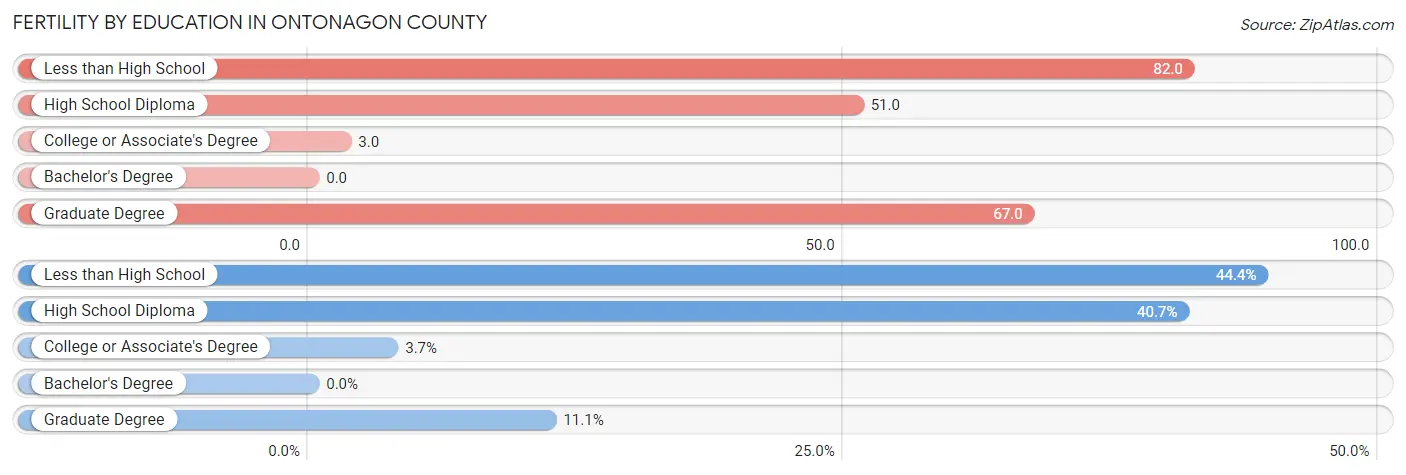
| Educational Attainment | Women with Births | Births / 1,000 Women |
| Less than High School | 12 (44.4%) | 82.0 |
| High School Diploma | 11 (40.7%) | 51.0 |
| College or Associate's Degree | 1 (3.7%) | 3.0 |
| Bachelor's Degree | 0 (0.0%) | 0.0 |
| Graduate Degree | 3 (11.1%) | 67.0 |
| Total | 27 (100.0%) | 34.0 |
Fertility by Education by Marriage Status in Ontonagon County
85.2% of women with births in Ontonagon County are unmarried. Women with the educational attainment of college or associate's degree are most likely to be married with 100.0% of them married at childbirth, while women with the educational attainment of less than high school are least likely to be married with 100.0% of them unmarried at childbirth.
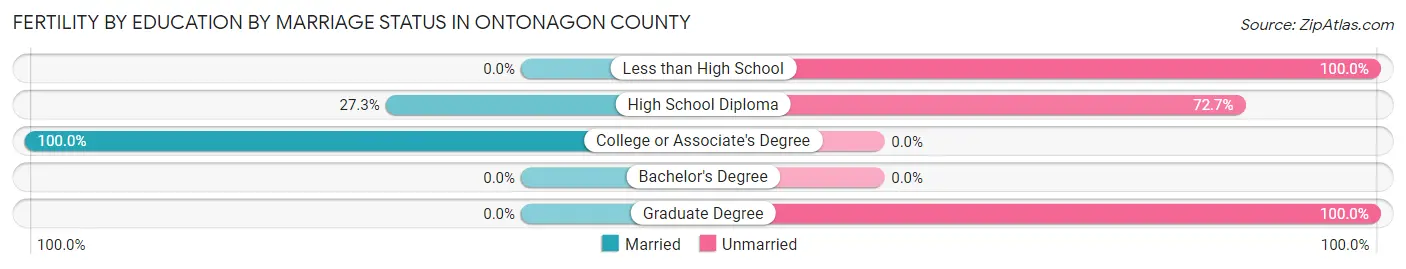
| Educational Attainment | Married | Unmarried |
| Less than High School | 0 (0.0%) | 12 (100.0%) |
| High School Diploma | 3 (27.3%) | 8 (72.7%) |
| College or Associate's Degree | 1 (100.0%) | 0 (0.0%) |
| Bachelor's Degree | 0 (0.0%) | 0 (0.0%) |
| Graduate Degree | 0 (0.0%) | 3 (100.0%) |
| Total | 4 (14.8%) | 23 (85.2%) |
Employment Characteristics in Ontonagon County
Employment by Class of Employer in Ontonagon County
Among the 1,992 employed individuals in Ontonagon County, private company employees (1,072 | 53.8%), local government employees (328 | 16.5%), and not-for-profit organizations (187 | 9.4%) make up the most common classes of employment.
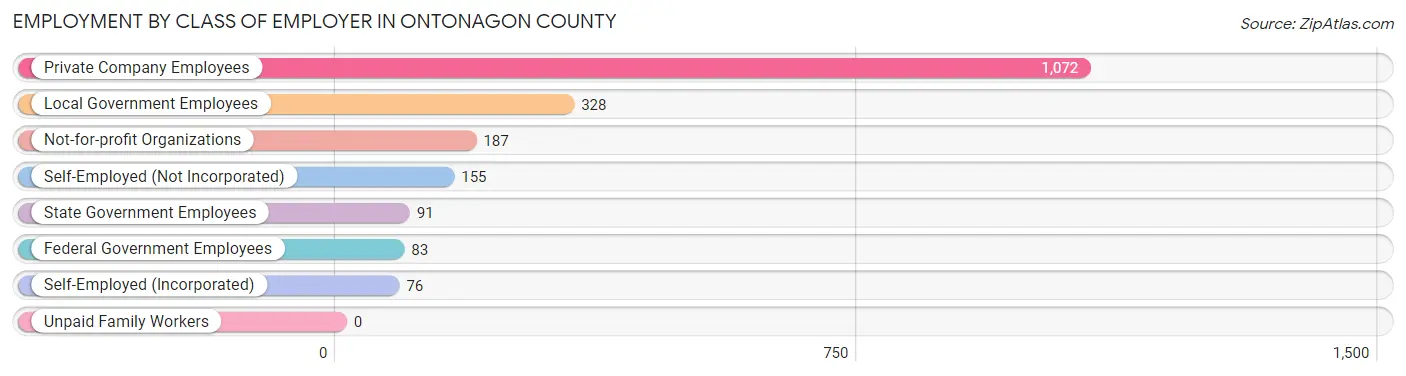
| Employer Class | # Employees | % Employees |
| Private Company Employees | 1,072 | 53.8% |
| Self-Employed (Incorporated) | 76 | 3.8% |
| Self-Employed (Not Incorporated) | 155 | 7.8% |
| Not-for-profit Organizations | 187 | 9.4% |
| Local Government Employees | 328 | 16.5% |
| State Government Employees | 91 | 4.6% |
| Federal Government Employees | 83 | 4.2% |
| Unpaid Family Workers | 0 | 0.0% |
| Total | 1,992 | 100.0% |
Employment Status by Age in Ontonagon County
According to the labor force statistics for Ontonagon County, out of the total population over 16 years of age (5,277), 40.9% or 2,158 individuals are in the labor force, with 6.3% or 136 of them unemployed. The age group with the highest labor force participation rate is 25 to 29 years, with 85.6% or 155 individuals in the labor force. Within the labor force, the 20 to 24 years age range has the highest percentage of unemployed individuals, with 22.0% or 28 of them being unemployed.
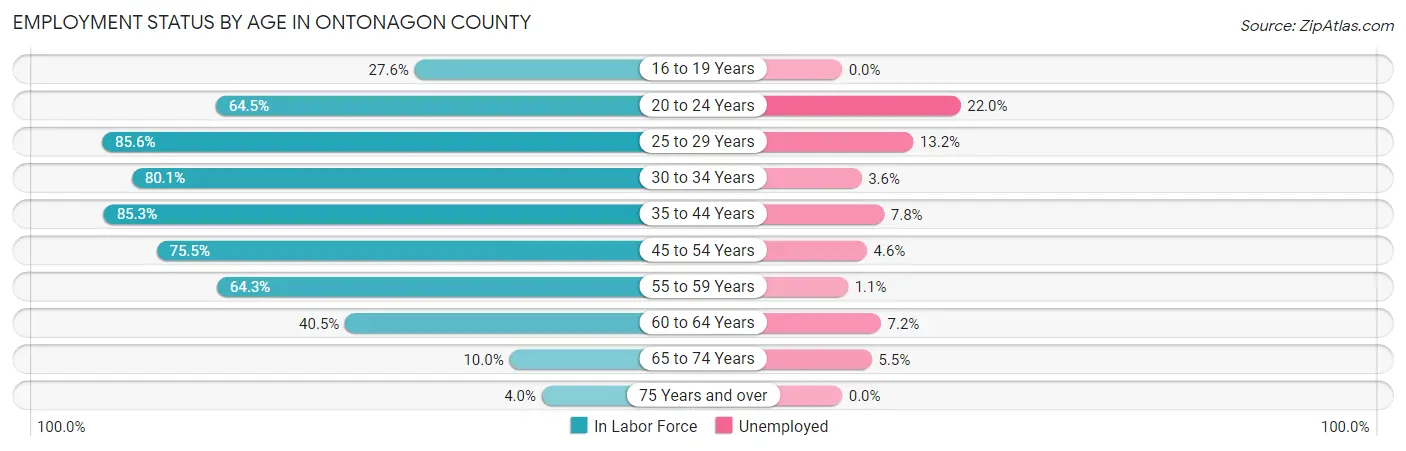
| Age Bracket | In Labor Force | Unemployed |
| 16 to 19 Years | 59 (27.6%) | 0 (0.0%) |
| 20 to 24 Years | 127 (64.5%) | 28 (22.0%) |
| 25 to 29 Years | 155 (85.6%) | 20 (13.2%) |
| 30 to 34 Years | 137 (80.1%) | 5 (3.6%) |
| 35 to 44 Years | 384 (85.3%) | 30 (7.8%) |
| 45 to 54 Years | 503 (75.5%) | 23 (4.6%) |
| 55 to 59 Years | 366 (64.3%) | 4 (1.1%) |
| 60 to 64 Years | 265 (40.5%) | 19 (7.2%) |
| 65 to 74 Years | 127 (10.0%) | 7 (5.5%) |
| 75 Years and over | 36 (4.0%) | 0 (0.0%) |
| Total | 2,158 (40.9%) | 136 (6.3%) |
Employment Status by Educational Attainment in Ontonagon County
According to labor force statistics for Ontonagon County, 67.3% of individuals (1,811) out of the total population between 25 and 64 years of age (2,691) are in the labor force, with 5.6% or 101 of them being unemployed. The group with the highest labor force participation rate are those with the educational attainment of bachelor's degree or higher, with 75.2% or 291 individuals in the labor force. Within the labor force, individuals with less than high school education have the highest percentage of unemployment, with 9.5% or 7 of them being unemployed.
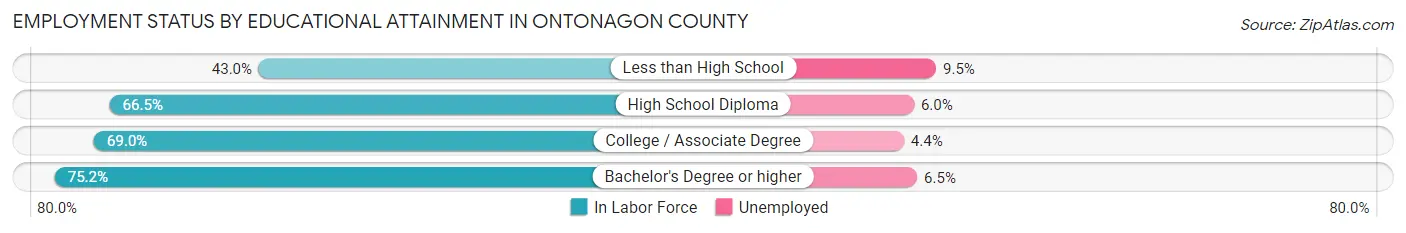
| Educational Attainment | In Labor Force | Unemployed |
| Less than High School | 74 (43.0%) | 16 (9.5%) |
| High School Diploma | 711 (66.5%) | 64 (6.0%) |
| College / Associate Degree | 733 (69.0%) | 47 (4.4%) |
| Bachelor's Degree or higher | 291 (75.2%) | 25 (6.5%) |
| Total | 1,811 (67.3%) | 151 (5.6%) |
Employment Occupations by Sex in Ontonagon County
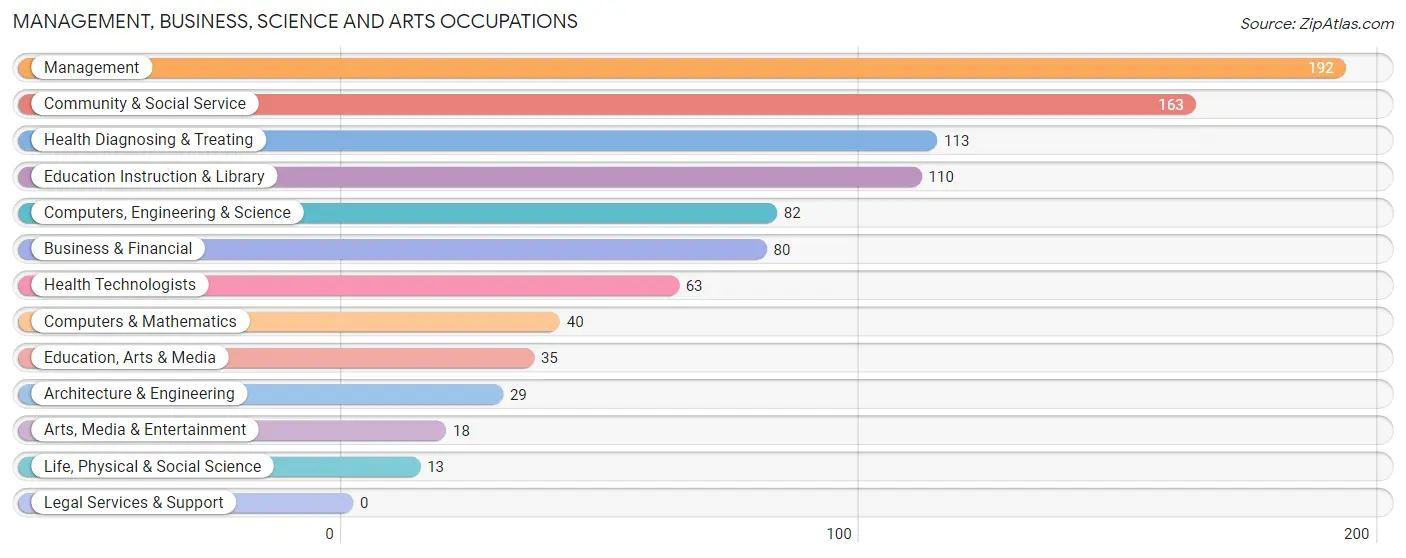
Management, Business, Science and Arts Occupations
The most common Management, Business, Science and Arts occupations in Ontonagon County are Management (192 | 9.5%), Community & Social Service (163 | 8.1%), Health Diagnosing & Treating (113 | 5.6%), Education Instruction & Library (110 | 5.4%), and Computers, Engineering & Science (82 | 4.1%).
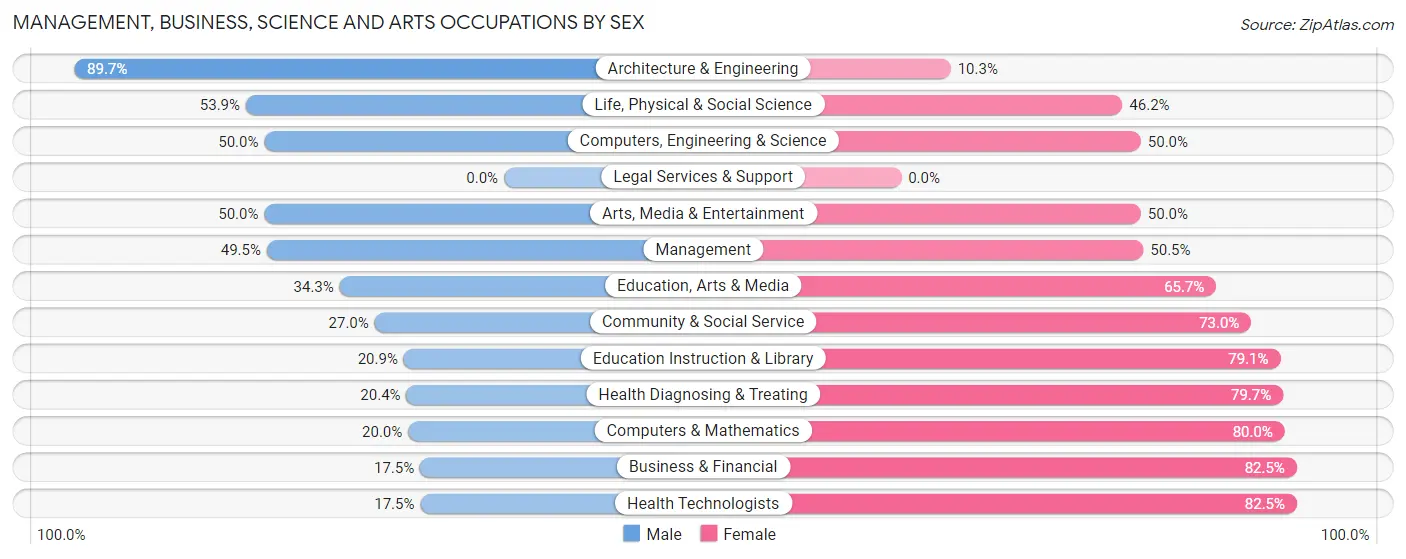
Management, Business, Science and Arts Occupations by Sex
Within the Management, Business, Science and Arts occupations in Ontonagon County, the most male-oriented occupations are Architecture & Engineering (89.7%), Life, Physical & Social Science (53.8%), and Computers, Engineering & Science (50.0%), while the most female-oriented occupations are Health Technologists (82.5%), Business & Financial (82.5%), and Computers & Mathematics (80.0%).
| Occupation | Male | Female |
| Management | 95 (49.5%) | 97 (50.5%) |
| Business & Financial | 14 (17.5%) | 66 (82.5%) |
| Computers, Engineering & Science | 41 (50.0%) | 41 (50.0%) |
| Computers & Mathematics | 8 (20.0%) | 32 (80.0%) |
| Architecture & Engineering | 26 (89.7%) | 3 (10.3%) |
| Life, Physical & Social Science | 7 (53.8%) | 6 (46.2%) |
| Community & Social Service | 44 (27.0%) | 119 (73.0%) |
| Education, Arts & Media | 12 (34.3%) | 23 (65.7%) |
| Legal Services & Support | 0 (0.0%) | 0 (0.0%) |
| Education Instruction & Library | 23 (20.9%) | 87 (79.1%) |
| Arts, Media & Entertainment | 9 (50.0%) | 9 (50.0%) |
| Health Diagnosing & Treating | 23 (20.3%) | 90 (79.6%) |
| Health Technologists | 11 (17.5%) | 52 (82.5%) |
| Total (Category) | 217 (34.4%) | 413 (65.6%) |
| Total (Overall) | 1,028 (50.9%) | 992 (49.1%) |
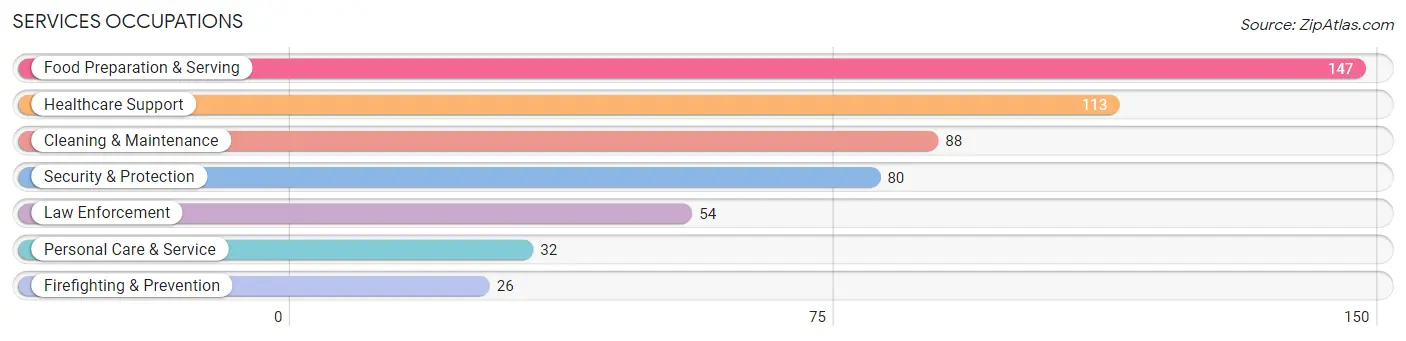
Services Occupations
The most common Services occupations in Ontonagon County are Food Preparation & Serving (147 | 7.3%), Healthcare Support (113 | 5.6%), Cleaning & Maintenance (88 | 4.4%), Security & Protection (80 | 4.0%), and Law Enforcement (54 | 2.7%).
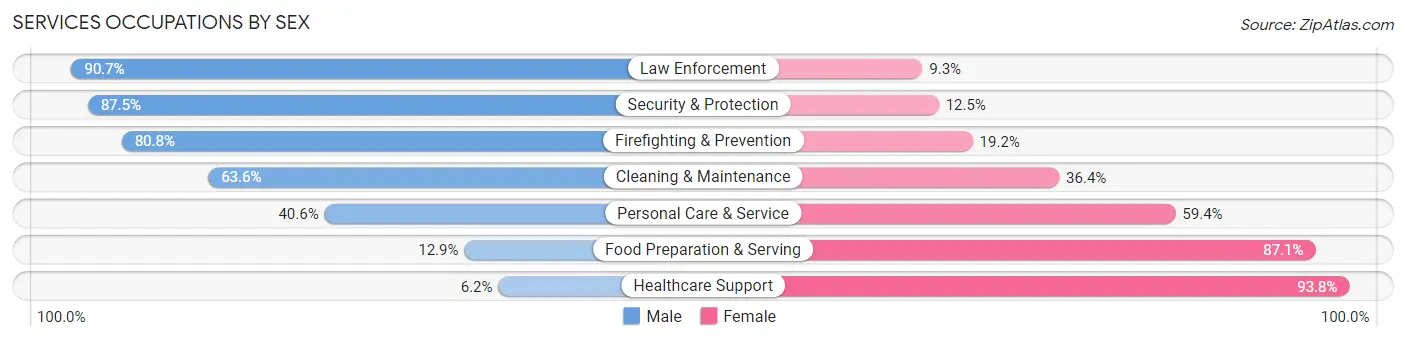
Services Occupations by Sex
Within the Services occupations in Ontonagon County, the most male-oriented occupations are Law Enforcement (90.7%), Security & Protection (87.5%), and Firefighting & Prevention (80.8%), while the most female-oriented occupations are Healthcare Support (93.8%), Food Preparation & Serving (87.1%), and Personal Care & Service (59.4%).
| Occupation | Male | Female |
| Healthcare Support | 7 (6.2%) | 106 (93.8%) |
| Security & Protection | 70 (87.5%) | 10 (12.5%) |
| Firefighting & Prevention | 21 (80.8%) | 5 (19.2%) |
| Law Enforcement | 49 (90.7%) | 5 (9.3%) |
| Food Preparation & Serving | 19 (12.9%) | 128 (87.1%) |
| Cleaning & Maintenance | 56 (63.6%) | 32 (36.4%) |
| Personal Care & Service | 13 (40.6%) | 19 (59.4%) |
| Total (Category) | 165 (35.9%) | 295 (64.1%) |
| Total (Overall) | 1,028 (50.9%) | 992 (49.1%) |
Sales and Office Occupations
The most common Sales and Office occupations in Ontonagon County are Office & Administration (192 | 9.5%), and Sales & Related (171 | 8.5%).
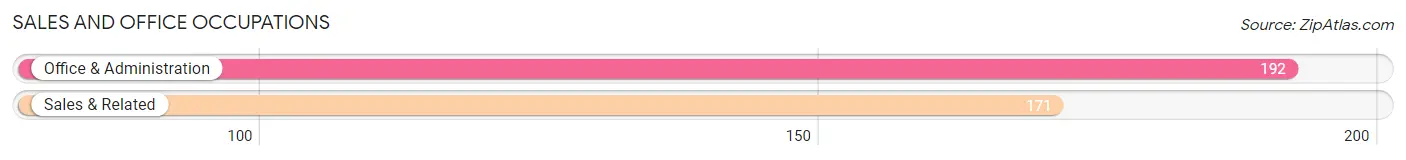
Sales and Office Occupations by Sex
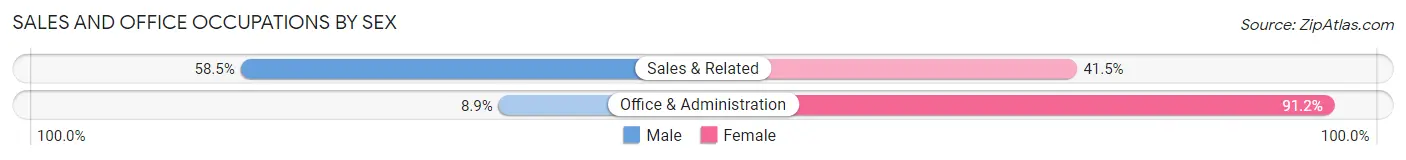
| Occupation | Male | Female |
| Sales & Related | 100 (58.5%) | 71 (41.5%) |
| Office & Administration | 17 (8.8%) | 175 (91.1%) |
| Total (Category) | 117 (32.2%) | 246 (67.8%) |
| Total (Overall) | 1,028 (50.9%) | 992 (49.1%) |
Natural Resources, Construction and Maintenance Occupations
The most common Natural Resources, Construction and Maintenance occupations in Ontonagon County are Construction & Extraction (108 | 5.3%), Installation, Maintenance & Repair (78 | 3.9%), and Farming, Fishing & Forestry (66 | 3.3%).
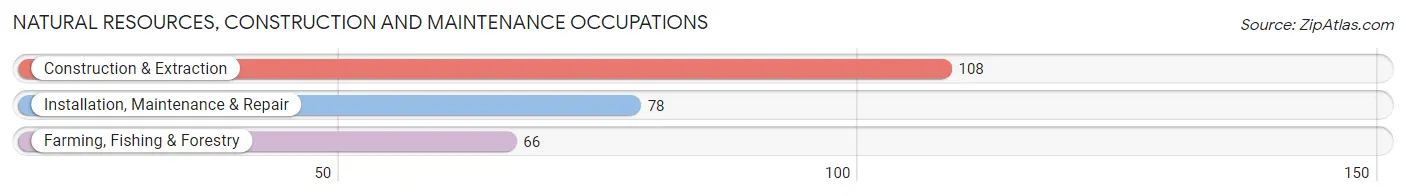
Natural Resources, Construction and Maintenance Occupations by Sex
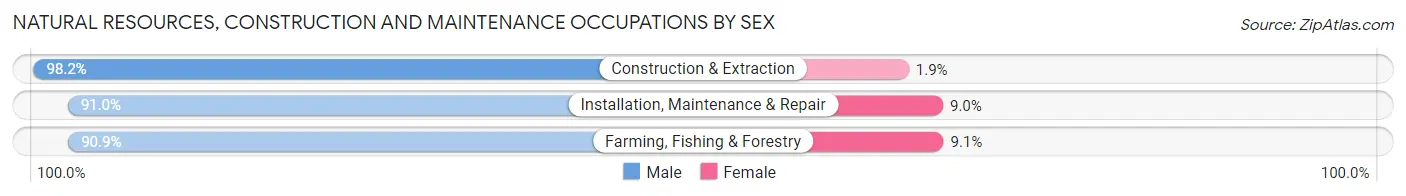
| Occupation | Male | Female |
| Farming, Fishing & Forestry | 60 (90.9%) | 6 (9.1%) |
| Construction & Extraction | 106 (98.2%) | 2 (1.8%) |
| Installation, Maintenance & Repair | 71 (91.0%) | 7 (9.0%) |
| Total (Category) | 237 (94.1%) | 15 (5.9%) |
| Total (Overall) | 1,028 (50.9%) | 992 (49.1%) |
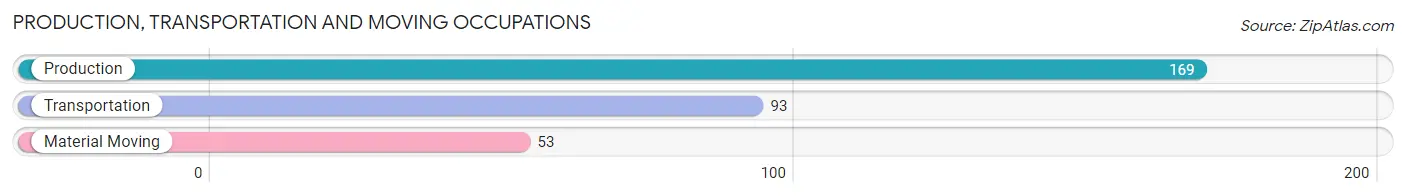
Production, Transportation and Moving Occupations
The most common Production, Transportation and Moving occupations in Ontonagon County are Production (169 | 8.4%), Transportation (93 | 4.6%), and Material Moving (53 | 2.6%).
Production, Transportation and Moving Occupations by Sex
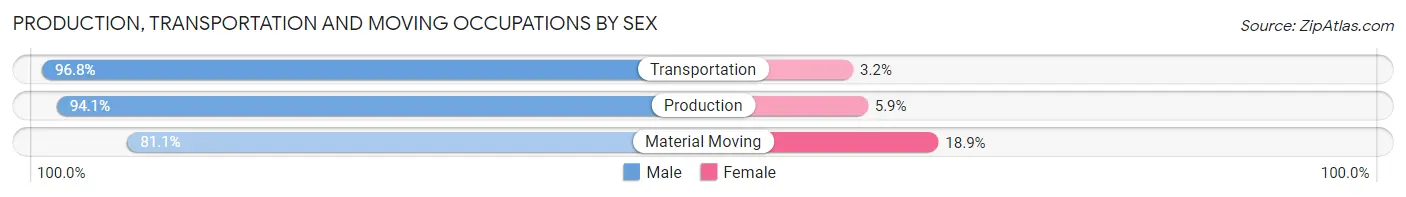
| Occupation | Male | Female |
| Production | 159 (94.1%) | 10 (5.9%) |
| Transportation | 90 (96.8%) | 3 (3.2%) |
| Material Moving | 43 (81.1%) | 10 (18.9%) |
| Total (Category) | 292 (92.7%) | 23 (7.3%) |
| Total (Overall) | 1,028 (50.9%) | 992 (49.1%) |
Employment Industries by Sex in Ontonagon County
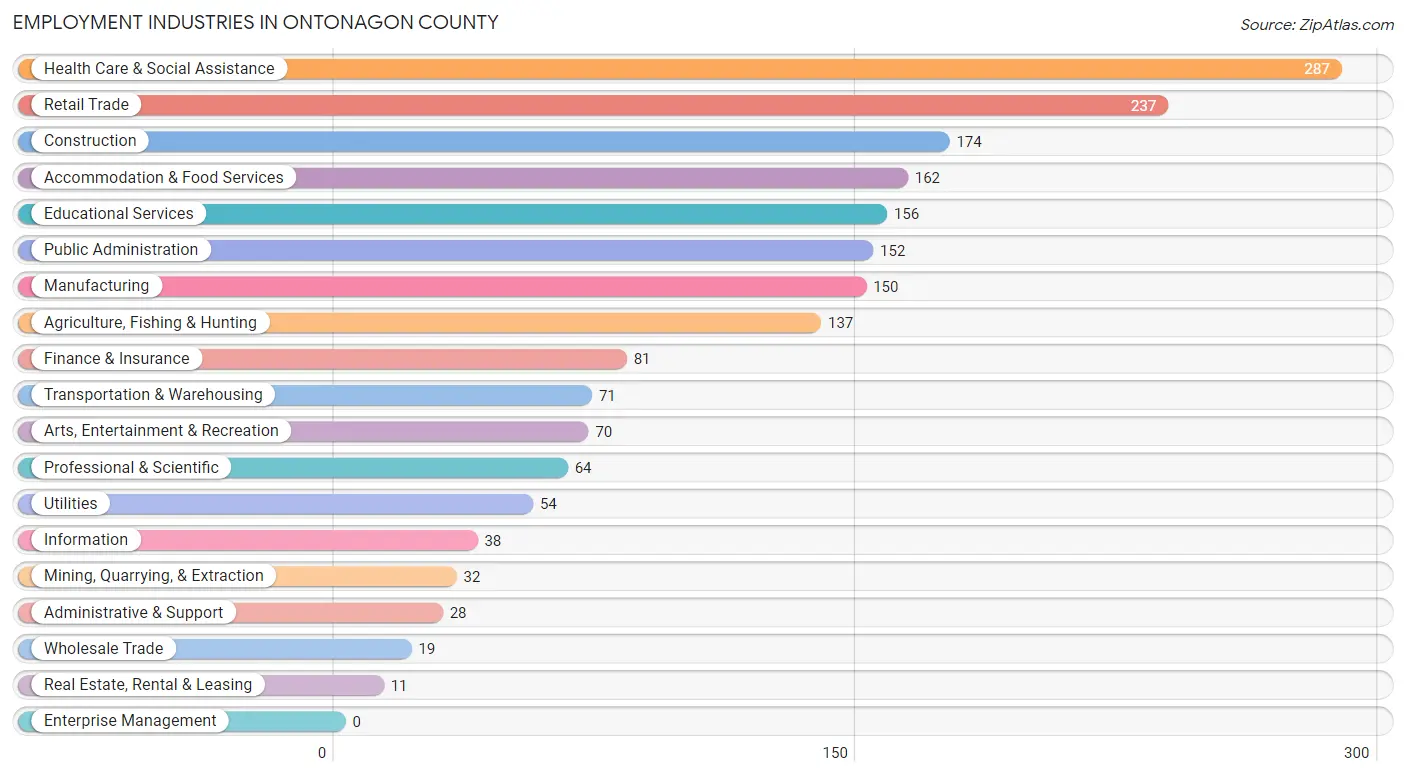
Employment Industries in Ontonagon County
The major employment industries in Ontonagon County include Health Care & Social Assistance (287 | 14.2%), Retail Trade (237 | 11.7%), Construction (174 | 8.6%), Accommodation & Food Services (162 | 8.0%), and Educational Services (156 | 7.7%).
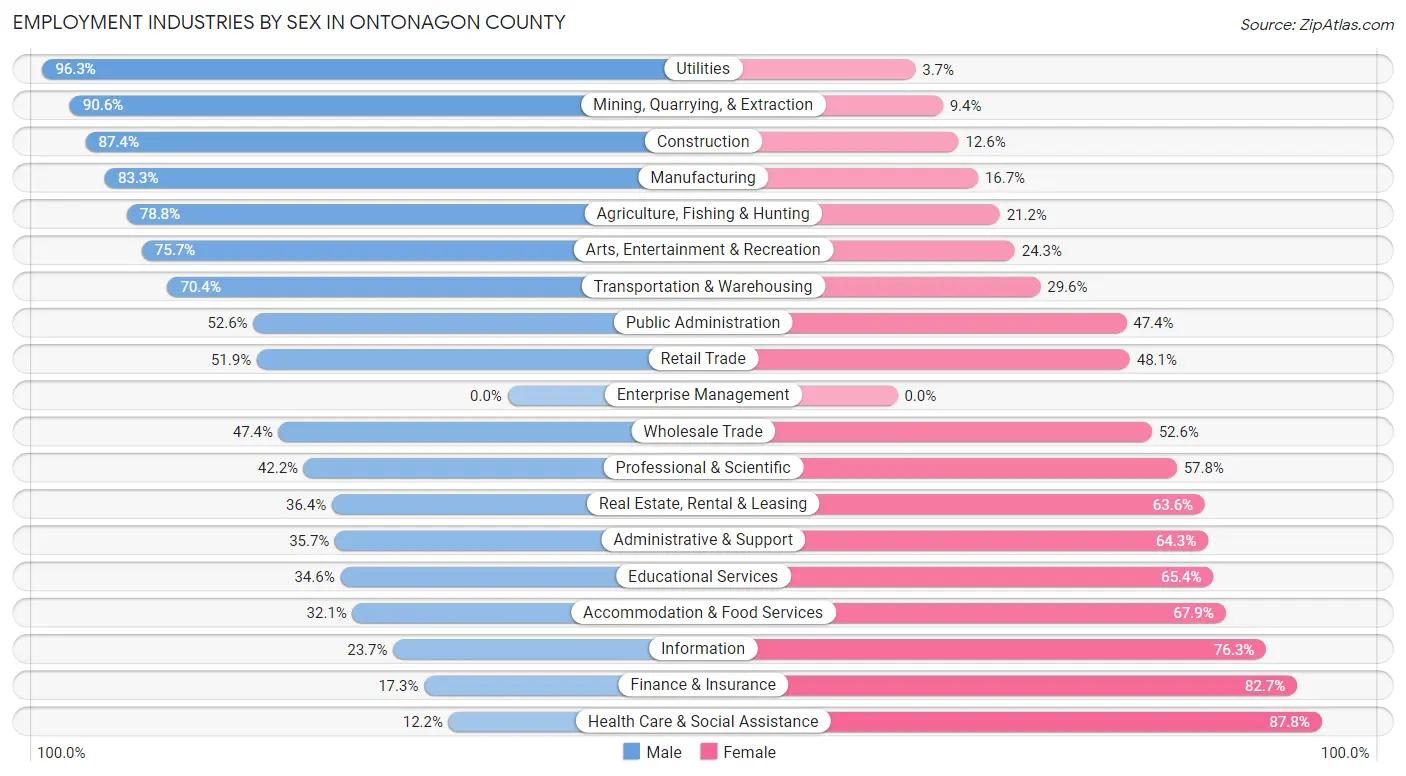
Employment Industries by Sex in Ontonagon County
The Ontonagon County industries that see more men than women are Utilities (96.3%), Mining, Quarrying, & Extraction (90.6%), and Construction (87.4%), whereas the industries that tend to have a higher number of women are Health Care & Social Assistance (87.8%), Finance & Insurance (82.7%), and Information (76.3%).
| Industry | Male | Female |
| Agriculture, Fishing & Hunting | 108 (78.8%) | 29 (21.2%) |
| Mining, Quarrying, & Extraction | 29 (90.6%) | 3 (9.4%) |
| Construction | 152 (87.4%) | 22 (12.6%) |
| Manufacturing | 125 (83.3%) | 25 (16.7%) |
| Wholesale Trade | 9 (47.4%) | 10 (52.6%) |
| Retail Trade | 123 (51.9%) | 114 (48.1%) |
| Transportation & Warehousing | 50 (70.4%) | 21 (29.6%) |
| Utilities | 52 (96.3%) | 2 (3.7%) |
| Information | 9 (23.7%) | 29 (76.3%) |
| Finance & Insurance | 14 (17.3%) | 67 (82.7%) |
| Real Estate, Rental & Leasing | 4 (36.4%) | 7 (63.6%) |
| Professional & Scientific | 27 (42.2%) | 37 (57.8%) |
| Enterprise Management | 0 (0.0%) | 0 (0.0%) |
| Administrative & Support | 10 (35.7%) | 18 (64.3%) |
| Educational Services | 54 (34.6%) | 102 (65.4%) |
| Health Care & Social Assistance | 35 (12.2%) | 252 (87.8%) |
| Arts, Entertainment & Recreation | 53 (75.7%) | 17 (24.3%) |
| Accommodation & Food Services | 52 (32.1%) | 110 (67.9%) |
| Public Administration | 80 (52.6%) | 72 (47.4%) |
| Total | 1,028 (50.9%) | 992 (49.1%) |
Education in Ontonagon County
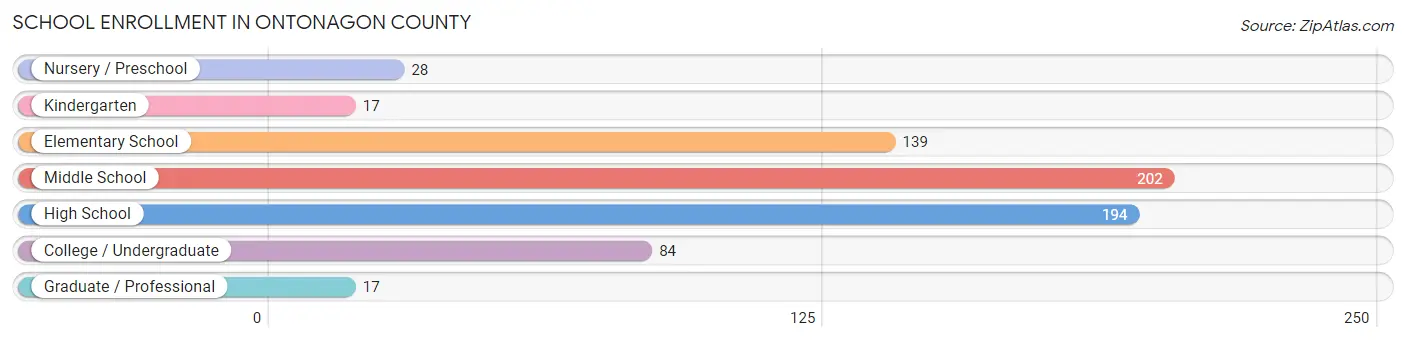
School Enrollment in Ontonagon County
The most common levels of schooling among the 681 students in Ontonagon County are middle school (202 | 29.7%), high school (194 | 28.5%), and elementary school (139 | 20.4%).
| School Level | # Students | % Students |
| Nursery / Preschool | 28 | 4.1% |
| Kindergarten | 17 | 2.5% |
| Elementary School | 139 | 20.4% |
| Middle School | 202 | 29.7% |
| High School | 194 | 28.5% |
| College / Undergraduate | 84 | 12.3% |
| Graduate / Professional | 17 | 2.5% |
| Total | 681 | 100.0% |
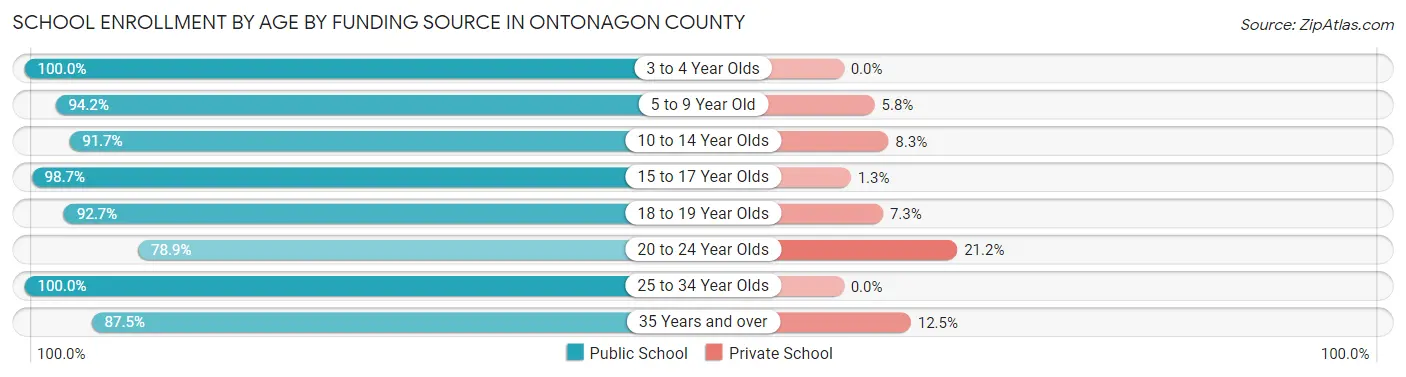
School Enrollment by Age by Funding Source in Ontonagon County
Out of a total of 681 students who are enrolled in schools in Ontonagon County, 46 (6.8%) attend a private institution, while the remaining 635 (93.2%) are enrolled in public schools. The age group of 20 to 24 year olds has the highest likelihood of being enrolled in private schools, with 11 (21.1% in the age bracket) enrolled. Conversely, the age group of 3 to 4 year olds has the lowest likelihood of being enrolled in a private school, with 24 (100.0% in the age bracket) attending a public institution.
| Age Bracket | Public School | Private School |
| 3 to 4 Year Olds | 24 (100.0%) | 0 (0.0%) |
| 5 to 9 Year Old | 131 (94.2%) | 8 (5.8%) |
| 10 to 14 Year Olds | 209 (91.7%) | 19 (8.3%) |
| 15 to 17 Year Olds | 151 (98.7%) | 2 (1.3%) |
| 18 to 19 Year Olds | 38 (92.7%) | 3 (7.3%) |
| 20 to 24 Year Olds | 41 (78.8%) | 11 (21.1%) |
| 25 to 34 Year Olds | 20 (100.0%) | 0 (0.0%) |
| 35 Years and over | 21 (87.5%) | 3 (12.5%) |
| Total | 635 (93.2%) | 46 (6.8%) |
Educational Attainment by Field of Study in Ontonagon County
Education (179 | 22.5%), bio, nature & agricultural (129 | 16.2%), business (88 | 11.0%), arts & humanities (76 | 9.5%), and science & technology (63 | 7.9%) are the most common fields of study among 797 individuals in Ontonagon County who have obtained a bachelor's degree or higher.
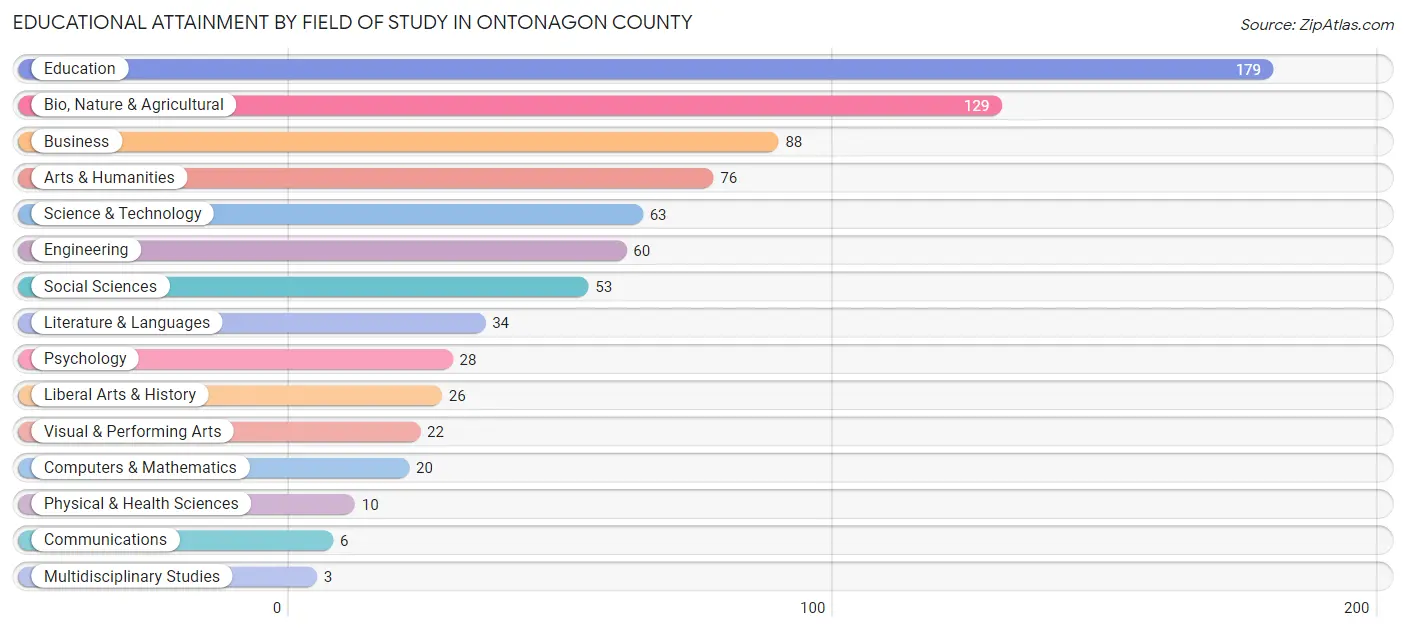
| Field of Study | # Graduates | % Graduates |
| Computers & Mathematics | 20 | 2.5% |
| Bio, Nature & Agricultural | 129 | 16.2% |
| Physical & Health Sciences | 10 | 1.3% |
| Psychology | 28 | 3.5% |
| Social Sciences | 53 | 6.7% |
| Engineering | 60 | 7.5% |
| Multidisciplinary Studies | 3 | 0.4% |
| Science & Technology | 63 | 7.9% |
| Business | 88 | 11.0% |
| Education | 179 | 22.5% |
| Literature & Languages | 34 | 4.3% |
| Liberal Arts & History | 26 | 3.3% |
| Visual & Performing Arts | 22 | 2.8% |
| Communications | 6 | 0.7% |
| Arts & Humanities | 76 | 9.5% |
| Total | 797 | 100.0% |
Transportation & Commute in Ontonagon County
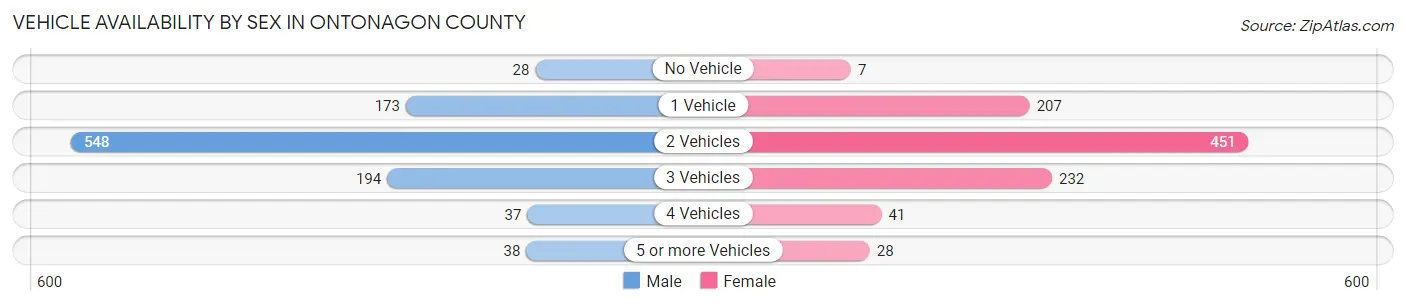
Vehicle Availability by Sex in Ontonagon County
The most prevalent vehicle ownership categories in Ontonagon County are males with 2 vehicles (548, accounting for 53.8%) and females with 2 vehicles (451, making up 56.7%).
| Vehicles Available | Male | Female |
| No Vehicle | 28 (2.8%) | 7 (0.7%) |
| 1 Vehicle | 173 (17.0%) | 207 (21.4%) |
| 2 Vehicles | 548 (53.8%) | 451 (46.7%) |
| 3 Vehicles | 194 (19.1%) | 232 (24.0%) |
| 4 Vehicles | 37 (3.6%) | 41 (4.2%) |
| 5 or more Vehicles | 38 (3.7%) | 28 (2.9%) |
| Total | 1,018 (100.0%) | 966 (100.0%) |
Commute Time in Ontonagon County
The most frequently occuring commute durations in Ontonagon County are 5 to 9 minutes (323 commuters, 17.7%), less than 5 minutes (245 commuters, 13.5%), and 10 to 14 minutes (211 commuters, 11.6%).
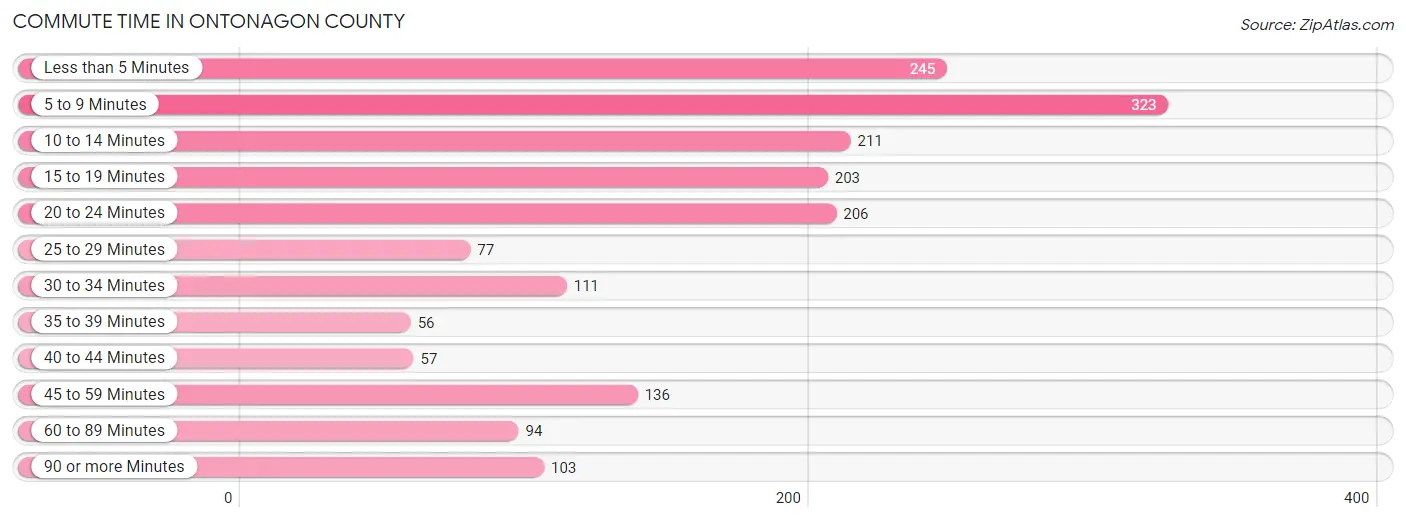
| Commute Time | # Commuters | % Commuters |
| Less than 5 Minutes | 245 | 13.5% |
| 5 to 9 Minutes | 323 | 17.7% |
| 10 to 14 Minutes | 211 | 11.6% |
| 15 to 19 Minutes | 203 | 11.1% |
| 20 to 24 Minutes | 206 | 11.3% |
| 25 to 29 Minutes | 77 | 4.2% |
| 30 to 34 Minutes | 111 | 6.1% |
| 35 to 39 Minutes | 56 | 3.1% |
| 40 to 44 Minutes | 57 | 3.1% |
| 45 to 59 Minutes | 136 | 7.5% |
| 60 to 89 Minutes | 94 | 5.2% |
| 90 or more Minutes | 103 | 5.7% |
Commute Time by Sex in Ontonagon County
The most common commute times in Ontonagon County are 5 to 9 minutes (164 commuters, 17.3%) for males and 5 to 9 minutes (159 commuters, 18.1%) for females.
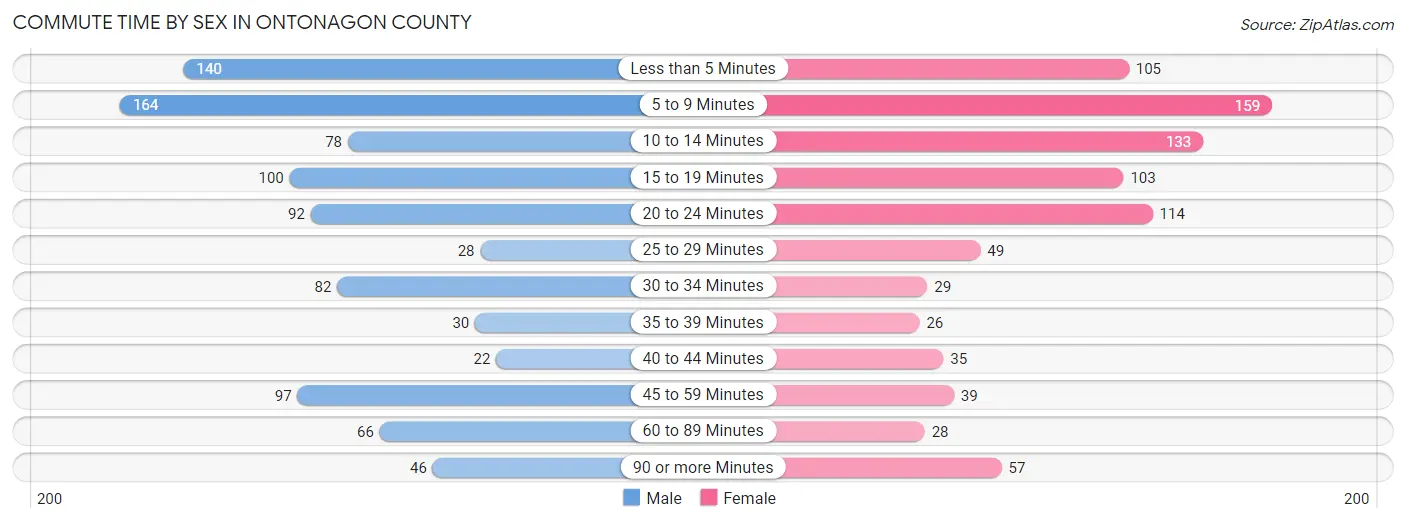
| Commute Time | Male | Female |
| Less than 5 Minutes | 140 (14.8%) | 105 (12.0%) |
| 5 to 9 Minutes | 164 (17.3%) | 159 (18.1%) |
| 10 to 14 Minutes | 78 (8.3%) | 133 (15.2%) |
| 15 to 19 Minutes | 100 (10.6%) | 103 (11.7%) |
| 20 to 24 Minutes | 92 (9.7%) | 114 (13.0%) |
| 25 to 29 Minutes | 28 (3.0%) | 49 (5.6%) |
| 30 to 34 Minutes | 82 (8.7%) | 29 (3.3%) |
| 35 to 39 Minutes | 30 (3.2%) | 26 (3.0%) |
| 40 to 44 Minutes | 22 (2.3%) | 35 (4.0%) |
| 45 to 59 Minutes | 97 (10.3%) | 39 (4.4%) |
| 60 to 89 Minutes | 66 (7.0%) | 28 (3.2%) |
| 90 or more Minutes | 46 (4.9%) | 57 (6.5%) |
Time of Departure to Work by Sex in Ontonagon County
The most frequent times of departure to work in Ontonagon County are 7:00 AM to 7:29 AM (111, 11.7%) for males and 8:00 AM to 8:29 AM (151, 17.2%) for females.
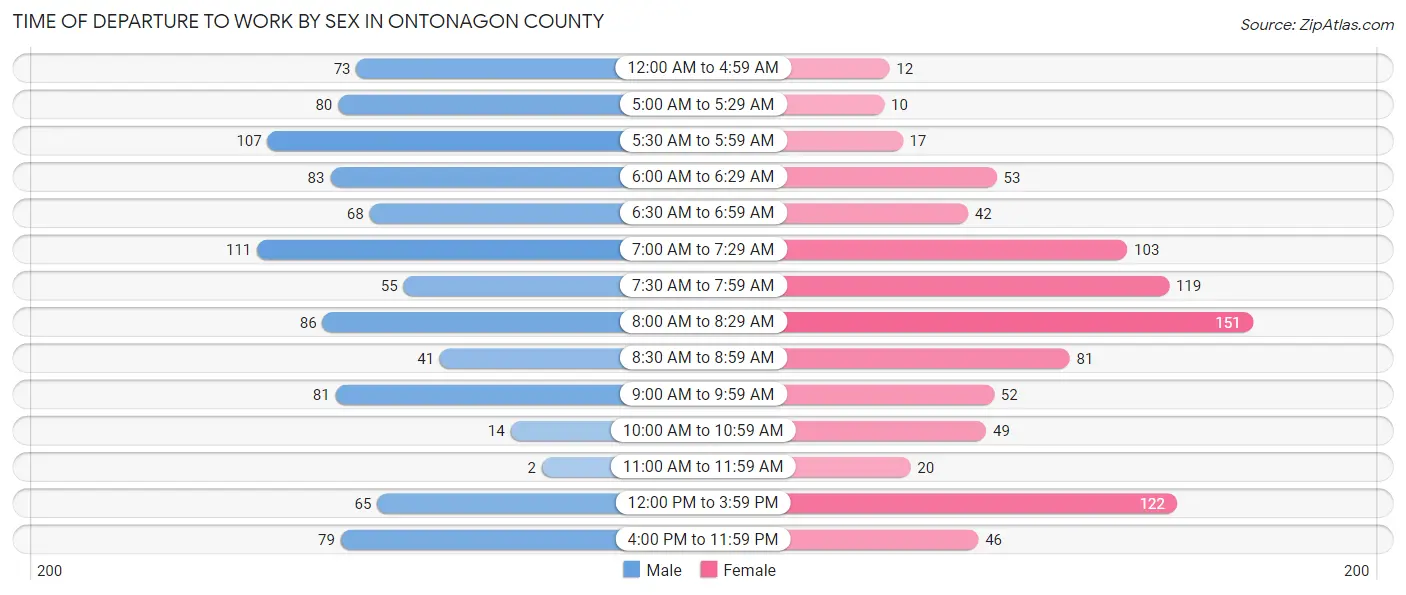
| Time of Departure | Male | Female |
| 12:00 AM to 4:59 AM | 73 (7.7%) | 12 (1.4%) |
| 5:00 AM to 5:29 AM | 80 (8.5%) | 10 (1.1%) |
| 5:30 AM to 5:59 AM | 107 (11.3%) | 17 (1.9%) |
| 6:00 AM to 6:29 AM | 83 (8.8%) | 53 (6.0%) |
| 6:30 AM to 6:59 AM | 68 (7.2%) | 42 (4.8%) |
| 7:00 AM to 7:29 AM | 111 (11.7%) | 103 (11.7%) |
| 7:30 AM to 7:59 AM | 55 (5.8%) | 119 (13.6%) |
| 8:00 AM to 8:29 AM | 86 (9.1%) | 151 (17.2%) |
| 8:30 AM to 8:59 AM | 41 (4.3%) | 81 (9.2%) |
| 9:00 AM to 9:59 AM | 81 (8.6%) | 52 (5.9%) |
| 10:00 AM to 10:59 AM | 14 (1.5%) | 49 (5.6%) |
| 11:00 AM to 11:59 AM | 2 (0.2%) | 20 (2.3%) |
| 12:00 PM to 3:59 PM | 65 (6.9%) | 122 (13.9%) |
| 4:00 PM to 11:59 PM | 79 (8.4%) | 46 (5.2%) |
| Total | 945 (100.0%) | 877 (100.0%) |
Housing Occupancy in Ontonagon County
Occupancy by Ownership in Ontonagon County
Of the total 2,872 dwellings in Ontonagon County, owner-occupied units account for 2,538 (88.4%), while renter-occupied units make up 334 (11.6%).
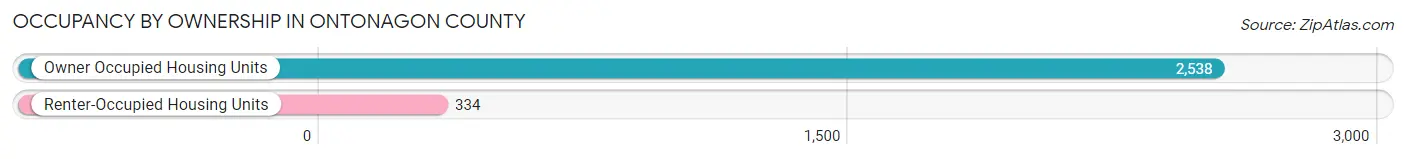
| Occupancy | # Housing Units | % Housing Units |
| Owner Occupied Housing Units | 2,538 | 88.4% |
| Renter-Occupied Housing Units | 334 | 11.6% |
| Total Occupied Housing Units | 2,872 | 100.0% |
Occupancy by Household Size in Ontonagon County
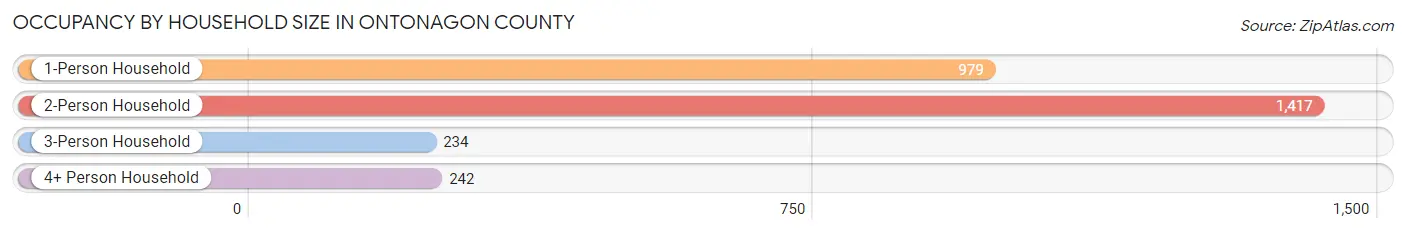
| Household Size | # Housing Units | % Housing Units |
| 1-Person Household | 979 | 34.1% |
| 2-Person Household | 1,417 | 49.3% |
| 3-Person Household | 234 | 8.2% |
| 4+ Person Household | 242 | 8.4% |
| Total Housing Units | 2,872 | 100.0% |
Occupancy by Ownership by Household Size in Ontonagon County
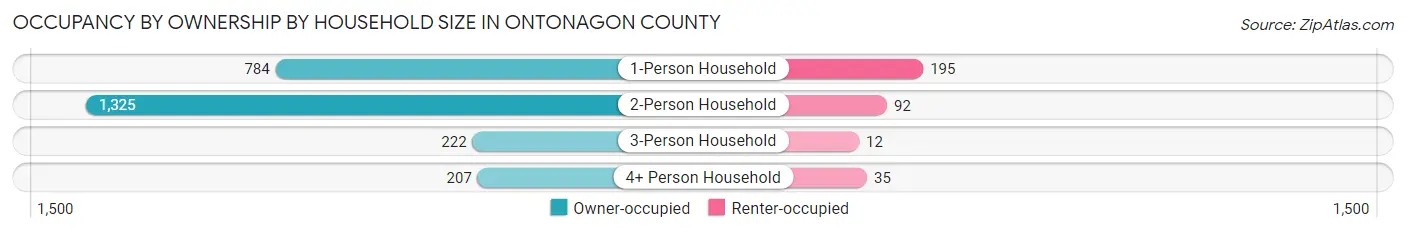
| Household Size | Owner-occupied | Renter-occupied |
| 1-Person Household | 784 (80.1%) | 195 (19.9%) |
| 2-Person Household | 1,325 (93.5%) | 92 (6.5%) |
| 3-Person Household | 222 (94.9%) | 12 (5.1%) |
| 4+ Person Household | 207 (85.5%) | 35 (14.5%) |
| Total Housing Units | 2,538 (88.4%) | 334 (11.6%) |
Occupancy by Educational Attainment in Ontonagon County
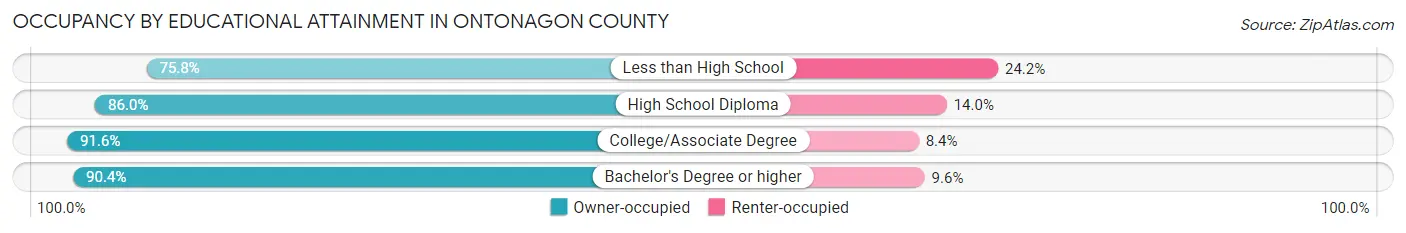
| Household Size | Owner-occupied | Renter-occupied |
| Less than High School | 113 (75.8%) | 36 (24.2%) |
| High School Diploma | 965 (86.0%) | 157 (14.0%) |
| College/Associate Degree | 999 (91.6%) | 92 (8.4%) |
| Bachelor's Degree or higher | 461 (90.4%) | 49 (9.6%) |
Occupancy by Age of Householder in Ontonagon County
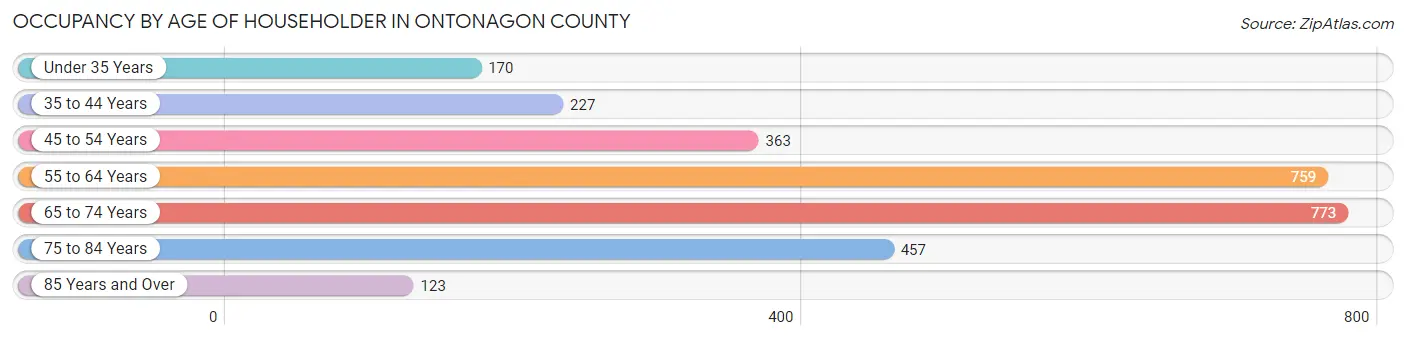
| Age Bracket | # Households | % Households |
| Under 35 Years | 170 | 5.9% |
| 35 to 44 Years | 227 | 7.9% |
| 45 to 54 Years | 363 | 12.6% |
| 55 to 64 Years | 759 | 26.4% |
| 65 to 74 Years | 773 | 26.9% |
| 75 to 84 Years | 457 | 15.9% |
| 85 Years and Over | 123 | 4.3% |
| Total | 2,872 | 100.0% |
Housing Finances in Ontonagon County
Median Income by Occupancy in Ontonagon County
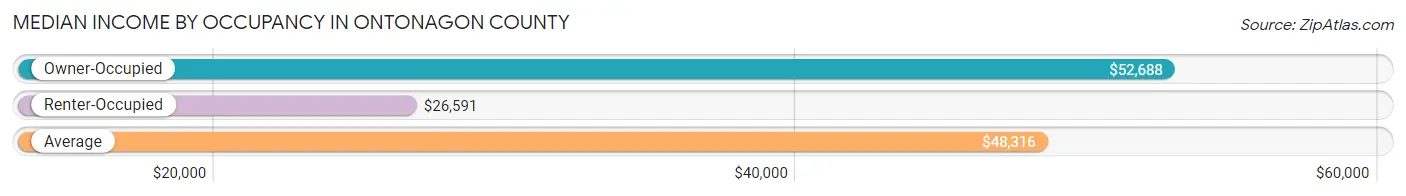
| Occupancy Type | # Households | Median Income |
| Owner-Occupied | 2,538 (88.4%) | $52,688 |
| Renter-Occupied | 334 (11.6%) | $26,591 |
| Average | 2,872 (100.0%) | $48,316 |
Occupancy by Householder Income Bracket in Ontonagon County
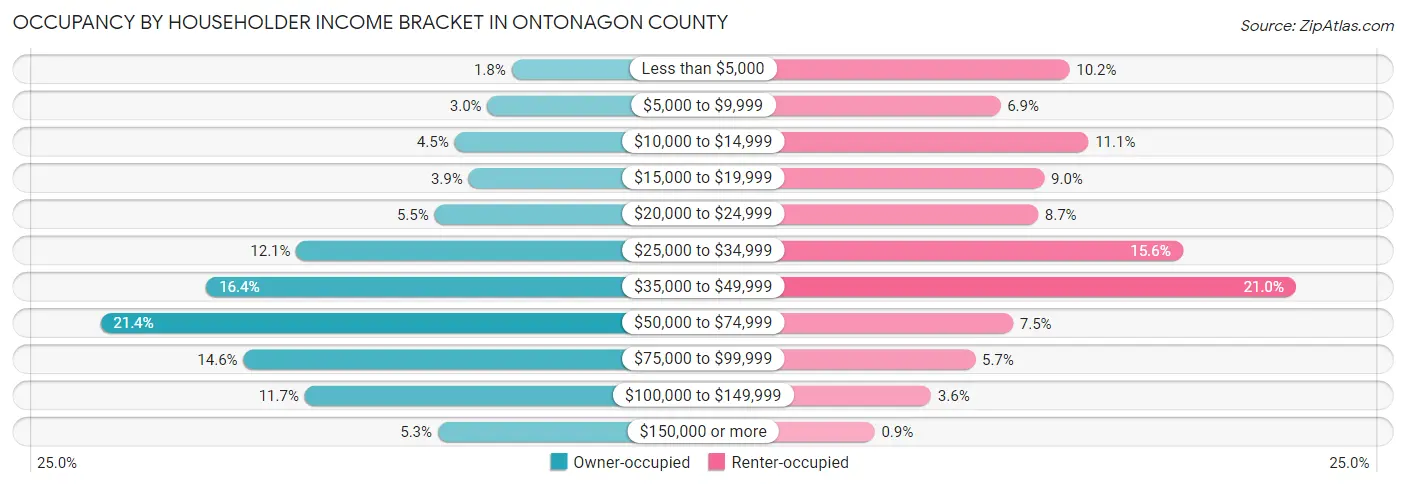
| Income Bracket | Owner-occupied | Renter-occupied |
| Less than $5,000 | 46 (1.8%) | 34 (10.2%) |
| $5,000 to $9,999 | 75 (3.0%) | 23 (6.9%) |
| $10,000 to $14,999 | 115 (4.5%) | 37 (11.1%) |
| $15,000 to $19,999 | 98 (3.9%) | 30 (9.0%) |
| $20,000 to $24,999 | 139 (5.5%) | 29 (8.7%) |
| $25,000 to $34,999 | 306 (12.1%) | 52 (15.6%) |
| $35,000 to $49,999 | 415 (16.4%) | 70 (21.0%) |
| $50,000 to $74,999 | 543 (21.4%) | 25 (7.5%) |
| $75,000 to $99,999 | 370 (14.6%) | 19 (5.7%) |
| $100,000 to $149,999 | 296 (11.7%) | 12 (3.6%) |
| $150,000 or more | 135 (5.3%) | 3 (0.9%) |
| Total | 2,538 (100.0%) | 334 (100.0%) |
Monthly Housing Cost Tiers in Ontonagon County
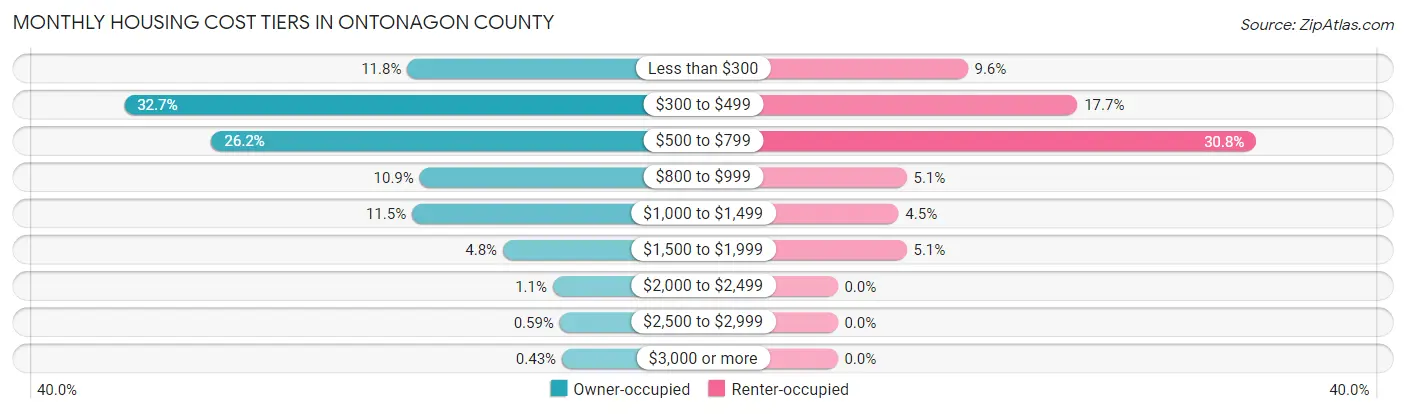
| Monthly Cost | Owner-occupied | Renter-occupied |
| Less than $300 | 300 (11.8%) | 32 (9.6%) |
| $300 to $499 | 829 (32.7%) | 59 (17.7%) |
| $500 to $799 | 666 (26.2%) | 103 (30.8%) |
| $800 to $999 | 277 (10.9%) | 17 (5.1%) |
| $1,000 to $1,499 | 291 (11.5%) | 15 (4.5%) |
| $1,500 to $1,999 | 121 (4.8%) | 17 (5.1%) |
| $2,000 to $2,499 | 28 (1.1%) | 0 (0.0%) |
| $2,500 to $2,999 | 15 (0.6%) | 0 (0.0%) |
| $3,000 or more | 11 (0.4%) | 0 (0.0%) |
| Total | 2,538 (100.0%) | 334 (100.0%) |
Physical Housing Characteristics in Ontonagon County
Housing Structures in Ontonagon County
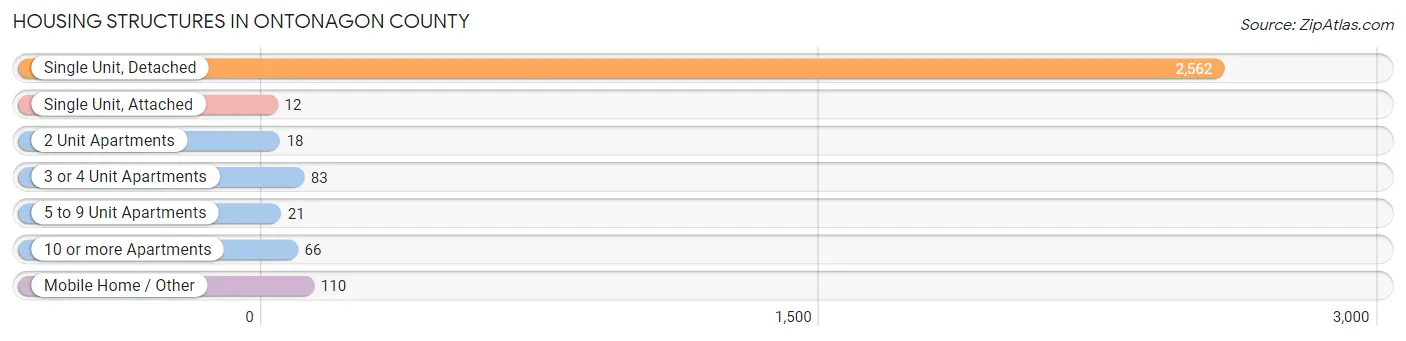
| Structure Type | # Housing Units | % Housing Units |
| Single Unit, Detached | 2,562 | 89.2% |
| Single Unit, Attached | 12 | 0.4% |
| 2 Unit Apartments | 18 | 0.6% |
| 3 or 4 Unit Apartments | 83 | 2.9% |
| 5 to 9 Unit Apartments | 21 | 0.7% |
| 10 or more Apartments | 66 | 2.3% |
| Mobile Home / Other | 110 | 3.8% |
| Total | 2,872 | 100.0% |
Housing Structures by Occupancy in Ontonagon County
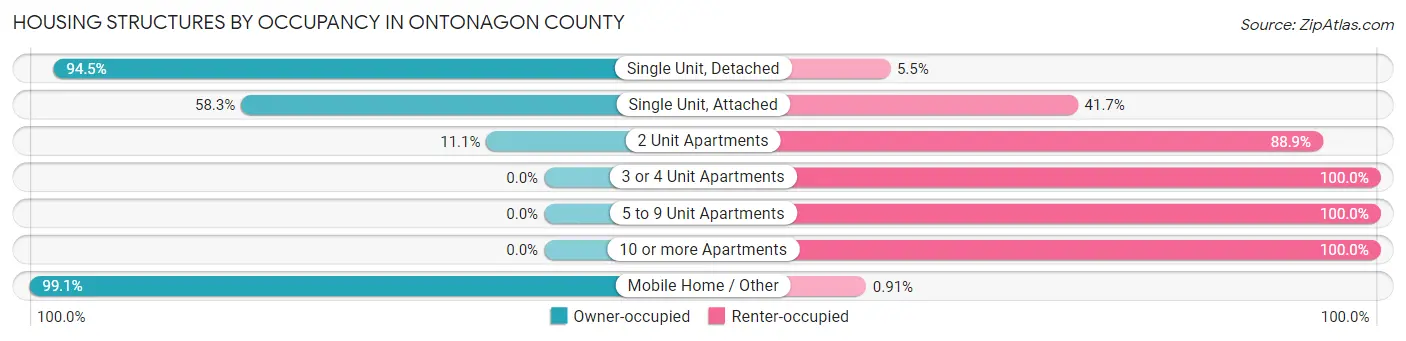
| Structure Type | Owner-occupied | Renter-occupied |
| Single Unit, Detached | 2,420 (94.5%) | 142 (5.5%) |
| Single Unit, Attached | 7 (58.3%) | 5 (41.7%) |
| 2 Unit Apartments | 2 (11.1%) | 16 (88.9%) |
| 3 or 4 Unit Apartments | 0 (0.0%) | 83 (100.0%) |
| 5 to 9 Unit Apartments | 0 (0.0%) | 21 (100.0%) |
| 10 or more Apartments | 0 (0.0%) | 66 (100.0%) |
| Mobile Home / Other | 109 (99.1%) | 1 (0.9%) |
| Total | 2,538 (88.4%) | 334 (11.6%) |
Housing Structures by Number of Rooms in Ontonagon County
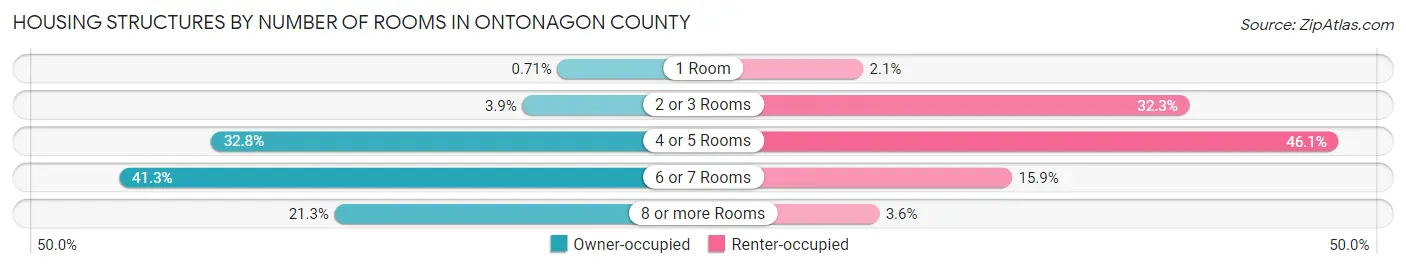
| Number of Rooms | Owner-occupied | Renter-occupied |
| 1 Room | 18 (0.7%) | 7 (2.1%) |
| 2 or 3 Rooms | 100 (3.9%) | 108 (32.3%) |
| 4 or 5 Rooms | 832 (32.8%) | 154 (46.1%) |
| 6 or 7 Rooms | 1,047 (41.2%) | 53 (15.9%) |
| 8 or more Rooms | 541 (21.3%) | 12 (3.6%) |
| Total | 2,538 (100.0%) | 334 (100.0%) |
Housing Structure by Heating Type in Ontonagon County
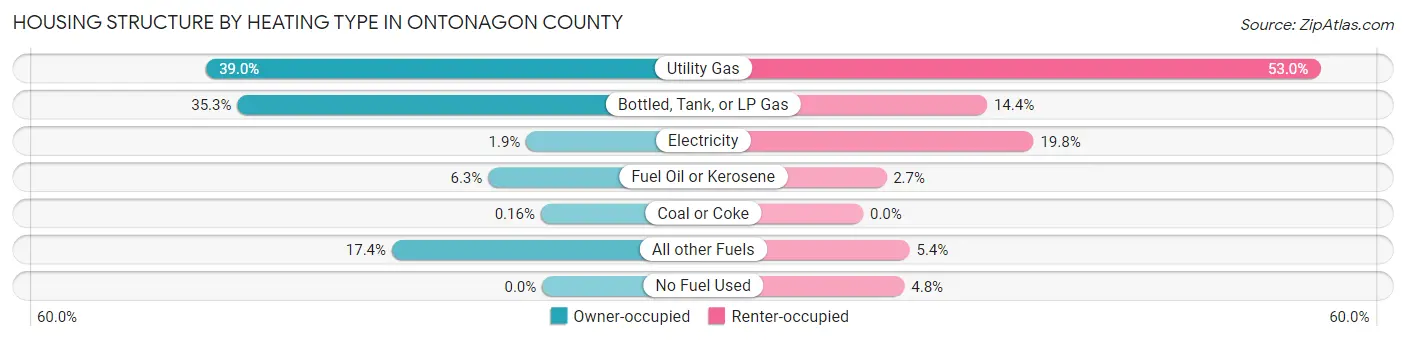
| Heating Type | Owner-occupied | Renter-occupied |
| Utility Gas | 989 (39.0%) | 177 (53.0%) |
| Bottled, Tank, or LP Gas | 897 (35.3%) | 48 (14.4%) |
| Electricity | 47 (1.8%) | 66 (19.8%) |
| Fuel Oil or Kerosene | 159 (6.3%) | 9 (2.7%) |
| Coal or Coke | 4 (0.2%) | 0 (0.0%) |
| All other Fuels | 442 (17.4%) | 18 (5.4%) |
| No Fuel Used | 0 (0.0%) | 16 (4.8%) |
| Total | 2,538 (100.0%) | 334 (100.0%) |
Household Vehicle Usage in Ontonagon County
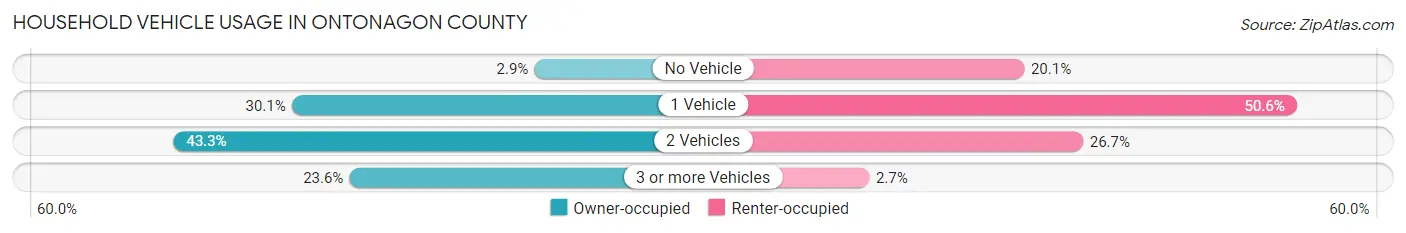
| Vehicles per Household | Owner-occupied | Renter-occupied |
| No Vehicle | 74 (2.9%) | 67 (20.1%) |
| 1 Vehicle | 764 (30.1%) | 169 (50.6%) |
| 2 Vehicles | 1,100 (43.3%) | 89 (26.7%) |
| 3 or more Vehicles | 600 (23.6%) | 9 (2.7%) |
| Total | 2,538 (100.0%) | 334 (100.0%) |
Real Estate & Mortgages in Ontonagon County
Real Estate and Mortgage Overview in Ontonagon County
| Characteristic | Without Mortgage | With Mortgage |
| Housing Units | 1,661 | 877 |
| Median Property Value | $82,500 | $104,600 |
| Median Household Income | $45,295 | $83 |
| Monthly Housing Costs | $424 | $11 |
| Real Estate Taxes | $1,138 | $16 |
Property Value by Mortgage Status in Ontonagon County
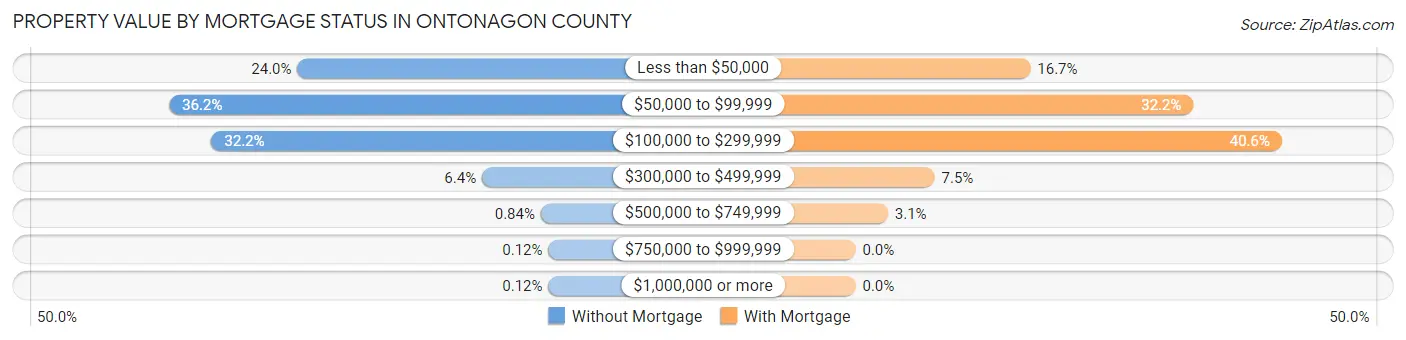
| Property Value | Without Mortgage | With Mortgage |
| Less than $50,000 | 399 (24.0%) | 146 (16.7%) |
| $50,000 to $99,999 | 602 (36.2%) | 282 (32.2%) |
| $100,000 to $299,999 | 535 (32.2%) | 356 (40.6%) |
| $300,000 to $499,999 | 107 (6.4%) | 66 (7.5%) |
| $500,000 to $749,999 | 14 (0.8%) | 27 (3.1%) |
| $750,000 to $999,999 | 2 (0.1%) | 0 (0.0%) |
| $1,000,000 or more | 2 (0.1%) | 0 (0.0%) |
| Total | 1,661 (100.0%) | 877 (100.0%) |
Household Income by Mortgage Status in Ontonagon County
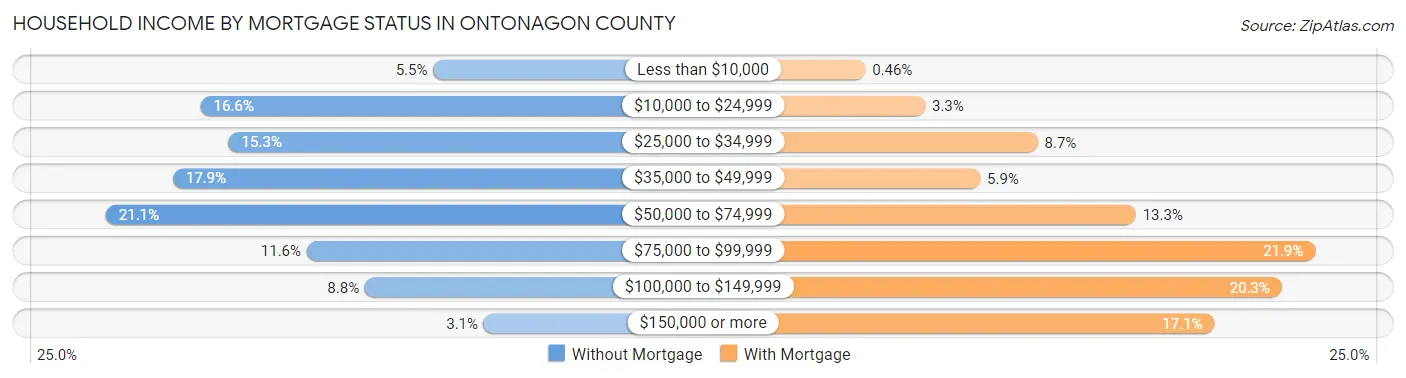
| Household Income | Without Mortgage | With Mortgage |
| Less than $10,000 | 92 (5.5%) | 4 (0.5%) |
| $10,000 to $24,999 | 276 (16.6%) | 29 (3.3%) |
| $25,000 to $34,999 | 254 (15.3%) | 76 (8.7%) |
| $35,000 to $49,999 | 298 (17.9%) | 52 (5.9%) |
| $50,000 to $74,999 | 351 (21.1%) | 117 (13.3%) |
| $75,000 to $99,999 | 192 (11.6%) | 192 (21.9%) |
| $100,000 to $149,999 | 146 (8.8%) | 178 (20.3%) |
| $150,000 or more | 52 (3.1%) | 150 (17.1%) |
| Total | 1,661 (100.0%) | 877 (100.0%) |
Property Value to Household Income Ratio in Ontonagon County
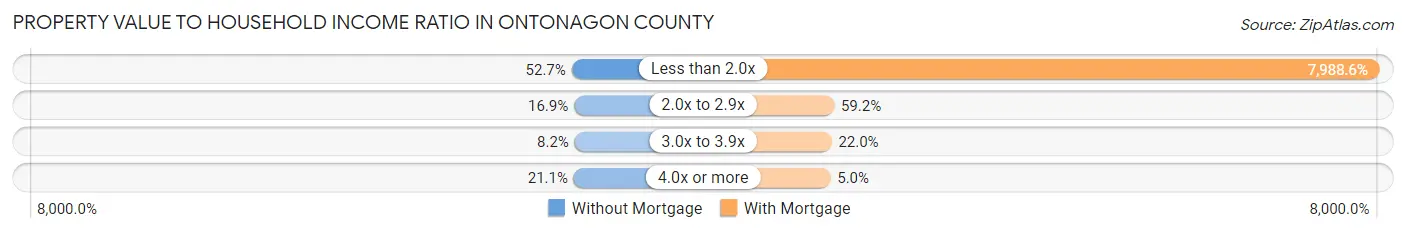
| Value-to-Income Ratio | Without Mortgage | With Mortgage |
| Less than 2.0x | 875 (52.7%) | 70,060 (7,988.6%) |
| 2.0x to 2.9x | 281 (16.9%) | 519 (59.2%) |
| 3.0x to 3.9x | 136 (8.2%) | 193 (22.0%) |
| 4.0x or more | 350 (21.1%) | 44 (5.0%) |
| Total | 1,661 (100.0%) | 877 (100.0%) |
Real Estate Taxes by Mortgage Status in Ontonagon County
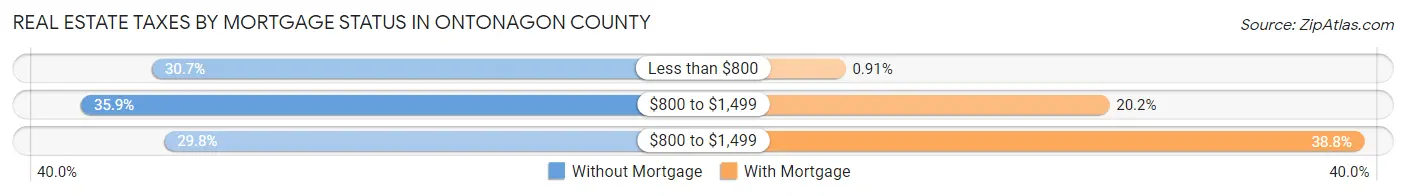
| Property Taxes | Without Mortgage | With Mortgage |
| Less than $800 | 510 (30.7%) | 8 (0.9%) |
| $800 to $1,499 | 596 (35.9%) | 177 (20.2%) |
| $800 to $1,499 | 495 (29.8%) | 340 (38.8%) |
| Total | 1,661 (100.0%) | 877 (100.0%) |
Health & Disability in Ontonagon County
Health Insurance Coverage by Age in Ontonagon County
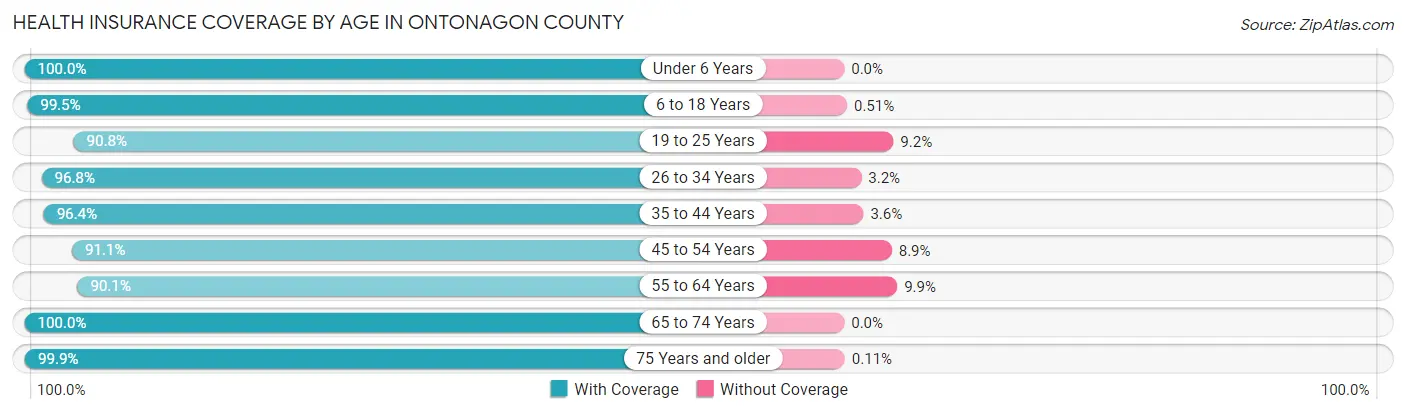
| Age Bracket | With Coverage | Without Coverage |
| Under 6 Years | 156 (100.0%) | 0 (0.0%) |
| 6 to 18 Years | 582 (99.5%) | 3 (0.5%) |
| 19 to 25 Years | 248 (90.8%) | 25 (9.2%) |
| 26 to 34 Years | 304 (96.8%) | 10 (3.2%) |
| 35 to 44 Years | 432 (96.4%) | 16 (3.6%) |
| 45 to 54 Years | 607 (91.1%) | 59 (8.9%) |
| 55 to 64 Years | 1,096 (90.1%) | 120 (9.9%) |
| 65 to 74 Years | 1,261 (100.0%) | 0 (0.0%) |
| 75 Years and older | 880 (99.9%) | 1 (0.1%) |
| Total | 5,566 (96.0%) | 234 (4.0%) |
Health Insurance Coverage by Citizenship Status in Ontonagon County
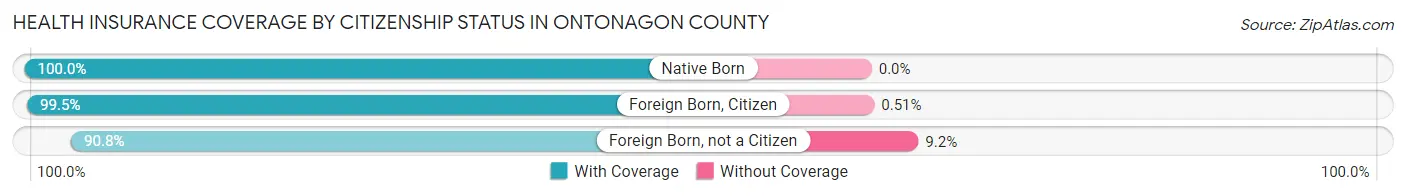
| Citizenship Status | With Coverage | Without Coverage |
| Native Born | 156 (100.0%) | 0 (0.0%) |
| Foreign Born, Citizen | 582 (99.5%) | 3 (0.5%) |
| Foreign Born, not a Citizen | 248 (90.8%) | 25 (9.2%) |
Health Insurance Coverage by Household Income in Ontonagon County
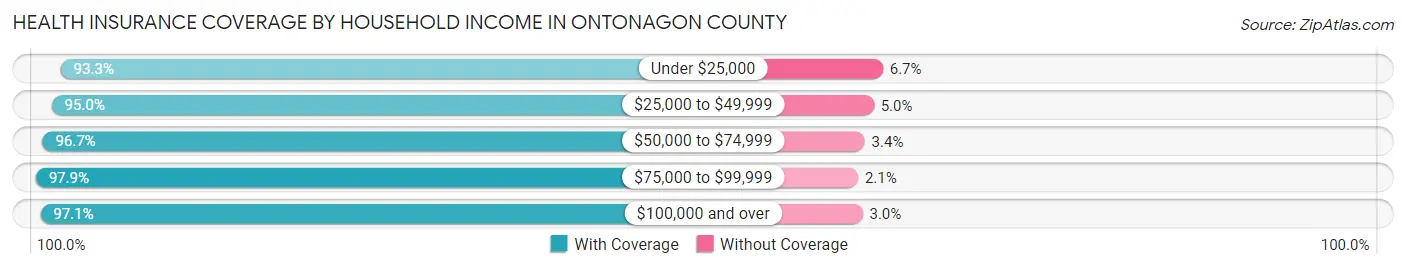
| Household Income | With Coverage | Without Coverage |
| Under $25,000 | 817 (93.3%) | 59 (6.7%) |
| $25,000 to $49,999 | 1,469 (95.0%) | 78 (5.0%) |
| $50,000 to $74,999 | 1,182 (96.7%) | 41 (3.4%) |
| $75,000 to $99,999 | 986 (97.9%) | 21 (2.1%) |
| $100,000 and over | 1,087 (97.1%) | 33 (2.9%) |
Public vs Private Health Insurance Coverage by Age in Ontonagon County
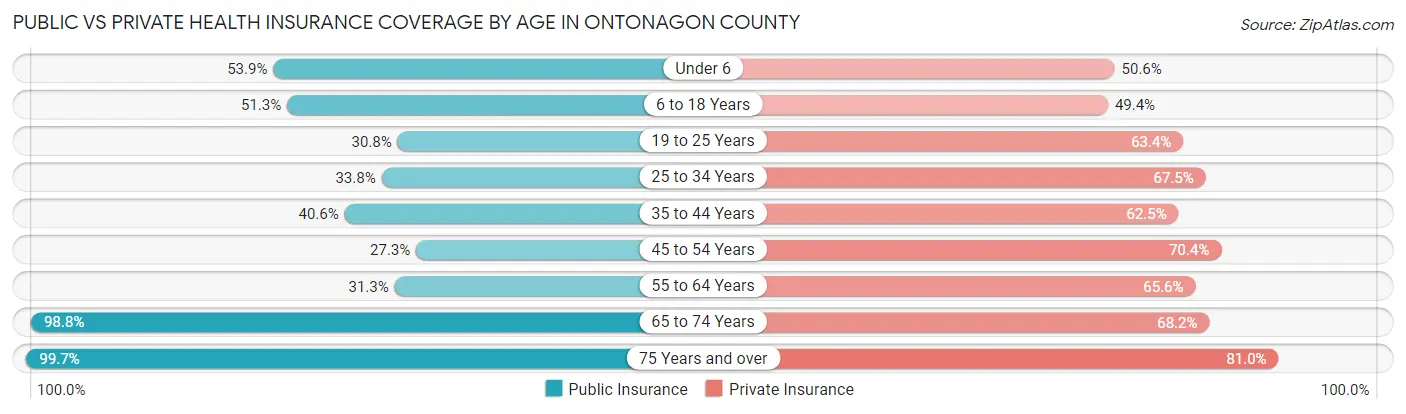
| Age Bracket | Public Insurance | Private Insurance |
| Under 6 | 84 (53.8%) | 79 (50.6%) |
| 6 to 18 Years | 300 (51.3%) | 289 (49.4%) |
| 19 to 25 Years | 84 (30.8%) | 173 (63.4%) |
| 25 to 34 Years | 106 (33.8%) | 212 (67.5%) |
| 35 to 44 Years | 182 (40.6%) | 280 (62.5%) |
| 45 to 54 Years | 182 (27.3%) | 469 (70.4%) |
| 55 to 64 Years | 381 (31.3%) | 798 (65.6%) |
| 65 to 74 Years | 1,246 (98.8%) | 860 (68.2%) |
| 75 Years and over | 878 (99.7%) | 714 (81.0%) |
| Total | 3,443 (59.4%) | 3,874 (66.8%) |
Disability Status by Sex by Age in Ontonagon County
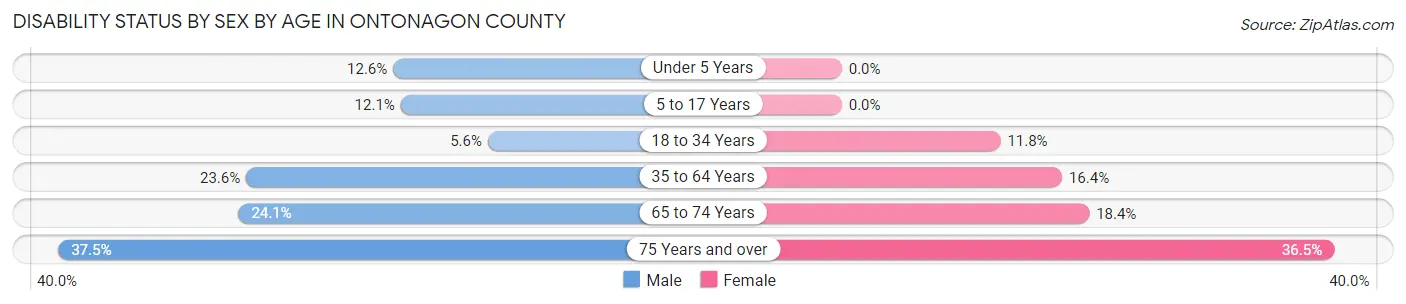
| Age Bracket | Male | Female |
| Under 5 Years | 11 (12.6%) | 0 (0.0%) |
| 5 to 17 Years | 32 (12.1%) | 0 (0.0%) |
| 18 to 34 Years | 18 (5.6%) | 39 (11.8%) |
| 35 to 64 Years | 278 (23.6%) | 188 (16.4%) |
| 65 to 74 Years | 165 (24.1%) | 106 (18.4%) |
| 75 Years and over | 159 (37.5%) | 167 (36.5%) |
Disability Class by Sex by Age in Ontonagon County
Disability Class: Hearing Difficulty
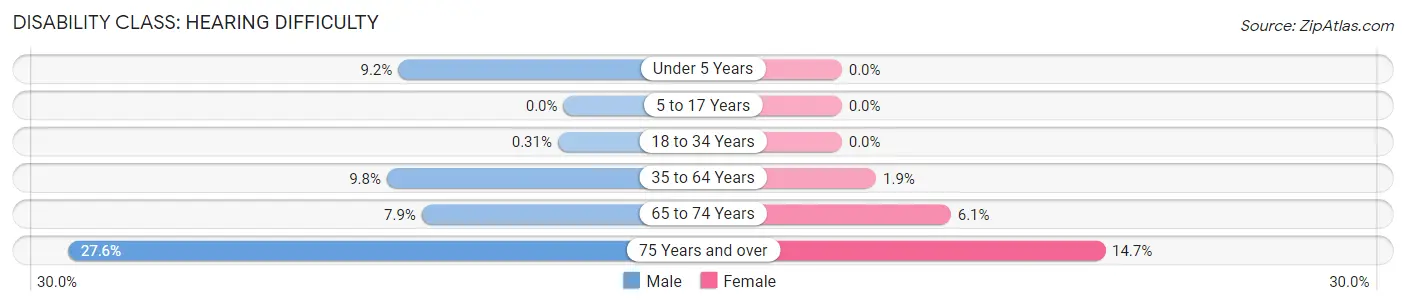
| Age Bracket | Male | Female |
| Under 5 Years | 8 (9.2%) | 0 (0.0%) |
| 5 to 17 Years | 0 (0.0%) | 0 (0.0%) |
| 18 to 34 Years | 1 (0.3%) | 0 (0.0%) |
| 35 to 64 Years | 116 (9.8%) | 22 (1.9%) |
| 65 to 74 Years | 54 (7.9%) | 35 (6.1%) |
| 75 Years and over | 117 (27.6%) | 67 (14.7%) |
Disability Class: Vision Difficulty
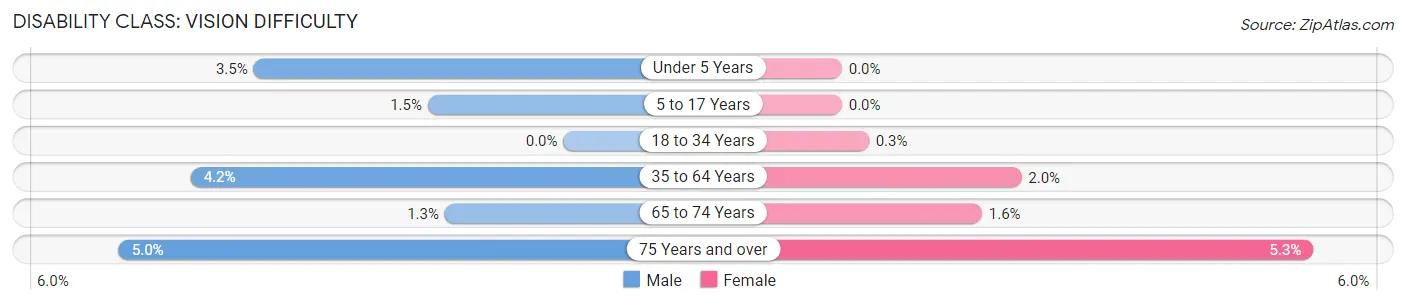
| Age Bracket | Male | Female |
| Under 5 Years | 3 (3.5%) | 0 (0.0%) |
| 5 to 17 Years | 4 (1.5%) | 0 (0.0%) |
| 18 to 34 Years | 0 (0.0%) | 1 (0.3%) |
| 35 to 64 Years | 49 (4.2%) | 23 (2.0%) |
| 65 to 74 Years | 9 (1.3%) | 9 (1.6%) |
| 75 Years and over | 21 (5.0%) | 24 (5.2%) |
Disability Class: Cognitive Difficulty
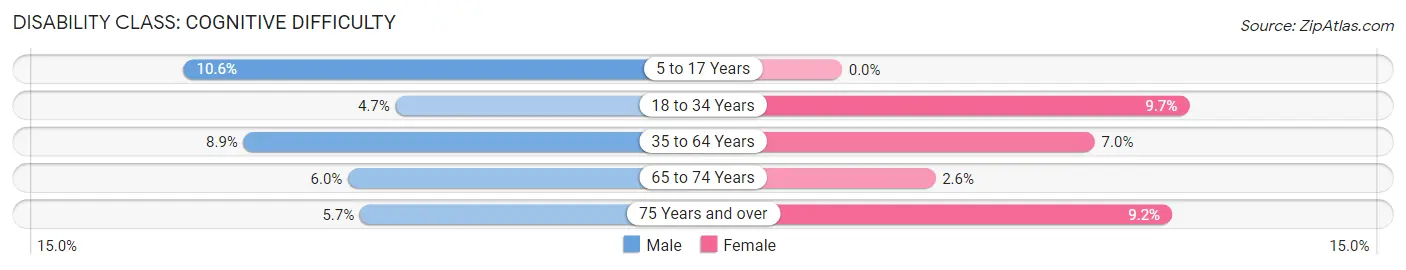
| Age Bracket | Male | Female |
| 5 to 17 Years | 28 (10.6%) | 0 (0.0%) |
| 18 to 34 Years | 15 (4.7%) | 32 (9.7%) |
| 35 to 64 Years | 105 (8.9%) | 81 (7.0%) |
| 65 to 74 Years | 41 (6.0%) | 15 (2.6%) |
| 75 Years and over | 24 (5.7%) | 42 (9.2%) |
Disability Class: Ambulatory Difficulty
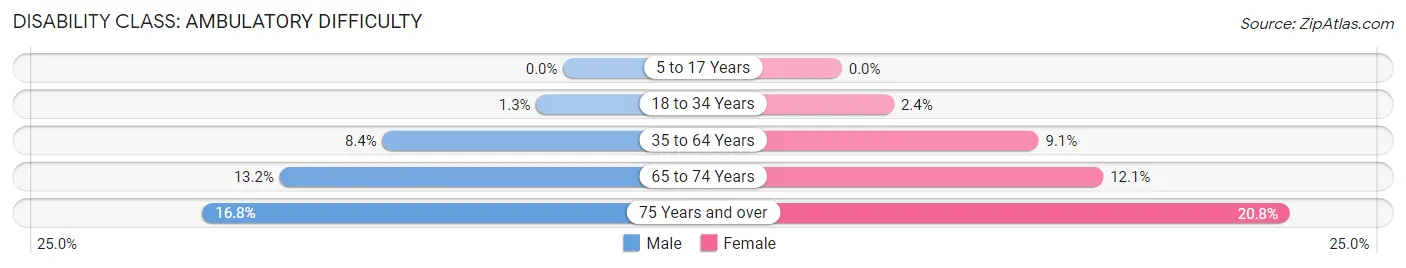
| Age Bracket | Male | Female |
| 5 to 17 Years | 0 (0.0%) | 0 (0.0%) |
| 18 to 34 Years | 4 (1.3%) | 8 (2.4%) |
| 35 to 64 Years | 99 (8.4%) | 105 (9.1%) |
| 65 to 74 Years | 90 (13.2%) | 70 (12.1%) |
| 75 Years and over | 71 (16.8%) | 95 (20.8%) |
Disability Class: Self-Care Difficulty
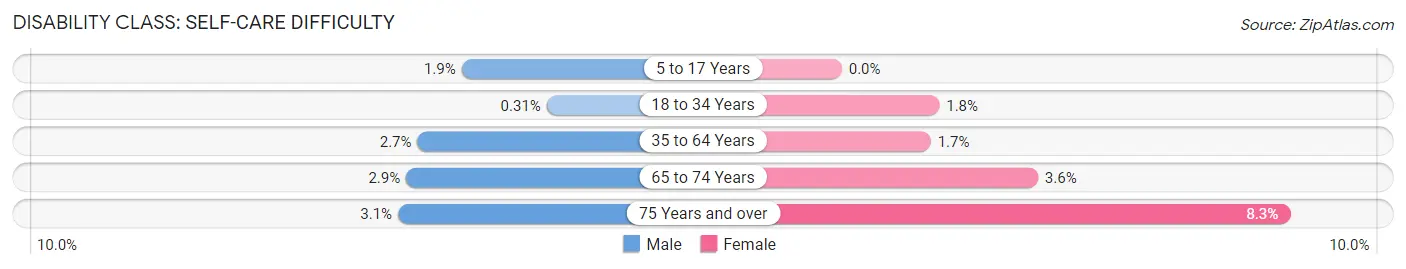
| Age Bracket | Male | Female |
| 5 to 17 Years | 5 (1.9%) | 0 (0.0%) |
| 18 to 34 Years | 1 (0.3%) | 6 (1.8%) |
| 35 to 64 Years | 32 (2.7%) | 19 (1.7%) |
| 65 to 74 Years | 20 (2.9%) | 21 (3.6%) |
| 75 Years and over | 13 (3.1%) | 38 (8.3%) |
Technology Access in Ontonagon County
Computing Device Access in Ontonagon County
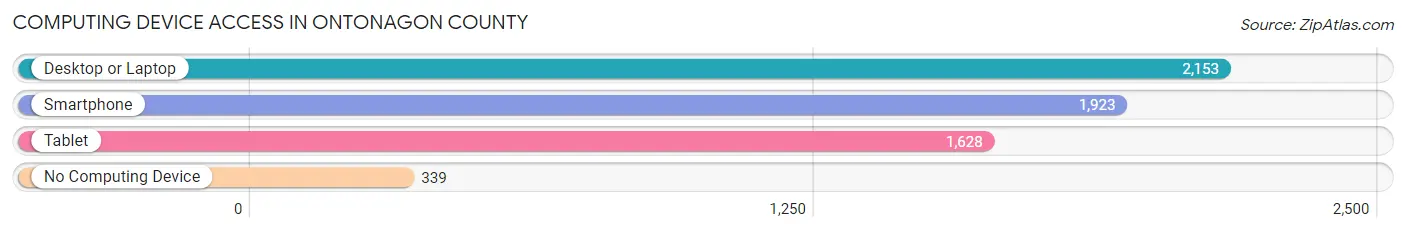
| Device Type | # Households | % Households |
| Desktop or Laptop | 2,153 | 75.0% |
| Smartphone | 1,923 | 67.0% |
| Tablet | 1,628 | 56.7% |
| No Computing Device | 339 | 11.8% |
| Total | 2,872 | 100.0% |
Internet Access in Ontonagon County
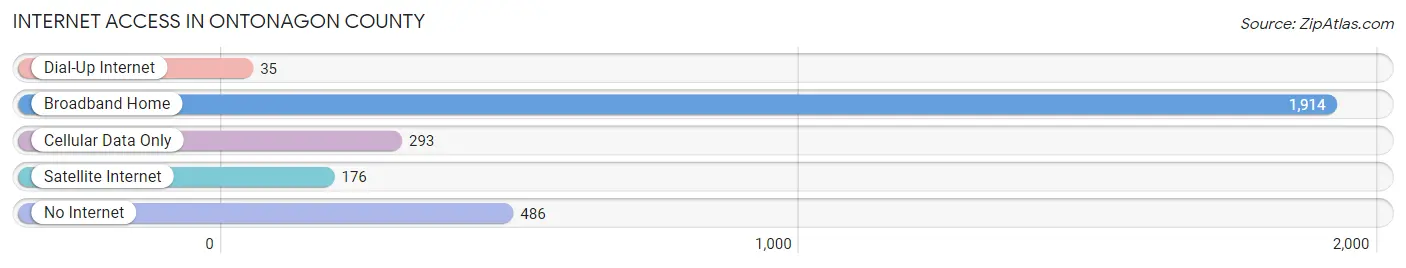
| Internet Type | # Households | % Households |
| Dial-Up Internet | 35 | 1.2% |
| Broadband Home | 1,914 | 66.6% |
| Cellular Data Only | 293 | 10.2% |
| Satellite Internet | 176 | 6.1% |
| No Internet | 486 | 16.9% |
| Total | 2,872 | 100.0% |
Ontonagon County Summary
Ontonagon County is located in the Upper Peninsula of Michigan, and is bordered by the states of Wisconsin and Minnesota. The county seat is Ontonagon, and the county has a total area of 1,845 square miles. As of the 2010 census, the population was 6,780.
Geography
Ontonagon County is located in the western part of the Upper Peninsula of Michigan. It is bordered by the states of Wisconsin and Minnesota. The county is mostly rural, with a few small towns and villages scattered throughout. The terrain is mostly rolling hills and forests, with some areas of flat land. The highest point in the county is Mount Arvon, which is 1,979 feet above sea level. The county is home to several rivers, including the Ontonagon River, the Sturgeon River, and the Brule River.
The climate of Ontonagon County is classified as humid continental, with cold winters and warm summers. The average annual temperature is around 40 degrees Fahrenheit. The average annual precipitation is around 30 inches.
Economy
The economy of Ontonagon County is largely based on tourism and natural resources. The county is home to several state parks, including Porcupine Mountains Wilderness State Park, which is the largest state park in Michigan. The county is also home to several ski resorts, including Indianhead Mountain Resort and Big Powderhorn Mountain Resort.
The county is also home to several timber and paper companies, including Weyerhaeuser and Georgia-Pacific. The county is also home to several mining companies, including the White Pine Copper Mine.
Demographics
As of the 2010 census, the population of Ontonagon County was 6,780. The population is mostly white (96.2%), with a small percentage of Native American (1.2%), African American (0.3%), and Asian (0.2%) residents. The median household income is $37,945, and the median age is 44.7 years.
Conclusion
Ontonagon County is a rural county located in the Upper Peninsula of Michigan. The county is home to several state parks, ski resorts, timber and paper companies, and mining companies. The population is mostly white, with a small percentage of Native American, African American, and Asian residents. The median household income is $37,945, and the median age is 44.7 years. The economy of the county is largely based on tourism and natural resources.
Common Questions
What is Per Capita Income in Ontonagon County?
Per Capita income in Ontonagon County is $30,182.
What is the Median Family Income in Ontonagon County?
Median Family Income in Ontonagon County is $64,191.
What is the Median Household income in Ontonagon County?
Median Household Income in Ontonagon County is $48,316.
What is Income or Wage Gap in Ontonagon County?
Income or Wage Gap in Ontonagon County is 35.7%.
Women in Ontonagon County earn 64.3 cents for every dollar earned by a man.
What is Family Income Deficit in Ontonagon County?
Family Income Deficit in Ontonagon County is $7,205.
Families that are below poverty line in Ontonagon County earn $7,205 less on average than the poverty threshold level.
What is Inequality or Gini Index in Ontonagon County?
Inequality or Gini Index in Ontonagon County is 0.41.
What is the Total Population of Ontonagon County?
Total Population of Ontonagon County is 5,862.
What is the Total Male Population of Ontonagon County?
Total Male Population of Ontonagon County is 3,005.
What is the Total Female Population of Ontonagon County?
Total Female Population of Ontonagon County is 2,857.
What is the Ratio of Males per 100 Females in Ontonagon County?
There are 105.18 Males per 100 Females in Ontonagon County.
What is the Ratio of Females per 100 Males in Ontonagon County?
There are 95.07 Females per 100 Males in Ontonagon County.
What is the Median Population Age in Ontonagon County?
Median Population Age in Ontonagon County is 59.2 Years.
What is the Average Family Size in Ontonagon County
Average Family Size in Ontonagon County is 2.5 People.
What is the Average Household Size in Ontonagon County
Average Household Size in Ontonagon County is 2.0 People.
How Large is the Labor Force in Ontonagon County?
There are 2,158 People in the Labor Forcein in Ontonagon County.
What is the Percentage of People in the Labor Force in Ontonagon County?
40.9% of People are in the Labor Force in Ontonagon County.
What is the Unemployment Rate in Ontonagon County?
Unemployment Rate in Ontonagon County is 6.3%.