Mackinac County, MI Map & Demographics
Mackinac County Map
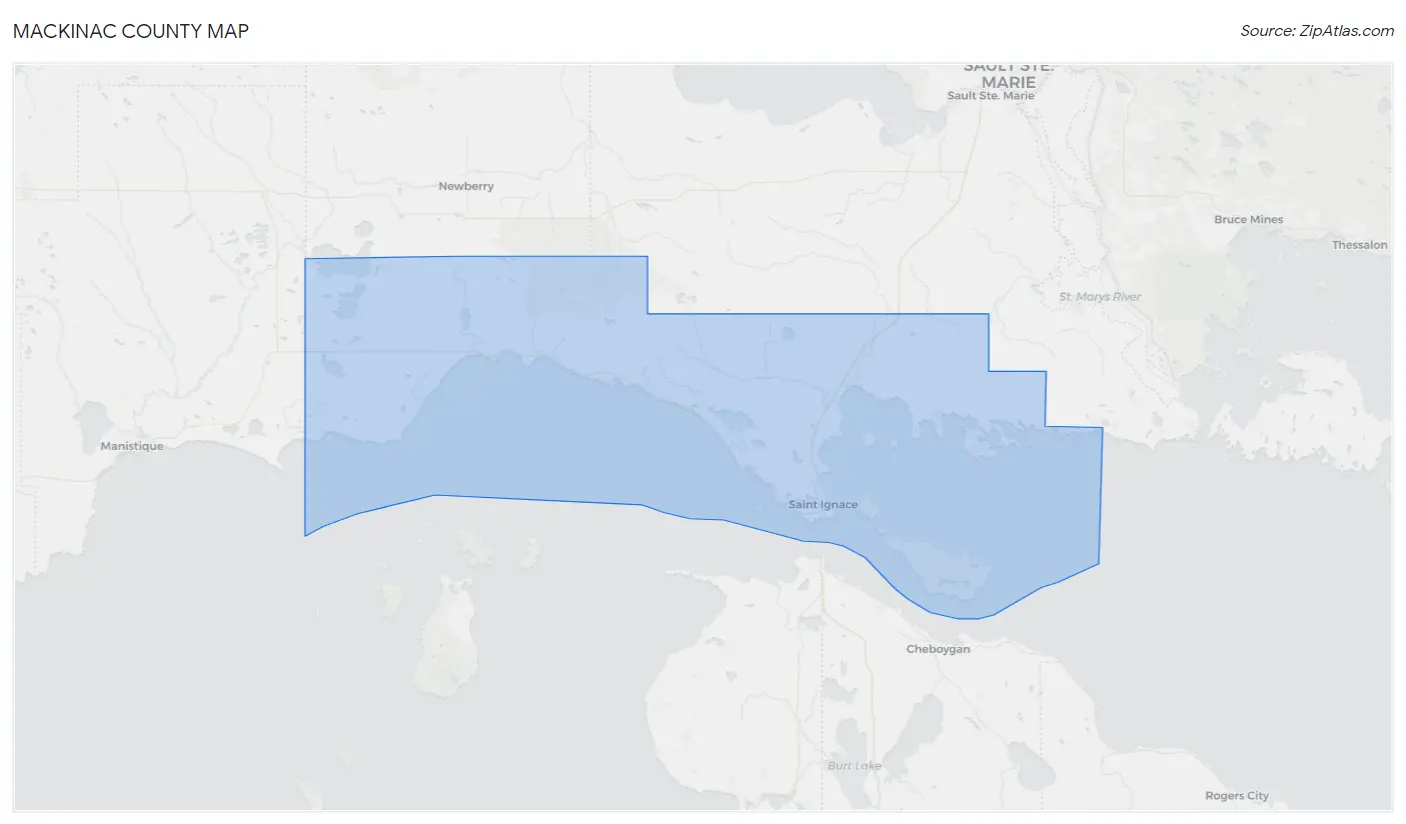
Mackinac County Overview
$35,512
PER CAPITA INCOME
$73,523
AVG FAMILY INCOME
$60,620
AVG HOUSEHOLD INCOME
29.6%
WAGE / INCOME GAP [ % ]
70.4¢/ $1
WAGE / INCOME GAP [ $ ]
$9,883
FAMILY INCOME DEFICIT
0.45
INEQUALITY / GINI INDEX
10,843
TOTAL POPULATION
5,594
MALE POPULATION
5,249
FEMALE POPULATION
106.57
MALES / 100 FEMALES
93.83
FEMALES / 100 MALES
52.7
MEDIAN AGE
2.4
AVG FAMILY SIZE
2.0
AVG HOUSEHOLD SIZE
4,883
LABOR FORCE [ PEOPLE ]
51.9%
PERCENT IN LABOR FORCE
10.1%
UNEMPLOYMENT RATE
Income in Mackinac County
Income Overview in Mackinac County
Per Capita Income in Mackinac County is $35,512, while median incomes of families and households are $73,523 and $60,620 respectively.
| Characteristic | Number | Measure |
| Per Capita Income | 10,843 | $35,512 |
| Median Family Income | 3,193 | $73,523 |
| Mean Family Income | 3,193 | $89,660 |
| Median Household Income | 5,226 | $60,620 |
| Mean Household Income | 5,226 | $76,023 |
| Income Deficit | 3,193 | $9,883 |
| Wage / Income Gap (%) | 10,843 | 29.62% |
| Wage / Income Gap ($) | 10,843 | 70.38¢ per $1 |
| Gini / Inequality Index | 10,843 | 0.45 |
Earnings by Sex in Mackinac County
Average Earnings in Mackinac County are $28,619, $35,024 for men and $24,650 for women, a difference of 29.6%.
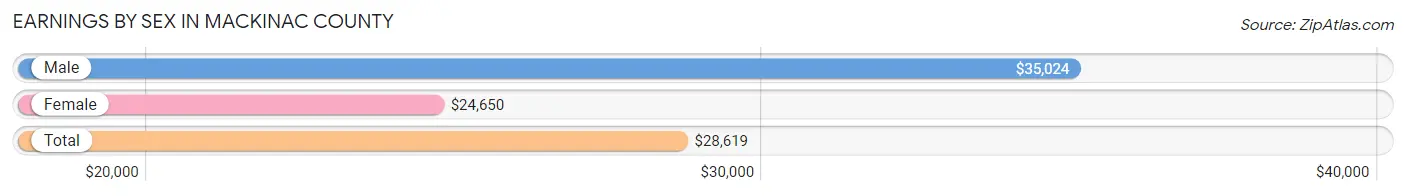
| Sex | Number | Average Earnings |
| Male | 2,792 (51.7%) | $35,024 |
| Female | 2,611 (48.3%) | $24,650 |
| Total | 5,403 (100.0%) | $28,619 |
Earnings by Sex by Income Bracket in Mackinac County
The most common earnings brackets in Mackinac County are $55,000 to $64,999 for men (333 | 11.9%) and $22,500 to $24,999 for women (239 | 9.1%).
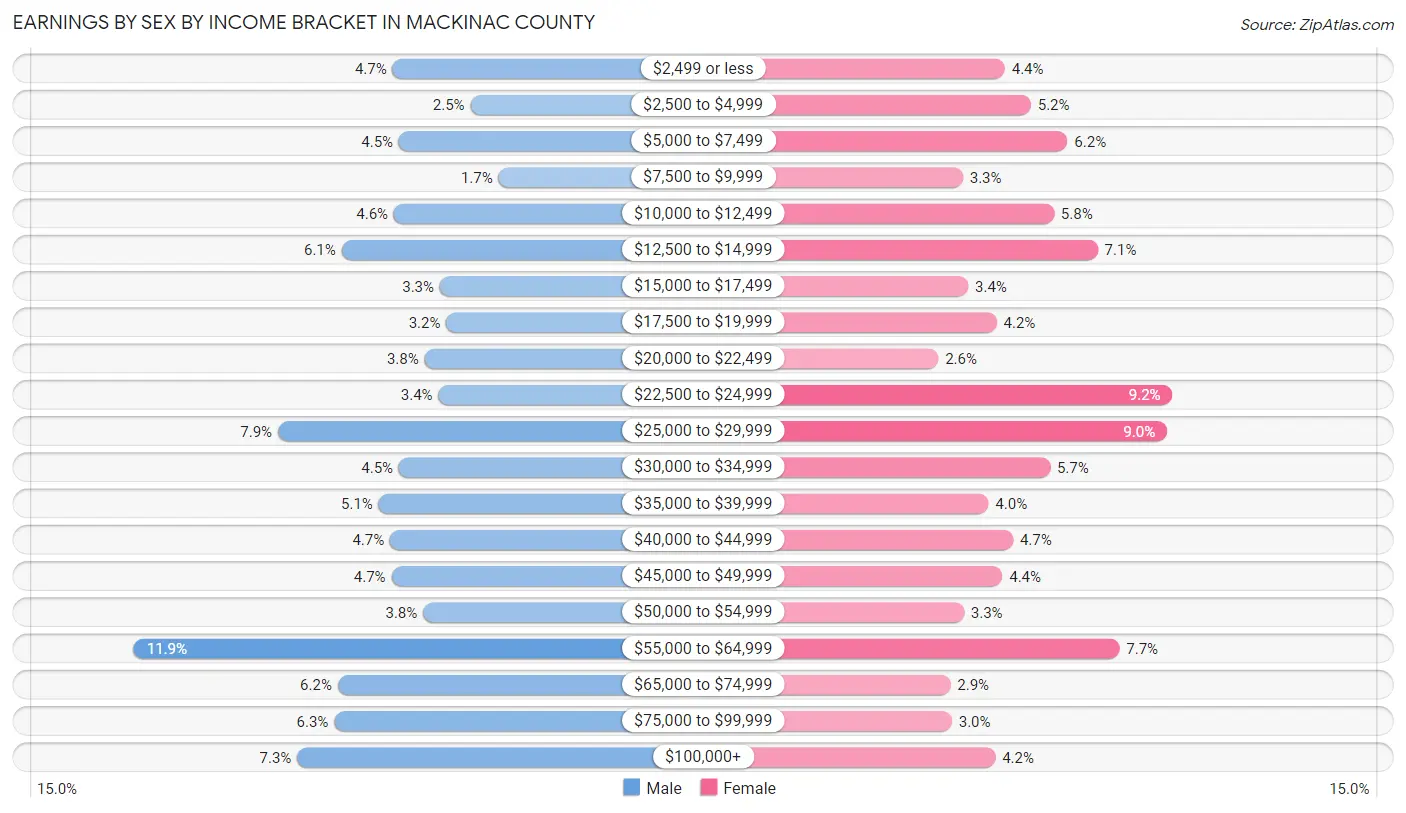
| Income | Male | Female |
| $2,499 or less | 130 (4.7%) | 116 (4.4%) |
| $2,500 to $4,999 | 69 (2.5%) | 135 (5.2%) |
| $5,000 to $7,499 | 125 (4.5%) | 162 (6.2%) |
| $7,500 to $9,999 | 47 (1.7%) | 85 (3.3%) |
| $10,000 to $12,499 | 129 (4.6%) | 152 (5.8%) |
| $12,500 to $14,999 | 170 (6.1%) | 184 (7.0%) |
| $15,000 to $17,499 | 93 (3.3%) | 89 (3.4%) |
| $17,500 to $19,999 | 88 (3.2%) | 110 (4.2%) |
| $20,000 to $22,499 | 105 (3.8%) | 67 (2.6%) |
| $22,500 to $24,999 | 94 (3.4%) | 239 (9.1%) |
| $25,000 to $29,999 | 220 (7.9%) | 235 (9.0%) |
| $30,000 to $34,999 | 125 (4.5%) | 149 (5.7%) |
| $35,000 to $39,999 | 141 (5.1%) | 104 (4.0%) |
| $40,000 to $44,999 | 132 (4.7%) | 122 (4.7%) |
| $45,000 to $49,999 | 131 (4.7%) | 114 (4.4%) |
| $50,000 to $54,999 | 106 (3.8%) | 86 (3.3%) |
| $55,000 to $64,999 | 333 (11.9%) | 200 (7.7%) |
| $65,000 to $74,999 | 173 (6.2%) | 76 (2.9%) |
| $75,000 to $99,999 | 176 (6.3%) | 77 (2.9%) |
| $100,000+ | 205 (7.3%) | 109 (4.2%) |
| Total | 2,792 (100.0%) | 2,611 (100.0%) |
Earnings by Sex by Educational Attainment in Mackinac County
Average earnings in Mackinac County are $40,027 for men and $27,442 for women, a difference of 31.4%. Men with an educational attainment of graduate degree enjoy the highest average annual earnings of $77,721, while those with less than high school education earn the least with $21,096. Women with an educational attainment of graduate degree earn the most with the average annual earnings of $53,750, while those with less than high school education have the smallest earnings of $18,542.
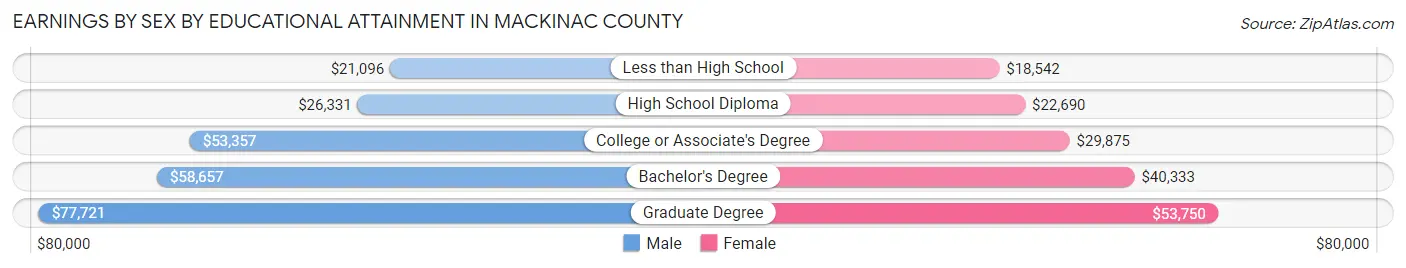
| Educational Attainment | Male Income | Female Income |
| Less than High School | $21,096 | $18,542 |
| High School Diploma | $26,331 | $22,690 |
| College or Associate's Degree | $53,357 | $29,875 |
| Bachelor's Degree | $58,657 | $40,333 |
| Graduate Degree | $77,721 | $53,750 |
| Total | $40,027 | $27,442 |
Family Income in Mackinac County
Family Income Brackets in Mackinac County
According to the Mackinac County family income data, there are 671 families falling into the $100,000 to $149,999 income range, which is the most common income bracket and makes up 21.0% of all families. Conversely, the $10,000 to $14,999 income bracket is the least frequent group with only 93 families (2.9%) belonging to this category.
| Income Bracket | # Families | % Families |
| Less than $10,000 | 96 | 3.0% |
| $10,000 to $14,999 | 93 | 2.9% |
| $15,000 to $24,999 | 224 | 7.0% |
| $25,000 to $34,999 | 239 | 7.5% |
| $35,000 to $49,999 | 351 | 11.0% |
| $50,000 to $74,999 | 639 | 20.0% |
| $75,000 to $99,999 | 533 | 16.7% |
| $100,000 to $149,999 | 671 | 21.0% |
| $150,000 to $199,999 | 172 | 5.4% |
| $200,000+ | 176 | 5.5% |
Family Income by Famaliy Size in Mackinac County
4-person families (294 | 9.2%) account for the highest median family income in Mackinac County with $81,627 per family, while 2-person families (2,090 | 65.5%) have the highest median income of $34,920 per family member.
| Income Bracket | # Families | Median Income |
| 2-Person Families | 2,090 (65.5%) | $69,840 |
| 3-Person Families | 608 (19.0%) | $75,481 |
| 4-Person Families | 294 (9.2%) | $81,627 |
| 5-Person Families | 151 (4.7%) | $69,097 |
| 6-Person Families | 31 (1.0%) | $72,083 |
| 7+ Person Families | 19 (0.6%) | $0 |
| Total | 3,193 (100.0%) | $73,523 |
Family Income by Number of Earners in Mackinac County
The median family income in Mackinac County is $73,523, with families comprising 3+ earners (236) having the highest median family income of $110,417, while families with 1 earner (1,035) have the lowest median family income of $59,420, accounting for 7.4% and 32.4% of families, respectively.
| Number of Earners | # Families | Median Income |
| No Earners | 943 (29.5%) | $61,250 |
| 1 Earner | 1,035 (32.4%) | $59,420 |
| 2 Earners | 979 (30.7%) | $81,683 |
| 3+ Earners | 236 (7.4%) | $110,417 |
| Total | 3,193 (100.0%) | $73,523 |
Household Income in Mackinac County
Household Income Brackets in Mackinac County
With 1,035 households falling in the category, the $50,000 to $74,999 income range is the most frequent in Mackinac County, accounting for 19.8% of all households. In contrast, only 199 households (3.8%) fall into the $200,000+ income bracket, making it the least populous group.
| Income Bracket | # Households | % Households |
| Less than $10,000 | 272 | 5.2% |
| $10,000 to $14,999 | 314 | 6.0% |
| $15,000 to $24,999 | 455 | 8.7% |
| $25,000 to $34,999 | 470 | 9.0% |
| $35,000 to $49,999 | 700 | 13.4% |
| $50,000 to $74,999 | 1,035 | 19.8% |
| $75,000 to $99,999 | 690 | 13.2% |
| $100,000 to $149,999 | 847 | 16.2% |
| $150,000 to $199,999 | 246 | 4.7% |
| $200,000+ | 199 | 3.8% |
Household Income by Householder Age in Mackinac County
The median household income in Mackinac County is $60,620, with the highest median household income of $64,781 found in the 25 to 44 years age bracket for the primary householder. A total of 1,195 households (22.9%) fall into this category. Meanwhile, the 15 to 24 years age bracket for the primary householder has the lowest median household income of $37,104, with 223 households (4.3%) in this group.
| Income Bracket | # Households | Median Income |
| 15 to 24 Years | 223 (4.3%) | $37,104 |
| 25 to 44 Years | 1,195 (22.9%) | $64,781 |
| 45 to 64 Years | 1,817 (34.8%) | $59,830 |
| 65+ Years | 1,991 (38.1%) | $56,016 |
| Total | 5,226 (100.0%) | $60,620 |
Poverty in Mackinac County
Income Below Poverty by Sex and Age in Mackinac County
With 16.3% poverty level for males and 15.3% for females among the residents of Mackinac County, 15 year old males and 5 year old females are the most vulnerable to poverty, with 41 males (51.2%) and 2 females (50.0%) in their respective age groups living below the poverty level.
| Age Bracket | Male | Female |
| Under 5 Years | 71 (34.6%) | 31 (15.4%) |
| 5 Years | 2 (4.5%) | 2 (50.0%) |
| 6 to 11 Years | 57 (23.6%) | 61 (25.0%) |
| 12 to 14 Years | 65 (44.5%) | 53 (37.9%) |
| 15 Years | 41 (51.2%) | 2 (5.4%) |
| 16 and 17 Years | 0 (0.0%) | 9 (8.4%) |
| 18 to 24 Years | 75 (17.1%) | 114 (49.3%) |
| 25 to 34 Years | 131 (23.3%) | 64 (11.6%) |
| 35 to 44 Years | 132 (25.8%) | 123 (23.2%) |
| 45 to 54 Years | 108 (16.4%) | 80 (12.7%) |
| 55 to 64 Years | 119 (12.2%) | 127 (13.5%) |
| 65 to 74 Years | 64 (7.0%) | 64 (7.1%) |
| 75 Years and over | 29 (4.9%) | 61 (9.2%) |
| Total | 894 (16.3%) | 791 (15.3%) |
Income Above Poverty by Sex and Age in Mackinac County
According to the poverty statistics in Mackinac County, males aged 16 and 17 years and females aged 15 years are the age groups that are most secure financially, with 100.0% of males and 94.6% of females in these age groups living above the poverty line.
| Age Bracket | Male | Female |
| Under 5 Years | 134 (65.4%) | 170 (84.6%) |
| 5 Years | 42 (95.5%) | 2 (50.0%) |
| 6 to 11 Years | 184 (76.3%) | 183 (75.0%) |
| 12 to 14 Years | 81 (55.5%) | 87 (62.1%) |
| 15 Years | 39 (48.7%) | 35 (94.6%) |
| 16 and 17 Years | 107 (100.0%) | 98 (91.6%) |
| 18 to 24 Years | 365 (83.0%) | 117 (50.6%) |
| 25 to 34 Years | 432 (76.7%) | 487 (88.4%) |
| 35 to 44 Years | 379 (74.2%) | 408 (76.8%) |
| 45 to 54 Years | 551 (83.6%) | 549 (87.3%) |
| 55 to 64 Years | 860 (87.8%) | 811 (86.5%) |
| 65 to 74 Years | 851 (93.0%) | 840 (92.9%) |
| 75 Years and over | 559 (95.1%) | 601 (90.8%) |
| Total | 4,584 (83.7%) | 4,388 (84.7%) |
Income Below Poverty Among Married-Couple Families in Mackinac County
The poverty statistics for married-couple families in Mackinac County show that 4.6% or 115 of the total 2,480 families live below the poverty line. Families with 5 or more children have the highest poverty rate of 55.6%, comprising of 10 families. On the other hand, families with no children have the lowest poverty rate of 3.8%, which includes 71 families.
| Children | Above Poverty | Below Poverty |
| No Children | 1,799 (96.2%) | 71 (3.8%) |
| 1 or 2 Children | 464 (94.9%) | 25 (5.1%) |
| 3 or 4 Children | 94 (91.3%) | 9 (8.7%) |
| 5 or more Children | 8 (44.4%) | 10 (55.6%) |
| Total | 2,365 (95.4%) | 115 (4.6%) |
Income Below Poverty Among Single-Parent Households in Mackinac County
According to the poverty data in Mackinac County, 31.0% or 93 single-father households and 28.6% or 118 single-mother households are living below the poverty line. Among single-father households, those with 1 or 2 children have the highest poverty rate, with 87 households (48.6%) experiencing poverty. Likewise, among single-mother households, those with 3 or 4 children have the highest poverty rate, with 20 households (95.2%) falling below the poverty line.
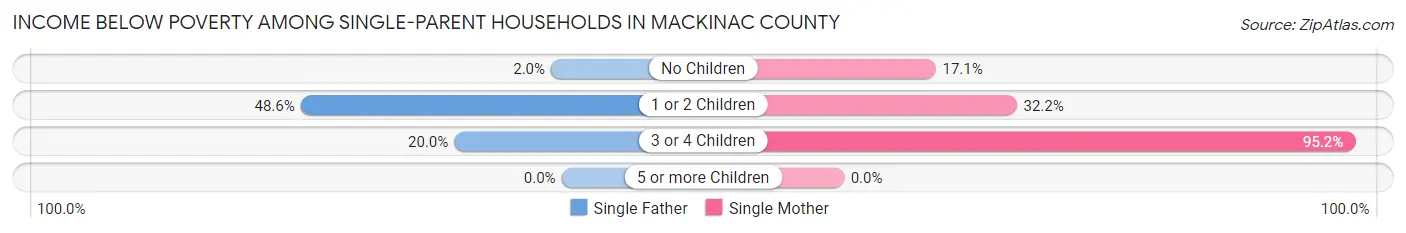
| Children | Single Father | Single Mother |
| No Children | 2 (2.0%) | 32 (17.1%) |
| 1 or 2 Children | 87 (48.6%) | 66 (32.2%) |
| 3 or 4 Children | 4 (20.0%) | 20 (95.2%) |
| 5 or more Children | 0 (0.0%) | 0 (0.0%) |
| Total | 93 (31.0%) | 118 (28.6%) |
Income Below Poverty Among Married-Couple vs Single-Parent Households in Mackinac County
The poverty data for Mackinac County shows that 115 of the married-couple family households (4.6%) and 211 of the single-parent households (29.6%) are living below the poverty level. Within the married-couple family households, those with 5 or more children have the highest poverty rate, with 10 households (55.6%) falling below the poverty line. Among the single-parent households, those with 3 or 4 children have the highest poverty rate, with 24 household (58.5%) living below poverty.
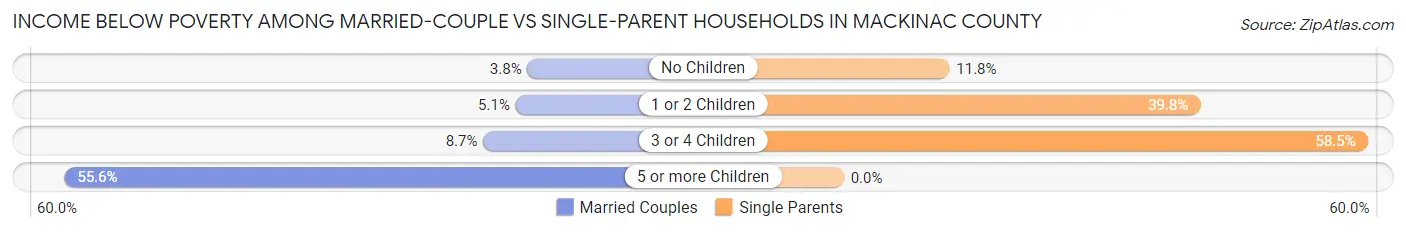
| Children | Married-Couple Families | Single-Parent Households |
| No Children | 71 (3.8%) | 34 (11.8%) |
| 1 or 2 Children | 25 (5.1%) | 153 (39.8%) |
| 3 or 4 Children | 9 (8.7%) | 24 (58.5%) |
| 5 or more Children | 10 (55.6%) | 0 (0.0%) |
| Total | 115 (4.6%) | 211 (29.6%) |
Race in Mackinac County
The most populous races in Mackinac County are White / Caucasian (7,851 | 72.4%), Native / Alaskan (1,586 | 14.6%), and Two or more Races (783 | 7.2%).
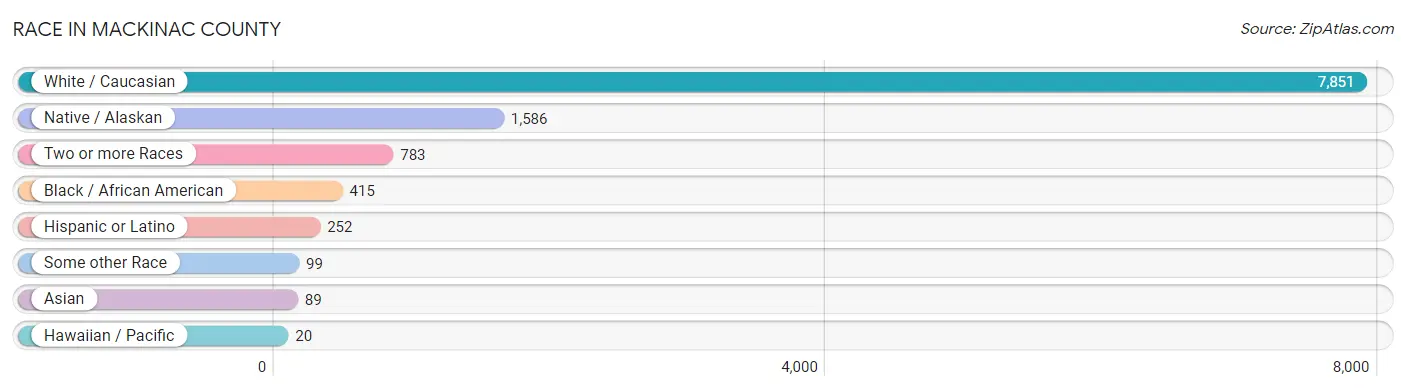
| Race | # Population | % Population |
| Asian | 89 | 0.8% |
| Black / African American | 415 | 3.8% |
| Hawaiian / Pacific | 20 | 0.2% |
| Hispanic or Latino | 252 | 2.3% |
| Native / Alaskan | 1,586 | 14.6% |
| White / Caucasian | 7,851 | 72.4% |
| Two or more Races | 783 | 7.2% |
| Some other Race | 99 | 0.9% |
| Total | 10,843 | 100.0% |
Ancestry in Mackinac County
The most populous ancestries reported in Mackinac County are German (2,157 | 19.9%), Chippewa (1,744 | 16.1%), English (1,231 | 11.4%), Irish (1,110 | 10.2%), and Polish (781 | 7.2%), together accounting for 64.8% of all Mackinac County residents.
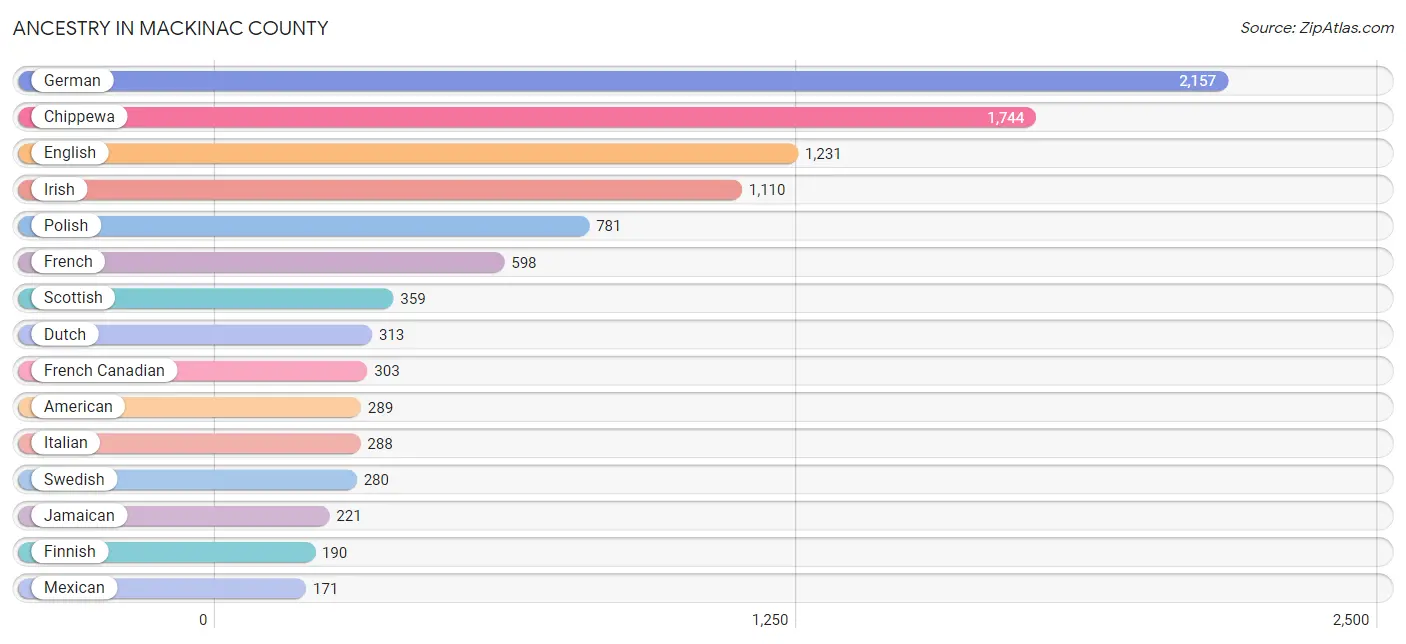
| Ancestry | # Population | % Population |
| Alaska Native | 2 | 0.0% |
| American | 289 | 2.7% |
| Arab | 16 | 0.2% |
| Arapaho | 8 | 0.1% |
| Armenian | 9 | 0.1% |
| Assyrian / Chaldean / Syriac | 1 | 0.0% |
| Austrian | 18 | 0.2% |
| Belgian | 9 | 0.1% |
| Bhutanese | 66 | 0.6% |
| Blackfeet | 3 | 0.0% |
| Bolivian | 1 | 0.0% |
| British | 85 | 0.8% |
| Burmese | 12 | 0.1% |
| Canadian | 19 | 0.2% |
| Central American | 15 | 0.1% |
| Cherokee | 37 | 0.3% |
| Chippewa | 1,744 | 16.1% |
| Choctaw | 2 | 0.0% |
| Colombian | 2 | 0.0% |
| Costa Rican | 11 | 0.1% |
| Creek | 2 | 0.0% |
| Croatian | 42 | 0.4% |
| Cuban | 6 | 0.1% |
| Czech | 37 | 0.3% |
| Czechoslovakian | 5 | 0.1% |
| Danish | 69 | 0.6% |
| Dutch | 313 | 2.9% |
| Eastern European | 11 | 0.1% |
| English | 1,231 | 11.4% |
| European | 76 | 0.7% |
| Finnish | 190 | 1.8% |
| French | 598 | 5.5% |
| French American Indian | 5 | 0.1% |
| French Canadian | 303 | 2.8% |
| German | 2,157 | 19.9% |
| Greek | 7 | 0.1% |
| Guamanian / Chamorro | 7 | 0.1% |
| Guatemalan | 1 | 0.0% |
| Honduran | 3 | 0.0% |
| Hungarian | 55 | 0.5% |
| Indian (Asian) | 49 | 0.4% |
| Inupiat | 2 | 0.0% |
| Irish | 1,110 | 10.2% |
| Iroquois | 12 | 0.1% |
| Italian | 288 | 2.7% |
| Jamaican | 221 | 2.0% |
| Japanese | 41 | 0.4% |
| Jordanian | 10 | 0.1% |
| Korean | 74 | 0.7% |
| Lebanese | 6 | 0.1% |
| Lithuanian | 15 | 0.1% |
| Macedonian | 19 | 0.2% |
| Mexican | 171 | 1.6% |
| Nigerian | 17 | 0.2% |
| Northern European | 15 | 0.1% |
| Norwegian | 112 | 1.0% |
| Ottawa | 40 | 0.4% |
| Pennsylvania German | 81 | 0.7% |
| Peruvian | 2 | 0.0% |
| Polish | 781 | 7.2% |
| Portuguese | 3 | 0.0% |
| Puerto Rican | 13 | 0.1% |
| Russian | 18 | 0.2% |
| Samoan | 6 | 0.1% |
| Scandinavian | 94 | 0.9% |
| Scotch-Irish | 56 | 0.5% |
| Scottish | 359 | 3.3% |
| Sioux | 21 | 0.2% |
| Slavic | 2 | 0.0% |
| Slovak | 3 | 0.0% |
| South American | 5 | 0.1% |
| Spaniard | 42 | 0.4% |
| Sri Lankan | 59 | 0.5% |
| Subsaharan African | 17 | 0.2% |
| Swedish | 280 | 2.6% |
| Swiss | 49 | 0.4% |
| Ukrainian | 13 | 0.1% |
| Vietnamese | 19 | 0.2% |
| Welsh | 146 | 1.3% |
| Yugoslavian | 14 | 0.1% | View All 80 Rows |
Immigrants in Mackinac County
The most numerous immigrant groups reported in Mackinac County came from Latin America (380 | 3.5%), Caribbean (265 | 2.4%), Jamaica (265 | 2.4%), Central America (113 | 1.0%), and Mexico (102 | 0.9%), together accounting for 10.4% of all Mackinac County residents.
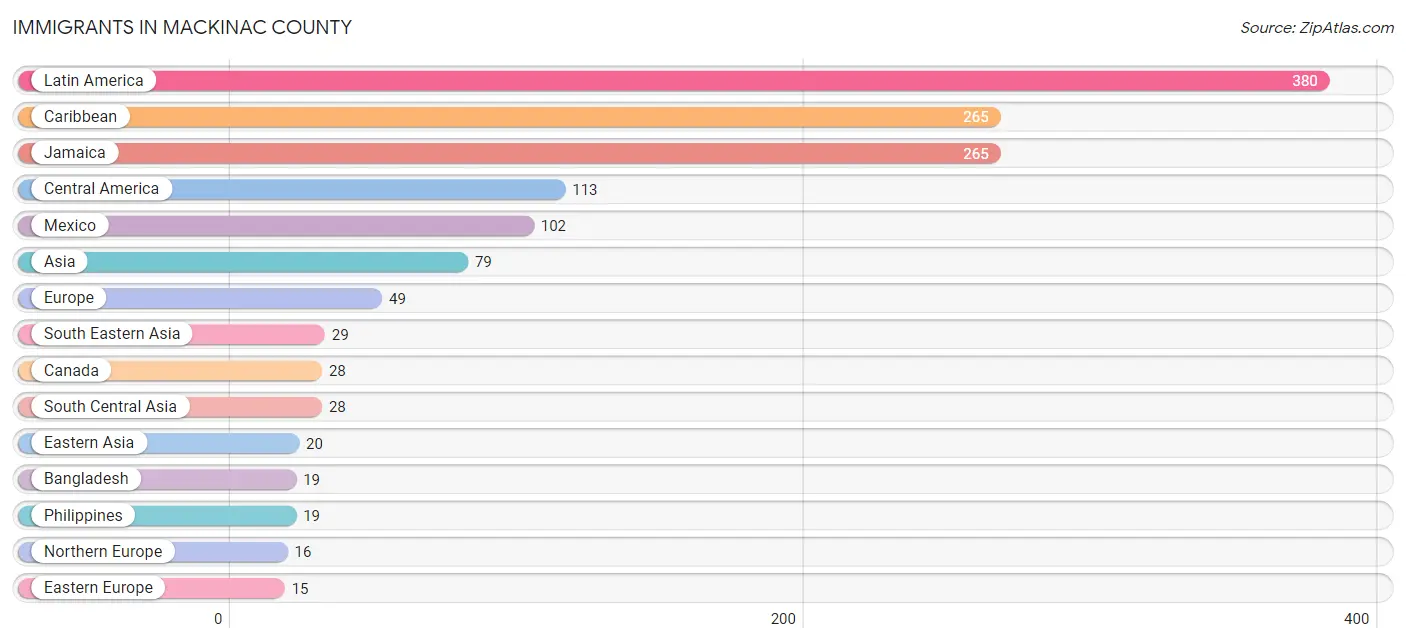
| Immigration Origin | # Population | % Population |
| Africa | 2 | 0.0% |
| Asia | 79 | 0.7% |
| Australia | 3 | 0.0% |
| Bangladesh | 19 | 0.2% |
| Bosnia and Herzegovina | 4 | 0.0% |
| Canada | 28 | 0.3% |
| Caribbean | 265 | 2.4% |
| Central America | 113 | 1.0% |
| China | 8 | 0.1% |
| Costa Rica | 11 | 0.1% |
| Czechoslovakia | 10 | 0.1% |
| Denmark | 3 | 0.0% |
| Eastern Asia | 20 | 0.2% |
| Eastern Europe | 15 | 0.1% |
| Europe | 49 | 0.4% |
| Fiji | 7 | 0.1% |
| Germany | 11 | 0.1% |
| Iraq | 2 | 0.0% |
| Italy | 2 | 0.0% |
| Jamaica | 265 | 2.4% |
| Korea | 12 | 0.1% |
| Latin America | 380 | 3.5% |
| Mexico | 102 | 0.9% |
| Nigeria | 2 | 0.0% |
| Northern Europe | 16 | 0.2% |
| Norway | 2 | 0.0% |
| Oceania | 10 | 0.1% |
| Pakistan | 9 | 0.1% |
| Peru | 2 | 0.0% |
| Philippines | 19 | 0.2% |
| Russia | 1 | 0.0% |
| Scotland | 8 | 0.1% |
| South America | 2 | 0.0% |
| South Central Asia | 28 | 0.3% |
| South Eastern Asia | 29 | 0.3% |
| Southern Europe | 7 | 0.1% |
| Spain | 5 | 0.1% |
| Vietnam | 10 | 0.1% |
| Western Africa | 2 | 0.0% |
| Western Asia | 2 | 0.0% |
| Western Europe | 11 | 0.1% | View All 41 Rows |
Sex and Age in Mackinac County
Sex and Age in Mackinac County
The most populous age groups in Mackinac County are 55 to 59 Years (494 | 8.8%) for men and 65 to 69 Years (517 | 9.9%) for women.
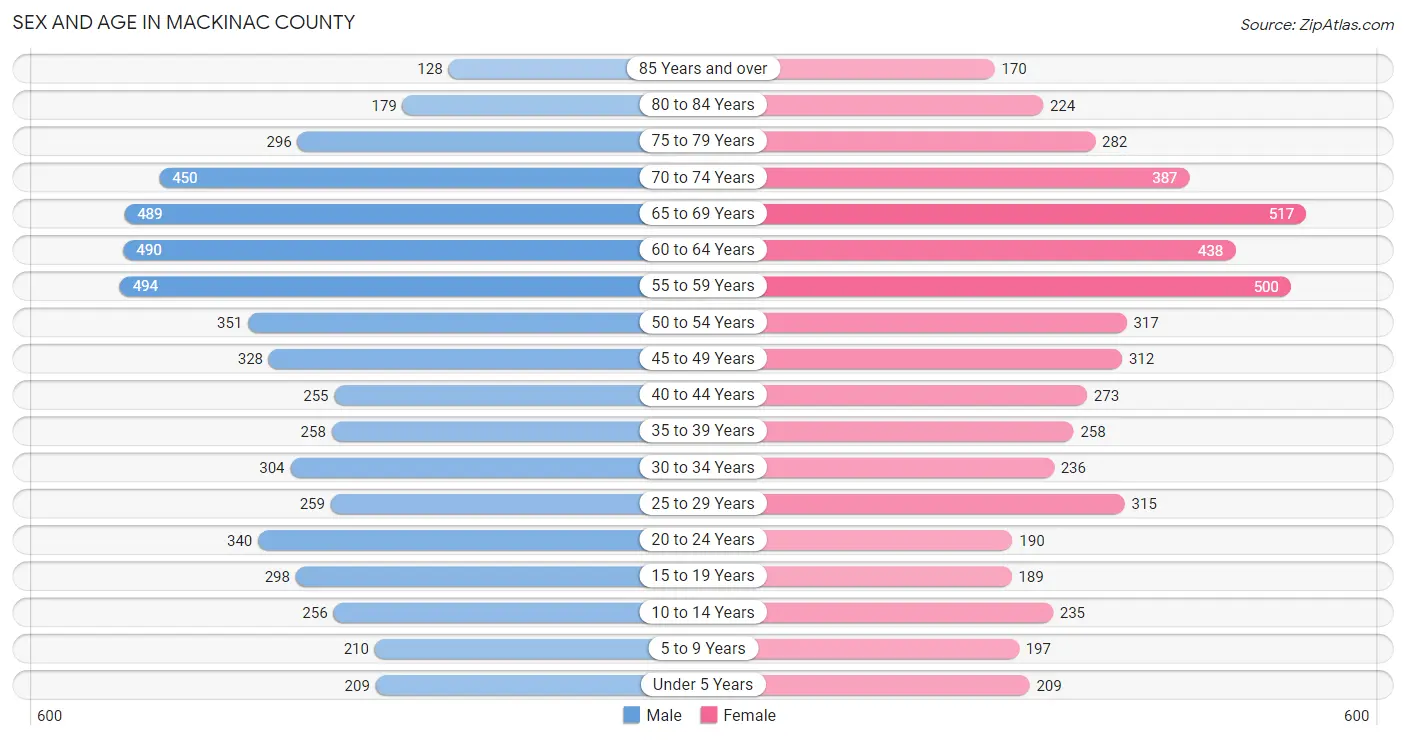
| Age Bracket | Male | Female |
| Under 5 Years | 209 (3.7%) | 209 (4.0%) |
| 5 to 9 Years | 210 (3.7%) | 197 (3.7%) |
| 10 to 14 Years | 256 (4.6%) | 235 (4.5%) |
| 15 to 19 Years | 298 (5.3%) | 189 (3.6%) |
| 20 to 24 Years | 340 (6.1%) | 190 (3.6%) |
| 25 to 29 Years | 259 (4.6%) | 315 (6.0%) |
| 30 to 34 Years | 304 (5.4%) | 236 (4.5%) |
| 35 to 39 Years | 258 (4.6%) | 258 (4.9%) |
| 40 to 44 Years | 255 (4.6%) | 273 (5.2%) |
| 45 to 49 Years | 328 (5.9%) | 312 (5.9%) |
| 50 to 54 Years | 351 (6.3%) | 317 (6.0%) |
| 55 to 59 Years | 494 (8.8%) | 500 (9.5%) |
| 60 to 64 Years | 490 (8.8%) | 438 (8.3%) |
| 65 to 69 Years | 489 (8.7%) | 517 (9.9%) |
| 70 to 74 Years | 450 (8.0%) | 387 (7.4%) |
| 75 to 79 Years | 296 (5.3%) | 282 (5.4%) |
| 80 to 84 Years | 179 (3.2%) | 224 (4.3%) |
| 85 Years and over | 128 (2.3%) | 170 (3.2%) |
| Total | 5,594 (100.0%) | 5,249 (100.0%) |
Families and Households in Mackinac County
Median Family Size in Mackinac County
The median family size in Mackinac County is 2.40 persons per family, with married-couple families (2,480 | 77.7%) accounting for the largest median family size of 2.48 persons per family. On the other hand, single male/father families (300 | 9.4%) represent the smallest median family size with 2.03 persons per family.
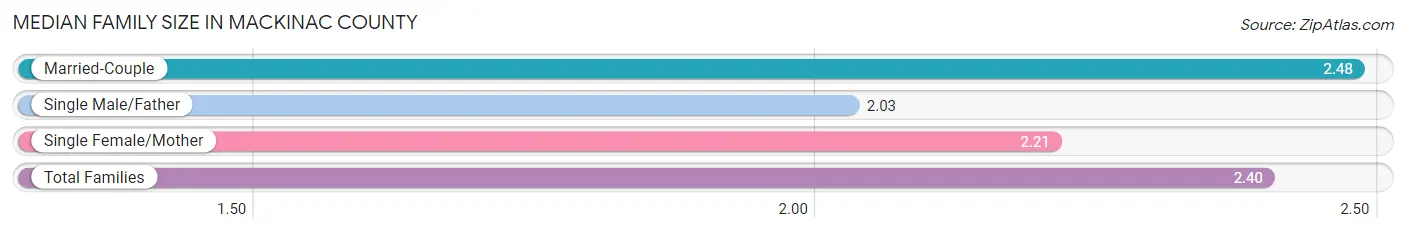
| Family Type | # Families | Family Size |
| Married-Couple | 2,480 (77.7%) | 2.48 |
| Single Male/Father | 300 (9.4%) | 2.03 |
| Single Female/Mother | 413 (12.9%) | 2.21 |
| Total Families | 3,193 (100.0%) | 2.40 |
Median Household Size in Mackinac County
The median household size in Mackinac County is 2.01 persons per household, with single female/mother households (413 | 7.9%) accounting for the largest median household size of 2.65 persons per household. non-family households (2,033 | 38.9%) represent the smallest median household size with 1.24 persons per household.
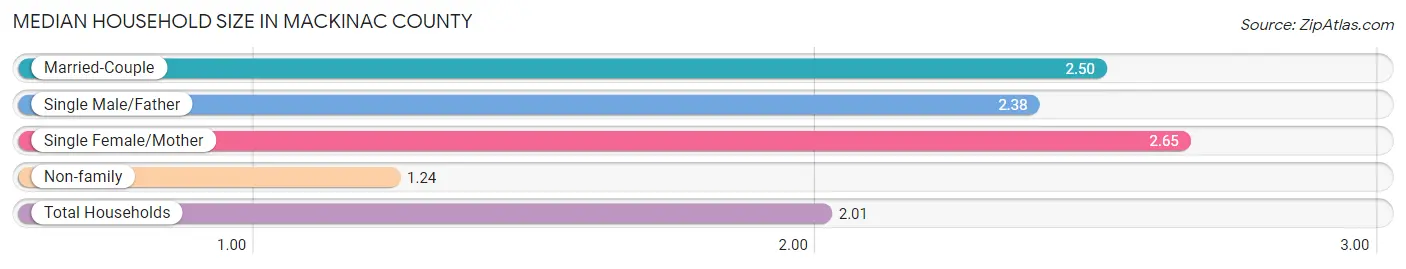
| Household Type | # Households | Household Size |
| Married-Couple | 2,480 (47.5%) | 2.50 |
| Single Male/Father | 300 (5.7%) | 2.38 |
| Single Female/Mother | 413 (7.9%) | 2.65 |
| Non-family | 2,033 (38.9%) | 1.24 |
| Total Households | 5,226 (100.0%) | 2.01 |
Household Size by Marriage Status in Mackinac County
Out of a total of 5,226 households in Mackinac County, 3,193 (61.1%) are family households, while 2,033 (38.9%) are nonfamily households. The most numerous type of family households are 2-person households, comprising 2,002, and the most common type of nonfamily households are 1-person households, comprising 1,658.
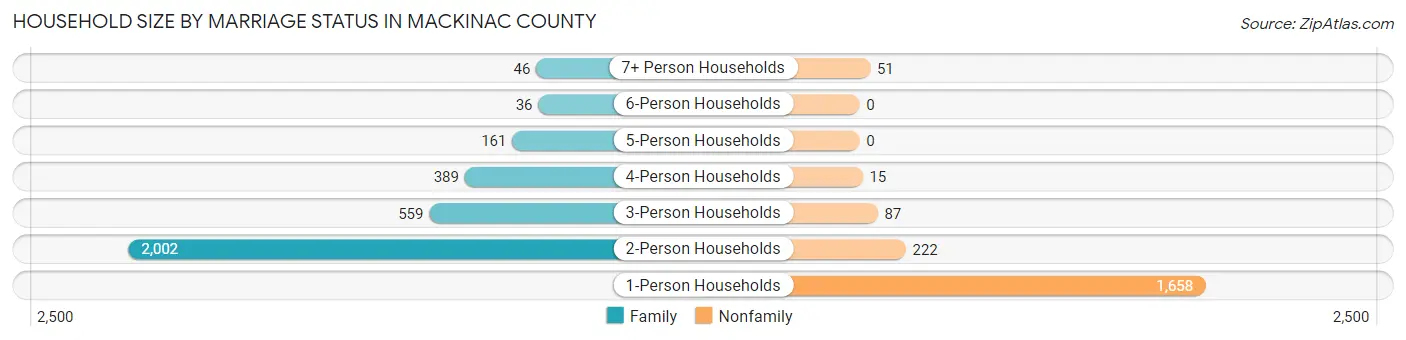
| Household Size | Family Households | Nonfamily Households |
| 1-Person Households | - | 1,658 (31.7%) |
| 2-Person Households | 2,002 (38.3%) | 222 (4.3%) |
| 3-Person Households | 559 (10.7%) | 87 (1.7%) |
| 4-Person Households | 389 (7.4%) | 15 (0.3%) |
| 5-Person Households | 161 (3.1%) | 0 (0.0%) |
| 6-Person Households | 36 (0.7%) | 0 (0.0%) |
| 7+ Person Households | 46 (0.9%) | 51 (1.0%) |
| Total | 3,193 (61.1%) | 2,033 (38.9%) |
Female Fertility in Mackinac County
Fertility by Age in Mackinac County
Average fertility rate in Mackinac County is 64.0 births per 1,000 women. Women in the age bracket of 20 to 34 years have the highest fertility rate with 147.0 births per 1,000 women. Women in the age bracket of 20 to 34 years acount for 93.2% of all women with births.
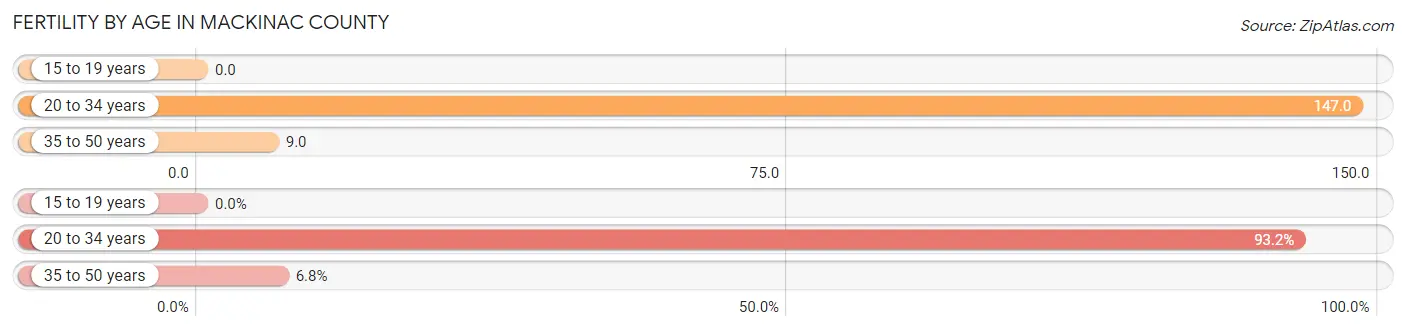
| Age Bracket | Women with Births | Births / 1,000 Women |
| 15 to 19 years | 0 (0.0%) | 0.0 |
| 20 to 34 years | 109 (93.2%) | 147.0 |
| 35 to 50 years | 8 (6.8%) | 9.0 |
| Total | 117 (100.0%) | 64.0 |
Fertility by Age by Marriage Status in Mackinac County
42.7% of women with births (117) in Mackinac County are married. The highest percentage of unmarried women with births falls into 20 to 34 years age bracket with 61.5% of them unmarried at the time of birth, while the lowest percentage of unmarried women with births belong to 35 to 50 years age bracket with 0.0% of them unmarried.
| Age Bracket | Married | Unmarried |
| 15 to 19 years | 0 (0.0%) | 0 (0.0%) |
| 20 to 34 years | 42 (38.5%) | 67 (61.5%) |
| 35 to 50 years | 8 (100.0%) | 0 (0.0%) |
| Total | 50 (42.7%) | 67 (57.3%) |
Fertility by Education in Mackinac County
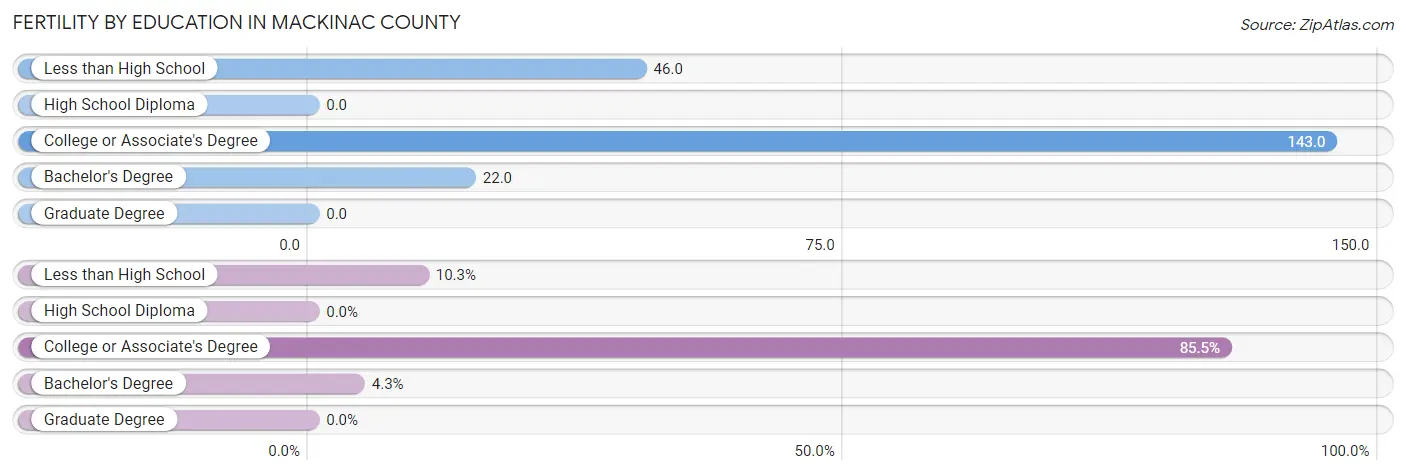
| Educational Attainment | Women with Births | Births / 1,000 Women |
| Less than High School | 12 (10.3%) | 46.0 |
| High School Diploma | 0 (0.0%) | 0.0 |
| College or Associate's Degree | 100 (85.5%) | 143.0 |
| Bachelor's Degree | 5 (4.3%) | 22.0 |
| Graduate Degree | 0 (0.0%) | 0.0 |
| Total | 117 (100.0%) | 64.0 |
Fertility by Education by Marriage Status in Mackinac County
57.3% of women with births in Mackinac County are unmarried. Women with the educational attainment of bachelor's degree are most likely to be married with 100.0% of them married at childbirth, while women with the educational attainment of less than high school are least likely to be married with 100.0% of them unmarried at childbirth.
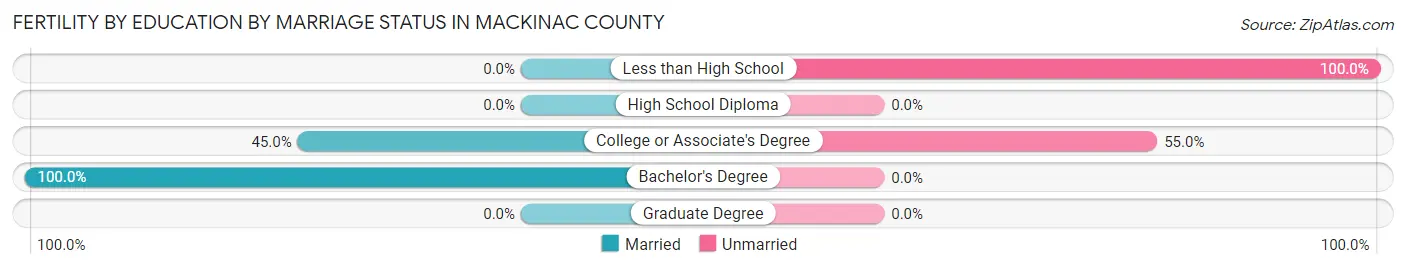
| Educational Attainment | Married | Unmarried |
| Less than High School | 0 (0.0%) | 12 (100.0%) |
| High School Diploma | 0 (0.0%) | 0 (0.0%) |
| College or Associate's Degree | 45 (45.0%) | 55 (55.0%) |
| Bachelor's Degree | 5 (100.0%) | 0 (0.0%) |
| Graduate Degree | 0 (0.0%) | 0 (0.0%) |
| Total | 50 (42.7%) | 67 (57.3%) |
Employment Characteristics in Mackinac County
Employment by Class of Employer in Mackinac County
Among the 4,287 employed individuals in Mackinac County, private company employees (2,353 | 54.9%), not-for-profit organizations (445 | 10.4%), and local government employees (439 | 10.2%) make up the most common classes of employment.
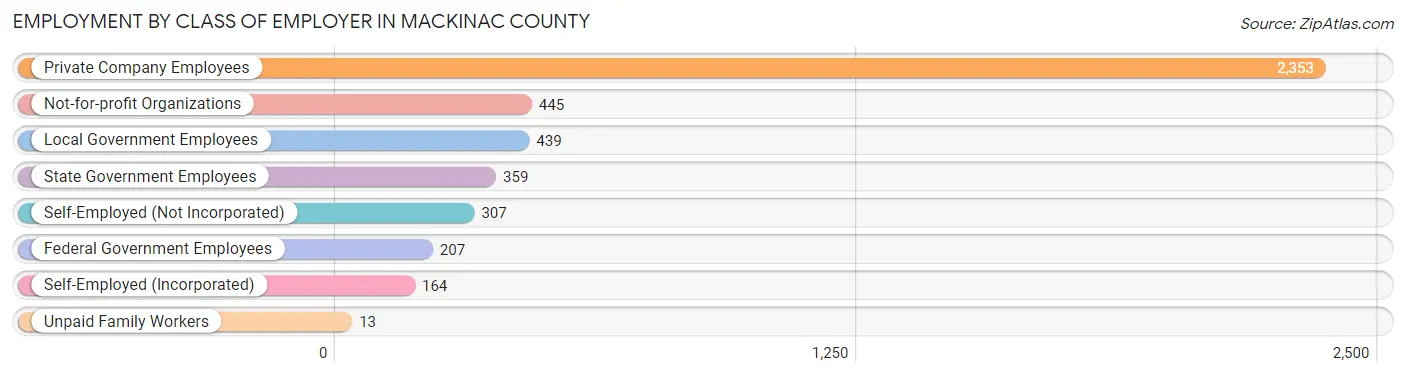
| Employer Class | # Employees | % Employees |
| Private Company Employees | 2,353 | 54.9% |
| Self-Employed (Incorporated) | 164 | 3.8% |
| Self-Employed (Not Incorporated) | 307 | 7.2% |
| Not-for-profit Organizations | 445 | 10.4% |
| Local Government Employees | 439 | 10.2% |
| State Government Employees | 359 | 8.4% |
| Federal Government Employees | 207 | 4.8% |
| Unpaid Family Workers | 13 | 0.3% |
| Total | 4,287 | 100.0% |
Employment Status by Age in Mackinac County
According to the labor force statistics for Mackinac County, out of the total population over 16 years of age (9,409), 51.9% or 4,883 individuals are in the labor force, with 10.1% or 493 of them unemployed. The age group with the highest labor force participation rate is 30 to 34 years, with 86.1% or 465 individuals in the labor force. Within the labor force, the 16 to 19 years age range has the highest percentage of unemployed individuals, with 21.2% or 33 of them being unemployed.
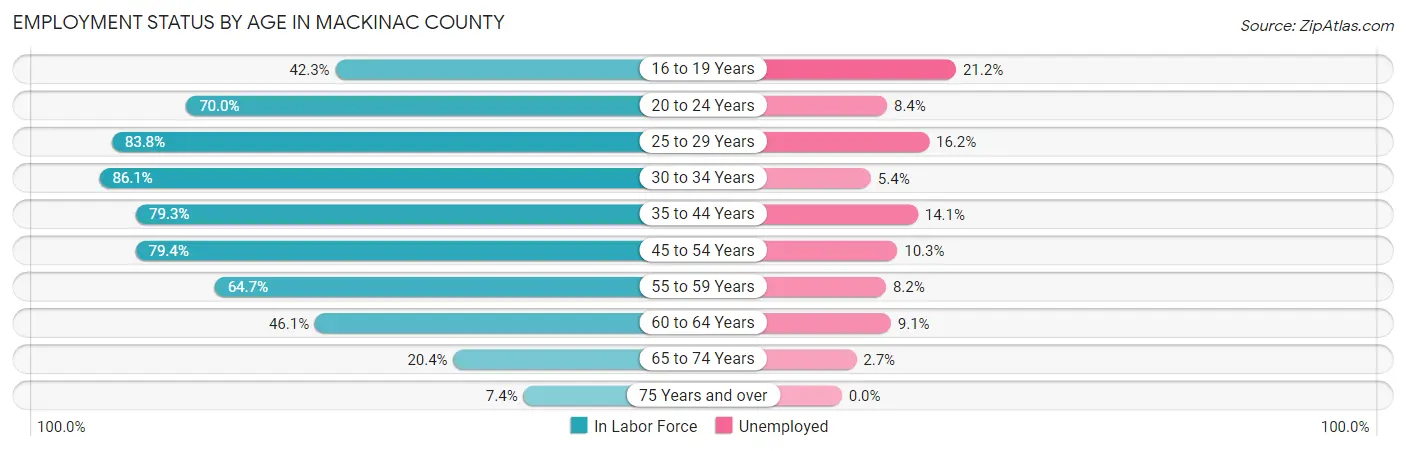
| Age Bracket | In Labor Force | Unemployed |
| 16 to 19 Years | 156 (42.3%) | 33 (21.2%) |
| 20 to 24 Years | 371 (70.0%) | 31 (8.4%) |
| 25 to 29 Years | 481 (83.8%) | 78 (16.2%) |
| 30 to 34 Years | 465 (86.1%) | 25 (5.4%) |
| 35 to 44 Years | 828 (79.3%) | 117 (14.1%) |
| 45 to 54 Years | 1,039 (79.4%) | 107 (10.3%) |
| 55 to 59 Years | 643 (64.7%) | 53 (8.2%) |
| 60 to 64 Years | 428 (46.1%) | 39 (9.1%) |
| 65 to 74 Years | 376 (20.4%) | 10 (2.7%) |
| 75 Years and over | 95 (7.4%) | 0 (0.0%) |
| Total | 4,883 (51.9%) | 493 (10.1%) |
Employment Status by Educational Attainment in Mackinac County
According to labor force statistics for Mackinac County, 72.1% of individuals (3,885) out of the total population between 25 and 64 years of age (5,388) are in the labor force, with 10.8% or 420 of them being unemployed. The group with the highest labor force participation rate are those with the educational attainment of bachelor's degree or higher, with 79.2% or 909 individuals in the labor force. Within the labor force, individuals with high school diploma education have the highest percentage of unemployment, with 18.4% or 272 of them being unemployed.
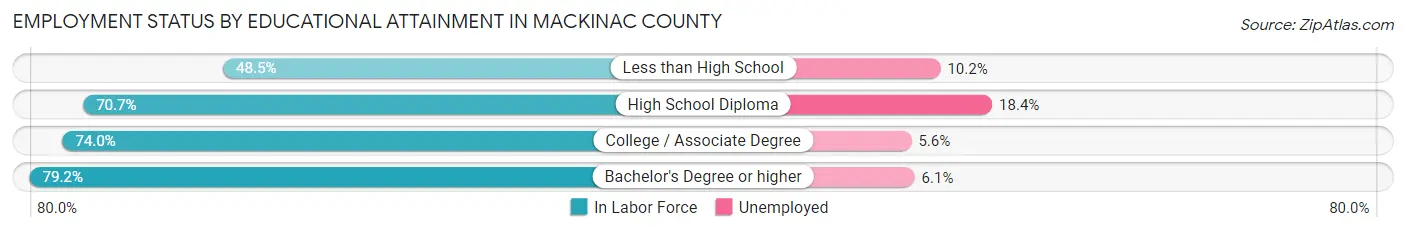
| Educational Attainment | In Labor Force | Unemployed |
| Less than High School | 176 (48.5%) | 37 (10.2%) |
| High School Diploma | 1,477 (70.7%) | 384 (18.4%) |
| College / Associate Degree | 1,323 (74.0%) | 100 (5.6%) |
| Bachelor's Degree or higher | 909 (79.2%) | 70 (6.1%) |
| Total | 3,885 (72.1%) | 582 (10.8%) |
Employment Occupations by Sex in Mackinac County
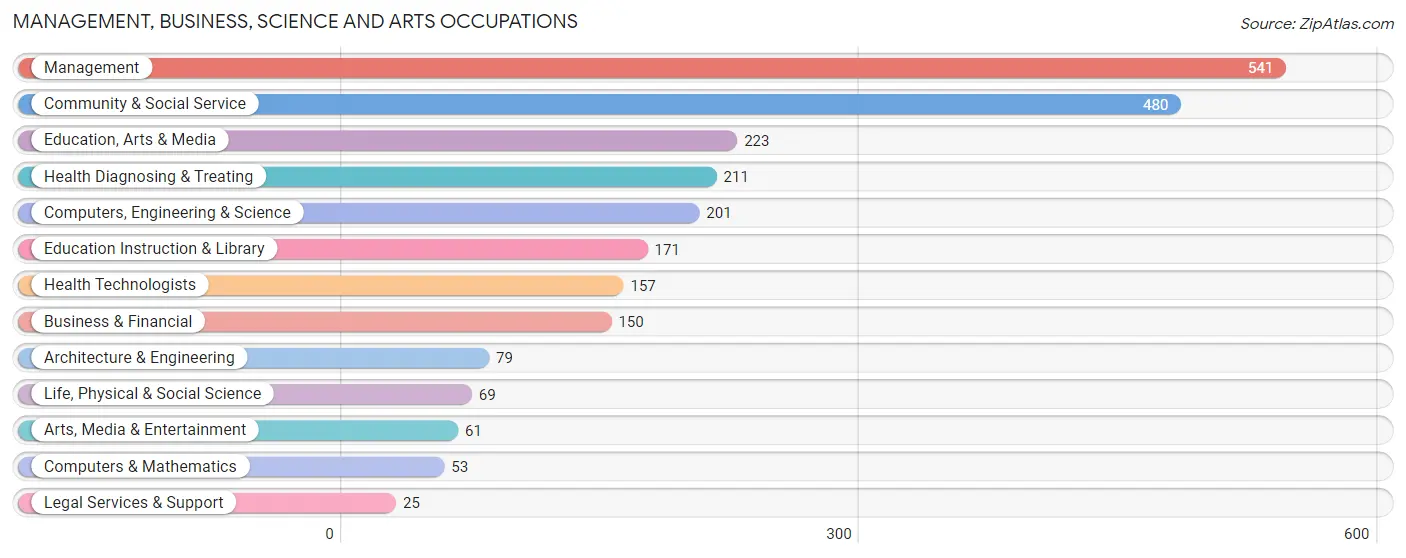
Management, Business, Science and Arts Occupations
The most common Management, Business, Science and Arts occupations in Mackinac County are Management (541 | 12.4%), Community & Social Service (480 | 11.0%), Education, Arts & Media (223 | 5.1%), Health Diagnosing & Treating (211 | 4.9%), and Computers, Engineering & Science (201 | 4.6%).
Management, Business, Science and Arts Occupations by Sex
Within the Management, Business, Science and Arts occupations in Mackinac County, the most male-oriented occupations are Architecture & Engineering (91.1%), Legal Services & Support (76.0%), and Computers, Engineering & Science (65.7%), while the most female-oriented occupations are Health Diagnosing & Treating (76.8%), Health Technologists (75.8%), and Education Instruction & Library (71.4%).
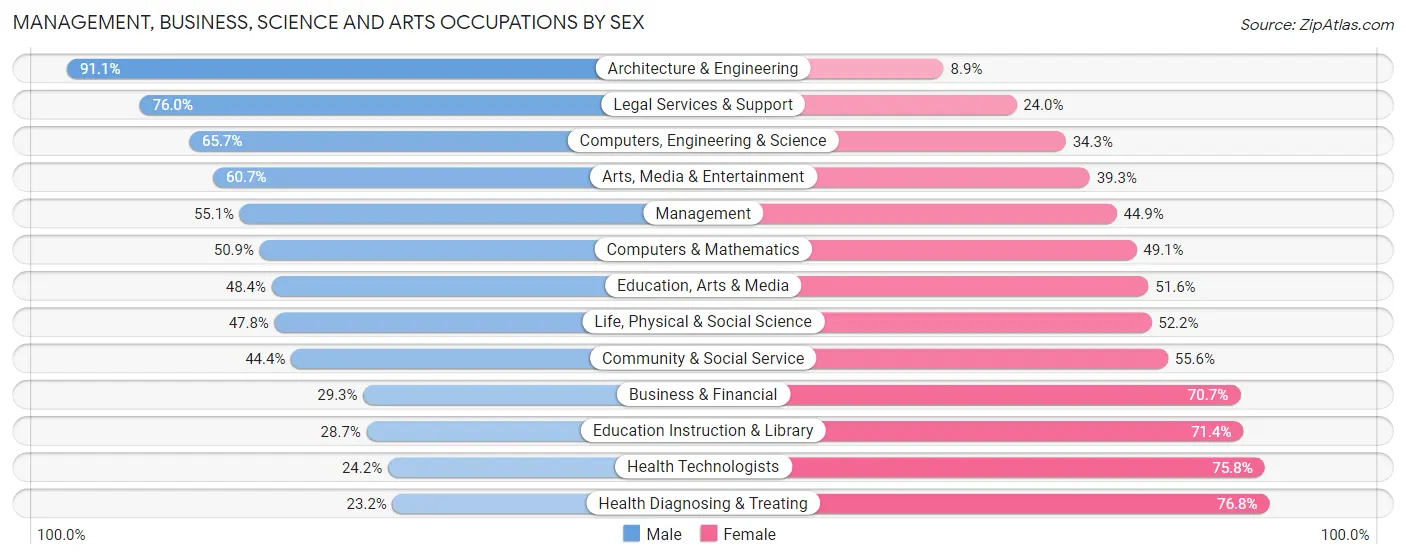
| Occupation | Male | Female |
| Management | 298 (55.1%) | 243 (44.9%) |
| Business & Financial | 44 (29.3%) | 106 (70.7%) |
| Computers, Engineering & Science | 132 (65.7%) | 69 (34.3%) |
| Computers & Mathematics | 27 (50.9%) | 26 (49.1%) |
| Architecture & Engineering | 72 (91.1%) | 7 (8.9%) |
| Life, Physical & Social Science | 33 (47.8%) | 36 (52.2%) |
| Community & Social Service | 213 (44.4%) | 267 (55.6%) |
| Education, Arts & Media | 108 (48.4%) | 115 (51.6%) |
| Legal Services & Support | 19 (76.0%) | 6 (24.0%) |
| Education Instruction & Library | 49 (28.6%) | 122 (71.4%) |
| Arts, Media & Entertainment | 37 (60.7%) | 24 (39.3%) |
| Health Diagnosing & Treating | 49 (23.2%) | 162 (76.8%) |
| Health Technologists | 38 (24.2%) | 119 (75.8%) |
| Total (Category) | 736 (46.5%) | 847 (53.5%) |
| Total (Overall) | 2,172 (49.9%) | 2,177 (50.1%) |
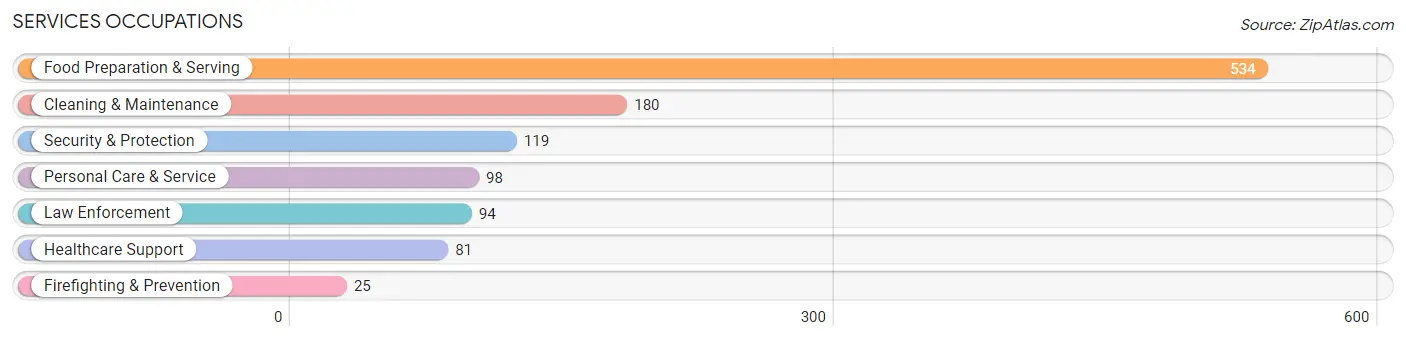
Services Occupations
The most common Services occupations in Mackinac County are Food Preparation & Serving (534 | 12.3%), Cleaning & Maintenance (180 | 4.1%), Security & Protection (119 | 2.7%), Personal Care & Service (98 | 2.2%), and Law Enforcement (94 | 2.2%).
Services Occupations by Sex
Within the Services occupations in Mackinac County, the most male-oriented occupations are Firefighting & Prevention (100.0%), Security & Protection (89.9%), and Law Enforcement (87.2%), while the most female-oriented occupations are Healthcare Support (92.6%), Food Preparation & Serving (60.5%), and Personal Care & Service (59.2%).
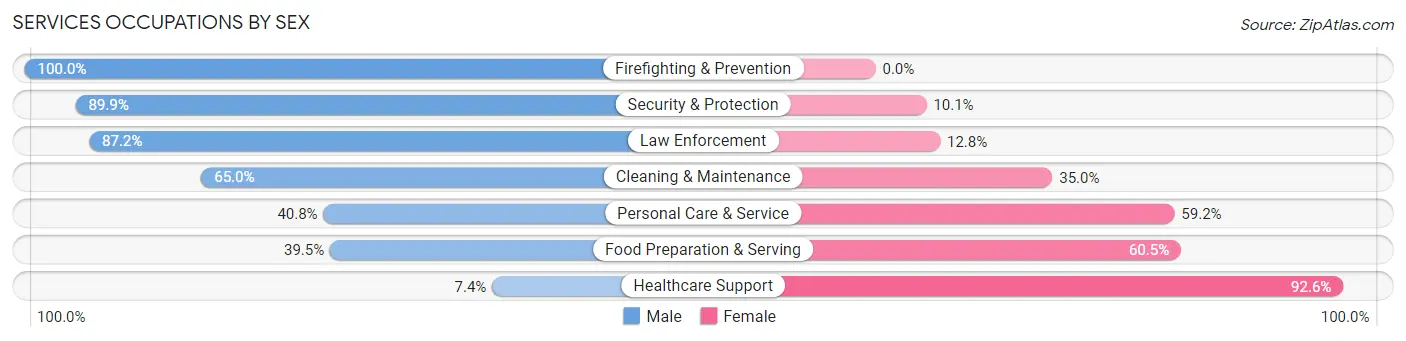
| Occupation | Male | Female |
| Healthcare Support | 6 (7.4%) | 75 (92.6%) |
| Security & Protection | 107 (89.9%) | 12 (10.1%) |
| Firefighting & Prevention | 25 (100.0%) | 0 (0.0%) |
| Law Enforcement | 82 (87.2%) | 12 (12.8%) |
| Food Preparation & Serving | 211 (39.5%) | 323 (60.5%) |
| Cleaning & Maintenance | 117 (65.0%) | 63 (35.0%) |
| Personal Care & Service | 40 (40.8%) | 58 (59.2%) |
| Total (Category) | 481 (47.5%) | 531 (52.5%) |
| Total (Overall) | 2,172 (49.9%) | 2,177 (50.1%) |
Sales and Office Occupations
The most common Sales and Office occupations in Mackinac County are Sales & Related (440 | 10.1%), and Office & Administration (377 | 8.7%).

Sales and Office Occupations by Sex

| Occupation | Male | Female |
| Sales & Related | 110 (25.0%) | 330 (75.0%) |
| Office & Administration | 42 (11.1%) | 335 (88.9%) |
| Total (Category) | 152 (18.6%) | 665 (81.4%) |
| Total (Overall) | 2,172 (49.9%) | 2,177 (50.1%) |
Natural Resources, Construction and Maintenance Occupations
The most common Natural Resources, Construction and Maintenance occupations in Mackinac County are Construction & Extraction (308 | 7.1%), Installation, Maintenance & Repair (117 | 2.7%), and Farming, Fishing & Forestry (44 | 1.0%).

Natural Resources, Construction and Maintenance Occupations by Sex
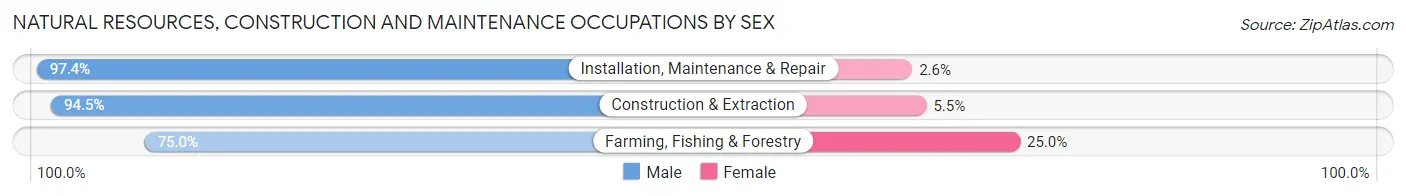
| Occupation | Male | Female |
| Farming, Fishing & Forestry | 33 (75.0%) | 11 (25.0%) |
| Construction & Extraction | 291 (94.5%) | 17 (5.5%) |
| Installation, Maintenance & Repair | 114 (97.4%) | 3 (2.6%) |
| Total (Category) | 438 (93.4%) | 31 (6.6%) |
| Total (Overall) | 2,172 (49.9%) | 2,177 (50.1%) |
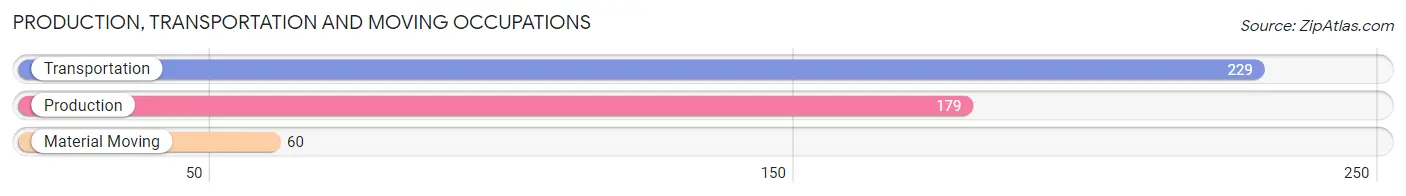
Production, Transportation and Moving Occupations
The most common Production, Transportation and Moving occupations in Mackinac County are Transportation (229 | 5.3%), Production (179 | 4.1%), and Material Moving (60 | 1.4%).
Production, Transportation and Moving Occupations by Sex
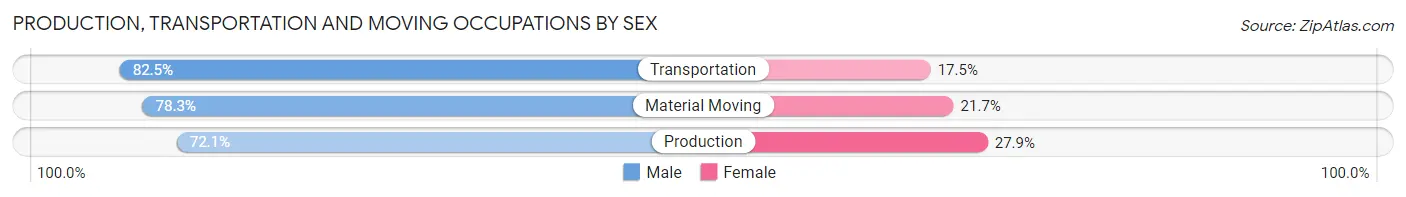
| Occupation | Male | Female |
| Production | 129 (72.1%) | 50 (27.9%) |
| Transportation | 189 (82.5%) | 40 (17.5%) |
| Material Moving | 47 (78.3%) | 13 (21.7%) |
| Total (Category) | 365 (78.0%) | 103 (22.0%) |
| Total (Overall) | 2,172 (49.9%) | 2,177 (50.1%) |
Employment Industries by Sex in Mackinac County
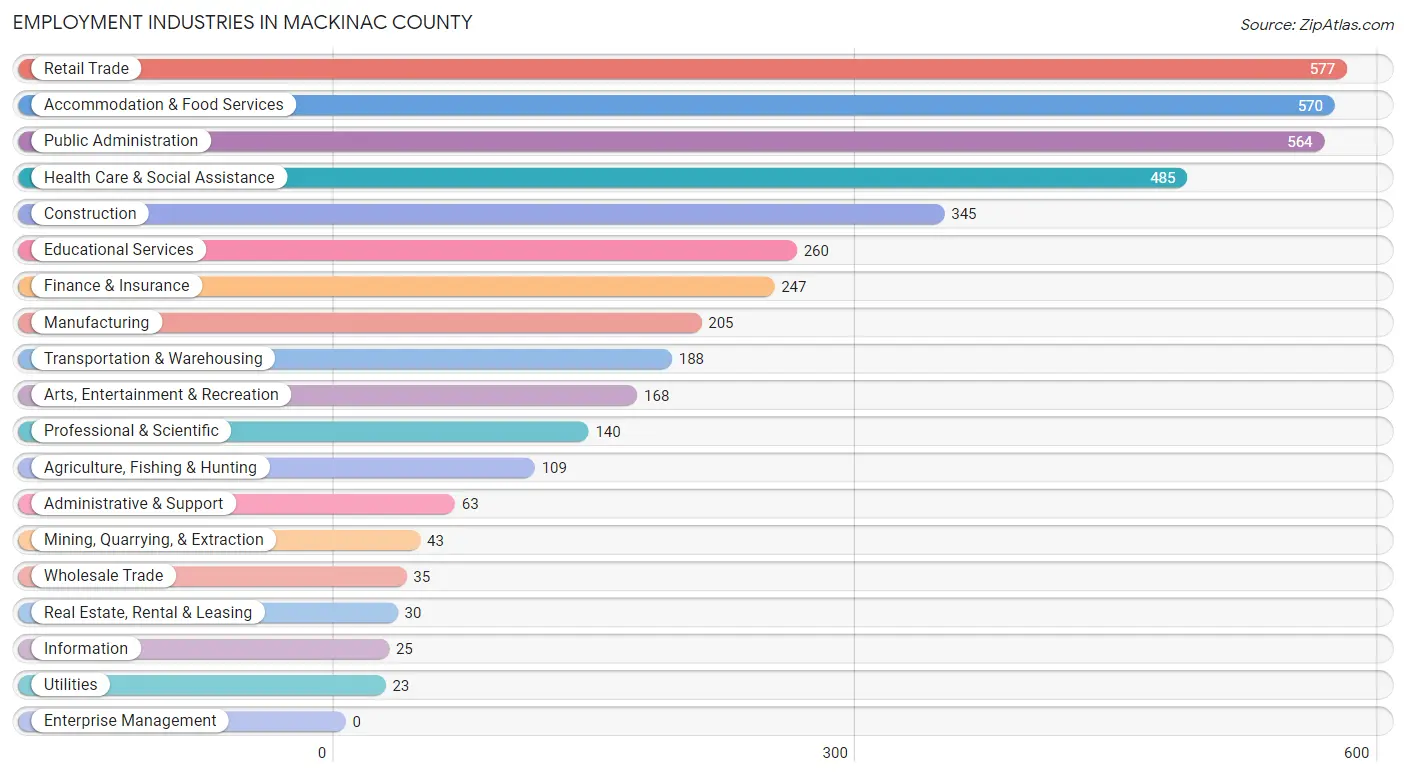
Employment Industries in Mackinac County
The major employment industries in Mackinac County include Retail Trade (577 | 13.3%), Accommodation & Food Services (570 | 13.1%), Public Administration (564 | 13.0%), Health Care & Social Assistance (485 | 11.2%), and Construction (345 | 7.9%).
Employment Industries by Sex in Mackinac County
The Mackinac County industries that see more men than women are Mining, Quarrying, & Extraction (100.0%), Wholesale Trade (100.0%), and Utilities (100.0%), whereas the industries that tend to have a higher number of women are Information (84.0%), Finance & Insurance (83.4%), and Health Care & Social Assistance (81.4%).
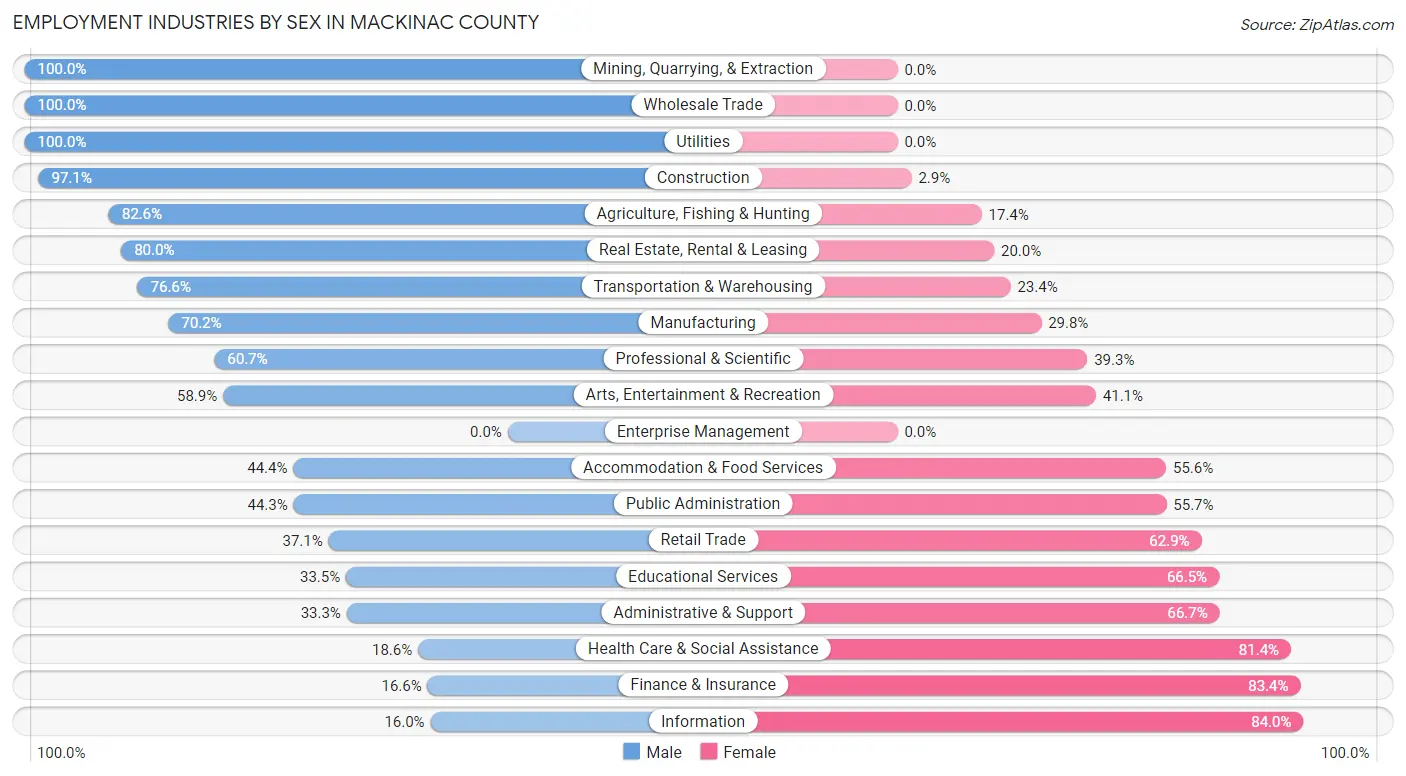
| Industry | Male | Female |
| Agriculture, Fishing & Hunting | 90 (82.6%) | 19 (17.4%) |
| Mining, Quarrying, & Extraction | 43 (100.0%) | 0 (0.0%) |
| Construction | 335 (97.1%) | 10 (2.9%) |
| Manufacturing | 144 (70.2%) | 61 (29.8%) |
| Wholesale Trade | 35 (100.0%) | 0 (0.0%) |
| Retail Trade | 214 (37.1%) | 363 (62.9%) |
| Transportation & Warehousing | 144 (76.6%) | 44 (23.4%) |
| Utilities | 23 (100.0%) | 0 (0.0%) |
| Information | 4 (16.0%) | 21 (84.0%) |
| Finance & Insurance | 41 (16.6%) | 206 (83.4%) |
| Real Estate, Rental & Leasing | 24 (80.0%) | 6 (20.0%) |
| Professional & Scientific | 85 (60.7%) | 55 (39.3%) |
| Enterprise Management | 0 (0.0%) | 0 (0.0%) |
| Administrative & Support | 21 (33.3%) | 42 (66.7%) |
| Educational Services | 87 (33.5%) | 173 (66.5%) |
| Health Care & Social Assistance | 90 (18.6%) | 395 (81.4%) |
| Arts, Entertainment & Recreation | 99 (58.9%) | 69 (41.1%) |
| Accommodation & Food Services | 253 (44.4%) | 317 (55.6%) |
| Public Administration | 250 (44.3%) | 314 (55.7%) |
| Total | 2,172 (49.9%) | 2,177 (50.1%) |
Education in Mackinac County
School Enrollment in Mackinac County
The most common levels of schooling among the 1,591 students in Mackinac County are high school (422 | 26.5%), elementary school (365 | 22.9%), and middle school (349 | 21.9%).
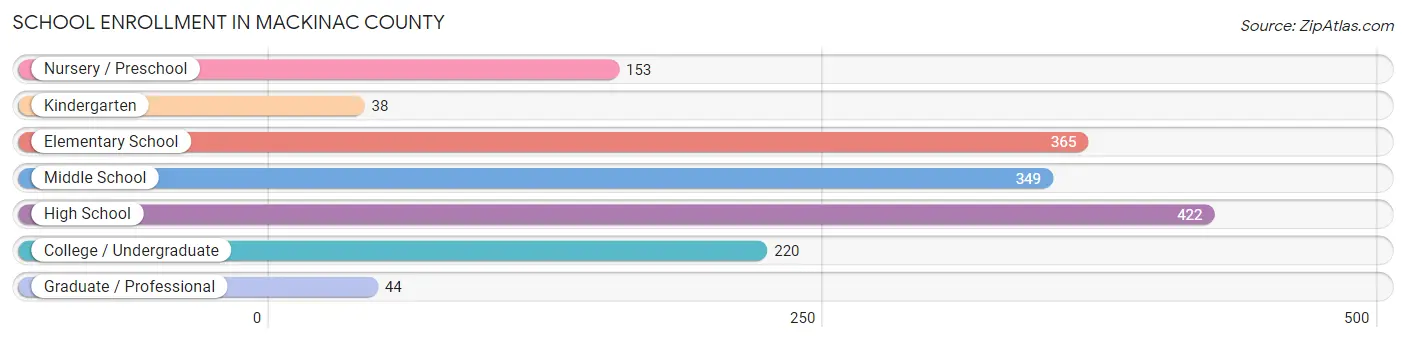
| School Level | # Students | % Students |
| Nursery / Preschool | 153 | 9.6% |
| Kindergarten | 38 | 2.4% |
| Elementary School | 365 | 22.9% |
| Middle School | 349 | 21.9% |
| High School | 422 | 26.5% |
| College / Undergraduate | 220 | 13.8% |
| Graduate / Professional | 44 | 2.8% |
| Total | 1,591 | 100.0% |
School Enrollment by Age by Funding Source in Mackinac County
Out of a total of 1,591 students who are enrolled in schools in Mackinac County, 235 (14.8%) attend a private institution, while the remaining 1,356 (85.2%) are enrolled in public schools. The age group of 20 to 24 year olds has the highest likelihood of being enrolled in private schools, with 37 (48.0% in the age bracket) enrolled. Conversely, the age group of 18 to 19 year olds has the lowest likelihood of being enrolled in a private school, with 114 (97.4% in the age bracket) attending a public institution.
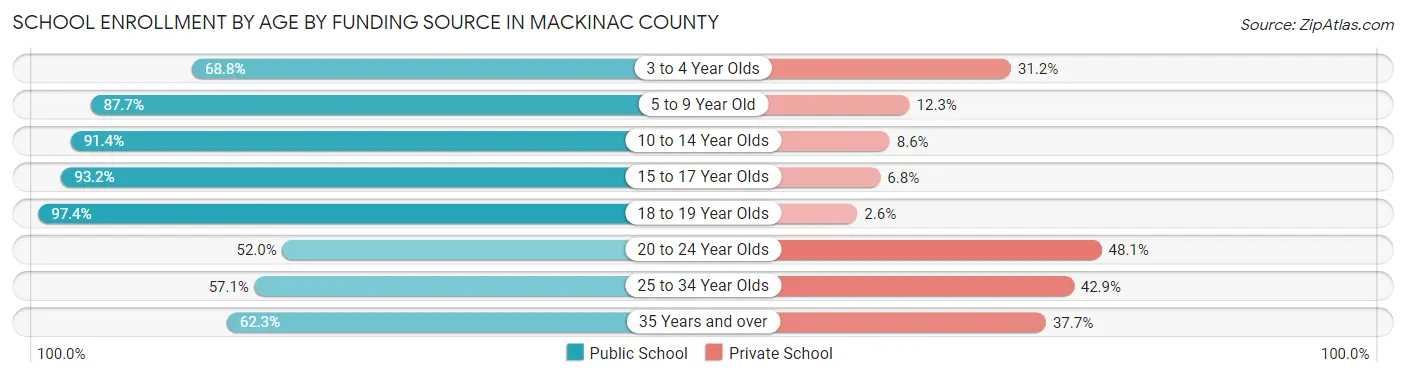
| Age Bracket | Public School | Private School |
| 3 to 4 Year Olds | 75 (68.8%) | 34 (31.2%) |
| 5 to 9 Year Old | 357 (87.7%) | 50 (12.3%) |
| 10 to 14 Year Olds | 404 (91.4%) | 38 (8.6%) |
| 15 to 17 Year Olds | 286 (93.2%) | 21 (6.8%) |
| 18 to 19 Year Olds | 114 (97.4%) | 3 (2.6%) |
| 20 to 24 Year Olds | 40 (51.9%) | 37 (48.0%) |
| 25 to 34 Year Olds | 36 (57.1%) | 27 (42.9%) |
| 35 Years and over | 43 (62.3%) | 26 (37.7%) |
| Total | 1,356 (85.2%) | 235 (14.8%) |
Educational Attainment by Field of Study in Mackinac County
Education (520 | 22.2%), business (439 | 18.7%), science & technology (246 | 10.5%), bio, nature & agricultural (211 | 9.0%), and social sciences (183 | 7.8%) are the most common fields of study among 2,348 individuals in Mackinac County who have obtained a bachelor's degree or higher.
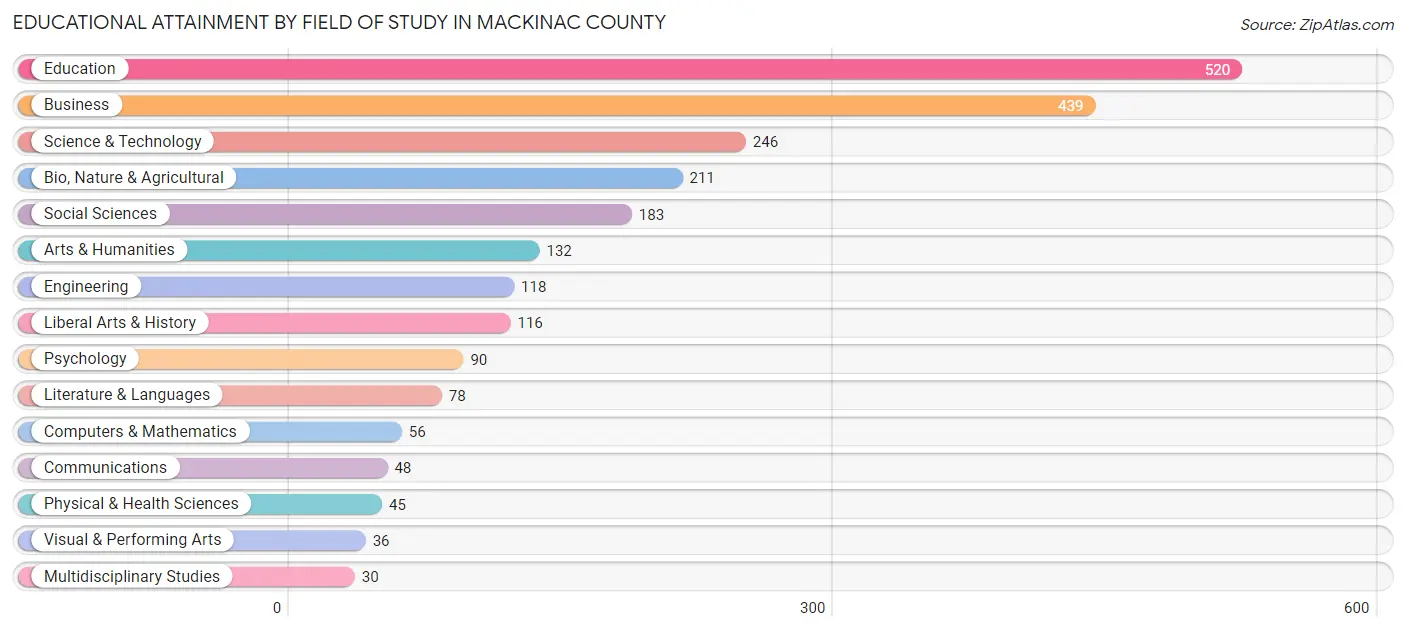
| Field of Study | # Graduates | % Graduates |
| Computers & Mathematics | 56 | 2.4% |
| Bio, Nature & Agricultural | 211 | 9.0% |
| Physical & Health Sciences | 45 | 1.9% |
| Psychology | 90 | 3.8% |
| Social Sciences | 183 | 7.8% |
| Engineering | 118 | 5.0% |
| Multidisciplinary Studies | 30 | 1.3% |
| Science & Technology | 246 | 10.5% |
| Business | 439 | 18.7% |
| Education | 520 | 22.2% |
| Literature & Languages | 78 | 3.3% |
| Liberal Arts & History | 116 | 4.9% |
| Visual & Performing Arts | 36 | 1.5% |
| Communications | 48 | 2.0% |
| Arts & Humanities | 132 | 5.6% |
| Total | 2,348 | 100.0% |
Transportation & Commute in Mackinac County
Vehicle Availability by Sex in Mackinac County
The most prevalent vehicle ownership categories in Mackinac County are males with 2 vehicles (761, accounting for 36.6%) and females with 2 vehicles (716, making up 36.9%).
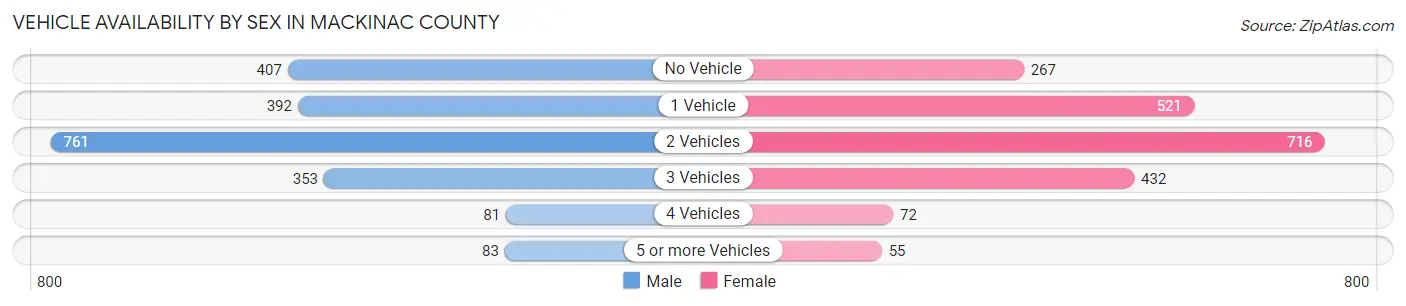
| Vehicles Available | Male | Female |
| No Vehicle | 407 (19.6%) | 267 (12.9%) |
| 1 Vehicle | 392 (18.9%) | 521 (25.3%) |
| 2 Vehicles | 761 (36.6%) | 716 (34.7%) |
| 3 Vehicles | 353 (17.0%) | 432 (20.9%) |
| 4 Vehicles | 81 (3.9%) | 72 (3.5%) |
| 5 or more Vehicles | 83 (4.0%) | 55 (2.7%) |
| Total | 2,077 (100.0%) | 2,063 (100.0%) |
Commute Time in Mackinac County
The most frequently occuring commute durations in Mackinac County are 5 to 9 minutes (984 commuters, 25.1%), 10 to 14 minutes (545 commuters, 13.9%), and less than 5 minutes (541 commuters, 13.8%).
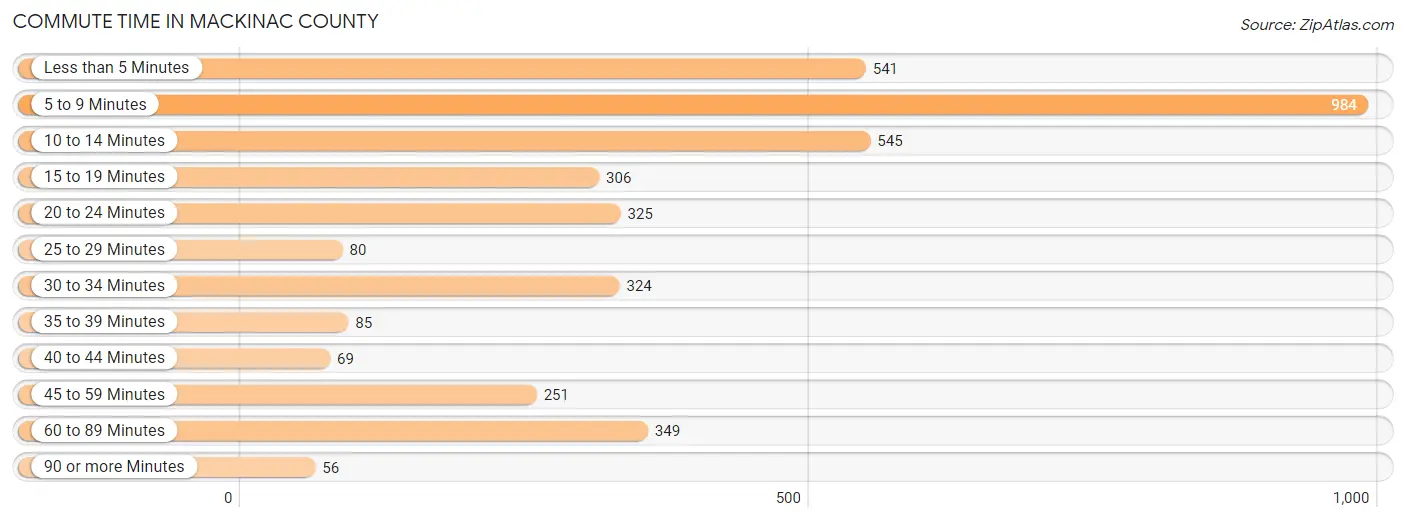
| Commute Time | # Commuters | % Commuters |
| Less than 5 Minutes | 541 | 13.8% |
| 5 to 9 Minutes | 984 | 25.1% |
| 10 to 14 Minutes | 545 | 13.9% |
| 15 to 19 Minutes | 306 | 7.8% |
| 20 to 24 Minutes | 325 | 8.3% |
| 25 to 29 Minutes | 80 | 2.0% |
| 30 to 34 Minutes | 324 | 8.3% |
| 35 to 39 Minutes | 85 | 2.2% |
| 40 to 44 Minutes | 69 | 1.8% |
| 45 to 59 Minutes | 251 | 6.4% |
| 60 to 89 Minutes | 349 | 8.9% |
| 90 or more Minutes | 56 | 1.4% |
Commute Time by Sex in Mackinac County
The most common commute times in Mackinac County are 5 to 9 minutes (520 commuters, 25.8%) for males and 5 to 9 minutes (464 commuters, 24.4%) for females.
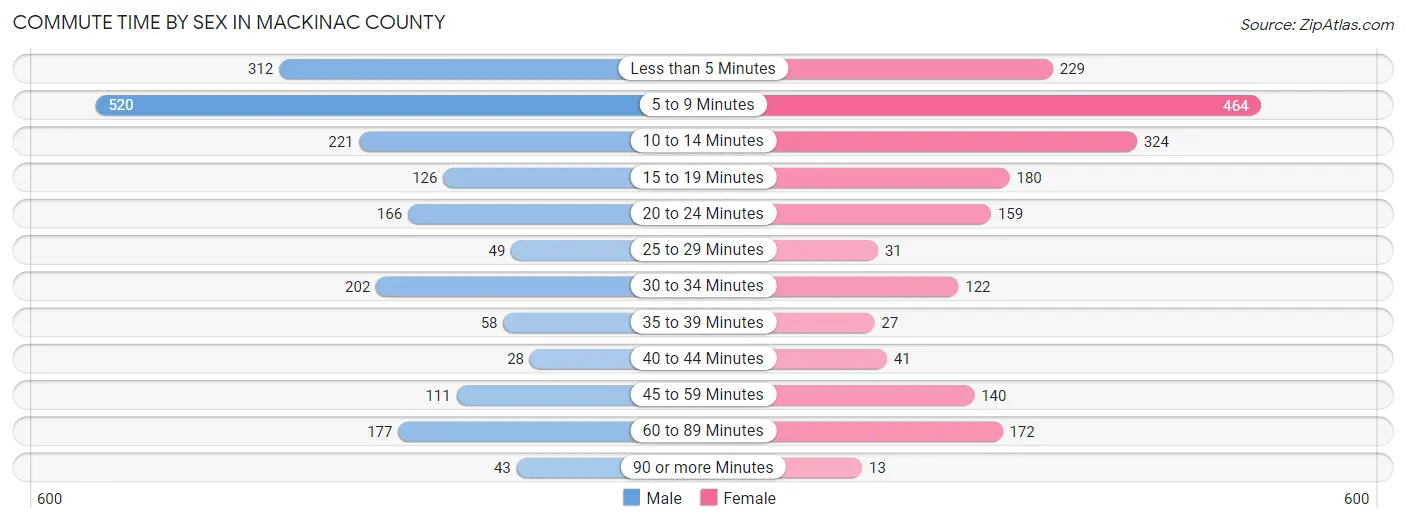
| Commute Time | Male | Female |
| Less than 5 Minutes | 312 (15.5%) | 229 (12.0%) |
| 5 to 9 Minutes | 520 (25.8%) | 464 (24.4%) |
| 10 to 14 Minutes | 221 (11.0%) | 324 (17.0%) |
| 15 to 19 Minutes | 126 (6.3%) | 180 (9.5%) |
| 20 to 24 Minutes | 166 (8.3%) | 159 (8.4%) |
| 25 to 29 Minutes | 49 (2.4%) | 31 (1.6%) |
| 30 to 34 Minutes | 202 (10.0%) | 122 (6.4%) |
| 35 to 39 Minutes | 58 (2.9%) | 27 (1.4%) |
| 40 to 44 Minutes | 28 (1.4%) | 41 (2.2%) |
| 45 to 59 Minutes | 111 (5.5%) | 140 (7.4%) |
| 60 to 89 Minutes | 177 (8.8%) | 172 (9.0%) |
| 90 or more Minutes | 43 (2.1%) | 13 (0.7%) |
Time of Departure to Work by Sex in Mackinac County
The most frequent times of departure to work in Mackinac County are 7:30 AM to 7:59 AM (373, 18.5%) for males and 7:30 AM to 7:59 AM (380, 20.0%) for females.
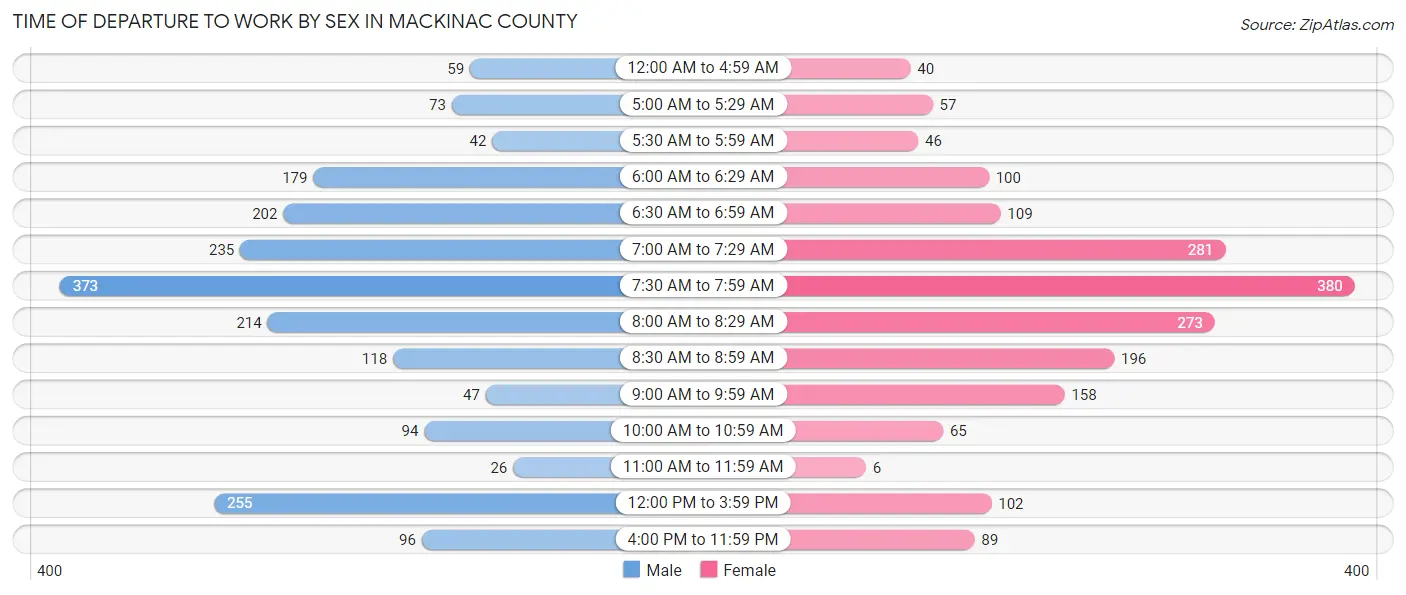
| Time of Departure | Male | Female |
| 12:00 AM to 4:59 AM | 59 (2.9%) | 40 (2.1%) |
| 5:00 AM to 5:29 AM | 73 (3.6%) | 57 (3.0%) |
| 5:30 AM to 5:59 AM | 42 (2.1%) | 46 (2.4%) |
| 6:00 AM to 6:29 AM | 179 (8.9%) | 100 (5.3%) |
| 6:30 AM to 6:59 AM | 202 (10.0%) | 109 (5.7%) |
| 7:00 AM to 7:29 AM | 235 (11.7%) | 281 (14.8%) |
| 7:30 AM to 7:59 AM | 373 (18.5%) | 380 (20.0%) |
| 8:00 AM to 8:29 AM | 214 (10.6%) | 273 (14.3%) |
| 8:30 AM to 8:59 AM | 118 (5.9%) | 196 (10.3%) |
| 9:00 AM to 9:59 AM | 47 (2.3%) | 158 (8.3%) |
| 10:00 AM to 10:59 AM | 94 (4.7%) | 65 (3.4%) |
| 11:00 AM to 11:59 AM | 26 (1.3%) | 6 (0.3%) |
| 12:00 PM to 3:59 PM | 255 (12.7%) | 102 (5.4%) |
| 4:00 PM to 11:59 PM | 96 (4.8%) | 89 (4.7%) |
| Total | 2,013 (100.0%) | 1,902 (100.0%) |
Housing Occupancy in Mackinac County
Occupancy by Ownership in Mackinac County
Of the total 5,226 dwellings in Mackinac County, owner-occupied units account for 3,973 (76.0%), while renter-occupied units make up 1,253 (24.0%).
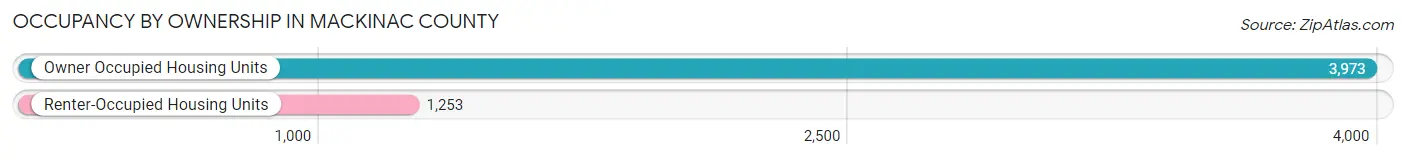
| Occupancy | # Housing Units | % Housing Units |
| Owner Occupied Housing Units | 3,973 | 76.0% |
| Renter-Occupied Housing Units | 1,253 | 24.0% |
| Total Occupied Housing Units | 5,226 | 100.0% |
Occupancy by Household Size in Mackinac County
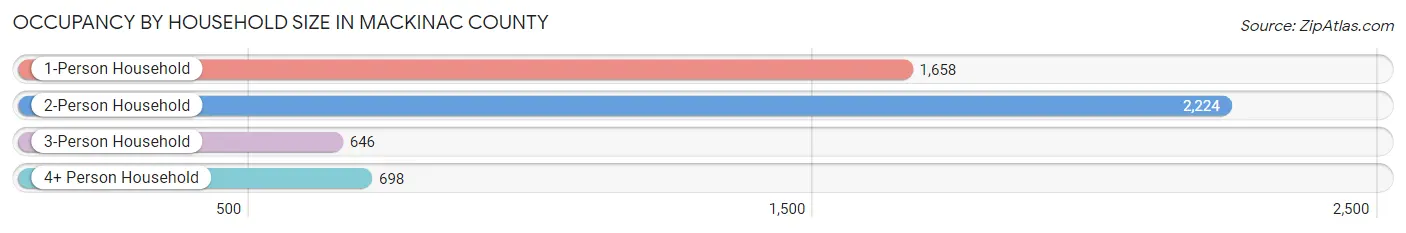
| Household Size | # Housing Units | % Housing Units |
| 1-Person Household | 1,658 | 31.7% |
| 2-Person Household | 2,224 | 42.6% |
| 3-Person Household | 646 | 12.4% |
| 4+ Person Household | 698 | 13.4% |
| Total Housing Units | 5,226 | 100.0% |
Occupancy by Ownership by Household Size in Mackinac County
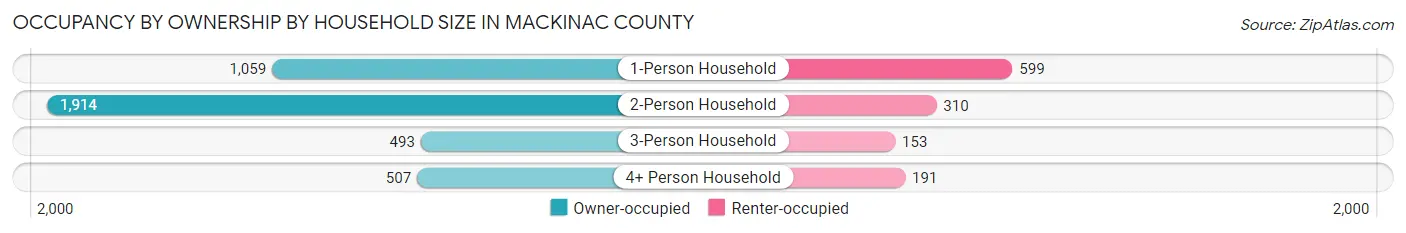
| Household Size | Owner-occupied | Renter-occupied |
| 1-Person Household | 1,059 (63.9%) | 599 (36.1%) |
| 2-Person Household | 1,914 (86.1%) | 310 (13.9%) |
| 3-Person Household | 493 (76.3%) | 153 (23.7%) |
| 4+ Person Household | 507 (72.6%) | 191 (27.4%) |
| Total Housing Units | 3,973 (76.0%) | 1,253 (24.0%) |
Occupancy by Educational Attainment in Mackinac County
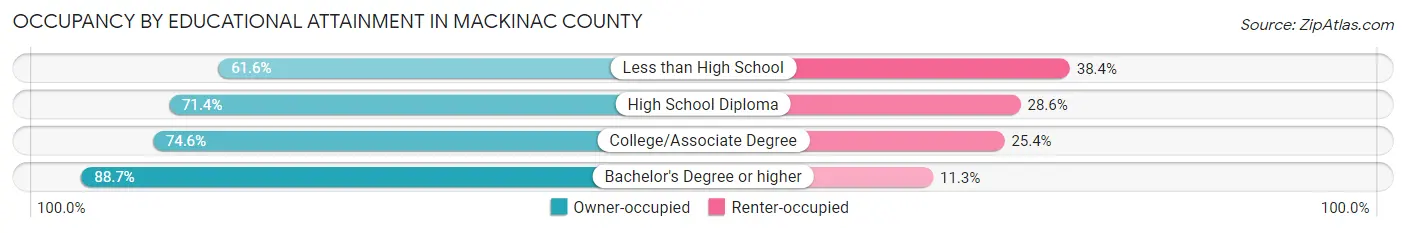
| Household Size | Owner-occupied | Renter-occupied |
| Less than High School | 191 (61.6%) | 119 (38.4%) |
| High School Diploma | 1,446 (71.4%) | 580 (28.6%) |
| College/Associate Degree | 1,202 (74.6%) | 410 (25.4%) |
| Bachelor's Degree or higher | 1,134 (88.7%) | 144 (11.3%) |
Occupancy by Age of Householder in Mackinac County
| Age Bracket | # Households | % Households |
| Under 35 Years | 829 | 15.9% |
| 35 to 44 Years | 589 | 11.3% |
| 45 to 54 Years | 696 | 13.3% |
| 55 to 64 Years | 1,121 | 21.4% |
| 65 to 74 Years | 1,182 | 22.6% |
| 75 to 84 Years | 611 | 11.7% |
| 85 Years and Over | 198 | 3.8% |
| Total | 5,226 | 100.0% |
Housing Finances in Mackinac County
Median Income by Occupancy in Mackinac County
| Occupancy Type | # Households | Median Income |
| Owner-Occupied | 3,973 (76.0%) | $65,121 |
| Renter-Occupied | 1,253 (24.0%) | $37,981 |
| Average | 5,226 (100.0%) | $60,620 |
Occupancy by Householder Income Bracket in Mackinac County
| Income Bracket | Owner-occupied | Renter-occupied |
| Less than $5,000 | 107 (2.7%) | 80 (6.4%) |
| $5,000 to $9,999 | 52 (1.3%) | 34 (2.7%) |
| $10,000 to $14,999 | 115 (2.9%) | 200 (16.0%) |
| $15,000 to $19,999 | 109 (2.7%) | 88 (7.0%) |
| $20,000 to $24,999 | 181 (4.6%) | 75 (6.0%) |
| $25,000 to $34,999 | 368 (9.3%) | 102 (8.1%) |
| $35,000 to $49,999 | 551 (13.9%) | 147 (11.7%) |
| $50,000 to $74,999 | 811 (20.4%) | 222 (17.7%) |
| $75,000 to $99,999 | 507 (12.8%) | 184 (14.7%) |
| $100,000 to $149,999 | 758 (19.1%) | 89 (7.1%) |
| $150,000 or more | 414 (10.4%) | 32 (2.5%) |
| Total | 3,973 (100.0%) | 1,253 (100.0%) |
Monthly Housing Cost Tiers in Mackinac County
| Monthly Cost | Owner-occupied | Renter-occupied |
| Less than $300 | 383 (9.6%) | 127 (10.1%) |
| $300 to $499 | 849 (21.4%) | 128 (10.2%) |
| $500 to $799 | 921 (23.2%) | 289 (23.1%) |
| $800 to $999 | 425 (10.7%) | 181 (14.4%) |
| $1,000 to $1,499 | 809 (20.4%) | 147 (11.7%) |
| $1,500 to $1,999 | 357 (9.0%) | 49 (3.9%) |
| $2,000 to $2,499 | 95 (2.4%) | 0 (0.0%) |
| $2,500 to $2,999 | 72 (1.8%) | 0 (0.0%) |
| $3,000 or more | 62 (1.6%) | 0 (0.0%) |
| Total | 3,973 (100.0%) | 1,253 (100.0%) |
Physical Housing Characteristics in Mackinac County
Housing Structures in Mackinac County
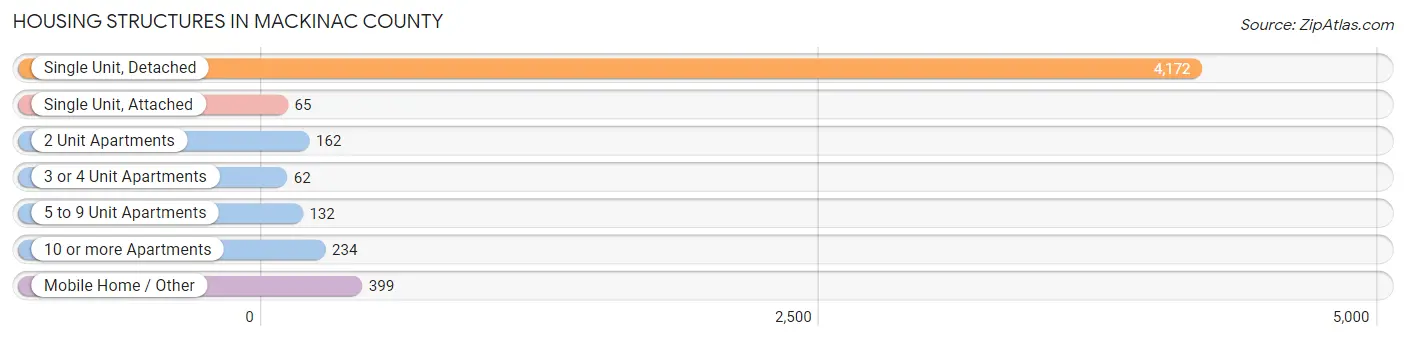
| Structure Type | # Housing Units | % Housing Units |
| Single Unit, Detached | 4,172 | 79.8% |
| Single Unit, Attached | 65 | 1.2% |
| 2 Unit Apartments | 162 | 3.1% |
| 3 or 4 Unit Apartments | 62 | 1.2% |
| 5 to 9 Unit Apartments | 132 | 2.5% |
| 10 or more Apartments | 234 | 4.5% |
| Mobile Home / Other | 399 | 7.6% |
| Total | 5,226 | 100.0% |
Housing Structures by Occupancy in Mackinac County
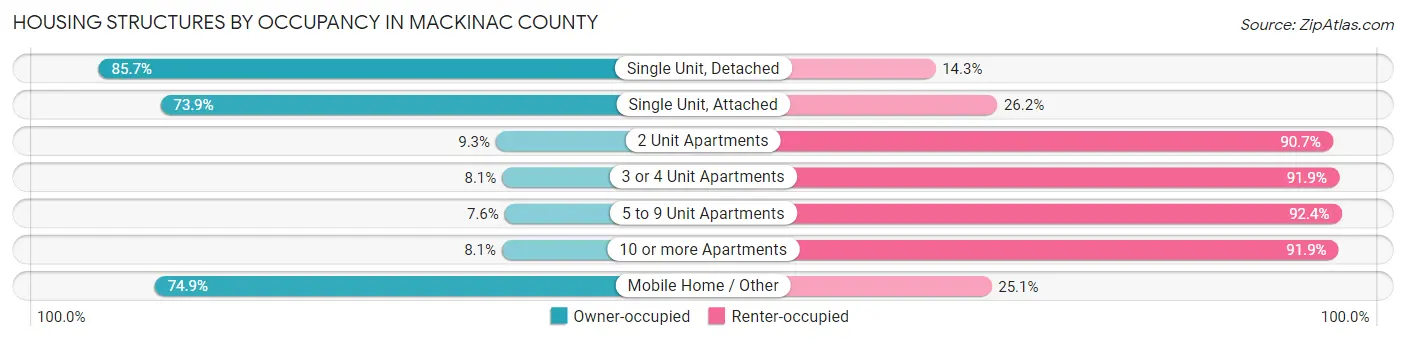
| Structure Type | Owner-occupied | Renter-occupied |
| Single Unit, Detached | 3,577 (85.7%) | 595 (14.3%) |
| Single Unit, Attached | 48 (73.9%) | 17 (26.2%) |
| 2 Unit Apartments | 15 (9.3%) | 147 (90.7%) |
| 3 or 4 Unit Apartments | 5 (8.1%) | 57 (91.9%) |
| 5 to 9 Unit Apartments | 10 (7.6%) | 122 (92.4%) |
| 10 or more Apartments | 19 (8.1%) | 215 (91.9%) |
| Mobile Home / Other | 299 (74.9%) | 100 (25.1%) |
| Total | 3,973 (76.0%) | 1,253 (24.0%) |
Housing Structures by Number of Rooms in Mackinac County
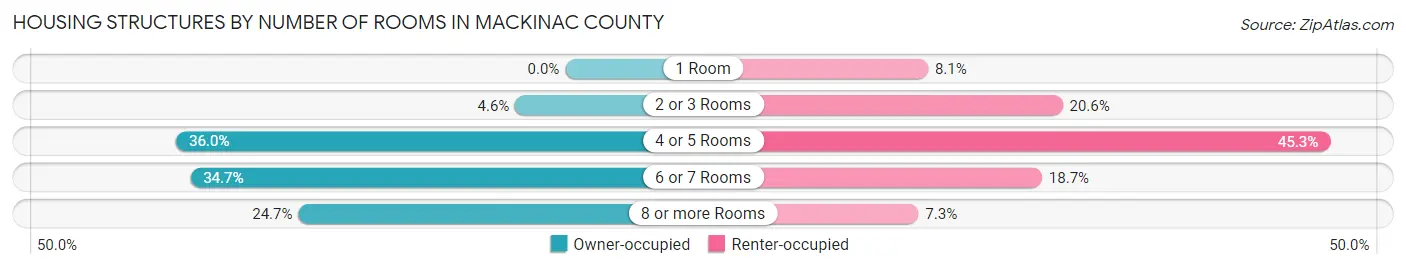
| Number of Rooms | Owner-occupied | Renter-occupied |
| 1 Room | 0 (0.0%) | 102 (8.1%) |
| 2 or 3 Rooms | 184 (4.6%) | 258 (20.6%) |
| 4 or 5 Rooms | 1,430 (36.0%) | 568 (45.3%) |
| 6 or 7 Rooms | 1,378 (34.7%) | 234 (18.7%) |
| 8 or more Rooms | 981 (24.7%) | 91 (7.3%) |
| Total | 3,973 (100.0%) | 1,253 (100.0%) |
Housing Structure by Heating Type in Mackinac County
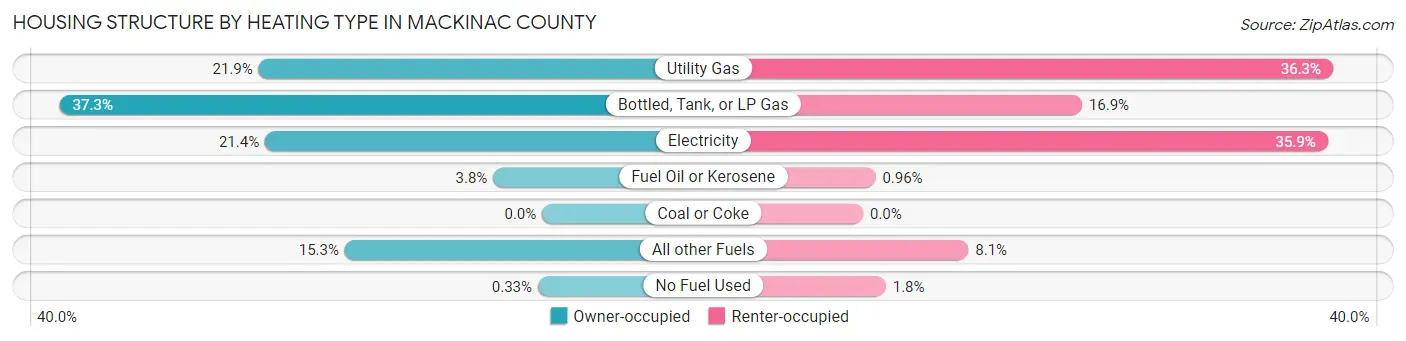
| Heating Type | Owner-occupied | Renter-occupied |
| Utility Gas | 871 (21.9%) | 455 (36.3%) |
| Bottled, Tank, or LP Gas | 1,482 (37.3%) | 212 (16.9%) |
| Electricity | 851 (21.4%) | 450 (35.9%) |
| Fuel Oil or Kerosene | 150 (3.8%) | 12 (1.0%) |
| Coal or Coke | 0 (0.0%) | 0 (0.0%) |
| All other Fuels | 606 (15.2%) | 102 (8.1%) |
| No Fuel Used | 13 (0.3%) | 22 (1.8%) |
| Total | 3,973 (100.0%) | 1,253 (100.0%) |
Household Vehicle Usage in Mackinac County
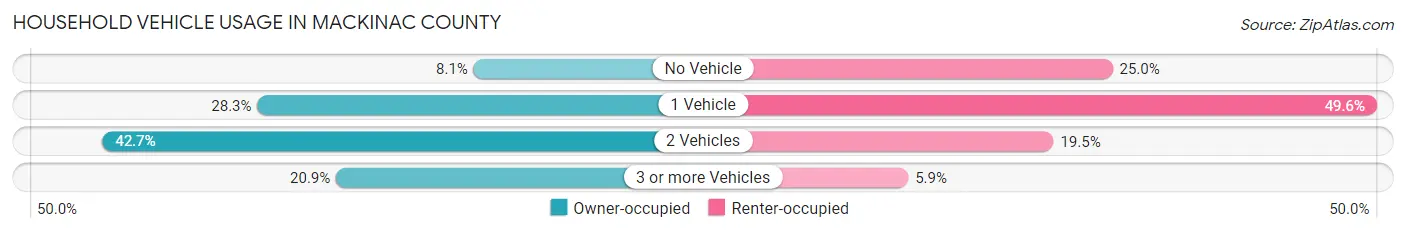
| Vehicles per Household | Owner-occupied | Renter-occupied |
| No Vehicle | 321 (8.1%) | 313 (25.0%) |
| 1 Vehicle | 1,123 (28.3%) | 622 (49.6%) |
| 2 Vehicles | 1,698 (42.7%) | 244 (19.5%) |
| 3 or more Vehicles | 831 (20.9%) | 74 (5.9%) |
| Total | 3,973 (100.0%) | 1,253 (100.0%) |
Real Estate & Mortgages in Mackinac County
Real Estate and Mortgage Overview in Mackinac County
| Characteristic | Without Mortgage | With Mortgage |
| Housing Units | 2,131 | 1,842 |
| Median Property Value | $145,900 | $164,600 |
| Median Household Income | $56,449 | $206 |
| Monthly Housing Costs | $463 | $59 |
| Real Estate Taxes | $1,659 | $83 |
Property Value by Mortgage Status in Mackinac County
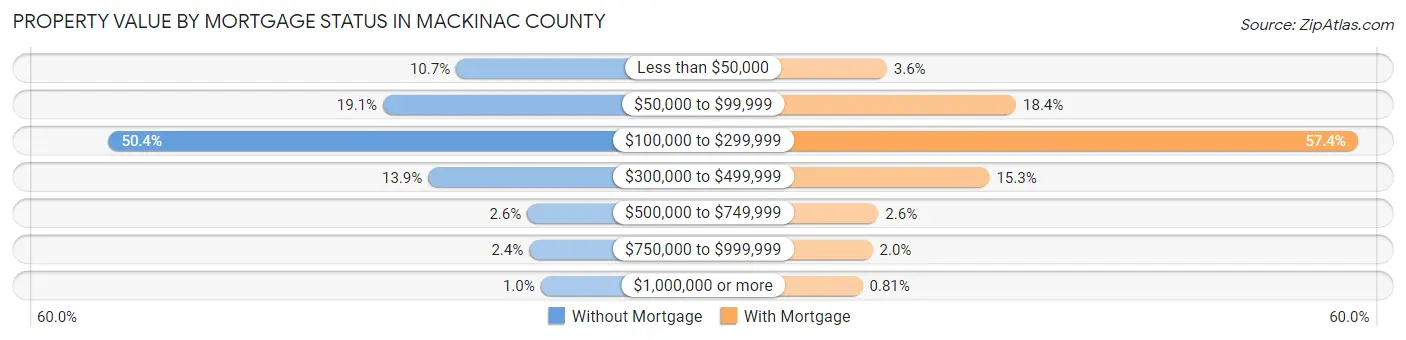
| Property Value | Without Mortgage | With Mortgage |
| Less than $50,000 | 228 (10.7%) | 66 (3.6%) |
| $50,000 to $99,999 | 406 (19.1%) | 338 (18.3%) |
| $100,000 to $299,999 | 1,074 (50.4%) | 1,057 (57.4%) |
| $300,000 to $499,999 | 296 (13.9%) | 282 (15.3%) |
| $500,000 to $749,999 | 55 (2.6%) | 48 (2.6%) |
| $750,000 to $999,999 | 50 (2.4%) | 36 (1.9%) |
| $1,000,000 or more | 22 (1.0%) | 15 (0.8%) |
| Total | 2,131 (100.0%) | 1,842 (100.0%) |
Household Income by Mortgage Status in Mackinac County
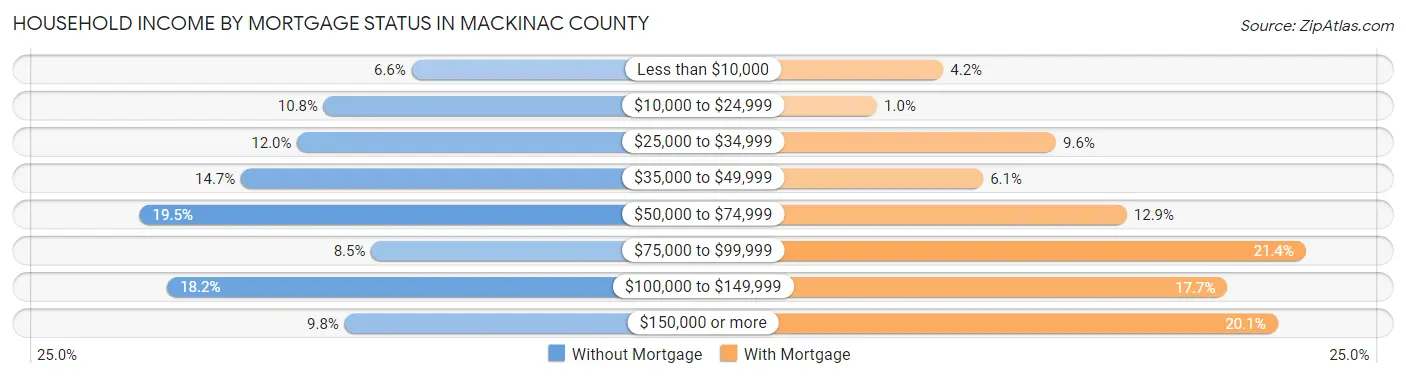
| Household Income | Without Mortgage | With Mortgage |
| Less than $10,000 | 140 (6.6%) | 77 (4.2%) |
| $10,000 to $24,999 | 229 (10.7%) | 19 (1.0%) |
| $25,000 to $34,999 | 256 (12.0%) | 176 (9.6%) |
| $35,000 to $49,999 | 313 (14.7%) | 112 (6.1%) |
| $50,000 to $74,999 | 416 (19.5%) | 238 (12.9%) |
| $75,000 to $99,999 | 181 (8.5%) | 395 (21.4%) |
| $100,000 to $149,999 | 388 (18.2%) | 326 (17.7%) |
| $150,000 or more | 208 (9.8%) | 370 (20.1%) |
| Total | 2,131 (100.0%) | 1,842 (100.0%) |
Property Value to Household Income Ratio in Mackinac County
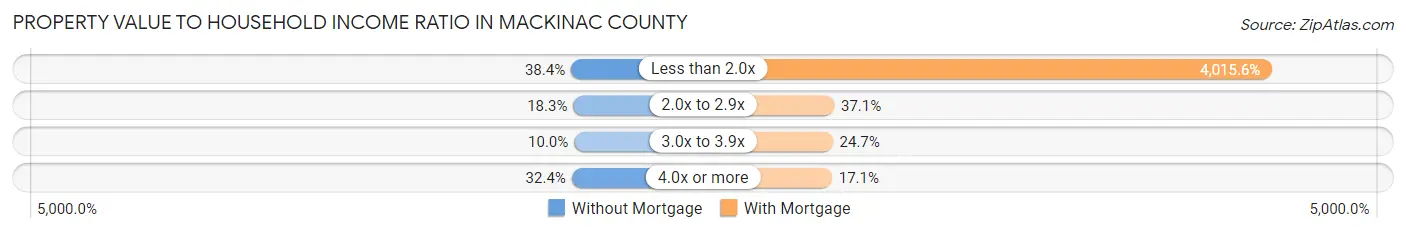
| Value-to-Income Ratio | Without Mortgage | With Mortgage |
| Less than 2.0x | 818 (38.4%) | 73,967 (4,015.6%) |
| 2.0x to 2.9x | 389 (18.2%) | 683 (37.1%) |
| 3.0x to 3.9x | 214 (10.0%) | 454 (24.6%) |
| 4.0x or more | 690 (32.4%) | 315 (17.1%) |
| Total | 2,131 (100.0%) | 1,842 (100.0%) |
Real Estate Taxes by Mortgage Status in Mackinac County
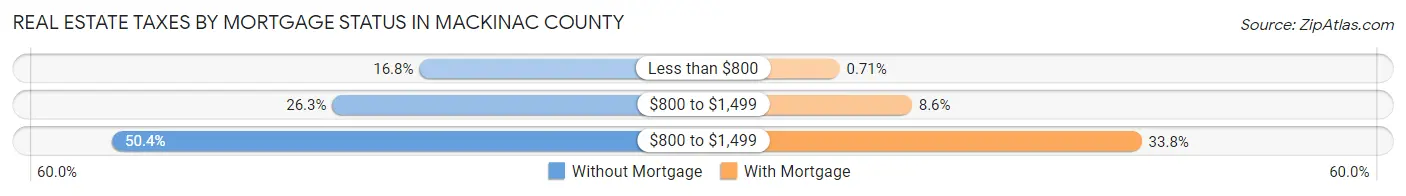
| Property Taxes | Without Mortgage | With Mortgage |
| Less than $800 | 357 (16.8%) | 13 (0.7%) |
| $800 to $1,499 | 560 (26.3%) | 159 (8.6%) |
| $800 to $1,499 | 1,074 (50.4%) | 623 (33.8%) |
| Total | 2,131 (100.0%) | 1,842 (100.0%) |
Health & Disability in Mackinac County
Health Insurance Coverage by Age in Mackinac County
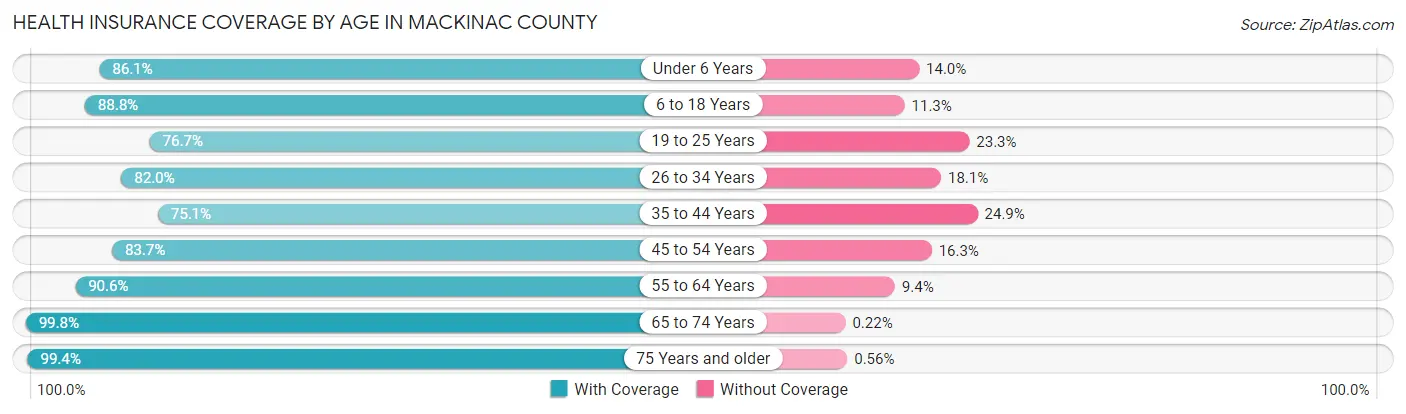
| Age Bracket | With Coverage | Without Coverage |
| Under 6 Years | 401 (86.1%) | 65 (14.0%) |
| 6 to 18 Years | 1,128 (88.7%) | 143 (11.3%) |
| 19 to 25 Years | 513 (76.7%) | 156 (23.3%) |
| 26 to 34 Years | 808 (82.0%) | 178 (18.0%) |
| 35 to 44 Years | 783 (75.1%) | 259 (24.9%) |
| 45 to 54 Years | 1,078 (83.7%) | 210 (16.3%) |
| 55 to 64 Years | 1,736 (90.6%) | 181 (9.4%) |
| 65 to 74 Years | 1,815 (99.8%) | 4 (0.2%) |
| 75 Years and older | 1,243 (99.4%) | 7 (0.6%) |
| Total | 9,505 (88.8%) | 1,203 (11.2%) |
Health Insurance Coverage by Citizenship Status in Mackinac County
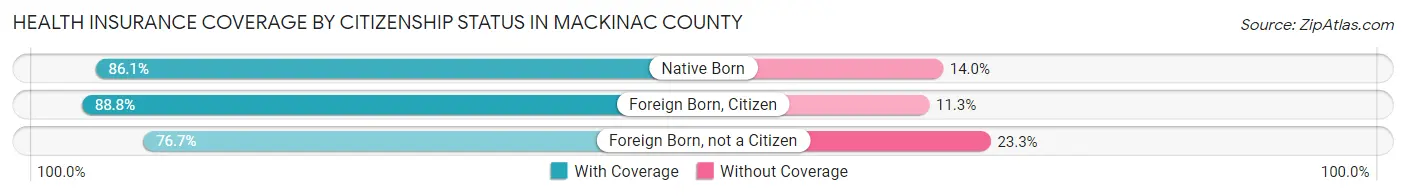
| Citizenship Status | With Coverage | Without Coverage |
| Native Born | 401 (86.1%) | 65 (14.0%) |
| Foreign Born, Citizen | 1,128 (88.7%) | 143 (11.3%) |
| Foreign Born, not a Citizen | 513 (76.7%) | 156 (23.3%) |
Health Insurance Coverage by Household Income in Mackinac County
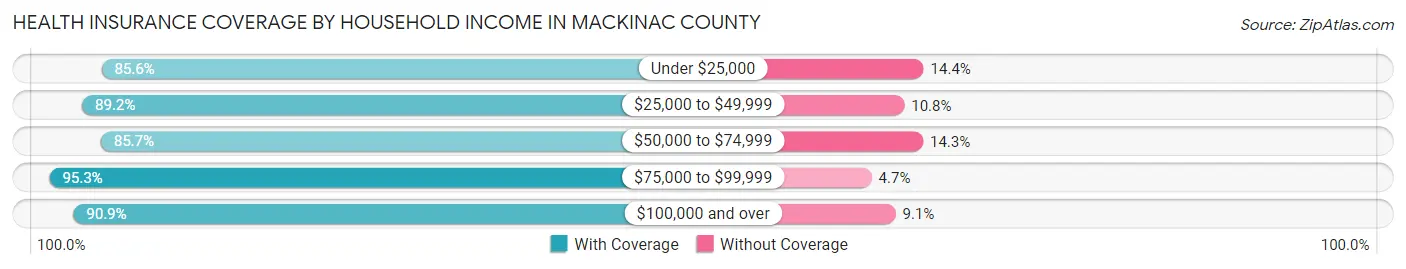
| Household Income | With Coverage | Without Coverage |
| Under $25,000 | 1,403 (85.6%) | 236 (14.4%) |
| $25,000 to $49,999 | 1,848 (89.2%) | 223 (10.8%) |
| $50,000 to $74,999 | 1,873 (85.7%) | 312 (14.3%) |
| $75,000 to $99,999 | 1,472 (95.3%) | 72 (4.7%) |
| $100,000 and over | 2,765 (90.9%) | 278 (9.1%) |
Public vs Private Health Insurance Coverage by Age in Mackinac County
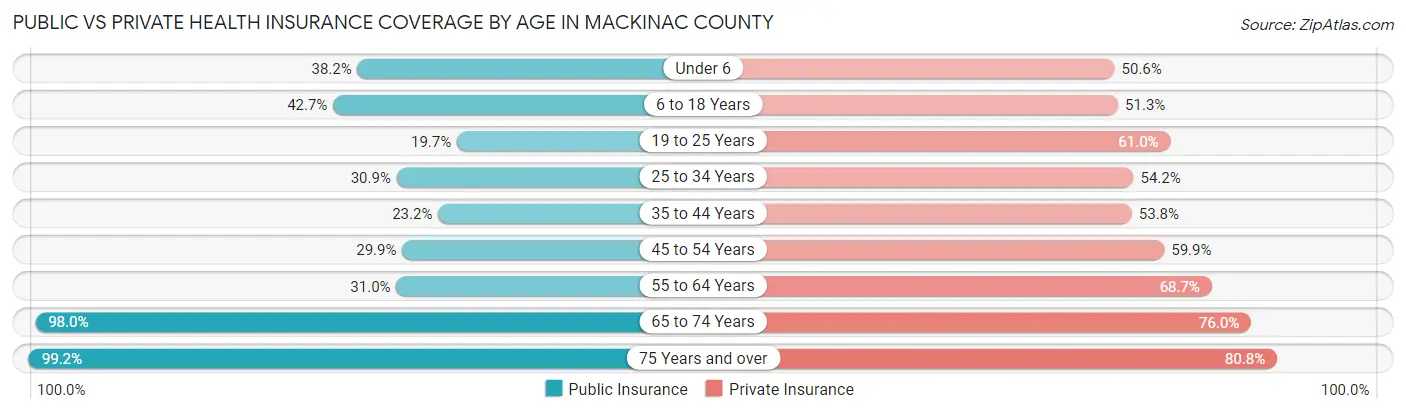
| Age Bracket | Public Insurance | Private Insurance |
| Under 6 | 178 (38.2%) | 236 (50.6%) |
| 6 to 18 Years | 543 (42.7%) | 652 (51.3%) |
| 19 to 25 Years | 132 (19.7%) | 408 (61.0%) |
| 25 to 34 Years | 305 (30.9%) | 534 (54.2%) |
| 35 to 44 Years | 242 (23.2%) | 561 (53.8%) |
| 45 to 54 Years | 385 (29.9%) | 771 (59.9%) |
| 55 to 64 Years | 594 (31.0%) | 1,316 (68.6%) |
| 65 to 74 Years | 1,783 (98.0%) | 1,382 (76.0%) |
| 75 Years and over | 1,240 (99.2%) | 1,010 (80.8%) |
| Total | 5,402 (50.4%) | 6,870 (64.2%) |
Disability Status by Sex by Age in Mackinac County
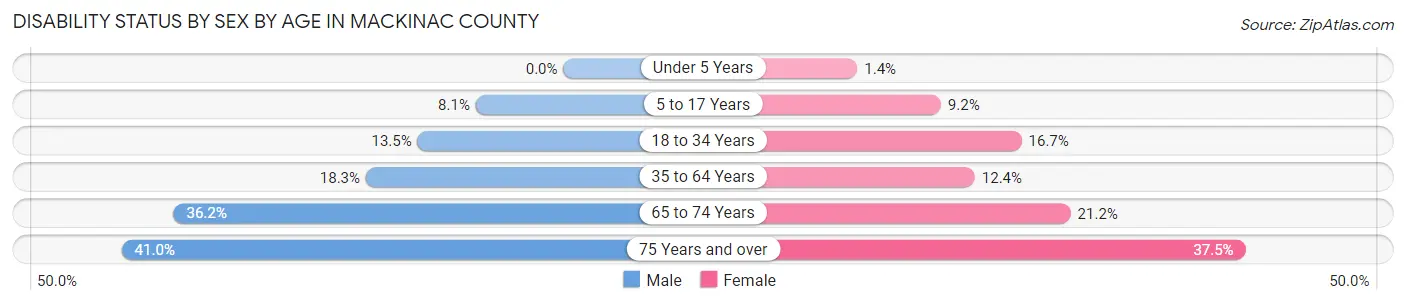
| Age Bracket | Male | Female |
| Under 5 Years | 0 (0.0%) | 3 (1.4%) |
| 5 to 17 Years | 53 (8.1%) | 53 (9.2%) |
| 18 to 34 Years | 130 (13.5%) | 131 (16.7%) |
| 35 to 64 Years | 394 (18.3%) | 259 (12.3%) |
| 65 to 74 Years | 331 (36.2%) | 192 (21.2%) |
| 75 Years and over | 241 (41.0%) | 248 (37.5%) |
Disability Class by Sex by Age in Mackinac County
Disability Class: Hearing Difficulty
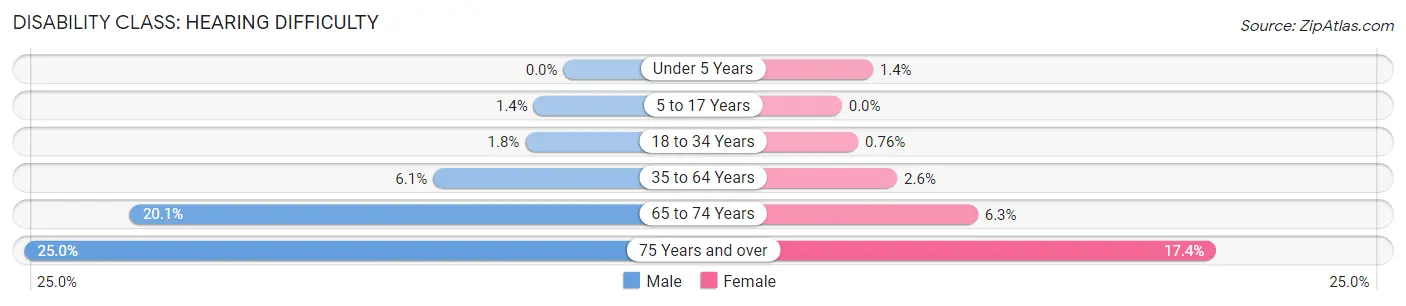
| Age Bracket | Male | Female |
| Under 5 Years | 0 (0.0%) | 3 (1.4%) |
| 5 to 17 Years | 9 (1.4%) | 0 (0.0%) |
| 18 to 34 Years | 17 (1.8%) | 6 (0.8%) |
| 35 to 64 Years | 130 (6.0%) | 54 (2.6%) |
| 65 to 74 Years | 184 (20.1%) | 57 (6.3%) |
| 75 Years and over | 147 (25.0%) | 115 (17.4%) |
Disability Class: Vision Difficulty
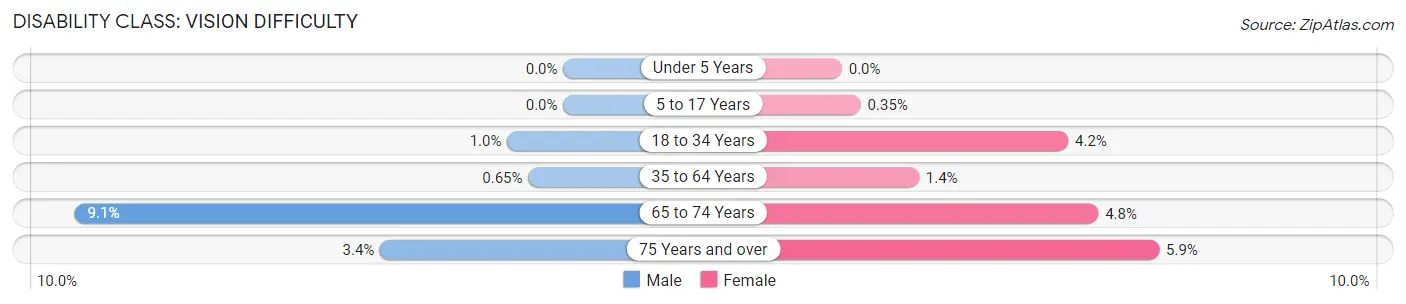
| Age Bracket | Male | Female |
| Under 5 Years | 0 (0.0%) | 0 (0.0%) |
| 5 to 17 Years | 0 (0.0%) | 2 (0.4%) |
| 18 to 34 Years | 10 (1.0%) | 33 (4.2%) |
| 35 to 64 Years | 14 (0.6%) | 30 (1.4%) |
| 65 to 74 Years | 83 (9.1%) | 43 (4.8%) |
| 75 Years and over | 20 (3.4%) | 39 (5.9%) |
Disability Class: Cognitive Difficulty
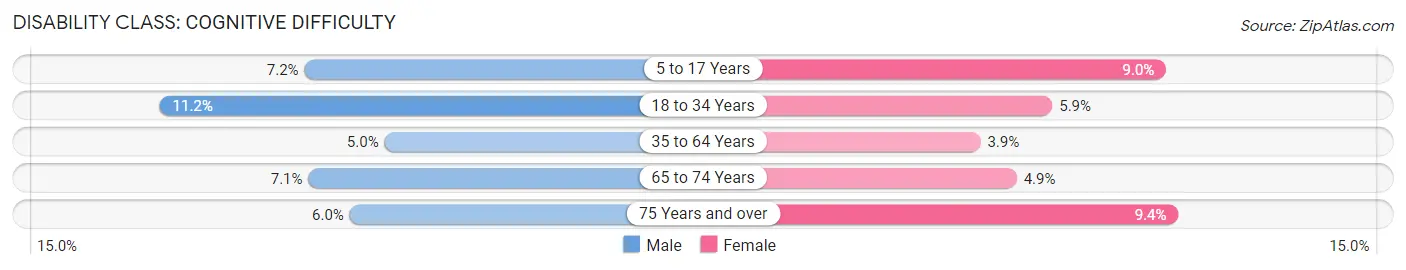
| Age Bracket | Male | Female |
| 5 to 17 Years | 47 (7.2%) | 52 (9.0%) |
| 18 to 34 Years | 108 (11.2%) | 46 (5.9%) |
| 35 to 64 Years | 107 (5.0%) | 81 (3.9%) |
| 65 to 74 Years | 65 (7.1%) | 44 (4.9%) |
| 75 Years and over | 35 (5.9%) | 62 (9.4%) |
Disability Class: Ambulatory Difficulty
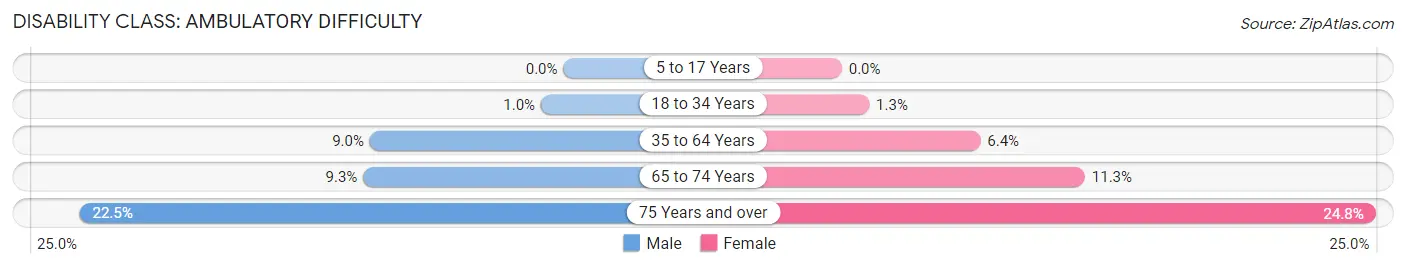
| Age Bracket | Male | Female |
| 5 to 17 Years | 0 (0.0%) | 0 (0.0%) |
| 18 to 34 Years | 10 (1.0%) | 10 (1.3%) |
| 35 to 64 Years | 193 (9.0%) | 135 (6.4%) |
| 65 to 74 Years | 85 (9.3%) | 102 (11.3%) |
| 75 Years and over | 132 (22.5%) | 164 (24.8%) |
Disability Class: Self-Care Difficulty
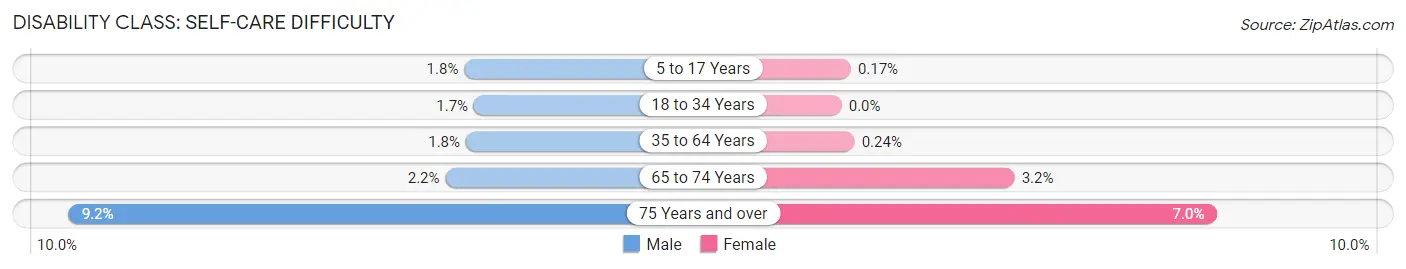
| Age Bracket | Male | Female |
| 5 to 17 Years | 12 (1.8%) | 1 (0.2%) |
| 18 to 34 Years | 16 (1.7%) | 0 (0.0%) |
| 35 to 64 Years | 39 (1.8%) | 5 (0.2%) |
| 65 to 74 Years | 20 (2.2%) | 29 (3.2%) |
| 75 Years and over | 54 (9.2%) | 46 (7.0%) |
Technology Access in Mackinac County
Computing Device Access in Mackinac County
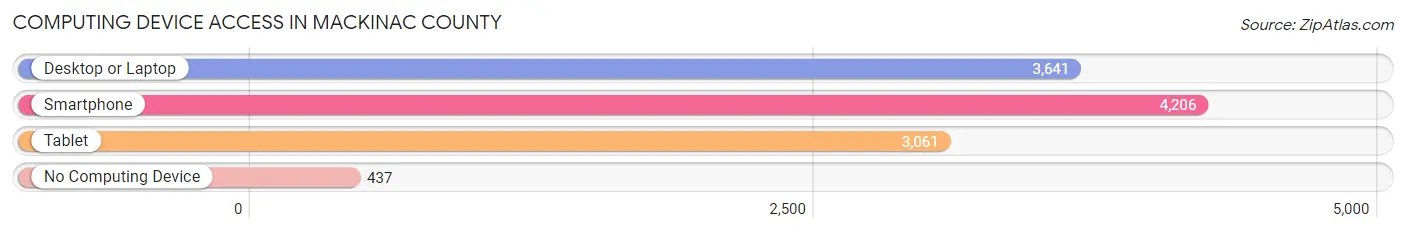
| Device Type | # Households | % Households |
| Desktop or Laptop | 3,641 | 69.7% |
| Smartphone | 4,206 | 80.5% |
| Tablet | 3,061 | 58.6% |
| No Computing Device | 437 | 8.4% |
| Total | 5,226 | 100.0% |
Internet Access in Mackinac County
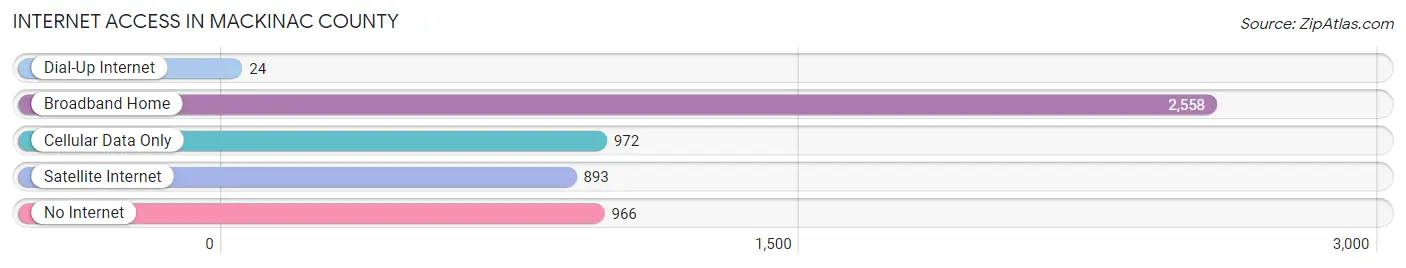
| Internet Type | # Households | % Households |
| Dial-Up Internet | 24 | 0.5% |
| Broadband Home | 2,558 | 48.9% |
| Cellular Data Only | 972 | 18.6% |
| Satellite Internet | 893 | 17.1% |
| No Internet | 966 | 18.5% |
| Total | 5,226 | 100.0% |
Mackinac County Summary
Mackinac County is a county located in the Upper Peninsula of the U.S. state of Michigan. As of the 2010 census, the population was 11,113. The county seat is St. Ignace. The county was created in 1818 and organized in 1871. It is named for Mackinac Island, which is located in the Straits of Mackinac between the county's two peninsulas.
History
Mackinac County was first inhabited by Native Americans, including the Ojibwe, Ottawa, and Potawatomi tribes. The first Europeans to explore the area were French fur traders, who arrived in the late 17th century. The area was part of the large New France territory, which was ceded to the British in 1763. After the American Revolution, the area became part of the Northwest Territory, and then part of the Michigan Territory in 1805.
Mackinac County was officially established in 1818, and was initially part of Mackinac County. In 1843, the county was divided into two parts, with the northern part becoming Emmet County and the southern part becoming Mackinac County.
Geography
Mackinac County is located in the Upper Peninsula of Michigan. It is bordered by Chippewa County to the north, Emmet County to the east, Cheboygan County to the south, and Lake Michigan to the west. The county is divided into two peninsulas, the Upper Peninsula and the Lower Peninsula. The county is home to Mackinac Island, which is located in the Straits of Mackinac between the two peninsulas.
The county has a total area of 1,845 square miles, of which 1,717 square miles is land and 128 square miles is water. The county is home to several lakes, including Lake Michigan, Lake Huron, and Lake Superior.
Economy
Mackinac County's economy is largely based on tourism. The county is home to Mackinac Island, which is a popular tourist destination. The island is home to several historic sites, including Fort Mackinac and the Grand Hotel. The county is also home to several state parks, including Mackinac Island State Park and Hiawatha National Forest.
The county is also home to several manufacturing companies, including Mackinac Island Carriage Tours, Mackinac Island Fudge Company, and Mackinac Island Brewing Company.
Demographics
As of the 2010 census, there were 11,113 people, 4,845 households, and 3,072 families residing in the county. The population density was 6.4 people per square mile. There were 5,845 housing units at an average density of 3.4 per square mile. The racial makeup of the county was 94.2% White, 0.7% Black or African American, 2.7% Native American, 0.3% Asian, 0.1% Pacific Islander, 0.4% from other races, and 1.6% from two or more races.
The median income for a household in the county was $37,945, and the median income for a family was $45,945. The per capita income for the county was $20,945. About 11.2% of families and 14.2% of the population were below the poverty line, including 19.2% of those under age 18 and 8.2% of those age 65 or over.
Common Questions
What is Per Capita Income in Mackinac County?
Per Capita income in Mackinac County is $35,512.
What is the Median Family Income in Mackinac County?
Median Family Income in Mackinac County is $73,523.
What is the Median Household income in Mackinac County?
Median Household Income in Mackinac County is $60,620.
What is Income or Wage Gap in Mackinac County?
Income or Wage Gap in Mackinac County is 29.6%.
Women in Mackinac County earn 70.4 cents for every dollar earned by a man.
What is Family Income Deficit in Mackinac County?
Family Income Deficit in Mackinac County is $9,883.
Families that are below poverty line in Mackinac County earn $9,883 less on average than the poverty threshold level.
What is Inequality or Gini Index in Mackinac County?
Inequality or Gini Index in Mackinac County is 0.45.
What is the Total Population of Mackinac County?
Total Population of Mackinac County is 10,843.
What is the Total Male Population of Mackinac County?
Total Male Population of Mackinac County is 5,594.
What is the Total Female Population of Mackinac County?
Total Female Population of Mackinac County is 5,249.
What is the Ratio of Males per 100 Females in Mackinac County?
There are 106.57 Males per 100 Females in Mackinac County.
What is the Ratio of Females per 100 Males in Mackinac County?
There are 93.83 Females per 100 Males in Mackinac County.
What is the Median Population Age in Mackinac County?
Median Population Age in Mackinac County is 52.7 Years.
What is the Average Family Size in Mackinac County
Average Family Size in Mackinac County is 2.4 People.
What is the Average Household Size in Mackinac County
Average Household Size in Mackinac County is 2.0 People.
How Large is the Labor Force in Mackinac County?
There are 4,883 People in the Labor Forcein in Mackinac County.
What is the Percentage of People in the Labor Force in Mackinac County?
51.9% of People are in the Labor Force in Mackinac County.
What is the Unemployment Rate in Mackinac County?
Unemployment Rate in Mackinac County is 10.1%.