Houghton County, MI Map & Demographics
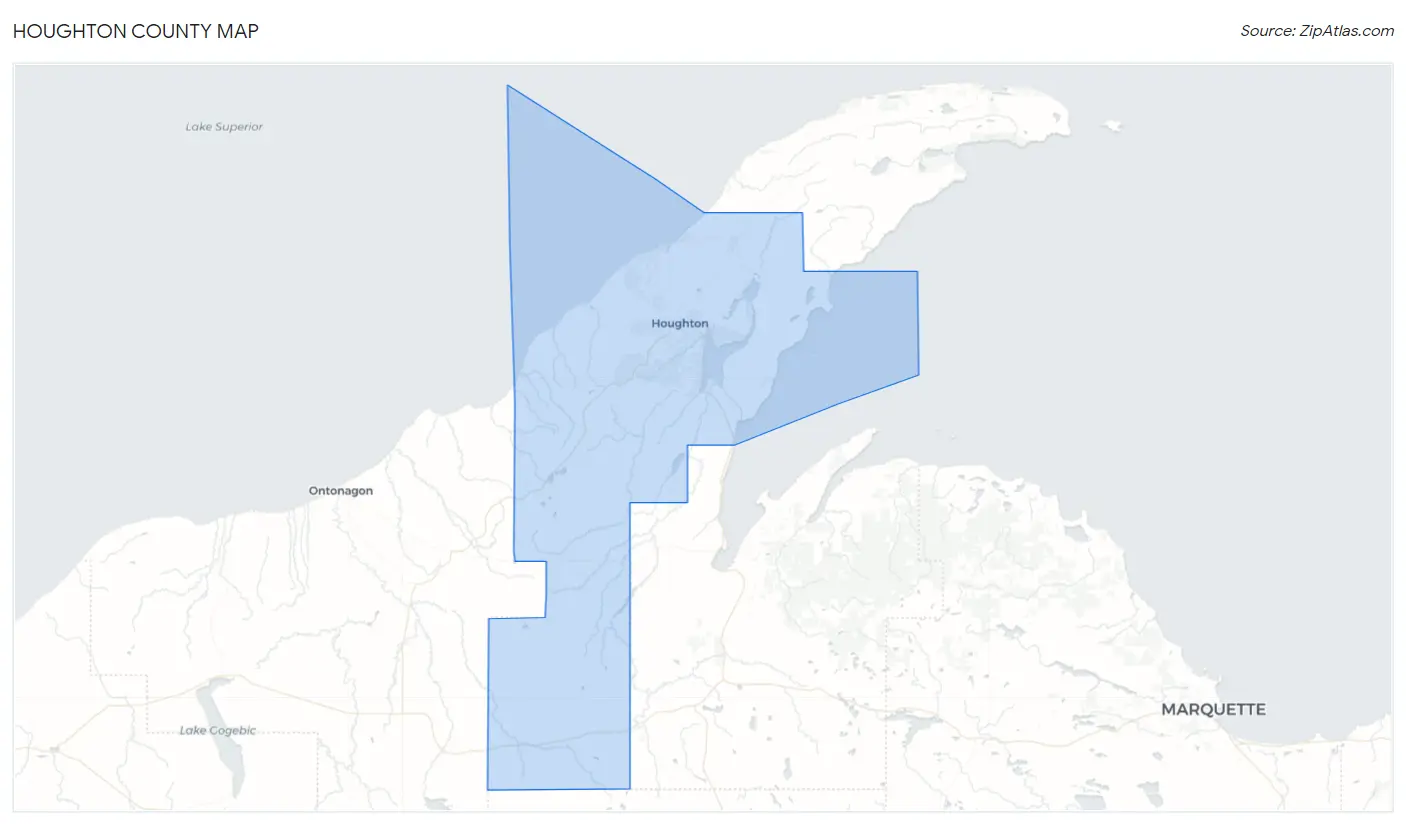
Houghton County Map
Houghton County Overview
$29,173
PER CAPITA INCOME
$77,209
AVG FAMILY INCOME
$52,736
AVG HOUSEHOLD INCOME
12.3%
WAGE / INCOME GAP [ % ]
87.7¢/ $1
WAGE / INCOME GAP [ $ ]
$10,162
FAMILY INCOME DEFICIT
0.48
INEQUALITY / GINI INDEX
37,414
TOTAL POPULATION
20,576
MALE POPULATION
16,838
FEMALE POPULATION
122.20
MALES / 100 FEMALES
81.83
FEMALES / 100 MALES
31.9
MEDIAN AGE
3.1
AVG FAMILY SIZE
2.4
AVG HOUSEHOLD SIZE
17,921
LABOR FORCE [ PEOPLE ]
58.0%
PERCENT IN LABOR FORCE
6.2%
UNEMPLOYMENT RATE
Houghton County Area Codes
Income in Houghton County
Income Overview in Houghton County
Per Capita Income in Houghton County is $29,173, while median incomes of families and households are $77,209 and $52,736 respectively.
| Characteristic | Number | Measure |
| Per Capita Income | 37,414 | $29,173 |
| Median Family Income | 7,727 | $77,209 |
| Mean Family Income | 7,727 | $97,730 |
| Median Household Income | 14,173 | $52,736 |
| Mean Household Income | 14,173 | $73,321 |
| Income Deficit | 7,727 | $10,162 |
| Wage / Income Gap (%) | 37,414 | 12.35% |
| Wage / Income Gap ($) | 37,414 | 87.65¢ per $1 |
| Gini / Inequality Index | 37,414 | 0.48 |
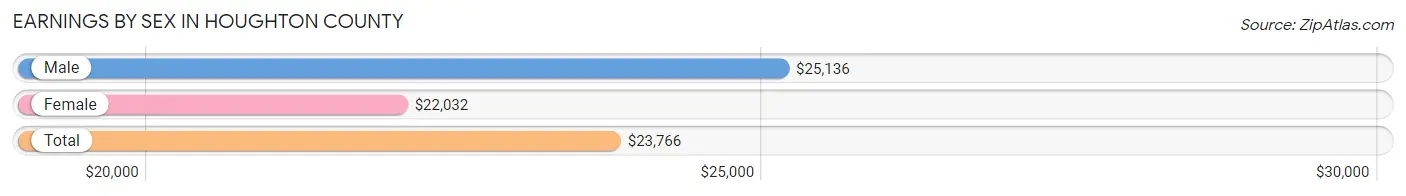
Earnings by Sex in Houghton County
Average Earnings in Houghton County are $23,766, $25,136 for men and $22,032 for women, a difference of 12.3%.
| Sex | Number | Average Earnings |
| Male | 11,888 (58.3%) | $25,136 |
| Female | 8,509 (41.7%) | $22,032 |
| Total | 20,397 (100.0%) | $23,766 |
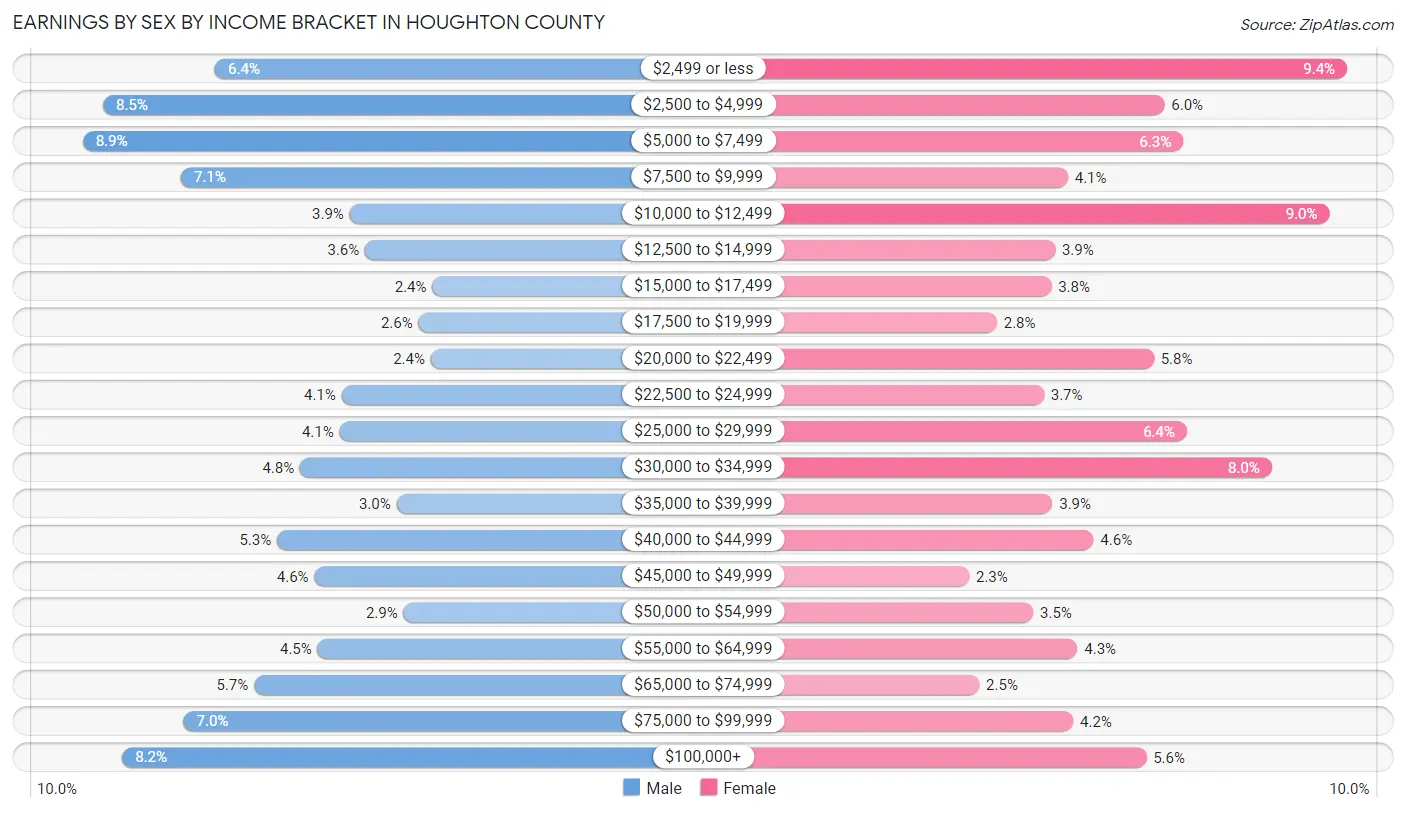
Earnings by Sex by Income Bracket in Houghton County
The most common earnings brackets in Houghton County are $5,000 to $7,499 for men (1,059 | 8.9%) and $2,499 or less for women (797 | 9.4%).
| Income | Male | Female |
| $2,499 or less | 764 (6.4%) | 797 (9.4%) |
| $2,500 to $4,999 | 1,014 (8.5%) | 506 (5.9%) |
| $5,000 to $7,499 | 1,059 (8.9%) | 536 (6.3%) |
| $7,500 to $9,999 | 841 (7.1%) | 352 (4.1%) |
| $10,000 to $12,499 | 465 (3.9%) | 769 (9.0%) |
| $12,500 to $14,999 | 430 (3.6%) | 332 (3.9%) |
| $15,000 to $17,499 | 280 (2.4%) | 326 (3.8%) |
| $17,500 to $19,999 | 312 (2.6%) | 239 (2.8%) |
| $20,000 to $22,499 | 284 (2.4%) | 489 (5.8%) |
| $22,500 to $24,999 | 483 (4.1%) | 314 (3.7%) |
| $25,000 to $29,999 | 487 (4.1%) | 542 (6.4%) |
| $30,000 to $34,999 | 575 (4.8%) | 677 (8.0%) |
| $35,000 to $39,999 | 360 (3.0%) | 328 (3.8%) |
| $40,000 to $44,999 | 627 (5.3%) | 393 (4.6%) |
| $45,000 to $49,999 | 543 (4.6%) | 195 (2.3%) |
| $50,000 to $54,999 | 345 (2.9%) | 297 (3.5%) |
| $55,000 to $64,999 | 536 (4.5%) | 368 (4.3%) |
| $65,000 to $74,999 | 678 (5.7%) | 211 (2.5%) |
| $75,000 to $99,999 | 834 (7.0%) | 361 (4.2%) |
| $100,000+ | 971 (8.2%) | 477 (5.6%) |
| Total | 11,888 (100.0%) | 8,509 (100.0%) |
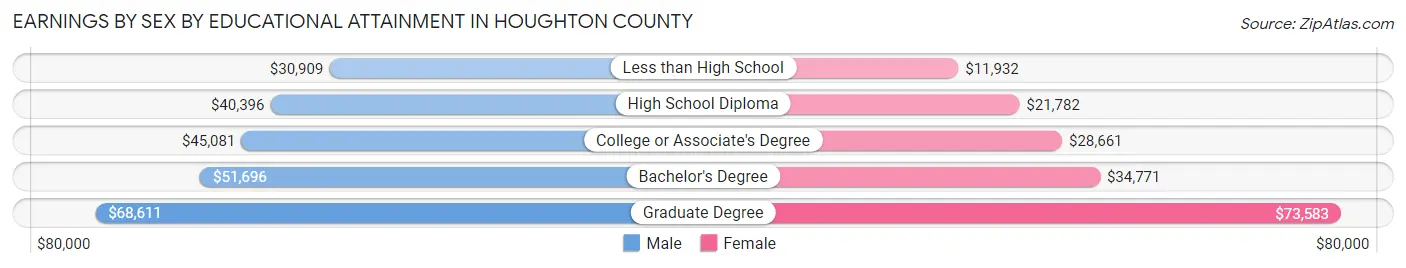
Earnings by Sex by Educational Attainment in Houghton County
Average earnings in Houghton County are $45,612 for men and $30,372 for women, a difference of 33.4%. Men with an educational attainment of graduate degree enjoy the highest average annual earnings of $68,611, while those with less than high school education earn the least with $30,909. Women with an educational attainment of graduate degree earn the most with the average annual earnings of $73,583, while those with less than high school education have the smallest earnings of $11,932.
| Educational Attainment | Male Income | Female Income |
| Less than High School | $30,909 | $11,932 |
| High School Diploma | $40,396 | $21,782 |
| College or Associate's Degree | $45,081 | $28,661 |
| Bachelor's Degree | $51,696 | $34,771 |
| Graduate Degree | $68,611 | $73,583 |
| Total | $45,612 | $30,372 |
Family Income in Houghton County
Family Income Brackets in Houghton County
According to the Houghton County family income data, there are 1,468 families falling into the $50,000 to $74,999 income range, which is the most common income bracket and makes up 19.0% of all families. Conversely, the $10,000 to $14,999 income bracket is the least frequent group with only 178 families (2.3%) belonging to this category.
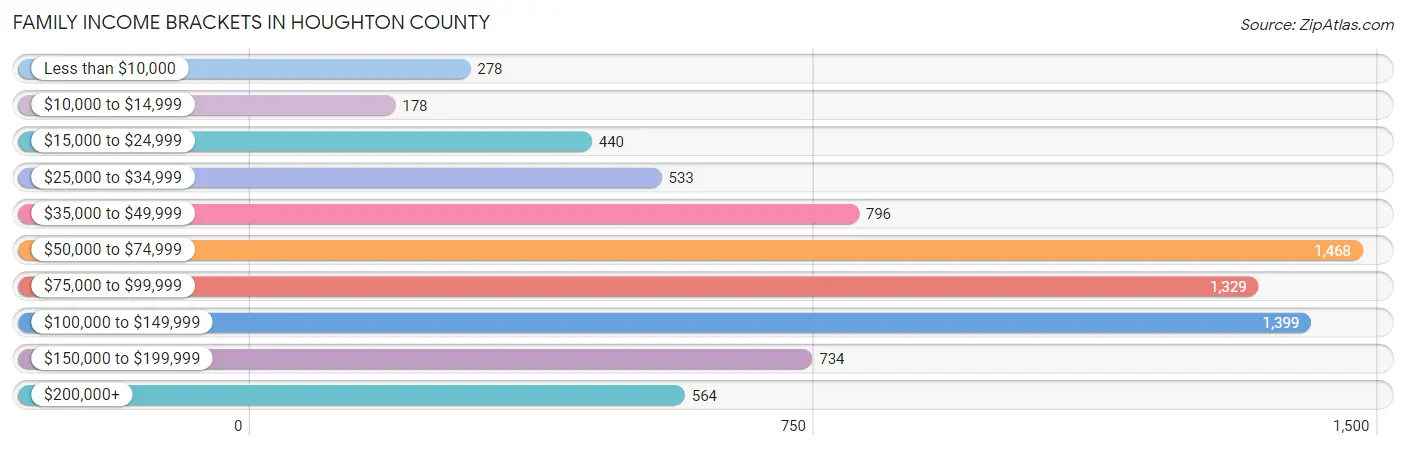
| Income Bracket | # Families | % Families |
| Less than $10,000 | 278 | 3.6% |
| $10,000 to $14,999 | 178 | 2.3% |
| $15,000 to $24,999 | 440 | 5.7% |
| $25,000 to $34,999 | 533 | 6.9% |
| $35,000 to $49,999 | 796 | 10.3% |
| $50,000 to $74,999 | 1,468 | 19.0% |
| $75,000 to $99,999 | 1,329 | 17.2% |
| $100,000 to $149,999 | 1,399 | 18.1% |
| $150,000 to $199,999 | 734 | 9.5% |
| $200,000+ | 564 | 7.3% |
Family Income by Famaliy Size in Houghton County
6-person families (359 | 4.6%) account for the highest median family income in Houghton County with $145,250 per family, while 2-person families (4,045 | 52.3%) have the highest median income of $33,323 per family member.
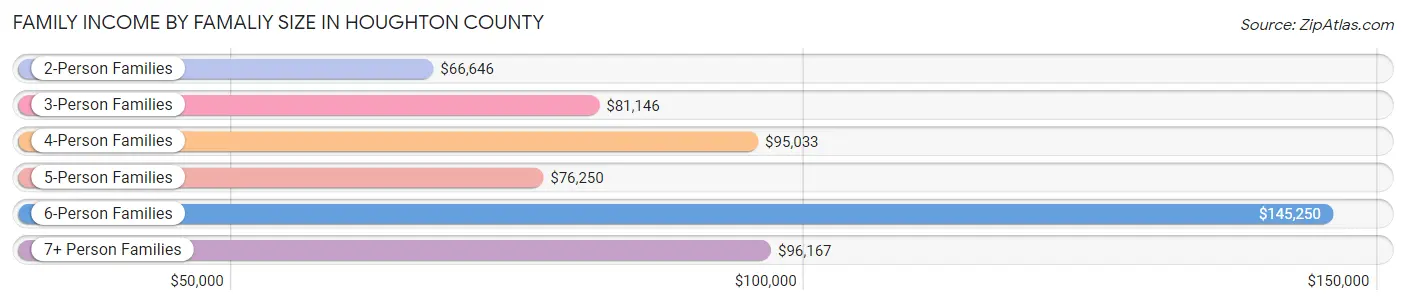
| Income Bracket | # Families | Median Income |
| 2-Person Families | 4,045 (52.3%) | $66,646 |
| 3-Person Families | 1,693 (21.9%) | $81,146 |
| 4-Person Families | 901 (11.7%) | $95,033 |
| 5-Person Families | 469 (6.1%) | $76,250 |
| 6-Person Families | 359 (4.6%) | $145,250 |
| 7+ Person Families | 260 (3.4%) | $96,167 |
| Total | 7,727 (100.0%) | $77,209 |
Family Income by Number of Earners in Houghton County
The median family income in Houghton County is $77,209, with families comprising 3+ earners (796) having the highest median family income of $127,014, while families with no earners (1,541) have the lowest median family income of $50,670, accounting for 10.3% and 19.9% of families, respectively.
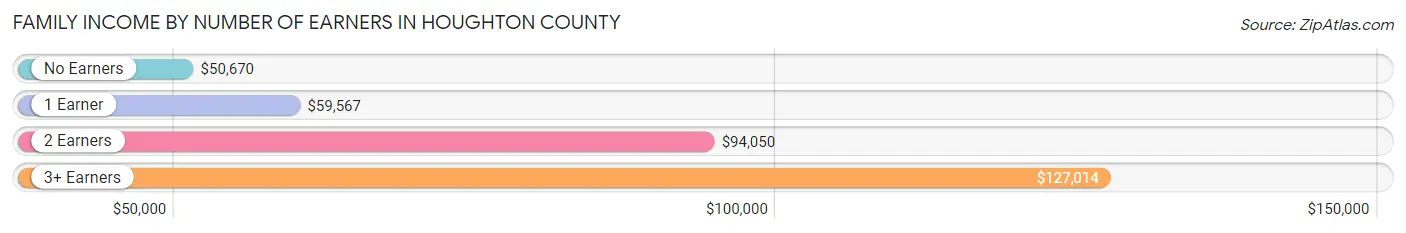
| Number of Earners | # Families | Median Income |
| No Earners | 1,541 (19.9%) | $50,670 |
| 1 Earner | 2,475 (32.0%) | $59,567 |
| 2 Earners | 2,915 (37.7%) | $94,050 |
| 3+ Earners | 796 (10.3%) | $127,014 |
| Total | 7,727 (100.0%) | $77,209 |
Household Income in Houghton County
Household Income Brackets in Houghton County
With 2,324 households falling in the category, the $50,000 to $74,999 income range is the most frequent in Houghton County, accounting for 16.4% of all households. In contrast, only 680 households (4.8%) fall into the $200,000+ income bracket, making it the least populous group.
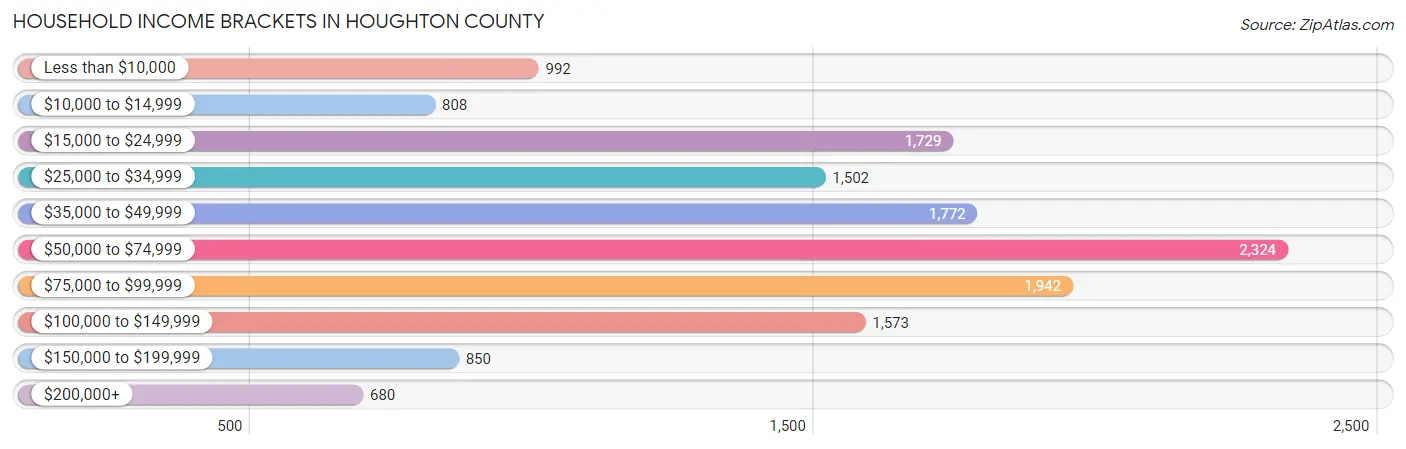
| Income Bracket | # Households | % Households |
| Less than $10,000 | 992 | 7.0% |
| $10,000 to $14,999 | 808 | 5.7% |
| $15,000 to $24,999 | 1,729 | 12.2% |
| $25,000 to $34,999 | 1,502 | 10.6% |
| $35,000 to $49,999 | 1,772 | 12.5% |
| $50,000 to $74,999 | 2,324 | 16.4% |
| $75,000 to $99,999 | 1,942 | 13.7% |
| $100,000 to $149,999 | 1,573 | 11.1% |
| $150,000 to $199,999 | 850 | 6.0% |
| $200,000+ | 680 | 4.8% |
Household Income by Householder Age in Houghton County
The median household income in Houghton County is $52,736, with the highest median household income of $72,685 found in the 45 to 64 years age bracket for the primary householder. A total of 4,584 households (32.3%) fall into this category. Meanwhile, the 15 to 24 years age bracket for the primary householder has the lowest median household income of $21,595, with 1,906 households (13.5%) in this group.
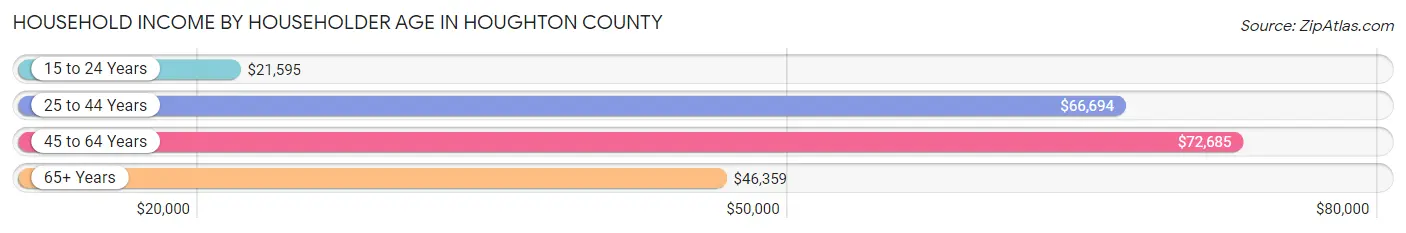
| Income Bracket | # Households | Median Income |
| 15 to 24 Years | 1,906 (13.5%) | $21,595 |
| 25 to 44 Years | 3,549 (25.0%) | $66,694 |
| 45 to 64 Years | 4,584 (32.3%) | $72,685 |
| 65+ Years | 4,134 (29.2%) | $46,359 |
| Total | 14,173 (100.0%) | $52,736 |
Poverty in Houghton County
Income Below Poverty by Sex and Age in Houghton County
With 18.2% poverty level for males and 16.2% for females among the residents of Houghton County, 18 to 24 year old males and 18 to 24 year old females are the most vulnerable to poverty, with 1,619 males (45.5%) and 998 females (45.2%) in their respective age groups living below the poverty level.
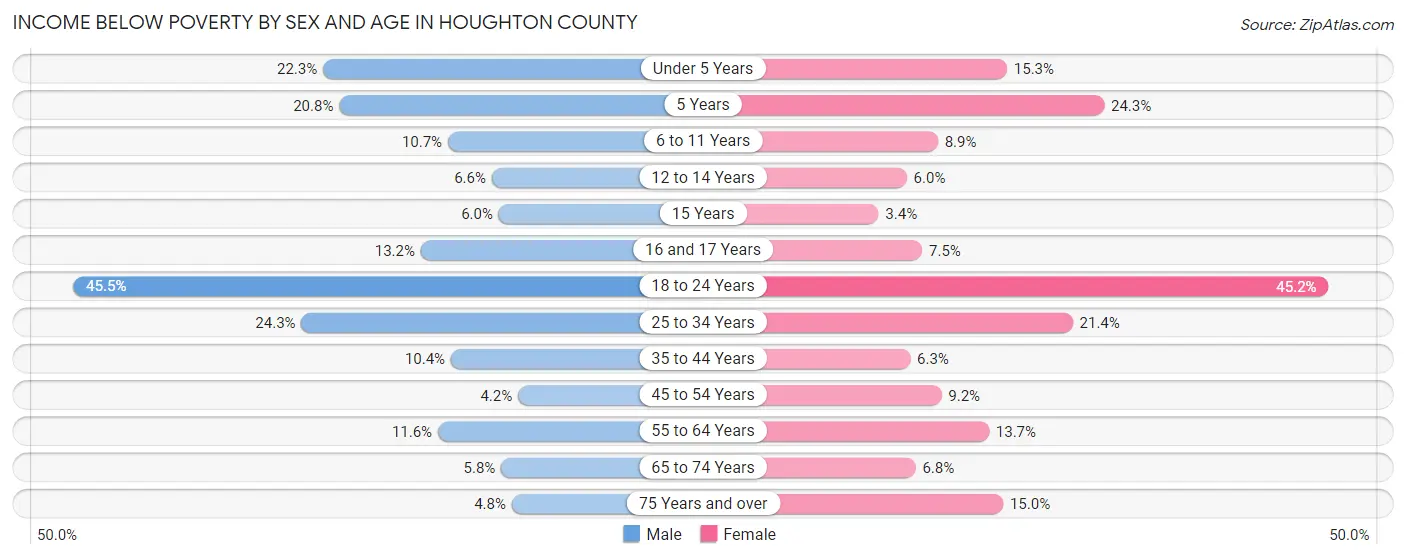
| Age Bracket | Male | Female |
| Under 5 Years | 215 (22.3%) | 127 (15.3%) |
| 5 Years | 52 (20.8%) | 37 (24.3%) |
| 6 to 11 Years | 132 (10.7%) | 89 (8.9%) |
| 12 to 14 Years | 47 (6.6%) | 48 (6.0%) |
| 15 Years | 19 (6.0%) | 7 (3.4%) |
| 16 and 17 Years | 50 (13.2%) | 33 (7.4%) |
| 18 to 24 Years | 1,619 (45.5%) | 998 (45.2%) |
| 25 to 34 Years | 473 (24.3%) | 352 (21.4%) |
| 35 to 44 Years | 185 (10.4%) | 106 (6.3%) |
| 45 to 54 Years | 74 (4.2%) | 149 (9.2%) |
| 55 to 64 Years | 250 (11.6%) | 277 (13.7%) |
| 65 to 74 Years | 109 (5.8%) | 121 (6.8%) |
| 75 Years and over | 50 (4.8%) | 219 (15.0%) |
| Total | 3,275 (18.2%) | 2,563 (16.2%) |
Income Above Poverty by Sex and Age in Houghton County
According to the poverty statistics in Houghton County, males aged 45 to 54 years and females aged 15 years are the age groups that are most secure financially, with 95.8% of males and 96.6% of females in these age groups living above the poverty line.
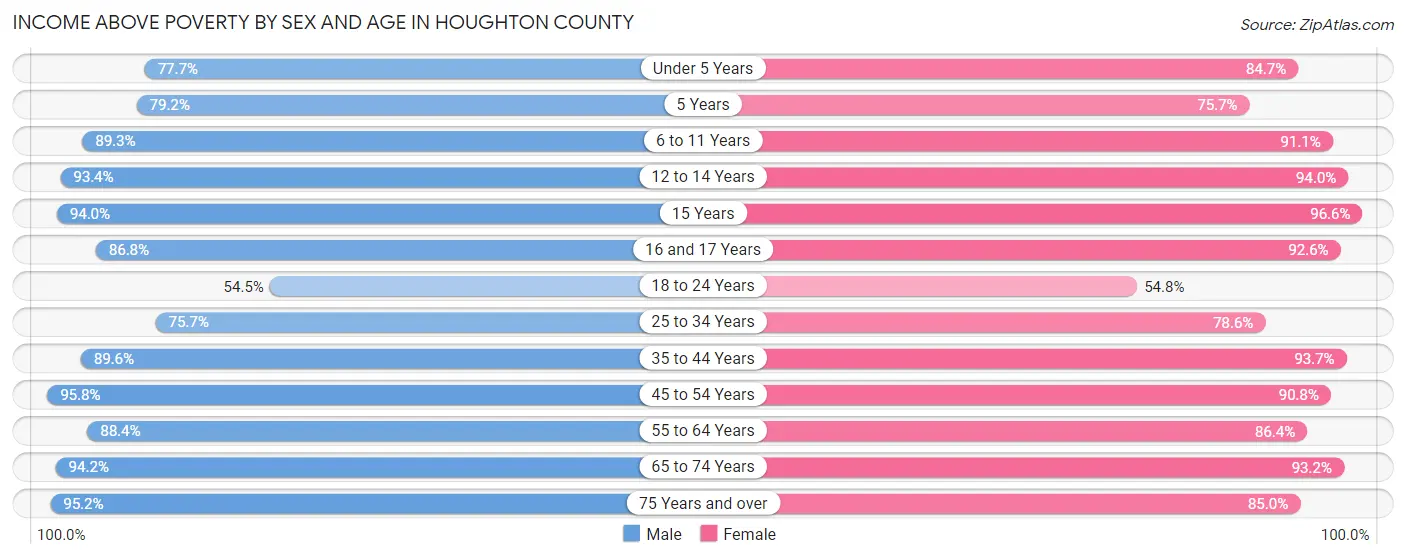
| Age Bracket | Male | Female |
| Under 5 Years | 749 (77.7%) | 702 (84.7%) |
| 5 Years | 198 (79.2%) | 115 (75.7%) |
| 6 to 11 Years | 1,100 (89.3%) | 911 (91.1%) |
| 12 to 14 Years | 661 (93.4%) | 749 (94.0%) |
| 15 Years | 298 (94.0%) | 199 (96.6%) |
| 16 and 17 Years | 328 (86.8%) | 410 (92.5%) |
| 18 to 24 Years | 1,940 (54.5%) | 1,212 (54.8%) |
| 25 to 34 Years | 1,473 (75.7%) | 1,291 (78.6%) |
| 35 to 44 Years | 1,589 (89.6%) | 1,565 (93.7%) |
| 45 to 54 Years | 1,687 (95.8%) | 1,464 (90.8%) |
| 55 to 64 Years | 1,897 (88.4%) | 1,753 (86.4%) |
| 65 to 74 Years | 1,779 (94.2%) | 1,648 (93.2%) |
| 75 Years and over | 997 (95.2%) | 1,245 (85.0%) |
| Total | 14,696 (81.8%) | 13,264 (83.8%) |
Income Below Poverty Among Married-Couple Families in Houghton County
The poverty statistics for married-couple families in Houghton County show that 4.6% or 279 of the total 6,110 families live below the poverty line. Families with 5 or more children have the highest poverty rate of 5.7%, comprising of 11 families. On the other hand, families with 1 or 2 children have the lowest poverty rate of 3.5%, which includes 56 families.
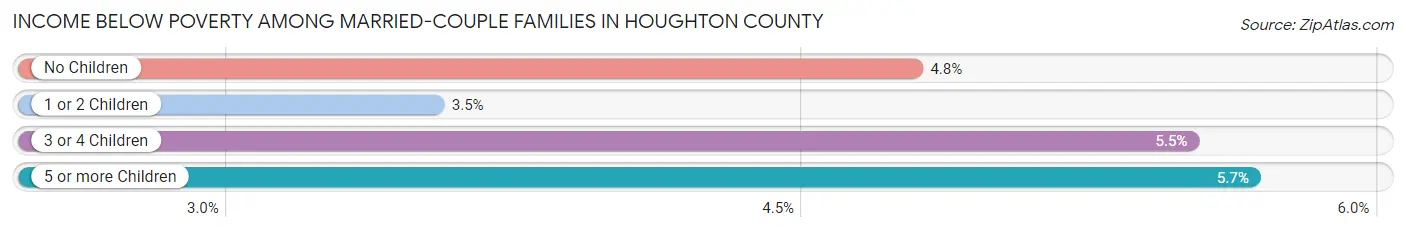
| Children | Above Poverty | Below Poverty |
| No Children | 3,558 (95.2%) | 179 (4.8%) |
| 1 or 2 Children | 1,524 (96.5%) | 56 (3.5%) |
| 3 or 4 Children | 566 (94.5%) | 33 (5.5%) |
| 5 or more Children | 183 (94.3%) | 11 (5.7%) |
| Total | 5,831 (95.4%) | 279 (4.6%) |
Income Below Poverty Among Single-Parent Households in Houghton County
According to the poverty data in Houghton County, 23.2% or 130 single-father households and 30.6% or 324 single-mother households are living below the poverty line. Among single-father households, those with 3 or 4 children have the highest poverty rate, with 39 households (60.9%) experiencing poverty. Likewise, among single-mother households, those with 5 or more children have the highest poverty rate, with 4 households (100.0%) falling below the poverty line.
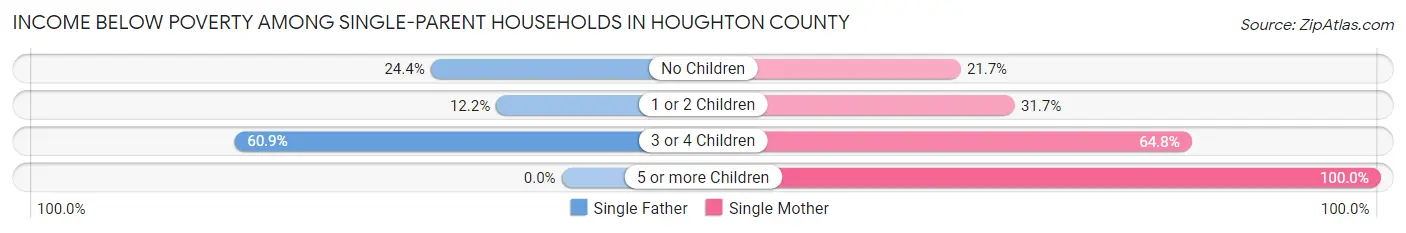
| Children | Single Father | Single Mother |
| No Children | 61 (24.4%) | 81 (21.7%) |
| 1 or 2 Children | 30 (12.2%) | 193 (31.7%) |
| 3 or 4 Children | 39 (60.9%) | 46 (64.8%) |
| 5 or more Children | 0 (0.0%) | 4 (100.0%) |
| Total | 130 (23.2%) | 324 (30.6%) |
Income Below Poverty Among Married-Couple vs Single-Parent Households in Houghton County
The poverty data for Houghton County shows that 279 of the married-couple family households (4.6%) and 454 of the single-parent households (28.1%) are living below the poverty level. Within the married-couple family households, those with 5 or more children have the highest poverty rate, with 11 households (5.7%) falling below the poverty line. Among the single-parent households, those with 5 or more children have the highest poverty rate, with 4 household (100.0%) living below poverty.
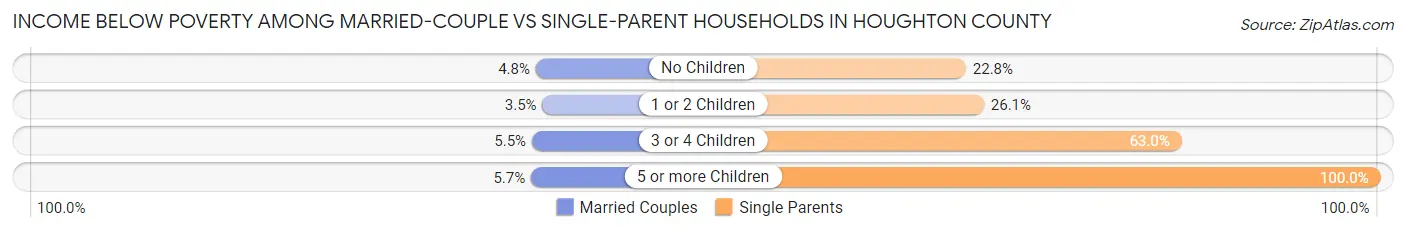
| Children | Married-Couple Families | Single-Parent Households |
| No Children | 179 (4.8%) | 142 (22.8%) |
| 1 or 2 Children | 56 (3.5%) | 223 (26.1%) |
| 3 or 4 Children | 33 (5.5%) | 85 (63.0%) |
| 5 or more Children | 11 (5.7%) | 4 (100.0%) |
| Total | 279 (4.6%) | 454 (28.1%) |
Race in Houghton County
The most populous races in Houghton County are White / Caucasian (34,326 | 91.7%), Asian (1,046 | 2.8%), and Two or more Races (1,043 | 2.8%).
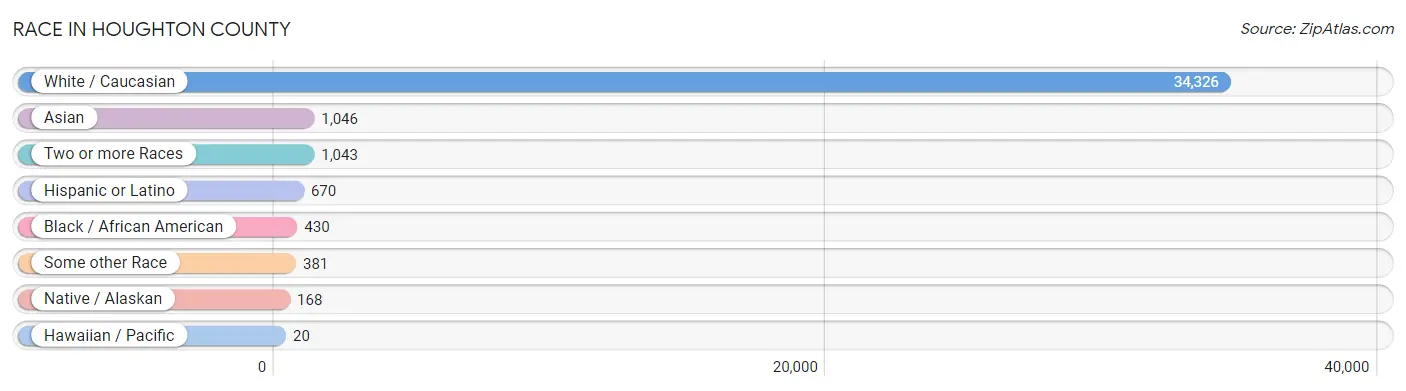
| Race | # Population | % Population |
| Asian | 1,046 | 2.8% |
| Black / African American | 430 | 1.1% |
| Hawaiian / Pacific | 20 | 0.1% |
| Hispanic or Latino | 670 | 1.8% |
| Native / Alaskan | 168 | 0.4% |
| White / Caucasian | 34,326 | 91.7% |
| Two or more Races | 1,043 | 2.8% |
| Some other Race | 381 | 1.0% |
| Total | 37,414 | 100.0% |
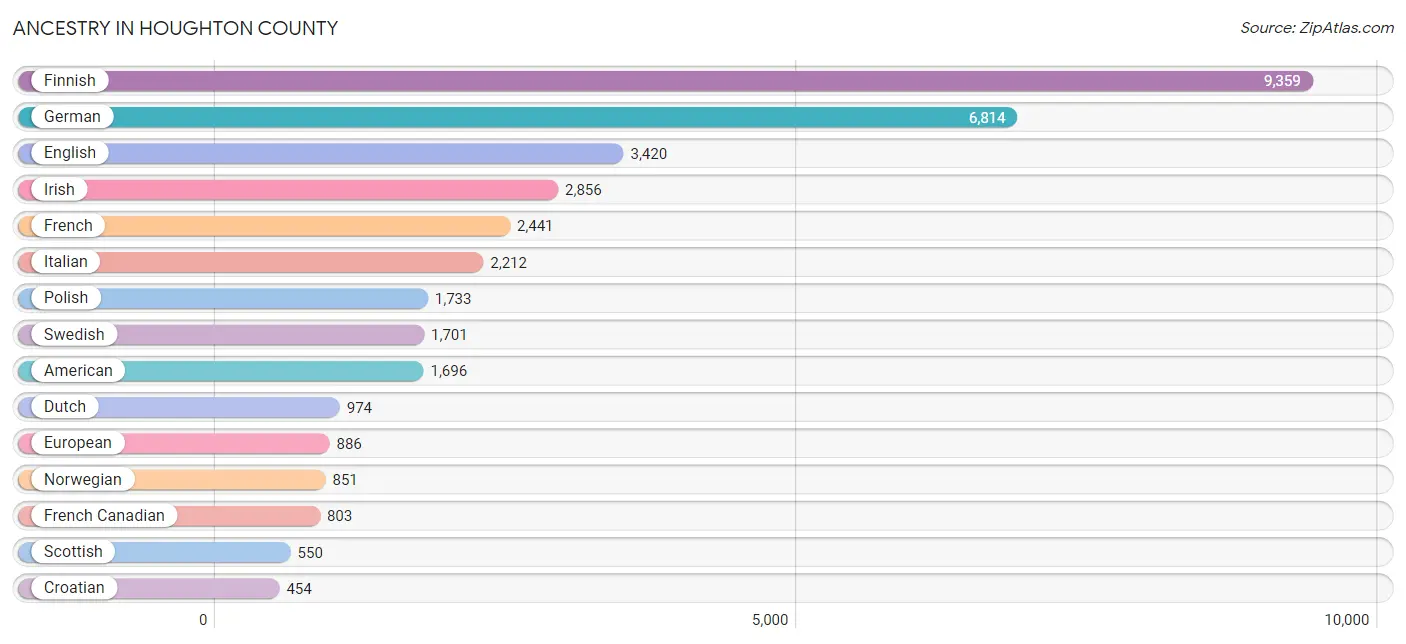
Ancestry in Houghton County
The most populous ancestries reported in Houghton County are Finnish (9,359 | 25.0%), German (6,814 | 18.2%), English (3,420 | 9.1%), Irish (2,856 | 7.6%), and French (2,441 | 6.5%), together accounting for 66.5% of all Houghton County residents.
| Ancestry | # Population | % Population |
| African | 20 | 0.1% |
| Alaskan Athabascan | 1 | 0.0% |
| Albanian | 11 | 0.0% |
| American | 1,696 | 4.5% |
| Arab | 211 | 0.6% |
| Argentinean | 17 | 0.1% |
| Armenian | 23 | 0.1% |
| Austrian | 71 | 0.2% |
| Belgian | 47 | 0.1% |
| Bhutanese | 23 | 0.1% |
| Blackfeet | 9 | 0.0% |
| Brazilian | 25 | 0.1% |
| British | 161 | 0.4% |
| Burmese | 127 | 0.3% |
| Cambodian | 10 | 0.0% |
| Canadian | 98 | 0.3% |
| Carpatho Rusyn | 9 | 0.0% |
| Central American | 10 | 0.0% |
| Central American Indian | 10 | 0.0% |
| Cherokee | 16 | 0.0% |
| Chinese | 5 | 0.0% |
| Chippewa | 210 | 0.6% |
| Colombian | 25 | 0.1% |
| Croatian | 454 | 1.2% |
| Cuban | 47 | 0.1% |
| Czech | 253 | 0.7% |
| Czechoslovakian | 4 | 0.0% |
| Danish | 74 | 0.2% |
| Dutch | 974 | 2.6% |
| Eastern European | 181 | 0.5% |
| English | 3,420 | 9.1% |
| Ethiopian | 2 | 0.0% |
| European | 886 | 2.4% |
| Finnish | 9,359 | 25.0% |
| French | 2,441 | 6.5% |
| French American Indian | 19 | 0.1% |
| French Canadian | 803 | 2.1% |
| German | 6,814 | 18.2% |
| Greek | 91 | 0.2% |
| Guatemalan | 7 | 0.0% |
| Haitian | 6 | 0.0% |
| Honduran | 3 | 0.0% |
| Hungarian | 175 | 0.5% |
| Indian (Asian) | 373 | 1.0% |
| Inupiat | 16 | 0.0% |
| Iranian | 66 | 0.2% |
| Irish | 2,856 | 7.6% |
| Italian | 2,212 | 5.9% |
| Jamaican | 11 | 0.0% |
| Japanese | 10 | 0.0% |
| Kenyan | 62 | 0.2% |
| Korean | 121 | 0.3% |
| Latvian | 4 | 0.0% |
| Lebanese | 85 | 0.2% |
| Lithuanian | 61 | 0.2% |
| Lumbee | 3 | 0.0% |
| Luxembourger | 6 | 0.0% |
| Maltese | 2 | 0.0% |
| Mexican | 386 | 1.0% |
| Mexican American Indian | 3 | 0.0% |
| Native Hawaiian | 20 | 0.1% |
| Navajo | 2 | 0.0% |
| Nigerian | 124 | 0.3% |
| Northern European | 132 | 0.4% |
| Norwegian | 851 | 2.3% |
| Okinawan | 2 | 0.0% |
| Ottawa | 45 | 0.1% |
| Paiute | 36 | 0.1% |
| Pakistani | 3 | 0.0% |
| Peruvian | 15 | 0.0% |
| Polish | 1,733 | 4.6% |
| Portuguese | 18 | 0.1% |
| Potawatomi | 32 | 0.1% |
| Puerto Rican | 60 | 0.2% |
| Romanian | 44 | 0.1% |
| Russian | 190 | 0.5% |
| Samoan | 4 | 0.0% |
| Scandinavian | 250 | 0.7% |
| Scotch-Irish | 298 | 0.8% |
| Scottish | 550 | 1.5% |
| Serbian | 32 | 0.1% |
| Sioux | 57 | 0.2% |
| Slavic | 4 | 0.0% |
| Slovak | 63 | 0.2% |
| Slovene | 118 | 0.3% |
| South African | 3 | 0.0% |
| South American | 74 | 0.2% |
| South American Indian | 14 | 0.0% |
| Spaniard | 70 | 0.2% |
| Spanish | 23 | 0.1% |
| Sri Lankan | 29 | 0.1% |
| Subsaharan African | 211 | 0.6% |
| Swedish | 1,701 | 4.5% |
| Swiss | 43 | 0.1% |
| Syrian | 4 | 0.0% |
| Thai | 351 | 0.9% |
| Turkish | 47 | 0.1% |
| Ukrainian | 57 | 0.2% |
| Venezuelan | 17 | 0.1% |
| Vietnamese | 62 | 0.2% |
| Welsh | 81 | 0.2% |
| Yugoslavian | 55 | 0.2% | View All 102 Rows |
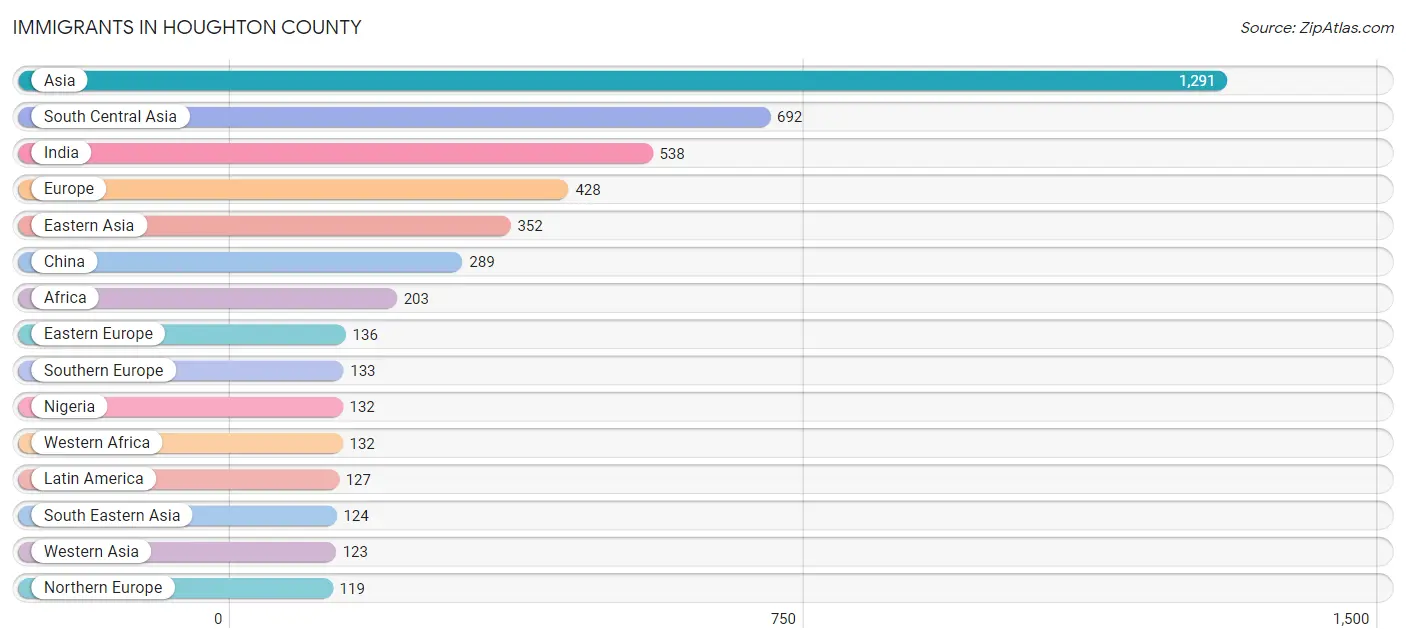
Immigrants in Houghton County
The most numerous immigrant groups reported in Houghton County came from Asia (1,291 | 3.5%), South Central Asia (692 | 1.8%), India (538 | 1.4%), Europe (428 | 1.1%), and Eastern Asia (352 | 0.9%), together accounting for 8.8% of all Houghton County residents.
| Immigration Origin | # Population | % Population |
| Africa | 203 | 0.5% |
| Albania | 3 | 0.0% |
| Argentina | 17 | 0.1% |
| Asia | 1,291 | 3.5% |
| Australia | 6 | 0.0% |
| Azores | 7 | 0.0% |
| Bangladesh | 62 | 0.2% |
| Brazil | 8 | 0.0% |
| Cambodia | 10 | 0.0% |
| Canada | 90 | 0.2% |
| Caribbean | 32 | 0.1% |
| Central America | 48 | 0.1% |
| China | 289 | 0.8% |
| Colombia | 22 | 0.1% |
| Eastern Africa | 64 | 0.2% |
| Eastern Asia | 352 | 0.9% |
| Eastern Europe | 136 | 0.4% |
| England | 28 | 0.1% |
| Ethiopia | 2 | 0.0% |
| Europe | 428 | 1.1% |
| Germany | 37 | 0.1% |
| Greece | 6 | 0.0% |
| Guatemala | 7 | 0.0% |
| Haiti | 6 | 0.0% |
| India | 538 | 1.4% |
| Iran | 49 | 0.1% |
| Italy | 111 | 0.3% |
| Jamaica | 16 | 0.0% |
| Japan | 25 | 0.1% |
| Kazakhstan | 10 | 0.0% |
| Kenya | 62 | 0.2% |
| Korea | 38 | 0.1% |
| Latin America | 127 | 0.3% |
| Lithuania | 11 | 0.0% |
| Mexico | 41 | 0.1% |
| Netherlands | 3 | 0.0% |
| Nigeria | 132 | 0.4% |
| Northern Africa | 7 | 0.0% |
| Northern Europe | 119 | 0.3% |
| Oceania | 16 | 0.0% |
| Pakistan | 33 | 0.1% |
| Philippines | 94 | 0.3% |
| Poland | 9 | 0.0% |
| Portugal | 7 | 0.0% |
| Romania | 12 | 0.0% |
| Russia | 77 | 0.2% |
| Scotland | 16 | 0.0% |
| Singapore | 10 | 0.0% |
| South America | 47 | 0.1% |
| South Central Asia | 692 | 1.8% |
| South Eastern Asia | 124 | 0.3% |
| Southern Europe | 133 | 0.4% |
| Spain | 9 | 0.0% |
| Sweden | 3 | 0.0% |
| Taiwan | 5 | 0.0% |
| Thailand | 3 | 0.0% |
| Trinidad and Tobago | 8 | 0.0% |
| Turkey | 42 | 0.1% |
| Ukraine | 19 | 0.1% |
| Vietnam | 7 | 0.0% |
| Western Africa | 132 | 0.4% |
| Western Asia | 123 | 0.3% |
| Western Europe | 40 | 0.1% |
| Yemen | 81 | 0.2% | View All 64 Rows |
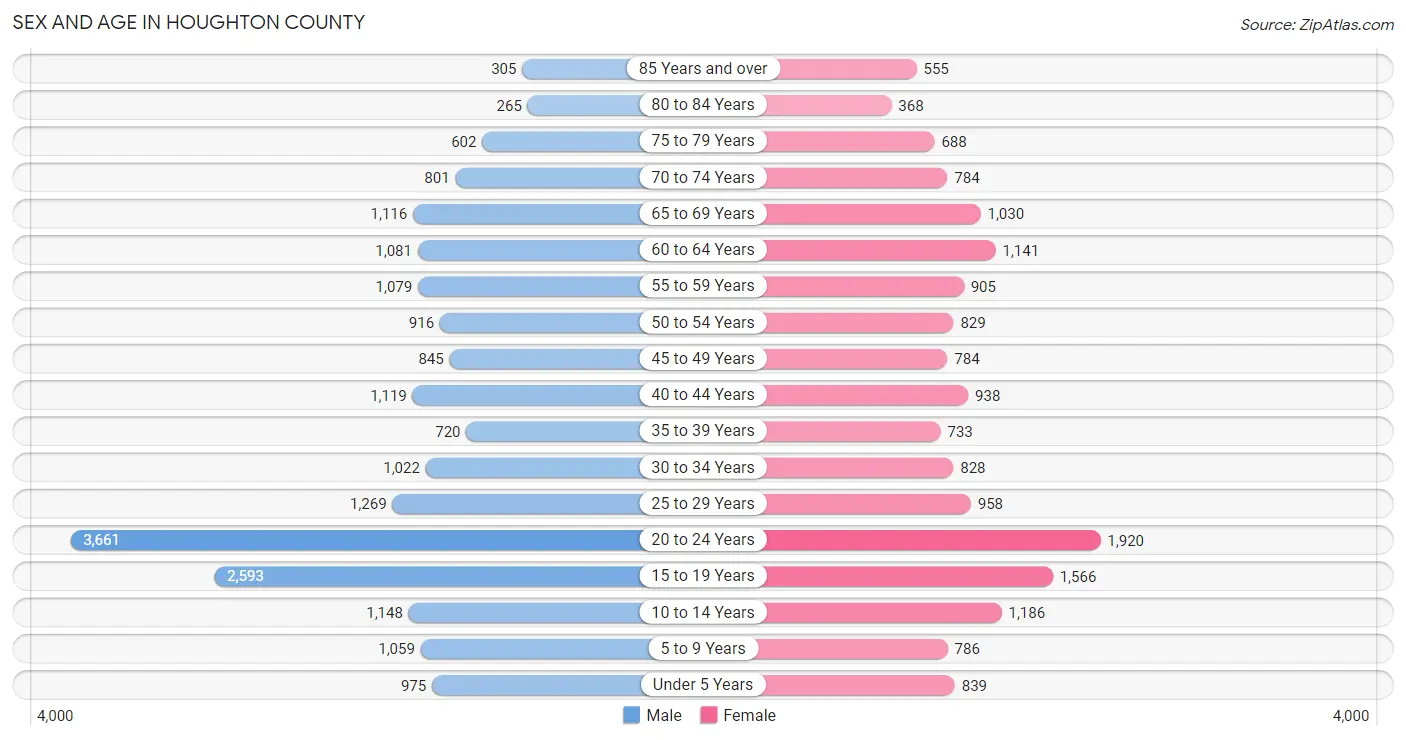
Sex and Age in Houghton County
Sex and Age in Houghton County
The most populous age groups in Houghton County are 20 to 24 Years (3,661 | 17.8%) for men and 20 to 24 Years (1,920 | 11.4%) for women.
| Age Bracket | Male | Female |
| Under 5 Years | 975 (4.7%) | 839 (5.0%) |
| 5 to 9 Years | 1,059 (5.1%) | 786 (4.7%) |
| 10 to 14 Years | 1,148 (5.6%) | 1,186 (7.0%) |
| 15 to 19 Years | 2,593 (12.6%) | 1,566 (9.3%) |
| 20 to 24 Years | 3,661 (17.8%) | 1,920 (11.4%) |
| 25 to 29 Years | 1,269 (6.2%) | 958 (5.7%) |
| 30 to 34 Years | 1,022 (5.0%) | 828 (4.9%) |
| 35 to 39 Years | 720 (3.5%) | 733 (4.3%) |
| 40 to 44 Years | 1,119 (5.4%) | 938 (5.6%) |
| 45 to 49 Years | 845 (4.1%) | 784 (4.7%) |
| 50 to 54 Years | 916 (4.4%) | 829 (4.9%) |
| 55 to 59 Years | 1,079 (5.2%) | 905 (5.4%) |
| 60 to 64 Years | 1,081 (5.2%) | 1,141 (6.8%) |
| 65 to 69 Years | 1,116 (5.4%) | 1,030 (6.1%) |
| 70 to 74 Years | 801 (3.9%) | 784 (4.7%) |
| 75 to 79 Years | 602 (2.9%) | 688 (4.1%) |
| 80 to 84 Years | 265 (1.3%) | 368 (2.2%) |
| 85 Years and over | 305 (1.5%) | 555 (3.3%) |
| Total | 20,576 (100.0%) | 16,838 (100.0%) |
Families and Households in Houghton County
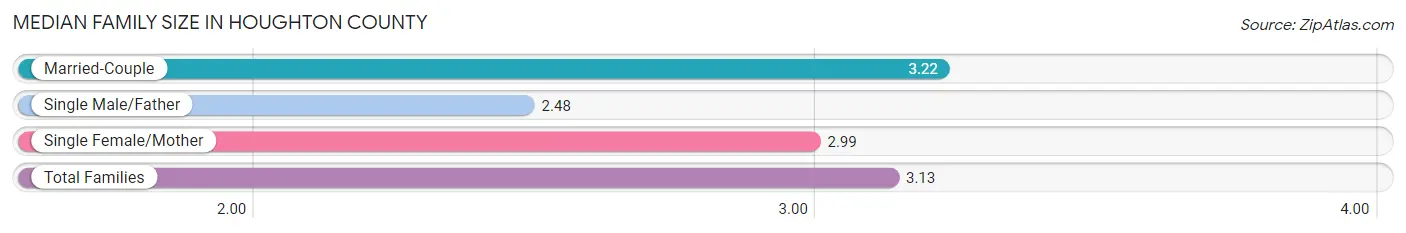
Median Family Size in Houghton County
The median family size in Houghton County is 3.13 persons per family, with married-couple families (6,110 | 79.1%) accounting for the largest median family size of 3.22 persons per family. On the other hand, single male/father families (560 | 7.2%) represent the smallest median family size with 2.48 persons per family.
| Family Type | # Families | Family Size |
| Married-Couple | 6,110 (79.1%) | 3.22 |
| Single Male/Father | 560 (7.2%) | 2.48 |
| Single Female/Mother | 1,057 (13.7%) | 2.99 |
| Total Families | 7,727 (100.0%) | 3.13 |
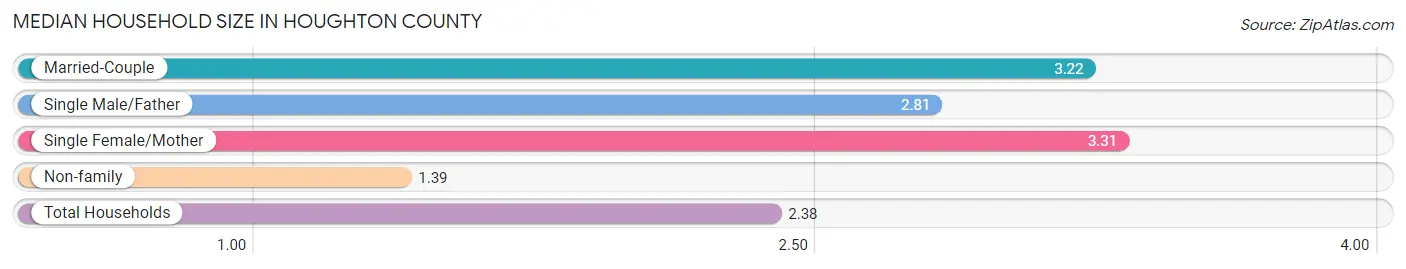
Median Household Size in Houghton County
The median household size in Houghton County is 2.38 persons per household, with single female/mother households (1,057 | 7.5%) accounting for the largest median household size of 3.31 persons per household. non-family households (6,446 | 45.5%) represent the smallest median household size with 1.39 persons per household.
| Household Type | # Households | Household Size |
| Married-Couple | 6,110 (43.1%) | 3.22 |
| Single Male/Father | 560 (4.0%) | 2.81 |
| Single Female/Mother | 1,057 (7.5%) | 3.31 |
| Non-family | 6,446 (45.5%) | 1.39 |
| Total Households | 14,173 (100.0%) | 2.38 |
Household Size by Marriage Status in Houghton County
Out of a total of 14,173 households in Houghton County, 7,727 (54.5%) are family households, while 6,446 (45.5%) are nonfamily households. The most numerous type of family households are 2-person households, comprising 3,892, and the most common type of nonfamily households are 1-person households, comprising 4,846.
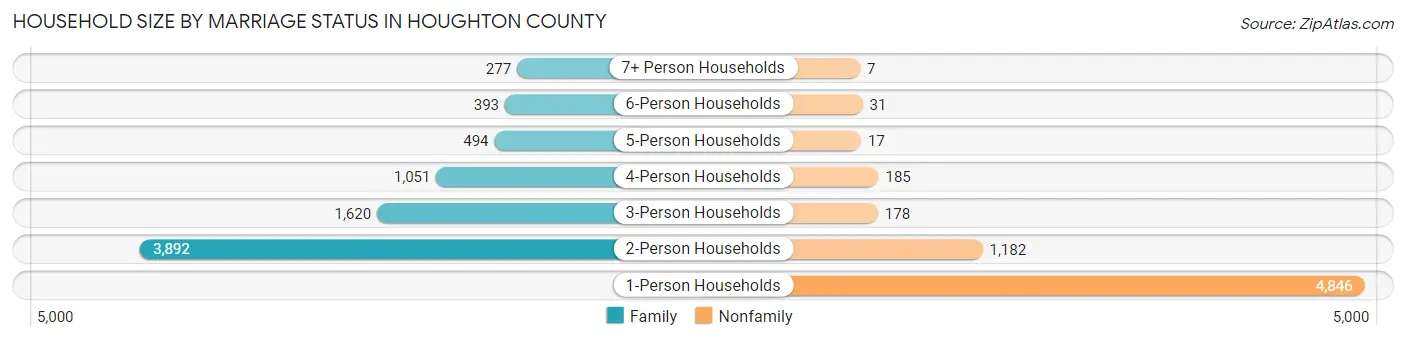
| Household Size | Family Households | Nonfamily Households |
| 1-Person Households | - | 4,846 (34.2%) |
| 2-Person Households | 3,892 (27.5%) | 1,182 (8.3%) |
| 3-Person Households | 1,620 (11.4%) | 178 (1.3%) |
| 4-Person Households | 1,051 (7.4%) | 185 (1.3%) |
| 5-Person Households | 494 (3.5%) | 17 (0.1%) |
| 6-Person Households | 393 (2.8%) | 31 (0.2%) |
| 7+ Person Households | 277 (1.9%) | 7 (0.1%) |
| Total | 7,727 (54.5%) | 6,446 (45.5%) |
Female Fertility in Houghton County
Fertility by Age in Houghton County
Average fertility rate in Houghton County is 38.0 births per 1,000 women. Women in the age bracket of 20 to 34 years have the highest fertility rate with 60.0 births per 1,000 women. Women in the age bracket of 20 to 34 years acount for 73.0% of all women with births.
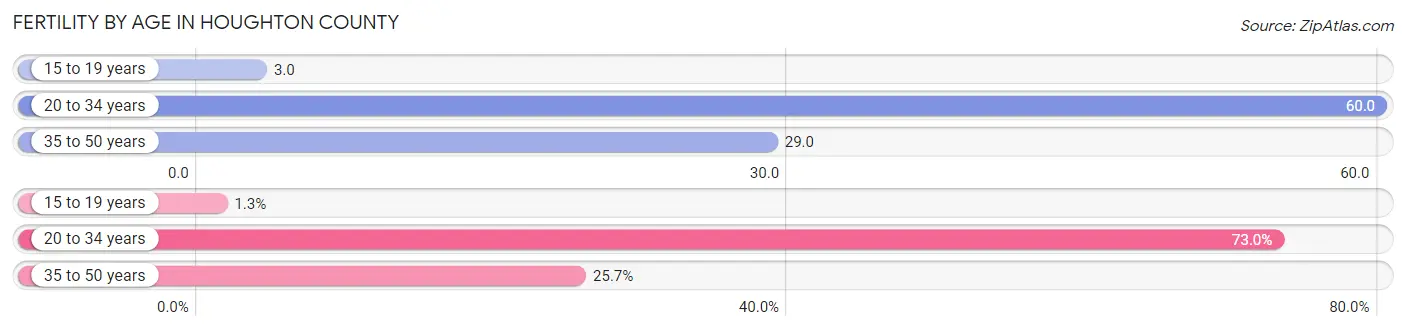
| Age Bracket | Women with Births | Births / 1,000 Women |
| 15 to 19 years | 4 (1.3%) | 3.0 |
| 20 to 34 years | 222 (73.0%) | 60.0 |
| 35 to 50 years | 78 (25.7%) | 29.0 |
| Total | 304 (100.0%) | 38.0 |
Fertility by Age by Marriage Status in Houghton County
68.1% of women with births (304) in Houghton County are married. The highest percentage of unmarried women with births falls into 15 to 19 years age bracket with 100.0% of them unmarried at the time of birth, while the lowest percentage of unmarried women with births belong to 35 to 50 years age bracket with 6.4% of them unmarried.
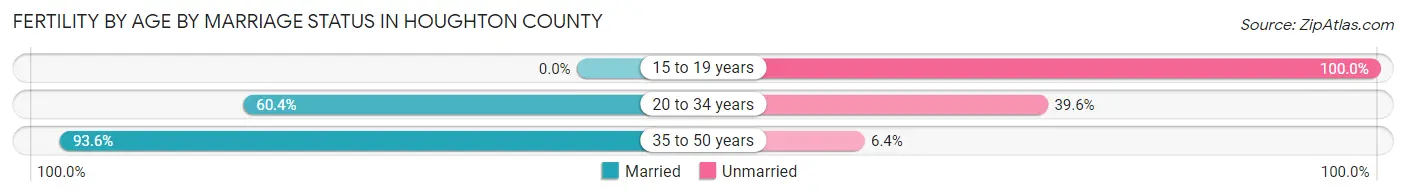
| Age Bracket | Married | Unmarried |
| 15 to 19 years | 0 (0.0%) | 4 (100.0%) |
| 20 to 34 years | 134 (60.4%) | 88 (39.6%) |
| 35 to 50 years | 73 (93.6%) | 5 (6.4%) |
| Total | 207 (68.1%) | 97 (31.9%) |
Fertility by Education in Houghton County
Average fertility rate in Houghton County is 38.0 births per 1,000 women. Women with the education attainment of high school diploma have the highest fertility rate of 58.0 births per 1,000 women, while women with the education attainment of bachelor's degree have the lowest fertility at 18.0 births per 1,000 women. Women with the education attainment of high school diploma represent 36.2% of all women with births.
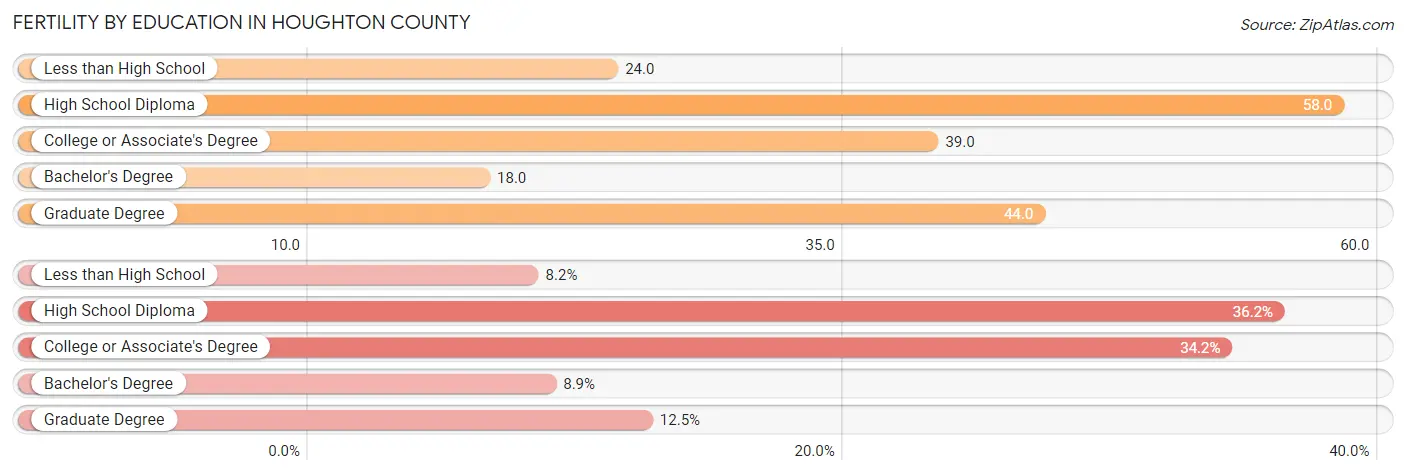
| Educational Attainment | Women with Births | Births / 1,000 Women |
| Less than High School | 25 (8.2%) | 24.0 |
| High School Diploma | 110 (36.2%) | 58.0 |
| College or Associate's Degree | 104 (34.2%) | 39.0 |
| Bachelor's Degree | 27 (8.9%) | 18.0 |
| Graduate Degree | 38 (12.5%) | 44.0 |
| Total | 304 (100.0%) | 38.0 |
Fertility by Education by Marriage Status in Houghton County
31.9% of women with births in Houghton County are unmarried. Women with the educational attainment of bachelor's degree are most likely to be married with 96.3% of them married at childbirth, while women with the educational attainment of less than high school are least likely to be married with 64.0% of them unmarried at childbirth.
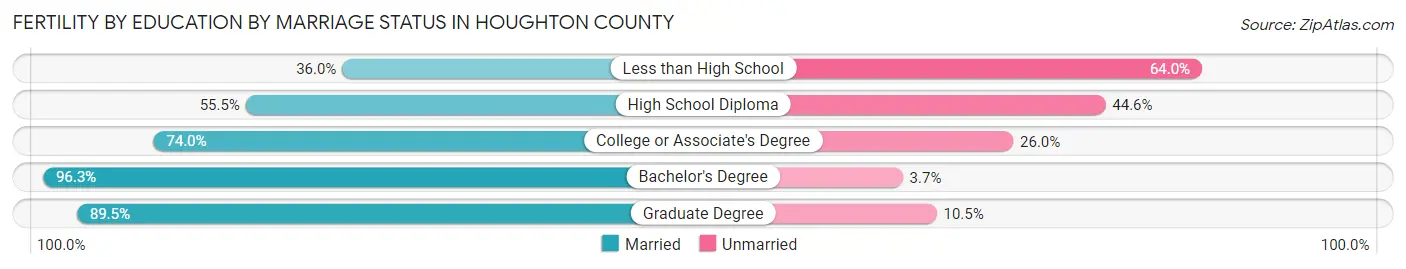
| Educational Attainment | Married | Unmarried |
| Less than High School | 9 (36.0%) | 16 (64.0%) |
| High School Diploma | 61 (55.4%) | 49 (44.6%) |
| College or Associate's Degree | 77 (74.0%) | 27 (26.0%) |
| Bachelor's Degree | 26 (96.3%) | 1 (3.7%) |
| Graduate Degree | 34 (89.5%) | 4 (10.5%) |
| Total | 207 (68.1%) | 97 (31.9%) |
Employment Characteristics in Houghton County
Employment by Class of Employer in Houghton County
Among the 16,375 employed individuals in Houghton County, private company employees (9,239 | 56.4%), state government employees (2,264 | 13.8%), and not-for-profit organizations (2,171 | 13.3%) make up the most common classes of employment.
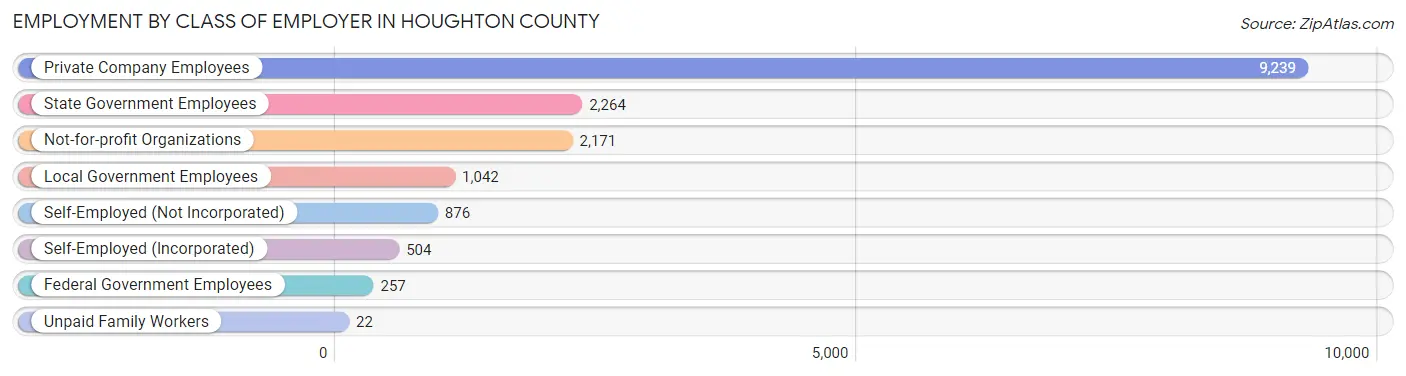
| Employer Class | # Employees | % Employees |
| Private Company Employees | 9,239 | 56.4% |
| Self-Employed (Incorporated) | 504 | 3.1% |
| Self-Employed (Not Incorporated) | 876 | 5.3% |
| Not-for-profit Organizations | 2,171 | 13.3% |
| Local Government Employees | 1,042 | 6.4% |
| State Government Employees | 2,264 | 13.8% |
| Federal Government Employees | 257 | 1.6% |
| Unpaid Family Workers | 22 | 0.1% |
| Total | 16,375 | 100.0% |
Employment Status by Age in Houghton County
According to the labor force statistics for Houghton County, out of the total population over 16 years of age (30,898), 58.0% or 17,921 individuals are in the labor force, with 6.2% or 1,111 of them unemployed. The age group with the highest labor force participation rate is 25 to 29 years, with 83.8% or 1,866 individuals in the labor force. Within the labor force, the 16 to 19 years age range has the highest percentage of unemployed individuals, with 13.5% or 217 of them being unemployed.
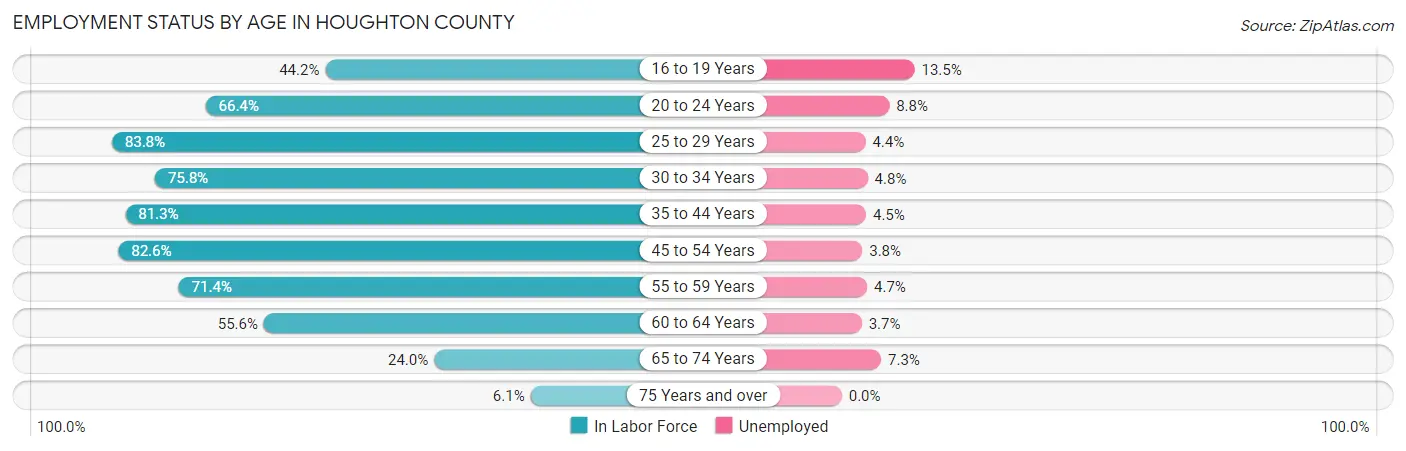
| Age Bracket | In Labor Force | Unemployed |
| 16 to 19 Years | 1,607 (44.2%) | 217 (13.5%) |
| 20 to 24 Years | 3,706 (66.4%) | 326 (8.8%) |
| 25 to 29 Years | 1,866 (83.8%) | 82 (4.4%) |
| 30 to 34 Years | 1,402 (75.8%) | 67 (4.8%) |
| 35 to 44 Years | 2,854 (81.3%) | 128 (4.5%) |
| 45 to 54 Years | 2,787 (82.6%) | 106 (3.8%) |
| 55 to 59 Years | 1,417 (71.4%) | 67 (4.7%) |
| 60 to 64 Years | 1,235 (55.6%) | 46 (3.7%) |
| 65 to 74 Years | 895 (24.0%) | 65 (7.3%) |
| 75 Years and over | 170 (6.1%) | 0 (0.0%) |
| Total | 17,921 (58.0%) | 1,111 (6.2%) |
Employment Status by Educational Attainment in Houghton County
According to labor force statistics for Houghton County, 76.2% of individuals (11,557) out of the total population between 25 and 64 years of age (15,167) are in the labor force, with 4.3% or 497 of them being unemployed. The group with the highest labor force participation rate are those with the educational attainment of bachelor's degree or higher, with 83.9% or 4,722 individuals in the labor force. Within the labor force, individuals with less than high school education have the highest percentage of unemployment, with 6.8% or 36 of them being unemployed.
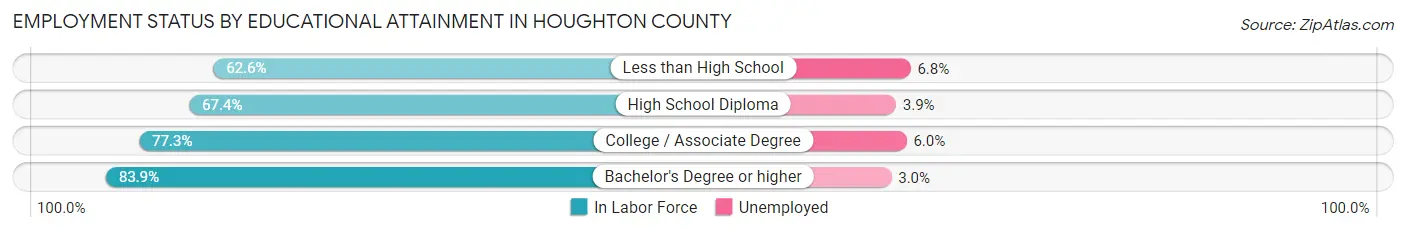
| Educational Attainment | In Labor Force | Unemployed |
| Less than High School | 530 (62.6%) | 58 (6.8%) |
| High School Diploma | 2,788 (67.4%) | 161 (3.9%) |
| College / Associate Degree | 3,521 (77.3%) | 273 (6.0%) |
| Bachelor's Degree or higher | 4,722 (83.9%) | 169 (3.0%) |
| Total | 11,557 (76.2%) | 652 (4.3%) |
Employment Occupations by Sex in Houghton County
Management, Business, Science and Arts Occupations
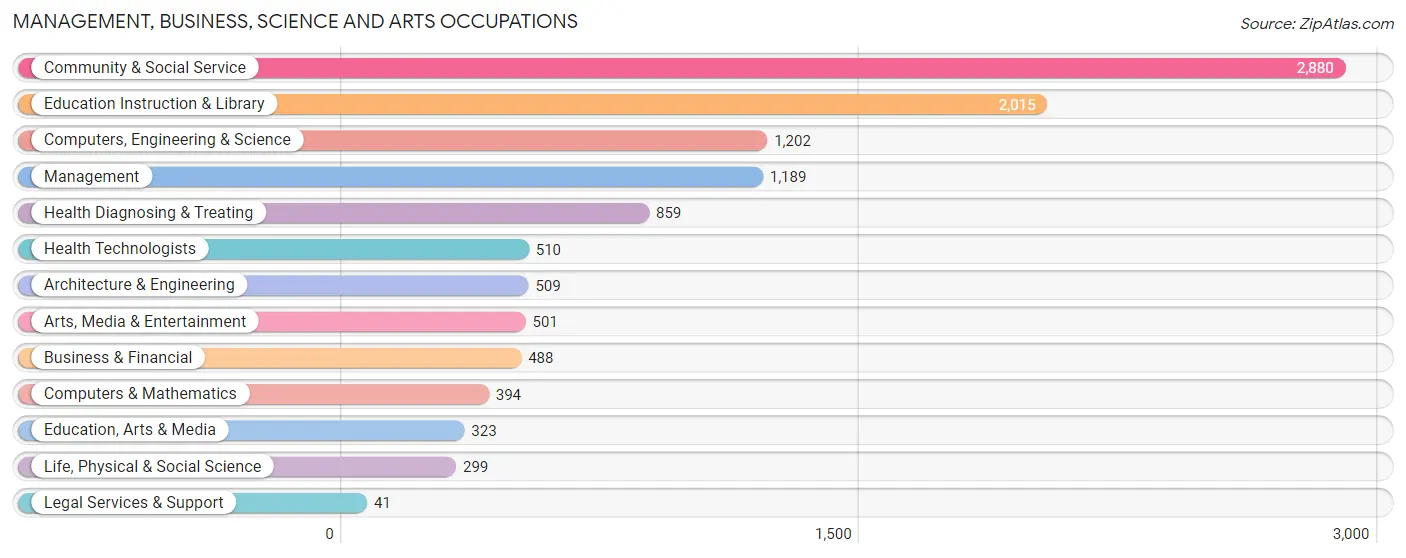
The most common Management, Business, Science and Arts occupations in Houghton County are Community & Social Service (2,880 | 17.2%), Education Instruction & Library (2,015 | 12.0%), Computers, Engineering & Science (1,202 | 7.2%), Management (1,189 | 7.1%), and Health Diagnosing & Treating (859 | 5.1%).
Management, Business, Science and Arts Occupations by Sex
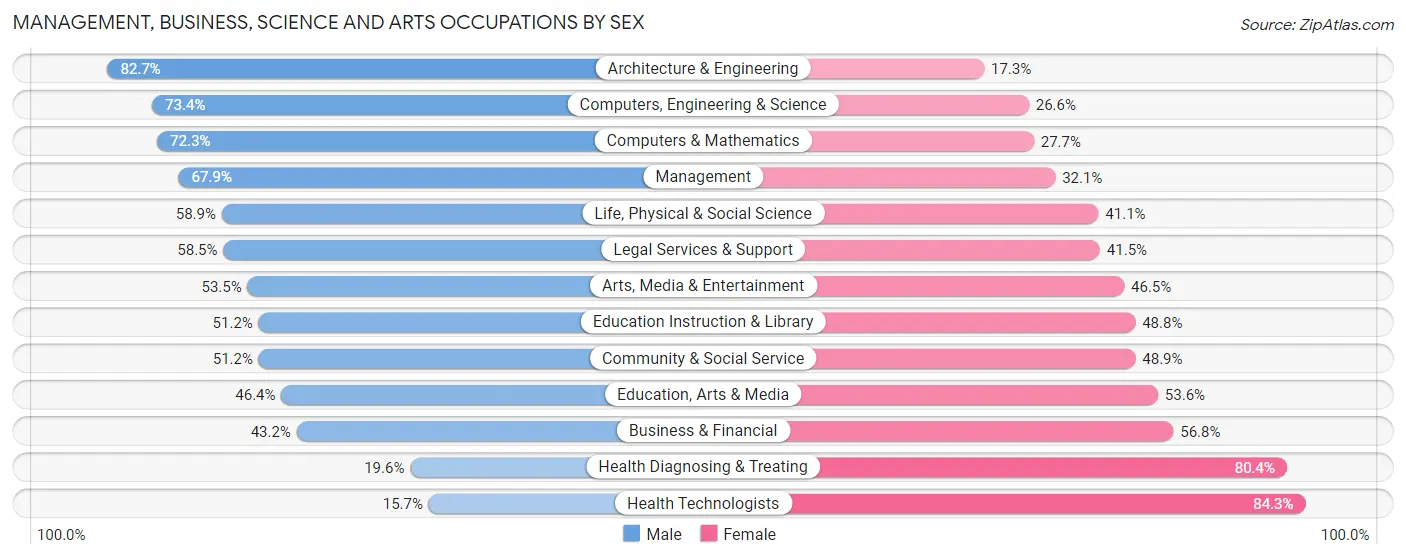
Within the Management, Business, Science and Arts occupations in Houghton County, the most male-oriented occupations are Architecture & Engineering (82.7%), Computers, Engineering & Science (73.4%), and Computers & Mathematics (72.3%), while the most female-oriented occupations are Health Technologists (84.3%), Health Diagnosing & Treating (80.4%), and Business & Financial (56.8%).
| Occupation | Male | Female |
| Management | 807 (67.9%) | 382 (32.1%) |
| Business & Financial | 211 (43.2%) | 277 (56.8%) |
| Computers, Engineering & Science | 882 (73.4%) | 320 (26.6%) |
| Computers & Mathematics | 285 (72.3%) | 109 (27.7%) |
| Architecture & Engineering | 421 (82.7%) | 88 (17.3%) |
| Life, Physical & Social Science | 176 (58.9%) | 123 (41.1%) |
| Community & Social Service | 1,473 (51.1%) | 1,407 (48.8%) |
| Education, Arts & Media | 150 (46.4%) | 173 (53.6%) |
| Legal Services & Support | 24 (58.5%) | 17 (41.5%) |
| Education Instruction & Library | 1,031 (51.2%) | 984 (48.8%) |
| Arts, Media & Entertainment | 268 (53.5%) | 233 (46.5%) |
| Health Diagnosing & Treating | 168 (19.6%) | 691 (80.4%) |
| Health Technologists | 80 (15.7%) | 430 (84.3%) |
| Total (Category) | 3,541 (53.5%) | 3,077 (46.5%) |
| Total (Overall) | 9,371 (55.8%) | 7,422 (44.2%) |
Services Occupations
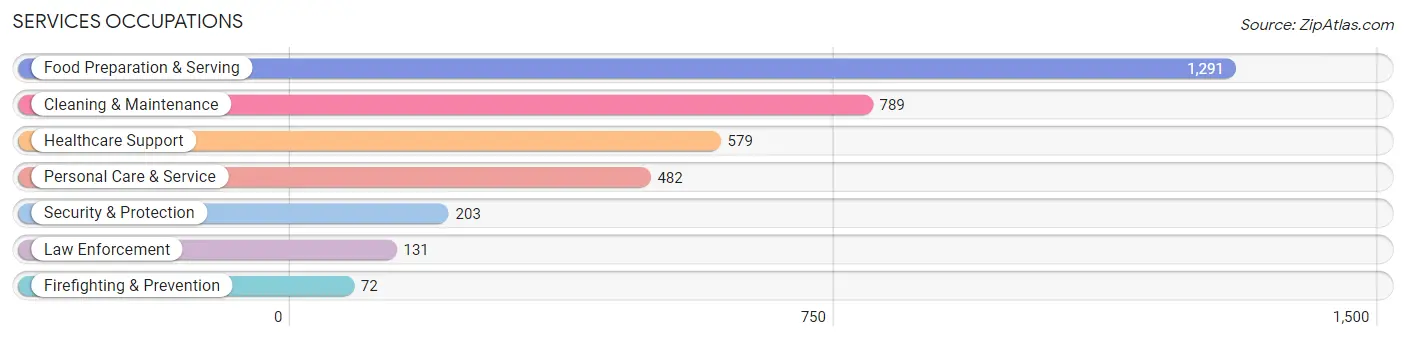
The most common Services occupations in Houghton County are Food Preparation & Serving (1,291 | 7.7%), Cleaning & Maintenance (789 | 4.7%), Healthcare Support (579 | 3.5%), Personal Care & Service (482 | 2.9%), and Security & Protection (203 | 1.2%).
Services Occupations by Sex
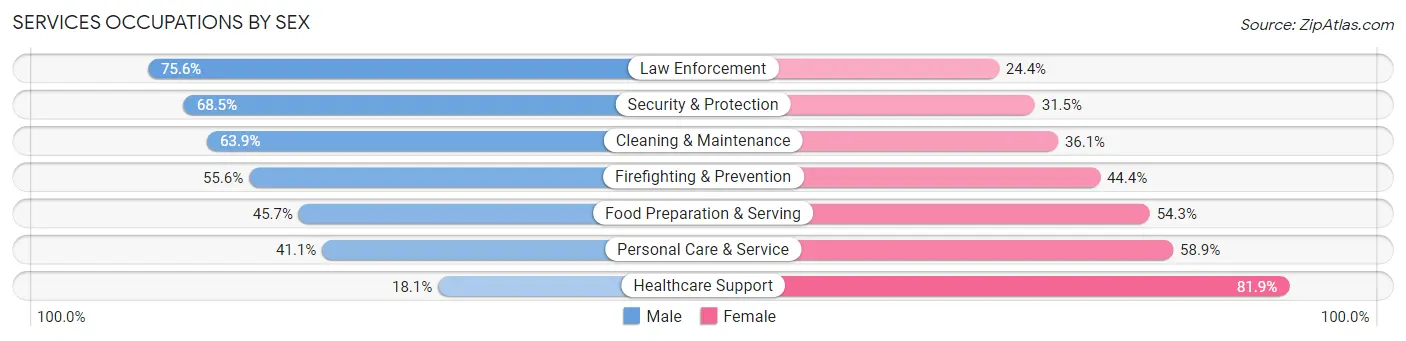
Within the Services occupations in Houghton County, the most male-oriented occupations are Law Enforcement (75.6%), Security & Protection (68.5%), and Cleaning & Maintenance (63.9%), while the most female-oriented occupations are Healthcare Support (81.9%), Personal Care & Service (58.9%), and Food Preparation & Serving (54.3%).
| Occupation | Male | Female |
| Healthcare Support | 105 (18.1%) | 474 (81.9%) |
| Security & Protection | 139 (68.5%) | 64 (31.5%) |
| Firefighting & Prevention | 40 (55.6%) | 32 (44.4%) |
| Law Enforcement | 99 (75.6%) | 32 (24.4%) |
| Food Preparation & Serving | 590 (45.7%) | 701 (54.3%) |
| Cleaning & Maintenance | 504 (63.9%) | 285 (36.1%) |
| Personal Care & Service | 198 (41.1%) | 284 (58.9%) |
| Total (Category) | 1,536 (45.9%) | 1,808 (54.1%) |
| Total (Overall) | 9,371 (55.8%) | 7,422 (44.2%) |
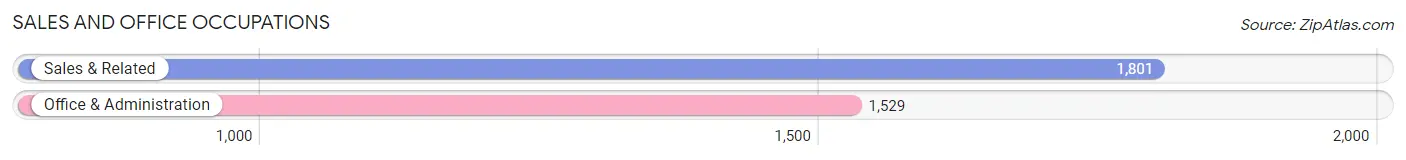
Sales and Office Occupations
The most common Sales and Office occupations in Houghton County are Sales & Related (1,801 | 10.7%), and Office & Administration (1,529 | 9.1%).
Sales and Office Occupations by Sex
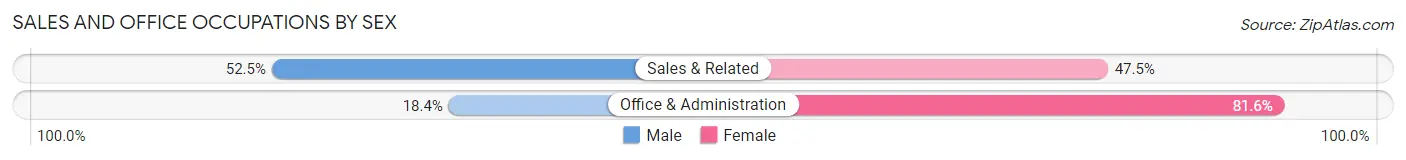
| Occupation | Male | Female |
| Sales & Related | 945 (52.5%) | 856 (47.5%) |
| Office & Administration | 282 (18.4%) | 1,247 (81.6%) |
| Total (Category) | 1,227 (36.8%) | 2,103 (63.1%) |
| Total (Overall) | 9,371 (55.8%) | 7,422 (44.2%) |
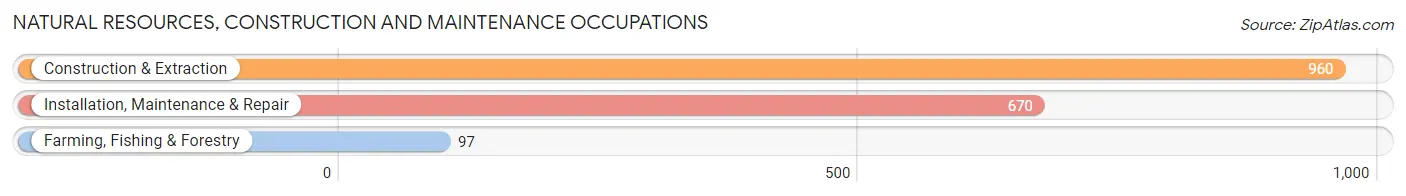
Natural Resources, Construction and Maintenance Occupations
The most common Natural Resources, Construction and Maintenance occupations in Houghton County are Construction & Extraction (960 | 5.7%), Installation, Maintenance & Repair (670 | 4.0%), and Farming, Fishing & Forestry (97 | 0.6%).
Natural Resources, Construction and Maintenance Occupations by Sex
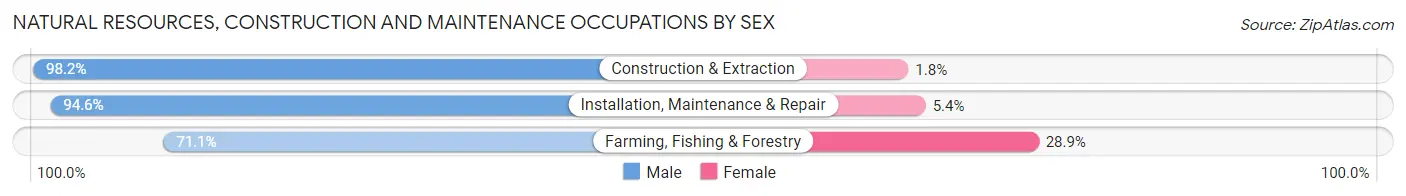
| Occupation | Male | Female |
| Farming, Fishing & Forestry | 69 (71.1%) | 28 (28.9%) |
| Construction & Extraction | 943 (98.2%) | 17 (1.8%) |
| Installation, Maintenance & Repair | 634 (94.6%) | 36 (5.4%) |
| Total (Category) | 1,646 (95.3%) | 81 (4.7%) |
| Total (Overall) | 9,371 (55.8%) | 7,422 (44.2%) |
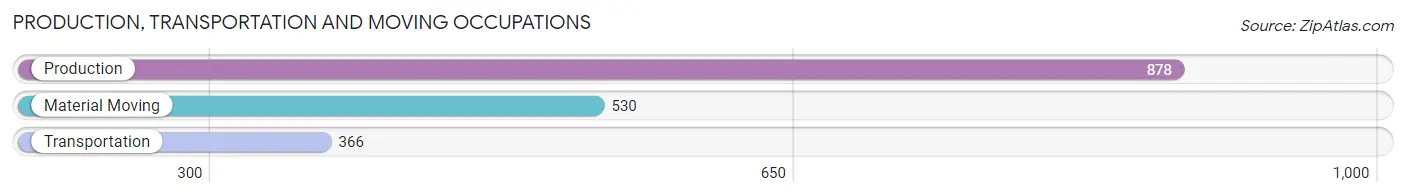
Production, Transportation and Moving Occupations
The most common Production, Transportation and Moving occupations in Houghton County are Production (878 | 5.2%), Material Moving (530 | 3.2%), and Transportation (366 | 2.2%).
Production, Transportation and Moving Occupations by Sex
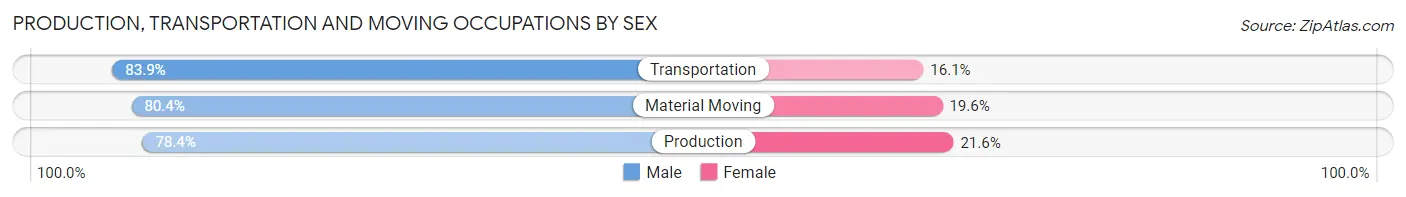
| Occupation | Male | Female |
| Production | 688 (78.4%) | 190 (21.6%) |
| Transportation | 307 (83.9%) | 59 (16.1%) |
| Material Moving | 426 (80.4%) | 104 (19.6%) |
| Total (Category) | 1,421 (80.1%) | 353 (19.9%) |
| Total (Overall) | 9,371 (55.8%) | 7,422 (44.2%) |
Employment Industries by Sex in Houghton County
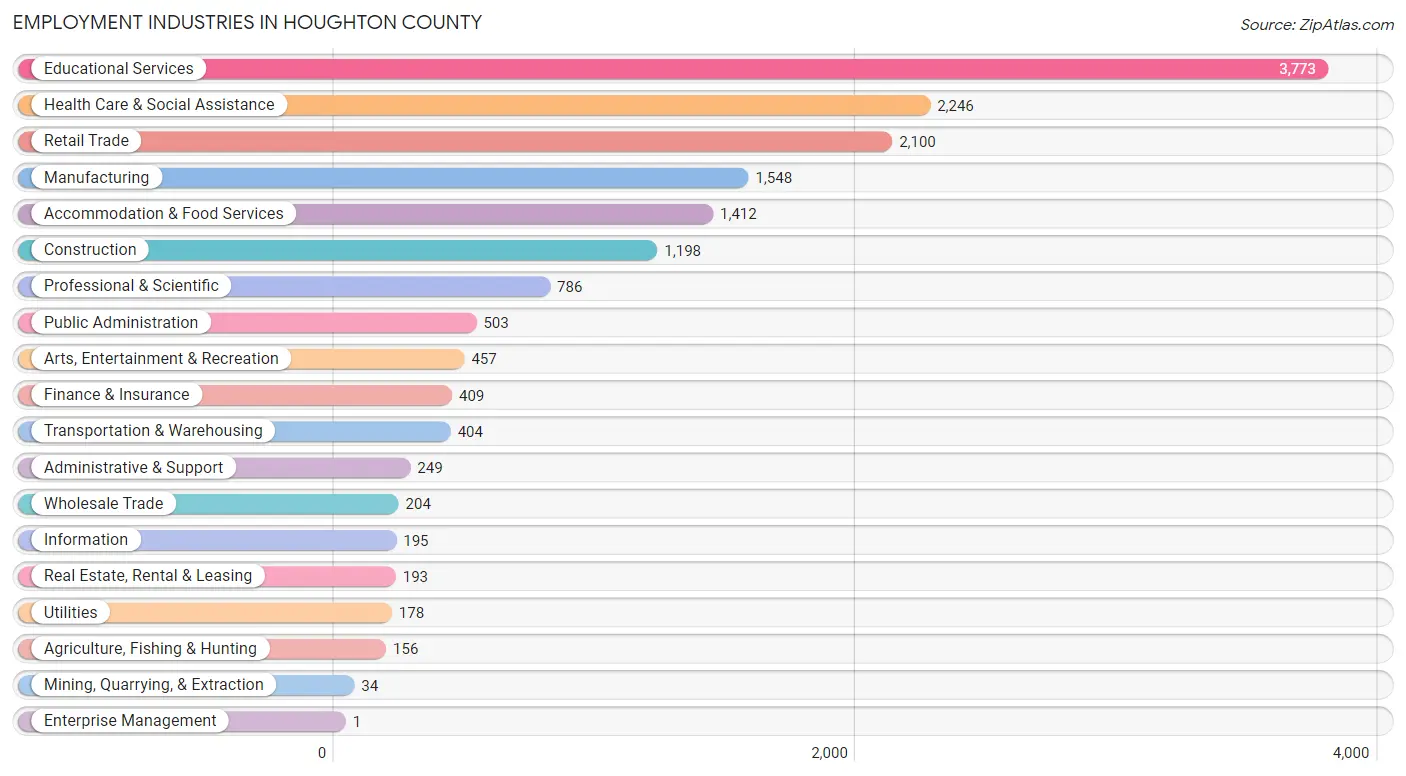
Employment Industries in Houghton County
The major employment industries in Houghton County include Educational Services (3,773 | 22.5%), Health Care & Social Assistance (2,246 | 13.4%), Retail Trade (2,100 | 12.5%), Manufacturing (1,548 | 9.2%), and Accommodation & Food Services (1,412 | 8.4%).
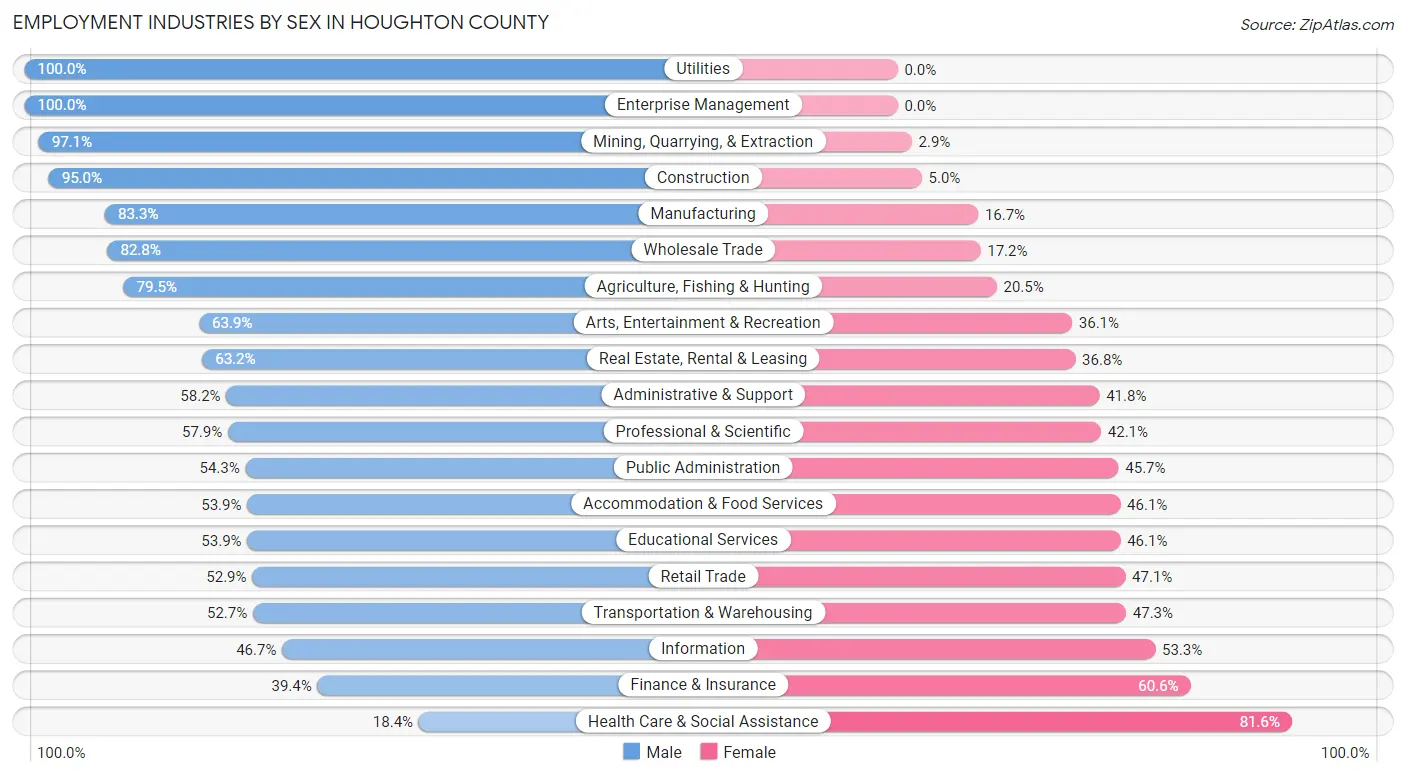
Employment Industries by Sex in Houghton County
The Houghton County industries that see more men than women are Utilities (100.0%), Enterprise Management (100.0%), and Mining, Quarrying, & Extraction (97.1%), whereas the industries that tend to have a higher number of women are Health Care & Social Assistance (81.6%), Finance & Insurance (60.6%), and Information (53.3%).
| Industry | Male | Female |
| Agriculture, Fishing & Hunting | 124 (79.5%) | 32 (20.5%) |
| Mining, Quarrying, & Extraction | 33 (97.1%) | 1 (2.9%) |
| Construction | 1,138 (95.0%) | 60 (5.0%) |
| Manufacturing | 1,290 (83.3%) | 258 (16.7%) |
| Wholesale Trade | 169 (82.8%) | 35 (17.2%) |
| Retail Trade | 1,110 (52.9%) | 990 (47.1%) |
| Transportation & Warehousing | 213 (52.7%) | 191 (47.3%) |
| Utilities | 178 (100.0%) | 0 (0.0%) |
| Information | 91 (46.7%) | 104 (53.3%) |
| Finance & Insurance | 161 (39.4%) | 248 (60.6%) |
| Real Estate, Rental & Leasing | 122 (63.2%) | 71 (36.8%) |
| Professional & Scientific | 455 (57.9%) | 331 (42.1%) |
| Enterprise Management | 1 (100.0%) | 0 (0.0%) |
| Administrative & Support | 145 (58.2%) | 104 (41.8%) |
| Educational Services | 2,033 (53.9%) | 1,740 (46.1%) |
| Health Care & Social Assistance | 413 (18.4%) | 1,833 (81.6%) |
| Arts, Entertainment & Recreation | 292 (63.9%) | 165 (36.1%) |
| Accommodation & Food Services | 761 (53.9%) | 651 (46.1%) |
| Public Administration | 273 (54.3%) | 230 (45.7%) |
| Total | 9,371 (55.8%) | 7,422 (44.2%) |
Education in Houghton County
School Enrollment in Houghton County
The most common levels of schooling among the 13,136 students in Houghton County are college / undergraduate (5,630 | 42.9%), high school (1,977 | 15.0%), and middle school (1,847 | 14.1%).
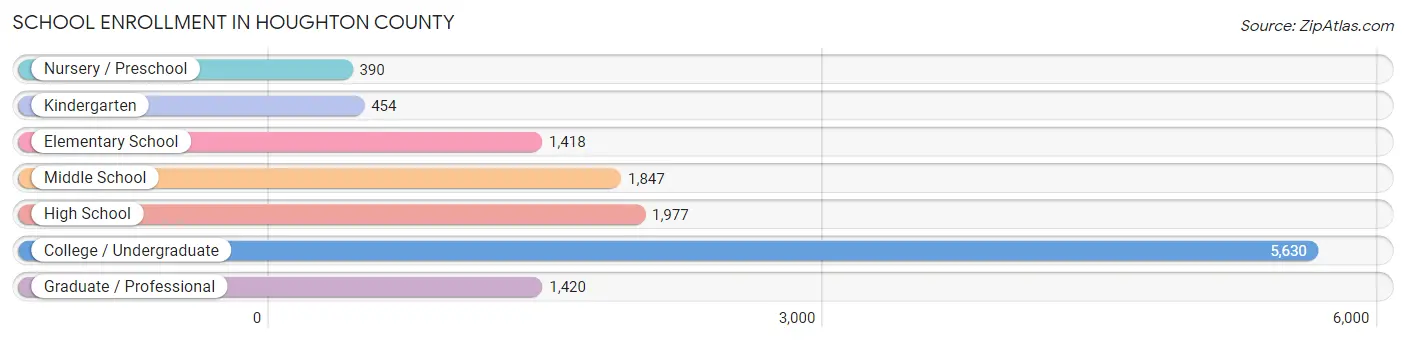
| School Level | # Students | % Students |
| Nursery / Preschool | 390 | 3.0% |
| Kindergarten | 454 | 3.5% |
| Elementary School | 1,418 | 10.8% |
| Middle School | 1,847 | 14.1% |
| High School | 1,977 | 15.0% |
| College / Undergraduate | 5,630 | 42.9% |
| Graduate / Professional | 1,420 | 10.8% |
| Total | 13,136 | 100.0% |
School Enrollment by Age by Funding Source in Houghton County
Out of a total of 13,136 students who are enrolled in schools in Houghton County, 1,287 (9.8%) attend a private institution, while the remaining 11,849 (90.2%) are enrolled in public schools. The age group of 25 to 34 year olds has the highest likelihood of being enrolled in private schools, with 171 (18.2% in the age bracket) enrolled. Conversely, the age group of 15 to 17 year olds has the lowest likelihood of being enrolled in a private school, with 1,268 (94.4% in the age bracket) attending a public institution.
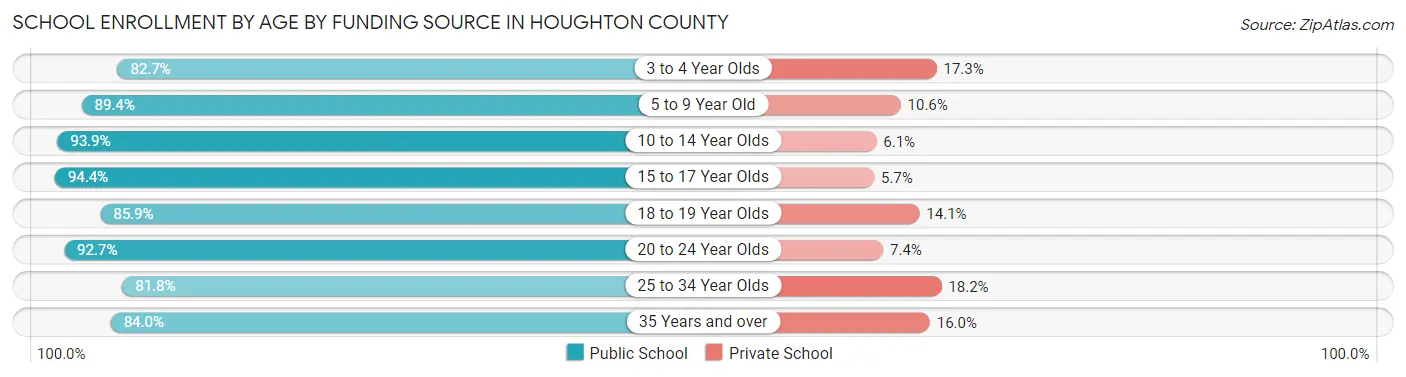
| Age Bracket | Public School | Private School |
| 3 to 4 Year Olds | 239 (82.7%) | 50 (17.3%) |
| 5 to 9 Year Old | 1,567 (89.4%) | 186 (10.6%) |
| 10 to 14 Year Olds | 2,174 (93.9%) | 141 (6.1%) |
| 15 to 17 Year Olds | 1,268 (94.4%) | 76 (5.7%) |
| 18 to 19 Year Olds | 2,058 (85.9%) | 338 (14.1%) |
| 20 to 24 Year Olds | 3,504 (92.6%) | 278 (7.3%) |
| 25 to 34 Year Olds | 768 (81.8%) | 171 (18.2%) |
| 35 Years and over | 267 (84.0%) | 51 (16.0%) |
| Total | 11,849 (90.2%) | 1,287 (9.8%) |
Educational Attainment by Field of Study in Houghton County
Engineering (1,416 | 16.8%), science & technology (1,095 | 13.0%), education (1,040 | 12.3%), business (927 | 11.0%), and bio, nature & agricultural (789 | 9.4%) are the most common fields of study among 8,427 individuals in Houghton County who have obtained a bachelor's degree or higher.
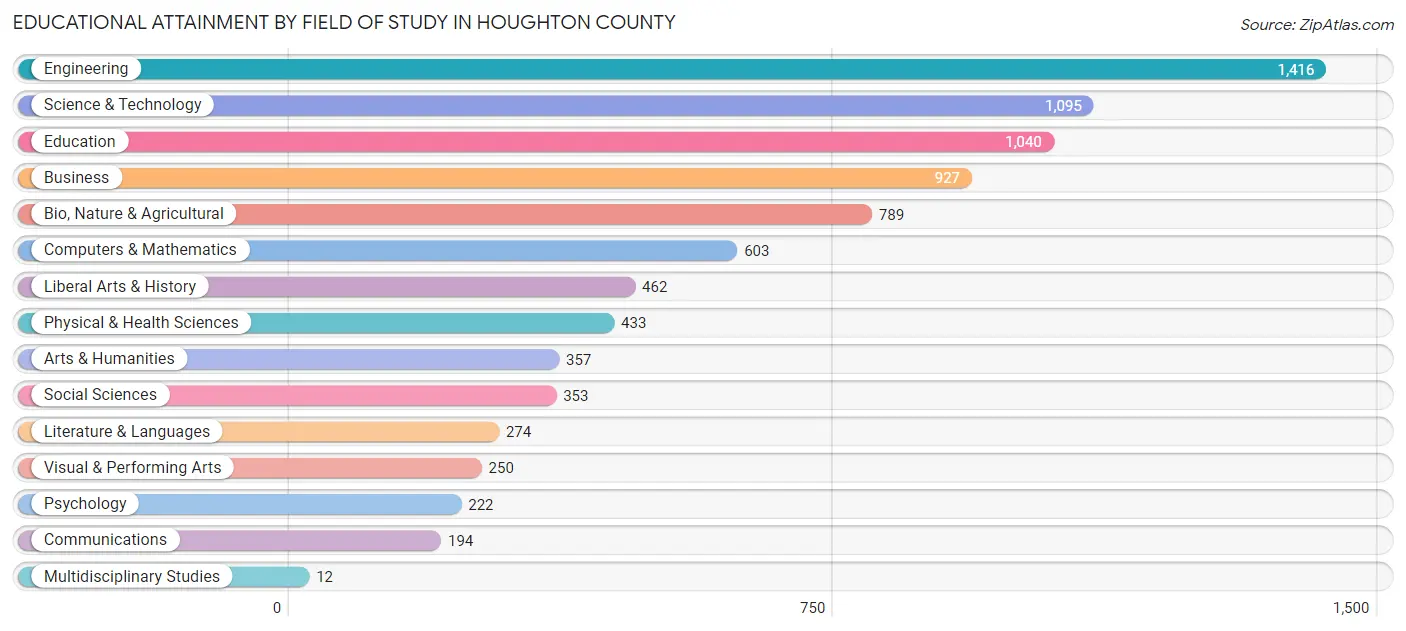
| Field of Study | # Graduates | % Graduates |
| Computers & Mathematics | 603 | 7.2% |
| Bio, Nature & Agricultural | 789 | 9.4% |
| Physical & Health Sciences | 433 | 5.1% |
| Psychology | 222 | 2.6% |
| Social Sciences | 353 | 4.2% |
| Engineering | 1,416 | 16.8% |
| Multidisciplinary Studies | 12 | 0.1% |
| Science & Technology | 1,095 | 13.0% |
| Business | 927 | 11.0% |
| Education | 1,040 | 12.3% |
| Literature & Languages | 274 | 3.3% |
| Liberal Arts & History | 462 | 5.5% |
| Visual & Performing Arts | 250 | 3.0% |
| Communications | 194 | 2.3% |
| Arts & Humanities | 357 | 4.2% |
| Total | 8,427 | 100.0% |
Transportation & Commute in Houghton County
Vehicle Availability by Sex in Houghton County
The most prevalent vehicle ownership categories in Houghton County are males with 2 vehicles (3,379, accounting for 40.7%) and females with 2 vehicles (2,748, making up 49.0%).
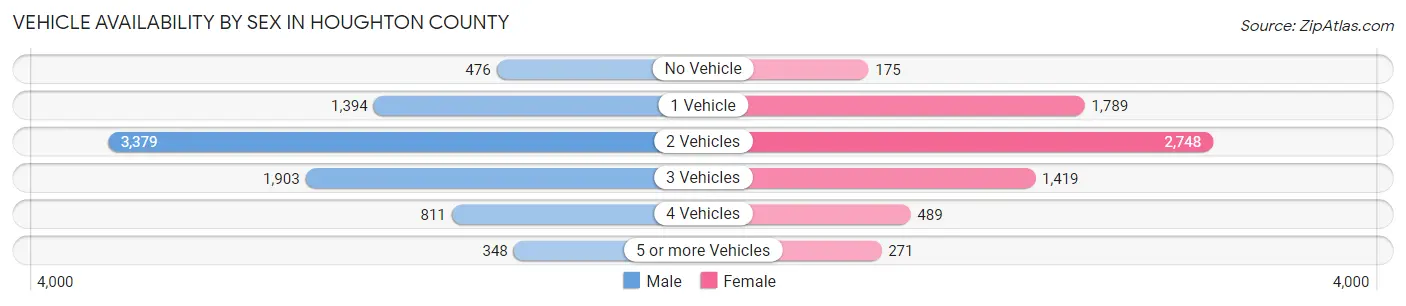
| Vehicles Available | Male | Female |
| No Vehicle | 476 (5.7%) | 175 (2.5%) |
| 1 Vehicle | 1,394 (16.8%) | 1,789 (26.0%) |
| 2 Vehicles | 3,379 (40.7%) | 2,748 (39.9%) |
| 3 Vehicles | 1,903 (22.9%) | 1,419 (20.6%) |
| 4 Vehicles | 811 (9.8%) | 489 (7.1%) |
| 5 or more Vehicles | 348 (4.2%) | 271 (3.9%) |
| Total | 8,311 (100.0%) | 6,891 (100.0%) |
Commute Time in Houghton County
The most frequently occuring commute durations in Houghton County are 5 to 9 minutes (3,838 commuters, 25.7%), 10 to 14 minutes (3,155 commuters, 21.1%), and 15 to 19 minutes (2,722 commuters, 18.2%).
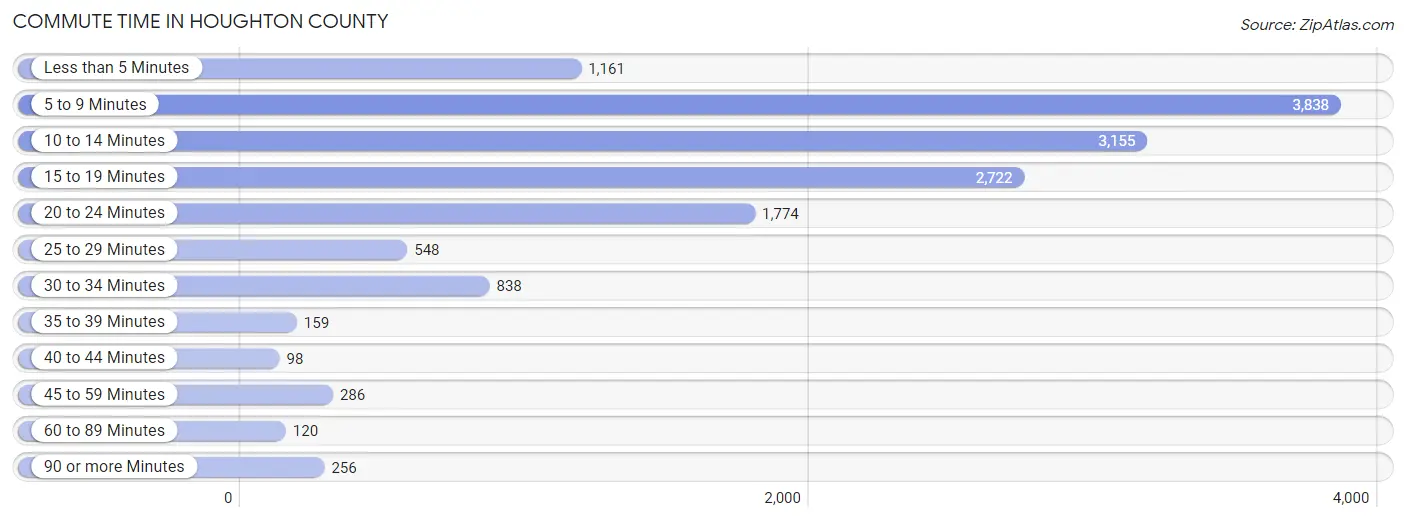
| Commute Time | # Commuters | % Commuters |
| Less than 5 Minutes | 1,161 | 7.8% |
| 5 to 9 Minutes | 3,838 | 25.7% |
| 10 to 14 Minutes | 3,155 | 21.1% |
| 15 to 19 Minutes | 2,722 | 18.2% |
| 20 to 24 Minutes | 1,774 | 11.9% |
| 25 to 29 Minutes | 548 | 3.7% |
| 30 to 34 Minutes | 838 | 5.6% |
| 35 to 39 Minutes | 159 | 1.1% |
| 40 to 44 Minutes | 98 | 0.7% |
| 45 to 59 Minutes | 286 | 1.9% |
| 60 to 89 Minutes | 120 | 0.8% |
| 90 or more Minutes | 256 | 1.7% |
Commute Time by Sex in Houghton County
The most common commute times in Houghton County are 5 to 9 minutes (2,211 commuters, 26.0%) for males and 5 to 9 minutes (1,627 commuters, 25.2%) for females.
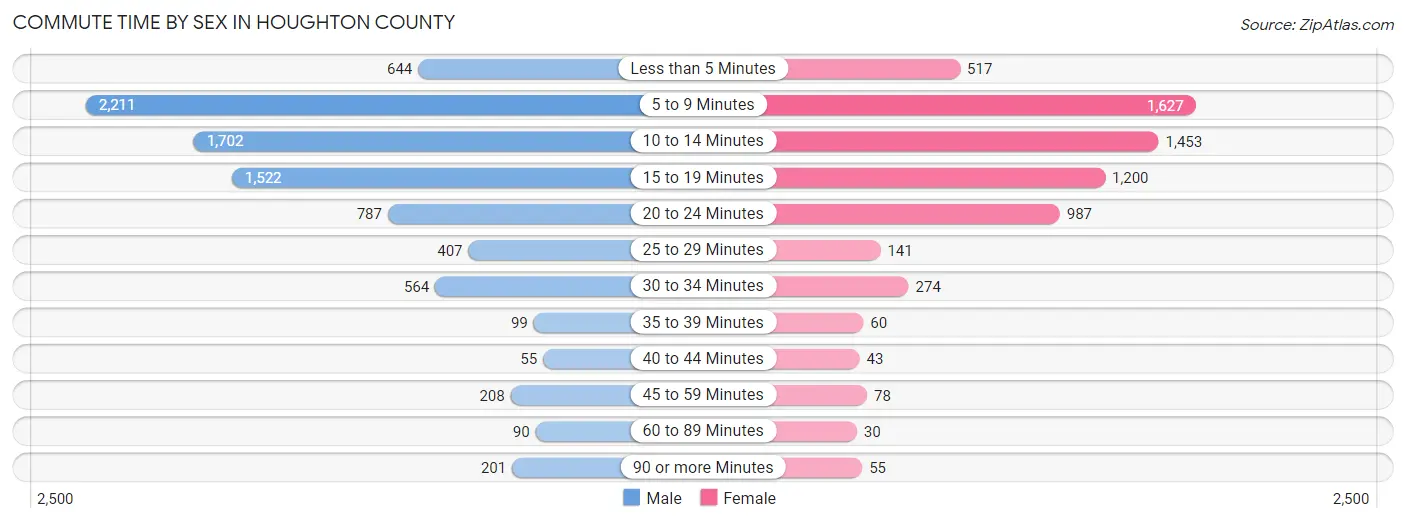
| Commute Time | Male | Female |
| Less than 5 Minutes | 644 (7.6%) | 517 (8.0%) |
| 5 to 9 Minutes | 2,211 (26.0%) | 1,627 (25.2%) |
| 10 to 14 Minutes | 1,702 (20.1%) | 1,453 (22.5%) |
| 15 to 19 Minutes | 1,522 (17.9%) | 1,200 (18.6%) |
| 20 to 24 Minutes | 787 (9.3%) | 987 (15.3%) |
| 25 to 29 Minutes | 407 (4.8%) | 141 (2.2%) |
| 30 to 34 Minutes | 564 (6.6%) | 274 (4.2%) |
| 35 to 39 Minutes | 99 (1.2%) | 60 (0.9%) |
| 40 to 44 Minutes | 55 (0.6%) | 43 (0.7%) |
| 45 to 59 Minutes | 208 (2.5%) | 78 (1.2%) |
| 60 to 89 Minutes | 90 (1.1%) | 30 (0.5%) |
| 90 or more Minutes | 201 (2.4%) | 55 (0.9%) |
Time of Departure to Work by Sex in Houghton County
The most frequent times of departure to work in Houghton County are 7:30 AM to 7:59 AM (1,551, 18.3%) for males and 7:30 AM to 7:59 AM (1,221, 18.9%) for females.
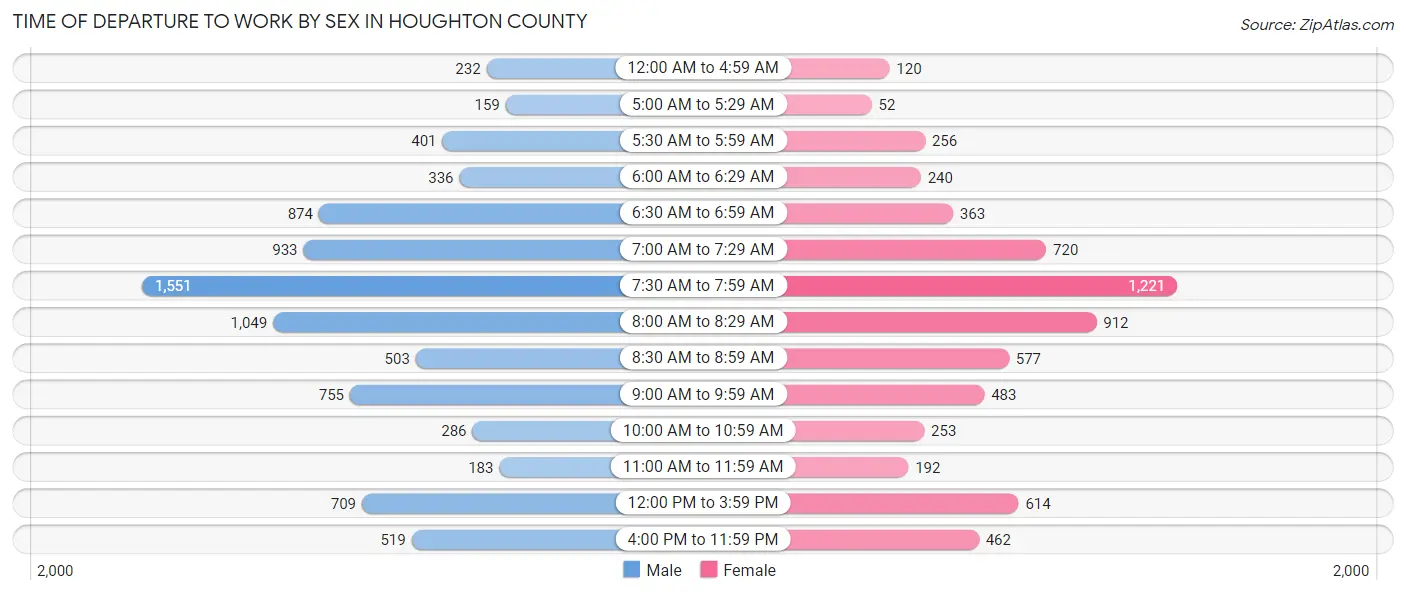
| Time of Departure | Male | Female |
| 12:00 AM to 4:59 AM | 232 (2.7%) | 120 (1.9%) |
| 5:00 AM to 5:29 AM | 159 (1.9%) | 52 (0.8%) |
| 5:30 AM to 5:59 AM | 401 (4.7%) | 256 (4.0%) |
| 6:00 AM to 6:29 AM | 336 (4.0%) | 240 (3.7%) |
| 6:30 AM to 6:59 AM | 874 (10.3%) | 363 (5.6%) |
| 7:00 AM to 7:29 AM | 933 (11.0%) | 720 (11.1%) |
| 7:30 AM to 7:59 AM | 1,551 (18.3%) | 1,221 (18.9%) |
| 8:00 AM to 8:29 AM | 1,049 (12.4%) | 912 (14.1%) |
| 8:30 AM to 8:59 AM | 503 (5.9%) | 577 (8.9%) |
| 9:00 AM to 9:59 AM | 755 (8.9%) | 483 (7.5%) |
| 10:00 AM to 10:59 AM | 286 (3.4%) | 253 (3.9%) |
| 11:00 AM to 11:59 AM | 183 (2.2%) | 192 (3.0%) |
| 12:00 PM to 3:59 PM | 709 (8.4%) | 614 (9.5%) |
| 4:00 PM to 11:59 PM | 519 (6.1%) | 462 (7.1%) |
| Total | 8,490 (100.0%) | 6,465 (100.0%) |
Housing Occupancy in Houghton County
Occupancy by Ownership in Houghton County
Of the total 14,173 dwellings in Houghton County, owner-occupied units account for 9,778 (69.0%), while renter-occupied units make up 4,395 (31.0%).
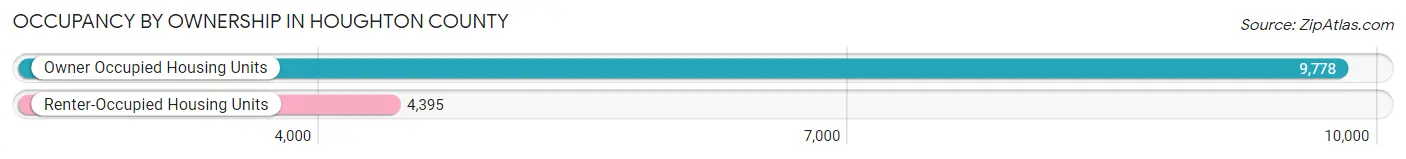
| Occupancy | # Housing Units | % Housing Units |
| Owner Occupied Housing Units | 9,778 | 69.0% |
| Renter-Occupied Housing Units | 4,395 | 31.0% |
| Total Occupied Housing Units | 14,173 | 100.0% |
Occupancy by Household Size in Houghton County
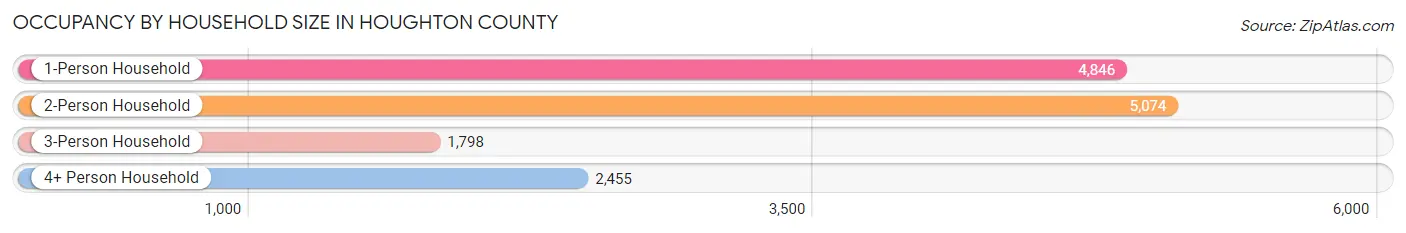
| Household Size | # Housing Units | % Housing Units |
| 1-Person Household | 4,846 | 34.2% |
| 2-Person Household | 5,074 | 35.8% |
| 3-Person Household | 1,798 | 12.7% |
| 4+ Person Household | 2,455 | 17.3% |
| Total Housing Units | 14,173 | 100.0% |
Occupancy by Ownership by Household Size in Houghton County
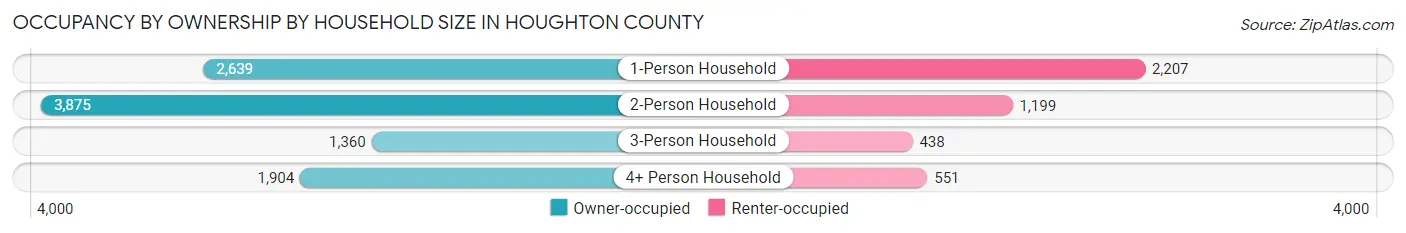
| Household Size | Owner-occupied | Renter-occupied |
| 1-Person Household | 2,639 (54.5%) | 2,207 (45.5%) |
| 2-Person Household | 3,875 (76.4%) | 1,199 (23.6%) |
| 3-Person Household | 1,360 (75.6%) | 438 (24.4%) |
| 4+ Person Household | 1,904 (77.6%) | 551 (22.4%) |
| Total Housing Units | 9,778 (69.0%) | 4,395 (31.0%) |
Occupancy by Educational Attainment in Houghton County
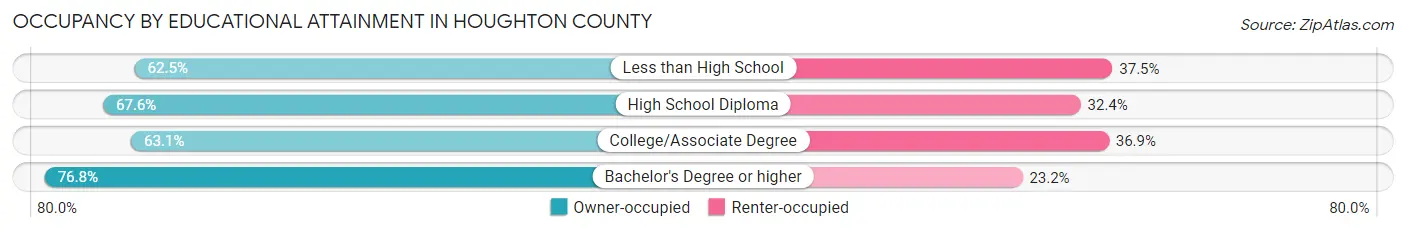
| Household Size | Owner-occupied | Renter-occupied |
| Less than High School | 404 (62.5%) | 242 (37.5%) |
| High School Diploma | 2,709 (67.6%) | 1,300 (32.4%) |
| College/Associate Degree | 2,973 (63.1%) | 1,738 (36.9%) |
| Bachelor's Degree or higher | 3,692 (76.8%) | 1,115 (23.2%) |
Occupancy by Age of Householder in Houghton County
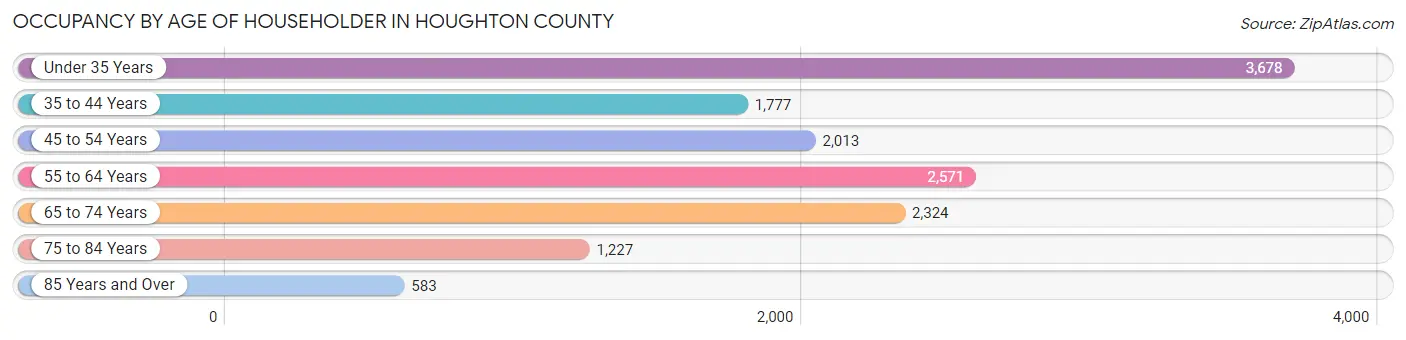
| Age Bracket | # Households | % Households |
| Under 35 Years | 3,678 | 26.0% |
| 35 to 44 Years | 1,777 | 12.5% |
| 45 to 54 Years | 2,013 | 14.2% |
| 55 to 64 Years | 2,571 | 18.1% |
| 65 to 74 Years | 2,324 | 16.4% |
| 75 to 84 Years | 1,227 | 8.7% |
| 85 Years and Over | 583 | 4.1% |
| Total | 14,173 | 100.0% |
Housing Finances in Houghton County
Median Income by Occupancy in Houghton County
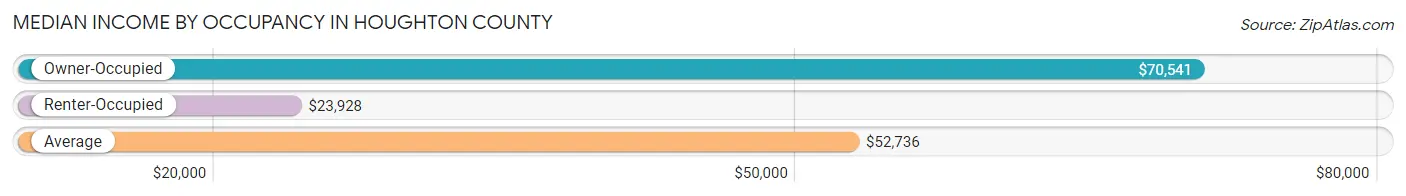
| Occupancy Type | # Households | Median Income |
| Owner-Occupied | 9,778 (69.0%) | $70,541 |
| Renter-Occupied | 4,395 (31.0%) | $23,928 |
| Average | 14,173 (100.0%) | $52,736 |
Occupancy by Householder Income Bracket in Houghton County
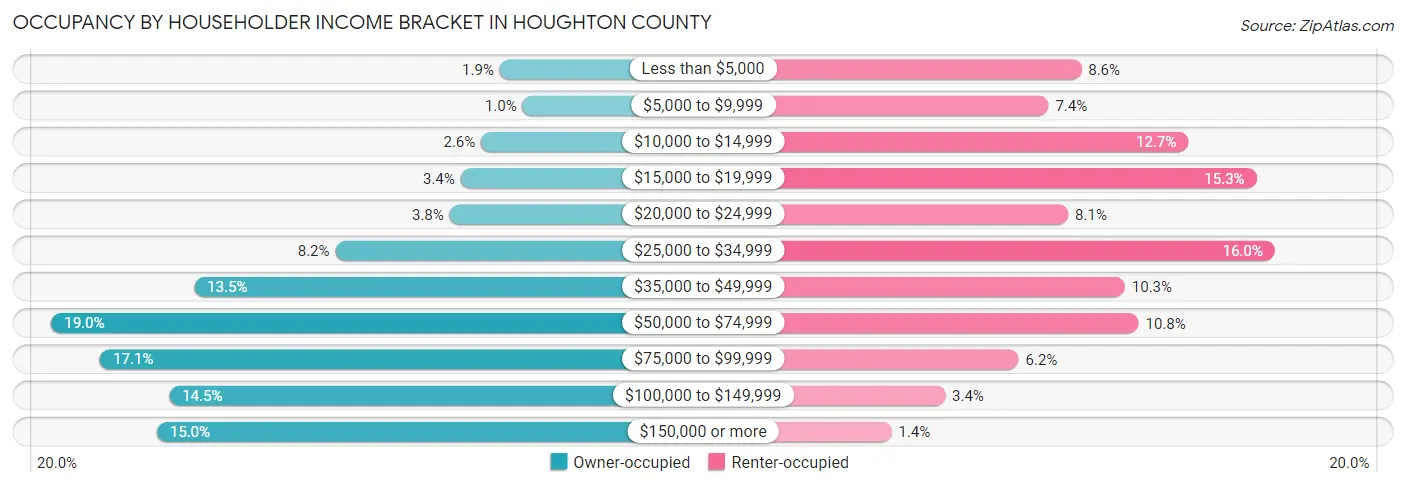
| Income Bracket | Owner-occupied | Renter-occupied |
| Less than $5,000 | 186 (1.9%) | 378 (8.6%) |
| $5,000 to $9,999 | 101 (1.0%) | 323 (7.3%) |
| $10,000 to $14,999 | 255 (2.6%) | 557 (12.7%) |
| $15,000 to $19,999 | 331 (3.4%) | 671 (15.3%) |
| $20,000 to $24,999 | 373 (3.8%) | 356 (8.1%) |
| $25,000 to $34,999 | 798 (8.2%) | 702 (16.0%) |
| $35,000 to $49,999 | 1,324 (13.5%) | 451 (10.3%) |
| $50,000 to $74,999 | 1,856 (19.0%) | 474 (10.8%) |
| $75,000 to $99,999 | 1,674 (17.1%) | 273 (6.2%) |
| $100,000 to $149,999 | 1,417 (14.5%) | 150 (3.4%) |
| $150,000 or more | 1,463 (15.0%) | 60 (1.4%) |
| Total | 9,778 (100.0%) | 4,395 (100.0%) |
Monthly Housing Cost Tiers in Houghton County
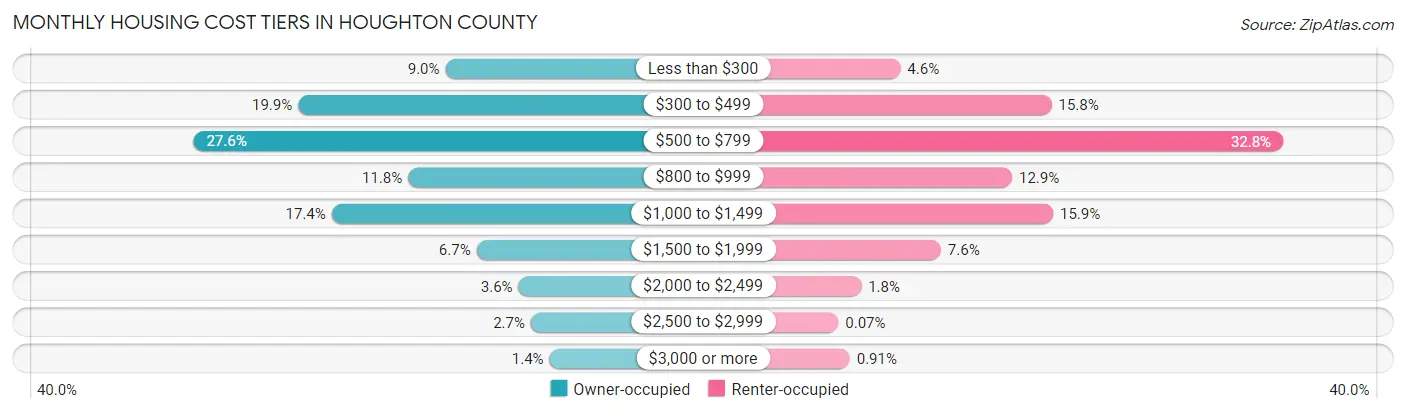
| Monthly Cost | Owner-occupied | Renter-occupied |
| Less than $300 | 881 (9.0%) | 204 (4.6%) |
| $300 to $499 | 1,942 (19.9%) | 693 (15.8%) |
| $500 to $799 | 2,695 (27.6%) | 1,442 (32.8%) |
| $800 to $999 | 1,150 (11.8%) | 565 (12.9%) |
| $1,000 to $1,499 | 1,700 (17.4%) | 698 (15.9%) |
| $1,500 to $1,999 | 657 (6.7%) | 335 (7.6%) |
| $2,000 to $2,499 | 355 (3.6%) | 77 (1.8%) |
| $2,500 to $2,999 | 266 (2.7%) | 3 (0.1%) |
| $3,000 or more | 132 (1.3%) | 40 (0.9%) |
| Total | 9,778 (100.0%) | 4,395 (100.0%) |
Physical Housing Characteristics in Houghton County
Housing Structures in Houghton County
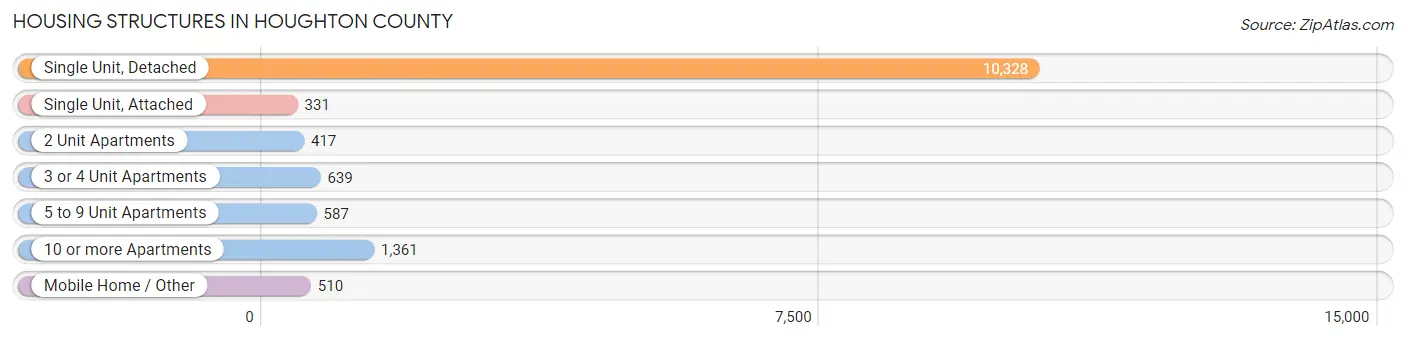
| Structure Type | # Housing Units | % Housing Units |
| Single Unit, Detached | 10,328 | 72.9% |
| Single Unit, Attached | 331 | 2.3% |
| 2 Unit Apartments | 417 | 2.9% |
| 3 or 4 Unit Apartments | 639 | 4.5% |
| 5 to 9 Unit Apartments | 587 | 4.1% |
| 10 or more Apartments | 1,361 | 9.6% |
| Mobile Home / Other | 510 | 3.6% |
| Total | 14,173 | 100.0% |
Housing Structures by Occupancy in Houghton County
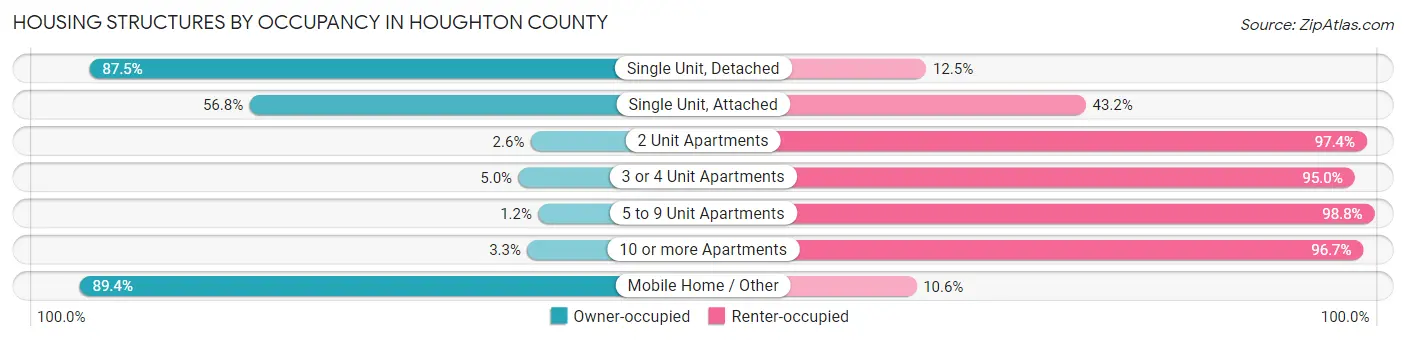
| Structure Type | Owner-occupied | Renter-occupied |
| Single Unit, Detached | 9,039 (87.5%) | 1,289 (12.5%) |
| Single Unit, Attached | 188 (56.8%) | 143 (43.2%) |
| 2 Unit Apartments | 11 (2.6%) | 406 (97.4%) |
| 3 or 4 Unit Apartments | 32 (5.0%) | 607 (95.0%) |
| 5 to 9 Unit Apartments | 7 (1.2%) | 580 (98.8%) |
| 10 or more Apartments | 45 (3.3%) | 1,316 (96.7%) |
| Mobile Home / Other | 456 (89.4%) | 54 (10.6%) |
| Total | 9,778 (69.0%) | 4,395 (31.0%) |
Housing Structures by Number of Rooms in Houghton County
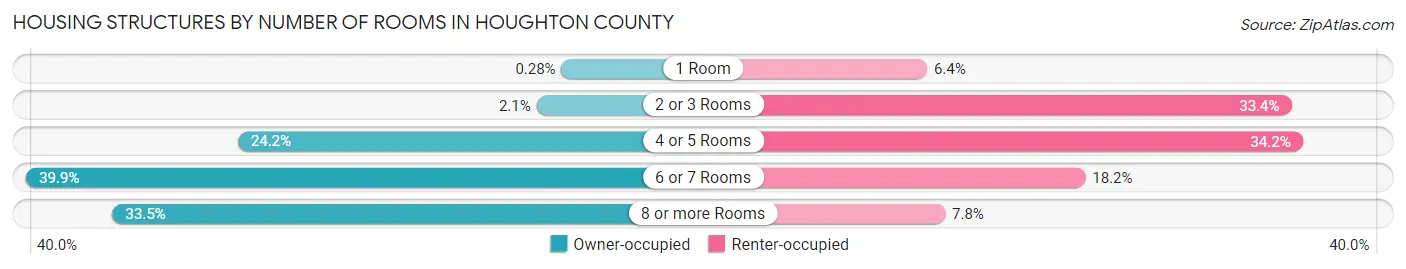
| Number of Rooms | Owner-occupied | Renter-occupied |
| 1 Room | 27 (0.3%) | 283 (6.4%) |
| 2 or 3 Rooms | 207 (2.1%) | 1,468 (33.4%) |
| 4 or 5 Rooms | 2,368 (24.2%) | 1,504 (34.2%) |
| 6 or 7 Rooms | 3,900 (39.9%) | 798 (18.2%) |
| 8 or more Rooms | 3,276 (33.5%) | 342 (7.8%) |
| Total | 9,778 (100.0%) | 4,395 (100.0%) |
Housing Structure by Heating Type in Houghton County
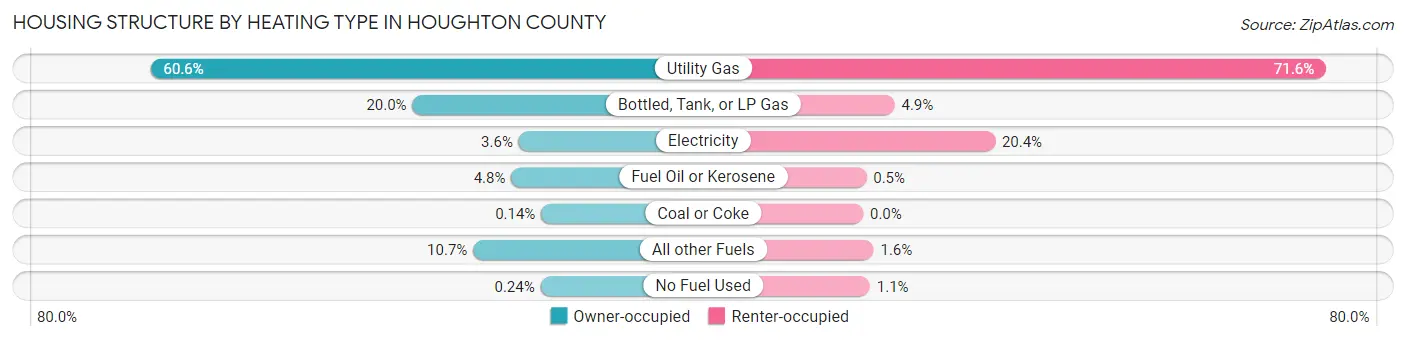
| Heating Type | Owner-occupied | Renter-occupied |
| Utility Gas | 5,921 (60.6%) | 3,146 (71.6%) |
| Bottled, Tank, or LP Gas | 1,960 (20.0%) | 214 (4.9%) |
| Electricity | 353 (3.6%) | 896 (20.4%) |
| Fuel Oil or Kerosene | 465 (4.8%) | 22 (0.5%) |
| Coal or Coke | 14 (0.1%) | 0 (0.0%) |
| All other Fuels | 1,042 (10.7%) | 71 (1.6%) |
| No Fuel Used | 23 (0.2%) | 46 (1.1%) |
| Total | 9,778 (100.0%) | 4,395 (100.0%) |
Household Vehicle Usage in Houghton County
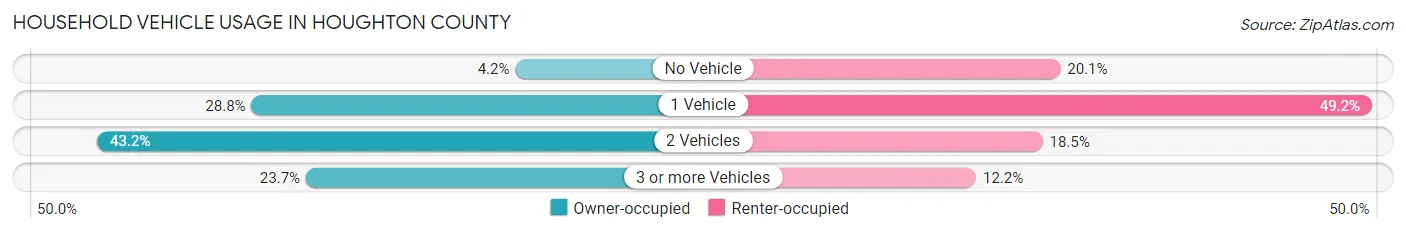
| Vehicles per Household | Owner-occupied | Renter-occupied |
| No Vehicle | 410 (4.2%) | 884 (20.1%) |
| 1 Vehicle | 2,819 (28.8%) | 2,162 (49.2%) |
| 2 Vehicles | 4,228 (43.2%) | 811 (18.4%) |
| 3 or more Vehicles | 2,321 (23.7%) | 538 (12.2%) |
| Total | 9,778 (100.0%) | 4,395 (100.0%) |
Real Estate & Mortgages in Houghton County
Real Estate and Mortgage Overview in Houghton County
| Characteristic | Without Mortgage | With Mortgage |
| Housing Units | 4,952 | 4,826 |
| Median Property Value | $114,600 | $147,000 |
| Median Household Income | $53,390 | $887 |
| Monthly Housing Costs | $470 | $128 |
| Real Estate Taxes | $1,436 | $119 |
Property Value by Mortgage Status in Houghton County
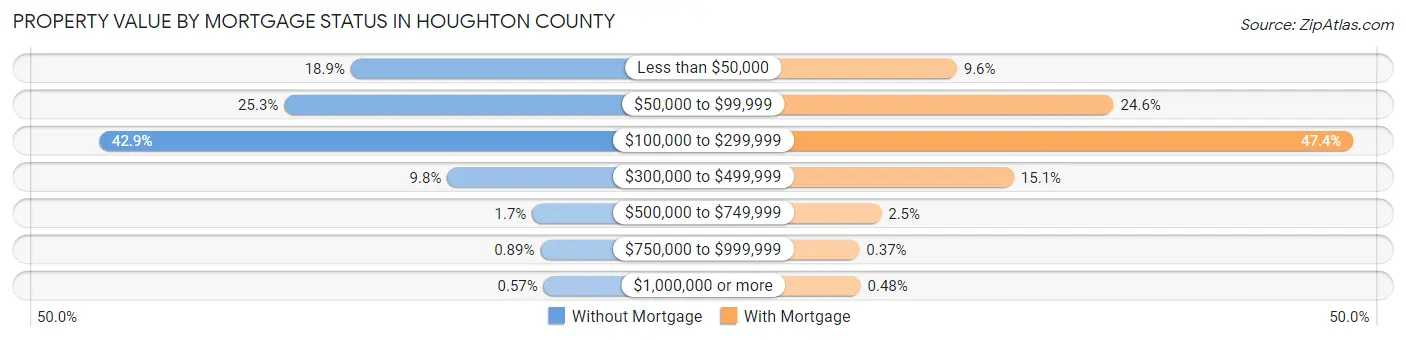
| Property Value | Without Mortgage | With Mortgage |
| Less than $50,000 | 938 (18.9%) | 465 (9.6%) |
| $50,000 to $99,999 | 1,252 (25.3%) | 1,186 (24.6%) |
| $100,000 to $299,999 | 2,125 (42.9%) | 2,288 (47.4%) |
| $300,000 to $499,999 | 483 (9.8%) | 728 (15.1%) |
| $500,000 to $749,999 | 82 (1.7%) | 118 (2.5%) |
| $750,000 to $999,999 | 44 (0.9%) | 18 (0.4%) |
| $1,000,000 or more | 28 (0.6%) | 23 (0.5%) |
| Total | 4,952 (100.0%) | 4,826 (100.0%) |
Household Income by Mortgage Status in Houghton County
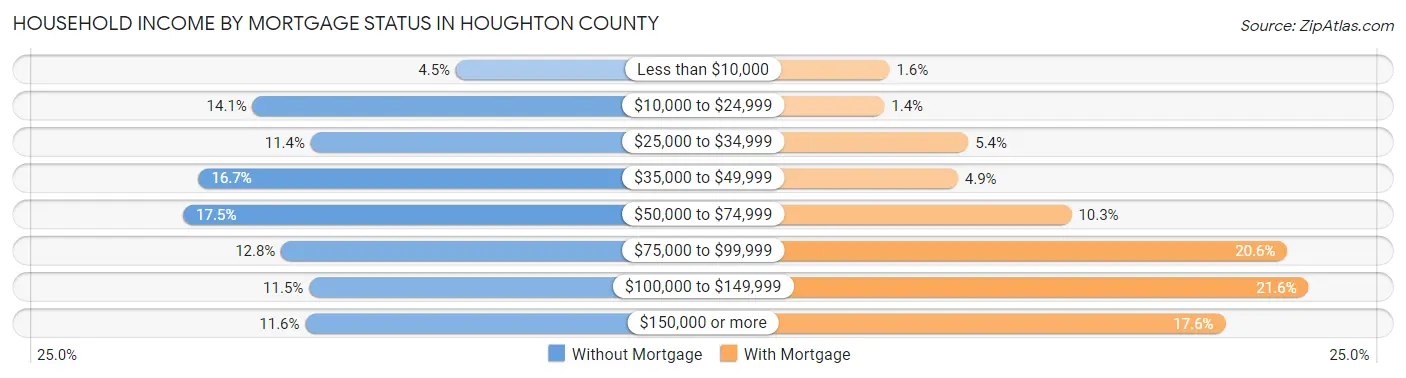
| Household Income | Without Mortgage | With Mortgage |
| Less than $10,000 | 221 (4.5%) | 78 (1.6%) |
| $10,000 to $24,999 | 700 (14.1%) | 66 (1.4%) |
| $25,000 to $34,999 | 563 (11.4%) | 259 (5.4%) |
| $35,000 to $49,999 | 828 (16.7%) | 235 (4.9%) |
| $50,000 to $74,999 | 864 (17.4%) | 496 (10.3%) |
| $75,000 to $99,999 | 633 (12.8%) | 992 (20.6%) |
| $100,000 to $149,999 | 567 (11.5%) | 1,041 (21.6%) |
| $150,000 or more | 576 (11.6%) | 850 (17.6%) |
| Total | 4,952 (100.0%) | 4,826 (100.0%) |
Property Value to Household Income Ratio in Houghton County
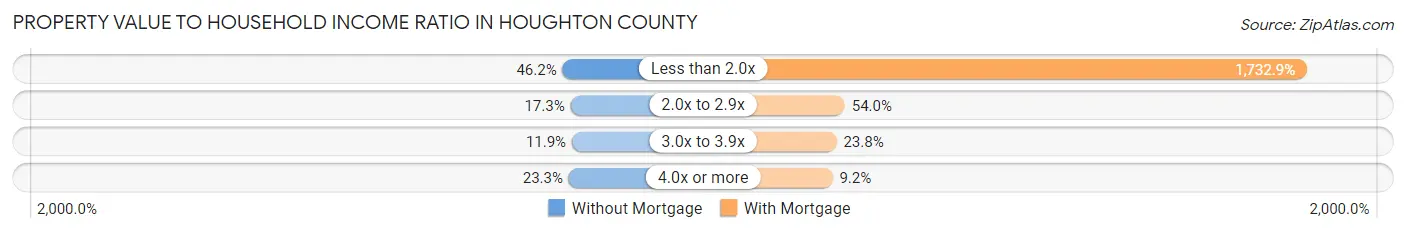
| Value-to-Income Ratio | Without Mortgage | With Mortgage |
| Less than 2.0x | 2,290 (46.2%) | 83,630 (1,732.9%) |
| 2.0x to 2.9x | 854 (17.2%) | 2,605 (54.0%) |
| 3.0x to 3.9x | 590 (11.9%) | 1,150 (23.8%) |
| 4.0x or more | 1,156 (23.3%) | 442 (9.2%) |
| Total | 4,952 (100.0%) | 4,826 (100.0%) |
Real Estate Taxes by Mortgage Status in Houghton County
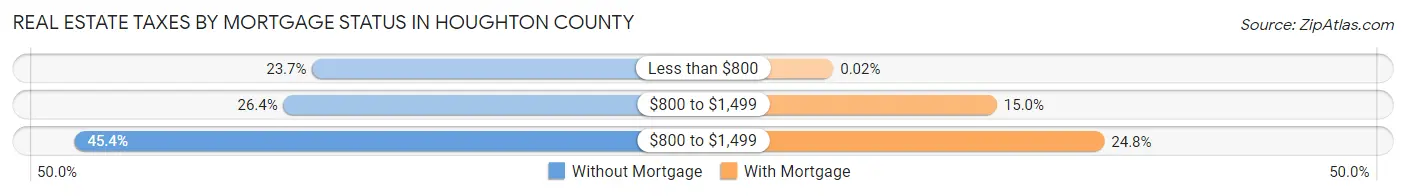
| Property Taxes | Without Mortgage | With Mortgage |
| Less than $800 | 1,175 (23.7%) | 1 (0.0%) |
| $800 to $1,499 | 1,305 (26.4%) | 722 (15.0%) |
| $800 to $1,499 | 2,250 (45.4%) | 1,196 (24.8%) |
| Total | 4,952 (100.0%) | 4,826 (100.0%) |
Health & Disability in Houghton County
Health Insurance Coverage by Age in Houghton County
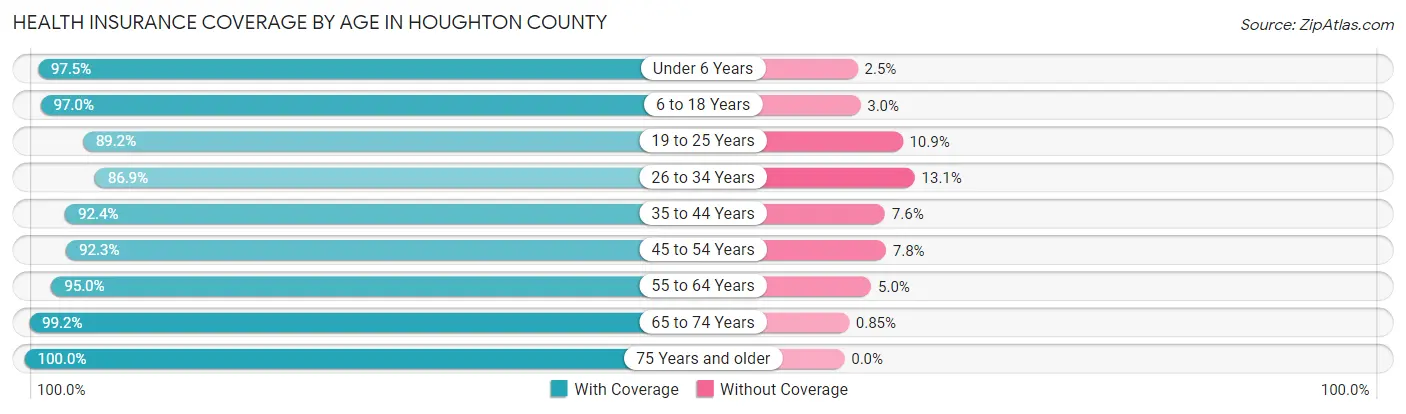
| Age Bracket | With Coverage | Without Coverage |
| Under 6 Years | 2,163 (97.5%) | 55 (2.5%) |
| 6 to 18 Years | 6,030 (97.0%) | 185 (3.0%) |
| 19 to 25 Years | 6,852 (89.1%) | 834 (10.8%) |
| 26 to 34 Years | 3,176 (86.9%) | 479 (13.1%) |
| 35 to 44 Years | 3,222 (92.4%) | 264 (7.6%) |
| 45 to 54 Years | 3,108 (92.2%) | 261 (7.7%) |
| 55 to 64 Years | 3,968 (95.0%) | 209 (5.0%) |
| 65 to 74 Years | 3,626 (99.2%) | 31 (0.9%) |
| 75 Years and older | 2,511 (100.0%) | 0 (0.0%) |
| Total | 34,656 (93.7%) | 2,318 (6.3%) |
Health Insurance Coverage by Citizenship Status in Houghton County
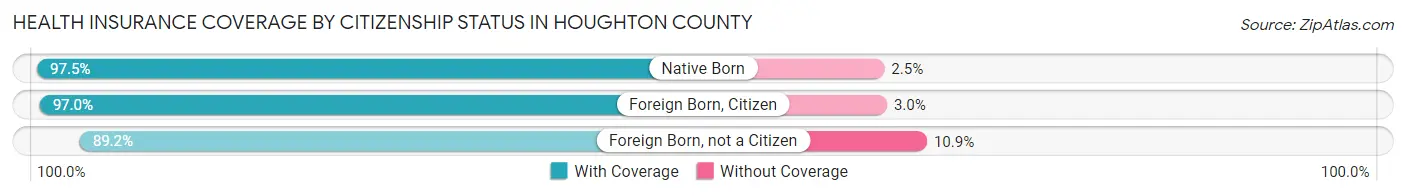
| Citizenship Status | With Coverage | Without Coverage |
| Native Born | 2,163 (97.5%) | 55 (2.5%) |
| Foreign Born, Citizen | 6,030 (97.0%) | 185 (3.0%) |
| Foreign Born, not a Citizen | 6,852 (89.1%) | 834 (10.8%) |
Health Insurance Coverage by Household Income in Houghton County
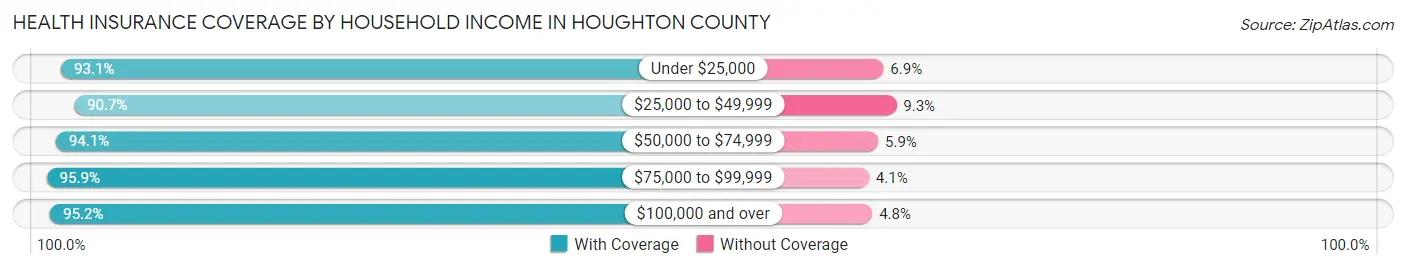
| Household Income | With Coverage | Without Coverage |
| Under $25,000 | 4,973 (93.1%) | 366 (6.9%) |
| $25,000 to $49,999 | 5,546 (90.7%) | 568 (9.3%) |
| $50,000 to $74,999 | 5,885 (94.1%) | 367 (5.9%) |
| $75,000 to $99,999 | 5,679 (95.9%) | 245 (4.1%) |
| $100,000 and over | 9,576 (95.2%) | 480 (4.8%) |
Public vs Private Health Insurance Coverage by Age in Houghton County
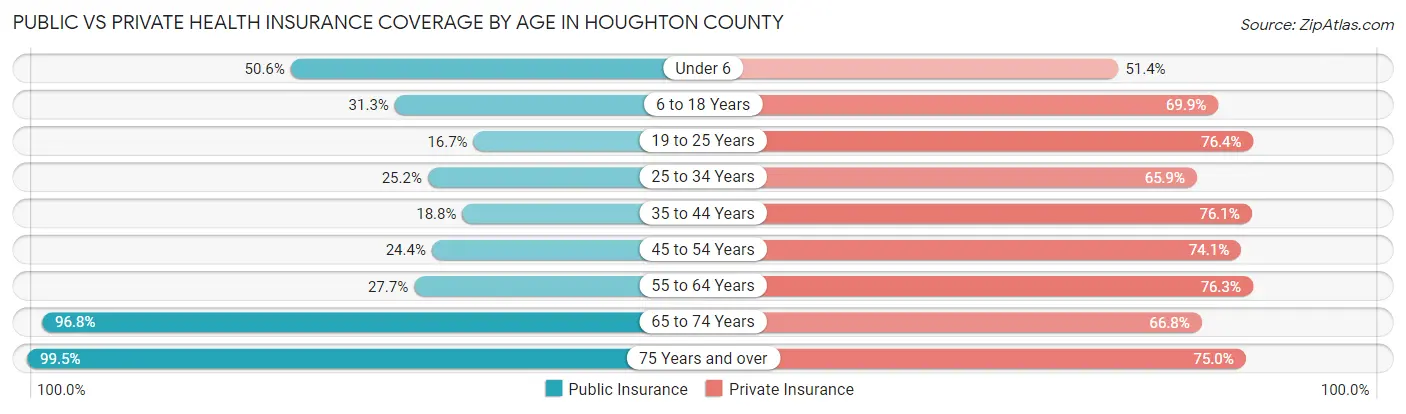
| Age Bracket | Public Insurance | Private Insurance |
| Under 6 | 1,123 (50.6%) | 1,139 (51.3%) |
| 6 to 18 Years | 1,946 (31.3%) | 4,341 (69.9%) |
| 19 to 25 Years | 1,283 (16.7%) | 5,871 (76.4%) |
| 25 to 34 Years | 920 (25.2%) | 2,408 (65.9%) |
| 35 to 44 Years | 654 (18.8%) | 2,651 (76.0%) |
| 45 to 54 Years | 823 (24.4%) | 2,496 (74.1%) |
| 55 to 64 Years | 1,158 (27.7%) | 3,186 (76.3%) |
| 65 to 74 Years | 3,538 (96.8%) | 2,442 (66.8%) |
| 75 Years and over | 2,499 (99.5%) | 1,882 (75.0%) |
| Total | 13,944 (37.7%) | 26,416 (71.4%) |
Disability Status by Sex by Age in Houghton County
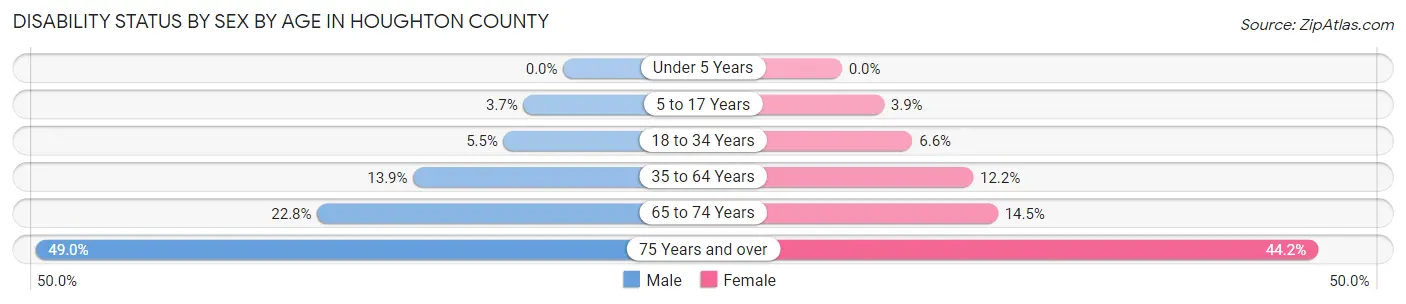
| Age Bracket | Male | Female |
| Under 5 Years | 0 (0.0%) | 0 (0.0%) |
| 5 to 17 Years | 107 (3.7%) | 103 (3.9%) |
| 18 to 34 Years | 433 (5.5%) | 300 (6.6%) |
| 35 to 64 Years | 796 (13.9%) | 647 (12.2%) |
| 65 to 74 Years | 431 (22.8%) | 256 (14.5%) |
| 75 Years and over | 513 (49.0%) | 647 (44.2%) |
Disability Class by Sex by Age in Houghton County
Disability Class: Hearing Difficulty
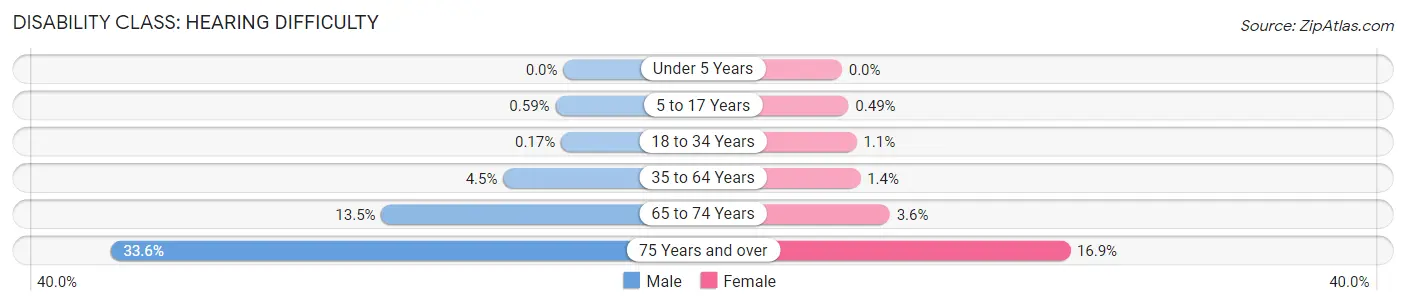
| Age Bracket | Male | Female |
| Under 5 Years | 0 (0.0%) | 0 (0.0%) |
| 5 to 17 Years | 17 (0.6%) | 13 (0.5%) |
| 18 to 34 Years | 13 (0.2%) | 50 (1.1%) |
| 35 to 64 Years | 255 (4.5%) | 73 (1.4%) |
| 65 to 74 Years | 255 (13.5%) | 63 (3.6%) |
| 75 Years and over | 352 (33.6%) | 248 (16.9%) |
Disability Class: Vision Difficulty
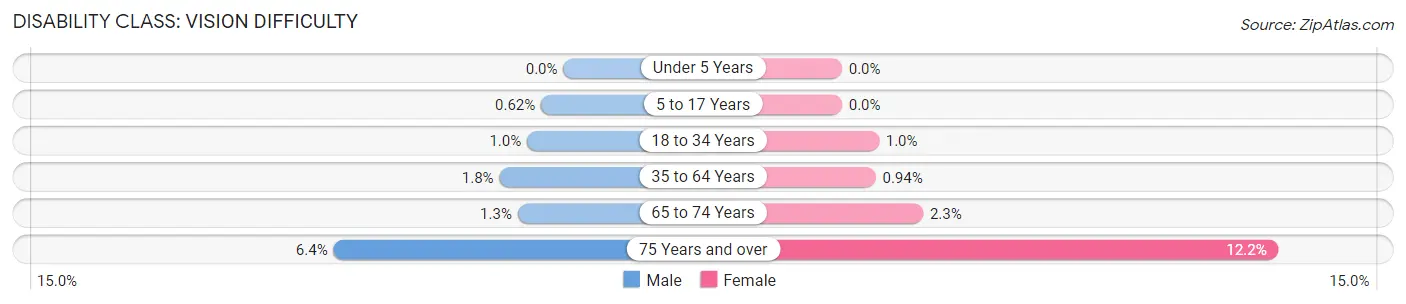
| Age Bracket | Male | Female |
| Under 5 Years | 0 (0.0%) | 0 (0.0%) |
| 5 to 17 Years | 18 (0.6%) | 0 (0.0%) |
| 18 to 34 Years | 79 (1.0%) | 47 (1.0%) |
| 35 to 64 Years | 102 (1.8%) | 50 (0.9%) |
| 65 to 74 Years | 24 (1.3%) | 40 (2.3%) |
| 75 Years and over | 67 (6.4%) | 178 (12.2%) |
Disability Class: Cognitive Difficulty
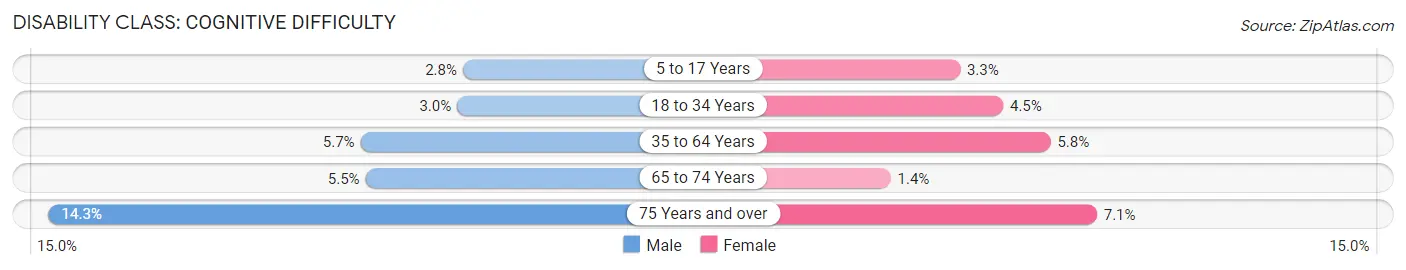
| Age Bracket | Male | Female |
| 5 to 17 Years | 81 (2.8%) | 87 (3.3%) |
| 18 to 34 Years | 232 (3.0%) | 206 (4.5%) |
| 35 to 64 Years | 323 (5.7%) | 309 (5.8%) |
| 65 to 74 Years | 104 (5.5%) | 24 (1.4%) |
| 75 Years and over | 150 (14.3%) | 104 (7.1%) |
Disability Class: Ambulatory Difficulty
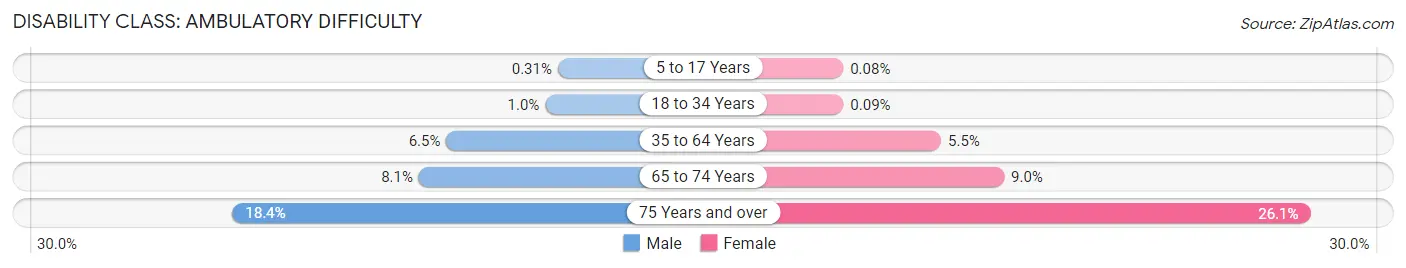
| Age Bracket | Male | Female |
| 5 to 17 Years | 9 (0.3%) | 2 (0.1%) |
| 18 to 34 Years | 79 (1.0%) | 4 (0.1%) |
| 35 to 64 Years | 373 (6.5%) | 294 (5.5%) |
| 65 to 74 Years | 152 (8.1%) | 160 (9.0%) |
| 75 Years and over | 193 (18.4%) | 382 (26.1%) |
Disability Class: Self-Care Difficulty
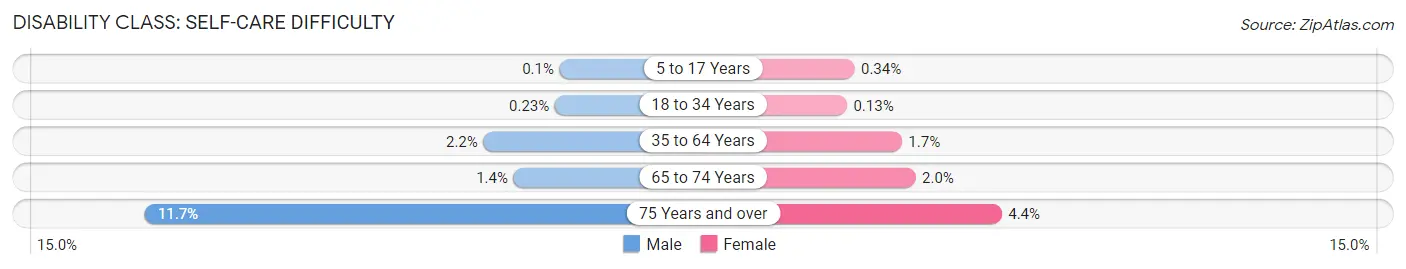
| Age Bracket | Male | Female |
| 5 to 17 Years | 3 (0.1%) | 9 (0.3%) |
| 18 to 34 Years | 18 (0.2%) | 6 (0.1%) |
| 35 to 64 Years | 127 (2.2%) | 88 (1.7%) |
| 65 to 74 Years | 26 (1.4%) | 36 (2.0%) |
| 75 Years and over | 122 (11.7%) | 65 (4.4%) |
Technology Access in Houghton County
Computing Device Access in Houghton County
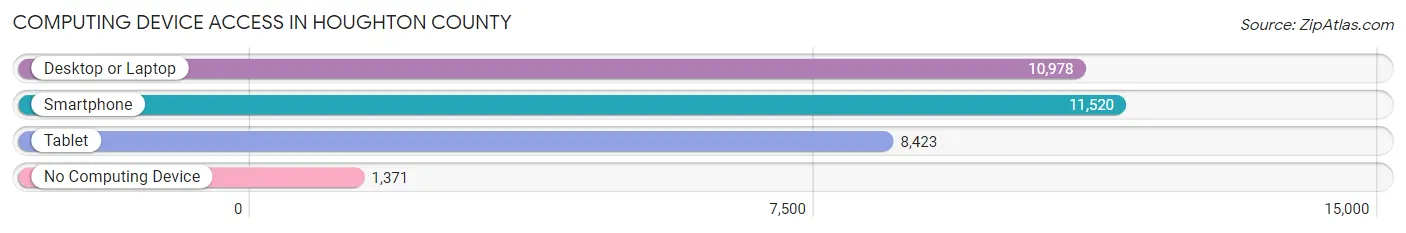
| Device Type | # Households | % Households |
| Desktop or Laptop | 10,978 | 77.5% |
| Smartphone | 11,520 | 81.3% |
| Tablet | 8,423 | 59.4% |
| No Computing Device | 1,371 | 9.7% |
| Total | 14,173 | 100.0% |
Internet Access in Houghton County
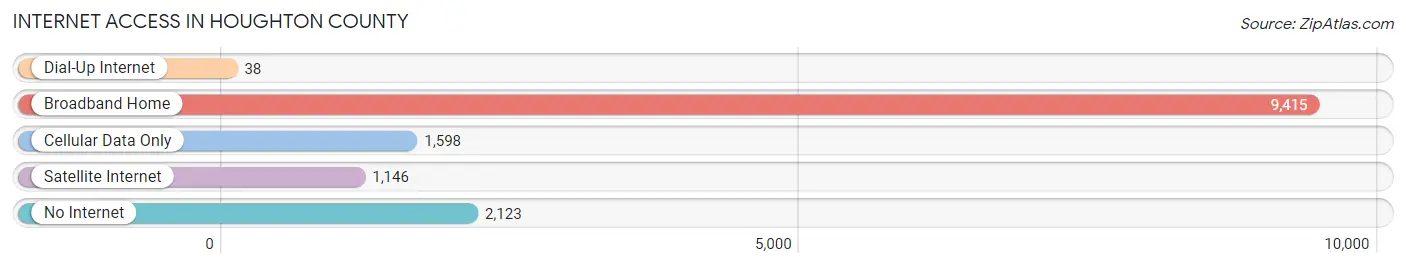
| Internet Type | # Households | % Households |
| Dial-Up Internet | 38 | 0.3% |
| Broadband Home | 9,415 | 66.4% |
| Cellular Data Only | 1,598 | 11.3% |
| Satellite Internet | 1,146 | 8.1% |
| No Internet | 2,123 | 15.0% |
| Total | 14,173 | 100.0% |
Houghton County Summary
Houghton County is located in the Upper Peninsula of Michigan, and is bordered by Ontonagon County to the west, Baraga County to the east, and Keweenaw County to the north. The county seat is Houghton, and the county is home to a population of 36,628 people, as of the 2010 census.
History
Houghton County was established in 1843, and was named after Douglass Houghton, a geologist and explorer who was the first to survey the area. The county was originally part of the Michigan Territory, and was part of the original Copper Country. The area was home to the Ojibwe people, who were the first to mine copper in the area.
The area was first settled by Europeans in the early 1800s, and the first copper mine was established in 1845. The copper mining industry quickly grew, and by the late 1800s, the area was home to numerous copper mines and smelters. The copper industry was the main source of employment in the area, and the population of the county grew rapidly.
The copper industry declined in the early 1900s, and the population of the county began to decline as well. The decline of the copper industry was due to a number of factors, including the introduction of new technologies, the depletion of copper ore, and the increasing cost of labor.
Geography
Houghton County is located in the Upper Peninsula of Michigan, and is bordered by Ontonagon County to the west, Baraga County to the east, and Keweenaw County to the north. The county is home to a total area of 1,845 square miles, of which 1,837 square miles is land and 8 square miles is water.
The county is home to numerous lakes, rivers, and streams, including the Portage River, the Sturgeon River, and the Ontonagon River. The county is also home to numerous parks, including the Porcupine Mountains Wilderness State Park, the Copper Country State Forest, and the Keweenaw National Historical Park.
Economy
The economy of Houghton County is largely based on tourism, manufacturing, and education. The county is home to Michigan Technological University, which is a major employer in the area. The university is also a major contributor to the local economy, as it attracts students and faculty from around the world.
The county is also home to numerous manufacturing companies, including the Houghton County Steel Company, the Houghton County Paper Company, and the Houghton County Mining Company. These companies provide employment for many of the county’s residents.
The county is also home to numerous tourist attractions, including the Keweenaw National Historical Park, the Porcupine Mountains Wilderness State Park, and the Copper Country State Forest. These attractions draw visitors from around the world, and contribute to the local economy.
Demographics
As of the 2010 census, the population of Houghton County was 36,628 people. The population is largely white (94.2%), with small percentages of Native American (1.2%), African American (0.7%), Asian (0.5%), and other races (3.4%).
The median household income in the county is $45,945, and the median family income is $56,945. The per capita income in the county is $25,945. The unemployment rate in the county is 6.2%, which is slightly higher than the national average.
Conclusion
Houghton County is located in the Upper Peninsula of Michigan, and is bordered by Ontonagon County to the west, Baraga County to the east, and Keweenaw County to the north. The county is home to a population of 36,628 people, as of the 2010 census. The economy of the county is largely based on tourism, manufacturing, and education, and the county is home to numerous tourist attractions, manufacturing companies, and Michigan Technological University. The population of the county is largely white, with small percentages of Native American, African American, Asian, and other races. The median household income in the county is $45,945, and the unemployment rate is 6.2%.
Common Questions
What is Per Capita Income in Houghton County?
Per Capita income in Houghton County is $29,173.
What is the Median Family Income in Houghton County?
Median Family Income in Houghton County is $77,209.
What is the Median Household income in Houghton County?
Median Household Income in Houghton County is $52,736.
What is Income or Wage Gap in Houghton County?
Income or Wage Gap in Houghton County is 12.3%.
Women in Houghton County earn 87.7 cents for every dollar earned by a man.
What is Family Income Deficit in Houghton County?
Family Income Deficit in Houghton County is $10,162.
Families that are below poverty line in Houghton County earn $10,162 less on average than the poverty threshold level.
What is Inequality or Gini Index in Houghton County?
Inequality or Gini Index in Houghton County is 0.48.
What is the Total Population of Houghton County?
Total Population of Houghton County is 37,414.
What is the Total Male Population of Houghton County?
Total Male Population of Houghton County is 20,576.
What is the Total Female Population of Houghton County?
Total Female Population of Houghton County is 16,838.
What is the Ratio of Males per 100 Females in Houghton County?
There are 122.20 Males per 100 Females in Houghton County.
What is the Ratio of Females per 100 Males in Houghton County?
There are 81.83 Females per 100 Males in Houghton County.
What is the Median Population Age in Houghton County?
Median Population Age in Houghton County is 31.9 Years.
What is the Average Family Size in Houghton County
Average Family Size in Houghton County is 3.1 People.
What is the Average Household Size in Houghton County
Average Household Size in Houghton County is 2.4 People.
How Large is the Labor Force in Houghton County?
There are 17,921 People in the Labor Forcein in Houghton County.
What is the Percentage of People in the Labor Force in Houghton County?
58.0% of People are in the Labor Force in Houghton County.
What is the Unemployment Rate in Houghton County?
Unemployment Rate in Houghton County is 6.2%.