Emmet County, MI Map & Demographics
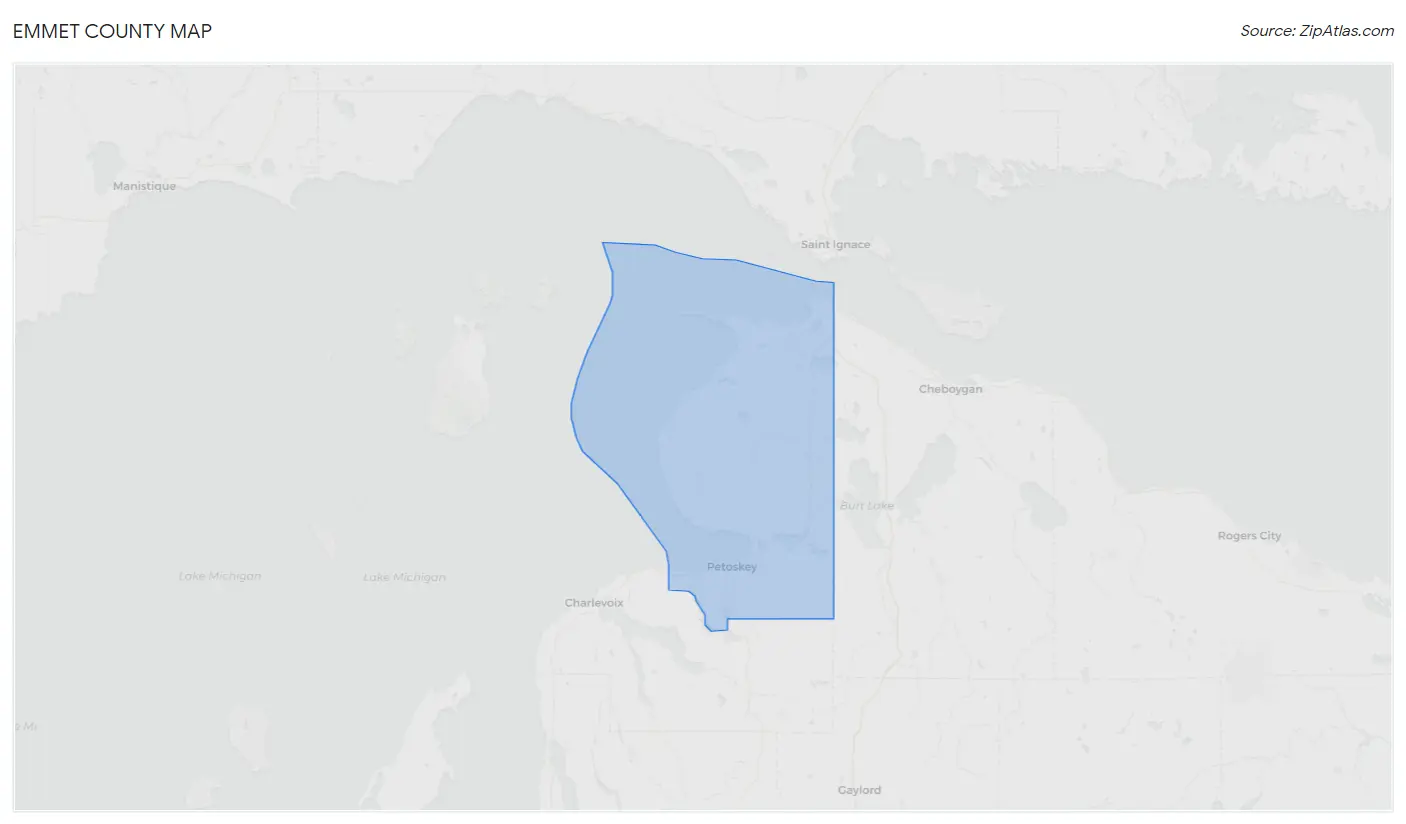
Emmet County Map
Emmet County Overview
$42,373
PER CAPITA INCOME
$84,810
AVG FAMILY INCOME
$69,690
AVG HOUSEHOLD INCOME
24.2%
WAGE / INCOME GAP [ % ]
75.8¢/ $1
WAGE / INCOME GAP [ $ ]
$10,081
FAMILY INCOME DEFICIT
0.46
INEQUALITY / GINI INDEX
34,072
TOTAL POPULATION
17,083
MALE POPULATION
16,989
FEMALE POPULATION
100.55
MALES / 100 FEMALES
99.45
FEMALES / 100 MALES
45.8
MEDIAN AGE
2.8
AVG FAMILY SIZE
2.3
AVG HOUSEHOLD SIZE
17,860
LABOR FORCE [ PEOPLE ]
62.3%
PERCENT IN LABOR FORCE
3.8%
UNEMPLOYMENT RATE
Income in Emmet County
Income Overview in Emmet County
Per Capita Income in Emmet County is $42,373, while median incomes of families and households are $84,810 and $69,690 respectively.
| Characteristic | Number | Measure |
| Per Capita Income | 34,072 | $42,373 |
| Median Family Income | 9,692 | $84,810 |
| Mean Family Income | 9,692 | $114,971 |
| Median Household Income | 14,530 | $69,690 |
| Mean Household Income | 14,530 | $98,070 |
| Income Deficit | 9,692 | $10,081 |
| Wage / Income Gap (%) | 34,072 | 24.24% |
| Wage / Income Gap ($) | 34,072 | 75.76¢ per $1 |
| Gini / Inequality Index | 34,072 | 0.46 |
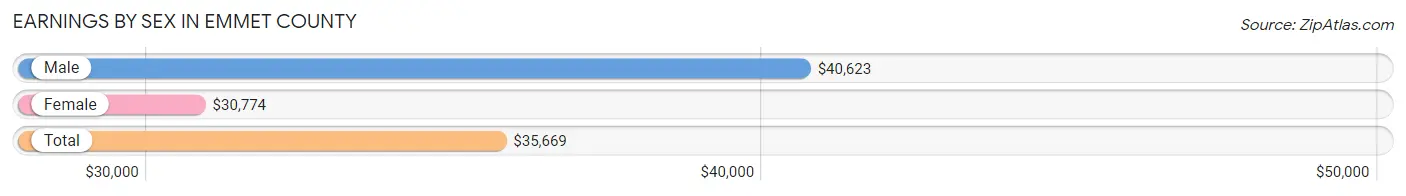
Earnings by Sex in Emmet County
Average Earnings in Emmet County are $35,669, $40,623 for men and $30,774 for women, a difference of 24.2%.
| Sex | Number | Average Earnings |
| Male | 10,241 (53.2%) | $40,623 |
| Female | 9,007 (46.8%) | $30,774 |
| Total | 19,248 (100.0%) | $35,669 |
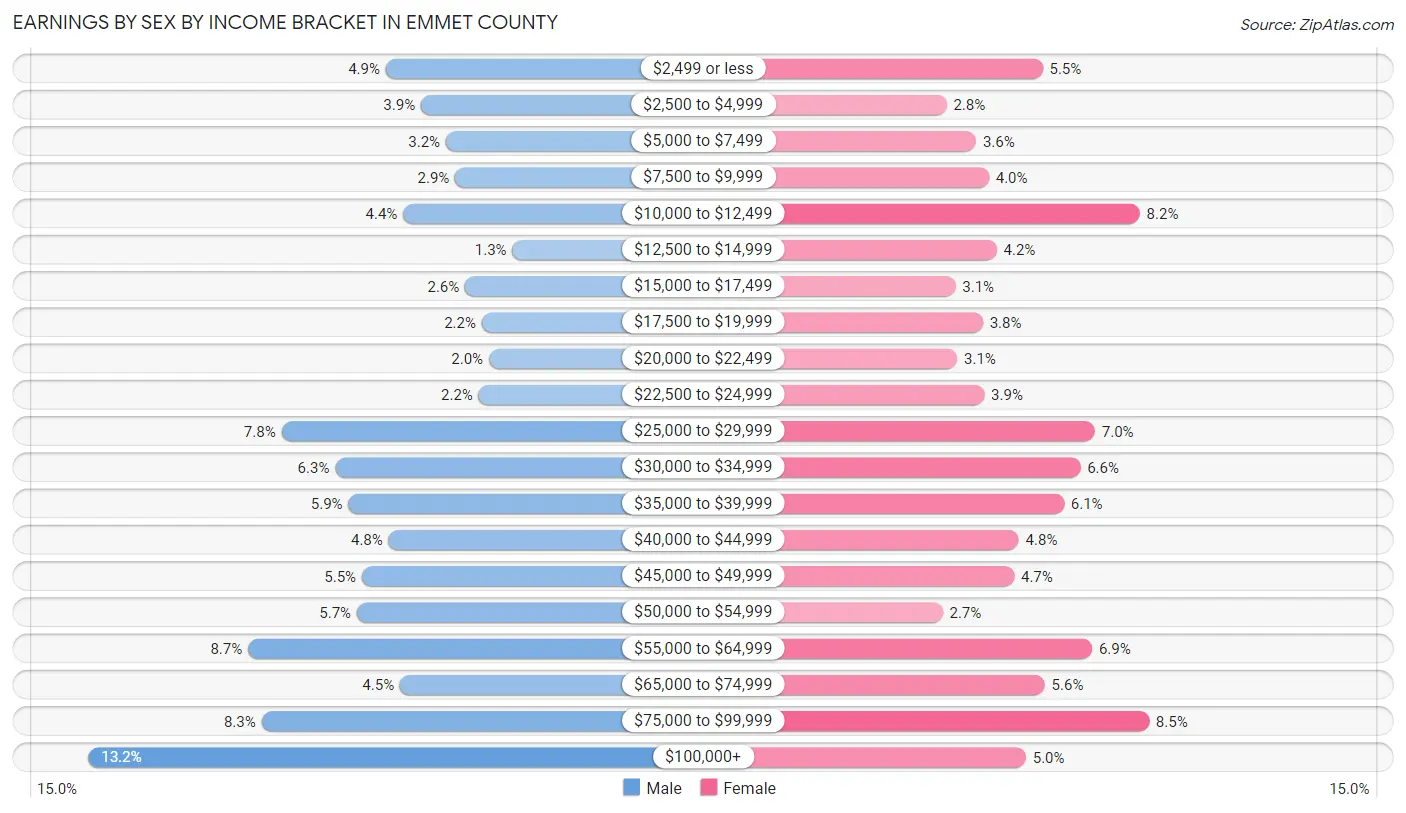
Earnings by Sex by Income Bracket in Emmet County
The most common earnings brackets in Emmet County are $100,000+ for men (1,353 | 13.2%) and $75,000 to $99,999 for women (765 | 8.5%).
| Income | Male | Female |
| $2,499 or less | 497 (4.9%) | 495 (5.5%) |
| $2,500 to $4,999 | 395 (3.9%) | 252 (2.8%) |
| $5,000 to $7,499 | 324 (3.2%) | 327 (3.6%) |
| $7,500 to $9,999 | 297 (2.9%) | 359 (4.0%) |
| $10,000 to $12,499 | 446 (4.4%) | 741 (8.2%) |
| $12,500 to $14,999 | 132 (1.3%) | 379 (4.2%) |
| $15,000 to $17,499 | 268 (2.6%) | 275 (3.0%) |
| $17,500 to $19,999 | 220 (2.1%) | 344 (3.8%) |
| $20,000 to $22,499 | 200 (1.9%) | 279 (3.1%) |
| $22,500 to $24,999 | 229 (2.2%) | 348 (3.9%) |
| $25,000 to $29,999 | 797 (7.8%) | 628 (7.0%) |
| $30,000 to $34,999 | 642 (6.3%) | 591 (6.6%) |
| $35,000 to $39,999 | 604 (5.9%) | 549 (6.1%) |
| $40,000 to $44,999 | 489 (4.8%) | 435 (4.8%) |
| $45,000 to $49,999 | 565 (5.5%) | 423 (4.7%) |
| $50,000 to $54,999 | 580 (5.7%) | 242 (2.7%) |
| $55,000 to $64,999 | 893 (8.7%) | 621 (6.9%) |
| $65,000 to $74,999 | 456 (4.4%) | 501 (5.6%) |
| $75,000 to $99,999 | 854 (8.3%) | 765 (8.5%) |
| $100,000+ | 1,353 (13.2%) | 453 (5.0%) |
| Total | 10,241 (100.0%) | 9,007 (100.0%) |
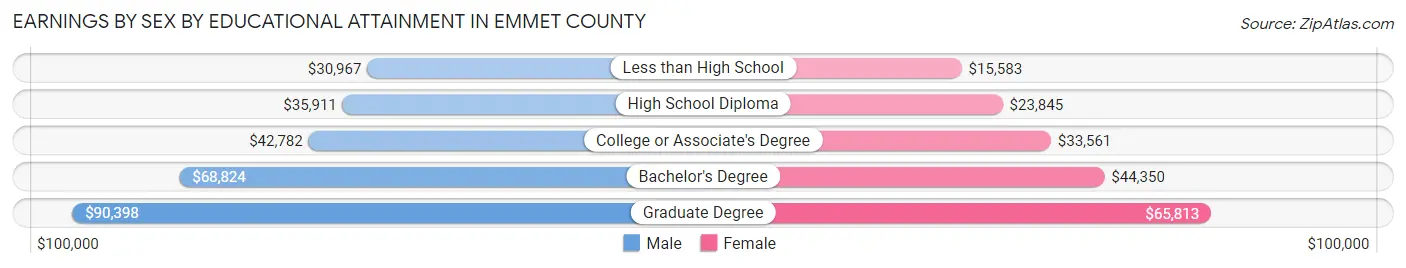
Earnings by Sex by Educational Attainment in Emmet County
Average earnings in Emmet County are $47,140 for men and $35,771 for women, a difference of 24.1%. Men with an educational attainment of graduate degree enjoy the highest average annual earnings of $90,398, while those with less than high school education earn the least with $30,967. Women with an educational attainment of graduate degree earn the most with the average annual earnings of $65,813, while those with less than high school education have the smallest earnings of $15,583.
| Educational Attainment | Male Income | Female Income |
| Less than High School | $30,967 | $15,583 |
| High School Diploma | $35,911 | $23,845 |
| College or Associate's Degree | $42,782 | $33,561 |
| Bachelor's Degree | $68,824 | $44,350 |
| Graduate Degree | $90,398 | $65,813 |
| Total | $47,140 | $35,771 |
Family Income in Emmet County
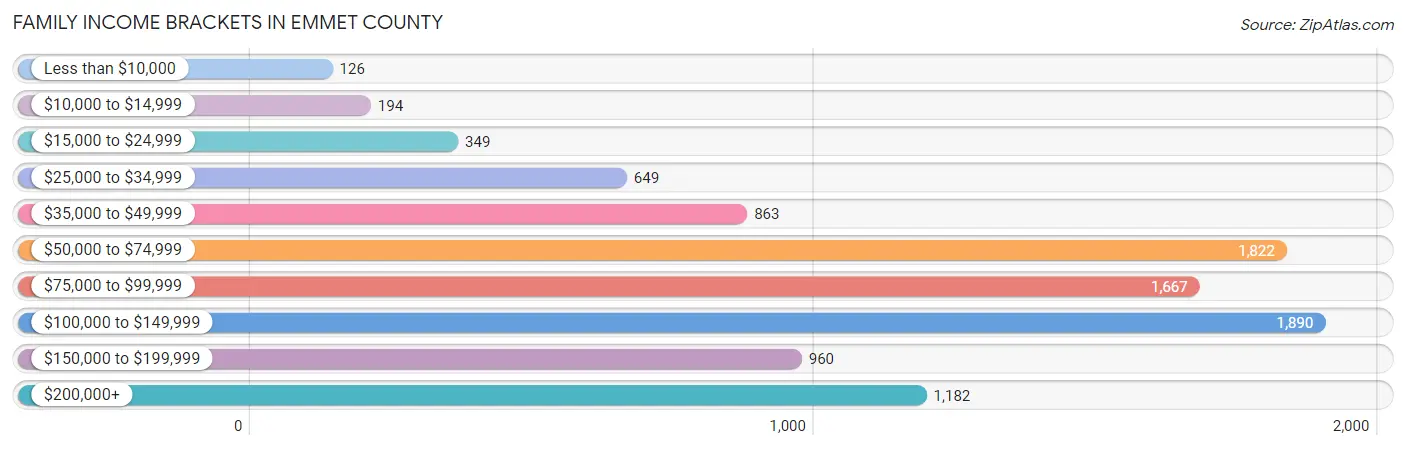
Family Income Brackets in Emmet County
According to the Emmet County family income data, there are 1,890 families falling into the $100,000 to $149,999 income range, which is the most common income bracket and makes up 19.5% of all families. Conversely, the less than $10,000 income bracket is the least frequent group with only 126 families (1.3%) belonging to this category.
| Income Bracket | # Families | % Families |
| Less than $10,000 | 126 | 1.3% |
| $10,000 to $14,999 | 194 | 2.0% |
| $15,000 to $24,999 | 349 | 3.6% |
| $25,000 to $34,999 | 649 | 6.7% |
| $35,000 to $49,999 | 863 | 8.9% |
| $50,000 to $74,999 | 1,822 | 18.8% |
| $75,000 to $99,999 | 1,667 | 17.2% |
| $100,000 to $149,999 | 1,890 | 19.5% |
| $150,000 to $199,999 | 960 | 9.9% |
| $200,000+ | 1,182 | 12.2% |
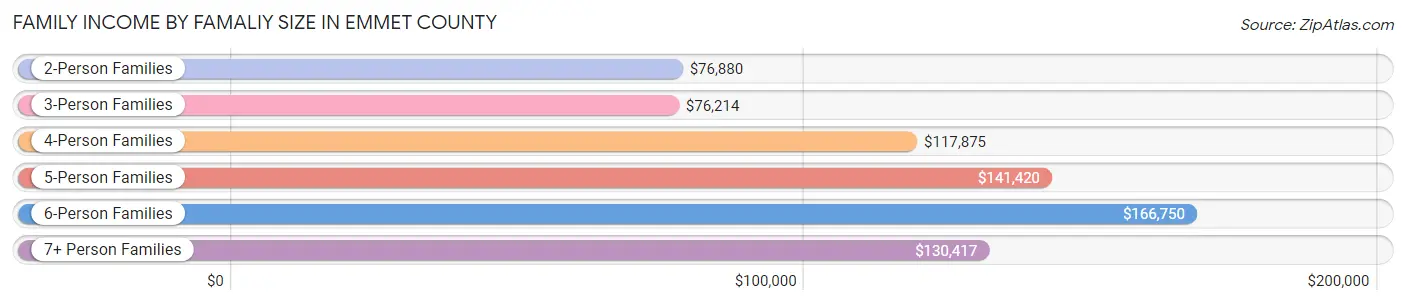
Family Income by Famaliy Size in Emmet County
6-person families (258 | 2.7%) account for the highest median family income in Emmet County with $166,750 per family, while 2-person families (5,510 | 56.9%) have the highest median income of $38,440 per family member.
| Income Bracket | # Families | Median Income |
| 2-Person Families | 5,510 (56.9%) | $76,880 |
| 3-Person Families | 1,944 (20.1%) | $76,214 |
| 4-Person Families | 1,301 (13.4%) | $117,875 |
| 5-Person Families | 549 (5.7%) | $141,420 |
| 6-Person Families | 258 (2.7%) | $166,750 |
| 7+ Person Families | 130 (1.3%) | $130,417 |
| Total | 9,692 (100.0%) | $84,810 |
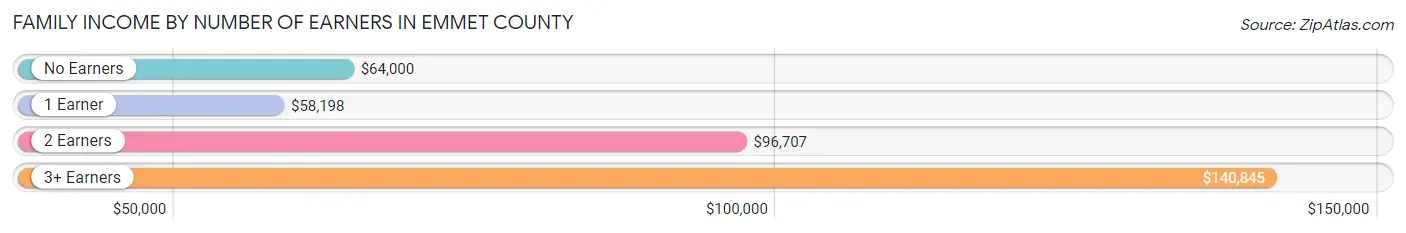
Family Income by Number of Earners in Emmet County
The median family income in Emmet County is $84,810, with families comprising 3+ earners (1,325) having the highest median family income of $140,845, while families with 1 earner (2,556) have the lowest median family income of $58,198, accounting for 13.7% and 26.4% of families, respectively.
| Number of Earners | # Families | Median Income |
| No Earners | 1,864 (19.2%) | $64,000 |
| 1 Earner | 2,556 (26.4%) | $58,198 |
| 2 Earners | 3,947 (40.7%) | $96,707 |
| 3+ Earners | 1,325 (13.7%) | $140,845 |
| Total | 9,692 (100.0%) | $84,810 |
Household Income in Emmet County
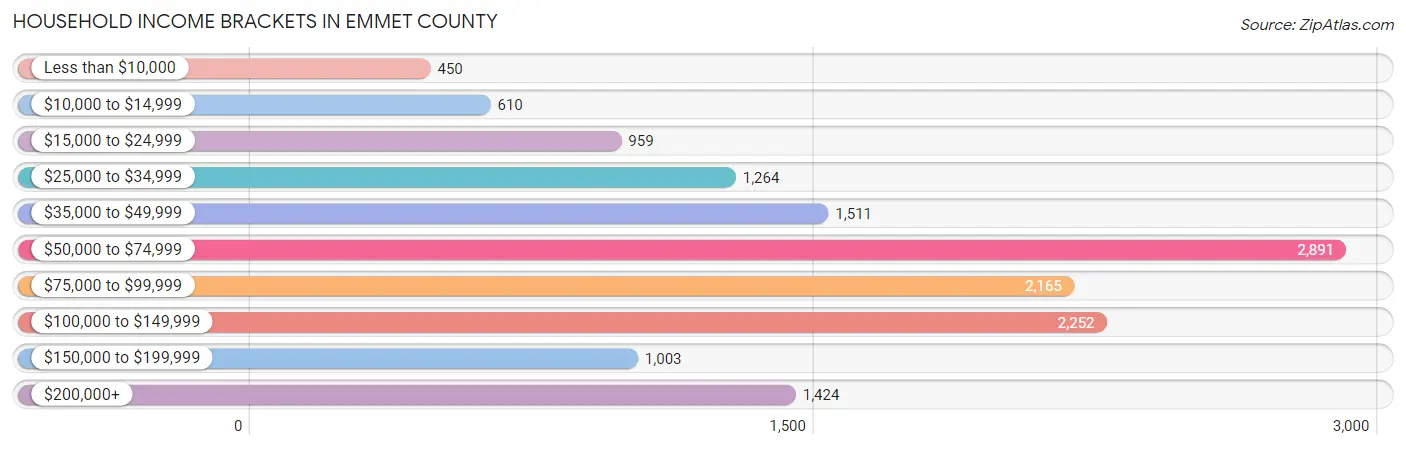
Household Income Brackets in Emmet County
With 2,891 households falling in the category, the $50,000 to $74,999 income range is the most frequent in Emmet County, accounting for 19.9% of all households. In contrast, only 450 households (3.1%) fall into the less than $10,000 income bracket, making it the least populous group.
| Income Bracket | # Households | % Households |
| Less than $10,000 | 450 | 3.1% |
| $10,000 to $14,999 | 610 | 4.2% |
| $15,000 to $24,999 | 959 | 6.6% |
| $25,000 to $34,999 | 1,264 | 8.7% |
| $35,000 to $49,999 | 1,511 | 10.4% |
| $50,000 to $74,999 | 2,891 | 19.9% |
| $75,000 to $99,999 | 2,165 | 14.9% |
| $100,000 to $149,999 | 2,252 | 15.5% |
| $150,000 to $199,999 | 1,003 | 6.9% |
| $200,000+ | 1,424 | 9.8% |
Household Income by Householder Age in Emmet County
The median household income in Emmet County is $69,690, with the highest median household income of $81,693 found in the 45 to 64 years age bracket for the primary householder. A total of 5,298 households (36.5%) fall into this category. Meanwhile, the 15 to 24 years age bracket for the primary householder has the lowest median household income of $39,575, with 660 households (4.5%) in this group.
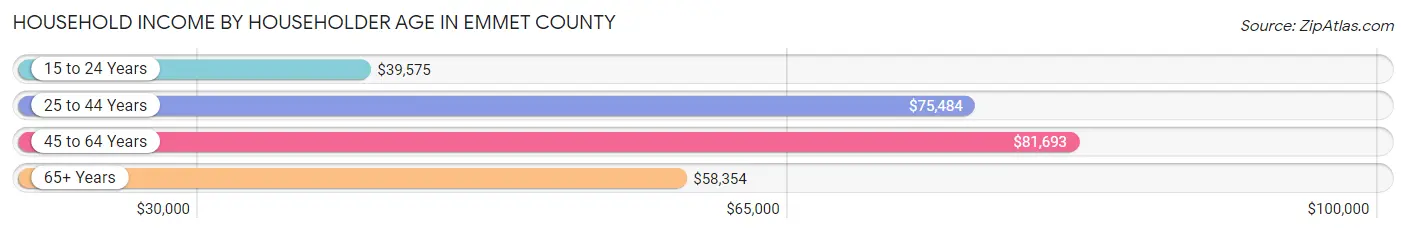
| Income Bracket | # Households | Median Income |
| 15 to 24 Years | 660 (4.5%) | $39,575 |
| 25 to 44 Years | 3,676 (25.3%) | $75,484 |
| 45 to 64 Years | 5,298 (36.5%) | $81,693 |
| 65+ Years | 4,896 (33.7%) | $58,354 |
| Total | 14,530 (100.0%) | $69,690 |
Poverty in Emmet County
Income Below Poverty by Sex and Age in Emmet County
With 7.3% poverty level for males and 9.4% for females among the residents of Emmet County, under 5 year old males and 25 to 34 year old females are the most vulnerable to poverty, with 132 males (15.9%) and 273 females (15.4%) in their respective age groups living below the poverty level.
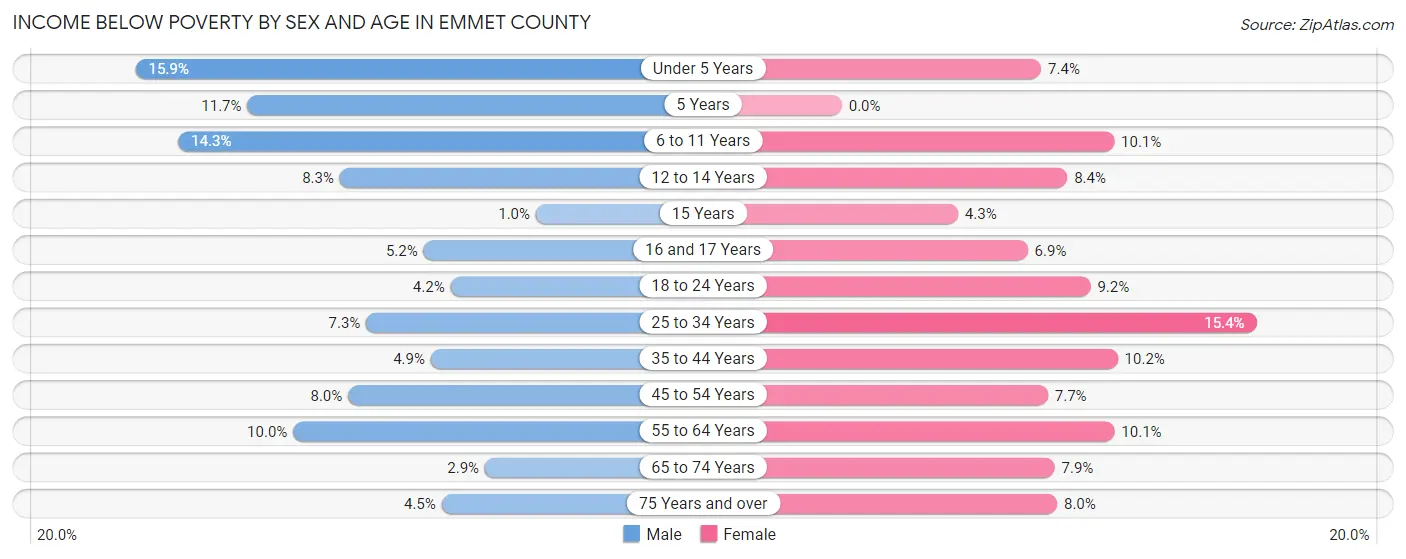
| Age Bracket | Male | Female |
| Under 5 Years | 132 (15.9%) | 50 (7.4%) |
| 5 Years | 19 (11.7%) | 0 (0.0%) |
| 6 to 11 Years | 165 (14.3%) | 107 (10.1%) |
| 12 to 14 Years | 40 (8.3%) | 39 (8.4%) |
| 15 Years | 2 (1.0%) | 9 (4.3%) |
| 16 and 17 Years | 23 (5.2%) | 30 (6.9%) |
| 18 to 24 Years | 59 (4.2%) | 121 (9.2%) |
| 25 to 34 Years | 148 (7.3%) | 273 (15.4%) |
| 35 to 44 Years | 88 (4.9%) | 203 (10.2%) |
| 45 to 54 Years | 169 (8.0%) | 151 (7.6%) |
| 55 to 64 Years | 264 (10.0%) | 274 (10.1%) |
| 65 to 74 Years | 68 (2.9%) | 194 (7.9%) |
| 75 Years and over | 60 (4.5%) | 128 (8.0%) |
| Total | 1,237 (7.3%) | 1,579 (9.4%) |
Income Above Poverty by Sex and Age in Emmet County
According to the poverty statistics in Emmet County, males aged 15 years and females aged 5 years are the age groups that are most secure financially, with 99.0% of males and 100.0% of females in these age groups living above the poverty line.
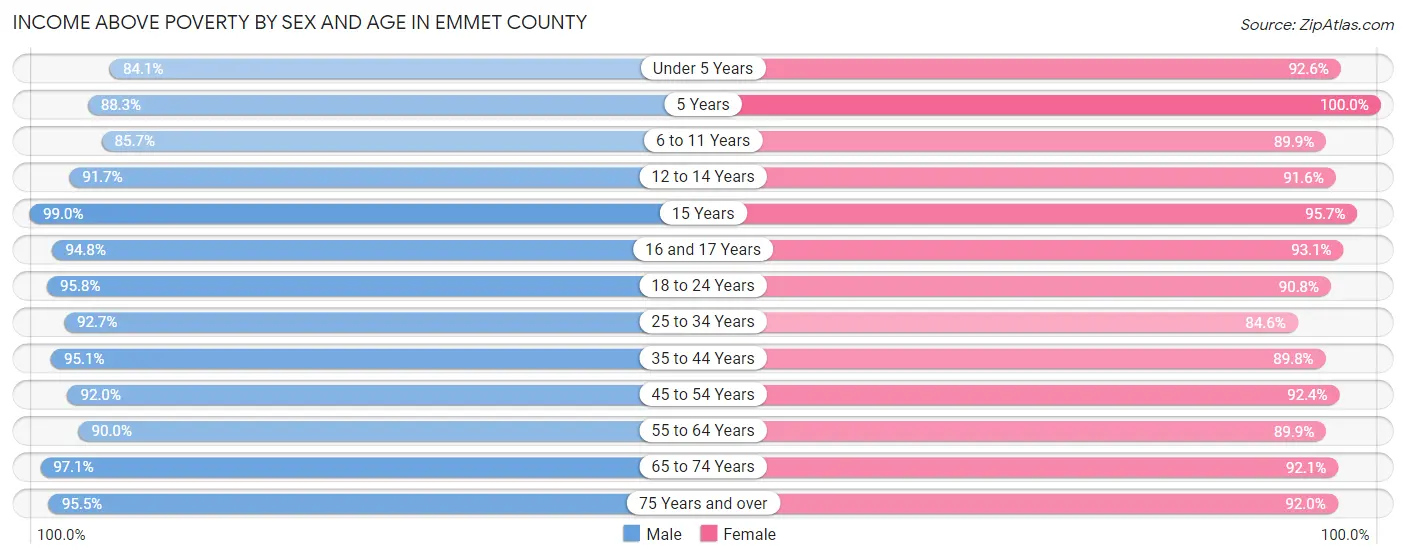
| Age Bracket | Male | Female |
| Under 5 Years | 699 (84.1%) | 626 (92.6%) |
| 5 Years | 143 (88.3%) | 91 (100.0%) |
| 6 to 11 Years | 989 (85.7%) | 951 (89.9%) |
| 12 to 14 Years | 442 (91.7%) | 427 (91.6%) |
| 15 Years | 194 (99.0%) | 200 (95.7%) |
| 16 and 17 Years | 420 (94.8%) | 405 (93.1%) |
| 18 to 24 Years | 1,350 (95.8%) | 1,190 (90.8%) |
| 25 to 34 Years | 1,875 (92.7%) | 1,501 (84.6%) |
| 35 to 44 Years | 1,702 (95.1%) | 1,779 (89.8%) |
| 45 to 54 Years | 1,946 (92.0%) | 1,824 (92.3%) |
| 55 to 64 Years | 2,367 (90.0%) | 2,434 (89.9%) |
| 65 to 74 Years | 2,272 (97.1%) | 2,263 (92.1%) |
| 75 Years and over | 1,267 (95.5%) | 1,475 (92.0%) |
| Total | 15,666 (92.7%) | 15,166 (90.6%) |
Income Below Poverty Among Married-Couple Families in Emmet County
The poverty statistics for married-couple families in Emmet County show that 2.8% or 219 of the total 7,923 families live below the poverty line. Families with 5 or more children have the highest poverty rate of 13.3%, comprising of 4 families. On the other hand, families with 1 or 2 children have the lowest poverty rate of 1.7%, which includes 33 families.
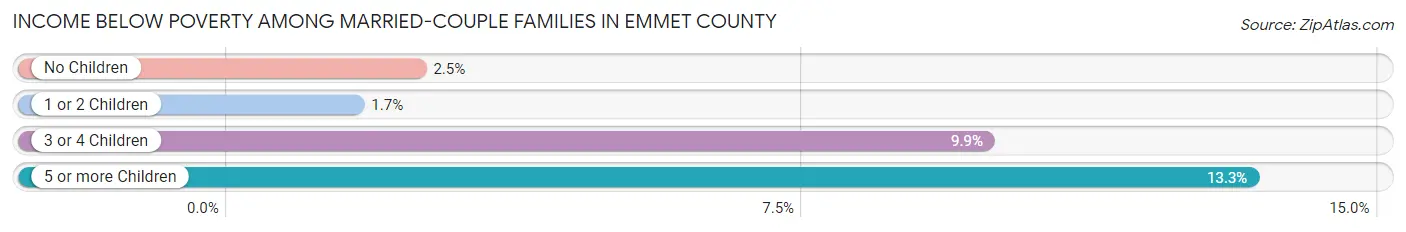
| Children | Above Poverty | Below Poverty |
| No Children | 5,264 (97.5%) | 133 (2.5%) |
| 1 or 2 Children | 1,967 (98.4%) | 33 (1.7%) |
| 3 or 4 Children | 447 (90.1%) | 49 (9.9%) |
| 5 or more Children | 26 (86.7%) | 4 (13.3%) |
| Total | 7,704 (97.2%) | 219 (2.8%) |
Income Below Poverty Among Single-Parent Households in Emmet County
According to the poverty data in Emmet County, 5.1% or 35 single-father households and 22.8% or 248 single-mother households are living below the poverty line. Among single-father households, those with no children have the highest poverty rate, with 21 households (8.1%) experiencing poverty. Likewise, among single-mother households, those with 5 or more children have the highest poverty rate, with 1 households (100.0%) falling below the poverty line.
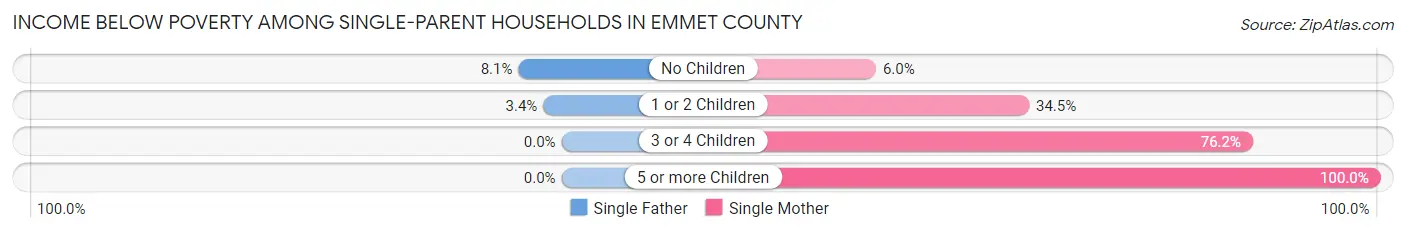
| Children | Single Father | Single Mother |
| No Children | 21 (8.1%) | 29 (6.0%) |
| 1 or 2 Children | 14 (3.4%) | 202 (34.5%) |
| 3 or 4 Children | 0 (0.0%) | 16 (76.2%) |
| 5 or more Children | 0 (0.0%) | 1 (100.0%) |
| Total | 35 (5.1%) | 248 (22.8%) |
Income Below Poverty Among Married-Couple vs Single-Parent Households in Emmet County
The poverty data for Emmet County shows that 219 of the married-couple family households (2.8%) and 283 of the single-parent households (16.0%) are living below the poverty level. Within the married-couple family households, those with 5 or more children have the highest poverty rate, with 4 households (13.3%) falling below the poverty line. Among the single-parent households, those with 5 or more children have the highest poverty rate, with 1 household (100.0%) living below poverty.
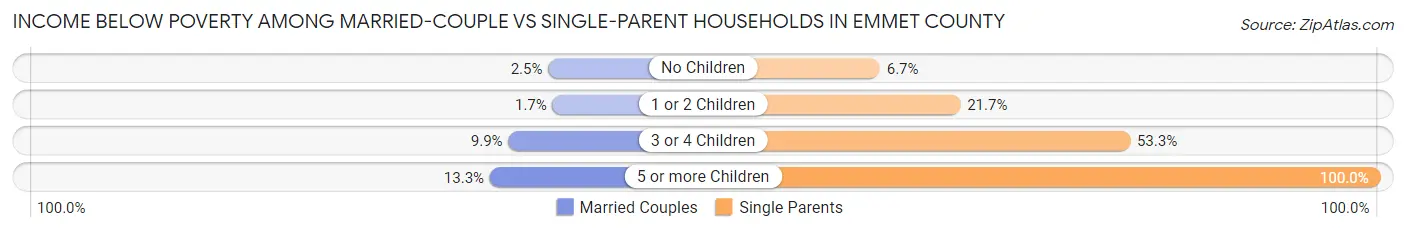
| Children | Married-Couple Families | Single-Parent Households |
| No Children | 133 (2.5%) | 50 (6.7%) |
| 1 or 2 Children | 33 (1.7%) | 216 (21.7%) |
| 3 or 4 Children | 49 (9.9%) | 16 (53.3%) |
| 5 or more Children | 4 (13.3%) | 1 (100.0%) |
| Total | 219 (2.8%) | 283 (16.0%) |
Race in Emmet County
The most populous races in Emmet County are White / Caucasian (30,889 | 90.7%), Two or more Races (1,672 | 4.9%), and Native / Alaskan (850 | 2.5%).
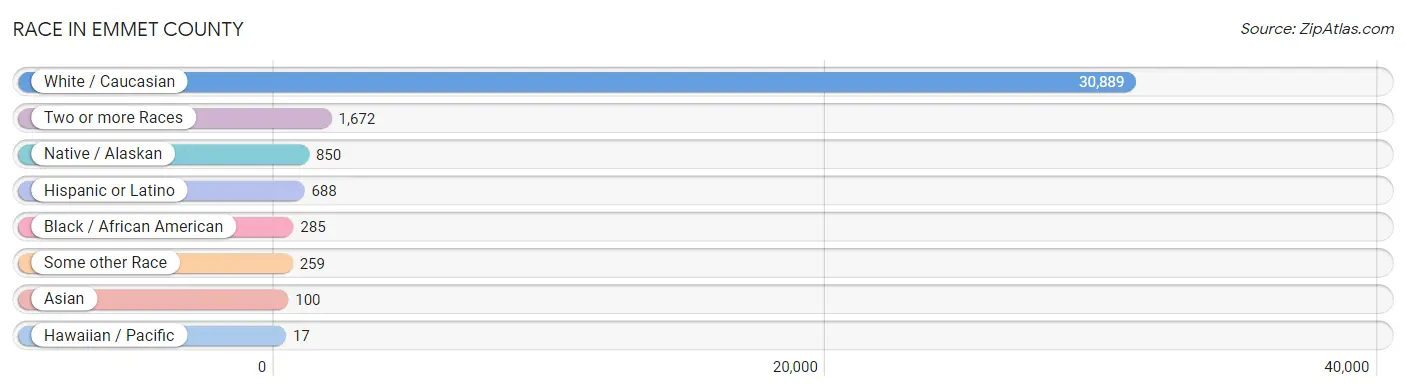
| Race | # Population | % Population |
| Asian | 100 | 0.3% |
| Black / African American | 285 | 0.8% |
| Hawaiian / Pacific | 17 | 0.1% |
| Hispanic or Latino | 688 | 2.0% |
| Native / Alaskan | 850 | 2.5% |
| White / Caucasian | 30,889 | 90.7% |
| Two or more Races | 1,672 | 4.9% |
| Some other Race | 259 | 0.8% |
| Total | 34,072 | 100.0% |
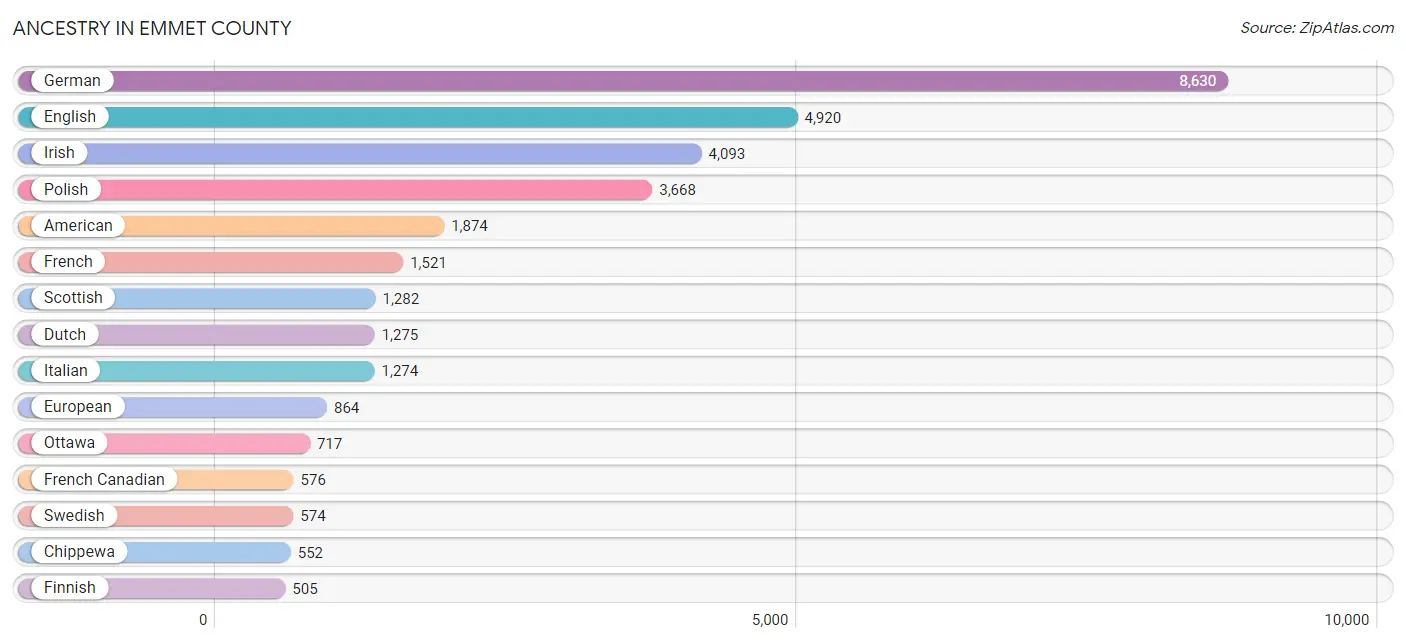
Ancestry in Emmet County
The most populous ancestries reported in Emmet County are German (8,630 | 25.3%), English (4,920 | 14.4%), Irish (4,093 | 12.0%), Polish (3,668 | 10.8%), and American (1,874 | 5.5%), together accounting for 68.1% of all Emmet County residents.
| Ancestry | # Population | % Population |
| African | 69 | 0.2% |
| Albanian | 2 | 0.0% |
| American | 1,874 | 5.5% |
| Apache | 4 | 0.0% |
| Arab | 230 | 0.7% |
| Argentinean | 14 | 0.0% |
| Armenian | 11 | 0.0% |
| Assyrian / Chaldean / Syriac | 2 | 0.0% |
| Austrian | 86 | 0.3% |
| Belgian | 191 | 0.6% |
| Bhutanese | 18 | 0.1% |
| Blackfeet | 17 | 0.1% |
| Brazilian | 35 | 0.1% |
| British | 128 | 0.4% |
| Burmese | 141 | 0.4% |
| Canadian | 155 | 0.4% |
| Central American | 69 | 0.2% |
| Cherokee | 62 | 0.2% |
| Chippewa | 552 | 1.6% |
| Colombian | 2 | 0.0% |
| Costa Rican | 20 | 0.1% |
| Cree | 6 | 0.0% |
| Creek | 6 | 0.0% |
| Croatian | 44 | 0.1% |
| Cuban | 34 | 0.1% |
| Czech | 225 | 0.7% |
| Czechoslovakian | 83 | 0.2% |
| Danish | 283 | 0.8% |
| Dutch | 1,275 | 3.7% |
| Eastern European | 160 | 0.5% |
| English | 4,920 | 14.4% |
| European | 864 | 2.5% |
| Finnish | 505 | 1.5% |
| French | 1,521 | 4.5% |
| French American Indian | 7 | 0.0% |
| French Canadian | 576 | 1.7% |
| German | 8,630 | 25.3% |
| Greek | 160 | 0.5% |
| Guamanian / Chamorro | 3 | 0.0% |
| Guatemalan | 12 | 0.0% |
| Hungarian | 287 | 0.8% |
| Icelander | 3 | 0.0% |
| Indian (Asian) | 149 | 0.4% |
| Iraqi | 3 | 0.0% |
| Irish | 4,093 | 12.0% |
| Iroquois | 9 | 0.0% |
| Italian | 1,274 | 3.7% |
| Jamaican | 75 | 0.2% |
| Korean | 150 | 0.4% |
| Laotian | 9 | 0.0% |
| Lebanese | 48 | 0.1% |
| Lithuanian | 63 | 0.2% |
| Lumbee | 18 | 0.1% |
| Luxembourger | 3 | 0.0% |
| Maltese | 35 | 0.1% |
| Mexican | 330 | 1.0% |
| Moroccan | 6 | 0.0% |
| Native Hawaiian | 13 | 0.0% |
| Nicaraguan | 36 | 0.1% |
| Northern European | 280 | 0.8% |
| Norwegian | 370 | 1.1% |
| Ottawa | 717 | 2.1% |
| Panamanian | 1 | 0.0% |
| Pennsylvania German | 13 | 0.0% |
| Polish | 3,668 | 10.8% |
| Portuguese | 30 | 0.1% |
| Potawatomi | 3 | 0.0% |
| Puerto Rican | 198 | 0.6% |
| Romanian | 11 | 0.0% |
| Russian | 99 | 0.3% |
| Scandinavian | 123 | 0.4% |
| Scotch-Irish | 285 | 0.8% |
| Scottish | 1,282 | 3.8% |
| Serbian | 4 | 0.0% |
| Sioux | 10 | 0.0% |
| Slavic | 184 | 0.5% |
| Slovak | 80 | 0.2% |
| South American | 16 | 0.1% |
| Spaniard | 34 | 0.1% |
| Subsaharan African | 69 | 0.2% |
| Swedish | 574 | 1.7% |
| Swiss | 173 | 0.5% |
| Syrian | 17 | 0.1% |
| Turkish | 13 | 0.0% |
| Ukrainian | 103 | 0.3% |
| Welsh | 157 | 0.5% |
| Yugoslavian | 5 | 0.0% | View All 87 Rows |
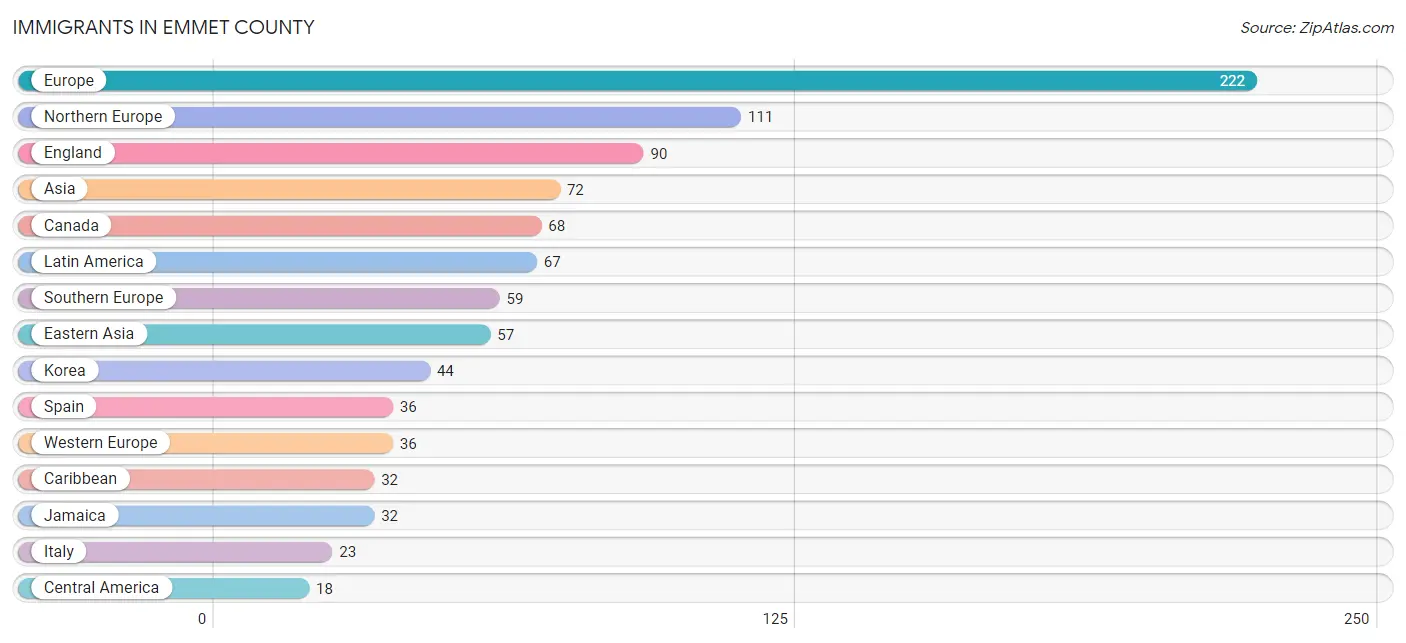
Immigrants in Emmet County
The most numerous immigrant groups reported in Emmet County came from Europe (222 | 0.6%), Northern Europe (111 | 0.3%), England (90 | 0.3%), Asia (72 | 0.2%), and Canada (68 | 0.2%), together accounting for 1.7% of all Emmet County residents.
| Immigration Origin | # Population | % Population |
| Africa | 8 | 0.0% |
| Argentina | 3 | 0.0% |
| Asia | 72 | 0.2% |
| Austria | 10 | 0.0% |
| Brazil | 12 | 0.0% |
| Canada | 68 | 0.2% |
| Caribbean | 32 | 0.1% |
| Central America | 18 | 0.1% |
| China | 13 | 0.0% |
| Colombia | 2 | 0.0% |
| Czechoslovakia | 2 | 0.0% |
| Eastern Africa | 1 | 0.0% |
| Eastern Asia | 57 | 0.2% |
| Eastern Europe | 16 | 0.1% |
| England | 90 | 0.3% |
| Europe | 222 | 0.6% |
| France | 4 | 0.0% |
| Germany | 10 | 0.0% |
| Guatemala | 12 | 0.0% |
| Indonesia | 9 | 0.0% |
| Iraq | 3 | 0.0% |
| Ireland | 2 | 0.0% |
| Italy | 23 | 0.1% |
| Jamaica | 32 | 0.1% |
| Korea | 44 | 0.1% |
| Latin America | 67 | 0.2% |
| Mexico | 6 | 0.0% |
| Morocco | 6 | 0.0% |
| Netherlands | 11 | 0.0% |
| Northern Africa | 6 | 0.0% |
| Northern Europe | 111 | 0.3% |
| Norway | 7 | 0.0% |
| Pakistan | 1 | 0.0% |
| Philippines | 2 | 0.0% |
| Romania | 6 | 0.0% |
| Russia | 7 | 0.0% |
| Scotland | 6 | 0.0% |
| Sierra Leone | 1 | 0.0% |
| South America | 17 | 0.1% |
| South Central Asia | 1 | 0.0% |
| South Eastern Asia | 11 | 0.0% |
| Southern Europe | 59 | 0.2% |
| Spain | 36 | 0.1% |
| Sweden | 6 | 0.0% |
| Western Africa | 1 | 0.0% |
| Western Asia | 3 | 0.0% |
| Western Europe | 36 | 0.1% | View All 47 Rows |
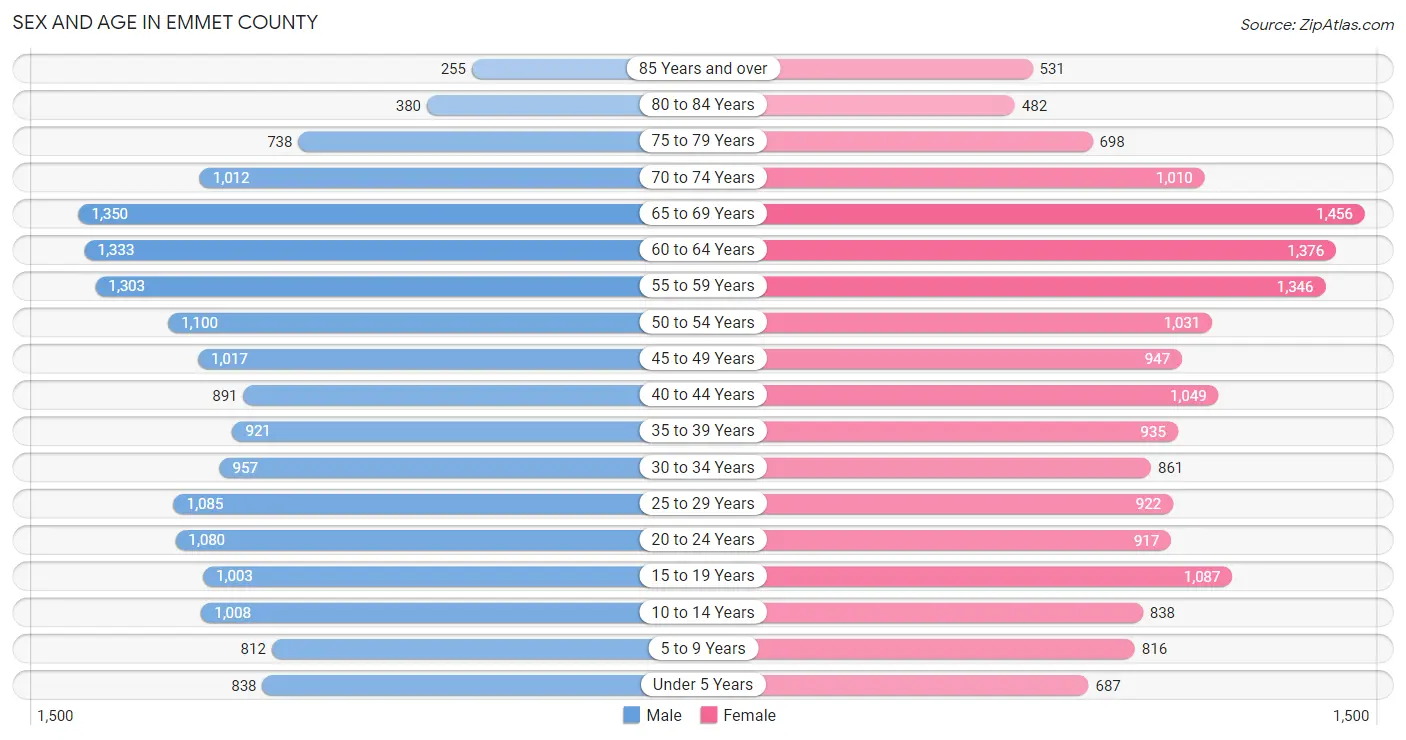
Sex and Age in Emmet County
Sex and Age in Emmet County
The most populous age groups in Emmet County are 65 to 69 Years (1,350 | 7.9%) for men and 65 to 69 Years (1,456 | 8.6%) for women.
| Age Bracket | Male | Female |
| Under 5 Years | 838 (4.9%) | 687 (4.0%) |
| 5 to 9 Years | 812 (4.8%) | 816 (4.8%) |
| 10 to 14 Years | 1,008 (5.9%) | 838 (4.9%) |
| 15 to 19 Years | 1,003 (5.9%) | 1,087 (6.4%) |
| 20 to 24 Years | 1,080 (6.3%) | 917 (5.4%) |
| 25 to 29 Years | 1,085 (6.4%) | 922 (5.4%) |
| 30 to 34 Years | 957 (5.6%) | 861 (5.1%) |
| 35 to 39 Years | 921 (5.4%) | 935 (5.5%) |
| 40 to 44 Years | 891 (5.2%) | 1,049 (6.2%) |
| 45 to 49 Years | 1,017 (5.9%) | 947 (5.6%) |
| 50 to 54 Years | 1,100 (6.4%) | 1,031 (6.1%) |
| 55 to 59 Years | 1,303 (7.6%) | 1,346 (7.9%) |
| 60 to 64 Years | 1,333 (7.8%) | 1,376 (8.1%) |
| 65 to 69 Years | 1,350 (7.9%) | 1,456 (8.6%) |
| 70 to 74 Years | 1,012 (5.9%) | 1,010 (5.9%) |
| 75 to 79 Years | 738 (4.3%) | 698 (4.1%) |
| 80 to 84 Years | 380 (2.2%) | 482 (2.8%) |
| 85 Years and over | 255 (1.5%) | 531 (3.1%) |
| Total | 17,083 (100.0%) | 16,989 (100.0%) |
Families and Households in Emmet County
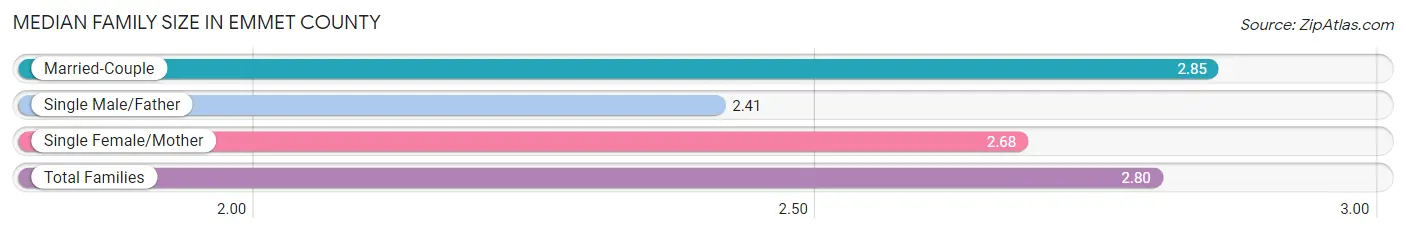
Median Family Size in Emmet County
The median family size in Emmet County is 2.80 persons per family, with married-couple families (7,923 | 81.8%) accounting for the largest median family size of 2.85 persons per family. On the other hand, single male/father families (680 | 7.0%) represent the smallest median family size with 2.41 persons per family.
| Family Type | # Families | Family Size |
| Married-Couple | 7,923 (81.8%) | 2.85 |
| Single Male/Father | 680 (7.0%) | 2.41 |
| Single Female/Mother | 1,089 (11.2%) | 2.68 |
| Total Families | 9,692 (100.0%) | 2.80 |
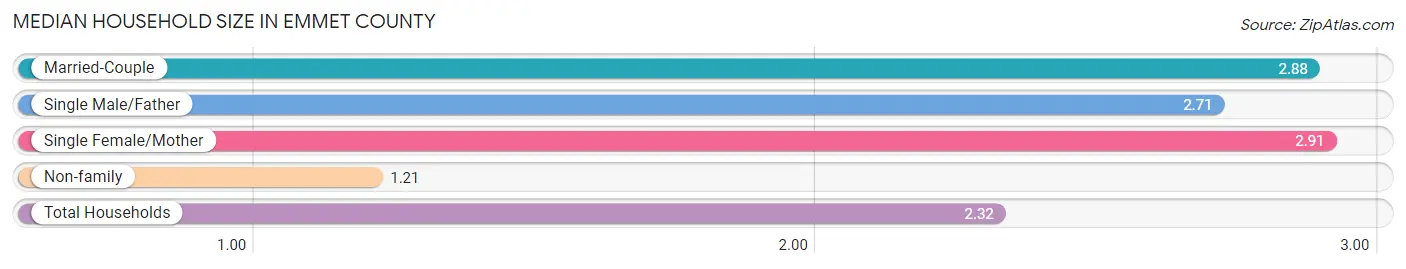
Median Household Size in Emmet County
The median household size in Emmet County is 2.32 persons per household, with single female/mother households (1,089 | 7.5%) accounting for the largest median household size of 2.91 persons per household. non-family households (4,838 | 33.3%) represent the smallest median household size with 1.21 persons per household.
| Household Type | # Households | Household Size |
| Married-Couple | 7,923 (54.5%) | 2.88 |
| Single Male/Father | 680 (4.7%) | 2.71 |
| Single Female/Mother | 1,089 (7.5%) | 2.91 |
| Non-family | 4,838 (33.3%) | 1.21 |
| Total Households | 14,530 (100.0%) | 2.32 |
Household Size by Marriage Status in Emmet County
Out of a total of 14,530 households in Emmet County, 9,692 (66.7%) are family households, while 4,838 (33.3%) are nonfamily households. The most numerous type of family households are 2-person households, comprising 5,260, and the most common type of nonfamily households are 1-person households, comprising 3,886.
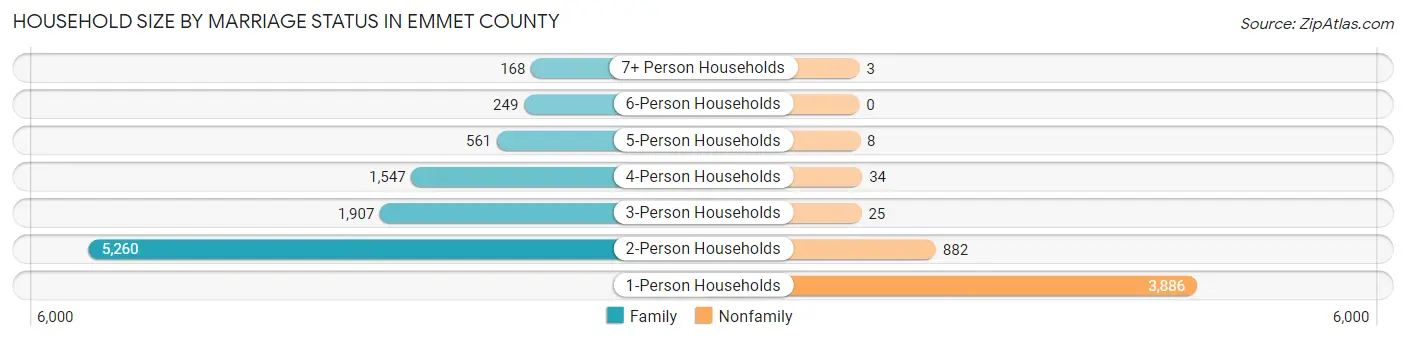
| Household Size | Family Households | Nonfamily Households |
| 1-Person Households | - | 3,886 (26.7%) |
| 2-Person Households | 5,260 (36.2%) | 882 (6.1%) |
| 3-Person Households | 1,907 (13.1%) | 25 (0.2%) |
| 4-Person Households | 1,547 (10.6%) | 34 (0.2%) |
| 5-Person Households | 561 (3.9%) | 8 (0.1%) |
| 6-Person Households | 249 (1.7%) | 0 (0.0%) |
| 7+ Person Households | 168 (1.2%) | 3 (0.0%) |
| Total | 9,692 (66.7%) | 4,838 (33.3%) |
Female Fertility in Emmet County
Fertility by Age in Emmet County
Average fertility rate in Emmet County is 39.0 births per 1,000 women. Women in the age bracket of 20 to 34 years have the highest fertility rate with 77.0 births per 1,000 women. Women in the age bracket of 20 to 34 years acount for 77.5% of all women with births.
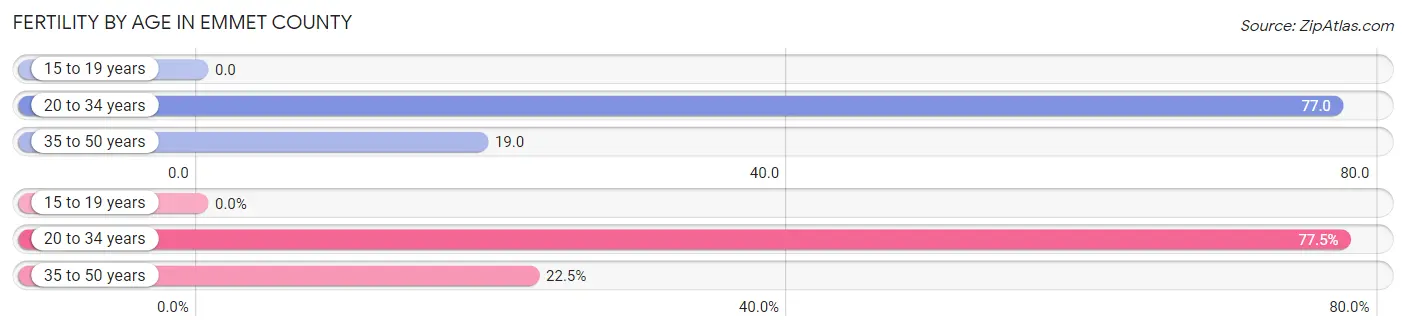
| Age Bracket | Women with Births | Births / 1,000 Women |
| 15 to 19 years | 0 (0.0%) | 0.0 |
| 20 to 34 years | 207 (77.5%) | 77.0 |
| 35 to 50 years | 60 (22.5%) | 19.0 |
| Total | 267 (100.0%) | 39.0 |
Fertility by Age by Marriage Status in Emmet County
83.1% of women with births (267) in Emmet County are married. The highest percentage of unmarried women with births falls into 20 to 34 years age bracket with 17.4% of them unmarried at the time of birth, while the lowest percentage of unmarried women with births belong to 35 to 50 years age bracket with 15.0% of them unmarried.
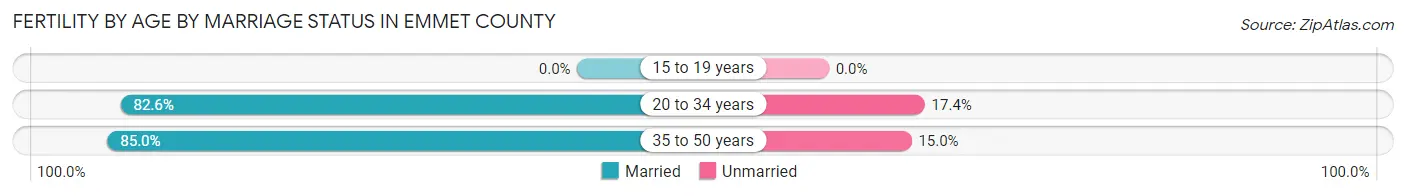
| Age Bracket | Married | Unmarried |
| 15 to 19 years | 0 (0.0%) | 0 (0.0%) |
| 20 to 34 years | 171 (82.6%) | 36 (17.4%) |
| 35 to 50 years | 51 (85.0%) | 9 (15.0%) |
| Total | 222 (83.2%) | 45 (16.9%) |
Fertility by Education in Emmet County
Average fertility rate in Emmet County is 39.0 births per 1,000 women. Women with the education attainment of high school diploma have the highest fertility rate of 93.0 births per 1,000 women, while women with the education attainment of less than high school have the lowest fertility at 9.0 births per 1,000 women. Women with the education attainment of high school diploma represent 46.1% of all women with births.
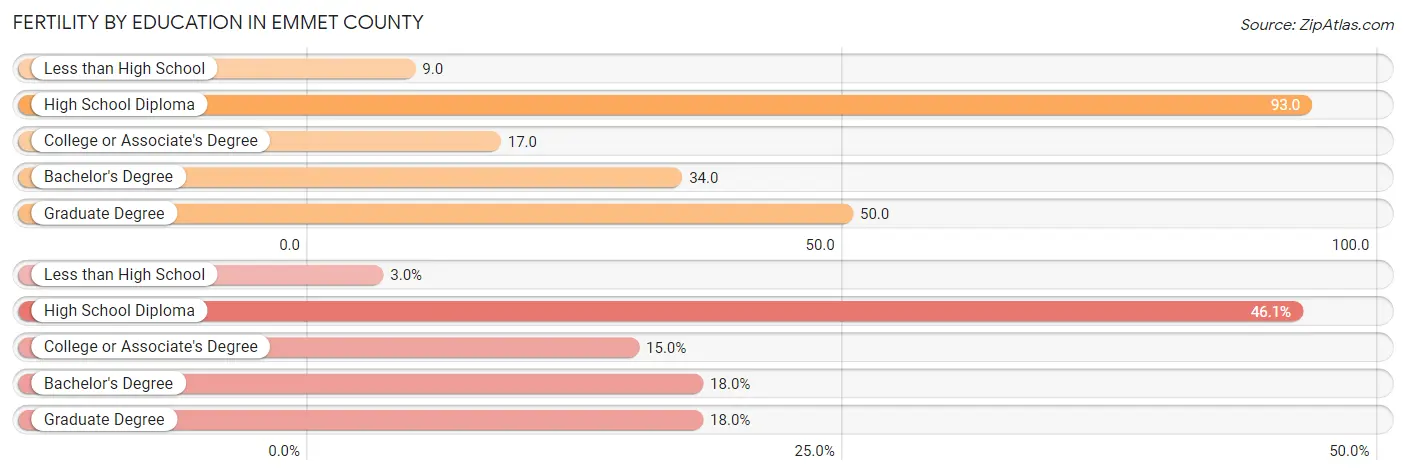
| Educational Attainment | Women with Births | Births / 1,000 Women |
| Less than High School | 8 (3.0%) | 9.0 |
| High School Diploma | 123 (46.1%) | 93.0 |
| College or Associate's Degree | 40 (15.0%) | 17.0 |
| Bachelor's Degree | 48 (18.0%) | 34.0 |
| Graduate Degree | 48 (18.0%) | 50.0 |
| Total | 267 (100.0%) | 39.0 |
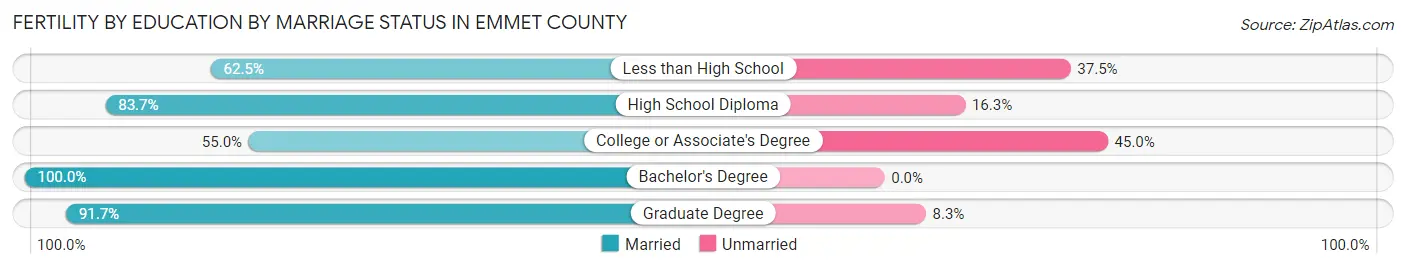
Fertility by Education by Marriage Status in Emmet County
16.9% of women with births in Emmet County are unmarried. Women with the educational attainment of bachelor's degree are most likely to be married with 100.0% of them married at childbirth, while women with the educational attainment of college or associate's degree are least likely to be married with 45.0% of them unmarried at childbirth.
| Educational Attainment | Married | Unmarried |
| Less than High School | 5 (62.5%) | 3 (37.5%) |
| High School Diploma | 103 (83.7%) | 20 (16.3%) |
| College or Associate's Degree | 22 (55.0%) | 18 (45.0%) |
| Bachelor's Degree | 48 (100.0%) | 0 (0.0%) |
| Graduate Degree | 44 (91.7%) | 4 (8.3%) |
| Total | 222 (83.2%) | 45 (16.9%) |
Employment Characteristics in Emmet County
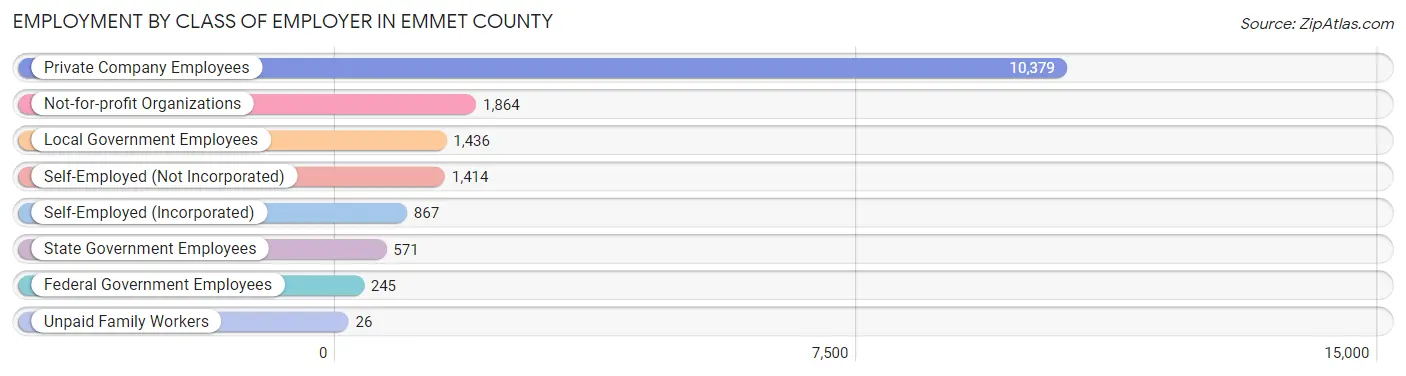
Employment by Class of Employer in Emmet County
Among the 16,802 employed individuals in Emmet County, private company employees (10,379 | 61.8%), not-for-profit organizations (1,864 | 11.1%), and local government employees (1,436 | 8.6%) make up the most common classes of employment.
| Employer Class | # Employees | % Employees |
| Private Company Employees | 10,379 | 61.8% |
| Self-Employed (Incorporated) | 867 | 5.2% |
| Self-Employed (Not Incorporated) | 1,414 | 8.4% |
| Not-for-profit Organizations | 1,864 | 11.1% |
| Local Government Employees | 1,436 | 8.6% |
| State Government Employees | 571 | 3.4% |
| Federal Government Employees | 245 | 1.5% |
| Unpaid Family Workers | 26 | 0.2% |
| Total | 16,802 | 100.0% |
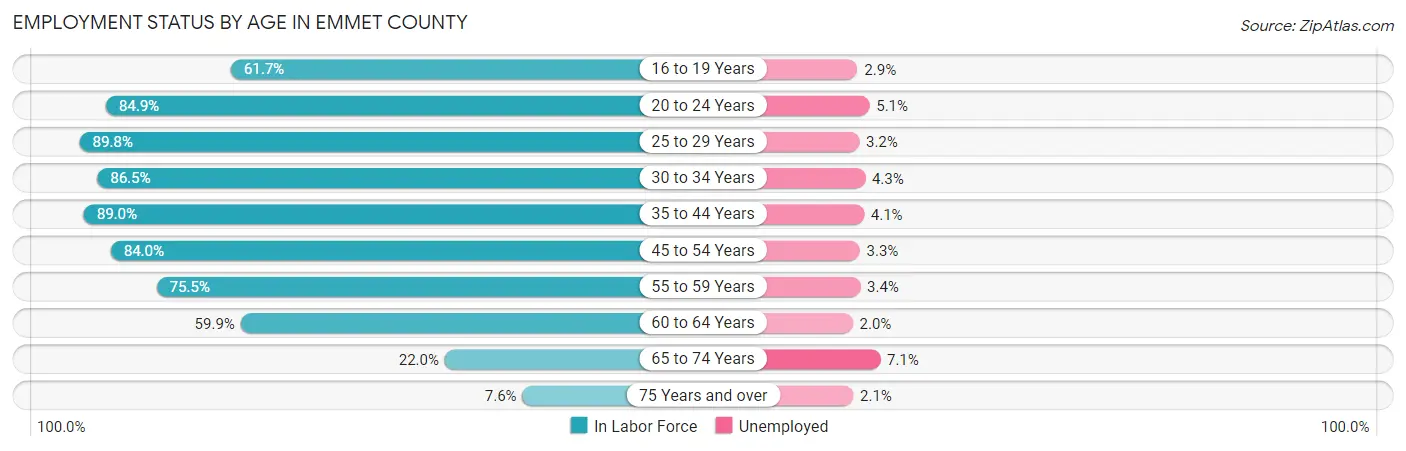
Employment Status by Age in Emmet County
According to the labor force statistics for Emmet County, out of the total population over 16 years of age (28,668), 62.3% or 17,860 individuals are in the labor force, with 3.8% or 679 of them unemployed. The age group with the highest labor force participation rate is 25 to 29 years, with 89.8% or 1,802 individuals in the labor force. Within the labor force, the 65 to 74 years age range has the highest percentage of unemployed individuals, with 7.1% or 75 of them being unemployed.
| Age Bracket | In Labor Force | Unemployed |
| 16 to 19 Years | 1,040 (61.7%) | 30 (2.9%) |
| 20 to 24 Years | 1,695 (84.9%) | 86 (5.1%) |
| 25 to 29 Years | 1,802 (89.8%) | 58 (3.2%) |
| 30 to 34 Years | 1,573 (86.5%) | 68 (4.3%) |
| 35 to 44 Years | 3,378 (89.0%) | 138 (4.1%) |
| 45 to 54 Years | 3,440 (84.0%) | 114 (3.3%) |
| 55 to 59 Years | 2,000 (75.5%) | 68 (3.4%) |
| 60 to 64 Years | 1,623 (59.9%) | 32 (2.0%) |
| 65 to 74 Years | 1,062 (22.0%) | 75 (7.1%) |
| 75 Years and over | 234 (7.6%) | 5 (2.1%) |
| Total | 17,860 (62.3%) | 679 (3.8%) |
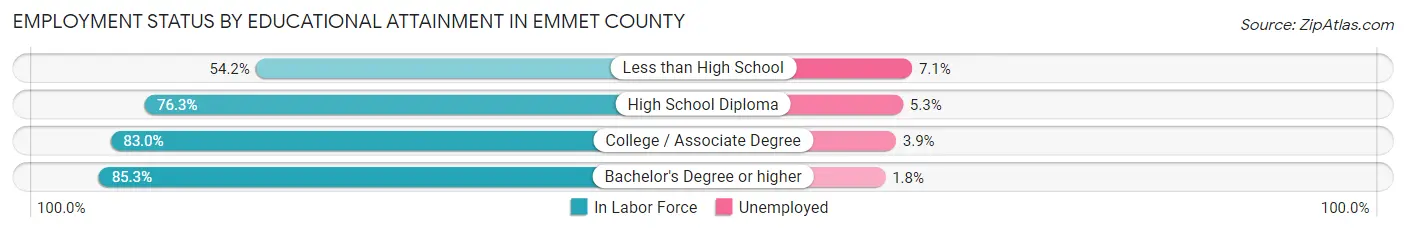
Employment Status by Educational Attainment in Emmet County
According to labor force statistics for Emmet County, 80.9% of individuals (13,813) out of the total population between 25 and 64 years of age (17,074) are in the labor force, with 3.5% or 483 of them being unemployed. The group with the highest labor force participation rate are those with the educational attainment of bachelor's degree or higher, with 85.3% or 5,504 individuals in the labor force. Within the labor force, individuals with less than high school education have the highest percentage of unemployment, with 7.1% or 28 of them being unemployed.
| Educational Attainment | In Labor Force | Unemployed |
| Less than High School | 396 (54.2%) | 52 (7.1%) |
| High School Diploma | 3,297 (76.3%) | 229 (5.3%) |
| College / Associate Degree | 4,624 (83.0%) | 217 (3.9%) |
| Bachelor's Degree or higher | 5,504 (85.3%) | 116 (1.8%) |
| Total | 13,813 (80.9%) | 598 (3.5%) |
Employment Occupations by Sex in Emmet County
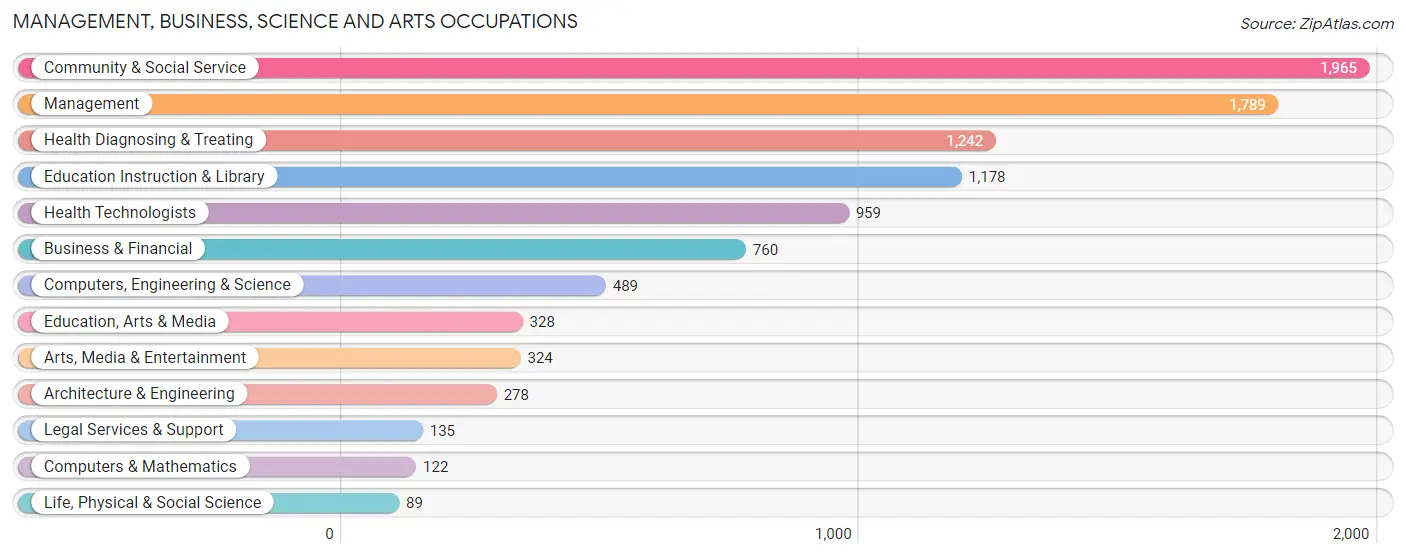
Management, Business, Science and Arts Occupations
The most common Management, Business, Science and Arts occupations in Emmet County are Community & Social Service (1,965 | 11.5%), Management (1,789 | 10.5%), Health Diagnosing & Treating (1,242 | 7.3%), Education Instruction & Library (1,178 | 6.9%), and Health Technologists (959 | 5.6%).
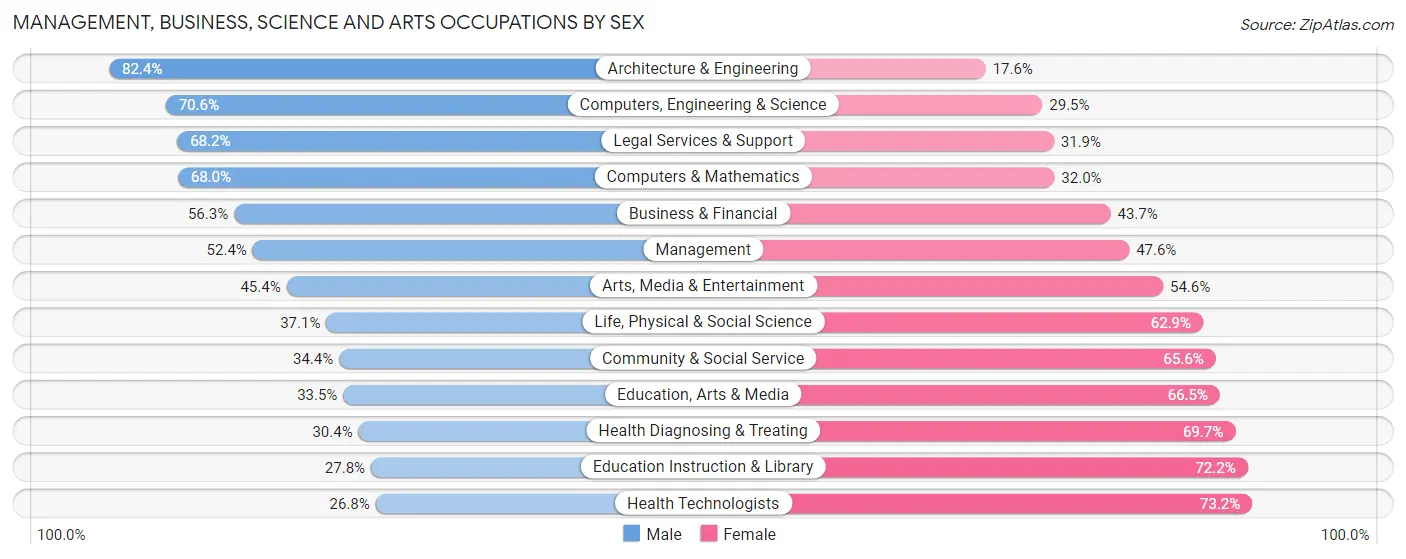
Management, Business, Science and Arts Occupations by Sex
Within the Management, Business, Science and Arts occupations in Emmet County, the most male-oriented occupations are Architecture & Engineering (82.4%), Computers, Engineering & Science (70.6%), and Legal Services & Support (68.1%), while the most female-oriented occupations are Health Technologists (73.2%), Education Instruction & Library (72.2%), and Health Diagnosing & Treating (69.7%).
| Occupation | Male | Female |
| Management | 938 (52.4%) | 851 (47.6%) |
| Business & Financial | 428 (56.3%) | 332 (43.7%) |
| Computers, Engineering & Science | 345 (70.6%) | 144 (29.4%) |
| Computers & Mathematics | 83 (68.0%) | 39 (32.0%) |
| Architecture & Engineering | 229 (82.4%) | 49 (17.6%) |
| Life, Physical & Social Science | 33 (37.1%) | 56 (62.9%) |
| Community & Social Service | 676 (34.4%) | 1,289 (65.6%) |
| Education, Arts & Media | 110 (33.5%) | 218 (66.5%) |
| Legal Services & Support | 92 (68.1%) | 43 (31.9%) |
| Education Instruction & Library | 327 (27.8%) | 851 (72.2%) |
| Arts, Media & Entertainment | 147 (45.4%) | 177 (54.6%) |
| Health Diagnosing & Treating | 377 (30.3%) | 865 (69.7%) |
| Health Technologists | 257 (26.8%) | 702 (73.2%) |
| Total (Category) | 2,764 (44.3%) | 3,481 (55.7%) |
| Total (Overall) | 9,110 (53.3%) | 7,965 (46.7%) |
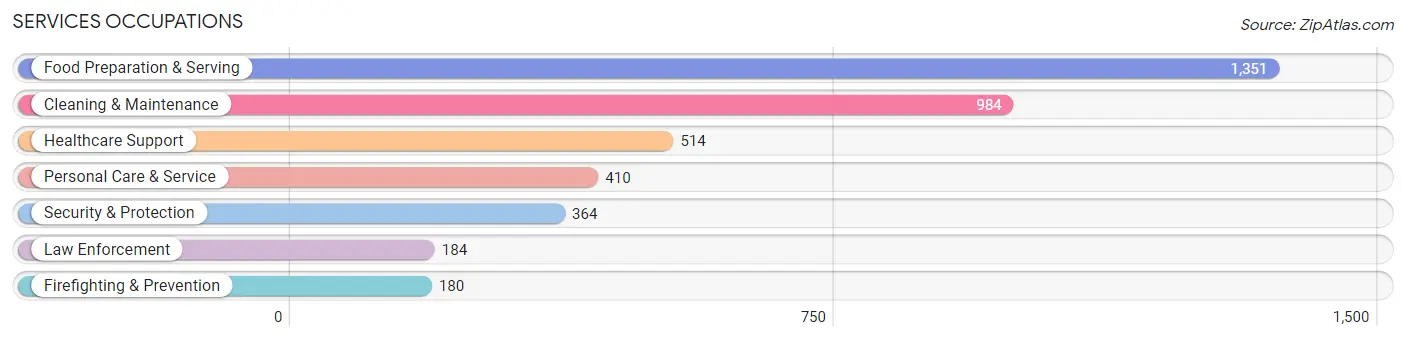
Services Occupations
The most common Services occupations in Emmet County are Food Preparation & Serving (1,351 | 7.9%), Cleaning & Maintenance (984 | 5.8%), Healthcare Support (514 | 3.0%), Personal Care & Service (410 | 2.4%), and Security & Protection (364 | 2.1%).
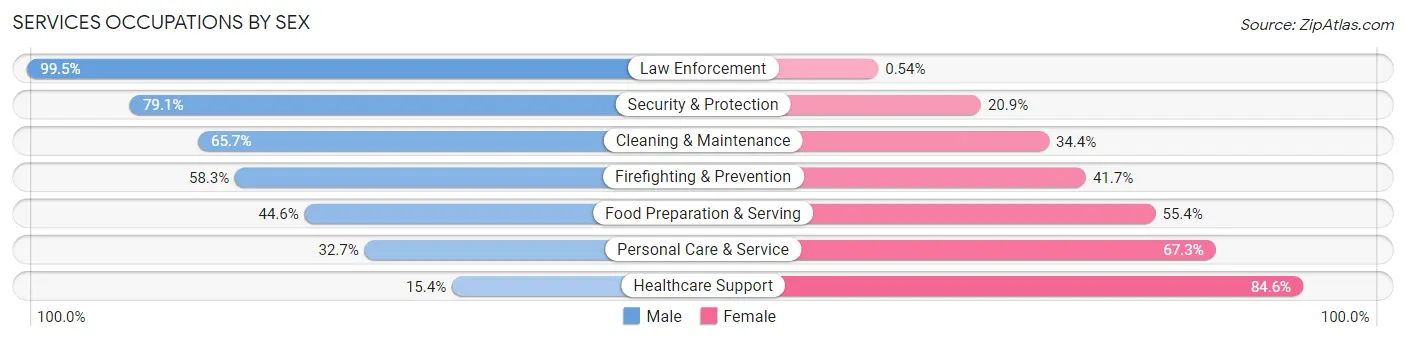
Services Occupations by Sex
Within the Services occupations in Emmet County, the most male-oriented occupations are Law Enforcement (99.5%), Security & Protection (79.1%), and Cleaning & Maintenance (65.6%), while the most female-oriented occupations are Healthcare Support (84.6%), Personal Care & Service (67.3%), and Food Preparation & Serving (55.4%).
| Occupation | Male | Female |
| Healthcare Support | 79 (15.4%) | 435 (84.6%) |
| Security & Protection | 288 (79.1%) | 76 (20.9%) |
| Firefighting & Prevention | 105 (58.3%) | 75 (41.7%) |
| Law Enforcement | 183 (99.5%) | 1 (0.5%) |
| Food Preparation & Serving | 602 (44.6%) | 749 (55.4%) |
| Cleaning & Maintenance | 646 (65.6%) | 338 (34.4%) |
| Personal Care & Service | 134 (32.7%) | 276 (67.3%) |
| Total (Category) | 1,749 (48.3%) | 1,874 (51.7%) |
| Total (Overall) | 9,110 (53.3%) | 7,965 (46.7%) |
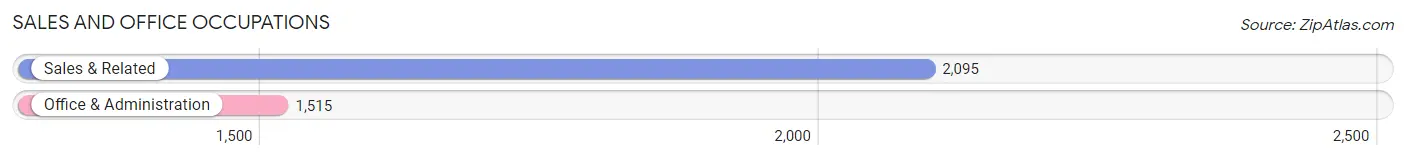
Sales and Office Occupations
The most common Sales and Office occupations in Emmet County are Sales & Related (2,095 | 12.3%), and Office & Administration (1,515 | 8.9%).
Sales and Office Occupations by Sex
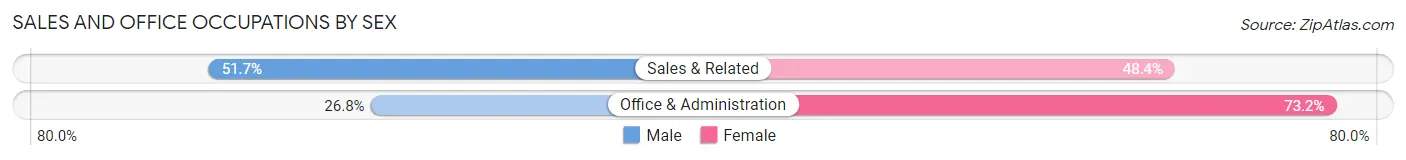
| Occupation | Male | Female |
| Sales & Related | 1,082 (51.6%) | 1,013 (48.3%) |
| Office & Administration | 406 (26.8%) | 1,109 (73.2%) |
| Total (Category) | 1,488 (41.2%) | 2,122 (58.8%) |
| Total (Overall) | 9,110 (53.3%) | 7,965 (46.7%) |
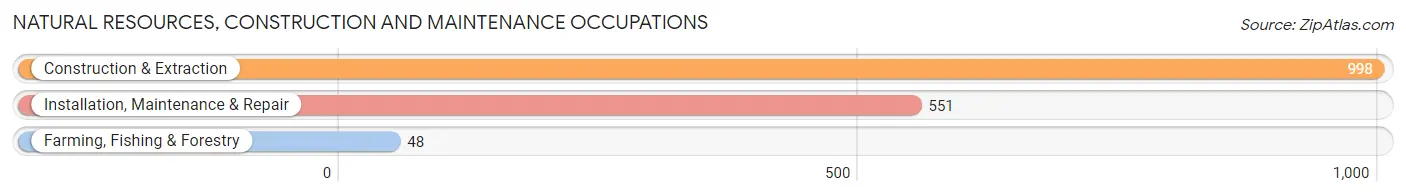
Natural Resources, Construction and Maintenance Occupations
The most common Natural Resources, Construction and Maintenance occupations in Emmet County are Construction & Extraction (998 | 5.8%), Installation, Maintenance & Repair (551 | 3.2%), and Farming, Fishing & Forestry (48 | 0.3%).
Natural Resources, Construction and Maintenance Occupations by Sex
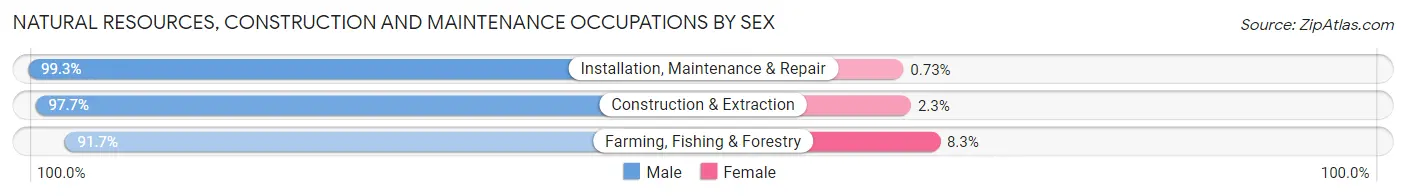
| Occupation | Male | Female |
| Farming, Fishing & Forestry | 44 (91.7%) | 4 (8.3%) |
| Construction & Extraction | 975 (97.7%) | 23 (2.3%) |
| Installation, Maintenance & Repair | 547 (99.3%) | 4 (0.7%) |
| Total (Category) | 1,566 (98.1%) | 31 (1.9%) |
| Total (Overall) | 9,110 (53.3%) | 7,965 (46.7%) |
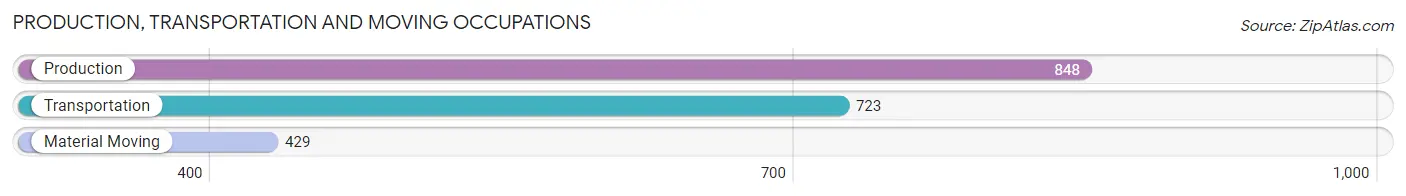
Production, Transportation and Moving Occupations
The most common Production, Transportation and Moving occupations in Emmet County are Production (848 | 5.0%), Transportation (723 | 4.2%), and Material Moving (429 | 2.5%).
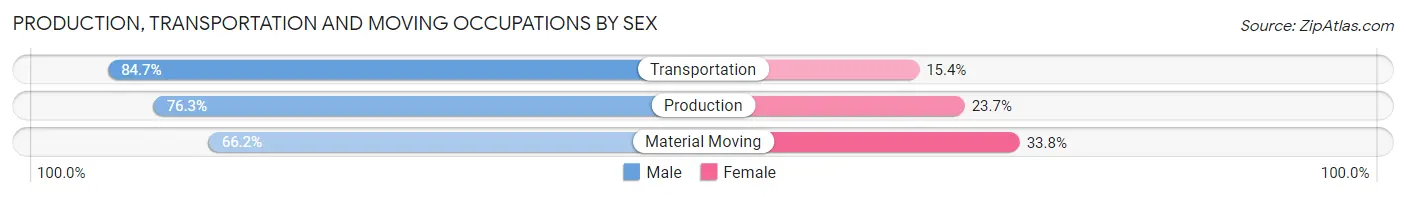
Production, Transportation and Moving Occupations by Sex
| Occupation | Male | Female |
| Production | 647 (76.3%) | 201 (23.7%) |
| Transportation | 612 (84.7%) | 111 (15.3%) |
| Material Moving | 284 (66.2%) | 145 (33.8%) |
| Total (Category) | 1,543 (77.1%) | 457 (22.9%) |
| Total (Overall) | 9,110 (53.3%) | 7,965 (46.7%) |
Employment Industries by Sex in Emmet County
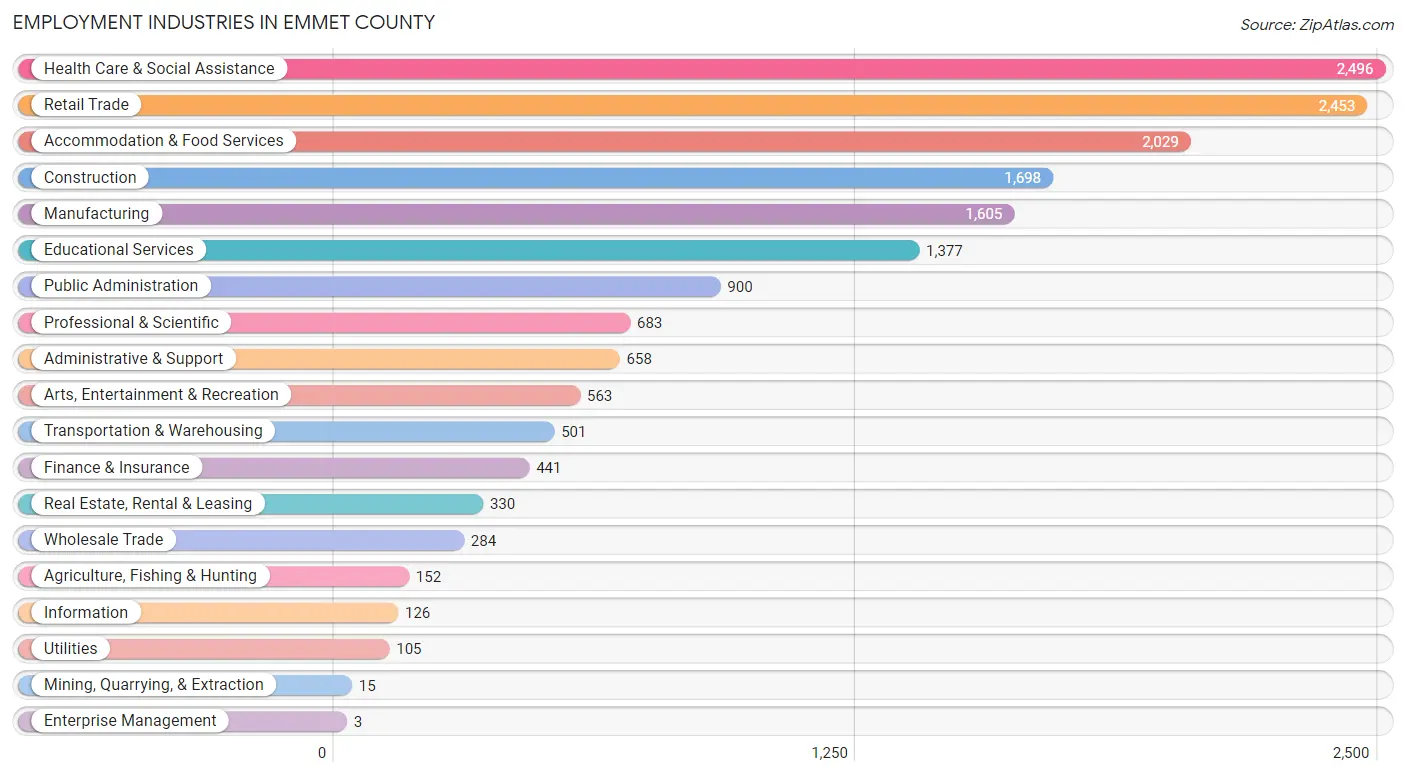
Employment Industries in Emmet County
The major employment industries in Emmet County include Health Care & Social Assistance (2,496 | 14.6%), Retail Trade (2,453 | 14.4%), Accommodation & Food Services (2,029 | 11.9%), Construction (1,698 | 9.9%), and Manufacturing (1,605 | 9.4%).
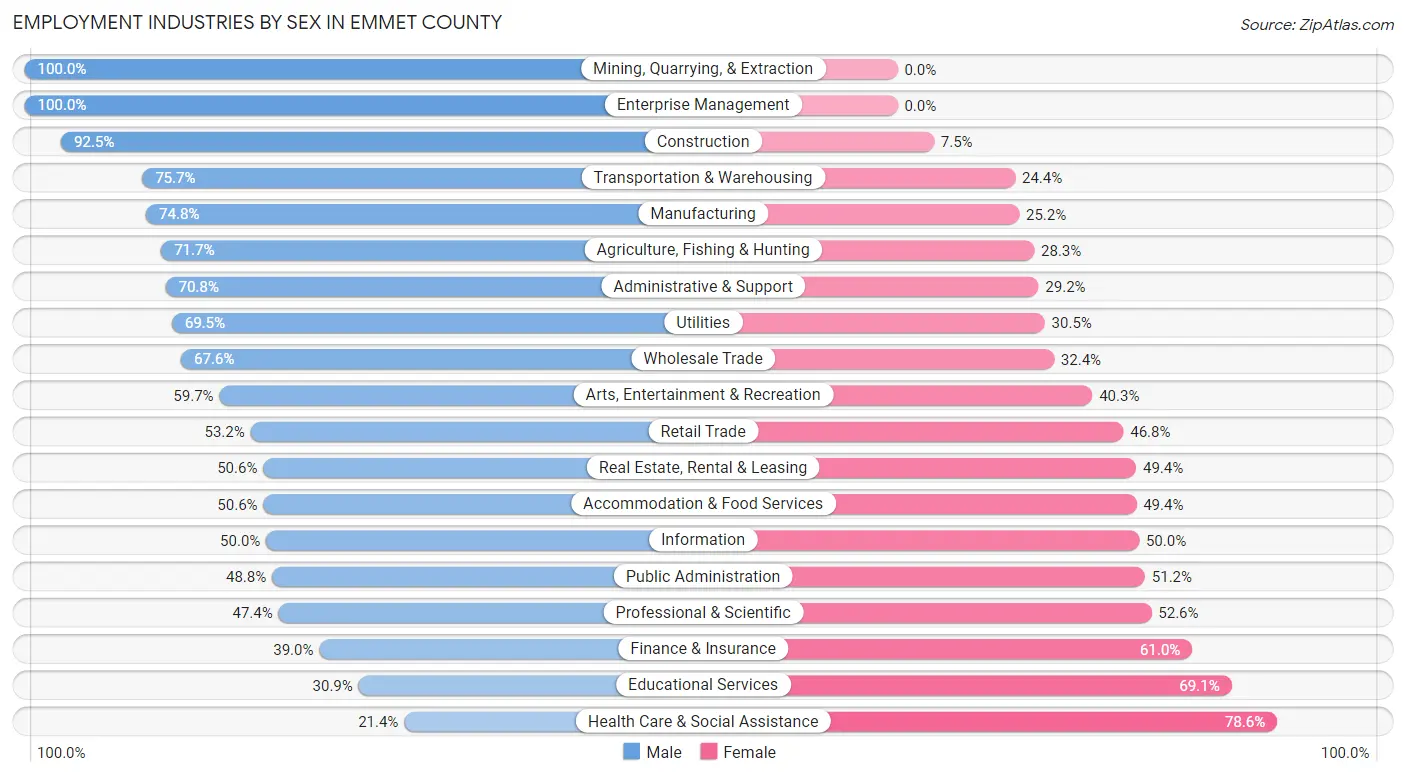
Employment Industries by Sex in Emmet County
The Emmet County industries that see more men than women are Mining, Quarrying, & Extraction (100.0%), Enterprise Management (100.0%), and Construction (92.5%), whereas the industries that tend to have a higher number of women are Health Care & Social Assistance (78.6%), Educational Services (69.1%), and Finance & Insurance (61.0%).
| Industry | Male | Female |
| Agriculture, Fishing & Hunting | 109 (71.7%) | 43 (28.3%) |
| Mining, Quarrying, & Extraction | 15 (100.0%) | 0 (0.0%) |
| Construction | 1,570 (92.5%) | 128 (7.5%) |
| Manufacturing | 1,201 (74.8%) | 404 (25.2%) |
| Wholesale Trade | 192 (67.6%) | 92 (32.4%) |
| Retail Trade | 1,306 (53.2%) | 1,147 (46.8%) |
| Transportation & Warehousing | 379 (75.6%) | 122 (24.3%) |
| Utilities | 73 (69.5%) | 32 (30.5%) |
| Information | 63 (50.0%) | 63 (50.0%) |
| Finance & Insurance | 172 (39.0%) | 269 (61.0%) |
| Real Estate, Rental & Leasing | 167 (50.6%) | 163 (49.4%) |
| Professional & Scientific | 324 (47.4%) | 359 (52.6%) |
| Enterprise Management | 3 (100.0%) | 0 (0.0%) |
| Administrative & Support | 466 (70.8%) | 192 (29.2%) |
| Educational Services | 425 (30.9%) | 952 (69.1%) |
| Health Care & Social Assistance | 535 (21.4%) | 1,961 (78.6%) |
| Arts, Entertainment & Recreation | 336 (59.7%) | 227 (40.3%) |
| Accommodation & Food Services | 1,026 (50.6%) | 1,003 (49.4%) |
| Public Administration | 439 (48.8%) | 461 (51.2%) |
| Total | 9,110 (53.3%) | 7,965 (46.7%) |
Education in Emmet County
School Enrollment in Emmet County
The most common levels of schooling among the 6,446 students in Emmet County are high school (1,741 | 27.0%), middle school (1,367 | 21.2%), and elementary school (1,357 | 21.0%).
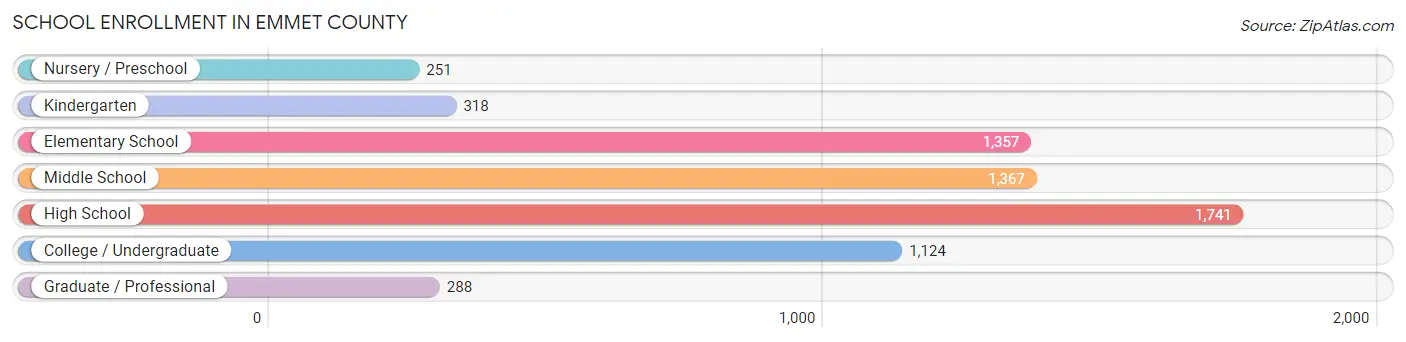
| School Level | # Students | % Students |
| Nursery / Preschool | 251 | 3.9% |
| Kindergarten | 318 | 4.9% |
| Elementary School | 1,357 | 21.0% |
| Middle School | 1,367 | 21.2% |
| High School | 1,741 | 27.0% |
| College / Undergraduate | 1,124 | 17.4% |
| Graduate / Professional | 288 | 4.5% |
| Total | 6,446 | 100.0% |
School Enrollment by Age by Funding Source in Emmet County
Out of a total of 6,446 students who are enrolled in schools in Emmet County, 799 (12.4%) attend a private institution, while the remaining 5,647 (87.6%) are enrolled in public schools. The age group of 25 to 34 year olds has the highest likelihood of being enrolled in private schools, with 60 (21.7% in the age bracket) enrolled. Conversely, the age group of 35 years and over has the lowest likelihood of being enrolled in a private school, with 290 (96.4% in the age bracket) attending a public institution.
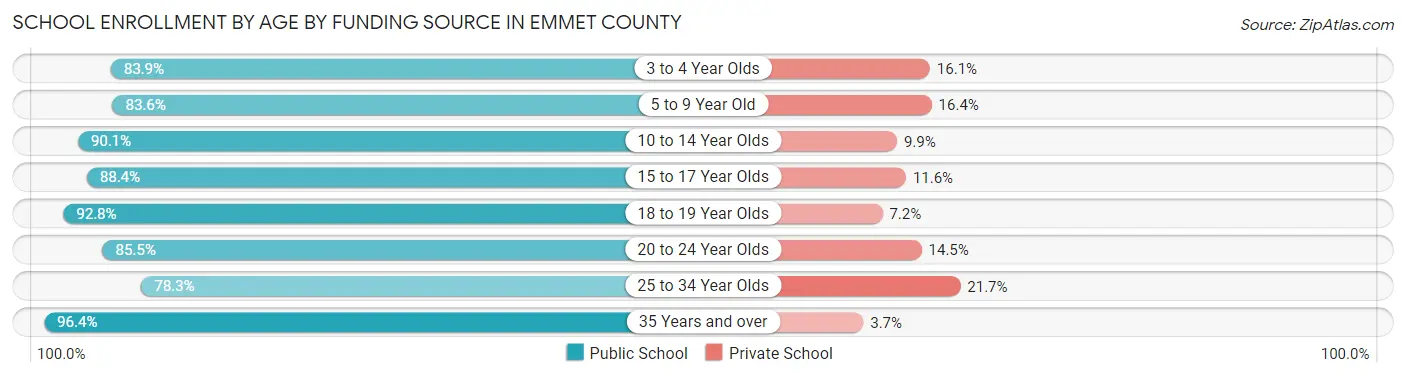
| Age Bracket | Public School | Private School |
| 3 to 4 Year Olds | 162 (83.9%) | 31 (16.1%) |
| 5 to 9 Year Old | 1,270 (83.6%) | 249 (16.4%) |
| 10 to 14 Year Olds | 1,588 (90.1%) | 175 (9.9%) |
| 15 to 17 Year Olds | 1,128 (88.4%) | 148 (11.6%) |
| 18 to 19 Year Olds | 475 (92.8%) | 37 (7.2%) |
| 20 to 24 Year Olds | 518 (85.5%) | 88 (14.5%) |
| 25 to 34 Year Olds | 216 (78.3%) | 60 (21.7%) |
| 35 Years and over | 290 (96.4%) | 11 (3.6%) |
| Total | 5,647 (87.6%) | 799 (12.4%) |
Educational Attainment by Field of Study in Emmet County
Business (2,117 | 20.3%), education (1,966 | 18.9%), science & technology (1,186 | 11.4%), social sciences (776 | 7.4%), and bio, nature & agricultural (756 | 7.2%) are the most common fields of study among 10,428 individuals in Emmet County who have obtained a bachelor's degree or higher.
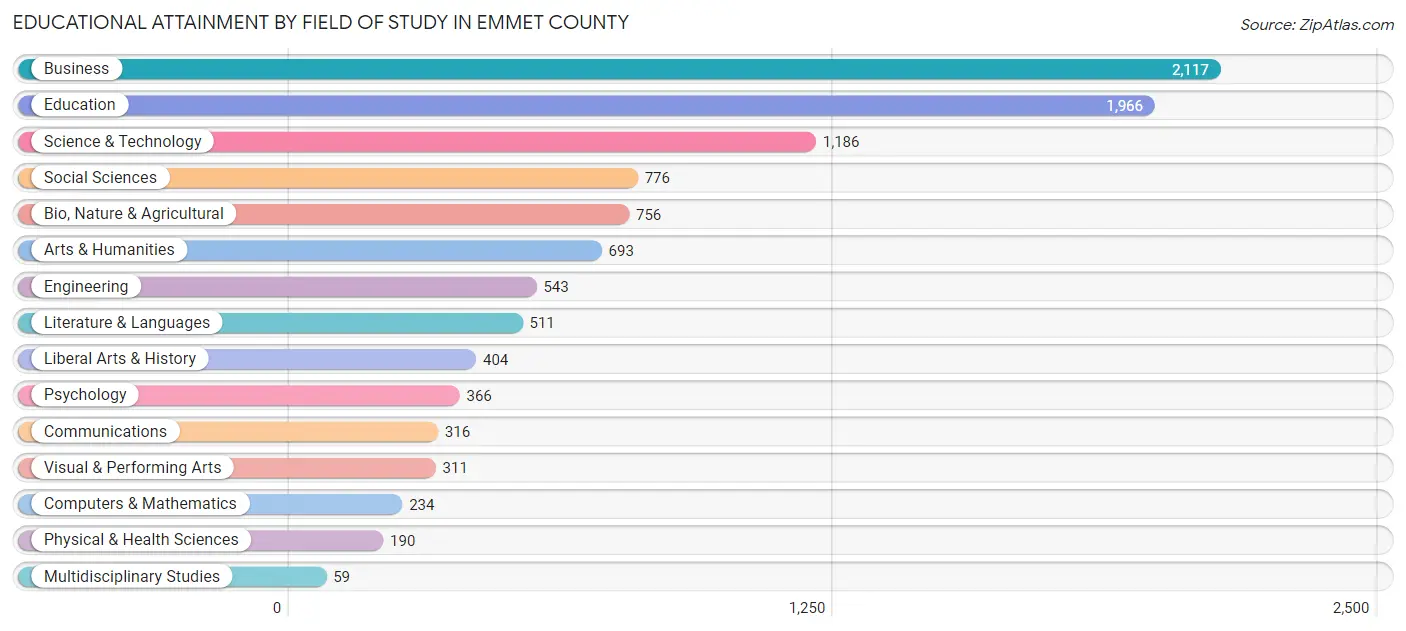
| Field of Study | # Graduates | % Graduates |
| Computers & Mathematics | 234 | 2.2% |
| Bio, Nature & Agricultural | 756 | 7.2% |
| Physical & Health Sciences | 190 | 1.8% |
| Psychology | 366 | 3.5% |
| Social Sciences | 776 | 7.4% |
| Engineering | 543 | 5.2% |
| Multidisciplinary Studies | 59 | 0.6% |
| Science & Technology | 1,186 | 11.4% |
| Business | 2,117 | 20.3% |
| Education | 1,966 | 18.9% |
| Literature & Languages | 511 | 4.9% |
| Liberal Arts & History | 404 | 3.9% |
| Visual & Performing Arts | 311 | 3.0% |
| Communications | 316 | 3.0% |
| Arts & Humanities | 693 | 6.7% |
| Total | 10,428 | 100.0% |
Transportation & Commute in Emmet County
Vehicle Availability by Sex in Emmet County
The most prevalent vehicle ownership categories in Emmet County are males with 2 vehicles (3,975, accounting for 44.1%) and females with 2 vehicles (3,319, making up 51.6%).
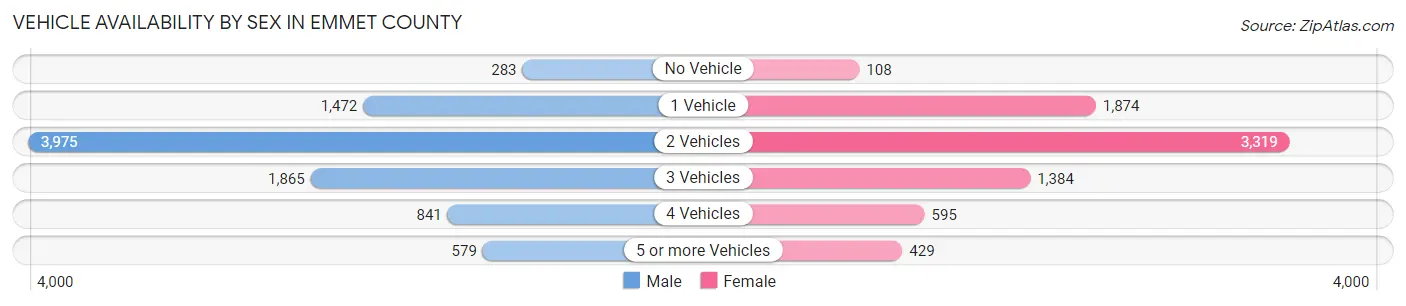
| Vehicles Available | Male | Female |
| No Vehicle | 283 (3.1%) | 108 (1.4%) |
| 1 Vehicle | 1,472 (16.3%) | 1,874 (24.3%) |
| 2 Vehicles | 3,975 (44.1%) | 3,319 (43.0%) |
| 3 Vehicles | 1,865 (20.7%) | 1,384 (17.9%) |
| 4 Vehicles | 841 (9.3%) | 595 (7.7%) |
| 5 or more Vehicles | 579 (6.4%) | 429 (5.6%) |
| Total | 9,015 (100.0%) | 7,709 (100.0%) |
Commute Time in Emmet County
The most frequently occuring commute durations in Emmet County are 5 to 9 minutes (2,960 commuters, 19.1%), 15 to 19 minutes (2,533 commuters, 16.3%), and 10 to 14 minutes (2,425 commuters, 15.6%).
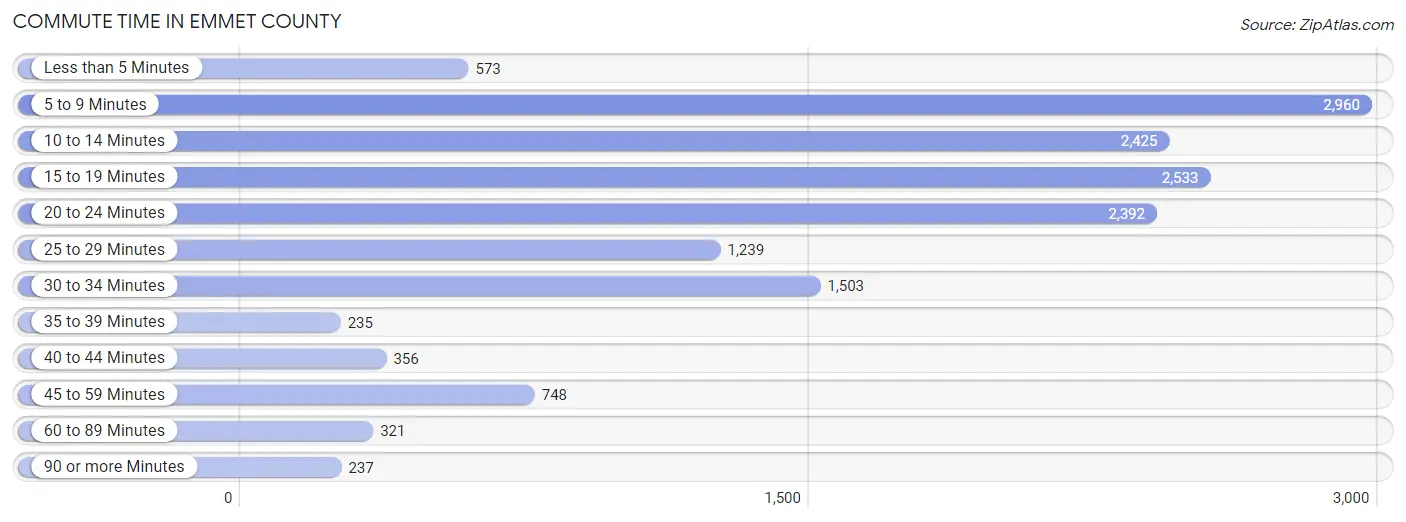
| Commute Time | # Commuters | % Commuters |
| Less than 5 Minutes | 573 | 3.7% |
| 5 to 9 Minutes | 2,960 | 19.1% |
| 10 to 14 Minutes | 2,425 | 15.6% |
| 15 to 19 Minutes | 2,533 | 16.3% |
| 20 to 24 Minutes | 2,392 | 15.4% |
| 25 to 29 Minutes | 1,239 | 8.0% |
| 30 to 34 Minutes | 1,503 | 9.7% |
| 35 to 39 Minutes | 235 | 1.5% |
| 40 to 44 Minutes | 356 | 2.3% |
| 45 to 59 Minutes | 748 | 4.8% |
| 60 to 89 Minutes | 321 | 2.1% |
| 90 or more Minutes | 237 | 1.5% |
Commute Time by Sex in Emmet County
The most common commute times in Emmet County are 5 to 9 minutes (1,422 commuters, 17.0%) for males and 5 to 9 minutes (1,538 commuters, 21.5%) for females.
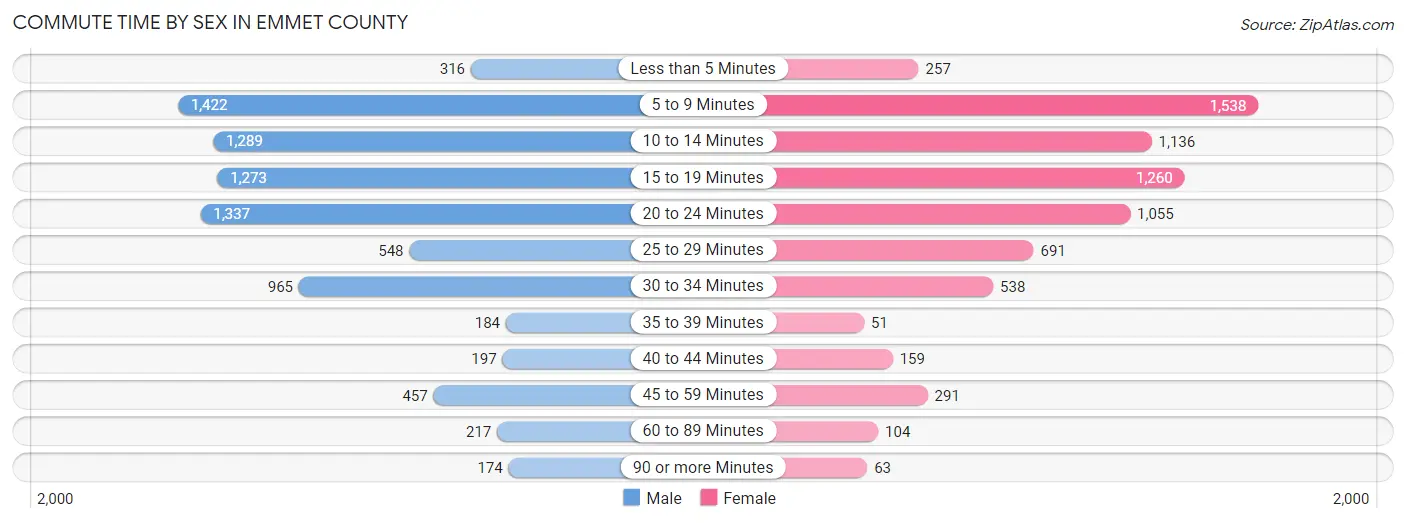
| Commute Time | Male | Female |
| Less than 5 Minutes | 316 (3.8%) | 257 (3.6%) |
| 5 to 9 Minutes | 1,422 (17.0%) | 1,538 (21.5%) |
| 10 to 14 Minutes | 1,289 (15.4%) | 1,136 (15.9%) |
| 15 to 19 Minutes | 1,273 (15.2%) | 1,260 (17.6%) |
| 20 to 24 Minutes | 1,337 (16.0%) | 1,055 (14.8%) |
| 25 to 29 Minutes | 548 (6.5%) | 691 (9.7%) |
| 30 to 34 Minutes | 965 (11.5%) | 538 (7.5%) |
| 35 to 39 Minutes | 184 (2.2%) | 51 (0.7%) |
| 40 to 44 Minutes | 197 (2.4%) | 159 (2.2%) |
| 45 to 59 Minutes | 457 (5.4%) | 291 (4.1%) |
| 60 to 89 Minutes | 217 (2.6%) | 104 (1.5%) |
| 90 or more Minutes | 174 (2.1%) | 63 (0.9%) |
Time of Departure to Work by Sex in Emmet County
The most frequent times of departure to work in Emmet County are 7:30 AM to 7:59 AM (1,414, 16.9%) for males and 7:30 AM to 7:59 AM (1,484, 20.8%) for females.
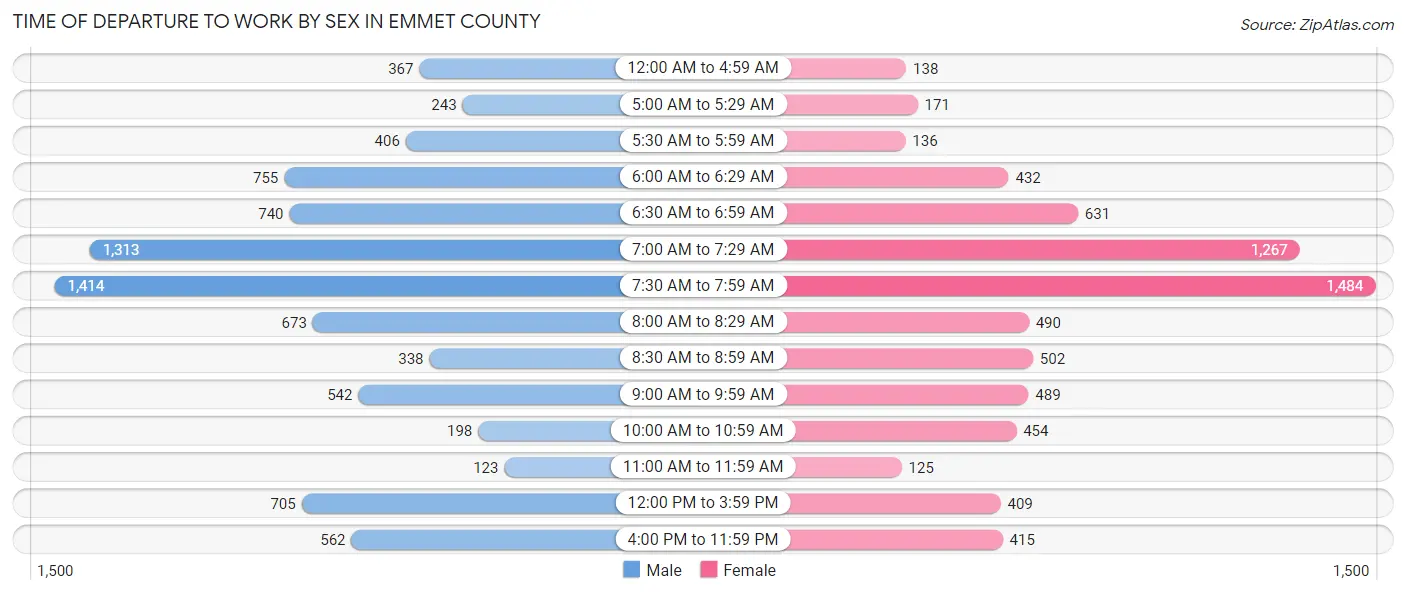
| Time of Departure | Male | Female |
| 12:00 AM to 4:59 AM | 367 (4.4%) | 138 (1.9%) |
| 5:00 AM to 5:29 AM | 243 (2.9%) | 171 (2.4%) |
| 5:30 AM to 5:59 AM | 406 (4.9%) | 136 (1.9%) |
| 6:00 AM to 6:29 AM | 755 (9.0%) | 432 (6.0%) |
| 6:30 AM to 6:59 AM | 740 (8.8%) | 631 (8.8%) |
| 7:00 AM to 7:29 AM | 1,313 (15.7%) | 1,267 (17.7%) |
| 7:30 AM to 7:59 AM | 1,414 (16.9%) | 1,484 (20.8%) |
| 8:00 AM to 8:29 AM | 673 (8.0%) | 490 (6.9%) |
| 8:30 AM to 8:59 AM | 338 (4.0%) | 502 (7.0%) |
| 9:00 AM to 9:59 AM | 542 (6.5%) | 489 (6.9%) |
| 10:00 AM to 10:59 AM | 198 (2.4%) | 454 (6.4%) |
| 11:00 AM to 11:59 AM | 123 (1.5%) | 125 (1.8%) |
| 12:00 PM to 3:59 PM | 705 (8.4%) | 409 (5.7%) |
| 4:00 PM to 11:59 PM | 562 (6.7%) | 415 (5.8%) |
| Total | 8,379 (100.0%) | 7,143 (100.0%) |
Housing Occupancy in Emmet County
Occupancy by Ownership in Emmet County
Of the total 14,530 dwellings in Emmet County, owner-occupied units account for 11,039 (76.0%), while renter-occupied units make up 3,491 (24.0%).
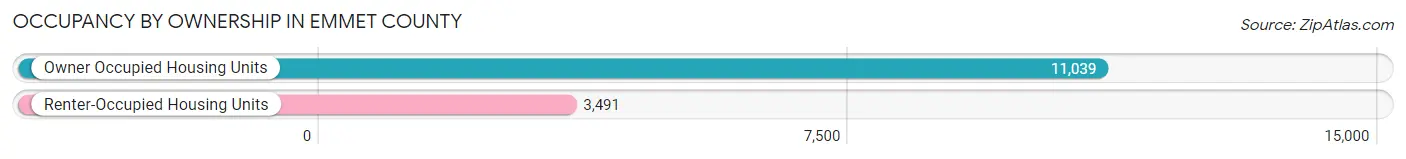
| Occupancy | # Housing Units | % Housing Units |
| Owner Occupied Housing Units | 11,039 | 76.0% |
| Renter-Occupied Housing Units | 3,491 | 24.0% |
| Total Occupied Housing Units | 14,530 | 100.0% |
Occupancy by Household Size in Emmet County
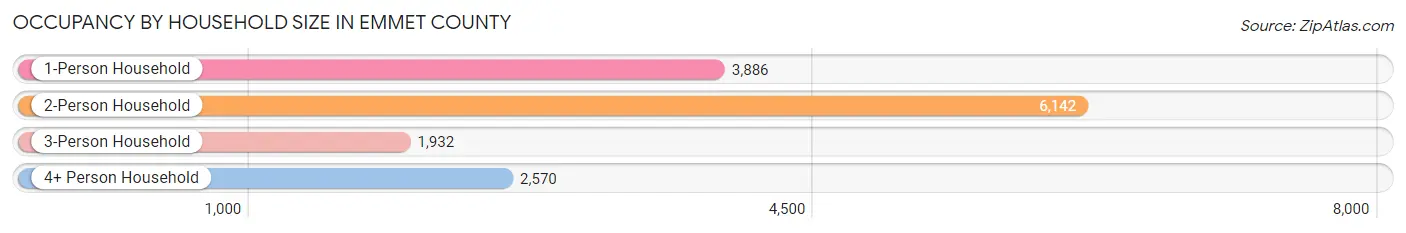
| Household Size | # Housing Units | % Housing Units |
| 1-Person Household | 3,886 | 26.7% |
| 2-Person Household | 6,142 | 42.3% |
| 3-Person Household | 1,932 | 13.3% |
| 4+ Person Household | 2,570 | 17.7% |
| Total Housing Units | 14,530 | 100.0% |
Occupancy by Ownership by Household Size in Emmet County
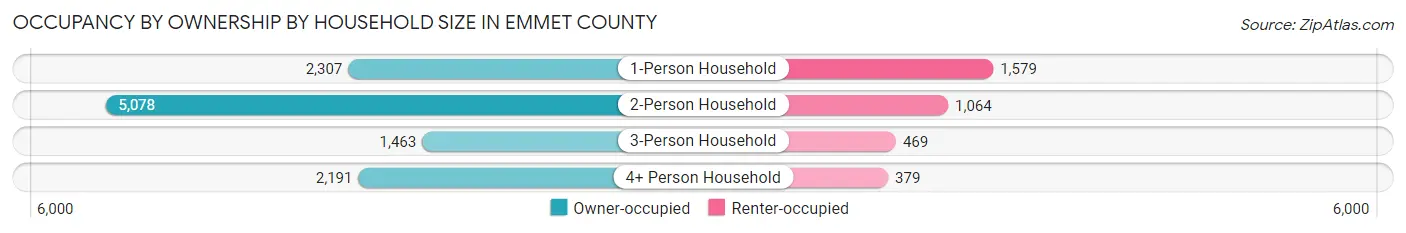
| Household Size | Owner-occupied | Renter-occupied |
| 1-Person Household | 2,307 (59.4%) | 1,579 (40.6%) |
| 2-Person Household | 5,078 (82.7%) | 1,064 (17.3%) |
| 3-Person Household | 1,463 (75.7%) | 469 (24.3%) |
| 4+ Person Household | 2,191 (85.3%) | 379 (14.7%) |
| Total Housing Units | 11,039 (76.0%) | 3,491 (24.0%) |
Occupancy by Educational Attainment in Emmet County
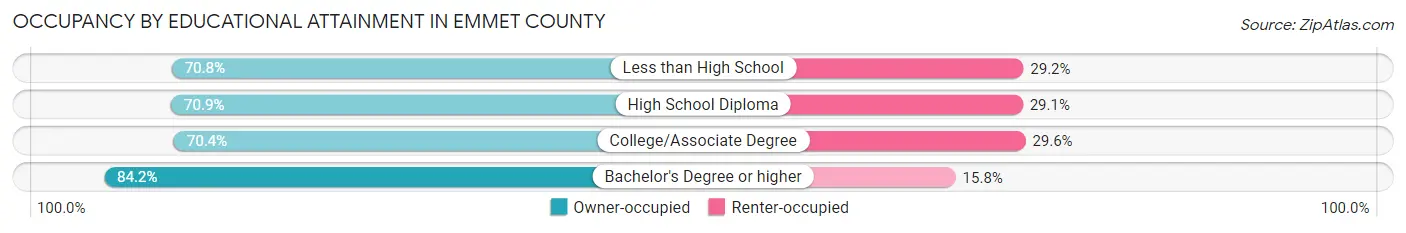
| Household Size | Owner-occupied | Renter-occupied |
| Less than High School | 364 (70.8%) | 150 (29.2%) |
| High School Diploma | 2,361 (70.9%) | 967 (29.1%) |
| College/Associate Degree | 3,505 (70.4%) | 1,474 (29.6%) |
| Bachelor's Degree or higher | 4,809 (84.2%) | 900 (15.8%) |
Occupancy by Age of Householder in Emmet County
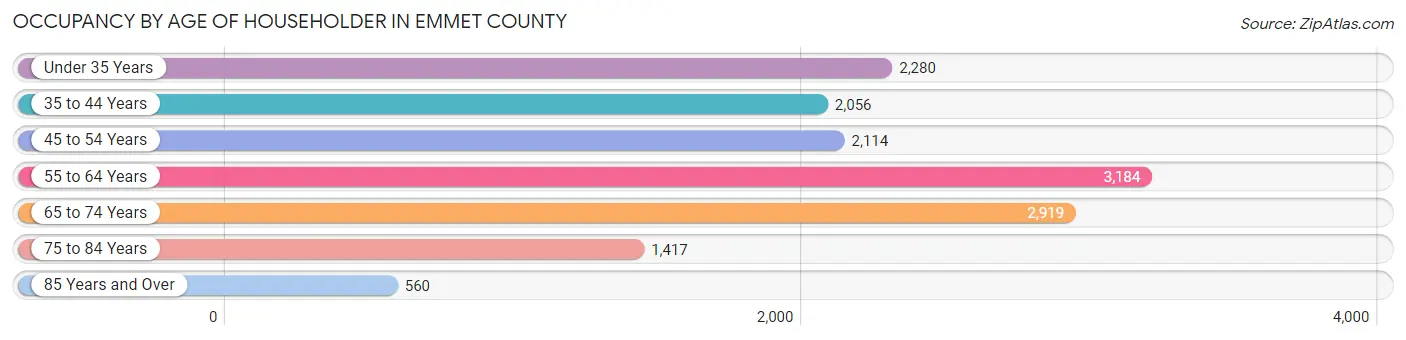
| Age Bracket | # Households | % Households |
| Under 35 Years | 2,280 | 15.7% |
| 35 to 44 Years | 2,056 | 14.1% |
| 45 to 54 Years | 2,114 | 14.5% |
| 55 to 64 Years | 3,184 | 21.9% |
| 65 to 74 Years | 2,919 | 20.1% |
| 75 to 84 Years | 1,417 | 9.8% |
| 85 Years and Over | 560 | 3.8% |
| Total | 14,530 | 100.0% |
Housing Finances in Emmet County
Median Income by Occupancy in Emmet County
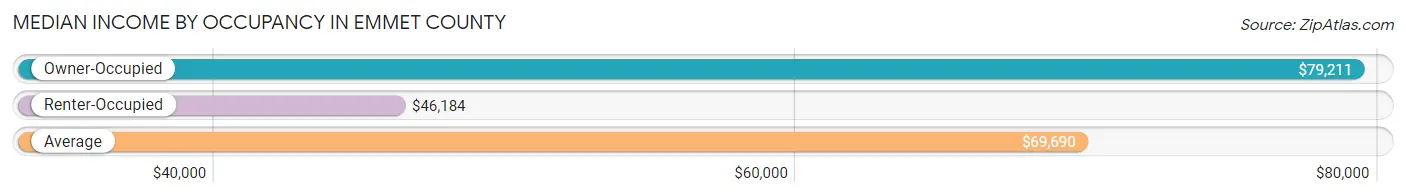
| Occupancy Type | # Households | Median Income |
| Owner-Occupied | 11,039 (76.0%) | $79,211 |
| Renter-Occupied | 3,491 (24.0%) | $46,184 |
| Average | 14,530 (100.0%) | $69,690 |
Occupancy by Householder Income Bracket in Emmet County
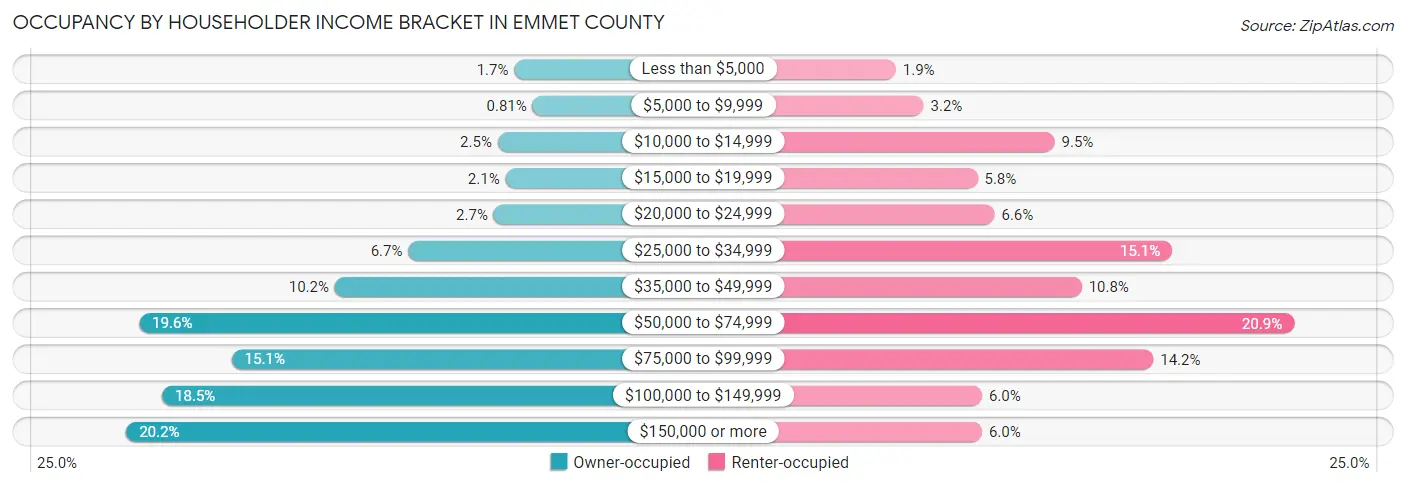
| Income Bracket | Owner-occupied | Renter-occupied |
| Less than $5,000 | 186 (1.7%) | 67 (1.9%) |
| $5,000 to $9,999 | 89 (0.8%) | 113 (3.2%) |
| $10,000 to $14,999 | 273 (2.5%) | 331 (9.5%) |
| $15,000 to $19,999 | 232 (2.1%) | 203 (5.8%) |
| $20,000 to $24,999 | 294 (2.7%) | 231 (6.6%) |
| $25,000 to $34,999 | 743 (6.7%) | 526 (15.1%) |
| $35,000 to $49,999 | 1,129 (10.2%) | 376 (10.8%) |
| $50,000 to $74,999 | 2,158 (19.6%) | 729 (20.9%) |
| $75,000 to $99,999 | 1,671 (15.1%) | 495 (14.2%) |
| $100,000 to $149,999 | 2,038 (18.5%) | 210 (6.0%) |
| $150,000 or more | 2,226 (20.2%) | 210 (6.0%) |
| Total | 11,039 (100.0%) | 3,491 (100.0%) |
Monthly Housing Cost Tiers in Emmet County
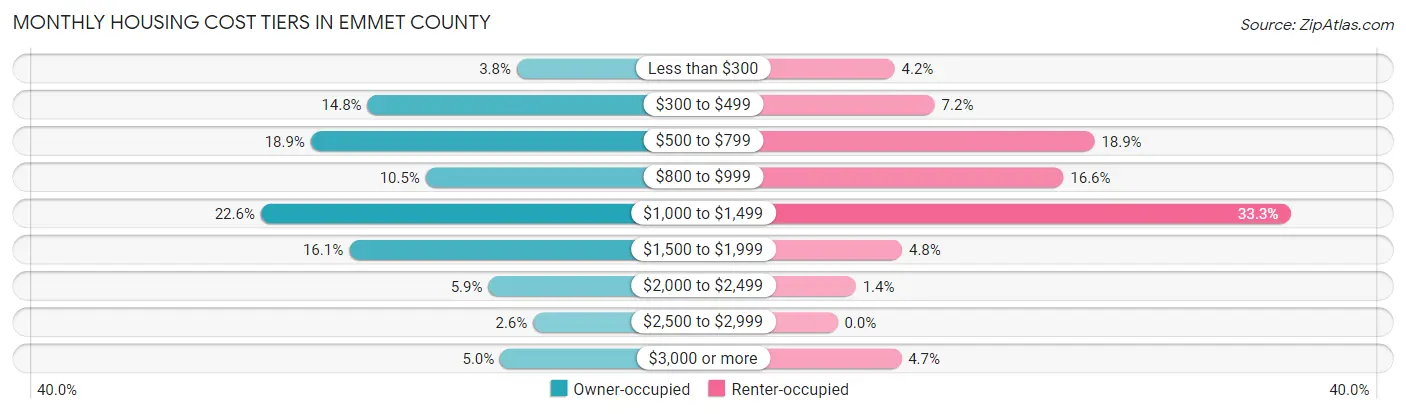
| Monthly Cost | Owner-occupied | Renter-occupied |
| Less than $300 | 414 (3.7%) | 147 (4.2%) |
| $300 to $499 | 1,628 (14.7%) | 250 (7.2%) |
| $500 to $799 | 2,090 (18.9%) | 661 (18.9%) |
| $800 to $999 | 1,155 (10.5%) | 581 (16.6%) |
| $1,000 to $1,499 | 2,496 (22.6%) | 1,164 (33.3%) |
| $1,500 to $1,999 | 1,778 (16.1%) | 166 (4.8%) |
| $2,000 to $2,499 | 646 (5.9%) | 47 (1.3%) |
| $2,500 to $2,999 | 282 (2.5%) | 0 (0.0%) |
| $3,000 or more | 550 (5.0%) | 164 (4.7%) |
| Total | 11,039 (100.0%) | 3,491 (100.0%) |
Physical Housing Characteristics in Emmet County
Housing Structures in Emmet County
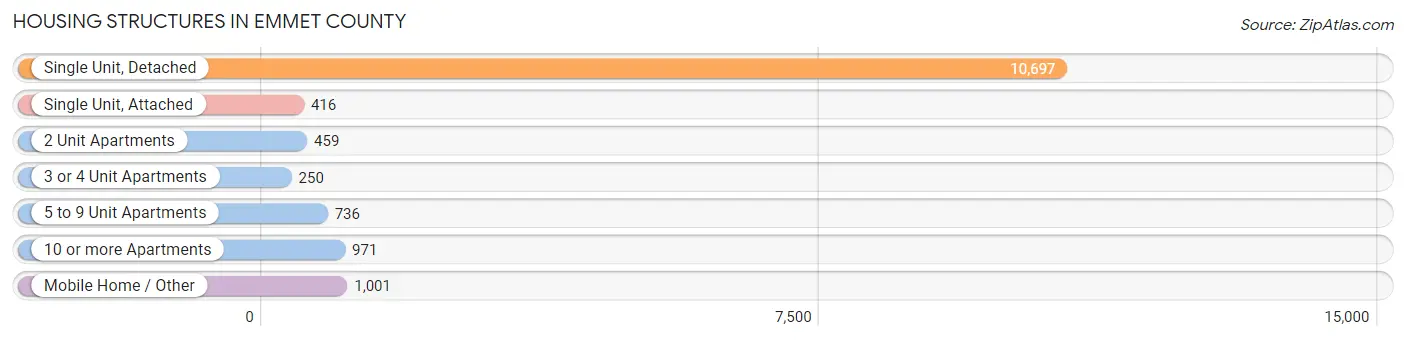
| Structure Type | # Housing Units | % Housing Units |
| Single Unit, Detached | 10,697 | 73.6% |
| Single Unit, Attached | 416 | 2.9% |
| 2 Unit Apartments | 459 | 3.2% |
| 3 or 4 Unit Apartments | 250 | 1.7% |
| 5 to 9 Unit Apartments | 736 | 5.1% |
| 10 or more Apartments | 971 | 6.7% |
| Mobile Home / Other | 1,001 | 6.9% |
| Total | 14,530 | 100.0% |
Housing Structures by Occupancy in Emmet County
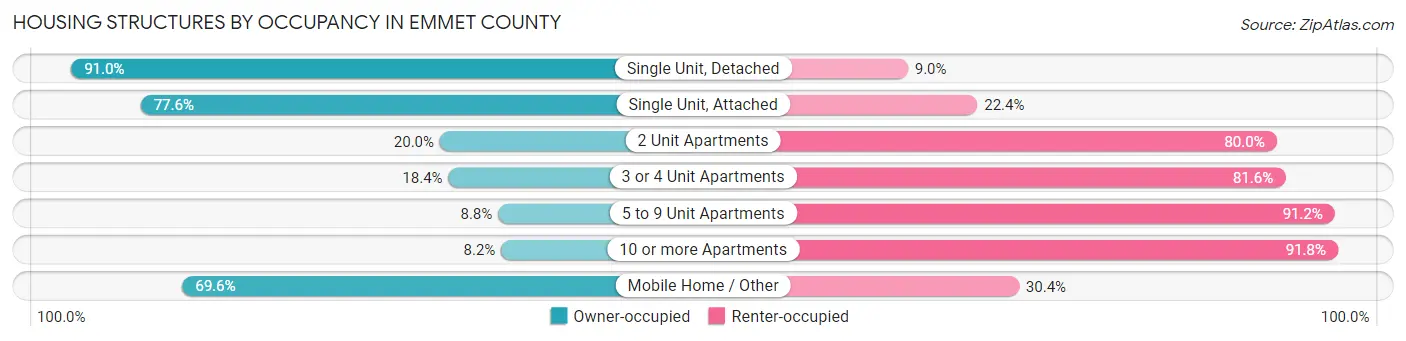
| Structure Type | Owner-occupied | Renter-occupied |
| Single Unit, Detached | 9,736 (91.0%) | 961 (9.0%) |
| Single Unit, Attached | 323 (77.6%) | 93 (22.4%) |
| 2 Unit Apartments | 92 (20.0%) | 367 (80.0%) |
| 3 or 4 Unit Apartments | 46 (18.4%) | 204 (81.6%) |
| 5 to 9 Unit Apartments | 65 (8.8%) | 671 (91.2%) |
| 10 or more Apartments | 80 (8.2%) | 891 (91.8%) |
| Mobile Home / Other | 697 (69.6%) | 304 (30.4%) |
| Total | 11,039 (76.0%) | 3,491 (24.0%) |
Housing Structures by Number of Rooms in Emmet County
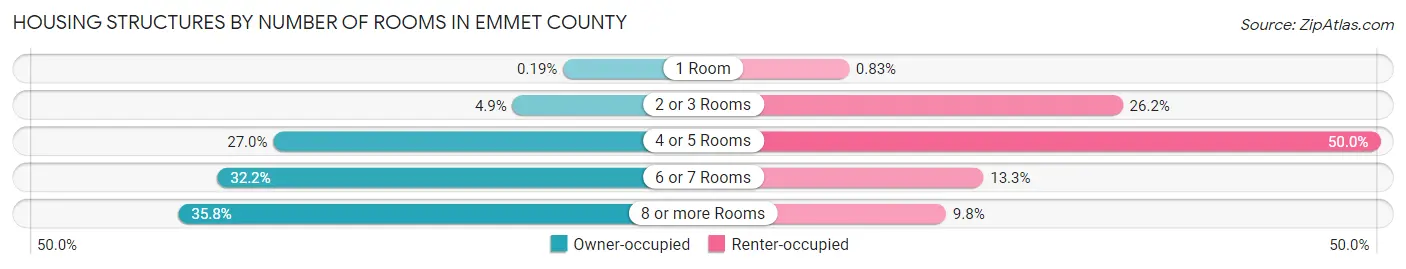
| Number of Rooms | Owner-occupied | Renter-occupied |
| 1 Room | 21 (0.2%) | 29 (0.8%) |
| 2 or 3 Rooms | 538 (4.9%) | 913 (26.2%) |
| 4 or 5 Rooms | 2,980 (27.0%) | 1,744 (50.0%) |
| 6 or 7 Rooms | 3,551 (32.2%) | 463 (13.3%) |
| 8 or more Rooms | 3,949 (35.8%) | 342 (9.8%) |
| Total | 11,039 (100.0%) | 3,491 (100.0%) |
Housing Structure by Heating Type in Emmet County
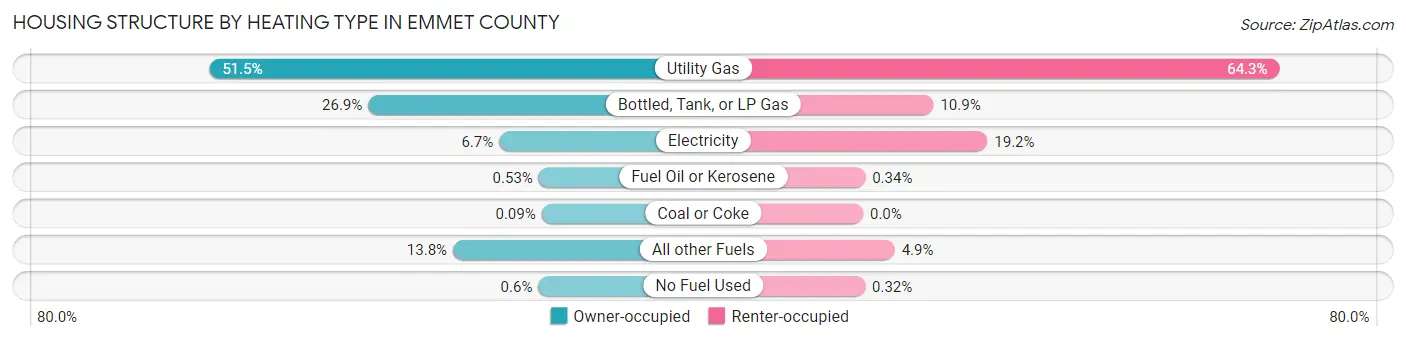
| Heating Type | Owner-occupied | Renter-occupied |
| Utility Gas | 5,680 (51.4%) | 2,246 (64.3%) |
| Bottled, Tank, or LP Gas | 2,969 (26.9%) | 380 (10.9%) |
| Electricity | 734 (6.7%) | 671 (19.2%) |
| Fuel Oil or Kerosene | 58 (0.5%) | 12 (0.3%) |
| Coal or Coke | 10 (0.1%) | 0 (0.0%) |
| All other Fuels | 1,522 (13.8%) | 171 (4.9%) |
| No Fuel Used | 66 (0.6%) | 11 (0.3%) |
| Total | 11,039 (100.0%) | 3,491 (100.0%) |
Household Vehicle Usage in Emmet County
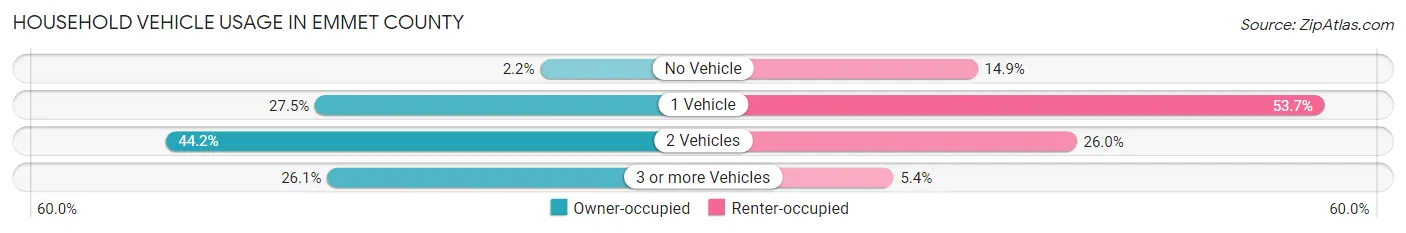
| Vehicles per Household | Owner-occupied | Renter-occupied |
| No Vehicle | 246 (2.2%) | 519 (14.9%) |
| 1 Vehicle | 3,030 (27.5%) | 1,876 (53.7%) |
| 2 Vehicles | 4,882 (44.2%) | 906 (26.0%) |
| 3 or more Vehicles | 2,881 (26.1%) | 190 (5.4%) |
| Total | 11,039 (100.0%) | 3,491 (100.0%) |
Real Estate & Mortgages in Emmet County
Real Estate and Mortgage Overview in Emmet County
| Characteristic | Without Mortgage | With Mortgage |
| Housing Units | 4,762 | 6,277 |
| Median Property Value | $242,100 | $250,300 |
| Median Household Income | $65,048 | $1,392 |
| Monthly Housing Costs | $570 | $531 |
| Real Estate Taxes | $2,584 | $271 |
Property Value by Mortgage Status in Emmet County
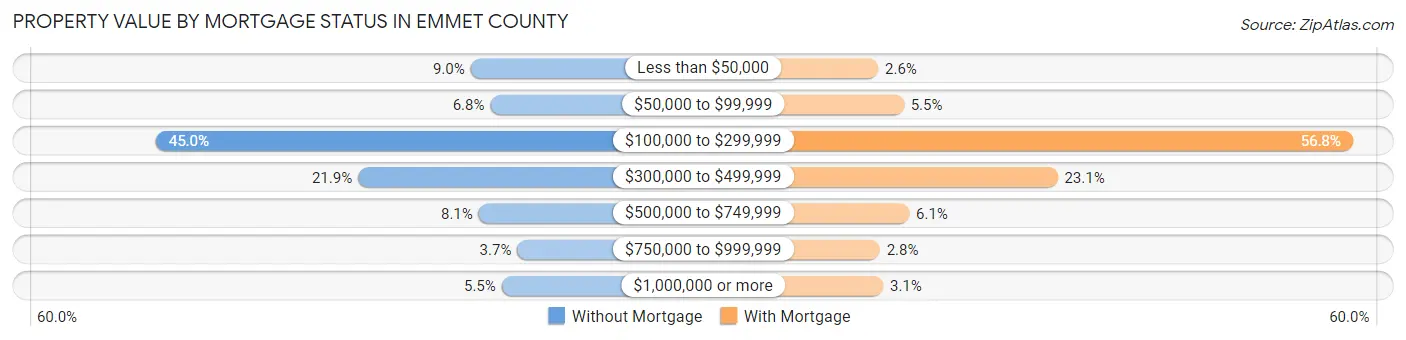
| Property Value | Without Mortgage | With Mortgage |
| Less than $50,000 | 430 (9.0%) | 162 (2.6%) |
| $50,000 to $99,999 | 323 (6.8%) | 345 (5.5%) |
| $100,000 to $299,999 | 2,143 (45.0%) | 3,567 (56.8%) |
| $300,000 to $499,999 | 1,043 (21.9%) | 1,449 (23.1%) |
| $500,000 to $749,999 | 386 (8.1%) | 384 (6.1%) |
| $750,000 to $999,999 | 176 (3.7%) | 173 (2.8%) |
| $1,000,000 or more | 261 (5.5%) | 197 (3.1%) |
| Total | 4,762 (100.0%) | 6,277 (100.0%) |
Household Income by Mortgage Status in Emmet County
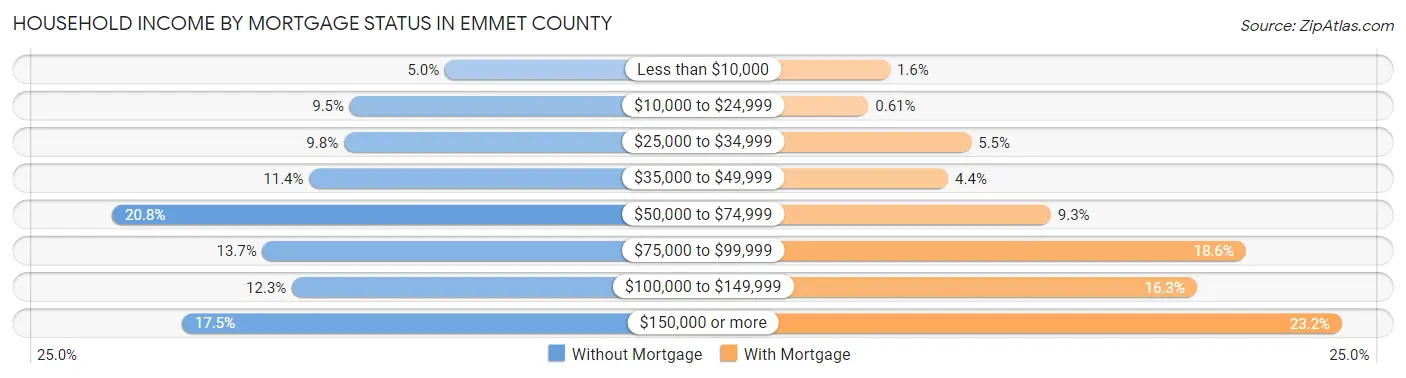
| Household Income | Without Mortgage | With Mortgage |
| Less than $10,000 | 237 (5.0%) | 103 (1.6%) |
| $10,000 to $24,999 | 453 (9.5%) | 38 (0.6%) |
| $25,000 to $34,999 | 466 (9.8%) | 346 (5.5%) |
| $35,000 to $49,999 | 545 (11.4%) | 277 (4.4%) |
| $50,000 to $74,999 | 992 (20.8%) | 584 (9.3%) |
| $75,000 to $99,999 | 651 (13.7%) | 1,166 (18.6%) |
| $100,000 to $149,999 | 584 (12.3%) | 1,020 (16.3%) |
| $150,000 or more | 834 (17.5%) | 1,454 (23.2%) |
| Total | 4,762 (100.0%) | 6,277 (100.0%) |
Property Value to Household Income Ratio in Emmet County
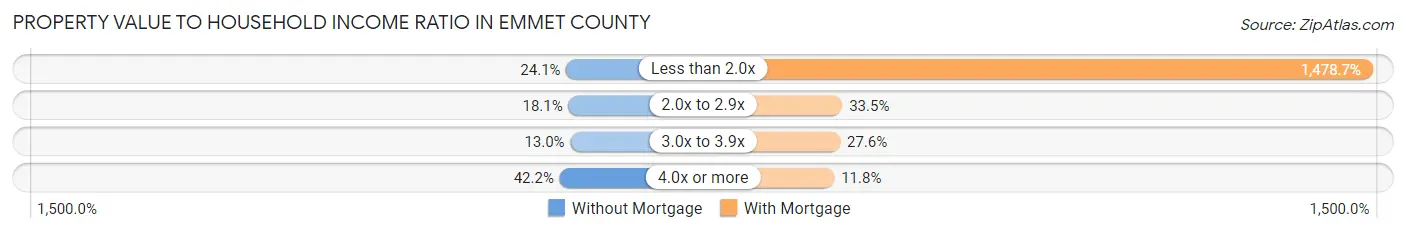
| Value-to-Income Ratio | Without Mortgage | With Mortgage |
| Less than 2.0x | 1,146 (24.1%) | 92,820 (1,478.7%) |
| 2.0x to 2.9x | 862 (18.1%) | 2,103 (33.5%) |
| 3.0x to 3.9x | 621 (13.0%) | 1,733 (27.6%) |
| 4.0x or more | 2,010 (42.2%) | 739 (11.8%) |
| Total | 4,762 (100.0%) | 6,277 (100.0%) |
Real Estate Taxes by Mortgage Status in Emmet County
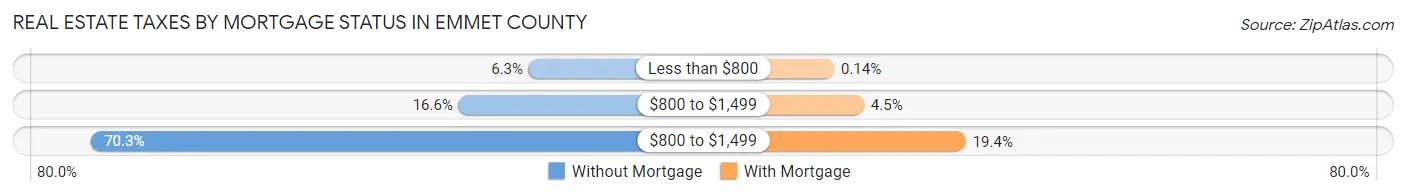
| Property Taxes | Without Mortgage | With Mortgage |
| Less than $800 | 301 (6.3%) | 9 (0.1%) |
| $800 to $1,499 | 789 (16.6%) | 283 (4.5%) |
| $800 to $1,499 | 3,346 (70.3%) | 1,217 (19.4%) |
| Total | 4,762 (100.0%) | 6,277 (100.0%) |
Health & Disability in Emmet County
Health Insurance Coverage by Age in Emmet County
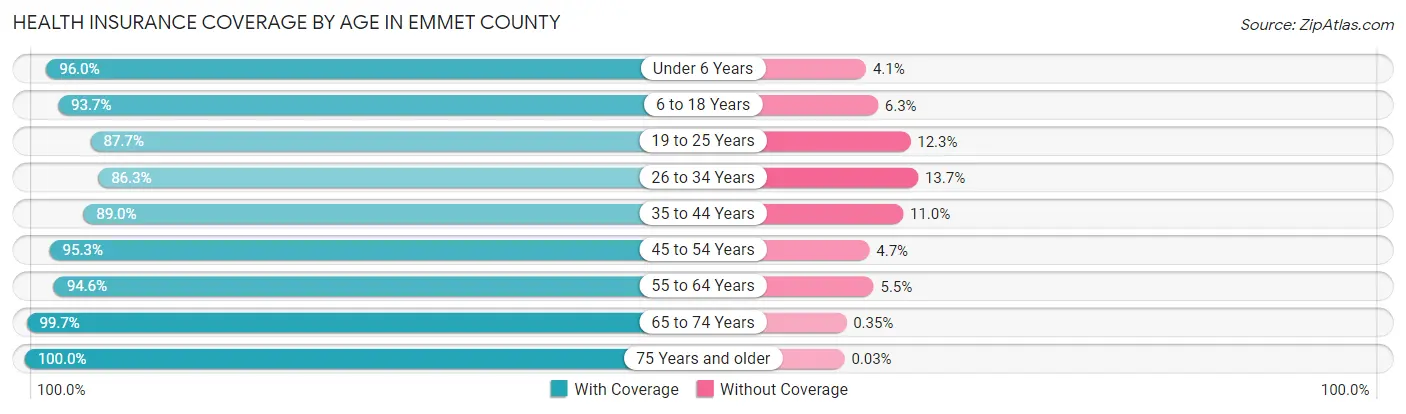
| Age Bracket | With Coverage | Without Coverage |
| Under 6 Years | 1,706 (96.0%) | 72 (4.1%) |
| 6 to 18 Years | 4,627 (93.7%) | 309 (6.3%) |
| 19 to 25 Years | 2,389 (87.7%) | 335 (12.3%) |
| 26 to 34 Years | 2,876 (86.3%) | 458 (13.7%) |
| 35 to 44 Years | 3,363 (89.0%) | 414 (11.0%) |
| 45 to 54 Years | 3,899 (95.3%) | 191 (4.7%) |
| 55 to 64 Years | 5,048 (94.6%) | 291 (5.4%) |
| 65 to 74 Years | 4,780 (99.7%) | 17 (0.4%) |
| 75 Years and older | 2,929 (100.0%) | 1 (0.0%) |
| Total | 31,617 (93.8%) | 2,088 (6.2%) |
Health Insurance Coverage by Citizenship Status in Emmet County
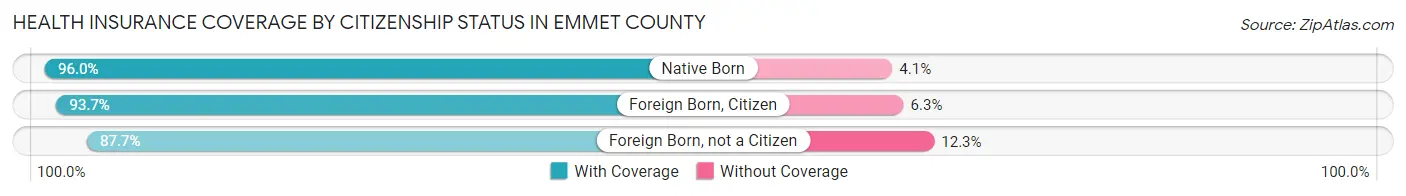
| Citizenship Status | With Coverage | Without Coverage |
| Native Born | 1,706 (96.0%) | 72 (4.1%) |
| Foreign Born, Citizen | 4,627 (93.7%) | 309 (6.3%) |
| Foreign Born, not a Citizen | 2,389 (87.7%) | 335 (12.3%) |
Health Insurance Coverage by Household Income in Emmet County
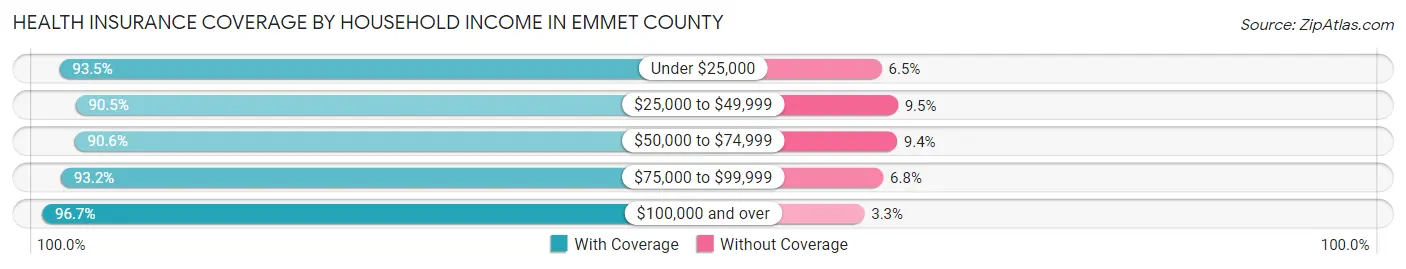
| Household Income | With Coverage | Without Coverage |
| Under $25,000 | 2,739 (93.5%) | 191 (6.5%) |
| $25,000 to $49,999 | 4,563 (90.5%) | 481 (9.5%) |
| $50,000 to $74,999 | 5,562 (90.6%) | 576 (9.4%) |
| $75,000 to $99,999 | 4,970 (93.2%) | 363 (6.8%) |
| $100,000 and over | 13,633 (96.7%) | 463 (3.3%) |
Public vs Private Health Insurance Coverage by Age in Emmet County
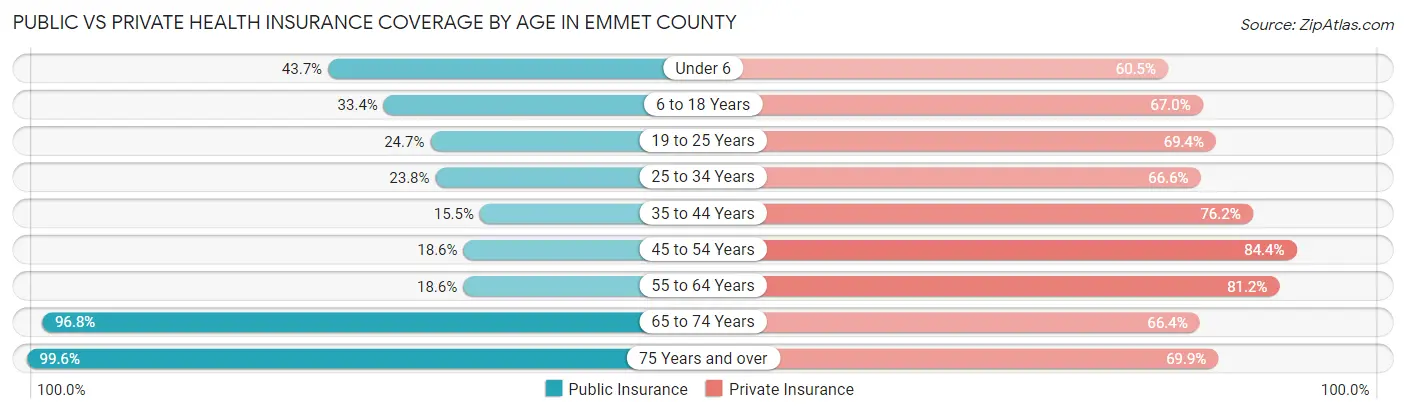
| Age Bracket | Public Insurance | Private Insurance |
| Under 6 | 777 (43.7%) | 1,076 (60.5%) |
| 6 to 18 Years | 1,646 (33.4%) | 3,305 (67.0%) |
| 19 to 25 Years | 673 (24.7%) | 1,891 (69.4%) |
| 25 to 34 Years | 792 (23.8%) | 2,219 (66.6%) |
| 35 to 44 Years | 586 (15.5%) | 2,879 (76.2%) |
| 45 to 54 Years | 759 (18.6%) | 3,450 (84.4%) |
| 55 to 64 Years | 994 (18.6%) | 4,334 (81.2%) |
| 65 to 74 Years | 4,642 (96.8%) | 3,185 (66.4%) |
| 75 Years and over | 2,919 (99.6%) | 2,047 (69.9%) |
| Total | 13,788 (40.9%) | 24,386 (72.4%) |
Disability Status by Sex by Age in Emmet County
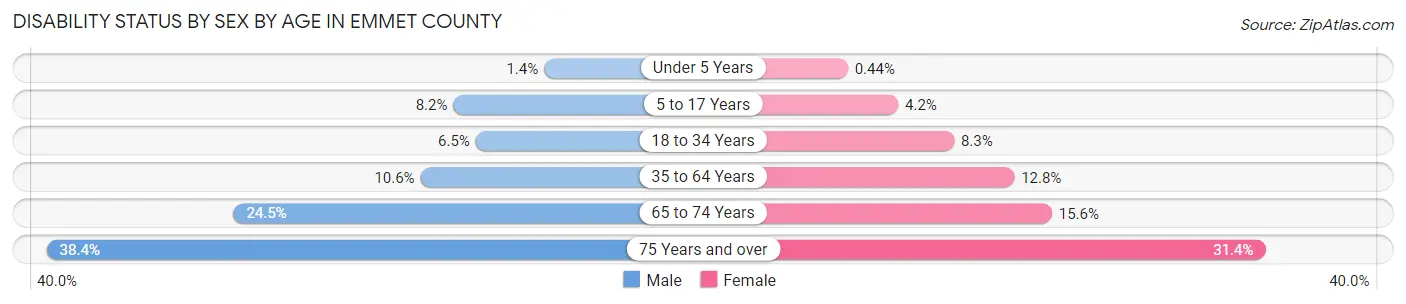
| Age Bracket | Male | Female |
| Under 5 Years | 12 (1.4%) | 3 (0.4%) |
| 5 to 17 Years | 201 (8.2%) | 96 (4.2%) |
| 18 to 34 Years | 220 (6.5%) | 259 (8.3%) |
| 35 to 64 Years | 694 (10.6%) | 853 (12.8%) |
| 65 to 74 Years | 573 (24.5%) | 383 (15.6%) |
| 75 Years and over | 509 (38.4%) | 504 (31.4%) |
Disability Class by Sex by Age in Emmet County
Disability Class: Hearing Difficulty
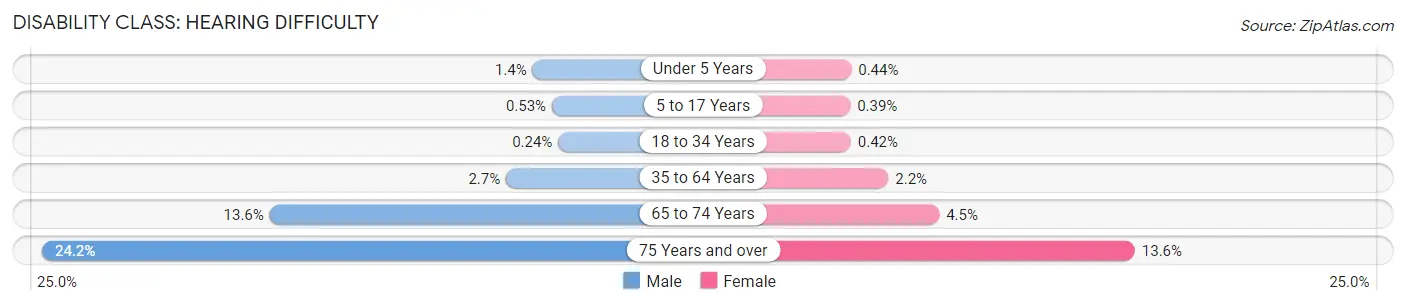
| Age Bracket | Male | Female |
| Under 5 Years | 12 (1.4%) | 3 (0.4%) |
| 5 to 17 Years | 13 (0.5%) | 9 (0.4%) |
| 18 to 34 Years | 8 (0.2%) | 13 (0.4%) |
| 35 to 64 Years | 174 (2.7%) | 144 (2.2%) |
| 65 to 74 Years | 319 (13.6%) | 111 (4.5%) |
| 75 Years and over | 321 (24.2%) | 218 (13.6%) |
Disability Class: Vision Difficulty
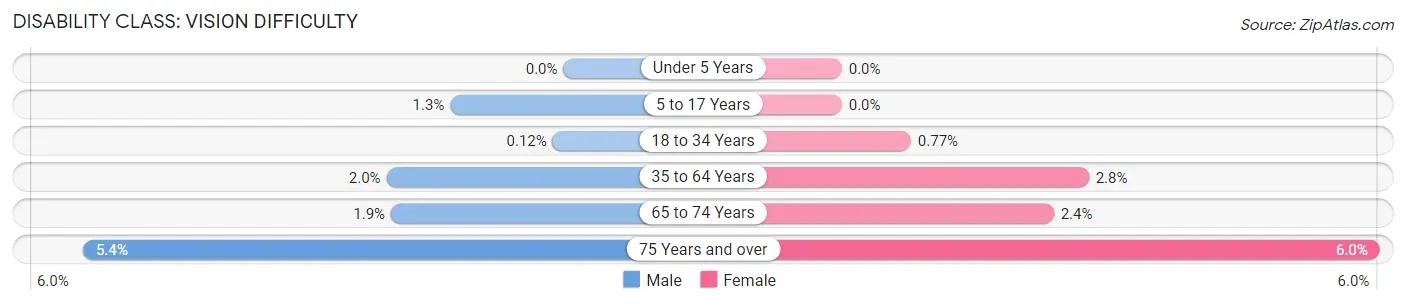
| Age Bracket | Male | Female |
| Under 5 Years | 0 (0.0%) | 0 (0.0%) |
| 5 to 17 Years | 31 (1.3%) | 0 (0.0%) |
| 18 to 34 Years | 4 (0.1%) | 24 (0.8%) |
| 35 to 64 Years | 129 (2.0%) | 183 (2.8%) |
| 65 to 74 Years | 45 (1.9%) | 58 (2.4%) |
| 75 Years and over | 71 (5.3%) | 96 (6.0%) |
Disability Class: Cognitive Difficulty
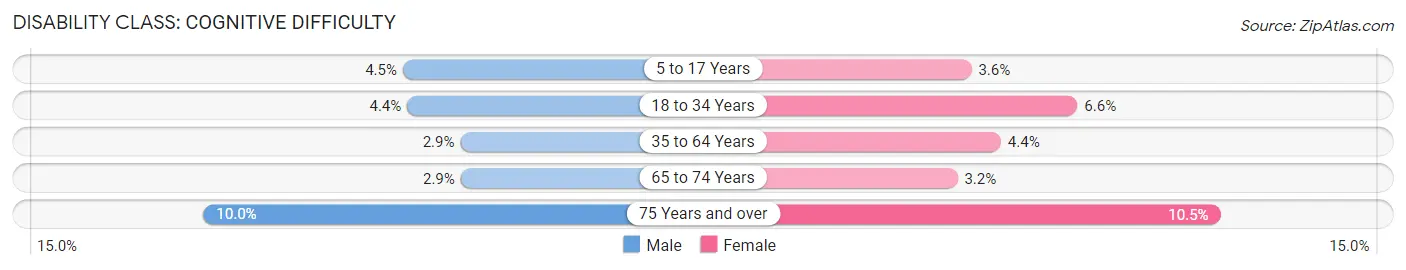
| Age Bracket | Male | Female |
| 5 to 17 Years | 110 (4.5%) | 83 (3.6%) |
| 18 to 34 Years | 147 (4.3%) | 204 (6.6%) |
| 35 to 64 Years | 188 (2.9%) | 295 (4.4%) |
| 65 to 74 Years | 67 (2.9%) | 79 (3.2%) |
| 75 Years and over | 133 (10.0%) | 169 (10.5%) |
Disability Class: Ambulatory Difficulty
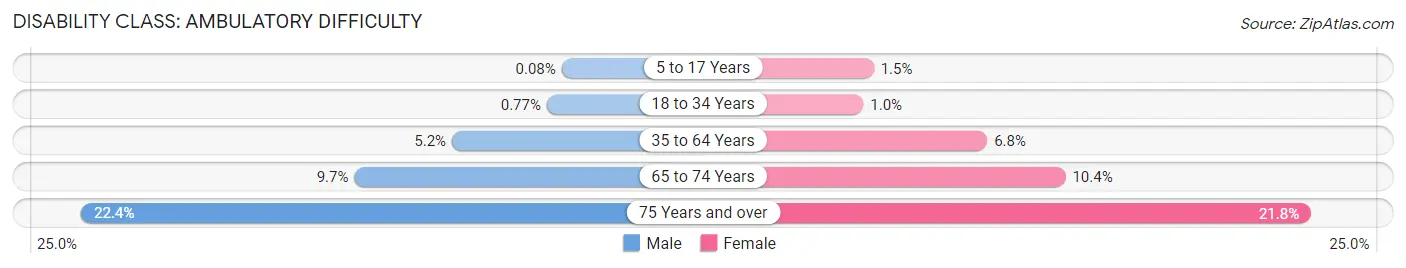
| Age Bracket | Male | Female |
| 5 to 17 Years | 2 (0.1%) | 34 (1.5%) |
| 18 to 34 Years | 26 (0.8%) | 31 (1.0%) |
| 35 to 64 Years | 338 (5.2%) | 450 (6.8%) |
| 65 to 74 Years | 227 (9.7%) | 255 (10.4%) |
| 75 Years and over | 297 (22.4%) | 349 (21.8%) |
Disability Class: Self-Care Difficulty
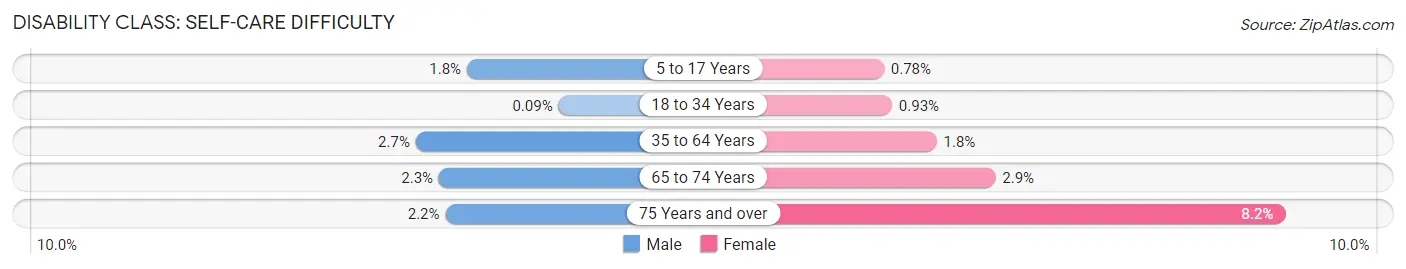
| Age Bracket | Male | Female |
| 5 to 17 Years | 44 (1.8%) | 18 (0.8%) |
| 18 to 34 Years | 3 (0.1%) | 29 (0.9%) |
| 35 to 64 Years | 179 (2.7%) | 117 (1.8%) |
| 65 to 74 Years | 54 (2.3%) | 70 (2.9%) |
| 75 Years and over | 29 (2.2%) | 132 (8.2%) |
Technology Access in Emmet County
Computing Device Access in Emmet County
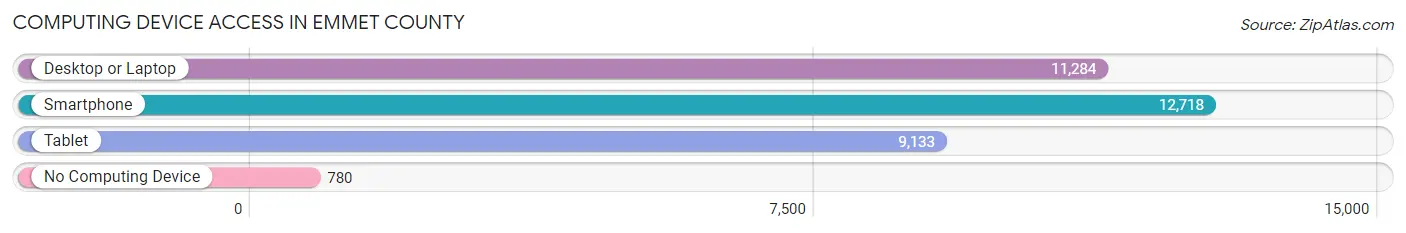
| Device Type | # Households | % Households |
| Desktop or Laptop | 11,284 | 77.7% |
| Smartphone | 12,718 | 87.5% |
| Tablet | 9,133 | 62.9% |
| No Computing Device | 780 | 5.4% |
| Total | 14,530 | 100.0% |
Internet Access in Emmet County
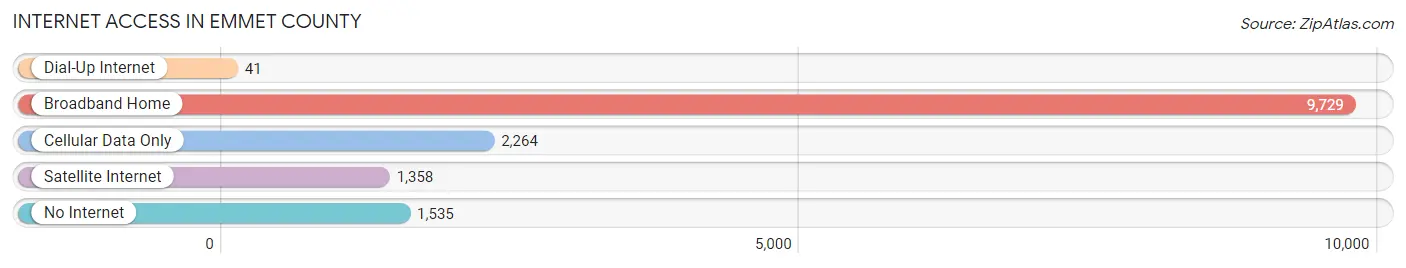
| Internet Type | # Households | % Households |
| Dial-Up Internet | 41 | 0.3% |
| Broadband Home | 9,729 | 67.0% |
| Cellular Data Only | 2,264 | 15.6% |
| Satellite Internet | 1,358 | 9.3% |
| No Internet | 1,535 | 10.6% |
| Total | 14,530 | 100.0% |
Emmet County Summary
Emmet County is located in the northwestern part of Michigan’s Lower Peninsula. It is bordered by Charlevoix County to the north, Cheboygan County to the east, Antrim County to the south, and Lake Michigan to the west. The county seat is Petoskey, and the largest city is also Petoskey. Emmet County covers an area of 576 square miles and has a population of 32,694 as of the 2010 census.
History
Emmet County was established in 1840 and was named after Irish patriot Robert Emmet. The county was originally part of Mackinac County, but was split off in 1840. The county was initially sparsely populated, but the population began to grow in the late 19th century with the arrival of settlers from the eastern United States. The county was also home to several Native American tribes, including the Odawa, Ojibwe, and Potawatomi.
Geography
Emmet County is located in the northwestern part of Michigan’s Lower Peninsula. It is bordered by Charlevoix County to the north, Cheboygan County to the east, Antrim County to the south, and Lake Michigan to the west. The county has a total area of 576 square miles, of which 545 square miles is land and 31 square miles is water. The terrain is generally flat, with rolling hills in the northern part of the county. The county is home to several lakes, including Crooked Lake, Burt Lake, and Walloon Lake.
Economy
Emmet County’s economy is largely based on tourism and agriculture. The county is home to several popular tourist destinations, including Petoskey State Park, the Mackinac Bridge, and the Little Traverse Bay. The county is also home to several wineries and breweries, as well as several golf courses. Agriculture is also an important part of the county’s economy, with the main crops being apples, cherries, and grapes.
Demographics
As of the 2010 census, there were 32,694 people, 13,845 households, and 8,845 families living in Emmet County. The population density was 59.7 people per square mile. The racial makeup of the county was 94.2% White, 0.7% African American, 1.7% Native American, 0.7% Asian, 0.1% Pacific Islander, 0.7% from other races, and 1.9% from two or more races. Hispanic or Latino of any race were 2.3% of the population.
The median income for a household in the county was $41,945, and the median income for a family was $51,945. The per capita income for the county was $22,945. About 8.2% of families and 11.2% of the population were below the poverty line, including 15.2% of those under age 18 and 6.2% of those age 65 or over.
Common Questions
What is Per Capita Income in Emmet County?
Per Capita income in Emmet County is $42,373.
What is the Median Family Income in Emmet County?
Median Family Income in Emmet County is $84,810.
What is the Median Household income in Emmet County?
Median Household Income in Emmet County is $69,690.
What is Income or Wage Gap in Emmet County?
Income or Wage Gap in Emmet County is 24.2%.
Women in Emmet County earn 75.8 cents for every dollar earned by a man.
What is Family Income Deficit in Emmet County?
Family Income Deficit in Emmet County is $10,081.
Families that are below poverty line in Emmet County earn $10,081 less on average than the poverty threshold level.
What is Inequality or Gini Index in Emmet County?
Inequality or Gini Index in Emmet County is 0.46.
What is the Total Population of Emmet County?
Total Population of Emmet County is 34,072.
What is the Total Male Population of Emmet County?
Total Male Population of Emmet County is 17,083.
What is the Total Female Population of Emmet County?
Total Female Population of Emmet County is 16,989.
What is the Ratio of Males per 100 Females in Emmet County?
There are 100.55 Males per 100 Females in Emmet County.
What is the Ratio of Females per 100 Males in Emmet County?
There are 99.45 Females per 100 Males in Emmet County.
What is the Median Population Age in Emmet County?
Median Population Age in Emmet County is 45.8 Years.
What is the Average Family Size in Emmet County
Average Family Size in Emmet County is 2.8 People.
What is the Average Household Size in Emmet County
Average Household Size in Emmet County is 2.3 People.
How Large is the Labor Force in Emmet County?
There are 17,860 People in the Labor Forcein in Emmet County.
What is the Percentage of People in the Labor Force in Emmet County?
62.3% of People are in the Labor Force in Emmet County.
What is the Unemployment Rate in Emmet County?
Unemployment Rate in Emmet County is 3.8%.