Charlevoix County, MI Map & Demographics
Charlevoix County Map
Charlevoix County Overview
$43,782
PER CAPITA INCOME
$86,509
AVG FAMILY INCOME
$69,764
AVG HOUSEHOLD INCOME
29.7%
WAGE / INCOME GAP [ % ]
70.3¢/ $1
WAGE / INCOME GAP [ $ ]
$8,676
FAMILY INCOME DEFICIT
0.46
INEQUALITY / GINI INDEX
26,174
TOTAL POPULATION
13,106
MALE POPULATION
13,068
FEMALE POPULATION
100.29
MALES / 100 FEMALES
99.71
FEMALES / 100 MALES
49.5
MEDIAN AGE
2.5
AVG FAMILY SIZE
2.1
AVG HOUSEHOLD SIZE
13,119
LABOR FORCE [ PEOPLE ]
59.6%
PERCENT IN LABOR FORCE
3.8%
UNEMPLOYMENT RATE
Income in Charlevoix County
Income Overview in Charlevoix County
Per Capita Income in Charlevoix County is $43,782, while median incomes of families and households are $86,509 and $69,764 respectively.
| Characteristic | Number | Measure |
| Per Capita Income | 26,174 | $43,782 |
| Median Family Income | 7,962 | $86,509 |
| Mean Family Income | 7,962 | $115,237 |
| Median Household Income | 12,232 | $69,764 |
| Mean Household Income | 12,232 | $94,468 |
| Income Deficit | 7,962 | $8,676 |
| Wage / Income Gap (%) | 26,174 | 29.66% |
| Wage / Income Gap ($) | 26,174 | 70.34¢ per $1 |
| Gini / Inequality Index | 26,174 | 0.46 |
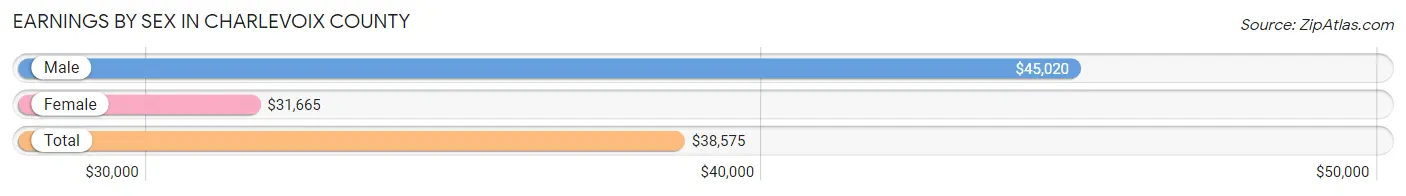
Earnings by Sex in Charlevoix County
Average Earnings in Charlevoix County are $38,575, $45,020 for men and $31,665 for women, a difference of 29.7%.
| Sex | Number | Average Earnings |
| Male | 7,668 (54.3%) | $45,020 |
| Female | 6,441 (45.7%) | $31,665 |
| Total | 14,109 (100.0%) | $38,575 |
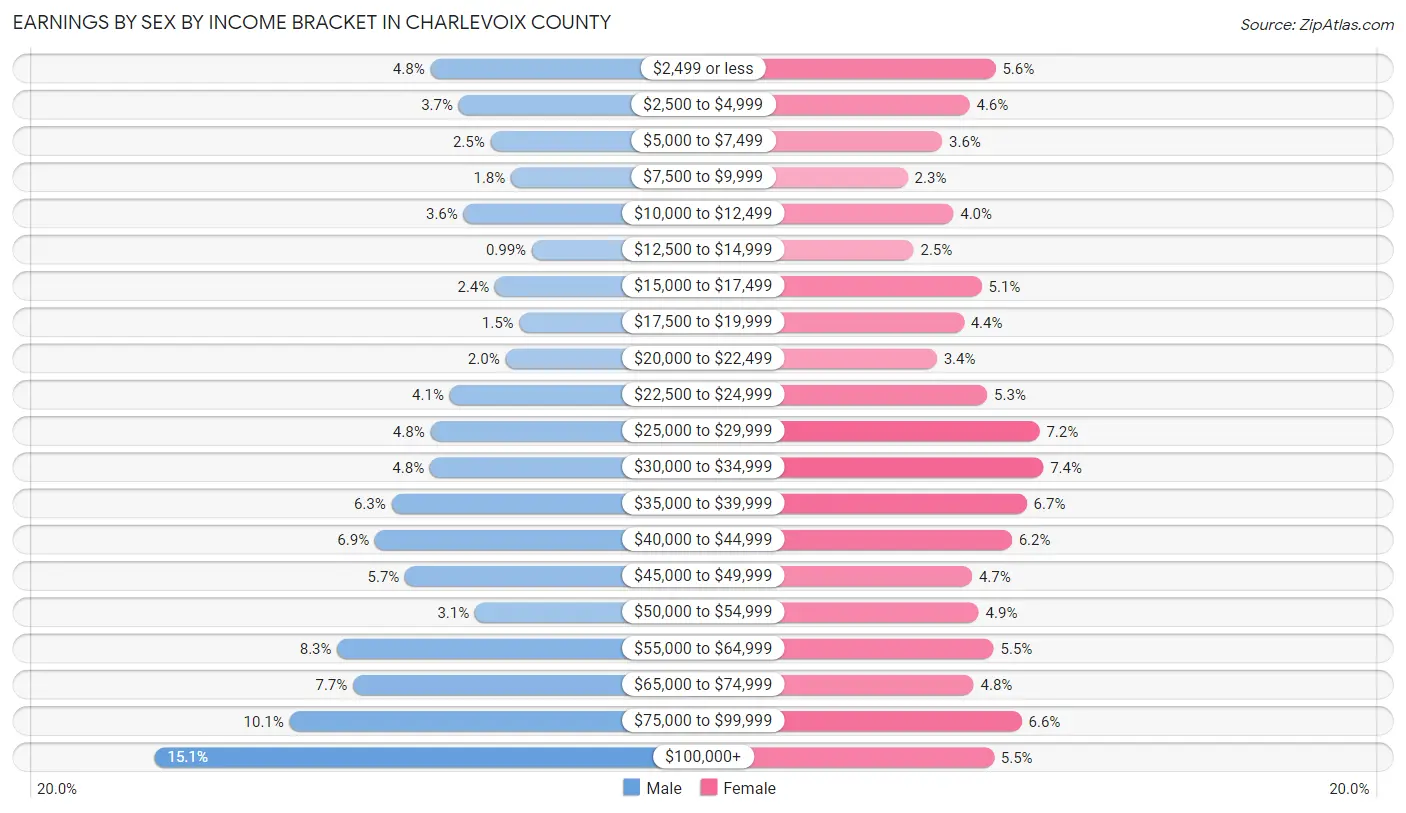
Earnings by Sex by Income Bracket in Charlevoix County
The most common earnings brackets in Charlevoix County are $100,000+ for men (1,160 | 15.1%) and $30,000 to $34,999 for women (474 | 7.4%).
| Income | Male | Female |
| $2,499 or less | 367 (4.8%) | 359 (5.6%) |
| $2,500 to $4,999 | 286 (3.7%) | 296 (4.6%) |
| $5,000 to $7,499 | 195 (2.5%) | 230 (3.6%) |
| $7,500 to $9,999 | 136 (1.8%) | 147 (2.3%) |
| $10,000 to $12,499 | 272 (3.5%) | 257 (4.0%) |
| $12,500 to $14,999 | 76 (1.0%) | 161 (2.5%) |
| $15,000 to $17,499 | 182 (2.4%) | 325 (5.1%) |
| $17,500 to $19,999 | 112 (1.5%) | 282 (4.4%) |
| $20,000 to $22,499 | 152 (2.0%) | 217 (3.4%) |
| $22,500 to $24,999 | 312 (4.1%) | 339 (5.3%) |
| $25,000 to $29,999 | 367 (4.8%) | 465 (7.2%) |
| $30,000 to $34,999 | 369 (4.8%) | 474 (7.4%) |
| $35,000 to $39,999 | 479 (6.2%) | 434 (6.7%) |
| $40,000 to $44,999 | 527 (6.9%) | 398 (6.2%) |
| $45,000 to $49,999 | 440 (5.7%) | 302 (4.7%) |
| $50,000 to $54,999 | 239 (3.1%) | 318 (4.9%) |
| $55,000 to $64,999 | 635 (8.3%) | 354 (5.5%) |
| $65,000 to $74,999 | 590 (7.7%) | 306 (4.8%) |
| $75,000 to $99,999 | 772 (10.1%) | 422 (6.6%) |
| $100,000+ | 1,160 (15.1%) | 355 (5.5%) |
| Total | 7,668 (100.0%) | 6,441 (100.0%) |
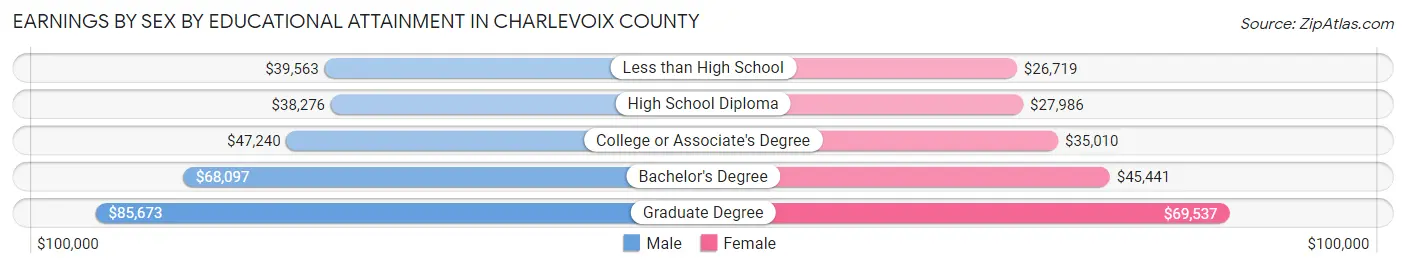
Earnings by Sex by Educational Attainment in Charlevoix County
Average earnings in Charlevoix County are $49,064 for men and $35,915 for women, a difference of 26.8%. Men with an educational attainment of graduate degree enjoy the highest average annual earnings of $85,673, while those with high school diploma education earn the least with $38,276. Women with an educational attainment of graduate degree earn the most with the average annual earnings of $69,537, while those with less than high school education have the smallest earnings of $26,719.
| Educational Attainment | Male Income | Female Income |
| Less than High School | $39,563 | $26,719 |
| High School Diploma | $38,276 | $27,986 |
| College or Associate's Degree | $47,240 | $35,010 |
| Bachelor's Degree | $68,097 | $45,441 |
| Graduate Degree | $85,673 | $69,537 |
| Total | $49,064 | $35,915 |
Family Income in Charlevoix County
Family Income Brackets in Charlevoix County
According to the Charlevoix County family income data, there are 1,712 families falling into the $100,000 to $149,999 income range, which is the most common income bracket and makes up 21.5% of all families. Conversely, the $10,000 to $14,999 income bracket is the least frequent group with only 80 families (1.0%) belonging to this category.
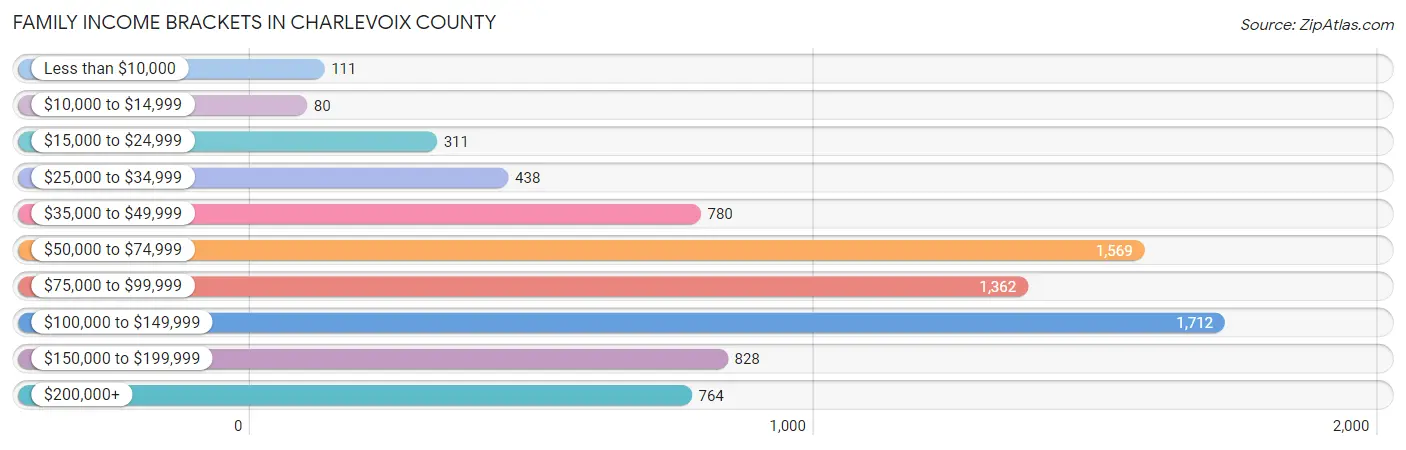
| Income Bracket | # Families | % Families |
| Less than $10,000 | 111 | 1.4% |
| $10,000 to $14,999 | 80 | 1.0% |
| $15,000 to $24,999 | 311 | 3.9% |
| $25,000 to $34,999 | 438 | 5.5% |
| $35,000 to $49,999 | 780 | 9.8% |
| $50,000 to $74,999 | 1,569 | 19.7% |
| $75,000 to $99,999 | 1,362 | 17.1% |
| $100,000 to $149,999 | 1,712 | 21.5% |
| $150,000 to $199,999 | 828 | 10.4% |
| $200,000+ | 764 | 9.6% |
Family Income by Famaliy Size in Charlevoix County
7+ person families (92 | 1.2%) account for the highest median family income in Charlevoix County with $173,636 per family, while 2-person families (4,819 | 60.5%) have the highest median income of $40,639 per family member.
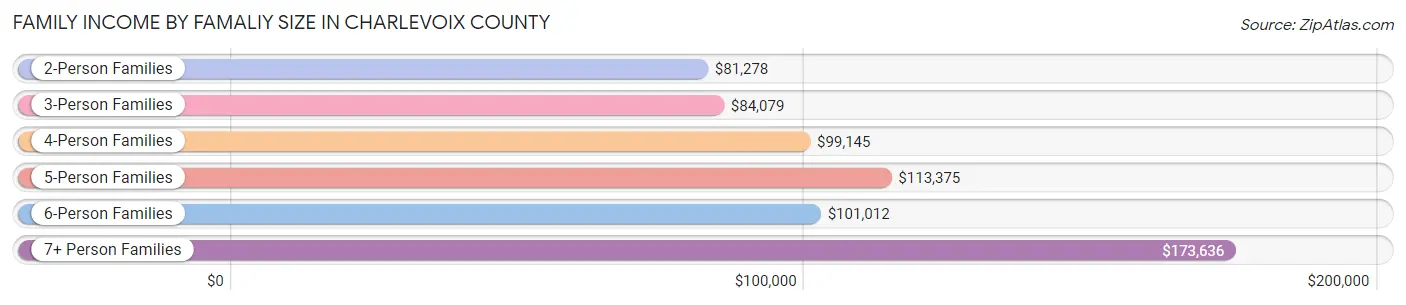
| Income Bracket | # Families | Median Income |
| 2-Person Families | 4,819 (60.5%) | $81,278 |
| 3-Person Families | 1,446 (18.2%) | $84,079 |
| 4-Person Families | 985 (12.4%) | $99,145 |
| 5-Person Families | 473 (5.9%) | $113,375 |
| 6-Person Families | 147 (1.8%) | $101,012 |
| 7+ Person Families | 92 (1.2%) | $173,636 |
| Total | 7,962 (100.0%) | $86,509 |
Family Income by Number of Earners in Charlevoix County
The median family income in Charlevoix County is $86,509, with families comprising 3+ earners (811) having the highest median family income of $121,750, while families with 1 earner (2,232) have the lowest median family income of $67,054, accounting for 10.2% and 28.0% of families, respectively.
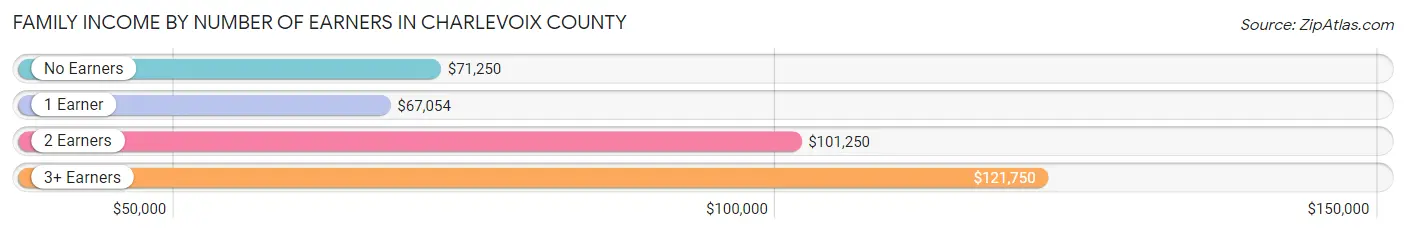
| Number of Earners | # Families | Median Income |
| No Earners | 1,750 (22.0%) | $71,250 |
| 1 Earner | 2,232 (28.0%) | $67,054 |
| 2 Earners | 3,169 (39.8%) | $101,250 |
| 3+ Earners | 811 (10.2%) | $121,750 |
| Total | 7,962 (100.0%) | $86,509 |
Household Income in Charlevoix County
Household Income Brackets in Charlevoix County
With 2,361 households falling in the category, the $50,000 to $74,999 income range is the most frequent in Charlevoix County, accounting for 19.3% of all households. In contrast, only 330 households (2.7%) fall into the less than $10,000 income bracket, making it the least populous group.
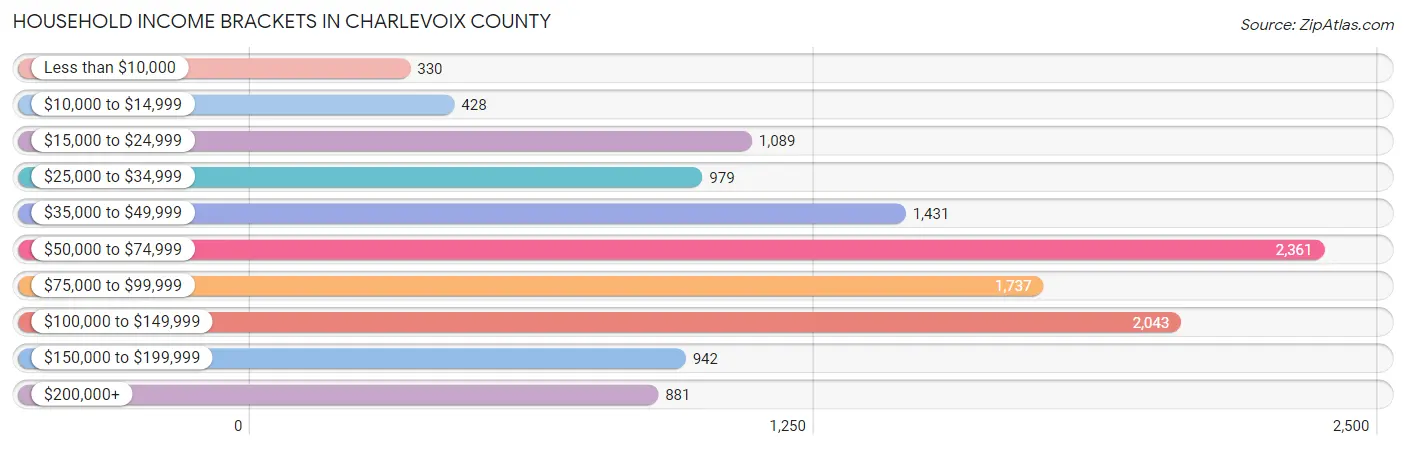
| Income Bracket | # Households | % Households |
| Less than $10,000 | 330 | 2.7% |
| $10,000 to $14,999 | 428 | 3.5% |
| $15,000 to $24,999 | 1,089 | 8.9% |
| $25,000 to $34,999 | 979 | 8.0% |
| $35,000 to $49,999 | 1,431 | 11.7% |
| $50,000 to $74,999 | 2,361 | 19.3% |
| $75,000 to $99,999 | 1,737 | 14.2% |
| $100,000 to $149,999 | 2,043 | 16.7% |
| $150,000 to $199,999 | 942 | 7.7% |
| $200,000+ | 881 | 7.2% |
Household Income by Householder Age in Charlevoix County
The median household income in Charlevoix County is $69,764, with the highest median household income of $84,050 found in the 45 to 64 years age bracket for the primary householder. A total of 4,527 households (37.0%) fall into this category. Meanwhile, the 15 to 24 years age bracket for the primary householder has the lowest median household income of $45,467, with 524 households (4.3%) in this group.
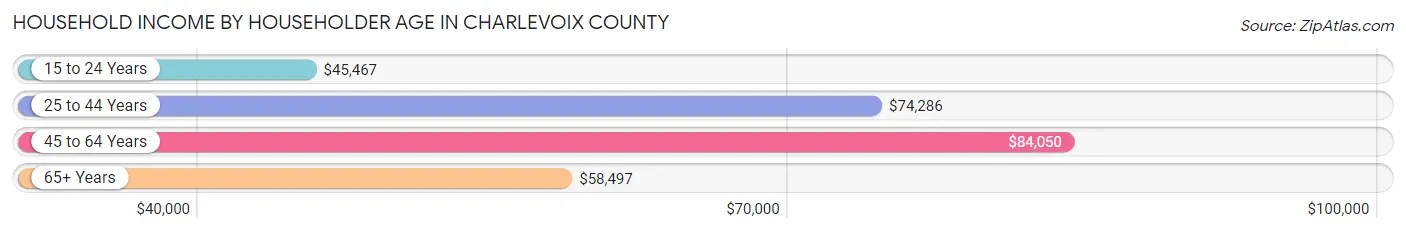
| Income Bracket | # Households | Median Income |
| 15 to 24 Years | 524 (4.3%) | $45,467 |
| 25 to 44 Years | 2,962 (24.2%) | $74,286 |
| 45 to 64 Years | 4,527 (37.0%) | $84,050 |
| 65+ Years | 4,219 (34.5%) | $58,497 |
| Total | 12,232 (100.0%) | $69,764 |
Poverty in Charlevoix County
Income Below Poverty by Sex and Age in Charlevoix County
With 6.8% poverty level for males and 10.5% for females among the residents of Charlevoix County, under 5 year old males and 18 to 24 year old females are the most vulnerable to poverty, with 111 males (20.8%) and 192 females (22.2%) in their respective age groups living below the poverty level.
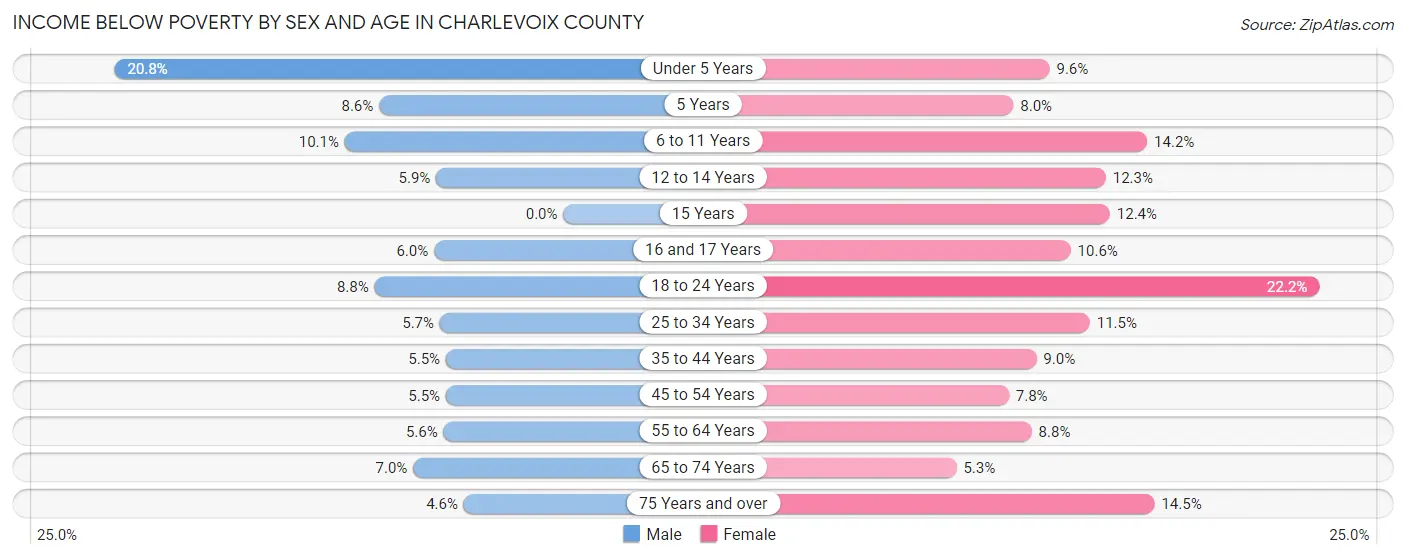
| Age Bracket | Male | Female |
| Under 5 Years | 111 (20.8%) | 51 (9.6%) |
| 5 Years | 10 (8.6%) | 9 (8.0%) |
| 6 to 11 Years | 79 (10.1%) | 101 (14.2%) |
| 12 to 14 Years | 27 (5.9%) | 56 (12.2%) |
| 15 Years | 0 (0.0%) | 24 (12.4%) |
| 16 and 17 Years | 18 (6.0%) | 31 (10.6%) |
| 18 to 24 Years | 85 (8.8%) | 192 (22.2%) |
| 25 to 34 Years | 74 (5.7%) | 146 (11.5%) |
| 35 to 44 Years | 77 (5.4%) | 116 (9.0%) |
| 45 to 54 Years | 83 (5.4%) | 120 (7.7%) |
| 55 to 64 Years | 124 (5.6%) | 200 (8.8%) |
| 65 to 74 Years | 136 (7.0%) | 105 (5.3%) |
| 75 Years and over | 56 (4.6%) | 199 (14.5%) |
| Total | 880 (6.8%) | 1,350 (10.5%) |
Income Above Poverty by Sex and Age in Charlevoix County
According to the poverty statistics in Charlevoix County, males aged 15 years and females aged 65 to 74 years are the age groups that are most secure financially, with 100.0% of males and 94.7% of females in these age groups living above the poverty line.
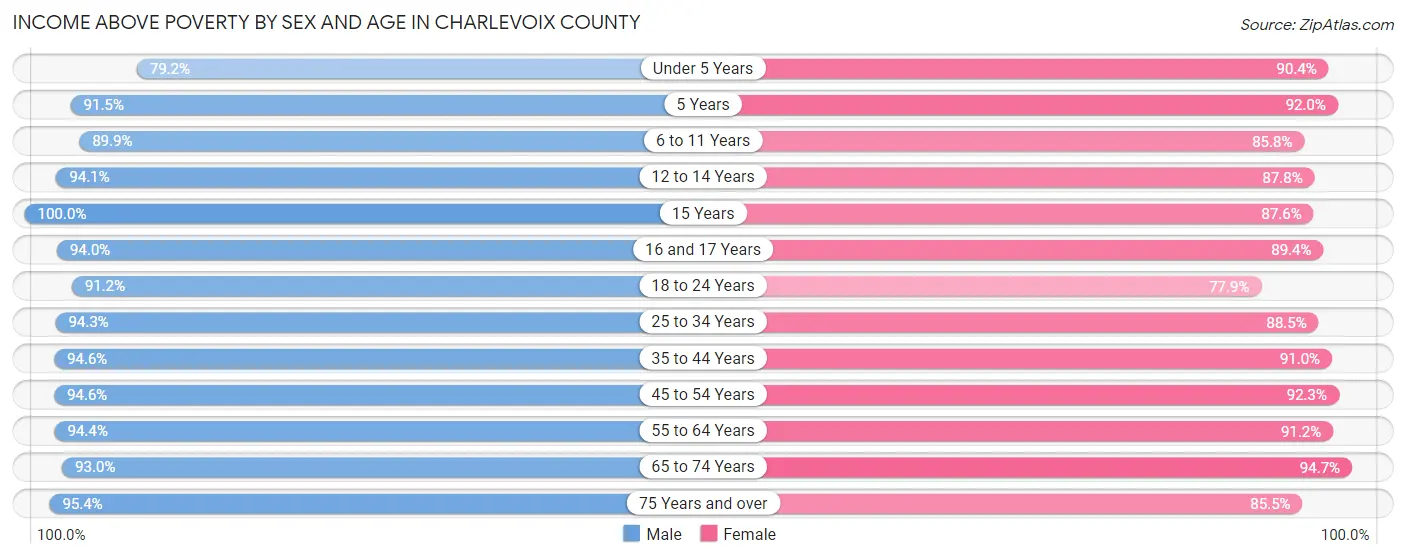
| Age Bracket | Male | Female |
| Under 5 Years | 422 (79.2%) | 478 (90.4%) |
| 5 Years | 107 (91.4%) | 104 (92.0%) |
| 6 to 11 Years | 700 (89.9%) | 612 (85.8%) |
| 12 to 14 Years | 431 (94.1%) | 401 (87.7%) |
| 15 Years | 172 (100.0%) | 169 (87.6%) |
| 16 and 17 Years | 282 (94.0%) | 261 (89.4%) |
| 18 to 24 Years | 885 (91.2%) | 675 (77.8%) |
| 25 to 34 Years | 1,217 (94.3%) | 1,122 (88.5%) |
| 35 to 44 Years | 1,337 (94.6%) | 1,169 (91.0%) |
| 45 to 54 Years | 1,441 (94.6%) | 1,428 (92.2%) |
| 55 to 64 Years | 2,105 (94.4%) | 2,071 (91.2%) |
| 65 to 74 Years | 1,815 (93.0%) | 1,867 (94.7%) |
| 75 Years and over | 1,155 (95.4%) | 1,172 (85.5%) |
| Total | 12,069 (93.2%) | 11,529 (89.5%) |
Income Below Poverty Among Married-Couple Families in Charlevoix County
The poverty statistics for married-couple families in Charlevoix County show that 1.9% or 121 of the total 6,328 families live below the poverty line. Families with 5 or more children have the highest poverty rate of 15.0%, comprising of 6 families. On the other hand, families with 3 or 4 children have the lowest poverty rate of 1.4%, which includes 5 families.
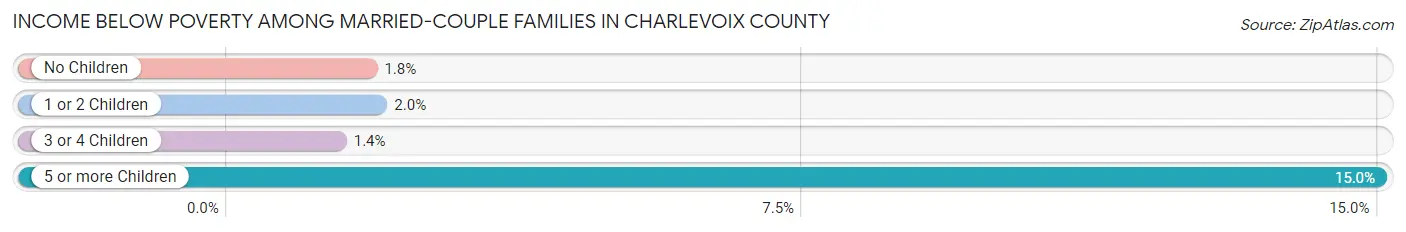
| Children | Above Poverty | Below Poverty |
| No Children | 4,418 (98.2%) | 82 (1.8%) |
| 1 or 2 Children | 1,408 (98.1%) | 28 (1.9%) |
| 3 or 4 Children | 347 (98.6%) | 5 (1.4%) |
| 5 or more Children | 34 (85.0%) | 6 (15.0%) |
| Total | 6,207 (98.1%) | 121 (1.9%) |
Income Below Poverty Among Single-Parent Households in Charlevoix County
According to the poverty data in Charlevoix County, 8.4% or 49 single-father households and 24.1% or 254 single-mother households are living below the poverty line. Among single-father households, those with 3 or 4 children have the highest poverty rate, with 9 households (30.0%) experiencing poverty. Likewise, among single-mother households, those with 5 or more children have the highest poverty rate, with 15 households (100.0%) falling below the poverty line.
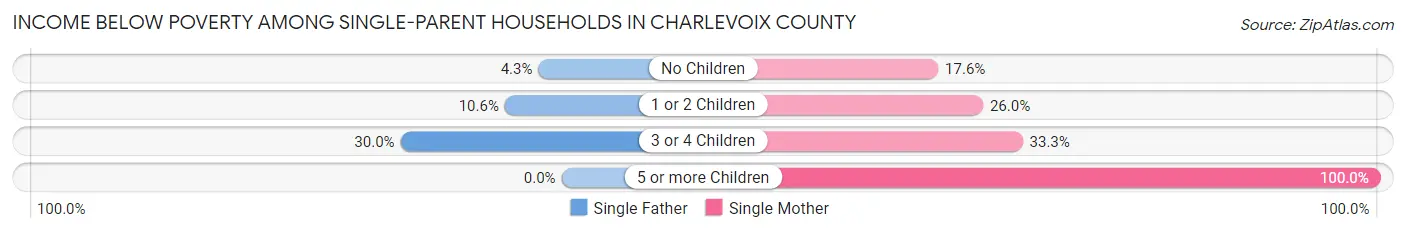
| Children | Single Father | Single Mother |
| No Children | 12 (4.3%) | 72 (17.6%) |
| 1 or 2 Children | 28 (10.6%) | 150 (26.0%) |
| 3 or 4 Children | 9 (30.0%) | 17 (33.3%) |
| 5 or more Children | 0 (0.0%) | 15 (100.0%) |
| Total | 49 (8.4%) | 254 (24.1%) |
Income Below Poverty Among Married-Couple vs Single-Parent Households in Charlevoix County
The poverty data for Charlevoix County shows that 121 of the married-couple family households (1.9%) and 303 of the single-parent households (18.5%) are living below the poverty level. Within the married-couple family households, those with 5 or more children have the highest poverty rate, with 6 households (15.0%) falling below the poverty line. Among the single-parent households, those with 5 or more children have the highest poverty rate, with 15 household (65.2%) living below poverty.
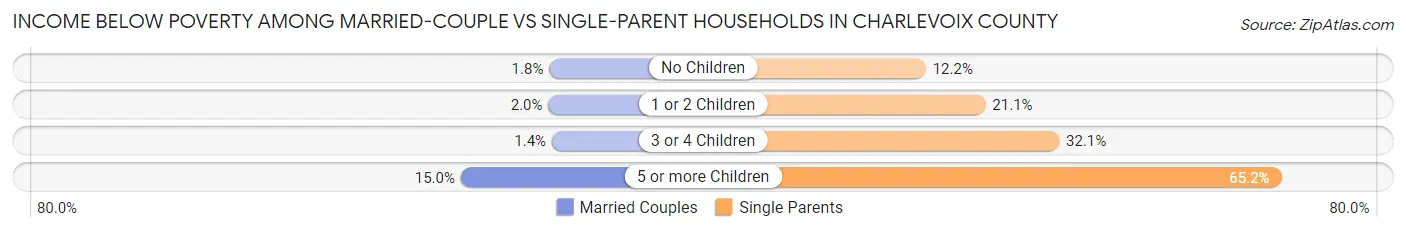
| Children | Married-Couple Families | Single-Parent Households |
| No Children | 82 (1.8%) | 84 (12.2%) |
| 1 or 2 Children | 28 (1.9%) | 178 (21.1%) |
| 3 or 4 Children | 5 (1.4%) | 26 (32.1%) |
| 5 or more Children | 6 (15.0%) | 15 (65.2%) |
| Total | 121 (1.9%) | 303 (18.5%) |
Race in Charlevoix County
The most populous races in Charlevoix County are White / Caucasian (24,621 | 94.1%), Two or more Races (891 | 3.4%), and Hispanic or Latino (631 | 2.4%).
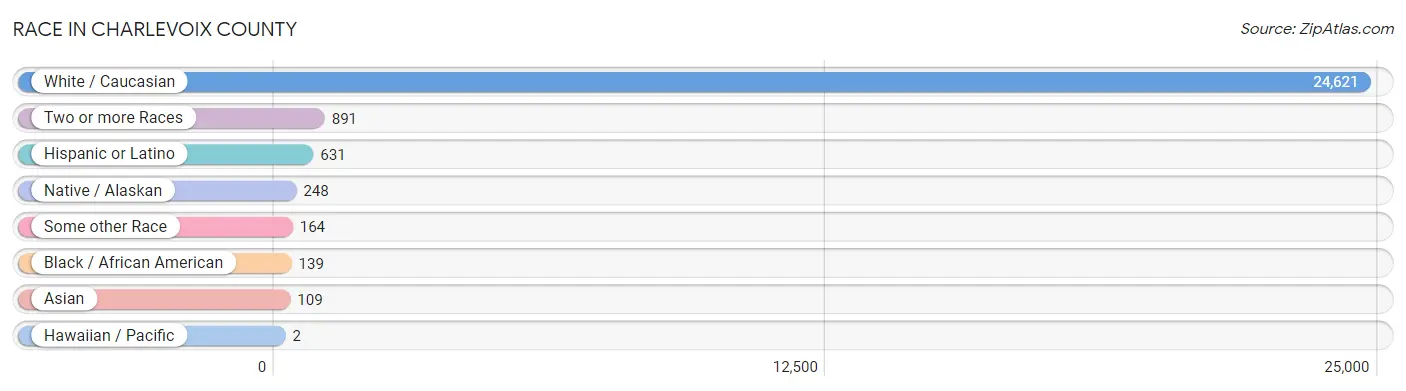
| Race | # Population | % Population |
| Asian | 109 | 0.4% |
| Black / African American | 139 | 0.5% |
| Hawaiian / Pacific | 2 | 0.0% |
| Hispanic or Latino | 631 | 2.4% |
| Native / Alaskan | 248 | 0.9% |
| White / Caucasian | 24,621 | 94.1% |
| Two or more Races | 891 | 3.4% |
| Some other Race | 164 | 0.6% |
| Total | 26,174 | 100.0% |
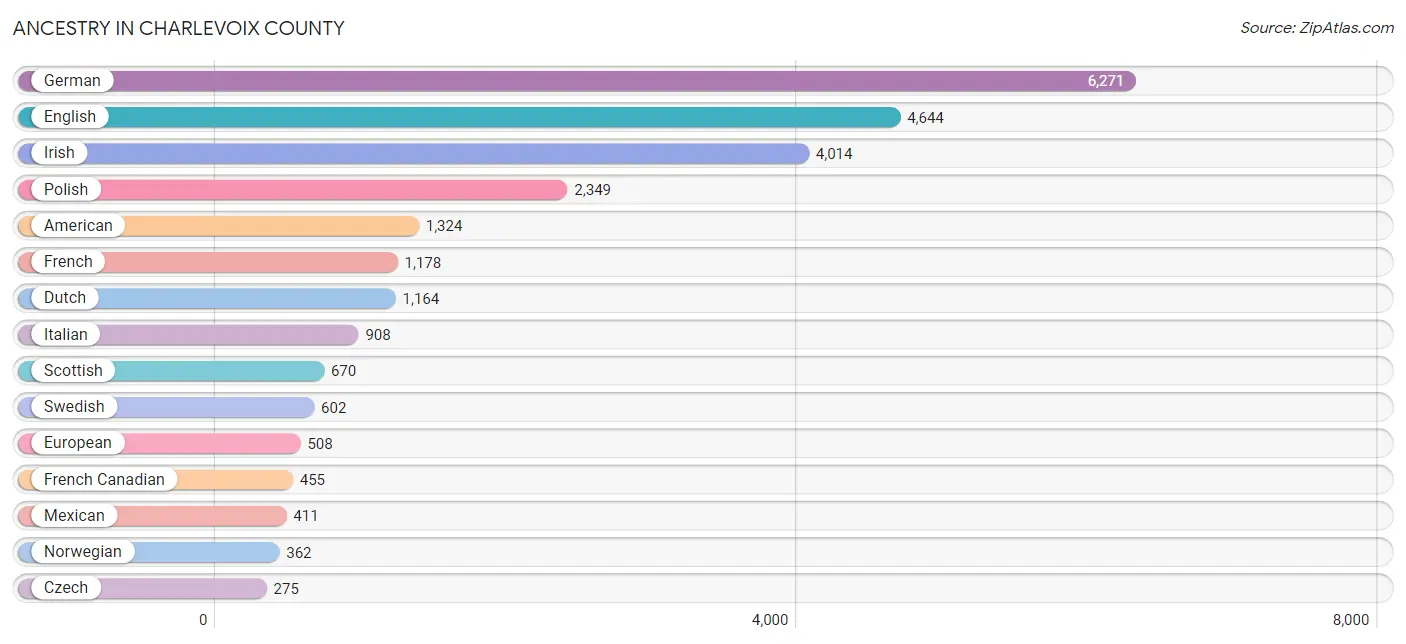
Ancestry in Charlevoix County
The most populous ancestries reported in Charlevoix County are German (6,271 | 24.0%), English (4,644 | 17.7%), Irish (4,014 | 15.3%), Polish (2,349 | 9.0%), and American (1,324 | 5.1%), together accounting for 71.1% of all Charlevoix County residents.
| Ancestry | # Population | % Population |
| African | 4 | 0.0% |
| Alaska Native | 5 | 0.0% |
| Albanian | 13 | 0.1% |
| American | 1,324 | 5.1% |
| Arab | 66 | 0.3% |
| Argentinean | 4 | 0.0% |
| Armenian | 5 | 0.0% |
| Australian | 11 | 0.0% |
| Austrian | 57 | 0.2% |
| Bangladeshi | 25 | 0.1% |
| Basque | 3 | 0.0% |
| Belgian | 95 | 0.4% |
| Bhutanese | 76 | 0.3% |
| Blackfeet | 30 | 0.1% |
| Brazilian | 25 | 0.1% |
| British | 202 | 0.8% |
| Burmese | 30 | 0.1% |
| Canadian | 111 | 0.4% |
| Celtic | 15 | 0.1% |
| Central American | 54 | 0.2% |
| Cherokee | 77 | 0.3% |
| Chippewa | 241 | 0.9% |
| Colombian | 7 | 0.0% |
| Costa Rican | 9 | 0.0% |
| Croatian | 39 | 0.2% |
| Czech | 275 | 1.1% |
| Czechoslovakian | 29 | 0.1% |
| Danish | 122 | 0.5% |
| Dutch | 1,164 | 4.4% |
| Eastern European | 65 | 0.3% |
| English | 4,644 | 17.7% |
| Ethiopian | 12 | 0.1% |
| European | 508 | 1.9% |
| Finnish | 272 | 1.0% |
| French | 1,178 | 4.5% |
| French American Indian | 10 | 0.0% |
| French Canadian | 455 | 1.7% |
| German | 6,271 | 24.0% |
| German Russian | 6 | 0.0% |
| Greek | 27 | 0.1% |
| Guatemalan | 20 | 0.1% |
| Honduran | 17 | 0.1% |
| Hungarian | 234 | 0.9% |
| Indian (Asian) | 31 | 0.1% |
| Irish | 4,014 | 15.3% |
| Iroquois | 25 | 0.1% |
| Israeli | 17 | 0.1% |
| Italian | 908 | 3.5% |
| Jamaican | 7 | 0.0% |
| Korean | 75 | 0.3% |
| Latvian | 3 | 0.0% |
| Lebanese | 30 | 0.1% |
| Lithuanian | 58 | 0.2% |
| Macedonian | 2 | 0.0% |
| Maltese | 20 | 0.1% |
| Mexican | 411 | 1.6% |
| Mexican American Indian | 3 | 0.0% |
| Native Hawaiian | 14 | 0.1% |
| Navajo | 22 | 0.1% |
| Northern European | 86 | 0.3% |
| Norwegian | 362 | 1.4% |
| Ottawa | 79 | 0.3% |
| Polish | 2,349 | 9.0% |
| Portuguese | 10 | 0.0% |
| Potawatomi | 5 | 0.0% |
| Puerto Rican | 124 | 0.5% |
| Romanian | 33 | 0.1% |
| Russian | 116 | 0.4% |
| Salvadoran | 8 | 0.0% |
| Samoan | 8 | 0.0% |
| Scandinavian | 134 | 0.5% |
| Scotch-Irish | 211 | 0.8% |
| Scottish | 670 | 2.6% |
| Slavic | 3 | 0.0% |
| Slovak | 91 | 0.4% |
| Slovene | 4 | 0.0% |
| South American | 11 | 0.0% |
| South American Indian | 4 | 0.0% |
| Spaniard | 3 | 0.0% |
| Spanish | 28 | 0.1% |
| Sri Lankan | 19 | 0.1% |
| Subsaharan African | 16 | 0.1% |
| Swedish | 602 | 2.3% |
| Swiss | 67 | 0.3% |
| Syrian | 25 | 0.1% |
| Thai | 3 | 0.0% |
| Ukrainian | 80 | 0.3% |
| Welsh | 226 | 0.9% |
| Yugoslavian | 15 | 0.1% |
| Yup'ik | 10 | 0.0% | View All 90 Rows |
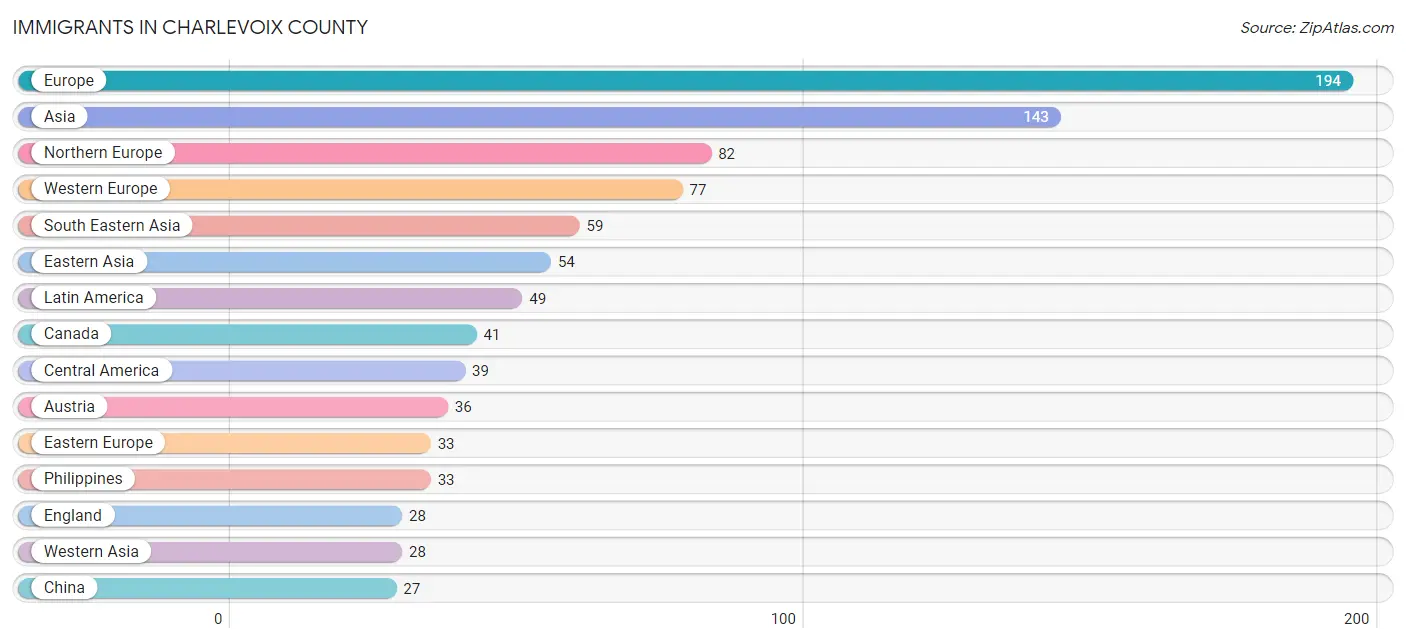
Immigrants in Charlevoix County
The most numerous immigrant groups reported in Charlevoix County came from Europe (194 | 0.7%), Asia (143 | 0.5%), Northern Europe (82 | 0.3%), Western Europe (77 | 0.3%), and South Eastern Asia (59 | 0.2%), together accounting for 2.1% of all Charlevoix County residents.
| Immigration Origin | # Population | % Population |
| Africa | 16 | 0.1% |
| Asia | 143 | 0.5% |
| Australia | 2 | 0.0% |
| Austria | 36 | 0.1% |
| Canada | 41 | 0.2% |
| Caribbean | 4 | 0.0% |
| Central America | 39 | 0.2% |
| China | 27 | 0.1% |
| Colombia | 6 | 0.0% |
| Eastern Africa | 12 | 0.1% |
| Eastern Asia | 54 | 0.2% |
| Eastern Europe | 33 | 0.1% |
| El Salvador | 8 | 0.0% |
| England | 28 | 0.1% |
| Ethiopia | 12 | 0.1% |
| Europe | 194 | 0.7% |
| France | 6 | 0.0% |
| Germany | 25 | 0.1% |
| Guatemala | 1 | 0.0% |
| Honduras | 3 | 0.0% |
| Hungary | 1 | 0.0% |
| India | 2 | 0.0% |
| Ireland | 3 | 0.0% |
| Israel | 17 | 0.1% |
| Jamaica | 4 | 0.0% |
| Japan | 7 | 0.0% |
| Korea | 20 | 0.1% |
| Latin America | 49 | 0.2% |
| Lithuania | 5 | 0.0% |
| Mexico | 27 | 0.1% |
| Morocco | 3 | 0.0% |
| Netherlands | 10 | 0.0% |
| North Macedonia | 2 | 0.0% |
| Northern Africa | 3 | 0.0% |
| Northern Europe | 82 | 0.3% |
| Oceania | 2 | 0.0% |
| Philippines | 33 | 0.1% |
| Romania | 13 | 0.1% |
| Russia | 1 | 0.0% |
| Scotland | 1 | 0.0% |
| South America | 6 | 0.0% |
| South Central Asia | 2 | 0.0% |
| South Eastern Asia | 59 | 0.2% |
| Southern Europe | 2 | 0.0% |
| Spain | 1 | 0.0% |
| Sweden | 23 | 0.1% |
| Syria | 6 | 0.0% |
| Thailand | 7 | 0.0% |
| Ukraine | 8 | 0.0% |
| Vietnam | 19 | 0.1% |
| Western Asia | 28 | 0.1% |
| Western Europe | 77 | 0.3% | View All 52 Rows |
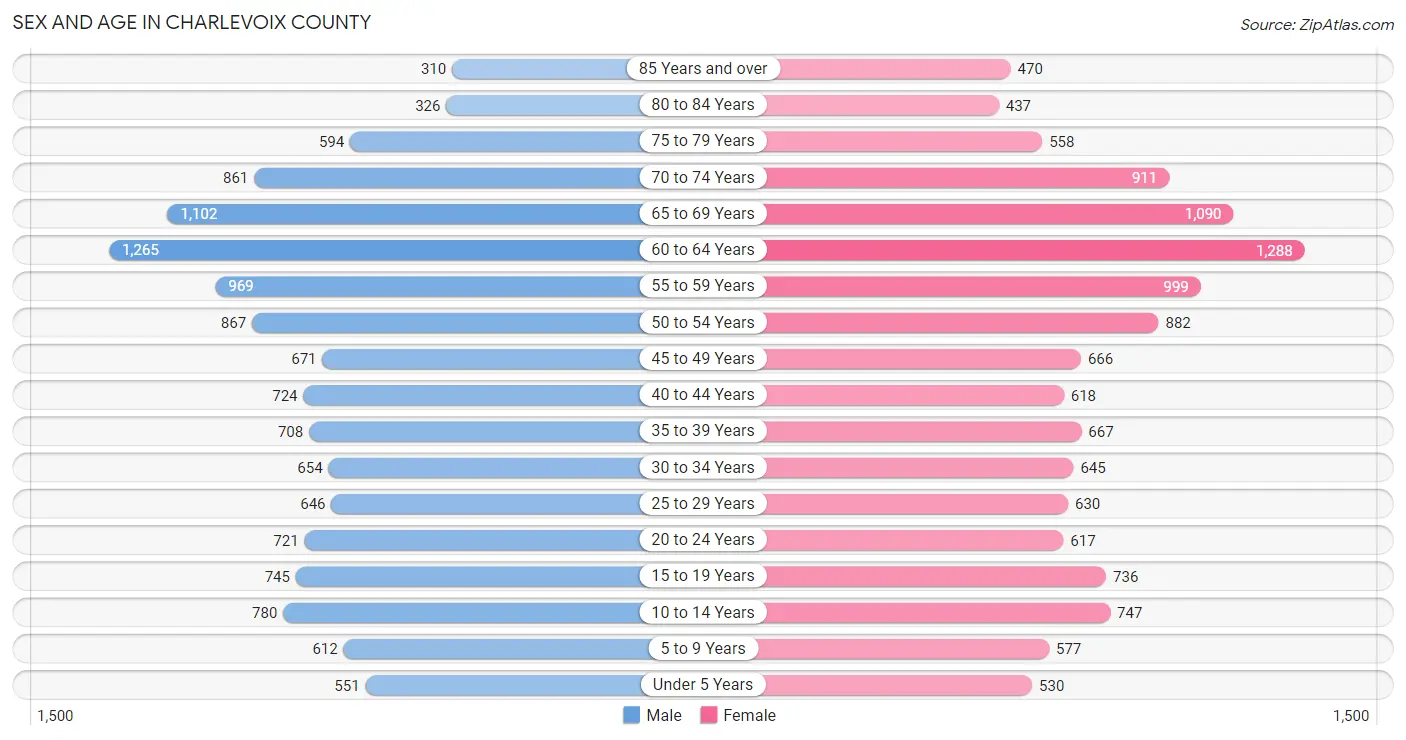
Sex and Age in Charlevoix County
Sex and Age in Charlevoix County
The most populous age groups in Charlevoix County are 60 to 64 Years (1,265 | 9.7%) for men and 60 to 64 Years (1,288 | 9.9%) for women.
| Age Bracket | Male | Female |
| Under 5 Years | 551 (4.2%) | 530 (4.1%) |
| 5 to 9 Years | 612 (4.7%) | 577 (4.4%) |
| 10 to 14 Years | 780 (5.9%) | 747 (5.7%) |
| 15 to 19 Years | 745 (5.7%) | 736 (5.6%) |
| 20 to 24 Years | 721 (5.5%) | 617 (4.7%) |
| 25 to 29 Years | 646 (4.9%) | 630 (4.8%) |
| 30 to 34 Years | 654 (5.0%) | 645 (4.9%) |
| 35 to 39 Years | 708 (5.4%) | 667 (5.1%) |
| 40 to 44 Years | 724 (5.5%) | 618 (4.7%) |
| 45 to 49 Years | 671 (5.1%) | 666 (5.1%) |
| 50 to 54 Years | 867 (6.6%) | 882 (6.8%) |
| 55 to 59 Years | 969 (7.4%) | 999 (7.6%) |
| 60 to 64 Years | 1,265 (9.7%) | 1,288 (9.9%) |
| 65 to 69 Years | 1,102 (8.4%) | 1,090 (8.3%) |
| 70 to 74 Years | 861 (6.6%) | 911 (7.0%) |
| 75 to 79 Years | 594 (4.5%) | 558 (4.3%) |
| 80 to 84 Years | 326 (2.5%) | 437 (3.3%) |
| 85 Years and over | 310 (2.4%) | 470 (3.6%) |
| Total | 13,106 (100.0%) | 13,068 (100.0%) |
Families and Households in Charlevoix County
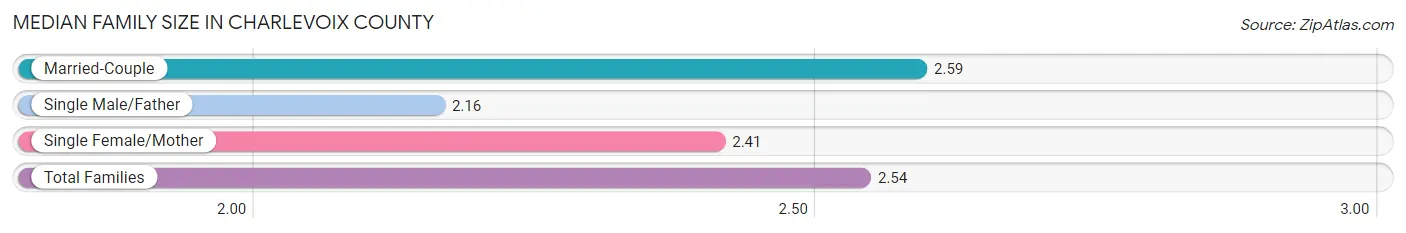
Median Family Size in Charlevoix County
The median family size in Charlevoix County is 2.54 persons per family, with married-couple families (6,328 | 79.5%) accounting for the largest median family size of 2.59 persons per family. On the other hand, single male/father families (581 | 7.3%) represent the smallest median family size with 2.16 persons per family.
| Family Type | # Families | Family Size |
| Married-Couple | 6,328 (79.5%) | 2.59 |
| Single Male/Father | 581 (7.3%) | 2.16 |
| Single Female/Mother | 1,053 (13.2%) | 2.41 |
| Total Families | 7,962 (100.0%) | 2.54 |
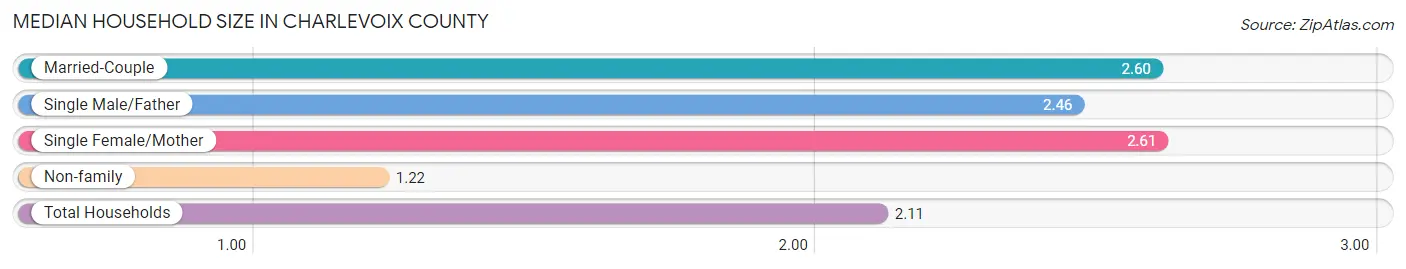
Median Household Size in Charlevoix County
The median household size in Charlevoix County is 2.11 persons per household, with single female/mother households (1,053 | 8.6%) accounting for the largest median household size of 2.61 persons per household. non-family households (4,270 | 34.9%) represent the smallest median household size with 1.22 persons per household.
| Household Type | # Households | Household Size |
| Married-Couple | 6,328 (51.7%) | 2.60 |
| Single Male/Father | 581 (4.8%) | 2.46 |
| Single Female/Mother | 1,053 (8.6%) | 2.61 |
| Non-family | 4,270 (34.9%) | 1.22 |
| Total Households | 12,232 (100.0%) | 2.11 |
Household Size by Marriage Status in Charlevoix County
Out of a total of 12,232 households in Charlevoix County, 7,962 (65.1%) are family households, while 4,270 (34.9%) are nonfamily households. The most numerous type of family households are 2-person households, comprising 4,632, and the most common type of nonfamily households are 1-person households, comprising 3,379.
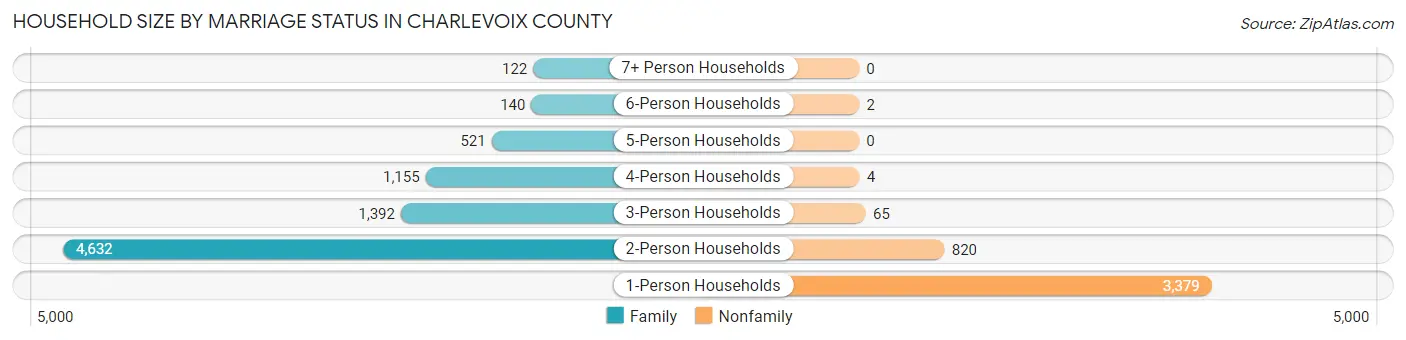
| Household Size | Family Households | Nonfamily Households |
| 1-Person Households | - | 3,379 (27.6%) |
| 2-Person Households | 4,632 (37.9%) | 820 (6.7%) |
| 3-Person Households | 1,392 (11.4%) | 65 (0.5%) |
| 4-Person Households | 1,155 (9.4%) | 4 (0.0%) |
| 5-Person Households | 521 (4.3%) | 0 (0.0%) |
| 6-Person Households | 140 (1.1%) | 2 (0.0%) |
| 7+ Person Households | 122 (1.0%) | 0 (0.0%) |
| Total | 7,962 (65.1%) | 4,270 (34.9%) |
Female Fertility in Charlevoix County
Fertility by Age in Charlevoix County
Average fertility rate in Charlevoix County is 50.0 births per 1,000 women. Women in the age bracket of 20 to 34 years have the highest fertility rate with 100.0 births per 1,000 women. Women in the age bracket of 20 to 34 years acount for 79.8% of all women with births.
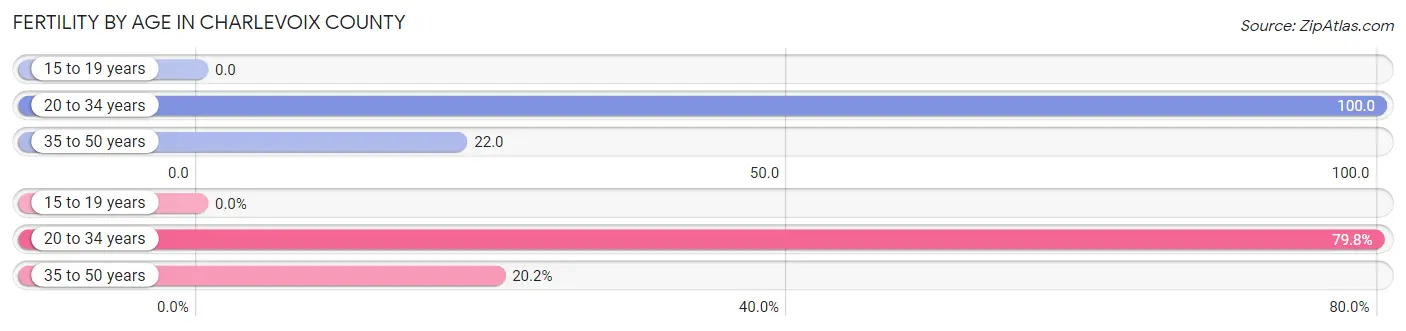
| Age Bracket | Women with Births | Births / 1,000 Women |
| 15 to 19 years | 0 (0.0%) | 0.0 |
| 20 to 34 years | 190 (79.8%) | 100.0 |
| 35 to 50 years | 48 (20.2%) | 22.0 |
| Total | 238 (100.0%) | 50.0 |
Fertility by Age by Marriage Status in Charlevoix County
70.6% of women with births (238) in Charlevoix County are married. The highest percentage of unmarried women with births falls into 35 to 50 years age bracket with 50.0% of them unmarried at the time of birth, while the lowest percentage of unmarried women with births belong to 20 to 34 years age bracket with 24.2% of them unmarried.
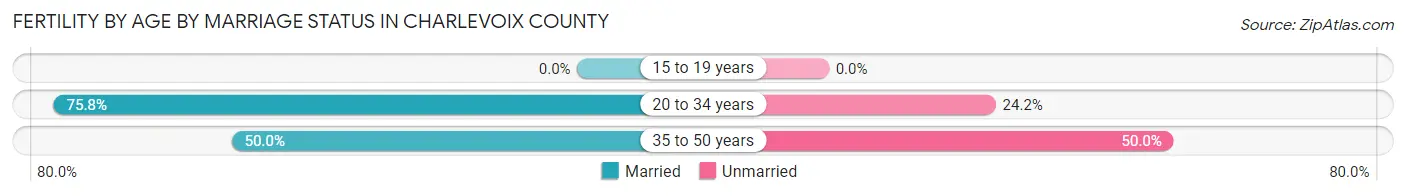
| Age Bracket | Married | Unmarried |
| 15 to 19 years | 0 (0.0%) | 0 (0.0%) |
| 20 to 34 years | 144 (75.8%) | 46 (24.2%) |
| 35 to 50 years | 24 (50.0%) | 24 (50.0%) |
| Total | 168 (70.6%) | 70 (29.4%) |
Fertility by Education in Charlevoix County
Average fertility rate in Charlevoix County is 50.0 births per 1,000 women. Women with the education attainment of graduate degree have the highest fertility rate of 74.0 births per 1,000 women, while women with the education attainment of less than high school have the lowest fertility at 24.0 births per 1,000 women. Women with the education attainment of college or associate's degree represent 35.7% of all women with births.
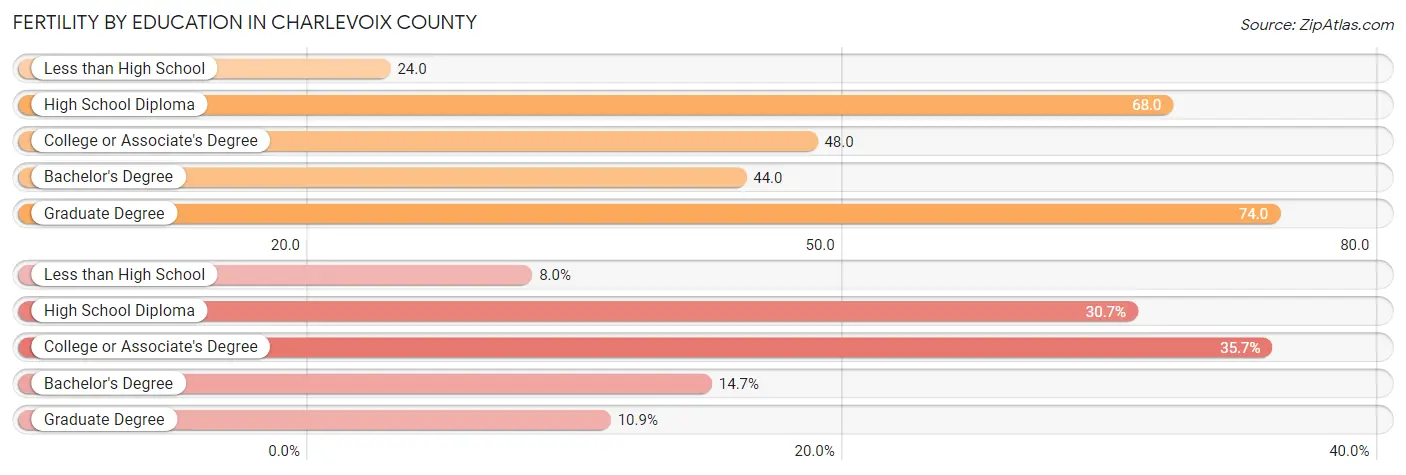
| Educational Attainment | Women with Births | Births / 1,000 Women |
| Less than High School | 19 (8.0%) | 24.0 |
| High School Diploma | 73 (30.7%) | 68.0 |
| College or Associate's Degree | 85 (35.7%) | 48.0 |
| Bachelor's Degree | 35 (14.7%) | 44.0 |
| Graduate Degree | 26 (10.9%) | 74.0 |
| Total | 238 (100.0%) | 50.0 |
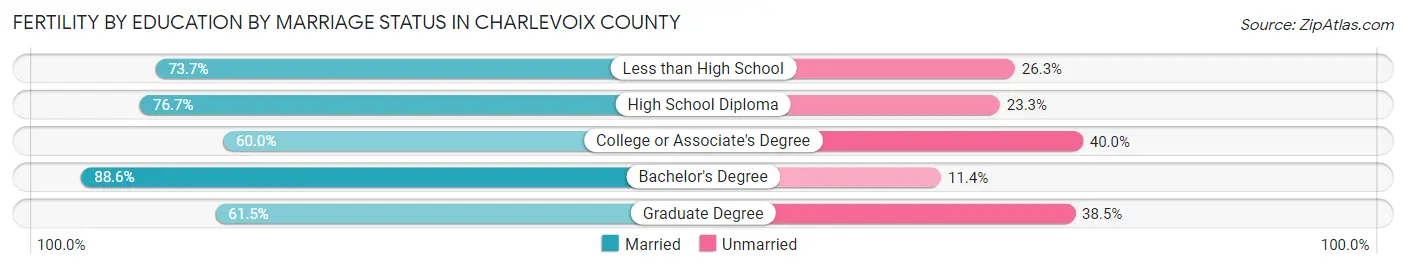
Fertility by Education by Marriage Status in Charlevoix County
29.4% of women with births in Charlevoix County are unmarried. Women with the educational attainment of bachelor's degree are most likely to be married with 88.6% of them married at childbirth, while women with the educational attainment of college or associate's degree are least likely to be married with 40.0% of them unmarried at childbirth.
| Educational Attainment | Married | Unmarried |
| Less than High School | 14 (73.7%) | 5 (26.3%) |
| High School Diploma | 56 (76.7%) | 17 (23.3%) |
| College or Associate's Degree | 51 (60.0%) | 34 (40.0%) |
| Bachelor's Degree | 31 (88.6%) | 4 (11.4%) |
| Graduate Degree | 16 (61.5%) | 10 (38.5%) |
| Total | 168 (70.6%) | 70 (29.4%) |
Employment Characteristics in Charlevoix County
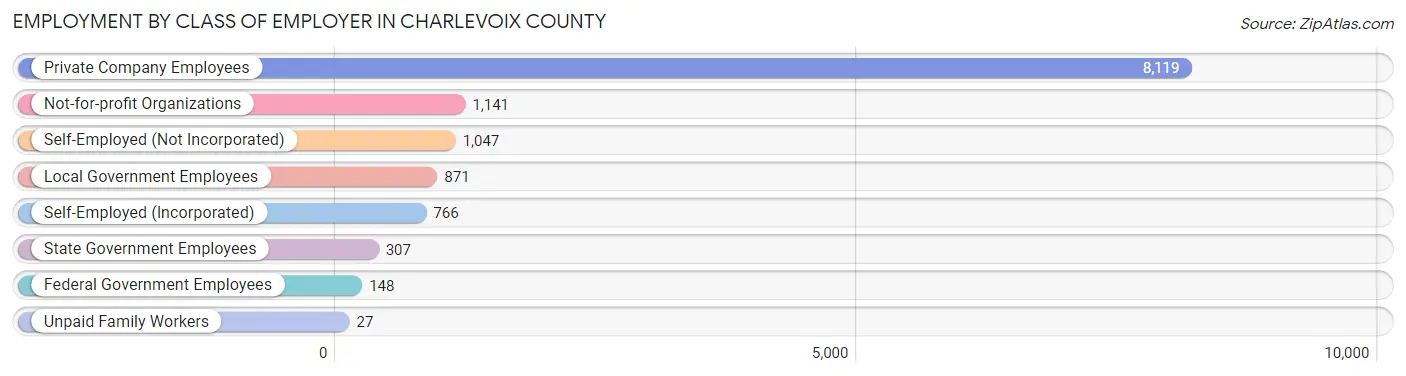
Employment by Class of Employer in Charlevoix County
Among the 12,426 employed individuals in Charlevoix County, private company employees (8,119 | 65.3%), not-for-profit organizations (1,141 | 9.2%), and self-employed (not incorporated) (1,047 | 8.4%) make up the most common classes of employment.
| Employer Class | # Employees | % Employees |
| Private Company Employees | 8,119 | 65.3% |
| Self-Employed (Incorporated) | 766 | 6.2% |
| Self-Employed (Not Incorporated) | 1,047 | 8.4% |
| Not-for-profit Organizations | 1,141 | 9.2% |
| Local Government Employees | 871 | 7.0% |
| State Government Employees | 307 | 2.5% |
| Federal Government Employees | 148 | 1.2% |
| Unpaid Family Workers | 27 | 0.2% |
| Total | 12,426 | 100.0% |
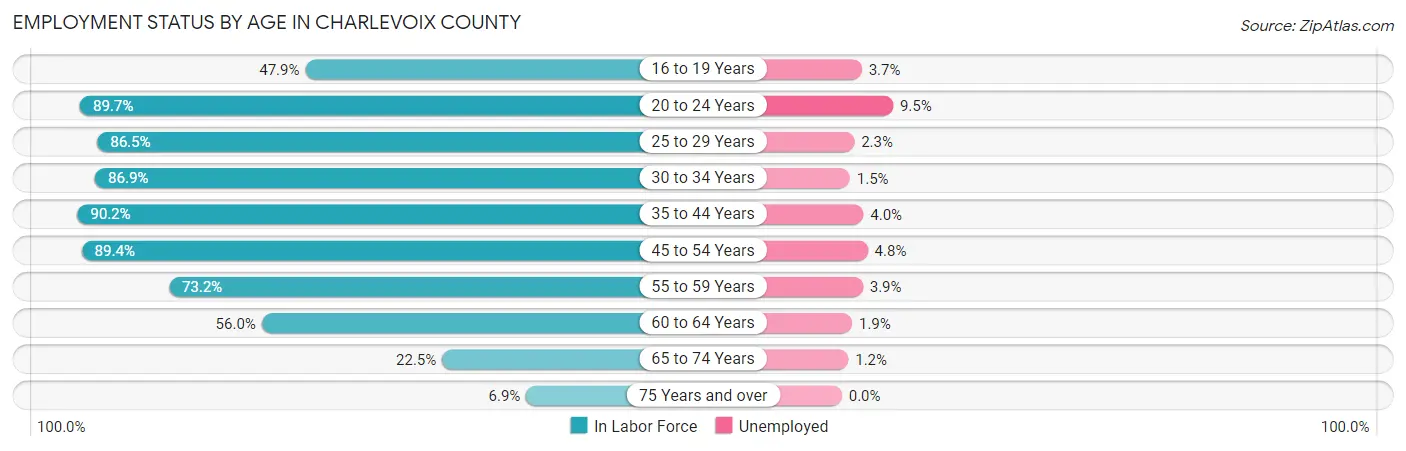
Employment Status by Age in Charlevoix County
According to the labor force statistics for Charlevoix County, out of the total population over 16 years of age (22,012), 59.6% or 13,119 individuals are in the labor force, with 3.8% or 499 of them unemployed. The age group with the highest labor force participation rate is 35 to 44 years, with 90.2% or 2,451 individuals in the labor force. Within the labor force, the 20 to 24 years age range has the highest percentage of unemployed individuals, with 9.5% or 114 of them being unemployed.
| Age Bracket | In Labor Force | Unemployed |
| 16 to 19 Years | 535 (47.9%) | 20 (3.7%) |
| 20 to 24 Years | 1,200 (89.7%) | 114 (9.5%) |
| 25 to 29 Years | 1,104 (86.5%) | 25 (2.3%) |
| 30 to 34 Years | 1,129 (86.9%) | 17 (1.5%) |
| 35 to 44 Years | 2,451 (90.2%) | 98 (4.0%) |
| 45 to 54 Years | 2,759 (89.4%) | 132 (4.8%) |
| 55 to 59 Years | 1,441 (73.2%) | 56 (3.9%) |
| 60 to 64 Years | 1,430 (56.0%) | 27 (1.9%) |
| 65 to 74 Years | 892 (22.5%) | 11 (1.2%) |
| 75 Years and over | 186 (6.9%) | 0 (0.0%) |
| Total | 13,119 (59.6%) | 499 (3.8%) |
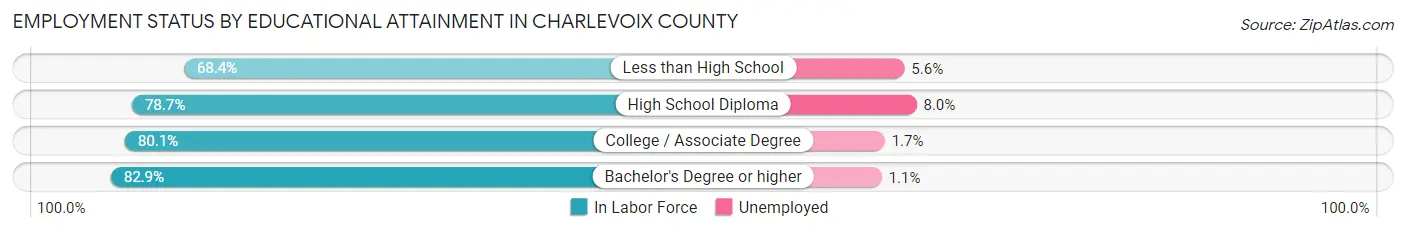
Employment Status by Educational Attainment in Charlevoix County
According to labor force statistics for Charlevoix County, 79.9% of individuals (10,306) out of the total population between 25 and 64 years of age (12,899) are in the labor force, with 3.4% or 350 of them being unemployed. The group with the highest labor force participation rate are those with the educational attainment of bachelor's degree or higher, with 82.9% or 3,198 individuals in the labor force. Within the labor force, individuals with high school diploma education have the highest percentage of unemployment, with 8.0% or 227 of them being unemployed.
| Educational Attainment | In Labor Force | Unemployed |
| Less than High School | 446 (68.4%) | 37 (5.6%) |
| High School Diploma | 2,843 (78.7%) | 289 (8.0%) |
| College / Associate Degree | 3,826 (80.1%) | 81 (1.7%) |
| Bachelor's Degree or higher | 3,198 (82.9%) | 42 (1.1%) |
| Total | 10,306 (79.9%) | 439 (3.4%) |
Employment Occupations by Sex in Charlevoix County
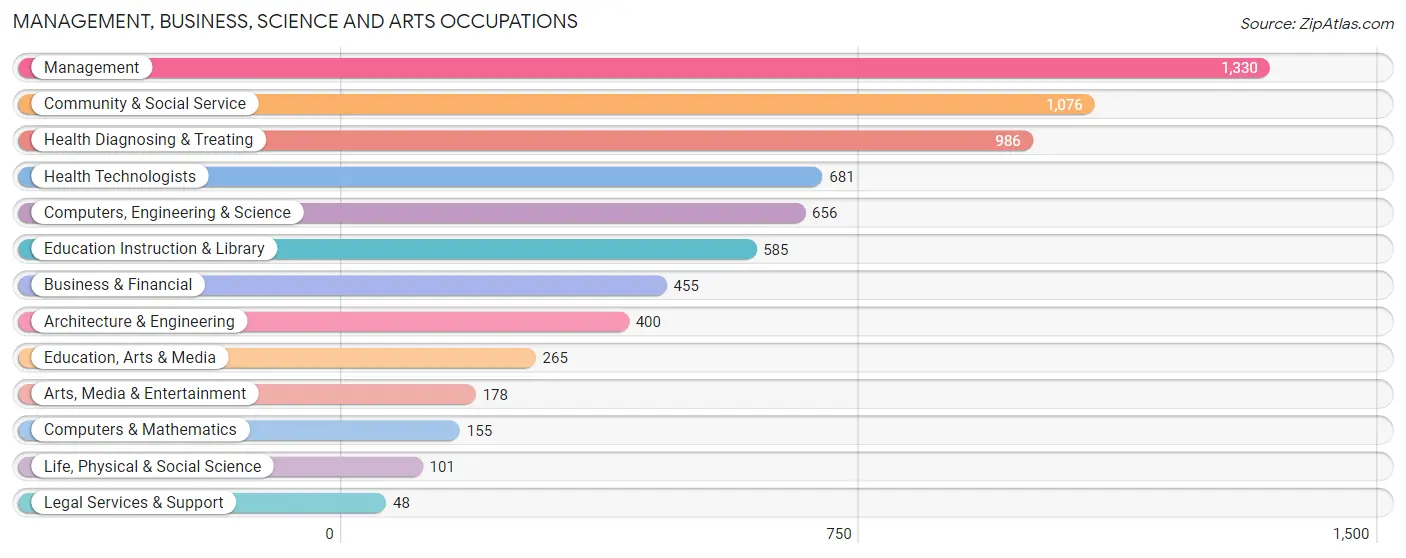
Management, Business, Science and Arts Occupations
The most common Management, Business, Science and Arts occupations in Charlevoix County are Management (1,330 | 10.5%), Community & Social Service (1,076 | 8.5%), Health Diagnosing & Treating (986 | 7.8%), Health Technologists (681 | 5.4%), and Computers, Engineering & Science (656 | 5.2%).
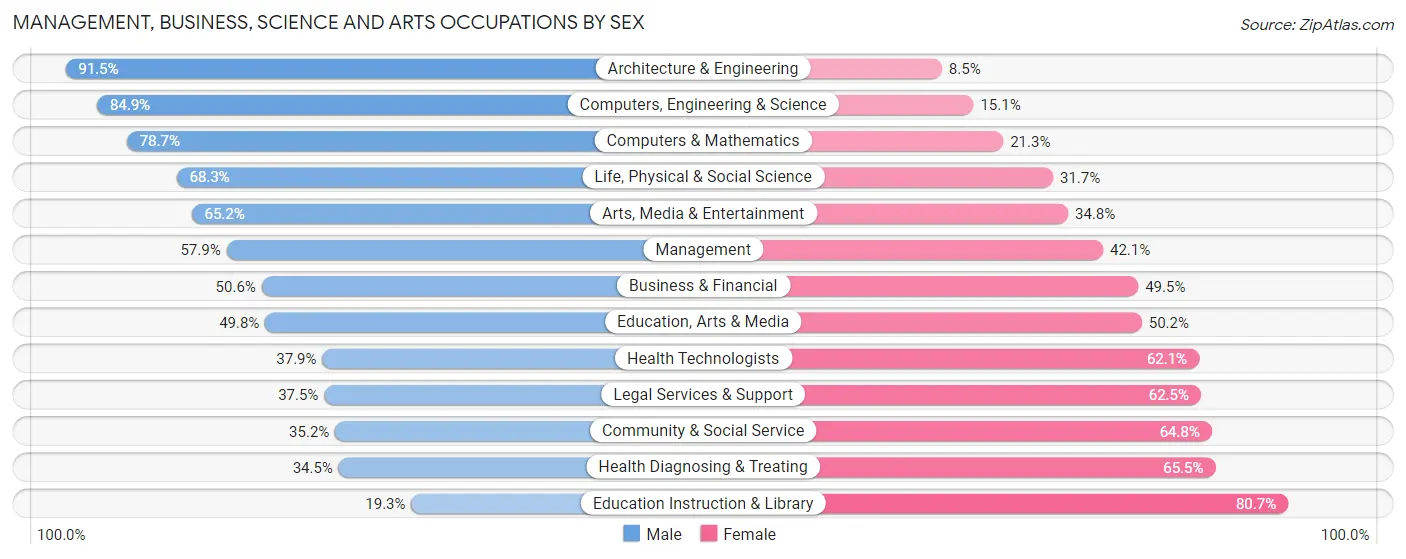
Management, Business, Science and Arts Occupations by Sex
Within the Management, Business, Science and Arts occupations in Charlevoix County, the most male-oriented occupations are Architecture & Engineering (91.5%), Computers, Engineering & Science (84.9%), and Computers & Mathematics (78.7%), while the most female-oriented occupations are Education Instruction & Library (80.7%), Health Diagnosing & Treating (65.5%), and Community & Social Service (64.8%).
| Occupation | Male | Female |
| Management | 770 (57.9%) | 560 (42.1%) |
| Business & Financial | 230 (50.5%) | 225 (49.4%) |
| Computers, Engineering & Science | 557 (84.9%) | 99 (15.1%) |
| Computers & Mathematics | 122 (78.7%) | 33 (21.3%) |
| Architecture & Engineering | 366 (91.5%) | 34 (8.5%) |
| Life, Physical & Social Science | 69 (68.3%) | 32 (31.7%) |
| Community & Social Service | 379 (35.2%) | 697 (64.8%) |
| Education, Arts & Media | 132 (49.8%) | 133 (50.2%) |
| Legal Services & Support | 18 (37.5%) | 30 (62.5%) |
| Education Instruction & Library | 113 (19.3%) | 472 (80.7%) |
| Arts, Media & Entertainment | 116 (65.2%) | 62 (34.8%) |
| Health Diagnosing & Treating | 340 (34.5%) | 646 (65.5%) |
| Health Technologists | 258 (37.9%) | 423 (62.1%) |
| Total (Category) | 2,276 (50.5%) | 2,227 (49.5%) |
| Total (Overall) | 6,798 (53.9%) | 5,817 (46.1%) |
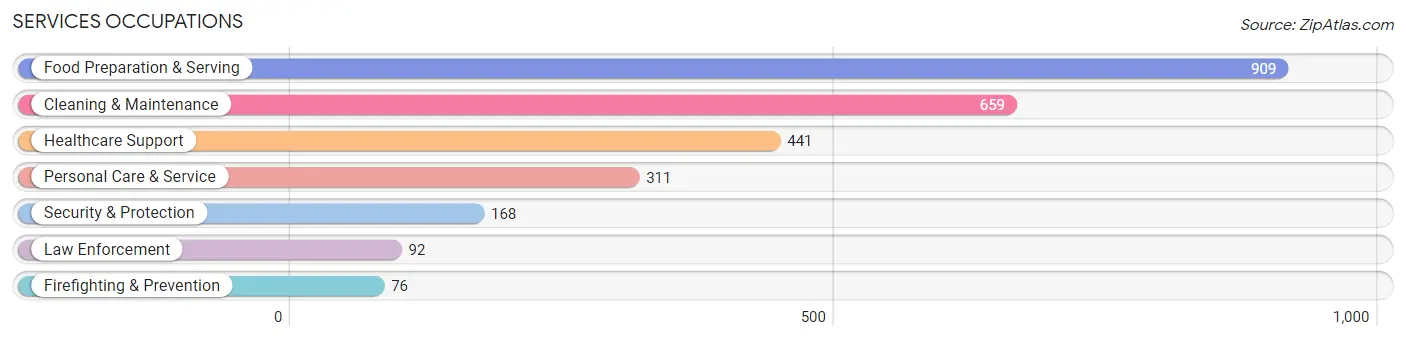
Services Occupations
The most common Services occupations in Charlevoix County are Food Preparation & Serving (909 | 7.2%), Cleaning & Maintenance (659 | 5.2%), Healthcare Support (441 | 3.5%), Personal Care & Service (311 | 2.5%), and Security & Protection (168 | 1.3%).
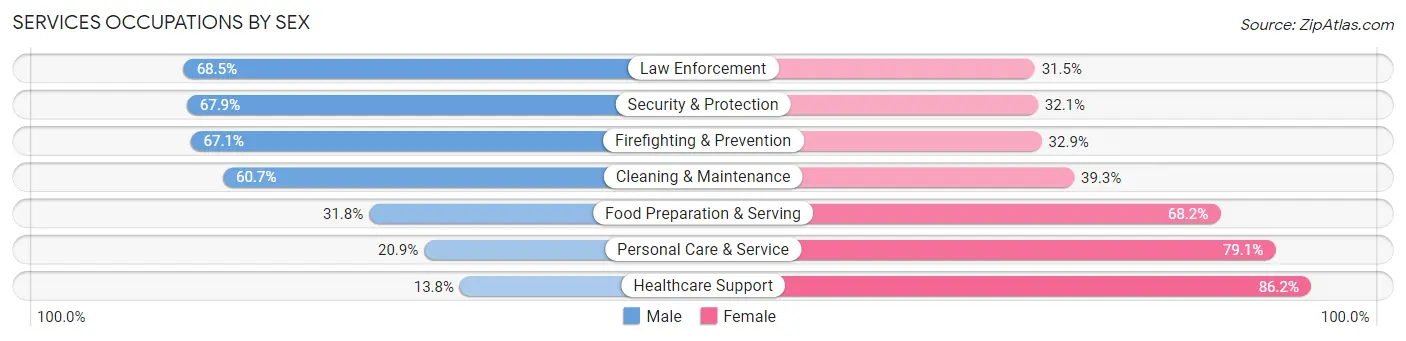
Services Occupations by Sex
Within the Services occupations in Charlevoix County, the most male-oriented occupations are Law Enforcement (68.5%), Security & Protection (67.9%), and Firefighting & Prevention (67.1%), while the most female-oriented occupations are Healthcare Support (86.2%), Personal Care & Service (79.1%), and Food Preparation & Serving (68.2%).
| Occupation | Male | Female |
| Healthcare Support | 61 (13.8%) | 380 (86.2%) |
| Security & Protection | 114 (67.9%) | 54 (32.1%) |
| Firefighting & Prevention | 51 (67.1%) | 25 (32.9%) |
| Law Enforcement | 63 (68.5%) | 29 (31.5%) |
| Food Preparation & Serving | 289 (31.8%) | 620 (68.2%) |
| Cleaning & Maintenance | 400 (60.7%) | 259 (39.3%) |
| Personal Care & Service | 65 (20.9%) | 246 (79.1%) |
| Total (Category) | 929 (37.3%) | 1,559 (62.7%) |
| Total (Overall) | 6,798 (53.9%) | 5,817 (46.1%) |
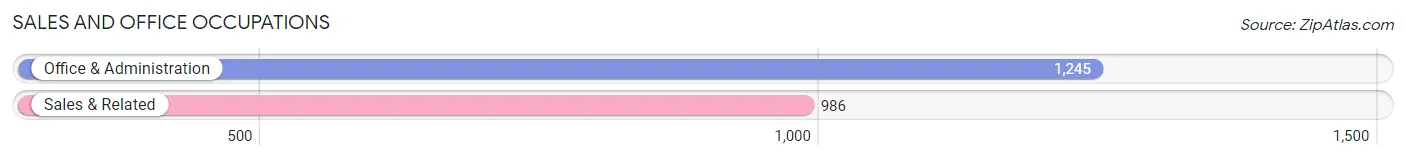
Sales and Office Occupations
The most common Sales and Office occupations in Charlevoix County are Office & Administration (1,245 | 9.9%), and Sales & Related (986 | 7.8%).
Sales and Office Occupations by Sex
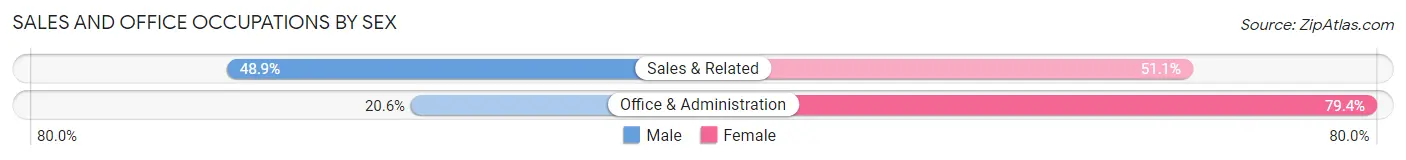
| Occupation | Male | Female |
| Sales & Related | 482 (48.9%) | 504 (51.1%) |
| Office & Administration | 256 (20.6%) | 989 (79.4%) |
| Total (Category) | 738 (33.1%) | 1,493 (66.9%) |
| Total (Overall) | 6,798 (53.9%) | 5,817 (46.1%) |
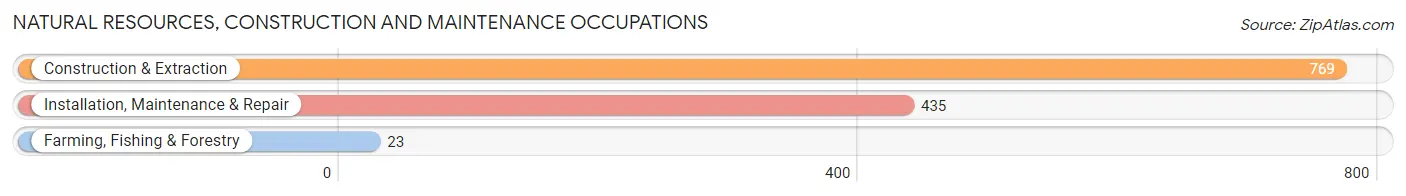
Natural Resources, Construction and Maintenance Occupations
The most common Natural Resources, Construction and Maintenance occupations in Charlevoix County are Construction & Extraction (769 | 6.1%), Installation, Maintenance & Repair (435 | 3.5%), and Farming, Fishing & Forestry (23 | 0.2%).
Natural Resources, Construction and Maintenance Occupations by Sex
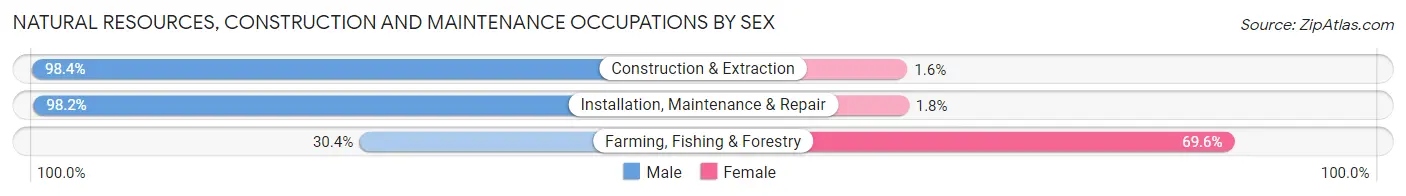
| Occupation | Male | Female |
| Farming, Fishing & Forestry | 7 (30.4%) | 16 (69.6%) |
| Construction & Extraction | 757 (98.4%) | 12 (1.6%) |
| Installation, Maintenance & Repair | 427 (98.2%) | 8 (1.8%) |
| Total (Category) | 1,191 (97.1%) | 36 (2.9%) |
| Total (Overall) | 6,798 (53.9%) | 5,817 (46.1%) |
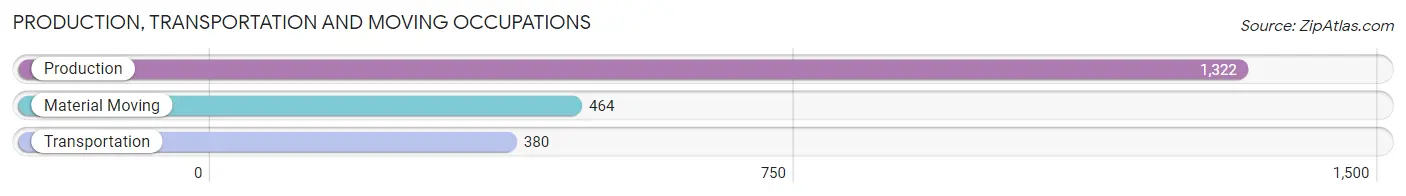
Production, Transportation and Moving Occupations
The most common Production, Transportation and Moving occupations in Charlevoix County are Production (1,322 | 10.5%), Material Moving (464 | 3.7%), and Transportation (380 | 3.0%).
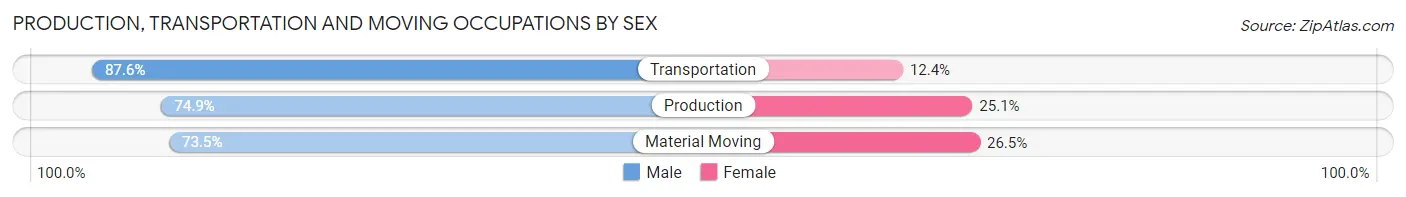
Production, Transportation and Moving Occupations by Sex
| Occupation | Male | Female |
| Production | 990 (74.9%) | 332 (25.1%) |
| Transportation | 333 (87.6%) | 47 (12.4%) |
| Material Moving | 341 (73.5%) | 123 (26.5%) |
| Total (Category) | 1,664 (76.8%) | 502 (23.2%) |
| Total (Overall) | 6,798 (53.9%) | 5,817 (46.1%) |
Employment Industries by Sex in Charlevoix County
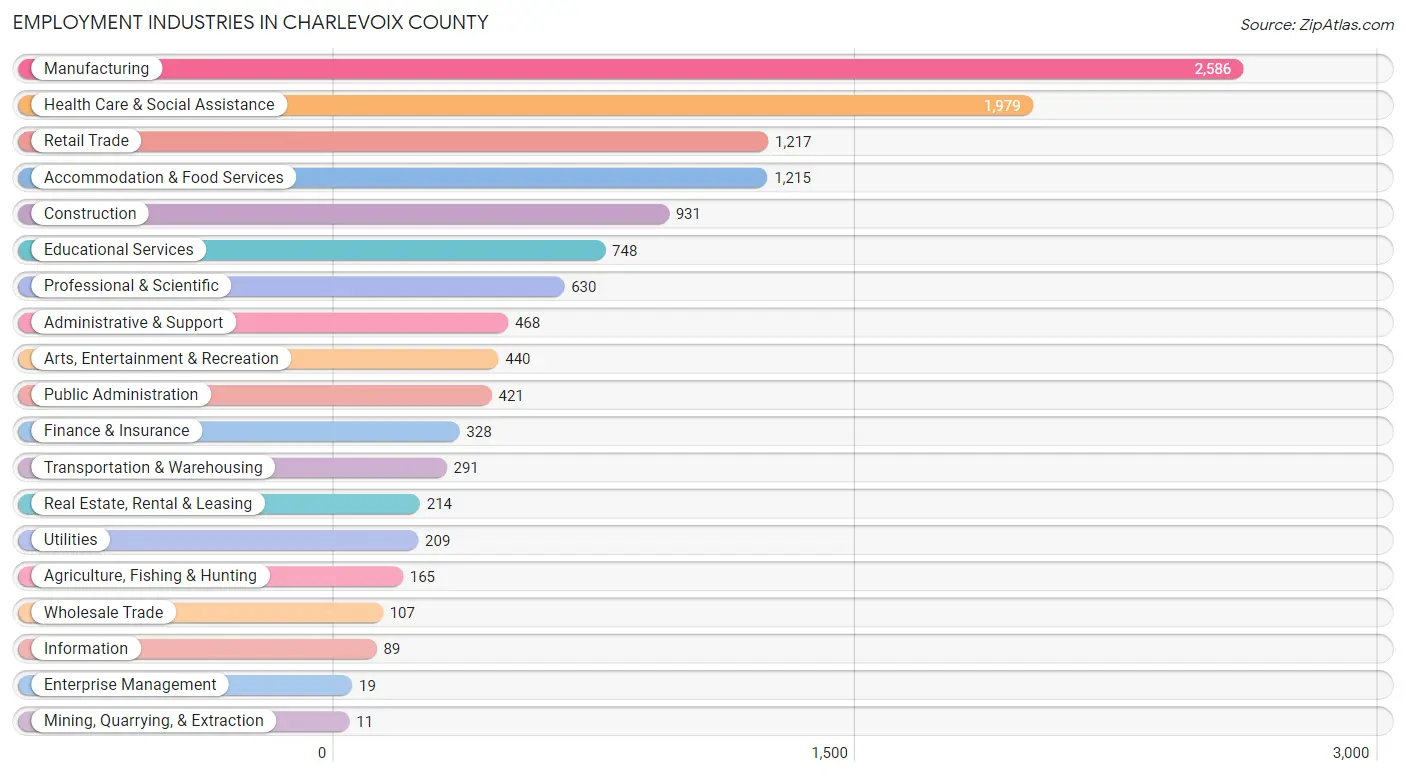
Employment Industries in Charlevoix County
The major employment industries in Charlevoix County include Manufacturing (2,586 | 20.5%), Health Care & Social Assistance (1,979 | 15.7%), Retail Trade (1,217 | 9.7%), Accommodation & Food Services (1,215 | 9.6%), and Construction (931 | 7.4%).
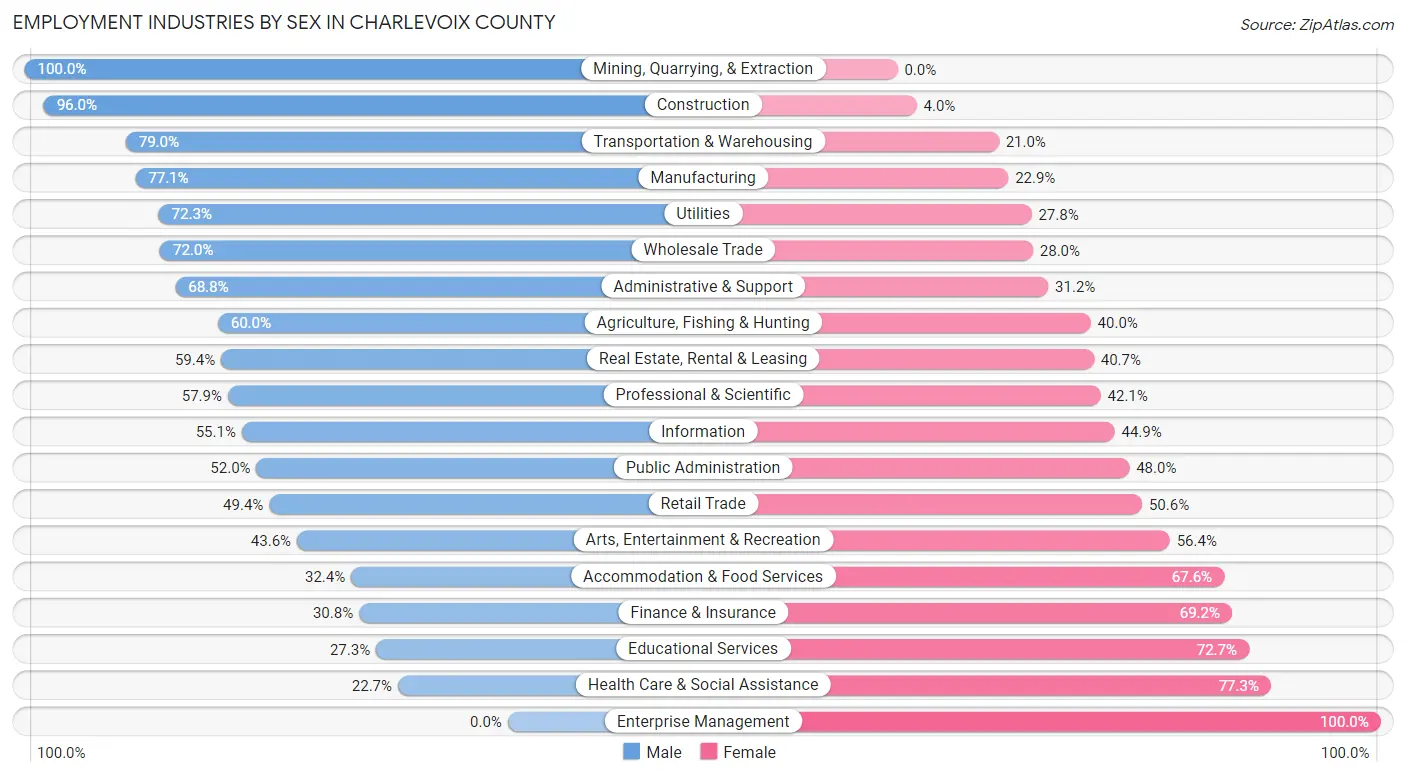
Employment Industries by Sex in Charlevoix County
The Charlevoix County industries that see more men than women are Mining, Quarrying, & Extraction (100.0%), Construction (96.0%), and Transportation & Warehousing (79.0%), whereas the industries that tend to have a higher number of women are Enterprise Management (100.0%), Health Care & Social Assistance (77.3%), and Educational Services (72.7%).
| Industry | Male | Female |
| Agriculture, Fishing & Hunting | 99 (60.0%) | 66 (40.0%) |
| Mining, Quarrying, & Extraction | 11 (100.0%) | 0 (0.0%) |
| Construction | 894 (96.0%) | 37 (4.0%) |
| Manufacturing | 1,993 (77.1%) | 593 (22.9%) |
| Wholesale Trade | 77 (72.0%) | 30 (28.0%) |
| Retail Trade | 601 (49.4%) | 616 (50.6%) |
| Transportation & Warehousing | 230 (79.0%) | 61 (21.0%) |
| Utilities | 151 (72.3%) | 58 (27.8%) |
| Information | 49 (55.1%) | 40 (44.9%) |
| Finance & Insurance | 101 (30.8%) | 227 (69.2%) |
| Real Estate, Rental & Leasing | 127 (59.4%) | 87 (40.6%) |
| Professional & Scientific | 365 (57.9%) | 265 (42.1%) |
| Enterprise Management | 0 (0.0%) | 19 (100.0%) |
| Administrative & Support | 322 (68.8%) | 146 (31.2%) |
| Educational Services | 204 (27.3%) | 544 (72.7%) |
| Health Care & Social Assistance | 450 (22.7%) | 1,529 (77.3%) |
| Arts, Entertainment & Recreation | 192 (43.6%) | 248 (56.4%) |
| Accommodation & Food Services | 394 (32.4%) | 821 (67.6%) |
| Public Administration | 219 (52.0%) | 202 (48.0%) |
| Total | 6,798 (53.9%) | 5,817 (46.1%) |
Education in Charlevoix County
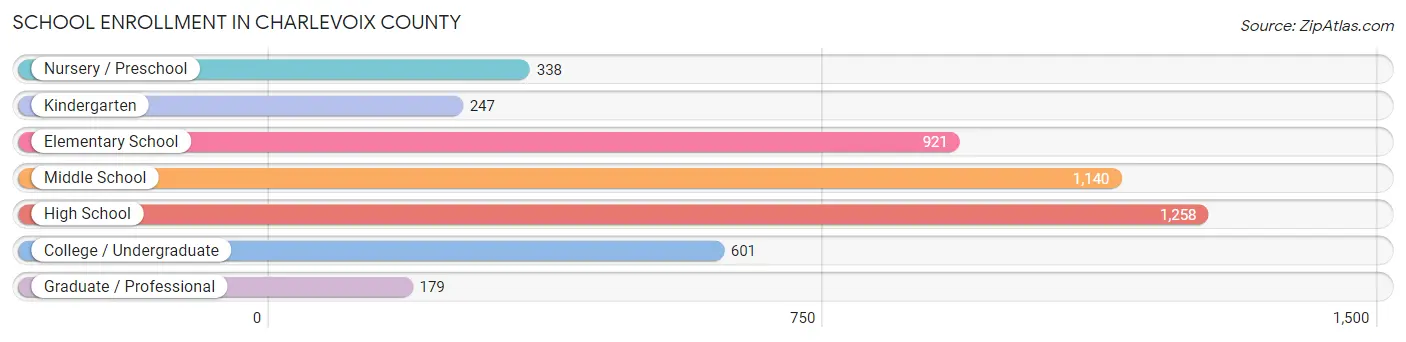
School Enrollment in Charlevoix County
The most common levels of schooling among the 4,684 students in Charlevoix County are high school (1,258 | 26.9%), middle school (1,140 | 24.3%), and elementary school (921 | 19.7%).
| School Level | # Students | % Students |
| Nursery / Preschool | 338 | 7.2% |
| Kindergarten | 247 | 5.3% |
| Elementary School | 921 | 19.7% |
| Middle School | 1,140 | 24.3% |
| High School | 1,258 | 26.9% |
| College / Undergraduate | 601 | 12.8% |
| Graduate / Professional | 179 | 3.8% |
| Total | 4,684 | 100.0% |
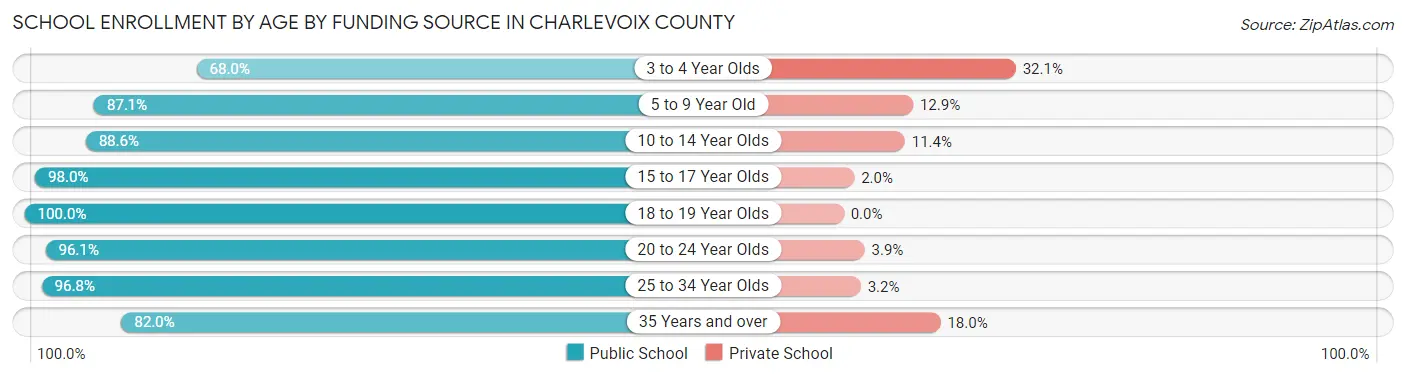
School Enrollment by Age by Funding Source in Charlevoix County
Out of a total of 4,684 students who are enrolled in schools in Charlevoix County, 459 (9.8%) attend a private institution, while the remaining 4,225 (90.2%) are enrolled in public schools. The age group of 3 to 4 year olds has the highest likelihood of being enrolled in private schools, with 75 (32.1% in the age bracket) enrolled. Conversely, the age group of 18 to 19 year olds has the lowest likelihood of being enrolled in a private school, with 305 (100.0% in the age bracket) attending a public institution.
| Age Bracket | Public School | Private School |
| 3 to 4 Year Olds | 159 (67.9%) | 75 (32.1%) |
| 5 to 9 Year Old | 985 (87.1%) | 146 (12.9%) |
| 10 to 14 Year Olds | 1,268 (88.6%) | 163 (11.4%) |
| 15 to 17 Year Olds | 898 (98.0%) | 18 (2.0%) |
| 18 to 19 Year Olds | 305 (100.0%) | 0 (0.0%) |
| 20 to 24 Year Olds | 296 (96.1%) | 12 (3.9%) |
| 25 to 34 Year Olds | 122 (96.8%) | 4 (3.2%) |
| 35 Years and over | 191 (82.0%) | 42 (18.0%) |
| Total | 4,225 (90.2%) | 459 (9.8%) |
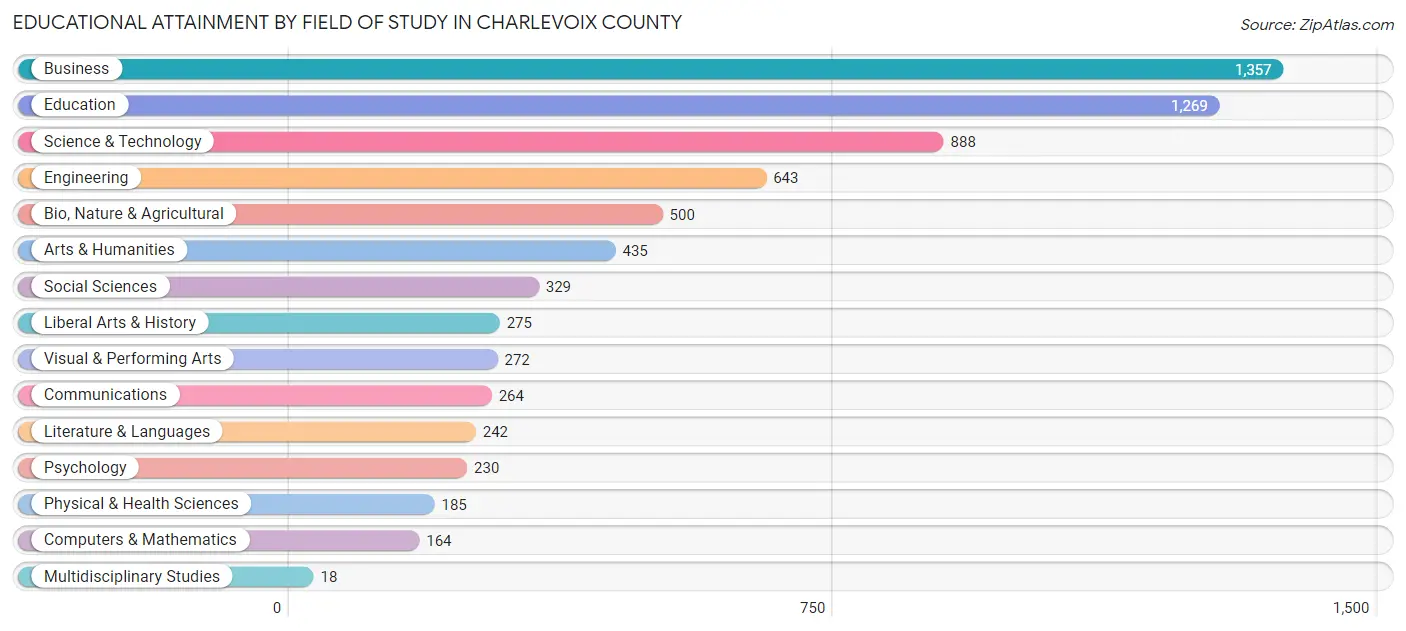
Educational Attainment by Field of Study in Charlevoix County
Business (1,357 | 19.2%), education (1,269 | 17.9%), science & technology (888 | 12.6%), engineering (643 | 9.1%), and bio, nature & agricultural (500 | 7.1%) are the most common fields of study among 7,071 individuals in Charlevoix County who have obtained a bachelor's degree or higher.
| Field of Study | # Graduates | % Graduates |
| Computers & Mathematics | 164 | 2.3% |
| Bio, Nature & Agricultural | 500 | 7.1% |
| Physical & Health Sciences | 185 | 2.6% |
| Psychology | 230 | 3.3% |
| Social Sciences | 329 | 4.6% |
| Engineering | 643 | 9.1% |
| Multidisciplinary Studies | 18 | 0.3% |
| Science & Technology | 888 | 12.6% |
| Business | 1,357 | 19.2% |
| Education | 1,269 | 17.9% |
| Literature & Languages | 242 | 3.4% |
| Liberal Arts & History | 275 | 3.9% |
| Visual & Performing Arts | 272 | 3.8% |
| Communications | 264 | 3.7% |
| Arts & Humanities | 435 | 6.1% |
| Total | 7,071 | 100.0% |
Transportation & Commute in Charlevoix County
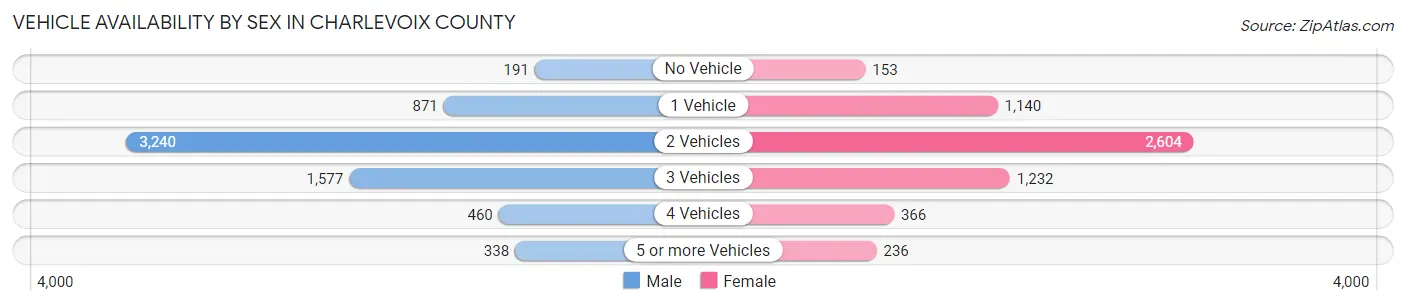
Vehicle Availability by Sex in Charlevoix County
The most prevalent vehicle ownership categories in Charlevoix County are males with 2 vehicles (3,240, accounting for 48.5%) and females with 2 vehicles (2,604, making up 56.5%).
| Vehicles Available | Male | Female |
| No Vehicle | 191 (2.9%) | 153 (2.7%) |
| 1 Vehicle | 871 (13.0%) | 1,140 (19.9%) |
| 2 Vehicles | 3,240 (48.5%) | 2,604 (45.4%) |
| 3 Vehicles | 1,577 (23.6%) | 1,232 (21.5%) |
| 4 Vehicles | 460 (6.9%) | 366 (6.4%) |
| 5 or more Vehicles | 338 (5.1%) | 236 (4.1%) |
| Total | 6,677 (100.0%) | 5,731 (100.0%) |
Commute Time in Charlevoix County
The most frequently occuring commute durations in Charlevoix County are 10 to 14 minutes (1,912 commuters, 16.8%), 20 to 24 minutes (1,804 commuters, 15.9%), and 5 to 9 minutes (1,774 commuters, 15.6%).
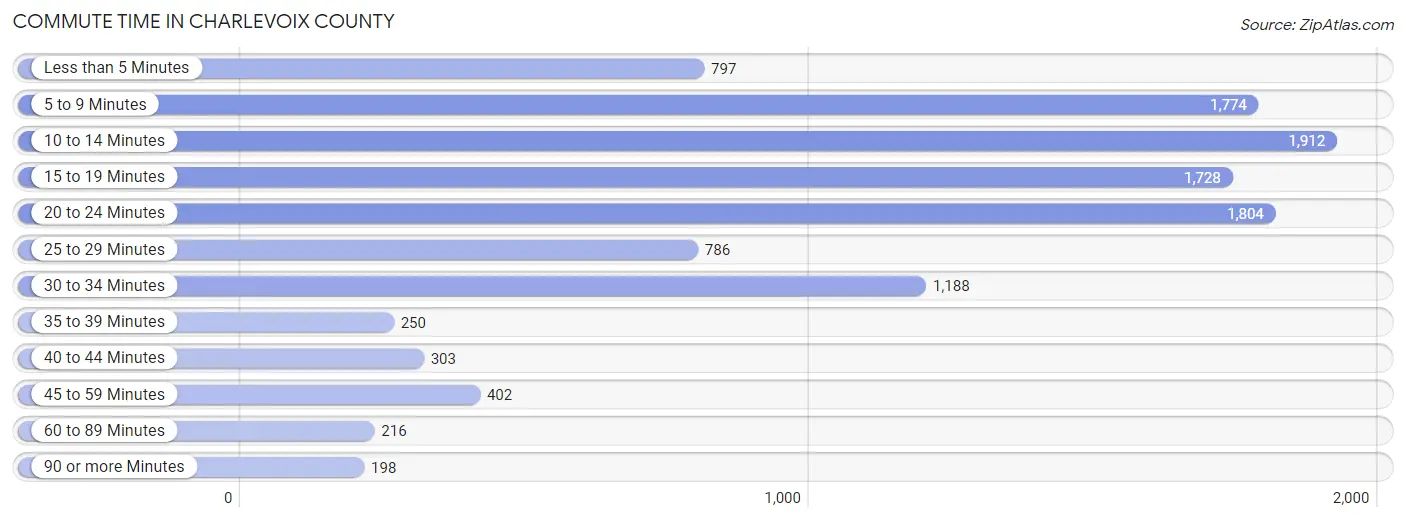
| Commute Time | # Commuters | % Commuters |
| Less than 5 Minutes | 797 | 7.0% |
| 5 to 9 Minutes | 1,774 | 15.6% |
| 10 to 14 Minutes | 1,912 | 16.8% |
| 15 to 19 Minutes | 1,728 | 15.2% |
| 20 to 24 Minutes | 1,804 | 15.9% |
| 25 to 29 Minutes | 786 | 6.9% |
| 30 to 34 Minutes | 1,188 | 10.5% |
| 35 to 39 Minutes | 250 | 2.2% |
| 40 to 44 Minutes | 303 | 2.7% |
| 45 to 59 Minutes | 402 | 3.5% |
| 60 to 89 Minutes | 216 | 1.9% |
| 90 or more Minutes | 198 | 1.7% |
Commute Time by Sex in Charlevoix County
The most common commute times in Charlevoix County are 10 to 14 minutes (1,086 commuters, 18.0%) for males and 15 to 19 minutes (892 commuters, 16.8%) for females.
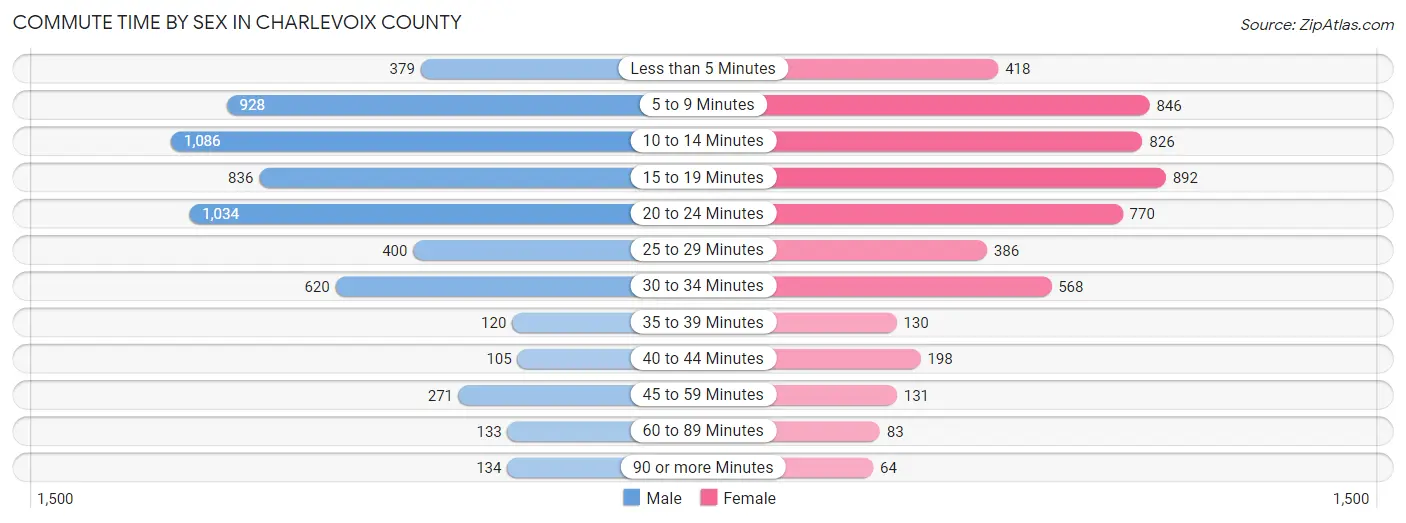
| Commute Time | Male | Female |
| Less than 5 Minutes | 379 (6.3%) | 418 (7.9%) |
| 5 to 9 Minutes | 928 (15.3%) | 846 (15.9%) |
| 10 to 14 Minutes | 1,086 (18.0%) | 826 (15.5%) |
| 15 to 19 Minutes | 836 (13.8%) | 892 (16.8%) |
| 20 to 24 Minutes | 1,034 (17.1%) | 770 (14.5%) |
| 25 to 29 Minutes | 400 (6.6%) | 386 (7.3%) |
| 30 to 34 Minutes | 620 (10.2%) | 568 (10.7%) |
| 35 to 39 Minutes | 120 (2.0%) | 130 (2.5%) |
| 40 to 44 Minutes | 105 (1.7%) | 198 (3.7%) |
| 45 to 59 Minutes | 271 (4.5%) | 131 (2.5%) |
| 60 to 89 Minutes | 133 (2.2%) | 83 (1.6%) |
| 90 or more Minutes | 134 (2.2%) | 64 (1.2%) |
Time of Departure to Work by Sex in Charlevoix County
The most frequent times of departure to work in Charlevoix County are 7:30 AM to 7:59 AM (1,065, 17.6%) for males and 7:30 AM to 7:59 AM (1,029, 19.4%) for females.
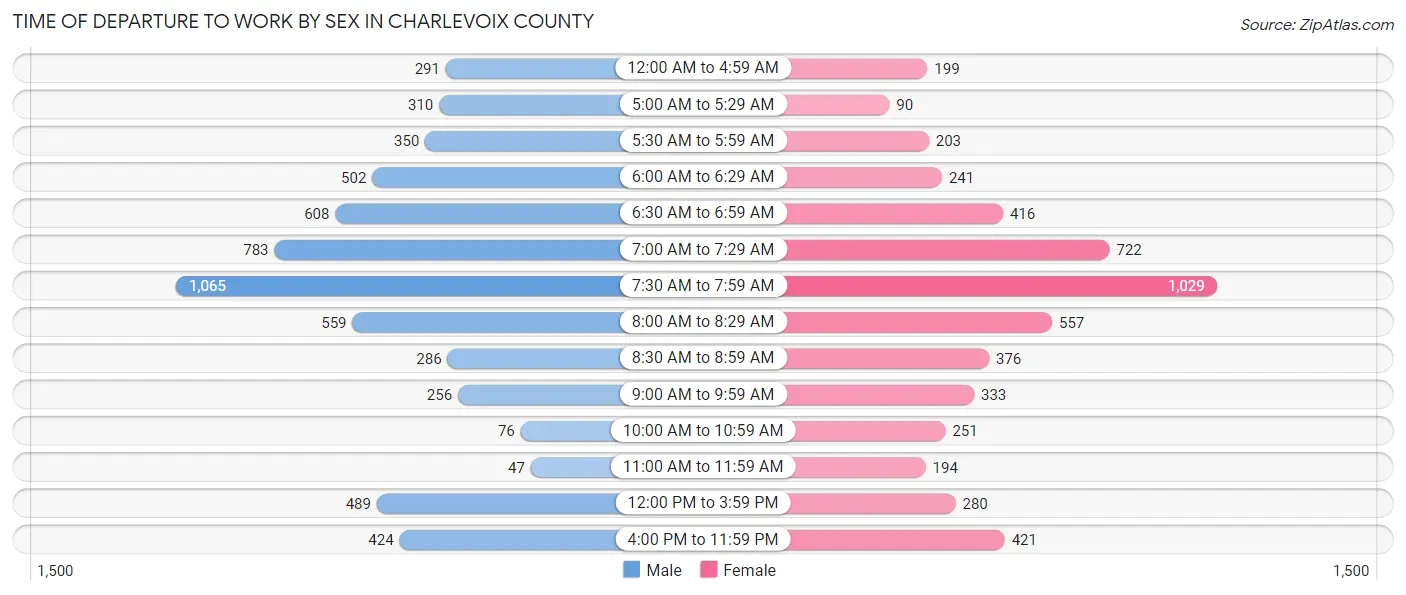
| Time of Departure | Male | Female |
| 12:00 AM to 4:59 AM | 291 (4.8%) | 199 (3.7%) |
| 5:00 AM to 5:29 AM | 310 (5.1%) | 90 (1.7%) |
| 5:30 AM to 5:59 AM | 350 (5.8%) | 203 (3.8%) |
| 6:00 AM to 6:29 AM | 502 (8.3%) | 241 (4.5%) |
| 6:30 AM to 6:59 AM | 608 (10.1%) | 416 (7.8%) |
| 7:00 AM to 7:29 AM | 783 (13.0%) | 722 (13.6%) |
| 7:30 AM to 7:59 AM | 1,065 (17.6%) | 1,029 (19.4%) |
| 8:00 AM to 8:29 AM | 559 (9.2%) | 557 (10.5%) |
| 8:30 AM to 8:59 AM | 286 (4.7%) | 376 (7.1%) |
| 9:00 AM to 9:59 AM | 256 (4.2%) | 333 (6.3%) |
| 10:00 AM to 10:59 AM | 76 (1.3%) | 251 (4.7%) |
| 11:00 AM to 11:59 AM | 47 (0.8%) | 194 (3.6%) |
| 12:00 PM to 3:59 PM | 489 (8.1%) | 280 (5.3%) |
| 4:00 PM to 11:59 PM | 424 (7.0%) | 421 (7.9%) |
| Total | 6,046 (100.0%) | 5,312 (100.0%) |
Housing Occupancy in Charlevoix County
Occupancy by Ownership in Charlevoix County
Of the total 12,232 dwellings in Charlevoix County, owner-occupied units account for 9,990 (81.7%), while renter-occupied units make up 2,242 (18.3%).
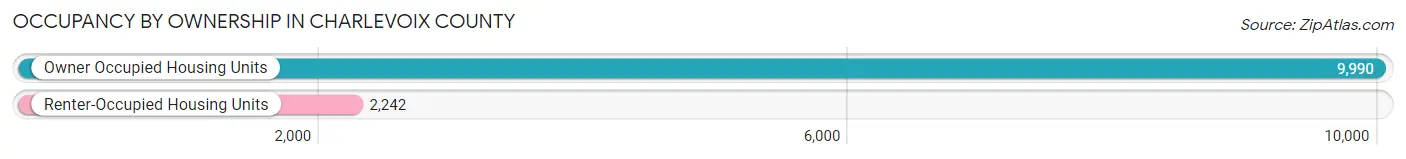
| Occupancy | # Housing Units | % Housing Units |
| Owner Occupied Housing Units | 9,990 | 81.7% |
| Renter-Occupied Housing Units | 2,242 | 18.3% |
| Total Occupied Housing Units | 12,232 | 100.0% |
Occupancy by Household Size in Charlevoix County
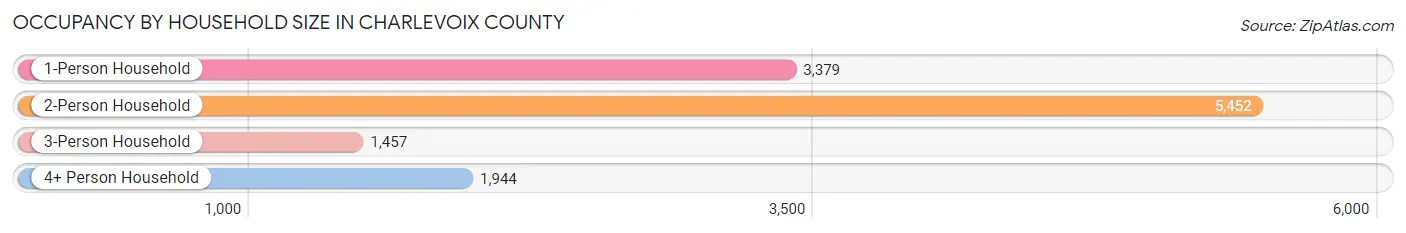
| Household Size | # Housing Units | % Housing Units |
| 1-Person Household | 3,379 | 27.6% |
| 2-Person Household | 5,452 | 44.6% |
| 3-Person Household | 1,457 | 11.9% |
| 4+ Person Household | 1,944 | 15.9% |
| Total Housing Units | 12,232 | 100.0% |
Occupancy by Ownership by Household Size in Charlevoix County
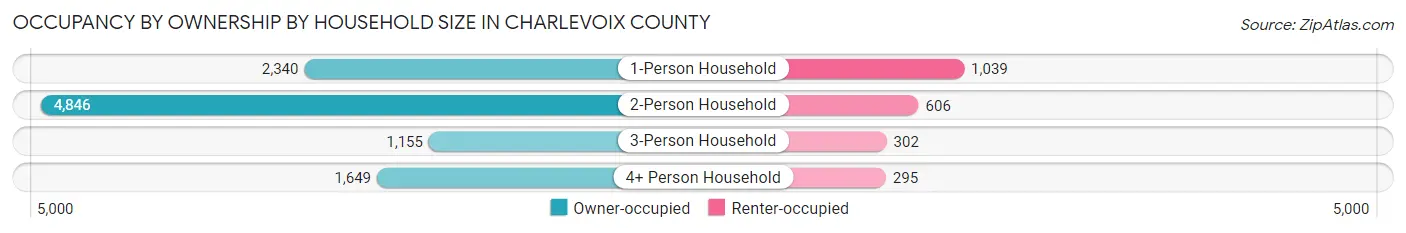
| Household Size | Owner-occupied | Renter-occupied |
| 1-Person Household | 2,340 (69.3%) | 1,039 (30.7%) |
| 2-Person Household | 4,846 (88.9%) | 606 (11.1%) |
| 3-Person Household | 1,155 (79.3%) | 302 (20.7%) |
| 4+ Person Household | 1,649 (84.8%) | 295 (15.2%) |
| Total Housing Units | 9,990 (81.7%) | 2,242 (18.3%) |
Occupancy by Educational Attainment in Charlevoix County
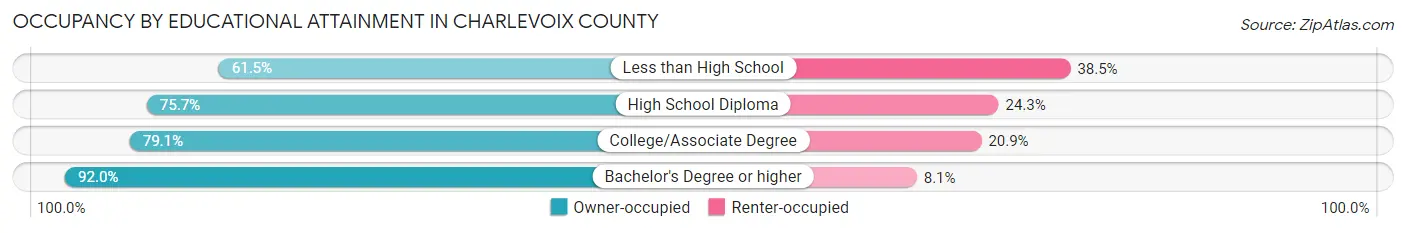
| Household Size | Owner-occupied | Renter-occupied |
| Less than High School | 391 (61.5%) | 245 (38.5%) |
| High School Diploma | 2,357 (75.7%) | 755 (24.3%) |
| College/Associate Degree | 3,450 (79.1%) | 910 (20.9%) |
| Bachelor's Degree or higher | 3,792 (91.9%) | 332 (8.1%) |
Occupancy by Age of Householder in Charlevoix County
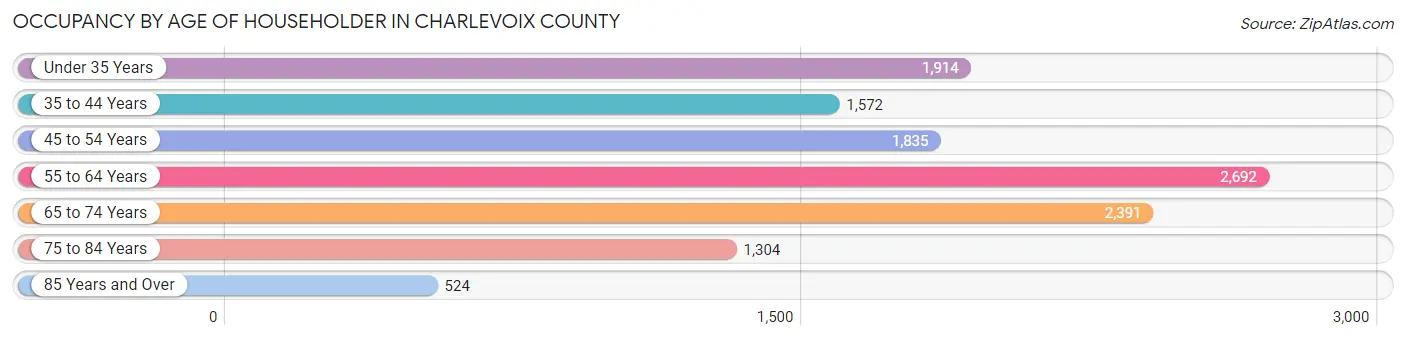
| Age Bracket | # Households | % Households |
| Under 35 Years | 1,914 | 15.7% |
| 35 to 44 Years | 1,572 | 12.9% |
| 45 to 54 Years | 1,835 | 15.0% |
| 55 to 64 Years | 2,692 | 22.0% |
| 65 to 74 Years | 2,391 | 19.6% |
| 75 to 84 Years | 1,304 | 10.7% |
| 85 Years and Over | 524 | 4.3% |
| Total | 12,232 | 100.0% |
Housing Finances in Charlevoix County
Median Income by Occupancy in Charlevoix County
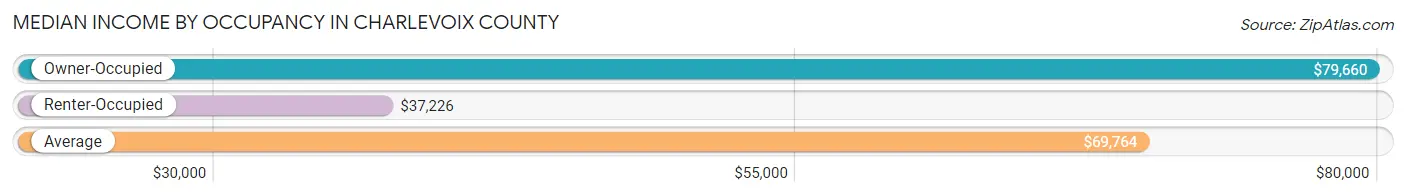
| Occupancy Type | # Households | Median Income |
| Owner-Occupied | 9,990 (81.7%) | $79,660 |
| Renter-Occupied | 2,242 (18.3%) | $37,226 |
| Average | 12,232 (100.0%) | $69,764 |
Occupancy by Householder Income Bracket in Charlevoix County
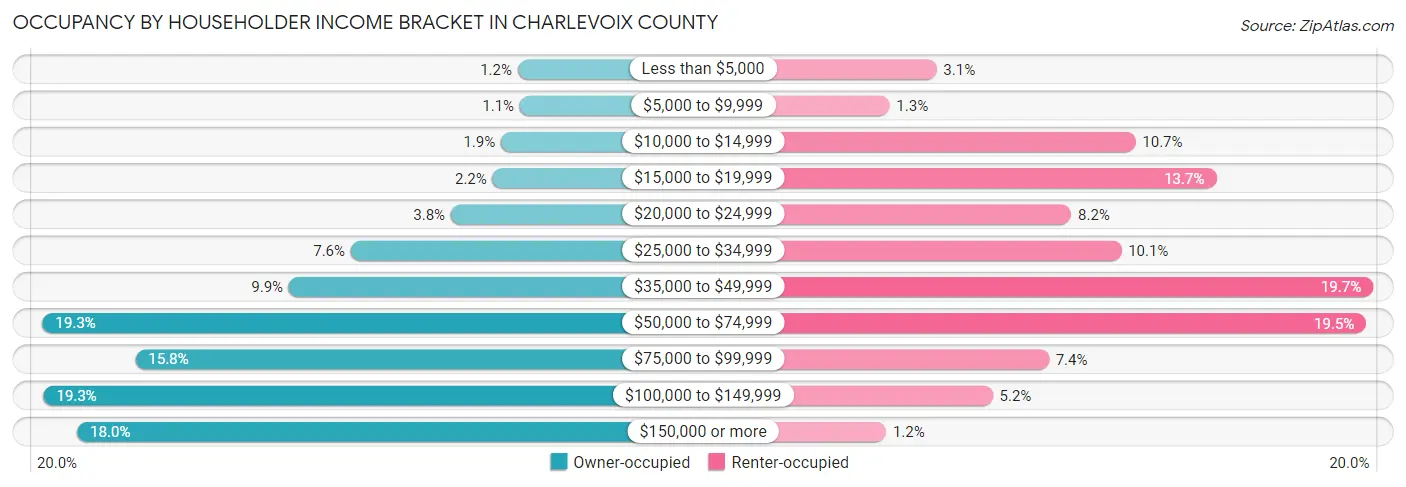
| Income Bracket | Owner-occupied | Renter-occupied |
| Less than $5,000 | 121 (1.2%) | 69 (3.1%) |
| $5,000 to $9,999 | 113 (1.1%) | 29 (1.3%) |
| $10,000 to $14,999 | 185 (1.8%) | 239 (10.7%) |
| $15,000 to $19,999 | 217 (2.2%) | 308 (13.7%) |
| $20,000 to $24,999 | 376 (3.8%) | 184 (8.2%) |
| $25,000 to $34,999 | 756 (7.6%) | 227 (10.1%) |
| $35,000 to $49,999 | 992 (9.9%) | 442 (19.7%) |
| $50,000 to $74,999 | 1,930 (19.3%) | 436 (19.5%) |
| $75,000 to $99,999 | 1,576 (15.8%) | 165 (7.4%) |
| $100,000 to $149,999 | 1,926 (19.3%) | 117 (5.2%) |
| $150,000 or more | 1,798 (18.0%) | 26 (1.2%) |
| Total | 9,990 (100.0%) | 2,242 (100.0%) |
Monthly Housing Cost Tiers in Charlevoix County
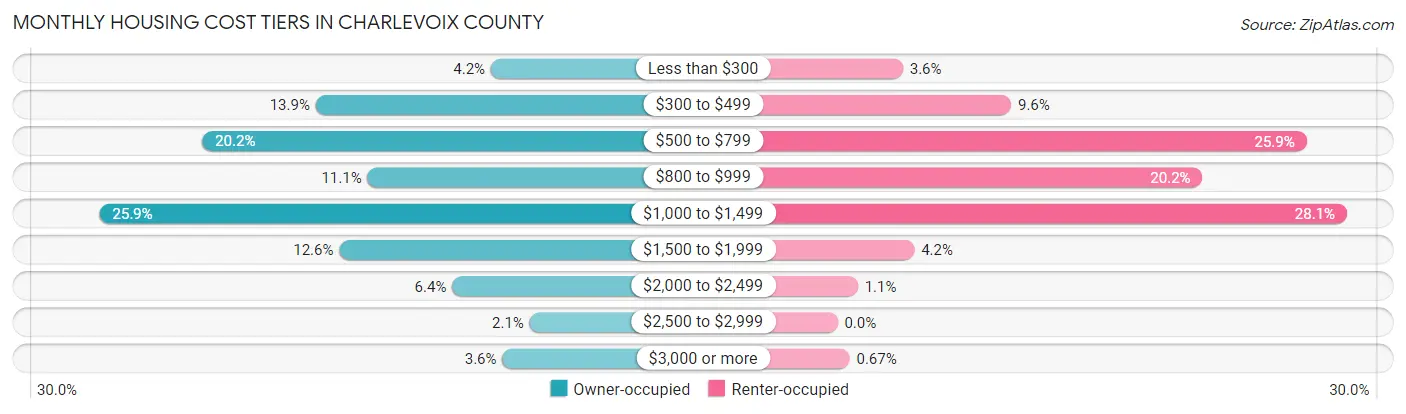
| Monthly Cost | Owner-occupied | Renter-occupied |
| Less than $300 | 424 (4.2%) | 81 (3.6%) |
| $300 to $499 | 1,391 (13.9%) | 215 (9.6%) |
| $500 to $799 | 2,017 (20.2%) | 581 (25.9%) |
| $800 to $999 | 1,105 (11.1%) | 452 (20.2%) |
| $1,000 to $1,499 | 2,584 (25.9%) | 631 (28.1%) |
| $1,500 to $1,999 | 1,261 (12.6%) | 95 (4.2%) |
| $2,000 to $2,499 | 637 (6.4%) | 25 (1.1%) |
| $2,500 to $2,999 | 210 (2.1%) | 0 (0.0%) |
| $3,000 or more | 361 (3.6%) | 15 (0.7%) |
| Total | 9,990 (100.0%) | 2,242 (100.0%) |
Physical Housing Characteristics in Charlevoix County
Housing Structures in Charlevoix County
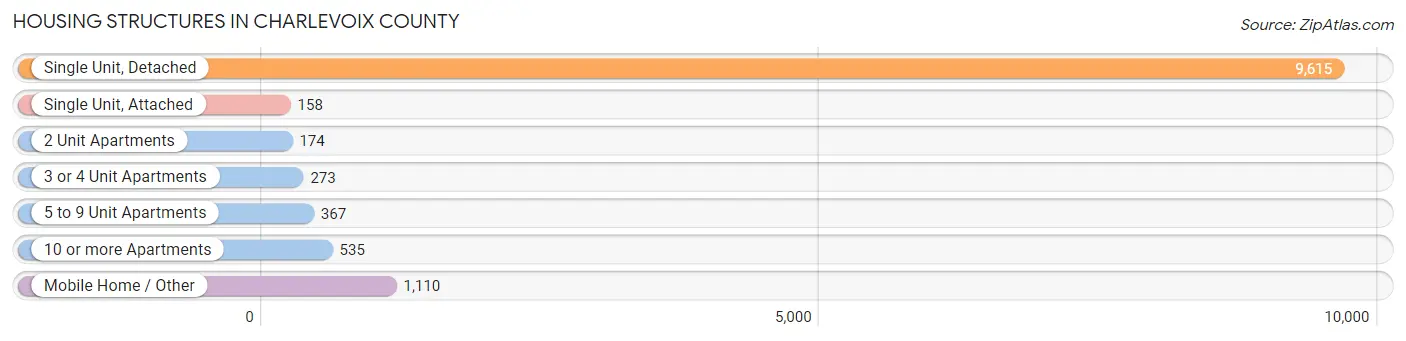
| Structure Type | # Housing Units | % Housing Units |
| Single Unit, Detached | 9,615 | 78.6% |
| Single Unit, Attached | 158 | 1.3% |
| 2 Unit Apartments | 174 | 1.4% |
| 3 or 4 Unit Apartments | 273 | 2.2% |
| 5 to 9 Unit Apartments | 367 | 3.0% |
| 10 or more Apartments | 535 | 4.4% |
| Mobile Home / Other | 1,110 | 9.1% |
| Total | 12,232 | 100.0% |
Housing Structures by Occupancy in Charlevoix County
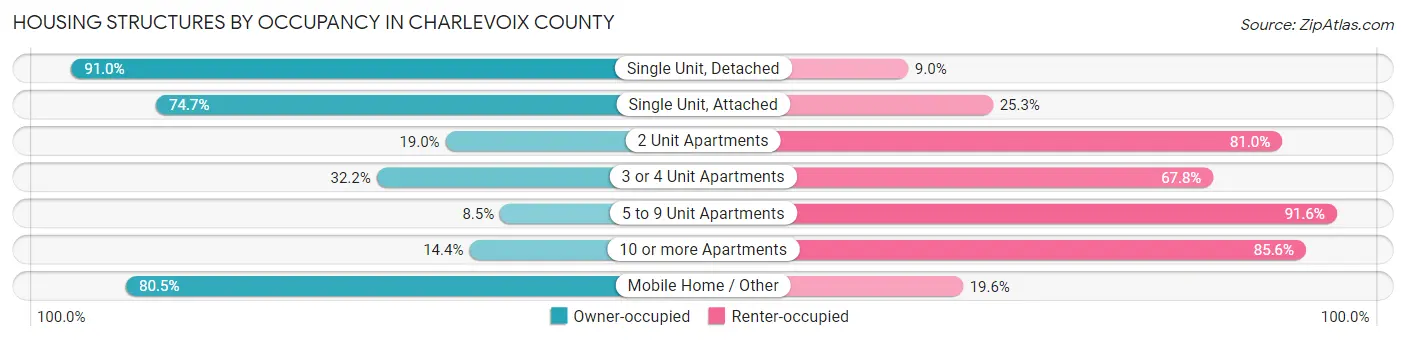
| Structure Type | Owner-occupied | Renter-occupied |
| Single Unit, Detached | 8,750 (91.0%) | 865 (9.0%) |
| Single Unit, Attached | 118 (74.7%) | 40 (25.3%) |
| 2 Unit Apartments | 33 (19.0%) | 141 (81.0%) |
| 3 or 4 Unit Apartments | 88 (32.2%) | 185 (67.8%) |
| 5 to 9 Unit Apartments | 31 (8.5%) | 336 (91.5%) |
| 10 or more Apartments | 77 (14.4%) | 458 (85.6%) |
| Mobile Home / Other | 893 (80.4%) | 217 (19.6%) |
| Total | 9,990 (81.7%) | 2,242 (18.3%) |
Housing Structures by Number of Rooms in Charlevoix County
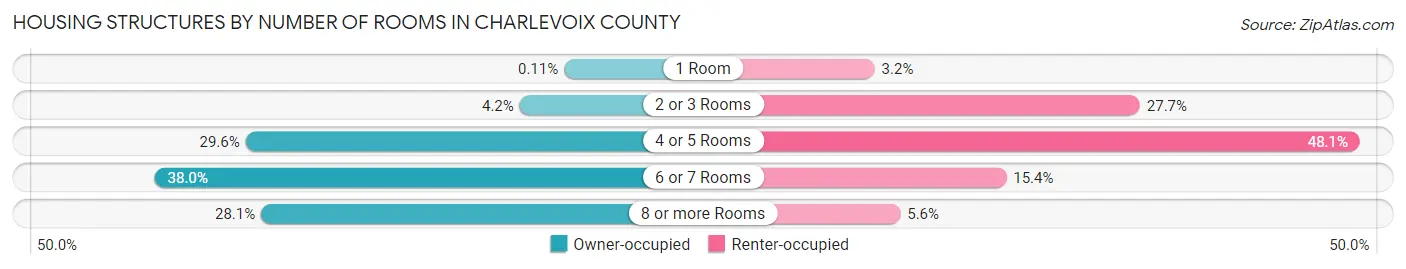
| Number of Rooms | Owner-occupied | Renter-occupied |
| 1 Room | 11 (0.1%) | 72 (3.2%) |
| 2 or 3 Rooms | 422 (4.2%) | 622 (27.7%) |
| 4 or 5 Rooms | 2,954 (29.6%) | 1,078 (48.1%) |
| 6 or 7 Rooms | 3,793 (38.0%) | 345 (15.4%) |
| 8 or more Rooms | 2,810 (28.1%) | 125 (5.6%) |
| Total | 9,990 (100.0%) | 2,242 (100.0%) |
Housing Structure by Heating Type in Charlevoix County
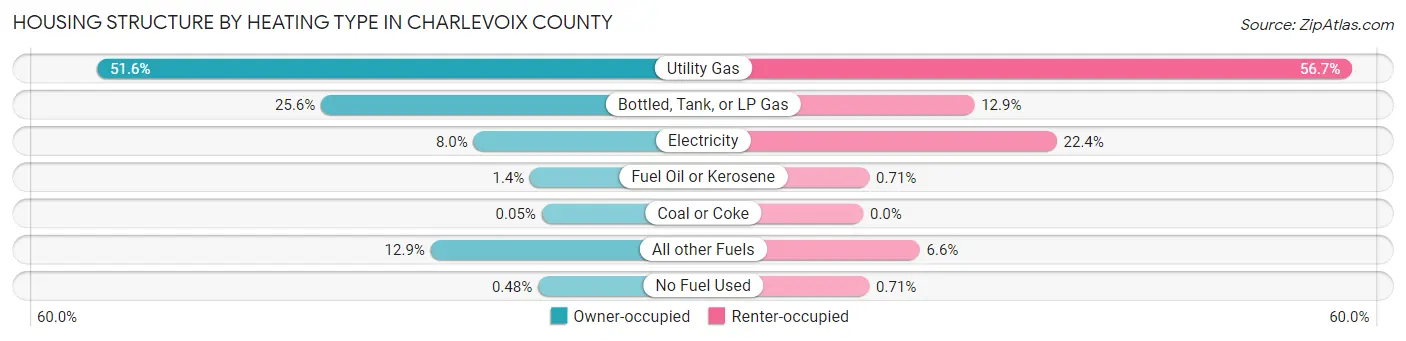
| Heating Type | Owner-occupied | Renter-occupied |
| Utility Gas | 5,154 (51.6%) | 1,271 (56.7%) |
| Bottled, Tank, or LP Gas | 2,559 (25.6%) | 289 (12.9%) |
| Electricity | 794 (8.0%) | 503 (22.4%) |
| Fuel Oil or Kerosene | 139 (1.4%) | 16 (0.7%) |
| Coal or Coke | 5 (0.1%) | 0 (0.0%) |
| All other Fuels | 1,291 (12.9%) | 147 (6.6%) |
| No Fuel Used | 48 (0.5%) | 16 (0.7%) |
| Total | 9,990 (100.0%) | 2,242 (100.0%) |
Household Vehicle Usage in Charlevoix County
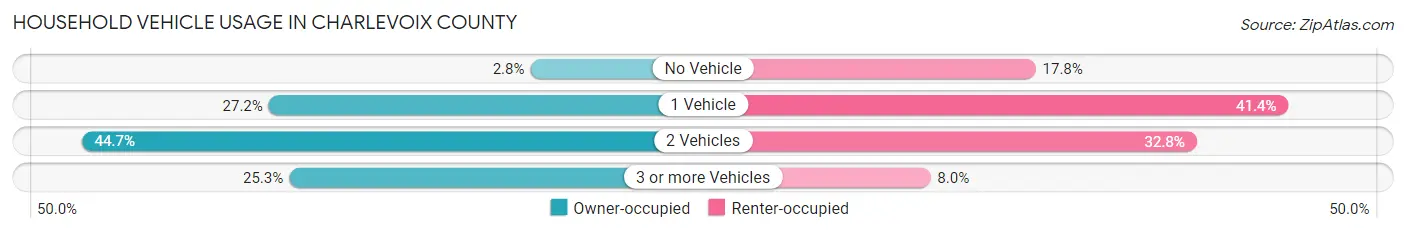
| Vehicles per Household | Owner-occupied | Renter-occupied |
| No Vehicle | 279 (2.8%) | 399 (17.8%) |
| 1 Vehicle | 2,719 (27.2%) | 928 (41.4%) |
| 2 Vehicles | 4,464 (44.7%) | 736 (32.8%) |
| 3 or more Vehicles | 2,528 (25.3%) | 179 (8.0%) |
| Total | 9,990 (100.0%) | 2,242 (100.0%) |
Real Estate & Mortgages in Charlevoix County
Real Estate and Mortgage Overview in Charlevoix County
| Characteristic | Without Mortgage | With Mortgage |
| Housing Units | 4,327 | 5,663 |
| Median Property Value | $222,000 | $218,800 |
| Median Household Income | $63,915 | $1,245 |
| Monthly Housing Costs | $558 | $336 |
| Real Estate Taxes | $2,270 | $257 |
Property Value by Mortgage Status in Charlevoix County
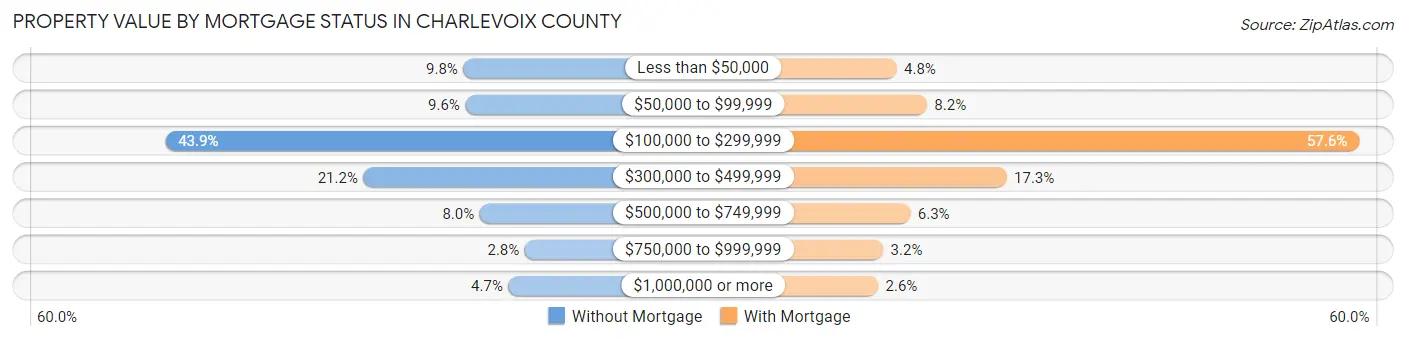
| Property Value | Without Mortgage | With Mortgage |
| Less than $50,000 | 425 (9.8%) | 269 (4.8%) |
| $50,000 to $99,999 | 415 (9.6%) | 465 (8.2%) |
| $100,000 to $299,999 | 1,901 (43.9%) | 3,259 (57.6%) |
| $300,000 to $499,999 | 919 (21.2%) | 981 (17.3%) |
| $500,000 to $749,999 | 344 (8.0%) | 358 (6.3%) |
| $750,000 to $999,999 | 121 (2.8%) | 182 (3.2%) |
| $1,000,000 or more | 202 (4.7%) | 149 (2.6%) |
| Total | 4,327 (100.0%) | 5,663 (100.0%) |
Household Income by Mortgage Status in Charlevoix County
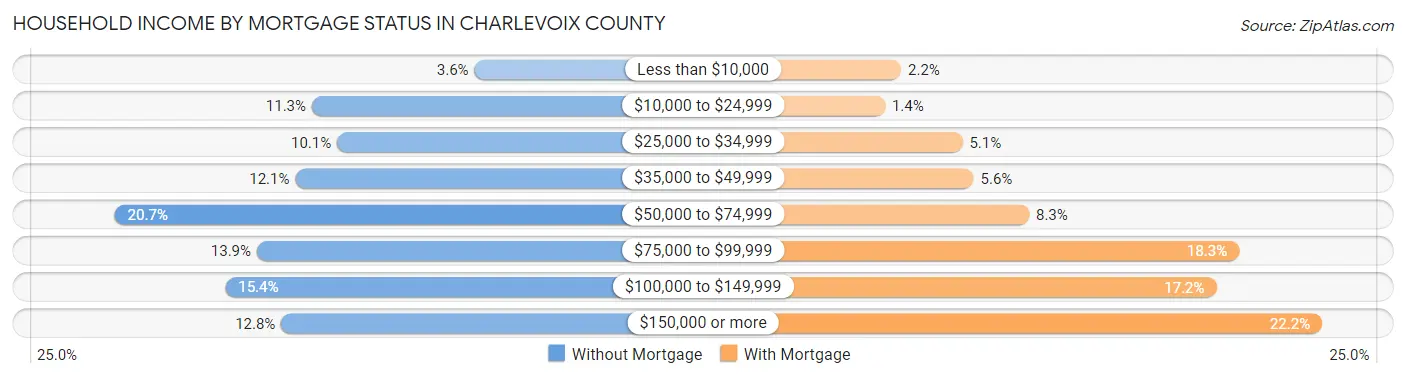
| Household Income | Without Mortgage | With Mortgage |
| Less than $10,000 | 155 (3.6%) | 123 (2.2%) |
| $10,000 to $24,999 | 490 (11.3%) | 79 (1.4%) |
| $25,000 to $34,999 | 438 (10.1%) | 288 (5.1%) |
| $35,000 to $49,999 | 524 (12.1%) | 318 (5.6%) |
| $50,000 to $74,999 | 896 (20.7%) | 468 (8.3%) |
| $75,000 to $99,999 | 603 (13.9%) | 1,034 (18.3%) |
| $100,000 to $149,999 | 668 (15.4%) | 973 (17.2%) |
| $150,000 or more | 553 (12.8%) | 1,258 (22.2%) |
| Total | 4,327 (100.0%) | 5,663 (100.0%) |
Property Value to Household Income Ratio in Charlevoix County
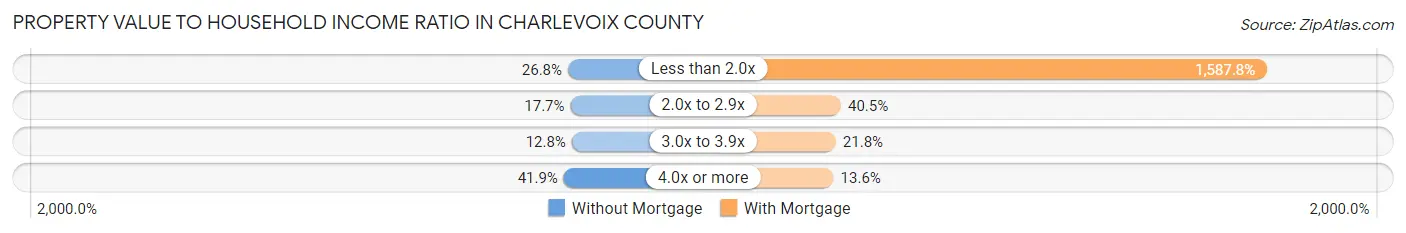
| Value-to-Income Ratio | Without Mortgage | With Mortgage |
| Less than 2.0x | 1,159 (26.8%) | 89,918 (1,587.8%) |
| 2.0x to 2.9x | 765 (17.7%) | 2,295 (40.5%) |
| 3.0x to 3.9x | 555 (12.8%) | 1,237 (21.8%) |
| 4.0x or more | 1,813 (41.9%) | 768 (13.6%) |
| Total | 4,327 (100.0%) | 5,663 (100.0%) |
Real Estate Taxes by Mortgage Status in Charlevoix County
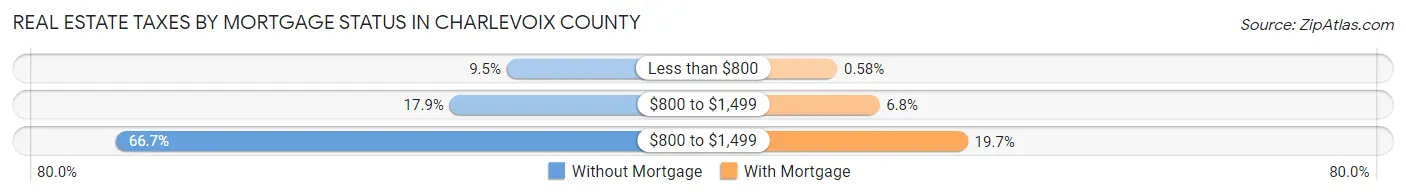
| Property Taxes | Without Mortgage | With Mortgage |
| Less than $800 | 413 (9.5%) | 33 (0.6%) |
| $800 to $1,499 | 774 (17.9%) | 383 (6.8%) |
| $800 to $1,499 | 2,885 (66.7%) | 1,114 (19.7%) |
| Total | 4,327 (100.0%) | 5,663 (100.0%) |
Health & Disability in Charlevoix County
Health Insurance Coverage by Age in Charlevoix County
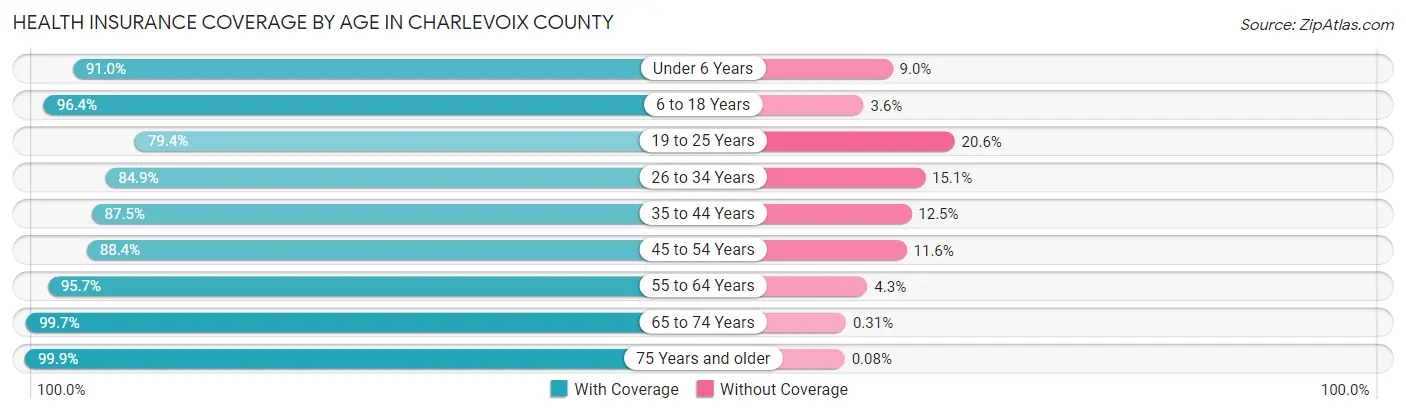
| Age Bracket | With Coverage | Without Coverage |
| Under 6 Years | 1,193 (91.0%) | 118 (9.0%) |
| 6 to 18 Years | 3,562 (96.4%) | 133 (3.6%) |
| 19 to 25 Years | 1,451 (79.4%) | 376 (20.6%) |
| 26 to 34 Years | 1,968 (84.9%) | 349 (15.1%) |
| 35 to 44 Years | 2,360 (87.5%) | 337 (12.5%) |
| 45 to 54 Years | 2,715 (88.4%) | 357 (11.6%) |
| 55 to 64 Years | 4,306 (95.7%) | 194 (4.3%) |
| 65 to 74 Years | 3,911 (99.7%) | 12 (0.3%) |
| 75 Years and older | 2,580 (99.9%) | 2 (0.1%) |
| Total | 24,046 (92.8%) | 1,878 (7.2%) |
Health Insurance Coverage by Citizenship Status in Charlevoix County
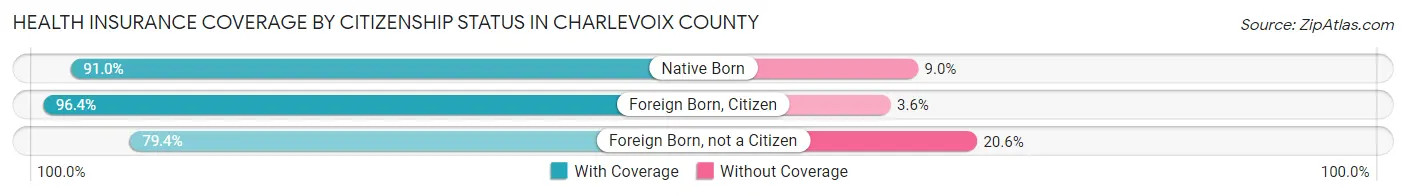
| Citizenship Status | With Coverage | Without Coverage |
| Native Born | 1,193 (91.0%) | 118 (9.0%) |
| Foreign Born, Citizen | 3,562 (96.4%) | 133 (3.6%) |
| Foreign Born, not a Citizen | 1,451 (79.4%) | 376 (20.6%) |
Health Insurance Coverage by Household Income in Charlevoix County
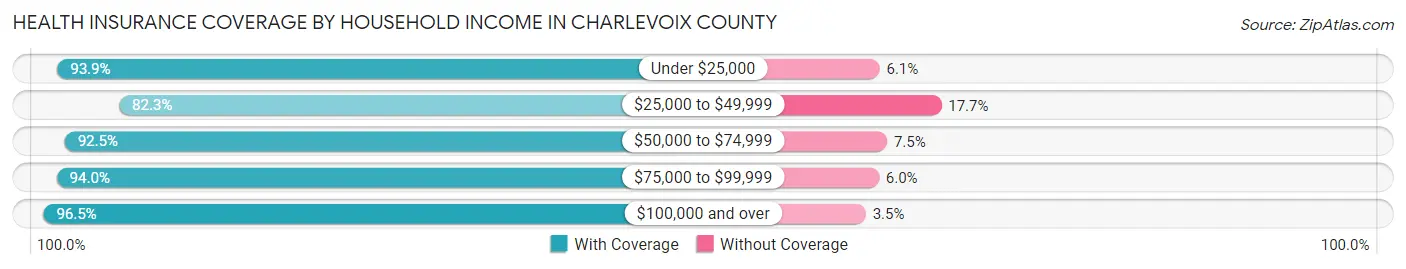
| Household Income | With Coverage | Without Coverage |
| Under $25,000 | 2,477 (93.9%) | 162 (6.1%) |
| $25,000 to $49,999 | 3,475 (82.3%) | 748 (17.7%) |
| $50,000 to $74,999 | 4,516 (92.5%) | 367 (7.5%) |
| $75,000 to $99,999 | 3,772 (94.0%) | 241 (6.0%) |
| $100,000 and over | 9,737 (96.5%) | 357 (3.5%) |
Public vs Private Health Insurance Coverage by Age in Charlevoix County
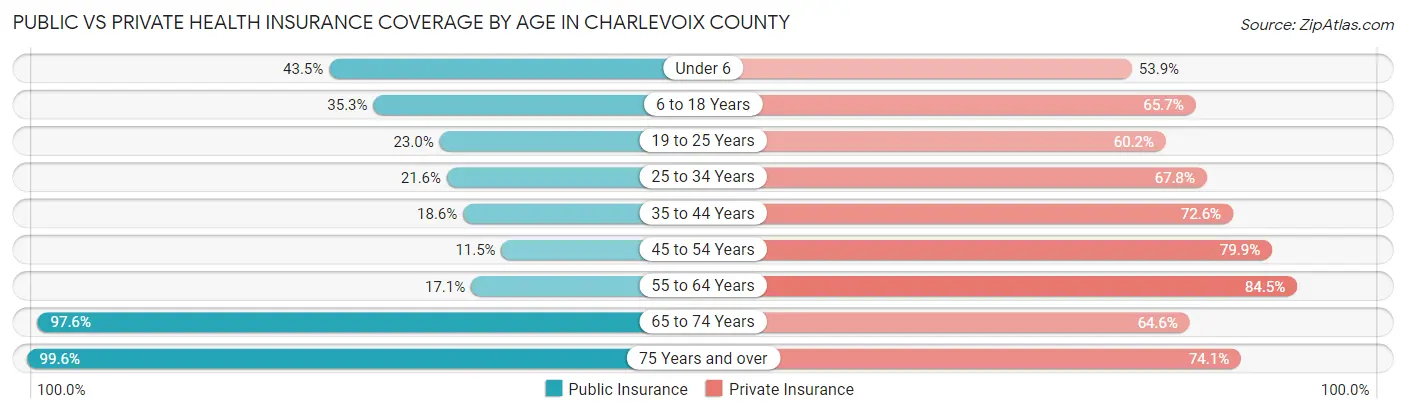
| Age Bracket | Public Insurance | Private Insurance |
| Under 6 | 570 (43.5%) | 706 (53.8%) |
| 6 to 18 Years | 1,303 (35.3%) | 2,426 (65.7%) |
| 19 to 25 Years | 420 (23.0%) | 1,099 (60.2%) |
| 25 to 34 Years | 501 (21.6%) | 1,570 (67.8%) |
| 35 to 44 Years | 502 (18.6%) | 1,958 (72.6%) |
| 45 to 54 Years | 353 (11.5%) | 2,453 (79.8%) |
| 55 to 64 Years | 771 (17.1%) | 3,803 (84.5%) |
| 65 to 74 Years | 3,828 (97.6%) | 2,533 (64.6%) |
| 75 Years and over | 2,572 (99.6%) | 1,913 (74.1%) |
| Total | 10,820 (41.7%) | 18,461 (71.2%) |
Disability Status by Sex by Age in Charlevoix County
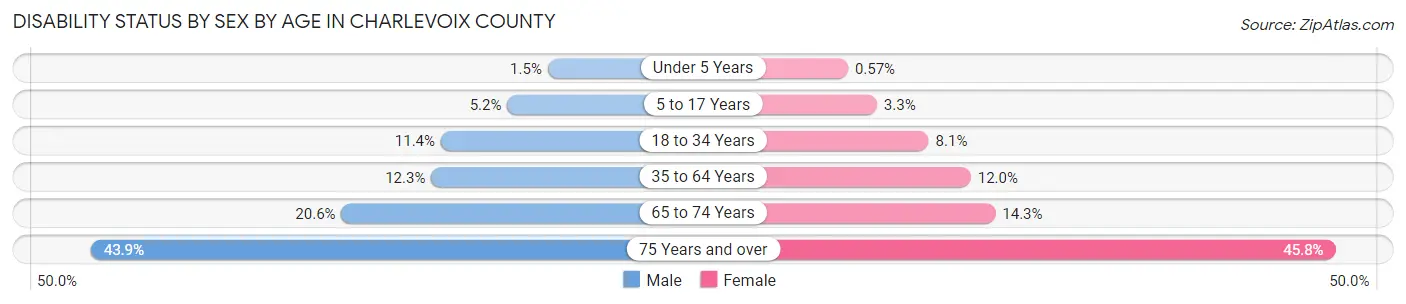
| Age Bracket | Male | Female |
| Under 5 Years | 8 (1.5%) | 3 (0.6%) |
| 5 to 17 Years | 97 (5.2%) | 59 (3.3%) |
| 18 to 34 Years | 257 (11.4%) | 172 (8.1%) |
| 35 to 64 Years | 633 (12.3%) | 611 (12.0%) |
| 65 to 74 Years | 402 (20.6%) | 281 (14.2%) |
| 75 Years and over | 531 (43.9%) | 628 (45.8%) |
Disability Class by Sex by Age in Charlevoix County
Disability Class: Hearing Difficulty
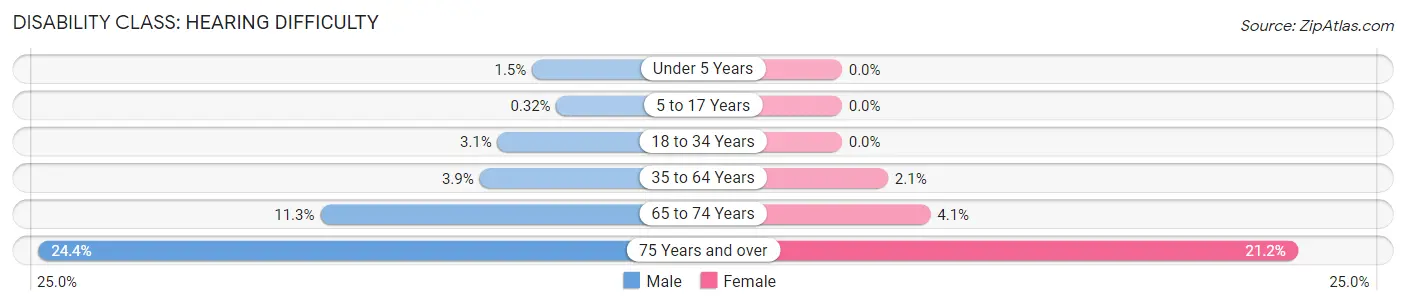
| Age Bracket | Male | Female |
| Under 5 Years | 8 (1.5%) | 0 (0.0%) |
| 5 to 17 Years | 6 (0.3%) | 0 (0.0%) |
| 18 to 34 Years | 69 (3.0%) | 0 (0.0%) |
| 35 to 64 Years | 201 (3.9%) | 109 (2.1%) |
| 65 to 74 Years | 220 (11.3%) | 81 (4.1%) |
| 75 Years and over | 295 (24.4%) | 290 (21.1%) |
Disability Class: Vision Difficulty
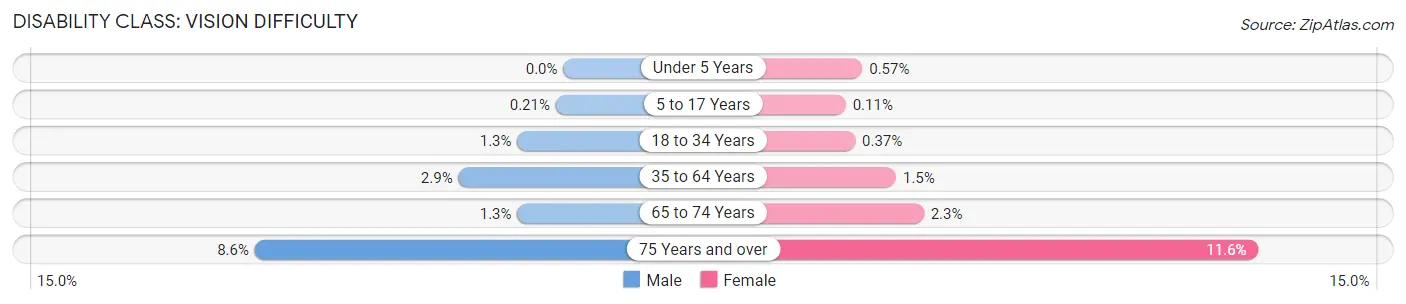
| Age Bracket | Male | Female |
| Under 5 Years | 0 (0.0%) | 3 (0.6%) |
| 5 to 17 Years | 4 (0.2%) | 2 (0.1%) |
| 18 to 34 Years | 29 (1.3%) | 8 (0.4%) |
| 35 to 64 Years | 151 (2.9%) | 77 (1.5%) |
| 65 to 74 Years | 25 (1.3%) | 45 (2.3%) |
| 75 Years and over | 104 (8.6%) | 159 (11.6%) |
Disability Class: Cognitive Difficulty
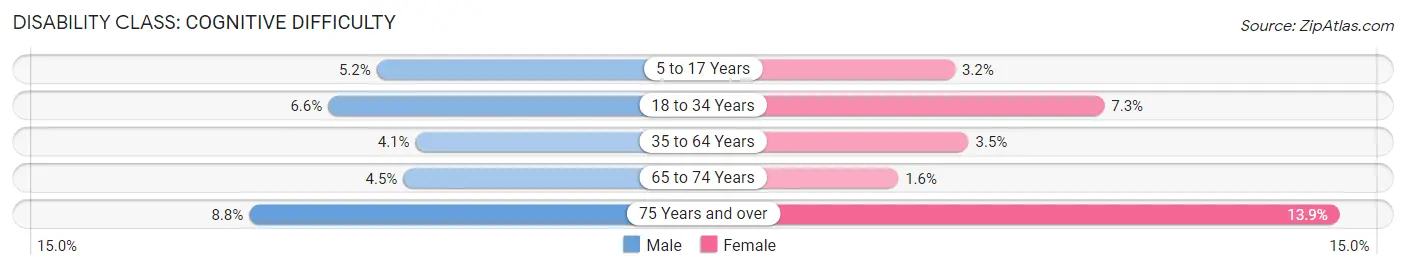
| Age Bracket | Male | Female |
| 5 to 17 Years | 97 (5.2%) | 57 (3.2%) |
| 18 to 34 Years | 148 (6.6%) | 156 (7.3%) |
| 35 to 64 Years | 213 (4.1%) | 180 (3.5%) |
| 65 to 74 Years | 87 (4.5%) | 31 (1.6%) |
| 75 Years and over | 106 (8.7%) | 190 (13.9%) |
Disability Class: Ambulatory Difficulty
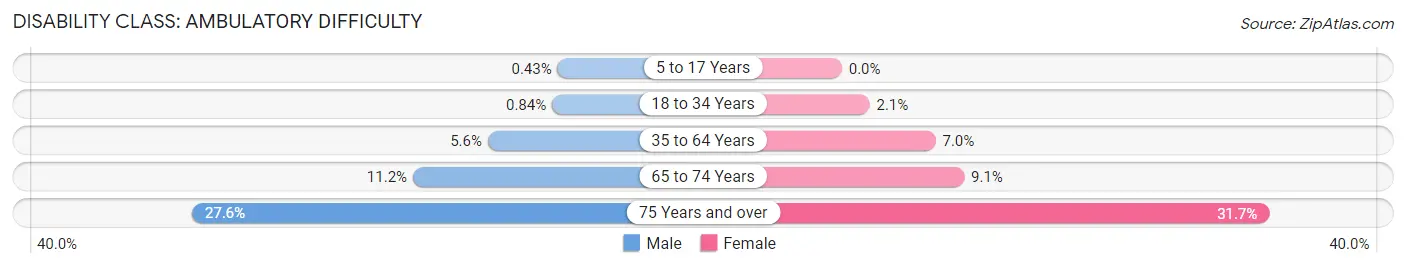
| Age Bracket | Male | Female |
| 5 to 17 Years | 8 (0.4%) | 0 (0.0%) |
| 18 to 34 Years | 19 (0.8%) | 44 (2.1%) |
| 35 to 64 Years | 290 (5.6%) | 355 (7.0%) |
| 65 to 74 Years | 218 (11.2%) | 179 (9.1%) |
| 75 Years and over | 334 (27.6%) | 435 (31.7%) |
Disability Class: Self-Care Difficulty
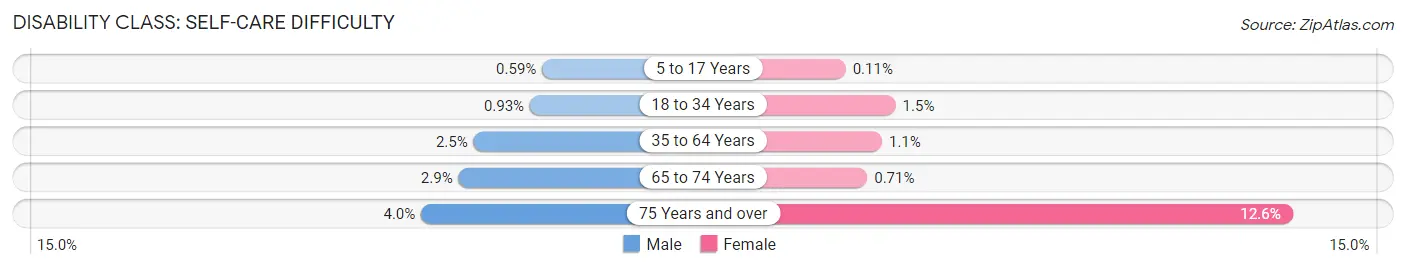
| Age Bracket | Male | Female |
| 5 to 17 Years | 11 (0.6%) | 2 (0.1%) |
| 18 to 34 Years | 21 (0.9%) | 32 (1.5%) |
| 35 to 64 Years | 129 (2.5%) | 57 (1.1%) |
| 65 to 74 Years | 57 (2.9%) | 14 (0.7%) |
| 75 Years and over | 48 (4.0%) | 172 (12.6%) |
Technology Access in Charlevoix County
Computing Device Access in Charlevoix County
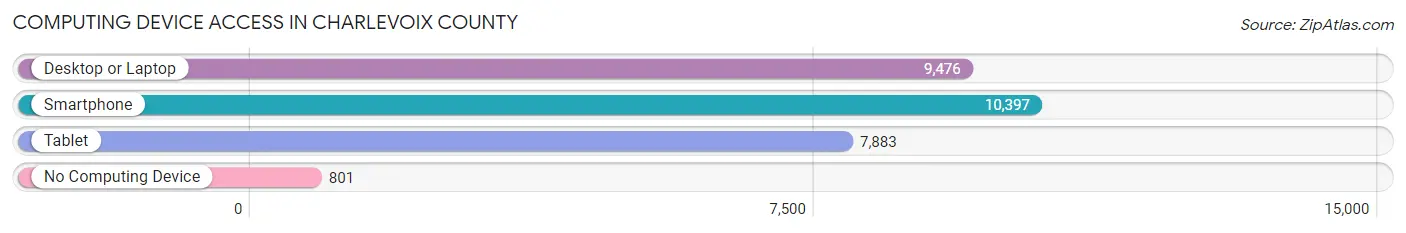
| Device Type | # Households | % Households |
| Desktop or Laptop | 9,476 | 77.5% |
| Smartphone | 10,397 | 85.0% |
| Tablet | 7,883 | 64.4% |
| No Computing Device | 801 | 6.6% |
| Total | 12,232 | 100.0% |
Internet Access in Charlevoix County
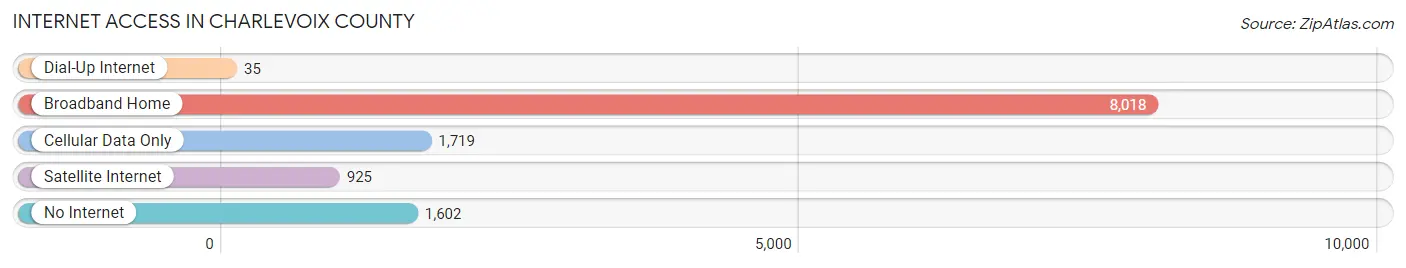
| Internet Type | # Households | % Households |
| Dial-Up Internet | 35 | 0.3% |
| Broadband Home | 8,018 | 65.5% |
| Cellular Data Only | 1,719 | 14.1% |
| Satellite Internet | 925 | 7.6% |
| No Internet | 1,602 | 13.1% |
| Total | 12,232 | 100.0% |
Charlevoix County Summary
Charlevoix County is located in the northern part of Michigan’s Lower Peninsula. It is bordered by Lake Michigan to the west, Lake Charlevoix to the east, and the Straits of Mackinac to the north. The county seat is Charlevoix, and the largest city is Boyne City. The county was established in 1840 and named after Pierre François Xavier de Charlevoix, a French explorer and historian.
History
The area that is now Charlevoix County was originally inhabited by the Odawa people. The first European settlers arrived in the area in the early 1800s, and the county was officially established in 1840. The county was initially a logging and fishing center, and the first sawmill was built in 1845. The county’s economy was further bolstered by the arrival of the railroad in 1871.
In the late 19th century, the county became a popular tourist destination. The area’s natural beauty and proximity to Lake Michigan and Lake Charlevoix attracted visitors from all over the country. The county’s first hotel, the Charlevoix House, opened in 1876. The county’s tourism industry continued to grow throughout the 20th century, and today it is one of the most popular tourist destinations in Michigan.
Geography
Charlevoix County covers an area of 545 square miles and is located in the northern part of Michigan’s Lower Peninsula. It is bordered by Lake Michigan to the west, Lake Charlevoix to the east, and the Straits of Mackinac to the north. The county is mostly rural, with rolling hills and forests. The highest point in the county is Mount McSauba, which has an elevation of 1,068 feet.
The county is home to several lakes, including Lake Charlevoix, Lake Michigan, and Lake Skegemog. The county also contains several rivers, including the Jordan River, the Boyne River, and the Pine River.
Economy
The economy of Charlevoix County is largely based on tourism. The county is home to several popular tourist attractions, including the Charlevoix County Historical Society Museum, the Charlevoix Circle of Arts, and the Charlevoix State Fish Hatchery. The county is also home to several wineries, breweries, and distilleries.
In addition to tourism, the county’s economy is also supported by agriculture, manufacturing, and retail. The county is home to several farms, which produce a variety of crops, including apples, cherries, and potatoes. The county is also home to several manufacturing companies, which produce a variety of products, including furniture, automotive parts, and medical supplies.
Demographics
As of the 2010 census, Charlevoix County had a population of 25,949. The population is predominantly white (94.3%), with small percentages of African American (1.2%), Native American (0.7%), Asian (0.5%), and Hispanic or Latino (1.3%) residents. The median household income is $45,945, and the median age is 44.7 years.
The county is home to several small towns and villages, including Charlevoix, Boyne City, East Jordan, and Ellsworth. The county seat is Charlevoix, which is home to the Charlevoix County Courthouse and the Charlevoix County Historical Society Museum. The largest city in the county is Boyne City, which is home to several restaurants, shops, and galleries.
Common Questions
What is Per Capita Income in Charlevoix County?
Per Capita income in Charlevoix County is $43,782.
What is the Median Family Income in Charlevoix County?
Median Family Income in Charlevoix County is $86,509.
What is the Median Household income in Charlevoix County?
Median Household Income in Charlevoix County is $69,764.
What is Income or Wage Gap in Charlevoix County?
Income or Wage Gap in Charlevoix County is 29.7%.
Women in Charlevoix County earn 70.3 cents for every dollar earned by a man.
What is Family Income Deficit in Charlevoix County?
Family Income Deficit in Charlevoix County is $8,676.
Families that are below poverty line in Charlevoix County earn $8,676 less on average than the poverty threshold level.
What is Inequality or Gini Index in Charlevoix County?
Inequality or Gini Index in Charlevoix County is 0.46.
What is the Total Population of Charlevoix County?
Total Population of Charlevoix County is 26,174.
What is the Total Male Population of Charlevoix County?
Total Male Population of Charlevoix County is 13,106.
What is the Total Female Population of Charlevoix County?
Total Female Population of Charlevoix County is 13,068.
What is the Ratio of Males per 100 Females in Charlevoix County?
There are 100.29 Males per 100 Females in Charlevoix County.
What is the Ratio of Females per 100 Males in Charlevoix County?
There are 99.71 Females per 100 Males in Charlevoix County.
What is the Median Population Age in Charlevoix County?
Median Population Age in Charlevoix County is 49.5 Years.
What is the Average Family Size in Charlevoix County
Average Family Size in Charlevoix County is 2.5 People.
What is the Average Household Size in Charlevoix County
Average Household Size in Charlevoix County is 2.1 People.
How Large is the Labor Force in Charlevoix County?
There are 13,119 People in the Labor Forcein in Charlevoix County.
What is the Percentage of People in the Labor Force in Charlevoix County?
59.6% of People are in the Labor Force in Charlevoix County.
What is the Unemployment Rate in Charlevoix County?
Unemployment Rate in Charlevoix County is 3.8%.