Alger County, MI Map & Demographics
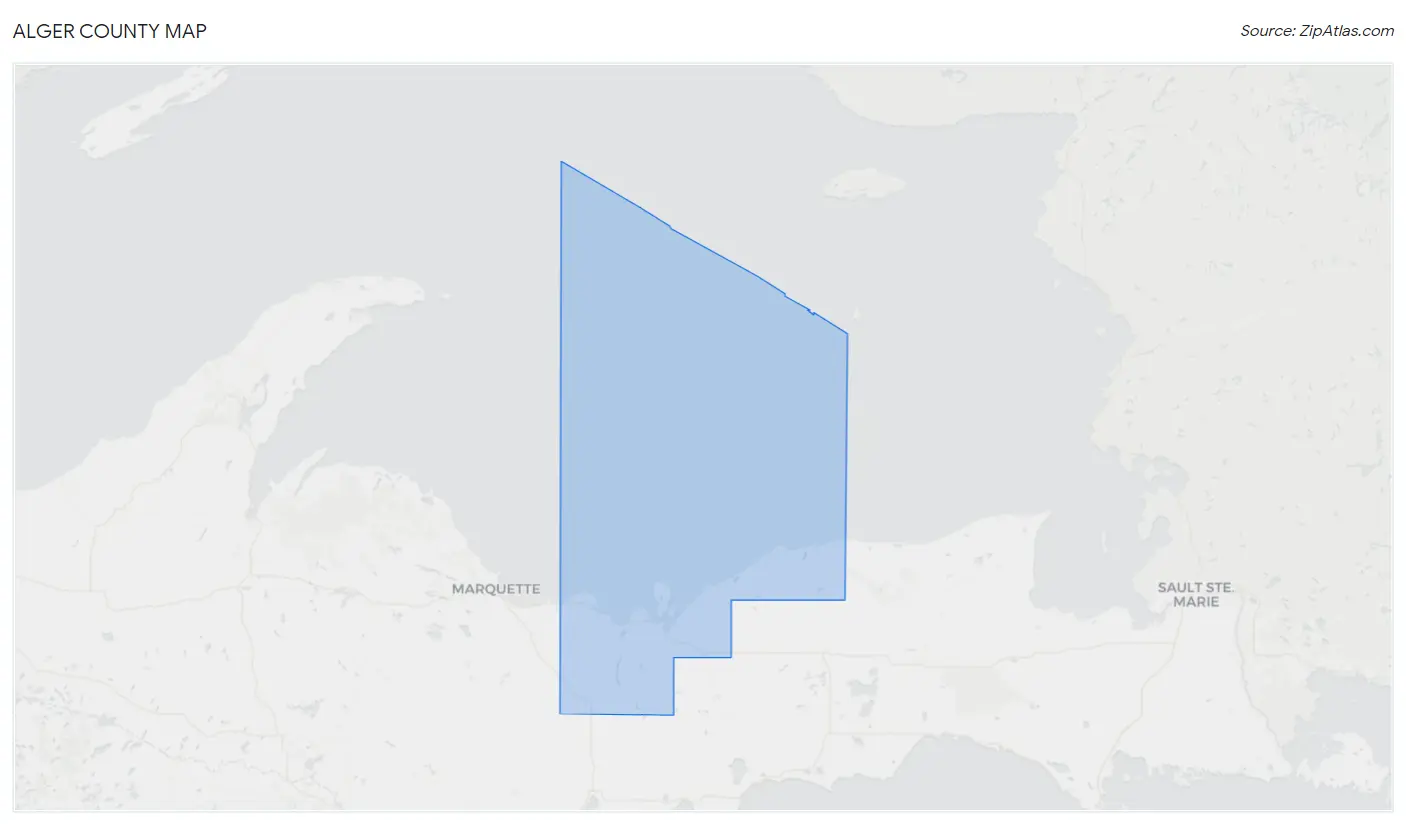
Alger County Map
Alger County Overview
$25,099
PER CAPITA INCOME
$66,829
AVG FAMILY INCOME
$55,528
AVG HOUSEHOLD INCOME
28.5%
WAGE / INCOME GAP [ % ]
71.5¢/ $1
WAGE / INCOME GAP [ $ ]
0.39
INEQUALITY / GINI INDEX
8,866
TOTAL POPULATION
4,943
MALE POPULATION
3,923
FEMALE POPULATION
126.00
MALES / 100 FEMALES
79.36
FEMALES / 100 MALES
47.2
MEDIAN AGE
3.0
AVG FAMILY SIZE
2.4
AVG HOUSEHOLD SIZE
3,073
LABOR FORCE [ PEOPLE ]
41.0%
PERCENT IN LABOR FORCE
5.1%
UNEMPLOYMENT RATE
Alger County Area Codes
Income in Alger County
Income Overview in Alger County
Per Capita Income in Alger County is $25,099, while median incomes of families and households are $66,829 and $55,528 respectively.
| Characteristic | Number | Measure |
| Per Capita Income | 8,866 | $25,099 |
| Median Family Income | 2,117 | $66,829 |
| Mean Family Income | 2,117 | $79,099 |
| Median Household Income | 3,274 | $55,528 |
| Mean Household Income | 3,274 | $64,943 |
| Income Deficit | 2,117 | $0 |
| Wage / Income Gap (%) | 8,866 | 28.50% |
| Wage / Income Gap ($) | 8,866 | 71.50¢ per $1 |
| Gini / Inequality Index | 8,866 | 0.39 |
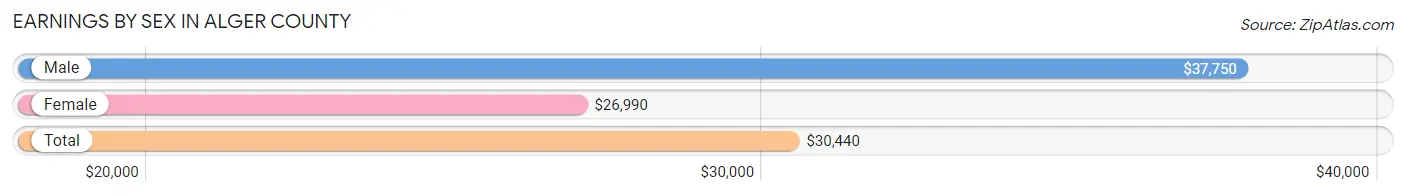
Earnings by Sex in Alger County
Average Earnings in Alger County are $30,440, $37,750 for men and $26,990 for women, a difference of 28.5%.
| Sex | Number | Average Earnings |
| Male | 1,956 (54.0%) | $37,750 |
| Female | 1,663 (46.0%) | $26,990 |
| Total | 3,619 (100.0%) | $30,440 |
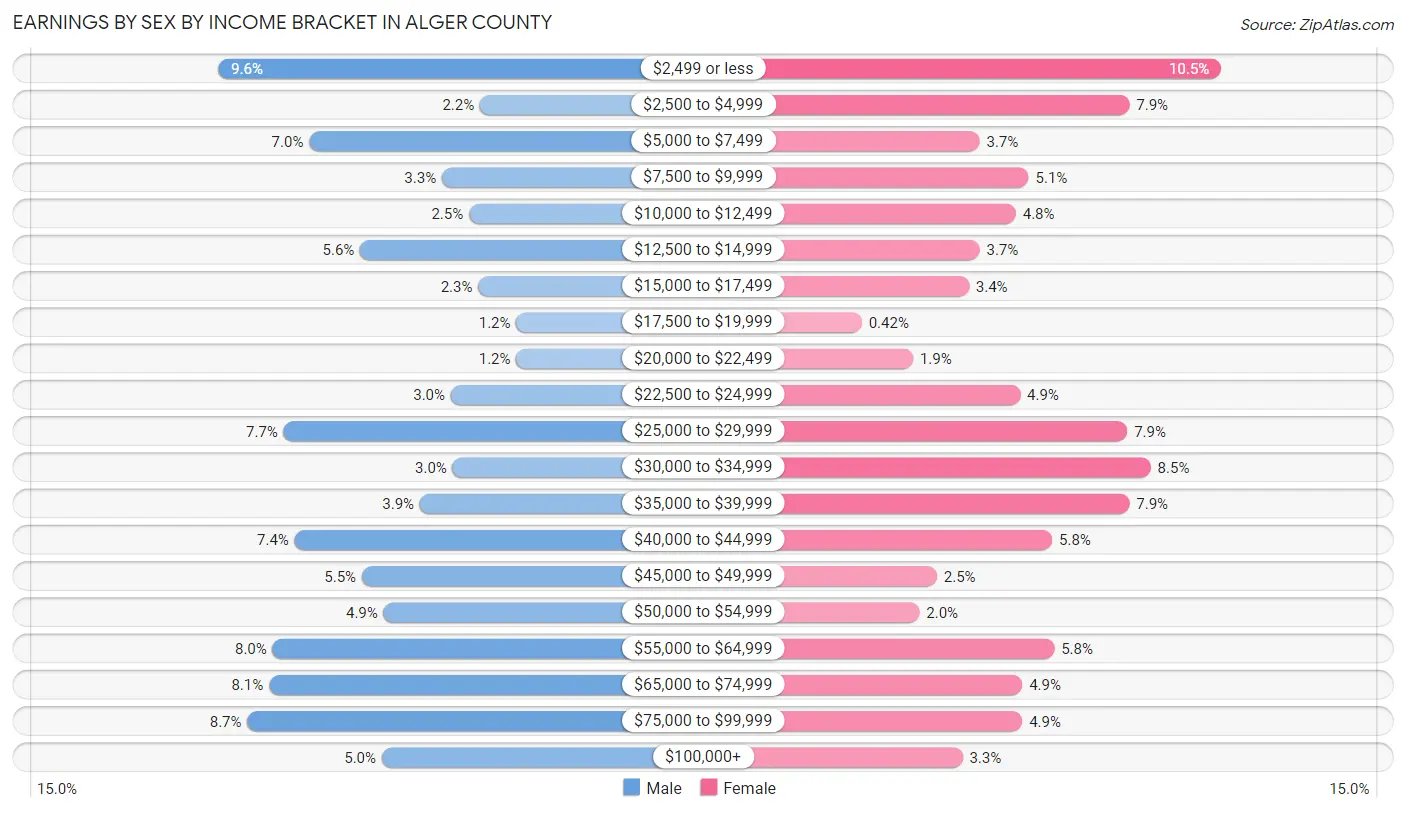
Earnings by Sex by Income Bracket in Alger County
The most common earnings brackets in Alger County are $2,499 or less for men (187 | 9.6%) and $2,499 or less for women (175 | 10.5%).
| Income | Male | Female |
| $2,499 or less | 187 (9.6%) | 175 (10.5%) |
| $2,500 to $4,999 | 43 (2.2%) | 132 (7.9%) |
| $5,000 to $7,499 | 137 (7.0%) | 62 (3.7%) |
| $7,500 to $9,999 | 64 (3.3%) | 85 (5.1%) |
| $10,000 to $12,499 | 49 (2.5%) | 79 (4.8%) |
| $12,500 to $14,999 | 109 (5.6%) | 62 (3.7%) |
| $15,000 to $17,499 | 44 (2.2%) | 57 (3.4%) |
| $17,500 to $19,999 | 23 (1.2%) | 7 (0.4%) |
| $20,000 to $22,499 | 23 (1.2%) | 31 (1.9%) |
| $22,500 to $24,999 | 59 (3.0%) | 81 (4.9%) |
| $25,000 to $29,999 | 151 (7.7%) | 131 (7.9%) |
| $30,000 to $34,999 | 58 (3.0%) | 142 (8.5%) |
| $35,000 to $39,999 | 76 (3.9%) | 132 (7.9%) |
| $40,000 to $44,999 | 145 (7.4%) | 96 (5.8%) |
| $45,000 to $49,999 | 108 (5.5%) | 42 (2.5%) |
| $50,000 to $54,999 | 96 (4.9%) | 34 (2.0%) |
| $55,000 to $64,999 | 157 (8.0%) | 97 (5.8%) |
| $65,000 to $74,999 | 159 (8.1%) | 82 (4.9%) |
| $75,000 to $99,999 | 171 (8.7%) | 82 (4.9%) |
| $100,000+ | 97 (5.0%) | 54 (3.3%) |
| Total | 1,956 (100.0%) | 1,663 (100.0%) |
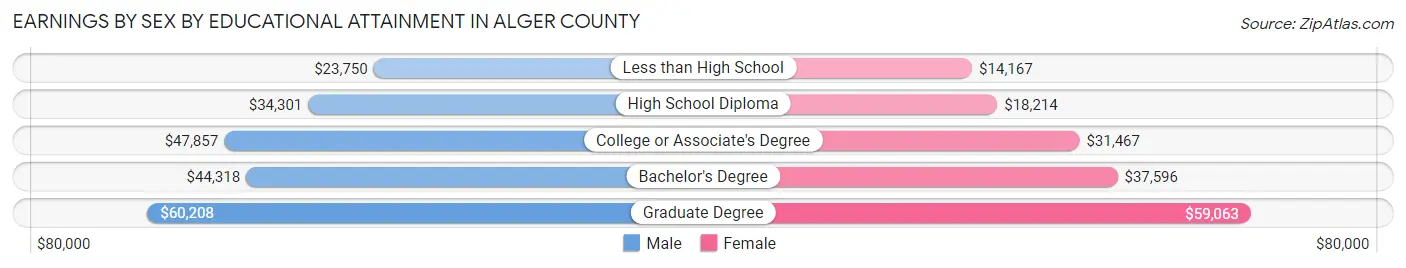
Earnings by Sex by Educational Attainment in Alger County
Average earnings in Alger County are $41,902 for men and $30,615 for women, a difference of 26.9%. Men with an educational attainment of graduate degree enjoy the highest average annual earnings of $60,208, while those with less than high school education earn the least with $23,750. Women with an educational attainment of graduate degree earn the most with the average annual earnings of $59,063, while those with less than high school education have the smallest earnings of $14,167.
| Educational Attainment | Male Income | Female Income |
| Less than High School | $23,750 | $14,167 |
| High School Diploma | $34,301 | $18,214 |
| College or Associate's Degree | $47,857 | $31,467 |
| Bachelor's Degree | $44,318 | $37,596 |
| Graduate Degree | $60,208 | $59,063 |
| Total | $41,902 | $30,615 |
Family Income in Alger County
Family Income Brackets in Alger County
According to the Alger County family income data, there are 582 families falling into the $50,000 to $74,999 income range, which is the most common income bracket and makes up 27.5% of all families. Conversely, the less than $10,000 income bracket is the least frequent group with only 32 families (1.5%) belonging to this category.
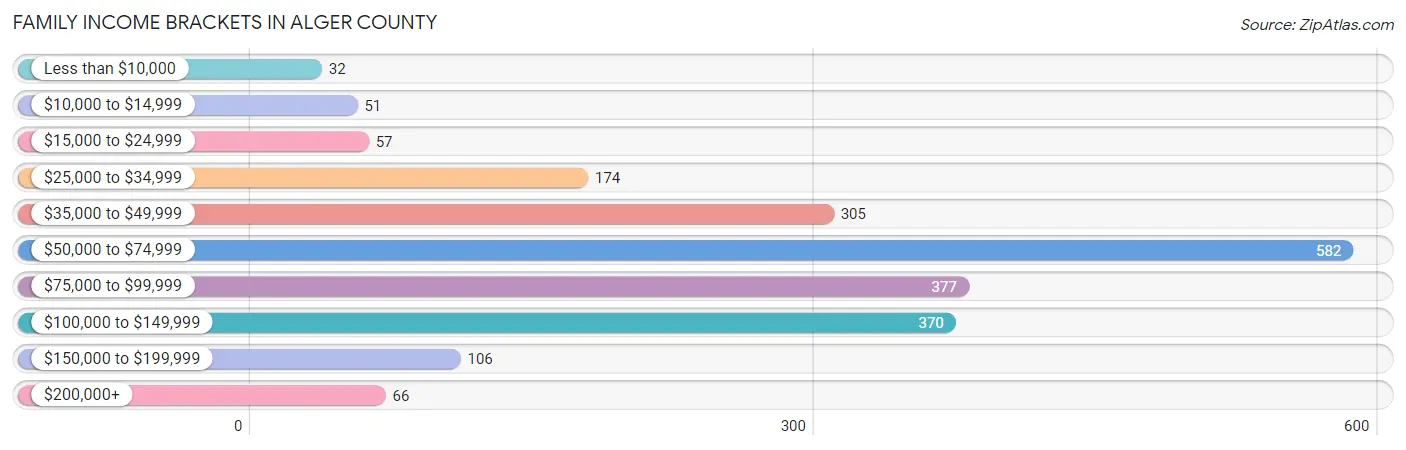
| Income Bracket | # Families | % Families |
| Less than $10,000 | 32 | 1.5% |
| $10,000 to $14,999 | 51 | 2.4% |
| $15,000 to $24,999 | 57 | 2.7% |
| $25,000 to $34,999 | 174 | 8.2% |
| $35,000 to $49,999 | 305 | 14.4% |
| $50,000 to $74,999 | 582 | 27.5% |
| $75,000 to $99,999 | 377 | 17.8% |
| $100,000 to $149,999 | 370 | 17.5% |
| $150,000 to $199,999 | 106 | 5.0% |
| $200,000+ | 66 | 3.1% |
Family Income by Famaliy Size in Alger County
7+ person families (21 | 1.0%) account for the highest median family income in Alger County with $111,250 per family, while 2-person families (1,337 | 63.2%) have the highest median income of $30,697 per family member.
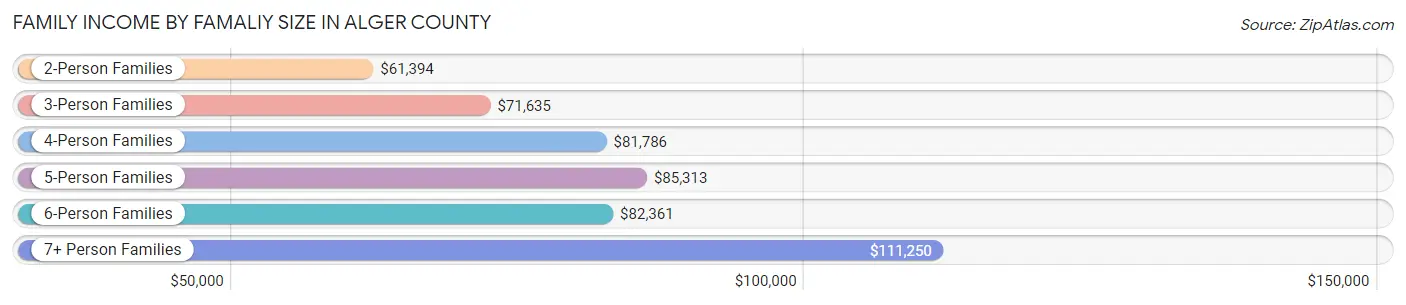
| Income Bracket | # Families | Median Income |
| 2-Person Families | 1,337 (63.2%) | $61,394 |
| 3-Person Families | 369 (17.4%) | $71,635 |
| 4-Person Families | 236 (11.2%) | $81,786 |
| 5-Person Families | 121 (5.7%) | $85,313 |
| 6-Person Families | 33 (1.6%) | $82,361 |
| 7+ Person Families | 21 (1.0%) | $111,250 |
| Total | 2,117 (100.0%) | $66,829 |
Family Income by Number of Earners in Alger County
The median family income in Alger County is $66,829, with families comprising 2 earners (663) having the highest median family income of $94,250, while families with no earners (583) have the lowest median family income of $51,542, accounting for 31.3% and 27.5% of families, respectively.
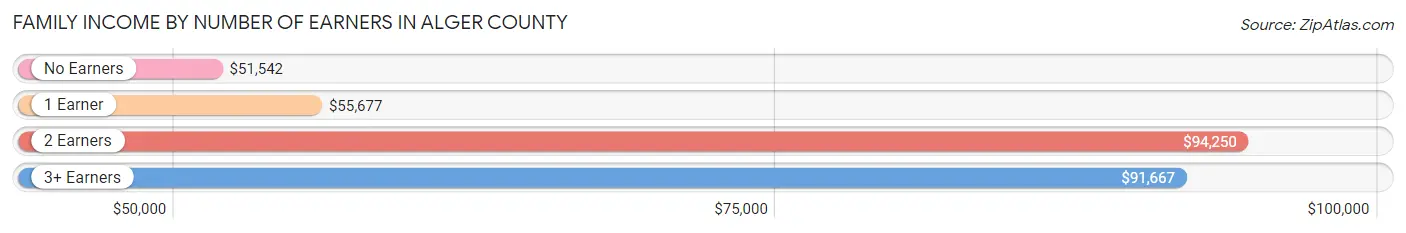
| Number of Earners | # Families | Median Income |
| No Earners | 583 (27.5%) | $51,542 |
| 1 Earner | 647 (30.6%) | $55,677 |
| 2 Earners | 663 (31.3%) | $94,250 |
| 3+ Earners | 224 (10.6%) | $91,667 |
| Total | 2,117 (100.0%) | $66,829 |
Household Income in Alger County
Household Income Brackets in Alger County
With 818 households falling in the category, the $50,000 to $74,999 income range is the most frequent in Alger County, accounting for 25.0% of all households. In contrast, only 69 households (2.1%) fall into the $200,000+ income bracket, making it the least populous group.
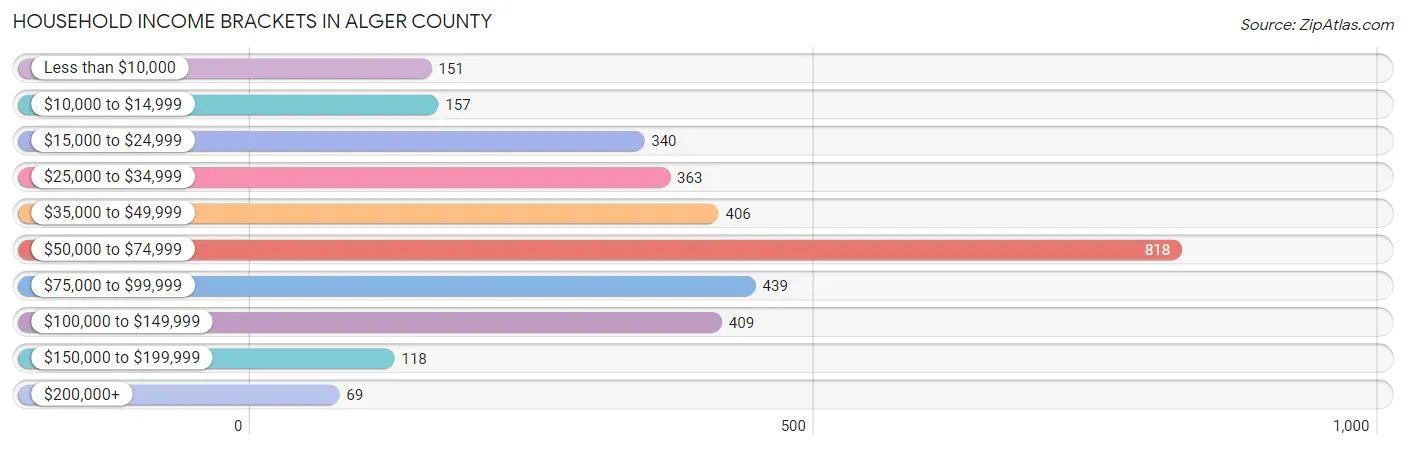
| Income Bracket | # Households | % Households |
| Less than $10,000 | 151 | 4.6% |
| $10,000 to $14,999 | 157 | 4.8% |
| $15,000 to $24,999 | 340 | 10.4% |
| $25,000 to $34,999 | 363 | 11.1% |
| $35,000 to $49,999 | 406 | 12.4% |
| $50,000 to $74,999 | 818 | 25.0% |
| $75,000 to $99,999 | 439 | 13.4% |
| $100,000 to $149,999 | 409 | 12.5% |
| $150,000 to $199,999 | 118 | 3.6% |
| $200,000+ | 69 | 2.1% |
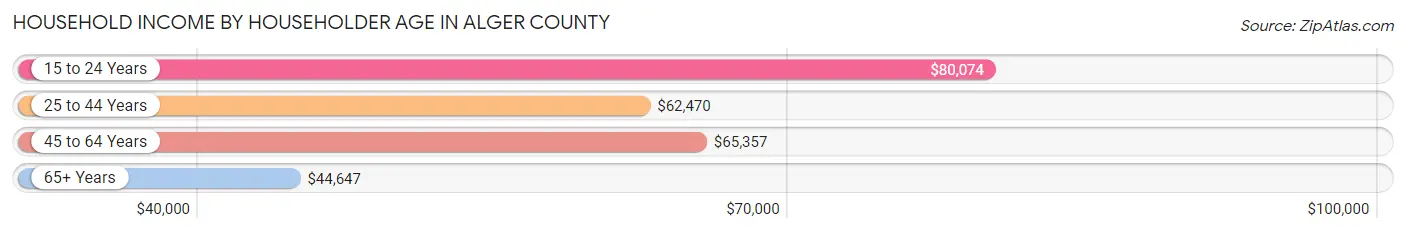
Household Income by Householder Age in Alger County
The median household income in Alger County is $55,528, with the highest median household income of $80,074 found in the 15 to 24 years age bracket for the primary householder. A total of 59 households (1.8%) fall into this category. Meanwhile, the 65+ years age bracket for the primary householder has the lowest median household income of $44,647, with 1,320 households (40.3%) in this group.
| Income Bracket | # Households | Median Income |
| 15 to 24 Years | 59 (1.8%) | $80,074 |
| 25 to 44 Years | 665 (20.3%) | $62,470 |
| 45 to 64 Years | 1,230 (37.6%) | $65,357 |
| 65+ Years | 1,320 (40.3%) | $44,647 |
| Total | 3,274 (100.0%) | $55,528 |
Poverty in Alger County
Income Below Poverty by Sex and Age in Alger County
With 9.7% poverty level for males and 10.8% for females among the residents of Alger County, 55 to 64 year old males and 55 to 64 year old females are the most vulnerable to poverty, with 114 males (16.4%) and 139 females (20.0%) in their respective age groups living below the poverty level.
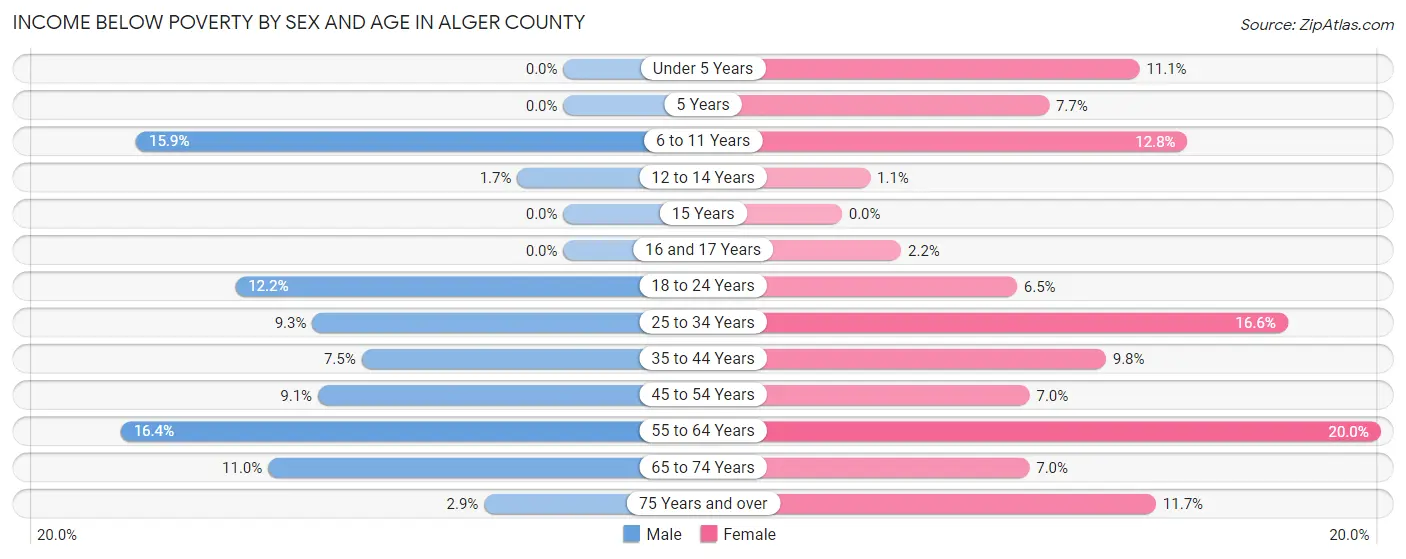
| Age Bracket | Male | Female |
| Under 5 Years | 0 (0.0%) | 19 (11.1%) |
| 5 Years | 0 (0.0%) | 5 (7.7%) |
| 6 to 11 Years | 46 (15.9%) | 34 (12.8%) |
| 12 to 14 Years | 2 (1.7%) | 2 (1.1%) |
| 15 Years | 0 (0.0%) | 0 (0.0%) |
| 16 and 17 Years | 0 (0.0%) | 2 (2.2%) |
| 18 to 24 Years | 24 (12.2%) | 16 (6.5%) |
| 25 to 34 Years | 34 (9.3%) | 49 (16.6%) |
| 35 to 44 Years | 29 (7.5%) | 34 (9.8%) |
| 45 to 54 Years | 42 (9.1%) | 29 (7.0%) |
| 55 to 64 Years | 114 (16.4%) | 139 (20.0%) |
| 65 to 74 Years | 78 (11.0%) | 45 (7.0%) |
| 75 Years and over | 11 (2.9%) | 47 (11.7%) |
| Total | 380 (9.7%) | 421 (10.8%) |
Income Above Poverty by Sex and Age in Alger County
According to the poverty statistics in Alger County, males aged under 5 years and females aged 15 years are the age groups that are most secure financially, with 100.0% of males and 100.0% of females in these age groups living above the poverty line.
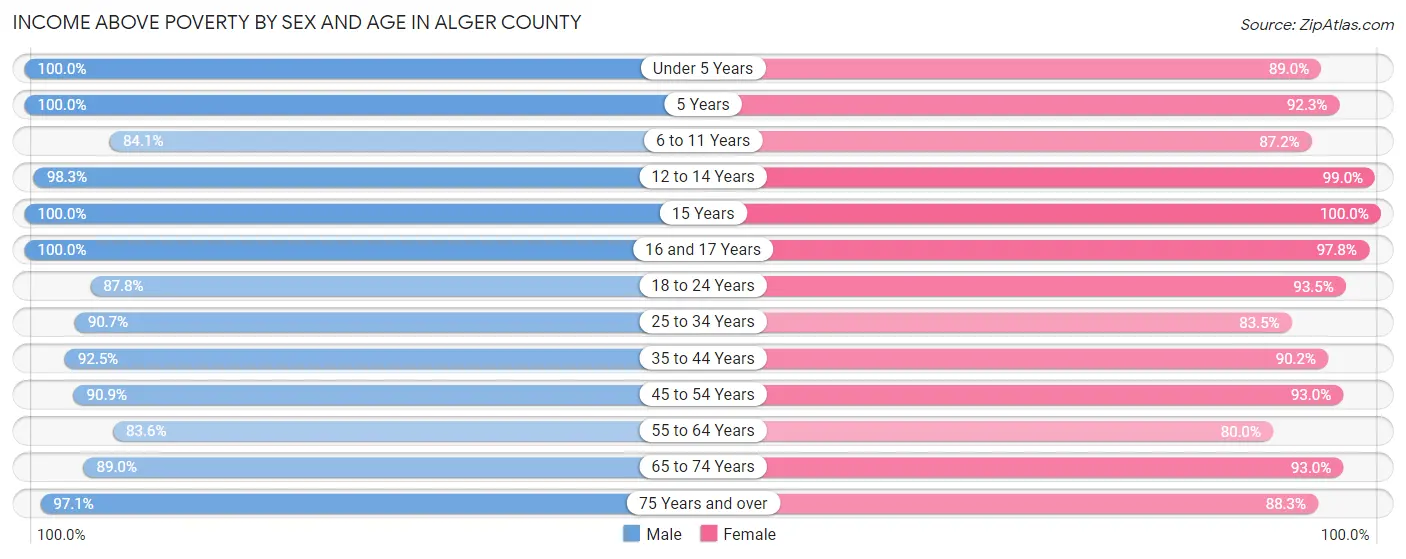
| Age Bracket | Male | Female |
| Under 5 Years | 123 (100.0%) | 153 (88.9%) |
| 5 Years | 2 (100.0%) | 60 (92.3%) |
| 6 to 11 Years | 244 (84.1%) | 231 (87.2%) |
| 12 to 14 Years | 115 (98.3%) | 188 (99.0%) |
| 15 Years | 75 (100.0%) | 47 (100.0%) |
| 16 and 17 Years | 137 (100.0%) | 89 (97.8%) |
| 18 to 24 Years | 173 (87.8%) | 230 (93.5%) |
| 25 to 34 Years | 331 (90.7%) | 247 (83.5%) |
| 35 to 44 Years | 358 (92.5%) | 313 (90.2%) |
| 45 to 54 Years | 419 (90.9%) | 387 (93.0%) |
| 55 to 64 Years | 580 (83.6%) | 556 (80.0%) |
| 65 to 74 Years | 634 (89.0%) | 602 (93.0%) |
| 75 Years and over | 363 (97.1%) | 356 (88.3%) |
| Total | 3,554 (90.3%) | 3,459 (89.1%) |
Income Below Poverty Among Married-Couple Families in Alger County
The poverty statistics for married-couple families in Alger County show that 3.6% or 64 of the total 1,785 families live below the poverty line. Families with 3 or 4 children have the highest poverty rate of 13.0%, comprising of 16 families. On the other hand, families with 1 or 2 children have the lowest poverty rate of 0.0%, which includes 0 families.
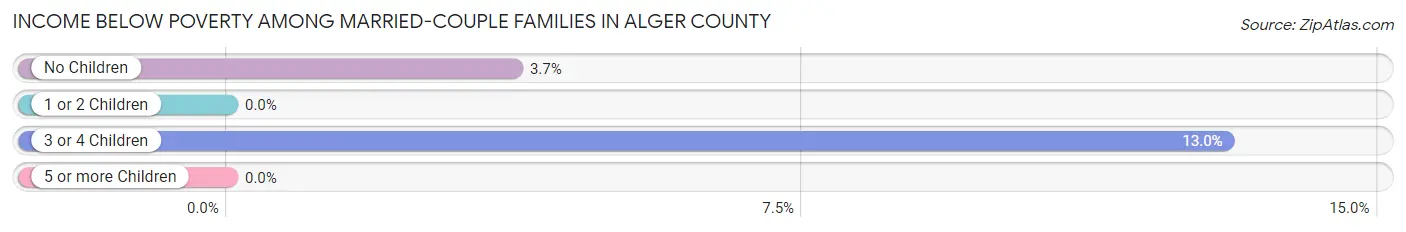
| Children | Above Poverty | Below Poverty |
| No Children | 1,243 (96.3%) | 48 (3.7%) |
| 1 or 2 Children | 358 (100.0%) | 0 (0.0%) |
| 3 or 4 Children | 107 (87.0%) | 16 (13.0%) |
| 5 or more Children | 13 (100.0%) | 0 (0.0%) |
| Total | 1,721 (96.4%) | 64 (3.6%) |
Income Below Poverty Among Single-Parent Households in Alger County
According to the poverty data in Alger County, 5.8% or 8 single-father households and 20.5% or 40 single-mother households are living below the poverty line. Among single-father households, those with no children have the highest poverty rate, with 8 households (8.3%) experiencing poverty. Likewise, among single-mother households, those with 3 or 4 children have the highest poverty rate, with 9 households (40.9%) falling below the poverty line.
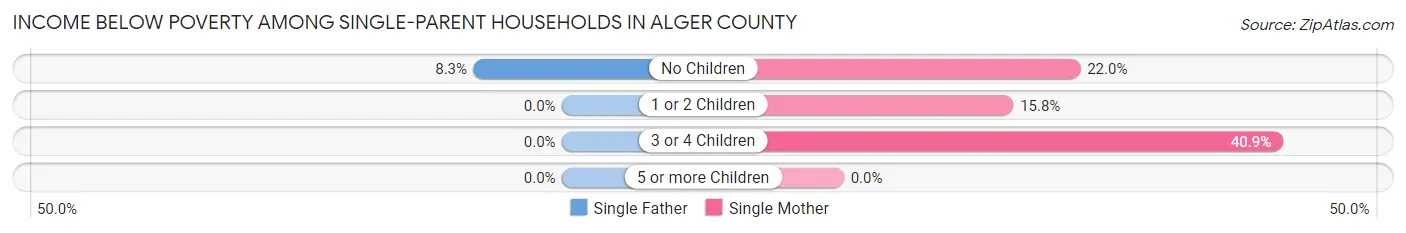
| Children | Single Father | Single Mother |
| No Children | 8 (8.3%) | 13 (22.0%) |
| 1 or 2 Children | 0 (0.0%) | 18 (15.8%) |
| 3 or 4 Children | 0 (0.0%) | 9 (40.9%) |
| 5 or more Children | 0 (0.0%) | 0 (0.0%) |
| Total | 8 (5.8%) | 40 (20.5%) |
Income Below Poverty Among Married-Couple vs Single-Parent Households in Alger County
The poverty data for Alger County shows that 64 of the married-couple family households (3.6%) and 48 of the single-parent households (14.5%) are living below the poverty level. Within the married-couple family households, those with 3 or 4 children have the highest poverty rate, with 16 households (13.0%) falling below the poverty line. Among the single-parent households, those with 3 or 4 children have the highest poverty rate, with 9 household (40.9%) living below poverty.
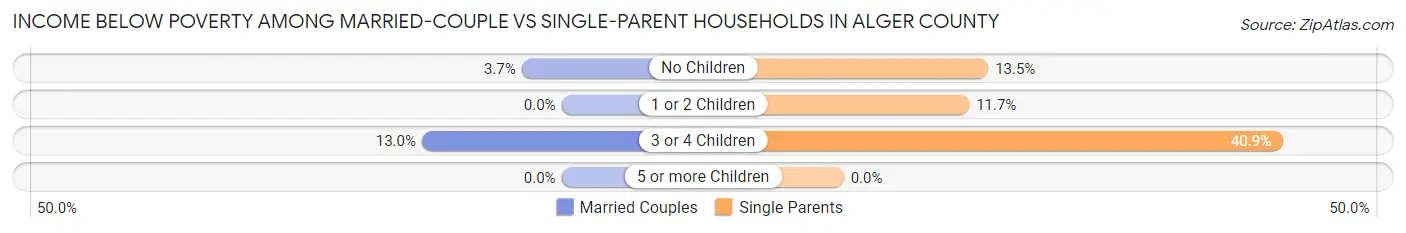
| Children | Married-Couple Families | Single-Parent Households |
| No Children | 48 (3.7%) | 21 (13.5%) |
| 1 or 2 Children | 0 (0.0%) | 18 (11.7%) |
| 3 or 4 Children | 16 (13.0%) | 9 (40.9%) |
| 5 or more Children | 0 (0.0%) | 0 (0.0%) |
| Total | 64 (3.6%) | 48 (14.5%) |
Race in Alger County
The most populous races in Alger County are White / Caucasian (7,324 | 82.6%), Black / African American (691 | 7.8%), and Two or more Races (441 | 5.0%).
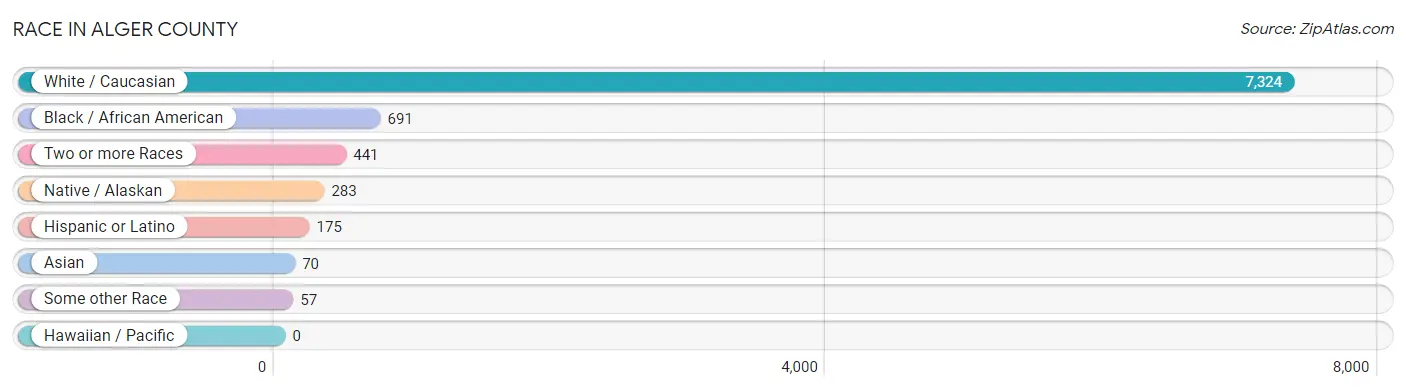
| Race | # Population | % Population |
| Asian | 70 | 0.8% |
| Black / African American | 691 | 7.8% |
| Hawaiian / Pacific | 0 | 0.0% |
| Hispanic or Latino | 175 | 2.0% |
| Native / Alaskan | 283 | 3.2% |
| White / Caucasian | 7,324 | 82.6% |
| Two or more Races | 441 | 5.0% |
| Some other Race | 57 | 0.6% |
| Total | 8,866 | 100.0% |
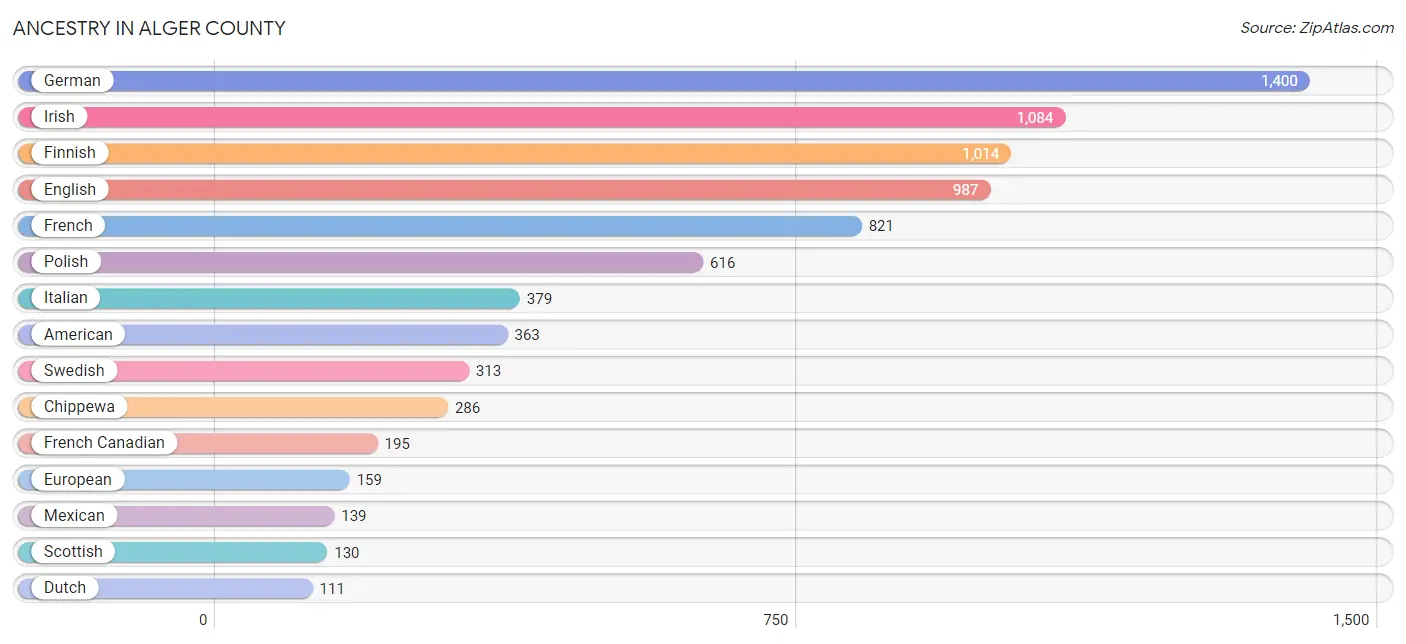
Ancestry in Alger County
The most populous ancestries reported in Alger County are German (1,400 | 15.8%), Irish (1,084 | 12.2%), Finnish (1,014 | 11.4%), English (987 | 11.1%), and French (821 | 9.3%), together accounting for 59.9% of all Alger County residents.
| Ancestry | # Population | % Population |
| African | 10 | 0.1% |
| American | 363 | 4.1% |
| Arab | 10 | 0.1% |
| Austrian | 45 | 0.5% |
| Belgian | 67 | 0.8% |
| Bhutanese | 7 | 0.1% |
| Blackfeet | 81 | 0.9% |
| British | 16 | 0.2% |
| Burmese | 9 | 0.1% |
| Canadian | 26 | 0.3% |
| Central American | 4 | 0.1% |
| Cherokee | 70 | 0.8% |
| Chippewa | 286 | 3.2% |
| Choctaw | 2 | 0.0% |
| Costa Rican | 3 | 0.0% |
| Croatian | 9 | 0.1% |
| Cuban | 5 | 0.1% |
| Czech | 42 | 0.5% |
| Danish | 76 | 0.9% |
| Dutch | 111 | 1.3% |
| Eastern European | 2 | 0.0% |
| Egyptian | 2 | 0.0% |
| English | 987 | 11.1% |
| European | 159 | 1.8% |
| Finnish | 1,014 | 11.4% |
| French | 821 | 9.3% |
| French American Indian | 3 | 0.0% |
| French Canadian | 195 | 2.2% |
| German | 1,400 | 15.8% |
| Greek | 7 | 0.1% |
| Guatemalan | 1 | 0.0% |
| Hungarian | 47 | 0.5% |
| Indian (Asian) | 99 | 1.1% |
| Irish | 1,084 | 12.2% |
| Iroquois | 1 | 0.0% |
| Italian | 379 | 4.3% |
| Jamaican | 8 | 0.1% |
| Korean | 4 | 0.1% |
| Latvian | 3 | 0.0% |
| Lithuanian | 13 | 0.2% |
| Mexican | 139 | 1.6% |
| Mexican American Indian | 1 | 0.0% |
| Moroccan | 8 | 0.1% |
| Northern European | 5 | 0.1% |
| Norwegian | 57 | 0.6% |
| Ottawa | 9 | 0.1% |
| Polish | 616 | 7.0% |
| Potawatomi | 12 | 0.1% |
| Puerto Rican | 7 | 0.1% |
| Russian | 38 | 0.4% |
| Samoan | 1 | 0.0% |
| Scandinavian | 21 | 0.2% |
| Scotch-Irish | 66 | 0.7% |
| Scottish | 130 | 1.5% |
| Seminole | 2 | 0.0% |
| Sioux | 8 | 0.1% |
| Slavic | 3 | 0.0% |
| Slovak | 24 | 0.3% |
| Slovene | 55 | 0.6% |
| Spaniard | 10 | 0.1% |
| Spanish | 7 | 0.1% |
| Spanish American | 3 | 0.0% |
| Subsaharan African | 10 | 0.1% |
| Swedish | 313 | 3.5% |
| Swiss | 6 | 0.1% |
| Ukrainian | 8 | 0.1% |
| Welsh | 42 | 0.5% |
| Yaqui | 1 | 0.0% |
| Yugoslavian | 13 | 0.2% | View All 69 Rows |
Immigrants in Alger County
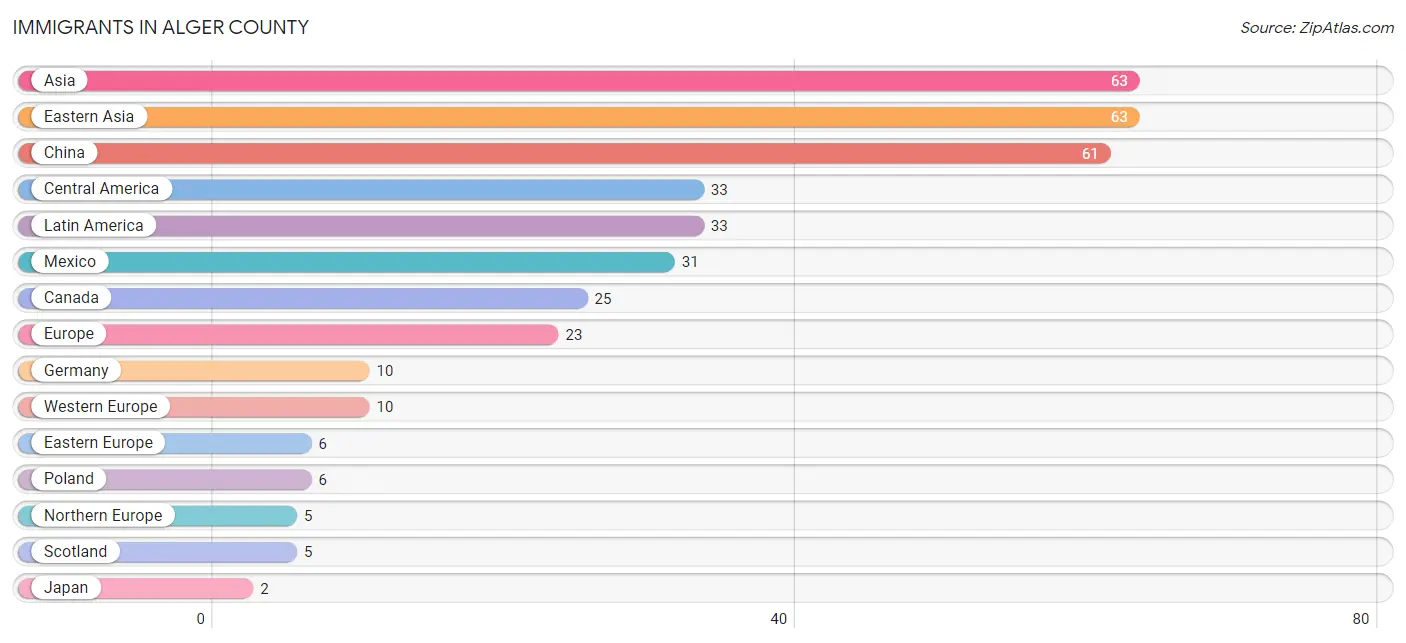
The most numerous immigrant groups reported in Alger County came from Asia (63 | 0.7%), Eastern Asia (63 | 0.7%), China (61 | 0.7%), Central America (33 | 0.4%), and Latin America (33 | 0.4%), together accounting for 2.9% of all Alger County residents.
| Immigration Origin | # Population | % Population |
| Asia | 63 | 0.7% |
| Canada | 25 | 0.3% |
| Central America | 33 | 0.4% |
| China | 61 | 0.7% |
| Costa Rica | 1 | 0.0% |
| Eastern Asia | 63 | 0.7% |
| Eastern Europe | 6 | 0.1% |
| Europe | 23 | 0.3% |
| Germany | 10 | 0.1% |
| Guatemala | 1 | 0.0% |
| Japan | 2 | 0.0% |
| Latin America | 33 | 0.4% |
| Mexico | 31 | 0.4% |
| Northern Europe | 5 | 0.1% |
| Poland | 6 | 0.1% |
| Scotland | 5 | 0.1% |
| Southern Europe | 2 | 0.0% |
| Spain | 2 | 0.0% |
| Western Europe | 10 | 0.1% | View All 19 Rows |
Sex and Age in Alger County
Sex and Age in Alger County
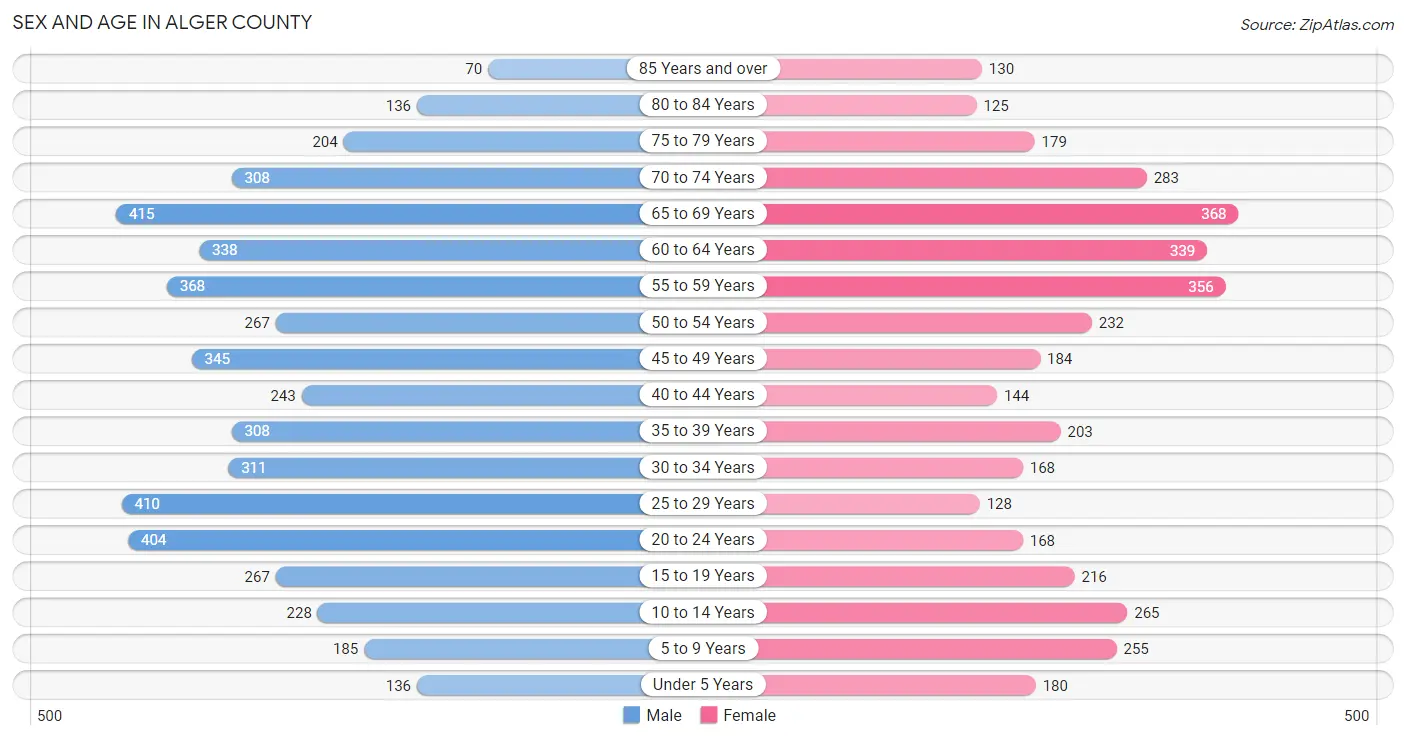
The most populous age groups in Alger County are 65 to 69 Years (415 | 8.4%) for men and 65 to 69 Years (368 | 9.4%) for women.
| Age Bracket | Male | Female |
| Under 5 Years | 136 (2.8%) | 180 (4.6%) |
| 5 to 9 Years | 185 (3.7%) | 255 (6.5%) |
| 10 to 14 Years | 228 (4.6%) | 265 (6.8%) |
| 15 to 19 Years | 267 (5.4%) | 216 (5.5%) |
| 20 to 24 Years | 404 (8.2%) | 168 (4.3%) |
| 25 to 29 Years | 410 (8.3%) | 128 (3.3%) |
| 30 to 34 Years | 311 (6.3%) | 168 (4.3%) |
| 35 to 39 Years | 308 (6.2%) | 203 (5.2%) |
| 40 to 44 Years | 243 (4.9%) | 144 (3.7%) |
| 45 to 49 Years | 345 (7.0%) | 184 (4.7%) |
| 50 to 54 Years | 267 (5.4%) | 232 (5.9%) |
| 55 to 59 Years | 368 (7.4%) | 356 (9.1%) |
| 60 to 64 Years | 338 (6.8%) | 339 (8.6%) |
| 65 to 69 Years | 415 (8.4%) | 368 (9.4%) |
| 70 to 74 Years | 308 (6.2%) | 283 (7.2%) |
| 75 to 79 Years | 204 (4.1%) | 179 (4.6%) |
| 80 to 84 Years | 136 (2.8%) | 125 (3.2%) |
| 85 Years and over | 70 (1.4%) | 130 (3.3%) |
| Total | 4,943 (100.0%) | 3,923 (100.0%) |
Families and Households in Alger County
Median Family Size in Alger County
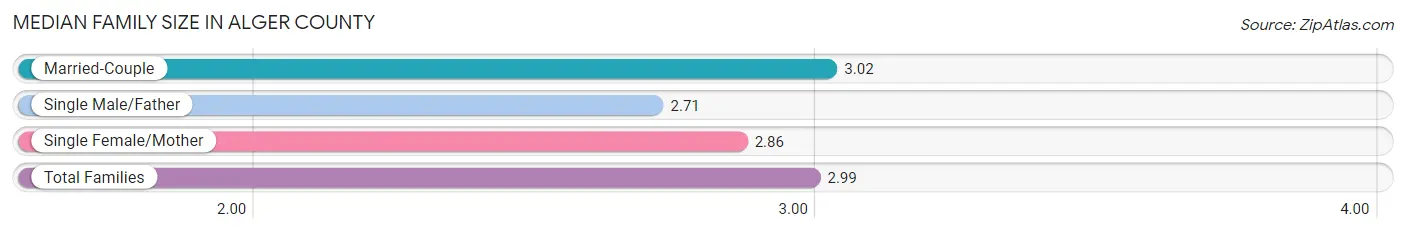
The median family size in Alger County is 2.99 persons per family, with married-couple families (1,785 | 84.3%) accounting for the largest median family size of 3.02 persons per family. On the other hand, single male/father families (137 | 6.5%) represent the smallest median family size with 2.71 persons per family.
| Family Type | # Families | Family Size |
| Married-Couple | 1,785 (84.3%) | 3.02 |
| Single Male/Father | 137 (6.5%) | 2.71 |
| Single Female/Mother | 195 (9.2%) | 2.86 |
| Total Families | 2,117 (100.0%) | 2.99 |
Median Household Size in Alger County
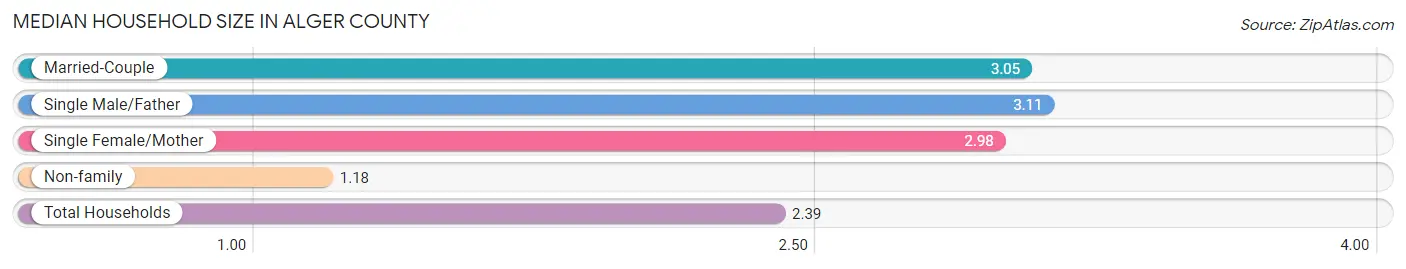
The median household size in Alger County is 2.39 persons per household, with single male/father households (137 | 4.2%) accounting for the largest median household size of 3.11 persons per household. non-family households (1,157 | 35.3%) represent the smallest median household size with 1.18 persons per household.
| Household Type | # Households | Household Size |
| Married-Couple | 1,785 (54.5%) | 3.05 |
| Single Male/Father | 137 (4.2%) | 3.11 |
| Single Female/Mother | 195 (6.0%) | 2.98 |
| Non-family | 1,157 (35.3%) | 1.18 |
| Total Households | 3,274 (100.0%) | 2.39 |
Household Size by Marriage Status in Alger County
Out of a total of 3,274 households in Alger County, 2,117 (64.7%) are family households, while 1,157 (35.3%) are nonfamily households. The most numerous type of family households are 2-person households, comprising 1,286, and the most common type of nonfamily households are 1-person households, comprising 932.
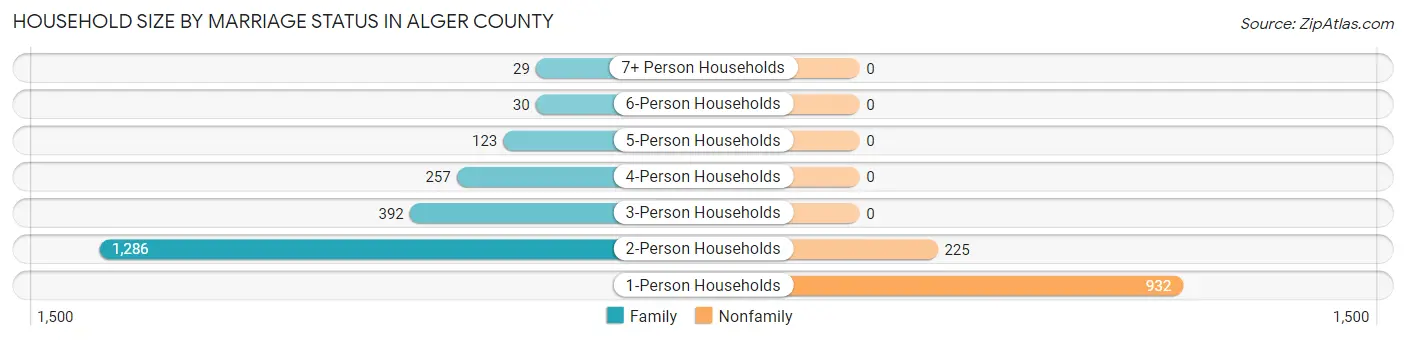
| Household Size | Family Households | Nonfamily Households |
| 1-Person Households | - | 932 (28.5%) |
| 2-Person Households | 1,286 (39.3%) | 225 (6.9%) |
| 3-Person Households | 392 (12.0%) | 0 (0.0%) |
| 4-Person Households | 257 (7.9%) | 0 (0.0%) |
| 5-Person Households | 123 (3.8%) | 0 (0.0%) |
| 6-Person Households | 30 (0.9%) | 0 (0.0%) |
| 7+ Person Households | 29 (0.9%) | 0 (0.0%) |
| Total | 2,117 (64.7%) | 1,157 (35.3%) |
Female Fertility in Alger County
Fertility by Age in Alger County
Average fertility rate in Alger County is 38.0 births per 1,000 women. Women in the age bracket of 15 to 19 years have the highest fertility rate with 65.0 births per 1,000 women. Women in the age bracket of 20 to 34 years acount for 60.4% of all women with births.
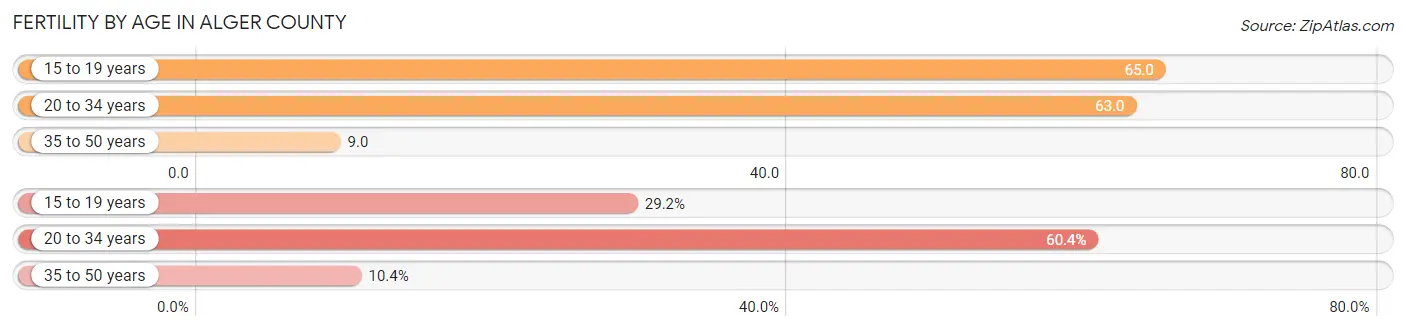
| Age Bracket | Women with Births | Births / 1,000 Women |
| 15 to 19 years | 14 (29.2%) | 65.0 |
| 20 to 34 years | 29 (60.4%) | 63.0 |
| 35 to 50 years | 5 (10.4%) | 9.0 |
| Total | 48 (100.0%) | 38.0 |
Fertility by Age by Marriage Status in Alger County
35.4% of women with births (48) in Alger County are married. The highest percentage of unmarried women with births falls into 15 to 19 years age bracket with 100.0% of them unmarried at the time of birth, while the lowest percentage of unmarried women with births belong to 35 to 50 years age bracket with 40.0% of them unmarried.
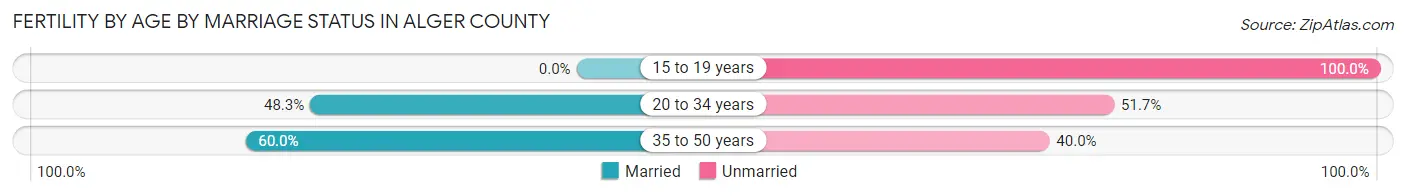
| Age Bracket | Married | Unmarried |
| 15 to 19 years | 0 (0.0%) | 14 (100.0%) |
| 20 to 34 years | 14 (48.3%) | 15 (51.7%) |
| 35 to 50 years | 3 (60.0%) | 2 (40.0%) |
| Total | 17 (35.4%) | 31 (64.6%) |
Fertility by Education in Alger County
Average fertility rate in Alger County is 38.0 births per 1,000 women. Women with the education attainment of high school diploma have the highest fertility rate of 82.0 births per 1,000 women, while women with the education attainment of college or associate's degree have the lowest fertility at 5.0 births per 1,000 women. Women with the education attainment of high school diploma represent 58.3% of all women with births.
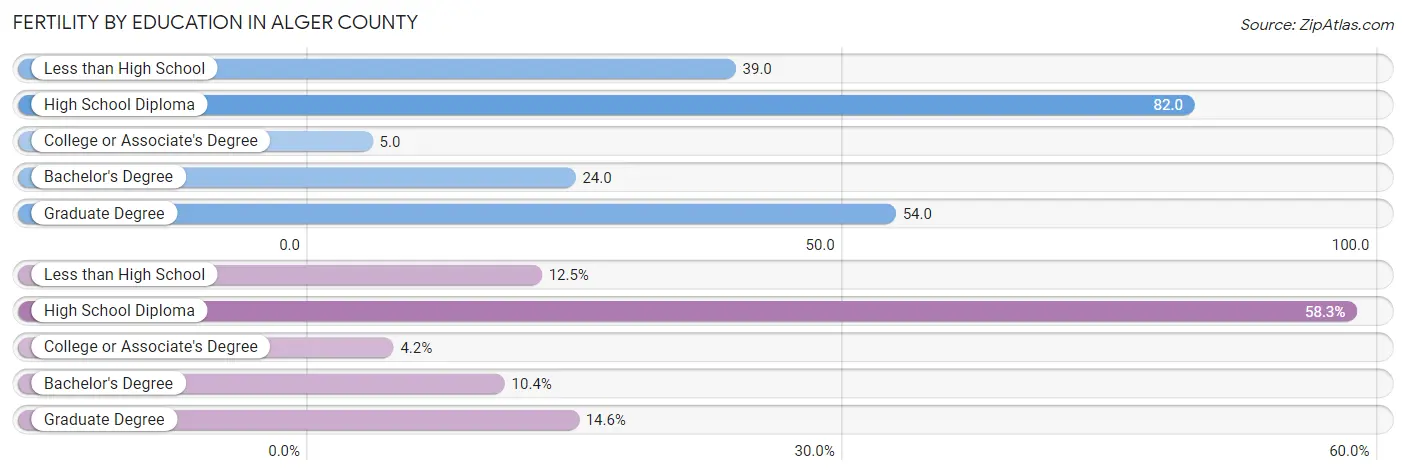
| Educational Attainment | Women with Births | Births / 1,000 Women |
| Less than High School | 6 (12.5%) | 39.0 |
| High School Diploma | 28 (58.3%) | 82.0 |
| College or Associate's Degree | 2 (4.2%) | 5.0 |
| Bachelor's Degree | 5 (10.4%) | 24.0 |
| Graduate Degree | 7 (14.6%) | 54.0 |
| Total | 48 (100.0%) | 38.0 |
Fertility by Education by Marriage Status in Alger County
64.6% of women with births in Alger County are unmarried. Women with the educational attainment of college or associate's degree are most likely to be married with 100.0% of them married at childbirth, while women with the educational attainment of less than high school are least likely to be married with 100.0% of them unmarried at childbirth.
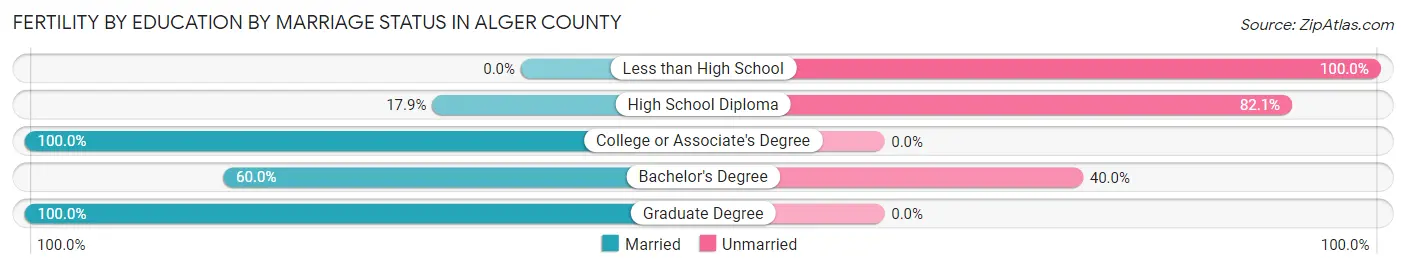
| Educational Attainment | Married | Unmarried |
| Less than High School | 0 (0.0%) | 6 (100.0%) |
| High School Diploma | 5 (17.9%) | 23 (82.1%) |
| College or Associate's Degree | 2 (100.0%) | 0 (0.0%) |
| Bachelor's Degree | 3 (60.0%) | 2 (40.0%) |
| Graduate Degree | 7 (100.0%) | 0 (0.0%) |
| Total | 17 (35.4%) | 31 (64.6%) |
Employment Characteristics in Alger County
Employment by Class of Employer in Alger County
Among the 2,856 employed individuals in Alger County, private company employees (1,832 | 64.1%), local government employees (265 | 9.3%), and state government employees (214 | 7.5%) make up the most common classes of employment.
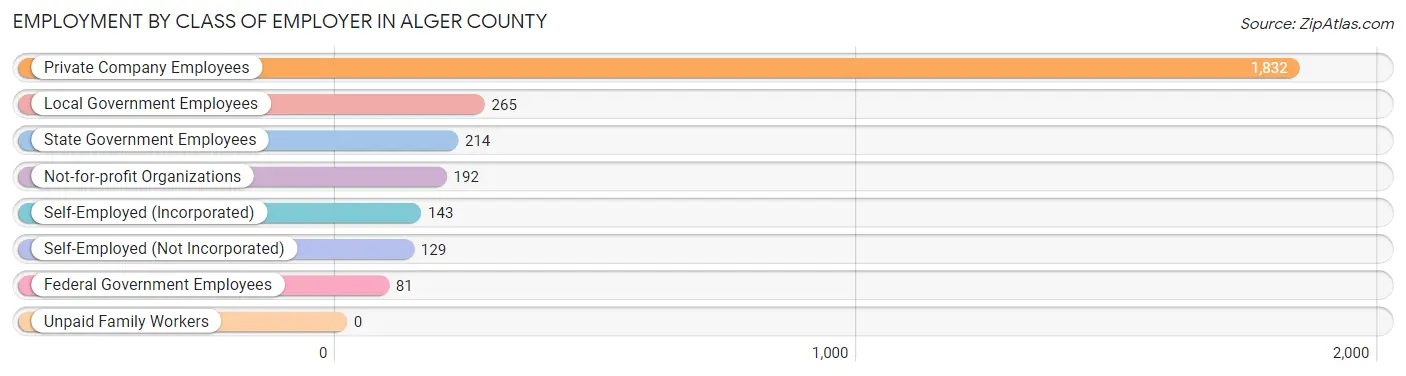
| Employer Class | # Employees | % Employees |
| Private Company Employees | 1,832 | 64.1% |
| Self-Employed (Incorporated) | 143 | 5.0% |
| Self-Employed (Not Incorporated) | 129 | 4.5% |
| Not-for-profit Organizations | 192 | 6.7% |
| Local Government Employees | 265 | 9.3% |
| State Government Employees | 214 | 7.5% |
| Federal Government Employees | 81 | 2.8% |
| Unpaid Family Workers | 0 | 0.0% |
| Total | 2,856 | 100.0% |
Employment Status by Age in Alger County
According to the labor force statistics for Alger County, out of the total population over 16 years of age (7,495), 41.0% or 3,073 individuals are in the labor force, with 5.1% or 157 of them unemployed. The age group with the highest labor force participation rate is 35 to 44 years, with 70.0% or 629 individuals in the labor force. Within the labor force, the 20 to 24 years age range has the highest percentage of unemployed individuals, with 18.0% or 50 of them being unemployed.
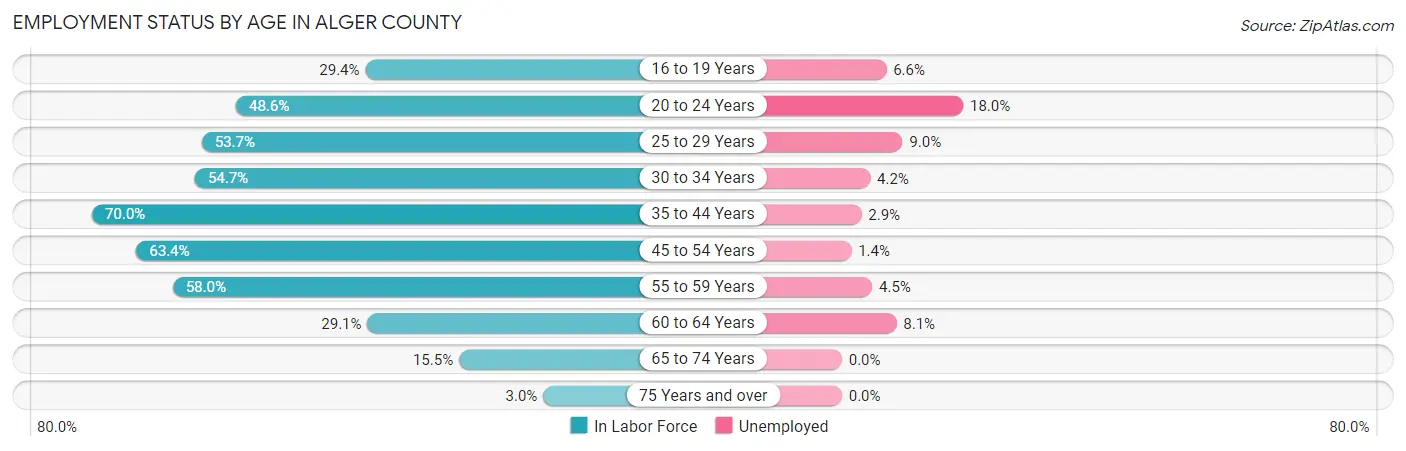
| Age Bracket | In Labor Force | Unemployed |
| 16 to 19 Years | 106 (29.4%) | 7 (6.6%) |
| 20 to 24 Years | 278 (48.6%) | 50 (18.0%) |
| 25 to 29 Years | 289 (53.7%) | 26 (9.0%) |
| 30 to 34 Years | 262 (54.7%) | 11 (4.2%) |
| 35 to 44 Years | 629 (70.0%) | 18 (2.9%) |
| 45 to 54 Years | 652 (63.4%) | 9 (1.4%) |
| 55 to 59 Years | 420 (58.0%) | 19 (4.5%) |
| 60 to 64 Years | 197 (29.1%) | 16 (8.1%) |
| 65 to 74 Years | 213 (15.5%) | 0 (0.0%) |
| 75 Years and over | 25 (3.0%) | 0 (0.0%) |
| Total | 3,073 (41.0%) | 157 (5.1%) |
Employment Status by Educational Attainment in Alger County
According to labor force statistics for Alger County, 56.4% of individuals (2,450) out of the total population between 25 and 64 years of age (4,344) are in the labor force, with 4.0% or 98 of them being unemployed. The group with the highest labor force participation rate are those with the educational attainment of bachelor's degree or higher, with 83.1% or 729 individuals in the labor force. Within the labor force, individuals with less than high school education have the highest percentage of unemployment, with 7.4% or 4 of them being unemployed.
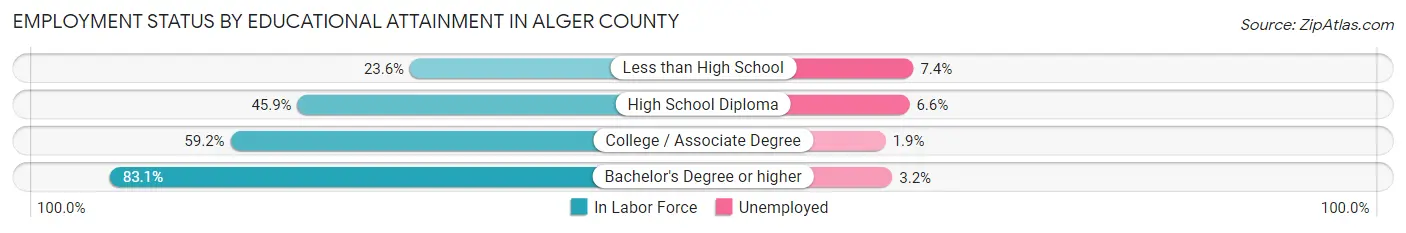
| Educational Attainment | In Labor Force | Unemployed |
| Less than High School | 54 (23.6%) | 17 (7.4%) |
| High School Diploma | 866 (45.9%) | 124 (6.6%) |
| College / Associate Degree | 800 (59.2%) | 26 (1.9%) |
| Bachelor's Degree or higher | 729 (83.1%) | 28 (3.2%) |
| Total | 2,450 (56.4%) | 174 (4.0%) |
Employment Occupations by Sex in Alger County
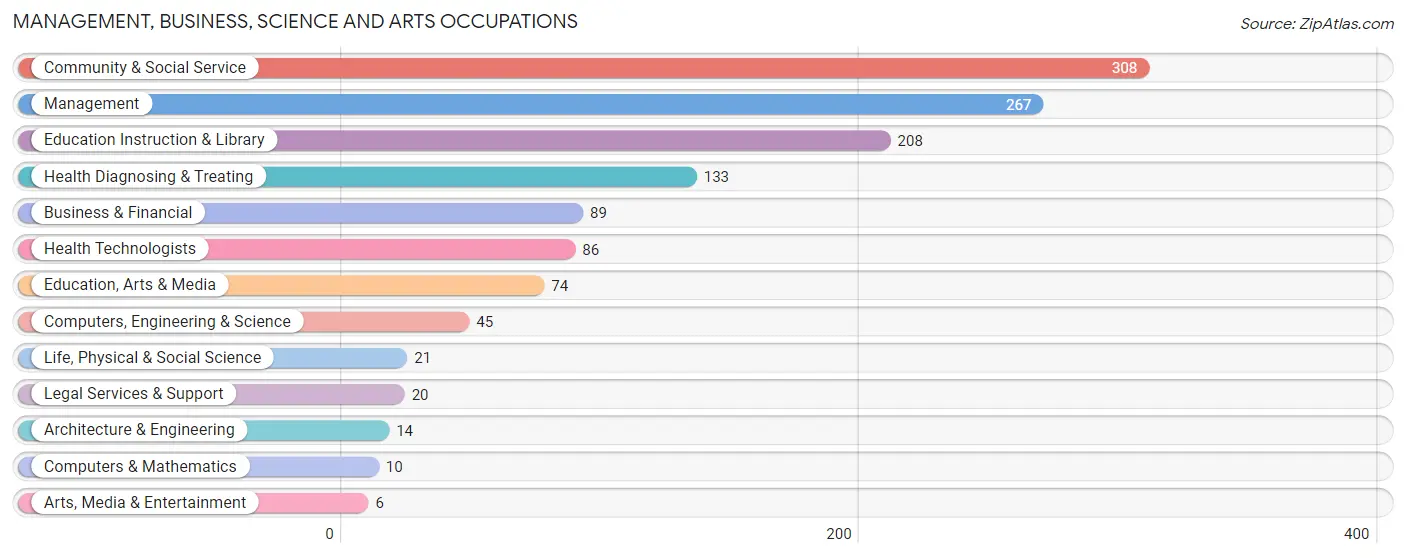
Management, Business, Science and Arts Occupations
The most common Management, Business, Science and Arts occupations in Alger County are Community & Social Service (308 | 10.6%), Management (267 | 9.2%), Education Instruction & Library (208 | 7.1%), Health Diagnosing & Treating (133 | 4.6%), and Business & Financial (89 | 3.0%).
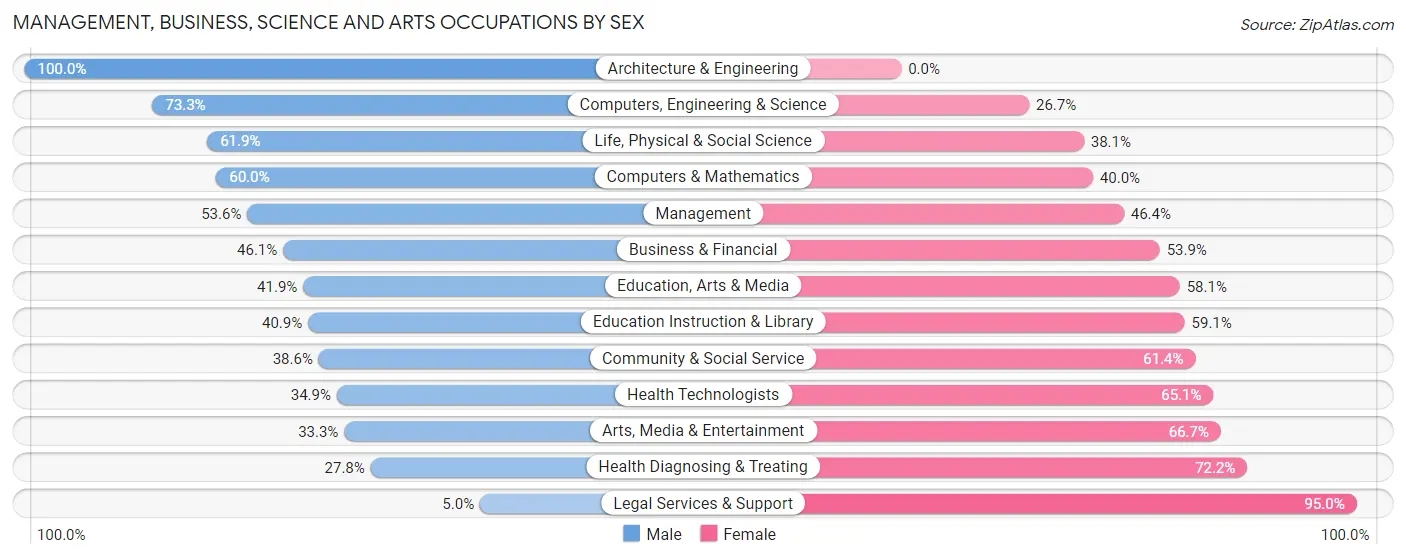
Management, Business, Science and Arts Occupations by Sex
Within the Management, Business, Science and Arts occupations in Alger County, the most male-oriented occupations are Architecture & Engineering (100.0%), Computers, Engineering & Science (73.3%), and Life, Physical & Social Science (61.9%), while the most female-oriented occupations are Legal Services & Support (95.0%), Health Diagnosing & Treating (72.2%), and Arts, Media & Entertainment (66.7%).
| Occupation | Male | Female |
| Management | 143 (53.6%) | 124 (46.4%) |
| Business & Financial | 41 (46.1%) | 48 (53.9%) |
| Computers, Engineering & Science | 33 (73.3%) | 12 (26.7%) |
| Computers & Mathematics | 6 (60.0%) | 4 (40.0%) |
| Architecture & Engineering | 14 (100.0%) | 0 (0.0%) |
| Life, Physical & Social Science | 13 (61.9%) | 8 (38.1%) |
| Community & Social Service | 119 (38.6%) | 189 (61.4%) |
| Education, Arts & Media | 31 (41.9%) | 43 (58.1%) |
| Legal Services & Support | 1 (5.0%) | 19 (95.0%) |
| Education Instruction & Library | 85 (40.9%) | 123 (59.1%) |
| Arts, Media & Entertainment | 2 (33.3%) | 4 (66.7%) |
| Health Diagnosing & Treating | 37 (27.8%) | 96 (72.2%) |
| Health Technologists | 30 (34.9%) | 56 (65.1%) |
| Total (Category) | 373 (44.3%) | 469 (55.7%) |
| Total (Overall) | 1,554 (53.3%) | 1,361 (46.7%) |
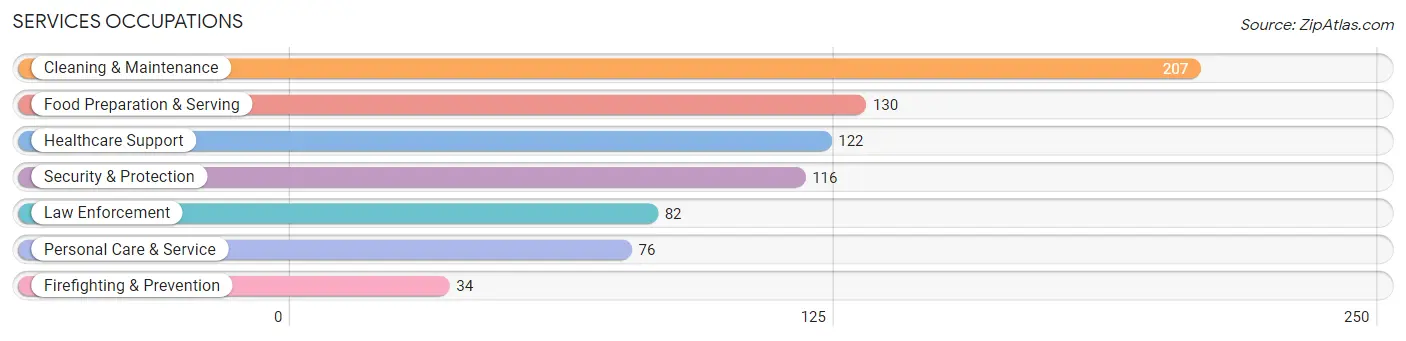
Services Occupations
The most common Services occupations in Alger County are Cleaning & Maintenance (207 | 7.1%), Food Preparation & Serving (130 | 4.5%), Healthcare Support (122 | 4.2%), Security & Protection (116 | 4.0%), and Law Enforcement (82 | 2.8%).
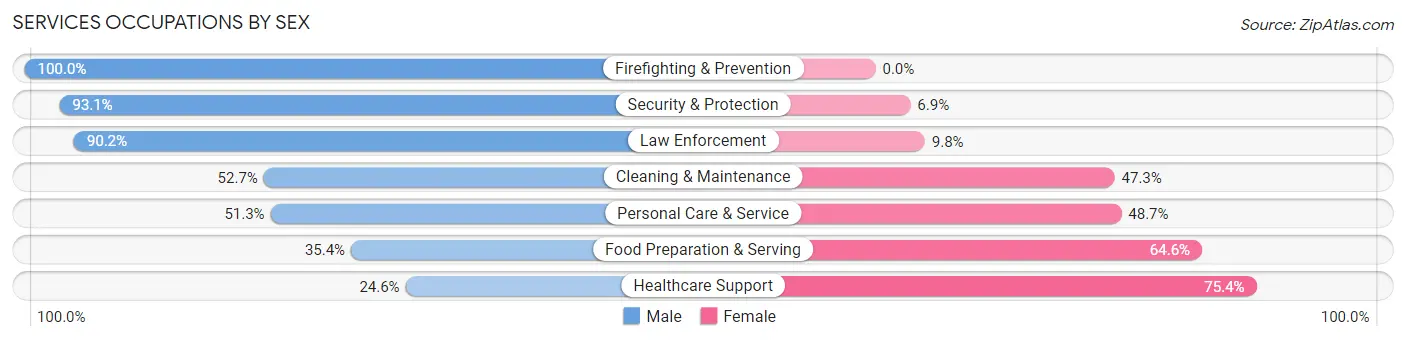
Services Occupations by Sex
Within the Services occupations in Alger County, the most male-oriented occupations are Firefighting & Prevention (100.0%), Security & Protection (93.1%), and Law Enforcement (90.2%), while the most female-oriented occupations are Healthcare Support (75.4%), Food Preparation & Serving (64.6%), and Personal Care & Service (48.7%).
| Occupation | Male | Female |
| Healthcare Support | 30 (24.6%) | 92 (75.4%) |
| Security & Protection | 108 (93.1%) | 8 (6.9%) |
| Firefighting & Prevention | 34 (100.0%) | 0 (0.0%) |
| Law Enforcement | 74 (90.2%) | 8 (9.8%) |
| Food Preparation & Serving | 46 (35.4%) | 84 (64.6%) |
| Cleaning & Maintenance | 109 (52.7%) | 98 (47.3%) |
| Personal Care & Service | 39 (51.3%) | 37 (48.7%) |
| Total (Category) | 332 (51.0%) | 319 (49.0%) |
| Total (Overall) | 1,554 (53.3%) | 1,361 (46.7%) |
Sales and Office Occupations
The most common Sales and Office occupations in Alger County are Office & Administration (295 | 10.1%), and Sales & Related (245 | 8.4%).
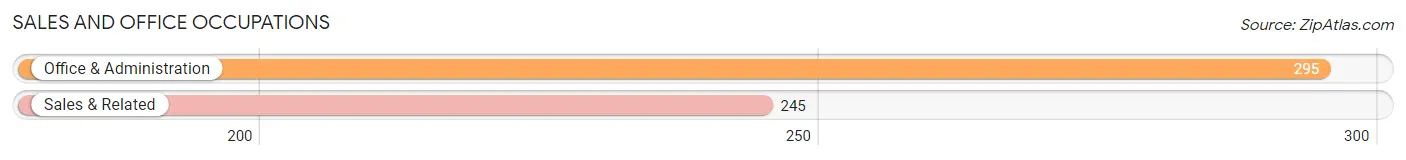
Sales and Office Occupations by Sex

| Occupation | Male | Female |
| Sales & Related | 64 (26.1%) | 181 (73.9%) |
| Office & Administration | 47 (15.9%) | 248 (84.1%) |
| Total (Category) | 111 (20.6%) | 429 (79.4%) |
| Total (Overall) | 1,554 (53.3%) | 1,361 (46.7%) |
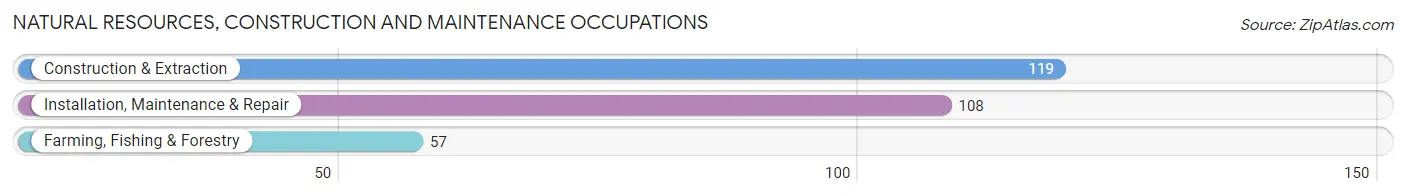
Natural Resources, Construction and Maintenance Occupations
The most common Natural Resources, Construction and Maintenance occupations in Alger County are Construction & Extraction (119 | 4.1%), Installation, Maintenance & Repair (108 | 3.7%), and Farming, Fishing & Forestry (57 | 2.0%).
Natural Resources, Construction and Maintenance Occupations by Sex
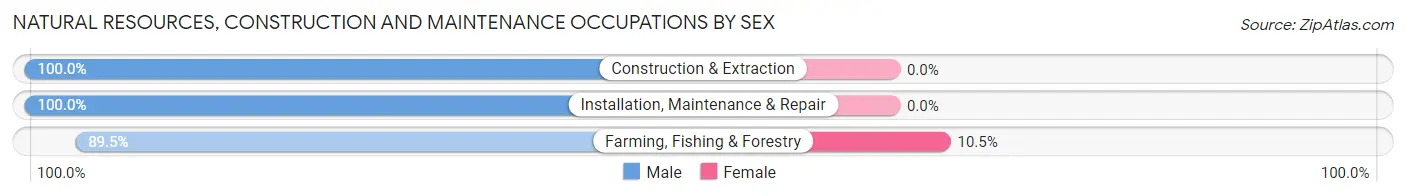
| Occupation | Male | Female |
| Farming, Fishing & Forestry | 51 (89.5%) | 6 (10.5%) |
| Construction & Extraction | 119 (100.0%) | 0 (0.0%) |
| Installation, Maintenance & Repair | 108 (100.0%) | 0 (0.0%) |
| Total (Category) | 278 (97.9%) | 6 (2.1%) |
| Total (Overall) | 1,554 (53.3%) | 1,361 (46.7%) |
Production, Transportation and Moving Occupations
The most common Production, Transportation and Moving occupations in Alger County are Production (344 | 11.8%), Material Moving (178 | 6.1%), and Transportation (76 | 2.6%).
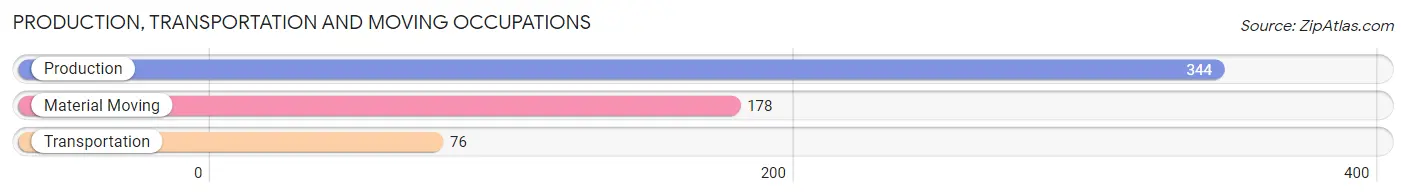
Production, Transportation and Moving Occupations by Sex
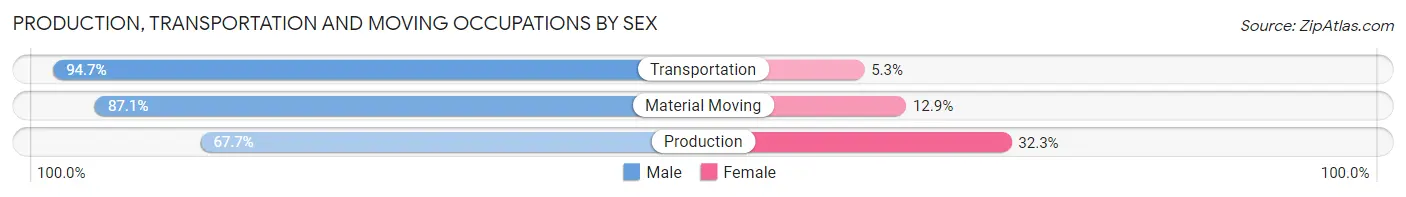
| Occupation | Male | Female |
| Production | 233 (67.7%) | 111 (32.3%) |
| Transportation | 72 (94.7%) | 4 (5.3%) |
| Material Moving | 155 (87.1%) | 23 (12.9%) |
| Total (Category) | 460 (76.9%) | 138 (23.1%) |
| Total (Overall) | 1,554 (53.3%) | 1,361 (46.7%) |
Employment Industries by Sex in Alger County
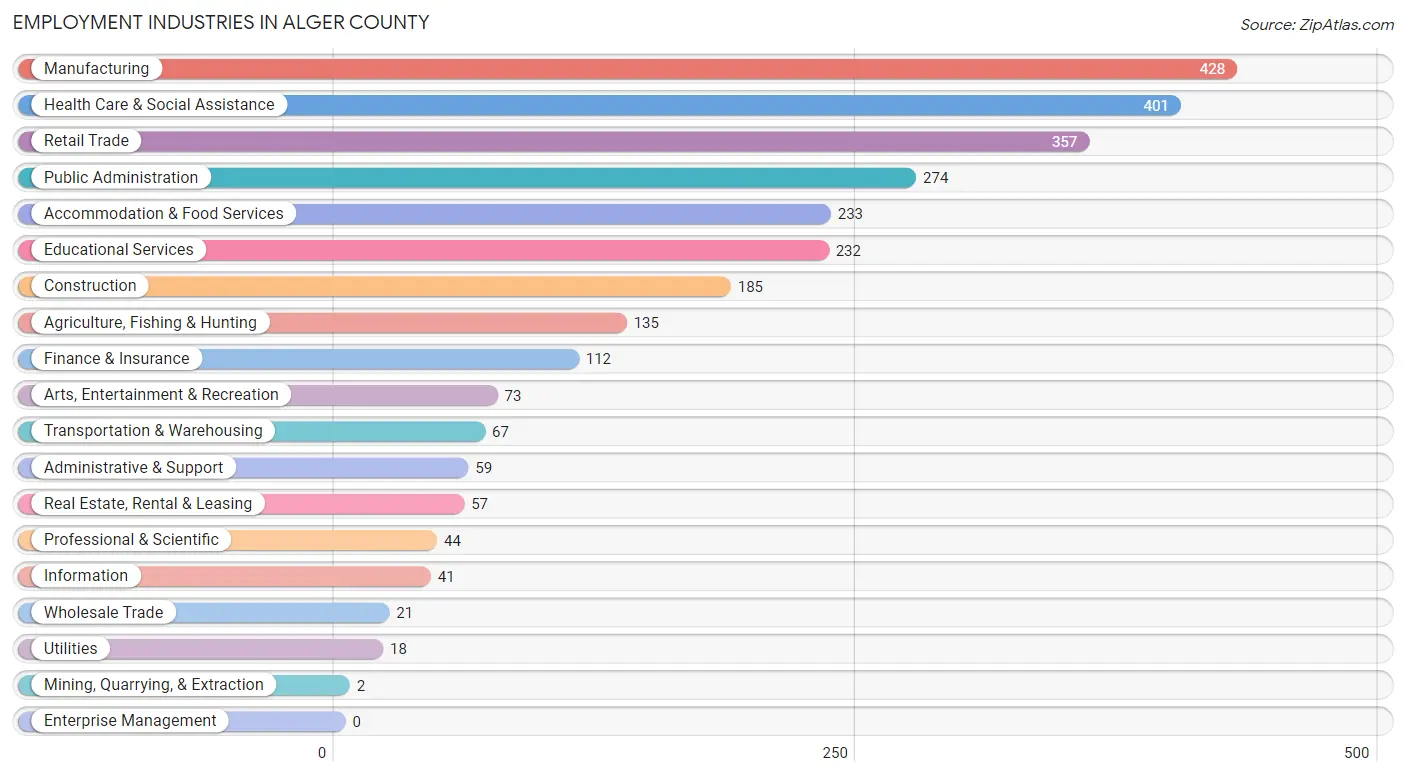
Employment Industries in Alger County
The major employment industries in Alger County include Manufacturing (428 | 14.7%), Health Care & Social Assistance (401 | 13.8%), Retail Trade (357 | 12.2%), Public Administration (274 | 9.4%), and Accommodation & Food Services (233 | 8.0%).
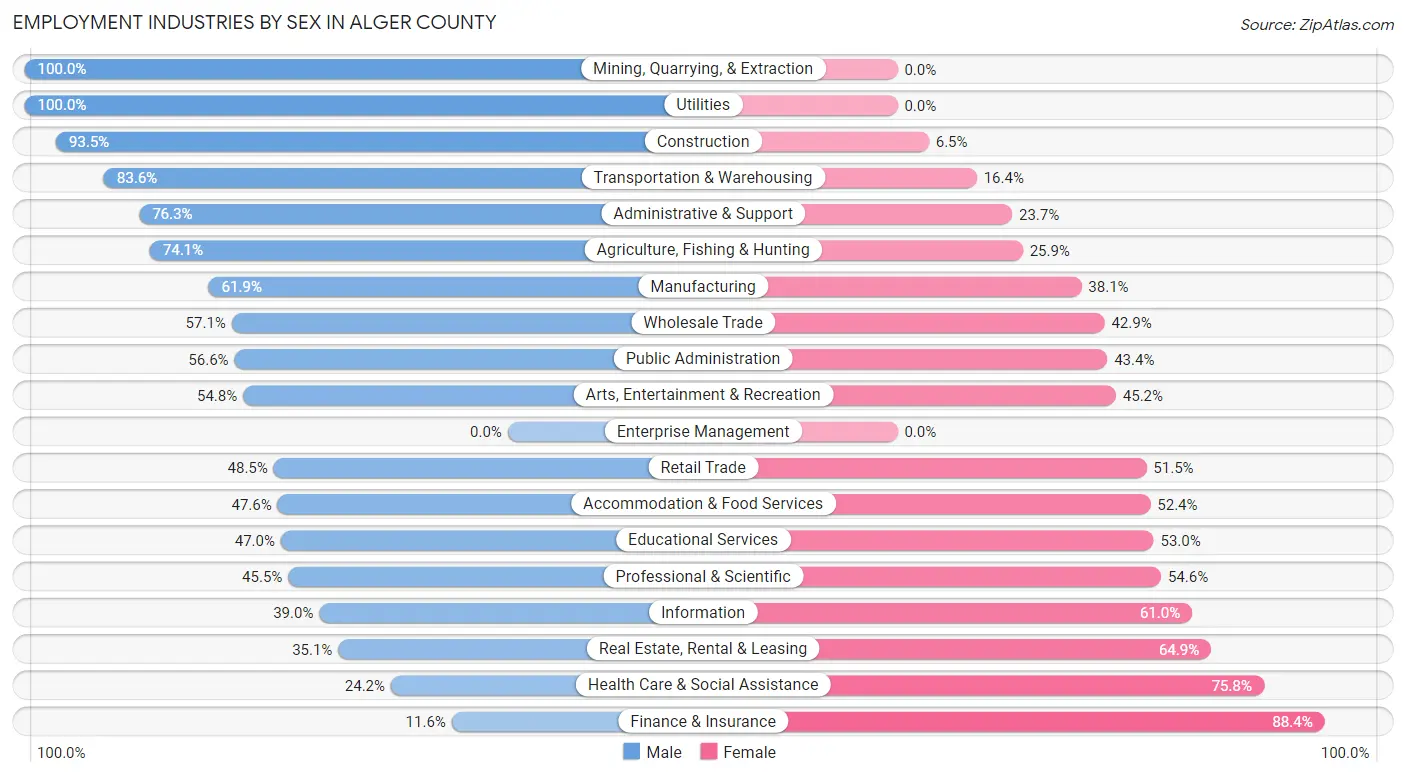
Employment Industries by Sex in Alger County
The Alger County industries that see more men than women are Mining, Quarrying, & Extraction (100.0%), Utilities (100.0%), and Construction (93.5%), whereas the industries that tend to have a higher number of women are Finance & Insurance (88.4%), Health Care & Social Assistance (75.8%), and Real Estate, Rental & Leasing (64.9%).
| Industry | Male | Female |
| Agriculture, Fishing & Hunting | 100 (74.1%) | 35 (25.9%) |
| Mining, Quarrying, & Extraction | 2 (100.0%) | 0 (0.0%) |
| Construction | 173 (93.5%) | 12 (6.5%) |
| Manufacturing | 265 (61.9%) | 163 (38.1%) |
| Wholesale Trade | 12 (57.1%) | 9 (42.9%) |
| Retail Trade | 173 (48.5%) | 184 (51.5%) |
| Transportation & Warehousing | 56 (83.6%) | 11 (16.4%) |
| Utilities | 18 (100.0%) | 0 (0.0%) |
| Information | 16 (39.0%) | 25 (61.0%) |
| Finance & Insurance | 13 (11.6%) | 99 (88.4%) |
| Real Estate, Rental & Leasing | 20 (35.1%) | 37 (64.9%) |
| Professional & Scientific | 20 (45.5%) | 24 (54.5%) |
| Enterprise Management | 0 (0.0%) | 0 (0.0%) |
| Administrative & Support | 45 (76.3%) | 14 (23.7%) |
| Educational Services | 109 (47.0%) | 123 (53.0%) |
| Health Care & Social Assistance | 97 (24.2%) | 304 (75.8%) |
| Arts, Entertainment & Recreation | 40 (54.8%) | 33 (45.2%) |
| Accommodation & Food Services | 111 (47.6%) | 122 (52.4%) |
| Public Administration | 155 (56.6%) | 119 (43.4%) |
| Total | 1,554 (53.3%) | 1,361 (46.7%) |
Education in Alger County
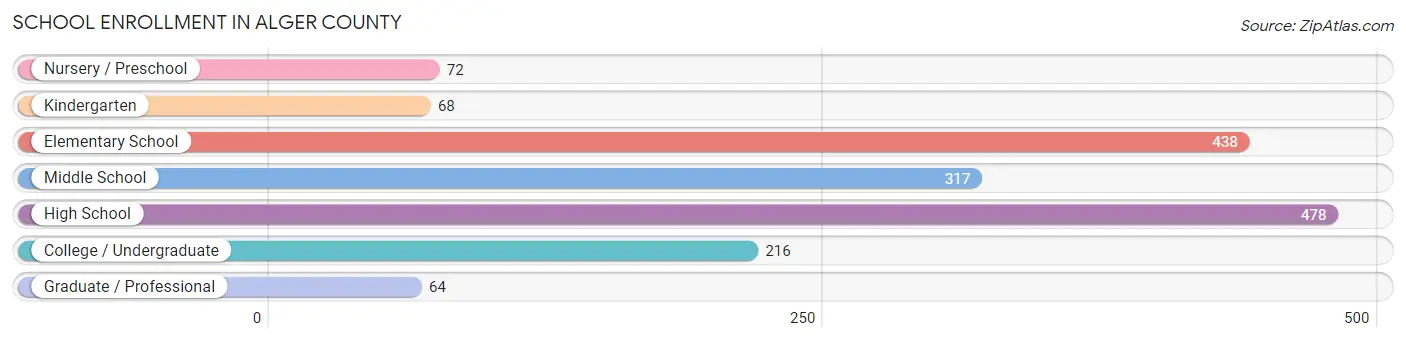
School Enrollment in Alger County
The most common levels of schooling among the 1,653 students in Alger County are high school (478 | 28.9%), elementary school (438 | 26.5%), and middle school (317 | 19.2%).
| School Level | # Students | % Students |
| Nursery / Preschool | 72 | 4.4% |
| Kindergarten | 68 | 4.1% |
| Elementary School | 438 | 26.5% |
| Middle School | 317 | 19.2% |
| High School | 478 | 28.9% |
| College / Undergraduate | 216 | 13.1% |
| Graduate / Professional | 64 | 3.9% |
| Total | 1,653 | 100.0% |
School Enrollment by Age by Funding Source in Alger County
Out of a total of 1,653 students who are enrolled in schools in Alger County, 136 (8.2%) attend a private institution, while the remaining 1,517 (91.8%) are enrolled in public schools. The age group of 3 to 4 year olds has the highest likelihood of being enrolled in private schools, with 17 (50.0% in the age bracket) enrolled. Conversely, the age group of 20 to 24 year olds has the lowest likelihood of being enrolled in a private school, with 107 (100.0% in the age bracket) attending a public institution.
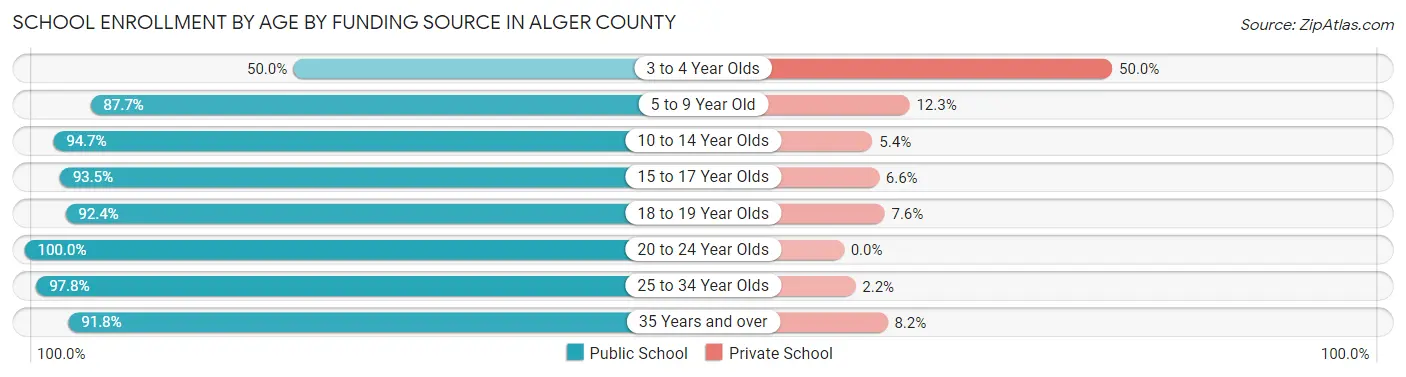
| Age Bracket | Public School | Private School |
| 3 to 4 Year Olds | 17 (50.0%) | 17 (50.0%) |
| 5 to 9 Year Old | 372 (87.7%) | 52 (12.3%) |
| 10 to 14 Year Olds | 442 (94.7%) | 25 (5.3%) |
| 15 to 17 Year Olds | 314 (93.4%) | 22 (6.6%) |
| 18 to 19 Year Olds | 85 (92.4%) | 7 (7.6%) |
| 20 to 24 Year Olds | 107 (100.0%) | 0 (0.0%) |
| 25 to 34 Year Olds | 45 (97.8%) | 1 (2.2%) |
| 35 Years and over | 135 (91.8%) | 12 (8.2%) |
| Total | 1,517 (91.8%) | 136 (8.2%) |
Educational Attainment by Field of Study in Alger County
Business (250 | 16.6%), science & technology (211 | 14.0%), education (203 | 13.5%), bio, nature & agricultural (171 | 11.4%), and arts & humanities (119 | 7.9%) are the most common fields of study among 1,505 individuals in Alger County who have obtained a bachelor's degree or higher.
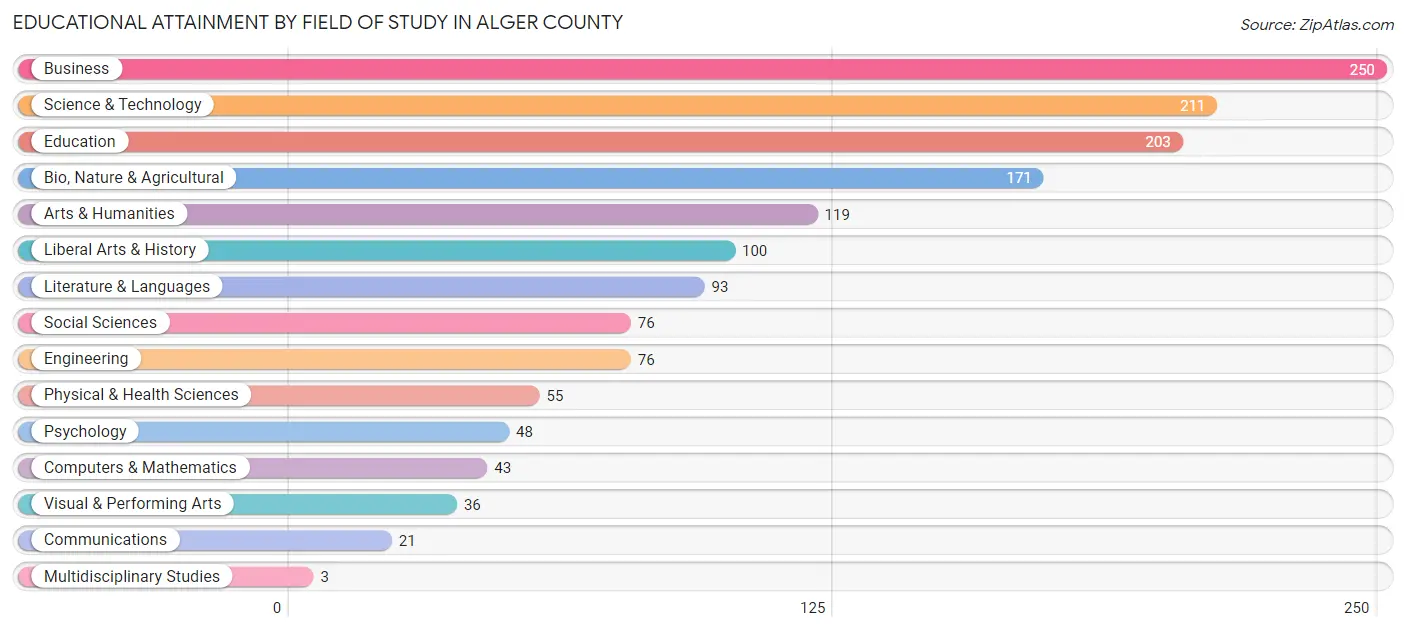
| Field of Study | # Graduates | % Graduates |
| Computers & Mathematics | 43 | 2.9% |
| Bio, Nature & Agricultural | 171 | 11.4% |
| Physical & Health Sciences | 55 | 3.6% |
| Psychology | 48 | 3.2% |
| Social Sciences | 76 | 5.1% |
| Engineering | 76 | 5.1% |
| Multidisciplinary Studies | 3 | 0.2% |
| Science & Technology | 211 | 14.0% |
| Business | 250 | 16.6% |
| Education | 203 | 13.5% |
| Literature & Languages | 93 | 6.2% |
| Liberal Arts & History | 100 | 6.6% |
| Visual & Performing Arts | 36 | 2.4% |
| Communications | 21 | 1.4% |
| Arts & Humanities | 119 | 7.9% |
| Total | 1,505 | 100.0% |
Transportation & Commute in Alger County
Vehicle Availability by Sex in Alger County
The most prevalent vehicle ownership categories in Alger County are males with 2 vehicles (612, accounting for 40.3%) and females with 2 vehicles (507, making up 45.9%).
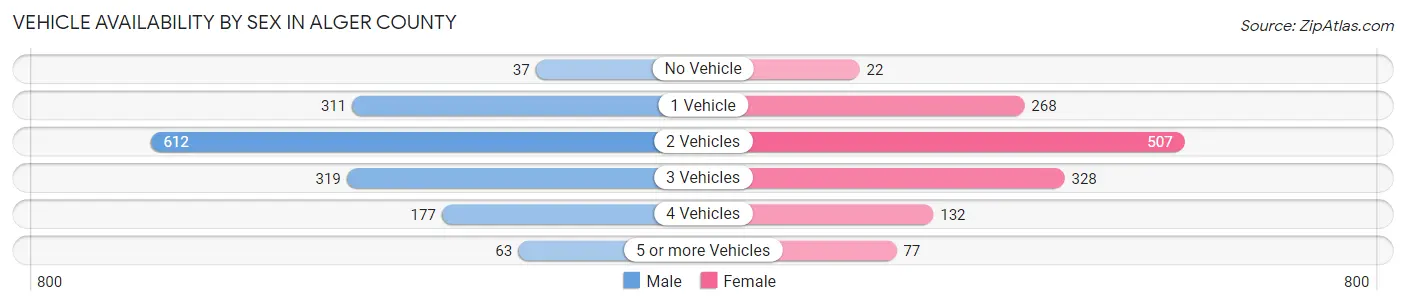
| Vehicles Available | Male | Female |
| No Vehicle | 37 (2.4%) | 22 (1.7%) |
| 1 Vehicle | 311 (20.5%) | 268 (20.1%) |
| 2 Vehicles | 612 (40.3%) | 507 (38.0%) |
| 3 Vehicles | 319 (21.0%) | 328 (24.6%) |
| 4 Vehicles | 177 (11.7%) | 132 (9.9%) |
| 5 or more Vehicles | 63 (4.2%) | 77 (5.8%) |
| Total | 1,519 (100.0%) | 1,334 (100.0%) |
Commute Time in Alger County
The most frequently occuring commute durations in Alger County are 5 to 9 minutes (486 commuters, 18.7%), less than 5 minutes (332 commuters, 12.8%), and 10 to 14 minutes (315 commuters, 12.1%).
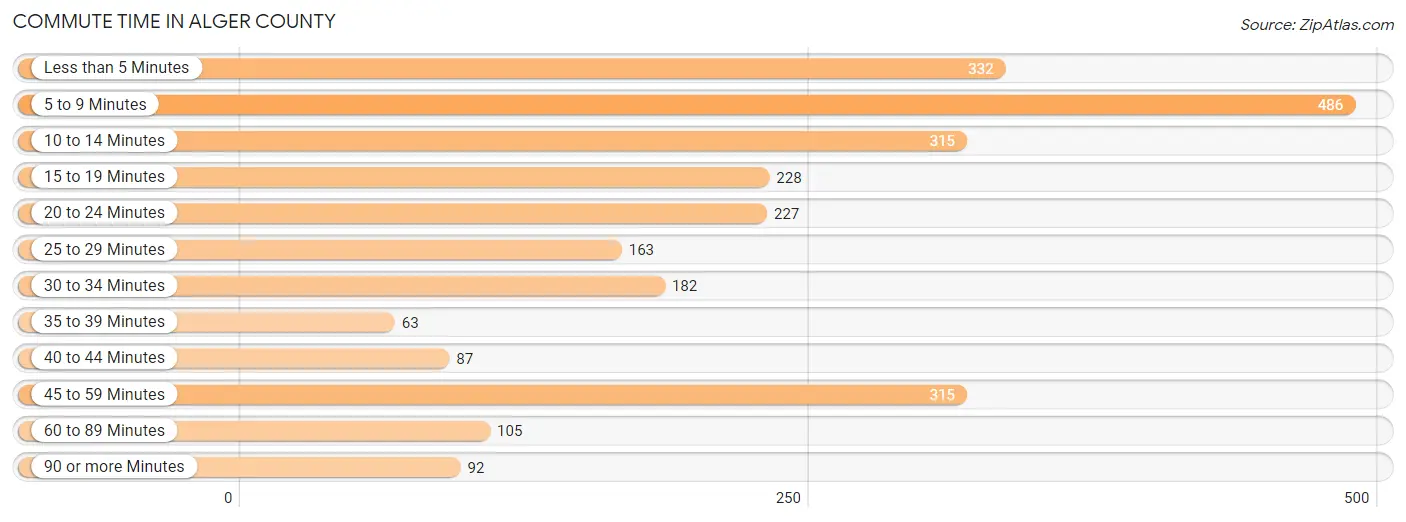
| Commute Time | # Commuters | % Commuters |
| Less than 5 Minutes | 332 | 12.8% |
| 5 to 9 Minutes | 486 | 18.7% |
| 10 to 14 Minutes | 315 | 12.1% |
| 15 to 19 Minutes | 228 | 8.8% |
| 20 to 24 Minutes | 227 | 8.7% |
| 25 to 29 Minutes | 163 | 6.3% |
| 30 to 34 Minutes | 182 | 7.0% |
| 35 to 39 Minutes | 63 | 2.4% |
| 40 to 44 Minutes | 87 | 3.4% |
| 45 to 59 Minutes | 315 | 12.1% |
| 60 to 89 Minutes | 105 | 4.1% |
| 90 or more Minutes | 92 | 3.5% |
Commute Time by Sex in Alger County
The most common commute times in Alger County are 5 to 9 minutes (186 commuters, 13.4%) for males and 5 to 9 minutes (300 commuters, 24.8%) for females.
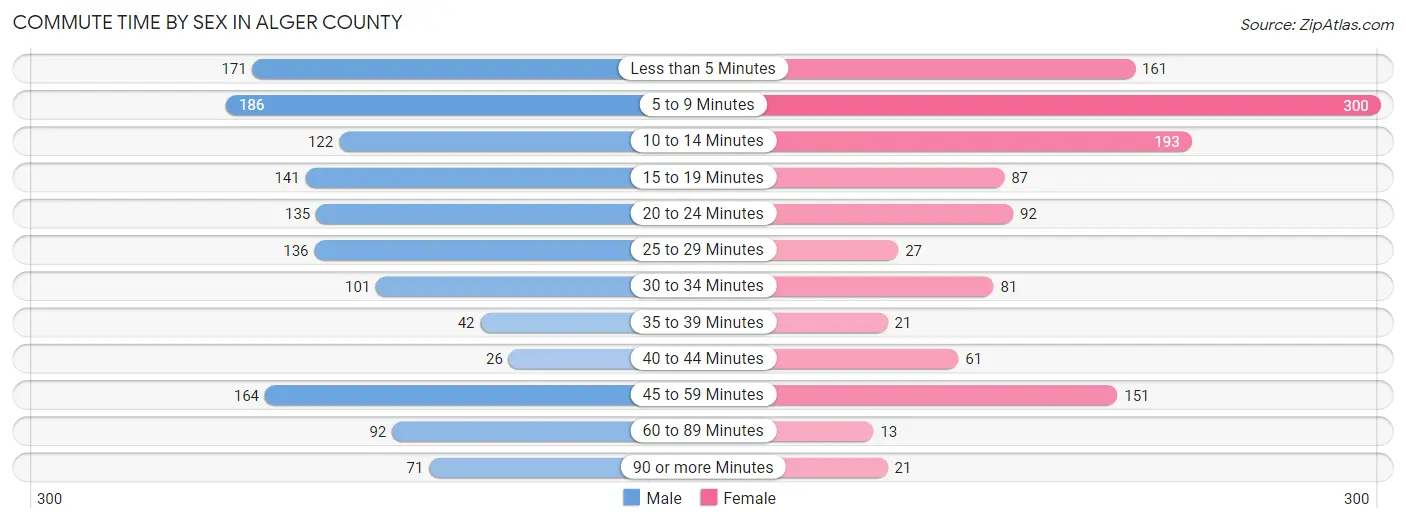
| Commute Time | Male | Female |
| Less than 5 Minutes | 171 (12.3%) | 161 (13.3%) |
| 5 to 9 Minutes | 186 (13.4%) | 300 (24.8%) |
| 10 to 14 Minutes | 122 (8.8%) | 193 (16.0%) |
| 15 to 19 Minutes | 141 (10.2%) | 87 (7.2%) |
| 20 to 24 Minutes | 135 (9.7%) | 92 (7.6%) |
| 25 to 29 Minutes | 136 (9.8%) | 27 (2.2%) |
| 30 to 34 Minutes | 101 (7.3%) | 81 (6.7%) |
| 35 to 39 Minutes | 42 (3.0%) | 21 (1.7%) |
| 40 to 44 Minutes | 26 (1.9%) | 61 (5.1%) |
| 45 to 59 Minutes | 164 (11.8%) | 151 (12.5%) |
| 60 to 89 Minutes | 92 (6.6%) | 13 (1.1%) |
| 90 or more Minutes | 71 (5.1%) | 21 (1.7%) |
Time of Departure to Work by Sex in Alger County
The most frequent times of departure to work in Alger County are 7:00 AM to 7:29 AM (347, 25.0%) for males and 12:00 PM to 3:59 PM (161, 13.3%) for females.
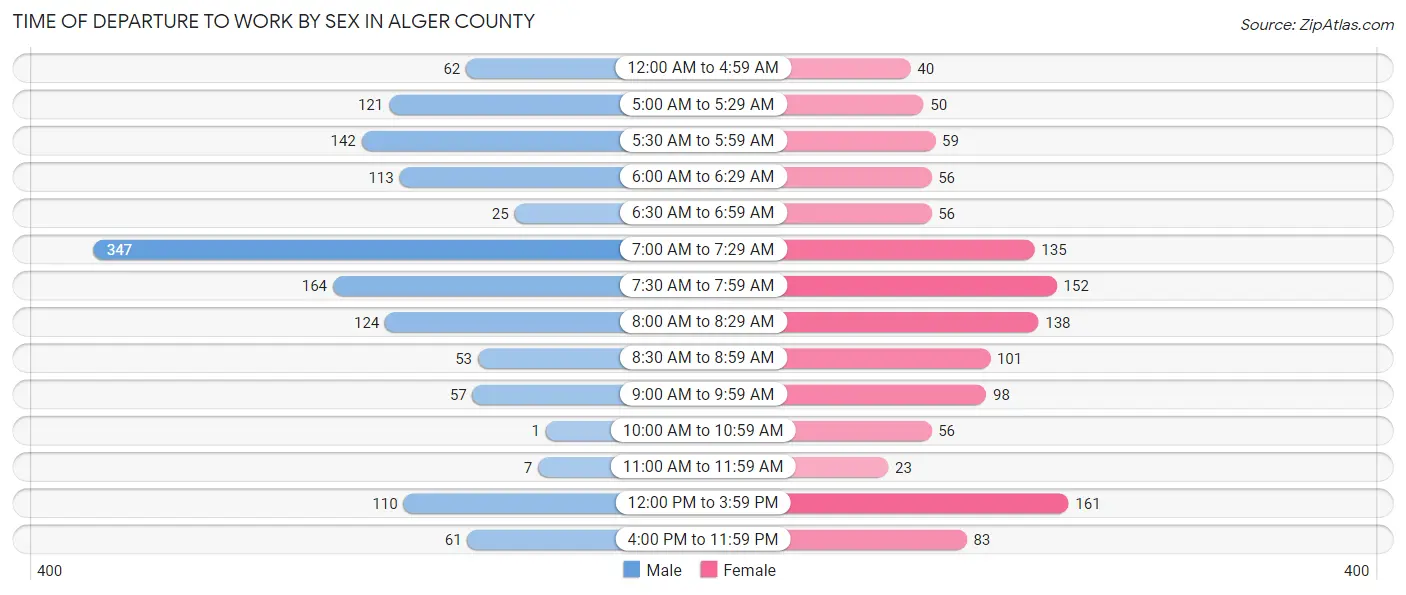
| Time of Departure | Male | Female |
| 12:00 AM to 4:59 AM | 62 (4.5%) | 40 (3.3%) |
| 5:00 AM to 5:29 AM | 121 (8.7%) | 50 (4.1%) |
| 5:30 AM to 5:59 AM | 142 (10.2%) | 59 (4.9%) |
| 6:00 AM to 6:29 AM | 113 (8.2%) | 56 (4.6%) |
| 6:30 AM to 6:59 AM | 25 (1.8%) | 56 (4.6%) |
| 7:00 AM to 7:29 AM | 347 (25.0%) | 135 (11.2%) |
| 7:30 AM to 7:59 AM | 164 (11.8%) | 152 (12.6%) |
| 8:00 AM to 8:29 AM | 124 (8.9%) | 138 (11.4%) |
| 8:30 AM to 8:59 AM | 53 (3.8%) | 101 (8.4%) |
| 9:00 AM to 9:59 AM | 57 (4.1%) | 98 (8.1%) |
| 10:00 AM to 10:59 AM | 1 (0.1%) | 56 (4.6%) |
| 11:00 AM to 11:59 AM | 7 (0.5%) | 23 (1.9%) |
| 12:00 PM to 3:59 PM | 110 (7.9%) | 161 (13.3%) |
| 4:00 PM to 11:59 PM | 61 (4.4%) | 83 (6.9%) |
| Total | 1,387 (100.0%) | 1,208 (100.0%) |
Housing Occupancy in Alger County
Occupancy by Ownership in Alger County
Of the total 3,274 dwellings in Alger County, owner-occupied units account for 2,683 (82.0%), while renter-occupied units make up 591 (18.0%).
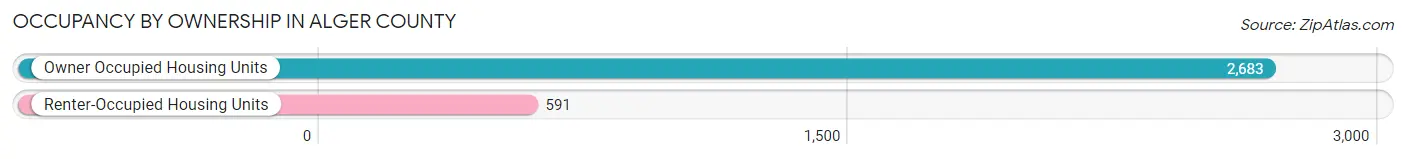
| Occupancy | # Housing Units | % Housing Units |
| Owner Occupied Housing Units | 2,683 | 82.0% |
| Renter-Occupied Housing Units | 591 | 18.0% |
| Total Occupied Housing Units | 3,274 | 100.0% |
Occupancy by Household Size in Alger County
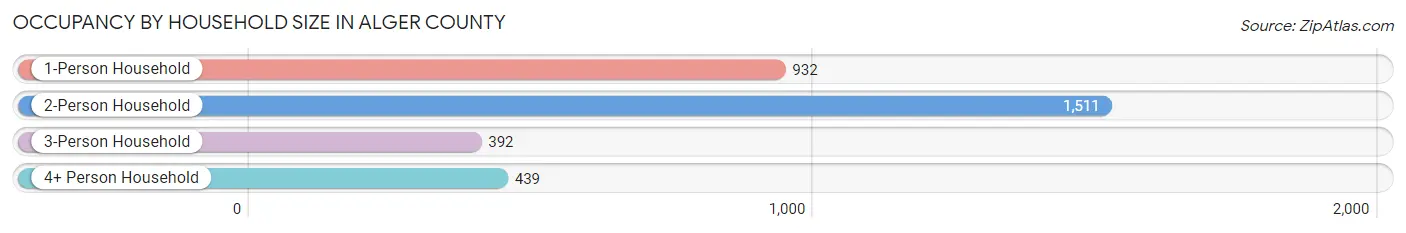
| Household Size | # Housing Units | % Housing Units |
| 1-Person Household | 932 | 28.5% |
| 2-Person Household | 1,511 | 46.2% |
| 3-Person Household | 392 | 12.0% |
| 4+ Person Household | 439 | 13.4% |
| Total Housing Units | 3,274 | 100.0% |
Occupancy by Ownership by Household Size in Alger County
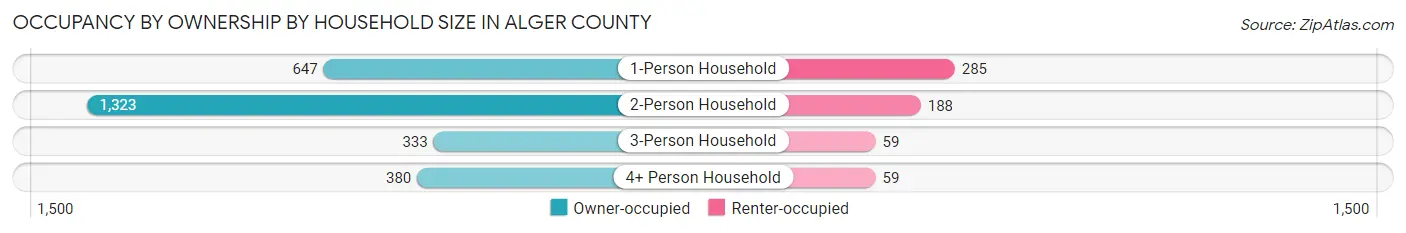
| Household Size | Owner-occupied | Renter-occupied |
| 1-Person Household | 647 (69.4%) | 285 (30.6%) |
| 2-Person Household | 1,323 (87.6%) | 188 (12.4%) |
| 3-Person Household | 333 (85.0%) | 59 (15.0%) |
| 4+ Person Household | 380 (86.6%) | 59 (13.4%) |
| Total Housing Units | 2,683 (82.0%) | 591 (18.0%) |
Occupancy by Educational Attainment in Alger County
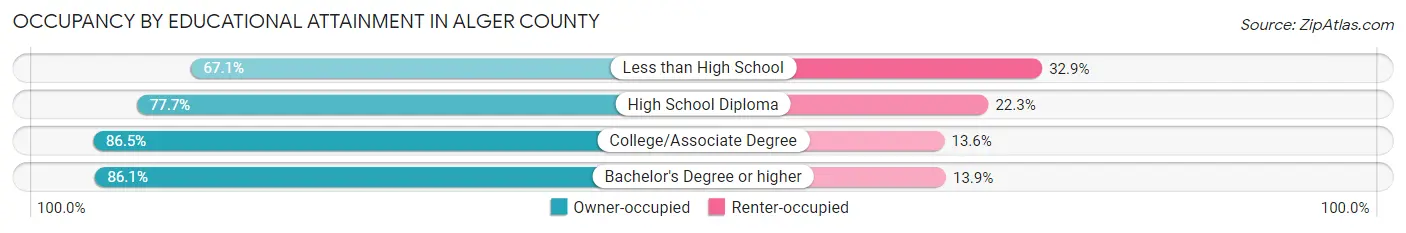
| Household Size | Owner-occupied | Renter-occupied |
| Less than High School | 110 (67.1%) | 54 (32.9%) |
| High School Diploma | 1,009 (77.7%) | 289 (22.3%) |
| College/Associate Degree | 874 (86.5%) | 137 (13.6%) |
| Bachelor's Degree or higher | 690 (86.1%) | 111 (13.9%) |
Occupancy by Age of Householder in Alger County
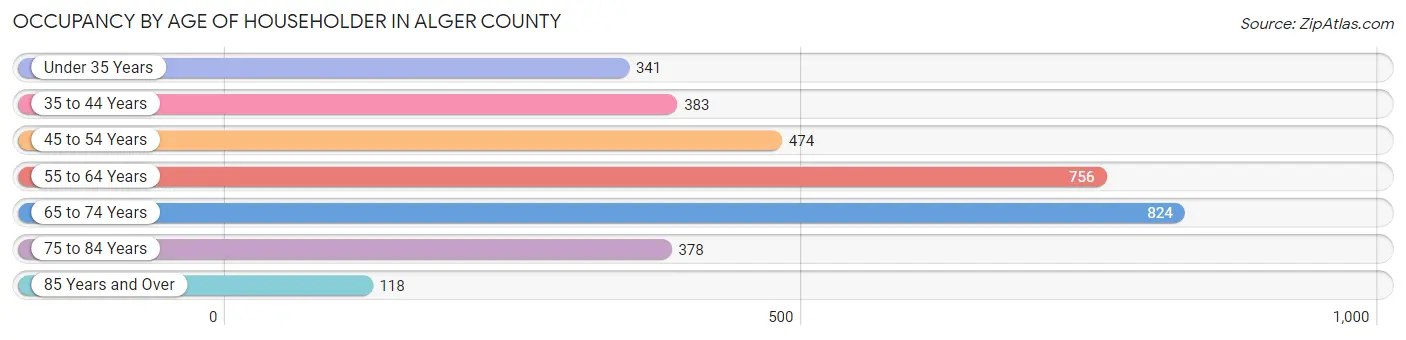
| Age Bracket | # Households | % Households |
| Under 35 Years | 341 | 10.4% |
| 35 to 44 Years | 383 | 11.7% |
| 45 to 54 Years | 474 | 14.5% |
| 55 to 64 Years | 756 | 23.1% |
| 65 to 74 Years | 824 | 25.2% |
| 75 to 84 Years | 378 | 11.6% |
| 85 Years and Over | 118 | 3.6% |
| Total | 3,274 | 100.0% |
Housing Finances in Alger County
Median Income by Occupancy in Alger County
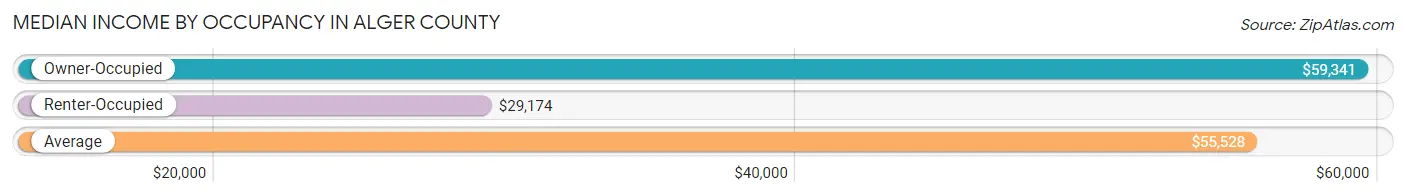
| Occupancy Type | # Households | Median Income |
| Owner-Occupied | 2,683 (82.0%) | $59,341 |
| Renter-Occupied | 591 (18.0%) | $29,174 |
| Average | 3,274 (100.0%) | $55,528 |
Occupancy by Householder Income Bracket in Alger County
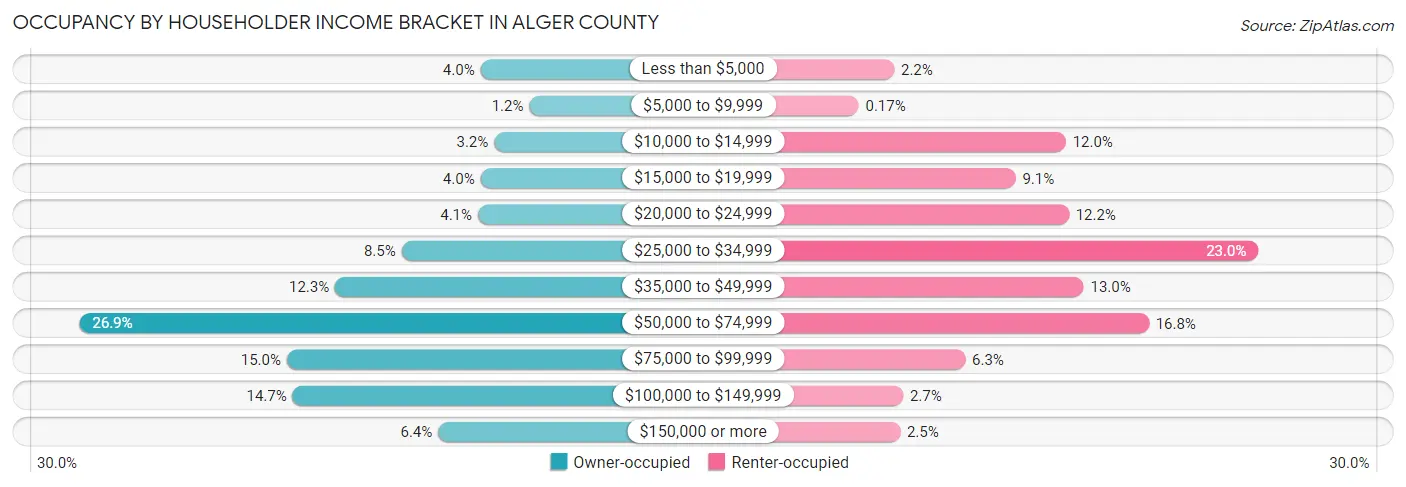
| Income Bracket | Owner-occupied | Renter-occupied |
| Less than $5,000 | 106 (4.0%) | 13 (2.2%) |
| $5,000 to $9,999 | 31 (1.2%) | 1 (0.2%) |
| $10,000 to $14,999 | 85 (3.2%) | 71 (12.0%) |
| $15,000 to $19,999 | 106 (4.0%) | 54 (9.1%) |
| $20,000 to $24,999 | 110 (4.1%) | 72 (12.2%) |
| $25,000 to $34,999 | 227 (8.5%) | 136 (23.0%) |
| $35,000 to $49,999 | 329 (12.3%) | 77 (13.0%) |
| $50,000 to $74,999 | 721 (26.9%) | 99 (16.8%) |
| $75,000 to $99,999 | 403 (15.0%) | 37 (6.3%) |
| $100,000 to $149,999 | 394 (14.7%) | 16 (2.7%) |
| $150,000 or more | 171 (6.4%) | 15 (2.5%) |
| Total | 2,683 (100.0%) | 591 (100.0%) |
Monthly Housing Cost Tiers in Alger County
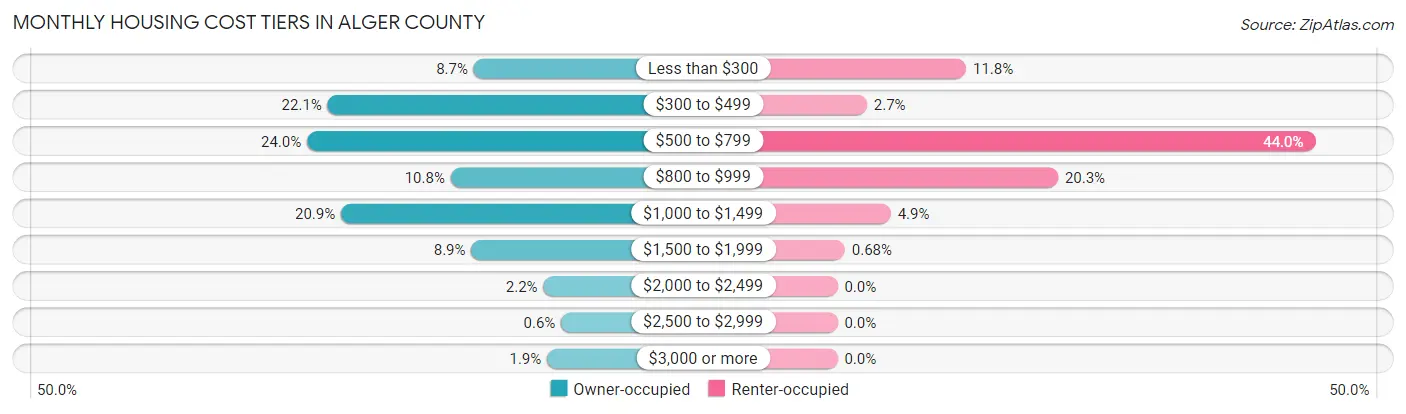
| Monthly Cost | Owner-occupied | Renter-occupied |
| Less than $300 | 232 (8.6%) | 70 (11.8%) |
| $300 to $499 | 593 (22.1%) | 16 (2.7%) |
| $500 to $799 | 644 (24.0%) | 260 (44.0%) |
| $800 to $999 | 289 (10.8%) | 120 (20.3%) |
| $1,000 to $1,499 | 560 (20.9%) | 29 (4.9%) |
| $1,500 to $1,999 | 238 (8.9%) | 4 (0.7%) |
| $2,000 to $2,499 | 60 (2.2%) | 0 (0.0%) |
| $2,500 to $2,999 | 16 (0.6%) | 0 (0.0%) |
| $3,000 or more | 51 (1.9%) | 0 (0.0%) |
| Total | 2,683 (100.0%) | 591 (100.0%) |
Physical Housing Characteristics in Alger County
Housing Structures in Alger County
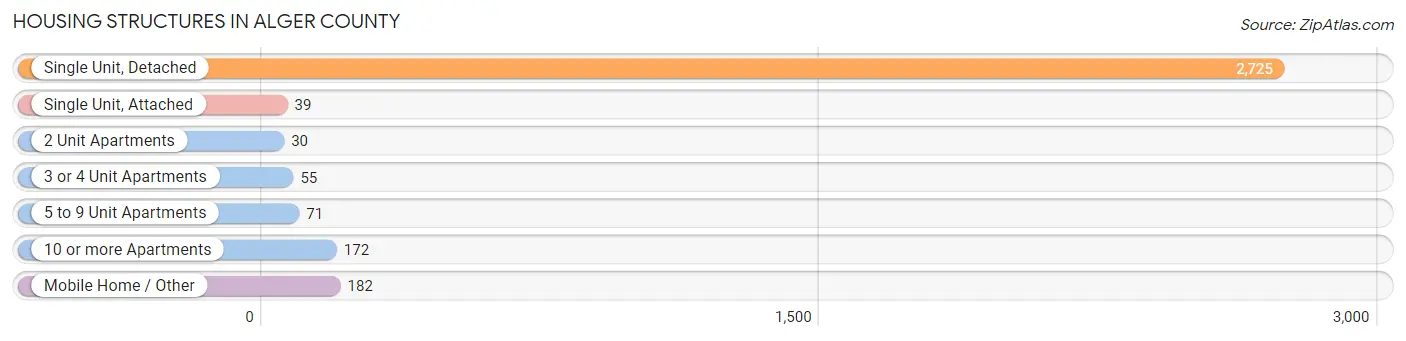
| Structure Type | # Housing Units | % Housing Units |
| Single Unit, Detached | 2,725 | 83.2% |
| Single Unit, Attached | 39 | 1.2% |
| 2 Unit Apartments | 30 | 0.9% |
| 3 or 4 Unit Apartments | 55 | 1.7% |
| 5 to 9 Unit Apartments | 71 | 2.2% |
| 10 or more Apartments | 172 | 5.2% |
| Mobile Home / Other | 182 | 5.6% |
| Total | 3,274 | 100.0% |
Housing Structures by Occupancy in Alger County
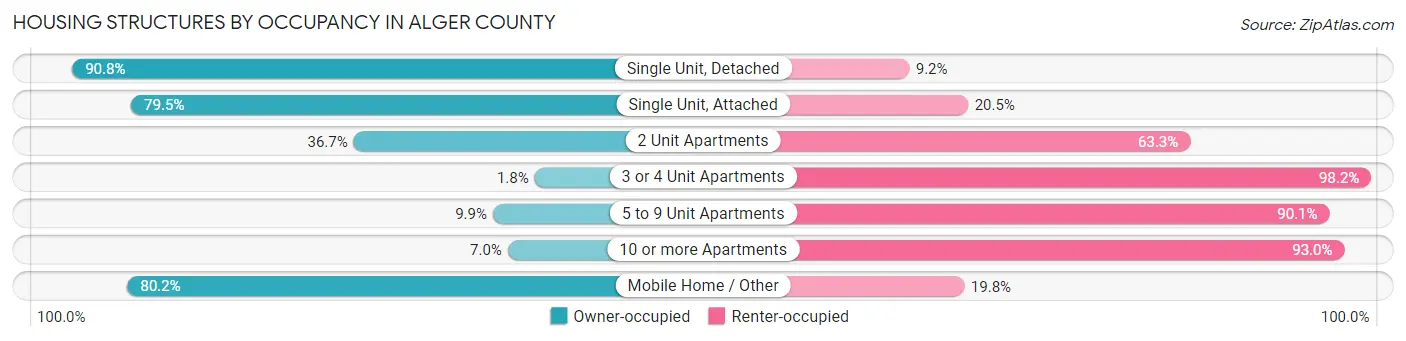
| Structure Type | Owner-occupied | Renter-occupied |
| Single Unit, Detached | 2,475 (90.8%) | 250 (9.2%) |
| Single Unit, Attached | 31 (79.5%) | 8 (20.5%) |
| 2 Unit Apartments | 11 (36.7%) | 19 (63.3%) |
| 3 or 4 Unit Apartments | 1 (1.8%) | 54 (98.2%) |
| 5 to 9 Unit Apartments | 7 (9.9%) | 64 (90.1%) |
| 10 or more Apartments | 12 (7.0%) | 160 (93.0%) |
| Mobile Home / Other | 146 (80.2%) | 36 (19.8%) |
| Total | 2,683 (82.0%) | 591 (18.0%) |
Housing Structures by Number of Rooms in Alger County
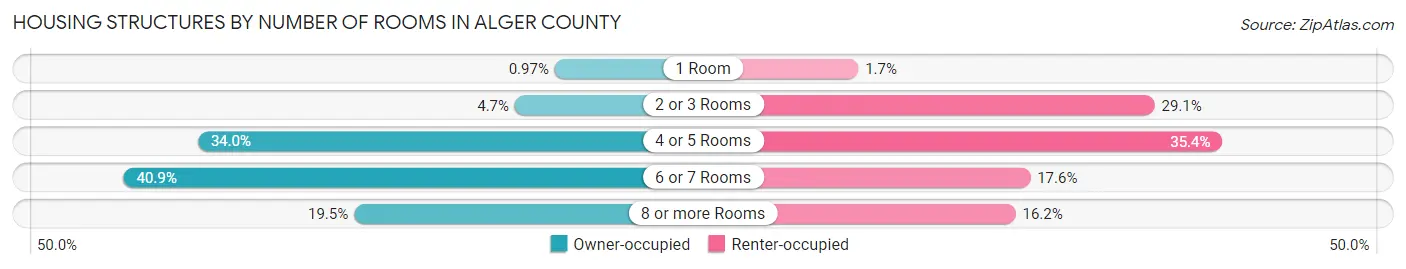
| Number of Rooms | Owner-occupied | Renter-occupied |
| 1 Room | 26 (1.0%) | 10 (1.7%) |
| 2 or 3 Rooms | 125 (4.7%) | 172 (29.1%) |
| 4 or 5 Rooms | 912 (34.0%) | 209 (35.4%) |
| 6 or 7 Rooms | 1,096 (40.8%) | 104 (17.6%) |
| 8 or more Rooms | 524 (19.5%) | 96 (16.2%) |
| Total | 2,683 (100.0%) | 591 (100.0%) |
Housing Structure by Heating Type in Alger County
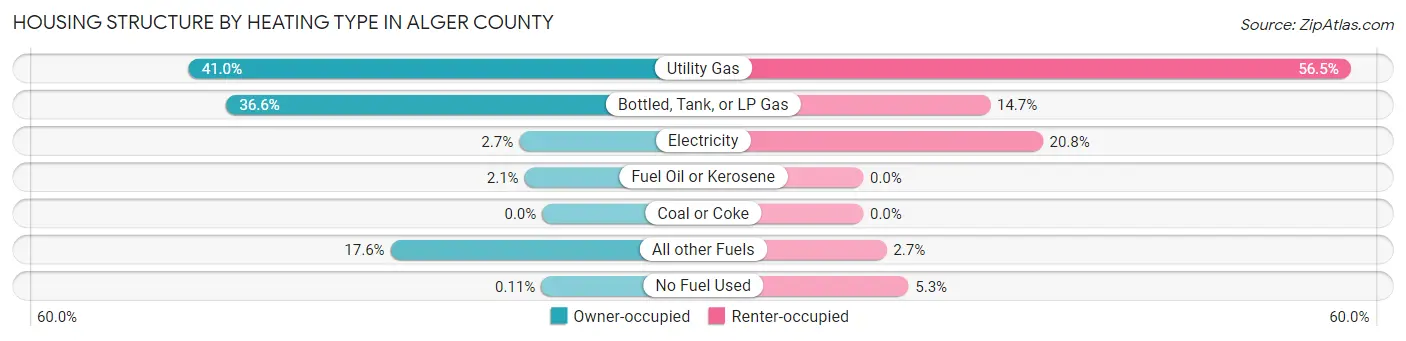
| Heating Type | Owner-occupied | Renter-occupied |
| Utility Gas | 1,099 (41.0%) | 334 (56.5%) |
| Bottled, Tank, or LP Gas | 982 (36.6%) | 87 (14.7%) |
| Electricity | 72 (2.7%) | 123 (20.8%) |
| Fuel Oil or Kerosene | 55 (2.1%) | 0 (0.0%) |
| Coal or Coke | 0 (0.0%) | 0 (0.0%) |
| All other Fuels | 472 (17.6%) | 16 (2.7%) |
| No Fuel Used | 3 (0.1%) | 31 (5.2%) |
| Total | 2,683 (100.0%) | 591 (100.0%) |
Household Vehicle Usage in Alger County
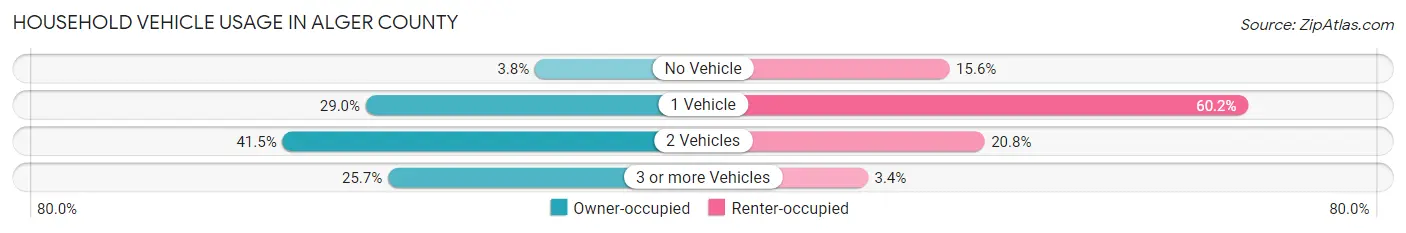
| Vehicles per Household | Owner-occupied | Renter-occupied |
| No Vehicle | 101 (3.8%) | 92 (15.6%) |
| 1 Vehicle | 779 (29.0%) | 356 (60.2%) |
| 2 Vehicles | 1,113 (41.5%) | 123 (20.8%) |
| 3 or more Vehicles | 690 (25.7%) | 20 (3.4%) |
| Total | 2,683 (100.0%) | 591 (100.0%) |
Real Estate & Mortgages in Alger County
Real Estate and Mortgage Overview in Alger County
| Characteristic | Without Mortgage | With Mortgage |
| Housing Units | 1,422 | 1,261 |
| Median Property Value | $146,400 | $168,300 |
| Median Household Income | $52,872 | $128 |
| Monthly Housing Costs | $464 | $51 |
| Real Estate Taxes | $1,485 | $40 |
Property Value by Mortgage Status in Alger County
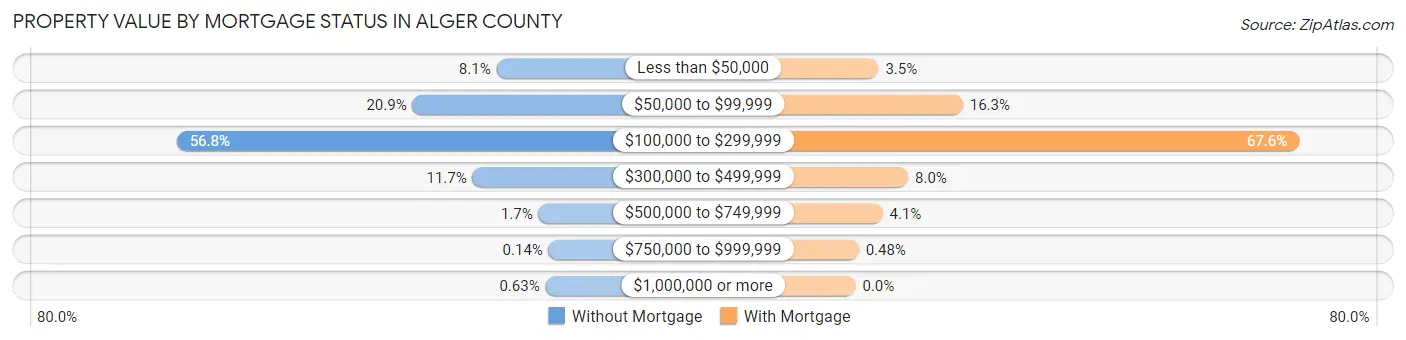
| Property Value | Without Mortgage | With Mortgage |
| Less than $50,000 | 115 (8.1%) | 44 (3.5%) |
| $50,000 to $99,999 | 297 (20.9%) | 206 (16.3%) |
| $100,000 to $299,999 | 808 (56.8%) | 852 (67.6%) |
| $300,000 to $499,999 | 167 (11.7%) | 101 (8.0%) |
| $500,000 to $749,999 | 24 (1.7%) | 52 (4.1%) |
| $750,000 to $999,999 | 2 (0.1%) | 6 (0.5%) |
| $1,000,000 or more | 9 (0.6%) | 0 (0.0%) |
| Total | 1,422 (100.0%) | 1,261 (100.0%) |
Household Income by Mortgage Status in Alger County
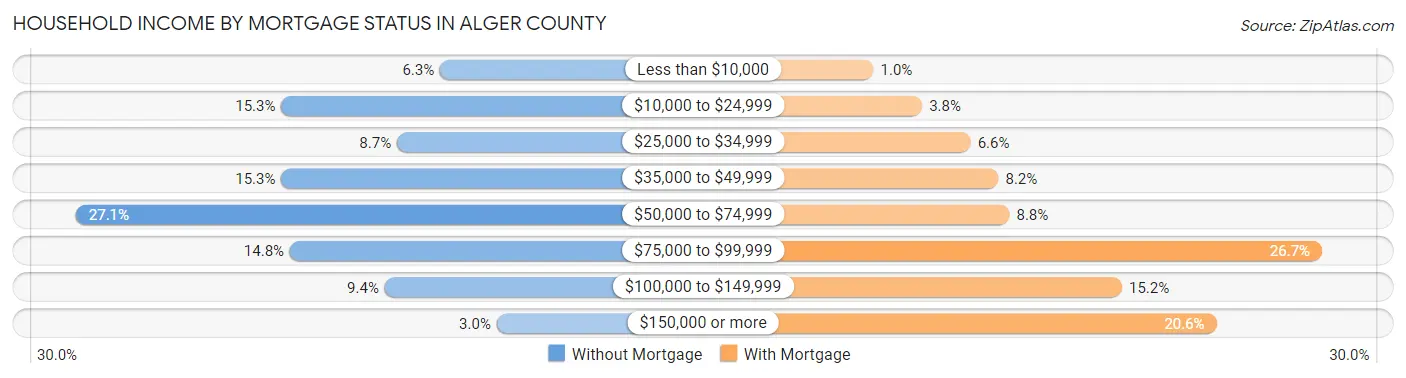
| Household Income | Without Mortgage | With Mortgage |
| Less than $10,000 | 89 (6.3%) | 13 (1.0%) |
| $10,000 to $24,999 | 218 (15.3%) | 48 (3.8%) |
| $25,000 to $34,999 | 124 (8.7%) | 83 (6.6%) |
| $35,000 to $49,999 | 218 (15.3%) | 103 (8.2%) |
| $50,000 to $74,999 | 385 (27.1%) | 111 (8.8%) |
| $75,000 to $99,999 | 211 (14.8%) | 336 (26.7%) |
| $100,000 to $149,999 | 134 (9.4%) | 192 (15.2%) |
| $150,000 or more | 43 (3.0%) | 260 (20.6%) |
| Total | 1,422 (100.0%) | 1,261 (100.0%) |
Property Value to Household Income Ratio in Alger County
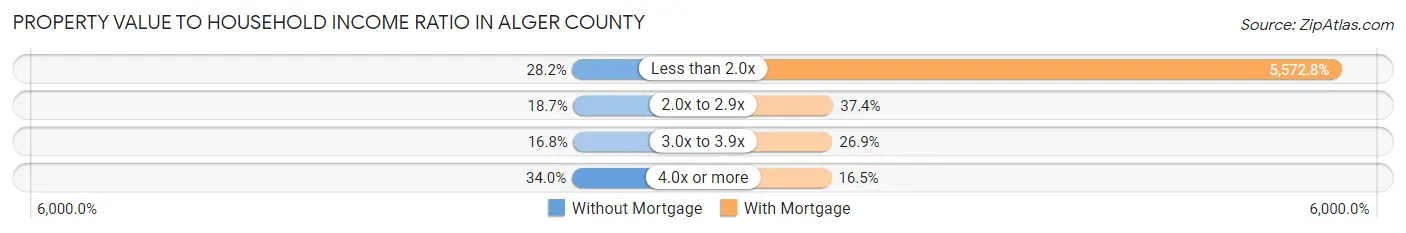
| Value-to-Income Ratio | Without Mortgage | With Mortgage |
| Less than 2.0x | 401 (28.2%) | 70,273 (5,572.8%) |
| 2.0x to 2.9x | 266 (18.7%) | 472 (37.4%) |
| 3.0x to 3.9x | 239 (16.8%) | 339 (26.9%) |
| 4.0x or more | 483 (34.0%) | 208 (16.5%) |
| Total | 1,422 (100.0%) | 1,261 (100.0%) |
Real Estate Taxes by Mortgage Status in Alger County
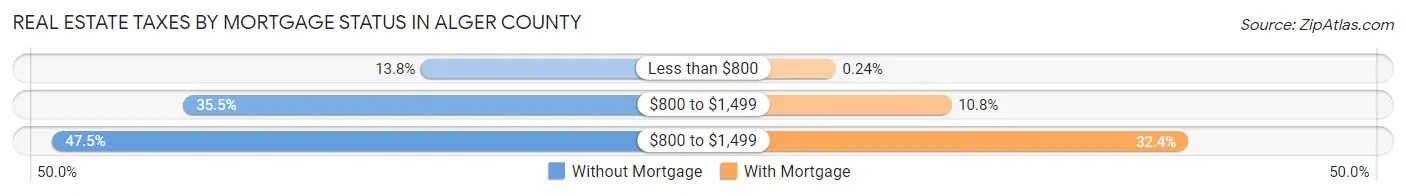
| Property Taxes | Without Mortgage | With Mortgage |
| Less than $800 | 196 (13.8%) | 3 (0.2%) |
| $800 to $1,499 | 505 (35.5%) | 136 (10.8%) |
| $800 to $1,499 | 675 (47.5%) | 409 (32.4%) |
| Total | 1,422 (100.0%) | 1,261 (100.0%) |
Health & Disability in Alger County
Health Insurance Coverage by Age in Alger County
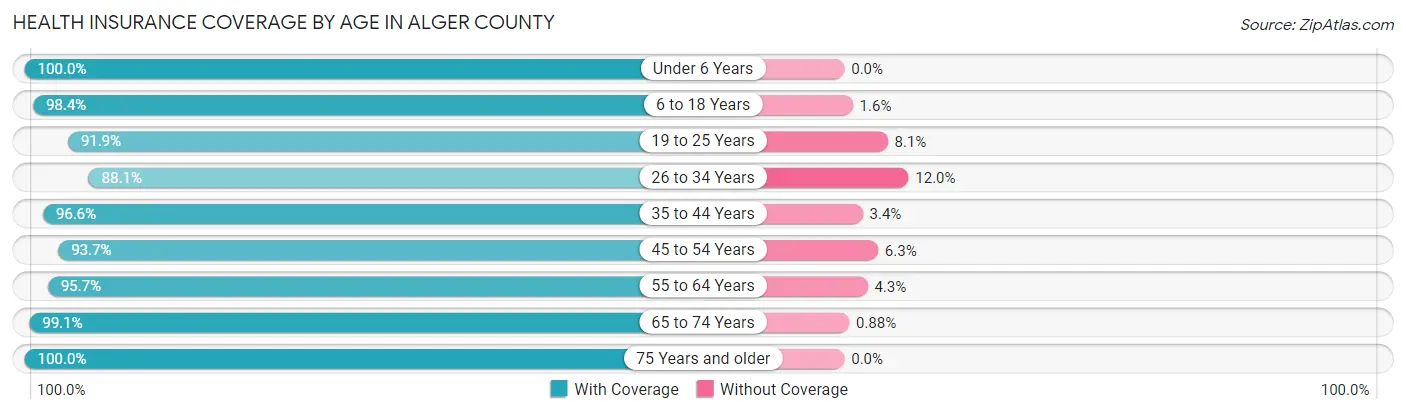
| Age Bracket | With Coverage | Without Coverage |
| Under 6 Years | 387 (100.0%) | 0 (0.0%) |
| 6 to 18 Years | 1,264 (98.4%) | 20 (1.6%) |
| 19 to 25 Years | 410 (91.9%) | 36 (8.1%) |
| 26 to 34 Years | 516 (88.0%) | 70 (11.9%) |
| 35 to 44 Years | 709 (96.6%) | 25 (3.4%) |
| 45 to 54 Years | 822 (93.7%) | 55 (6.3%) |
| 55 to 64 Years | 1,329 (95.7%) | 60 (4.3%) |
| 65 to 74 Years | 1,347 (99.1%) | 12 (0.9%) |
| 75 Years and older | 777 (100.0%) | 0 (0.0%) |
| Total | 7,561 (96.5%) | 278 (3.5%) |
Health Insurance Coverage by Citizenship Status in Alger County

| Citizenship Status | With Coverage | Without Coverage |
| Native Born | 387 (100.0%) | 0 (0.0%) |
| Foreign Born, Citizen | 1,264 (98.4%) | 20 (1.6%) |
| Foreign Born, not a Citizen | 410 (91.9%) | 36 (8.1%) |
Health Insurance Coverage by Household Income in Alger County
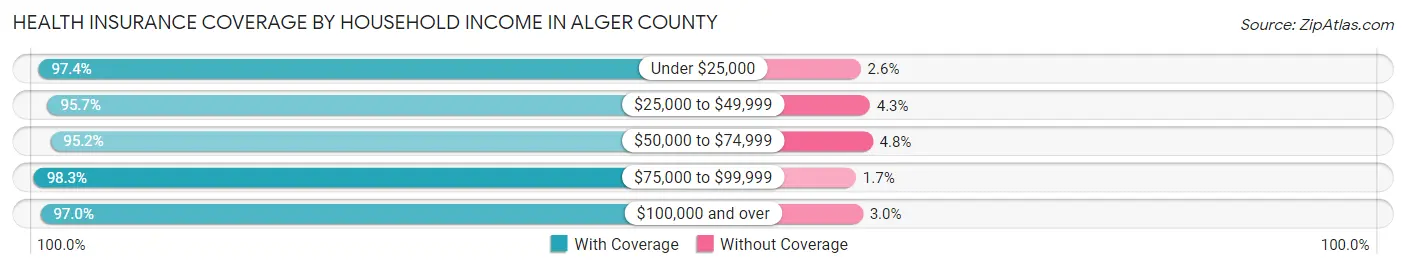
| Household Income | With Coverage | Without Coverage |
| Under $25,000 | 862 (97.4%) | 23 (2.6%) |
| $25,000 to $49,999 | 1,509 (95.7%) | 68 (4.3%) |
| $50,000 to $74,999 | 2,047 (95.2%) | 104 (4.8%) |
| $75,000 to $99,999 | 1,035 (98.3%) | 18 (1.7%) |
| $100,000 and over | 2,086 (97.0%) | 64 (3.0%) |
Public vs Private Health Insurance Coverage by Age in Alger County
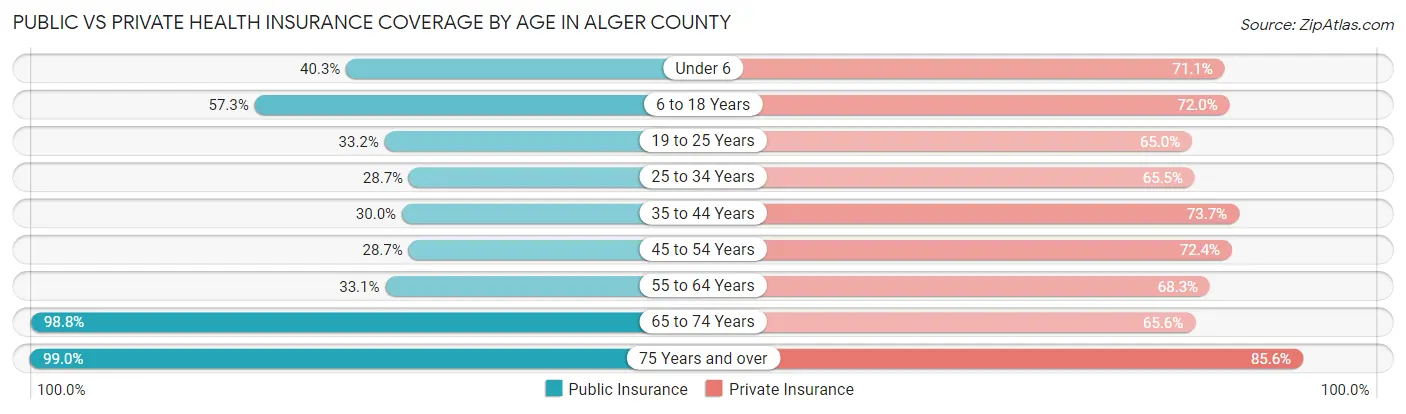
| Age Bracket | Public Insurance | Private Insurance |
| Under 6 | 156 (40.3%) | 275 (71.1%) |
| 6 to 18 Years | 736 (57.3%) | 924 (72.0%) |
| 19 to 25 Years | 148 (33.2%) | 290 (65.0%) |
| 25 to 34 Years | 168 (28.7%) | 384 (65.5%) |
| 35 to 44 Years | 220 (30.0%) | 541 (73.7%) |
| 45 to 54 Years | 252 (28.7%) | 635 (72.4%) |
| 55 to 64 Years | 459 (33.1%) | 949 (68.3%) |
| 65 to 74 Years | 1,343 (98.8%) | 891 (65.6%) |
| 75 Years and over | 769 (99.0%) | 665 (85.6%) |
| Total | 4,251 (54.2%) | 5,554 (70.9%) |
Disability Status by Sex by Age in Alger County
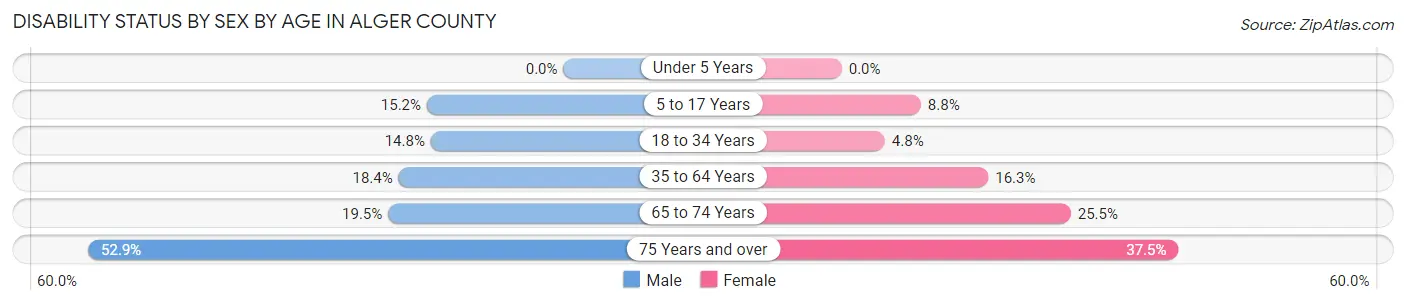
| Age Bracket | Male | Female |
| Under 5 Years | 0 (0.0%) | 0 (0.0%) |
| 5 to 17 Years | 95 (15.2%) | 58 (8.8%) |
| 18 to 34 Years | 83 (14.8%) | 26 (4.8%) |
| 35 to 64 Years | 283 (18.3%) | 238 (16.3%) |
| 65 to 74 Years | 139 (19.5%) | 165 (25.5%) |
| 75 Years and over | 198 (52.9%) | 151 (37.5%) |
Disability Class by Sex by Age in Alger County
Disability Class: Hearing Difficulty
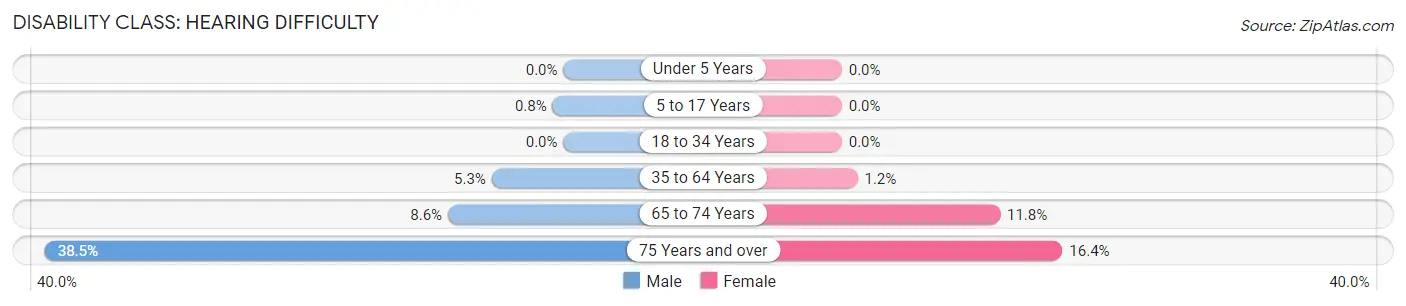
| Age Bracket | Male | Female |
| Under 5 Years | 0 (0.0%) | 0 (0.0%) |
| 5 to 17 Years | 5 (0.8%) | 0 (0.0%) |
| 18 to 34 Years | 0 (0.0%) | 0 (0.0%) |
| 35 to 64 Years | 82 (5.3%) | 17 (1.2%) |
| 65 to 74 Years | 61 (8.6%) | 76 (11.7%) |
| 75 Years and over | 144 (38.5%) | 66 (16.4%) |
Disability Class: Vision Difficulty
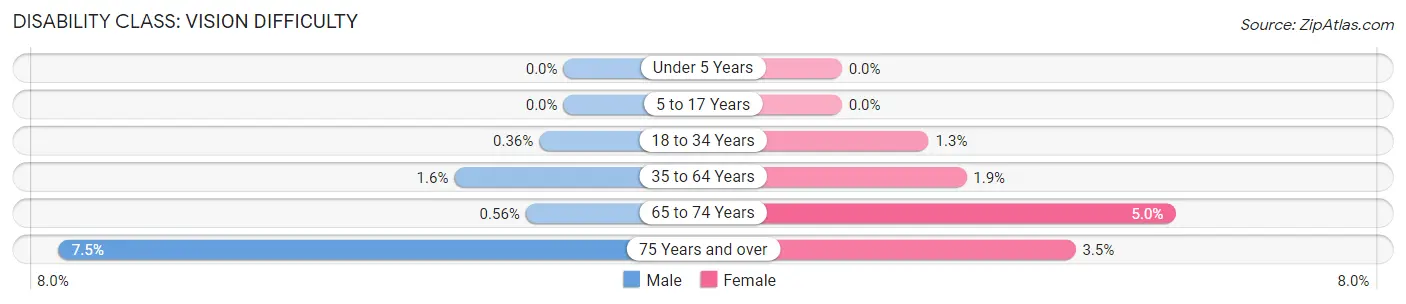
| Age Bracket | Male | Female |
| Under 5 Years | 0 (0.0%) | 0 (0.0%) |
| 5 to 17 Years | 0 (0.0%) | 0 (0.0%) |
| 18 to 34 Years | 2 (0.4%) | 7 (1.3%) |
| 35 to 64 Years | 25 (1.6%) | 27 (1.8%) |
| 65 to 74 Years | 4 (0.6%) | 32 (5.0%) |
| 75 Years and over | 28 (7.5%) | 14 (3.5%) |
Disability Class: Cognitive Difficulty
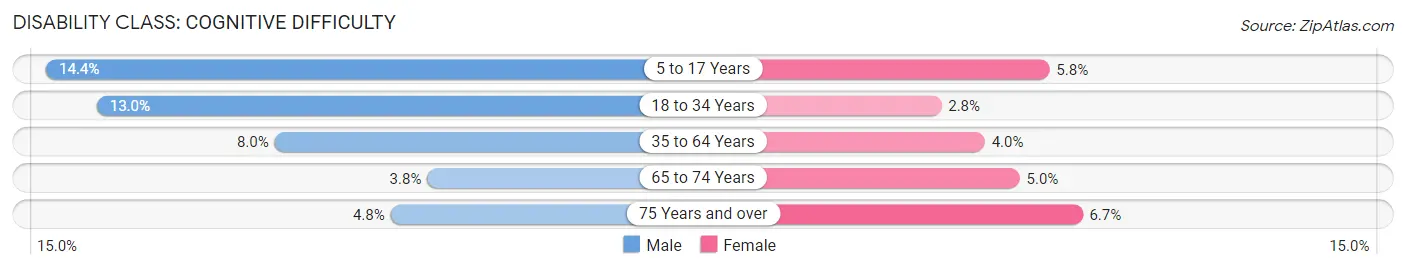
| Age Bracket | Male | Female |
| 5 to 17 Years | 90 (14.4%) | 38 (5.8%) |
| 18 to 34 Years | 73 (13.0%) | 15 (2.8%) |
| 35 to 64 Years | 124 (8.0%) | 58 (4.0%) |
| 65 to 74 Years | 27 (3.8%) | 32 (5.0%) |
| 75 Years and over | 18 (4.8%) | 27 (6.7%) |
Disability Class: Ambulatory Difficulty
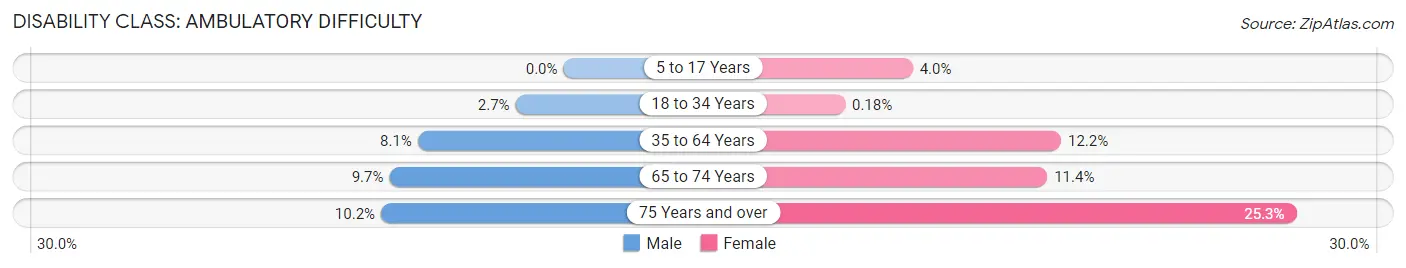
| Age Bracket | Male | Female |
| 5 to 17 Years | 0 (0.0%) | 26 (4.0%) |
| 18 to 34 Years | 15 (2.7%) | 1 (0.2%) |
| 35 to 64 Years | 125 (8.1%) | 178 (12.2%) |
| 65 to 74 Years | 69 (9.7%) | 74 (11.4%) |
| 75 Years and over | 38 (10.2%) | 102 (25.3%) |
Disability Class: Self-Care Difficulty
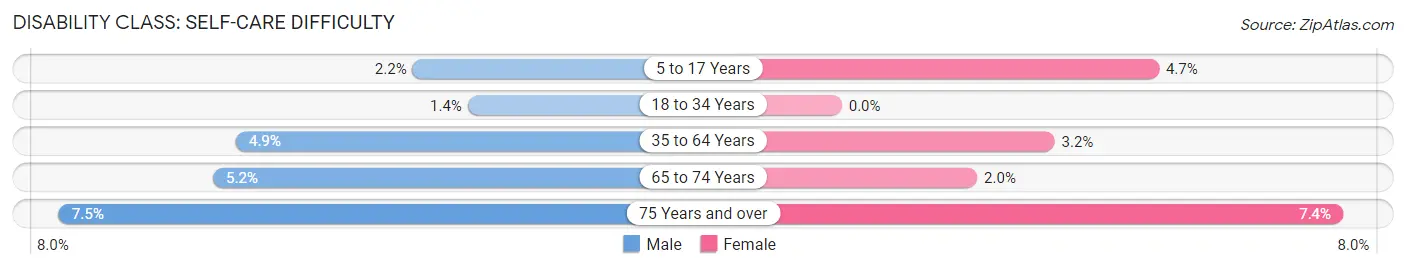
| Age Bracket | Male | Female |
| 5 to 17 Years | 14 (2.2%) | 31 (4.7%) |
| 18 to 34 Years | 8 (1.4%) | 0 (0.0%) |
| 35 to 64 Years | 75 (4.9%) | 46 (3.2%) |
| 65 to 74 Years | 37 (5.2%) | 13 (2.0%) |
| 75 Years and over | 28 (7.5%) | 30 (7.4%) |
Technology Access in Alger County
Computing Device Access in Alger County
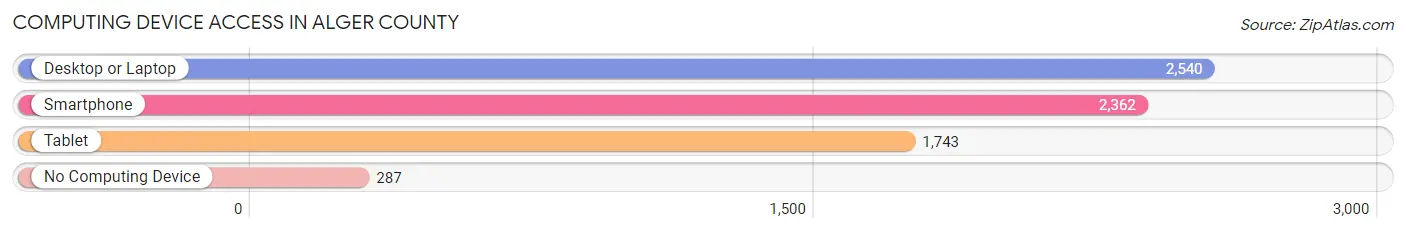
| Device Type | # Households | % Households |
| Desktop or Laptop | 2,540 | 77.6% |
| Smartphone | 2,362 | 72.1% |
| Tablet | 1,743 | 53.2% |
| No Computing Device | 287 | 8.8% |
| Total | 3,274 | 100.0% |
Internet Access in Alger County
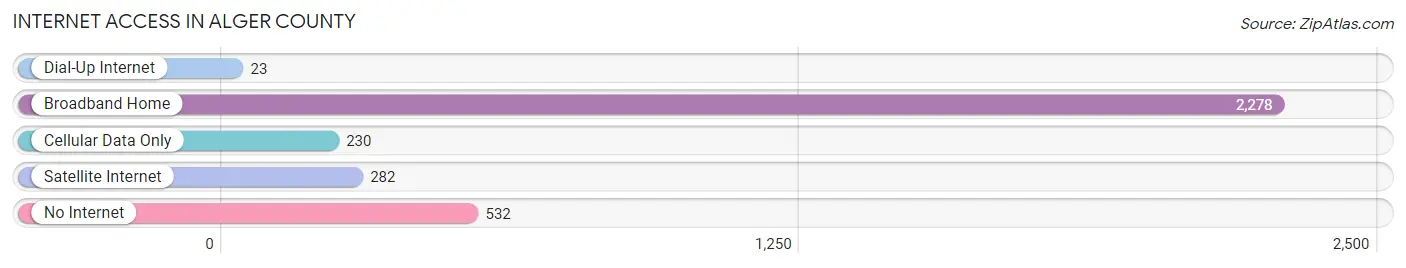
| Internet Type | # Households | % Households |
| Dial-Up Internet | 23 | 0.7% |
| Broadband Home | 2,278 | 69.6% |
| Cellular Data Only | 230 | 7.0% |
| Satellite Internet | 282 | 8.6% |
| No Internet | 532 | 16.3% |
| Total | 3,274 | 100.0% |
Alger County Summary
Alger County is located in the Upper Peninsula of Michigan, and is bordered by Marquette County to the west, Schoolcraft County to the east, Delta County to the south, and Chippewa County to the north. The county seat is Munising, and the county has a total area of 1,845 square miles, making it the fourth largest county in Michigan. As of the 2010 census, the population was 9,601.
History
Alger County was established in 1885 and named after Russell A. Alger, a Civil War general and the 20th Governor of Michigan. The county was originally part of Marquette County, and was created to provide better access to the county seat of Marquette. The first settlers in the area were French-Canadian fur traders, who established trading posts in the area in the early 1800s.
The first permanent settlement in the county was established in 1846, when a group of settlers from Ohio and Indiana arrived in the area. The settlement was named Munising, after the Munising River, which flows through the county. The settlement quickly grew, and by 1854, it had become the county seat.
In the late 1800s, the county experienced a period of rapid growth, as logging and mining became major industries in the area. The logging industry was particularly important, as the county was home to some of the largest stands of white pine in the country. The logging industry also led to the development of several small towns in the county, including Grand Marais, Au Train, and Christmas.
The county also experienced a period of economic decline in the early 1900s, as the logging industry began to decline and the mining industry began to move away from the area. The Great Depression also had a major impact on the county, as unemployment rose and many people were forced to leave the area in search of work.
Geography
Alger County is located in the Upper Peninsula of Michigan, and is bordered by Marquette County to the west, Schoolcraft County to the east, Delta County to the south, and Chippewa County to the north. The county has a total area of 1,845 square miles, making it the fourth largest county in Michigan.
The county is mostly covered by forests, with the Huron Mountains located in the western part of the county. The county is also home to several lakes, including Lake Superior, Lake Michigan, and Lake Huron. The county also contains several rivers, including the Munising River, the Au Train River, and the Two Hearted River.
Economy
The economy of Alger County is largely based on tourism, as the county is home to several popular tourist destinations, including Pictured Rocks National Lakeshore, Grand Island National Recreation Area, and the Seney National Wildlife Refuge. The county is also home to several ski resorts, including Indianhead Mountain and Big Powderhorn Mountain.
The county is also home to several manufacturing companies, including a paper mill in Munising, a furniture factory in Grand Marais, and a sawmill in Christmas. The county is also home to several small businesses, including restaurants, retail stores, and lodging establishments.
Demographics
As of the 2010 census, the population of Alger County was 9,601. The racial makeup of the county was 95.2% White, 0.7% African American, 0.7% Native American, 0.3% Asian, 0.1% Pacific Islander, 0.7% from other races, and 2.3% from two or more races. Hispanic or Latino of any race were 2.2% of the population.
The median income for a household in the county was $37,945, and the median income for a family was $45,938. The per capita income for the county was $20,845. About 14.2% of families and 18.2% of the population were below the poverty line, including 25.2% of those under age 18 and 11.2% of those age 65 or over.
Common Questions
What is Per Capita Income in Alger County?
Per Capita income in Alger County is $25,099.
What is the Median Family Income in Alger County?
Median Family Income in Alger County is $66,829.
What is the Median Household income in Alger County?
Median Household Income in Alger County is $55,528.
What is Income or Wage Gap in Alger County?
Income or Wage Gap in Alger County is 28.5%.
Women in Alger County earn 71.5 cents for every dollar earned by a man.
What is Inequality or Gini Index in Alger County?
Inequality or Gini Index in Alger County is 0.39.
What is the Total Population of Alger County?
Total Population of Alger County is 8,866.
What is the Total Male Population of Alger County?
Total Male Population of Alger County is 4,943.
What is the Total Female Population of Alger County?
Total Female Population of Alger County is 3,923.
What is the Ratio of Males per 100 Females in Alger County?
There are 126.00 Males per 100 Females in Alger County.
What is the Ratio of Females per 100 Males in Alger County?
There are 79.36 Females per 100 Males in Alger County.
What is the Median Population Age in Alger County?
Median Population Age in Alger County is 47.2 Years.
What is the Average Family Size in Alger County
Average Family Size in Alger County is 3.0 People.
What is the Average Household Size in Alger County
Average Household Size in Alger County is 2.4 People.
How Large is the Labor Force in Alger County?
There are 3,073 People in the Labor Forcein in Alger County.
What is the Percentage of People in the Labor Force in Alger County?
41.0% of People are in the Labor Force in Alger County.
What is the Unemployment Rate in Alger County?
Unemployment Rate in Alger County is 5.1%.