Unionville, GA Map & Demographics
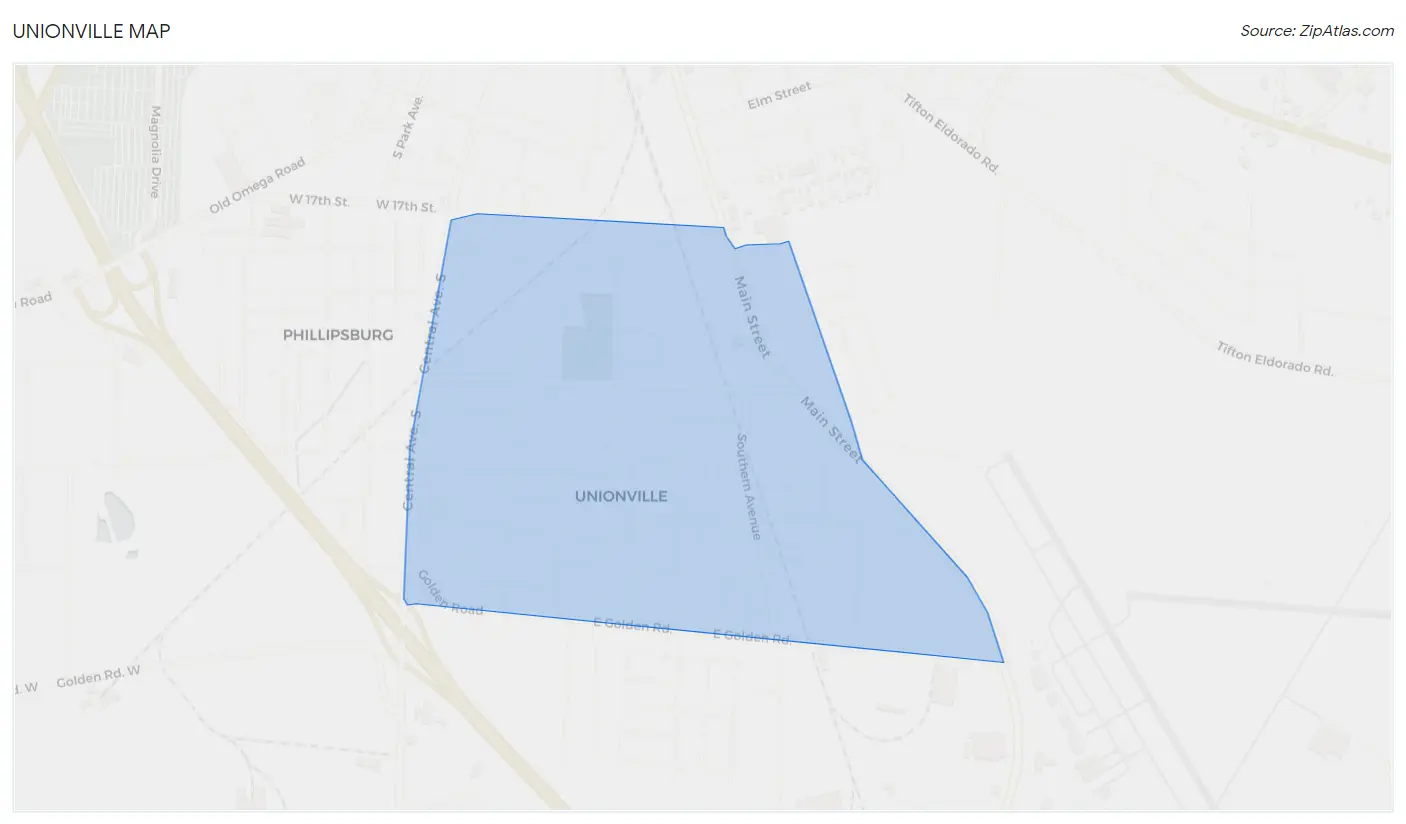
Unionville Map
Unionville Overview
$19,694
PER CAPITA INCOME
$64,028
AVG FAMILY INCOME
$49,149
AVG HOUSEHOLD INCOME
30.2%
WAGE / INCOME GAP [ % ]
69.8¢/ $1
WAGE / INCOME GAP [ $ ]
0.45
INEQUALITY / GINI INDEX
2,215
TOTAL POPULATION
1,173
MALE POPULATION
1,042
FEMALE POPULATION
112.57
MALES / 100 FEMALES
88.83
FEMALES / 100 MALES
29.1
MEDIAN AGE
5.0
AVG FAMILY SIZE
3.5
AVG HOUSEHOLD SIZE
802
LABOR FORCE [ PEOPLE ]
52.4%
PERCENT IN LABOR FORCE
11.5%
UNEMPLOYMENT RATE
Income in Unionville
Income Overview in Unionville
Per Capita Income in Unionville is $19,694, while median incomes of families and households are $64,028 and $49,149 respectively.
| Characteristic | Number | Measure |
| Per Capita Income | 2,215 | $19,694 |
| Median Family Income | 330 | $64,028 |
| Mean Family Income | 330 | $100,801 |
| Median Household Income | 635 | $49,149 |
| Mean Household Income | 635 | $71,057 |
| Income Deficit | 330 | $0 |
| Wage / Income Gap (%) | 2,215 | 30.25% |
| Wage / Income Gap ($) | 2,215 | 69.75¢ per $1 |
| Gini / Inequality Index | 2,215 | 0.45 |
Earnings by Sex in Unionville
Average Earnings in Unionville are $40,038, $40,754 for men and $28,426 for women, a difference of 30.2%.
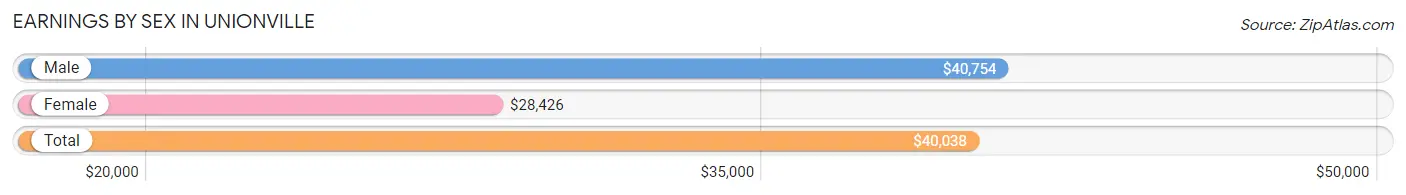
| Sex | Number | Average Earnings |
| Male | 526 (68.0%) | $40,754 |
| Female | 248 (32.0%) | $28,426 |
| Total | 774 (100.0%) | $40,038 |
Earnings by Sex by Income Bracket in Unionville
The most common earnings brackets in Unionville are $40,000 to $44,999 for men (199 | 37.8%) and $5,000 to $7,499 for women (38 | 15.3%).
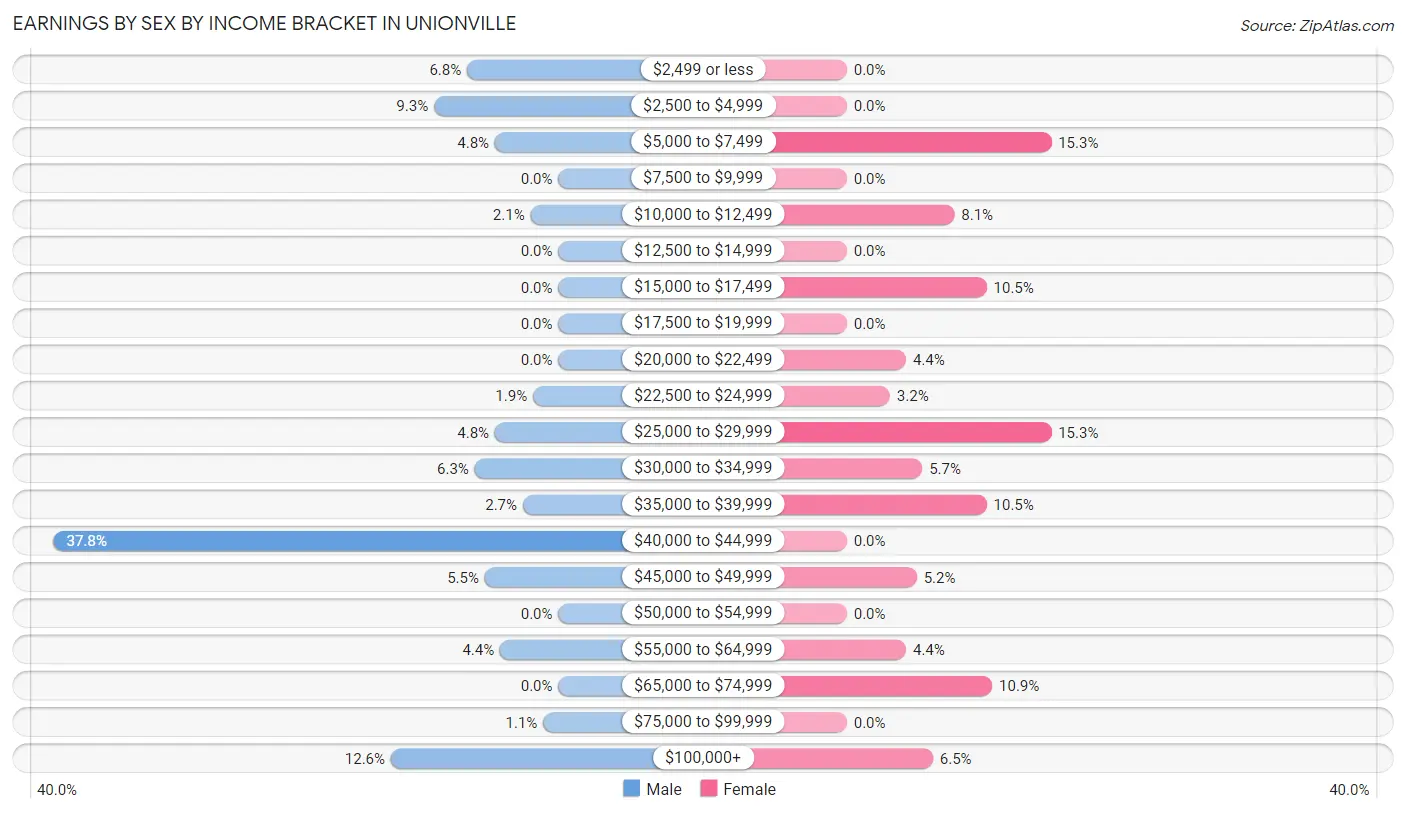
| Income | Male | Female |
| $2,499 or less | 36 (6.8%) | 0 (0.0%) |
| $2,500 to $4,999 | 49 (9.3%) | 0 (0.0%) |
| $5,000 to $7,499 | 25 (4.8%) | 38 (15.3%) |
| $7,500 to $9,999 | 0 (0.0%) | 0 (0.0%) |
| $10,000 to $12,499 | 11 (2.1%) | 20 (8.1%) |
| $12,500 to $14,999 | 0 (0.0%) | 0 (0.0%) |
| $15,000 to $17,499 | 0 (0.0%) | 26 (10.5%) |
| $17,500 to $19,999 | 0 (0.0%) | 0 (0.0%) |
| $20,000 to $22,499 | 0 (0.0%) | 11 (4.4%) |
| $22,500 to $24,999 | 10 (1.9%) | 8 (3.2%) |
| $25,000 to $29,999 | 25 (4.8%) | 38 (15.3%) |
| $30,000 to $34,999 | 33 (6.3%) | 14 (5.7%) |
| $35,000 to $39,999 | 14 (2.7%) | 26 (10.5%) |
| $40,000 to $44,999 | 199 (37.8%) | 0 (0.0%) |
| $45,000 to $49,999 | 29 (5.5%) | 13 (5.2%) |
| $50,000 to $54,999 | 0 (0.0%) | 0 (0.0%) |
| $55,000 to $64,999 | 23 (4.4%) | 11 (4.4%) |
| $65,000 to $74,999 | 0 (0.0%) | 27 (10.9%) |
| $75,000 to $99,999 | 6 (1.1%) | 0 (0.0%) |
| $100,000+ | 66 (12.6%) | 16 (6.5%) |
| Total | 526 (100.0%) | 248 (100.0%) |
Earnings by Sex by Educational Attainment in Unionville
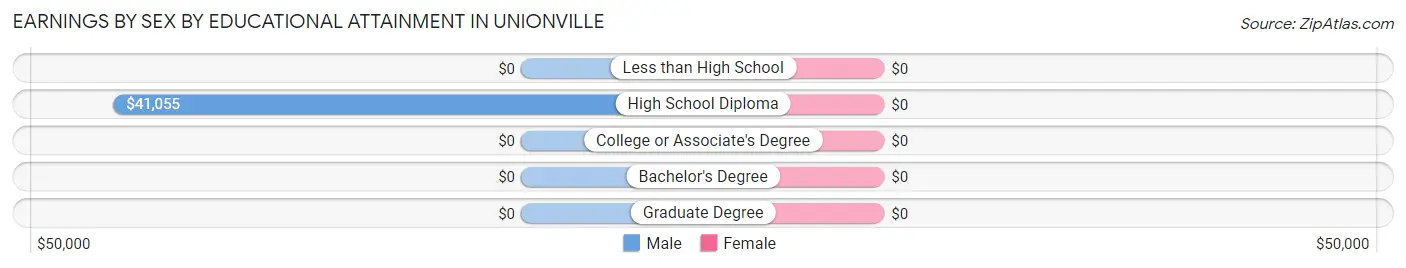
| Educational Attainment | Male Income | Female Income |
| Less than High School | - | - |
| High School Diploma | $41,055 | $0 |
| College or Associate's Degree | - | - |
| Bachelor's Degree | - | - |
| Graduate Degree | - | - |
| Total | $41,288 | $30,357 |
Family Income in Unionville
Family Income Brackets in Unionville
According to the Unionville family income data, there are 116 families falling into the $50,000 to $74,999 income range, which is the most common income bracket and makes up 35.1% of all families.
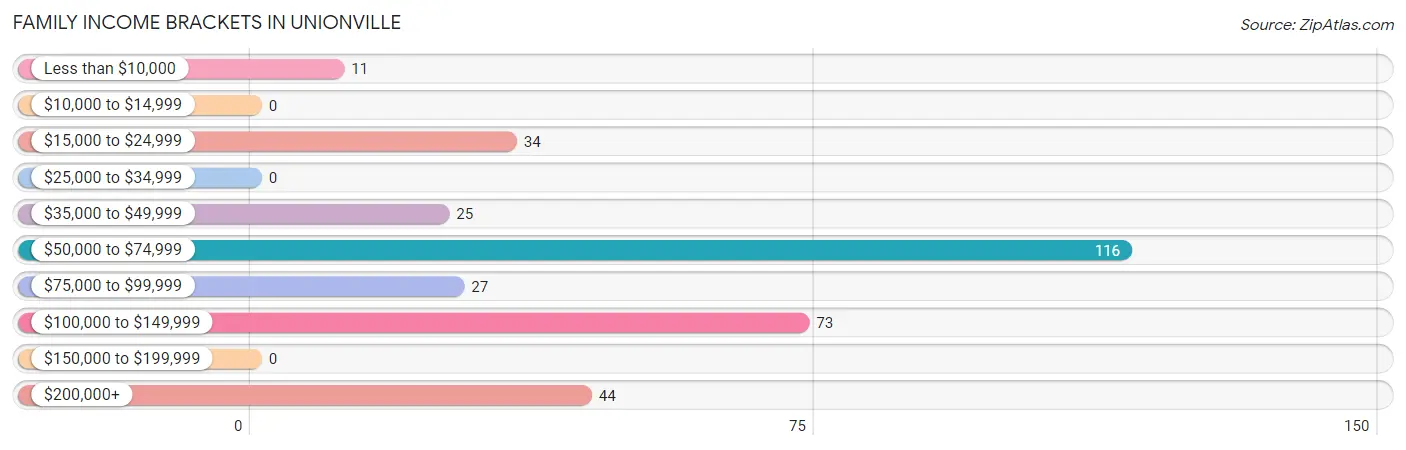
| Income Bracket | # Families | % Families |
| Less than $10,000 | 11 | 3.3% |
| $10,000 to $14,999 | 0 | 0.0% |
| $15,000 to $24,999 | 34 | 10.3% |
| $25,000 to $34,999 | 0 | 0.0% |
| $35,000 to $49,999 | 25 | 7.6% |
| $50,000 to $74,999 | 116 | 35.2% |
| $75,000 to $99,999 | 27 | 8.2% |
| $100,000 to $149,999 | 73 | 22.1% |
| $150,000 to $199,999 | 0 | 0.0% |
| $200,000+ | 44 | 13.3% |
Family Income by Famaliy Size in Unionville
3-person families (67 | 20.3%) account for the highest median family income in Unionville with $103,774 per family, while 3-person families (67 | 20.3%) have the highest median income of $34,591 per family member.
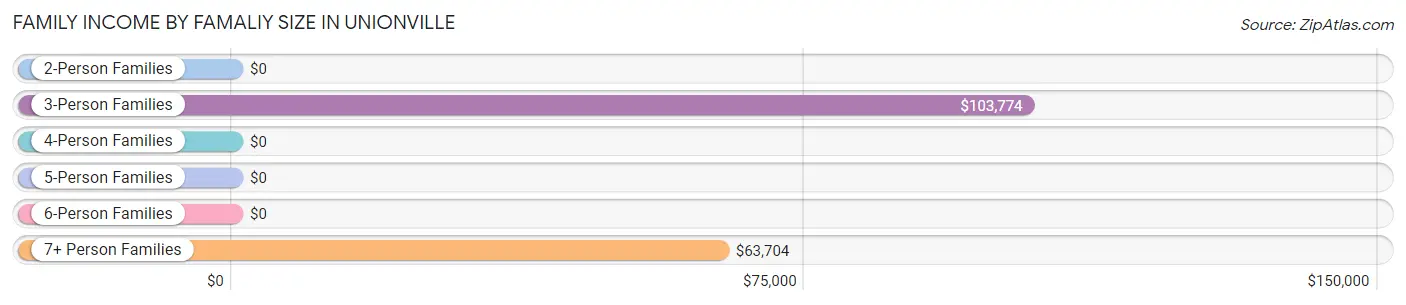
| Income Bracket | # Families | Median Income |
| 2-Person Families | 95 (28.8%) | $0 |
| 3-Person Families | 67 (20.3%) | $103,774 |
| 4-Person Families | 24 (7.3%) | $0 |
| 5-Person Families | 34 (10.3%) | $0 |
| 6-Person Families | 0 (0.0%) | $0 |
| 7+ Person Families | 110 (33.3%) | $63,704 |
| Total | 330 (100.0%) | $64,028 |
Family Income by Number of Earners in Unionville
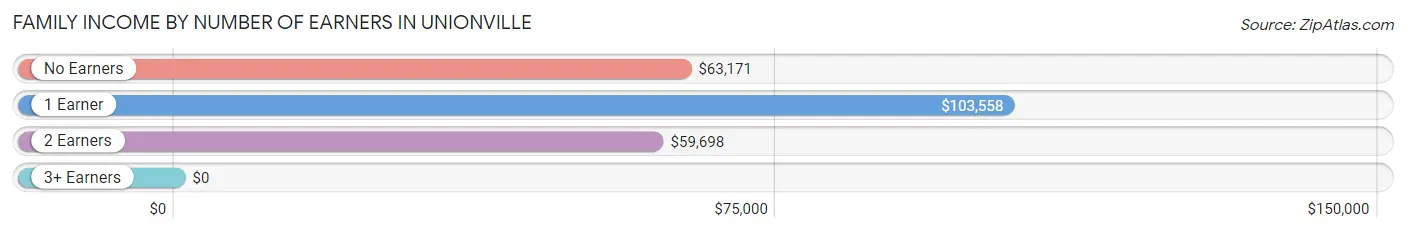
| Number of Earners | # Families | Median Income |
| No Earners | 79 (23.9%) | $63,171 |
| 1 Earner | 88 (26.7%) | $103,558 |
| 2 Earners | 163 (49.4%) | $59,698 |
| 3+ Earners | 0 (0.0%) | $0 |
| Total | 330 (100.0%) | $64,028 |
Household Income in Unionville
Household Income Brackets in Unionville
With 252 households falling in the category, the $35,000 to $49,999 income range is the most frequent in Unionville, accounting for 39.7% of all households.
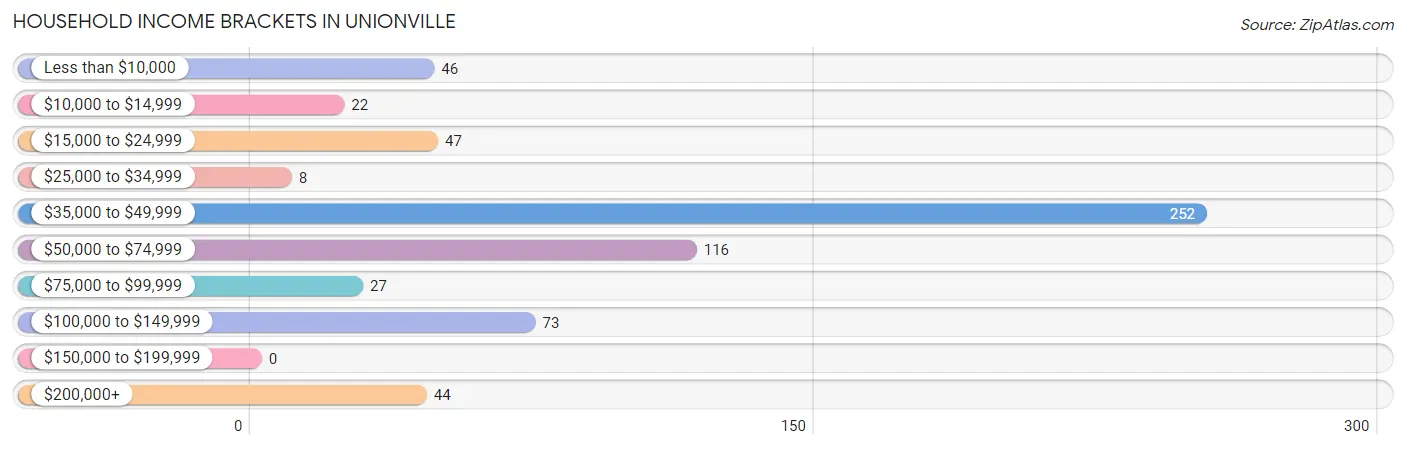
| Income Bracket | # Households | % Households |
| Less than $10,000 | 46 | 7.2% |
| $10,000 to $14,999 | 22 | 3.5% |
| $15,000 to $24,999 | 47 | 7.4% |
| $25,000 to $34,999 | 8 | 1.3% |
| $35,000 to $49,999 | 252 | 39.7% |
| $50,000 to $74,999 | 116 | 18.3% |
| $75,000 to $99,999 | 27 | 4.3% |
| $100,000 to $149,999 | 73 | 11.5% |
| $150,000 to $199,999 | 0 | 0.0% |
| $200,000+ | 44 | 6.9% |
Household Income by Householder Age in Unionville
The median household income in Unionville is $49,149, with the highest median household income of $49,379 found in the 25 to 44 years age bracket for the primary householder. A total of 306 households (48.2%) fall into this category.
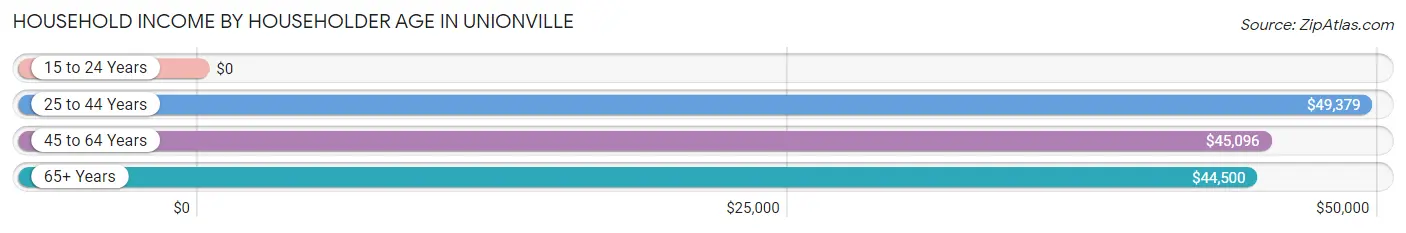
| Income Bracket | # Households | Median Income |
| 15 to 24 Years | 0 (0.0%) | $0 |
| 25 to 44 Years | 306 (48.2%) | $49,379 |
| 45 to 64 Years | 169 (26.6%) | $45,096 |
| 65+ Years | 160 (25.2%) | $44,500 |
| Total | 635 (100.0%) | $49,149 |
Poverty in Unionville
Income Below Poverty by Sex and Age in Unionville
With 22.0% poverty level for males and 30.2% for females among the residents of Unionville, 6 to 11 year old males and 16 and 17 year old females are the most vulnerable to poverty, with 141 males (100.0%) and 38 females (100.0%) in their respective age groups living below the poverty level.
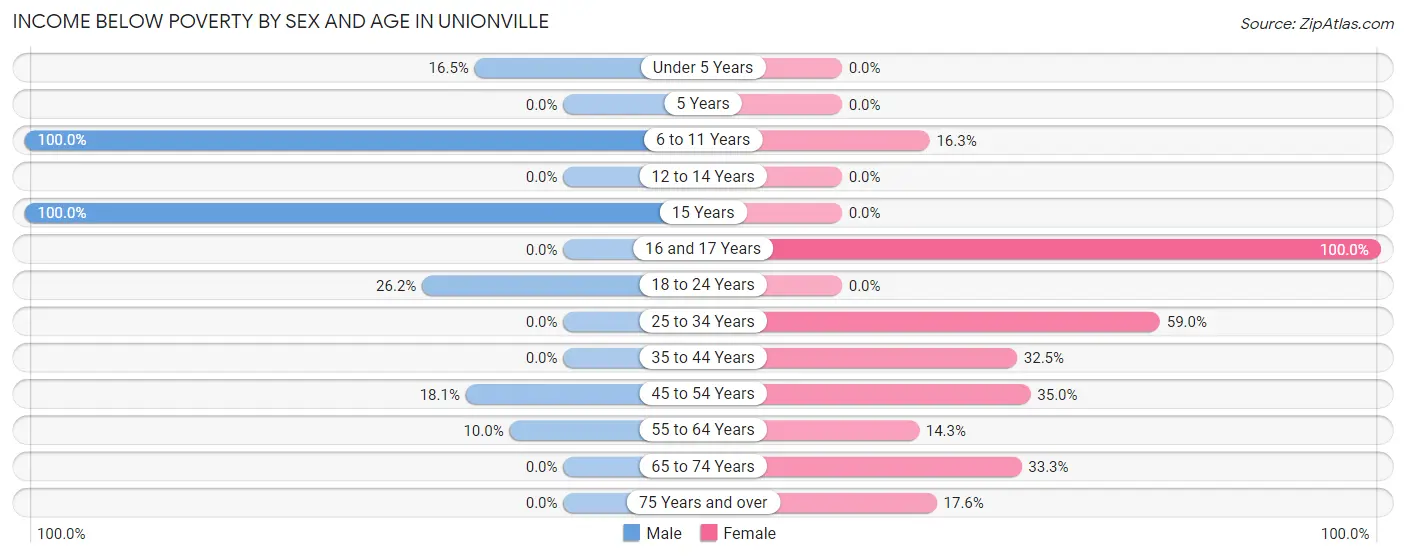
| Age Bracket | Male | Female |
| Under 5 Years | 13 (16.5%) | 0 (0.0%) |
| 5 Years | 0 (0.0%) | 0 (0.0%) |
| 6 to 11 Years | 141 (100.0%) | 14 (16.3%) |
| 12 to 14 Years | 0 (0.0%) | 0 (0.0%) |
| 15 Years | 30 (100.0%) | 0 (0.0%) |
| 16 and 17 Years | 0 (0.0%) | 38 (100.0%) |
| 18 to 24 Years | 38 (26.2%) | 0 (0.0%) |
| 25 to 34 Years | 0 (0.0%) | 144 (59.0%) |
| 35 to 44 Years | 0 (0.0%) | 26 (32.5%) |
| 45 to 54 Years | 25 (18.1%) | 35 (35.0%) |
| 55 to 64 Years | 11 (10.0%) | 11 (14.3%) |
| 65 to 74 Years | 0 (0.0%) | 25 (33.3%) |
| 75 Years and over | 0 (0.0%) | 22 (17.6%) |
| Total | 258 (22.0%) | 315 (30.2%) |
Income Above Poverty by Sex and Age in Unionville
According to the poverty statistics in Unionville, males aged 5 years and females aged under 5 years are the age groups that are most secure financially, with 100.0% of males and 100.0% of females in these age groups living above the poverty line.
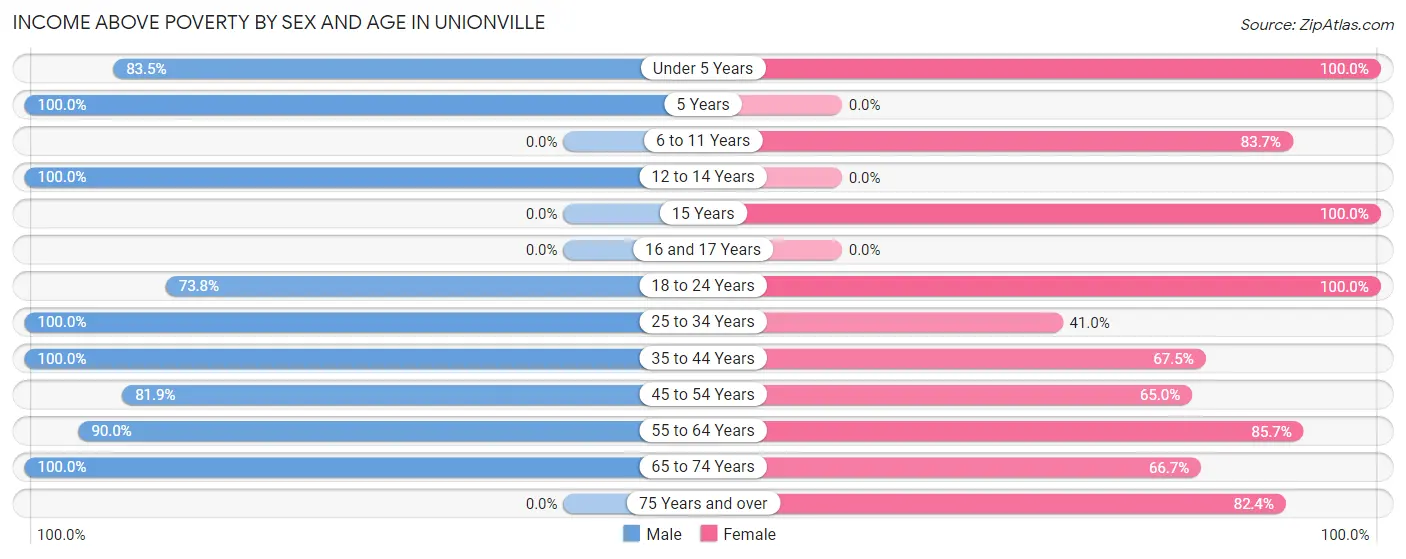
| Age Bracket | Male | Female |
| Under 5 Years | 66 (83.5%) | 83 (100.0%) |
| 5 Years | 48 (100.0%) | 0 (0.0%) |
| 6 to 11 Years | 0 (0.0%) | 72 (83.7%) |
| 12 to 14 Years | 141 (100.0%) | 0 (0.0%) |
| 15 Years | 0 (0.0%) | 77 (100.0%) |
| 16 and 17 Years | 0 (0.0%) | 0 (0.0%) |
| 18 to 24 Years | 107 (73.8%) | 57 (100.0%) |
| 25 to 34 Years | 221 (100.0%) | 100 (41.0%) |
| 35 to 44 Years | 82 (100.0%) | 54 (67.5%) |
| 45 to 54 Years | 113 (81.9%) | 65 (65.0%) |
| 55 to 64 Years | 99 (90.0%) | 66 (85.7%) |
| 65 to 74 Years | 38 (100.0%) | 50 (66.7%) |
| 75 Years and over | 0 (0.0%) | 103 (82.4%) |
| Total | 915 (78.0%) | 727 (69.8%) |
Income Below Poverty Among Married-Couple Families in Unionville
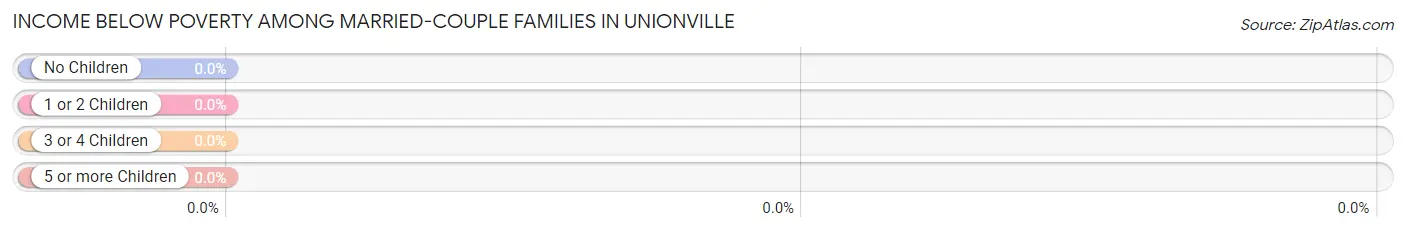
| Children | Above Poverty | Below Poverty |
| No Children | 58 (100.0%) | 0 (0.0%) |
| 1 or 2 Children | 62 (100.0%) | 0 (0.0%) |
| 3 or 4 Children | 27 (100.0%) | 0 (0.0%) |
| 5 or more Children | 29 (100.0%) | 0 (0.0%) |
| Total | 176 (100.0%) | 0 (0.0%) |
Income Below Poverty Among Single-Parent Households in Unionville
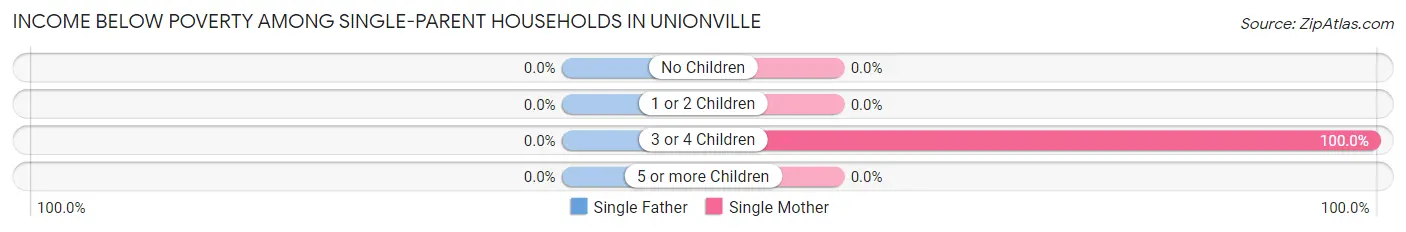
| Children | Single Father | Single Mother |
| No Children | 0 (0.0%) | 0 (0.0%) |
| 1 or 2 Children | 0 (0.0%) | 0 (0.0%) |
| 3 or 4 Children | 0 (0.0%) | 37 (100.0%) |
| 5 or more Children | 0 (0.0%) | 0 (0.0%) |
| Total | 0 (0.0%) | 37 (63.8%) |
Income Below Poverty Among Married-Couple vs Single-Parent Households in Unionville
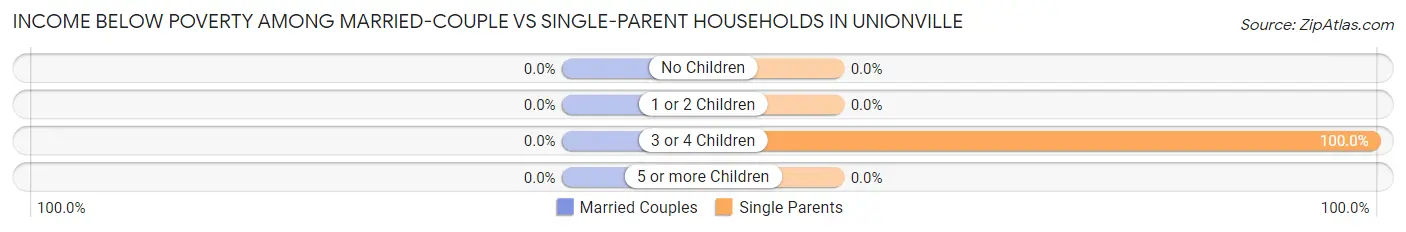
| Children | Married-Couple Families | Single-Parent Households |
| No Children | 0 (0.0%) | 0 (0.0%) |
| 1 or 2 Children | 0 (0.0%) | 0 (0.0%) |
| 3 or 4 Children | 0 (0.0%) | 37 (100.0%) |
| 5 or more Children | 0 (0.0%) | 0 (0.0%) |
| Total | 0 (0.0%) | 37 (24.0%) |
Race in Unionville
The most populous races in Unionville are , and Black / African American (2,215 | 100.0%).
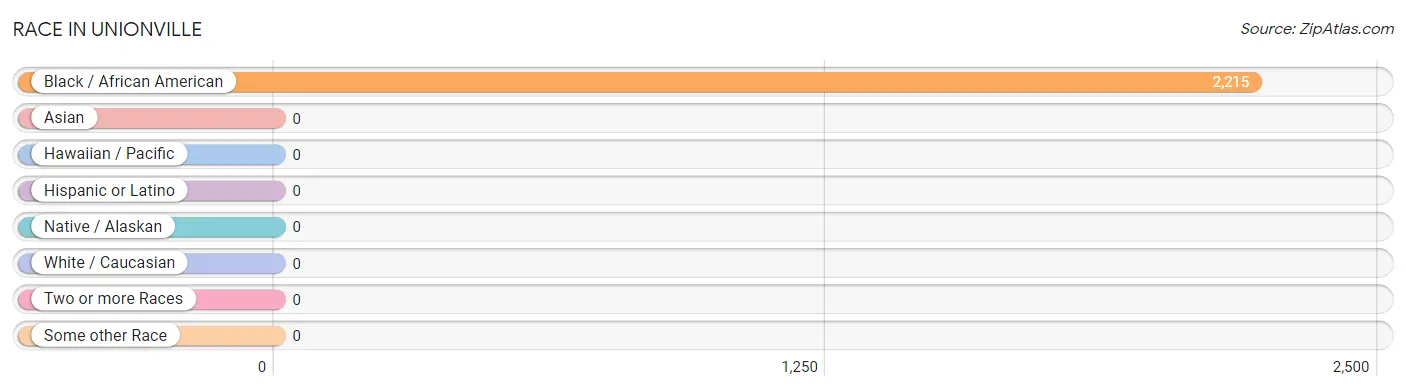
| Race | # Population | % Population |
| Asian | 0 | 0.0% |
| Black / African American | 2,215 | 100.0% |
| Hawaiian / Pacific | 0 | 0.0% |
| Hispanic or Latino | 0 | 0.0% |
| Native / Alaskan | 0 | 0.0% |
| White / Caucasian | 0 | 0.0% |
| Two or more Races | 0 | 0.0% |
| Some other Race | 0 | 0.0% |
| Total | 2,215 | 100.0% |
Ancestry in Unionville
The most populous ancestries reported in Unionville are , and American (919 | 41.5%), together accounting for 41.5% of all Unionville residents.

| Ancestry | # Population | % Population |
| American | 919 | 41.5% | View All 1 Rows |
Immigrants in Unionville

| Immigration Origin | # Population | % Population | View All 0 Rows |
Sex and Age in Unionville
Sex and Age in Unionville
The most populous age groups in Unionville are 10 to 14 Years (243 | 20.7%) for men and 25 to 29 Years (170 | 16.3%) for women.
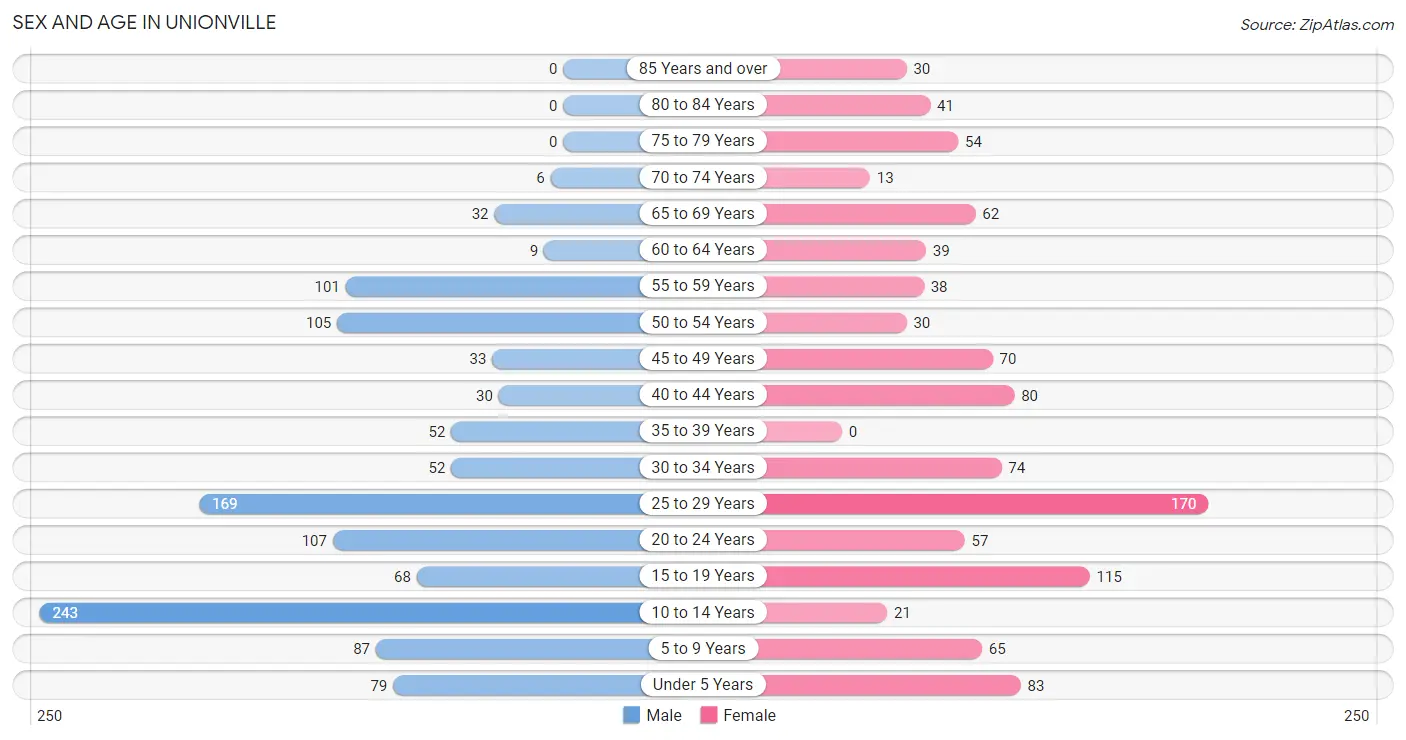
| Age Bracket | Male | Female |
| Under 5 Years | 79 (6.7%) | 83 (8.0%) |
| 5 to 9 Years | 87 (7.4%) | 65 (6.2%) |
| 10 to 14 Years | 243 (20.7%) | 21 (2.0%) |
| 15 to 19 Years | 68 (5.8%) | 115 (11.0%) |
| 20 to 24 Years | 107 (9.1%) | 57 (5.5%) |
| 25 to 29 Years | 169 (14.4%) | 170 (16.3%) |
| 30 to 34 Years | 52 (4.4%) | 74 (7.1%) |
| 35 to 39 Years | 52 (4.4%) | 0 (0.0%) |
| 40 to 44 Years | 30 (2.6%) | 80 (7.7%) |
| 45 to 49 Years | 33 (2.8%) | 70 (6.7%) |
| 50 to 54 Years | 105 (8.9%) | 30 (2.9%) |
| 55 to 59 Years | 101 (8.6%) | 38 (3.6%) |
| 60 to 64 Years | 9 (0.8%) | 39 (3.7%) |
| 65 to 69 Years | 32 (2.7%) | 62 (5.9%) |
| 70 to 74 Years | 6 (0.5%) | 13 (1.3%) |
| 75 to 79 Years | 0 (0.0%) | 54 (5.2%) |
| 80 to 84 Years | 0 (0.0%) | 41 (3.9%) |
| 85 Years and over | 0 (0.0%) | 30 (2.9%) |
| Total | 1,173 (100.0%) | 1,042 (100.0%) |
Families and Households in Unionville
Median Family Size in Unionville
The median family size in Unionville is 5.01 persons per family, with single female/mother families (58 | 17.6%) accounting for the largest median family size of 6.66 persons per family. On the other hand, single male/father families (96 | 29.1%) represent the smallest median family size with 2.44 persons per family.
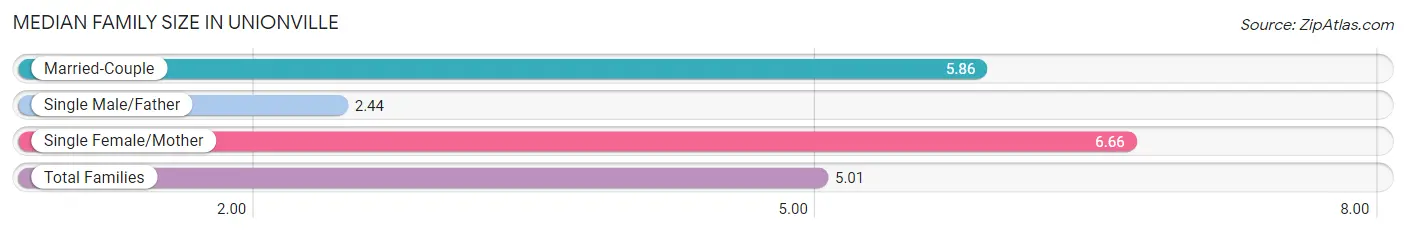
| Family Type | # Families | Family Size |
| Married-Couple | 176 (53.3%) | 5.86 |
| Single Male/Father | 96 (29.1%) | 2.44 |
| Single Female/Mother | 58 (17.6%) | 6.66 |
| Total Families | 330 (100.0%) | 5.01 |
Median Household Size in Unionville
The median household size in Unionville is 3.49 persons per household, with single female/mother households (58 | 9.1%) accounting for the largest median household size of 7.1 persons per household. non-family households (305 | 48.0%) represent the smallest median household size with 1.64 persons per household.
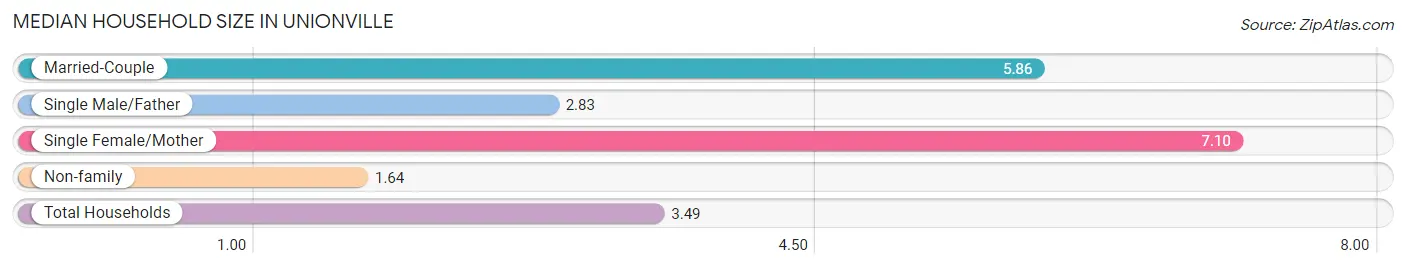
| Household Type | # Households | Household Size |
| Married-Couple | 176 (27.7%) | 5.86 |
| Single Male/Father | 96 (15.1%) | 2.83 |
| Single Female/Mother | 58 (9.1%) | 7.10 |
| Non-family | 305 (48.0%) | 1.64 |
| Total Households | 635 (100.0%) | 3.49 |
Household Size by Marriage Status in Unionville
Out of a total of 635 households in Unionville, 330 (52.0%) are family households, while 305 (48.0%) are nonfamily households. The most numerous type of family households are 7+ person households, comprising 110, and the most common type of nonfamily households are 2-person households, comprising 169.
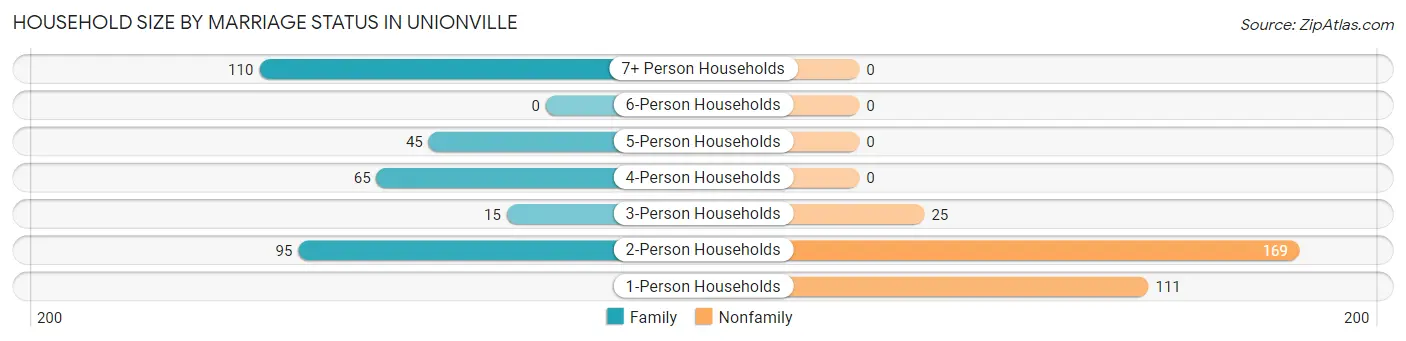
| Household Size | Family Households | Nonfamily Households |
| 1-Person Households | - | 111 (17.5%) |
| 2-Person Households | 95 (15.0%) | 169 (26.6%) |
| 3-Person Households | 15 (2.4%) | 25 (3.9%) |
| 4-Person Households | 65 (10.2%) | 0 (0.0%) |
| 5-Person Households | 45 (7.1%) | 0 (0.0%) |
| 6-Person Households | 0 (0.0%) | 0 (0.0%) |
| 7+ Person Households | 110 (17.3%) | 0 (0.0%) |
| Total | 330 (52.0%) | 305 (48.0%) |
Female Fertility in Unionville
Fertility by Age in Unionville
Average fertility rate in Unionville is 97.0 births per 1,000 women. Women in the age bracket of 20 to 34 years have the highest fertility rate with 189.0 births per 1,000 women. Women in the age bracket of 20 to 34 years acount for 100.0% of all women with births.
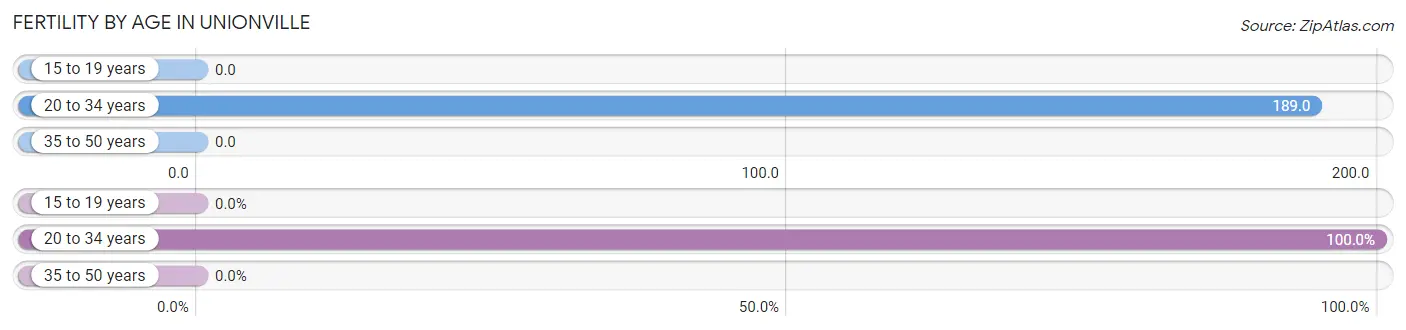
| Age Bracket | Women with Births | Births / 1,000 Women |
| 15 to 19 years | 0 (0.0%) | 0.0 |
| 20 to 34 years | 57 (100.0%) | 189.0 |
| 35 to 50 years | 0 (0.0%) | 0.0 |
| Total | 57 (100.0%) | 97.0 |
Fertility by Age by Marriage Status in Unionville
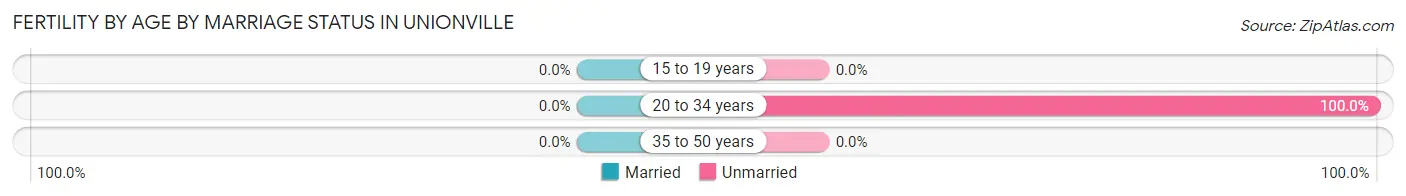
| Age Bracket | Married | Unmarried |
| 15 to 19 years | 0 (0.0%) | 0 (0.0%) |
| 20 to 34 years | 0 (0.0%) | 57 (100.0%) |
| 35 to 50 years | 0 (0.0%) | 0 (0.0%) |
| Total | 0 (0.0%) | 57 (100.0%) |
Fertility by Education in Unionville
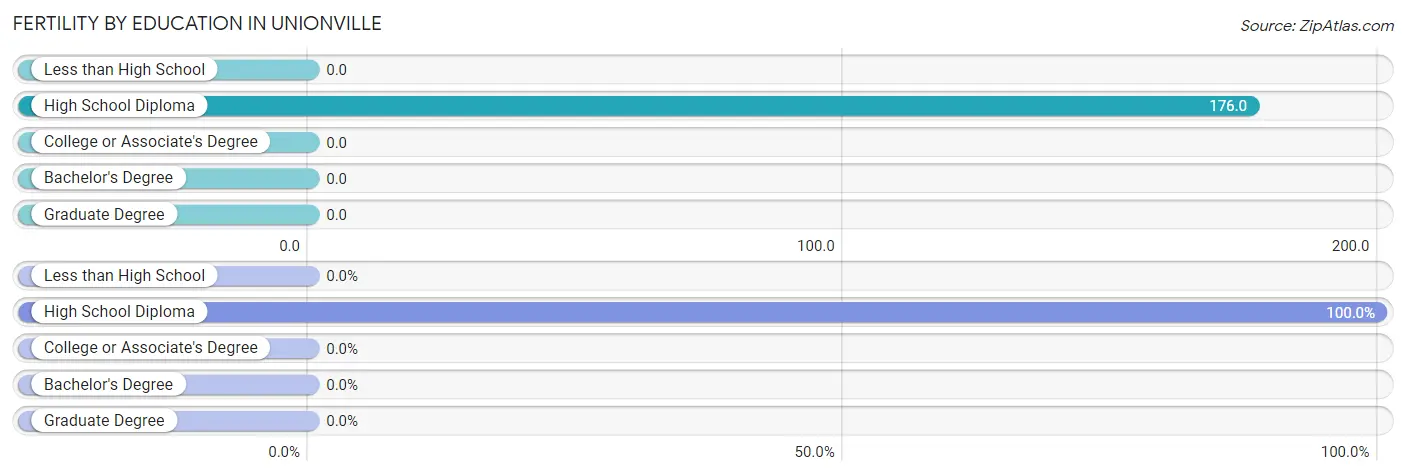
| Educational Attainment | Women with Births | Births / 1,000 Women |
| Less than High School | 0 (0.0%) | 0.0 |
| High School Diploma | 57 (100.0%) | 176.0 |
| College or Associate's Degree | 0 (0.0%) | 0.0 |
| Bachelor's Degree | 0 (0.0%) | 0.0 |
| Graduate Degree | 0 (0.0%) | 0.0 |
| Total | 57 (100.0%) | 97.0 |
Fertility by Education by Marriage Status in Unionville
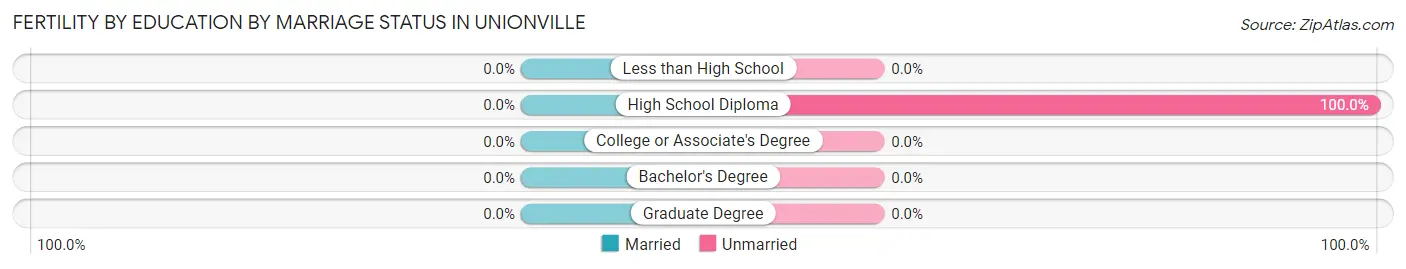
| Educational Attainment | Married | Unmarried |
| Less than High School | 0 (0.0%) | 0 (0.0%) |
| High School Diploma | 0 (0.0%) | 57 (100.0%) |
| College or Associate's Degree | 0 (0.0%) | 0 (0.0%) |
| Bachelor's Degree | 0 (0.0%) | 0 (0.0%) |
| Graduate Degree | 0 (0.0%) | 0 (0.0%) |
| Total | 0 (0.0%) | 57 (100.0%) |
Employment Characteristics in Unionville
Employment by Class of Employer in Unionville
Among the 710 employed individuals in Unionville, private company employees (604 | 85.1%), local government employees (88 | 12.4%), and state government employees (18 | 2.5%) make up the most common classes of employment.
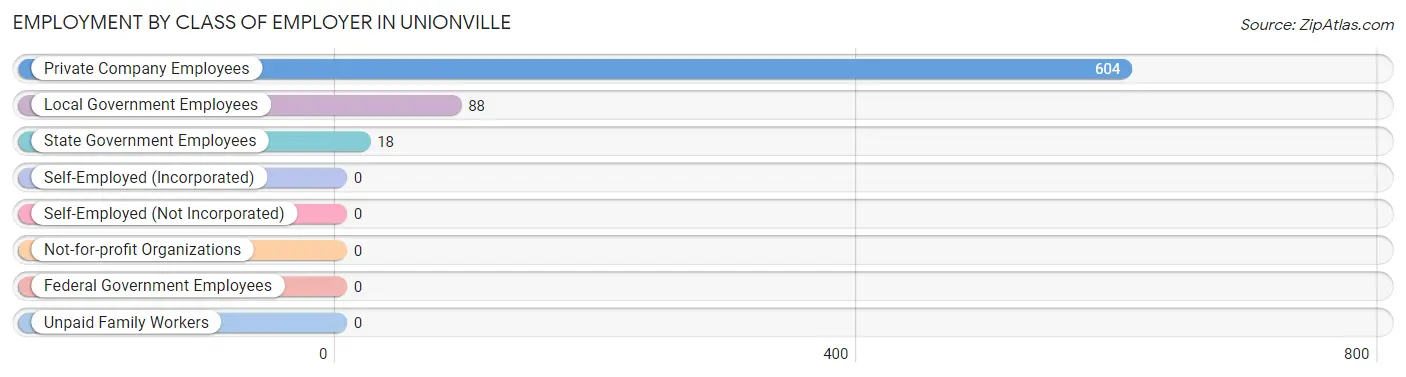
| Employer Class | # Employees | % Employees |
| Private Company Employees | 604 | 85.1% |
| Self-Employed (Incorporated) | 0 | 0.0% |
| Self-Employed (Not Incorporated) | 0 | 0.0% |
| Not-for-profit Organizations | 0 | 0.0% |
| Local Government Employees | 88 | 12.4% |
| State Government Employees | 18 | 2.5% |
| Federal Government Employees | 0 | 0.0% |
| Unpaid Family Workers | 0 | 0.0% |
| Total | 710 | 100.0% |
Employment Status by Age in Unionville
According to the labor force statistics for Unionville, out of the total population over 16 years of age (1,530), 52.4% or 802 individuals are in the labor force, with 11.5% or 92 of them unemployed. The age group with the highest labor force participation rate is 45 to 54 years, with 88.7% or 211 individuals in the labor force. Within the labor force, the 20 to 24 years age range has the highest percentage of unemployed individuals, with 54.8% or 57 of them being unemployed.
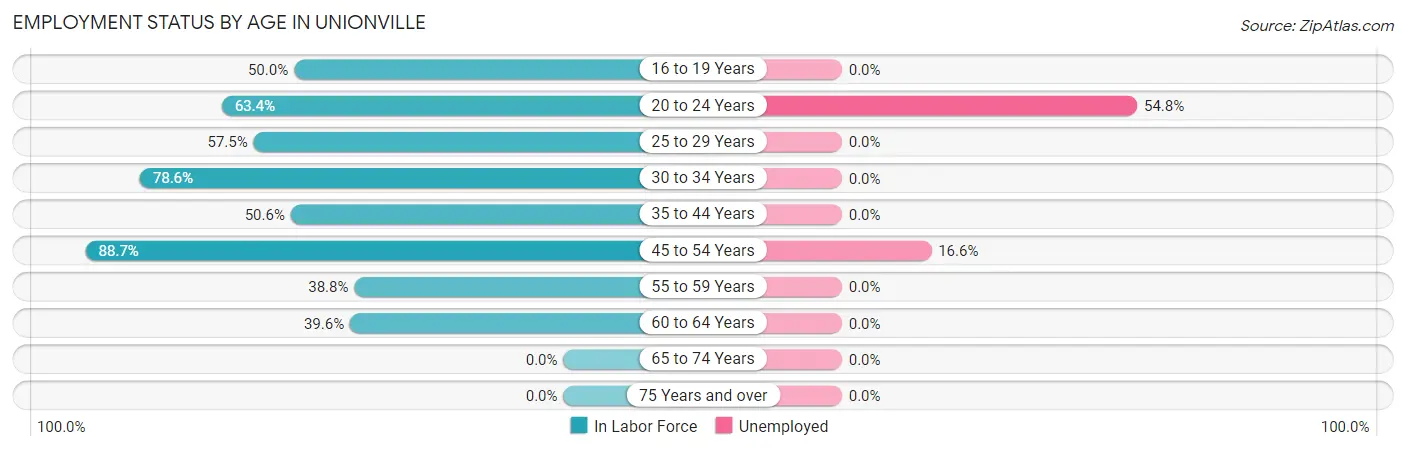
| Age Bracket | In Labor Force | Unemployed |
| 16 to 19 Years | 38 (50.0%) | 0 (0.0%) |
| 20 to 24 Years | 104 (63.4%) | 57 (54.8%) |
| 25 to 29 Years | 195 (57.5%) | 0 (0.0%) |
| 30 to 34 Years | 99 (78.6%) | 0 (0.0%) |
| 35 to 44 Years | 82 (50.6%) | 0 (0.0%) |
| 45 to 54 Years | 211 (88.7%) | 35 (16.6%) |
| 55 to 59 Years | 54 (38.8%) | 0 (0.0%) |
| 60 to 64 Years | 19 (39.6%) | 0 (0.0%) |
| 65 to 74 Years | 0 (0.0%) | 0 (0.0%) |
| 75 Years and over | 0 (0.0%) | 0 (0.0%) |
| Total | 802 (52.4%) | 92 (11.5%) |
Employment Status by Educational Attainment in Unionville
According to labor force statistics for Unionville, 62.7% of individuals (660) out of the total population between 25 and 64 years of age (1,052) are in the labor force, with 5.3% or 35 of them being unemployed. The group with the highest labor force participation rate are those with the educational attainment of college / associate degree, with 72.9% or 156 individuals in the labor force. Within the labor force, individuals with college / associate degree education have the highest percentage of unemployment, with 22.4% or 35 of them being unemployed.
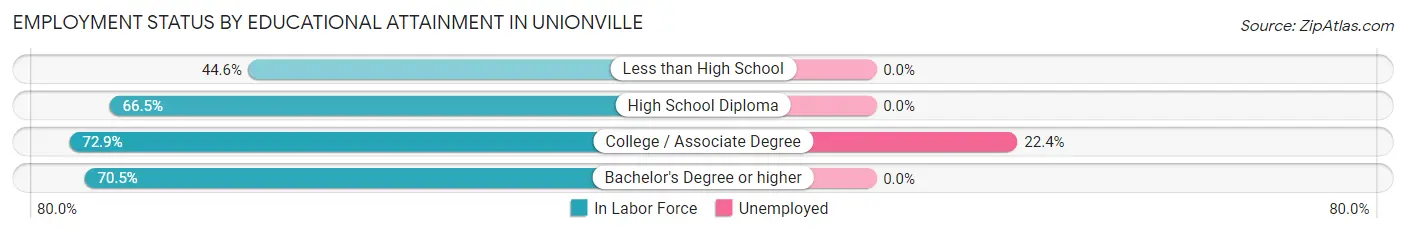
| Educational Attainment | In Labor Force | Unemployed |
| Less than High School | 112 (44.6%) | 0 (0.0%) |
| High School Diploma | 361 (66.5%) | 0 (0.0%) |
| College / Associate Degree | 156 (72.9%) | 48 (22.4%) |
| Bachelor's Degree or higher | 31 (70.5%) | 0 (0.0%) |
| Total | 660 (62.7%) | 56 (5.3%) |
Employment Occupations by Sex in Unionville
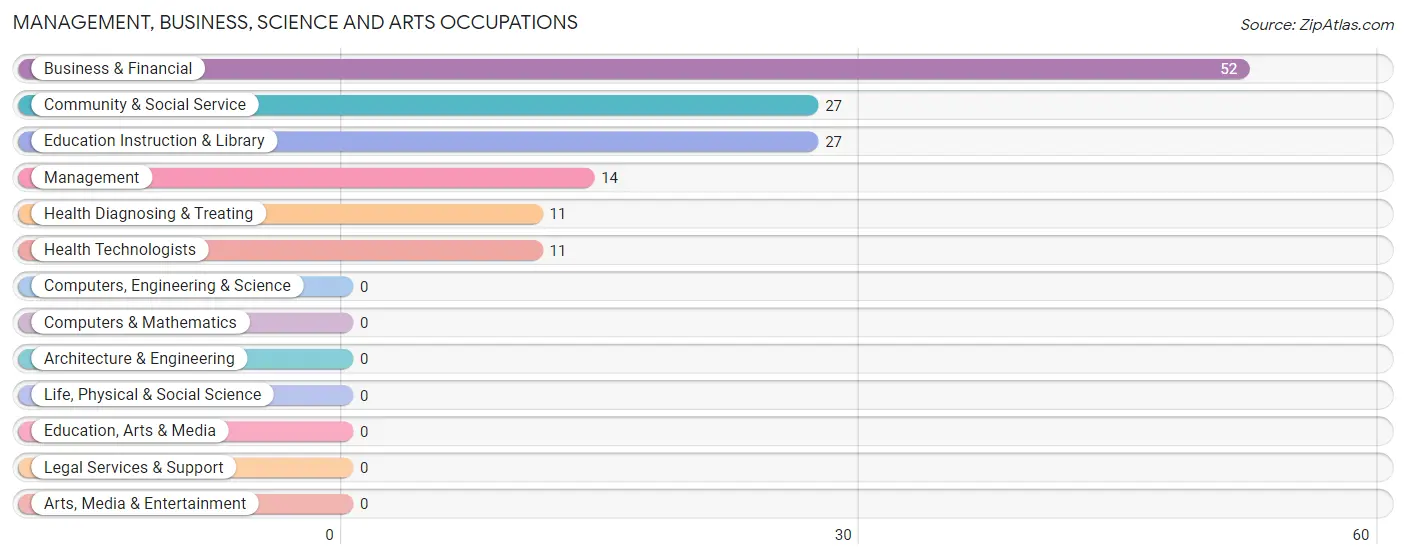
Management, Business, Science and Arts Occupations
The most common Management, Business, Science and Arts occupations in Unionville are Business & Financial (52 | 7.3%), Community & Social Service (27 | 3.8%), Education Instruction & Library (27 | 3.8%), Management (14 | 2.0%), and Health Diagnosing & Treating (11 | 1.5%).
Management, Business, Science and Arts Occupations by Sex
Within the Management, Business, Science and Arts occupations in Unionville, the most male-oriented occupations are Management (100.0%), and Business & Financial (100.0%), while the most female-oriented occupations are Community & Social Service (100.0%), Education Instruction & Library (100.0%), and Health Diagnosing & Treating (100.0%).
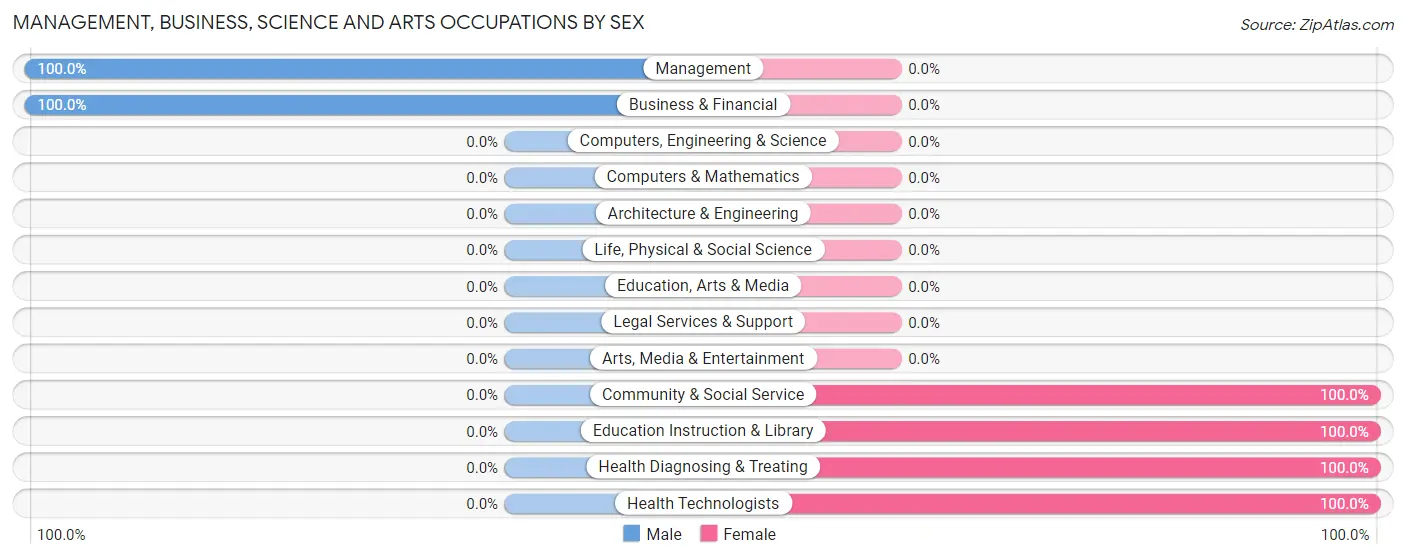
| Occupation | Male | Female |
| Management | 14 (100.0%) | 0 (0.0%) |
| Business & Financial | 52 (100.0%) | 0 (0.0%) |
| Computers, Engineering & Science | 0 (0.0%) | 0 (0.0%) |
| Computers & Mathematics | 0 (0.0%) | 0 (0.0%) |
| Architecture & Engineering | 0 (0.0%) | 0 (0.0%) |
| Life, Physical & Social Science | 0 (0.0%) | 0 (0.0%) |
| Community & Social Service | 0 (0.0%) | 27 (100.0%) |
| Education, Arts & Media | 0 (0.0%) | 0 (0.0%) |
| Legal Services & Support | 0 (0.0%) | 0 (0.0%) |
| Education Instruction & Library | 0 (0.0%) | 27 (100.0%) |
| Arts, Media & Entertainment | 0 (0.0%) | 0 (0.0%) |
| Health Diagnosing & Treating | 0 (0.0%) | 11 (100.0%) |
| Health Technologists | 0 (0.0%) | 11 (100.0%) |
| Total (Category) | 66 (63.5%) | 38 (36.5%) |
| Total (Overall) | 488 (68.7%) | 222 (31.3%) |
Services Occupations
The most common Services occupations in Unionville are Food Preparation & Serving (63 | 8.9%), Security & Protection (42 | 5.9%), Firefighting & Prevention (42 | 5.9%), Healthcare Support (27 | 3.8%), and Cleaning & Maintenance (10 | 1.4%).
Services Occupations by Sex
Within the Services occupations in Unionville, the most male-oriented occupations are Security & Protection (100.0%), Firefighting & Prevention (100.0%), and Cleaning & Maintenance (100.0%), while the most female-oriented occupations are Healthcare Support (100.0%), and Food Preparation & Serving (100.0%).
| Occupation | Male | Female |
| Healthcare Support | 0 (0.0%) | 27 (100.0%) |
| Security & Protection | 42 (100.0%) | 0 (0.0%) |
| Firefighting & Prevention | 42 (100.0%) | 0 (0.0%) |
| Law Enforcement | 0 (0.0%) | 0 (0.0%) |
| Food Preparation & Serving | 0 (0.0%) | 63 (100.0%) |
| Cleaning & Maintenance | 10 (100.0%) | 0 (0.0%) |
| Personal Care & Service | 0 (0.0%) | 0 (0.0%) |
| Total (Category) | 52 (36.6%) | 90 (63.4%) |
| Total (Overall) | 488 (68.7%) | 222 (31.3%) |
Sales and Office Occupations
The most common Sales and Office occupations in Unionville are Office & Administration (79 | 11.1%), and Sales & Related (23 | 3.2%).
Sales and Office Occupations by Sex
| Occupation | Male | Female |
| Sales & Related | 23 (100.0%) | 0 (0.0%) |
| Office & Administration | 25 (31.7%) | 54 (68.3%) |
| Total (Category) | 48 (47.1%) | 54 (52.9%) |
| Total (Overall) | 488 (68.7%) | 222 (31.3%) |
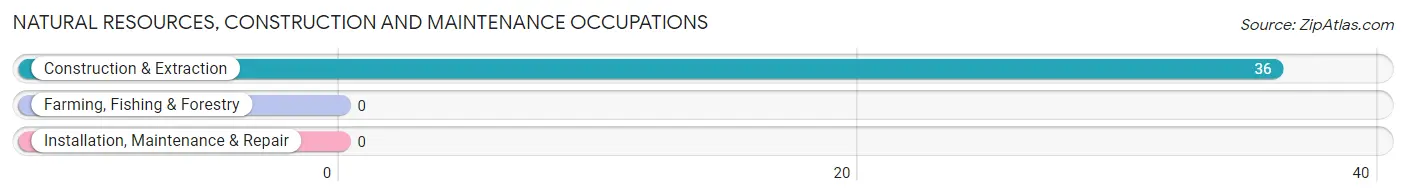
Natural Resources, Construction and Maintenance Occupations
The most common Natural Resources, Construction and Maintenance occupations in Unionville are , and Construction & Extraction (36 | 5.1%).
Natural Resources, Construction and Maintenance Occupations by Sex
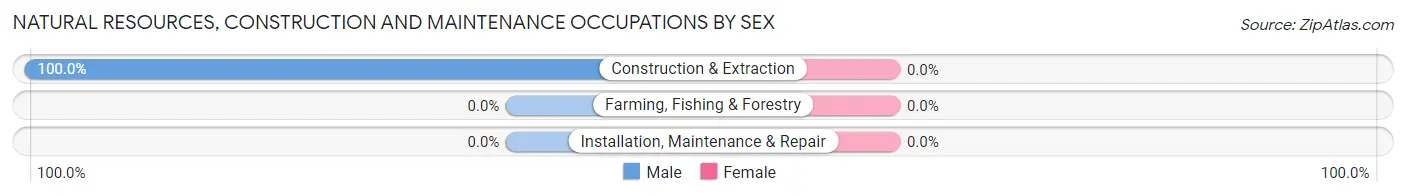
| Occupation | Male | Female |
| Farming, Fishing & Forestry | 0 (0.0%) | 0 (0.0%) |
| Construction & Extraction | 36 (100.0%) | 0 (0.0%) |
| Installation, Maintenance & Repair | 0 (0.0%) | 0 (0.0%) |
| Total (Category) | 36 (100.0%) | 0 (0.0%) |
| Total (Overall) | 488 (68.7%) | 222 (31.3%) |
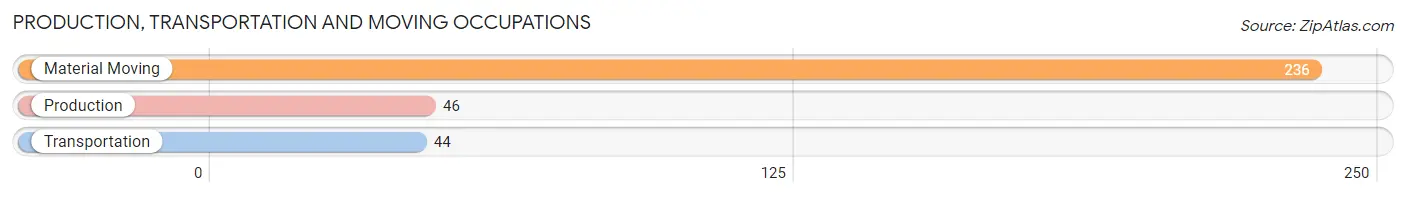
Production, Transportation and Moving Occupations
The most common Production, Transportation and Moving occupations in Unionville are Material Moving (236 | 33.2%), Production (46 | 6.5%), and Transportation (44 | 6.2%).
Production, Transportation and Moving Occupations by Sex
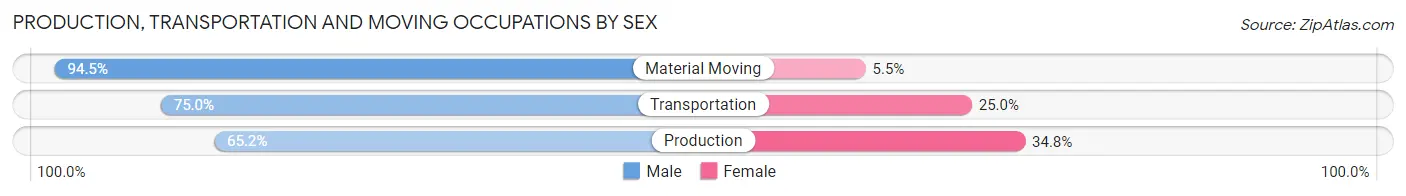
| Occupation | Male | Female |
| Production | 30 (65.2%) | 16 (34.8%) |
| Transportation | 33 (75.0%) | 11 (25.0%) |
| Material Moving | 223 (94.5%) | 13 (5.5%) |
| Total (Category) | 286 (87.7%) | 40 (12.3%) |
| Total (Overall) | 488 (68.7%) | 222 (31.3%) |
Employment Industries by Sex in Unionville
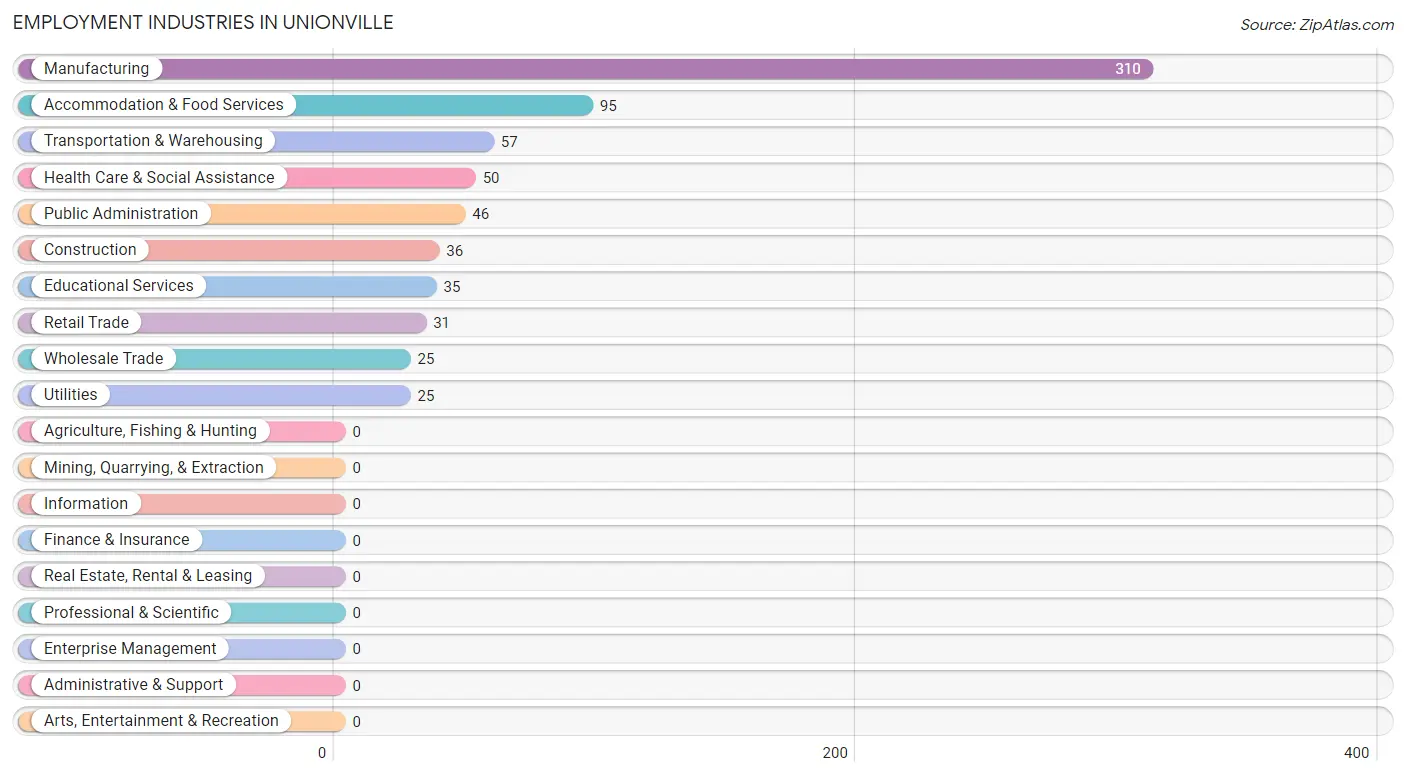
Employment Industries in Unionville
The major employment industries in Unionville include Manufacturing (310 | 43.7%), Accommodation & Food Services (95 | 13.4%), Transportation & Warehousing (57 | 8.0%), Health Care & Social Assistance (50 | 7.0%), and Public Administration (46 | 6.5%).
Employment Industries by Sex in Unionville
The Unionville industries that see more men than women are Construction (100.0%), Wholesale Trade (100.0%), and Utilities (100.0%), whereas the industries that tend to have a higher number of women are Educational Services (100.0%), Accommodation & Food Services (100.0%), and Health Care & Social Assistance (88.0%).
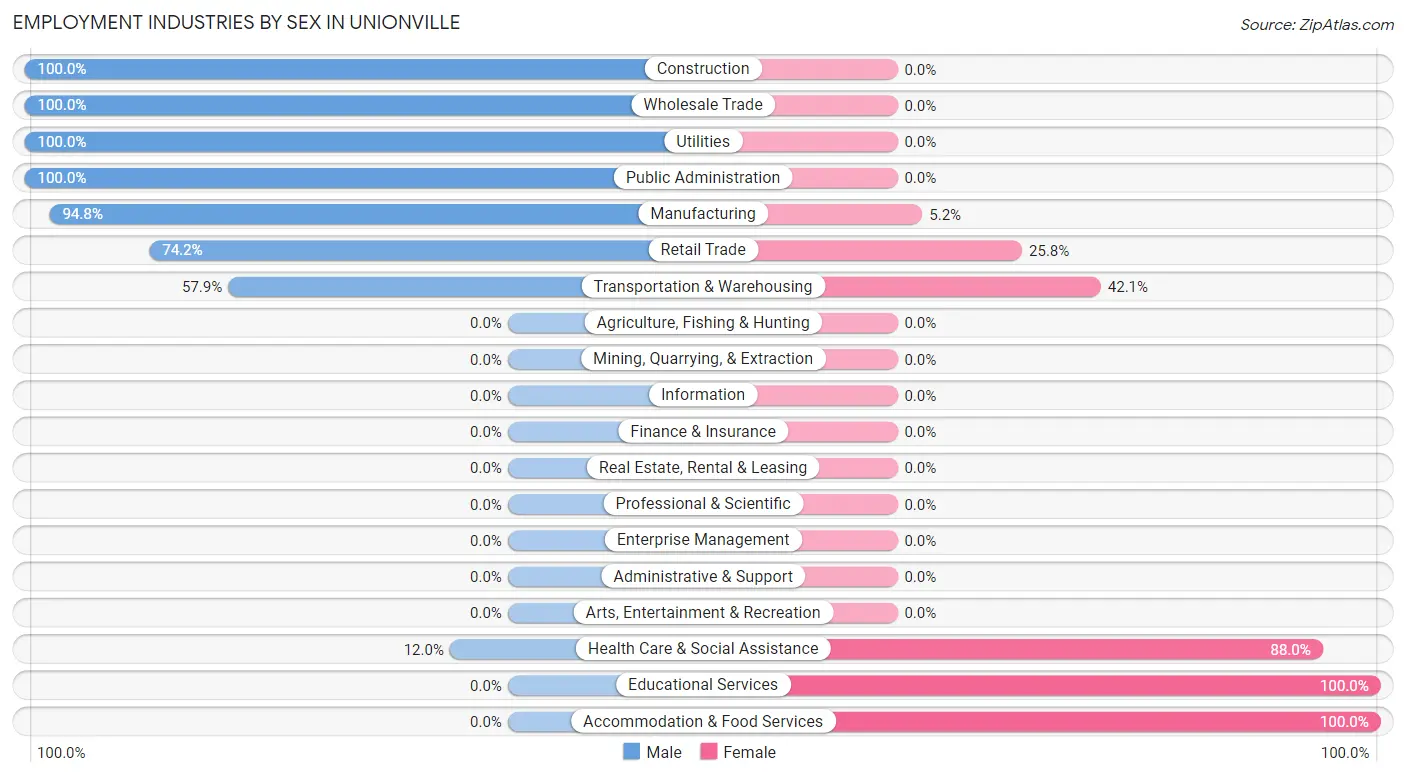
| Industry | Male | Female |
| Agriculture, Fishing & Hunting | 0 (0.0%) | 0 (0.0%) |
| Mining, Quarrying, & Extraction | 0 (0.0%) | 0 (0.0%) |
| Construction | 36 (100.0%) | 0 (0.0%) |
| Manufacturing | 294 (94.8%) | 16 (5.2%) |
| Wholesale Trade | 25 (100.0%) | 0 (0.0%) |
| Retail Trade | 23 (74.2%) | 8 (25.8%) |
| Transportation & Warehousing | 33 (57.9%) | 24 (42.1%) |
| Utilities | 25 (100.0%) | 0 (0.0%) |
| Information | 0 (0.0%) | 0 (0.0%) |
| Finance & Insurance | 0 (0.0%) | 0 (0.0%) |
| Real Estate, Rental & Leasing | 0 (0.0%) | 0 (0.0%) |
| Professional & Scientific | 0 (0.0%) | 0 (0.0%) |
| Enterprise Management | 0 (0.0%) | 0 (0.0%) |
| Administrative & Support | 0 (0.0%) | 0 (0.0%) |
| Educational Services | 0 (0.0%) | 35 (100.0%) |
| Health Care & Social Assistance | 6 (12.0%) | 44 (88.0%) |
| Arts, Entertainment & Recreation | 0 (0.0%) | 0 (0.0%) |
| Accommodation & Food Services | 0 (0.0%) | 95 (100.0%) |
| Public Administration | 46 (100.0%) | 0 (0.0%) |
| Total | 488 (68.7%) | 222 (31.3%) |
Education in Unionville
School Enrollment in Unionville
The most common levels of schooling among the 548 students in Unionville are middle school (192 | 35.0%), elementary school (159 | 29.0%), and high school (145 | 26.5%).
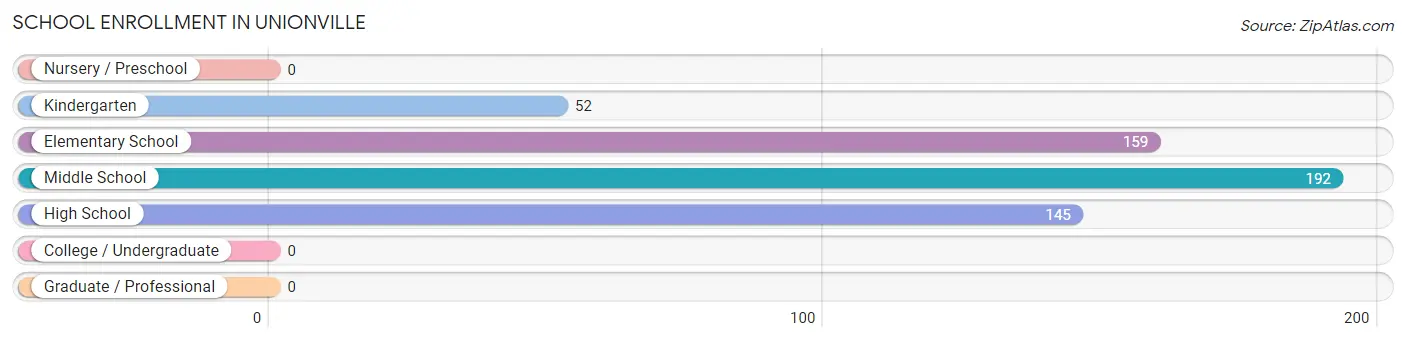
| School Level | # Students | % Students |
| Nursery / Preschool | 0 | 0.0% |
| Kindergarten | 52 | 9.5% |
| Elementary School | 159 | 29.0% |
| Middle School | 192 | 35.0% |
| High School | 145 | 26.5% |
| College / Undergraduate | 0 | 0.0% |
| Graduate / Professional | 0 | 0.0% |
| Total | 548 | 100.0% |
School Enrollment by Age by Funding Source in Unionville
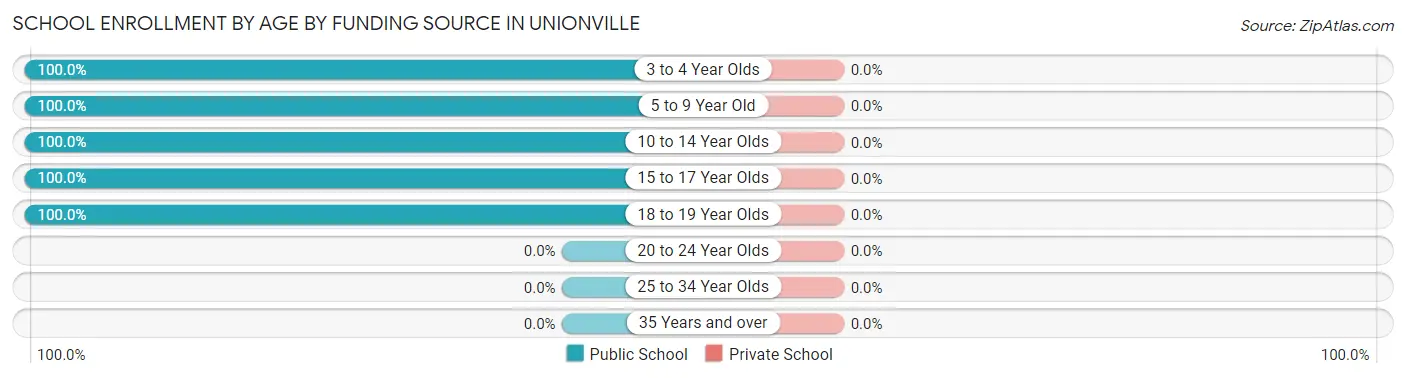
| Age Bracket | Public School | Private School |
| 3 to 4 Year Olds | 52 (100.0%) | 0 (0.0%) |
| 5 to 9 Year Old | 87 (100.0%) | 0 (0.0%) |
| 10 to 14 Year Olds | 264 (100.0%) | 0 (0.0%) |
| 15 to 17 Year Olds | 107 (100.0%) | 0 (0.0%) |
| 18 to 19 Year Olds | 38 (100.0%) | 0 (0.0%) |
| 20 to 24 Year Olds | 0 (0.0%) | 0 (0.0%) |
| 25 to 34 Year Olds | 0 (0.0%) | 0 (0.0%) |
| 35 Years and over | 0 (0.0%) | 0 (0.0%) |
| Total | 548 (100.0%) | 0 (0.0%) |
Educational Attainment by Field of Study in Unionville
Education (24 | 46.2%), business (14 | 26.9%), and liberal arts & history (14 | 26.9%) are the most common fields of study among 52 individuals in Unionville who have obtained a bachelor's degree or higher.
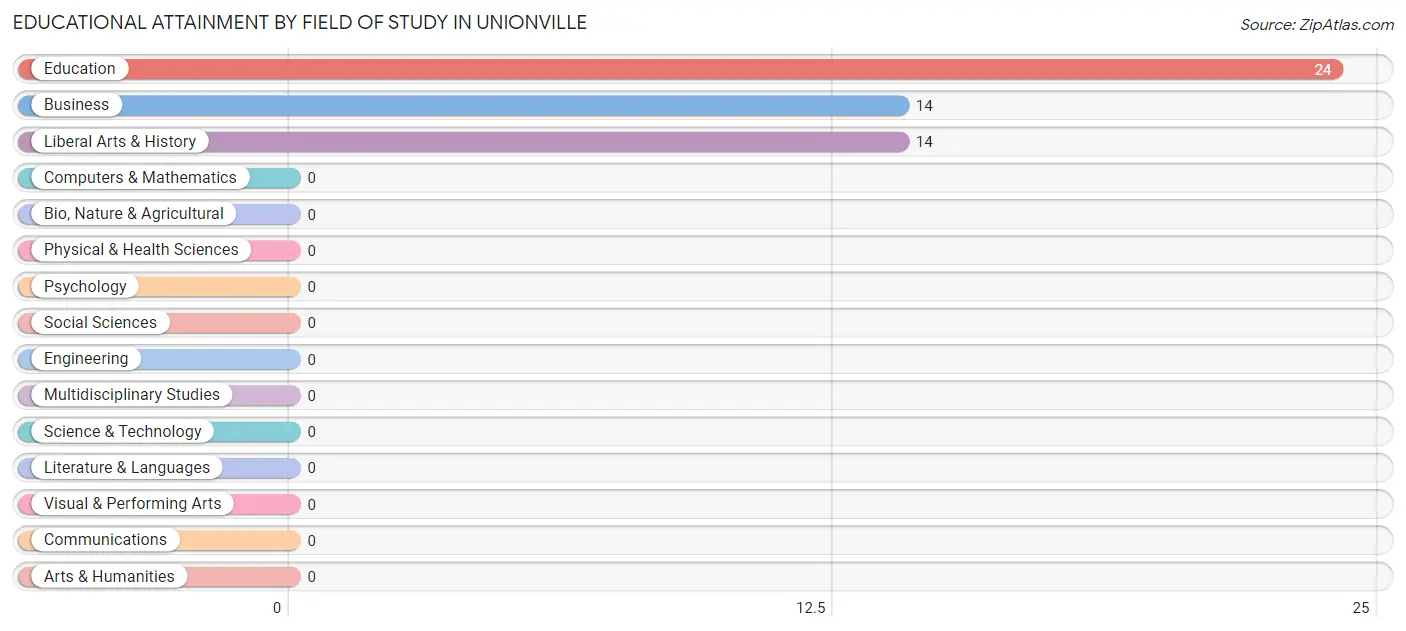
| Field of Study | # Graduates | % Graduates |
| Computers & Mathematics | 0 | 0.0% |
| Bio, Nature & Agricultural | 0 | 0.0% |
| Physical & Health Sciences | 0 | 0.0% |
| Psychology | 0 | 0.0% |
| Social Sciences | 0 | 0.0% |
| Engineering | 0 | 0.0% |
| Multidisciplinary Studies | 0 | 0.0% |
| Science & Technology | 0 | 0.0% |
| Business | 14 | 26.9% |
| Education | 24 | 46.2% |
| Literature & Languages | 0 | 0.0% |
| Liberal Arts & History | 14 | 26.9% |
| Visual & Performing Arts | 0 | 0.0% |
| Communications | 0 | 0.0% |
| Arts & Humanities | 0 | 0.0% |
| Total | 52 | 100.0% |
Transportation & Commute in Unionville
Vehicle Availability by Sex in Unionville
The most prevalent vehicle ownership categories in Unionville are males with 1 vehicle (208, accounting for 42.6%) and females with 1 vehicle (88, making up 93.7%).
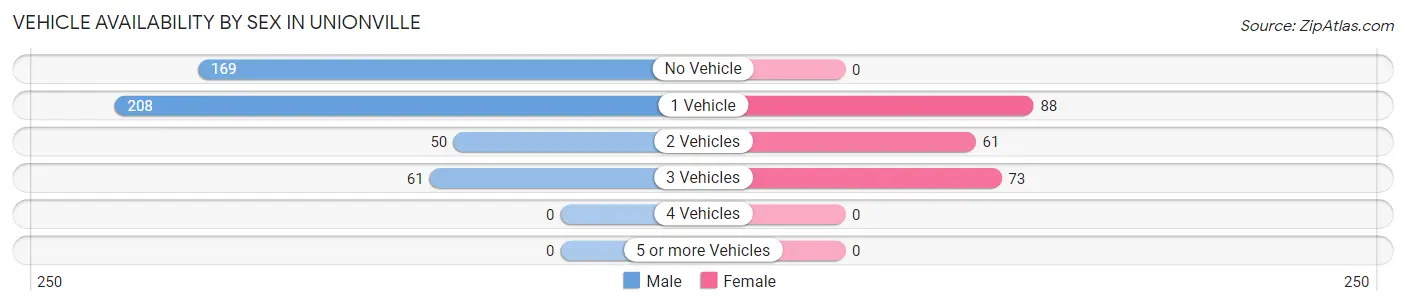
| Vehicles Available | Male | Female |
| No Vehicle | 169 (34.6%) | 0 (0.0%) |
| 1 Vehicle | 208 (42.6%) | 88 (39.6%) |
| 2 Vehicles | 50 (10.2%) | 61 (27.5%) |
| 3 Vehicles | 61 (12.5%) | 73 (32.9%) |
| 4 Vehicles | 0 (0.0%) | 0 (0.0%) |
| 5 or more Vehicles | 0 (0.0%) | 0 (0.0%) |
| Total | 488 (100.0%) | 222 (100.0%) |
Commute Time in Unionville
The most frequently occuring commute durations in Unionville are 15 to 19 minutes (197 commuters, 27.8%), 60 to 89 minutes (169 commuters, 23.8%), and 5 to 9 minutes (94 commuters, 13.2%).
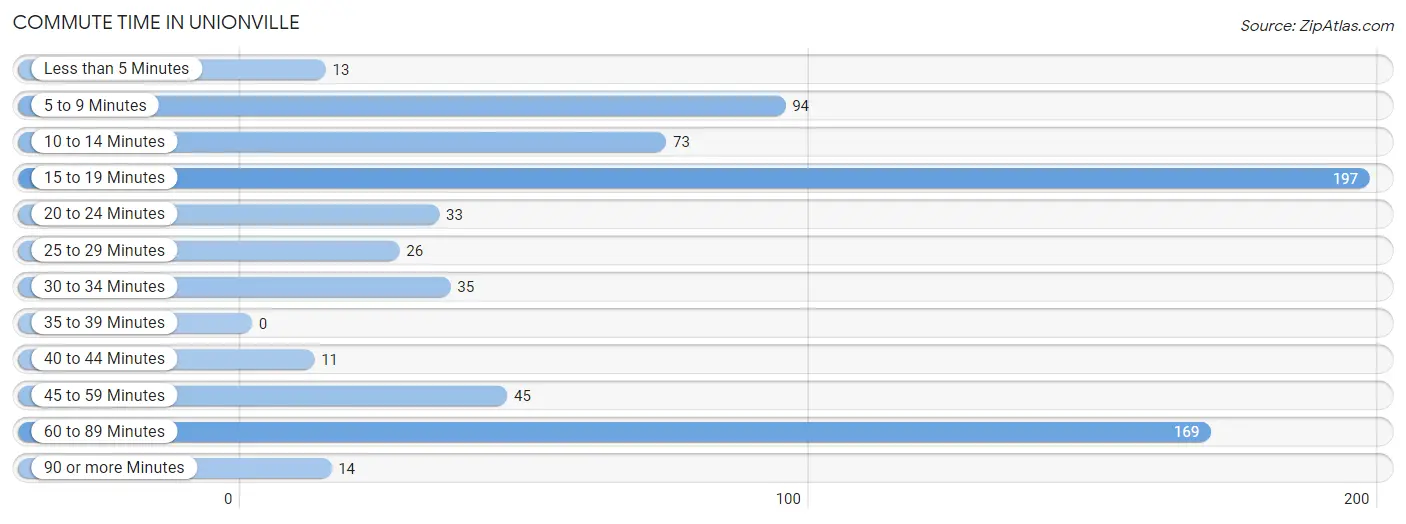
| Commute Time | # Commuters | % Commuters |
| Less than 5 Minutes | 13 | 1.8% |
| 5 to 9 Minutes | 94 | 13.2% |
| 10 to 14 Minutes | 73 | 10.3% |
| 15 to 19 Minutes | 197 | 27.8% |
| 20 to 24 Minutes | 33 | 4.6% |
| 25 to 29 Minutes | 26 | 3.7% |
| 30 to 34 Minutes | 35 | 4.9% |
| 35 to 39 Minutes | 0 | 0.0% |
| 40 to 44 Minutes | 11 | 1.5% |
| 45 to 59 Minutes | 45 | 6.3% |
| 60 to 89 Minutes | 169 | 23.8% |
| 90 or more Minutes | 14 | 2.0% |
Commute Time by Sex in Unionville
The most common commute times in Unionville are 60 to 89 minutes (169 commuters, 34.6%) for males and 15 to 19 minutes (125 commuters, 56.3%) for females.
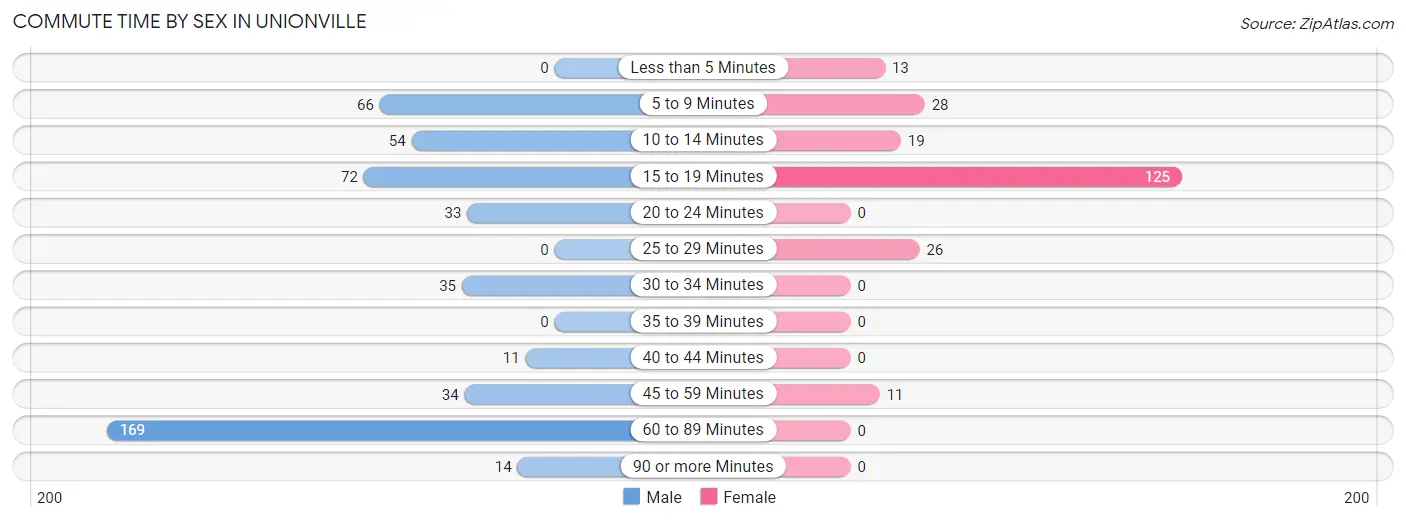
| Commute Time | Male | Female |
| Less than 5 Minutes | 0 (0.0%) | 13 (5.9%) |
| 5 to 9 Minutes | 66 (13.5%) | 28 (12.6%) |
| 10 to 14 Minutes | 54 (11.1%) | 19 (8.6%) |
| 15 to 19 Minutes | 72 (14.7%) | 125 (56.3%) |
| 20 to 24 Minutes | 33 (6.8%) | 0 (0.0%) |
| 25 to 29 Minutes | 0 (0.0%) | 26 (11.7%) |
| 30 to 34 Minutes | 35 (7.2%) | 0 (0.0%) |
| 35 to 39 Minutes | 0 (0.0%) | 0 (0.0%) |
| 40 to 44 Minutes | 11 (2.2%) | 0 (0.0%) |
| 45 to 59 Minutes | 34 (7.0%) | 11 (5.0%) |
| 60 to 89 Minutes | 169 (34.6%) | 0 (0.0%) |
| 90 or more Minutes | 14 (2.9%) | 0 (0.0%) |
Time of Departure to Work by Sex in Unionville
The most frequent times of departure to work in Unionville are 12:00 AM to 4:59 AM (183, 37.5%) for males and 6:30 AM to 6:59 AM (88, 39.6%) for females.
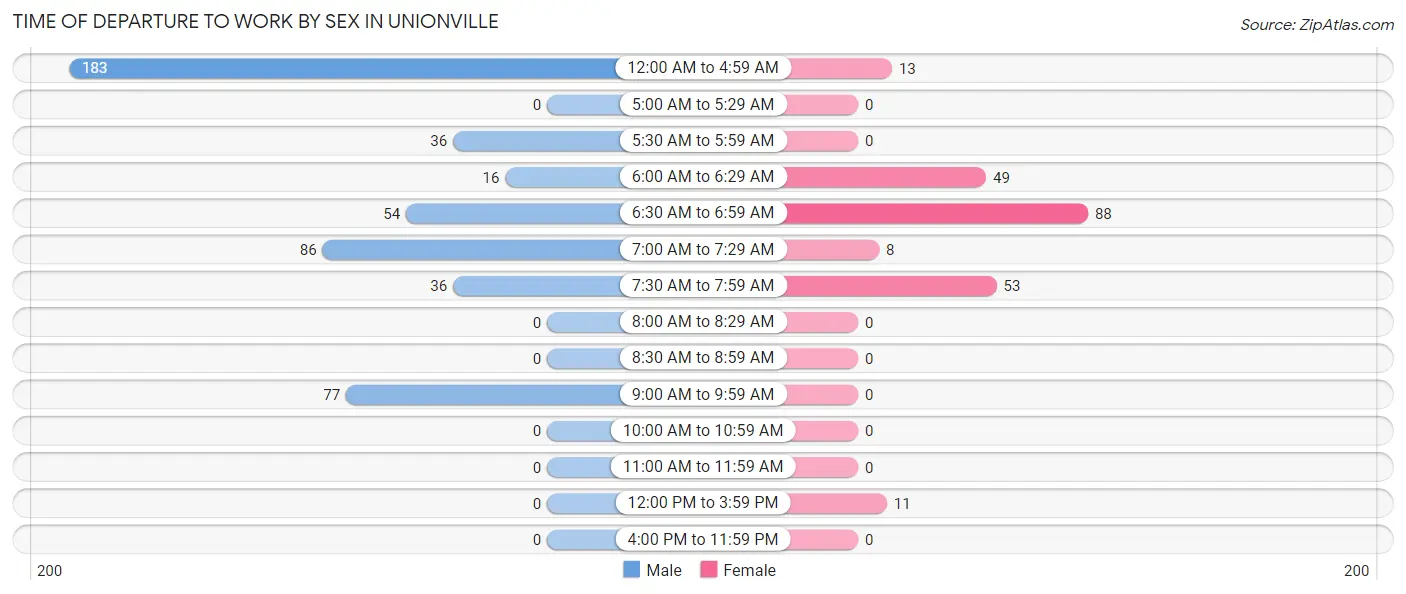
| Time of Departure | Male | Female |
| 12:00 AM to 4:59 AM | 183 (37.5%) | 13 (5.9%) |
| 5:00 AM to 5:29 AM | 0 (0.0%) | 0 (0.0%) |
| 5:30 AM to 5:59 AM | 36 (7.4%) | 0 (0.0%) |
| 6:00 AM to 6:29 AM | 16 (3.3%) | 49 (22.1%) |
| 6:30 AM to 6:59 AM | 54 (11.1%) | 88 (39.6%) |
| 7:00 AM to 7:29 AM | 86 (17.6%) | 8 (3.6%) |
| 7:30 AM to 7:59 AM | 36 (7.4%) | 53 (23.9%) |
| 8:00 AM to 8:29 AM | 0 (0.0%) | 0 (0.0%) |
| 8:30 AM to 8:59 AM | 0 (0.0%) | 0 (0.0%) |
| 9:00 AM to 9:59 AM | 77 (15.8%) | 0 (0.0%) |
| 10:00 AM to 10:59 AM | 0 (0.0%) | 0 (0.0%) |
| 11:00 AM to 11:59 AM | 0 (0.0%) | 0 (0.0%) |
| 12:00 PM to 3:59 PM | 0 (0.0%) | 11 (5.0%) |
| 4:00 PM to 11:59 PM | 0 (0.0%) | 0 (0.0%) |
| Total | 488 (100.0%) | 222 (100.0%) |
Housing Occupancy in Unionville
Occupancy by Ownership in Unionville
Of the total 635 dwellings in Unionville, owner-occupied units account for 396 (62.4%), while renter-occupied units make up 239 (37.6%).
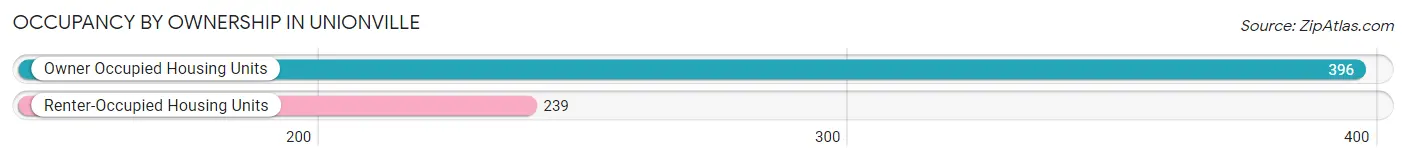
| Occupancy | # Housing Units | % Housing Units |
| Owner Occupied Housing Units | 396 | 62.4% |
| Renter-Occupied Housing Units | 239 | 37.6% |
| Total Occupied Housing Units | 635 | 100.0% |
Occupancy by Household Size in Unionville
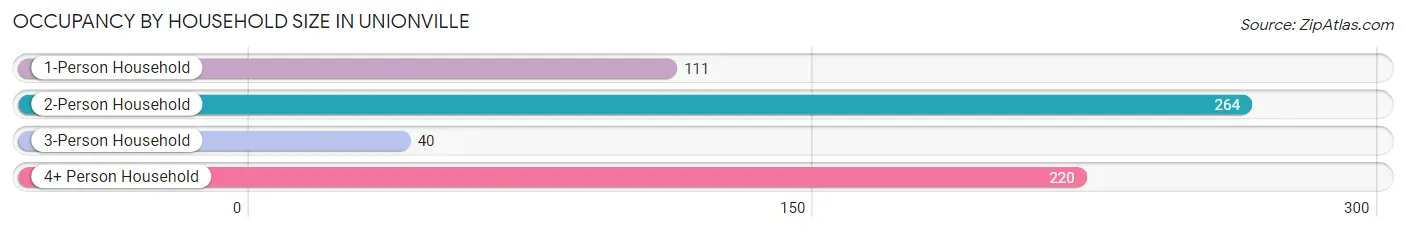
| Household Size | # Housing Units | % Housing Units |
| 1-Person Household | 111 | 17.5% |
| 2-Person Household | 264 | 41.6% |
| 3-Person Household | 40 | 6.3% |
| 4+ Person Household | 220 | 34.6% |
| Total Housing Units | 635 | 100.0% |
Occupancy by Ownership by Household Size in Unionville
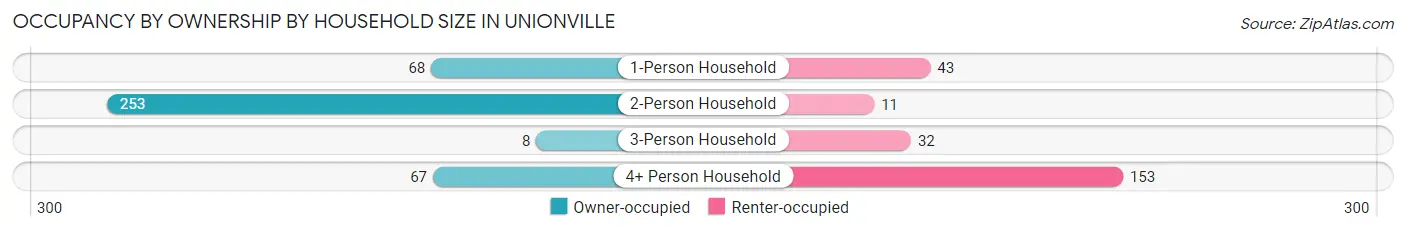
| Household Size | Owner-occupied | Renter-occupied |
| 1-Person Household | 68 (61.3%) | 43 (38.7%) |
| 2-Person Household | 253 (95.8%) | 11 (4.2%) |
| 3-Person Household | 8 (20.0%) | 32 (80.0%) |
| 4+ Person Household | 67 (30.4%) | 153 (69.6%) |
| Total Housing Units | 396 (62.4%) | 239 (37.6%) |
Occupancy by Educational Attainment in Unionville
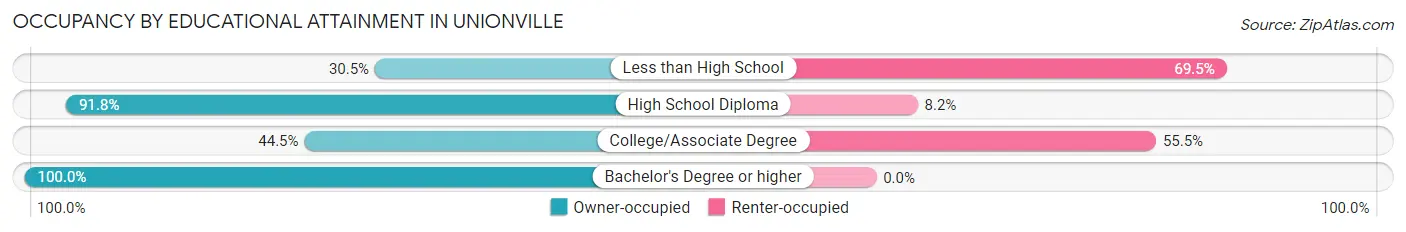
| Household Size | Owner-occupied | Renter-occupied |
| Less than High School | 62 (30.5%) | 141 (69.5%) |
| High School Diploma | 246 (91.8%) | 22 (8.2%) |
| College/Associate Degree | 61 (44.5%) | 76 (55.5%) |
| Bachelor's Degree or higher | 27 (100.0%) | 0 (0.0%) |
Occupancy by Age of Householder in Unionville
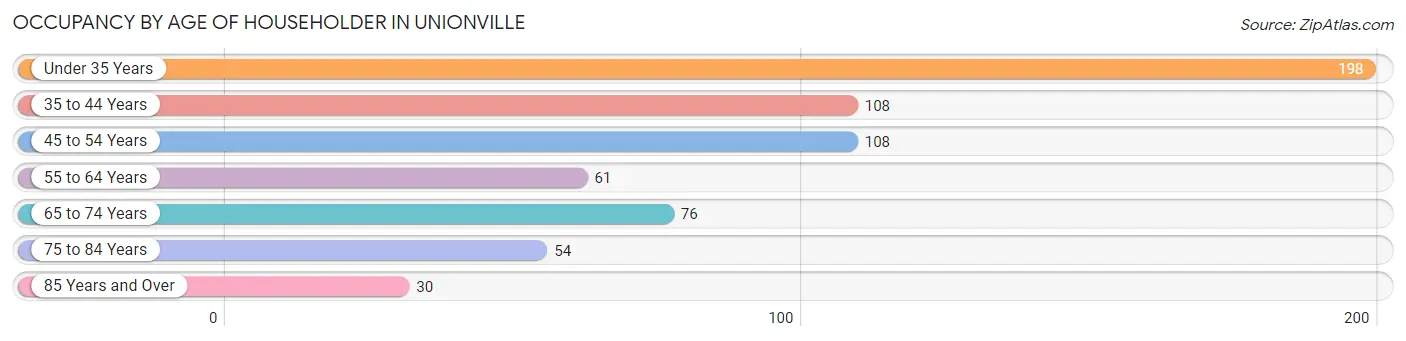
| Age Bracket | # Households | % Households |
| Under 35 Years | 198 | 31.2% |
| 35 to 44 Years | 108 | 17.0% |
| 45 to 54 Years | 108 | 17.0% |
| 55 to 64 Years | 61 | 9.6% |
| 65 to 74 Years | 76 | 12.0% |
| 75 to 84 Years | 54 | 8.5% |
| 85 Years and Over | 30 | 4.7% |
| Total | 635 | 100.0% |
Housing Finances in Unionville
Median Income by Occupancy in Unionville
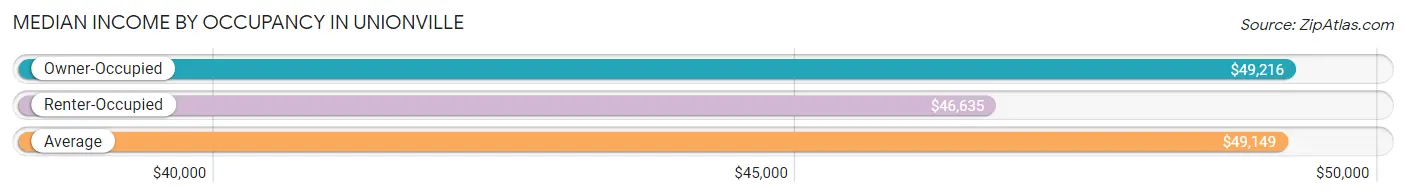
| Occupancy Type | # Households | Median Income |
| Owner-Occupied | 396 (62.4%) | $49,216 |
| Renter-Occupied | 239 (37.6%) | $46,635 |
| Average | 635 (100.0%) | $49,149 |
Occupancy by Householder Income Bracket in Unionville
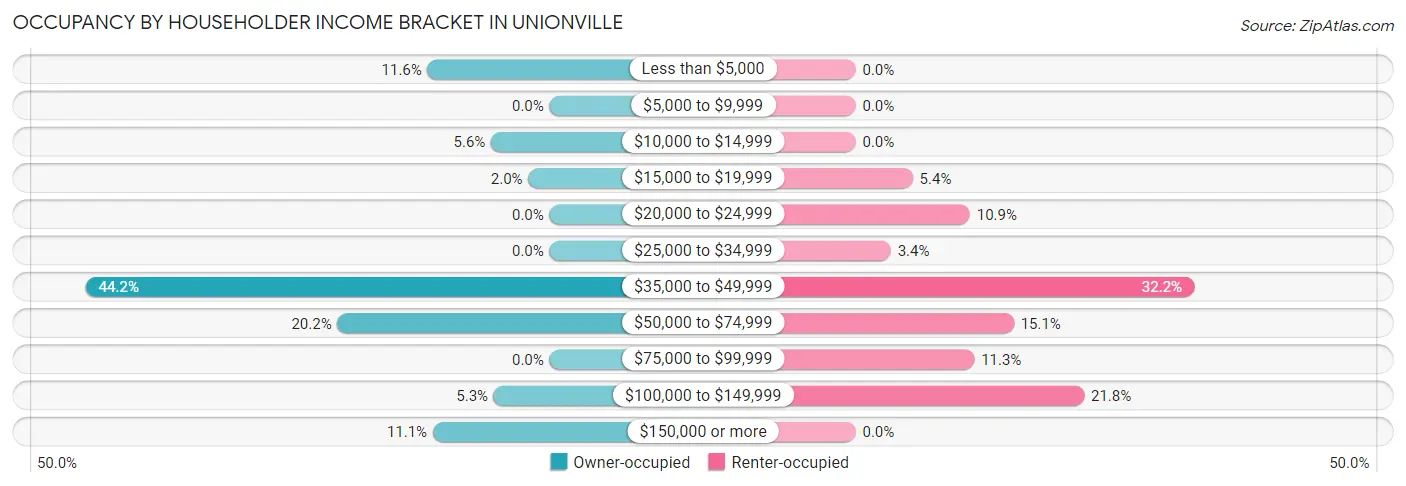
| Income Bracket | Owner-occupied | Renter-occupied |
| Less than $5,000 | 46 (11.6%) | 0 (0.0%) |
| $5,000 to $9,999 | 0 (0.0%) | 0 (0.0%) |
| $10,000 to $14,999 | 22 (5.6%) | 0 (0.0%) |
| $15,000 to $19,999 | 8 (2.0%) | 13 (5.4%) |
| $20,000 to $24,999 | 0 (0.0%) | 26 (10.9%) |
| $25,000 to $34,999 | 0 (0.0%) | 8 (3.4%) |
| $35,000 to $49,999 | 175 (44.2%) | 77 (32.2%) |
| $50,000 to $74,999 | 80 (20.2%) | 36 (15.1%) |
| $75,000 to $99,999 | 0 (0.0%) | 27 (11.3%) |
| $100,000 to $149,999 | 21 (5.3%) | 52 (21.8%) |
| $150,000 or more | 44 (11.1%) | 0 (0.0%) |
| Total | 396 (100.0%) | 239 (100.0%) |
Monthly Housing Cost Tiers in Unionville
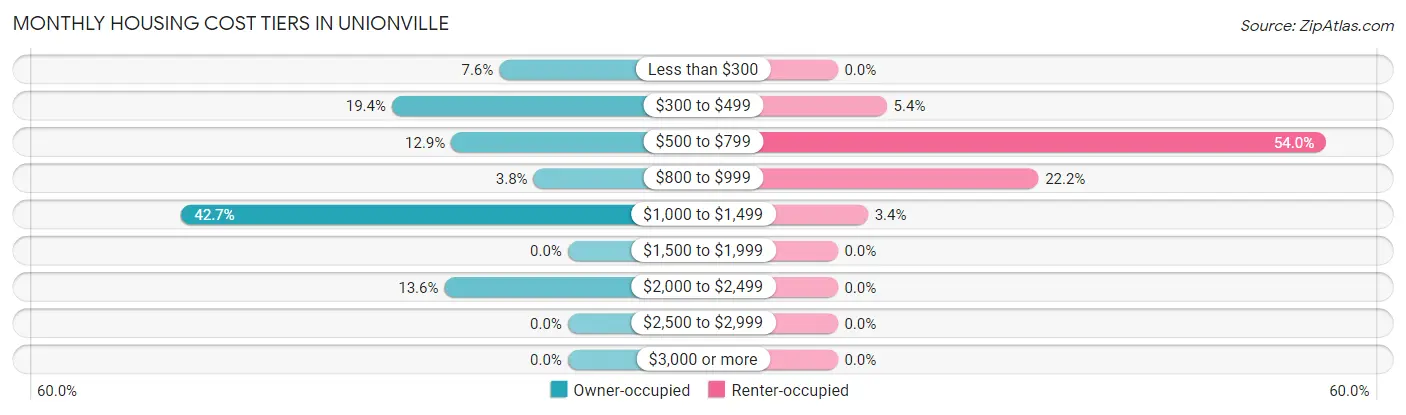
| Monthly Cost | Owner-occupied | Renter-occupied |
| Less than $300 | 30 (7.6%) | 0 (0.0%) |
| $300 to $499 | 77 (19.4%) | 13 (5.4%) |
| $500 to $799 | 51 (12.9%) | 129 (54.0%) |
| $800 to $999 | 15 (3.8%) | 53 (22.2%) |
| $1,000 to $1,499 | 169 (42.7%) | 8 (3.4%) |
| $1,500 to $1,999 | 0 (0.0%) | 0 (0.0%) |
| $2,000 to $2,499 | 54 (13.6%) | 0 (0.0%) |
| $2,500 to $2,999 | 0 (0.0%) | 0 (0.0%) |
| $3,000 or more | 0 (0.0%) | 0 (0.0%) |
| Total | 396 (100.0%) | 239 (100.0%) |
Physical Housing Characteristics in Unionville
Housing Structures in Unionville
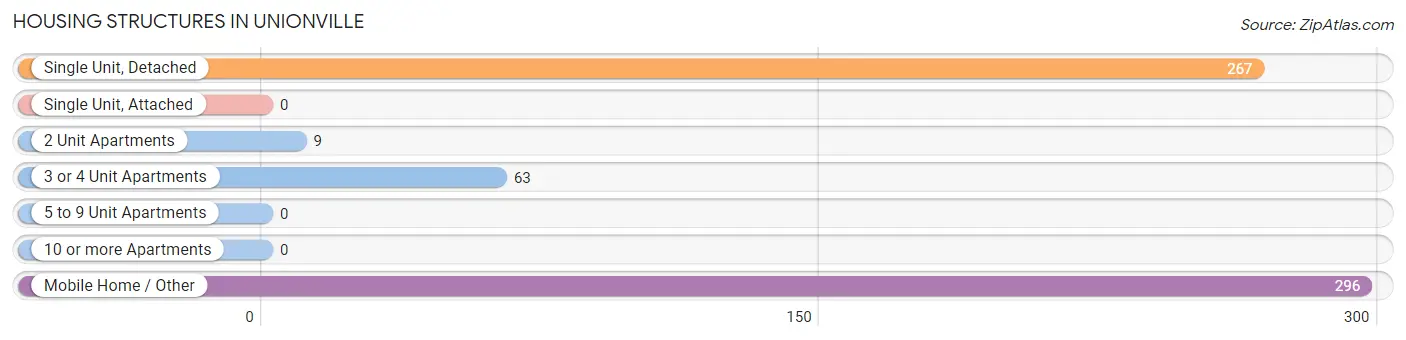
| Structure Type | # Housing Units | % Housing Units |
| Single Unit, Detached | 267 | 42.0% |
| Single Unit, Attached | 0 | 0.0% |
| 2 Unit Apartments | 9 | 1.4% |
| 3 or 4 Unit Apartments | 63 | 9.9% |
| 5 to 9 Unit Apartments | 0 | 0.0% |
| 10 or more Apartments | 0 | 0.0% |
| Mobile Home / Other | 296 | 46.6% |
| Total | 635 | 100.0% |
Housing Structures by Occupancy in Unionville
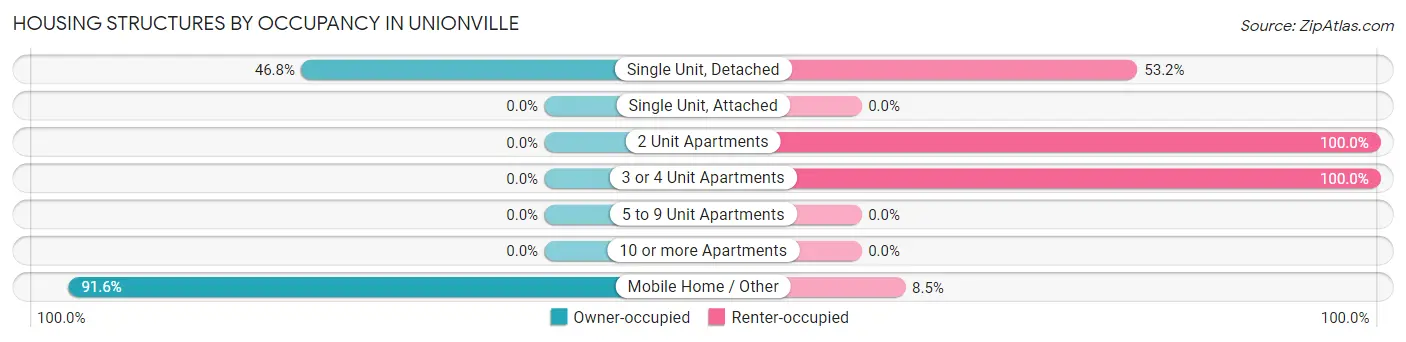
| Structure Type | Owner-occupied | Renter-occupied |
| Single Unit, Detached | 125 (46.8%) | 142 (53.2%) |
| Single Unit, Attached | 0 (0.0%) | 0 (0.0%) |
| 2 Unit Apartments | 0 (0.0%) | 9 (100.0%) |
| 3 or 4 Unit Apartments | 0 (0.0%) | 63 (100.0%) |
| 5 to 9 Unit Apartments | 0 (0.0%) | 0 (0.0%) |
| 10 or more Apartments | 0 (0.0%) | 0 (0.0%) |
| Mobile Home / Other | 271 (91.5%) | 25 (8.5%) |
| Total | 396 (62.4%) | 239 (37.6%) |
Housing Structures by Number of Rooms in Unionville
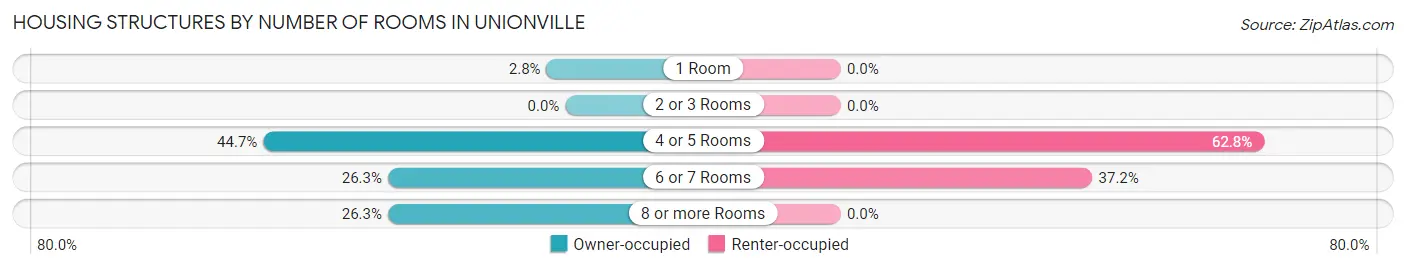
| Number of Rooms | Owner-occupied | Renter-occupied |
| 1 Room | 11 (2.8%) | 0 (0.0%) |
| 2 or 3 Rooms | 0 (0.0%) | 0 (0.0%) |
| 4 or 5 Rooms | 177 (44.7%) | 150 (62.8%) |
| 6 or 7 Rooms | 104 (26.3%) | 89 (37.2%) |
| 8 or more Rooms | 104 (26.3%) | 0 (0.0%) |
| Total | 396 (100.0%) | 239 (100.0%) |
Housing Structure by Heating Type in Unionville
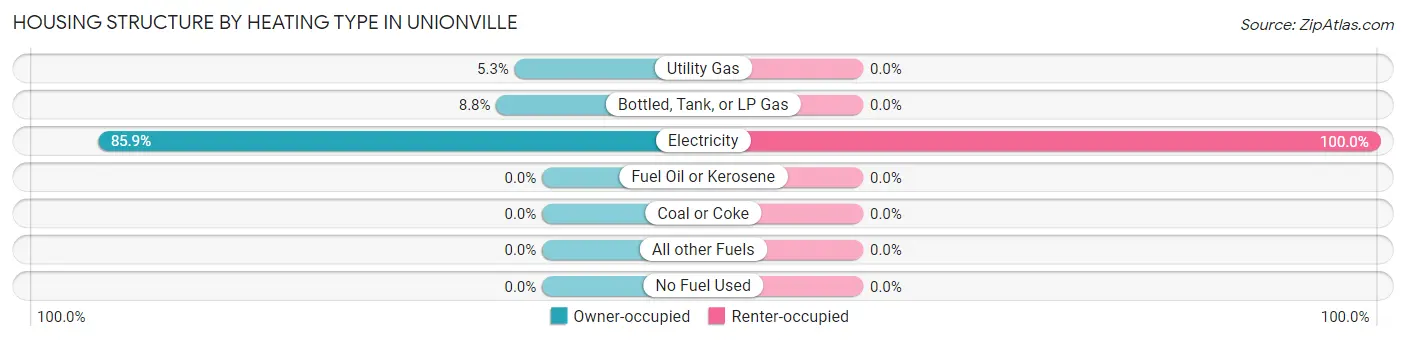
| Heating Type | Owner-occupied | Renter-occupied |
| Utility Gas | 21 (5.3%) | 0 (0.0%) |
| Bottled, Tank, or LP Gas | 35 (8.8%) | 0 (0.0%) |
| Electricity | 340 (85.9%) | 239 (100.0%) |
| Fuel Oil or Kerosene | 0 (0.0%) | 0 (0.0%) |
| Coal or Coke | 0 (0.0%) | 0 (0.0%) |
| All other Fuels | 0 (0.0%) | 0 (0.0%) |
| No Fuel Used | 0 (0.0%) | 0 (0.0%) |
| Total | 396 (100.0%) | 239 (100.0%) |
Household Vehicle Usage in Unionville
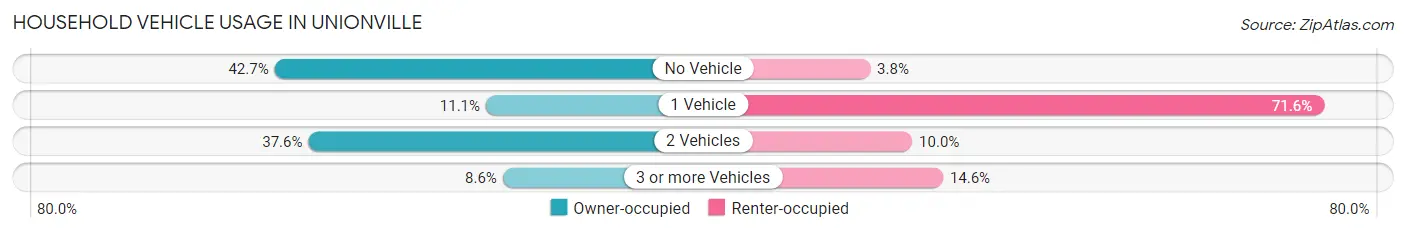
| Vehicles per Household | Owner-occupied | Renter-occupied |
| No Vehicle | 169 (42.7%) | 9 (3.8%) |
| 1 Vehicle | 44 (11.1%) | 171 (71.6%) |
| 2 Vehicles | 149 (37.6%) | 24 (10.0%) |
| 3 or more Vehicles | 34 (8.6%) | 35 (14.6%) |
| Total | 396 (100.0%) | 239 (100.0%) |
Real Estate & Mortgages in Unionville
Real Estate and Mortgage Overview in Unionville
| Characteristic | Without Mortgage | With Mortgage |
| Housing Units | 128 | 268 |
| Median Property Value | - | - |
| Median Household Income | - | - |
| Monthly Housing Costs | $371 | $0 |
| Real Estate Taxes | - | - |
Property Value by Mortgage Status in Unionville
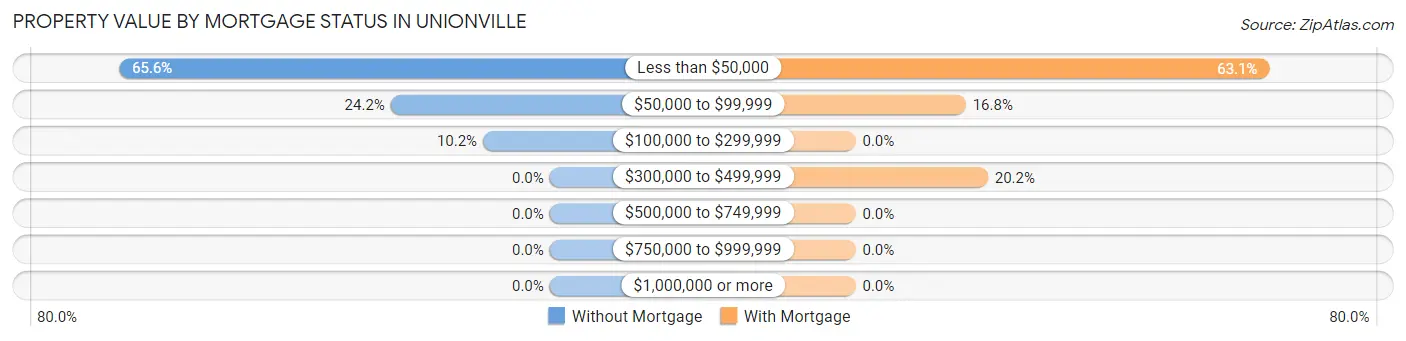
| Property Value | Without Mortgage | With Mortgage |
| Less than $50,000 | 84 (65.6%) | 169 (63.1%) |
| $50,000 to $99,999 | 31 (24.2%) | 45 (16.8%) |
| $100,000 to $299,999 | 13 (10.2%) | 0 (0.0%) |
| $300,000 to $499,999 | 0 (0.0%) | 54 (20.2%) |
| $500,000 to $749,999 | 0 (0.0%) | 0 (0.0%) |
| $750,000 to $999,999 | 0 (0.0%) | 0 (0.0%) |
| $1,000,000 or more | 0 (0.0%) | 0 (0.0%) |
| Total | 128 (100.0%) | 268 (100.0%) |
Household Income by Mortgage Status in Unionville
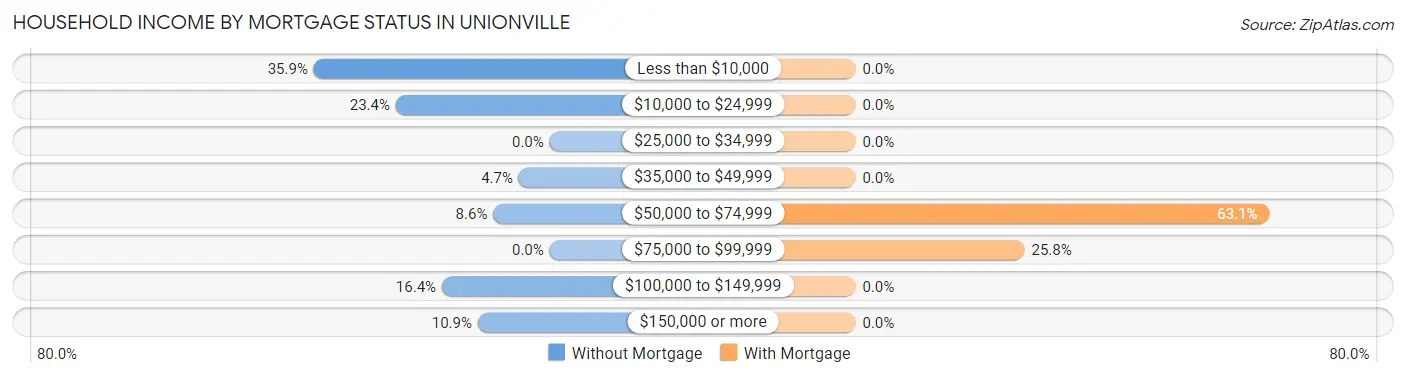
| Household Income | Without Mortgage | With Mortgage |
| Less than $10,000 | 46 (35.9%) | 0 (0.0%) |
| $10,000 to $24,999 | 30 (23.4%) | 0 (0.0%) |
| $25,000 to $34,999 | 0 (0.0%) | 0 (0.0%) |
| $35,000 to $49,999 | 6 (4.7%) | 0 (0.0%) |
| $50,000 to $74,999 | 11 (8.6%) | 169 (63.1%) |
| $75,000 to $99,999 | 0 (0.0%) | 69 (25.8%) |
| $100,000 to $149,999 | 21 (16.4%) | 0 (0.0%) |
| $150,000 or more | 14 (10.9%) | 0 (0.0%) |
| Total | 128 (100.0%) | 268 (100.0%) |
Property Value to Household Income Ratio in Unionville
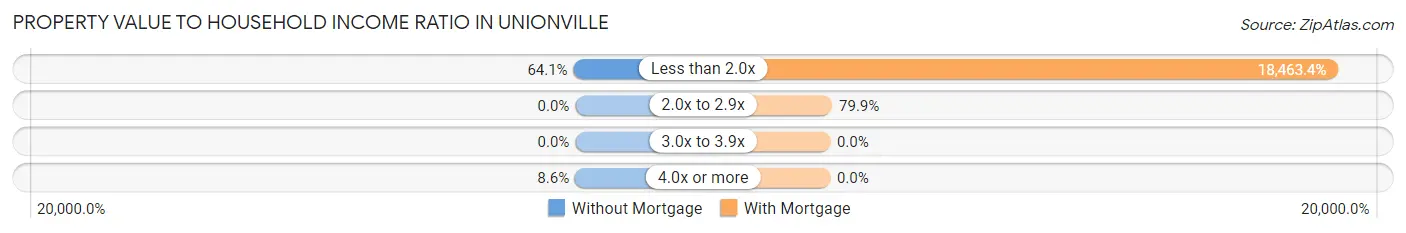
| Value-to-Income Ratio | Without Mortgage | With Mortgage |
| Less than 2.0x | 82 (64.1%) | 49,482 (18,463.4%) |
| 2.0x to 2.9x | 0 (0.0%) | 214 (79.8%) |
| 3.0x to 3.9x | 0 (0.0%) | 0 (0.0%) |
| 4.0x or more | 11 (8.6%) | 0 (0.0%) |
| Total | 128 (100.0%) | 268 (100.0%) |
Real Estate Taxes by Mortgage Status in Unionville
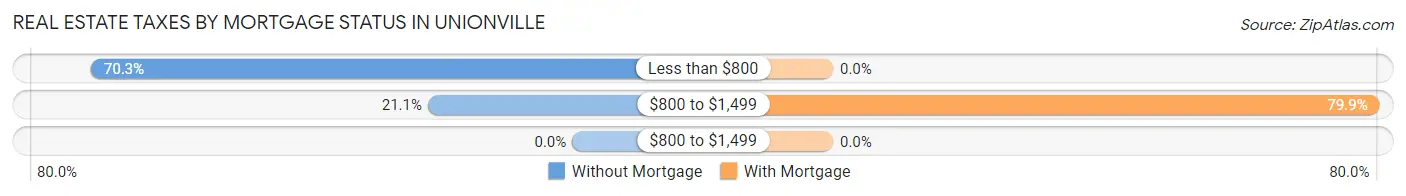
| Property Taxes | Without Mortgage | With Mortgage |
| Less than $800 | 90 (70.3%) | 0 (0.0%) |
| $800 to $1,499 | 27 (21.1%) | 214 (79.8%) |
| $800 to $1,499 | 0 (0.0%) | 0 (0.0%) |
| Total | 128 (100.0%) | 268 (100.0%) |
Health & Disability in Unionville
Health Insurance Coverage by Age in Unionville
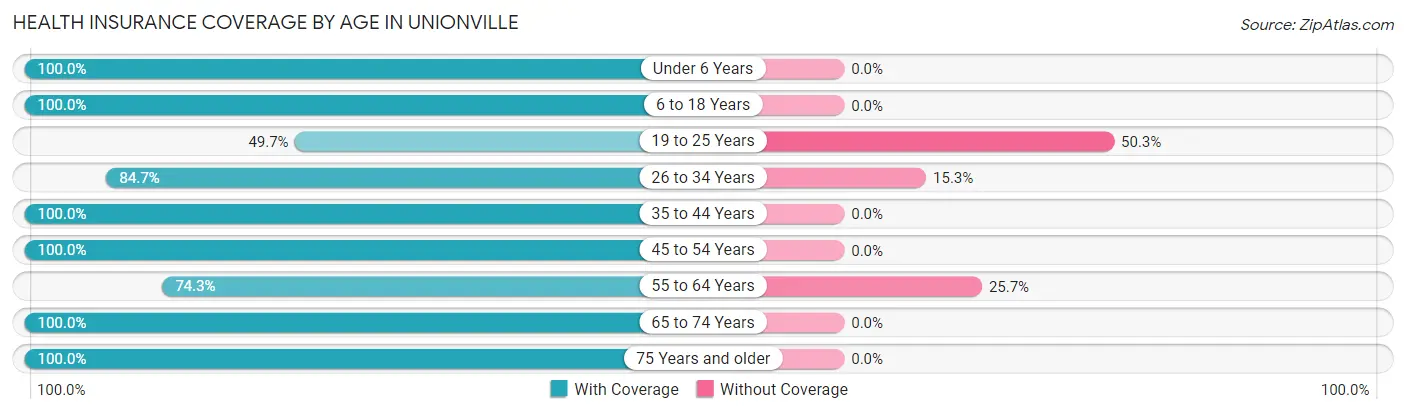
| Age Bracket | With Coverage | Without Coverage |
| Under 6 Years | 210 (100.0%) | 0 (0.0%) |
| 6 to 18 Years | 551 (100.0%) | 0 (0.0%) |
| 19 to 25 Years | 153 (49.7%) | 155 (50.3%) |
| 26 to 34 Years | 272 (84.7%) | 49 (15.3%) |
| 35 to 44 Years | 162 (100.0%) | 0 (0.0%) |
| 45 to 54 Years | 238 (100.0%) | 0 (0.0%) |
| 55 to 64 Years | 139 (74.3%) | 48 (25.7%) |
| 65 to 74 Years | 113 (100.0%) | 0 (0.0%) |
| 75 Years and older | 125 (100.0%) | 0 (0.0%) |
| Total | 1,963 (88.6%) | 252 (11.4%) |
Health Insurance Coverage by Citizenship Status in Unionville
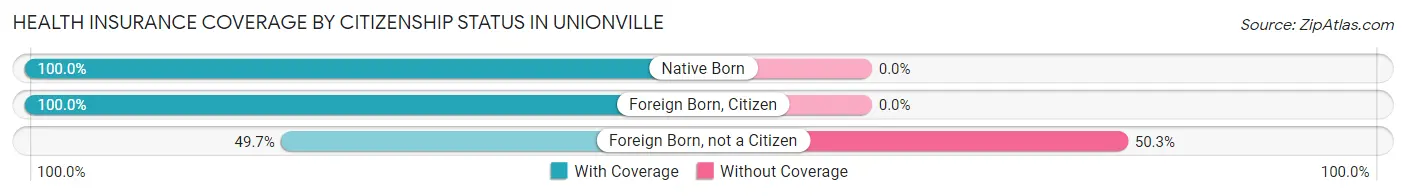
| Citizenship Status | With Coverage | Without Coverage |
| Native Born | 210 (100.0%) | 0 (0.0%) |
| Foreign Born, Citizen | 551 (100.0%) | 0 (0.0%) |
| Foreign Born, not a Citizen | 153 (49.7%) | 155 (50.3%) |
Health Insurance Coverage by Household Income in Unionville
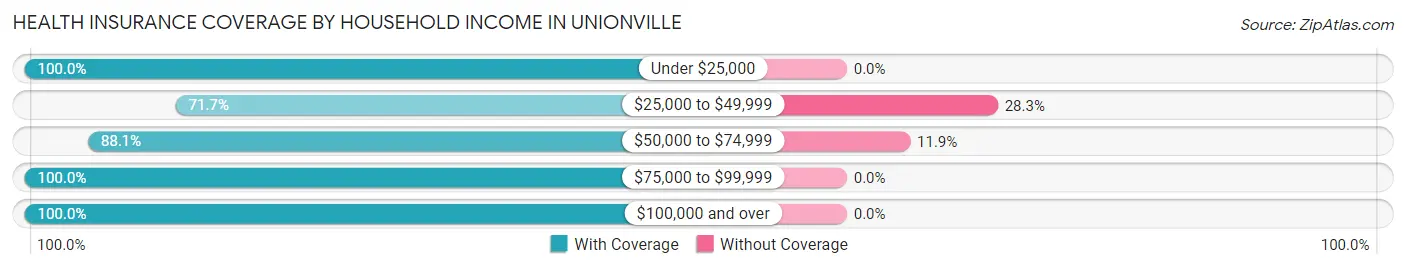
| Household Income | With Coverage | Without Coverage |
| Under $25,000 | 293 (100.0%) | 0 (0.0%) |
| $25,000 to $49,999 | 421 (71.7%) | 166 (28.3%) |
| $50,000 to $74,999 | 639 (88.1%) | 86 (11.9%) |
| $75,000 to $99,999 | 225 (100.0%) | 0 (0.0%) |
| $100,000 and over | 385 (100.0%) | 0 (0.0%) |
Public vs Private Health Insurance Coverage by Age in Unionville
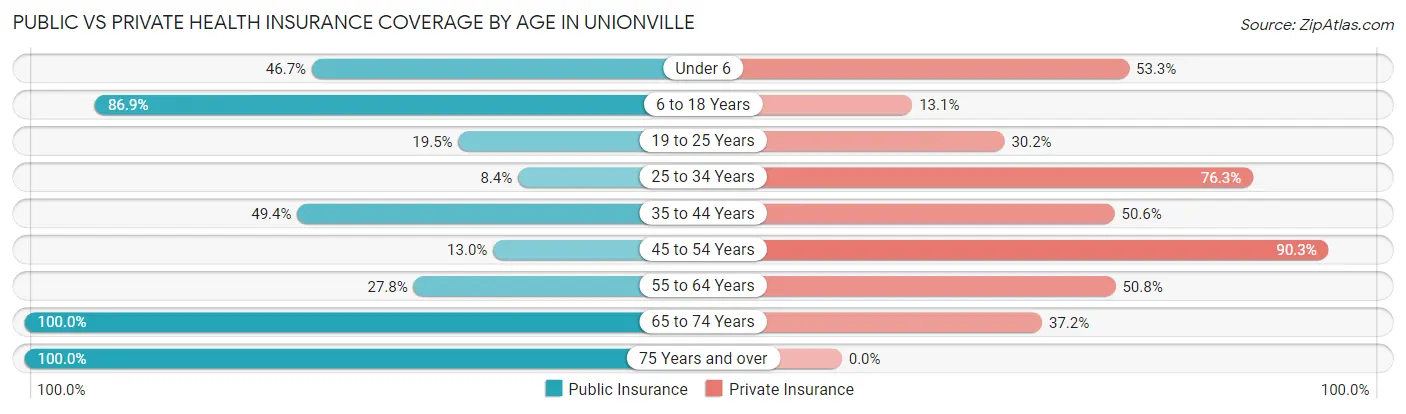
| Age Bracket | Public Insurance | Private Insurance |
| Under 6 | 98 (46.7%) | 112 (53.3%) |
| 6 to 18 Years | 479 (86.9%) | 72 (13.1%) |
| 19 to 25 Years | 60 (19.5%) | 93 (30.2%) |
| 25 to 34 Years | 27 (8.4%) | 245 (76.3%) |
| 35 to 44 Years | 80 (49.4%) | 82 (50.6%) |
| 45 to 54 Years | 31 (13.0%) | 215 (90.3%) |
| 55 to 64 Years | 52 (27.8%) | 95 (50.8%) |
| 65 to 74 Years | 113 (100.0%) | 42 (37.2%) |
| 75 Years and over | 125 (100.0%) | 0 (0.0%) |
| Total | 1,065 (48.1%) | 956 (43.2%) |
Disability Status by Sex by Age in Unionville
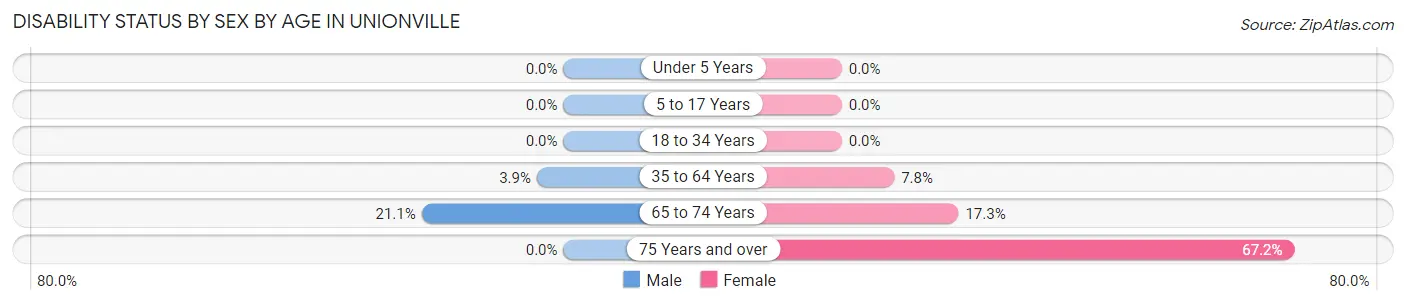
| Age Bracket | Male | Female |
| Under 5 Years | 0 (0.0%) | 0 (0.0%) |
| 5 to 17 Years | 0 (0.0%) | 0 (0.0%) |
| 18 to 34 Years | 0 (0.0%) | 0 (0.0%) |
| 35 to 64 Years | 13 (3.9%) | 20 (7.8%) |
| 65 to 74 Years | 8 (21.0%) | 13 (17.3%) |
| 75 Years and over | 0 (0.0%) | 84 (67.2%) |
Disability Class by Sex by Age in Unionville
Disability Class: Hearing Difficulty
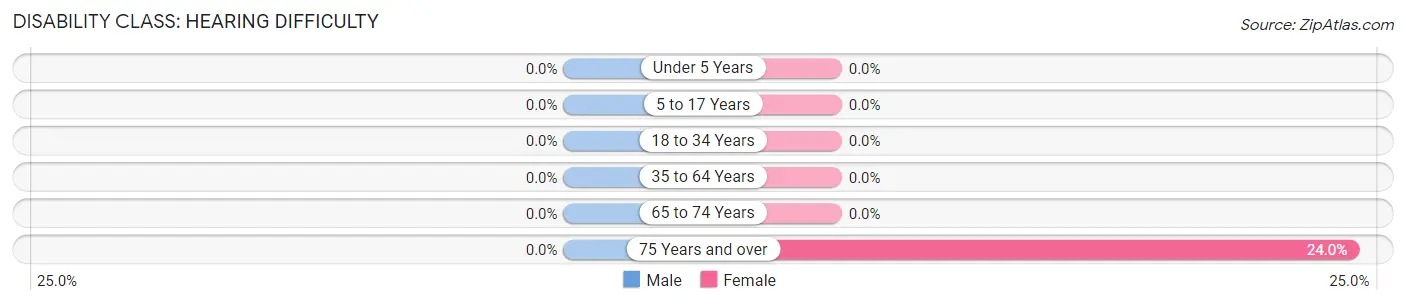
| Age Bracket | Male | Female |
| Under 5 Years | 0 (0.0%) | 0 (0.0%) |
| 5 to 17 Years | 0 (0.0%) | 0 (0.0%) |
| 18 to 34 Years | 0 (0.0%) | 0 (0.0%) |
| 35 to 64 Years | 0 (0.0%) | 0 (0.0%) |
| 65 to 74 Years | 0 (0.0%) | 0 (0.0%) |
| 75 Years and over | 0 (0.0%) | 30 (24.0%) |
Disability Class: Vision Difficulty
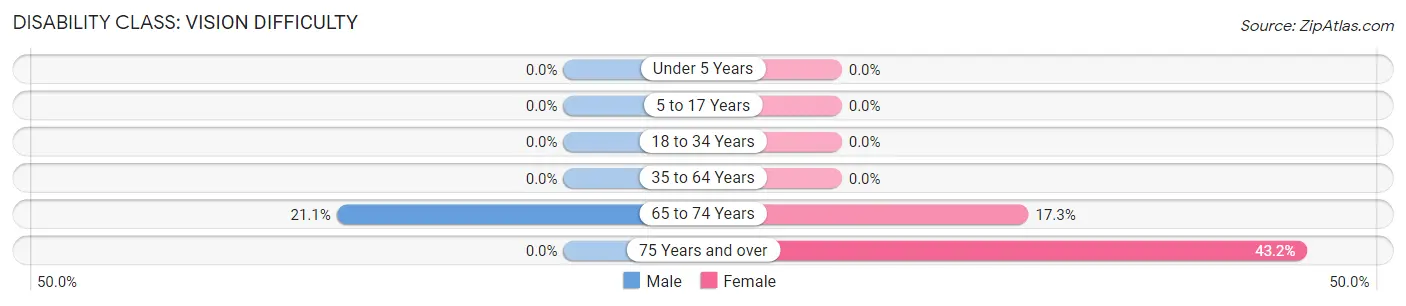
| Age Bracket | Male | Female |
| Under 5 Years | 0 (0.0%) | 0 (0.0%) |
| 5 to 17 Years | 0 (0.0%) | 0 (0.0%) |
| 18 to 34 Years | 0 (0.0%) | 0 (0.0%) |
| 35 to 64 Years | 0 (0.0%) | 0 (0.0%) |
| 65 to 74 Years | 8 (21.0%) | 13 (17.3%) |
| 75 Years and over | 0 (0.0%) | 54 (43.2%) |
Disability Class: Cognitive Difficulty
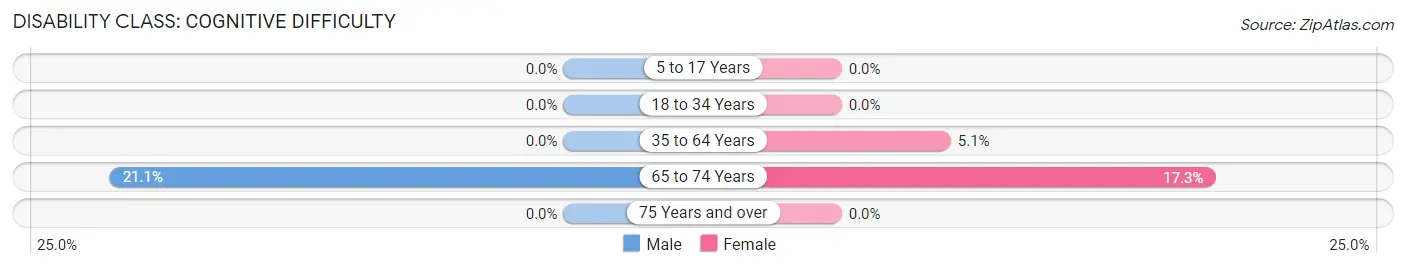
| Age Bracket | Male | Female |
| 5 to 17 Years | 0 (0.0%) | 0 (0.0%) |
| 18 to 34 Years | 0 (0.0%) | 0 (0.0%) |
| 35 to 64 Years | 0 (0.0%) | 13 (5.1%) |
| 65 to 74 Years | 8 (21.0%) | 13 (17.3%) |
| 75 Years and over | 0 (0.0%) | 0 (0.0%) |
Disability Class: Ambulatory Difficulty
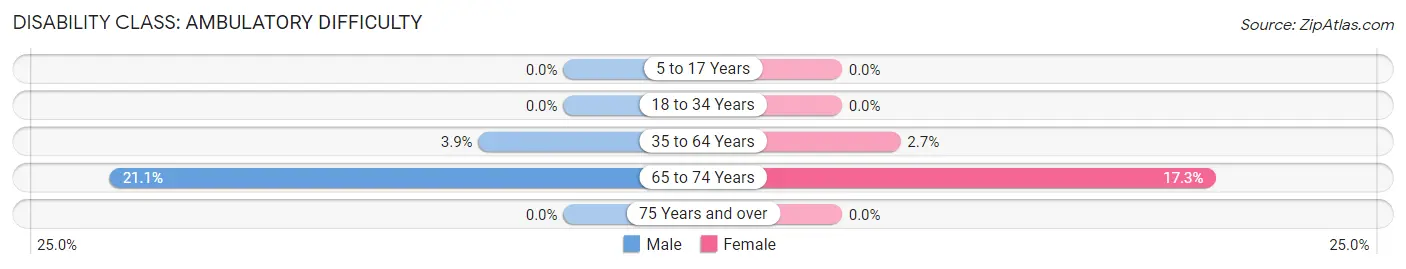
| Age Bracket | Male | Female |
| 5 to 17 Years | 0 (0.0%) | 0 (0.0%) |
| 18 to 34 Years | 0 (0.0%) | 0 (0.0%) |
| 35 to 64 Years | 13 (3.9%) | 7 (2.7%) |
| 65 to 74 Years | 8 (21.0%) | 13 (17.3%) |
| 75 Years and over | 0 (0.0%) | 0 (0.0%) |
Disability Class: Self-Care Difficulty
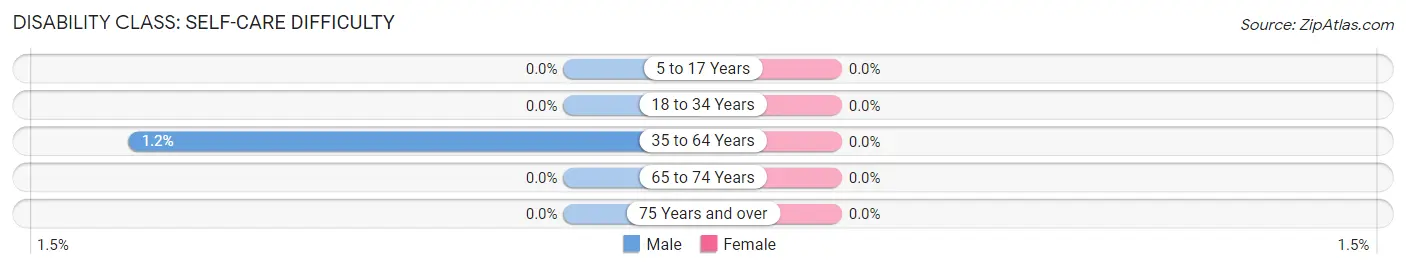
| Age Bracket | Male | Female |
| 5 to 17 Years | 0 (0.0%) | 0 (0.0%) |
| 18 to 34 Years | 0 (0.0%) | 0 (0.0%) |
| 35 to 64 Years | 4 (1.2%) | 0 (0.0%) |
| 65 to 74 Years | 0 (0.0%) | 0 (0.0%) |
| 75 Years and over | 0 (0.0%) | 0 (0.0%) |
Technology Access in Unionville
Computing Device Access in Unionville
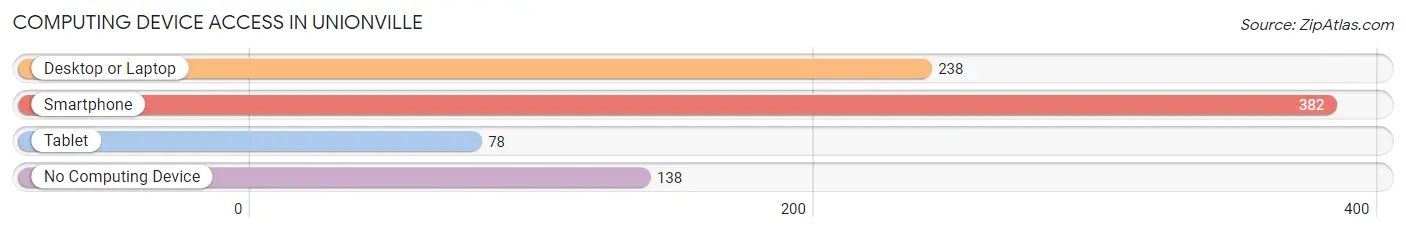
| Device Type | # Households | % Households |
| Desktop or Laptop | 238 | 37.5% |
| Smartphone | 382 | 60.2% |
| Tablet | 78 | 12.3% |
| No Computing Device | 138 | 21.7% |
| Total | 635 | 100.0% |
Internet Access in Unionville
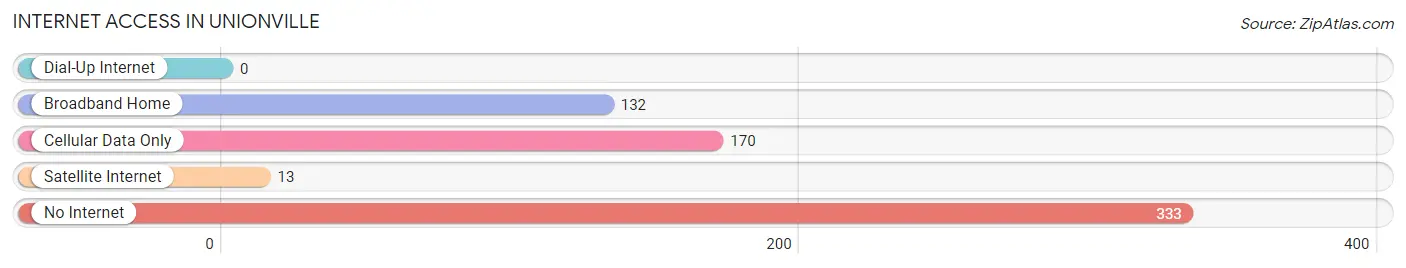
| Internet Type | # Households | % Households |
| Dial-Up Internet | 0 | 0.0% |
| Broadband Home | 132 | 20.8% |
| Cellular Data Only | 170 | 26.8% |
| Satellite Internet | 13 | 2.1% |
| No Internet | 333 | 52.4% |
| Total | 635 | 100.0% |
Unionville Summary
Introduction
Unionville is a small town located in Fannin County, Georgia, United States. It is situated in the foothills of the Blue Ridge Mountains, and is part of the Blue Ridge Mountains region. The town has a population of approximately 1,000 people, and is known for its rural charm and scenic beauty.
History
Unionville was founded in 1837 by a group of settlers from North Carolina. The town was named after the Unionville Presbyterian Church, which was established in 1838. The church was the first in the area, and served as a gathering place for the community.
The town grew slowly over the years, and by the late 19th century, it had become a thriving agricultural center. The town was home to several cotton mills, and the local economy was largely based on the production of cotton.
In the early 20th century, Unionville experienced a period of decline. The cotton mills closed, and the population began to decline. However, the town was able to survive, and in the late 20th century, it experienced a resurgence. The town has become a popular tourist destination, and is home to several historic sites, including the Unionville Presbyterian Church.
Geography
Unionville is located in the foothills of the Blue Ridge Mountains, and is part of the Blue Ridge Mountains region. The town is situated at an elevation of 1,400 feet, and is surrounded by rolling hills and lush forests. The town is located near the Toccoa River, and is approximately 30 miles from the Georgia-Tennessee border.
The climate in Unionville is mild, with hot summers and cool winters. The average annual temperature is around 60 degrees Fahrenheit, and the average annual precipitation is around 50 inches.
Economy
The economy of Unionville is largely based on tourism. The town is home to several historic sites, and is a popular destination for outdoor activities such as hiking, fishing, and camping. The town is also home to several small businesses, including restaurants, shops, and galleries.
Demographics
As of the 2010 census, the population of Unionville was 1,000. The racial makeup of the town was 97.2% White, 0.7% African American, 0.3% Native American, 0.3% Asian, and 1.5% from other races. The median household income was $30,000, and the median family income was $35,000.
Conclusion
Unionville is a small town located in Fannin County, Georgia. It is situated in the foothills of the Blue Ridge Mountains, and is known for its rural charm and scenic beauty. The town has a population of approximately 1,000 people, and the economy is largely based on tourism. The town is home to several historic sites, and is a popular destination for outdoor activities.
Common Questions
What is Per Capita Income in Unionville?
Per Capita income in Unionville is $19,694.
What is the Median Family Income in Unionville?
Median Family Income in Unionville is $64,028.
What is the Median Household income in Unionville?
Median Household Income in Unionville is $49,149.
What is Income or Wage Gap in Unionville?
Income or Wage Gap in Unionville is 30.2%.
Women in Unionville earn 69.8 cents for every dollar earned by a man.
What is Inequality or Gini Index in Unionville?
Inequality or Gini Index in Unionville is 0.45.
What is the Total Population of Unionville?
Total Population of Unionville is 2,215.
What is the Total Male Population of Unionville?
Total Male Population of Unionville is 1,173.
What is the Total Female Population of Unionville?
Total Female Population of Unionville is 1,042.
What is the Ratio of Males per 100 Females in Unionville?
There are 112.57 Males per 100 Females in Unionville.
What is the Ratio of Females per 100 Males in Unionville?
There are 88.83 Females per 100 Males in Unionville.
What is the Median Population Age in Unionville?
Median Population Age in Unionville is 29.1 Years.
What is the Average Family Size in Unionville
Average Family Size in Unionville is 5.0 People.
What is the Average Household Size in Unionville
Average Household Size in Unionville is 3.5 People.
How Large is the Labor Force in Unionville?
There are 802 People in the Labor Forcein in Unionville.
What is the Percentage of People in the Labor Force in Unionville?
52.4% of People are in the Labor Force in Unionville.
What is the Unemployment Rate in Unionville?
Unemployment Rate in Unionville is 11.5%.