Lake Park, GA Map & Demographics
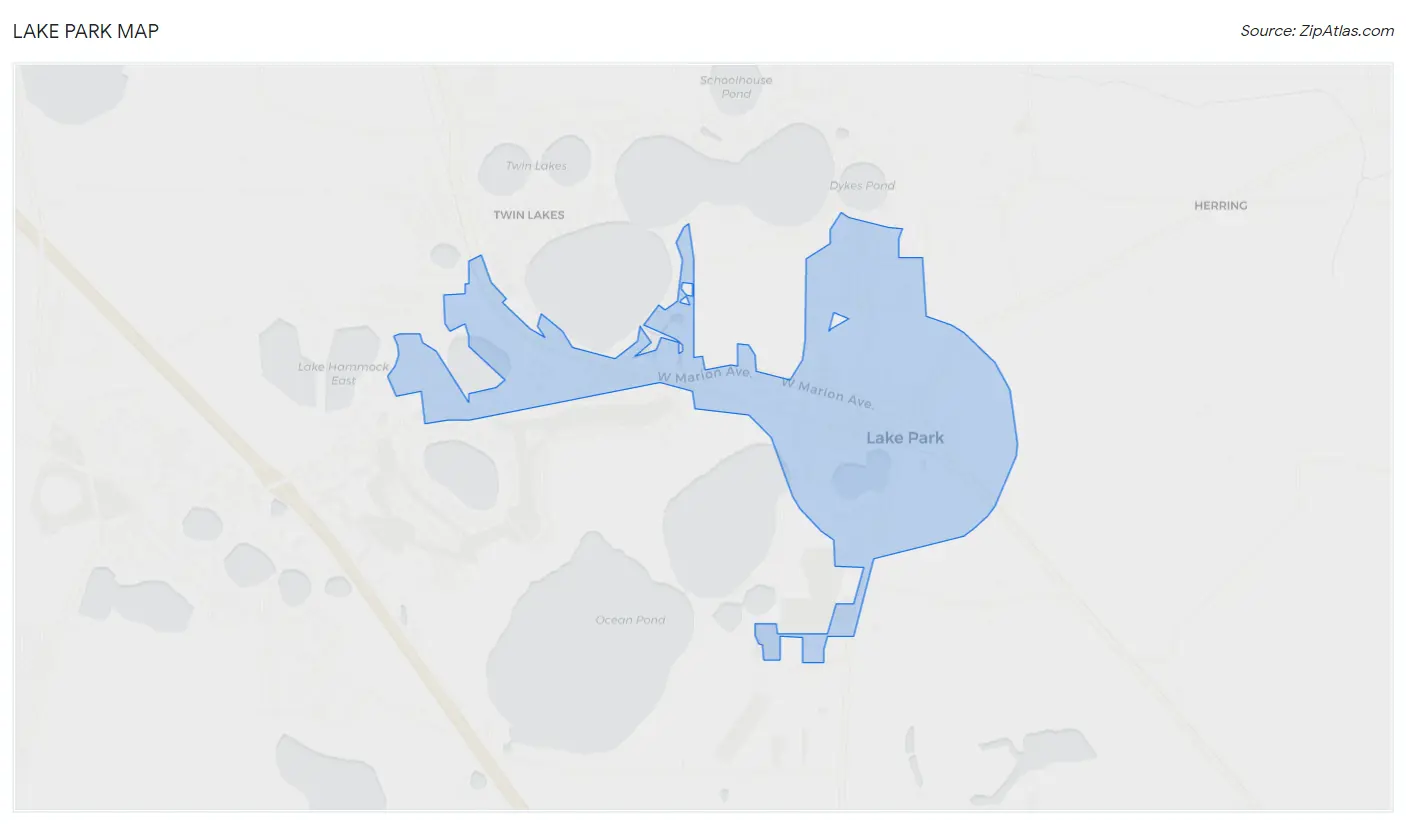
Lake Park Map
Lake Park Overview
$40,843
PER CAPITA INCOME
$18,988
FAMILY INCOME DEFICIT
0.71
INEQUALITY / GINI INDEX
980
TOTAL POPULATION
325
MALE POPULATION
655
FEMALE POPULATION
49.62
MALES / 100 FEMALES
201.54
FEMALES / 100 MALES
28.9
MEDIAN AGE
3.1
AVG FAMILY SIZE
2.9
AVG HOUSEHOLD SIZE
440
LABOR FORCE [ PEOPLE ]
66.8%
PERCENT IN LABOR FORCE
1.1%
UNEMPLOYMENT RATE
Lake Park Zip Codes
Lake Park Area Codes
Income in Lake Park
Income Overview in Lake Park
| Characteristic | Number | Measure |
| Per Capita Income | 980 | $40,843 |
| Median Family Income | 283 | $0 |
| Mean Family Income | 283 | $116,437 |
| Median Household Income | 337 | $0 |
| Mean Household Income | 337 | $105,395 |
| Income Deficit | 283 | $18,988 |
| Wage / Income Gap (%) | 980 | 0.00% |
| Wage / Income Gap ($) | 980 | 100.00¢ per $1 |
| Gini / Inequality Index | 980 | 0.71 |
Earnings by Sex in Lake Park
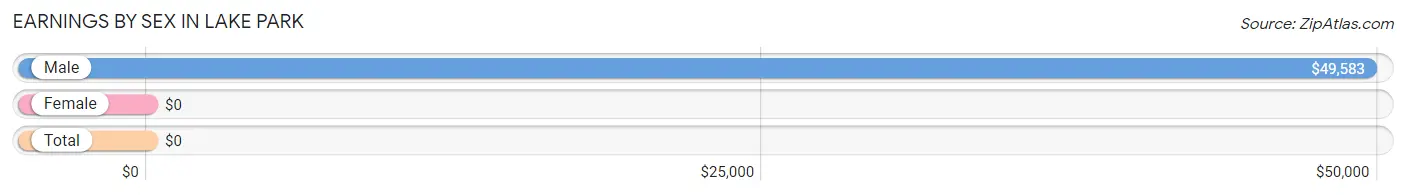
| Sex | Number | Average Earnings |
| Male | 173 (38.5%) | $49,583 |
| Female | 276 (61.5%) | $0 |
| Total | 449 (100.0%) | $0 |
Earnings by Sex by Income Bracket in Lake Park
The most common earnings brackets in Lake Park are $100,000+ for men (38 | 22.0%) and $2,499 or less for women (102 | 37.0%).
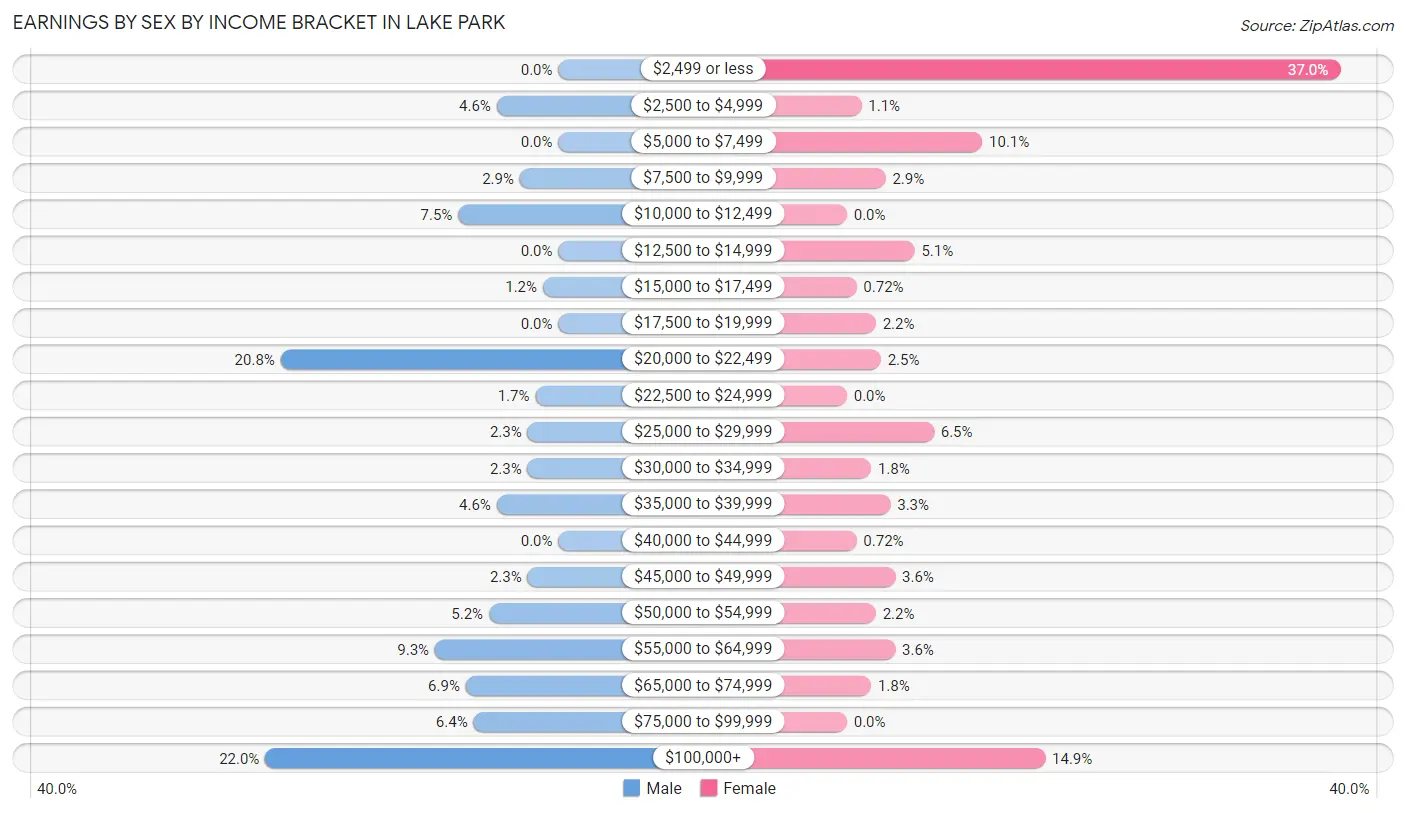
| Income | Male | Female |
| $2,499 or less | 0 (0.0%) | 102 (37.0%) |
| $2,500 to $4,999 | 8 (4.6%) | 3 (1.1%) |
| $5,000 to $7,499 | 0 (0.0%) | 28 (10.1%) |
| $7,500 to $9,999 | 5 (2.9%) | 8 (2.9%) |
| $10,000 to $12,499 | 13 (7.5%) | 0 (0.0%) |
| $12,500 to $14,999 | 0 (0.0%) | 14 (5.1%) |
| $15,000 to $17,499 | 2 (1.2%) | 2 (0.7%) |
| $17,500 to $19,999 | 0 (0.0%) | 6 (2.2%) |
| $20,000 to $22,499 | 36 (20.8%) | 7 (2.5%) |
| $22,500 to $24,999 | 3 (1.7%) | 0 (0.0%) |
| $25,000 to $29,999 | 4 (2.3%) | 18 (6.5%) |
| $30,000 to $34,999 | 4 (2.3%) | 5 (1.8%) |
| $35,000 to $39,999 | 8 (4.6%) | 9 (3.3%) |
| $40,000 to $44,999 | 0 (0.0%) | 2 (0.7%) |
| $45,000 to $49,999 | 4 (2.3%) | 10 (3.6%) |
| $50,000 to $54,999 | 9 (5.2%) | 6 (2.2%) |
| $55,000 to $64,999 | 16 (9.2%) | 10 (3.6%) |
| $65,000 to $74,999 | 12 (6.9%) | 5 (1.8%) |
| $75,000 to $99,999 | 11 (6.4%) | 0 (0.0%) |
| $100,000+ | 38 (22.0%) | 41 (14.9%) |
| Total | 173 (100.0%) | 276 (100.0%) |
Earnings by Sex by Educational Attainment in Lake Park
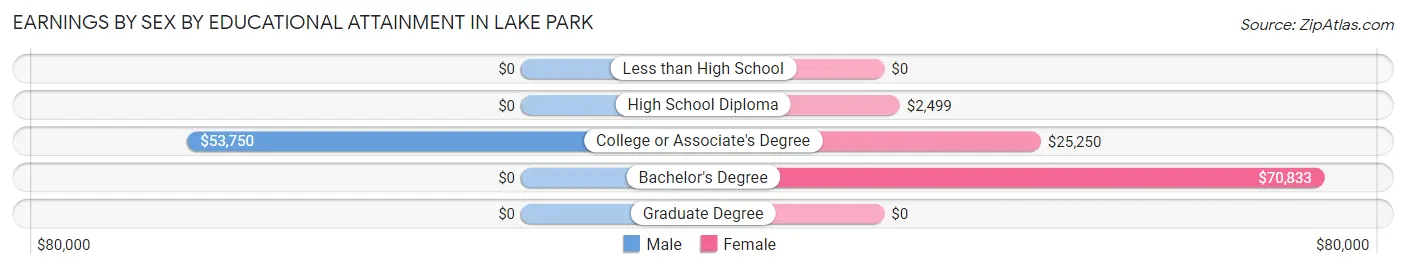
| Educational Attainment | Male Income | Female Income |
| Less than High School | - | - |
| High School Diploma | - | - |
| College or Associate's Degree | $53,750 | $25,250 |
| Bachelor's Degree | - | - |
| Graduate Degree | - | - |
| Total | $52,000 | $0 |
Family Income in Lake Park
Family Income Brackets in Lake Park
According to the Lake Park family income data, there are 113 families falling into the less than $10,000 income range, which is the most common income bracket and makes up 39.9% of all families. Conversely, the $10,000 to $14,999 income bracket is the least frequent group with only 2 families (0.7%) belonging to this category.
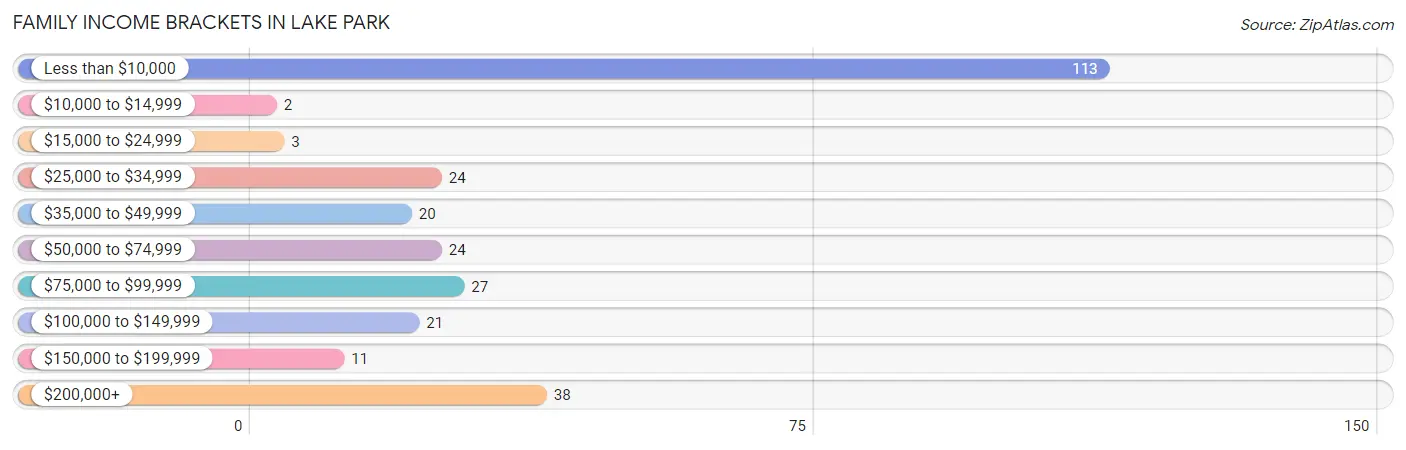
| Income Bracket | # Families | % Families |
| Less than $10,000 | 113 | 39.9% |
| $10,000 to $14,999 | 2 | 0.7% |
| $15,000 to $24,999 | 3 | 1.1% |
| $25,000 to $34,999 | 24 | 8.5% |
| $35,000 to $49,999 | 20 | 7.1% |
| $50,000 to $74,999 | 24 | 8.5% |
| $75,000 to $99,999 | 27 | 9.5% |
| $100,000 to $149,999 | 21 | 7.4% |
| $150,000 to $199,999 | 11 | 3.9% |
| $200,000+ | 38 | 13.4% |
Family Income by Famaliy Size in Lake Park
5-person families (16 | 5.7%) account for the highest median family income in Lake Park with $250,001 per family, while 5-person families (16 | 5.7%) have the highest median income of $50,000 per family member.
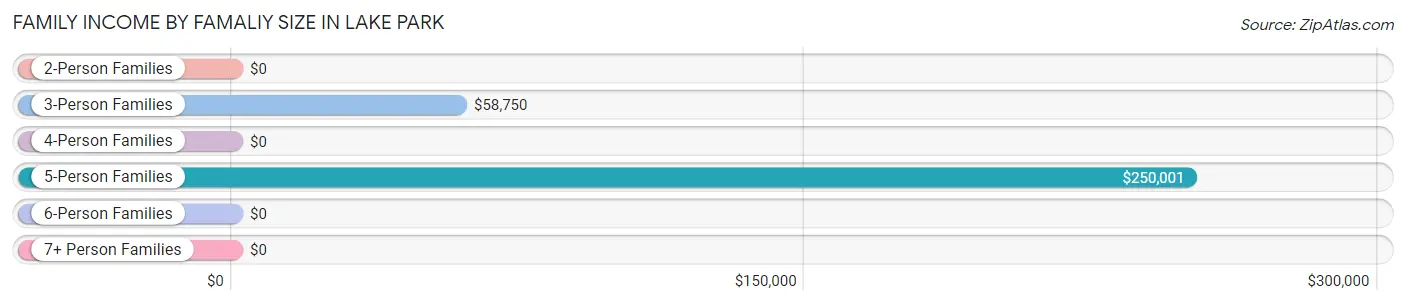
| Income Bracket | # Families | Median Income |
| 2-Person Families | 148 (52.3%) | $0 |
| 3-Person Families | 20 (7.1%) | $58,750 |
| 4-Person Families | 95 (33.6%) | $0 |
| 5-Person Families | 16 (5.7%) | $250,001 |
| 6-Person Families | 4 (1.4%) | $0 |
| 7+ Person Families | 0 (0.0%) | $0 |
| Total | 283 (100.0%) | $0 |
Family Income by Number of Earners in Lake Park
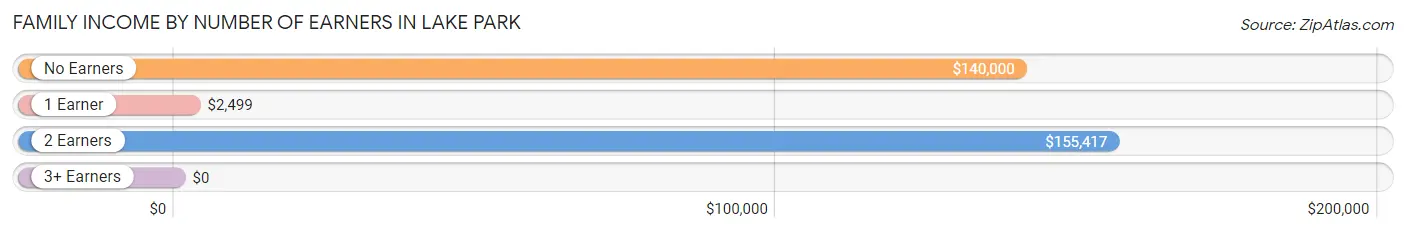
| Number of Earners | # Families | Median Income |
| No Earners | 16 (5.7%) | $140,000 |
| 1 Earner | 180 (63.6%) | $2,499 |
| 2 Earners | 85 (30.0%) | $155,417 |
| 3+ Earners | 2 (0.7%) | $0 |
| Total | 283 (100.0%) | $0 |
Household Income in Lake Park
Household Income Brackets in Lake Park
With 89 households falling in the category, the less than $10,000 income range is the most frequent in Lake Park, accounting for 26.4% of all households. In contrast, only 4 households (1.2%) fall into the $10,000 to $14,999 income bracket, making it the least populous group.
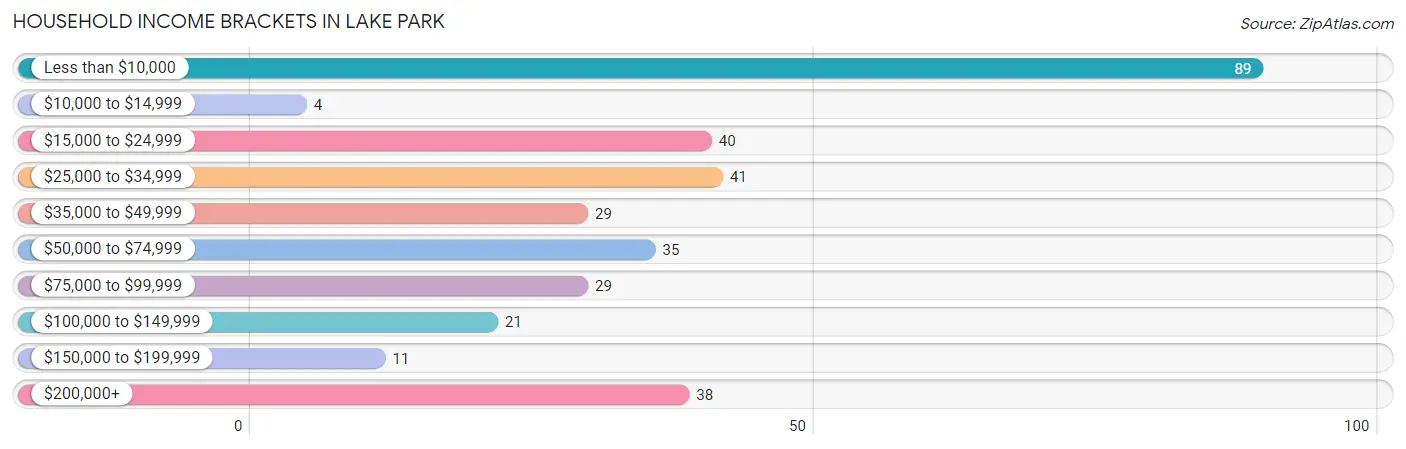
| Income Bracket | # Households | % Households |
| Less than $10,000 | 89 | 26.4% |
| $10,000 to $14,999 | 4 | 1.2% |
| $15,000 to $24,999 | 40 | 11.9% |
| $25,000 to $34,999 | 41 | 12.2% |
| $35,000 to $49,999 | 29 | 8.6% |
| $50,000 to $74,999 | 35 | 10.4% |
| $75,000 to $99,999 | 29 | 8.6% |
| $100,000 to $149,999 | 21 | 6.2% |
| $150,000 to $199,999 | 11 | 3.3% |
| $200,000+ | 38 | 11.3% |
Household Income by Householder Age in Lake Park
The median household income in Lake Park is $0, with the highest median household income of $74,063 found in the 45 to 64 years age bracket for the primary householder. A total of 107 households (31.8%) fall into this category. Meanwhile, the 15 to 24 years age bracket for the primary householder has the lowest median household income of $0, with 6 households (1.8%) in this group.
| Income Bracket | # Households | Median Income |
| 15 to 24 Years | 6 (1.8%) | $0 |
| 25 to 44 Years | 159 (47.2%) | $0 |
| 45 to 64 Years | 107 (31.8%) | $74,063 |
| 65+ Years | 65 (19.3%) | $0 |
| Total | 337 (100.0%) | $0 |
Poverty in Lake Park
Income Below Poverty by Sex and Age in Lake Park
With 3.4% poverty level for males and 51.3% for females among the residents of Lake Park, 18 to 24 year old males and 12 to 14 year old females are the most vulnerable to poverty, with 4 males (28.6%) and 39 females (92.9%) in their respective age groups living below the poverty level.
| Age Bracket | Male | Female |
| Under 5 Years | 0 (0.0%) | 93 (84.6%) |
| 5 Years | 0 (0.0%) | 0 (0.0%) |
| 6 to 11 Years | 2 (9.1%) | 74 (75.5%) |
| 12 to 14 Years | 0 (0.0%) | 39 (92.9%) |
| 15 Years | 0 (0.0%) | 0 (0.0%) |
| 16 and 17 Years | 0 (0.0%) | 4 (40.0%) |
| 18 to 24 Years | 4 (28.6%) | 3 (6.2%) |
| 25 to 34 Years | 0 (0.0%) | 80 (72.1%) |
| 35 to 44 Years | 2 (3.6%) | 31 (59.6%) |
| 45 to 54 Years | 0 (0.0%) | 7 (7.4%) |
| 55 to 64 Years | 3 (13.0%) | 3 (6.1%) |
| 65 to 74 Years | 0 (0.0%) | 0 (0.0%) |
| 75 Years and over | 0 (0.0%) | 2 (33.3%) |
| Total | 11 (3.4%) | 336 (51.3%) |
Income Above Poverty by Sex and Age in Lake Park
According to the poverty statistics in Lake Park, males aged under 5 years and females aged 15 years are the age groups that are most secure financially, with 100.0% of males and 100.0% of females in these age groups living above the poverty line.
| Age Bracket | Male | Female |
| Under 5 Years | 39 (100.0%) | 17 (15.4%) |
| 5 Years | 0 (0.0%) | 0 (0.0%) |
| 6 to 11 Years | 20 (90.9%) | 24 (24.5%) |
| 12 to 14 Years | 4 (100.0%) | 3 (7.1%) |
| 15 Years | 3 (100.0%) | 3 (100.0%) |
| 16 and 17 Years | 21 (100.0%) | 6 (60.0%) |
| 18 to 24 Years | 10 (71.4%) | 45 (93.8%) |
| 25 to 34 Years | 36 (100.0%) | 31 (27.9%) |
| 35 to 44 Years | 53 (96.4%) | 21 (40.4%) |
| 45 to 54 Years | 62 (100.0%) | 88 (92.6%) |
| 55 to 64 Years | 20 (87.0%) | 46 (93.9%) |
| 65 to 74 Years | 41 (100.0%) | 31 (100.0%) |
| 75 Years and over | 5 (100.0%) | 4 (66.7%) |
| Total | 314 (96.6%) | 319 (48.7%) |
Income Below Poverty Among Married-Couple Families in Lake Park
The poverty statistics for married-couple families in Lake Park show that 7.9% or 10 of the total 127 families live below the poverty line. Families with 3 or 4 children have the highest poverty rate of 60.0%, comprising of 3 families. On the other hand, families with 1 or 2 children have the lowest poverty rate of 0.0%, which includes 0 families.
| Children | Above Poverty | Below Poverty |
| No Children | 54 (88.5%) | 7 (11.5%) |
| 1 or 2 Children | 61 (100.0%) | 0 (0.0%) |
| 3 or 4 Children | 2 (40.0%) | 3 (60.0%) |
| 5 or more Children | 0 (0.0%) | 0 (0.0%) |
| Total | 117 (92.1%) | 10 (7.9%) |
Income Below Poverty Among Single-Parent Households in Lake Park
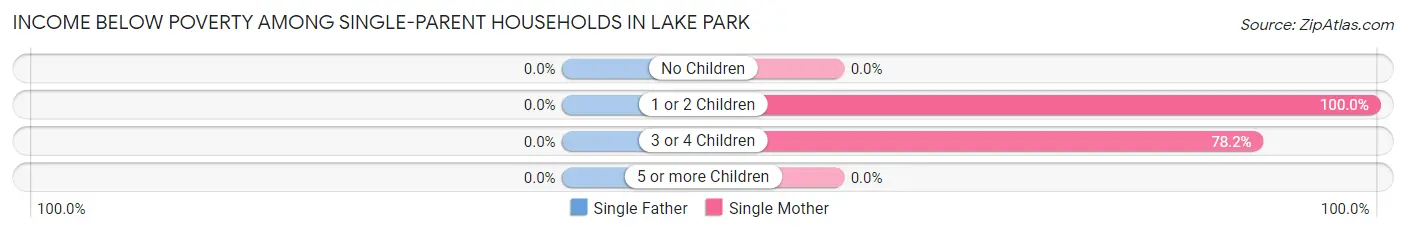
| Children | Single Father | Single Mother |
| No Children | 0 (0.0%) | 0 (0.0%) |
| 1 or 2 Children | 0 (0.0%) | 65 (100.0%) |
| 3 or 4 Children | 0 (0.0%) | 43 (78.2%) |
| 5 or more Children | 0 (0.0%) | 0 (0.0%) |
| Total | 0 (0.0%) | 108 (74.5%) |
Income Below Poverty Among Married-Couple vs Single-Parent Households in Lake Park
The poverty data for Lake Park shows that 10 of the married-couple family households (7.9%) and 108 of the single-parent households (69.2%) are living below the poverty level. Within the married-couple family households, those with 3 or 4 children have the highest poverty rate, with 3 households (60.0%) falling below the poverty line. Among the single-parent households, those with 1 or 2 children have the highest poverty rate, with 65 household (100.0%) living below poverty.
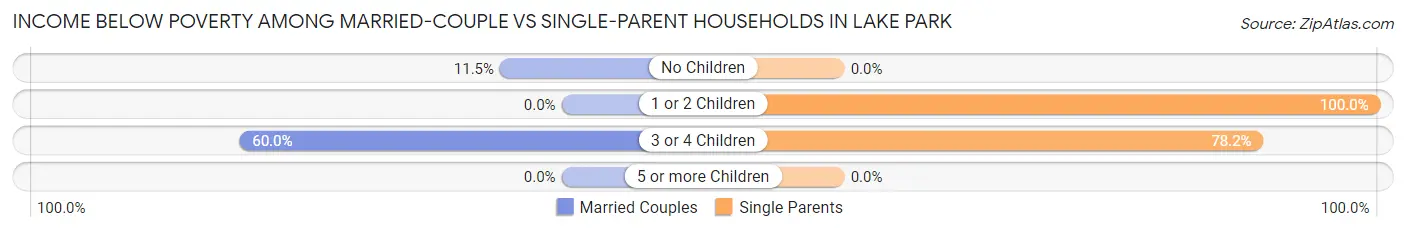
| Children | Married-Couple Families | Single-Parent Households |
| No Children | 7 (11.5%) | 0 (0.0%) |
| 1 or 2 Children | 0 (0.0%) | 65 (100.0%) |
| 3 or 4 Children | 3 (60.0%) | 43 (78.2%) |
| 5 or more Children | 0 (0.0%) | 0 (0.0%) |
| Total | 10 (7.9%) | 108 (69.2%) |
Race in Lake Park
The most populous races in Lake Park are White / Caucasian (688 | 70.2%), Black / African American (219 | 22.4%), and Hispanic or Latino (41 | 4.2%).
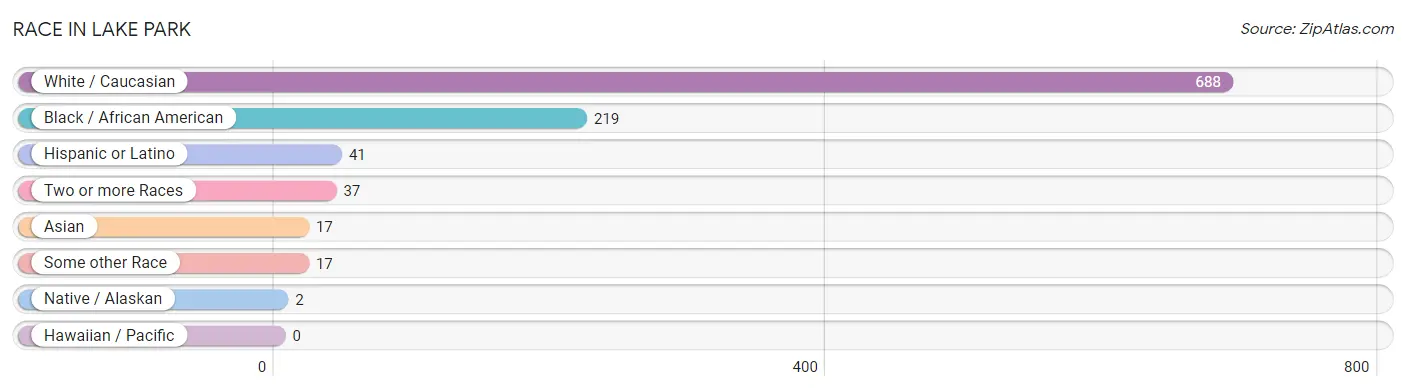
| Race | # Population | % Population |
| Asian | 17 | 1.7% |
| Black / African American | 219 | 22.4% |
| Hawaiian / Pacific | 0 | 0.0% |
| Hispanic or Latino | 41 | 4.2% |
| Native / Alaskan | 2 | 0.2% |
| White / Caucasian | 688 | 70.2% |
| Two or more Races | 37 | 3.8% |
| Some other Race | 17 | 1.7% |
| Total | 980 | 100.0% |
Ancestry in Lake Park
The most populous ancestries reported in Lake Park are American (93 | 9.5%), English (40 | 4.1%), German (39 | 4.0%), Polish (34 | 3.5%), and Scottish (28 | 2.9%), together accounting for 23.9% of all Lake Park residents.
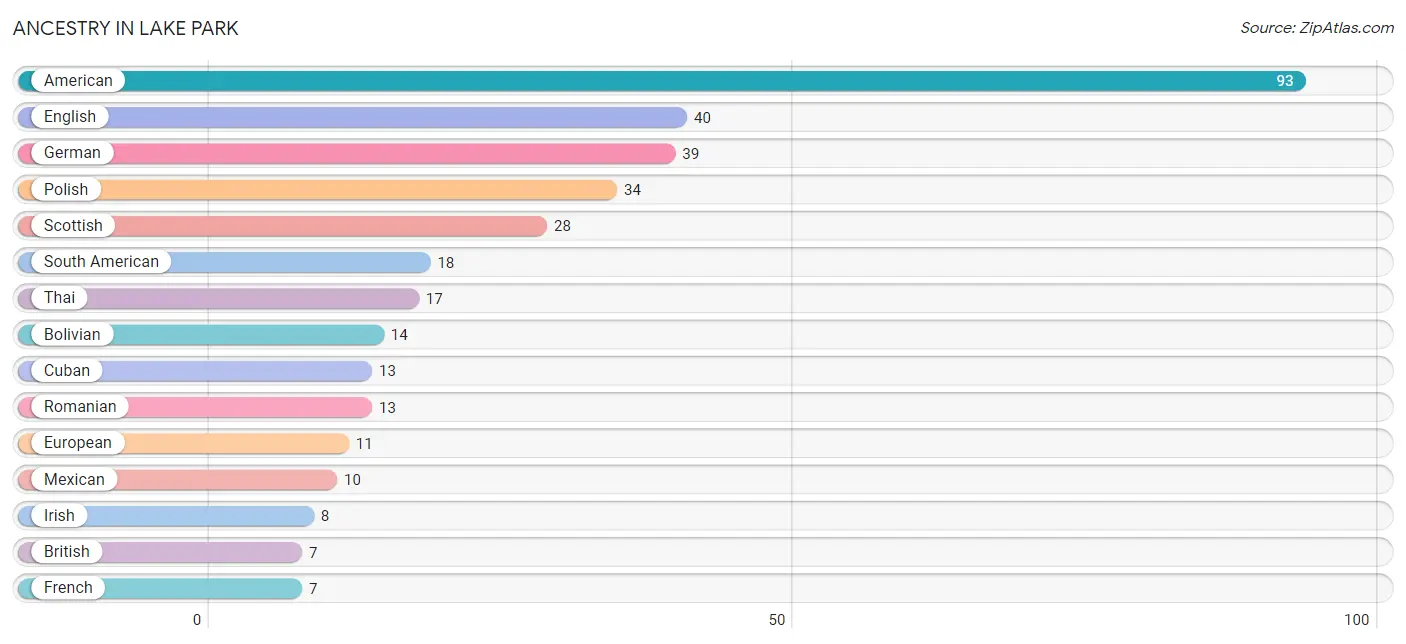
| Ancestry | # Population | % Population |
| American | 93 | 9.5% |
| Argentinean | 4 | 0.4% |
| Austrian | 2 | 0.2% |
| Bolivian | 14 | 1.4% |
| British | 7 | 0.7% |
| Cuban | 13 | 1.3% |
| English | 40 | 4.1% |
| European | 11 | 1.1% |
| French | 7 | 0.7% |
| German | 39 | 4.0% |
| Irish | 8 | 0.8% |
| Italian | 6 | 0.6% |
| Mexican | 10 | 1.0% |
| Polish | 34 | 3.5% |
| Romanian | 13 | 1.3% |
| Russian | 3 | 0.3% |
| Scotch-Irish | 4 | 0.4% |
| Scottish | 28 | 2.9% |
| South American | 18 | 1.8% |
| Thai | 17 | 1.7% | View All 20 Rows |
Immigrants in Lake Park
The most numerous immigrant groups reported in Lake Park came from Asia (10 | 1.0%), India (10 | 1.0%), South Central Asia (10 | 1.0%), Latin America (7 | 0.7%), and Africa (5 | 0.5%), together accounting for 4.3% of all Lake Park residents.
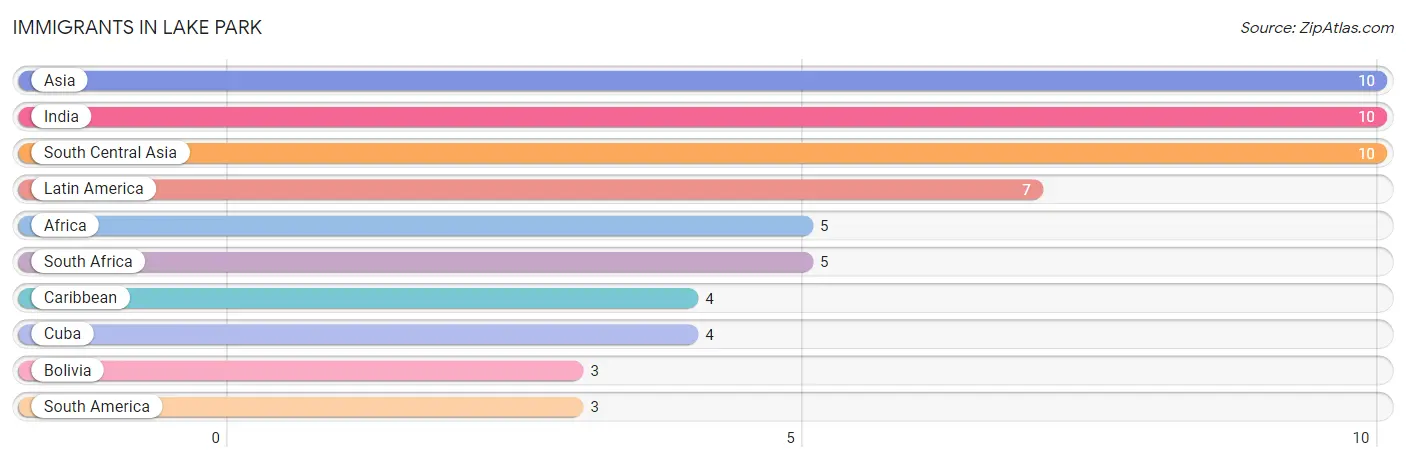
| Immigration Origin | # Population | % Population |
| Africa | 5 | 0.5% |
| Asia | 10 | 1.0% |
| Bolivia | 3 | 0.3% |
| Caribbean | 4 | 0.4% |
| Cuba | 4 | 0.4% |
| India | 10 | 1.0% |
| Latin America | 7 | 0.7% |
| South Africa | 5 | 0.5% |
| South America | 3 | 0.3% |
| South Central Asia | 10 | 1.0% | View All 10 Rows |
Sex and Age in Lake Park
Sex and Age in Lake Park
The most populous age groups in Lake Park are 40 to 44 Years (42 | 12.9%) for men and Under 5 Years (110 | 16.8%) for women.
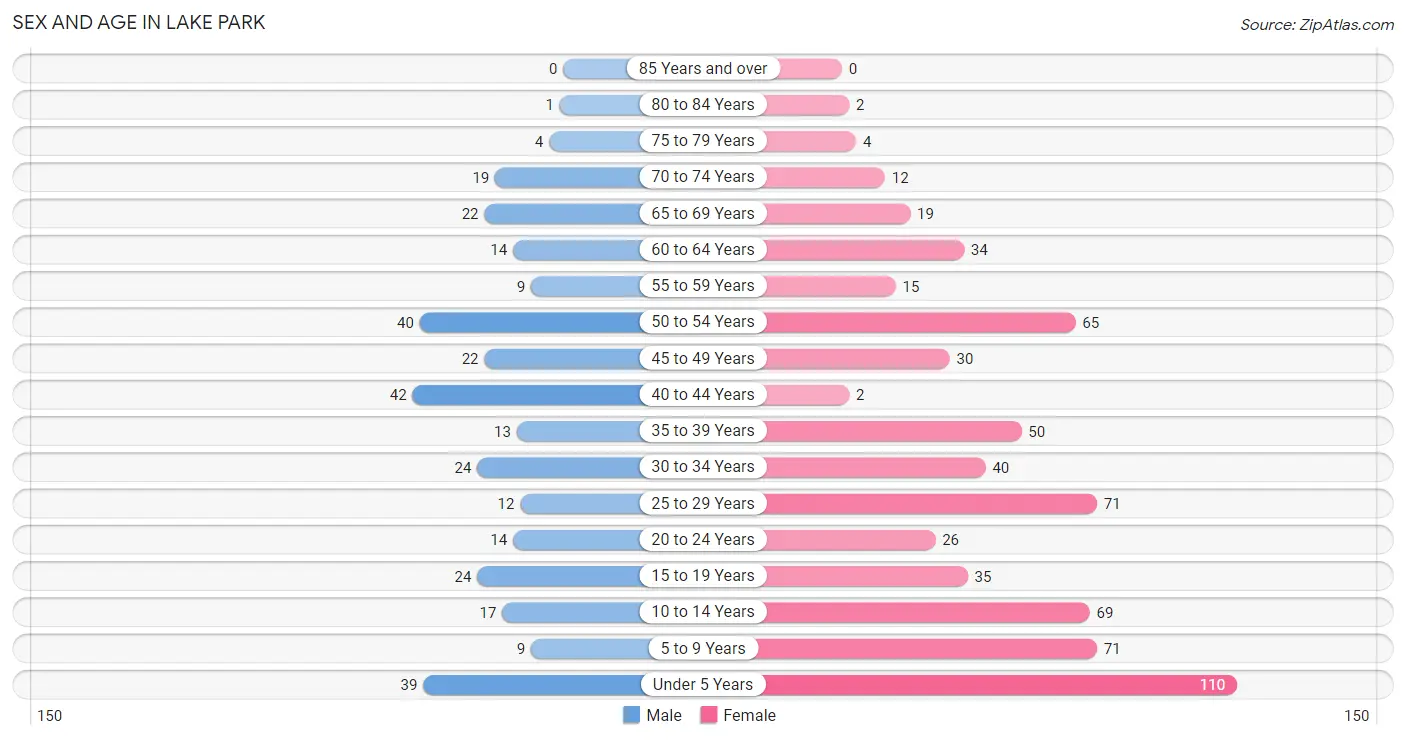
| Age Bracket | Male | Female |
| Under 5 Years | 39 (12.0%) | 110 (16.8%) |
| 5 to 9 Years | 9 (2.8%) | 71 (10.8%) |
| 10 to 14 Years | 17 (5.2%) | 69 (10.5%) |
| 15 to 19 Years | 24 (7.4%) | 35 (5.3%) |
| 20 to 24 Years | 14 (4.3%) | 26 (4.0%) |
| 25 to 29 Years | 12 (3.7%) | 71 (10.8%) |
| 30 to 34 Years | 24 (7.4%) | 40 (6.1%) |
| 35 to 39 Years | 13 (4.0%) | 50 (7.6%) |
| 40 to 44 Years | 42 (12.9%) | 2 (0.3%) |
| 45 to 49 Years | 22 (6.8%) | 30 (4.6%) |
| 50 to 54 Years | 40 (12.3%) | 65 (9.9%) |
| 55 to 59 Years | 9 (2.8%) | 15 (2.3%) |
| 60 to 64 Years | 14 (4.3%) | 34 (5.2%) |
| 65 to 69 Years | 22 (6.8%) | 19 (2.9%) |
| 70 to 74 Years | 19 (5.9%) | 12 (1.8%) |
| 75 to 79 Years | 4 (1.2%) | 4 (0.6%) |
| 80 to 84 Years | 1 (0.3%) | 2 (0.3%) |
| 85 Years and over | 0 (0.0%) | 0 (0.0%) |
| Total | 325 (100.0%) | 655 (100.0%) |
Families and Households in Lake Park
Median Family Size in Lake Park
The median family size in Lake Park is 3.12 persons per family, with married-couple families (127 | 44.9%) accounting for the largest median family size of 3.26 persons per family. On the other hand, single male/father families (11 | 3.9%) represent the smallest median family size with 2.82 persons per family.
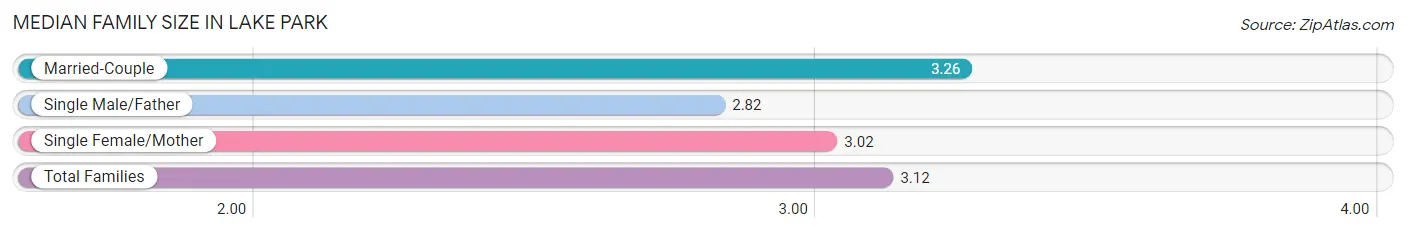
| Family Type | # Families | Family Size |
| Married-Couple | 127 (44.9%) | 3.26 |
| Single Male/Father | 11 (3.9%) | 2.82 |
| Single Female/Mother | 145 (51.2%) | 3.02 |
| Total Families | 283 (100.0%) | 3.12 |
Median Household Size in Lake Park
The median household size in Lake Park is 2.91 persons per household, with single female/mother households (145 | 43.0%) accounting for the largest median household size of 3.27 persons per household. non-family households (54 | 16.0%) represent the smallest median household size with 1.13 persons per household.
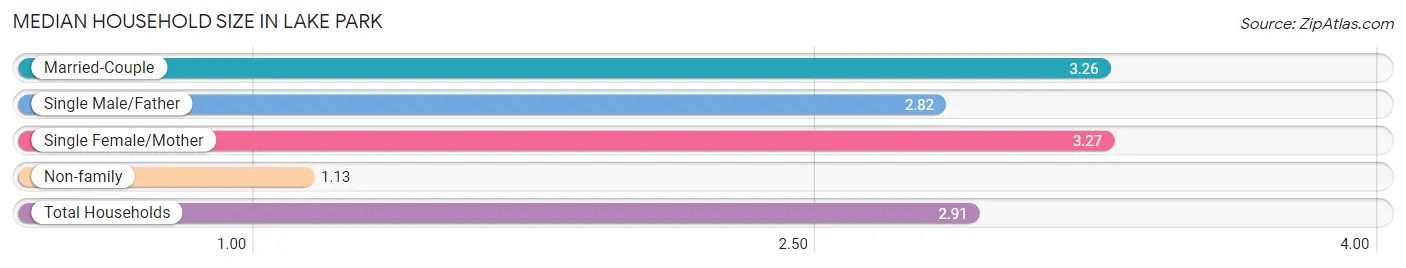
| Household Type | # Households | Household Size |
| Married-Couple | 127 (37.7%) | 3.26 |
| Single Male/Father | 11 (3.3%) | 2.82 |
| Single Female/Mother | 145 (43.0%) | 3.27 |
| Non-family | 54 (16.0%) | 1.13 |
| Total Households | 337 (100.0%) | 2.91 |
Household Size by Marriage Status in Lake Park
Out of a total of 337 households in Lake Park, 283 (84.0%) are family households, while 54 (16.0%) are nonfamily households. The most numerous type of family households are 2-person households, comprising 148, and the most common type of nonfamily households are 1-person households, comprising 48.
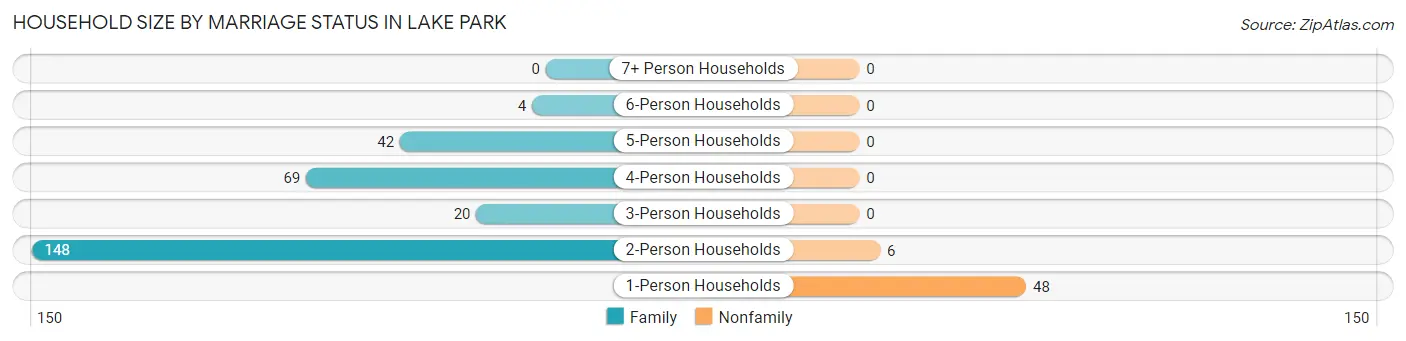
| Household Size | Family Households | Nonfamily Households |
| 1-Person Households | - | 48 (14.2%) |
| 2-Person Households | 148 (43.9%) | 6 (1.8%) |
| 3-Person Households | 20 (5.9%) | 0 (0.0%) |
| 4-Person Households | 69 (20.5%) | 0 (0.0%) |
| 5-Person Households | 42 (12.5%) | 0 (0.0%) |
| 6-Person Households | 4 (1.2%) | 0 (0.0%) |
| 7+ Person Households | 0 (0.0%) | 0 (0.0%) |
| Total | 283 (84.0%) | 54 (16.0%) |
Female Fertility in Lake Park
Fertility by Age in Lake Park
Average fertility rate in Lake Park is 47.0 births per 1,000 women. Women in the age bracket of 20 to 34 years have the highest fertility rate with 88.0 births per 1,000 women. Women in the age bracket of 20 to 34 years acount for 100.0% of all women with births.
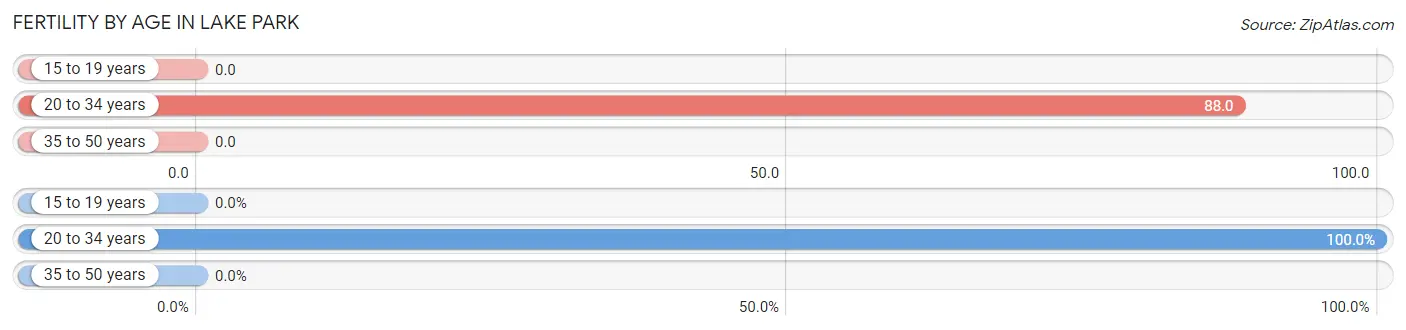
| Age Bracket | Women with Births | Births / 1,000 Women |
| 15 to 19 years | 0 (0.0%) | 0.0 |
| 20 to 34 years | 12 (100.0%) | 88.0 |
| 35 to 50 years | 0 (0.0%) | 0.0 |
| Total | 12 (100.0%) | 47.0 |
Fertility by Age by Marriage Status in Lake Park
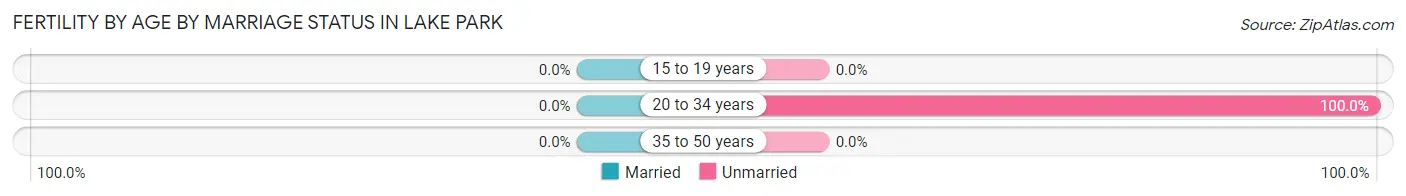
| Age Bracket | Married | Unmarried |
| 15 to 19 years | 0 (0.0%) | 0 (0.0%) |
| 20 to 34 years | 0 (0.0%) | 12 (100.0%) |
| 35 to 50 years | 0 (0.0%) | 0 (0.0%) |
| Total | 0 (0.0%) | 12 (100.0%) |
Fertility by Education in Lake Park
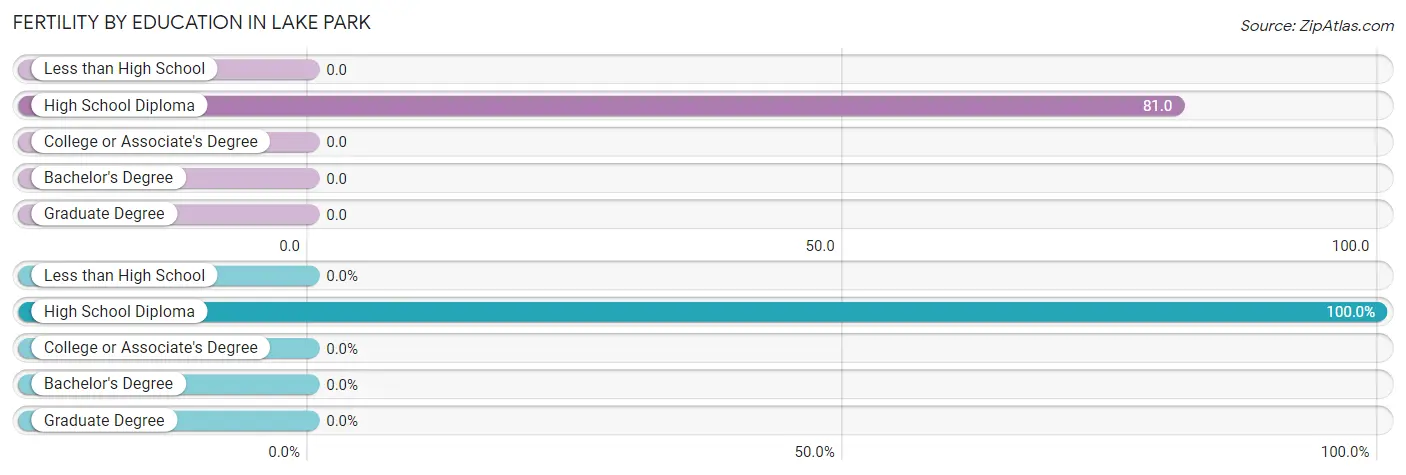
| Educational Attainment | Women with Births | Births / 1,000 Women |
| Less than High School | 0 (0.0%) | 0.0 |
| High School Diploma | 12 (100.0%) | 81.0 |
| College or Associate's Degree | 0 (0.0%) | 0.0 |
| Bachelor's Degree | 0 (0.0%) | 0.0 |
| Graduate Degree | 0 (0.0%) | 0.0 |
| Total | 12 (100.0%) | 47.0 |
Fertility by Education by Marriage Status in Lake Park
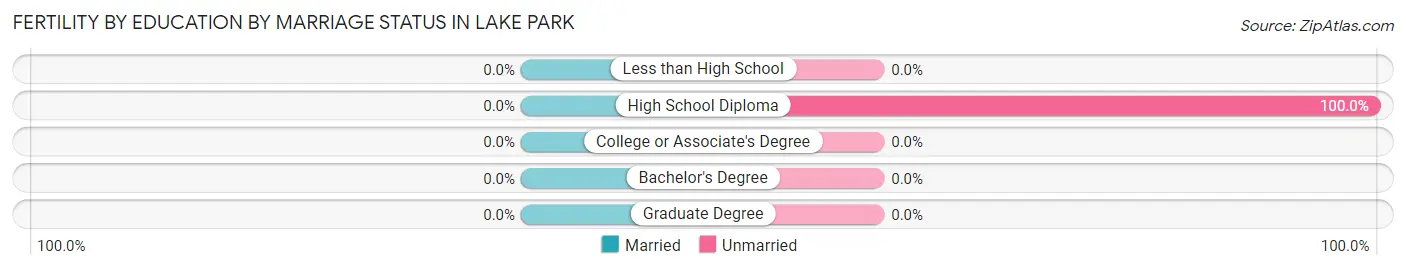
| Educational Attainment | Married | Unmarried |
| Less than High School | 0 (0.0%) | 0 (0.0%) |
| High School Diploma | 0 (0.0%) | 12 (100.0%) |
| College or Associate's Degree | 0 (0.0%) | 0 (0.0%) |
| Bachelor's Degree | 0 (0.0%) | 0 (0.0%) |
| Graduate Degree | 0 (0.0%) | 0 (0.0%) |
| Total | 0 (0.0%) | 12 (100.0%) |
Employment Characteristics in Lake Park
Employment by Class of Employer in Lake Park
Among the 430 employed individuals in Lake Park, private company employees (263 | 61.2%), self-employed (not incorporated) (67 | 15.6%), and local government employees (47 | 10.9%) make up the most common classes of employment.
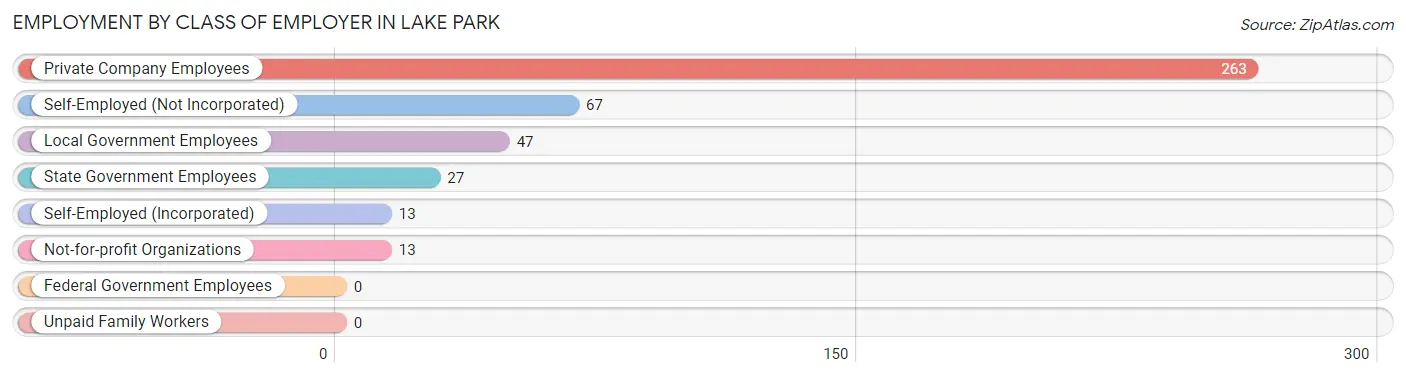
| Employer Class | # Employees | % Employees |
| Private Company Employees | 263 | 61.2% |
| Self-Employed (Incorporated) | 13 | 3.0% |
| Self-Employed (Not Incorporated) | 67 | 15.6% |
| Not-for-profit Organizations | 13 | 3.0% |
| Local Government Employees | 47 | 10.9% |
| State Government Employees | 27 | 6.3% |
| Federal Government Employees | 0 | 0.0% |
| Unpaid Family Workers | 0 | 0.0% |
| Total | 430 | 100.0% |
Employment Status by Age in Lake Park
According to the labor force statistics for Lake Park, out of the total population over 16 years of age (659), 66.8% or 440 individuals are in the labor force, with 1.1% or 5 of them unemployed. The age group with the highest labor force participation rate is 30 to 34 years, with 100.0% or 64 individuals in the labor force. Within the labor force, the 16 to 19 years age range has the highest percentage of unemployed individuals, with 62.5% or 5 of them being unemployed.
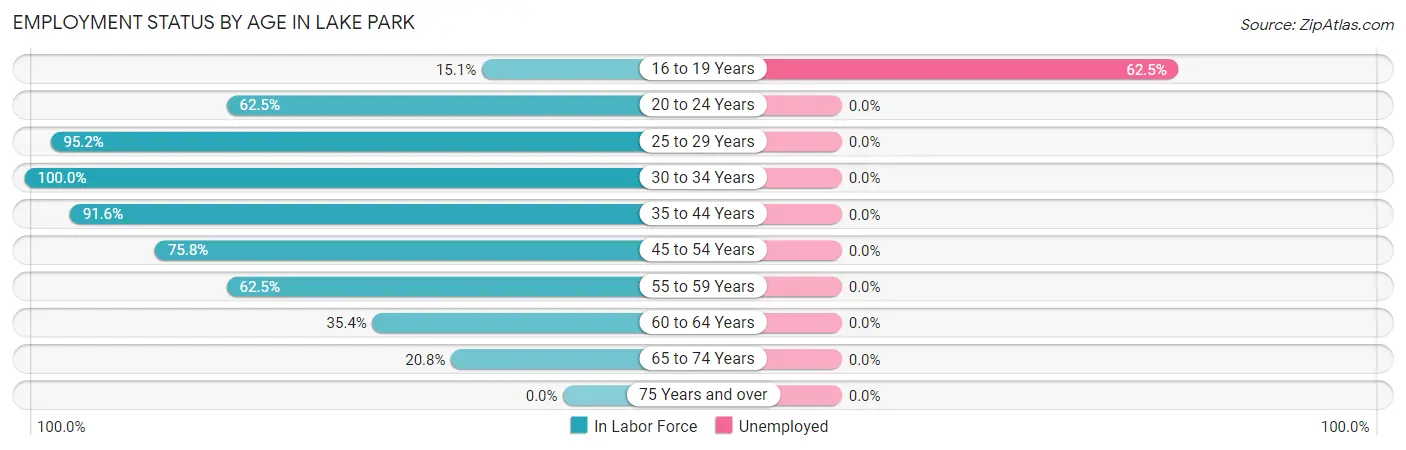
| Age Bracket | In Labor Force | Unemployed |
| 16 to 19 Years | 8 (15.1%) | 5 (62.5%) |
| 20 to 24 Years | 25 (62.5%) | 0 (0.0%) |
| 25 to 29 Years | 79 (95.2%) | 0 (0.0%) |
| 30 to 34 Years | 64 (100.0%) | 0 (0.0%) |
| 35 to 44 Years | 98 (91.6%) | 0 (0.0%) |
| 45 to 54 Years | 119 (75.8%) | 0 (0.0%) |
| 55 to 59 Years | 15 (62.5%) | 0 (0.0%) |
| 60 to 64 Years | 17 (35.4%) | 0 (0.0%) |
| 65 to 74 Years | 15 (20.8%) | 0 (0.0%) |
| 75 Years and over | 0 (0.0%) | 0 (0.0%) |
| Total | 440 (66.8%) | 5 (1.1%) |
Employment Status by Educational Attainment in Lake Park
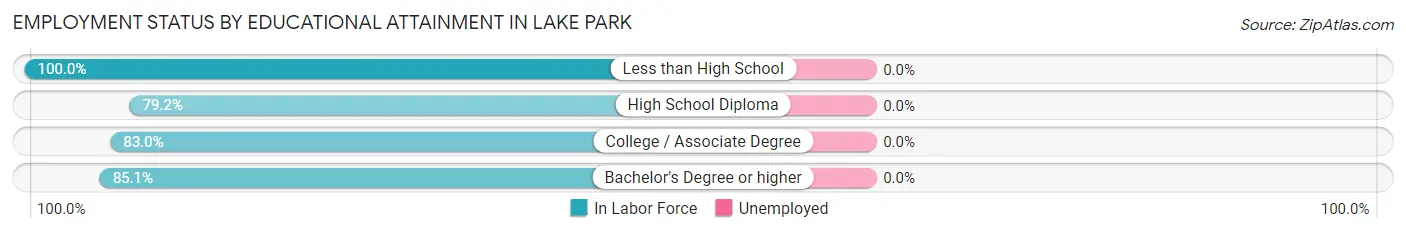
| Educational Attainment | In Labor Force | Unemployed |
| Less than High School | 11 (100.0%) | 0 (0.0%) |
| High School Diploma | 248 (79.2%) | 0 (0.0%) |
| College / Associate Degree | 93 (83.0%) | 0 (0.0%) |
| Bachelor's Degree or higher | 40 (85.1%) | 0 (0.0%) |
| Total | 392 (81.2%) | 0 (0.0%) |
Employment Occupations by Sex in Lake Park
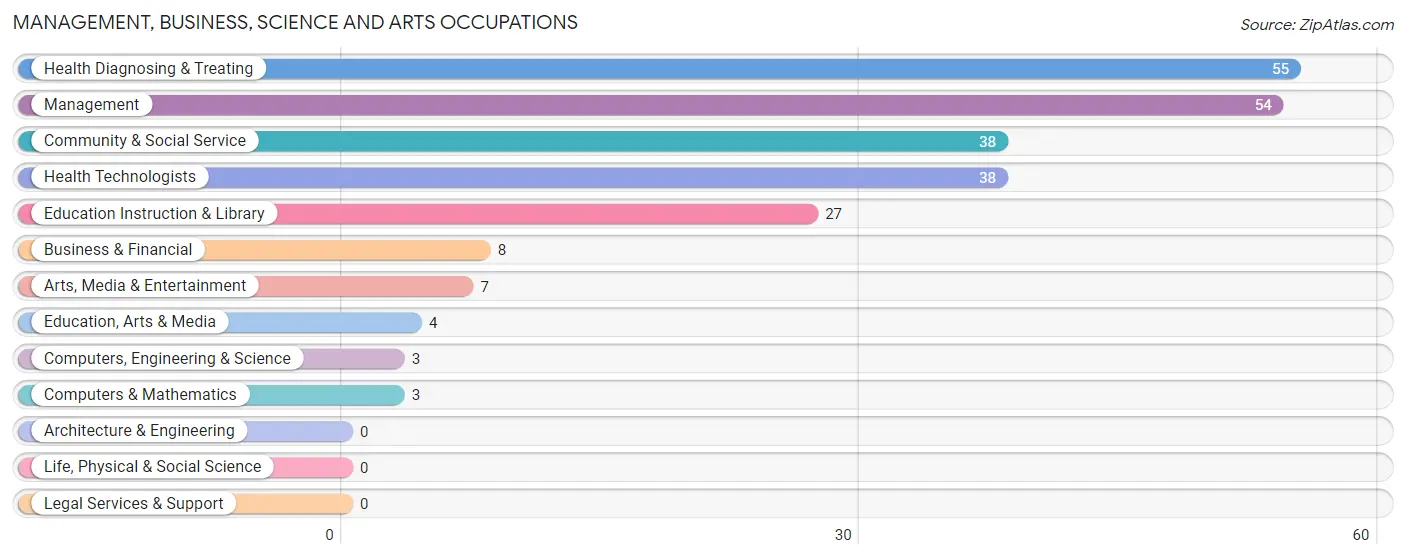
Management, Business, Science and Arts Occupations
The most common Management, Business, Science and Arts occupations in Lake Park are Health Diagnosing & Treating (55 | 12.6%), Management (54 | 12.4%), Community & Social Service (38 | 8.7%), Health Technologists (38 | 8.7%), and Education Instruction & Library (27 | 6.2%).
Management, Business, Science and Arts Occupations by Sex
Within the Management, Business, Science and Arts occupations in Lake Park, the most male-oriented occupations are Computers, Engineering & Science (100.0%), Computers & Mathematics (100.0%), and Arts, Media & Entertainment (57.1%), while the most female-oriented occupations are Education, Arts & Media (100.0%), Health Technologists (100.0%), and Health Diagnosing & Treating (80.0%).
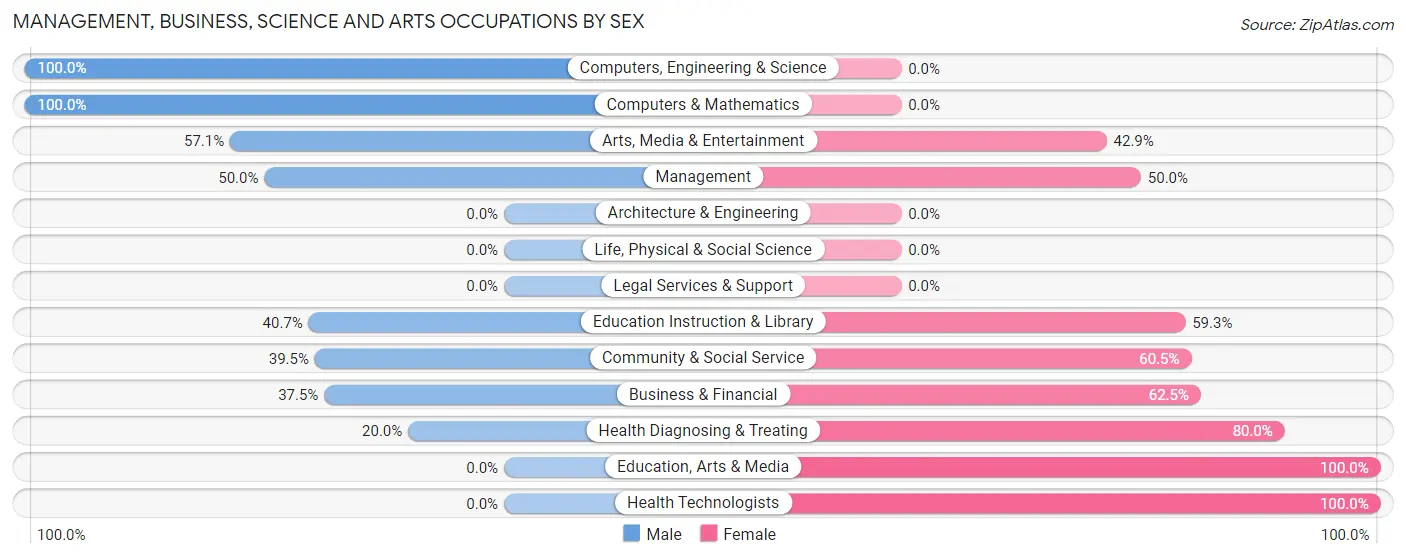
| Occupation | Male | Female |
| Management | 27 (50.0%) | 27 (50.0%) |
| Business & Financial | 3 (37.5%) | 5 (62.5%) |
| Computers, Engineering & Science | 3 (100.0%) | 0 (0.0%) |
| Computers & Mathematics | 3 (100.0%) | 0 (0.0%) |
| Architecture & Engineering | 0 (0.0%) | 0 (0.0%) |
| Life, Physical & Social Science | 0 (0.0%) | 0 (0.0%) |
| Community & Social Service | 15 (39.5%) | 23 (60.5%) |
| Education, Arts & Media | 0 (0.0%) | 4 (100.0%) |
| Legal Services & Support | 0 (0.0%) | 0 (0.0%) |
| Education Instruction & Library | 11 (40.7%) | 16 (59.3%) |
| Arts, Media & Entertainment | 4 (57.1%) | 3 (42.9%) |
| Health Diagnosing & Treating | 11 (20.0%) | 44 (80.0%) |
| Health Technologists | 0 (0.0%) | 38 (100.0%) |
| Total (Category) | 59 (37.3%) | 99 (62.7%) |
| Total (Overall) | 169 (38.9%) | 266 (61.2%) |
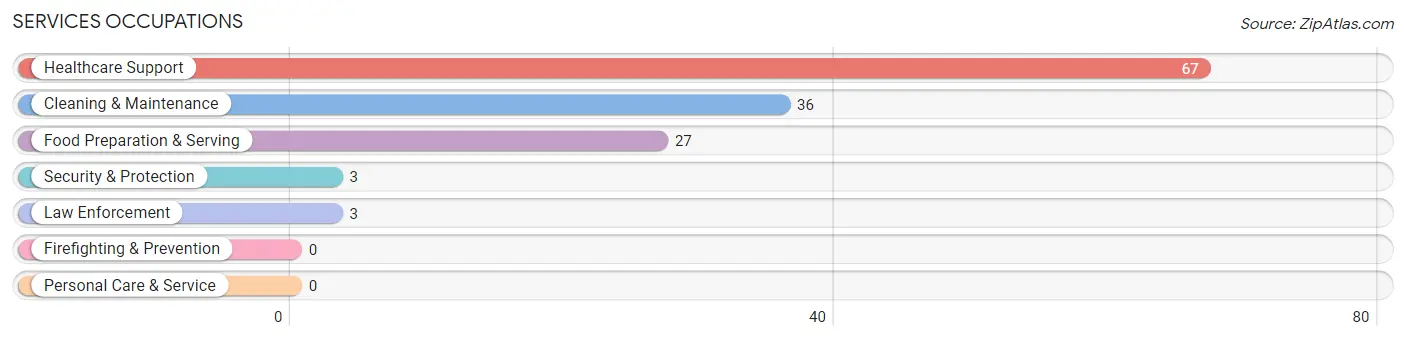
Services Occupations
The most common Services occupations in Lake Park are Healthcare Support (67 | 15.4%), Cleaning & Maintenance (36 | 8.3%), Food Preparation & Serving (27 | 6.2%), Security & Protection (3 | 0.7%), and Law Enforcement (3 | 0.7%).
Services Occupations by Sex
Within the Services occupations in Lake Park, the most male-oriented occupations are Security & Protection (100.0%), Law Enforcement (100.0%), and Cleaning & Maintenance (100.0%), while the most female-oriented occupations are Healthcare Support (100.0%), and Food Preparation & Serving (100.0%).
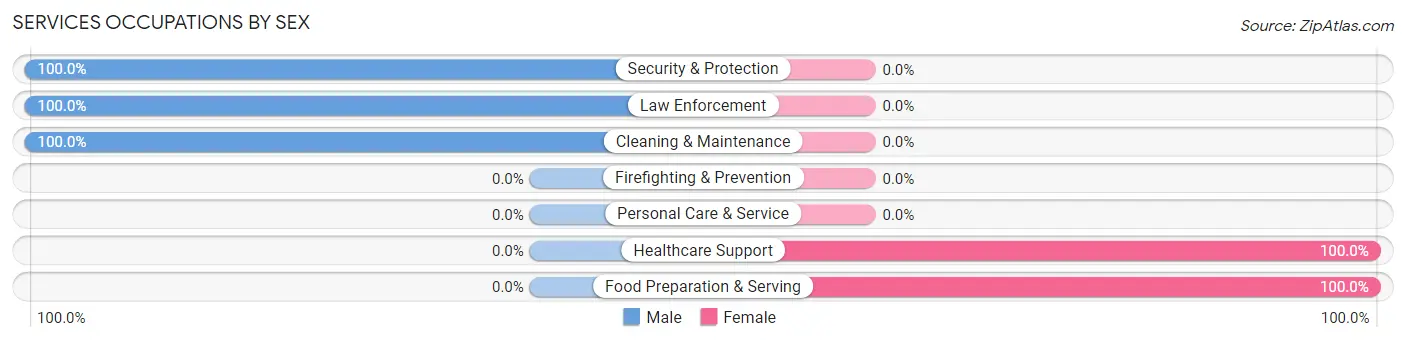
| Occupation | Male | Female |
| Healthcare Support | 0 (0.0%) | 67 (100.0%) |
| Security & Protection | 3 (100.0%) | 0 (0.0%) |
| Firefighting & Prevention | 0 (0.0%) | 0 (0.0%) |
| Law Enforcement | 3 (100.0%) | 0 (0.0%) |
| Food Preparation & Serving | 0 (0.0%) | 27 (100.0%) |
| Cleaning & Maintenance | 36 (100.0%) | 0 (0.0%) |
| Personal Care & Service | 0 (0.0%) | 0 (0.0%) |
| Total (Category) | 39 (29.3%) | 94 (70.7%) |
| Total (Overall) | 169 (38.9%) | 266 (61.2%) |
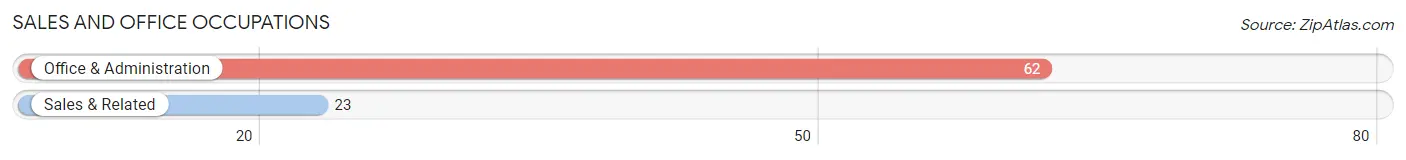
Sales and Office Occupations
The most common Sales and Office occupations in Lake Park are Office & Administration (62 | 14.2%), and Sales & Related (23 | 5.3%).
Sales and Office Occupations by Sex
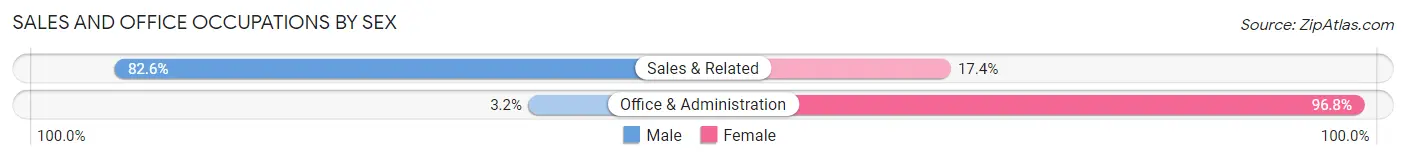
| Occupation | Male | Female |
| Sales & Related | 19 (82.6%) | 4 (17.4%) |
| Office & Administration | 2 (3.2%) | 60 (96.8%) |
| Total (Category) | 21 (24.7%) | 64 (75.3%) |
| Total (Overall) | 169 (38.9%) | 266 (61.2%) |
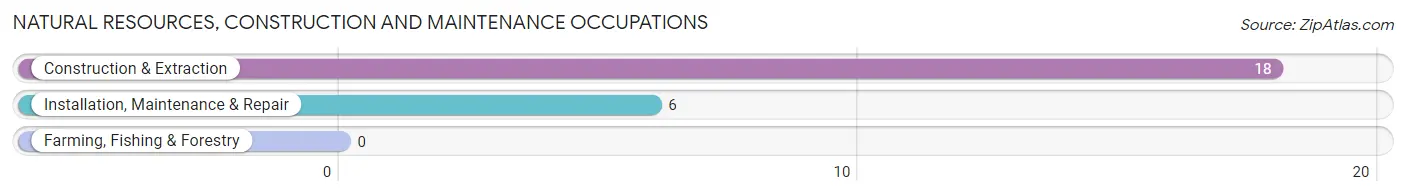
Natural Resources, Construction and Maintenance Occupations
The most common Natural Resources, Construction and Maintenance occupations in Lake Park are Construction & Extraction (18 | 4.1%), and Installation, Maintenance & Repair (6 | 1.4%).
Natural Resources, Construction and Maintenance Occupations by Sex
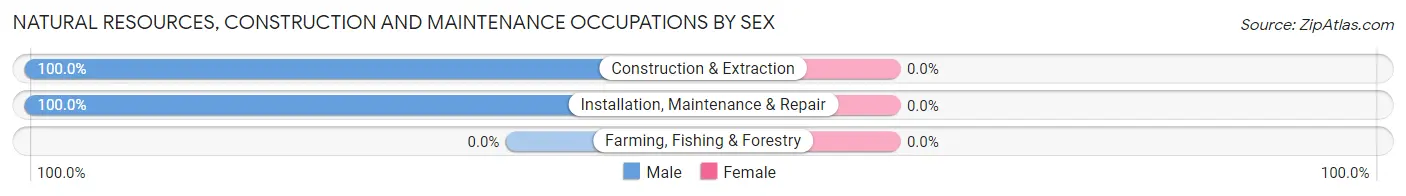
| Occupation | Male | Female |
| Farming, Fishing & Forestry | 0 (0.0%) | 0 (0.0%) |
| Construction & Extraction | 18 (100.0%) | 0 (0.0%) |
| Installation, Maintenance & Repair | 6 (100.0%) | 0 (0.0%) |
| Total (Category) | 24 (100.0%) | 0 (0.0%) |
| Total (Overall) | 169 (38.9%) | 266 (61.2%) |
Production, Transportation and Moving Occupations
The most common Production, Transportation and Moving occupations in Lake Park are Transportation (18 | 4.1%), and Production (17 | 3.9%).
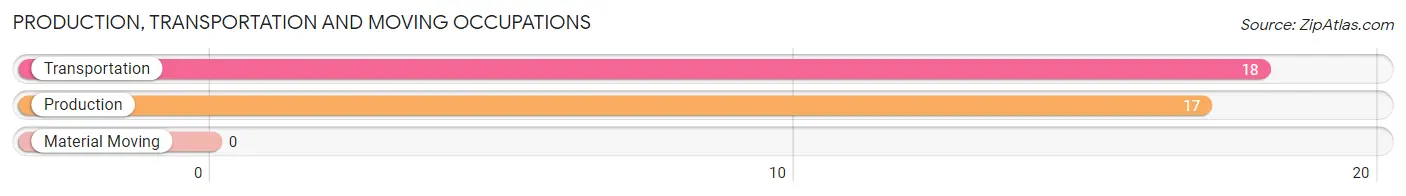
Production, Transportation and Moving Occupations by Sex
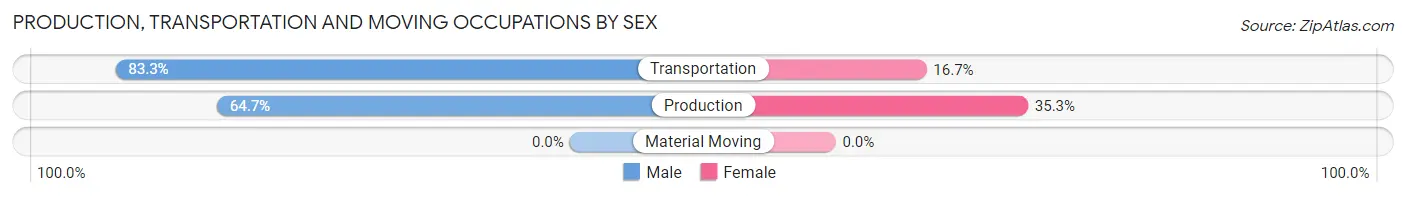
| Occupation | Male | Female |
| Production | 11 (64.7%) | 6 (35.3%) |
| Transportation | 15 (83.3%) | 3 (16.7%) |
| Material Moving | 0 (0.0%) | 0 (0.0%) |
| Total (Category) | 26 (74.3%) | 9 (25.7%) |
| Total (Overall) | 169 (38.9%) | 266 (61.2%) |
Employment Industries by Sex in Lake Park
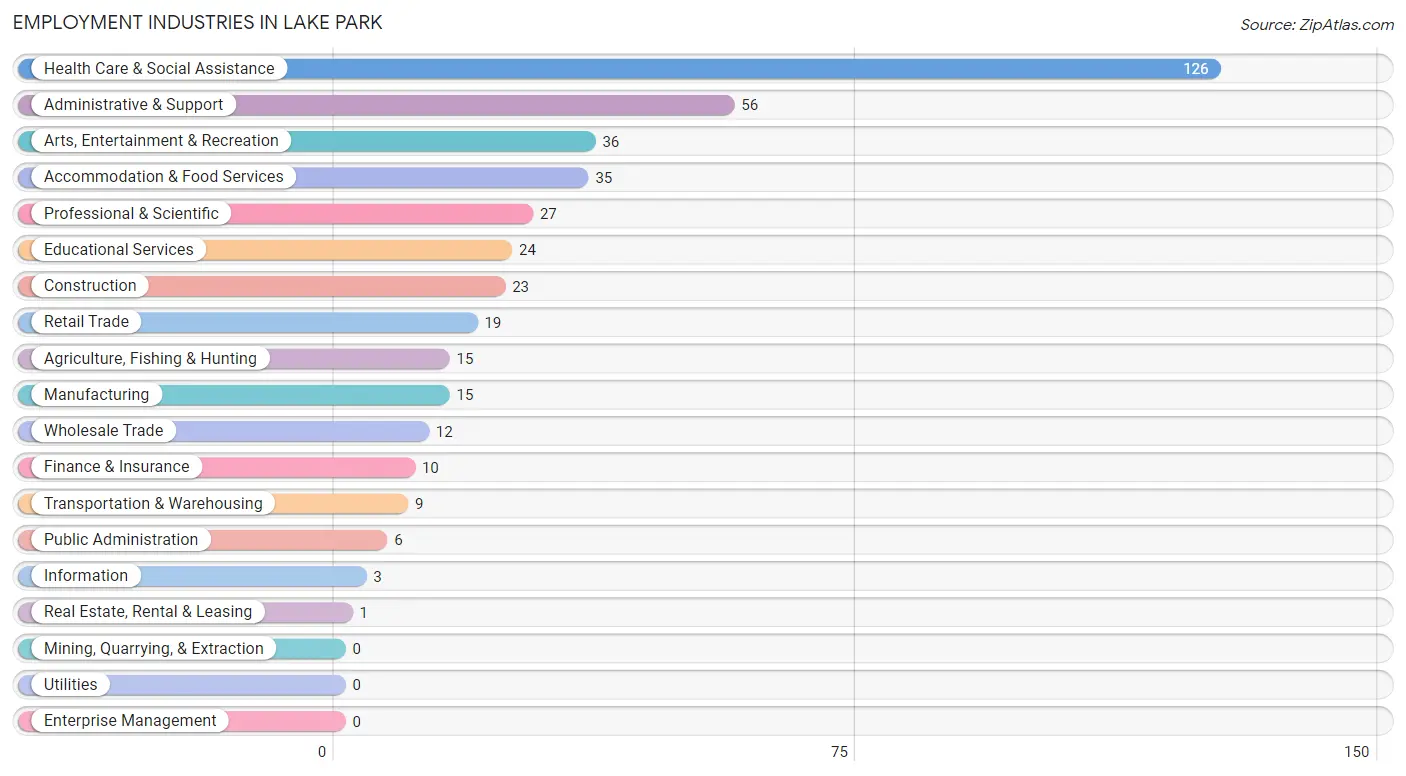
Employment Industries in Lake Park
The major employment industries in Lake Park include Health Care & Social Assistance (126 | 29.0%), Administrative & Support (56 | 12.9%), Arts, Entertainment & Recreation (36 | 8.3%), Accommodation & Food Services (35 | 8.1%), and Professional & Scientific (27 | 6.2%).
Employment Industries by Sex in Lake Park
The Lake Park industries that see more men than women are Wholesale Trade (100.0%), Real Estate, Rental & Leasing (100.0%), and Arts, Entertainment & Recreation (100.0%), whereas the industries that tend to have a higher number of women are Agriculture, Fishing & Hunting (100.0%), Information (100.0%), and Accommodation & Food Services (100.0%).
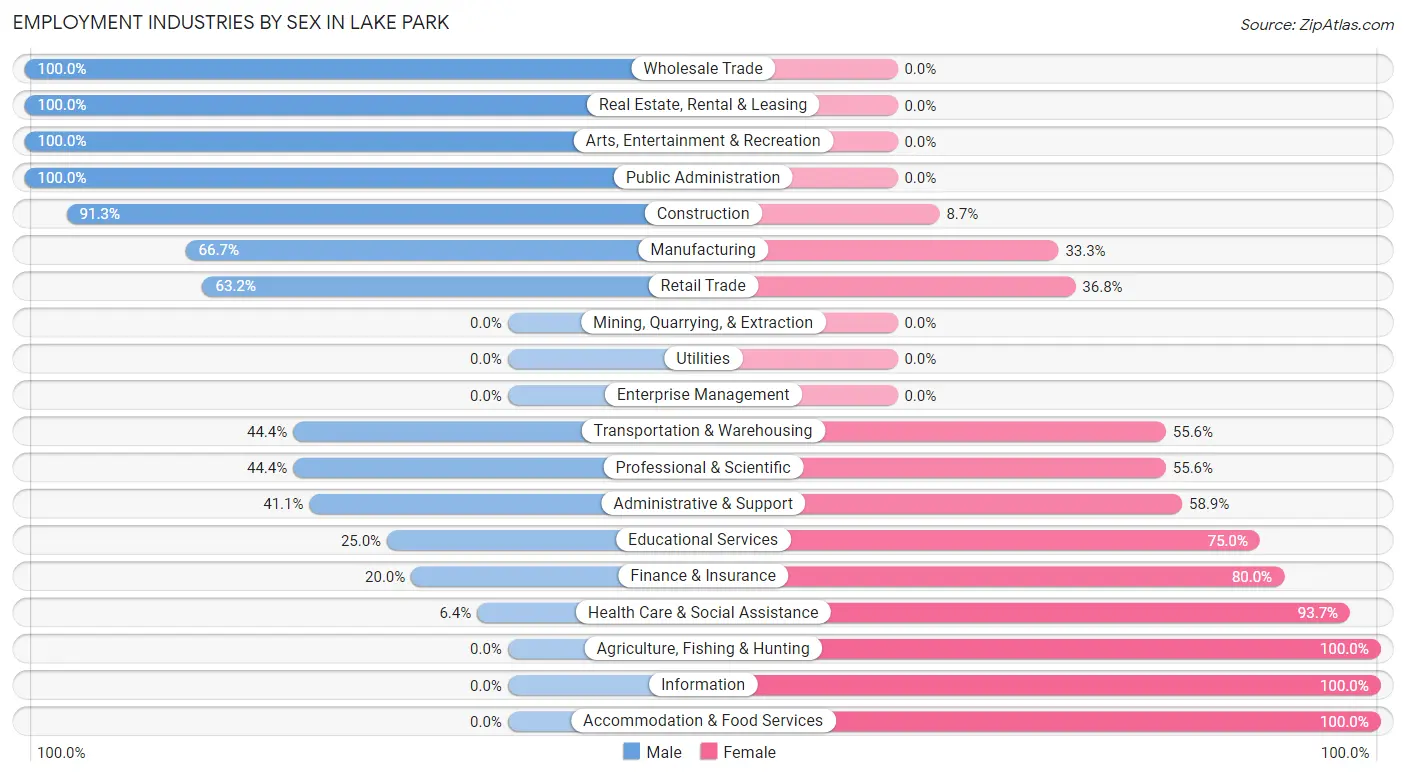
| Industry | Male | Female |
| Agriculture, Fishing & Hunting | 0 (0.0%) | 15 (100.0%) |
| Mining, Quarrying, & Extraction | 0 (0.0%) | 0 (0.0%) |
| Construction | 21 (91.3%) | 2 (8.7%) |
| Manufacturing | 10 (66.7%) | 5 (33.3%) |
| Wholesale Trade | 12 (100.0%) | 0 (0.0%) |
| Retail Trade | 12 (63.2%) | 7 (36.8%) |
| Transportation & Warehousing | 4 (44.4%) | 5 (55.6%) |
| Utilities | 0 (0.0%) | 0 (0.0%) |
| Information | 0 (0.0%) | 3 (100.0%) |
| Finance & Insurance | 2 (20.0%) | 8 (80.0%) |
| Real Estate, Rental & Leasing | 1 (100.0%) | 0 (0.0%) |
| Professional & Scientific | 12 (44.4%) | 15 (55.6%) |
| Enterprise Management | 0 (0.0%) | 0 (0.0%) |
| Administrative & Support | 23 (41.1%) | 33 (58.9%) |
| Educational Services | 6 (25.0%) | 18 (75.0%) |
| Health Care & Social Assistance | 8 (6.4%) | 118 (93.6%) |
| Arts, Entertainment & Recreation | 36 (100.0%) | 0 (0.0%) |
| Accommodation & Food Services | 0 (0.0%) | 35 (100.0%) |
| Public Administration | 6 (100.0%) | 0 (0.0%) |
| Total | 169 (38.9%) | 266 (61.2%) |
Education in Lake Park
School Enrollment in Lake Park
The most common levels of schooling among the 237 students in Lake Park are elementary school (95 | 40.1%), middle school (53 | 22.4%), and high school (36 | 15.2%).
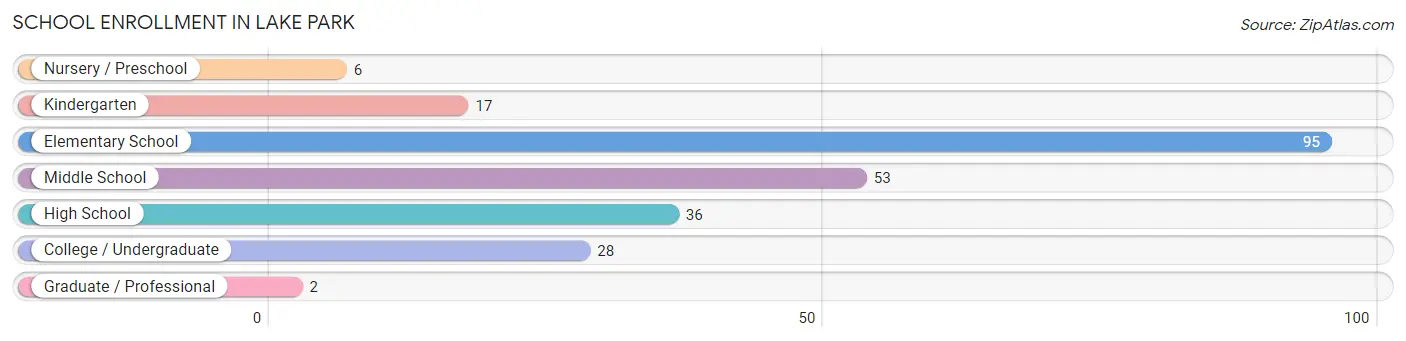
| School Level | # Students | % Students |
| Nursery / Preschool | 6 | 2.5% |
| Kindergarten | 17 | 7.2% |
| Elementary School | 95 | 40.1% |
| Middle School | 53 | 22.4% |
| High School | 36 | 15.2% |
| College / Undergraduate | 28 | 11.8% |
| Graduate / Professional | 2 | 0.8% |
| Total | 237 | 100.0% |
School Enrollment by Age by Funding Source in Lake Park
Out of a total of 237 students who are enrolled in schools in Lake Park, 18 (7.6%) attend a private institution, while the remaining 219 (92.4%) are enrolled in public schools. The age group of 15 to 17 year olds has the highest likelihood of being enrolled in private schools, with 14 (41.2% in the age bracket) enrolled. Conversely, the age group of 3 to 4 year olds has the lowest likelihood of being enrolled in a private school, with 9 (100.0% in the age bracket) attending a public institution.
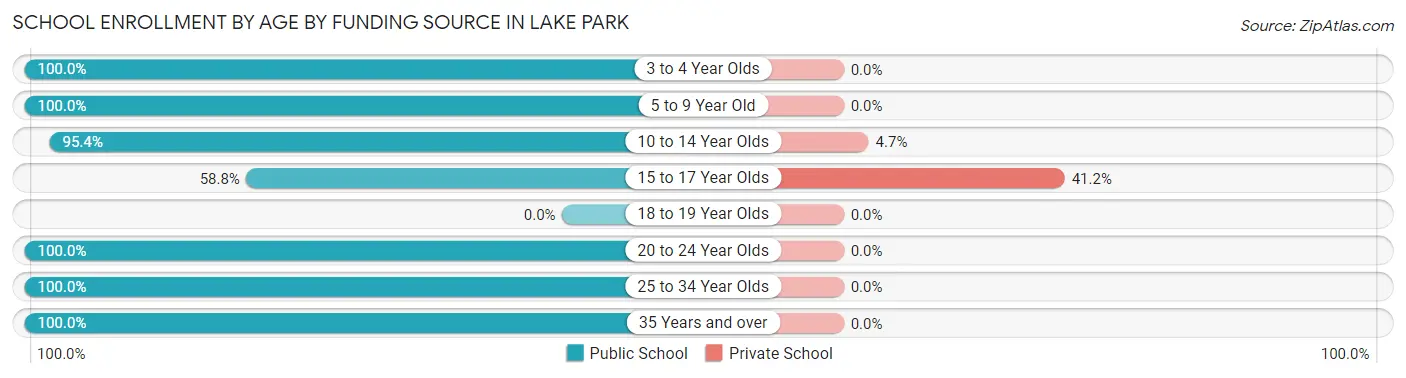
| Age Bracket | Public School | Private School |
| 3 to 4 Year Olds | 9 (100.0%) | 0 (0.0%) |
| 5 to 9 Year Old | 80 (100.0%) | 0 (0.0%) |
| 10 to 14 Year Olds | 82 (95.4%) | 4 (4.6%) |
| 15 to 17 Year Olds | 20 (58.8%) | 14 (41.2%) |
| 18 to 19 Year Olds | 0 (0.0%) | 0 (0.0%) |
| 20 to 24 Year Olds | 21 (100.0%) | 0 (0.0%) |
| 25 to 34 Year Olds | 5 (100.0%) | 0 (0.0%) |
| 35 Years and over | 2 (100.0%) | 0 (0.0%) |
| Total | 219 (92.4%) | 18 (7.6%) |
Educational Attainment by Field of Study in Lake Park
Education (13 | 20.6%), psychology (12 | 19.1%), science & technology (12 | 19.1%), business (11 | 17.5%), and liberal arts & history (5 | 7.9%) are the most common fields of study among 63 individuals in Lake Park who have obtained a bachelor's degree or higher.
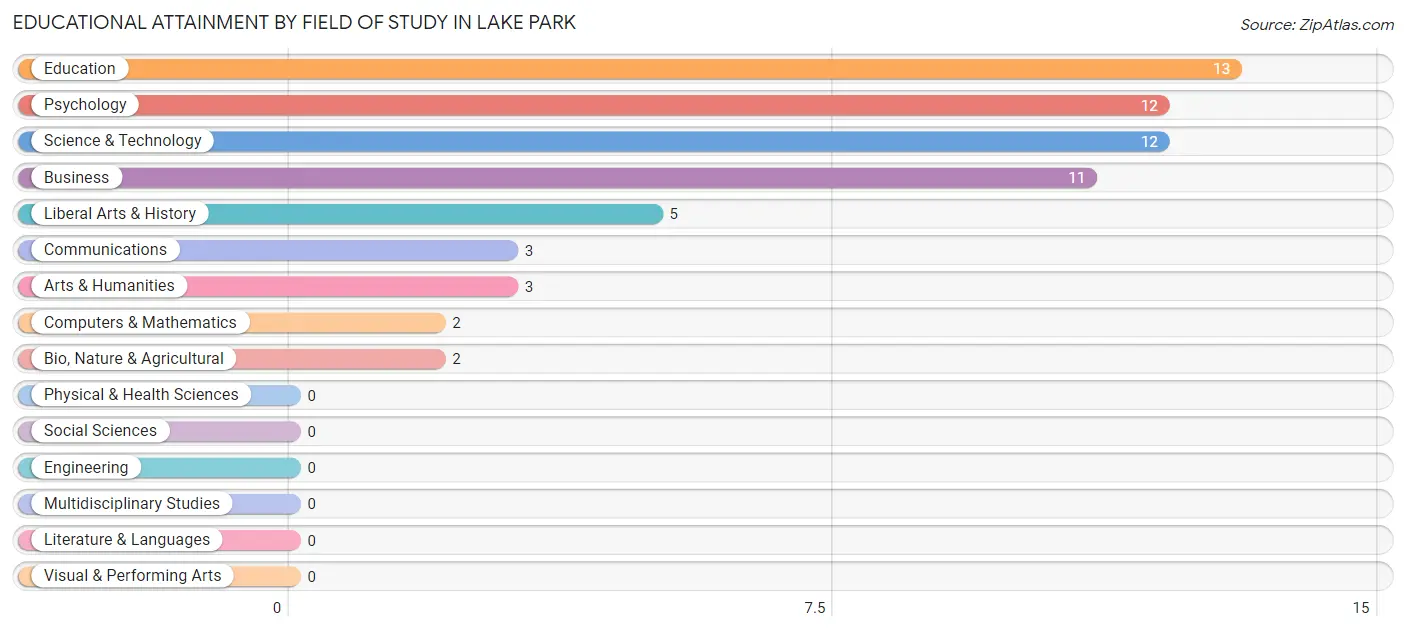
| Field of Study | # Graduates | % Graduates |
| Computers & Mathematics | 2 | 3.2% |
| Bio, Nature & Agricultural | 2 | 3.2% |
| Physical & Health Sciences | 0 | 0.0% |
| Psychology | 12 | 19.1% |
| Social Sciences | 0 | 0.0% |
| Engineering | 0 | 0.0% |
| Multidisciplinary Studies | 0 | 0.0% |
| Science & Technology | 12 | 19.1% |
| Business | 11 | 17.5% |
| Education | 13 | 20.6% |
| Literature & Languages | 0 | 0.0% |
| Liberal Arts & History | 5 | 7.9% |
| Visual & Performing Arts | 0 | 0.0% |
| Communications | 3 | 4.8% |
| Arts & Humanities | 3 | 4.8% |
| Total | 63 | 100.0% |
Transportation & Commute in Lake Park
Vehicle Availability by Sex in Lake Park
The most prevalent vehicle ownership categories in Lake Park are males with 2 vehicles (77, accounting for 46.1%) and females with 2 vehicles (147, making up 29.3%).
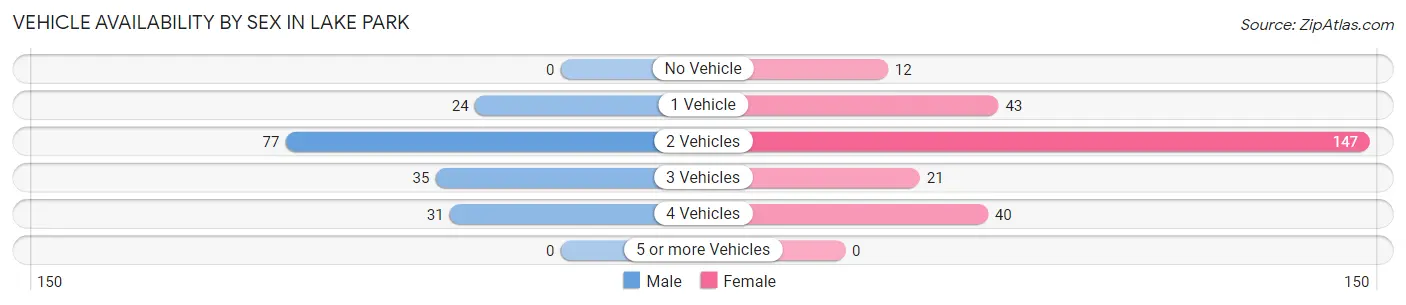
| Vehicles Available | Male | Female |
| No Vehicle | 0 (0.0%) | 12 (4.6%) |
| 1 Vehicle | 24 (14.4%) | 43 (16.4%) |
| 2 Vehicles | 77 (46.1%) | 147 (55.9%) |
| 3 Vehicles | 35 (21.0%) | 21 (8.0%) |
| 4 Vehicles | 31 (18.6%) | 40 (15.2%) |
| 5 or more Vehicles | 0 (0.0%) | 0 (0.0%) |
| Total | 167 (100.0%) | 263 (100.0%) |
Commute Time in Lake Park
The most frequently occuring commute durations in Lake Park are 25 to 29 minutes (104 commuters, 26.6%), 20 to 24 minutes (100 commuters, 25.6%), and 15 to 19 minutes (59 commuters, 15.1%).
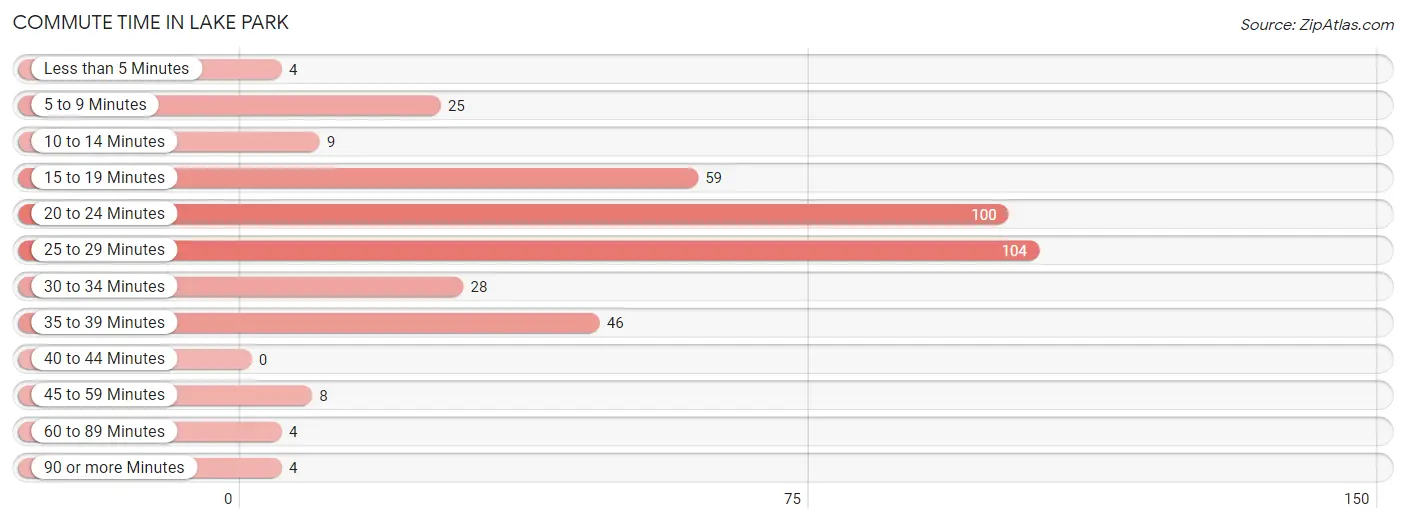
| Commute Time | # Commuters | % Commuters |
| Less than 5 Minutes | 4 | 1.0% |
| 5 to 9 Minutes | 25 | 6.4% |
| 10 to 14 Minutes | 9 | 2.3% |
| 15 to 19 Minutes | 59 | 15.1% |
| 20 to 24 Minutes | 100 | 25.6% |
| 25 to 29 Minutes | 104 | 26.6% |
| 30 to 34 Minutes | 28 | 7.2% |
| 35 to 39 Minutes | 46 | 11.8% |
| 40 to 44 Minutes | 0 | 0.0% |
| 45 to 59 Minutes | 8 | 2.1% |
| 60 to 89 Minutes | 4 | 1.0% |
| 90 or more Minutes | 4 | 1.0% |
Commute Time by Sex in Lake Park
The most common commute times in Lake Park are 20 to 24 minutes (53 commuters, 32.9%) for males and 25 to 29 minutes (91 commuters, 39.6%) for females.
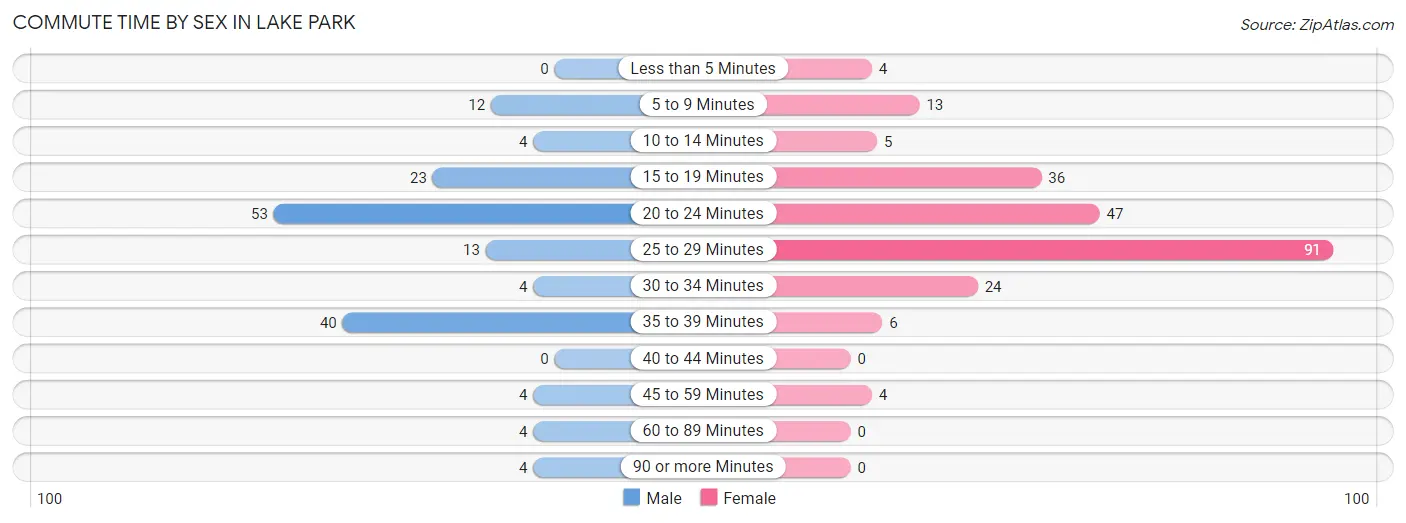
| Commute Time | Male | Female |
| Less than 5 Minutes | 0 (0.0%) | 4 (1.7%) |
| 5 to 9 Minutes | 12 (7.4%) | 13 (5.7%) |
| 10 to 14 Minutes | 4 (2.5%) | 5 (2.2%) |
| 15 to 19 Minutes | 23 (14.3%) | 36 (15.7%) |
| 20 to 24 Minutes | 53 (32.9%) | 47 (20.4%) |
| 25 to 29 Minutes | 13 (8.1%) | 91 (39.6%) |
| 30 to 34 Minutes | 4 (2.5%) | 24 (10.4%) |
| 35 to 39 Minutes | 40 (24.8%) | 6 (2.6%) |
| 40 to 44 Minutes | 0 (0.0%) | 0 (0.0%) |
| 45 to 59 Minutes | 4 (2.5%) | 4 (1.7%) |
| 60 to 89 Minutes | 4 (2.5%) | 0 (0.0%) |
| 90 or more Minutes | 4 (2.5%) | 0 (0.0%) |
Time of Departure to Work by Sex in Lake Park
The most frequent times of departure to work in Lake Park are 7:30 AM to 7:59 AM (41, 25.5%) for males and 12:00 PM to 3:59 PM (74, 32.2%) for females.
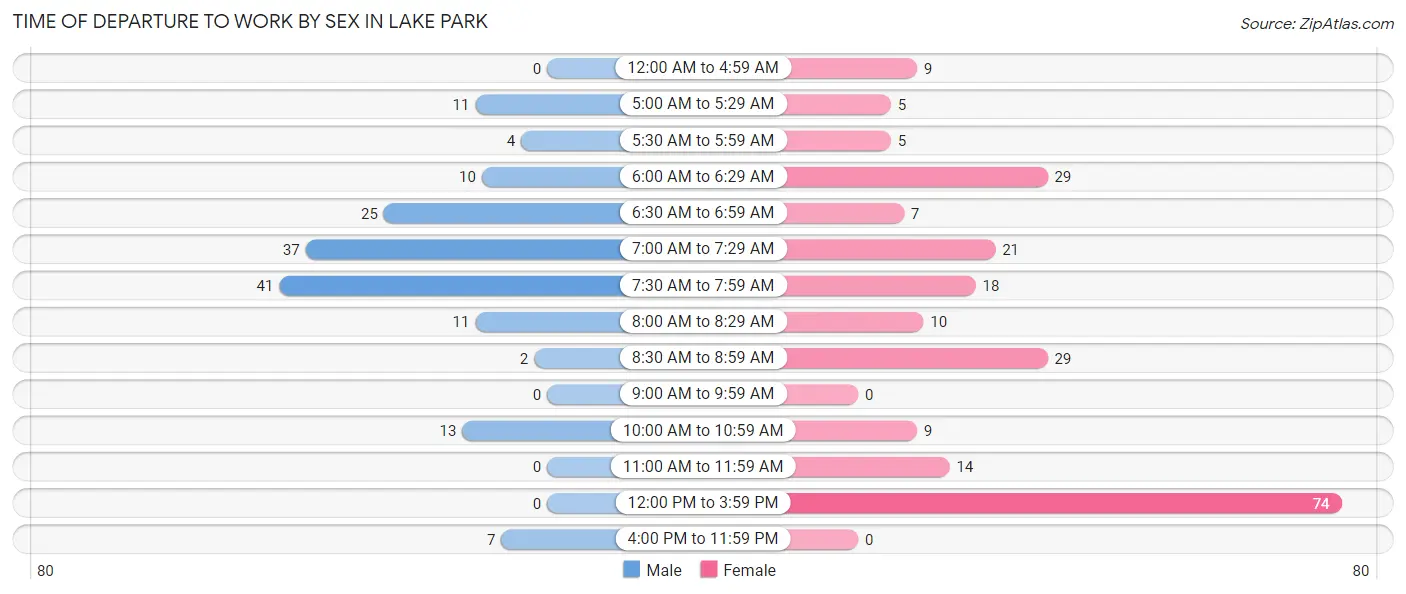
| Time of Departure | Male | Female |
| 12:00 AM to 4:59 AM | 0 (0.0%) | 9 (3.9%) |
| 5:00 AM to 5:29 AM | 11 (6.8%) | 5 (2.2%) |
| 5:30 AM to 5:59 AM | 4 (2.5%) | 5 (2.2%) |
| 6:00 AM to 6:29 AM | 10 (6.2%) | 29 (12.6%) |
| 6:30 AM to 6:59 AM | 25 (15.5%) | 7 (3.0%) |
| 7:00 AM to 7:29 AM | 37 (23.0%) | 21 (9.1%) |
| 7:30 AM to 7:59 AM | 41 (25.5%) | 18 (7.8%) |
| 8:00 AM to 8:29 AM | 11 (6.8%) | 10 (4.3%) |
| 8:30 AM to 8:59 AM | 2 (1.2%) | 29 (12.6%) |
| 9:00 AM to 9:59 AM | 0 (0.0%) | 0 (0.0%) |
| 10:00 AM to 10:59 AM | 13 (8.1%) | 9 (3.9%) |
| 11:00 AM to 11:59 AM | 0 (0.0%) | 14 (6.1%) |
| 12:00 PM to 3:59 PM | 0 (0.0%) | 74 (32.2%) |
| 4:00 PM to 11:59 PM | 7 (4.3%) | 0 (0.0%) |
| Total | 161 (100.0%) | 230 (100.0%) |
Housing Occupancy in Lake Park
Occupancy by Ownership in Lake Park
Of the total 337 dwellings in Lake Park, owner-occupied units account for 168 (49.8%), while renter-occupied units make up 169 (50.1%).
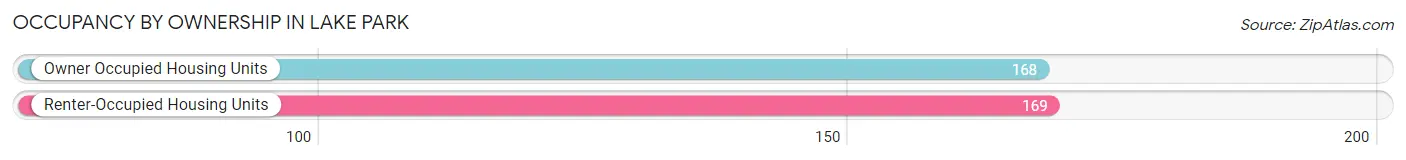
| Occupancy | # Housing Units | % Housing Units |
| Owner Occupied Housing Units | 168 | 49.8% |
| Renter-Occupied Housing Units | 169 | 50.1% |
| Total Occupied Housing Units | 337 | 100.0% |
Occupancy by Household Size in Lake Park
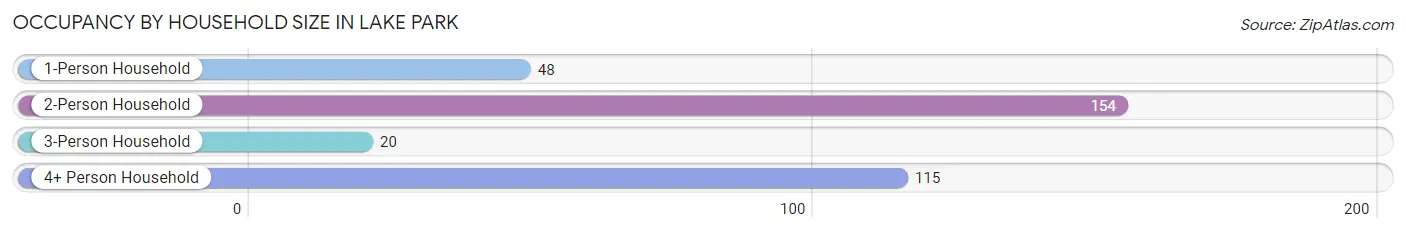
| Household Size | # Housing Units | % Housing Units |
| 1-Person Household | 48 | 14.2% |
| 2-Person Household | 154 | 45.7% |
| 3-Person Household | 20 | 5.9% |
| 4+ Person Household | 115 | 34.1% |
| Total Housing Units | 337 | 100.0% |
Occupancy by Ownership by Household Size in Lake Park
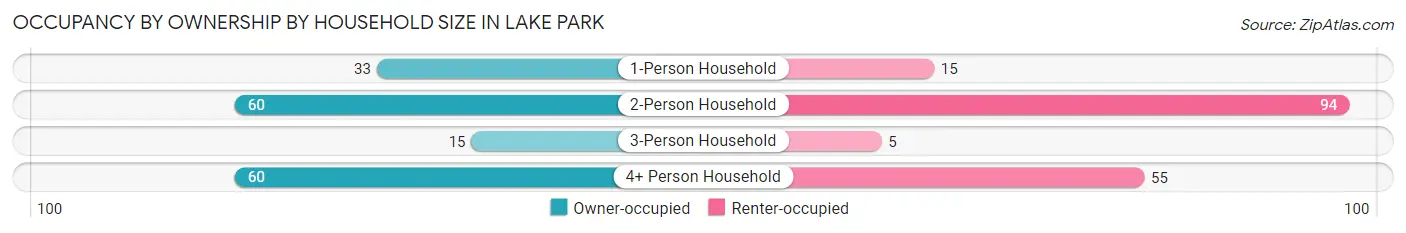
| Household Size | Owner-occupied | Renter-occupied |
| 1-Person Household | 33 (68.8%) | 15 (31.2%) |
| 2-Person Household | 60 (39.0%) | 94 (61.0%) |
| 3-Person Household | 15 (75.0%) | 5 (25.0%) |
| 4+ Person Household | 60 (52.2%) | 55 (47.8%) |
| Total Housing Units | 168 (49.8%) | 169 (50.1%) |
Occupancy by Educational Attainment in Lake Park
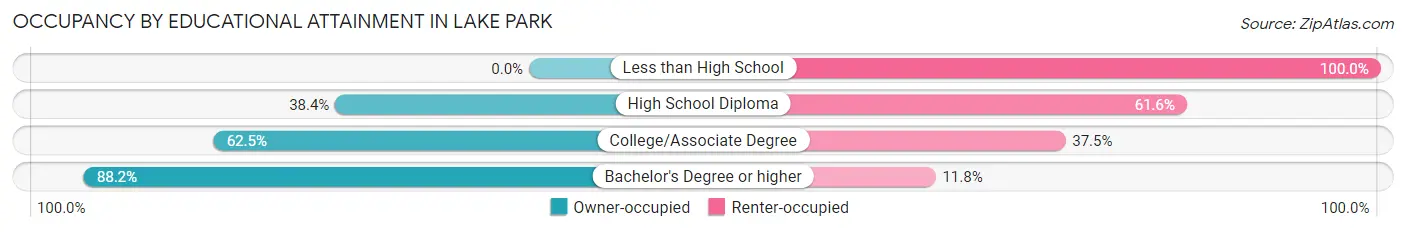
| Household Size | Owner-occupied | Renter-occupied |
| Less than High School | 0 (0.0%) | 4 (100.0%) |
| High School Diploma | 78 (38.4%) | 125 (61.6%) |
| College/Associate Degree | 60 (62.5%) | 36 (37.5%) |
| Bachelor's Degree or higher | 30 (88.2%) | 4 (11.8%) |
Occupancy by Age of Householder in Lake Park
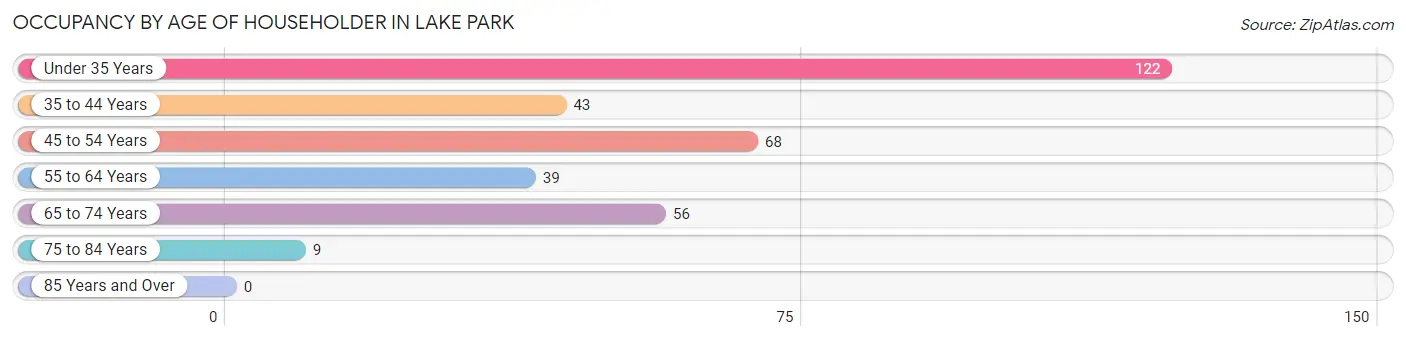
| Age Bracket | # Households | % Households |
| Under 35 Years | 122 | 36.2% |
| 35 to 44 Years | 43 | 12.8% |
| 45 to 54 Years | 68 | 20.2% |
| 55 to 64 Years | 39 | 11.6% |
| 65 to 74 Years | 56 | 16.6% |
| 75 to 84 Years | 9 | 2.7% |
| 85 Years and Over | 0 | 0.0% |
| Total | 337 | 100.0% |
Housing Finances in Lake Park
Median Income by Occupancy in Lake Park
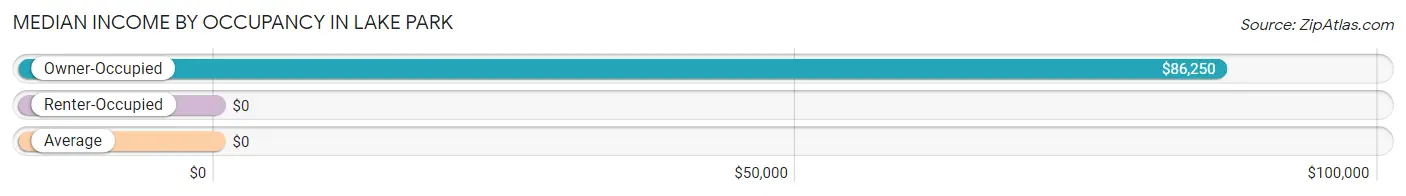
| Occupancy Type | # Households | Median Income |
| Owner-Occupied | 168 (49.8%) | $86,250 |
| Renter-Occupied | 169 (50.1%) | $0 |
| Average | 337 (100.0%) | $0 |
Occupancy by Householder Income Bracket in Lake Park
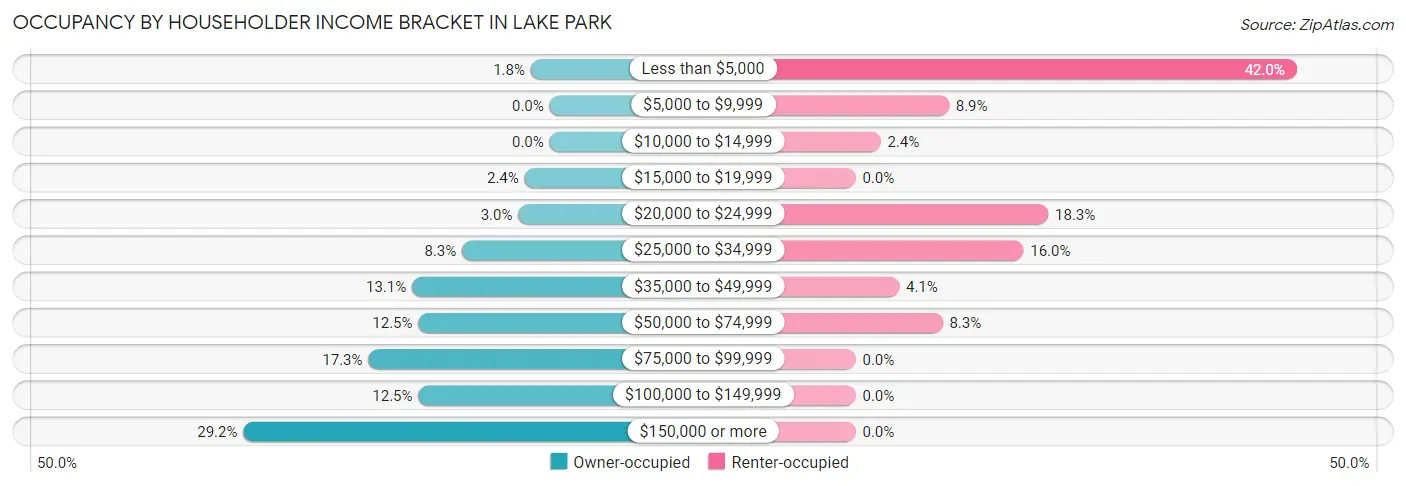
| Income Bracket | Owner-occupied | Renter-occupied |
| Less than $5,000 | 3 (1.8%) | 71 (42.0%) |
| $5,000 to $9,999 | 0 (0.0%) | 15 (8.9%) |
| $10,000 to $14,999 | 0 (0.0%) | 4 (2.4%) |
| $15,000 to $19,999 | 4 (2.4%) | 0 (0.0%) |
| $20,000 to $24,999 | 5 (3.0%) | 31 (18.3%) |
| $25,000 to $34,999 | 14 (8.3%) | 27 (16.0%) |
| $35,000 to $49,999 | 22 (13.1%) | 7 (4.1%) |
| $50,000 to $74,999 | 21 (12.5%) | 14 (8.3%) |
| $75,000 to $99,999 | 29 (17.3%) | 0 (0.0%) |
| $100,000 to $149,999 | 21 (12.5%) | 0 (0.0%) |
| $150,000 or more | 49 (29.2%) | 0 (0.0%) |
| Total | 168 (100.0%) | 169 (100.0%) |
Monthly Housing Cost Tiers in Lake Park
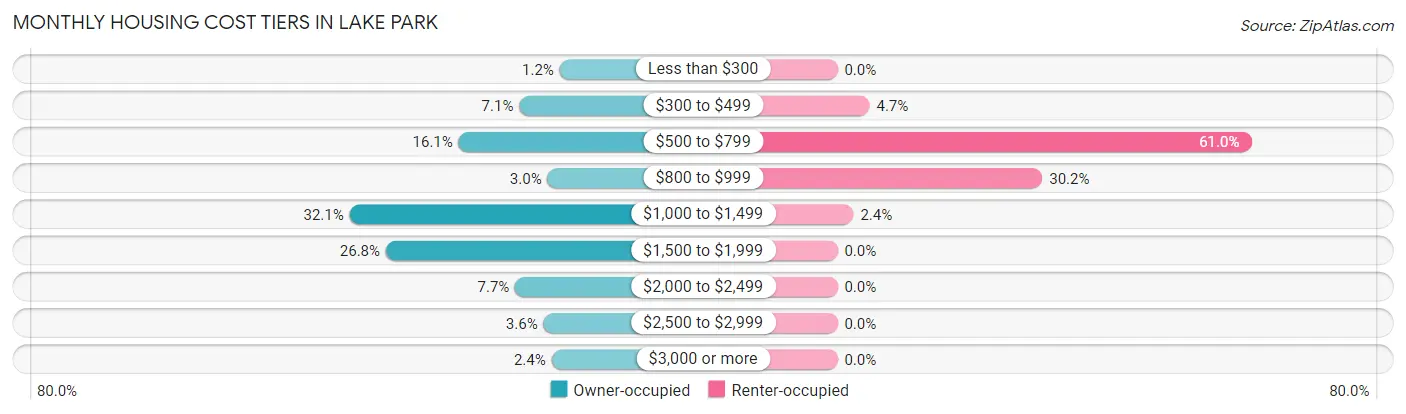
| Monthly Cost | Owner-occupied | Renter-occupied |
| Less than $300 | 2 (1.2%) | 0 (0.0%) |
| $300 to $499 | 12 (7.1%) | 8 (4.7%) |
| $500 to $799 | 27 (16.1%) | 103 (61.0%) |
| $800 to $999 | 5 (3.0%) | 51 (30.2%) |
| $1,000 to $1,499 | 54 (32.1%) | 4 (2.4%) |
| $1,500 to $1,999 | 45 (26.8%) | 0 (0.0%) |
| $2,000 to $2,499 | 13 (7.7%) | 0 (0.0%) |
| $2,500 to $2,999 | 6 (3.6%) | 0 (0.0%) |
| $3,000 or more | 4 (2.4%) | 0 (0.0%) |
| Total | 168 (100.0%) | 169 (100.0%) |
Physical Housing Characteristics in Lake Park
Housing Structures in Lake Park
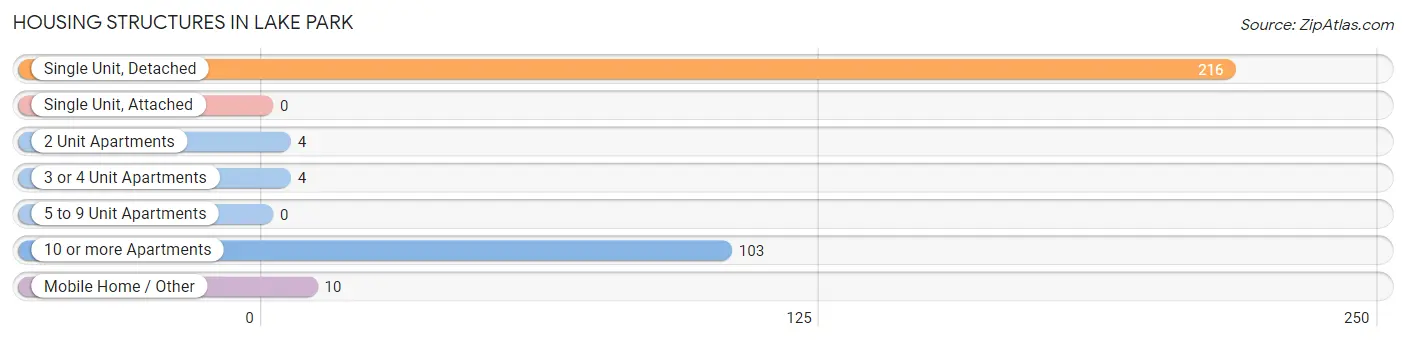
| Structure Type | # Housing Units | % Housing Units |
| Single Unit, Detached | 216 | 64.1% |
| Single Unit, Attached | 0 | 0.0% |
| 2 Unit Apartments | 4 | 1.2% |
| 3 or 4 Unit Apartments | 4 | 1.2% |
| 5 to 9 Unit Apartments | 0 | 0.0% |
| 10 or more Apartments | 103 | 30.6% |
| Mobile Home / Other | 10 | 3.0% |
| Total | 337 | 100.0% |
Housing Structures by Occupancy in Lake Park
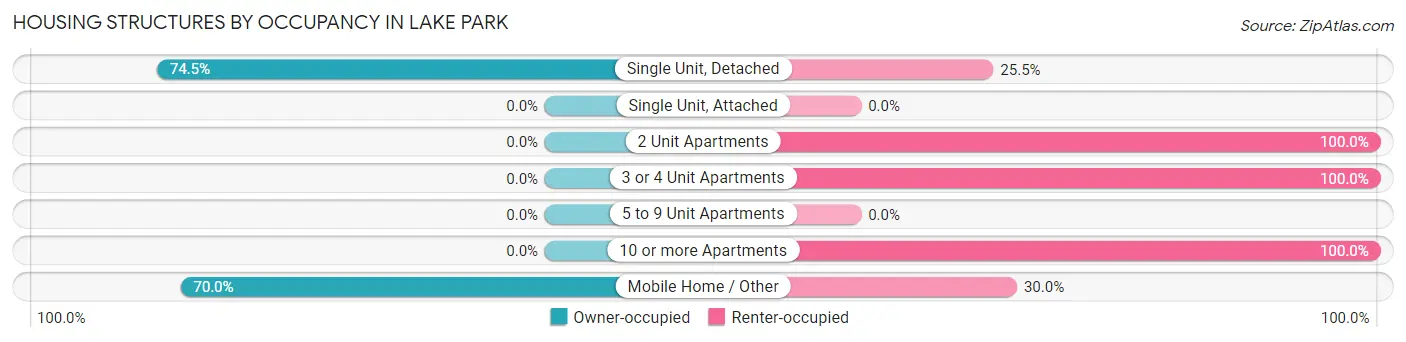
| Structure Type | Owner-occupied | Renter-occupied |
| Single Unit, Detached | 161 (74.5%) | 55 (25.5%) |
| Single Unit, Attached | 0 (0.0%) | 0 (0.0%) |
| 2 Unit Apartments | 0 (0.0%) | 4 (100.0%) |
| 3 or 4 Unit Apartments | 0 (0.0%) | 4 (100.0%) |
| 5 to 9 Unit Apartments | 0 (0.0%) | 0 (0.0%) |
| 10 or more Apartments | 0 (0.0%) | 103 (100.0%) |
| Mobile Home / Other | 7 (70.0%) | 3 (30.0%) |
| Total | 168 (49.8%) | 169 (50.1%) |
Housing Structures by Number of Rooms in Lake Park
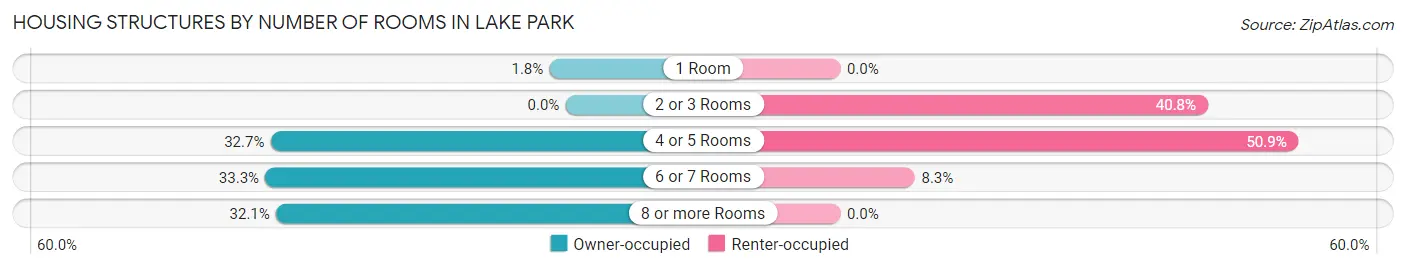
| Number of Rooms | Owner-occupied | Renter-occupied |
| 1 Room | 3 (1.8%) | 0 (0.0%) |
| 2 or 3 Rooms | 0 (0.0%) | 69 (40.8%) |
| 4 or 5 Rooms | 55 (32.7%) | 86 (50.9%) |
| 6 or 7 Rooms | 56 (33.3%) | 14 (8.3%) |
| 8 or more Rooms | 54 (32.1%) | 0 (0.0%) |
| Total | 168 (100.0%) | 169 (100.0%) |
Housing Structure by Heating Type in Lake Park
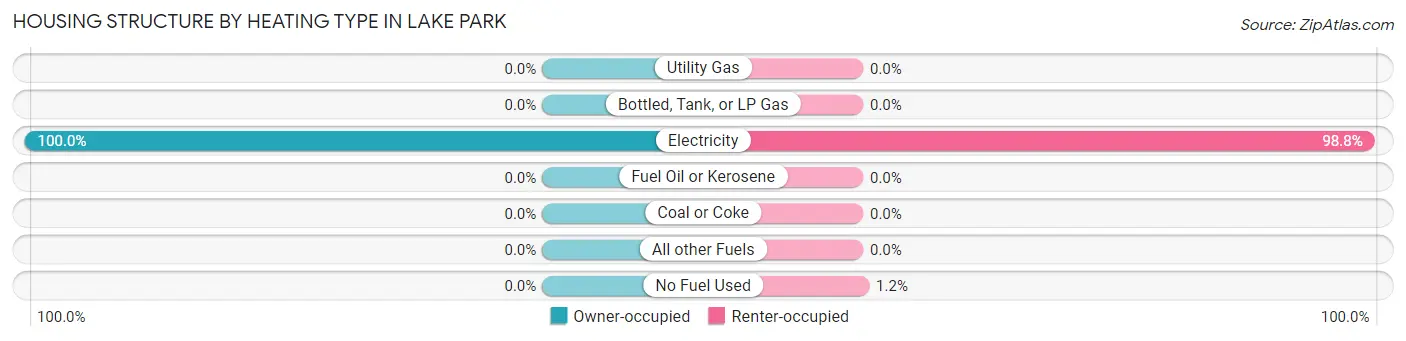
| Heating Type | Owner-occupied | Renter-occupied |
| Utility Gas | 0 (0.0%) | 0 (0.0%) |
| Bottled, Tank, or LP Gas | 0 (0.0%) | 0 (0.0%) |
| Electricity | 168 (100.0%) | 167 (98.8%) |
| Fuel Oil or Kerosene | 0 (0.0%) | 0 (0.0%) |
| Coal or Coke | 0 (0.0%) | 0 (0.0%) |
| All other Fuels | 0 (0.0%) | 0 (0.0%) |
| No Fuel Used | 0 (0.0%) | 2 (1.2%) |
| Total | 168 (100.0%) | 169 (100.0%) |
Household Vehicle Usage in Lake Park
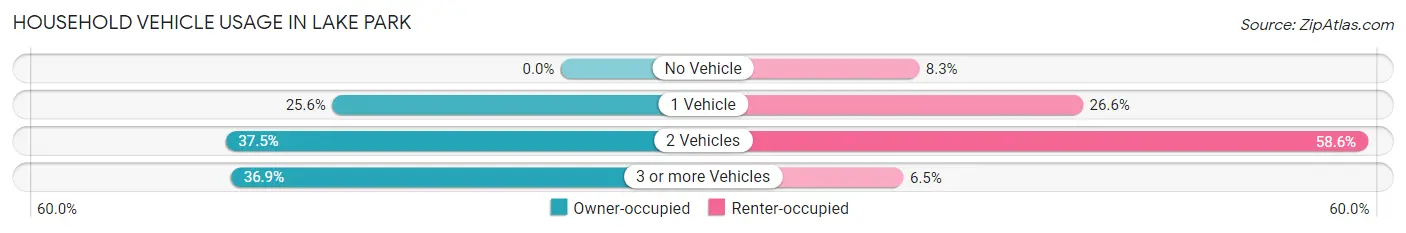
| Vehicles per Household | Owner-occupied | Renter-occupied |
| No Vehicle | 0 (0.0%) | 14 (8.3%) |
| 1 Vehicle | 43 (25.6%) | 45 (26.6%) |
| 2 Vehicles | 63 (37.5%) | 99 (58.6%) |
| 3 or more Vehicles | 62 (36.9%) | 11 (6.5%) |
| Total | 168 (100.0%) | 169 (100.0%) |
Real Estate & Mortgages in Lake Park
Real Estate and Mortgage Overview in Lake Park
| Characteristic | Without Mortgage | With Mortgage |
| Housing Units | 35 | 133 |
| Median Property Value | $209,400 | $233,500 |
| Median Household Income | $83,125 | $47 |
| Monthly Housing Costs | $570 | $4 |
| Real Estate Taxes | $2,100 | $0 |
Property Value by Mortgage Status in Lake Park
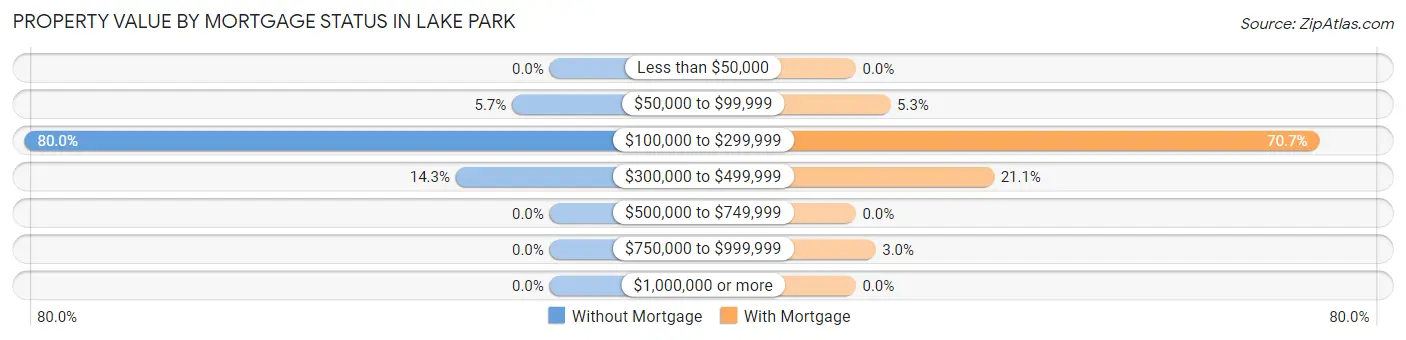
| Property Value | Without Mortgage | With Mortgage |
| Less than $50,000 | 0 (0.0%) | 0 (0.0%) |
| $50,000 to $99,999 | 2 (5.7%) | 7 (5.3%) |
| $100,000 to $299,999 | 28 (80.0%) | 94 (70.7%) |
| $300,000 to $499,999 | 5 (14.3%) | 28 (21.0%) |
| $500,000 to $749,999 | 0 (0.0%) | 0 (0.0%) |
| $750,000 to $999,999 | 0 (0.0%) | 4 (3.0%) |
| $1,000,000 or more | 0 (0.0%) | 0 (0.0%) |
| Total | 35 (100.0%) | 133 (100.0%) |
Household Income by Mortgage Status in Lake Park
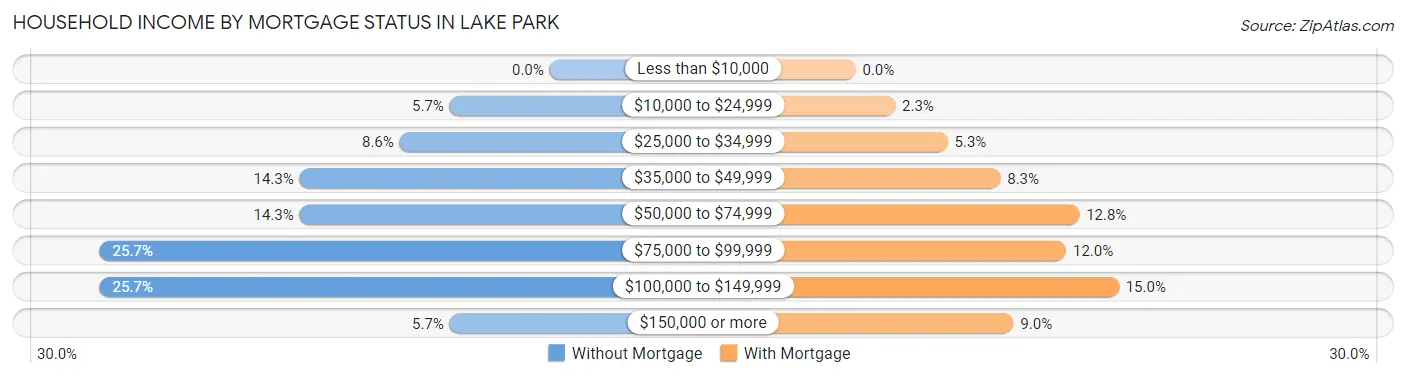
| Household Income | Without Mortgage | With Mortgage |
| Less than $10,000 | 0 (0.0%) | 0 (0.0%) |
| $10,000 to $24,999 | 2 (5.7%) | 3 (2.3%) |
| $25,000 to $34,999 | 3 (8.6%) | 7 (5.3%) |
| $35,000 to $49,999 | 5 (14.3%) | 11 (8.3%) |
| $50,000 to $74,999 | 5 (14.3%) | 17 (12.8%) |
| $75,000 to $99,999 | 9 (25.7%) | 16 (12.0%) |
| $100,000 to $149,999 | 9 (25.7%) | 20 (15.0%) |
| $150,000 or more | 2 (5.7%) | 12 (9.0%) |
| Total | 35 (100.0%) | 133 (100.0%) |
Property Value to Household Income Ratio in Lake Park
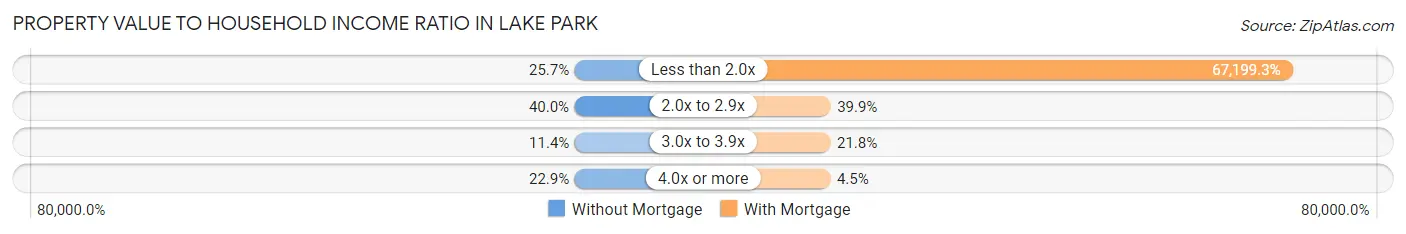
| Value-to-Income Ratio | Without Mortgage | With Mortgage |
| Less than 2.0x | 9 (25.7%) | 89,375 (67,199.2%) |
| 2.0x to 2.9x | 14 (40.0%) | 53 (39.9%) |
| 3.0x to 3.9x | 4 (11.4%) | 29 (21.8%) |
| 4.0x or more | 8 (22.9%) | 6 (4.5%) |
| Total | 35 (100.0%) | 133 (100.0%) |
Real Estate Taxes by Mortgage Status in Lake Park
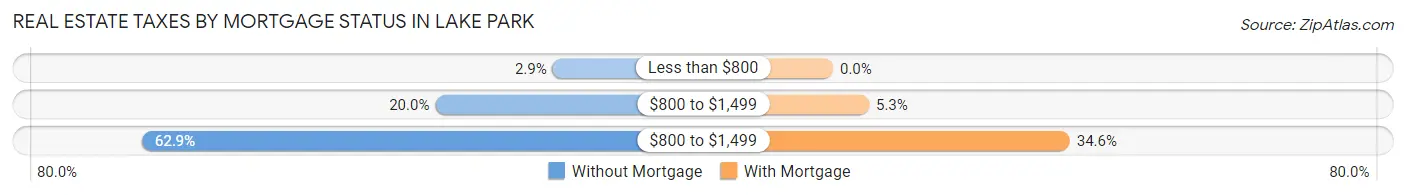
| Property Taxes | Without Mortgage | With Mortgage |
| Less than $800 | 1 (2.9%) | 0 (0.0%) |
| $800 to $1,499 | 7 (20.0%) | 7 (5.3%) |
| $800 to $1,499 | 22 (62.9%) | 46 (34.6%) |
| Total | 35 (100.0%) | 133 (100.0%) |
Health & Disability in Lake Park
Health Insurance Coverage by Age in Lake Park
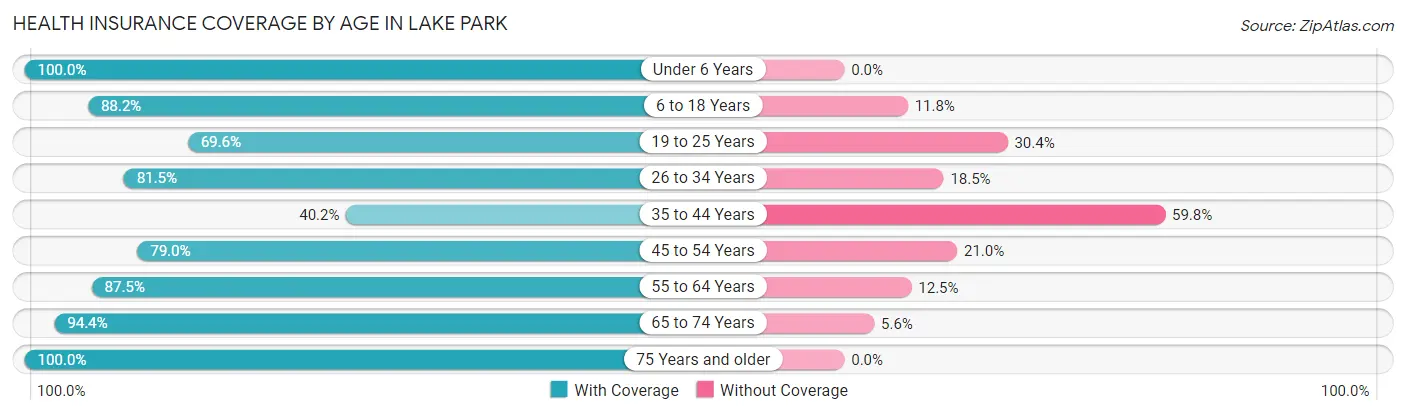
| Age Bracket | With Coverage | Without Coverage |
| Under 6 Years | 149 (100.0%) | 0 (0.0%) |
| 6 to 18 Years | 194 (88.2%) | 26 (11.8%) |
| 19 to 25 Years | 32 (69.6%) | 14 (30.4%) |
| 26 to 34 Years | 119 (81.5%) | 27 (18.5%) |
| 35 to 44 Years | 43 (40.2%) | 64 (59.8%) |
| 45 to 54 Years | 124 (79.0%) | 33 (21.0%) |
| 55 to 64 Years | 63 (87.5%) | 9 (12.5%) |
| 65 to 74 Years | 68 (94.4%) | 4 (5.6%) |
| 75 Years and older | 11 (100.0%) | 0 (0.0%) |
| Total | 803 (81.9%) | 177 (18.1%) |
Health Insurance Coverage by Citizenship Status in Lake Park
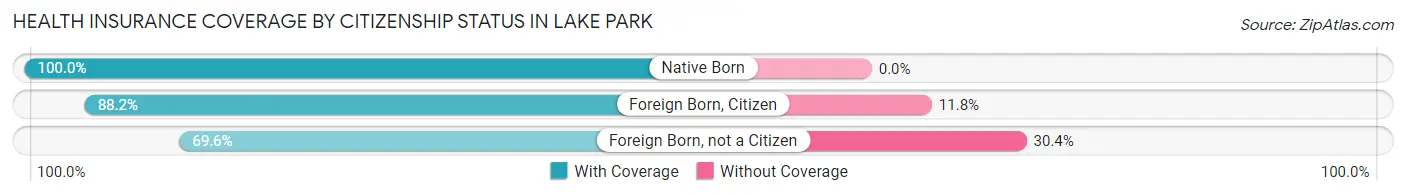
| Citizenship Status | With Coverage | Without Coverage |
| Native Born | 149 (100.0%) | 0 (0.0%) |
| Foreign Born, Citizen | 194 (88.2%) | 26 (11.8%) |
| Foreign Born, not a Citizen | 32 (69.6%) | 14 (30.4%) |
Health Insurance Coverage by Household Income in Lake Park
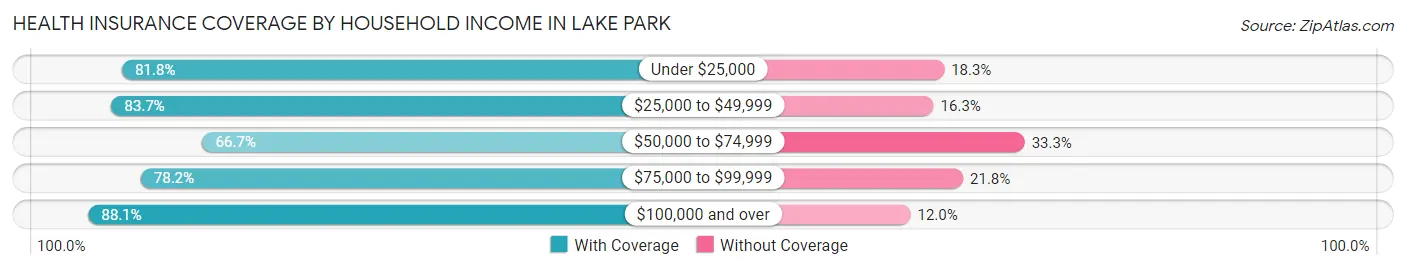
| Household Income | With Coverage | Without Coverage |
| Under $25,000 | 318 (81.8%) | 71 (18.2%) |
| $25,000 to $49,999 | 139 (83.7%) | 27 (16.3%) |
| $50,000 to $74,999 | 64 (66.7%) | 32 (33.3%) |
| $75,000 to $99,999 | 61 (78.2%) | 17 (21.8%) |
| $100,000 and over | 221 (88.0%) | 30 (11.9%) |
Public vs Private Health Insurance Coverage by Age in Lake Park
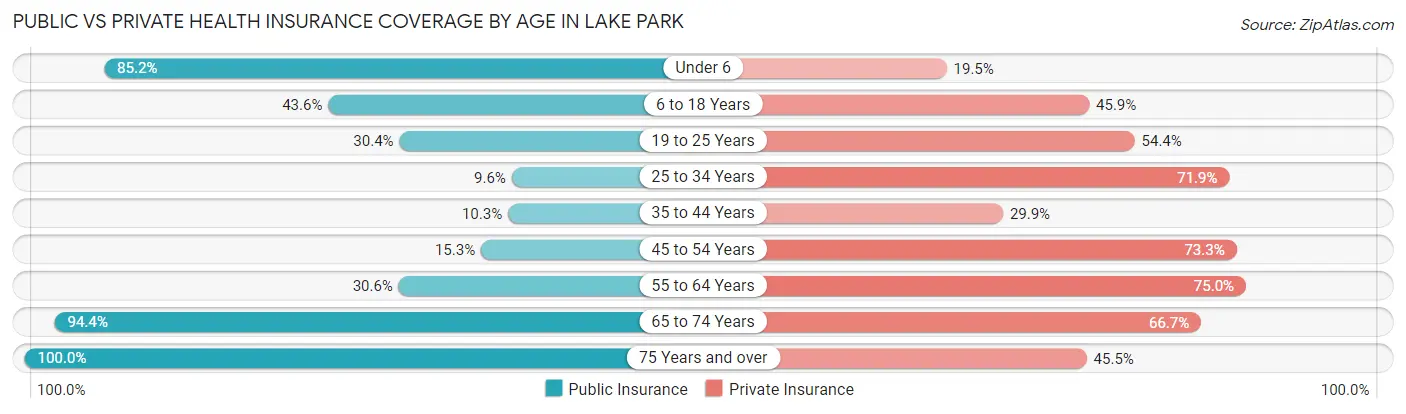
| Age Bracket | Public Insurance | Private Insurance |
| Under 6 | 127 (85.2%) | 29 (19.5%) |
| 6 to 18 Years | 96 (43.6%) | 101 (45.9%) |
| 19 to 25 Years | 14 (30.4%) | 25 (54.3%) |
| 25 to 34 Years | 14 (9.6%) | 105 (71.9%) |
| 35 to 44 Years | 11 (10.3%) | 32 (29.9%) |
| 45 to 54 Years | 24 (15.3%) | 115 (73.3%) |
| 55 to 64 Years | 22 (30.6%) | 54 (75.0%) |
| 65 to 74 Years | 68 (94.4%) | 48 (66.7%) |
| 75 Years and over | 11 (100.0%) | 5 (45.5%) |
| Total | 387 (39.5%) | 514 (52.4%) |
Disability Status by Sex by Age in Lake Park
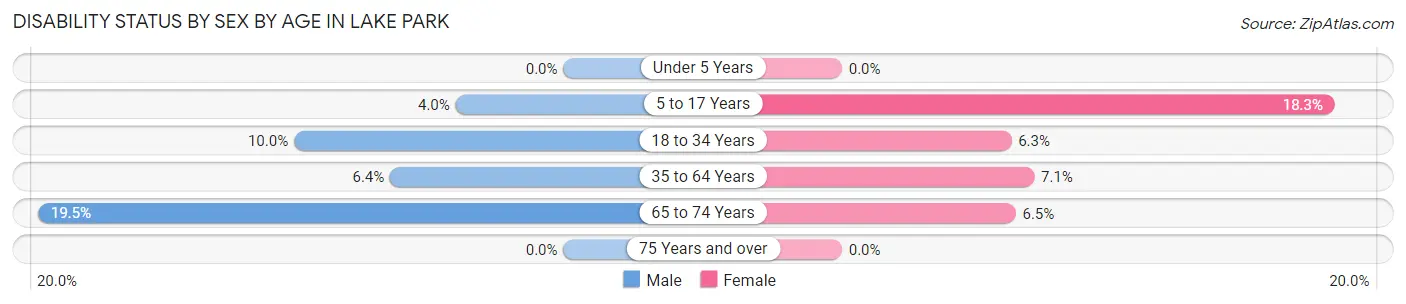
| Age Bracket | Male | Female |
| Under 5 Years | 0 (0.0%) | 0 (0.0%) |
| 5 to 17 Years | 2 (4.0%) | 28 (18.3%) |
| 18 to 34 Years | 5 (10.0%) | 10 (6.3%) |
| 35 to 64 Years | 9 (6.4%) | 14 (7.1%) |
| 65 to 74 Years | 8 (19.5%) | 2 (6.5%) |
| 75 Years and over | 0 (0.0%) | 0 (0.0%) |
Disability Class by Sex by Age in Lake Park
Disability Class: Hearing Difficulty
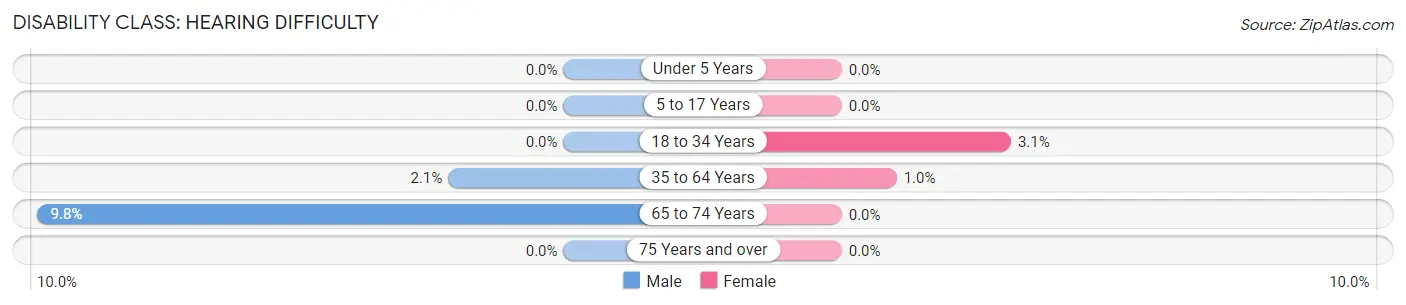
| Age Bracket | Male | Female |
| Under 5 Years | 0 (0.0%) | 0 (0.0%) |
| 5 to 17 Years | 0 (0.0%) | 0 (0.0%) |
| 18 to 34 Years | 0 (0.0%) | 5 (3.1%) |
| 35 to 64 Years | 3 (2.1%) | 2 (1.0%) |
| 65 to 74 Years | 4 (9.8%) | 0 (0.0%) |
| 75 Years and over | 0 (0.0%) | 0 (0.0%) |
Disability Class: Vision Difficulty
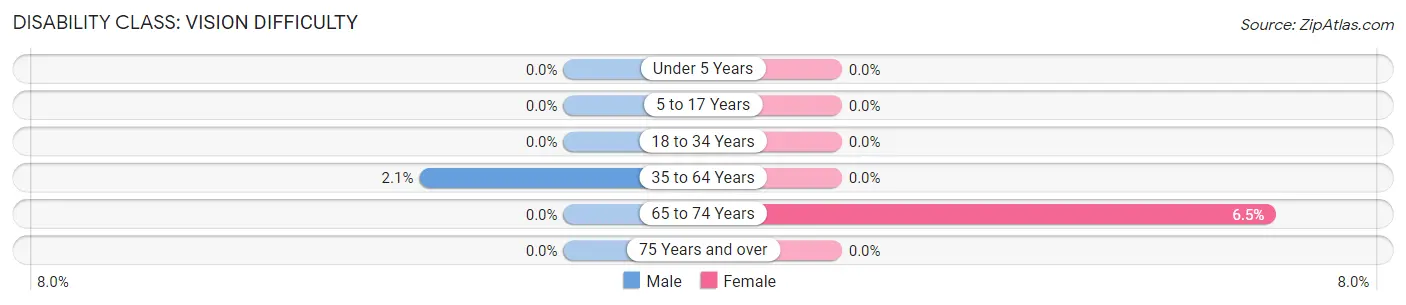
| Age Bracket | Male | Female |
| Under 5 Years | 0 (0.0%) | 0 (0.0%) |
| 5 to 17 Years | 0 (0.0%) | 0 (0.0%) |
| 18 to 34 Years | 0 (0.0%) | 0 (0.0%) |
| 35 to 64 Years | 3 (2.1%) | 0 (0.0%) |
| 65 to 74 Years | 0 (0.0%) | 2 (6.5%) |
| 75 Years and over | 0 (0.0%) | 0 (0.0%) |
Disability Class: Cognitive Difficulty
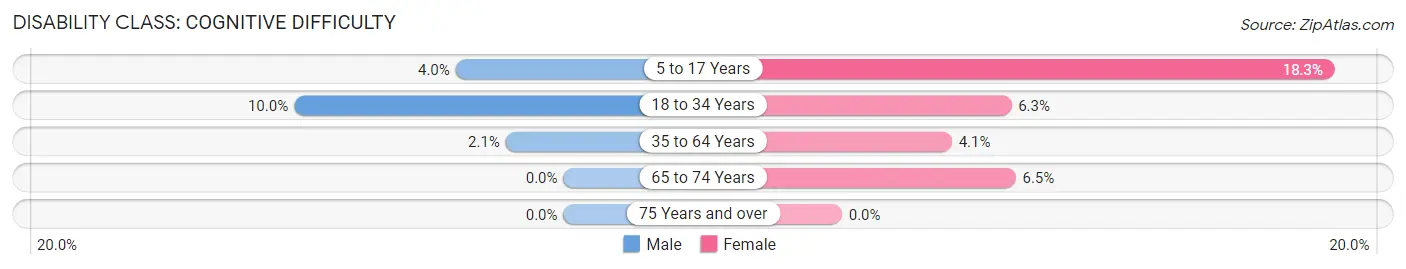
| Age Bracket | Male | Female |
| 5 to 17 Years | 2 (4.0%) | 28 (18.3%) |
| 18 to 34 Years | 5 (10.0%) | 10 (6.3%) |
| 35 to 64 Years | 3 (2.1%) | 8 (4.1%) |
| 65 to 74 Years | 0 (0.0%) | 2 (6.5%) |
| 75 Years and over | 0 (0.0%) | 0 (0.0%) |
Disability Class: Ambulatory Difficulty
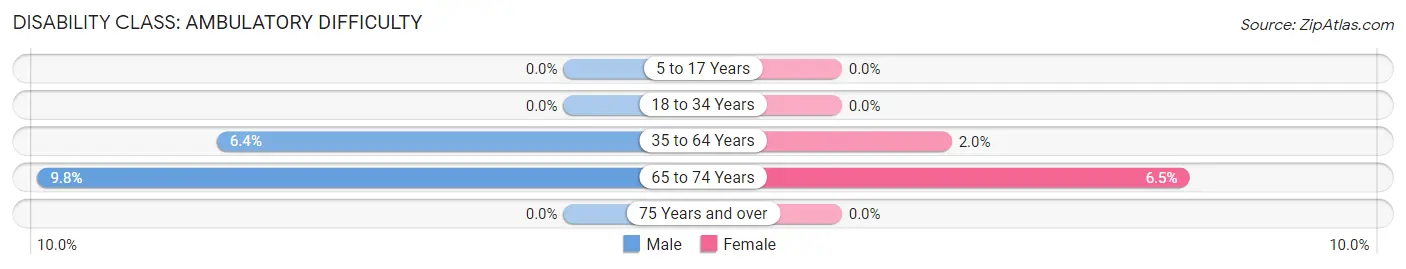
| Age Bracket | Male | Female |
| 5 to 17 Years | 0 (0.0%) | 0 (0.0%) |
| 18 to 34 Years | 0 (0.0%) | 0 (0.0%) |
| 35 to 64 Years | 9 (6.4%) | 4 (2.0%) |
| 65 to 74 Years | 4 (9.8%) | 2 (6.5%) |
| 75 Years and over | 0 (0.0%) | 0 (0.0%) |
Disability Class: Self-Care Difficulty
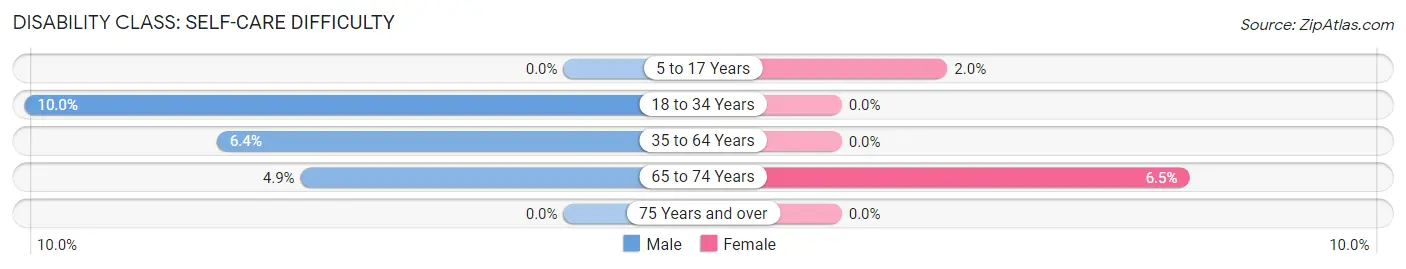
| Age Bracket | Male | Female |
| 5 to 17 Years | 0 (0.0%) | 3 (2.0%) |
| 18 to 34 Years | 5 (10.0%) | 0 (0.0%) |
| 35 to 64 Years | 9 (6.4%) | 0 (0.0%) |
| 65 to 74 Years | 2 (4.9%) | 2 (6.5%) |
| 75 Years and over | 0 (0.0%) | 0 (0.0%) |
Technology Access in Lake Park
Computing Device Access in Lake Park
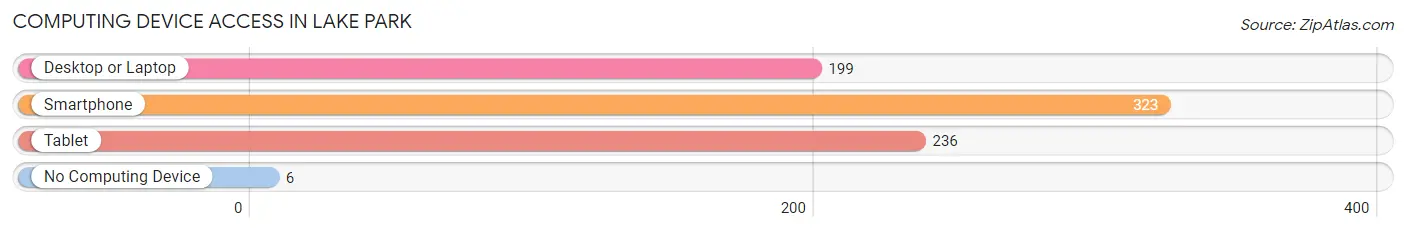
| Device Type | # Households | % Households |
| Desktop or Laptop | 199 | 59.1% |
| Smartphone | 323 | 95.9% |
| Tablet | 236 | 70.0% |
| No Computing Device | 6 | 1.8% |
| Total | 337 | 100.0% |
Internet Access in Lake Park
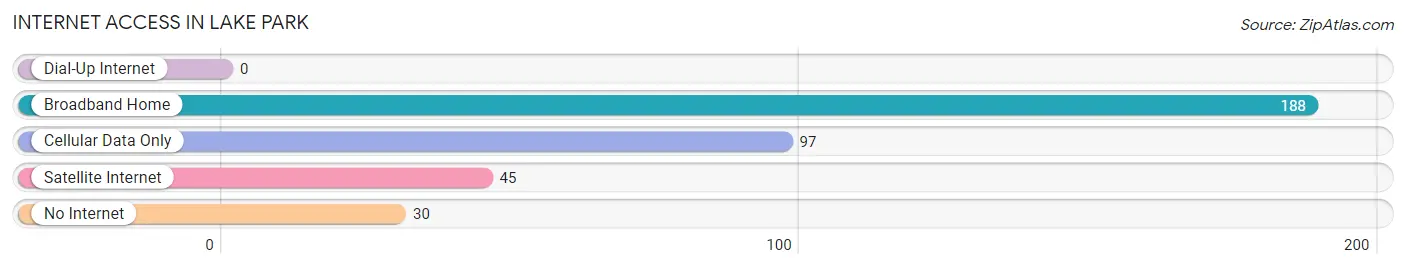
| Internet Type | # Households | % Households |
| Dial-Up Internet | 0 | 0.0% |
| Broadband Home | 188 | 55.8% |
| Cellular Data Only | 97 | 28.8% |
| Satellite Internet | 45 | 13.4% |
| No Internet | 30 | 8.9% |
| Total | 337 | 100.0% |
Lake Park Summary
Park Lake, Georgia is a small town located in the northwest corner of the state, near the border of Alabama. It is part of the Chattahoochee National Forest and is home to a population of just over 1,000 people. The town was founded in 1887 and has a rich history of farming, logging, and mining.
Geography
Park Lake is located in the northwest corner of Georgia, near the border of Alabama. It is part of the Chattahoochee National Forest and is surrounded by the Chattahoochee River, which provides a natural border between the two states. The town is situated in a valley, surrounded by rolling hills and mountains. The area is known for its lush vegetation and abundant wildlife.
Economy
Park Lake’s economy is largely based on agriculture and forestry. The town is home to several farms, which produce a variety of crops, including corn, soybeans, and cotton. The town also has a thriving timber industry, with several sawmills and lumber companies operating in the area. In addition, the town is home to several small businesses, including restaurants, stores, and a gas station.
Demographics
As of the 2010 census, Park Lake had a population of 1,072 people. The population is predominantly white, with African Americans making up the second largest racial group. The median household income is $37,500, and the median age is 44. The town has a high rate of poverty, with nearly one-third of the population living below the poverty line.
History
Park Lake was founded in 1887 by a group of settlers from Alabama. The town was originally called “Park’s Lake” after the nearby lake, which was named after the first settler, William Park. The town quickly grew and became a center for farming, logging, and mining. In the early 1900s, the town was home to several sawmills and lumber companies, as well as a cotton gin.
In the late 1950s, the town began to decline as the timber industry moved away and the population began to dwindle. However, in the late 1980s, the town began to experience a resurgence as people began to move back to the area. Today, Park Lake is a small, rural town with a population of just over 1,000 people. It is a popular destination for outdoor enthusiasts, with several hiking trails, fishing spots, and camping sites in the area.
Common Questions
What is Per Capita Income in Lake Park?
Per Capita income in Lake Park is $40,843.
What is Family Income Deficit in Lake Park?
Family Income Deficit in Lake Park is $18,988.
Families that are below poverty line in Lake Park earn $18,988 less on average than the poverty threshold level.
What is Inequality or Gini Index in Lake Park?
Inequality or Gini Index in Lake Park is 0.71.
What is the Total Population of Lake Park?
Total Population of Lake Park is 980.
What is the Total Male Population of Lake Park?
Total Male Population of Lake Park is 325.
What is the Total Female Population of Lake Park?
Total Female Population of Lake Park is 655.
What is the Ratio of Males per 100 Females in Lake Park?
There are 49.62 Males per 100 Females in Lake Park.
What is the Ratio of Females per 100 Males in Lake Park?
There are 201.54 Females per 100 Males in Lake Park.
What is the Median Population Age in Lake Park?
Median Population Age in Lake Park is 28.9 Years.
What is the Average Family Size in Lake Park
Average Family Size in Lake Park is 3.1 People.
What is the Average Household Size in Lake Park
Average Household Size in Lake Park is 2.9 People.
How Large is the Labor Force in Lake Park?
There are 440 People in the Labor Forcein in Lake Park.
What is the Percentage of People in the Labor Force in Lake Park?
66.8% of People are in the Labor Force in Lake Park.
What is the Unemployment Rate in Lake Park?
Unemployment Rate in Lake Park is 1.1%.