Zip Codes with the Highest Percentage of Population Employed in Computer, Engineering & Science in Brighton, CO
RELATED REPORTS & OPTIONS
Computer, Engineering & Science
Brighton
Compare Zip Codes
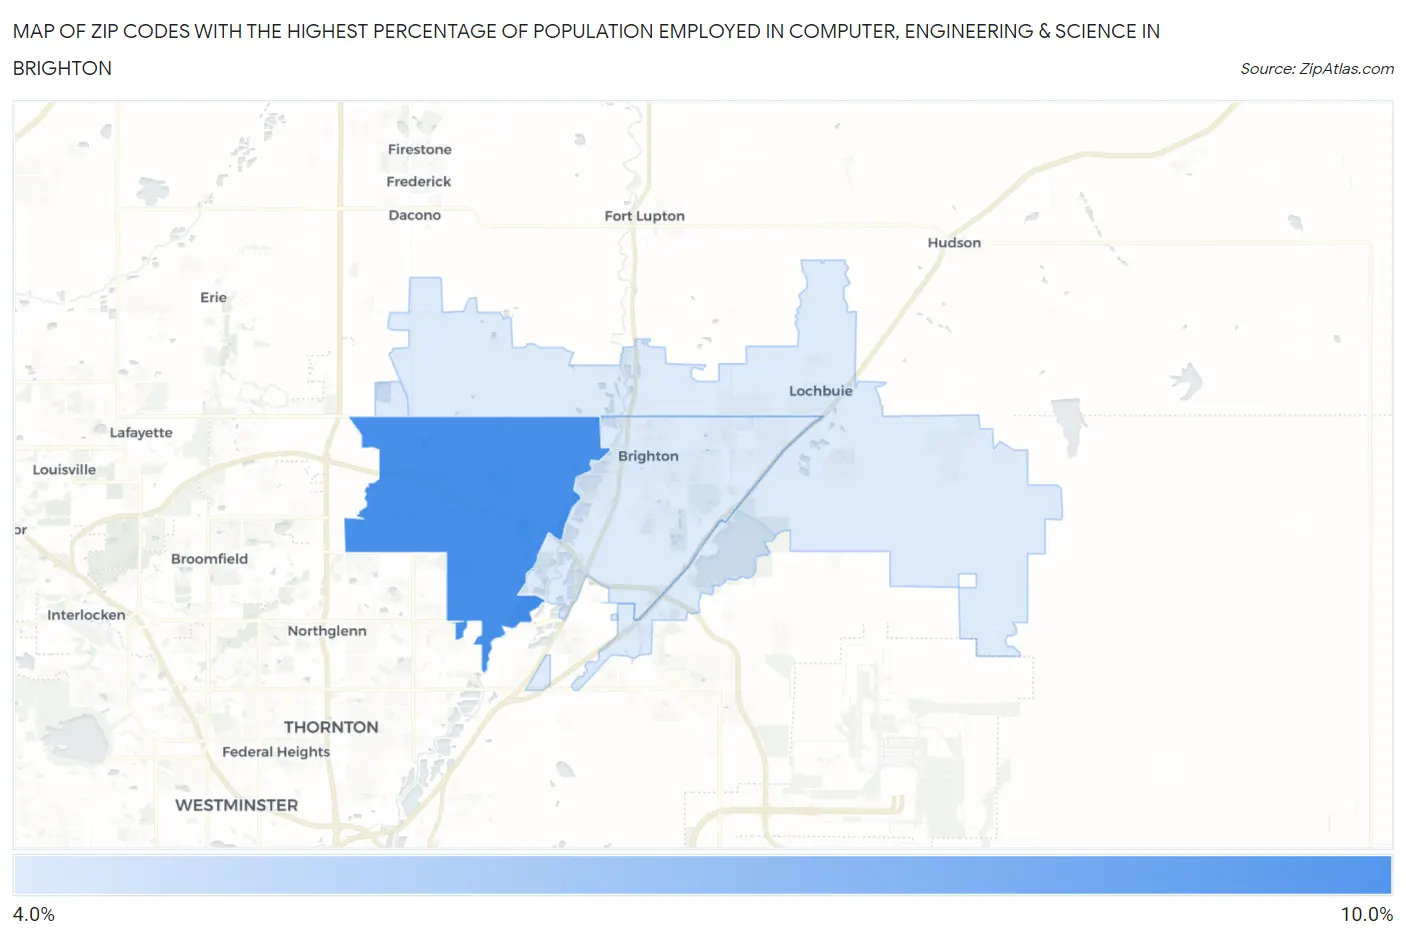
Map of Zip Codes with the Highest Percentage of Population Employed in Computer, Engineering & Science in Brighton
4.2%
9.4%
Zip Codes with the Highest Percentage of Population Employed in Computer, Engineering & Science in Brighton, CO
| Zip Code | % Employed | vs State | vs National | |
| 1. | 80602 | 9.4% | 9.0%(+0.355)#129 | 6.8%(+2.59)#3,737 |
| 2. | 80603 | 4.2% | 9.0%(-4.80)#279 | 6.8%(-2.57)#13,877 |
| 3. | 80601 | 4.2% | 9.0%(-4.84)#282 | 6.8%(-2.61)#14,005 |
1
Common Questions
What are the Top Zip Codes with the Highest Percentage of Population Employed in Computer, Engineering & Science in Brighton, CO?
Top Zip Codes with the Highest Percentage of Population Employed in Computer, Engineering & Science in Brighton, CO are:
What zip code has the Highest Percentage of Population Employed in Computer, Engineering & Science in Brighton, CO?
80602 has the Highest Percentage of Population Employed in Computer, Engineering & Science in Brighton, CO with 9.4%.
What is the Percentage of Population Employed in Computer, Engineering & Science in Brighton, CO?
Percentage of Population Employed in Computer, Engineering & Science in Brighton is 4.3%.
What is the Percentage of Population Employed in Computer, Engineering & Science in Colorado?
Percentage of Population Employed in Computer, Engineering & Science in Colorado is 9.0%.
What is the Percentage of Population Employed in Computer, Engineering & Science in the United States?
Percentage of Population Employed in Computer, Engineering & Science in the United States is 6.8%.