Gold Hill, CO Map & Demographics
Gold Hill Map
Gold Hill Overview
$65,779
PER CAPITA INCOME
$187,083
AVG FAMILY INCOME
0.60
INEQUALITY / GINI INDEX
249
TOTAL POPULATION
95
MALE POPULATION
154
FEMALE POPULATION
61.69
MALES / 100 FEMALES
162.11
FEMALES / 100 MALES
47.5
MEDIAN AGE
2.8
AVG FAMILY SIZE
1.6
AVG HOUSEHOLD SIZE
208
LABOR FORCE [ PEOPLE ]
96.7%
PERCENT IN LABOR FORCE
Income in Gold Hill
Income Overview in Gold Hill
| Characteristic | Number | Measure |
| Per Capita Income | 249 | $65,779 |
| Median Family Income | 41 | $187,083 |
| Mean Family Income | 41 | $183,534 |
| Median Household Income | 148 | $0 |
| Mean Household Income | 148 | $108,908 |
| Income Deficit | 41 | $0 |
| Wage / Income Gap (%) | 249 | 0.00% |
| Wage / Income Gap ($) | 249 | 100.00¢ per $1 |
| Gini / Inequality Index | 249 | 0.60 |
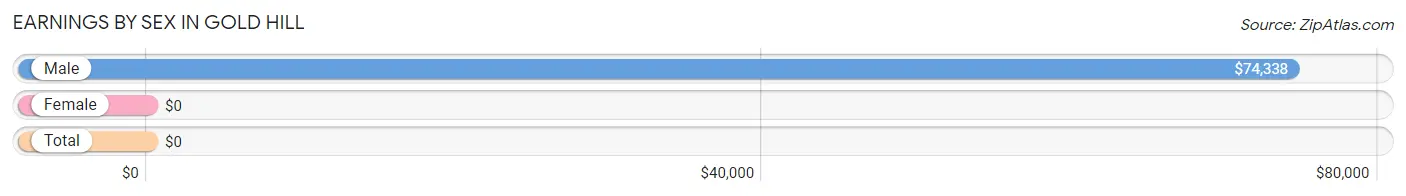
Earnings by Sex in Gold Hill
| Sex | Number | Average Earnings |
| Male | 61 (29.3%) | $74,338 |
| Female | 147 (70.7%) | $0 |
| Total | 208 (100.0%) | $0 |
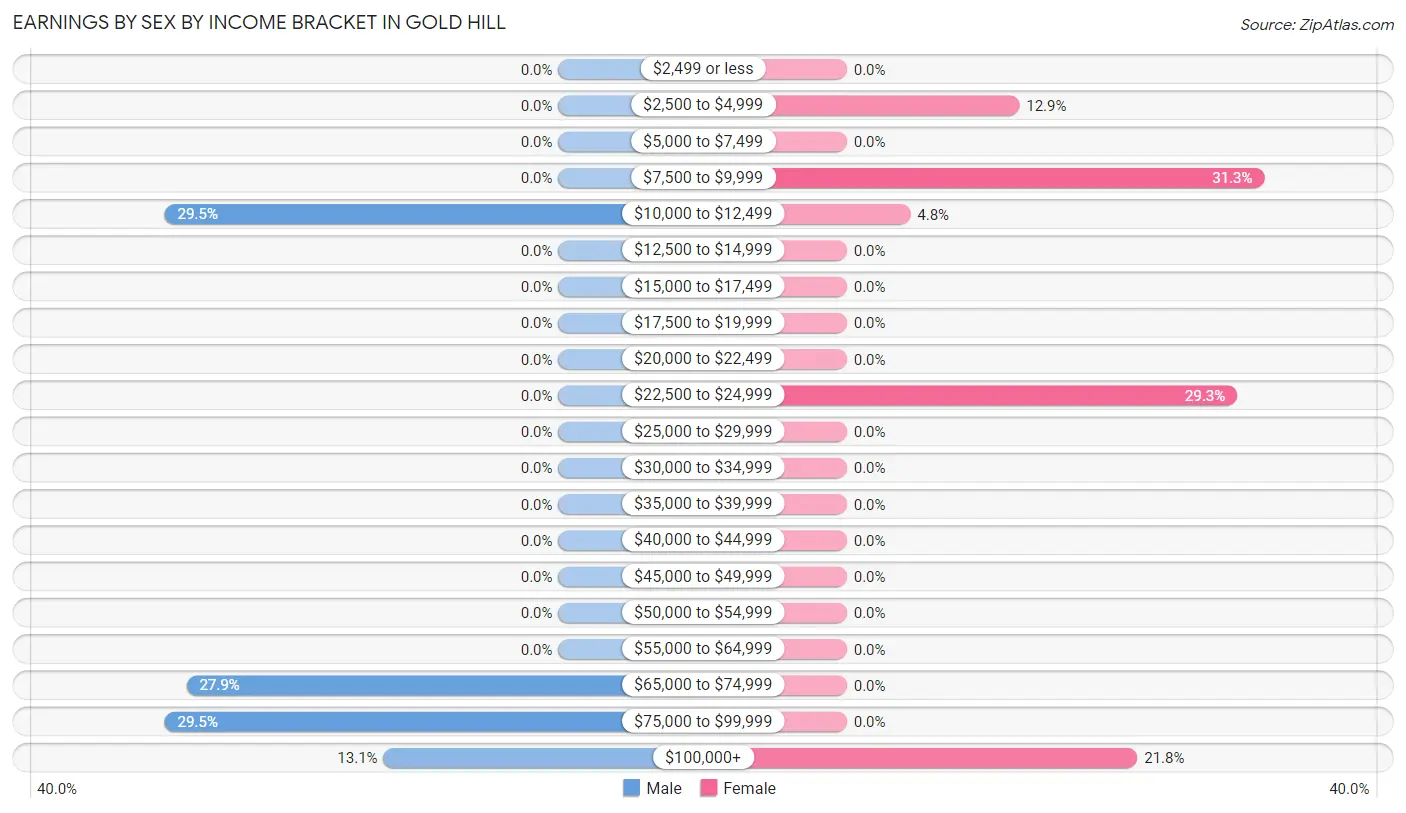
Earnings by Sex by Income Bracket in Gold Hill
The most common earnings brackets in Gold Hill are $10,000 to $12,499 for men (18 | 29.5%) and $7,500 to $9,999 for women (46 | 31.3%).
| Income | Male | Female |
| $2,499 or less | 0 (0.0%) | 0 (0.0%) |
| $2,500 to $4,999 | 0 (0.0%) | 19 (12.9%) |
| $5,000 to $7,499 | 0 (0.0%) | 0 (0.0%) |
| $7,500 to $9,999 | 0 (0.0%) | 46 (31.3%) |
| $10,000 to $12,499 | 18 (29.5%) | 7 (4.8%) |
| $12,500 to $14,999 | 0 (0.0%) | 0 (0.0%) |
| $15,000 to $17,499 | 0 (0.0%) | 0 (0.0%) |
| $17,500 to $19,999 | 0 (0.0%) | 0 (0.0%) |
| $20,000 to $22,499 | 0 (0.0%) | 0 (0.0%) |
| $22,500 to $24,999 | 0 (0.0%) | 43 (29.2%) |
| $25,000 to $29,999 | 0 (0.0%) | 0 (0.0%) |
| $30,000 to $34,999 | 0 (0.0%) | 0 (0.0%) |
| $35,000 to $39,999 | 0 (0.0%) | 0 (0.0%) |
| $40,000 to $44,999 | 0 (0.0%) | 0 (0.0%) |
| $45,000 to $49,999 | 0 (0.0%) | 0 (0.0%) |
| $50,000 to $54,999 | 0 (0.0%) | 0 (0.0%) |
| $55,000 to $64,999 | 0 (0.0%) | 0 (0.0%) |
| $65,000 to $74,999 | 17 (27.9%) | 0 (0.0%) |
| $75,000 to $99,999 | 18 (29.5%) | 0 (0.0%) |
| $100,000+ | 8 (13.1%) | 32 (21.8%) |
| Total | 61 (100.0%) | 147 (100.0%) |
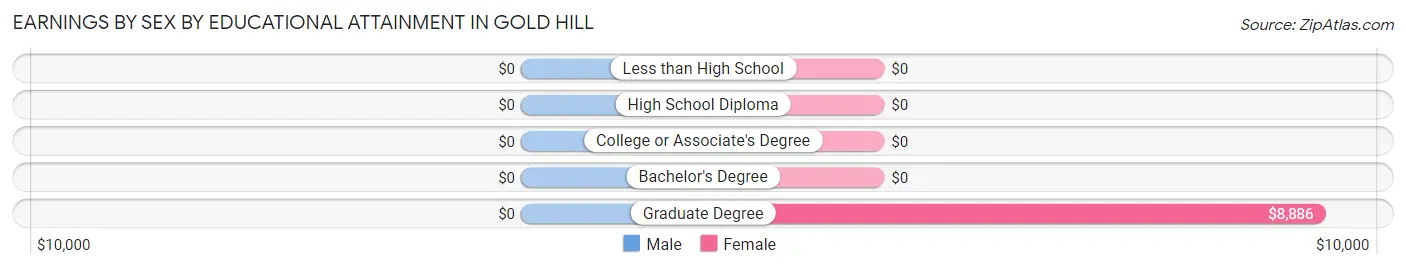
Earnings by Sex by Educational Attainment in Gold Hill
| Educational Attainment | Male Income | Female Income |
| Less than High School | - | - |
| High School Diploma | - | - |
| College or Associate's Degree | - | - |
| Bachelor's Degree | - | - |
| Graduate Degree | - | - |
| Total | $74,338 | $0 |
Family Income in Gold Hill
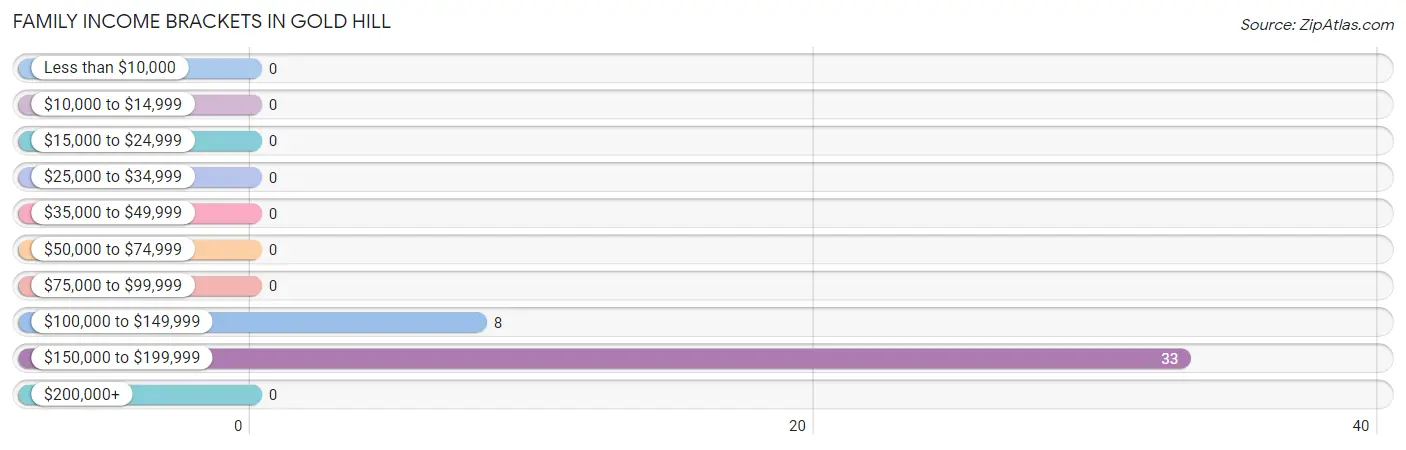
Family Income Brackets in Gold Hill
According to the Gold Hill family income data, there are 33 families falling into the $150,000 to $199,999 income range, which is the most common income bracket and makes up 80.5% of all families.
| Income Bracket | # Families | % Families |
| Less than $10,000 | 0 | 0.0% |
| $10,000 to $14,999 | 0 | 0.0% |
| $15,000 to $24,999 | 0 | 0.0% |
| $25,000 to $34,999 | 0 | 0.0% |
| $35,000 to $49,999 | 0 | 0.0% |
| $50,000 to $74,999 | 0 | 0.0% |
| $75,000 to $99,999 | 0 | 0.0% |
| $100,000 to $149,999 | 8 | 19.5% |
| $150,000 to $199,999 | 33 | 80.5% |
| $200,000+ | 0 | 0.0% |
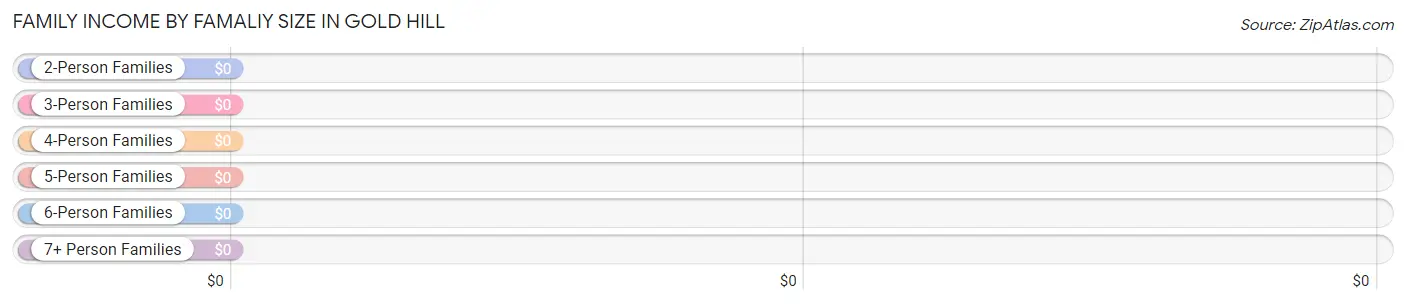
Family Income by Famaliy Size in Gold Hill
| Income Bracket | # Families | Median Income |
| 2-Person Families | 23 (56.1%) | $0 |
| 3-Person Families | 0 (0.0%) | $0 |
| 4-Person Families | 18 (43.9%) | $0 |
| 5-Person Families | 0 (0.0%) | $0 |
| 6-Person Families | 0 (0.0%) | $0 |
| 7+ Person Families | 0 (0.0%) | $0 |
| Total | 41 (100.0%) | $187,083 |
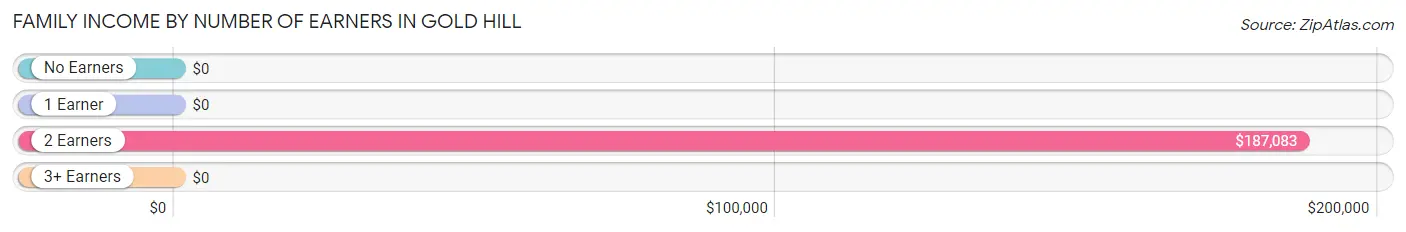
Family Income by Number of Earners in Gold Hill
| Number of Earners | # Families | Median Income |
| No Earners | 0 (0.0%) | $0 |
| 1 Earner | 0 (0.0%) | $0 |
| 2 Earners | 41 (100.0%) | $187,083 |
| 3+ Earners | 0 (0.0%) | $0 |
| Total | 41 (100.0%) | $187,083 |
Household Income in Gold Hill
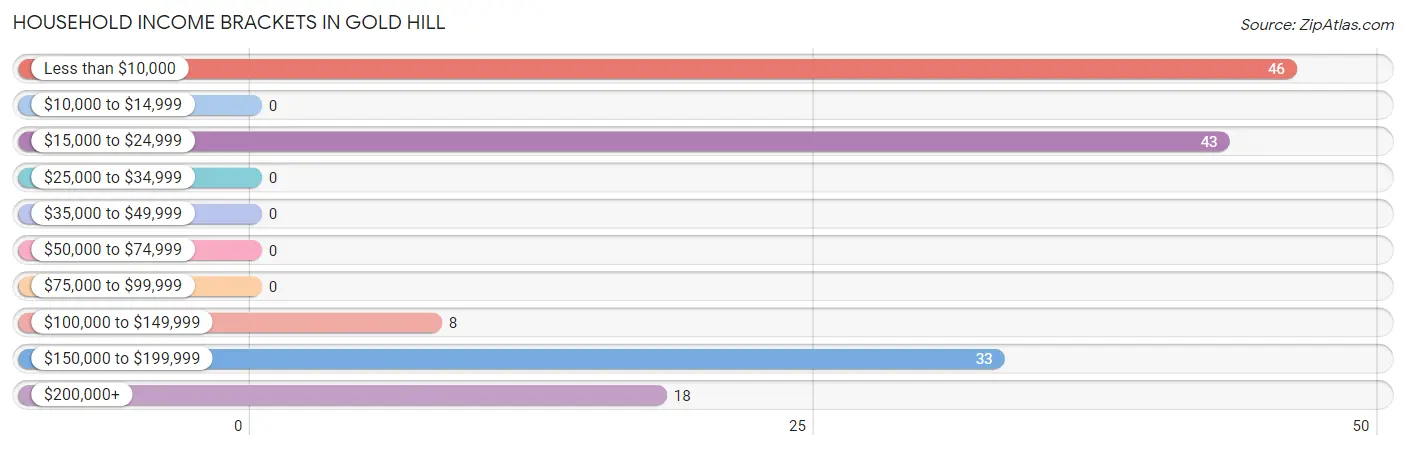
Household Income Brackets in Gold Hill
With 46 households falling in the category, the less than $10,000 income range is the most frequent in Gold Hill, accounting for 31.1% of all households.
| Income Bracket | # Households | % Households |
| Less than $10,000 | 46 | 31.1% |
| $10,000 to $14,999 | 0 | 0.0% |
| $15,000 to $24,999 | 43 | 29.1% |
| $25,000 to $34,999 | 0 | 0.0% |
| $35,000 to $49,999 | 0 | 0.0% |
| $50,000 to $74,999 | 0 | 0.0% |
| $75,000 to $99,999 | 0 | 0.0% |
| $100,000 to $149,999 | 8 | 5.4% |
| $150,000 to $199,999 | 33 | 22.3% |
| $200,000+ | 18 | 12.2% |
Household Income by Householder Age in Gold Hill
| Income Bracket | # Households | Median Income |
| 15 to 24 Years | 0 (0.0%) | $0 |
| 25 to 44 Years | 58 (39.2%) | $0 |
| 45 to 64 Years | 72 (48.6%) | $0 |
| 65+ Years | 18 (12.2%) | $0 |
| Total | 148 (100.0%) | $0 |
Poverty in Gold Hill
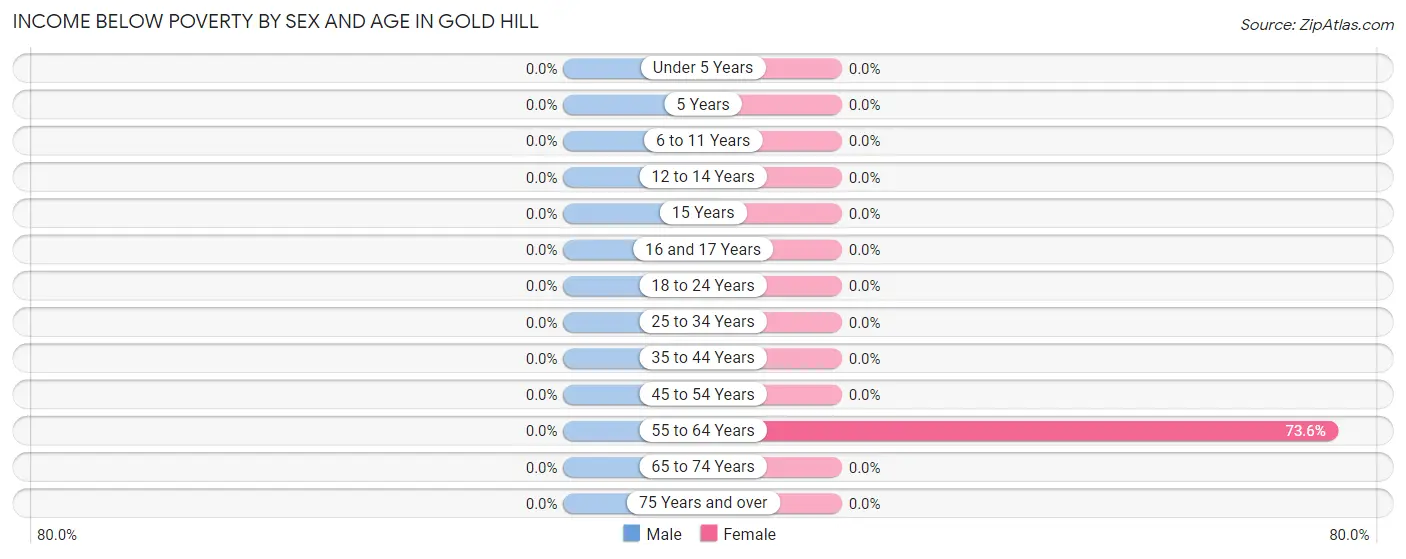
Income Below Poverty by Sex and Age in Gold Hill
| Age Bracket | Male | Female |
| Under 5 Years | 0 (0.0%) | 0 (0.0%) |
| 5 Years | 0 (0.0%) | 0 (0.0%) |
| 6 to 11 Years | 0 (0.0%) | 0 (0.0%) |
| 12 to 14 Years | 0 (0.0%) | 0 (0.0%) |
| 15 Years | 0 (0.0%) | 0 (0.0%) |
| 16 and 17 Years | 0 (0.0%) | 0 (0.0%) |
| 18 to 24 Years | 0 (0.0%) | 0 (0.0%) |
| 25 to 34 Years | 0 (0.0%) | 0 (0.0%) |
| 35 to 44 Years | 0 (0.0%) | 0 (0.0%) |
| 45 to 54 Years | 0 (0.0%) | 0 (0.0%) |
| 55 to 64 Years | 0 (0.0%) | 53 (73.6%) |
| 65 to 74 Years | 0 (0.0%) | 0 (0.0%) |
| 75 Years and over | 0 (0.0%) | 0 (0.0%) |
| Total | 0 (0.0%) | 53 (34.4%) |
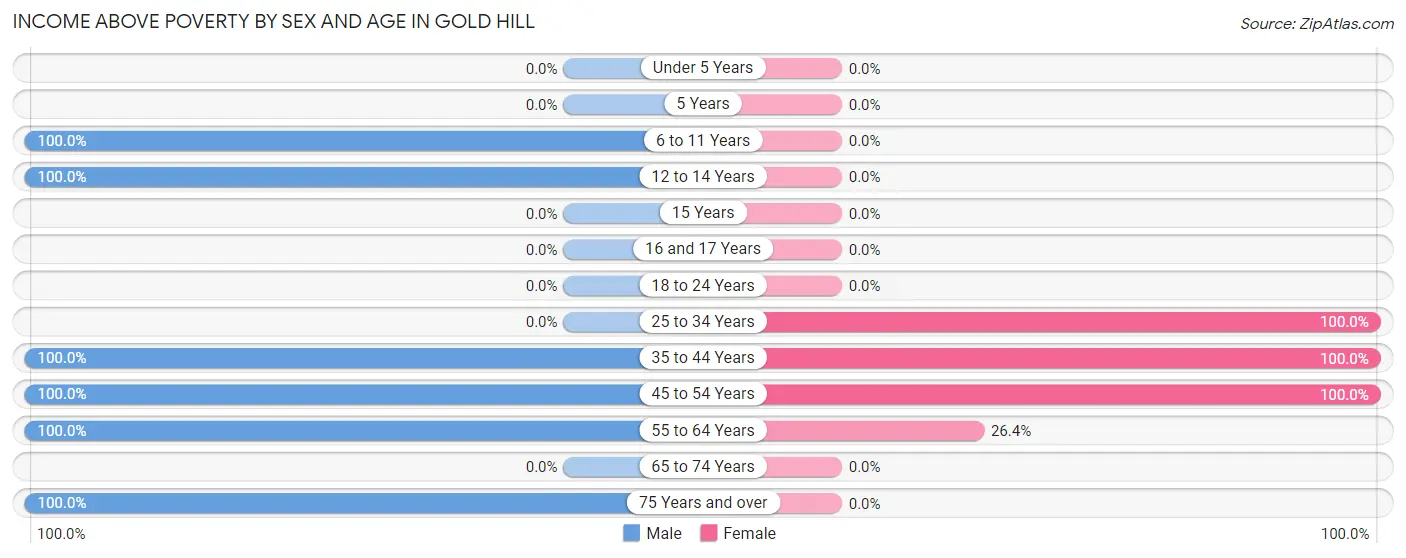
Income Above Poverty by Sex and Age in Gold Hill
According to the poverty statistics in Gold Hill, males aged 6 to 11 years and females aged 25 to 34 years are the age groups that are most secure financially, with 100.0% of males and 100.0% of females in these age groups living above the poverty line.
| Age Bracket | Male | Female |
| Under 5 Years | 0 (0.0%) | 0 (0.0%) |
| 5 Years | 0 (0.0%) | 0 (0.0%) |
| 6 to 11 Years | 17 (100.0%) | 0 (0.0%) |
| 12 to 14 Years | 17 (100.0%) | 0 (0.0%) |
| 15 Years | 0 (0.0%) | 0 (0.0%) |
| 16 and 17 Years | 0 (0.0%) | 0 (0.0%) |
| 18 to 24 Years | 0 (0.0%) | 0 (0.0%) |
| 25 to 34 Years | 0 (0.0%) | 43 (100.0%) |
| 35 to 44 Years | 17 (100.0%) | 22 (100.0%) |
| 45 to 54 Years | 18 (100.0%) | 17 (100.0%) |
| 55 to 64 Years | 8 (100.0%) | 19 (26.4%) |
| 65 to 74 Years | 0 (0.0%) | 0 (0.0%) |
| 75 Years and over | 18 (100.0%) | 0 (0.0%) |
| Total | 95 (100.0%) | 101 (65.6%) |
Income Below Poverty Among Married-Couple Families in Gold Hill
| Children | Above Poverty | Below Poverty |
| No Children | 23 (100.0%) | 0 (0.0%) |
| 1 or 2 Children | 18 (100.0%) | 0 (0.0%) |
| 3 or 4 Children | 0 (0.0%) | 0 (0.0%) |
| 5 or more Children | 0 (0.0%) | 0 (0.0%) |
| Total | 41 (100.0%) | 0 (0.0%) |
Income Below Poverty Among Single-Parent Households in Gold Hill
| Children | Single Father | Single Mother |
| No Children | 0 (0.0%) | 0 (0.0%) |
| 1 or 2 Children | 0 (0.0%) | 0 (0.0%) |
| 3 or 4 Children | 0 (0.0%) | 0 (0.0%) |
| 5 or more Children | 0 (0.0%) | 0 (0.0%) |
| Total | 0 (0.0%) | 0 (0.0%) |
Income Below Poverty Among Married-Couple vs Single-Parent Households in Gold Hill
| Children | Married-Couple Families | Single-Parent Households |
| No Children | 0 (0.0%) | 0 (0.0%) |
| 1 or 2 Children | 0 (0.0%) | 0 (0.0%) |
| 3 or 4 Children | 0 (0.0%) | 0 (0.0%) |
| 5 or more Children | 0 (0.0%) | 0 (0.0%) |
| Total | 0 (0.0%) | 0 (0.0%) |
Race in Gold Hill
The most populous races in Gold Hill are , and White / Caucasian (249 | 100.0%).
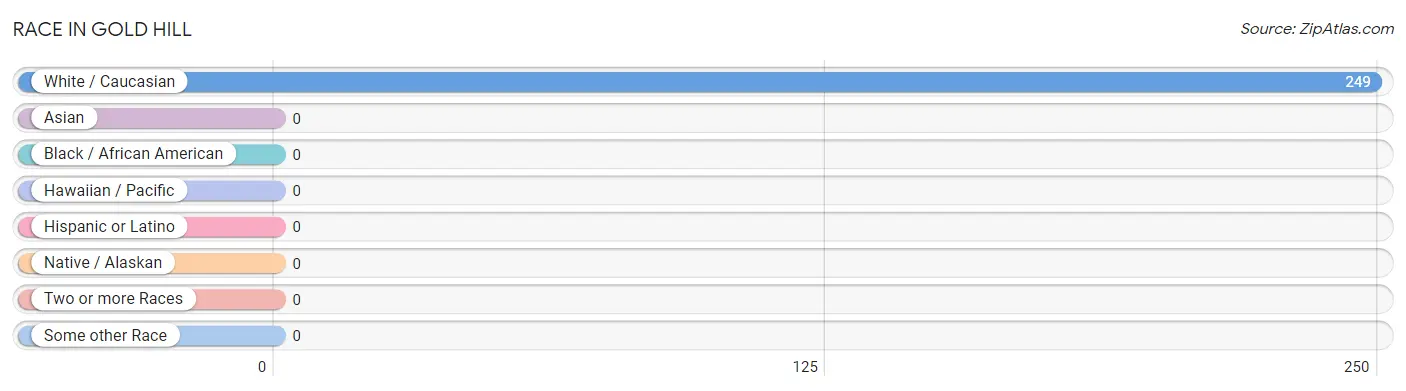
| Race | # Population | % Population |
| Asian | 0 | 0.0% |
| Black / African American | 0 | 0.0% |
| Hawaiian / Pacific | 0 | 0.0% |
| Hispanic or Latino | 0 | 0.0% |
| Native / Alaskan | 0 | 0.0% |
| White / Caucasian | 249 | 100.0% |
| Two or more Races | 0 | 0.0% |
| Some other Race | 0 | 0.0% |
| Total | 249 | 100.0% |
Ancestry in Gold Hill
The most populous ancestries reported in Gold Hill are German (83 | 33.3%), Norwegian (52 | 20.9%), Italian (43 | 17.3%), Scotch-Irish (43 | 17.3%), and Irish (25 | 10.0%), together accounting for 98.8% of all Gold Hill residents.
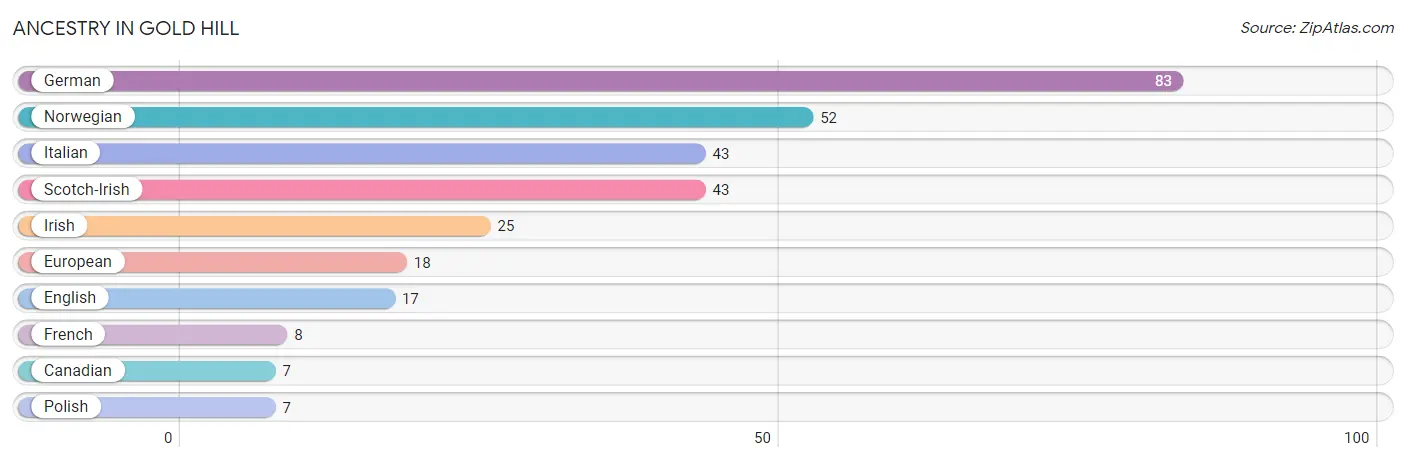
| Ancestry | # Population | % Population |
| Canadian | 7 | 2.8% |
| English | 17 | 6.8% |
| European | 18 | 7.2% |
| French | 8 | 3.2% |
| German | 83 | 33.3% |
| Irish | 25 | 10.0% |
| Italian | 43 | 17.3% |
| Norwegian | 52 | 20.9% |
| Polish | 7 | 2.8% |
| Scotch-Irish | 43 | 17.3% | View All 10 Rows |
Immigrants in Gold Hill
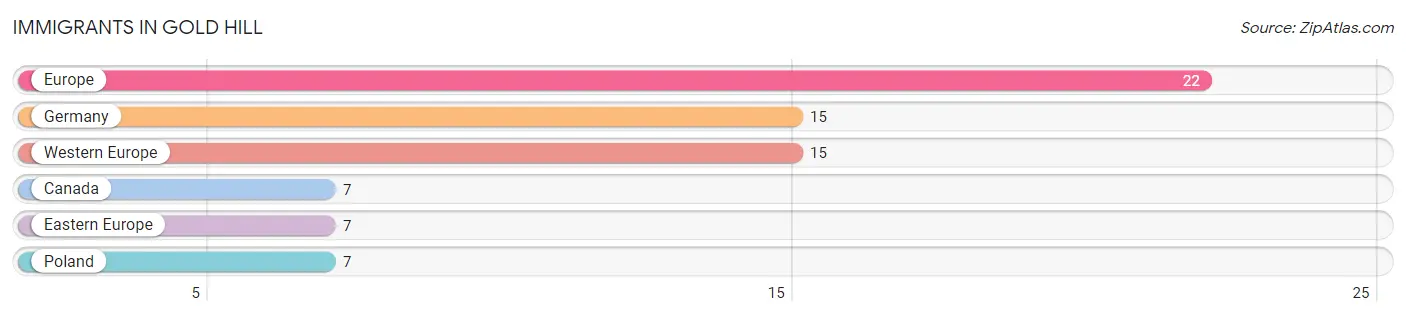
The most numerous immigrant groups reported in Gold Hill came from Europe (22 | 8.8%), Germany (15 | 6.0%), Western Europe (15 | 6.0%), Canada (7 | 2.8%), and Eastern Europe (7 | 2.8%), together accounting for 26.5% of all Gold Hill residents.
| Immigration Origin | # Population | % Population |
| Canada | 7 | 2.8% |
| Eastern Europe | 7 | 2.8% |
| Europe | 22 | 8.8% |
| Germany | 15 | 6.0% |
| Poland | 7 | 2.8% |
| Western Europe | 15 | 6.0% | View All 6 Rows |
Sex and Age in Gold Hill
Sex and Age in Gold Hill
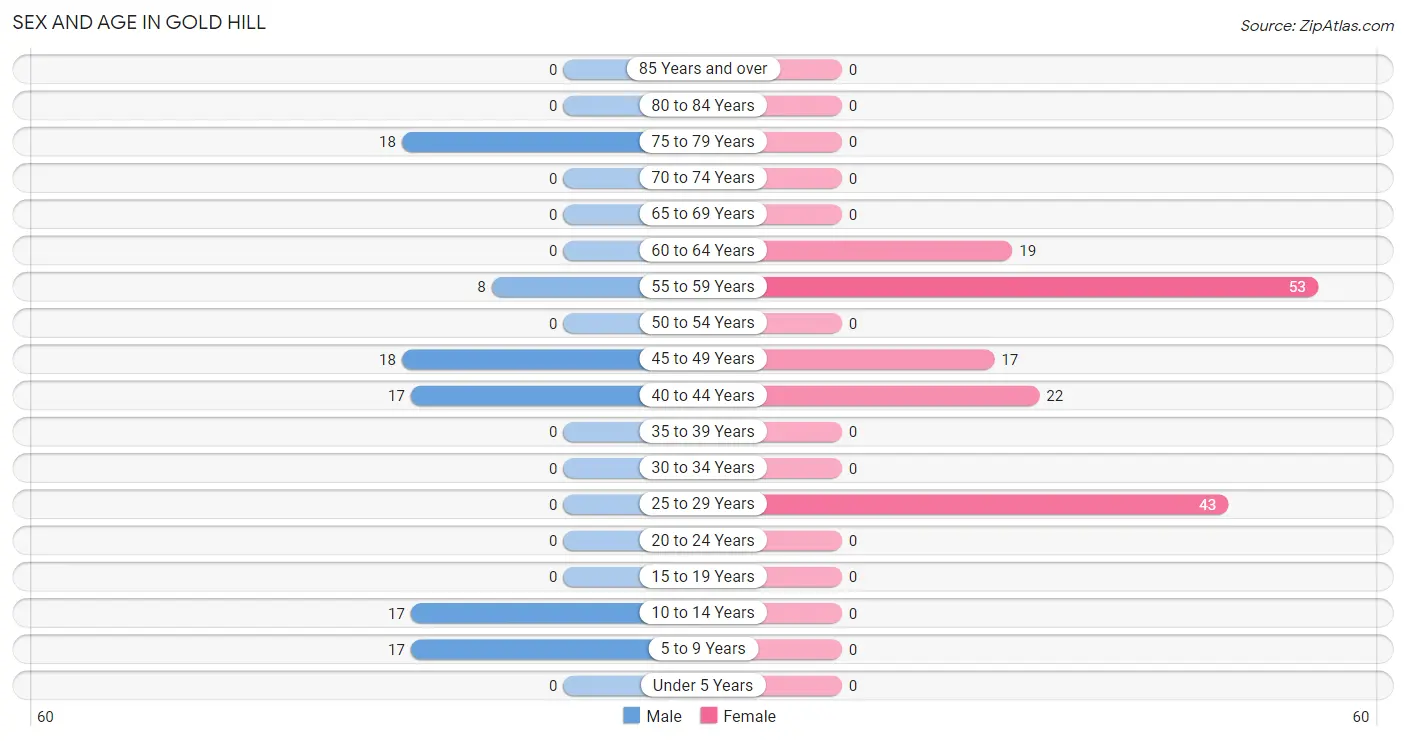
The most populous age groups in Gold Hill are 45 to 49 Years (18 | 19.0%) for men and 55 to 59 Years (53 | 34.4%) for women.
| Age Bracket | Male | Female |
| Under 5 Years | 0 (0.0%) | 0 (0.0%) |
| 5 to 9 Years | 17 (17.9%) | 0 (0.0%) |
| 10 to 14 Years | 17 (17.9%) | 0 (0.0%) |
| 15 to 19 Years | 0 (0.0%) | 0 (0.0%) |
| 20 to 24 Years | 0 (0.0%) | 0 (0.0%) |
| 25 to 29 Years | 0 (0.0%) | 43 (27.9%) |
| 30 to 34 Years | 0 (0.0%) | 0 (0.0%) |
| 35 to 39 Years | 0 (0.0%) | 0 (0.0%) |
| 40 to 44 Years | 17 (17.9%) | 22 (14.3%) |
| 45 to 49 Years | 18 (19.0%) | 17 (11.0%) |
| 50 to 54 Years | 0 (0.0%) | 0 (0.0%) |
| 55 to 59 Years | 8 (8.4%) | 53 (34.4%) |
| 60 to 64 Years | 0 (0.0%) | 19 (12.3%) |
| 65 to 69 Years | 0 (0.0%) | 0 (0.0%) |
| 70 to 74 Years | 0 (0.0%) | 0 (0.0%) |
| 75 to 79 Years | 18 (19.0%) | 0 (0.0%) |
| 80 to 84 Years | 0 (0.0%) | 0 (0.0%) |
| 85 Years and over | 0 (0.0%) | 0 (0.0%) |
| Total | 95 (100.0%) | 154 (100.0%) |
Families and Households in Gold Hill
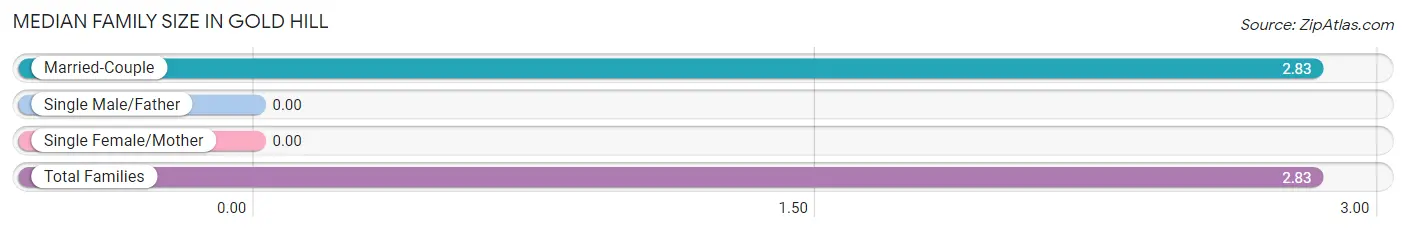
Median Family Size in Gold Hill
| Family Type | # Families | Family Size |
| Married-Couple | 41 (100.0%) | 2.83 |
| Single Male/Father | 0 (0.0%) | - |
| Single Female/Mother | 0 (0.0%) | - |
| Total Families | 41 (100.0%) | 2.83 |
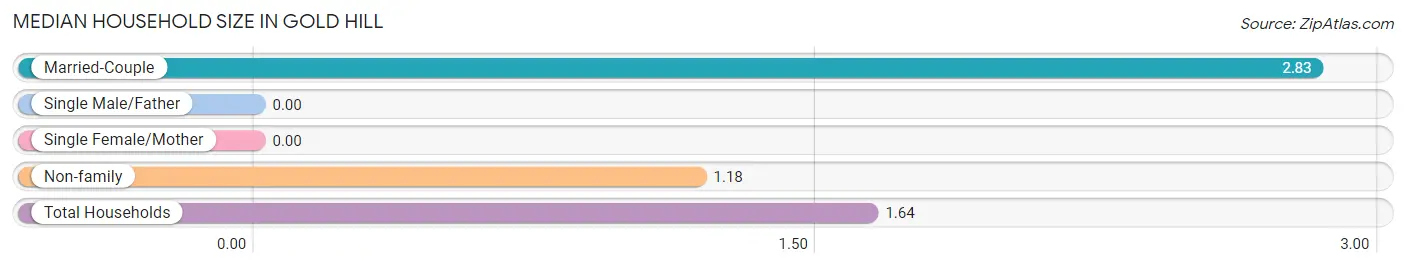
Median Household Size in Gold Hill
| Household Type | # Households | Household Size |
| Married-Couple | 41 (27.7%) | 2.83 |
| Single Male/Father | 0 (0.0%) | - |
| Single Female/Mother | 0 (0.0%) | - |
| Non-family | 107 (72.3%) | 1.18 |
| Total Households | 148 (100.0%) | 1.64 |
Household Size by Marriage Status in Gold Hill
Out of a total of 148 households in Gold Hill, 41 (27.7%) are family households, while 107 (72.3%) are nonfamily households. The most numerous type of family households are 2-person households, comprising 23, and the most common type of nonfamily households are 1-person households, comprising 89.
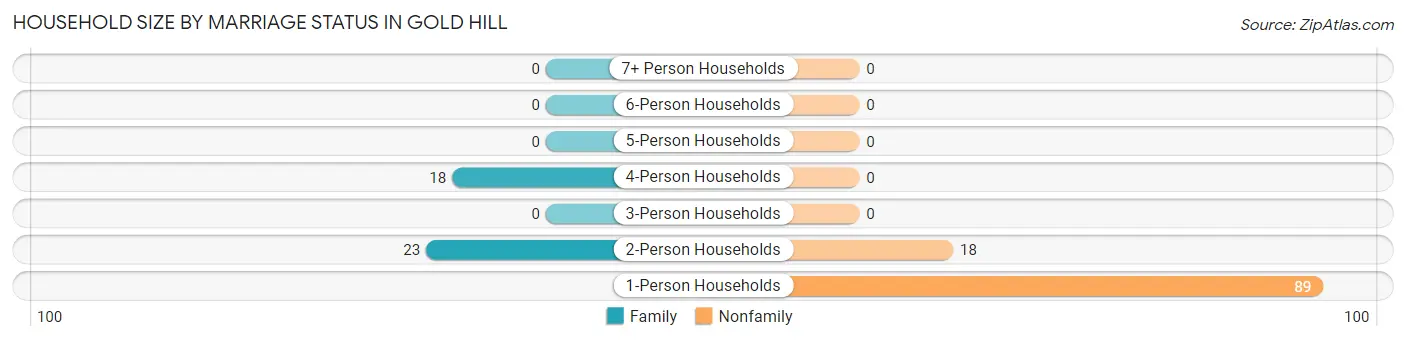
| Household Size | Family Households | Nonfamily Households |
| 1-Person Households | - | 89 (60.1%) |
| 2-Person Households | 23 (15.5%) | 18 (12.2%) |
| 3-Person Households | 0 (0.0%) | 0 (0.0%) |
| 4-Person Households | 18 (12.2%) | 0 (0.0%) |
| 5-Person Households | 0 (0.0%) | 0 (0.0%) |
| 6-Person Households | 0 (0.0%) | 0 (0.0%) |
| 7+ Person Households | 0 (0.0%) | 0 (0.0%) |
| Total | 41 (27.7%) | 107 (72.3%) |
Female Fertility in Gold Hill
Fertility by Age in Gold Hill
| Age Bracket | Women with Births | Births / 1,000 Women |
| 15 to 19 years | 0 (0.0%) | 0.0 |
| 20 to 34 years | 0 (0.0%) | 0.0 |
| 35 to 50 years | 0 (0.0%) | 0.0 |
| Total | 0 (0.0%) | 0.0 |
Fertility by Age by Marriage Status in Gold Hill
| Age Bracket | Married | Unmarried |
| 15 to 19 years | 0 (0.0%) | 0 (0.0%) |
| 20 to 34 years | 0 (0.0%) | 0 (0.0%) |
| 35 to 50 years | 0 (0.0%) | 0 (0.0%) |
| Total | 0 (0.0%) | 0 (0.0%) |
Fertility by Education in Gold Hill
| Educational Attainment | Women with Births | Births / 1,000 Women |
| Less than High School | 0 (0.0%) | 0.0 |
| High School Diploma | 0 (0.0%) | 0.0 |
| College or Associate's Degree | 0 (0.0%) | 0.0 |
| Bachelor's Degree | 0 (0.0%) | 0.0 |
| Graduate Degree | 0 (0.0%) | 0.0 |
| Total | 0 (0.0%) | 0.0 |
Fertility by Education by Marriage Status in Gold Hill
| Educational Attainment | Married | Unmarried |
| Less than High School | 0 (0.0%) | 0 (0.0%) |
| High School Diploma | 0 (0.0%) | 0 (0.0%) |
| College or Associate's Degree | 0 (0.0%) | 0 (0.0%) |
| Bachelor's Degree | 0 (0.0%) | 0 (0.0%) |
| Graduate Degree | 0 (0.0%) | 0 (0.0%) |
| Total | 0 (0.0%) | 0 (0.0%) |
Employment Characteristics in Gold Hill
Employment by Class of Employer in Gold Hill
Among the 208 employed individuals in Gold Hill, private company employees (108 | 51.9%), not-for-profit organizations (63 | 30.3%), and self-employed (not incorporated) (19 | 9.1%) make up the most common classes of employment.
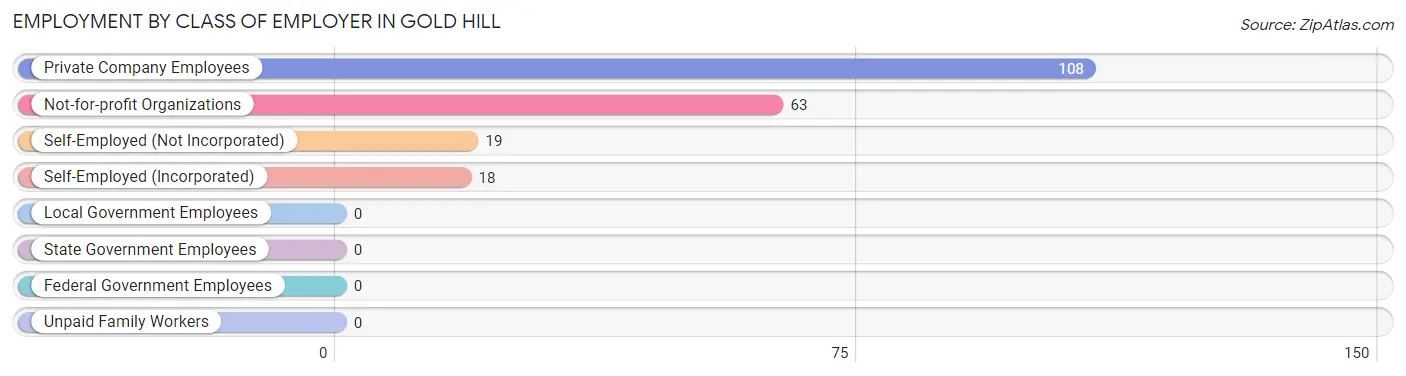
| Employer Class | # Employees | % Employees |
| Private Company Employees | 108 | 51.9% |
| Self-Employed (Incorporated) | 18 | 8.6% |
| Self-Employed (Not Incorporated) | 19 | 9.1% |
| Not-for-profit Organizations | 63 | 30.3% |
| Local Government Employees | 0 | 0.0% |
| State Government Employees | 0 | 0.0% |
| Federal Government Employees | 0 | 0.0% |
| Unpaid Family Workers | 0 | 0.0% |
| Total | 208 | 100.0% |
Employment Status by Age in Gold Hill
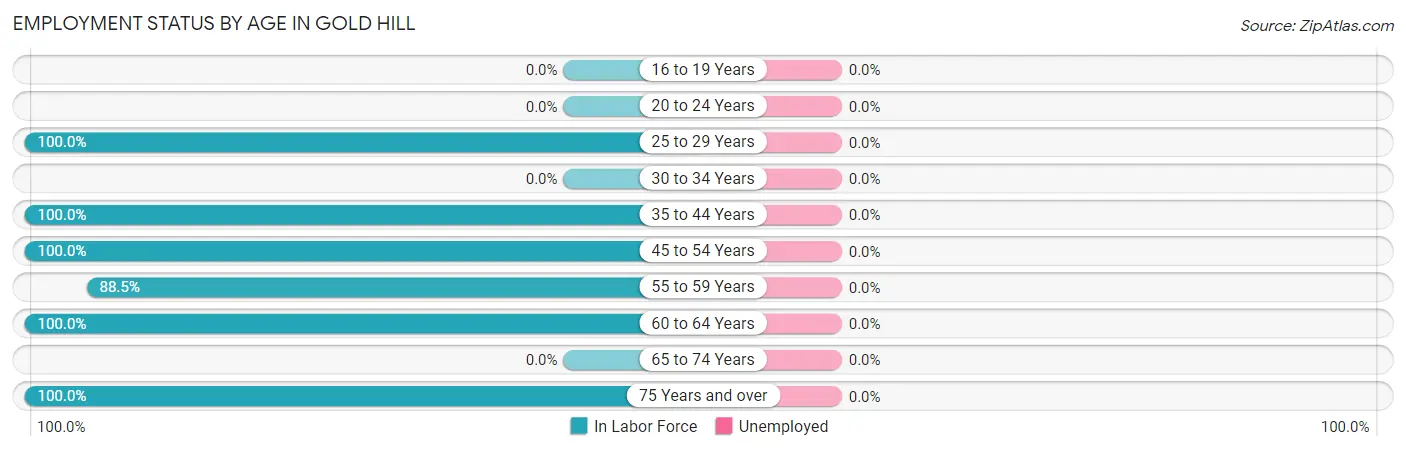
| Age Bracket | In Labor Force | Unemployed |
| 16 to 19 Years | 0 (0.0%) | 0 (0.0%) |
| 20 to 24 Years | 0 (0.0%) | 0 (0.0%) |
| 25 to 29 Years | 43 (100.0%) | 0 (0.0%) |
| 30 to 34 Years | 0 (0.0%) | 0 (0.0%) |
| 35 to 44 Years | 39 (100.0%) | 0 (0.0%) |
| 45 to 54 Years | 35 (100.0%) | 0 (0.0%) |
| 55 to 59 Years | 54 (88.5%) | 0 (0.0%) |
| 60 to 64 Years | 19 (100.0%) | 0 (0.0%) |
| 65 to 74 Years | 0 (0.0%) | 0 (0.0%) |
| 75 Years and over | 18 (100.0%) | 0 (0.0%) |
| Total | 208 (96.7%) | 0 (0.0%) |
Employment Status by Educational Attainment in Gold Hill
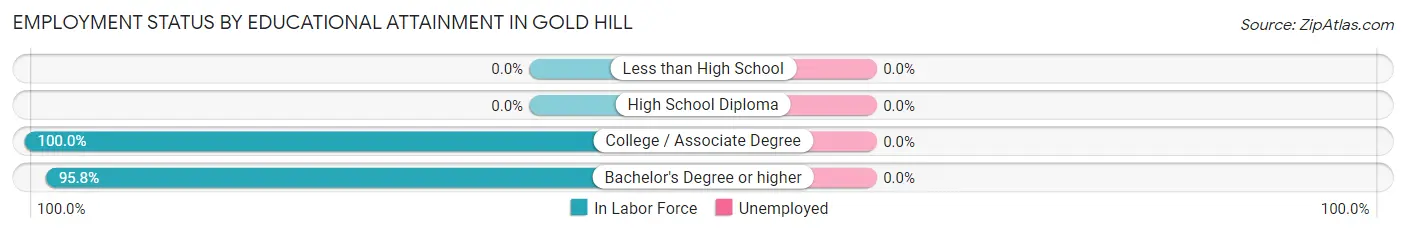
| Educational Attainment | In Labor Force | Unemployed |
| Less than High School | 0 (0.0%) | 0 (0.0%) |
| High School Diploma | 0 (0.0%) | 0 (0.0%) |
| College / Associate Degree | 32 (100.0%) | 0 (0.0%) |
| Bachelor's Degree or higher | 158 (95.8%) | 0 (0.0%) |
| Total | 190 (96.4%) | 0 (0.0%) |
Employment Occupations by Sex in Gold Hill
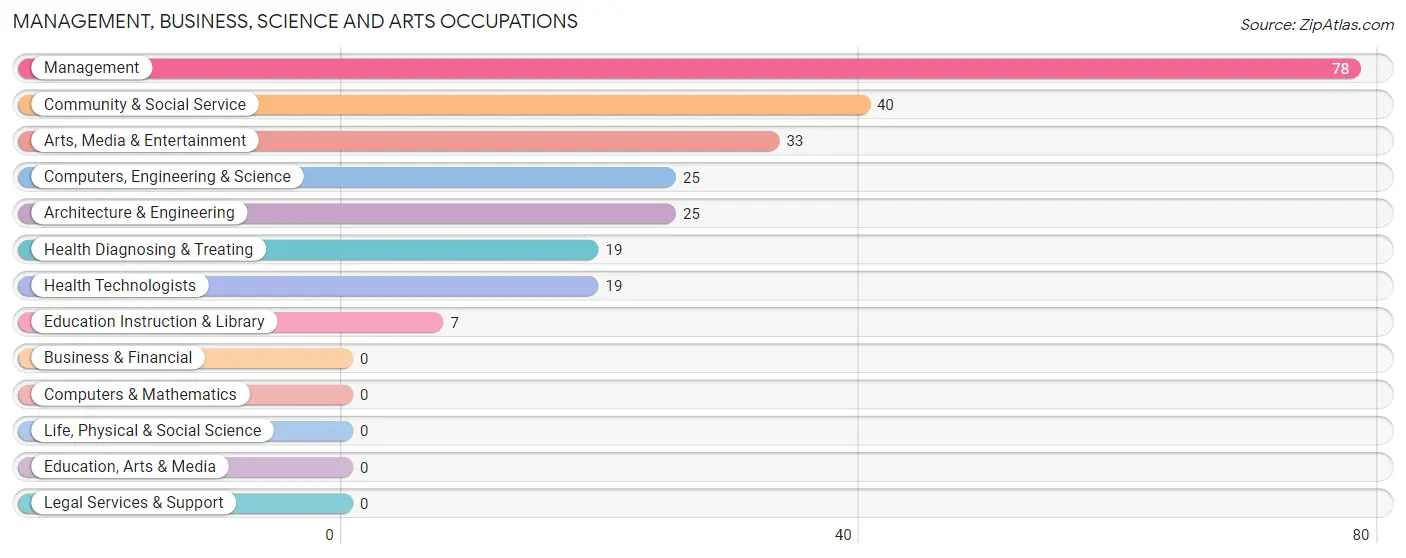
Management, Business, Science and Arts Occupations
The most common Management, Business, Science and Arts occupations in Gold Hill are Management (78 | 37.5%), Community & Social Service (40 | 19.2%), Arts, Media & Entertainment (33 | 15.9%), Computers, Engineering & Science (25 | 12.0%), and Architecture & Engineering (25 | 12.0%).
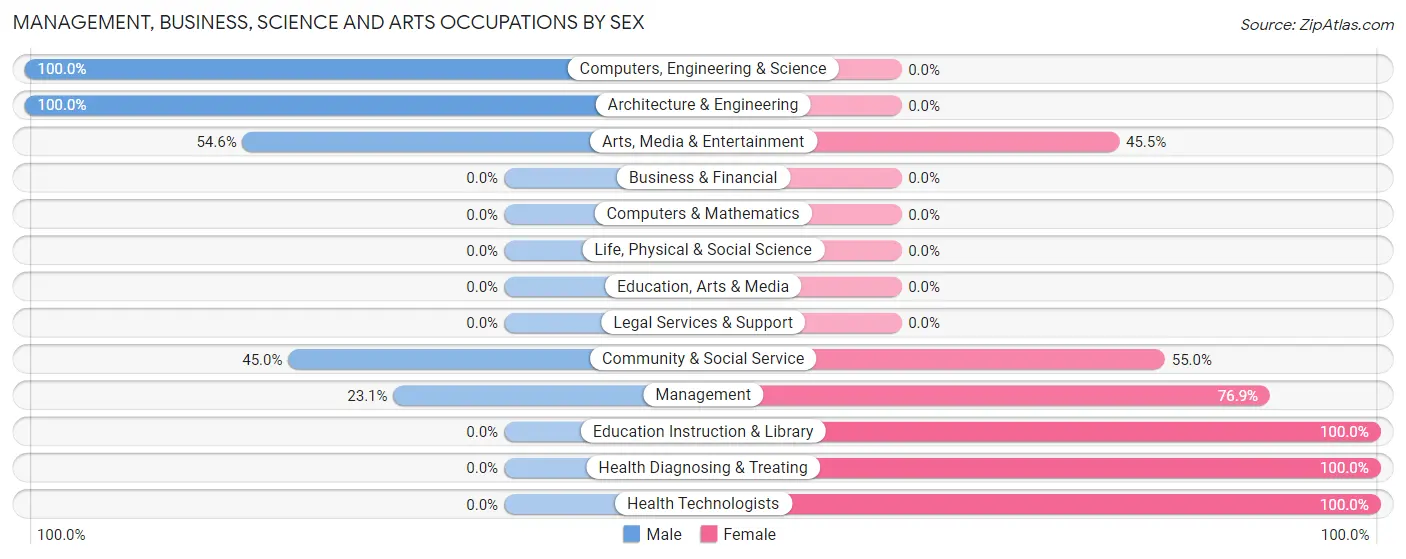
Management, Business, Science and Arts Occupations by Sex
Within the Management, Business, Science and Arts occupations in Gold Hill, the most male-oriented occupations are Computers, Engineering & Science (100.0%), Architecture & Engineering (100.0%), and Arts, Media & Entertainment (54.5%), while the most female-oriented occupations are Education Instruction & Library (100.0%), Health Diagnosing & Treating (100.0%), and Health Technologists (100.0%).
| Occupation | Male | Female |
| Management | 18 (23.1%) | 60 (76.9%) |
| Business & Financial | 0 (0.0%) | 0 (0.0%) |
| Computers, Engineering & Science | 25 (100.0%) | 0 (0.0%) |
| Computers & Mathematics | 0 (0.0%) | 0 (0.0%) |
| Architecture & Engineering | 25 (100.0%) | 0 (0.0%) |
| Life, Physical & Social Science | 0 (0.0%) | 0 (0.0%) |
| Community & Social Service | 18 (45.0%) | 22 (55.0%) |
| Education, Arts & Media | 0 (0.0%) | 0 (0.0%) |
| Legal Services & Support | 0 (0.0%) | 0 (0.0%) |
| Education Instruction & Library | 0 (0.0%) | 7 (100.0%) |
| Arts, Media & Entertainment | 18 (54.5%) | 15 (45.5%) |
| Health Diagnosing & Treating | 0 (0.0%) | 19 (100.0%) |
| Health Technologists | 0 (0.0%) | 19 (100.0%) |
| Total (Category) | 61 (37.7%) | 101 (62.4%) |
| Total (Overall) | 61 (29.3%) | 147 (70.7%) |
Services Occupations
Services Occupations by Sex
| Occupation | Male | Female |
| Healthcare Support | 0 (0.0%) | 0 (0.0%) |
| Security & Protection | 0 (0.0%) | 0 (0.0%) |
| Firefighting & Prevention | 0 (0.0%) | 0 (0.0%) |
| Law Enforcement | 0 (0.0%) | 0 (0.0%) |
| Food Preparation & Serving | 0 (0.0%) | 0 (0.0%) |
| Cleaning & Maintenance | 0 (0.0%) | 0 (0.0%) |
| Personal Care & Service | 0 (0.0%) | 0 (0.0%) |
| Total (Category) | 0 (0.0%) | 0 (0.0%) |
| Total (Overall) | 61 (29.3%) | 147 (70.7%) |
Sales and Office Occupations
The most common Sales and Office occupations in Gold Hill are , and Office & Administration (46 | 22.1%).
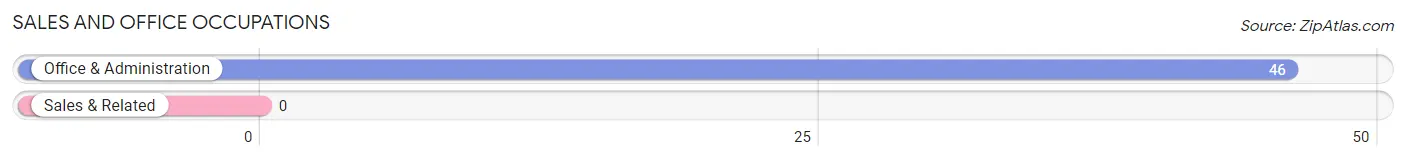
Sales and Office Occupations by Sex
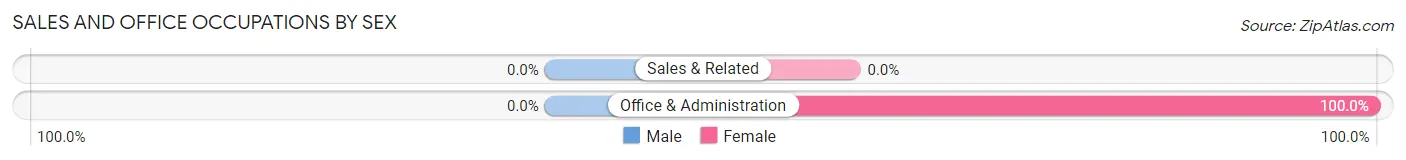
| Occupation | Male | Female |
| Sales & Related | 0 (0.0%) | 0 (0.0%) |
| Office & Administration | 0 (0.0%) | 46 (100.0%) |
| Total (Category) | 0 (0.0%) | 46 (100.0%) |
| Total (Overall) | 61 (29.3%) | 147 (70.7%) |
Natural Resources, Construction and Maintenance Occupations
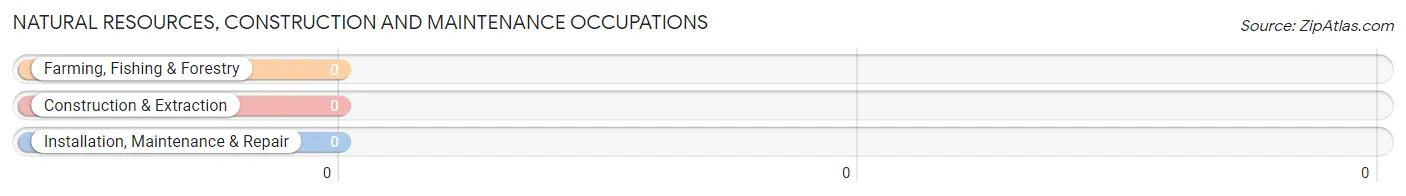
Natural Resources, Construction and Maintenance Occupations by Sex
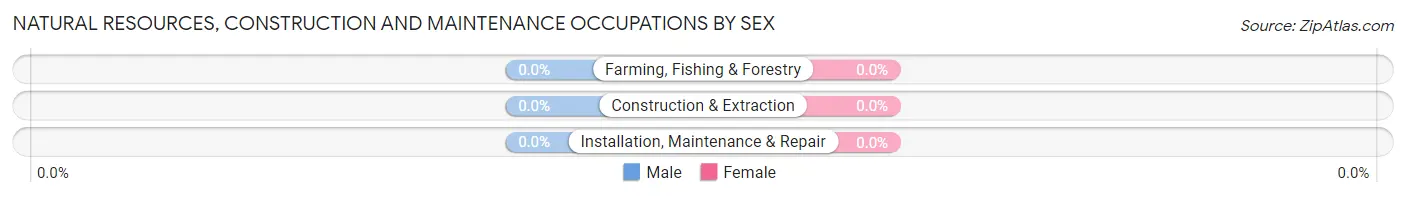
| Occupation | Male | Female |
| Farming, Fishing & Forestry | 0 (0.0%) | 0 (0.0%) |
| Construction & Extraction | 0 (0.0%) | 0 (0.0%) |
| Installation, Maintenance & Repair | 0 (0.0%) | 0 (0.0%) |
| Total (Category) | 0 (0.0%) | 0 (0.0%) |
| Total (Overall) | 61 (29.3%) | 147 (70.7%) |
Production, Transportation and Moving Occupations
Production, Transportation and Moving Occupations by Sex
| Occupation | Male | Female |
| Production | 0 (0.0%) | 0 (0.0%) |
| Transportation | 0 (0.0%) | 0 (0.0%) |
| Material Moving | 0 (0.0%) | 0 (0.0%) |
| Total (Category) | 0 (0.0%) | 0 (0.0%) |
| Total (Overall) | 61 (29.3%) | 147 (70.7%) |
Employment Industries by Sex in Gold Hill
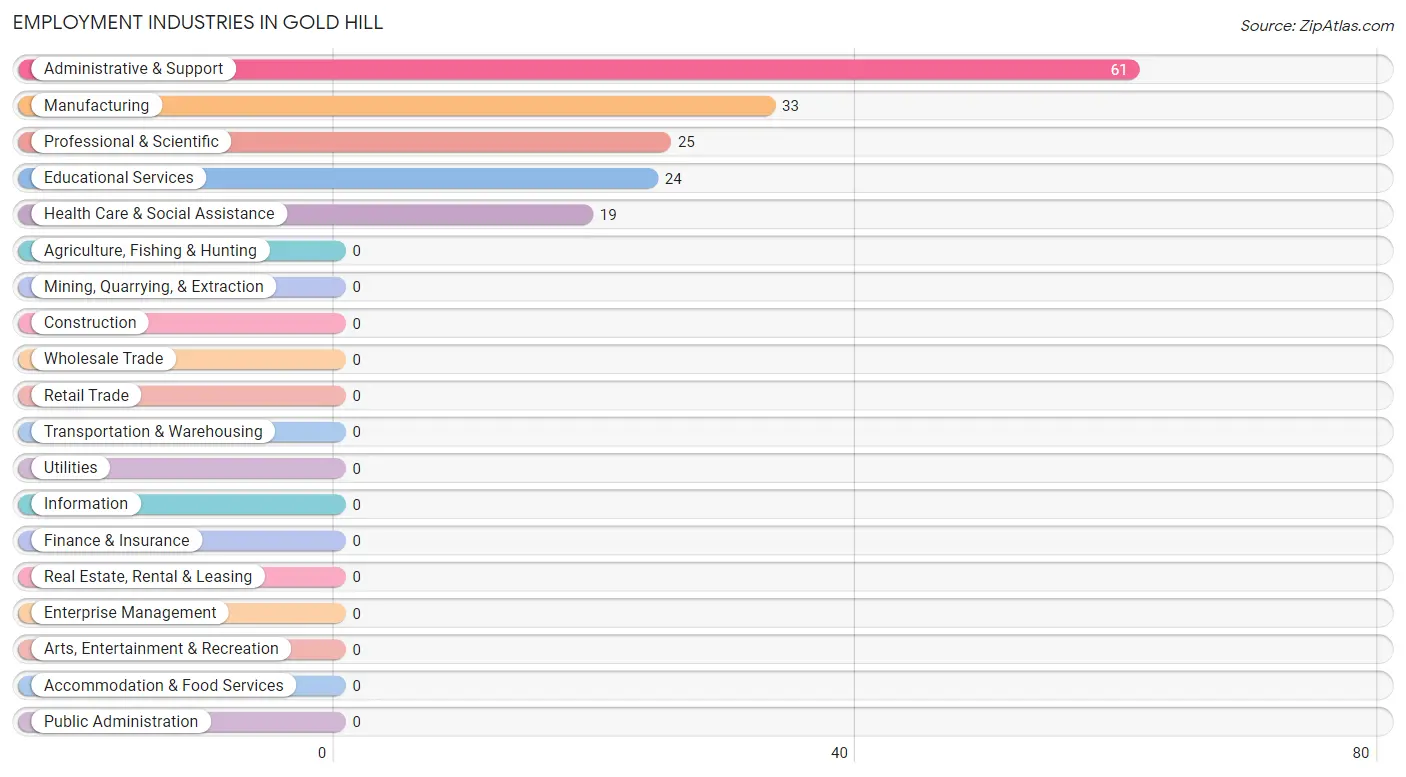
Employment Industries in Gold Hill
The major employment industries in Gold Hill include Administrative & Support (61 | 29.3%), Manufacturing (33 | 15.9%), Professional & Scientific (25 | 12.0%), Educational Services (24 | 11.5%), and Health Care & Social Assistance (19 | 9.1%).
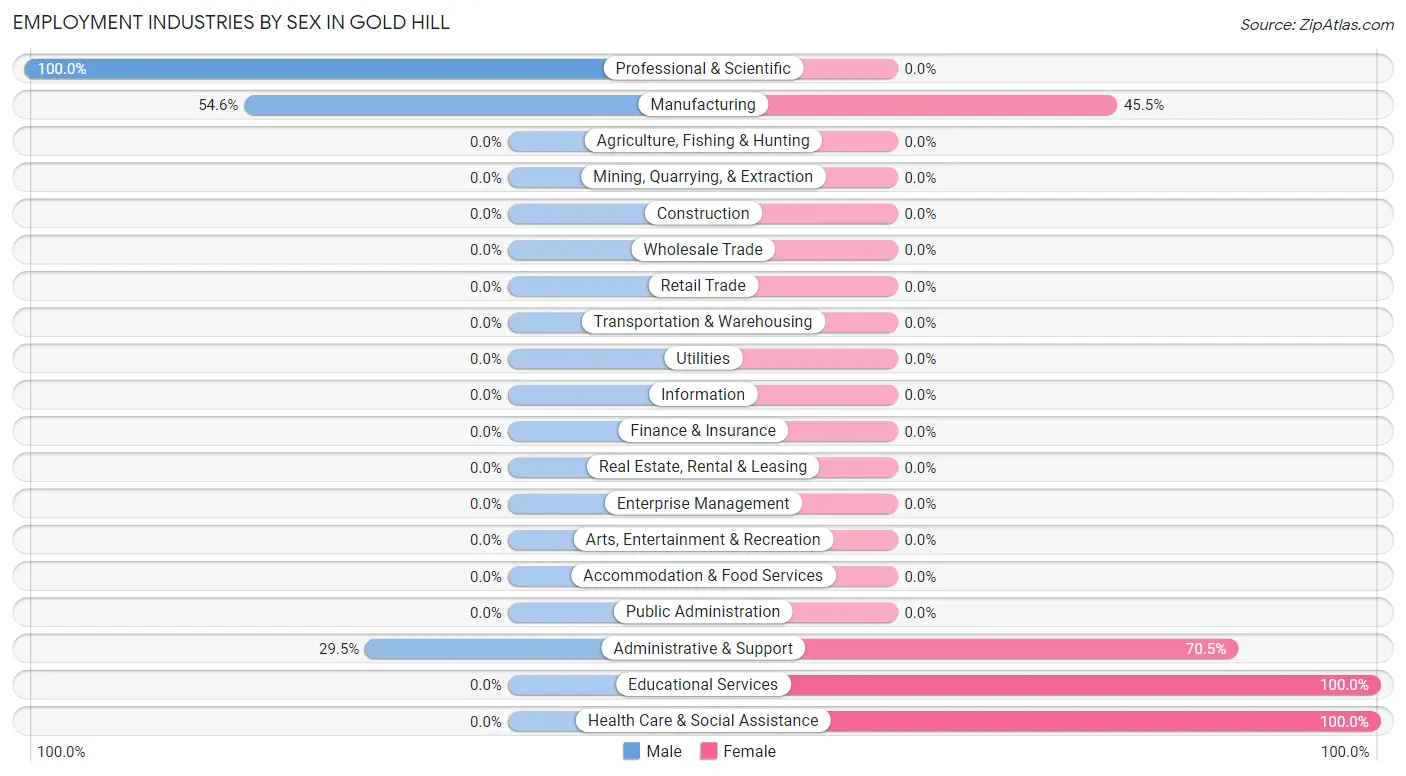
Employment Industries by Sex in Gold Hill
The Gold Hill industries that see more men than women are Professional & Scientific (100.0%), Manufacturing (54.5%), and Administrative & Support (29.5%), whereas the industries that tend to have a higher number of women are Educational Services (100.0%), Health Care & Social Assistance (100.0%), and Administrative & Support (70.5%).
| Industry | Male | Female |
| Agriculture, Fishing & Hunting | 0 (0.0%) | 0 (0.0%) |
| Mining, Quarrying, & Extraction | 0 (0.0%) | 0 (0.0%) |
| Construction | 0 (0.0%) | 0 (0.0%) |
| Manufacturing | 18 (54.5%) | 15 (45.5%) |
| Wholesale Trade | 0 (0.0%) | 0 (0.0%) |
| Retail Trade | 0 (0.0%) | 0 (0.0%) |
| Transportation & Warehousing | 0 (0.0%) | 0 (0.0%) |
| Utilities | 0 (0.0%) | 0 (0.0%) |
| Information | 0 (0.0%) | 0 (0.0%) |
| Finance & Insurance | 0 (0.0%) | 0 (0.0%) |
| Real Estate, Rental & Leasing | 0 (0.0%) | 0 (0.0%) |
| Professional & Scientific | 25 (100.0%) | 0 (0.0%) |
| Enterprise Management | 0 (0.0%) | 0 (0.0%) |
| Administrative & Support | 18 (29.5%) | 43 (70.5%) |
| Educational Services | 0 (0.0%) | 24 (100.0%) |
| Health Care & Social Assistance | 0 (0.0%) | 19 (100.0%) |
| Arts, Entertainment & Recreation | 0 (0.0%) | 0 (0.0%) |
| Accommodation & Food Services | 0 (0.0%) | 0 (0.0%) |
| Public Administration | 0 (0.0%) | 0 (0.0%) |
| Total | 61 (29.3%) | 147 (70.7%) |
Education in Gold Hill
School Enrollment in Gold Hill
The most common levels of schooling among the 41 students in Gold Hill are elementary school (17 | 41.5%), middle school (17 | 41.5%), and college / undergraduate (7 | 17.1%).
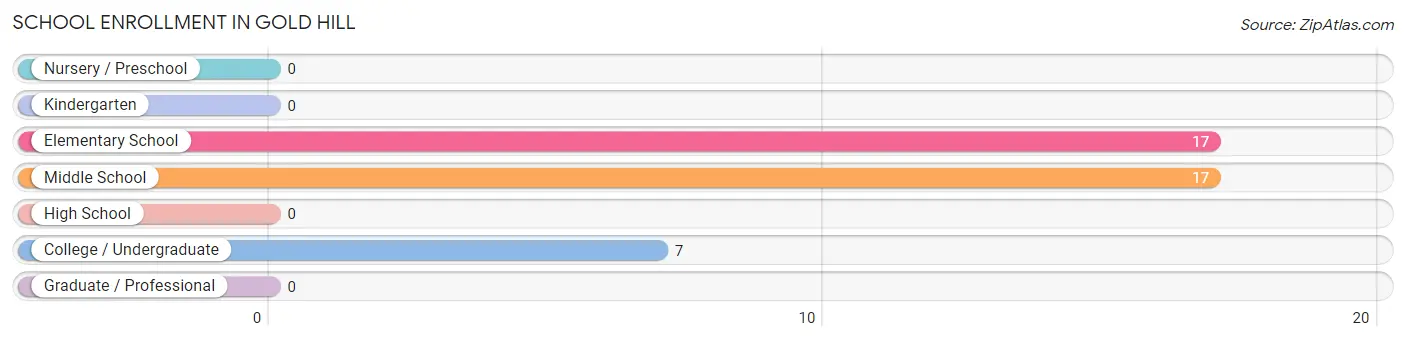
| School Level | # Students | % Students |
| Nursery / Preschool | 0 | 0.0% |
| Kindergarten | 0 | 0.0% |
| Elementary School | 17 | 41.5% |
| Middle School | 17 | 41.5% |
| High School | 0 | 0.0% |
| College / Undergraduate | 7 | 17.1% |
| Graduate / Professional | 0 | 0.0% |
| Total | 41 | 100.0% |
School Enrollment by Age by Funding Source in Gold Hill
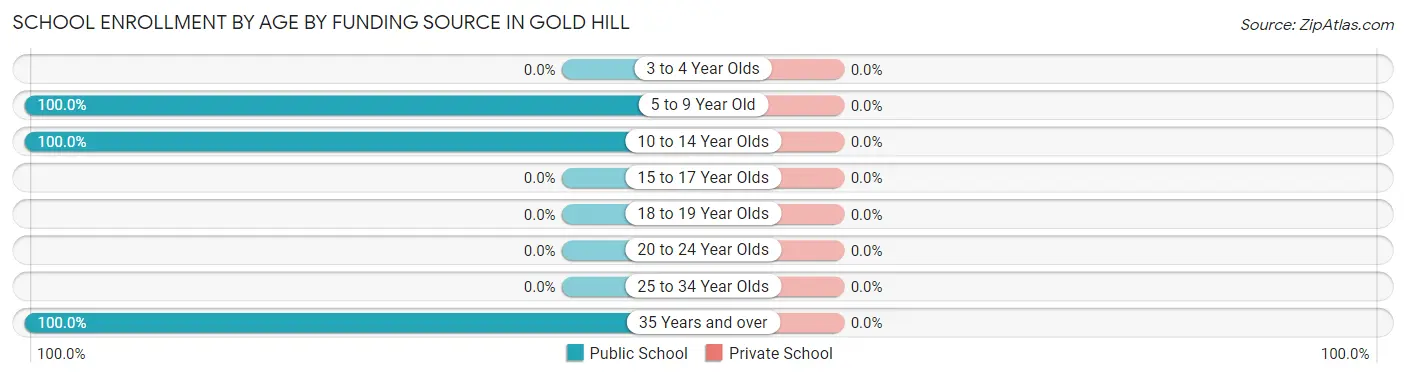
| Age Bracket | Public School | Private School |
| 3 to 4 Year Olds | 0 (0.0%) | 0 (0.0%) |
| 5 to 9 Year Old | 17 (100.0%) | 0 (0.0%) |
| 10 to 14 Year Olds | 17 (100.0%) | 0 (0.0%) |
| 15 to 17 Year Olds | 0 (0.0%) | 0 (0.0%) |
| 18 to 19 Year Olds | 0 (0.0%) | 0 (0.0%) |
| 20 to 24 Year Olds | 0 (0.0%) | 0 (0.0%) |
| 25 to 34 Year Olds | 0 (0.0%) | 0 (0.0%) |
| 35 Years and over | 7 (100.0%) | 0 (0.0%) |
| Total | 41 (100.0%) | 0 (0.0%) |
Educational Attainment by Field of Study in Gold Hill
Bio, nature & agricultural (89 | 38.9%), psychology (46 | 20.1%), engineering (26 | 11.4%), liberal arts & history (25 | 10.9%), and science & technology (19 | 8.3%) are the most common fields of study among 229 individuals in Gold Hill who have obtained a bachelor's degree or higher.
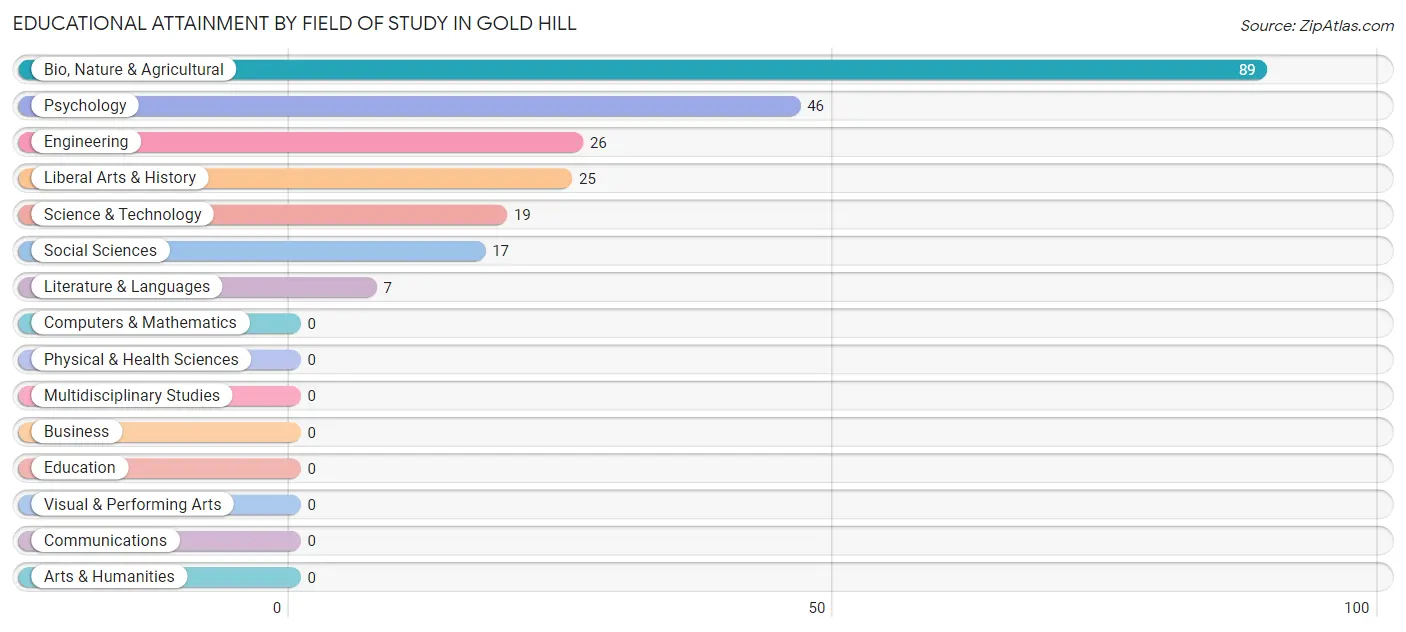
| Field of Study | # Graduates | % Graduates |
| Computers & Mathematics | 0 | 0.0% |
| Bio, Nature & Agricultural | 89 | 38.9% |
| Physical & Health Sciences | 0 | 0.0% |
| Psychology | 46 | 20.1% |
| Social Sciences | 17 | 7.4% |
| Engineering | 26 | 11.4% |
| Multidisciplinary Studies | 0 | 0.0% |
| Science & Technology | 19 | 8.3% |
| Business | 0 | 0.0% |
| Education | 0 | 0.0% |
| Literature & Languages | 7 | 3.1% |
| Liberal Arts & History | 25 | 10.9% |
| Visual & Performing Arts | 0 | 0.0% |
| Communications | 0 | 0.0% |
| Arts & Humanities | 0 | 0.0% |
| Total | 229 | 100.0% |
Transportation & Commute in Gold Hill
Vehicle Availability by Sex in Gold Hill
The most prevalent vehicle ownership categories in Gold Hill are males with 2 vehicles (43, accounting for 70.5%) and females with 2 vehicles (85, making up 29.2%).
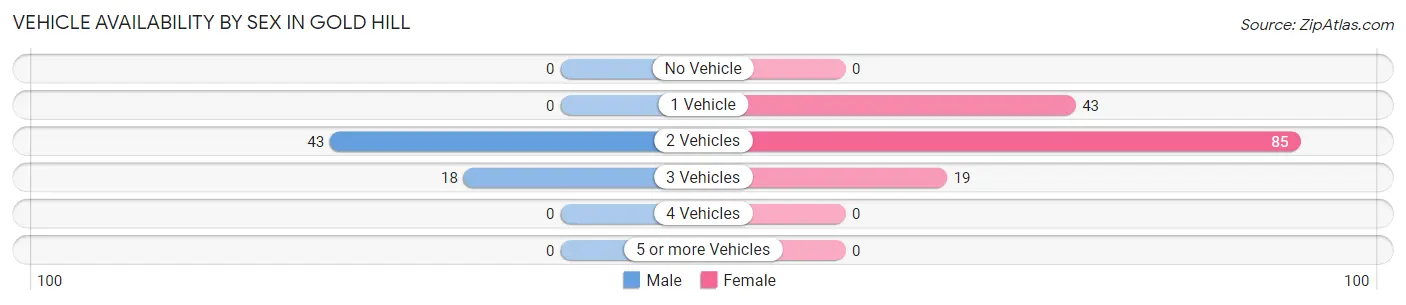
| Vehicles Available | Male | Female |
| No Vehicle | 0 (0.0%) | 0 (0.0%) |
| 1 Vehicle | 0 (0.0%) | 43 (29.2%) |
| 2 Vehicles | 43 (70.5%) | 85 (57.8%) |
| 3 Vehicles | 18 (29.5%) | 19 (12.9%) |
| 4 Vehicles | 0 (0.0%) | 0 (0.0%) |
| 5 or more Vehicles | 0 (0.0%) | 0 (0.0%) |
| Total | 61 (100.0%) | 147 (100.0%) |
Commute Time in Gold Hill
The most frequently occuring commute durations in Gold Hill are 45 to 59 minutes (64 commuters, 36.0%), 30 to 34 minutes (43 commuters, 24.2%), and 40 to 44 minutes (35 commuters, 19.7%).
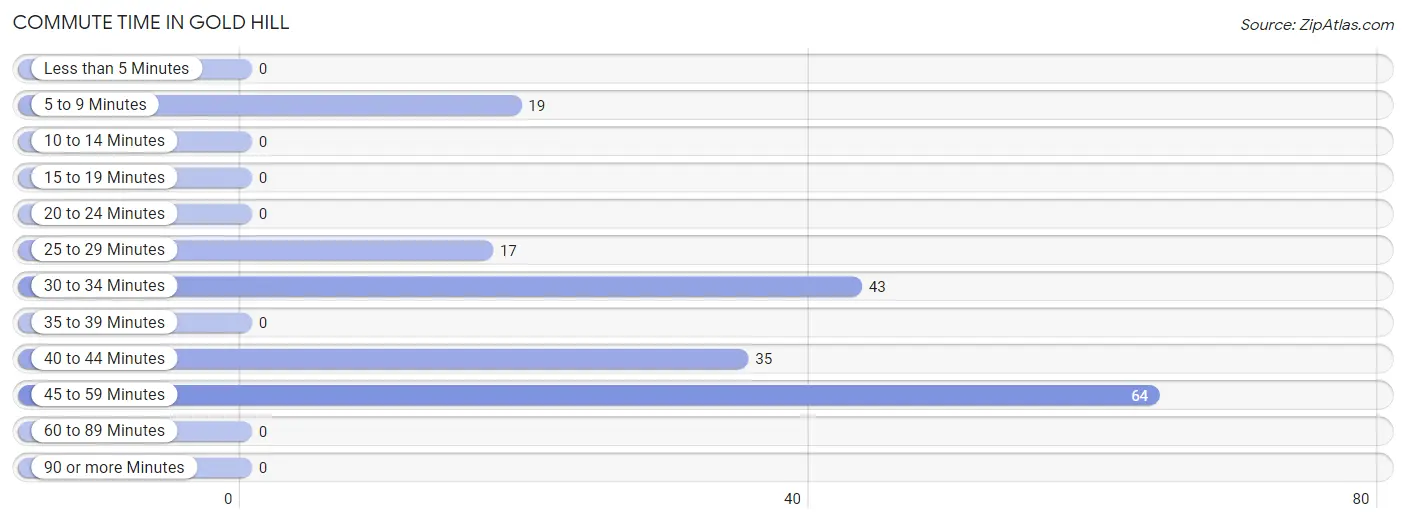
| Commute Time | # Commuters | % Commuters |
| Less than 5 Minutes | 0 | 0.0% |
| 5 to 9 Minutes | 19 | 10.7% |
| 10 to 14 Minutes | 0 | 0.0% |
| 15 to 19 Minutes | 0 | 0.0% |
| 20 to 24 Minutes | 0 | 0.0% |
| 25 to 29 Minutes | 17 | 9.6% |
| 30 to 34 Minutes | 43 | 24.2% |
| 35 to 39 Minutes | 0 | 0.0% |
| 40 to 44 Minutes | 35 | 19.7% |
| 45 to 59 Minutes | 64 | 36.0% |
| 60 to 89 Minutes | 0 | 0.0% |
| 90 or more Minutes | 0 | 0.0% |
Commute Time by Sex in Gold Hill
The most common commute times in Gold Hill are 40 to 44 minutes (18 commuters, 34.0%) for males and 45 to 59 minutes (46 commuters, 36.8%) for females.
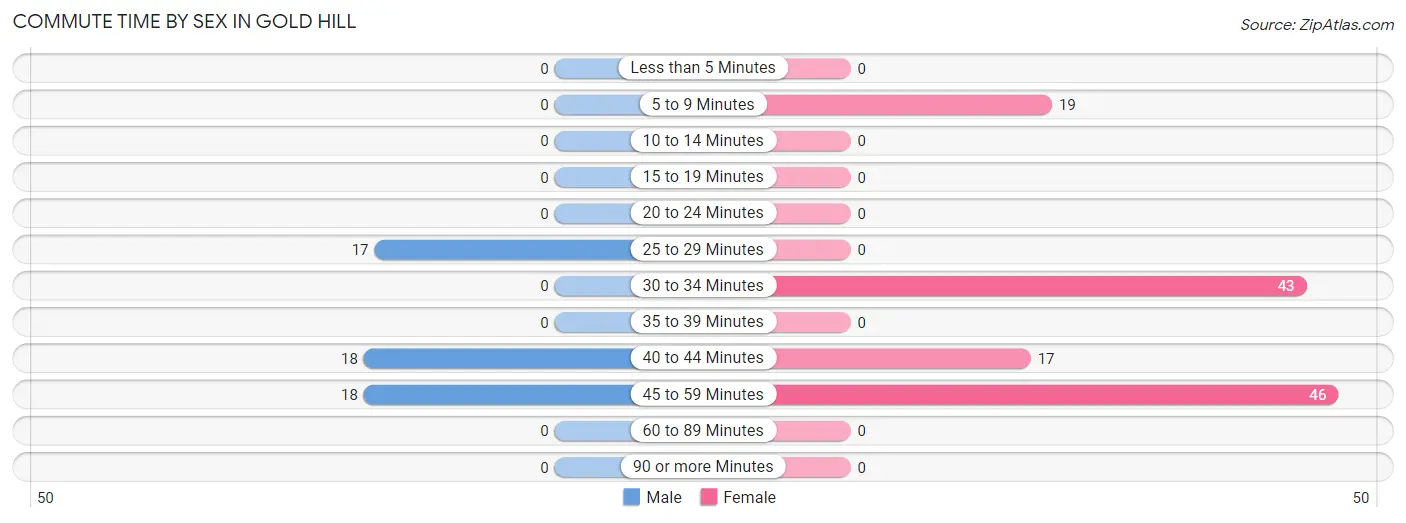
| Commute Time | Male | Female |
| Less than 5 Minutes | 0 (0.0%) | 0 (0.0%) |
| 5 to 9 Minutes | 0 (0.0%) | 19 (15.2%) |
| 10 to 14 Minutes | 0 (0.0%) | 0 (0.0%) |
| 15 to 19 Minutes | 0 (0.0%) | 0 (0.0%) |
| 20 to 24 Minutes | 0 (0.0%) | 0 (0.0%) |
| 25 to 29 Minutes | 17 (32.1%) | 0 (0.0%) |
| 30 to 34 Minutes | 0 (0.0%) | 43 (34.4%) |
| 35 to 39 Minutes | 0 (0.0%) | 0 (0.0%) |
| 40 to 44 Minutes | 18 (34.0%) | 17 (13.6%) |
| 45 to 59 Minutes | 18 (34.0%) | 46 (36.8%) |
| 60 to 89 Minutes | 0 (0.0%) | 0 (0.0%) |
| 90 or more Minutes | 0 (0.0%) | 0 (0.0%) |
Time of Departure to Work by Sex in Gold Hill
The most frequent times of departure to work in Gold Hill are 7:00 AM to 7:29 AM (18, 34.0%) for males and 9:00 AM to 9:59 AM (46, 36.8%) for females.
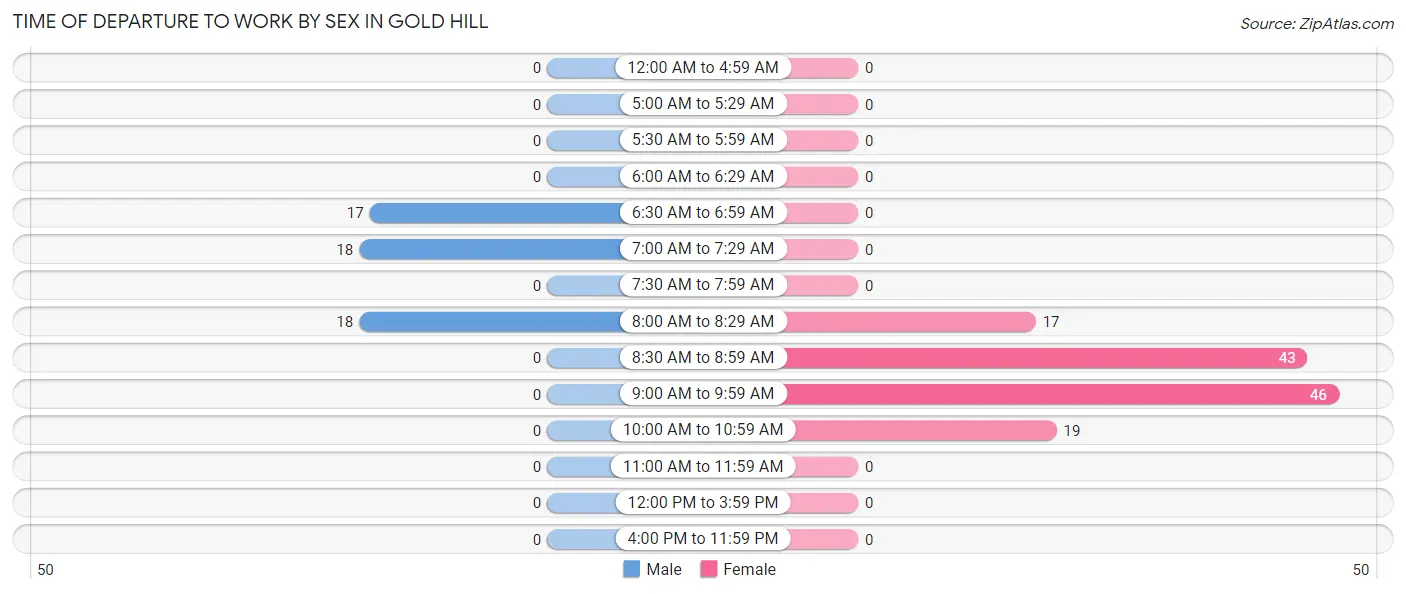
| Time of Departure | Male | Female |
| 12:00 AM to 4:59 AM | 0 (0.0%) | 0 (0.0%) |
| 5:00 AM to 5:29 AM | 0 (0.0%) | 0 (0.0%) |
| 5:30 AM to 5:59 AM | 0 (0.0%) | 0 (0.0%) |
| 6:00 AM to 6:29 AM | 0 (0.0%) | 0 (0.0%) |
| 6:30 AM to 6:59 AM | 17 (32.1%) | 0 (0.0%) |
| 7:00 AM to 7:29 AM | 18 (34.0%) | 0 (0.0%) |
| 7:30 AM to 7:59 AM | 0 (0.0%) | 0 (0.0%) |
| 8:00 AM to 8:29 AM | 18 (34.0%) | 17 (13.6%) |
| 8:30 AM to 8:59 AM | 0 (0.0%) | 43 (34.4%) |
| 9:00 AM to 9:59 AM | 0 (0.0%) | 46 (36.8%) |
| 10:00 AM to 10:59 AM | 0 (0.0%) | 19 (15.2%) |
| 11:00 AM to 11:59 AM | 0 (0.0%) | 0 (0.0%) |
| 12:00 PM to 3:59 PM | 0 (0.0%) | 0 (0.0%) |
| 4:00 PM to 11:59 PM | 0 (0.0%) | 0 (0.0%) |
| Total | 53 (100.0%) | 125 (100.0%) |
Housing Occupancy in Gold Hill
Occupancy by Ownership in Gold Hill
Of the total 148 dwellings in Gold Hill, owner-occupied units account for 41 (27.7%), while renter-occupied units make up 107 (72.3%).
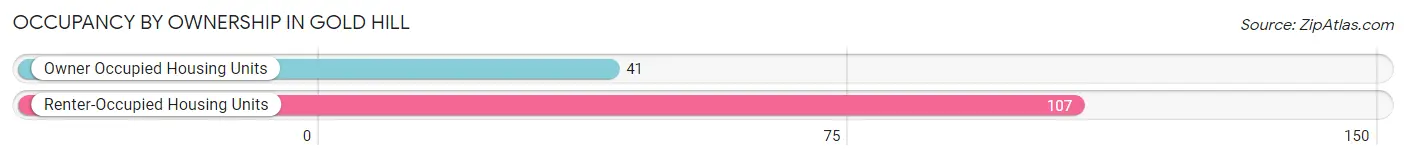
| Occupancy | # Housing Units | % Housing Units |
| Owner Occupied Housing Units | 41 | 27.7% |
| Renter-Occupied Housing Units | 107 | 72.3% |
| Total Occupied Housing Units | 148 | 100.0% |
Occupancy by Household Size in Gold Hill
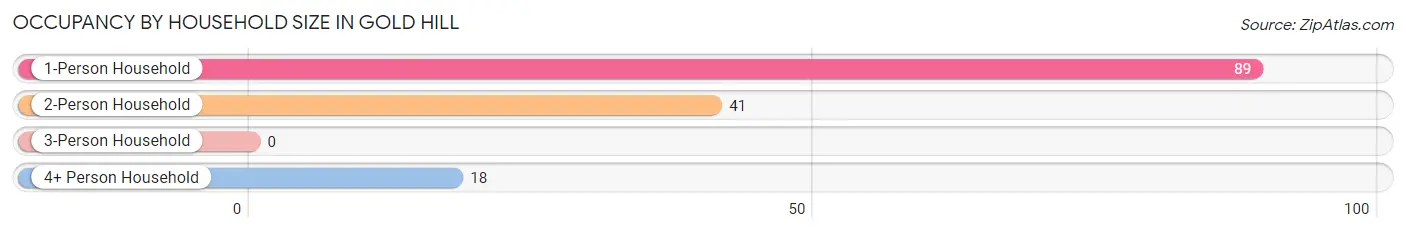
| Household Size | # Housing Units | % Housing Units |
| 1-Person Household | 89 | 60.1% |
| 2-Person Household | 41 | 27.7% |
| 3-Person Household | 0 | 0.0% |
| 4+ Person Household | 18 | 12.2% |
| Total Housing Units | 148 | 100.0% |
Occupancy by Ownership by Household Size in Gold Hill
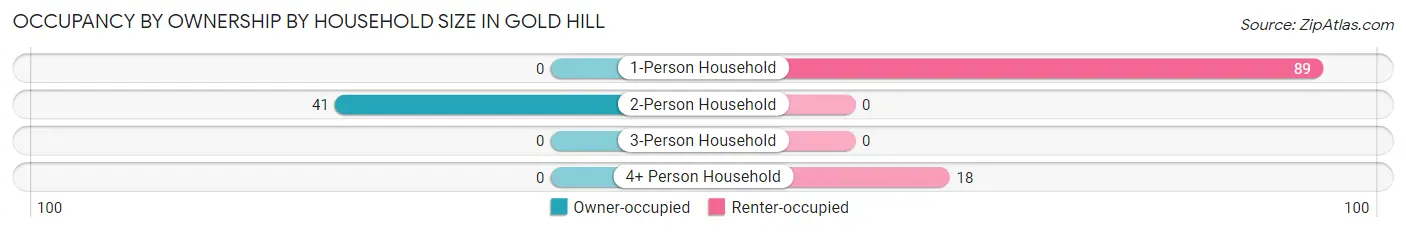
| Household Size | Owner-occupied | Renter-occupied |
| 1-Person Household | 0 (0.0%) | 89 (100.0%) |
| 2-Person Household | 41 (100.0%) | 0 (0.0%) |
| 3-Person Household | 0 (0.0%) | 0 (0.0%) |
| 4+ Person Household | 0 (0.0%) | 18 (100.0%) |
| Total Housing Units | 41 (27.7%) | 107 (72.3%) |
Occupancy by Educational Attainment in Gold Hill
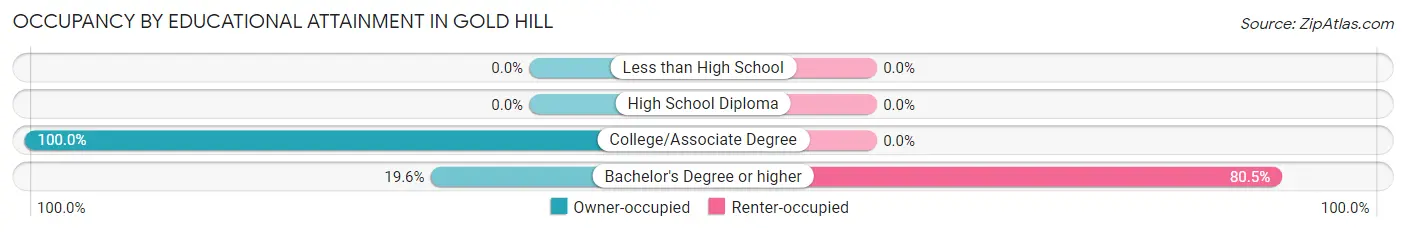
| Household Size | Owner-occupied | Renter-occupied |
| Less than High School | 0 (0.0%) | 0 (0.0%) |
| High School Diploma | 0 (0.0%) | 0 (0.0%) |
| College/Associate Degree | 15 (100.0%) | 0 (0.0%) |
| Bachelor's Degree or higher | 26 (19.6%) | 107 (80.4%) |
Occupancy by Age of Householder in Gold Hill
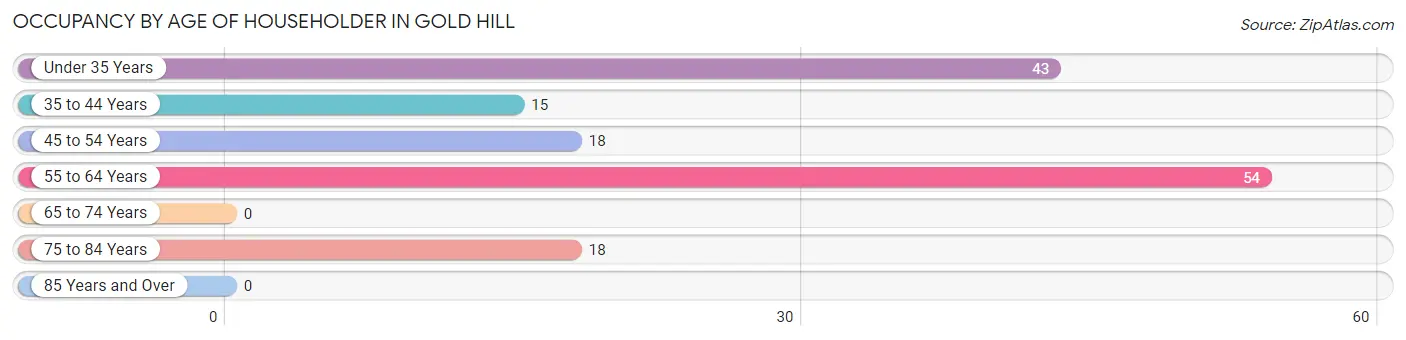
| Age Bracket | # Households | % Households |
| Under 35 Years | 43 | 29.0% |
| 35 to 44 Years | 15 | 10.1% |
| 45 to 54 Years | 18 | 12.2% |
| 55 to 64 Years | 54 | 36.5% |
| 65 to 74 Years | 0 | 0.0% |
| 75 to 84 Years | 18 | 12.2% |
| 85 Years and Over | 0 | 0.0% |
| Total | 148 | 100.0% |
Housing Finances in Gold Hill
Median Income by Occupancy in Gold Hill
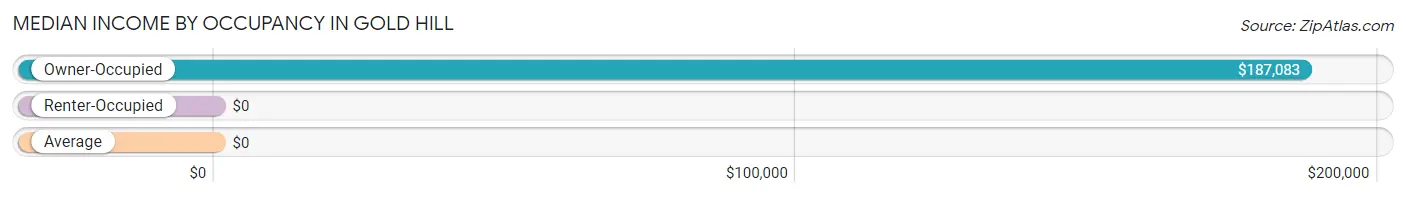
| Occupancy Type | # Households | Median Income |
| Owner-Occupied | 41 (27.7%) | $187,083 |
| Renter-Occupied | 107 (72.3%) | $0 |
| Average | 148 (100.0%) | $0 |
Occupancy by Householder Income Bracket in Gold Hill
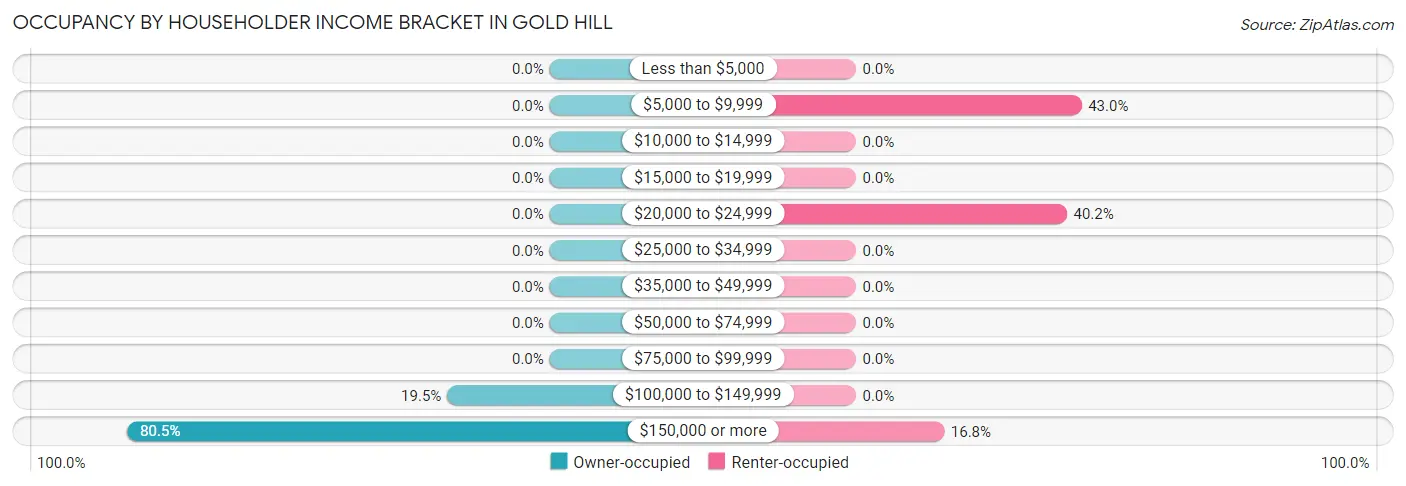
| Income Bracket | Owner-occupied | Renter-occupied |
| Less than $5,000 | 0 (0.0%) | 0 (0.0%) |
| $5,000 to $9,999 | 0 (0.0%) | 46 (43.0%) |
| $10,000 to $14,999 | 0 (0.0%) | 0 (0.0%) |
| $15,000 to $19,999 | 0 (0.0%) | 0 (0.0%) |
| $20,000 to $24,999 | 0 (0.0%) | 43 (40.2%) |
| $25,000 to $34,999 | 0 (0.0%) | 0 (0.0%) |
| $35,000 to $49,999 | 0 (0.0%) | 0 (0.0%) |
| $50,000 to $74,999 | 0 (0.0%) | 0 (0.0%) |
| $75,000 to $99,999 | 0 (0.0%) | 0 (0.0%) |
| $100,000 to $149,999 | 8 (19.5%) | 0 (0.0%) |
| $150,000 or more | 33 (80.5%) | 18 (16.8%) |
| Total | 41 (100.0%) | 107 (100.0%) |
Monthly Housing Cost Tiers in Gold Hill
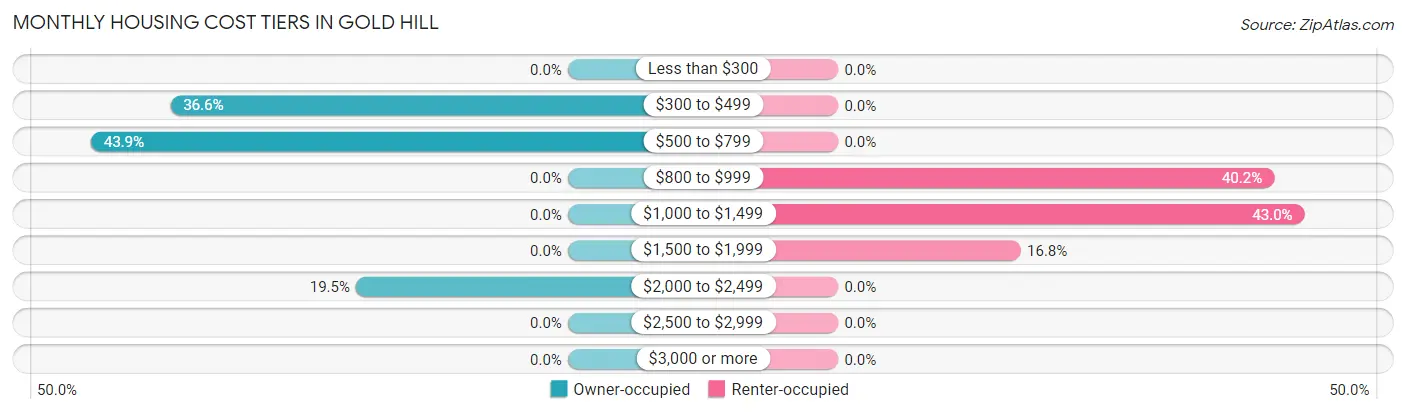
| Monthly Cost | Owner-occupied | Renter-occupied |
| Less than $300 | 0 (0.0%) | 0 (0.0%) |
| $300 to $499 | 15 (36.6%) | 0 (0.0%) |
| $500 to $799 | 18 (43.9%) | 0 (0.0%) |
| $800 to $999 | 0 (0.0%) | 43 (40.2%) |
| $1,000 to $1,499 | 0 (0.0%) | 46 (43.0%) |
| $1,500 to $1,999 | 0 (0.0%) | 18 (16.8%) |
| $2,000 to $2,499 | 8 (19.5%) | 0 (0.0%) |
| $2,500 to $2,999 | 0 (0.0%) | 0 (0.0%) |
| $3,000 or more | 0 (0.0%) | 0 (0.0%) |
| Total | 41 (100.0%) | 107 (100.0%) |
Physical Housing Characteristics in Gold Hill
Housing Structures in Gold Hill
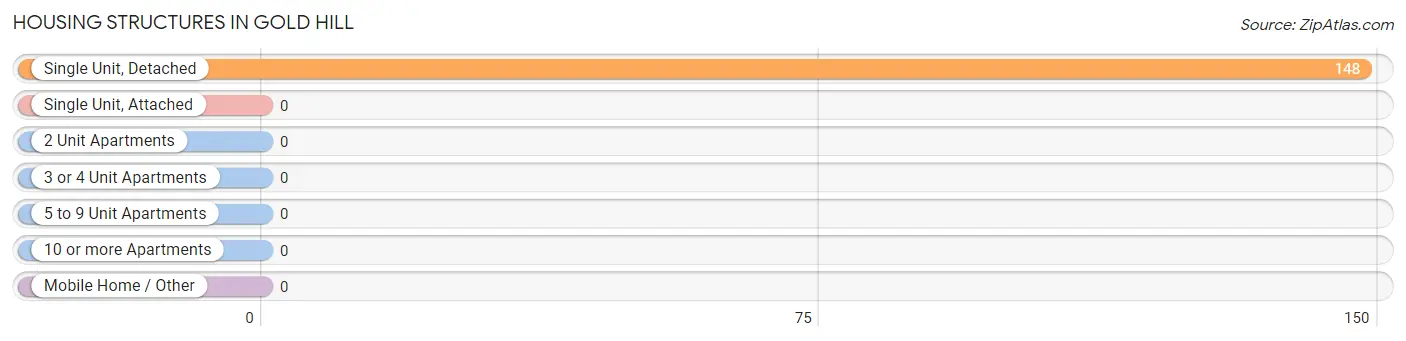
| Structure Type | # Housing Units | % Housing Units |
| Single Unit, Detached | 148 | 100.0% |
| Single Unit, Attached | 0 | 0.0% |
| 2 Unit Apartments | 0 | 0.0% |
| 3 or 4 Unit Apartments | 0 | 0.0% |
| 5 to 9 Unit Apartments | 0 | 0.0% |
| 10 or more Apartments | 0 | 0.0% |
| Mobile Home / Other | 0 | 0.0% |
| Total | 148 | 100.0% |
Housing Structures by Occupancy in Gold Hill
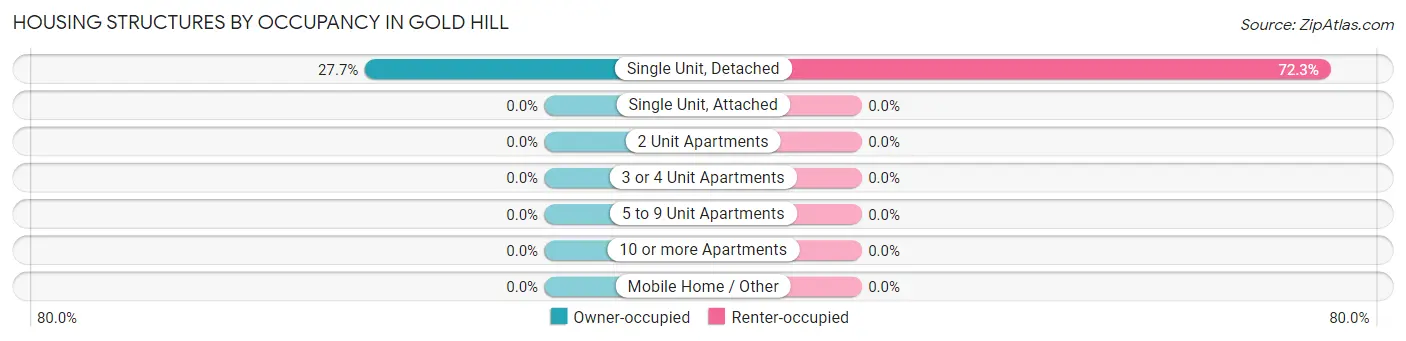
| Structure Type | Owner-occupied | Renter-occupied |
| Single Unit, Detached | 41 (27.7%) | 107 (72.3%) |
| Single Unit, Attached | 0 (0.0%) | 0 (0.0%) |
| 2 Unit Apartments | 0 (0.0%) | 0 (0.0%) |
| 3 or 4 Unit Apartments | 0 (0.0%) | 0 (0.0%) |
| 5 to 9 Unit Apartments | 0 (0.0%) | 0 (0.0%) |
| 10 or more Apartments | 0 (0.0%) | 0 (0.0%) |
| Mobile Home / Other | 0 (0.0%) | 0 (0.0%) |
| Total | 41 (27.7%) | 107 (72.3%) |
Housing Structures by Number of Rooms in Gold Hill
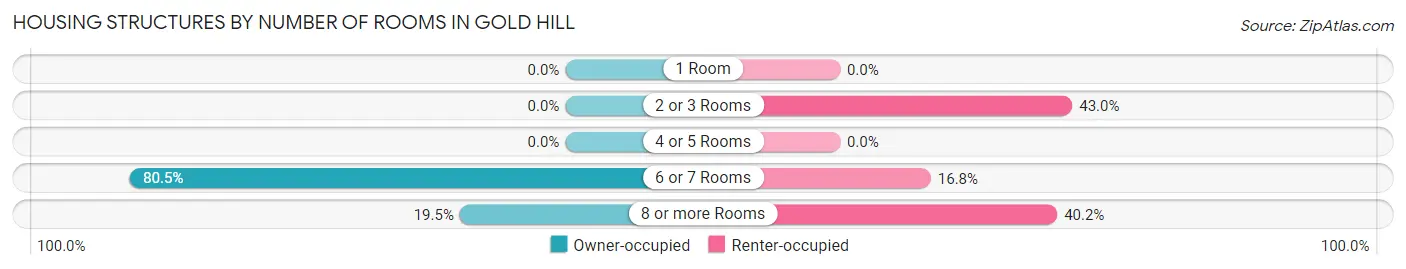
| Number of Rooms | Owner-occupied | Renter-occupied |
| 1 Room | 0 (0.0%) | 0 (0.0%) |
| 2 or 3 Rooms | 0 (0.0%) | 46 (43.0%) |
| 4 or 5 Rooms | 0 (0.0%) | 0 (0.0%) |
| 6 or 7 Rooms | 33 (80.5%) | 18 (16.8%) |
| 8 or more Rooms | 8 (19.5%) | 43 (40.2%) |
| Total | 41 (100.0%) | 107 (100.0%) |
Housing Structure by Heating Type in Gold Hill
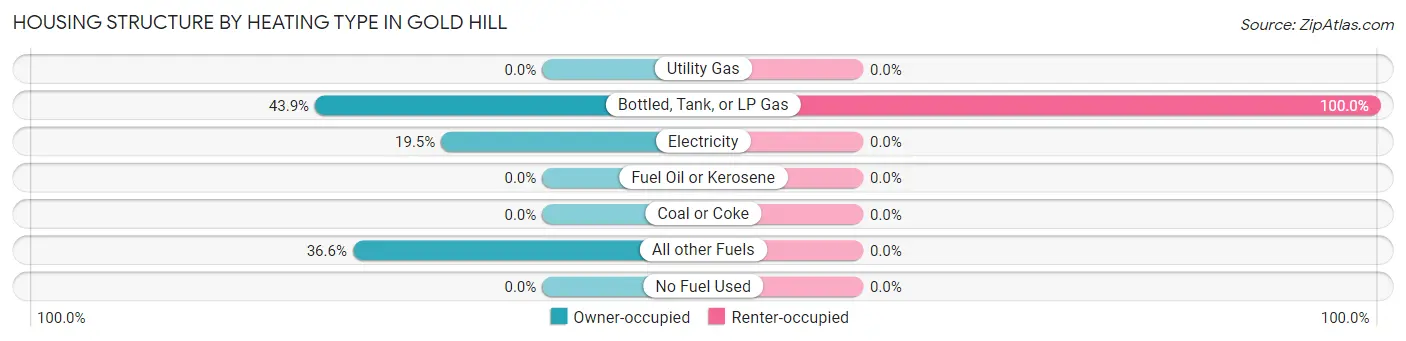
| Heating Type | Owner-occupied | Renter-occupied |
| Utility Gas | 0 (0.0%) | 0 (0.0%) |
| Bottled, Tank, or LP Gas | 18 (43.9%) | 107 (100.0%) |
| Electricity | 8 (19.5%) | 0 (0.0%) |
| Fuel Oil or Kerosene | 0 (0.0%) | 0 (0.0%) |
| Coal or Coke | 0 (0.0%) | 0 (0.0%) |
| All other Fuels | 15 (36.6%) | 0 (0.0%) |
| No Fuel Used | 0 (0.0%) | 0 (0.0%) |
| Total | 41 (100.0%) | 107 (100.0%) |
Household Vehicle Usage in Gold Hill
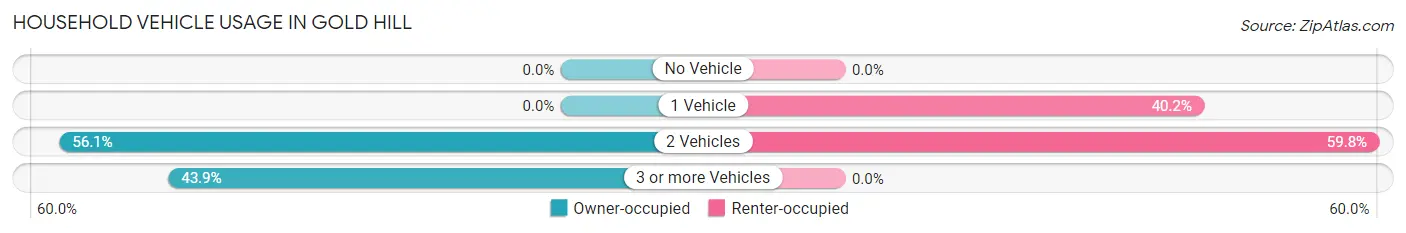
| Vehicles per Household | Owner-occupied | Renter-occupied |
| No Vehicle | 0 (0.0%) | 0 (0.0%) |
| 1 Vehicle | 0 (0.0%) | 43 (40.2%) |
| 2 Vehicles | 23 (56.1%) | 64 (59.8%) |
| 3 or more Vehicles | 18 (43.9%) | 0 (0.0%) |
| Total | 41 (100.0%) | 107 (100.0%) |
Real Estate & Mortgages in Gold Hill
Real Estate and Mortgage Overview in Gold Hill
| Characteristic | Without Mortgage | With Mortgage |
| Housing Units | 33 | 8 |
| Median Property Value | - | - |
| Median Household Income | - | - |
| Monthly Housing Costs | - | - |
| Real Estate Taxes | - | - |
Property Value by Mortgage Status in Gold Hill
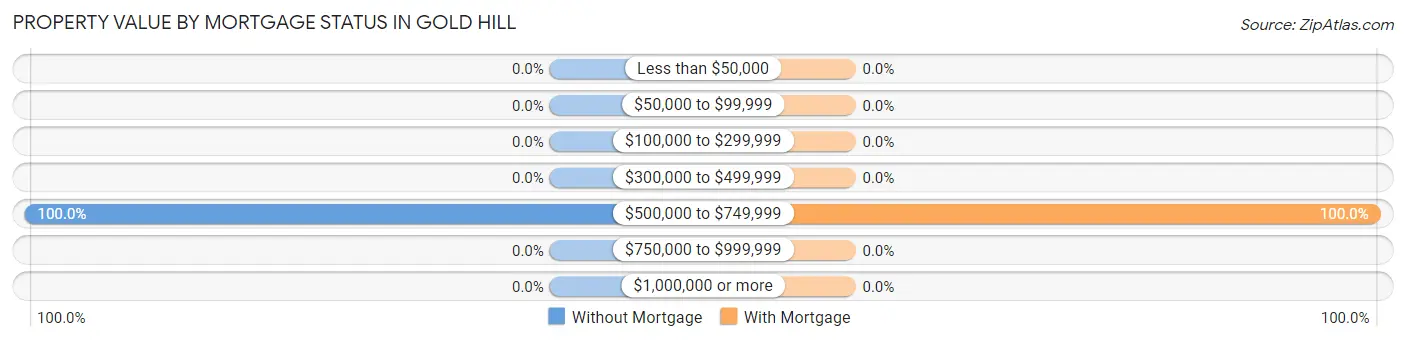
| Property Value | Without Mortgage | With Mortgage |
| Less than $50,000 | 0 (0.0%) | 0 (0.0%) |
| $50,000 to $99,999 | 0 (0.0%) | 0 (0.0%) |
| $100,000 to $299,999 | 0 (0.0%) | 0 (0.0%) |
| $300,000 to $499,999 | 0 (0.0%) | 0 (0.0%) |
| $500,000 to $749,999 | 33 (100.0%) | 8 (100.0%) |
| $750,000 to $999,999 | 0 (0.0%) | 0 (0.0%) |
| $1,000,000 or more | 0 (0.0%) | 0 (0.0%) |
| Total | 33 (100.0%) | 8 (100.0%) |
Household Income by Mortgage Status in Gold Hill
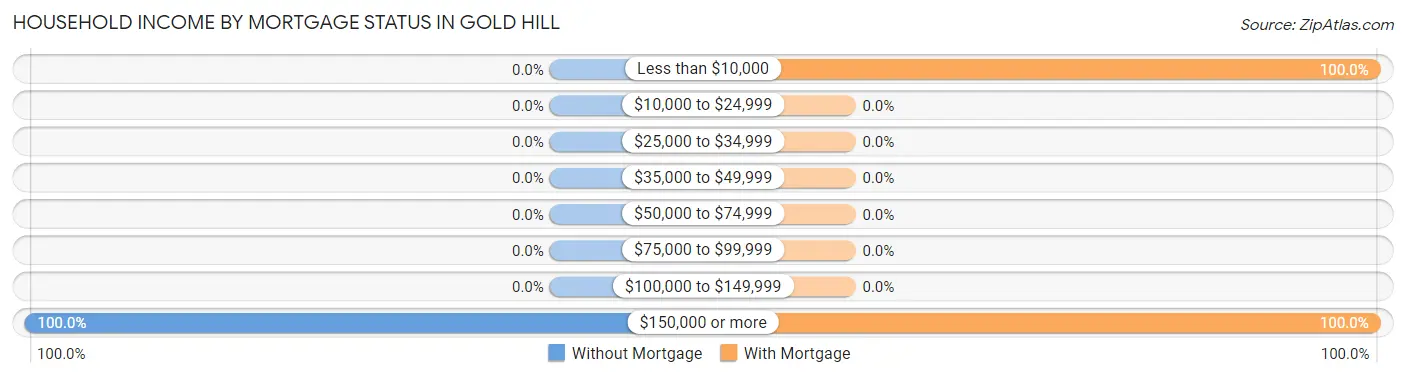
| Household Income | Without Mortgage | With Mortgage |
| Less than $10,000 | 0 (0.0%) | 8 (100.0%) |
| $10,000 to $24,999 | 0 (0.0%) | 0 (0.0%) |
| $25,000 to $34,999 | 0 (0.0%) | 0 (0.0%) |
| $35,000 to $49,999 | 0 (0.0%) | 0 (0.0%) |
| $50,000 to $74,999 | 0 (0.0%) | 0 (0.0%) |
| $75,000 to $99,999 | 0 (0.0%) | 0 (0.0%) |
| $100,000 to $149,999 | 0 (0.0%) | 0 (0.0%) |
| $150,000 or more | 33 (100.0%) | 8 (100.0%) |
| Total | 33 (100.0%) | 8 (100.0%) |
Property Value to Household Income Ratio in Gold Hill
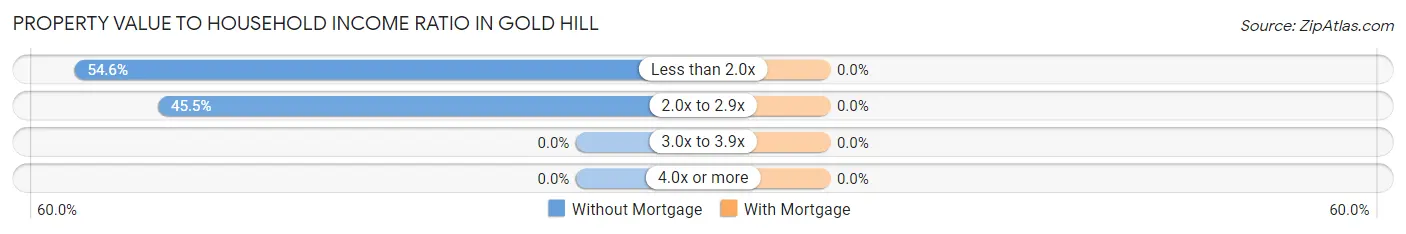
| Value-to-Income Ratio | Without Mortgage | With Mortgage |
| Less than 2.0x | 18 (54.5%) | 0 (0.0%) |
| 2.0x to 2.9x | 15 (45.5%) | 0 (0.0%) |
| 3.0x to 3.9x | 0 (0.0%) | 0 (0.0%) |
| 4.0x or more | 0 (0.0%) | 0 (0.0%) |
| Total | 33 (100.0%) | 8 (100.0%) |
Real Estate Taxes by Mortgage Status in Gold Hill
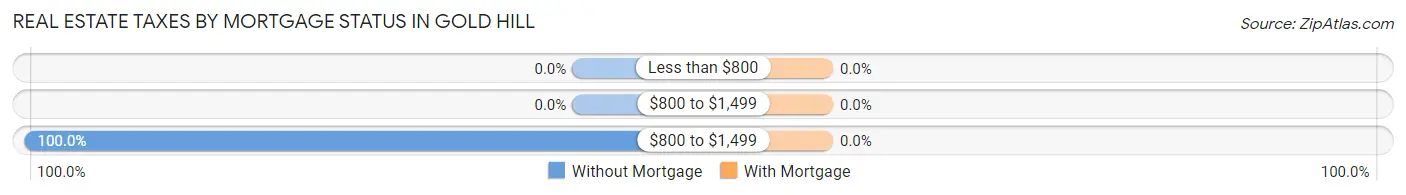
| Property Taxes | Without Mortgage | With Mortgage |
| Less than $800 | 0 (0.0%) | 0 (0.0%) |
| $800 to $1,499 | 0 (0.0%) | 0 (0.0%) |
| $800 to $1,499 | 33 (100.0%) | 0 (0.0%) |
| Total | 33 (100.0%) | 8 (100.0%) |
Health & Disability in Gold Hill
Health Insurance Coverage by Age in Gold Hill
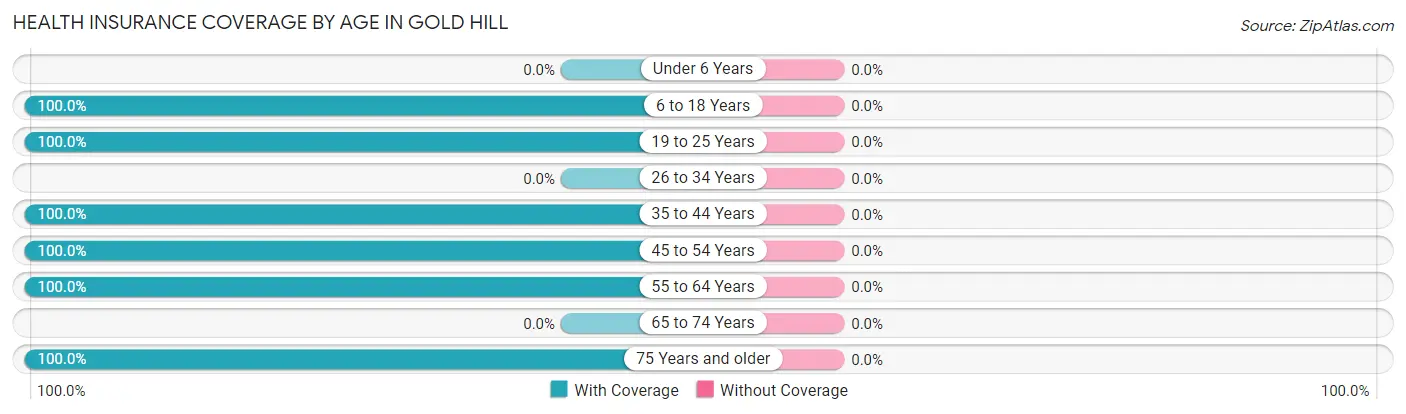
| Age Bracket | With Coverage | Without Coverage |
| Under 6 Years | 0 (0.0%) | 0 (0.0%) |
| 6 to 18 Years | 34 (100.0%) | 0 (0.0%) |
| 19 to 25 Years | 43 (100.0%) | 0 (0.0%) |
| 26 to 34 Years | 0 (0.0%) | 0 (0.0%) |
| 35 to 44 Years | 39 (100.0%) | 0 (0.0%) |
| 45 to 54 Years | 35 (100.0%) | 0 (0.0%) |
| 55 to 64 Years | 80 (100.0%) | 0 (0.0%) |
| 65 to 74 Years | 0 (0.0%) | 0 (0.0%) |
| 75 Years and older | 18 (100.0%) | 0 (0.0%) |
| Total | 249 (100.0%) | 0 (0.0%) |
Health Insurance Coverage by Citizenship Status in Gold Hill
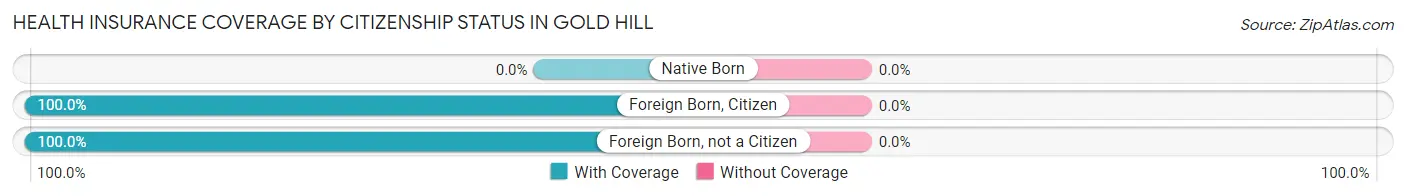
| Citizenship Status | With Coverage | Without Coverage |
| Native Born | 0 (0.0%) | 0 (0.0%) |
| Foreign Born, Citizen | 34 (100.0%) | 0 (0.0%) |
| Foreign Born, not a Citizen | 43 (100.0%) | 0 (0.0%) |
Health Insurance Coverage by Household Income in Gold Hill
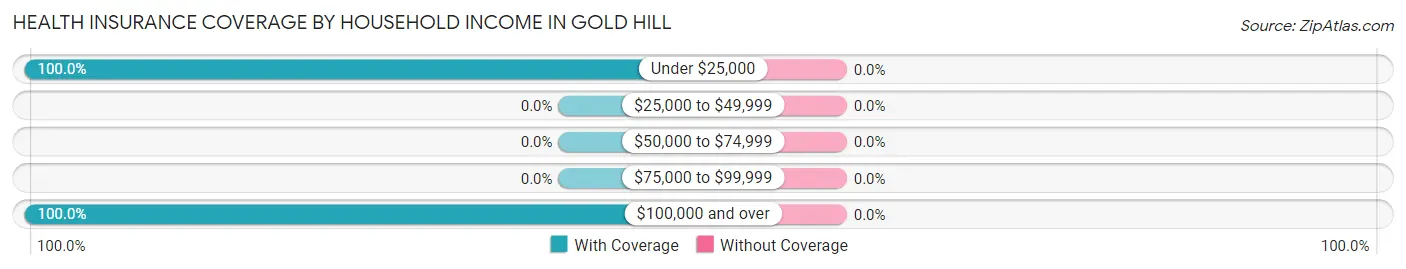
| Household Income | With Coverage | Without Coverage |
| Under $25,000 | 89 (100.0%) | 0 (0.0%) |
| $25,000 to $49,999 | 0 (0.0%) | 0 (0.0%) |
| $50,000 to $74,999 | 0 (0.0%) | 0 (0.0%) |
| $75,000 to $99,999 | 0 (0.0%) | 0 (0.0%) |
| $100,000 and over | 153 (100.0%) | 0 (0.0%) |
Public vs Private Health Insurance Coverage by Age in Gold Hill
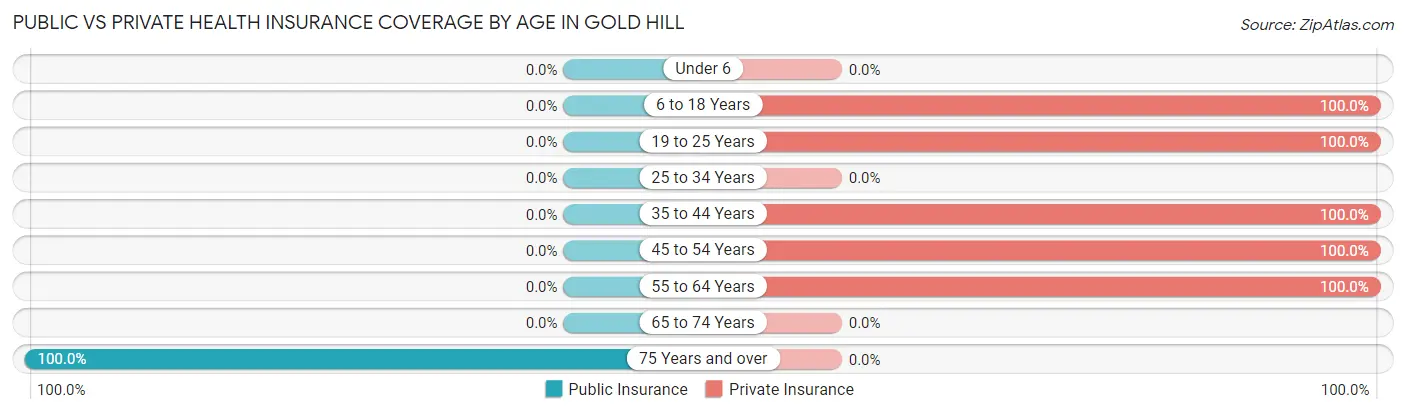
| Age Bracket | Public Insurance | Private Insurance |
| Under 6 | 0 (0.0%) | 0 (0.0%) |
| 6 to 18 Years | 0 (0.0%) | 34 (100.0%) |
| 19 to 25 Years | 0 (0.0%) | 43 (100.0%) |
| 25 to 34 Years | 0 (0.0%) | 0 (0.0%) |
| 35 to 44 Years | 0 (0.0%) | 39 (100.0%) |
| 45 to 54 Years | 0 (0.0%) | 35 (100.0%) |
| 55 to 64 Years | 0 (0.0%) | 80 (100.0%) |
| 65 to 74 Years | 0 (0.0%) | 0 (0.0%) |
| 75 Years and over | 18 (100.0%) | 0 (0.0%) |
| Total | 18 (7.2%) | 231 (92.8%) |
Disability Status by Sex by Age in Gold Hill
| Age Bracket | Male | Female |
| Under 5 Years | 0 (0.0%) | 0 (0.0%) |
| 5 to 17 Years | 0 (0.0%) | 0 (0.0%) |
| 18 to 34 Years | 0 (0.0%) | 0 (0.0%) |
| 35 to 64 Years | 0 (0.0%) | 0 (0.0%) |
| 65 to 74 Years | 0 (0.0%) | 0 (0.0%) |
| 75 Years and over | 0 (0.0%) | 0 (0.0%) |
Disability Class by Sex by Age in Gold Hill
Disability Class: Hearing Difficulty
| Age Bracket | Male | Female |
| Under 5 Years | 0 (0.0%) | 0 (0.0%) |
| 5 to 17 Years | 0 (0.0%) | 0 (0.0%) |
| 18 to 34 Years | 0 (0.0%) | 0 (0.0%) |
| 35 to 64 Years | 0 (0.0%) | 0 (0.0%) |
| 65 to 74 Years | 0 (0.0%) | 0 (0.0%) |
| 75 Years and over | 0 (0.0%) | 0 (0.0%) |
Disability Class: Vision Difficulty
| Age Bracket | Male | Female |
| Under 5 Years | 0 (0.0%) | 0 (0.0%) |
| 5 to 17 Years | 0 (0.0%) | 0 (0.0%) |
| 18 to 34 Years | 0 (0.0%) | 0 (0.0%) |
| 35 to 64 Years | 0 (0.0%) | 0 (0.0%) |
| 65 to 74 Years | 0 (0.0%) | 0 (0.0%) |
| 75 Years and over | 0 (0.0%) | 0 (0.0%) |
Disability Class: Cognitive Difficulty
| Age Bracket | Male | Female |
| 5 to 17 Years | 0 (0.0%) | 0 (0.0%) |
| 18 to 34 Years | 0 (0.0%) | 0 (0.0%) |
| 35 to 64 Years | 0 (0.0%) | 0 (0.0%) |
| 65 to 74 Years | 0 (0.0%) | 0 (0.0%) |
| 75 Years and over | 0 (0.0%) | 0 (0.0%) |
Disability Class: Ambulatory Difficulty
| Age Bracket | Male | Female |
| 5 to 17 Years | 0 (0.0%) | 0 (0.0%) |
| 18 to 34 Years | 0 (0.0%) | 0 (0.0%) |
| 35 to 64 Years | 0 (0.0%) | 0 (0.0%) |
| 65 to 74 Years | 0 (0.0%) | 0 (0.0%) |
| 75 Years and over | 0 (0.0%) | 0 (0.0%) |
Disability Class: Self-Care Difficulty
| Age Bracket | Male | Female |
| 5 to 17 Years | 0 (0.0%) | 0 (0.0%) |
| 18 to 34 Years | 0 (0.0%) | 0 (0.0%) |
| 35 to 64 Years | 0 (0.0%) | 0 (0.0%) |
| 65 to 74 Years | 0 (0.0%) | 0 (0.0%) |
| 75 Years and over | 0 (0.0%) | 0 (0.0%) |
Technology Access in Gold Hill
Computing Device Access in Gold Hill
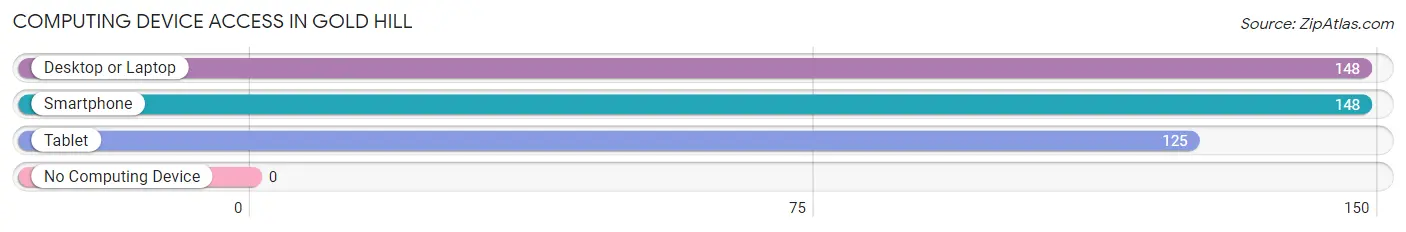
| Device Type | # Households | % Households |
| Desktop or Laptop | 148 | 100.0% |
| Smartphone | 148 | 100.0% |
| Tablet | 125 | 84.5% |
| No Computing Device | 0 | 0.0% |
| Total | 148 | 100.0% |
Internet Access in Gold Hill
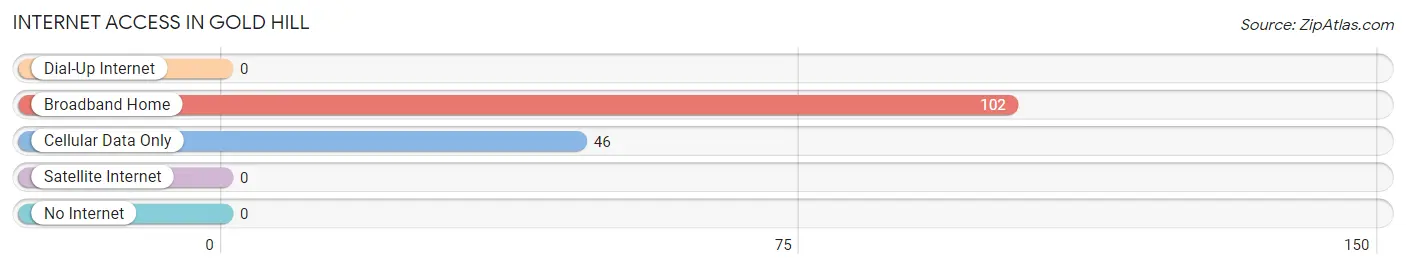
| Internet Type | # Households | % Households |
| Dial-Up Internet | 0 | 0.0% |
| Broadband Home | 102 | 68.9% |
| Cellular Data Only | 46 | 31.1% |
| Satellite Internet | 0 | 0.0% |
| No Internet | 0 | 0.0% |
| Total | 148 | 100.0% |
Gold Hill Summary
Gold Hill is a small unincorporated community located in Boulder County, Colorado. It is situated in the foothills of the Rocky Mountains, approximately 8 miles west of Boulder. The town was founded in 1859 during the Colorado Gold Rush and is one of the oldest settlements in the state.
History
Gold Hill was founded in 1859 by prospectors during the Colorado Gold Rush. The town was originally known as “Gold Hill Camp” and was the first settlement in Boulder County. The town was named after the nearby Gold Hill Mine, which was one of the most productive gold mines in the area. The mine was discovered in 1858 and was the first major gold discovery in Colorado.
The town quickly grew as prospectors flocked to the area in search of gold. By 1860, the population had grown to over 500 people. The town was home to several saloons, stores, and hotels. It also had a post office, a school, and a newspaper.
The town’s population began to decline in the late 1800s as the gold rush ended and the mines began to close. By the early 1900s, the population had dropped to just over 100 people. The town remained relatively small until the 1950s when it began to experience a population boom. The population has since grown to over 1,000 people.
Geography
Gold Hill is located in the foothills of the Rocky Mountains, approximately 8 miles west of Boulder. The town is situated at an elevation of 6,400 feet and is surrounded by mountains and forests. The area is known for its scenic beauty and is popular with hikers, campers, and outdoor enthusiasts.
The town is located in a semi-arid climate and receives an average of 16 inches of precipitation per year. The average temperature in the summer is around 70 degrees Fahrenheit and in the winter it is around 30 degrees Fahrenheit.
Economy
Gold Hill’s economy is largely based on tourism. The town is home to several restaurants, shops, and lodging establishments that cater to visitors. The town is also home to several small businesses, including a winery, a brewery, and a distillery.
The town is also home to several farms and ranches that produce hay, cattle, and other agricultural products. The town is also home to several mining operations, including the Gold Hill Mine, which is still in operation today.
Demographics
As of the 2010 census, Gold Hill had a population of 1,072 people. The racial makeup of the town was 94.3% White, 0.7% African American, 0.3% Native American, 0.7% Asian, 0.1% Pacific Islander, 1.7% from other races, and 2.1% from two or more races. Hispanic or Latino of any race were 4.2% of the population.
The median household income in Gold Hill was $60,000 and the median family income was $68,000. The per capita income was $30,000. About 8.3% of families and 10.2% of the population were below the poverty line, including 11.3% of those under age 18 and 8.3% of those age 65 or over.
Gold Hill is a small but vibrant community that has a rich history and a bright future. The town is home to a diverse population and a thriving economy. It is a great place to live, work, and play.
Common Questions
What is Per Capita Income in Gold Hill?
Per Capita income in Gold Hill is $65,779.
What is the Median Family Income in Gold Hill?
Median Family Income in Gold Hill is $187,083.
What is Inequality or Gini Index in Gold Hill?
Inequality or Gini Index in Gold Hill is 0.60.
What is the Total Population of Gold Hill?
Total Population of Gold Hill is 249.
What is the Total Male Population of Gold Hill?
Total Male Population of Gold Hill is 95.
What is the Total Female Population of Gold Hill?
Total Female Population of Gold Hill is 154.
What is the Ratio of Males per 100 Females in Gold Hill?
There are 61.69 Males per 100 Females in Gold Hill.
What is the Ratio of Females per 100 Males in Gold Hill?
There are 162.11 Females per 100 Males in Gold Hill.
What is the Median Population Age in Gold Hill?
Median Population Age in Gold Hill is 47.5 Years.
What is the Average Family Size in Gold Hill
Average Family Size in Gold Hill is 2.8 People.
What is the Average Household Size in Gold Hill
Average Household Size in Gold Hill is 1.6 People.
How Large is the Labor Force in Gold Hill?
There are 208 People in the Labor Forcein in Gold Hill.
What is the Percentage of People in the Labor Force in Gold Hill?
96.7% of People are in the Labor Force in Gold Hill.