Cascade Chipita Park, CO Map & Demographics
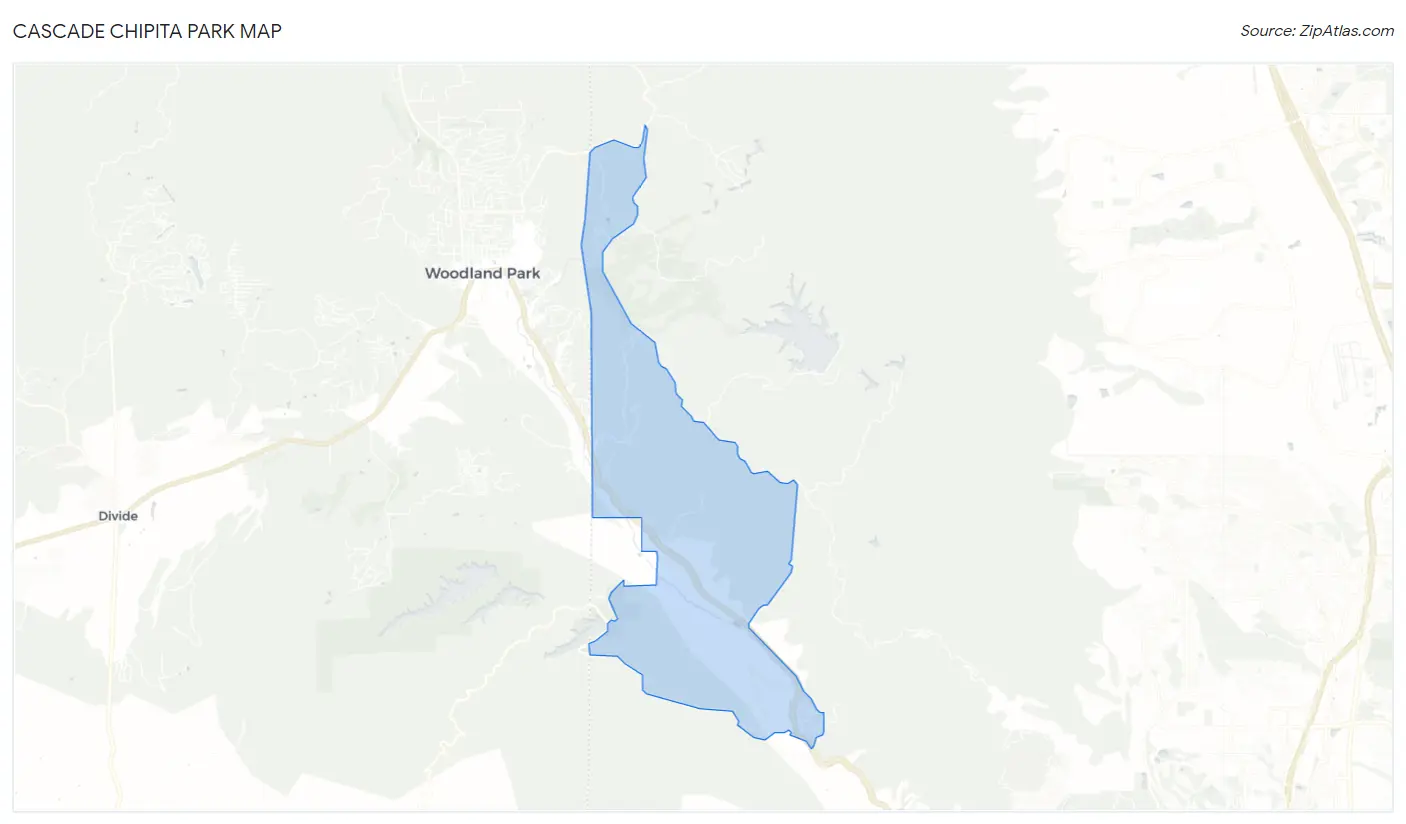
Cascade Chipita Park Map
Cascade Chipita Park Overview
$56,612
PER CAPITA INCOME
$109,250
AVG FAMILY INCOME
$78,542
AVG HOUSEHOLD INCOME
45.0%
WAGE / INCOME GAP [ % ]
55.0¢/ $1
WAGE / INCOME GAP [ $ ]
0.50
INEQUALITY / GINI INDEX
1,302
TOTAL POPULATION
730
MALE POPULATION
572
FEMALE POPULATION
127.62
MALES / 100 FEMALES
78.36
FEMALES / 100 MALES
52.7
MEDIAN AGE
2.7
AVG FAMILY SIZE
2.2
AVG HOUSEHOLD SIZE
648
LABOR FORCE [ PEOPLE ]
53.3%
PERCENT IN LABOR FORCE
18.2%
UNEMPLOYMENT RATE
Income in Cascade Chipita Park
Income Overview in Cascade Chipita Park
Per Capita Income in Cascade Chipita Park is $56,612, while median incomes of families and households are $109,250 and $78,542 respectively.
| Characteristic | Number | Measure |
| Per Capita Income | 1,302 | $56,612 |
| Median Family Income | 328 | $109,250 |
| Mean Family Income | 328 | $142,591 |
| Median Household Income | 562 | $78,542 |
| Mean Household Income | 562 | $132,613 |
| Income Deficit | 328 | $0 |
| Wage / Income Gap (%) | 1,302 | 45.04% |
| Wage / Income Gap ($) | 1,302 | 54.96¢ per $1 |
| Gini / Inequality Index | 1,302 | 0.50 |
Earnings by Sex in Cascade Chipita Park
Average Earnings in Cascade Chipita Park are $57,798, $81,500 for men and $44,792 for women, a difference of 45.0%.
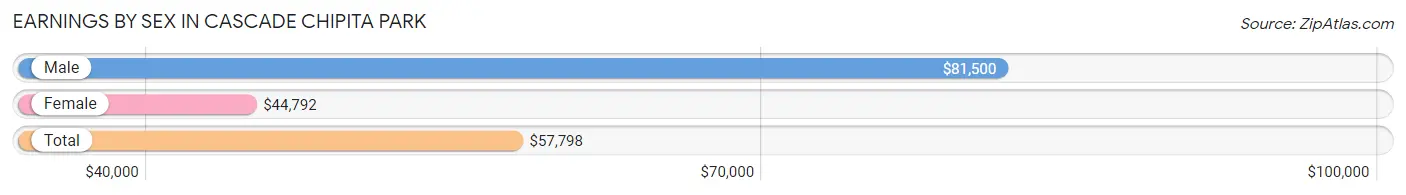
| Sex | Number | Average Earnings |
| Male | 410 (61.8%) | $81,500 |
| Female | 253 (38.2%) | $44,792 |
| Total | 663 (100.0%) | $57,798 |
Earnings by Sex by Income Bracket in Cascade Chipita Park
The most common earnings brackets in Cascade Chipita Park are $100,000+ for men (170 | 41.5%) and $55,000 to $64,999 for women (68 | 26.9%).
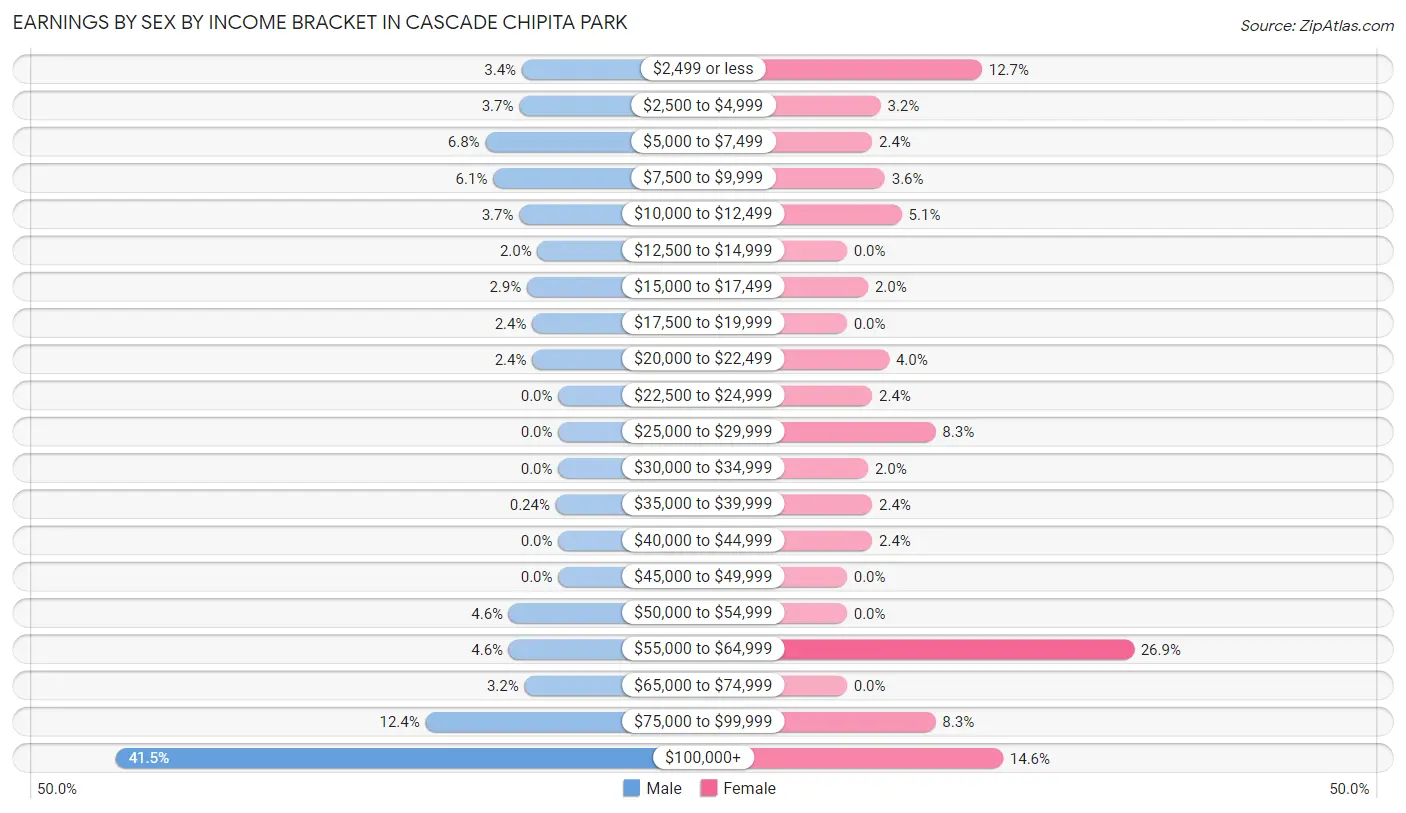
| Income | Male | Female |
| $2,499 or less | 14 (3.4%) | 32 (12.7%) |
| $2,500 to $4,999 | 15 (3.7%) | 8 (3.2%) |
| $5,000 to $7,499 | 28 (6.8%) | 6 (2.4%) |
| $7,500 to $9,999 | 25 (6.1%) | 9 (3.6%) |
| $10,000 to $12,499 | 15 (3.7%) | 13 (5.1%) |
| $12,500 to $14,999 | 8 (1.9%) | 0 (0.0%) |
| $15,000 to $17,499 | 12 (2.9%) | 5 (2.0%) |
| $17,500 to $19,999 | 10 (2.4%) | 0 (0.0%) |
| $20,000 to $22,499 | 10 (2.4%) | 10 (4.0%) |
| $22,500 to $24,999 | 0 (0.0%) | 6 (2.4%) |
| $25,000 to $29,999 | 0 (0.0%) | 21 (8.3%) |
| $30,000 to $34,999 | 0 (0.0%) | 5 (2.0%) |
| $35,000 to $39,999 | 1 (0.2%) | 6 (2.4%) |
| $40,000 to $44,999 | 0 (0.0%) | 6 (2.4%) |
| $45,000 to $49,999 | 0 (0.0%) | 0 (0.0%) |
| $50,000 to $54,999 | 19 (4.6%) | 0 (0.0%) |
| $55,000 to $64,999 | 19 (4.6%) | 68 (26.9%) |
| $65,000 to $74,999 | 13 (3.2%) | 0 (0.0%) |
| $75,000 to $99,999 | 51 (12.4%) | 21 (8.3%) |
| $100,000+ | 170 (41.5%) | 37 (14.6%) |
| Total | 410 (100.0%) | 253 (100.0%) |
Earnings by Sex by Educational Attainment in Cascade Chipita Park
Average earnings in Cascade Chipita Park are $89,375 for men and $55,132 for women, a difference of 38.3%. Men with an educational attainment of graduate degree enjoy the highest average annual earnings of $179,861, while those with high school diploma education earn the least with $54,531. Women with an educational attainment of bachelor's degree earn the most with the average annual earnings of $60,278, while those with graduate degree education have the smallest earnings of $56,414.
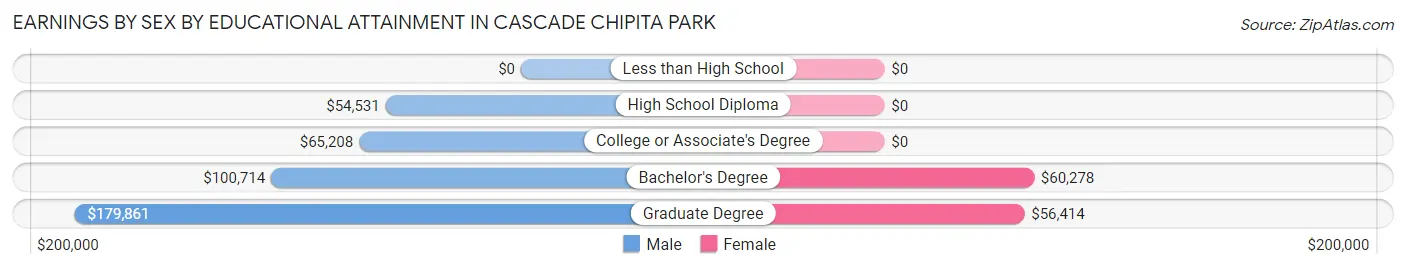
| Educational Attainment | Male Income | Female Income |
| Less than High School | - | - |
| High School Diploma | $54,531 | $0 |
| College or Associate's Degree | $65,208 | $0 |
| Bachelor's Degree | $100,714 | $60,278 |
| Graduate Degree | $179,861 | $56,414 |
| Total | $89,375 | $55,132 |
Family Income in Cascade Chipita Park
Family Income Brackets in Cascade Chipita Park
According to the Cascade Chipita Park family income data, there are 101 families falling into the $200,000+ income range, which is the most common income bracket and makes up 30.8% of all families.
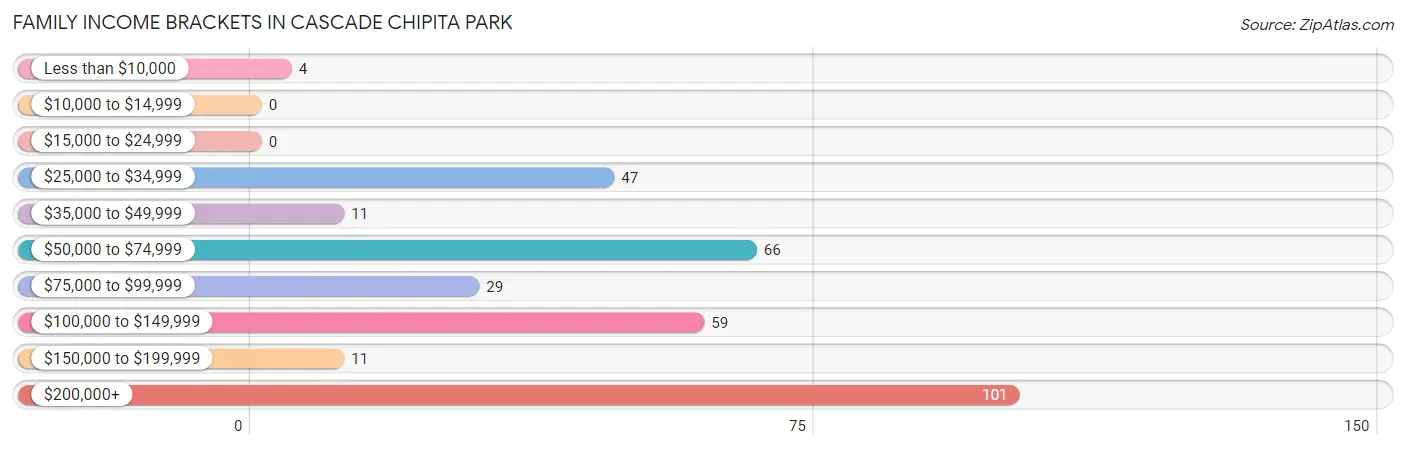
| Income Bracket | # Families | % Families |
| Less than $10,000 | 4 | 1.2% |
| $10,000 to $14,999 | 0 | 0.0% |
| $15,000 to $24,999 | 0 | 0.0% |
| $25,000 to $34,999 | 47 | 14.3% |
| $35,000 to $49,999 | 11 | 3.4% |
| $50,000 to $74,999 | 66 | 20.1% |
| $75,000 to $99,999 | 29 | 8.8% |
| $100,000 to $149,999 | 59 | 18.0% |
| $150,000 to $199,999 | 11 | 3.4% |
| $200,000+ | 101 | 30.8% |
Family Income by Famaliy Size in Cascade Chipita Park
3-person families (49 | 14.9%) account for the highest median family income in Cascade Chipita Park with $222,604 per family, while 3-person families (49 | 14.9%) have the highest median income of $74,201 per family member.
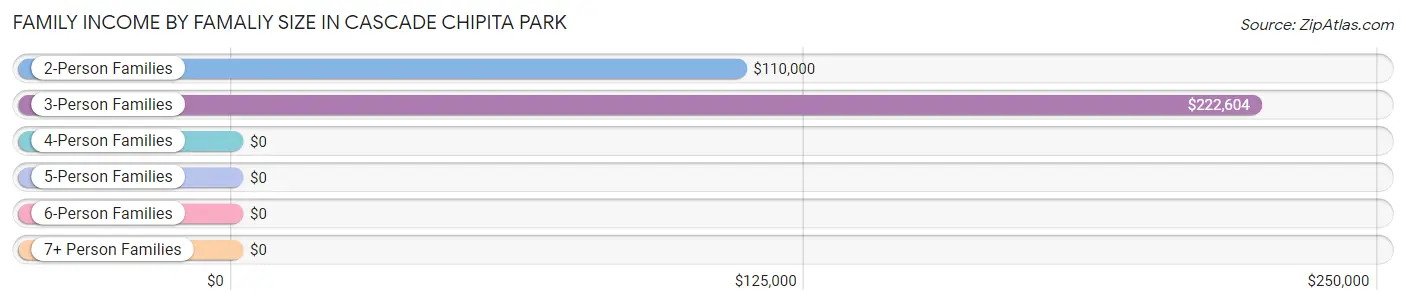
| Income Bracket | # Families | Median Income |
| 2-Person Families | 214 (65.2%) | $110,000 |
| 3-Person Families | 49 (14.9%) | $222,604 |
| 4-Person Families | 47 (14.3%) | $0 |
| 5-Person Families | 18 (5.5%) | $0 |
| 6-Person Families | 0 (0.0%) | $0 |
| 7+ Person Families | 0 (0.0%) | $0 |
| Total | 328 (100.0%) | $109,250 |
Family Income by Number of Earners in Cascade Chipita Park
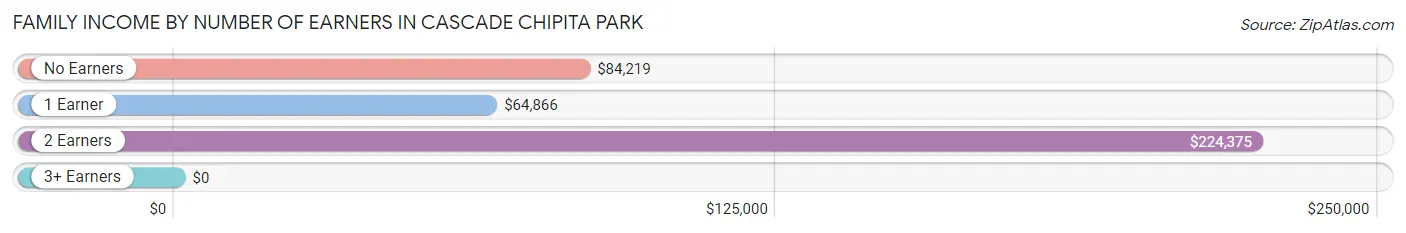
| Number of Earners | # Families | Median Income |
| No Earners | 33 (10.1%) | $84,219 |
| 1 Earner | 179 (54.6%) | $64,866 |
| 2 Earners | 110 (33.5%) | $224,375 |
| 3+ Earners | 6 (1.8%) | $0 |
| Total | 328 (100.0%) | $109,250 |
Household Income in Cascade Chipita Park
Household Income Brackets in Cascade Chipita Park
With 168 households falling in the category, the $200,000+ income range is the most frequent in Cascade Chipita Park, accounting for 29.9% of all households. In contrast, only 11 households (2.0%) fall into the $35,000 to $49,999 income bracket, making it the least populous group.
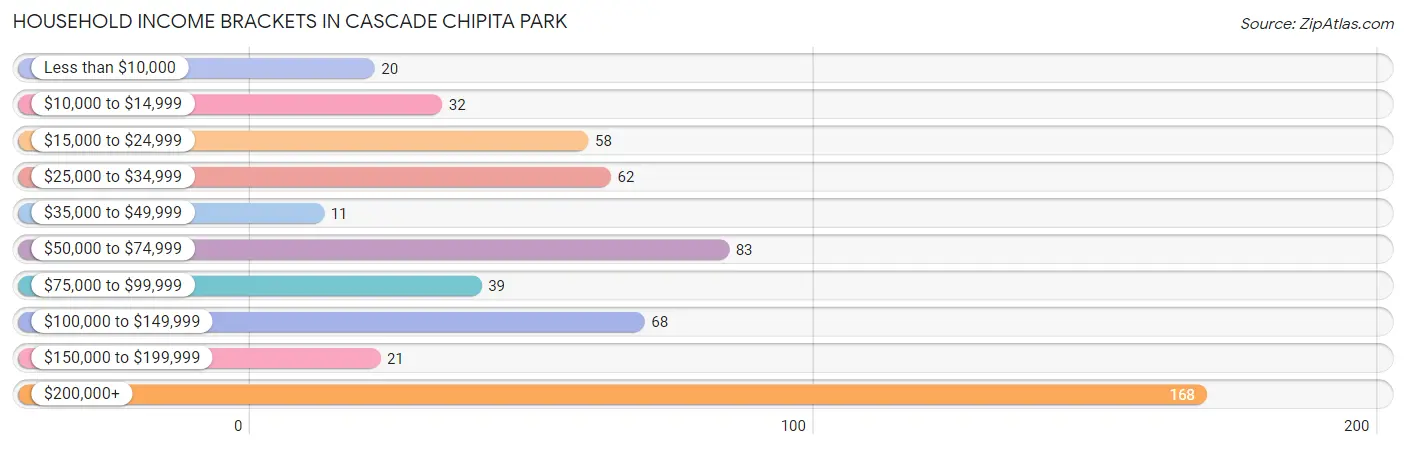
| Income Bracket | # Households | % Households |
| Less than $10,000 | 20 | 3.6% |
| $10,000 to $14,999 | 32 | 5.7% |
| $15,000 to $24,999 | 58 | 10.3% |
| $25,000 to $34,999 | 62 | 11.0% |
| $35,000 to $49,999 | 11 | 2.0% |
| $50,000 to $74,999 | 83 | 14.8% |
| $75,000 to $99,999 | 39 | 6.9% |
| $100,000 to $149,999 | 68 | 12.1% |
| $150,000 to $199,999 | 21 | 3.7% |
| $200,000+ | 168 | 29.9% |
Household Income by Householder Age in Cascade Chipita Park
The median household income in Cascade Chipita Park is $78,542, with the highest median household income of $149,444 found in the 45 to 64 years age bracket for the primary householder. A total of 186 households (33.1%) fall into this category.
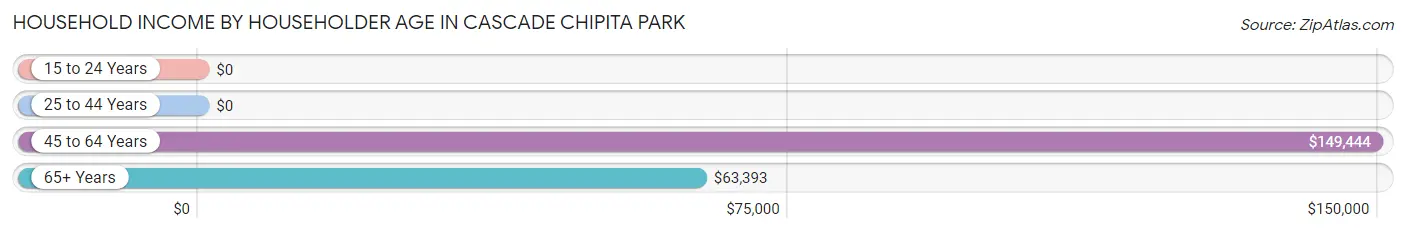
| Income Bracket | # Households | Median Income |
| 15 to 24 Years | 0 (0.0%) | $0 |
| 25 to 44 Years | 150 (26.7%) | $0 |
| 45 to 64 Years | 186 (33.1%) | $149,444 |
| 65+ Years | 226 (40.2%) | $63,393 |
| Total | 562 (100.0%) | $78,542 |
Poverty in Cascade Chipita Park
Income Below Poverty by Sex and Age in Cascade Chipita Park
With 4.4% poverty level for males and 5.8% for females among the residents of Cascade Chipita Park, 45 to 54 year old males and 75 year old and over females are the most vulnerable to poverty, with 26 males (27.1%) and 16 females (21.9%) in their respective age groups living below the poverty level.
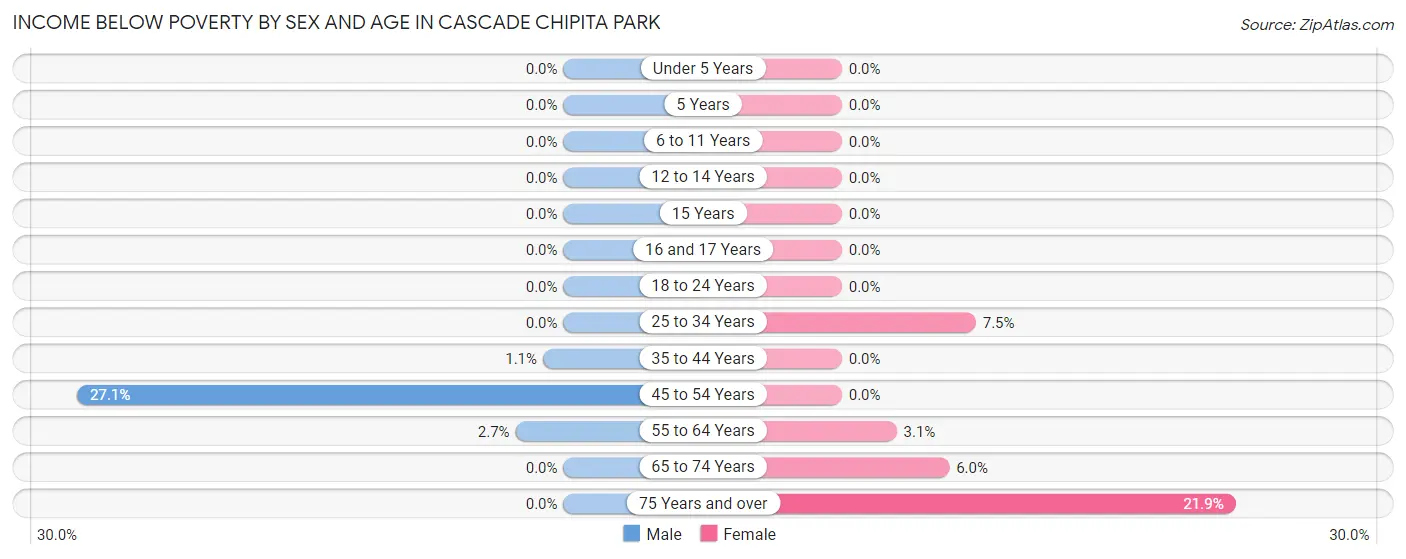
| Age Bracket | Male | Female |
| Under 5 Years | 0 (0.0%) | 0 (0.0%) |
| 5 Years | 0 (0.0%) | 0 (0.0%) |
| 6 to 11 Years | 0 (0.0%) | 0 (0.0%) |
| 12 to 14 Years | 0 (0.0%) | 0 (0.0%) |
| 15 Years | 0 (0.0%) | 0 (0.0%) |
| 16 and 17 Years | 0 (0.0%) | 0 (0.0%) |
| 18 to 24 Years | 0 (0.0%) | 0 (0.0%) |
| 25 to 34 Years | 0 (0.0%) | 5 (7.5%) |
| 35 to 44 Years | 1 (1.1%) | 0 (0.0%) |
| 45 to 54 Years | 26 (27.1%) | 0 (0.0%) |
| 55 to 64 Years | 4 (2.7%) | 5 (3.0%) |
| 65 to 74 Years | 0 (0.0%) | 7 (6.0%) |
| 75 Years and over | 0 (0.0%) | 16 (21.9%) |
| Total | 31 (4.4%) | 33 (5.8%) |
Income Above Poverty by Sex and Age in Cascade Chipita Park
According to the poverty statistics in Cascade Chipita Park, males aged under 5 years and females aged under 5 years are the age groups that are most secure financially, with 100.0% of males and 100.0% of females in these age groups living above the poverty line.
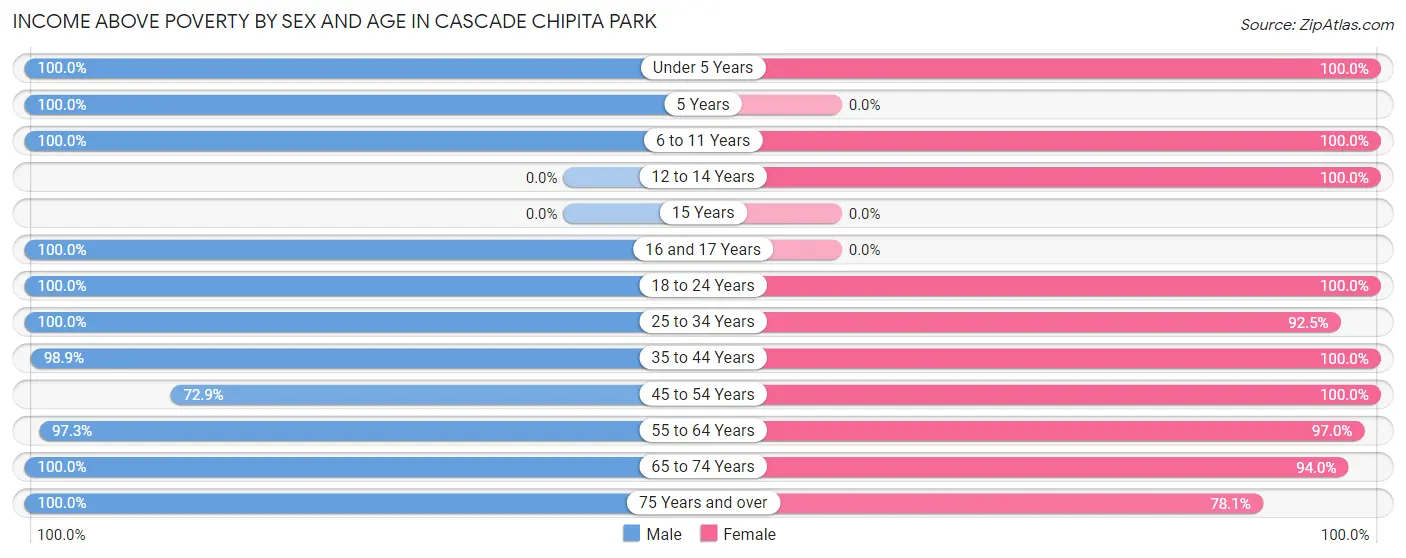
| Age Bracket | Male | Female |
| Under 5 Years | 25 (100.0%) | 10 (100.0%) |
| 5 Years | 9 (100.0%) | 0 (0.0%) |
| 6 to 11 Years | 7 (100.0%) | 18 (100.0%) |
| 12 to 14 Years | 0 (0.0%) | 12 (100.0%) |
| 15 Years | 0 (0.0%) | 0 (0.0%) |
| 16 and 17 Years | 8 (100.0%) | 0 (0.0%) |
| 18 to 24 Years | 111 (100.0%) | 5 (100.0%) |
| 25 to 34 Years | 105 (100.0%) | 62 (92.5%) |
| 35 to 44 Years | 87 (98.9%) | 51 (100.0%) |
| 45 to 54 Years | 70 (72.9%) | 55 (100.0%) |
| 55 to 64 Years | 146 (97.3%) | 159 (97.0%) |
| 65 to 74 Years | 68 (100.0%) | 110 (94.0%) |
| 75 Years and over | 44 (100.0%) | 57 (78.1%) |
| Total | 680 (95.6%) | 539 (94.2%) |
Income Below Poverty Among Married-Couple Families in Cascade Chipita Park
The poverty statistics for married-couple families in Cascade Chipita Park show that 1.3% or 4 of the total 307 families live below the poverty line. Families with no children have the highest poverty rate of 1.4%, comprising of 4 families. On the other hand, families with 1 or 2 children have the lowest poverty rate of 0.0%, which includes 0 families.
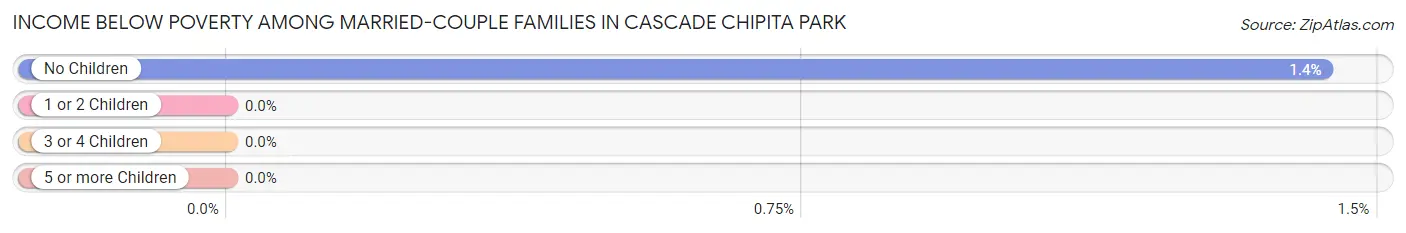
| Children | Above Poverty | Below Poverty |
| No Children | 276 (98.6%) | 4 (1.4%) |
| 1 or 2 Children | 15 (100.0%) | 0 (0.0%) |
| 3 or 4 Children | 12 (100.0%) | 0 (0.0%) |
| 5 or more Children | 0 (0.0%) | 0 (0.0%) |
| Total | 303 (98.7%) | 4 (1.3%) |
Income Below Poverty Among Single-Parent Households in Cascade Chipita Park
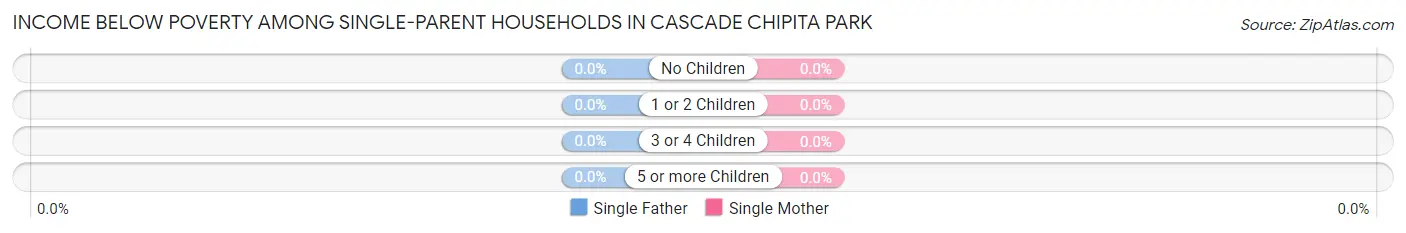
| Children | Single Father | Single Mother |
| No Children | 0 (0.0%) | 0 (0.0%) |
| 1 or 2 Children | 0 (0.0%) | 0 (0.0%) |
| 3 or 4 Children | 0 (0.0%) | 0 (0.0%) |
| 5 or more Children | 0 (0.0%) | 0 (0.0%) |
| Total | 0 (0.0%) | 0 (0.0%) |
Income Below Poverty Among Married-Couple vs Single-Parent Households in Cascade Chipita Park
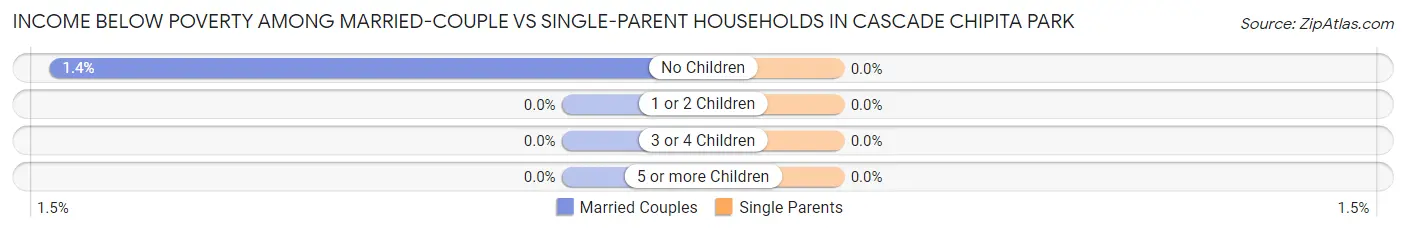
| Children | Married-Couple Families | Single-Parent Households |
| No Children | 4 (1.4%) | 0 (0.0%) |
| 1 or 2 Children | 0 (0.0%) | 0 (0.0%) |
| 3 or 4 Children | 0 (0.0%) | 0 (0.0%) |
| 5 or more Children | 0 (0.0%) | 0 (0.0%) |
| Total | 4 (1.3%) | 0 (0.0%) |
Race in Cascade Chipita Park
The most populous races in Cascade Chipita Park are White / Caucasian (1,203 | 92.4%), Hispanic or Latino (82 | 6.3%), and Two or more Races (63 | 4.8%).
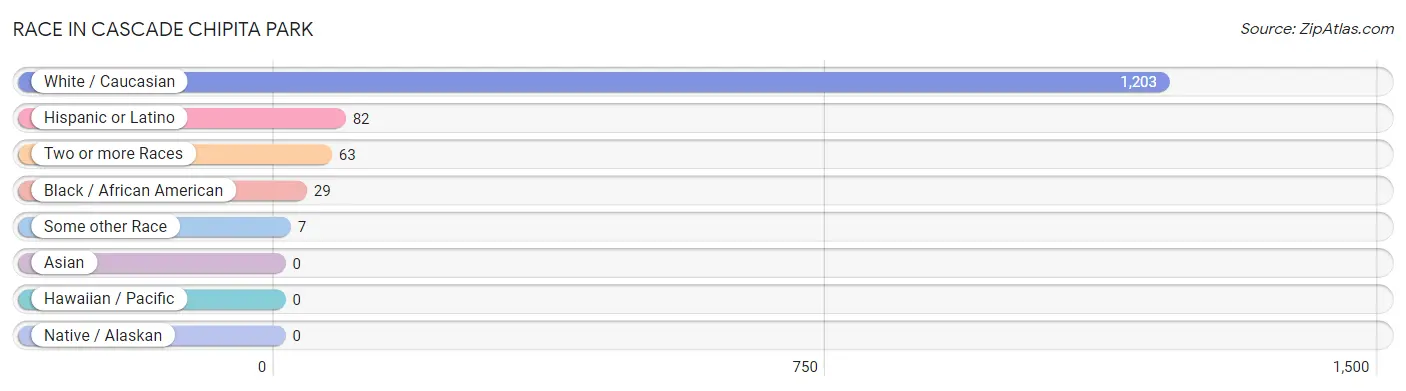
| Race | # Population | % Population |
| Asian | 0 | 0.0% |
| Black / African American | 29 | 2.2% |
| Hawaiian / Pacific | 0 | 0.0% |
| Hispanic or Latino | 82 | 6.3% |
| Native / Alaskan | 0 | 0.0% |
| White / Caucasian | 1,203 | 92.4% |
| Two or more Races | 63 | 4.8% |
| Some other Race | 7 | 0.5% |
| Total | 1,302 | 100.0% |
Ancestry in Cascade Chipita Park
The most populous ancestries reported in Cascade Chipita Park are German (264 | 20.3%), Irish (198 | 15.2%), English (183 | 14.1%), European (122 | 9.4%), and Polish (73 | 5.6%), together accounting for 64.5% of all Cascade Chipita Park residents.
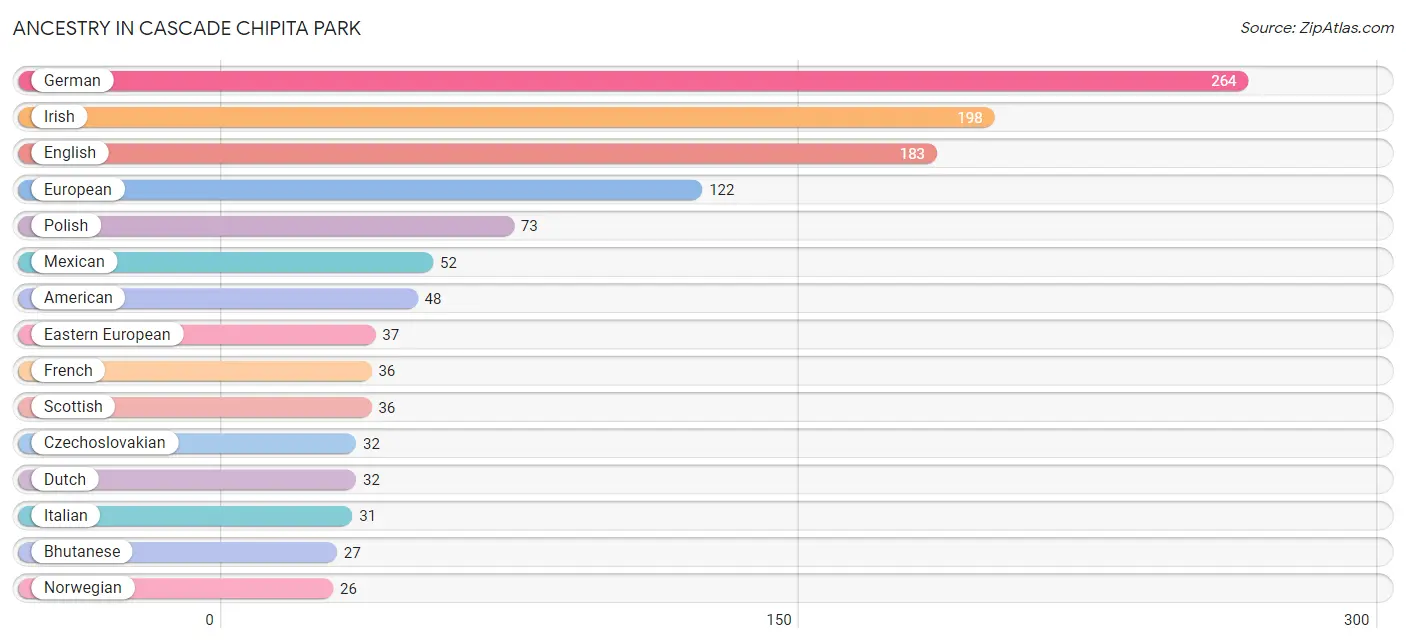
| Ancestry | # Population | % Population |
| American | 48 | 3.7% |
| Bhutanese | 27 | 2.1% |
| British | 9 | 0.7% |
| Cherokee | 1 | 0.1% |
| Chippewa | 1 | 0.1% |
| Czech | 5 | 0.4% |
| Czechoslovakian | 32 | 2.5% |
| Danish | 3 | 0.2% |
| Dutch | 32 | 2.5% |
| Eastern European | 37 | 2.8% |
| English | 183 | 14.1% |
| European | 122 | 9.4% |
| French | 36 | 2.8% |
| German | 264 | 20.3% |
| Irish | 198 | 15.2% |
| Italian | 31 | 2.4% |
| Luxembourger | 3 | 0.2% |
| Mexican | 52 | 4.0% |
| Northern European | 10 | 0.8% |
| Norwegian | 26 | 2.0% |
| Pennsylvania German | 10 | 0.8% |
| Polish | 73 | 5.6% |
| Puerto Rican | 1 | 0.1% |
| Scandinavian | 6 | 0.5% |
| Scottish | 36 | 2.8% |
| Swedish | 25 | 1.9% |
| Welsh | 8 | 0.6% | View All 27 Rows |
Immigrants in Cascade Chipita Park
The most numerous immigrant groups reported in Cascade Chipita Park came from Europe (9 | 0.7%), and Northern Europe (9 | 0.7%), together accounting for 1.4% of all Cascade Chipita Park residents.
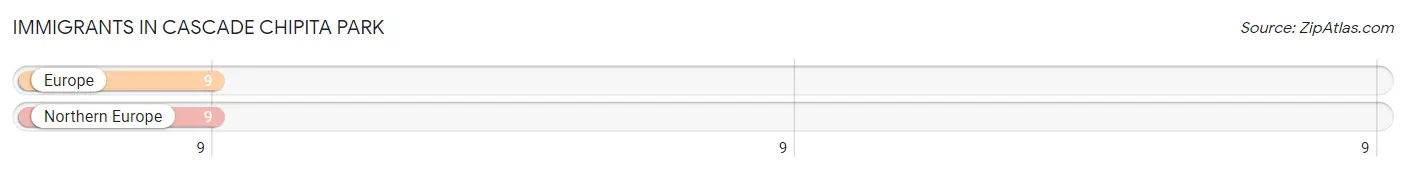
| Immigration Origin | # Population | % Population |
| Europe | 9 | 0.7% |
| Northern Europe | 9 | 0.7% | View All 2 Rows |
Sex and Age in Cascade Chipita Park
Sex and Age in Cascade Chipita Park
The most populous age groups in Cascade Chipita Park are 20 to 24 Years (111 | 15.2%) for men and 60 to 64 Years (95 | 16.6%) for women.
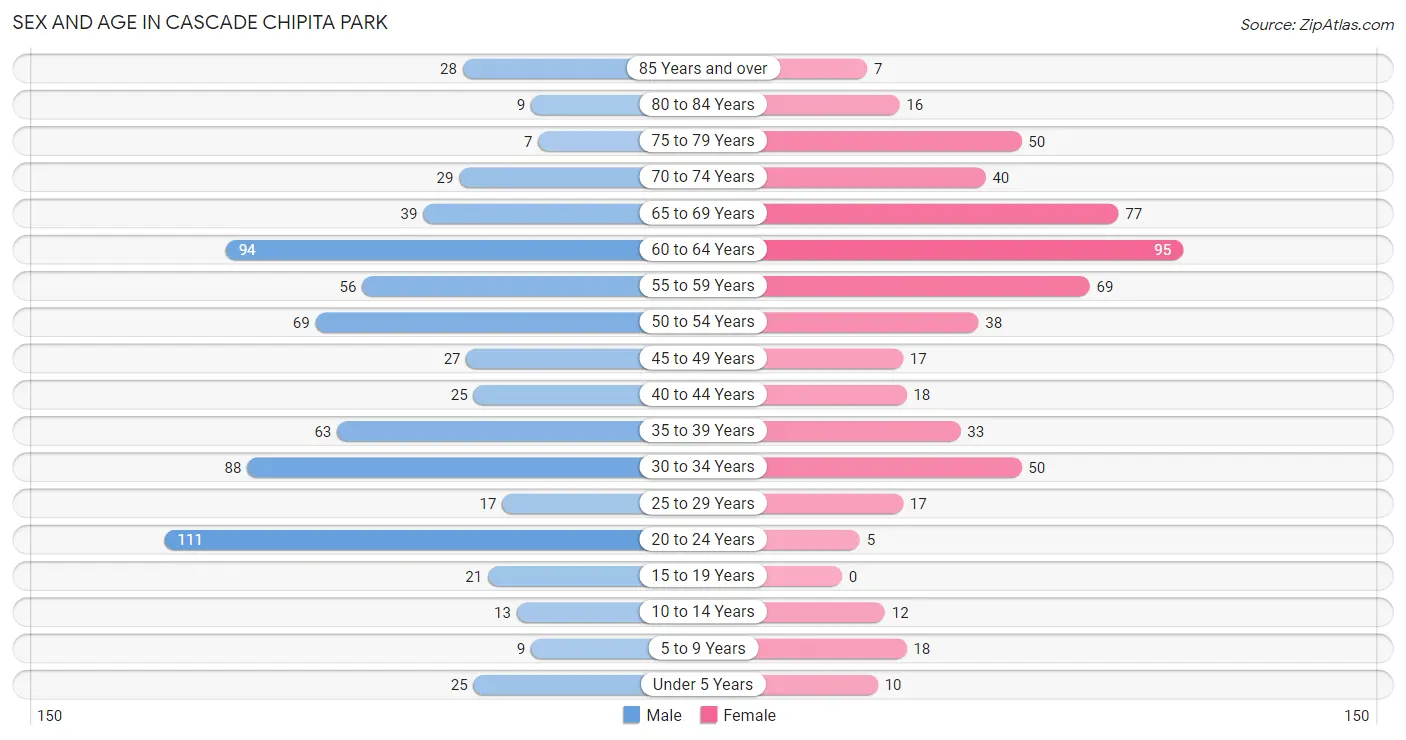
| Age Bracket | Male | Female |
| Under 5 Years | 25 (3.4%) | 10 (1.8%) |
| 5 to 9 Years | 9 (1.2%) | 18 (3.2%) |
| 10 to 14 Years | 13 (1.8%) | 12 (2.1%) |
| 15 to 19 Years | 21 (2.9%) | 0 (0.0%) |
| 20 to 24 Years | 111 (15.2%) | 5 (0.9%) |
| 25 to 29 Years | 17 (2.3%) | 17 (3.0%) |
| 30 to 34 Years | 88 (12.0%) | 50 (8.7%) |
| 35 to 39 Years | 63 (8.6%) | 33 (5.8%) |
| 40 to 44 Years | 25 (3.4%) | 18 (3.2%) |
| 45 to 49 Years | 27 (3.7%) | 17 (3.0%) |
| 50 to 54 Years | 69 (9.5%) | 38 (6.6%) |
| 55 to 59 Years | 56 (7.7%) | 69 (12.1%) |
| 60 to 64 Years | 94 (12.9%) | 95 (16.6%) |
| 65 to 69 Years | 39 (5.3%) | 77 (13.5%) |
| 70 to 74 Years | 29 (4.0%) | 40 (7.0%) |
| 75 to 79 Years | 7 (1.0%) | 50 (8.7%) |
| 80 to 84 Years | 9 (1.2%) | 16 (2.8%) |
| 85 Years and over | 28 (3.8%) | 7 (1.2%) |
| Total | 730 (100.0%) | 572 (100.0%) |
Families and Households in Cascade Chipita Park
Median Family Size in Cascade Chipita Park
The median family size in Cascade Chipita Park is 2.69 persons per family, with single male/father families (9 | 2.7%) accounting for the largest median family size of 4 persons per family. On the other hand, married-couple families (307 | 93.6%) represent the smallest median family size with 2.64 persons per family.
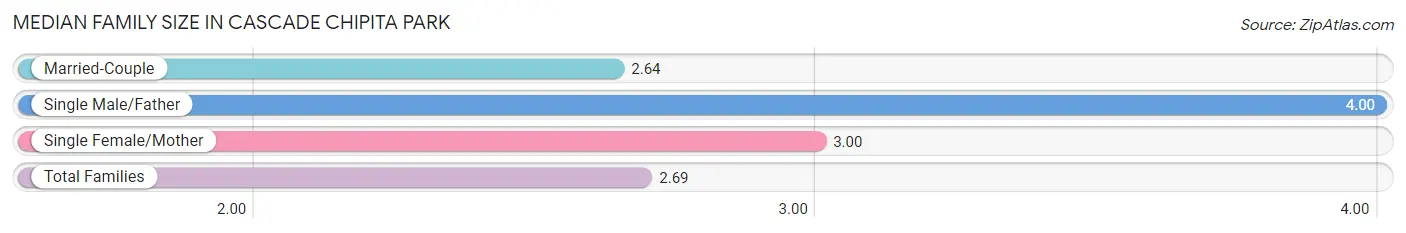
| Family Type | # Families | Family Size |
| Married-Couple | 307 (93.6%) | 2.64 |
| Single Male/Father | 9 (2.7%) | 4.00 |
| Single Female/Mother | 12 (3.7%) | 3.00 |
| Total Families | 328 (100.0%) | 2.69 |
Median Household Size in Cascade Chipita Park
The median household size in Cascade Chipita Park is 2.23 persons per household, with single male/father households (9 | 1.6%) accounting for the largest median household size of 4.56 persons per household. non-family households (234 | 41.6%) represent the smallest median household size with 1.30 persons per household.
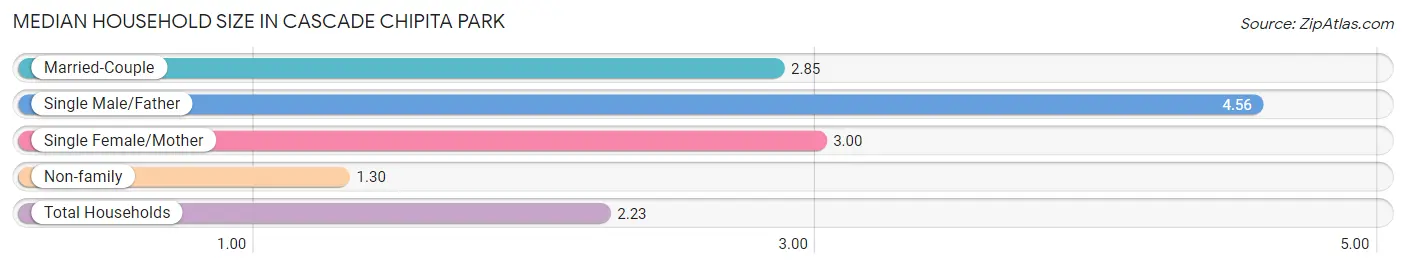
| Household Type | # Households | Household Size |
| Married-Couple | 307 (54.6%) | 2.85 |
| Single Male/Father | 9 (1.6%) | 4.56 |
| Single Female/Mother | 12 (2.1%) | 3.00 |
| Non-family | 234 (41.6%) | 1.30 |
| Total Households | 562 (100.0%) | 2.23 |
Household Size by Marriage Status in Cascade Chipita Park
Out of a total of 562 households in Cascade Chipita Park, 328 (58.4%) are family households, while 234 (41.6%) are nonfamily households. The most numerous type of family households are 2-person households, comprising 207, and the most common type of nonfamily households are 1-person households, comprising 160.
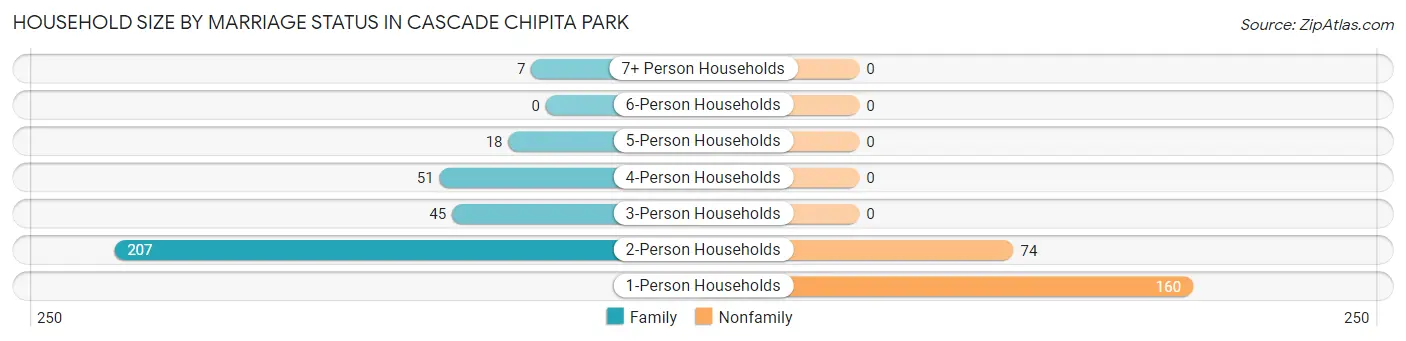
| Household Size | Family Households | Nonfamily Households |
| 1-Person Households | - | 160 (28.5%) |
| 2-Person Households | 207 (36.8%) | 74 (13.2%) |
| 3-Person Households | 45 (8.0%) | 0 (0.0%) |
| 4-Person Households | 51 (9.1%) | 0 (0.0%) |
| 5-Person Households | 18 (3.2%) | 0 (0.0%) |
| 6-Person Households | 0 (0.0%) | 0 (0.0%) |
| 7+ Person Households | 7 (1.3%) | 0 (0.0%) |
| Total | 328 (58.4%) | 234 (41.6%) |
Female Fertility in Cascade Chipita Park
Fertility by Age in Cascade Chipita Park
| Age Bracket | Women with Births | Births / 1,000 Women |
| 15 to 19 years | 0 (0.0%) | 0.0 |
| 20 to 34 years | 0 (0.0%) | 0.0 |
| 35 to 50 years | 0 (0.0%) | 0.0 |
| Total | 0 (0.0%) | 0.0 |
Fertility by Age by Marriage Status in Cascade Chipita Park
| Age Bracket | Married | Unmarried |
| 15 to 19 years | 0 (0.0%) | 0 (0.0%) |
| 20 to 34 years | 0 (0.0%) | 0 (0.0%) |
| 35 to 50 years | 0 (0.0%) | 0 (0.0%) |
| Total | 0 (0.0%) | 0 (0.0%) |
Fertility by Education in Cascade Chipita Park
| Educational Attainment | Women with Births | Births / 1,000 Women |
| Less than High School | 0 (0.0%) | 0.0 |
| High School Diploma | 0 (0.0%) | 0.0 |
| College or Associate's Degree | 0 (0.0%) | 0.0 |
| Bachelor's Degree | 0 (0.0%) | 0.0 |
| Graduate Degree | 0 (0.0%) | 0.0 |
| Total | 0 (0.0%) | 0.0 |
Fertility by Education by Marriage Status in Cascade Chipita Park
| Educational Attainment | Married | Unmarried |
| Less than High School | 0 (0.0%) | 0 (0.0%) |
| High School Diploma | 0 (0.0%) | 0 (0.0%) |
| College or Associate's Degree | 0 (0.0%) | 0 (0.0%) |
| Bachelor's Degree | 0 (0.0%) | 0 (0.0%) |
| Graduate Degree | 0 (0.0%) | 0 (0.0%) |
| Total | 0 (0.0%) | 0 (0.0%) |
Employment Characteristics in Cascade Chipita Park
Employment by Class of Employer in Cascade Chipita Park
Among the 529 employed individuals in Cascade Chipita Park, private company employees (338 | 63.9%), not-for-profit organizations (46 | 8.7%), and federal government employees (44 | 8.3%) make up the most common classes of employment.
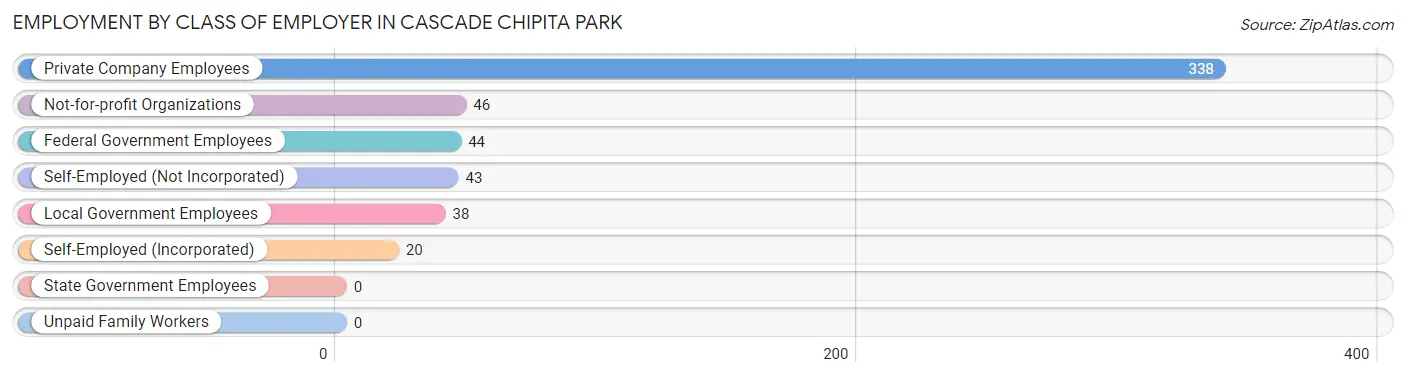
| Employer Class | # Employees | % Employees |
| Private Company Employees | 338 | 63.9% |
| Self-Employed (Incorporated) | 20 | 3.8% |
| Self-Employed (Not Incorporated) | 43 | 8.1% |
| Not-for-profit Organizations | 46 | 8.7% |
| Local Government Employees | 38 | 7.2% |
| State Government Employees | 0 | 0.0% |
| Federal Government Employees | 44 | 8.3% |
| Unpaid Family Workers | 0 | 0.0% |
| Total | 529 | 100.0% |
Employment Status by Age in Cascade Chipita Park
According to the labor force statistics for Cascade Chipita Park, out of the total population over 16 years of age (1,215), 53.3% or 648 individuals are in the labor force, with 18.2% or 118 of them unemployed. The age group with the highest labor force participation rate is 35 to 44 years, with 86.3% or 120 individuals in the labor force. Within the labor force, the 20 to 24 years age range has the highest percentage of unemployed individuals, with 94.1% or 80 of them being unemployed.
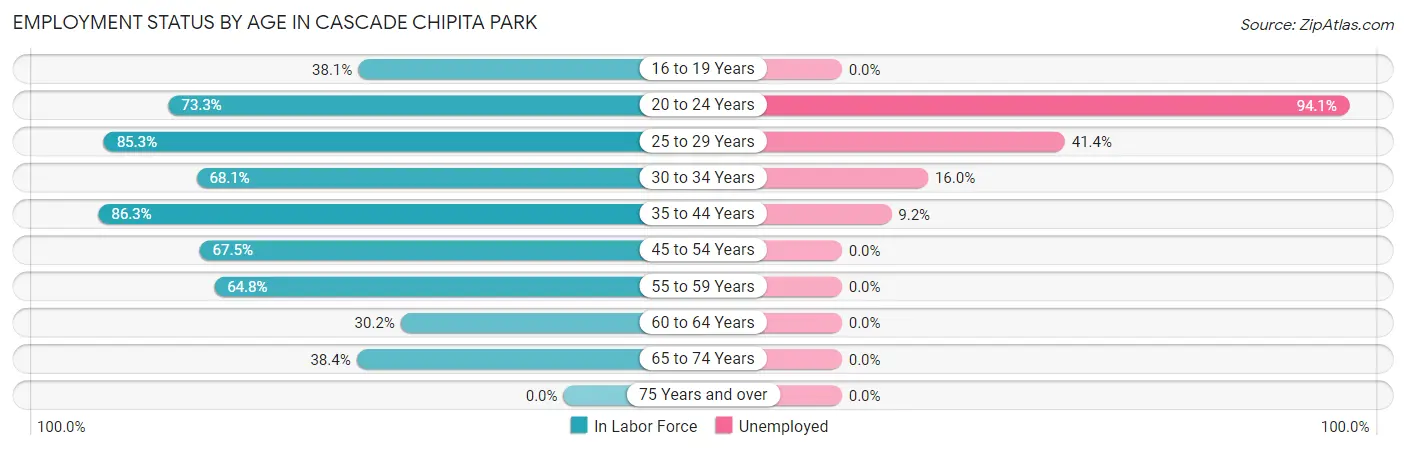
| Age Bracket | In Labor Force | Unemployed |
| 16 to 19 Years | 8 (38.1%) | 0 (0.0%) |
| 20 to 24 Years | 85 (73.3%) | 80 (94.1%) |
| 25 to 29 Years | 29 (85.3%) | 12 (41.4%) |
| 30 to 34 Years | 94 (68.1%) | 15 (16.0%) |
| 35 to 44 Years | 120 (86.3%) | 11 (9.2%) |
| 45 to 54 Years | 102 (67.5%) | 0 (0.0%) |
| 55 to 59 Years | 81 (64.8%) | 0 (0.0%) |
| 60 to 64 Years | 57 (30.2%) | 0 (0.0%) |
| 65 to 74 Years | 71 (38.4%) | 0 (0.0%) |
| 75 Years and over | 0 (0.0%) | 0 (0.0%) |
| Total | 648 (53.3%) | 118 (18.2%) |
Employment Status by Educational Attainment in Cascade Chipita Park
According to labor force statistics for Cascade Chipita Park, 62.2% of individuals (483) out of the total population between 25 and 64 years of age (776) are in the labor force, with 7.9% or 38 of them being unemployed. The group with the highest labor force participation rate are those with the educational attainment of less than high school, with 100.0% or 6 individuals in the labor force. Within the labor force, individuals with high school diploma education have the highest percentage of unemployment, with 11.2% or 10 of them being unemployed.
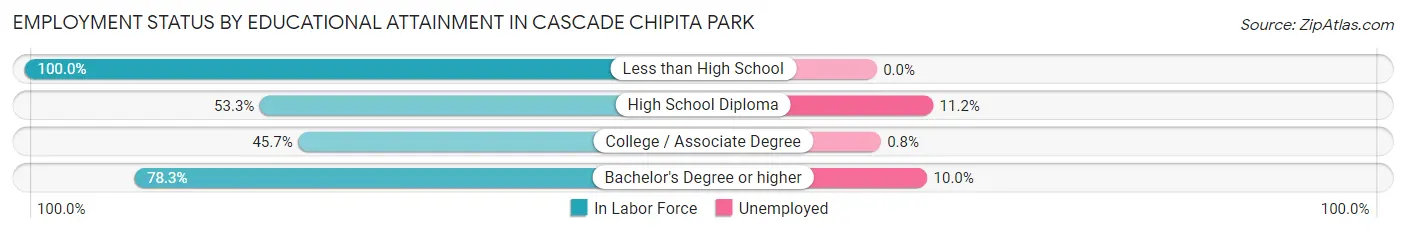
| Educational Attainment | In Labor Force | Unemployed |
| Less than High School | 6 (100.0%) | 0 (0.0%) |
| High School Diploma | 89 (53.3%) | 19 (11.2%) |
| College / Associate Degree | 118 (45.7%) | 2 (0.8%) |
| Bachelor's Degree or higher | 270 (78.3%) | 34 (10.0%) |
| Total | 483 (62.2%) | 61 (7.9%) |
Employment Occupations by Sex in Cascade Chipita Park
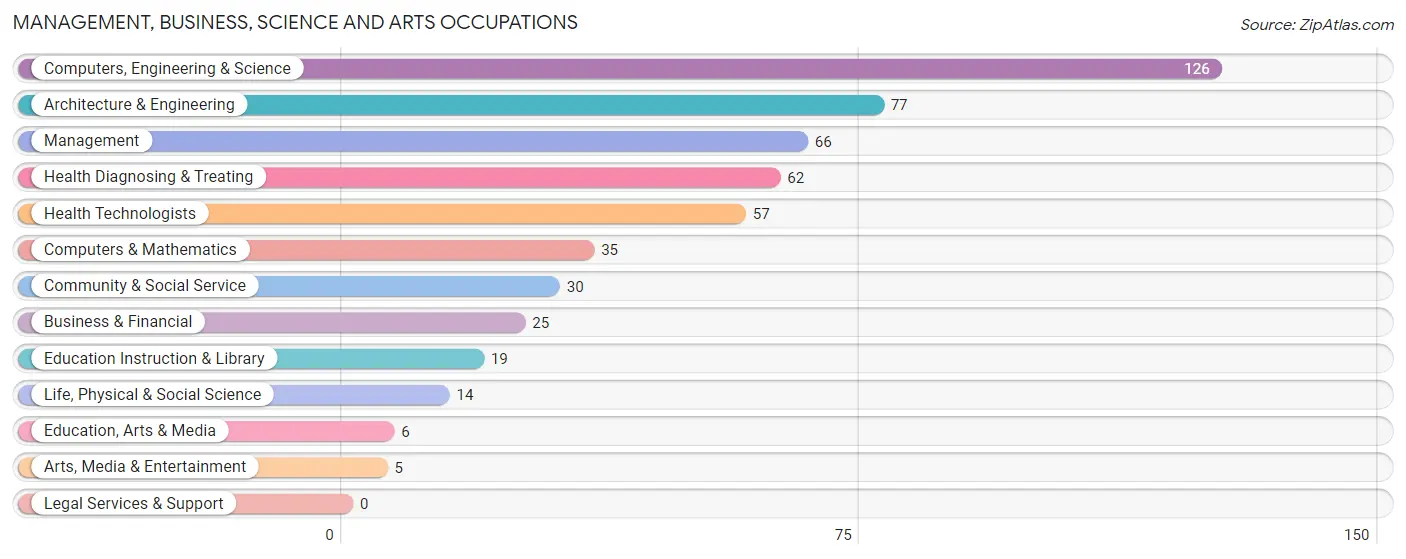
Management, Business, Science and Arts Occupations
The most common Management, Business, Science and Arts occupations in Cascade Chipita Park are Computers, Engineering & Science (126 | 23.8%), Architecture & Engineering (77 | 14.6%), Management (66 | 12.5%), Health Diagnosing & Treating (62 | 11.7%), and Health Technologists (57 | 10.8%).
Management, Business, Science and Arts Occupations by Sex
Within the Management, Business, Science and Arts occupations in Cascade Chipita Park, the most male-oriented occupations are Management (100.0%), Computers & Mathematics (100.0%), and Architecture & Engineering (100.0%), while the most female-oriented occupations are Life, Physical & Social Science (100.0%), Community & Social Service (100.0%), and Education, Arts & Media (100.0%).
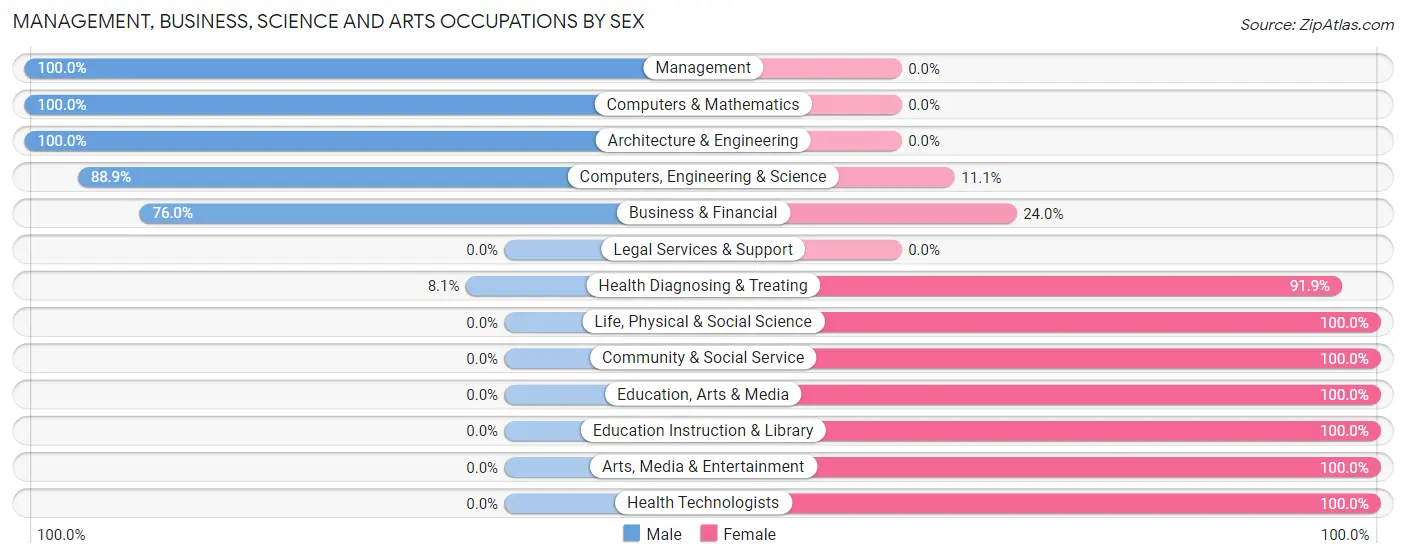
| Occupation | Male | Female |
| Management | 66 (100.0%) | 0 (0.0%) |
| Business & Financial | 19 (76.0%) | 6 (24.0%) |
| Computers, Engineering & Science | 112 (88.9%) | 14 (11.1%) |
| Computers & Mathematics | 35 (100.0%) | 0 (0.0%) |
| Architecture & Engineering | 77 (100.0%) | 0 (0.0%) |
| Life, Physical & Social Science | 0 (0.0%) | 14 (100.0%) |
| Community & Social Service | 0 (0.0%) | 30 (100.0%) |
| Education, Arts & Media | 0 (0.0%) | 6 (100.0%) |
| Legal Services & Support | 0 (0.0%) | 0 (0.0%) |
| Education Instruction & Library | 0 (0.0%) | 19 (100.0%) |
| Arts, Media & Entertainment | 0 (0.0%) | 5 (100.0%) |
| Health Diagnosing & Treating | 5 (8.1%) | 57 (91.9%) |
| Health Technologists | 0 (0.0%) | 57 (100.0%) |
| Total (Category) | 202 (65.4%) | 107 (34.6%) |
| Total (Overall) | 326 (61.6%) | 203 (38.4%) |
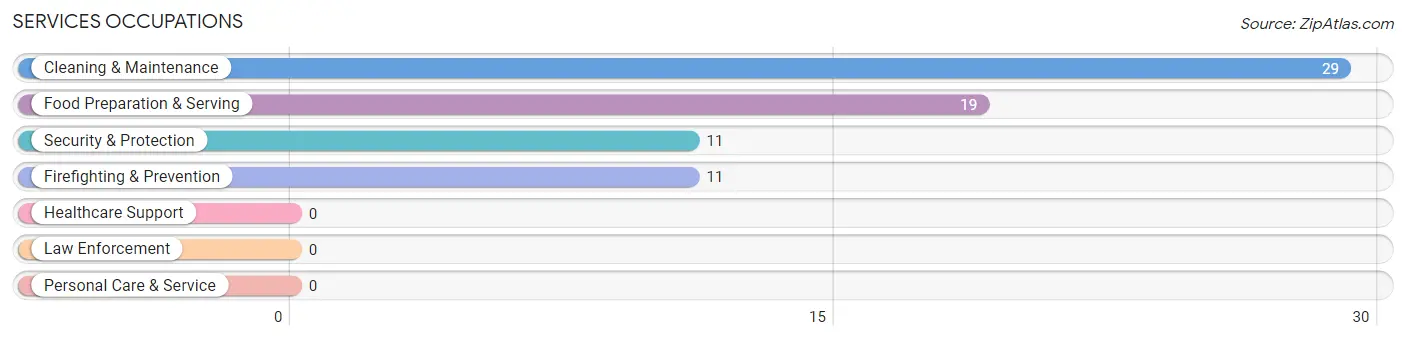
Services Occupations
The most common Services occupations in Cascade Chipita Park are Cleaning & Maintenance (29 | 5.5%), Food Preparation & Serving (19 | 3.6%), Security & Protection (11 | 2.1%), and Firefighting & Prevention (11 | 2.1%).
Services Occupations by Sex
Within the Services occupations in Cascade Chipita Park, the most male-oriented occupations are Security & Protection (100.0%), Firefighting & Prevention (100.0%), and Cleaning & Maintenance (69.0%), while the most female-oriented occupations are Food Preparation & Serving (57.9%), and Cleaning & Maintenance (31.0%).
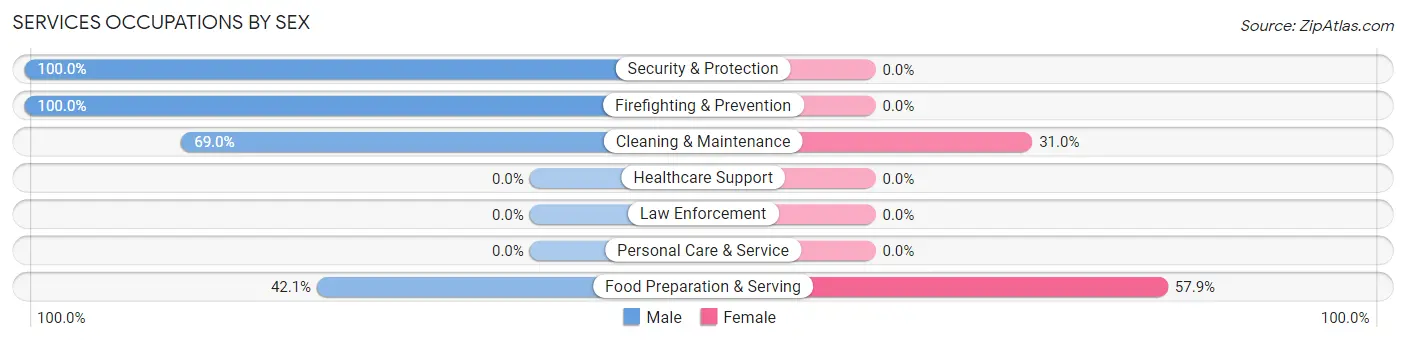
| Occupation | Male | Female |
| Healthcare Support | 0 (0.0%) | 0 (0.0%) |
| Security & Protection | 11 (100.0%) | 0 (0.0%) |
| Firefighting & Prevention | 11 (100.0%) | 0 (0.0%) |
| Law Enforcement | 0 (0.0%) | 0 (0.0%) |
| Food Preparation & Serving | 8 (42.1%) | 11 (57.9%) |
| Cleaning & Maintenance | 20 (69.0%) | 9 (31.0%) |
| Personal Care & Service | 0 (0.0%) | 0 (0.0%) |
| Total (Category) | 39 (66.1%) | 20 (33.9%) |
| Total (Overall) | 326 (61.6%) | 203 (38.4%) |
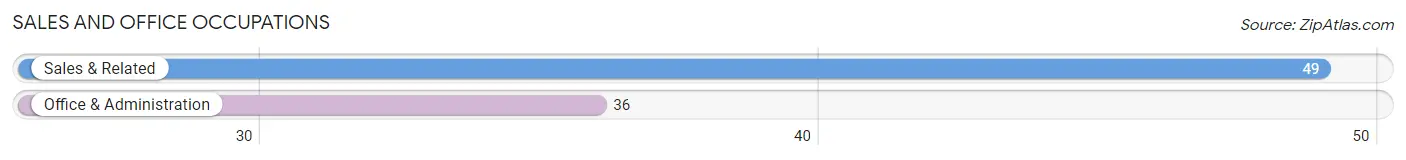
Sales and Office Occupations
The most common Sales and Office occupations in Cascade Chipita Park are Sales & Related (49 | 9.3%), and Office & Administration (36 | 6.8%).
Sales and Office Occupations by Sex
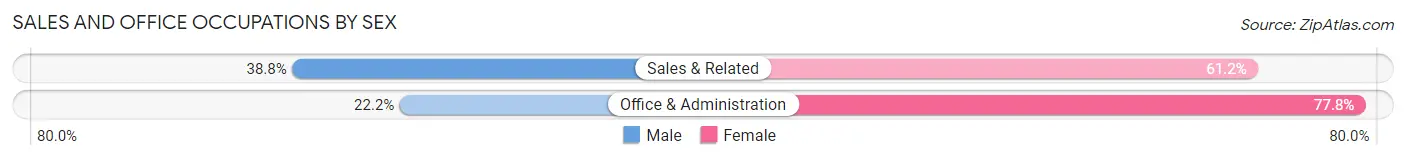
| Occupation | Male | Female |
| Sales & Related | 19 (38.8%) | 30 (61.2%) |
| Office & Administration | 8 (22.2%) | 28 (77.8%) |
| Total (Category) | 27 (31.8%) | 58 (68.2%) |
| Total (Overall) | 326 (61.6%) | 203 (38.4%) |
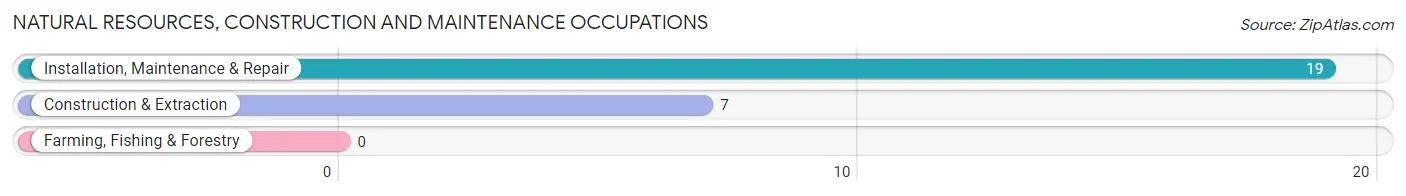
Natural Resources, Construction and Maintenance Occupations
The most common Natural Resources, Construction and Maintenance occupations in Cascade Chipita Park are Installation, Maintenance & Repair (19 | 3.6%), and Construction & Extraction (7 | 1.3%).
Natural Resources, Construction and Maintenance Occupations by Sex
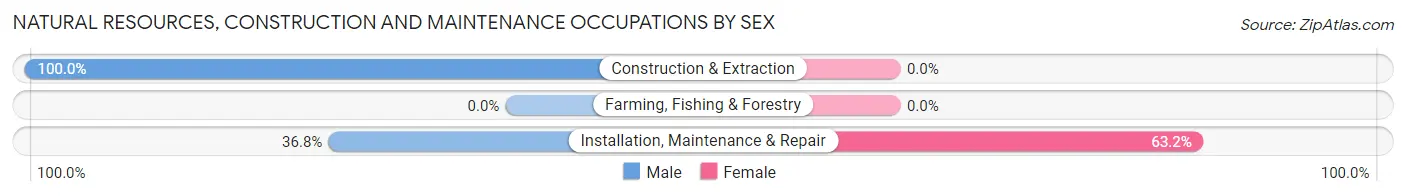
| Occupation | Male | Female |
| Farming, Fishing & Forestry | 0 (0.0%) | 0 (0.0%) |
| Construction & Extraction | 7 (100.0%) | 0 (0.0%) |
| Installation, Maintenance & Repair | 7 (36.8%) | 12 (63.2%) |
| Total (Category) | 14 (53.8%) | 12 (46.2%) |
| Total (Overall) | 326 (61.6%) | 203 (38.4%) |
Production, Transportation and Moving Occupations
The most common Production, Transportation and Moving occupations in Cascade Chipita Park are Transportation (39 | 7.4%), Production (6 | 1.1%), and Material Moving (5 | 0.9%).
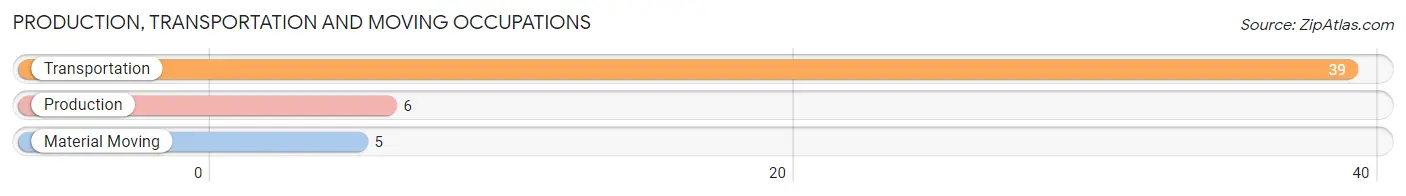
Production, Transportation and Moving Occupations by Sex

| Occupation | Male | Female |
| Production | 0 (0.0%) | 6 (100.0%) |
| Transportation | 39 (100.0%) | 0 (0.0%) |
| Material Moving | 5 (100.0%) | 0 (0.0%) |
| Total (Category) | 44 (88.0%) | 6 (12.0%) |
| Total (Overall) | 326 (61.6%) | 203 (38.4%) |
Employment Industries by Sex in Cascade Chipita Park
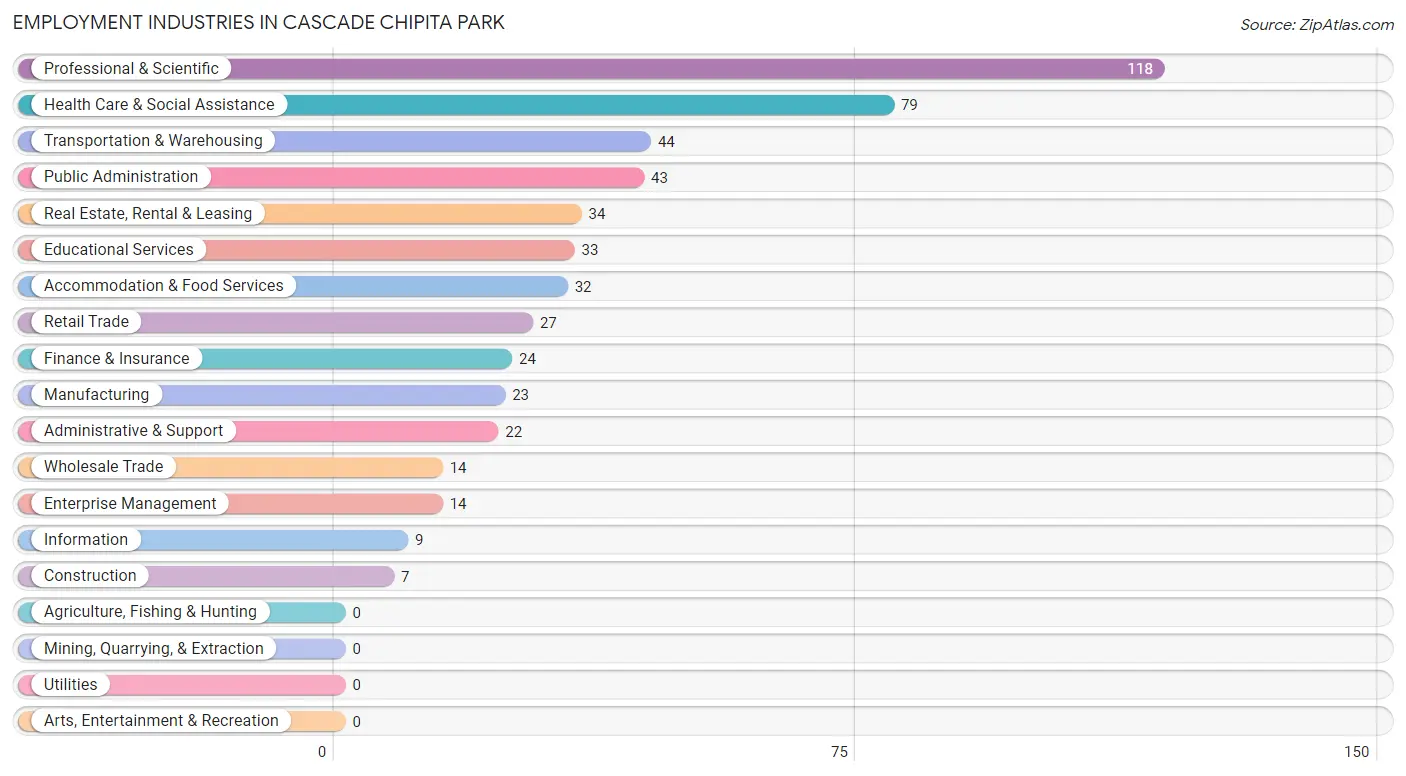
Employment Industries in Cascade Chipita Park
The major employment industries in Cascade Chipita Park include Professional & Scientific (118 | 22.3%), Health Care & Social Assistance (79 | 14.9%), Transportation & Warehousing (44 | 8.3%), Public Administration (43 | 8.1%), and Real Estate, Rental & Leasing (34 | 6.4%).
Employment Industries by Sex in Cascade Chipita Park
The Cascade Chipita Park industries that see more men than women are Construction (100.0%), Wholesale Trade (100.0%), and Transportation & Warehousing (100.0%), whereas the industries that tend to have a higher number of women are Enterprise Management (100.0%), Health Care & Social Assistance (93.7%), and Retail Trade (74.1%).
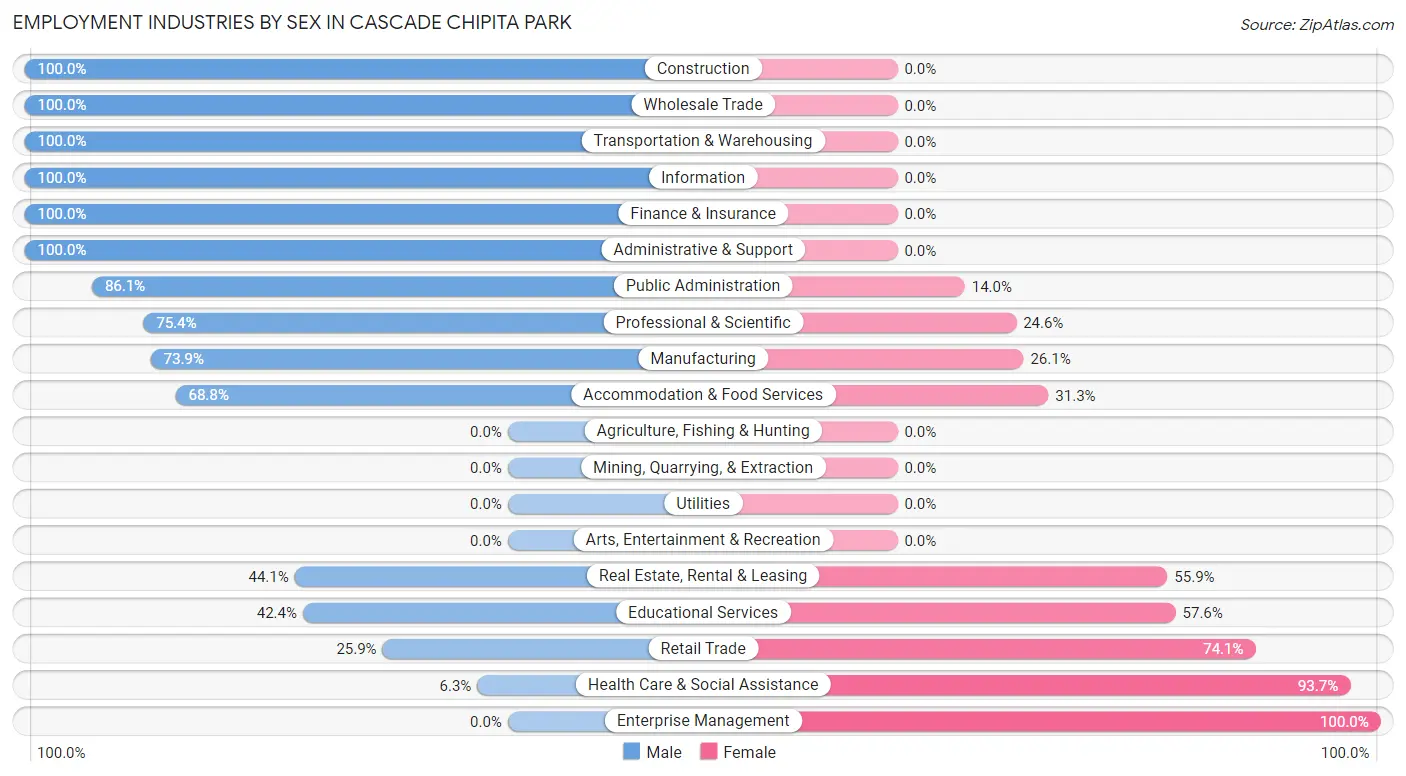
| Industry | Male | Female |
| Agriculture, Fishing & Hunting | 0 (0.0%) | 0 (0.0%) |
| Mining, Quarrying, & Extraction | 0 (0.0%) | 0 (0.0%) |
| Construction | 7 (100.0%) | 0 (0.0%) |
| Manufacturing | 17 (73.9%) | 6 (26.1%) |
| Wholesale Trade | 14 (100.0%) | 0 (0.0%) |
| Retail Trade | 7 (25.9%) | 20 (74.1%) |
| Transportation & Warehousing | 44 (100.0%) | 0 (0.0%) |
| Utilities | 0 (0.0%) | 0 (0.0%) |
| Information | 9 (100.0%) | 0 (0.0%) |
| Finance & Insurance | 24 (100.0%) | 0 (0.0%) |
| Real Estate, Rental & Leasing | 15 (44.1%) | 19 (55.9%) |
| Professional & Scientific | 89 (75.4%) | 29 (24.6%) |
| Enterprise Management | 0 (0.0%) | 14 (100.0%) |
| Administrative & Support | 22 (100.0%) | 0 (0.0%) |
| Educational Services | 14 (42.4%) | 19 (57.6%) |
| Health Care & Social Assistance | 5 (6.3%) | 74 (93.7%) |
| Arts, Entertainment & Recreation | 0 (0.0%) | 0 (0.0%) |
| Accommodation & Food Services | 22 (68.8%) | 10 (31.2%) |
| Public Administration | 37 (86.1%) | 6 (14.0%) |
| Total | 326 (61.6%) | 203 (38.4%) |
Education in Cascade Chipita Park
School Enrollment in Cascade Chipita Park
The most common levels of schooling among the 119 students in Cascade Chipita Park are college / undergraduate (46 | 38.7%), middle school (25 | 21.0%), and high school (21 | 17.6%).
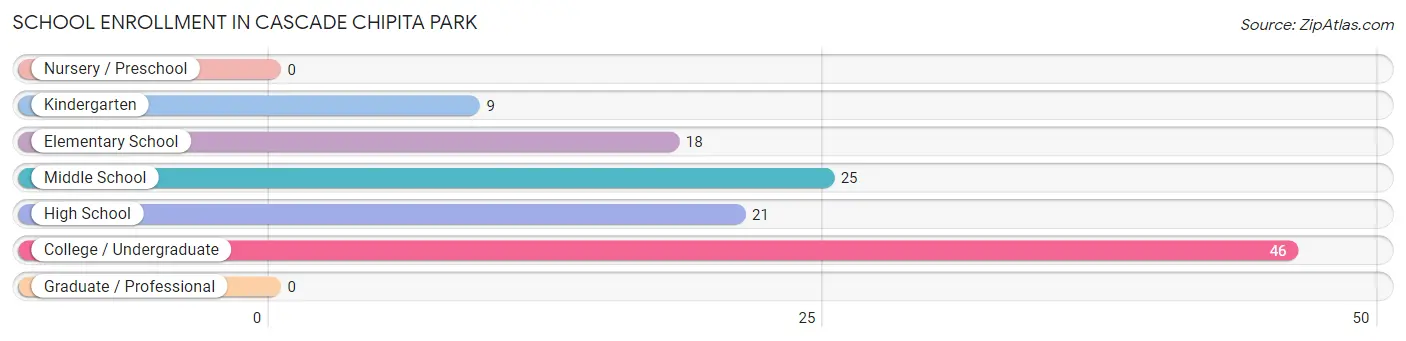
| School Level | # Students | % Students |
| Nursery / Preschool | 0 | 0.0% |
| Kindergarten | 9 | 7.6% |
| Elementary School | 18 | 15.1% |
| Middle School | 25 | 21.0% |
| High School | 21 | 17.6% |
| College / Undergraduate | 46 | 38.7% |
| Graduate / Professional | 0 | 0.0% |
| Total | 119 | 100.0% |
School Enrollment by Age by Funding Source in Cascade Chipita Park
Out of a total of 119 students who are enrolled in schools in Cascade Chipita Park, 6 (5.0%) attend a private institution, while the remaining 113 (95.0%) are enrolled in public schools. The age group of 15 to 17 year olds has the highest likelihood of being enrolled in private schools, with 3 (20.0% in the age bracket) enrolled. Conversely, the age group of 5 to 9 year old has the lowest likelihood of being enrolled in a private school, with 27 (100.0% in the age bracket) attending a public institution.
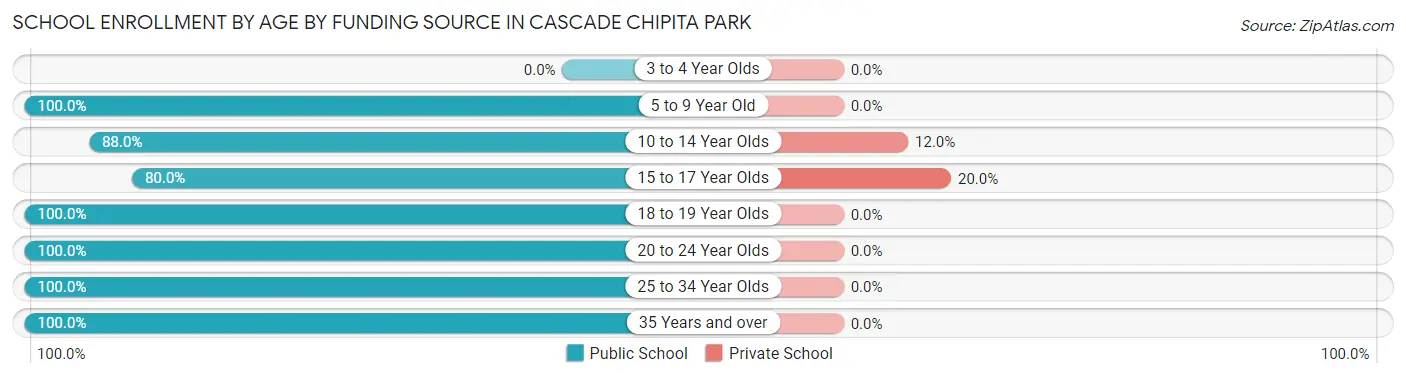
| Age Bracket | Public School | Private School |
| 3 to 4 Year Olds | 0 (0.0%) | 0 (0.0%) |
| 5 to 9 Year Old | 27 (100.0%) | 0 (0.0%) |
| 10 to 14 Year Olds | 22 (88.0%) | 3 (12.0%) |
| 15 to 17 Year Olds | 12 (80.0%) | 3 (20.0%) |
| 18 to 19 Year Olds | 6 (100.0%) | 0 (0.0%) |
| 20 to 24 Year Olds | 22 (100.0%) | 0 (0.0%) |
| 25 to 34 Year Olds | 17 (100.0%) | 0 (0.0%) |
| 35 Years and over | 7 (100.0%) | 0 (0.0%) |
| Total | 113 (95.0%) | 6 (5.0%) |
Educational Attainment by Field of Study in Cascade Chipita Park
Bio, nature & agricultural (111 | 19.8%), business (79 | 14.1%), engineering (66 | 11.7%), science & technology (51 | 9.1%), and physical & health sciences (49 | 8.7%) are the most common fields of study among 562 individuals in Cascade Chipita Park who have obtained a bachelor's degree or higher.
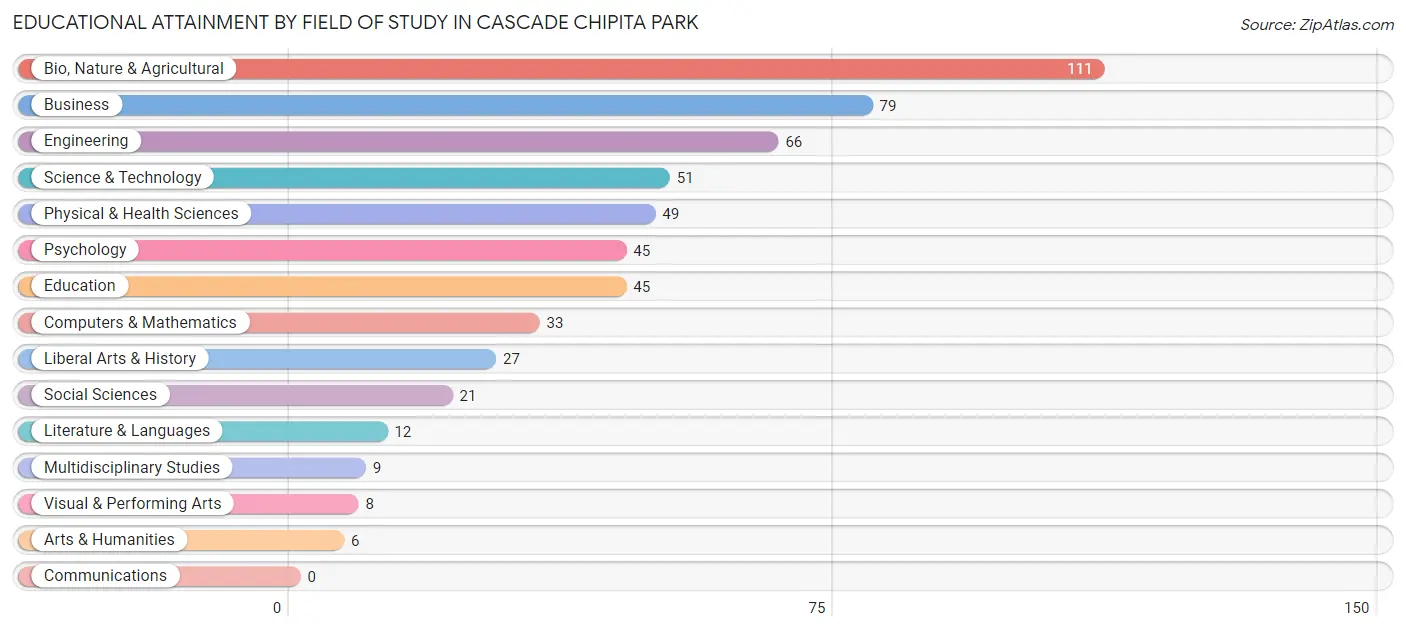
| Field of Study | # Graduates | % Graduates |
| Computers & Mathematics | 33 | 5.9% |
| Bio, Nature & Agricultural | 111 | 19.8% |
| Physical & Health Sciences | 49 | 8.7% |
| Psychology | 45 | 8.0% |
| Social Sciences | 21 | 3.7% |
| Engineering | 66 | 11.7% |
| Multidisciplinary Studies | 9 | 1.6% |
| Science & Technology | 51 | 9.1% |
| Business | 79 | 14.1% |
| Education | 45 | 8.0% |
| Literature & Languages | 12 | 2.1% |
| Liberal Arts & History | 27 | 4.8% |
| Visual & Performing Arts | 8 | 1.4% |
| Communications | 0 | 0.0% |
| Arts & Humanities | 6 | 1.1% |
| Total | 562 | 100.0% |
Transportation & Commute in Cascade Chipita Park
Vehicle Availability by Sex in Cascade Chipita Park
The most prevalent vehicle ownership categories in Cascade Chipita Park are males with 2 vehicles (113, accounting for 34.8%) and females with 2 vehicles (45, making up 55.7%).
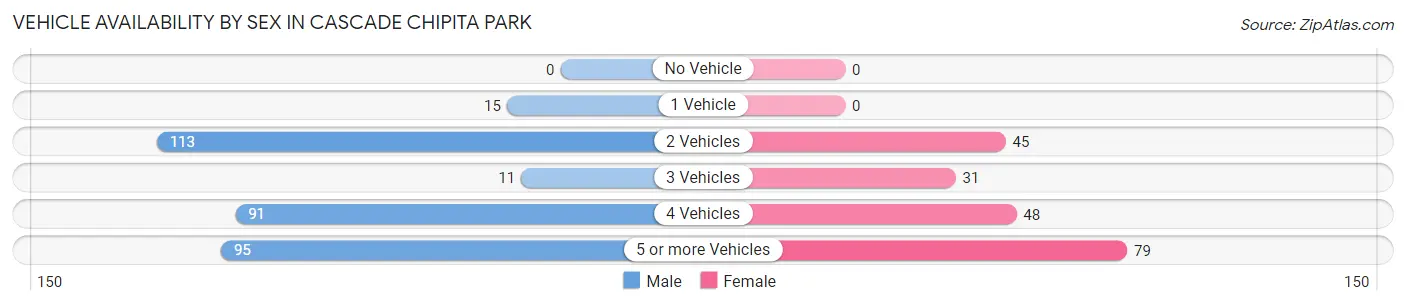
| Vehicles Available | Male | Female |
| No Vehicle | 0 (0.0%) | 0 (0.0%) |
| 1 Vehicle | 15 (4.6%) | 0 (0.0%) |
| 2 Vehicles | 113 (34.8%) | 45 (22.2%) |
| 3 Vehicles | 11 (3.4%) | 31 (15.3%) |
| 4 Vehicles | 91 (28.0%) | 48 (23.6%) |
| 5 or more Vehicles | 95 (29.2%) | 79 (38.9%) |
| Total | 325 (100.0%) | 203 (100.0%) |
Commute Time in Cascade Chipita Park
The most frequently occuring commute durations in Cascade Chipita Park are 15 to 19 minutes (63 commuters, 17.1%), 20 to 24 minutes (54 commuters, 14.6%), and 25 to 29 minutes (50 commuters, 13.6%).
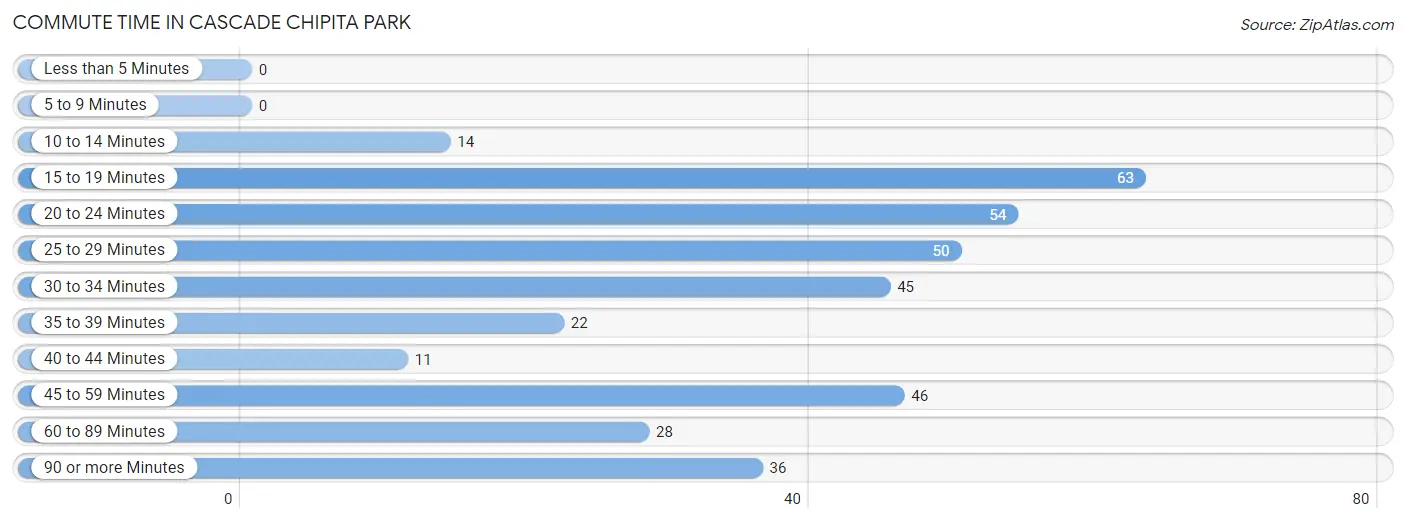
| Commute Time | # Commuters | % Commuters |
| Less than 5 Minutes | 0 | 0.0% |
| 5 to 9 Minutes | 0 | 0.0% |
| 10 to 14 Minutes | 14 | 3.8% |
| 15 to 19 Minutes | 63 | 17.1% |
| 20 to 24 Minutes | 54 | 14.6% |
| 25 to 29 Minutes | 50 | 13.6% |
| 30 to 34 Minutes | 45 | 12.2% |
| 35 to 39 Minutes | 22 | 6.0% |
| 40 to 44 Minutes | 11 | 3.0% |
| 45 to 59 Minutes | 46 | 12.5% |
| 60 to 89 Minutes | 28 | 7.6% |
| 90 or more Minutes | 36 | 9.8% |
Commute Time by Sex in Cascade Chipita Park
The most common commute times in Cascade Chipita Park are 25 to 29 minutes (45 commuters, 22.5%) for males and 15 to 19 minutes (56 commuters, 33.1%) for females.
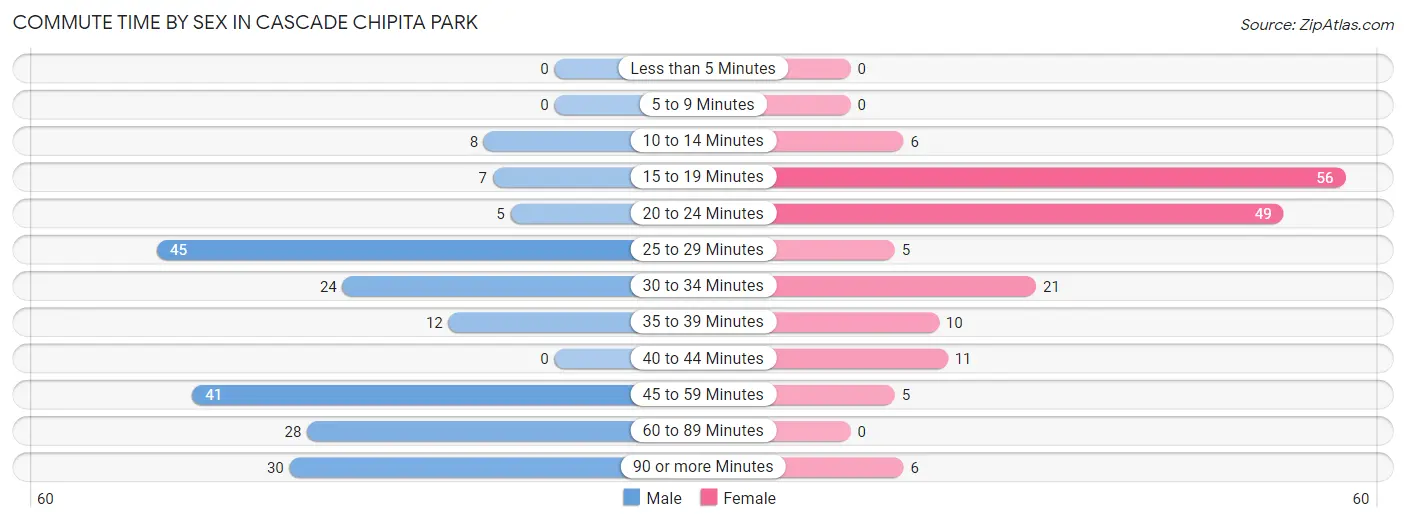
| Commute Time | Male | Female |
| Less than 5 Minutes | 0 (0.0%) | 0 (0.0%) |
| 5 to 9 Minutes | 0 (0.0%) | 0 (0.0%) |
| 10 to 14 Minutes | 8 (4.0%) | 6 (3.5%) |
| 15 to 19 Minutes | 7 (3.5%) | 56 (33.1%) |
| 20 to 24 Minutes | 5 (2.5%) | 49 (29.0%) |
| 25 to 29 Minutes | 45 (22.5%) | 5 (3.0%) |
| 30 to 34 Minutes | 24 (12.0%) | 21 (12.4%) |
| 35 to 39 Minutes | 12 (6.0%) | 10 (5.9%) |
| 40 to 44 Minutes | 0 (0.0%) | 11 (6.5%) |
| 45 to 59 Minutes | 41 (20.5%) | 5 (3.0%) |
| 60 to 89 Minutes | 28 (14.0%) | 0 (0.0%) |
| 90 or more Minutes | 30 (15.0%) | 6 (3.5%) |
Time of Departure to Work by Sex in Cascade Chipita Park
The most frequent times of departure to work in Cascade Chipita Park are 7:00 AM to 7:29 AM (58, 29.0%) for males and 8:00 AM to 8:29 AM (59, 34.9%) for females.
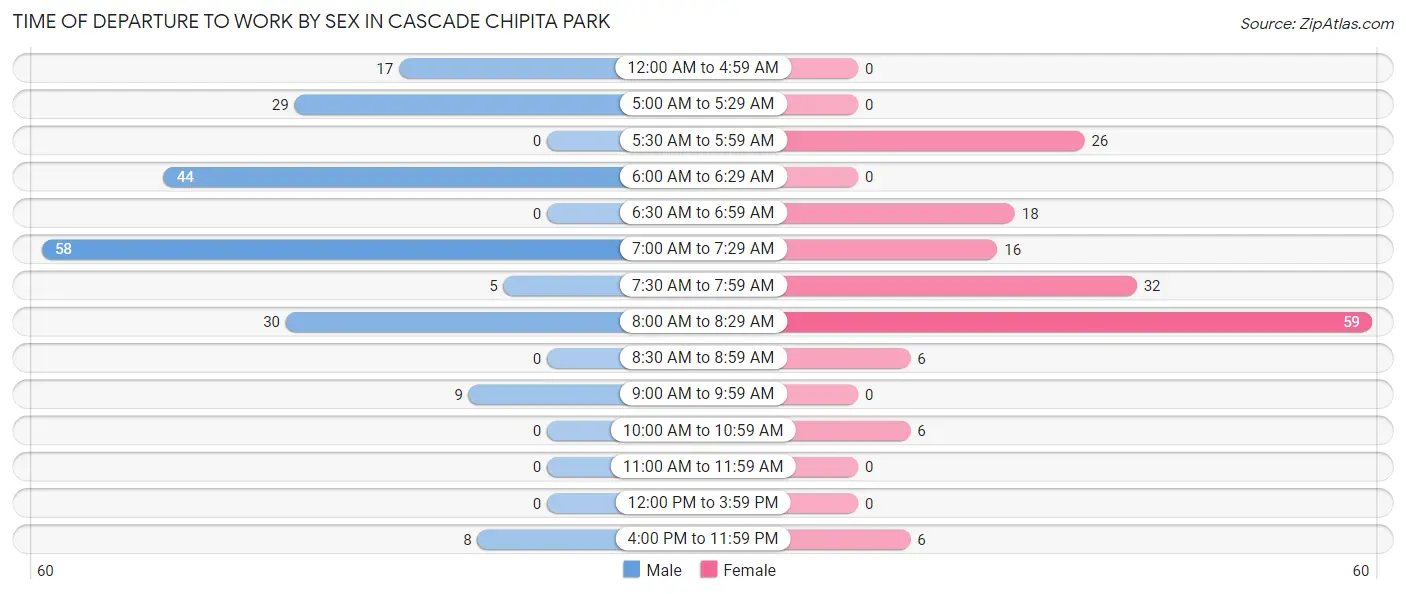
| Time of Departure | Male | Female |
| 12:00 AM to 4:59 AM | 17 (8.5%) | 0 (0.0%) |
| 5:00 AM to 5:29 AM | 29 (14.5%) | 0 (0.0%) |
| 5:30 AM to 5:59 AM | 0 (0.0%) | 26 (15.4%) |
| 6:00 AM to 6:29 AM | 44 (22.0%) | 0 (0.0%) |
| 6:30 AM to 6:59 AM | 0 (0.0%) | 18 (10.6%) |
| 7:00 AM to 7:29 AM | 58 (29.0%) | 16 (9.5%) |
| 7:30 AM to 7:59 AM | 5 (2.5%) | 32 (18.9%) |
| 8:00 AM to 8:29 AM | 30 (15.0%) | 59 (34.9%) |
| 8:30 AM to 8:59 AM | 0 (0.0%) | 6 (3.5%) |
| 9:00 AM to 9:59 AM | 9 (4.5%) | 0 (0.0%) |
| 10:00 AM to 10:59 AM | 0 (0.0%) | 6 (3.5%) |
| 11:00 AM to 11:59 AM | 0 (0.0%) | 0 (0.0%) |
| 12:00 PM to 3:59 PM | 0 (0.0%) | 0 (0.0%) |
| 4:00 PM to 11:59 PM | 8 (4.0%) | 6 (3.5%) |
| Total | 200 (100.0%) | 169 (100.0%) |
Housing Occupancy in Cascade Chipita Park
Occupancy by Ownership in Cascade Chipita Park
Of the total 562 dwellings in Cascade Chipita Park, owner-occupied units account for 468 (83.3%), while renter-occupied units make up 94 (16.7%).
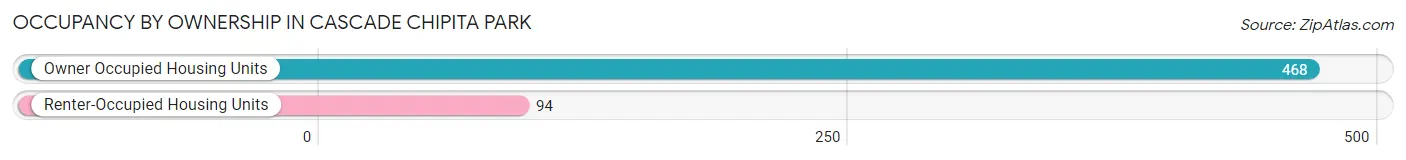
| Occupancy | # Housing Units | % Housing Units |
| Owner Occupied Housing Units | 468 | 83.3% |
| Renter-Occupied Housing Units | 94 | 16.7% |
| Total Occupied Housing Units | 562 | 100.0% |
Occupancy by Household Size in Cascade Chipita Park
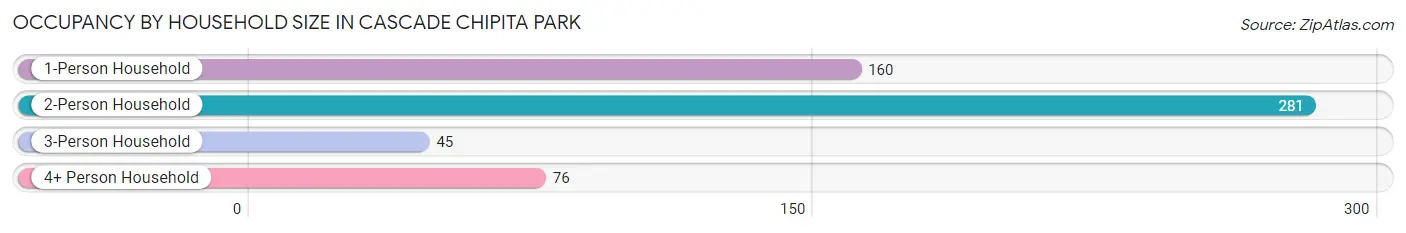
| Household Size | # Housing Units | % Housing Units |
| 1-Person Household | 160 | 28.5% |
| 2-Person Household | 281 | 50.0% |
| 3-Person Household | 45 | 8.0% |
| 4+ Person Household | 76 | 13.5% |
| Total Housing Units | 562 | 100.0% |
Occupancy by Ownership by Household Size in Cascade Chipita Park
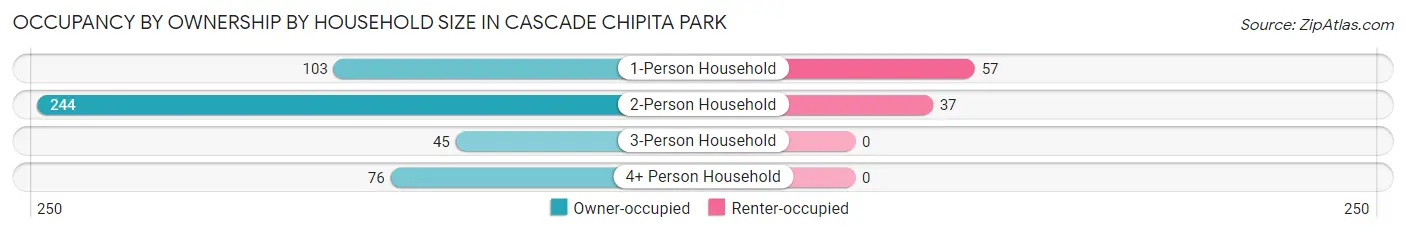
| Household Size | Owner-occupied | Renter-occupied |
| 1-Person Household | 103 (64.4%) | 57 (35.6%) |
| 2-Person Household | 244 (86.8%) | 37 (13.2%) |
| 3-Person Household | 45 (100.0%) | 0 (0.0%) |
| 4+ Person Household | 76 (100.0%) | 0 (0.0%) |
| Total Housing Units | 468 (83.3%) | 94 (16.7%) |
Occupancy by Educational Attainment in Cascade Chipita Park
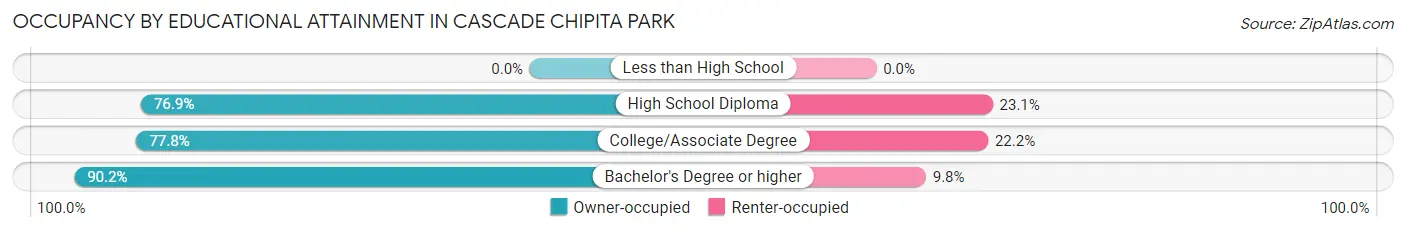
| Household Size | Owner-occupied | Renter-occupied |
| Less than High School | 0 (0.0%) | 0 (0.0%) |
| High School Diploma | 60 (76.9%) | 18 (23.1%) |
| College/Associate Degree | 179 (77.8%) | 51 (22.2%) |
| Bachelor's Degree or higher | 229 (90.2%) | 25 (9.8%) |
Occupancy by Age of Householder in Cascade Chipita Park
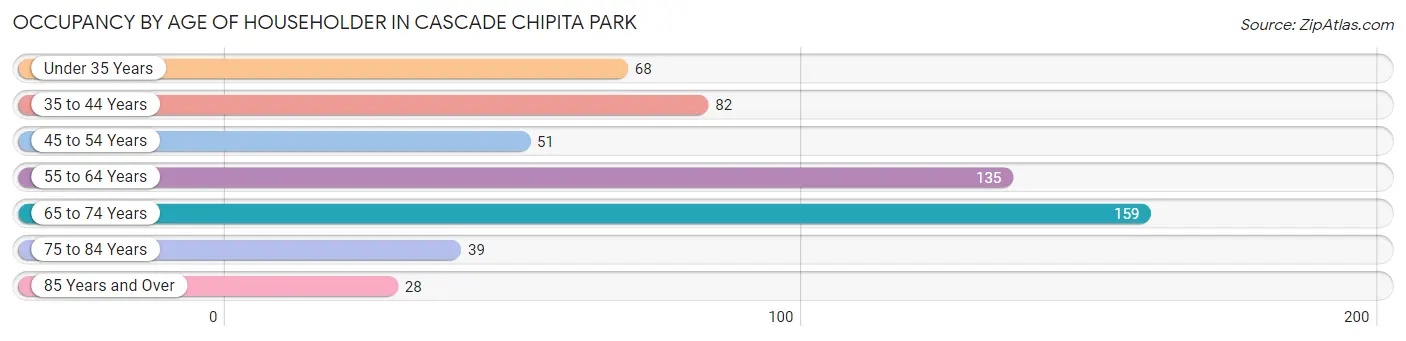
| Age Bracket | # Households | % Households |
| Under 35 Years | 68 | 12.1% |
| 35 to 44 Years | 82 | 14.6% |
| 45 to 54 Years | 51 | 9.1% |
| 55 to 64 Years | 135 | 24.0% |
| 65 to 74 Years | 159 | 28.3% |
| 75 to 84 Years | 39 | 6.9% |
| 85 Years and Over | 28 | 5.0% |
| Total | 562 | 100.0% |
Housing Finances in Cascade Chipita Park
Median Income by Occupancy in Cascade Chipita Park
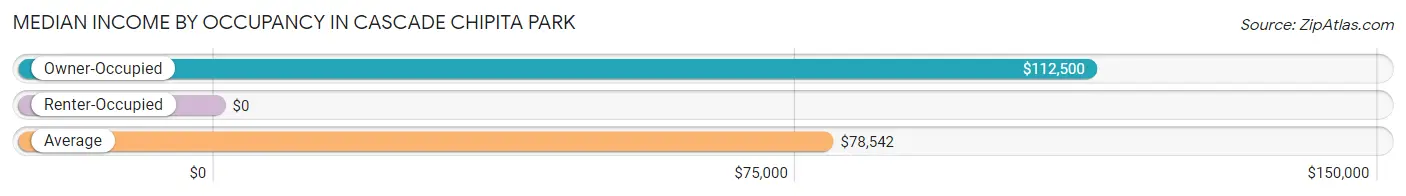
| Occupancy Type | # Households | Median Income |
| Owner-Occupied | 468 (83.3%) | $112,500 |
| Renter-Occupied | 94 (16.7%) | $0 |
| Average | 562 (100.0%) | $78,542 |
Occupancy by Householder Income Bracket in Cascade Chipita Park
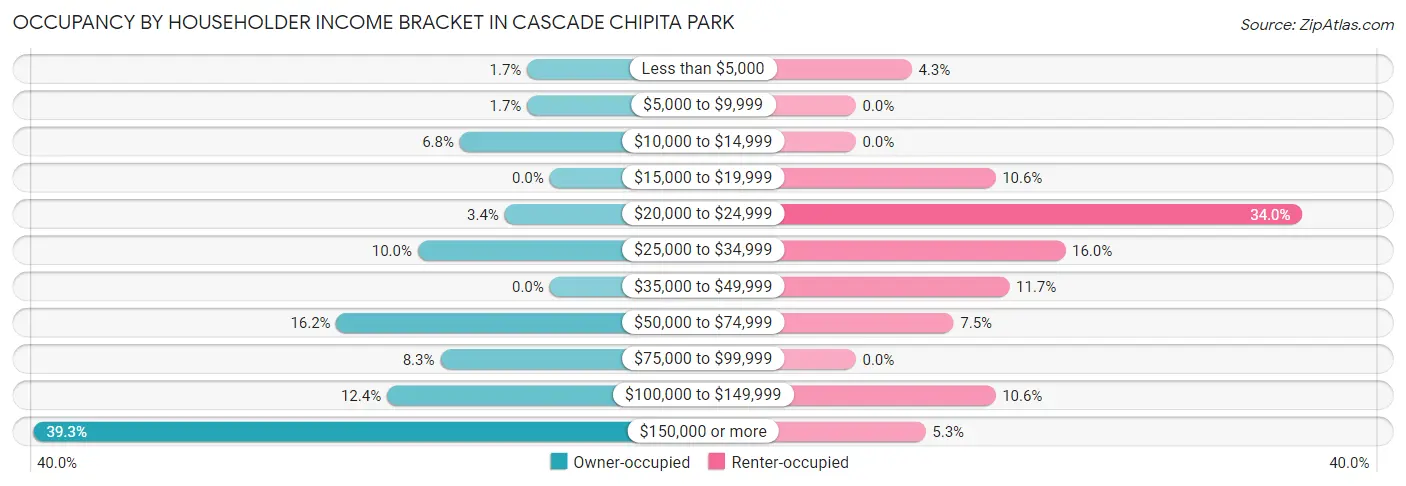
| Income Bracket | Owner-occupied | Renter-occupied |
| Less than $5,000 | 8 (1.7%) | 4 (4.3%) |
| $5,000 to $9,999 | 8 (1.7%) | 0 (0.0%) |
| $10,000 to $14,999 | 32 (6.8%) | 0 (0.0%) |
| $15,000 to $19,999 | 0 (0.0%) | 10 (10.6%) |
| $20,000 to $24,999 | 16 (3.4%) | 32 (34.0%) |
| $25,000 to $34,999 | 47 (10.0%) | 15 (16.0%) |
| $35,000 to $49,999 | 0 (0.0%) | 11 (11.7%) |
| $50,000 to $74,999 | 76 (16.2%) | 7 (7.4%) |
| $75,000 to $99,999 | 39 (8.3%) | 0 (0.0%) |
| $100,000 to $149,999 | 58 (12.4%) | 10 (10.6%) |
| $150,000 or more | 184 (39.3%) | 5 (5.3%) |
| Total | 468 (100.0%) | 94 (100.0%) |
Monthly Housing Cost Tiers in Cascade Chipita Park
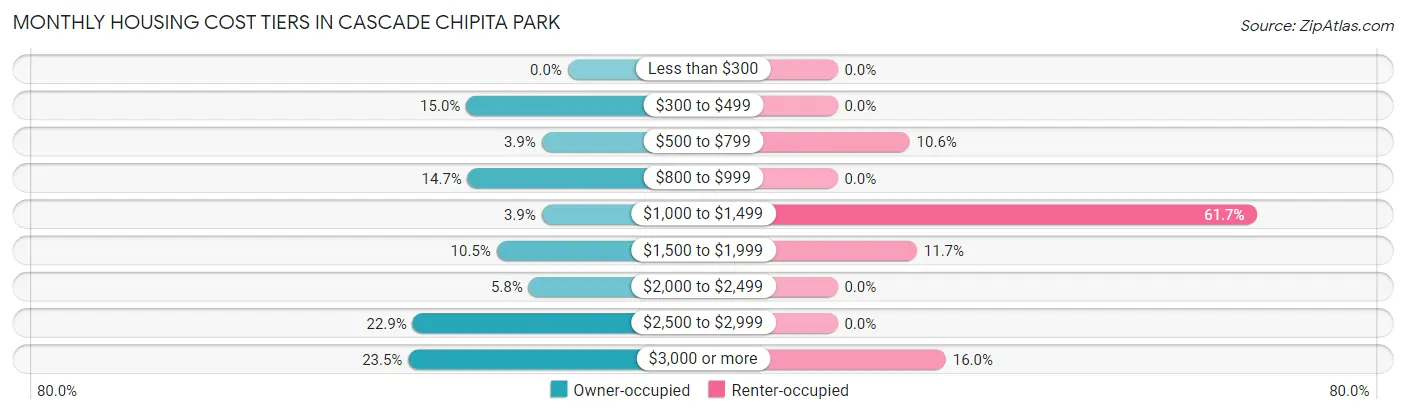
| Monthly Cost | Owner-occupied | Renter-occupied |
| Less than $300 | 0 (0.0%) | 0 (0.0%) |
| $300 to $499 | 70 (15.0%) | 0 (0.0%) |
| $500 to $799 | 18 (3.8%) | 10 (10.6%) |
| $800 to $999 | 69 (14.7%) | 0 (0.0%) |
| $1,000 to $1,499 | 18 (3.8%) | 58 (61.7%) |
| $1,500 to $1,999 | 49 (10.5%) | 11 (11.7%) |
| $2,000 to $2,499 | 27 (5.8%) | 0 (0.0%) |
| $2,500 to $2,999 | 107 (22.9%) | 0 (0.0%) |
| $3,000 or more | 110 (23.5%) | 15 (16.0%) |
| Total | 468 (100.0%) | 94 (100.0%) |
Physical Housing Characteristics in Cascade Chipita Park
Housing Structures in Cascade Chipita Park
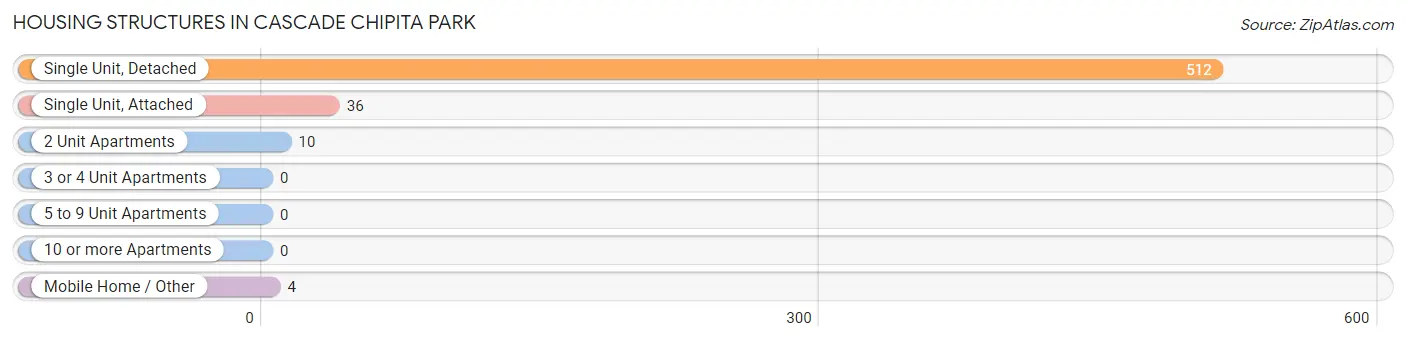
| Structure Type | # Housing Units | % Housing Units |
| Single Unit, Detached | 512 | 91.1% |
| Single Unit, Attached | 36 | 6.4% |
| 2 Unit Apartments | 10 | 1.8% |
| 3 or 4 Unit Apartments | 0 | 0.0% |
| 5 to 9 Unit Apartments | 0 | 0.0% |
| 10 or more Apartments | 0 | 0.0% |
| Mobile Home / Other | 4 | 0.7% |
| Total | 562 | 100.0% |
Housing Structures by Occupancy in Cascade Chipita Park
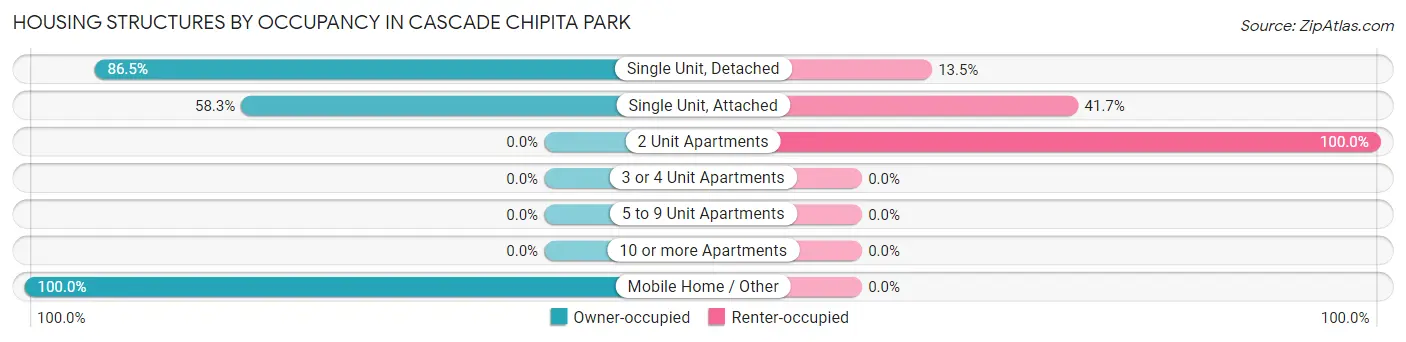
| Structure Type | Owner-occupied | Renter-occupied |
| Single Unit, Detached | 443 (86.5%) | 69 (13.5%) |
| Single Unit, Attached | 21 (58.3%) | 15 (41.7%) |
| 2 Unit Apartments | 0 (0.0%) | 10 (100.0%) |
| 3 or 4 Unit Apartments | 0 (0.0%) | 0 (0.0%) |
| 5 to 9 Unit Apartments | 0 (0.0%) | 0 (0.0%) |
| 10 or more Apartments | 0 (0.0%) | 0 (0.0%) |
| Mobile Home / Other | 4 (100.0%) | 0 (0.0%) |
| Total | 468 (83.3%) | 94 (16.7%) |
Housing Structures by Number of Rooms in Cascade Chipita Park
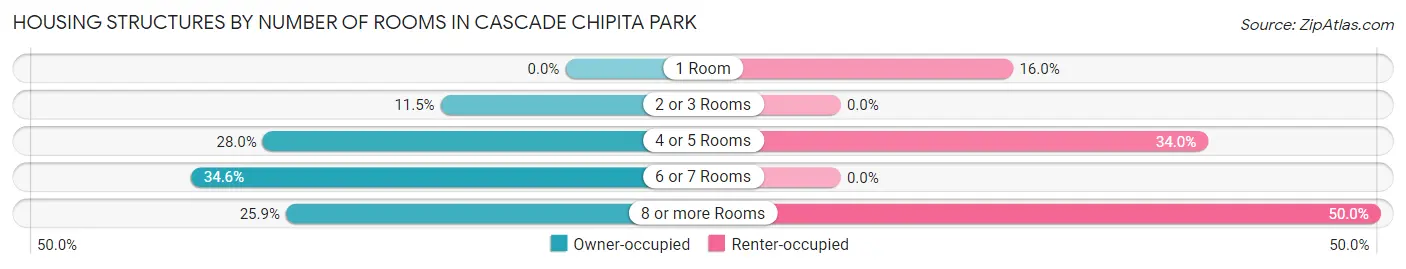
| Number of Rooms | Owner-occupied | Renter-occupied |
| 1 Room | 0 (0.0%) | 15 (16.0%) |
| 2 or 3 Rooms | 54 (11.5%) | 0 (0.0%) |
| 4 or 5 Rooms | 131 (28.0%) | 32 (34.0%) |
| 6 or 7 Rooms | 162 (34.6%) | 0 (0.0%) |
| 8 or more Rooms | 121 (25.9%) | 47 (50.0%) |
| Total | 468 (100.0%) | 94 (100.0%) |
Housing Structure by Heating Type in Cascade Chipita Park
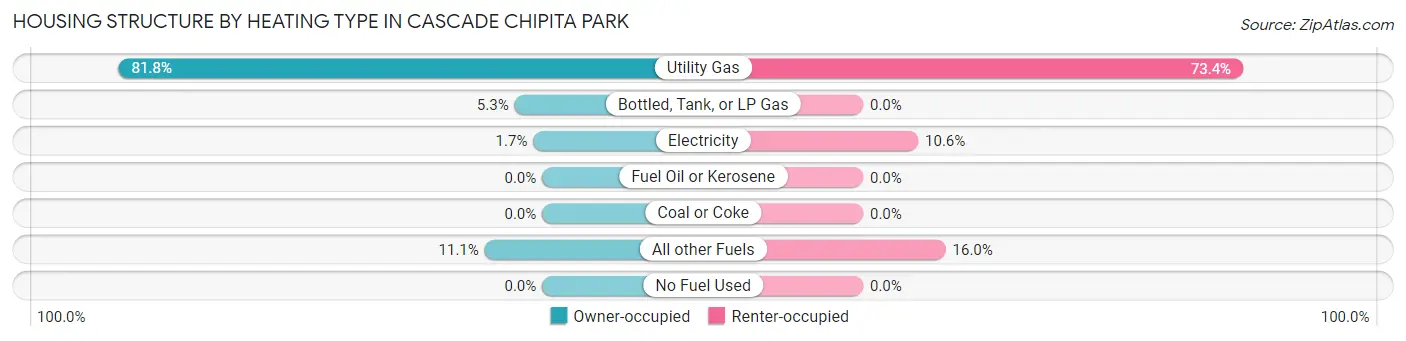
| Heating Type | Owner-occupied | Renter-occupied |
| Utility Gas | 383 (81.8%) | 69 (73.4%) |
| Bottled, Tank, or LP Gas | 25 (5.3%) | 0 (0.0%) |
| Electricity | 8 (1.7%) | 10 (10.6%) |
| Fuel Oil or Kerosene | 0 (0.0%) | 0 (0.0%) |
| Coal or Coke | 0 (0.0%) | 0 (0.0%) |
| All other Fuels | 52 (11.1%) | 15 (16.0%) |
| No Fuel Used | 0 (0.0%) | 0 (0.0%) |
| Total | 468 (100.0%) | 94 (100.0%) |
Household Vehicle Usage in Cascade Chipita Park
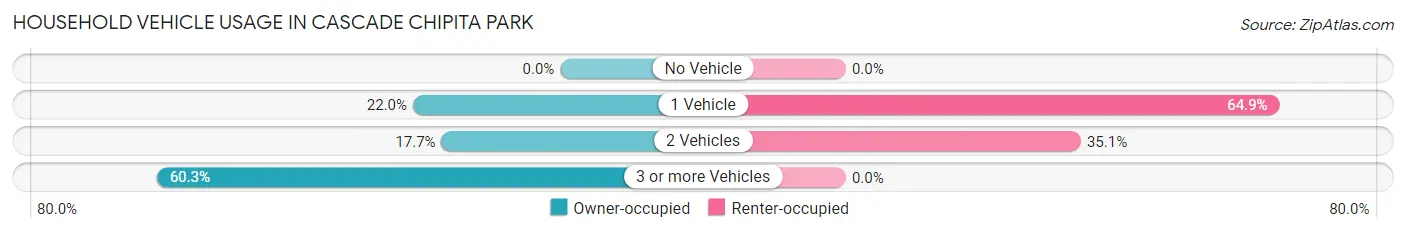
| Vehicles per Household | Owner-occupied | Renter-occupied |
| No Vehicle | 0 (0.0%) | 0 (0.0%) |
| 1 Vehicle | 103 (22.0%) | 61 (64.9%) |
| 2 Vehicles | 83 (17.7%) | 33 (35.1%) |
| 3 or more Vehicles | 282 (60.3%) | 0 (0.0%) |
| Total | 468 (100.0%) | 94 (100.0%) |
Real Estate & Mortgages in Cascade Chipita Park
Real Estate and Mortgage Overview in Cascade Chipita Park
| Characteristic | Without Mortgage | With Mortgage |
| Housing Units | 88 | 380 |
| Median Property Value | $246,800 | $479,100 |
| Median Household Income | $69,000 | $177 |
| Monthly Housing Costs | $433 | $110 |
| Real Estate Taxes | $1,839 | $24 |
Property Value by Mortgage Status in Cascade Chipita Park
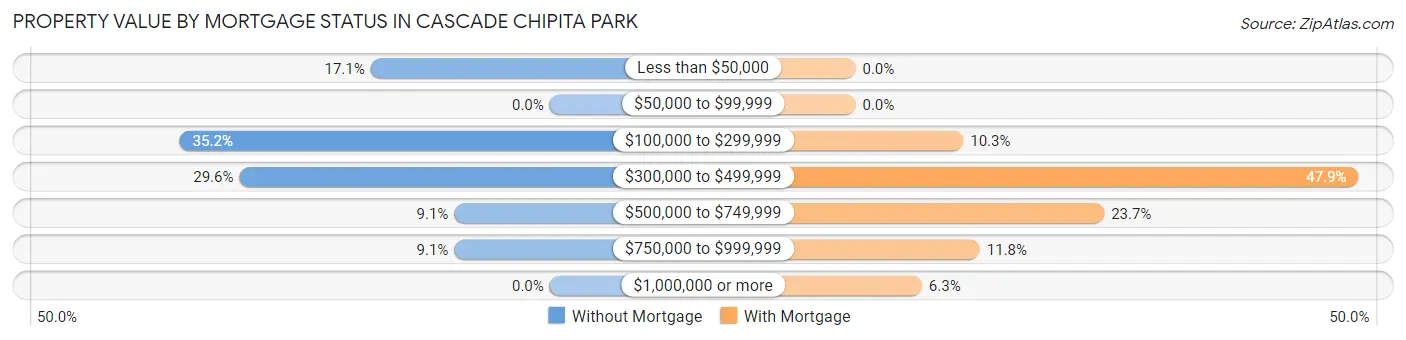
| Property Value | Without Mortgage | With Mortgage |
| Less than $50,000 | 15 (17.1%) | 0 (0.0%) |
| $50,000 to $99,999 | 0 (0.0%) | 0 (0.0%) |
| $100,000 to $299,999 | 31 (35.2%) | 39 (10.3%) |
| $300,000 to $499,999 | 26 (29.5%) | 182 (47.9%) |
| $500,000 to $749,999 | 8 (9.1%) | 90 (23.7%) |
| $750,000 to $999,999 | 8 (9.1%) | 45 (11.8%) |
| $1,000,000 or more | 0 (0.0%) | 24 (6.3%) |
| Total | 88 (100.0%) | 380 (100.0%) |
Household Income by Mortgage Status in Cascade Chipita Park
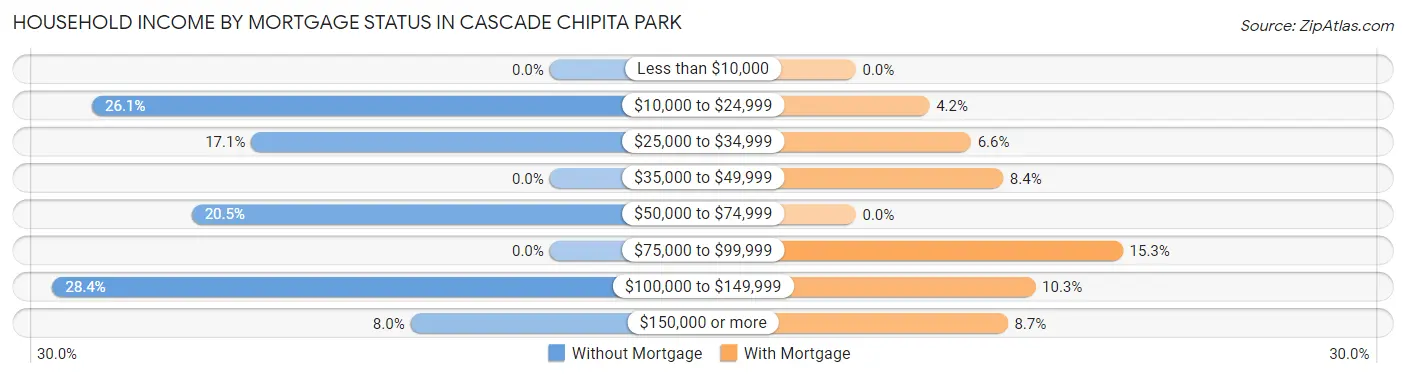
| Household Income | Without Mortgage | With Mortgage |
| Less than $10,000 | 0 (0.0%) | 0 (0.0%) |
| $10,000 to $24,999 | 23 (26.1%) | 16 (4.2%) |
| $25,000 to $34,999 | 15 (17.1%) | 25 (6.6%) |
| $35,000 to $49,999 | 0 (0.0%) | 32 (8.4%) |
| $50,000 to $74,999 | 18 (20.4%) | 0 (0.0%) |
| $75,000 to $99,999 | 0 (0.0%) | 58 (15.3%) |
| $100,000 to $149,999 | 25 (28.4%) | 39 (10.3%) |
| $150,000 or more | 7 (8.0%) | 33 (8.7%) |
| Total | 88 (100.0%) | 380 (100.0%) |
Property Value to Household Income Ratio in Cascade Chipita Park
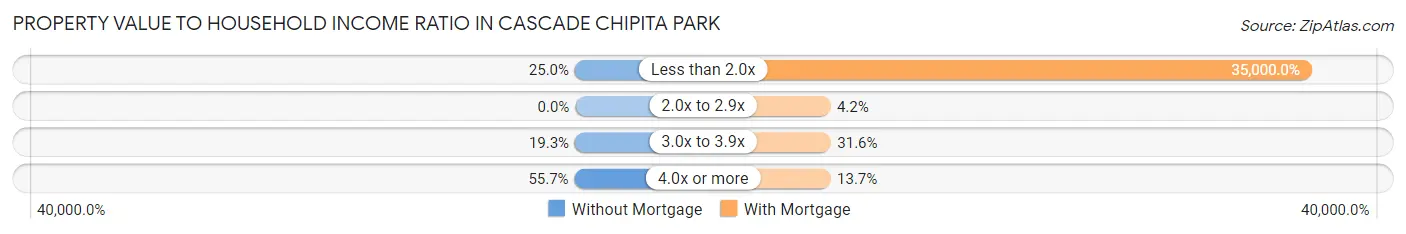
| Value-to-Income Ratio | Without Mortgage | With Mortgage |
| Less than 2.0x | 22 (25.0%) | 133,000 (35,000.0%) |
| 2.0x to 2.9x | 0 (0.0%) | 16 (4.2%) |
| 3.0x to 3.9x | 17 (19.3%) | 120 (31.6%) |
| 4.0x or more | 49 (55.7%) | 52 (13.7%) |
| Total | 88 (100.0%) | 380 (100.0%) |
Real Estate Taxes by Mortgage Status in Cascade Chipita Park
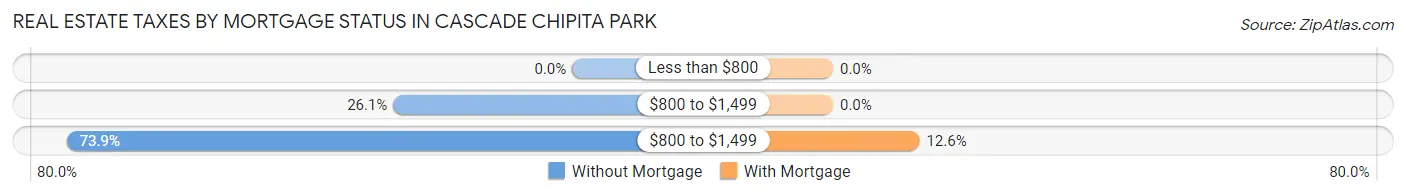
| Property Taxes | Without Mortgage | With Mortgage |
| Less than $800 | 0 (0.0%) | 0 (0.0%) |
| $800 to $1,499 | 23 (26.1%) | 0 (0.0%) |
| $800 to $1,499 | 65 (73.9%) | 48 (12.6%) |
| Total | 88 (100.0%) | 380 (100.0%) |
Health & Disability in Cascade Chipita Park
Health Insurance Coverage by Age in Cascade Chipita Park
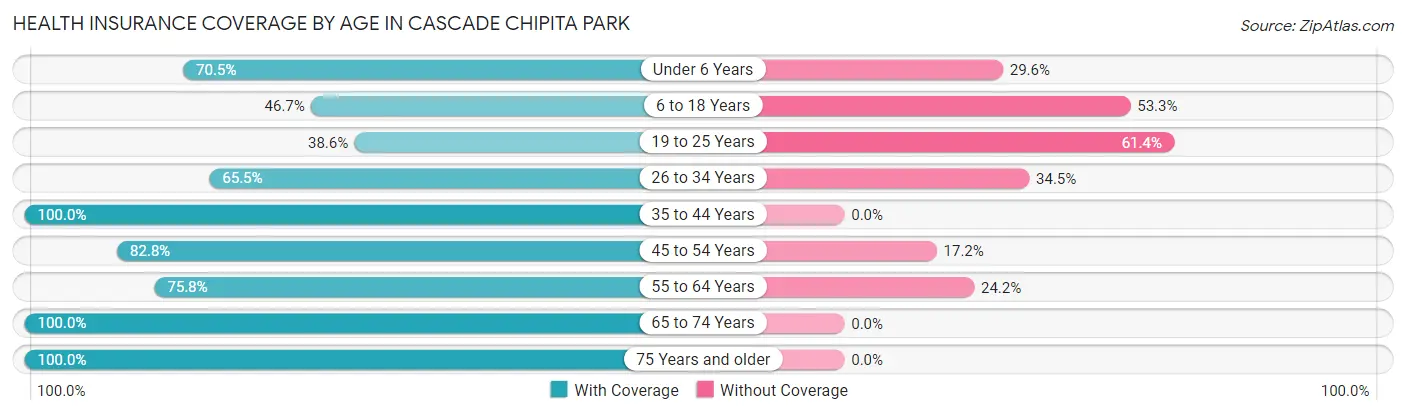
| Age Bracket | With Coverage | Without Coverage |
| Under 6 Years | 31 (70.5%) | 13 (29.5%) |
| 6 to 18 Years | 21 (46.7%) | 24 (53.3%) |
| 19 to 25 Years | 54 (38.6%) | 86 (61.4%) |
| 26 to 34 Years | 97 (65.5%) | 51 (34.5%) |
| 35 to 44 Years | 139 (100.0%) | 0 (0.0%) |
| 45 to 54 Years | 125 (82.8%) | 26 (17.2%) |
| 55 to 64 Years | 238 (75.8%) | 76 (24.2%) |
| 65 to 74 Years | 185 (100.0%) | 0 (0.0%) |
| 75 Years and older | 117 (100.0%) | 0 (0.0%) |
| Total | 1,007 (78.5%) | 276 (21.5%) |
Health Insurance Coverage by Citizenship Status in Cascade Chipita Park
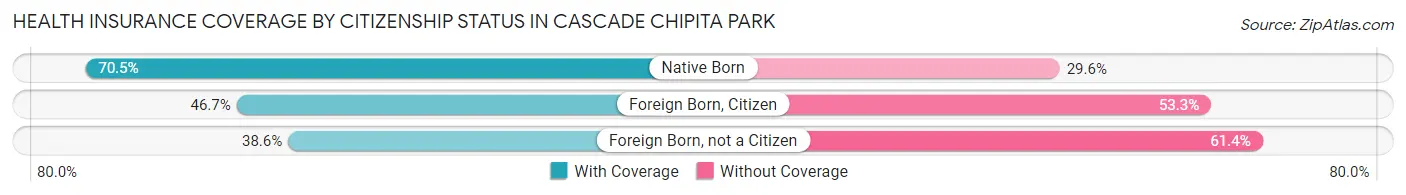
| Citizenship Status | With Coverage | Without Coverage |
| Native Born | 31 (70.5%) | 13 (29.5%) |
| Foreign Born, Citizen | 21 (46.7%) | 24 (53.3%) |
| Foreign Born, not a Citizen | 54 (38.6%) | 86 (61.4%) |
Health Insurance Coverage by Household Income in Cascade Chipita Park
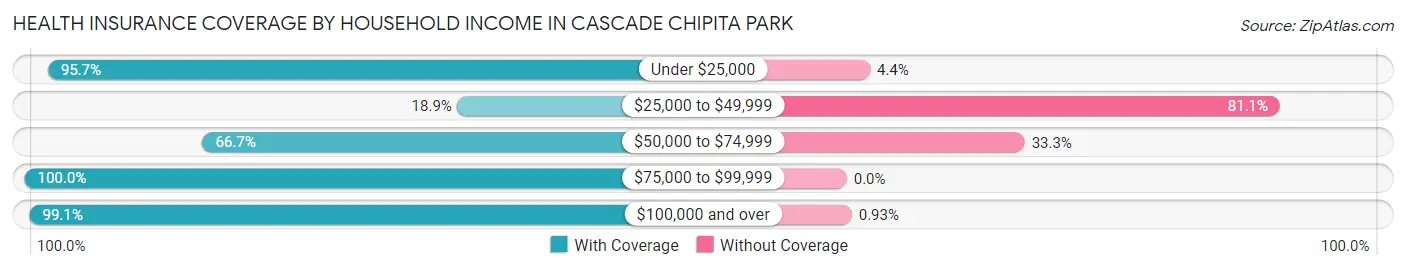
| Household Income | With Coverage | Without Coverage |
| Under $25,000 | 110 (95.7%) | 5 (4.3%) |
| $25,000 to $49,999 | 40 (18.9%) | 172 (81.1%) |
| $50,000 to $74,999 | 134 (66.7%) | 67 (33.3%) |
| $75,000 to $99,999 | 80 (100.0%) | 0 (0.0%) |
| $100,000 and over | 641 (99.1%) | 6 (0.9%) |
Public vs Private Health Insurance Coverage by Age in Cascade Chipita Park
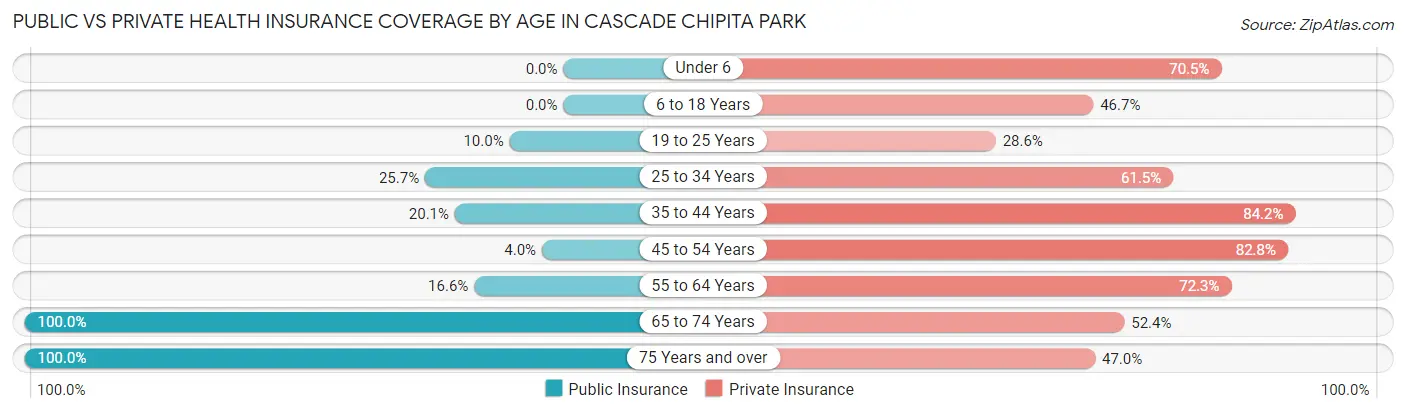
| Age Bracket | Public Insurance | Private Insurance |
| Under 6 | 0 (0.0%) | 31 (70.5%) |
| 6 to 18 Years | 0 (0.0%) | 21 (46.7%) |
| 19 to 25 Years | 14 (10.0%) | 40 (28.6%) |
| 25 to 34 Years | 38 (25.7%) | 91 (61.5%) |
| 35 to 44 Years | 28 (20.1%) | 117 (84.2%) |
| 45 to 54 Years | 6 (4.0%) | 125 (82.8%) |
| 55 to 64 Years | 52 (16.6%) | 227 (72.3%) |
| 65 to 74 Years | 185 (100.0%) | 97 (52.4%) |
| 75 Years and over | 117 (100.0%) | 55 (47.0%) |
| Total | 440 (34.3%) | 804 (62.7%) |
Disability Status by Sex by Age in Cascade Chipita Park
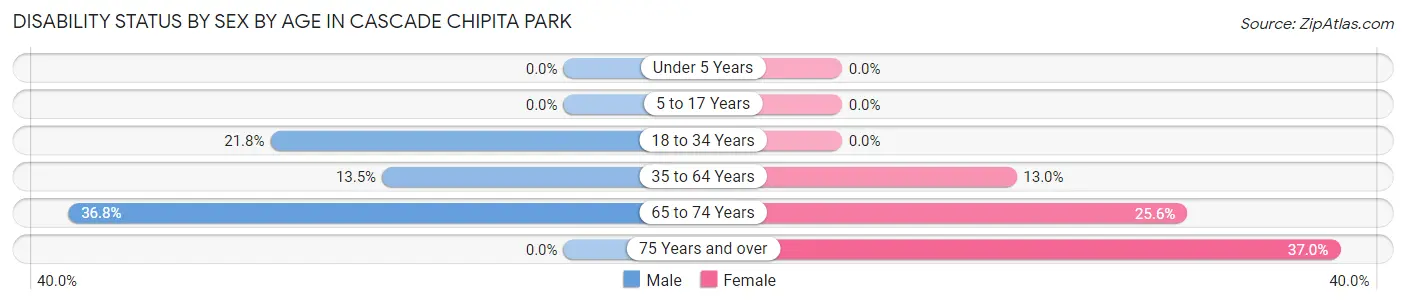
| Age Bracket | Male | Female |
| Under 5 Years | 0 (0.0%) | 0 (0.0%) |
| 5 to 17 Years | 0 (0.0%) | 0 (0.0%) |
| 18 to 34 Years | 47 (21.8%) | 0 (0.0%) |
| 35 to 64 Years | 45 (13.5%) | 35 (13.0%) |
| 65 to 74 Years | 25 (36.8%) | 30 (25.6%) |
| 75 Years and over | 0 (0.0%) | 27 (37.0%) |
Disability Class by Sex by Age in Cascade Chipita Park
Disability Class: Hearing Difficulty
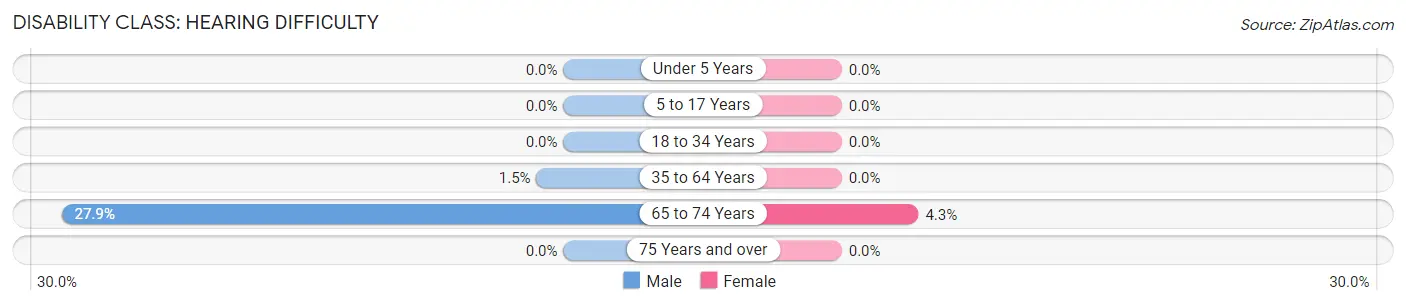
| Age Bracket | Male | Female |
| Under 5 Years | 0 (0.0%) | 0 (0.0%) |
| 5 to 17 Years | 0 (0.0%) | 0 (0.0%) |
| 18 to 34 Years | 0 (0.0%) | 0 (0.0%) |
| 35 to 64 Years | 5 (1.5%) | 0 (0.0%) |
| 65 to 74 Years | 19 (27.9%) | 5 (4.3%) |
| 75 Years and over | 0 (0.0%) | 0 (0.0%) |
Disability Class: Vision Difficulty
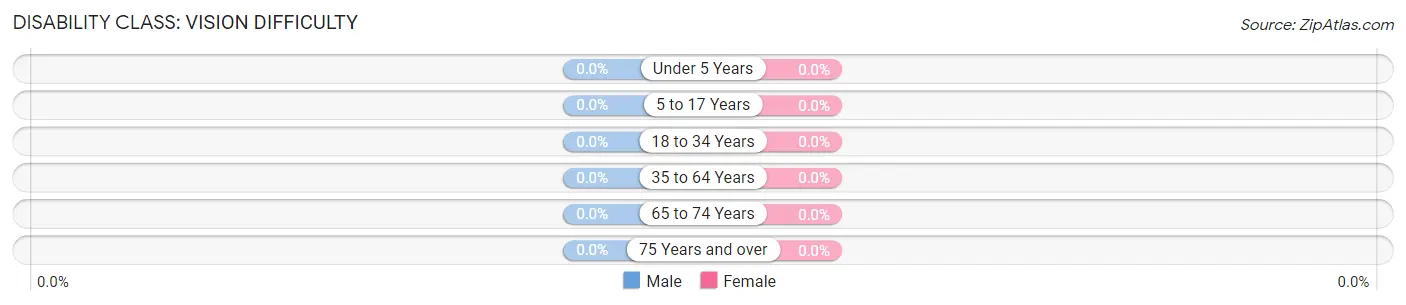
| Age Bracket | Male | Female |
| Under 5 Years | 0 (0.0%) | 0 (0.0%) |
| 5 to 17 Years | 0 (0.0%) | 0 (0.0%) |
| 18 to 34 Years | 0 (0.0%) | 0 (0.0%) |
| 35 to 64 Years | 0 (0.0%) | 0 (0.0%) |
| 65 to 74 Years | 0 (0.0%) | 0 (0.0%) |
| 75 Years and over | 0 (0.0%) | 0 (0.0%) |
Disability Class: Cognitive Difficulty
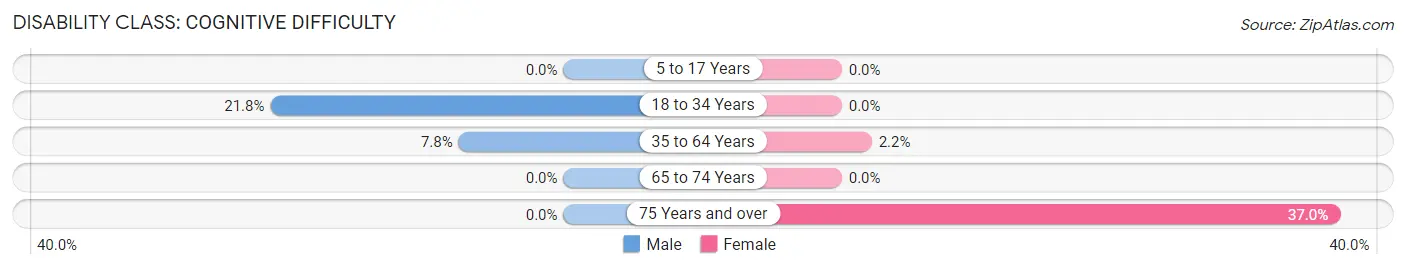
| Age Bracket | Male | Female |
| 5 to 17 Years | 0 (0.0%) | 0 (0.0%) |
| 18 to 34 Years | 47 (21.8%) | 0 (0.0%) |
| 35 to 64 Years | 26 (7.8%) | 6 (2.2%) |
| 65 to 74 Years | 0 (0.0%) | 0 (0.0%) |
| 75 Years and over | 0 (0.0%) | 27 (37.0%) |
Disability Class: Ambulatory Difficulty
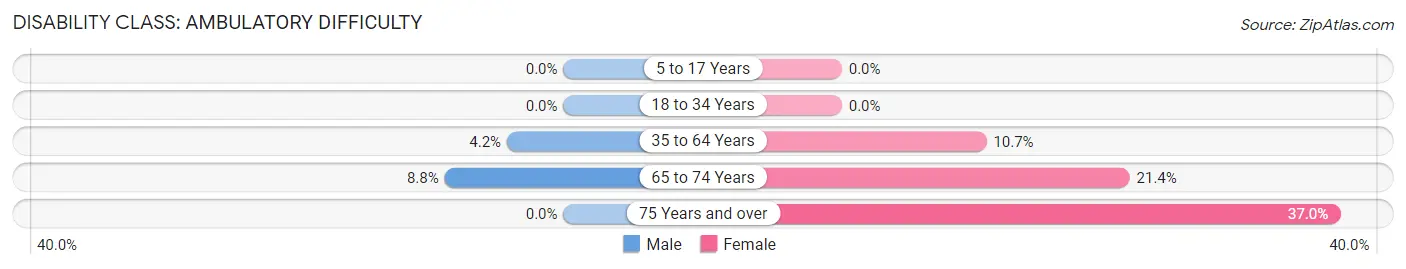
| Age Bracket | Male | Female |
| 5 to 17 Years | 0 (0.0%) | 0 (0.0%) |
| 18 to 34 Years | 0 (0.0%) | 0 (0.0%) |
| 35 to 64 Years | 14 (4.2%) | 29 (10.7%) |
| 65 to 74 Years | 6 (8.8%) | 25 (21.4%) |
| 75 Years and over | 0 (0.0%) | 27 (37.0%) |
Disability Class: Self-Care Difficulty
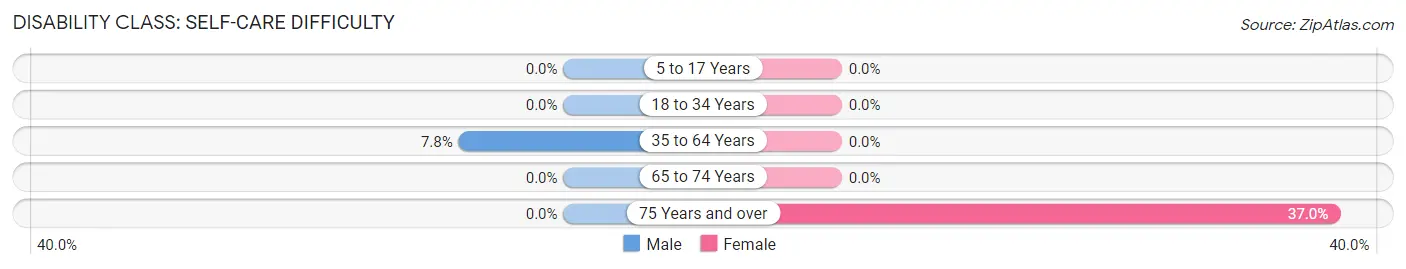
| Age Bracket | Male | Female |
| 5 to 17 Years | 0 (0.0%) | 0 (0.0%) |
| 18 to 34 Years | 0 (0.0%) | 0 (0.0%) |
| 35 to 64 Years | 26 (7.8%) | 0 (0.0%) |
| 65 to 74 Years | 0 (0.0%) | 0 (0.0%) |
| 75 Years and over | 0 (0.0%) | 27 (37.0%) |
Technology Access in Cascade Chipita Park
Computing Device Access in Cascade Chipita Park
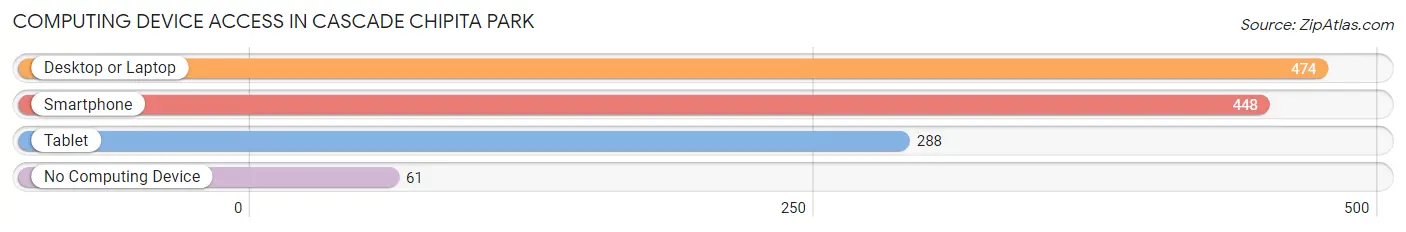
| Device Type | # Households | % Households |
| Desktop or Laptop | 474 | 84.3% |
| Smartphone | 448 | 79.7% |
| Tablet | 288 | 51.2% |
| No Computing Device | 61 | 10.8% |
| Total | 562 | 100.0% |
Internet Access in Cascade Chipita Park
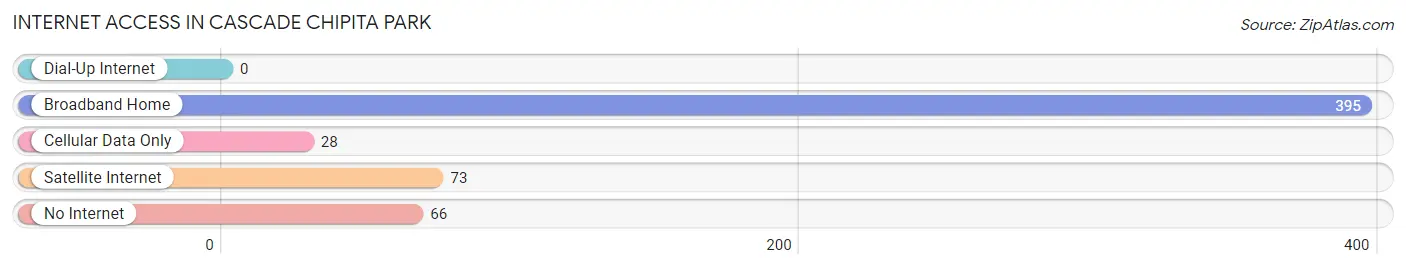
| Internet Type | # Households | % Households |
| Dial-Up Internet | 0 | 0.0% |
| Broadband Home | 395 | 70.3% |
| Cellular Data Only | 28 | 5.0% |
| Satellite Internet | 73 | 13.0% |
| No Internet | 66 | 11.7% |
| Total | 562 | 100.0% |
Cascade Chipita Park Summary
Chipita Park is a small unincorporated community located in El Paso County, Colorado, United States. It is situated in the foothills of the Rocky Mountains, approximately 10 miles west of Colorado Springs. The community is located along U.S. Highway 24, and is bordered by the towns of Cascade and Green Mountain Falls.
History
Chipita Park was founded in 1876 by a group of settlers from the nearby town of Cascade. The settlers were looking for a place to build a new community, and they chose the area around Chipita Park because of its beautiful scenery and abundant natural resources. The town was named after Chipita, a Native American woman who lived in the area.
The town quickly grew, and by the early 1900s it had become a popular tourist destination. The town was known for its natural beauty, and it was a popular spot for fishing, hunting, and camping. In the 1920s, the town was home to a number of resorts, including the Chipita Park Hotel and the Cascade Hotel.
Geography
Chipita Park is located in the foothills of the Rocky Mountains, approximately 10 miles west of Colorado Springs. The town is situated at an elevation of 7,000 feet, and is surrounded by the Pike National Forest. The town is located along U.S. Highway 24, and is bordered by the towns of Cascade and Green Mountain Falls.
The town is located in a mountainous region, and is home to a number of natural attractions, including the Chipita Park Reservoir, the Chipita Park Falls, and the Chipita Park Trail. The town is also home to a number of historic sites, including the Chipita Park Cemetery and the Chipita Park Schoolhouse.
Economy
The economy of Chipita Park is largely based on tourism. The town is home to a number of resorts, including the Chipita Park Hotel and the Cascade Hotel. The town is also home to a number of restaurants, shops, and other businesses.
The town is also home to a number of outdoor recreation activities, including fishing, hunting, and camping. The town is also home to a number of historic sites, including the Chipita Park Cemetery and the Chipita Park Schoolhouse.
Demographics
As of the 2010 census, the population of Chipita Park was 1,072. The racial makeup of the town was 97.3% White, 0.7% African American, 0.3% Native American, 0.2% Asian, 0.1% Pacific Islander, 0.7% from other races, and 0.9% from two or more races. Hispanic or Latino of any race were 3.2% of the population.
The median household income in Chipita Park was $50,000, and the median family income was $54,000. The per capita income in Chipita Park was $25,000. About 8.3% of families and 10.2% of the population were below the poverty line, including 14.3% of those under age 18 and none of those age 65 or over.
Common Questions
What is Per Capita Income in Cascade Chipita Park?
Per Capita income in Cascade Chipita Park is $56,612.
What is the Median Family Income in Cascade Chipita Park?
Median Family Income in Cascade Chipita Park is $109,250.
What is the Median Household income in Cascade Chipita Park?
Median Household Income in Cascade Chipita Park is $78,542.
What is Income or Wage Gap in Cascade Chipita Park?
Income or Wage Gap in Cascade Chipita Park is 45.0%.
Women in Cascade Chipita Park earn 55.0 cents for every dollar earned by a man.
What is Inequality or Gini Index in Cascade Chipita Park?
Inequality or Gini Index in Cascade Chipita Park is 0.50.
What is the Total Population of Cascade Chipita Park?
Total Population of Cascade Chipita Park is 1,302.
What is the Total Male Population of Cascade Chipita Park?
Total Male Population of Cascade Chipita Park is 730.
What is the Total Female Population of Cascade Chipita Park?
Total Female Population of Cascade Chipita Park is 572.
What is the Ratio of Males per 100 Females in Cascade Chipita Park?
There are 127.62 Males per 100 Females in Cascade Chipita Park.
What is the Ratio of Females per 100 Males in Cascade Chipita Park?
There are 78.36 Females per 100 Males in Cascade Chipita Park.
What is the Median Population Age in Cascade Chipita Park?
Median Population Age in Cascade Chipita Park is 52.7 Years.
What is the Average Family Size in Cascade Chipita Park
Average Family Size in Cascade Chipita Park is 2.7 People.
What is the Average Household Size in Cascade Chipita Park
Average Household Size in Cascade Chipita Park is 2.2 People.
How Large is the Labor Force in Cascade Chipita Park?
There are 648 People in the Labor Forcein in Cascade Chipita Park.
What is the Percentage of People in the Labor Force in Cascade Chipita Park?
53.3% of People are in the Labor Force in Cascade Chipita Park.
What is the Unemployment Rate in Cascade Chipita Park?
Unemployment Rate in Cascade Chipita Park is 18.2%.