Winter Park, CO Map & Demographics
Winter Park Map
Winter Park Overview
$66,619
PER CAPITA INCOME
$138,500
AVG FAMILY INCOME
$80,000
AVG HOUSEHOLD INCOME
2.3%
WAGE / INCOME GAP [ % ]
97.7¢/ $1
WAGE / INCOME GAP [ $ ]
0.53
INEQUALITY / GINI INDEX
762
TOTAL POPULATION
497
MALE POPULATION
265
FEMALE POPULATION
187.55
MALES / 100 FEMALES
53.32
FEMALES / 100 MALES
46.3
MEDIAN AGE
2.7
AVG FAMILY SIZE
2.1
AVG HOUSEHOLD SIZE
490
LABOR FORCE [ PEOPLE ]
66.4%
PERCENT IN LABOR FORCE
6.5%
UNEMPLOYMENT RATE
Winter Park Zip Codes
Winter Park Area Codes
Income in Winter Park
Income Overview in Winter Park
Per Capita Income in Winter Park is $66,619, while median incomes of families and households are $138,500 and $80,000 respectively.
| Characteristic | Number | Measure |
| Per Capita Income | 762 | $66,619 |
| Median Family Income | 200 | $138,500 |
| Mean Family Income | 200 | $193,493 |
| Median Household Income | 360 | $80,000 |
| Mean Household Income | 360 | $129,056 |
| Income Deficit | 200 | $0 |
| Wage / Income Gap (%) | 762 | 2.31% |
| Wage / Income Gap ($) | 762 | 97.69¢ per $1 |
| Gini / Inequality Index | 762 | 0.53 |
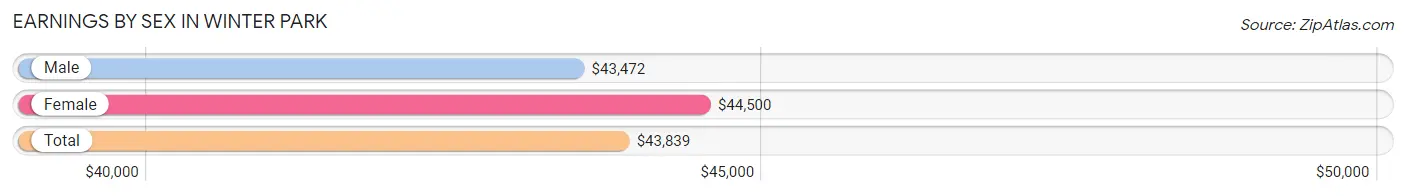
Earnings by Sex in Winter Park
Average Earnings in Winter Park are $43,839, $43,472 for men and $44,500 for women, a difference of 2.3%.
| Sex | Number | Average Earnings |
| Male | 301 (62.6%) | $43,472 |
| Female | 180 (37.4%) | $44,500 |
| Total | 481 (100.0%) | $43,839 |
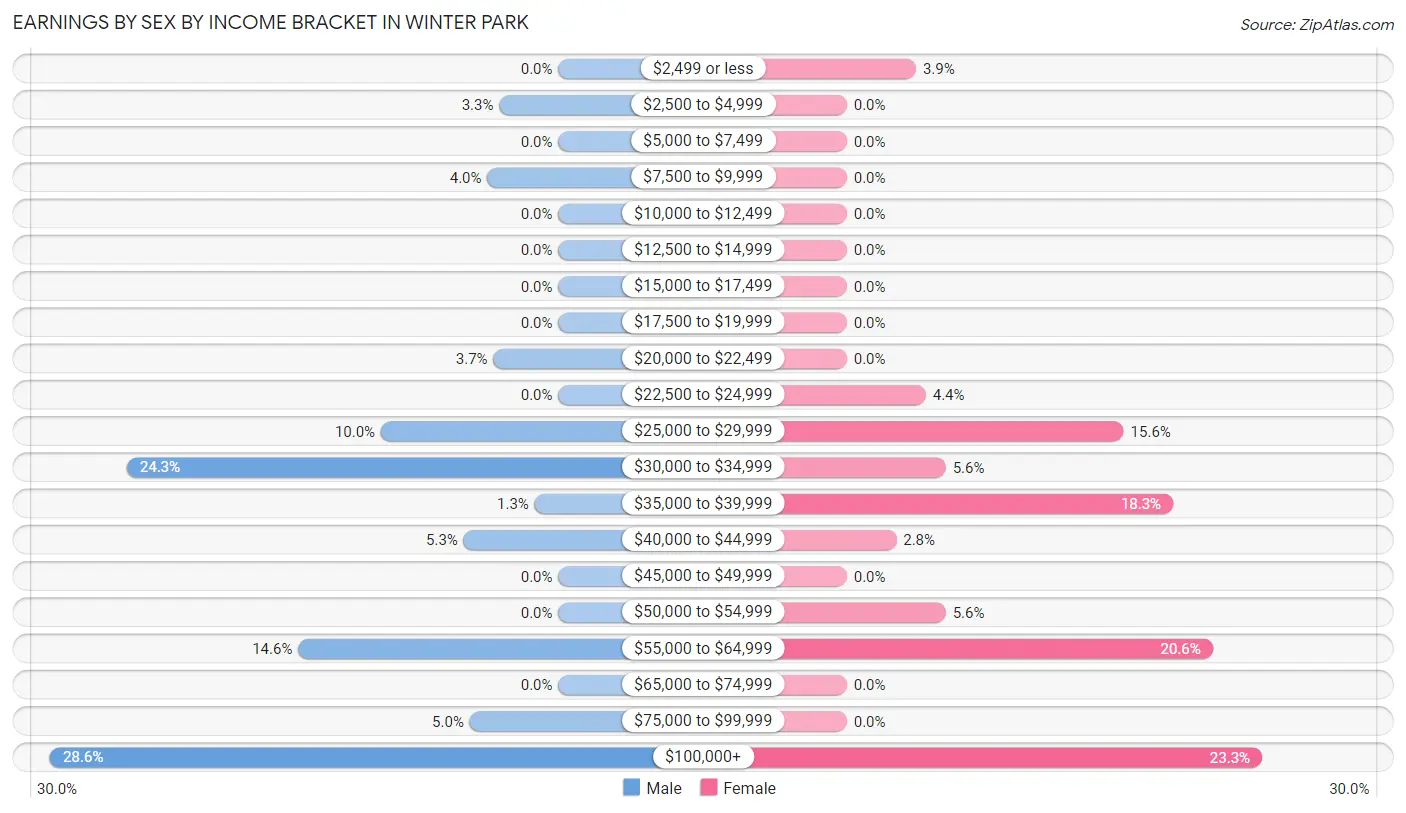
Earnings by Sex by Income Bracket in Winter Park
The most common earnings brackets in Winter Park are $100,000+ for men (86 | 28.6%) and $100,000+ for women (42 | 23.3%).
| Income | Male | Female |
| $2,499 or less | 0 (0.0%) | 7 (3.9%) |
| $2,500 to $4,999 | 10 (3.3%) | 0 (0.0%) |
| $5,000 to $7,499 | 0 (0.0%) | 0 (0.0%) |
| $7,500 to $9,999 | 12 (4.0%) | 0 (0.0%) |
| $10,000 to $12,499 | 0 (0.0%) | 0 (0.0%) |
| $12,500 to $14,999 | 0 (0.0%) | 0 (0.0%) |
| $15,000 to $17,499 | 0 (0.0%) | 0 (0.0%) |
| $17,500 to $19,999 | 0 (0.0%) | 0 (0.0%) |
| $20,000 to $22,499 | 11 (3.6%) | 0 (0.0%) |
| $22,500 to $24,999 | 0 (0.0%) | 8 (4.4%) |
| $25,000 to $29,999 | 30 (10.0%) | 28 (15.6%) |
| $30,000 to $34,999 | 73 (24.2%) | 10 (5.6%) |
| $35,000 to $39,999 | 4 (1.3%) | 33 (18.3%) |
| $40,000 to $44,999 | 16 (5.3%) | 5 (2.8%) |
| $45,000 to $49,999 | 0 (0.0%) | 0 (0.0%) |
| $50,000 to $54,999 | 0 (0.0%) | 10 (5.6%) |
| $55,000 to $64,999 | 44 (14.6%) | 37 (20.6%) |
| $65,000 to $74,999 | 0 (0.0%) | 0 (0.0%) |
| $75,000 to $99,999 | 15 (5.0%) | 0 (0.0%) |
| $100,000+ | 86 (28.6%) | 42 (23.3%) |
| Total | 301 (100.0%) | 180 (100.0%) |
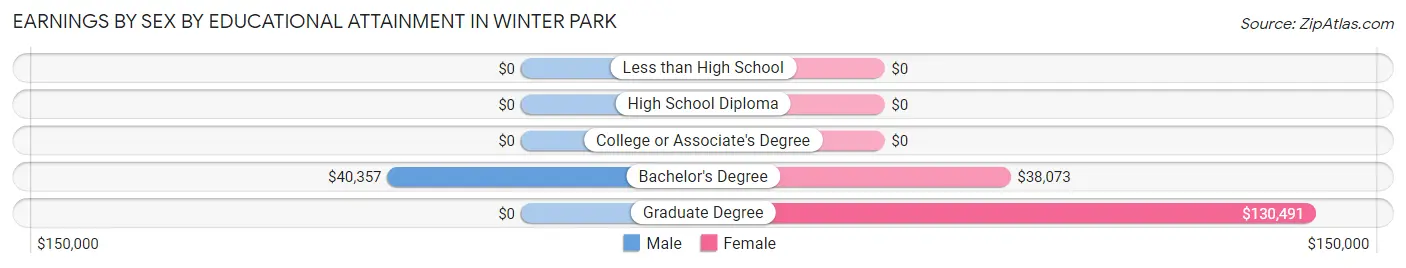
Earnings by Sex by Educational Attainment in Winter Park
Average earnings in Winter Park are $44,861 for men and $50,625 for women, a difference of 11.4%. Men with an educational attainment of bachelor's degree enjoy the highest average annual earnings of $40,357, while those with bachelor's degree education earn the least with $40,357. Women with an educational attainment of graduate degree earn the most with the average annual earnings of $130,491, while those with bachelor's degree education have the smallest earnings of $38,073.
| Educational Attainment | Male Income | Female Income |
| Less than High School | - | - |
| High School Diploma | - | - |
| College or Associate's Degree | - | - |
| Bachelor's Degree | $40,357 | $38,073 |
| Graduate Degree | - | - |
| Total | $44,861 | $50,625 |
Family Income in Winter Park
Family Income Brackets in Winter Park
According to the Winter Park family income data, there are 60 families falling into the $200,000+ income range, which is the most common income bracket and makes up 30.0% of all families.
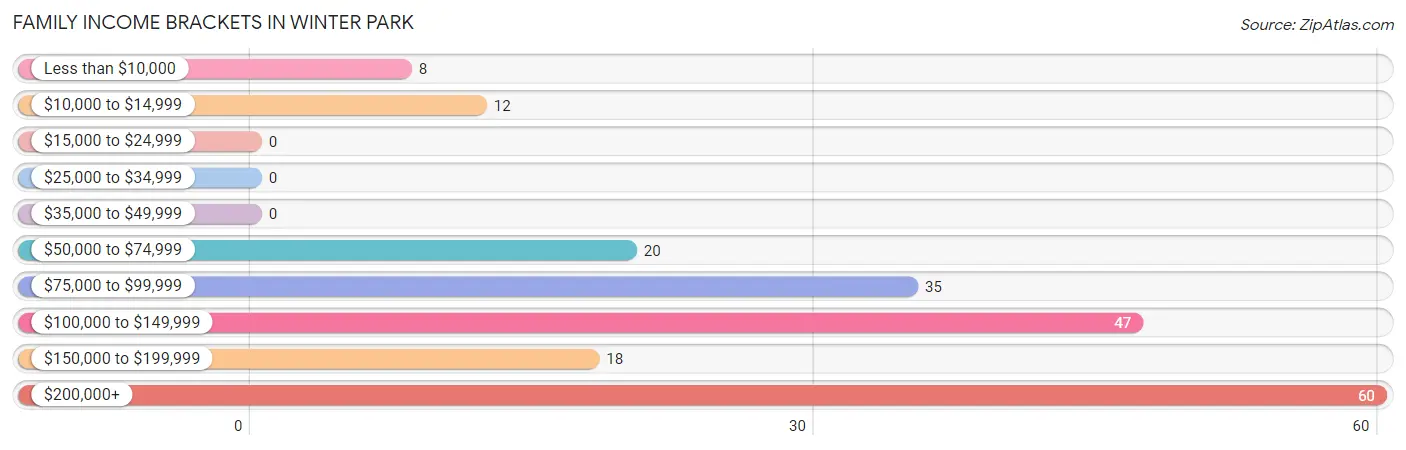
| Income Bracket | # Families | % Families |
| Less than $10,000 | 8 | 4.0% |
| $10,000 to $14,999 | 12 | 6.0% |
| $15,000 to $24,999 | 0 | 0.0% |
| $25,000 to $34,999 | 0 | 0.0% |
| $35,000 to $49,999 | 0 | 0.0% |
| $50,000 to $74,999 | 20 | 10.0% |
| $75,000 to $99,999 | 35 | 17.5% |
| $100,000 to $149,999 | 47 | 23.5% |
| $150,000 to $199,999 | 18 | 9.0% |
| $200,000+ | 60 | 30.0% |
Family Income by Famaliy Size in Winter Park
2-person families (144 | 72.0%) account for the highest median family income in Winter Park with $138,750 per family, while 2-person families (144 | 72.0%) have the highest median income of $69,375 per family member.
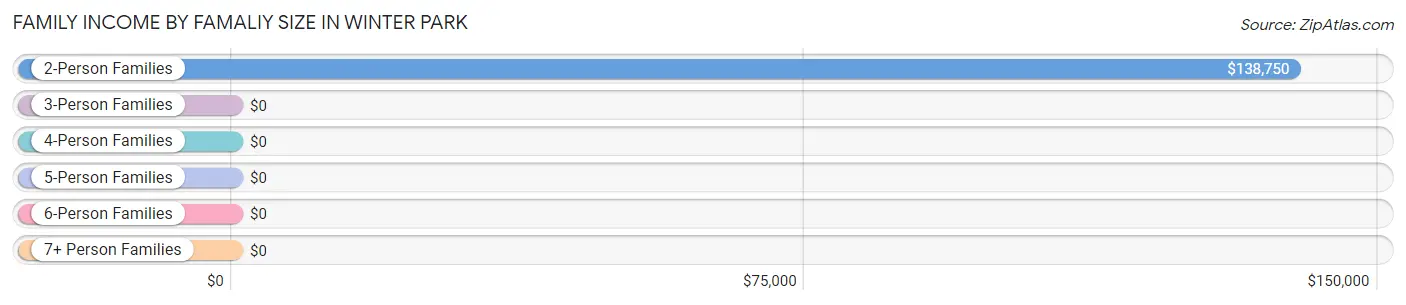
| Income Bracket | # Families | Median Income |
| 2-Person Families | 144 (72.0%) | $138,750 |
| 3-Person Families | 48 (24.0%) | $0 |
| 4-Person Families | 8 (4.0%) | $0 |
| 5-Person Families | 0 (0.0%) | $0 |
| 6-Person Families | 0 (0.0%) | $0 |
| 7+ Person Families | 0 (0.0%) | $0 |
| Total | 200 (100.0%) | $138,500 |
Family Income by Number of Earners in Winter Park
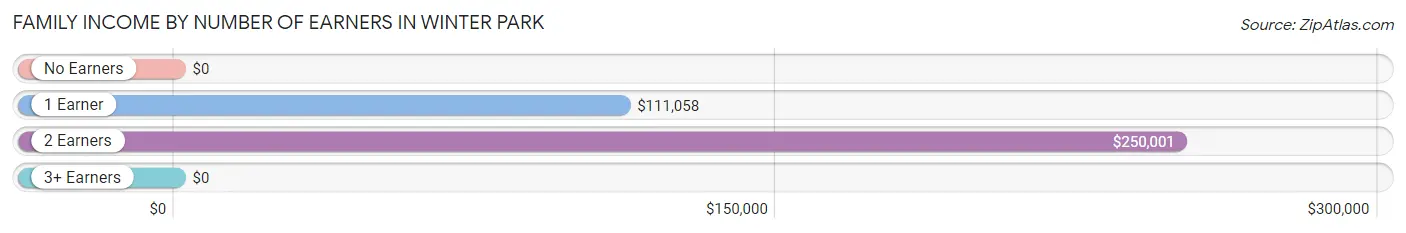
| Number of Earners | # Families | Median Income |
| No Earners | 8 (4.0%) | $0 |
| 1 Earner | 75 (37.5%) | $111,058 |
| 2 Earners | 117 (58.5%) | $250,001 |
| 3+ Earners | 0 (0.0%) | $0 |
| Total | 200 (100.0%) | $138,500 |
Household Income in Winter Park
Household Income Brackets in Winter Park
With 69 households falling in the category, the $50,000 to $74,999 income range is the most frequent in Winter Park, accounting for 19.2% of all households. In contrast, only 8 households (2.2%) fall into the less than $10,000 income bracket, making it the least populous group.
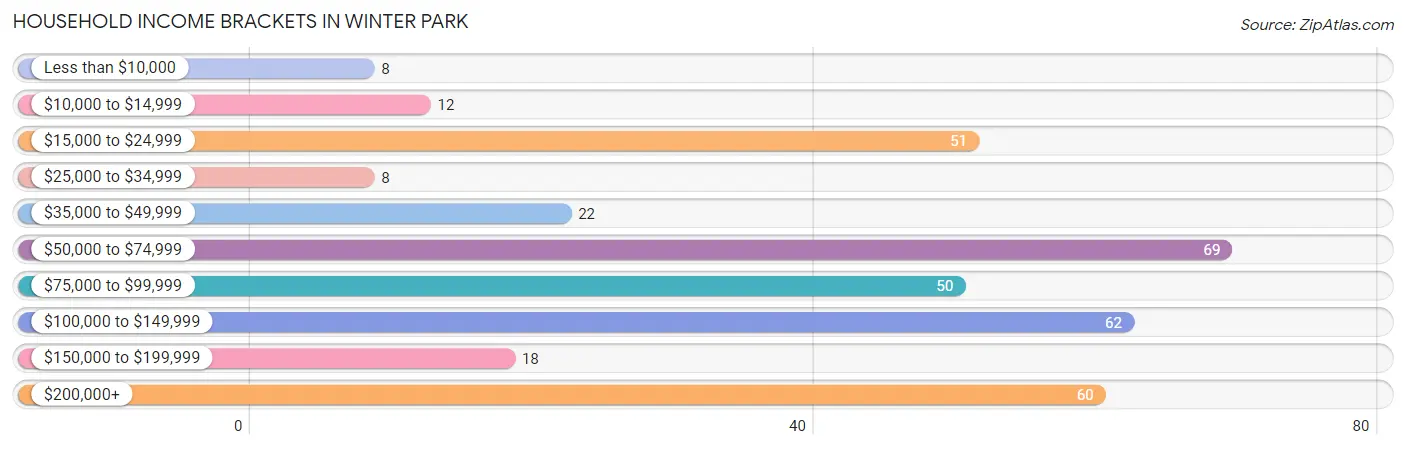
| Income Bracket | # Households | % Households |
| Less than $10,000 | 8 | 2.2% |
| $10,000 to $14,999 | 12 | 3.3% |
| $15,000 to $24,999 | 51 | 14.2% |
| $25,000 to $34,999 | 8 | 2.2% |
| $35,000 to $49,999 | 22 | 6.1% |
| $50,000 to $74,999 | 69 | 19.2% |
| $75,000 to $99,999 | 50 | 13.9% |
| $100,000 to $149,999 | 62 | 17.2% |
| $150,000 to $199,999 | 18 | 5.0% |
| $200,000+ | 60 | 16.7% |
Household Income by Householder Age in Winter Park
The median household income in Winter Park is $80,000, with the highest median household income of $139,167 found in the 45 to 64 years age bracket for the primary householder. A total of 176 households (48.9%) fall into this category.
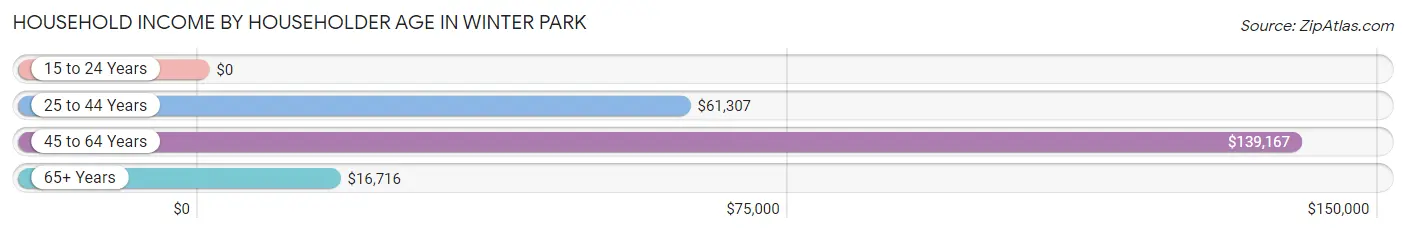
| Income Bracket | # Households | Median Income |
| 15 to 24 Years | 0 (0.0%) | $0 |
| 25 to 44 Years | 114 (31.7%) | $61,307 |
| 45 to 64 Years | 176 (48.9%) | $139,167 |
| 65+ Years | 70 (19.4%) | $16,716 |
| Total | 360 (100.0%) | $80,000 |
Poverty in Winter Park
Income Below Poverty by Sex and Age in Winter Park
With 4.0% poverty level for males and 4.9% for females among the residents of Winter Park, 55 to 64 year old males and 25 to 34 year old females are the most vulnerable to poverty, with 8 males (15.4%) and 6 females (21.4%) in their respective age groups living below the poverty level.
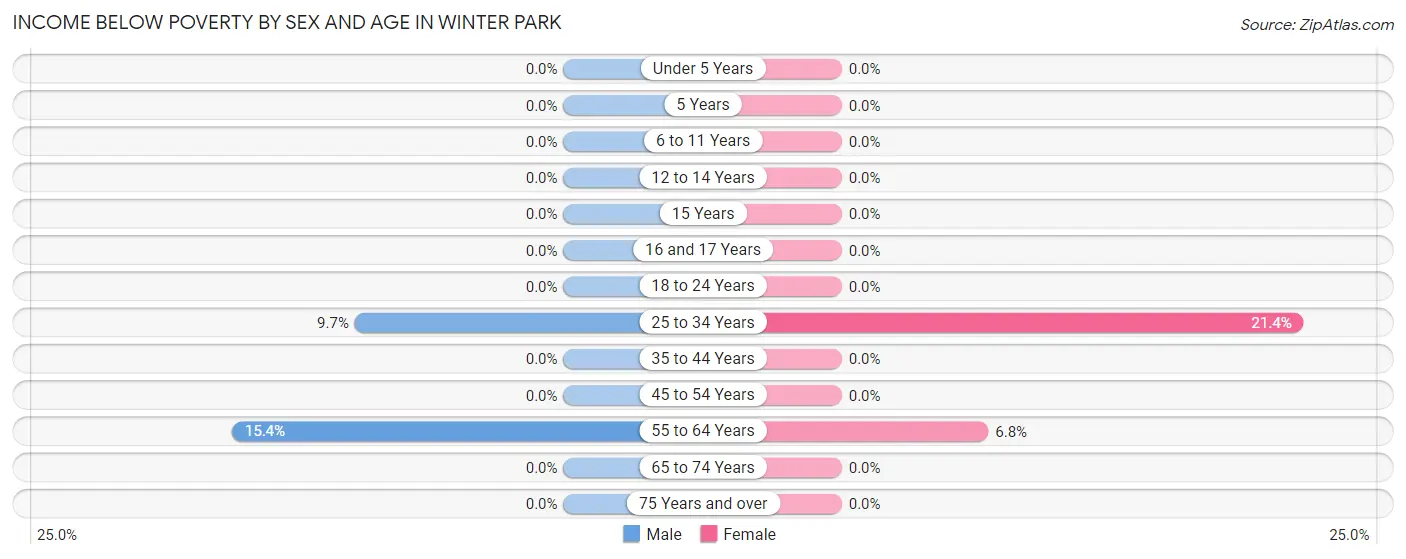
| Age Bracket | Male | Female |
| Under 5 Years | 0 (0.0%) | 0 (0.0%) |
| 5 Years | 0 (0.0%) | 0 (0.0%) |
| 6 to 11 Years | 0 (0.0%) | 0 (0.0%) |
| 12 to 14 Years | 0 (0.0%) | 0 (0.0%) |
| 15 Years | 0 (0.0%) | 0 (0.0%) |
| 16 and 17 Years | 0 (0.0%) | 0 (0.0%) |
| 18 to 24 Years | 0 (0.0%) | 0 (0.0%) |
| 25 to 34 Years | 12 (9.7%) | 6 (21.4%) |
| 35 to 44 Years | 0 (0.0%) | 0 (0.0%) |
| 45 to 54 Years | 0 (0.0%) | 0 (0.0%) |
| 55 to 64 Years | 8 (15.4%) | 7 (6.8%) |
| 65 to 74 Years | 0 (0.0%) | 0 (0.0%) |
| 75 Years and over | 0 (0.0%) | 0 (0.0%) |
| Total | 20 (4.0%) | 13 (4.9%) |
Income Above Poverty by Sex and Age in Winter Park
According to the poverty statistics in Winter Park, males aged under 5 years and females aged 6 to 11 years are the age groups that are most secure financially, with 100.0% of males and 100.0% of females in these age groups living above the poverty line.
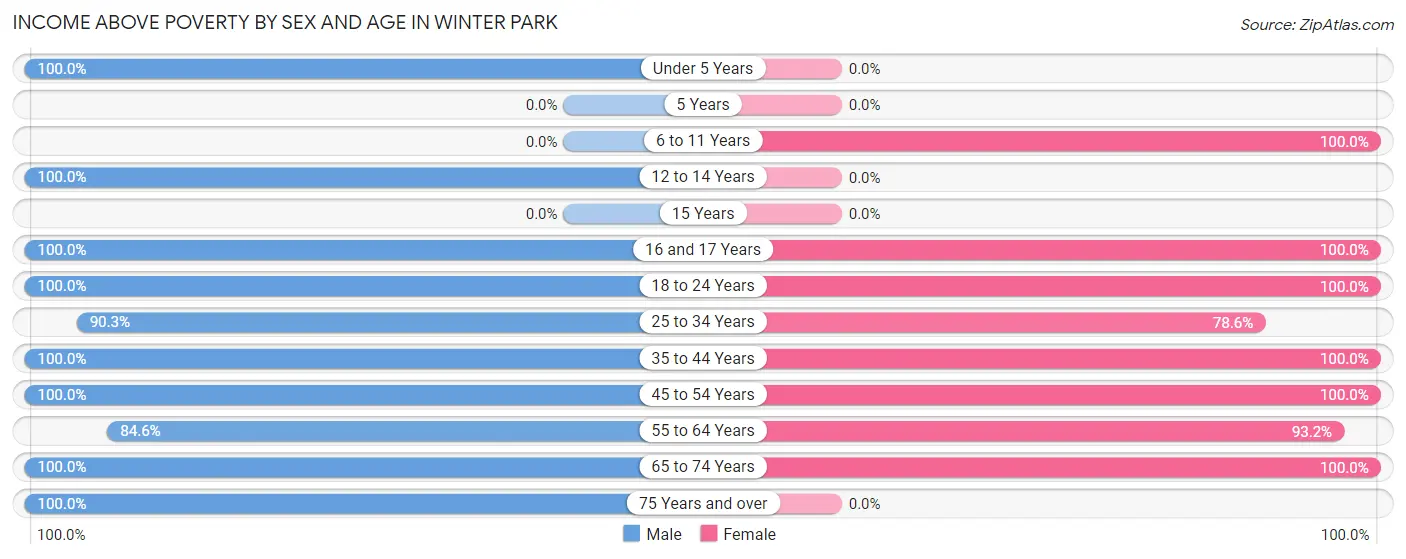
| Age Bracket | Male | Female |
| Under 5 Years | 3 (100.0%) | 0 (0.0%) |
| 5 Years | 0 (0.0%) | 0 (0.0%) |
| 6 to 11 Years | 0 (0.0%) | 10 (100.0%) |
| 12 to 14 Years | 11 (100.0%) | 0 (0.0%) |
| 15 Years | 0 (0.0%) | 0 (0.0%) |
| 16 and 17 Years | 17 (100.0%) | 36 (100.0%) |
| 18 to 24 Years | 10 (100.0%) | 27 (100.0%) |
| 25 to 34 Years | 112 (90.3%) | 22 (78.6%) |
| 35 to 44 Years | 39 (100.0%) | 11 (100.0%) |
| 45 to 54 Years | 77 (100.0%) | 42 (100.0%) |
| 55 to 64 Years | 44 (84.6%) | 96 (93.2%) |
| 65 to 74 Years | 81 (100.0%) | 8 (100.0%) |
| 75 Years and over | 83 (100.0%) | 0 (0.0%) |
| Total | 477 (96.0%) | 252 (95.1%) |
Income Below Poverty Among Married-Couple Families in Winter Park
The poverty statistics for married-couple families in Winter Park show that 10.4% or 20 of the total 193 families live below the poverty line. Families with no children have the highest poverty rate of 13.3%, comprising of 20 families. On the other hand, families with 1 or 2 children have the lowest poverty rate of 0.0%, which includes 0 families.
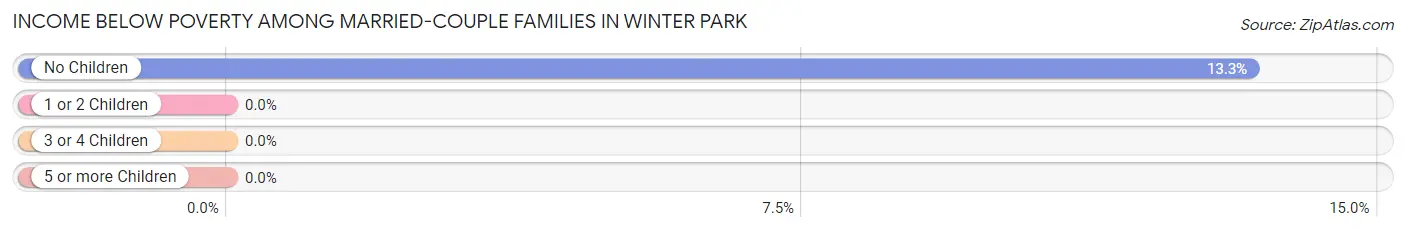
| Children | Above Poverty | Below Poverty |
| No Children | 130 (86.7%) | 20 (13.3%) |
| 1 or 2 Children | 43 (100.0%) | 0 (0.0%) |
| 3 or 4 Children | 0 (0.0%) | 0 (0.0%) |
| 5 or more Children | 0 (0.0%) | 0 (0.0%) |
| Total | 173 (89.6%) | 20 (10.4%) |
Income Below Poverty Among Single-Parent Households in Winter Park
| Children | Single Father | Single Mother |
| No Children | 0 (0.0%) | 0 (0.0%) |
| 1 or 2 Children | 0 (0.0%) | 0 (0.0%) |
| 3 or 4 Children | 0 (0.0%) | 0 (0.0%) |
| 5 or more Children | 0 (0.0%) | 0 (0.0%) |
| Total | 0 (0.0%) | 0 (0.0%) |
Income Below Poverty Among Married-Couple vs Single-Parent Households in Winter Park
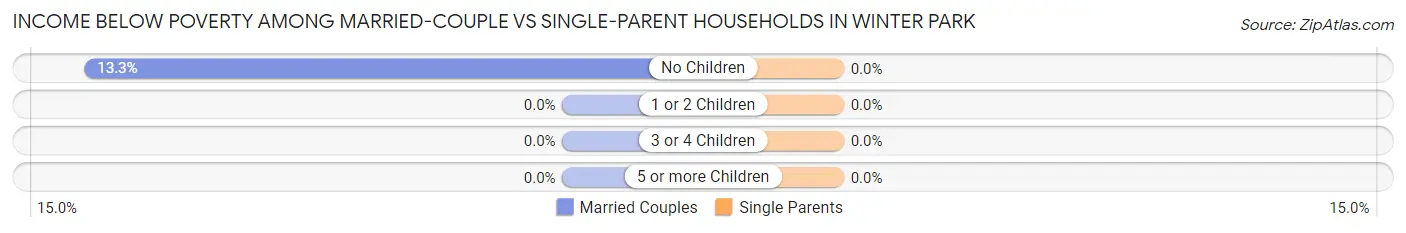
| Children | Married-Couple Families | Single-Parent Households |
| No Children | 20 (13.3%) | 0 (0.0%) |
| 1 or 2 Children | 0 (0.0%) | 0 (0.0%) |
| 3 or 4 Children | 0 (0.0%) | 0 (0.0%) |
| 5 or more Children | 0 (0.0%) | 0 (0.0%) |
| Total | 20 (10.4%) | 0 (0.0%) |
Race in Winter Park
The most populous races in Winter Park are White / Caucasian (720 | 94.5%), Two or more Races (37 | 4.9%), and Hispanic or Latino (18 | 2.4%).
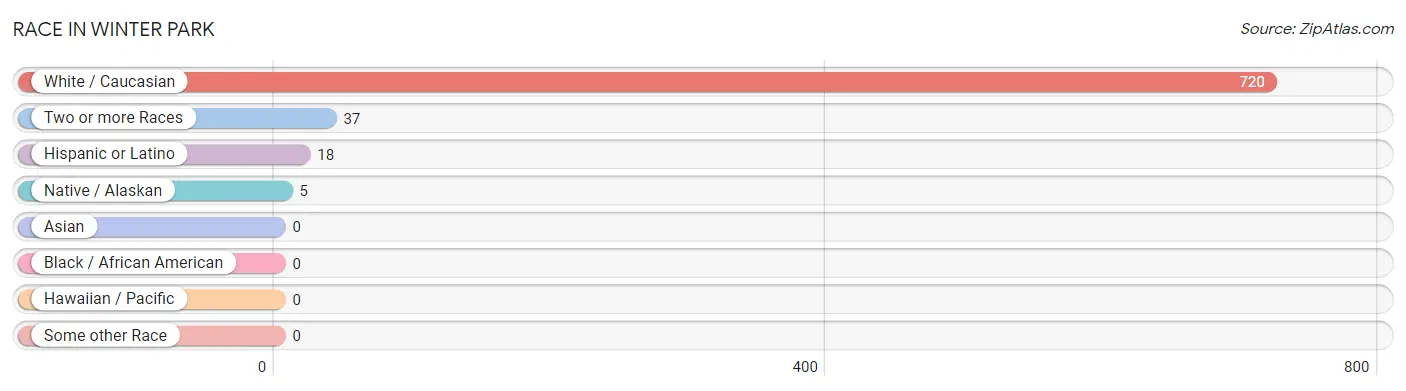
| Race | # Population | % Population |
| Asian | 0 | 0.0% |
| Black / African American | 0 | 0.0% |
| Hawaiian / Pacific | 0 | 0.0% |
| Hispanic or Latino | 18 | 2.4% |
| Native / Alaskan | 5 | 0.7% |
| White / Caucasian | 720 | 94.5% |
| Two or more Races | 37 | 4.9% |
| Some other Race | 0 | 0.0% |
| Total | 762 | 100.0% |
Ancestry in Winter Park
The most populous ancestries reported in Winter Park are German (103 | 13.5%), Italian (57 | 7.5%), Lithuanian (51 | 6.7%), Irish (40 | 5.2%), and English (34 | 4.5%), together accounting for 37.4% of all Winter Park residents.
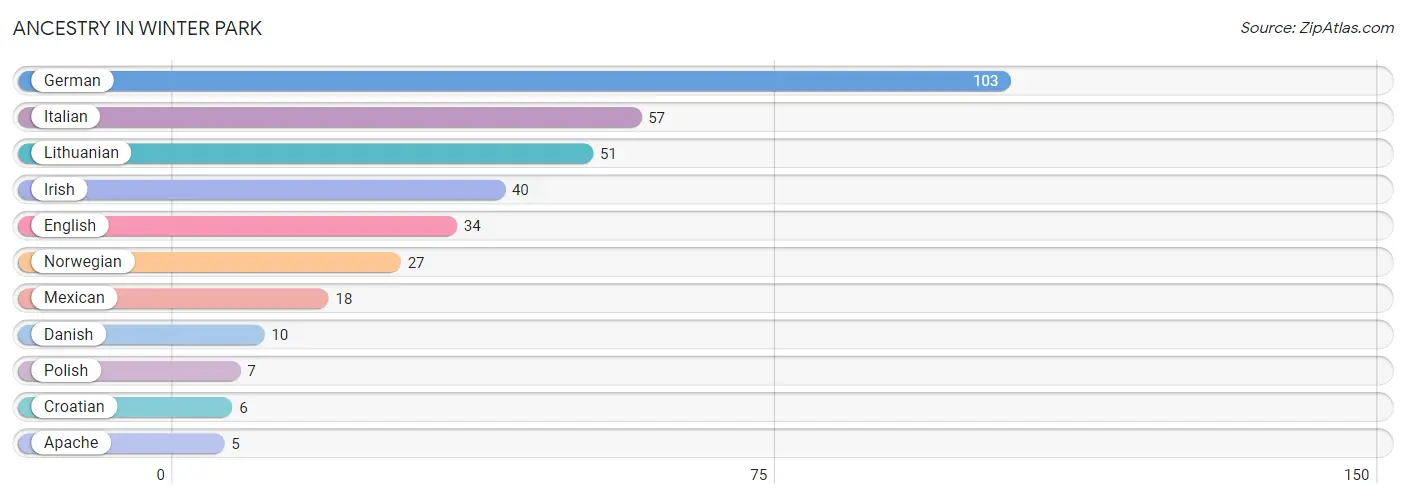
| Ancestry | # Population | % Population |
| Apache | 5 | 0.7% |
| Croatian | 6 | 0.8% |
| Danish | 10 | 1.3% |
| English | 34 | 4.5% |
| German | 103 | 13.5% |
| Irish | 40 | 5.2% |
| Italian | 57 | 7.5% |
| Lithuanian | 51 | 6.7% |
| Mexican | 18 | 2.4% |
| Norwegian | 27 | 3.5% |
| Polish | 7 | 0.9% | View All 11 Rows |
Immigrants in Winter Park
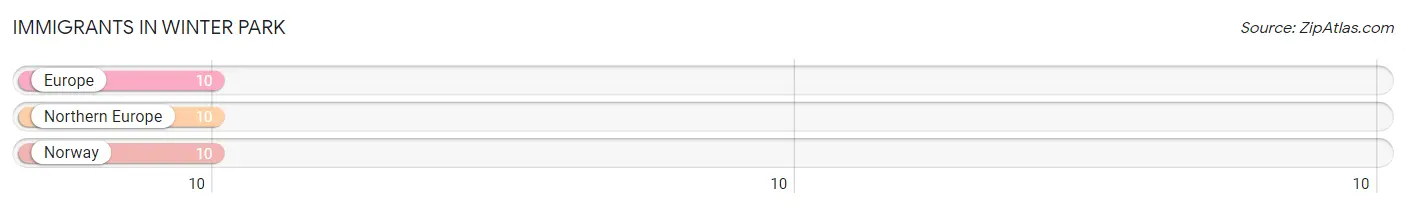
The most numerous immigrant groups reported in Winter Park came from Europe (10 | 1.3%), Northern Europe (10 | 1.3%), and Norway (10 | 1.3%), together accounting for 3.9% of all Winter Park residents.
| Immigration Origin | # Population | % Population |
| Europe | 10 | 1.3% |
| Northern Europe | 10 | 1.3% |
| Norway | 10 | 1.3% | View All 3 Rows |
Sex and Age in Winter Park
Sex and Age in Winter Park
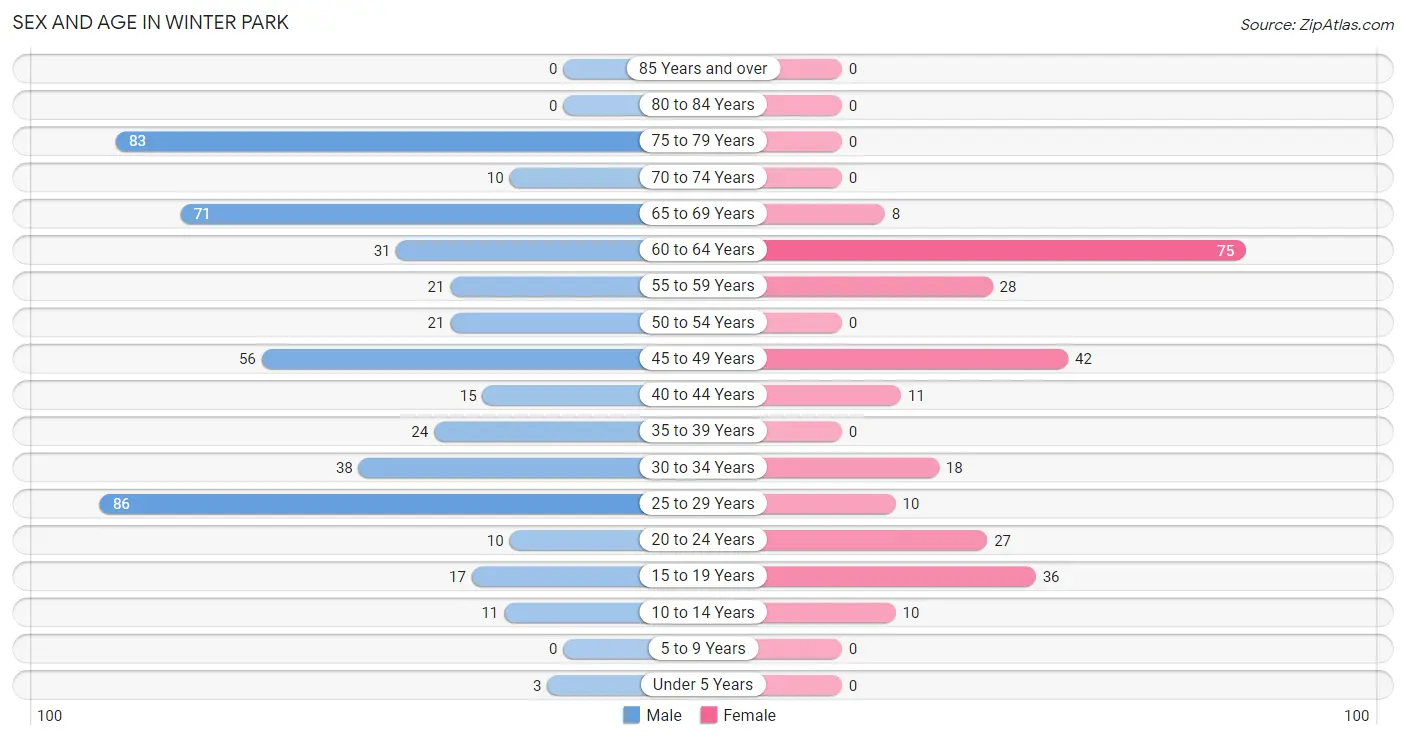
The most populous age groups in Winter Park are 25 to 29 Years (86 | 17.3%) for men and 60 to 64 Years (75 | 28.3%) for women.
| Age Bracket | Male | Female |
| Under 5 Years | 3 (0.6%) | 0 (0.0%) |
| 5 to 9 Years | 0 (0.0%) | 0 (0.0%) |
| 10 to 14 Years | 11 (2.2%) | 10 (3.8%) |
| 15 to 19 Years | 17 (3.4%) | 36 (13.6%) |
| 20 to 24 Years | 10 (2.0%) | 27 (10.2%) |
| 25 to 29 Years | 86 (17.3%) | 10 (3.8%) |
| 30 to 34 Years | 38 (7.6%) | 18 (6.8%) |
| 35 to 39 Years | 24 (4.8%) | 0 (0.0%) |
| 40 to 44 Years | 15 (3.0%) | 11 (4.2%) |
| 45 to 49 Years | 56 (11.3%) | 42 (15.9%) |
| 50 to 54 Years | 21 (4.2%) | 0 (0.0%) |
| 55 to 59 Years | 21 (4.2%) | 28 (10.6%) |
| 60 to 64 Years | 31 (6.2%) | 75 (28.3%) |
| 65 to 69 Years | 71 (14.3%) | 8 (3.0%) |
| 70 to 74 Years | 10 (2.0%) | 0 (0.0%) |
| 75 to 79 Years | 83 (16.7%) | 0 (0.0%) |
| 80 to 84 Years | 0 (0.0%) | 0 (0.0%) |
| 85 Years and over | 0 (0.0%) | 0 (0.0%) |
| Total | 497 (100.0%) | 265 (100.0%) |
Families and Households in Winter Park
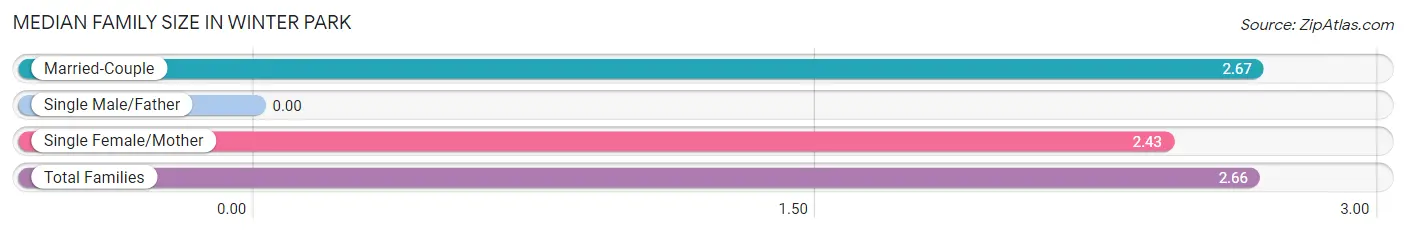
Median Family Size in Winter Park
| Family Type | # Families | Family Size |
| Married-Couple | 193 (96.5%) | 2.67 |
| Single Male/Father | 0 (0.0%) | - |
| Single Female/Mother | 7 (3.5%) | 2.43 |
| Total Families | 200 (100.0%) | 2.66 |
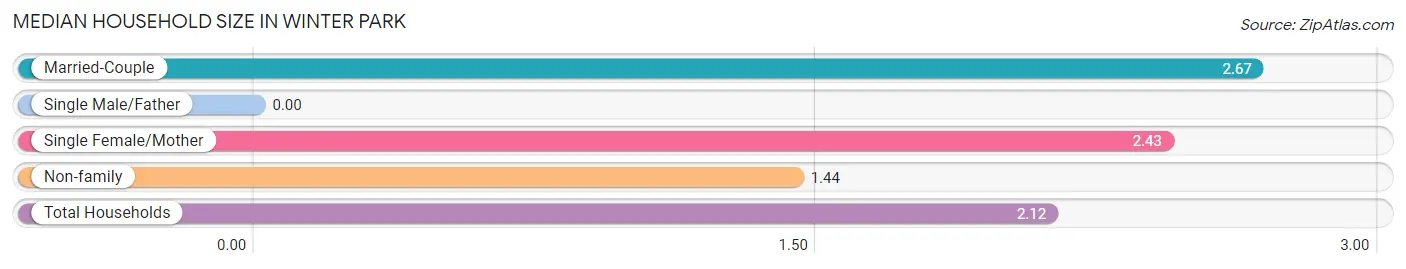
Median Household Size in Winter Park
| Household Type | # Households | Household Size |
| Married-Couple | 193 (53.6%) | 2.67 |
| Single Male/Father | 0 (0.0%) | - |
| Single Female/Mother | 7 (1.9%) | 2.43 |
| Non-family | 160 (44.4%) | 1.44 |
| Total Households | 360 (100.0%) | 2.12 |
Household Size by Marriage Status in Winter Park
Out of a total of 360 households in Winter Park, 200 (55.6%) are family households, while 160 (44.4%) are nonfamily households. The most numerous type of family households are 2-person households, comprising 144, and the most common type of nonfamily households are 1-person households, comprising 132.
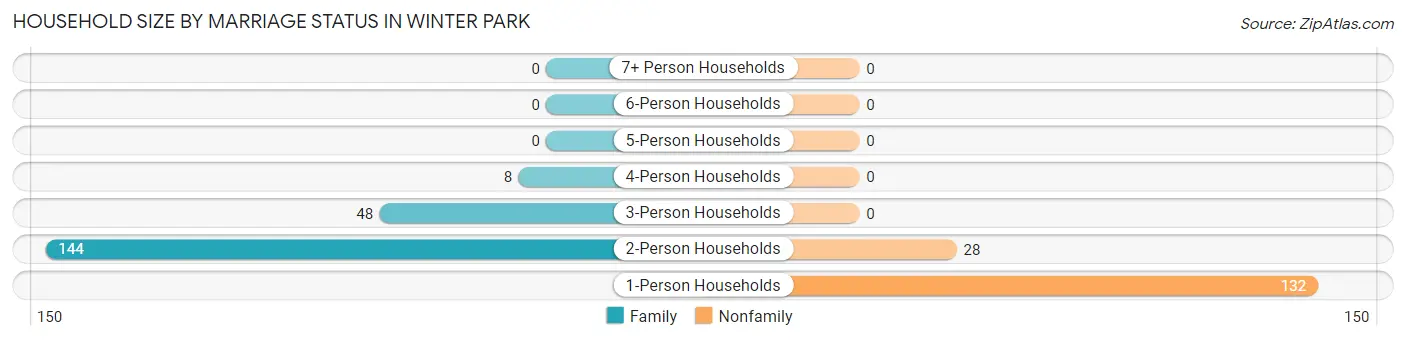
| Household Size | Family Households | Nonfamily Households |
| 1-Person Households | - | 132 (36.7%) |
| 2-Person Households | 144 (40.0%) | 28 (7.8%) |
| 3-Person Households | 48 (13.3%) | 0 (0.0%) |
| 4-Person Households | 8 (2.2%) | 0 (0.0%) |
| 5-Person Households | 0 (0.0%) | 0 (0.0%) |
| 6-Person Households | 0 (0.0%) | 0 (0.0%) |
| 7+ Person Households | 0 (0.0%) | 0 (0.0%) |
| Total | 200 (55.6%) | 160 (44.4%) |
Female Fertility in Winter Park
Fertility by Age in Winter Park
Average fertility rate in Winter Park is 49.0 births per 1,000 women. Women in the age bracket of 35 to 50 years have the highest fertility rate with 132.0 births per 1,000 women. Women in the age bracket of 35 to 50 years acount for 100.0% of all women with births.
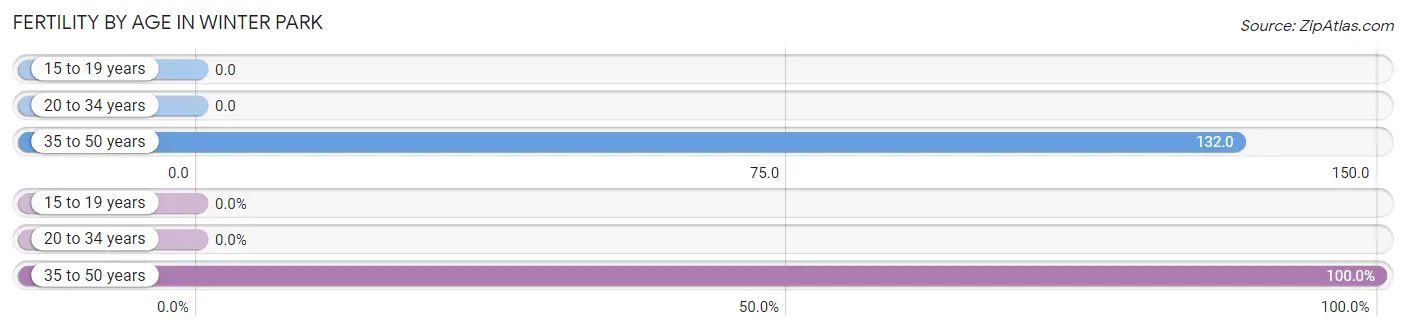
| Age Bracket | Women with Births | Births / 1,000 Women |
| 15 to 19 years | 0 (0.0%) | 0.0 |
| 20 to 34 years | 0 (0.0%) | 0.0 |
| 35 to 50 years | 7 (100.0%) | 132.0 |
| Total | 7 (100.0%) | 49.0 |
Fertility by Age by Marriage Status in Winter Park
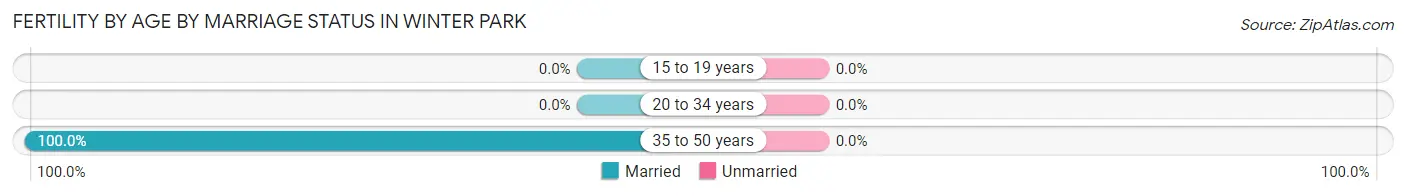
| Age Bracket | Married | Unmarried |
| 15 to 19 years | 0 (0.0%) | 0 (0.0%) |
| 20 to 34 years | 0 (0.0%) | 0 (0.0%) |
| 35 to 50 years | 7 (100.0%) | 0 (0.0%) |
| Total | 7 (100.0%) | 0 (0.0%) |
Fertility by Education in Winter Park
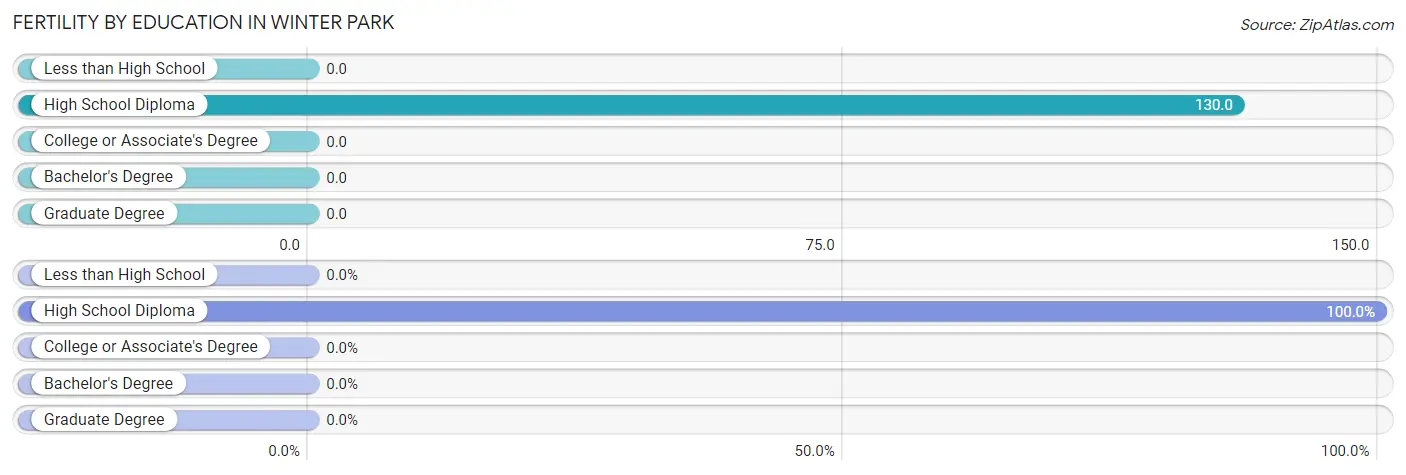
| Educational Attainment | Women with Births | Births / 1,000 Women |
| Less than High School | 0 (0.0%) | 0.0 |
| High School Diploma | 7 (100.0%) | 130.0 |
| College or Associate's Degree | 0 (0.0%) | 0.0 |
| Bachelor's Degree | 0 (0.0%) | 0.0 |
| Graduate Degree | 0 (0.0%) | 0.0 |
| Total | 7 (100.0%) | 49.0 |
Fertility by Education by Marriage Status in Winter Park
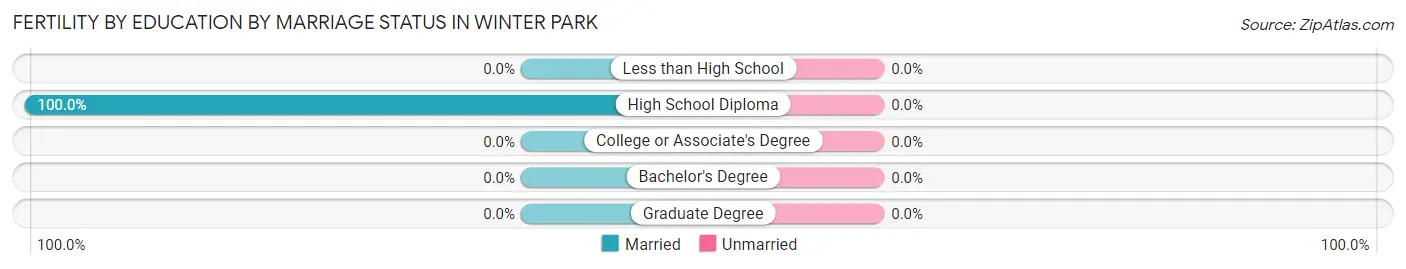
| Educational Attainment | Married | Unmarried |
| Less than High School | 0 (0.0%) | 0 (0.0%) |
| High School Diploma | 7 (100.0%) | 0 (0.0%) |
| College or Associate's Degree | 0 (0.0%) | 0 (0.0%) |
| Bachelor's Degree | 0 (0.0%) | 0 (0.0%) |
| Graduate Degree | 0 (0.0%) | 0 (0.0%) |
| Total | 7 (100.0%) | 0 (0.0%) |
Employment Characteristics in Winter Park
Employment by Class of Employer in Winter Park
Among the 458 employed individuals in Winter Park, private company employees (339 | 74.0%), not-for-profit organizations (71 | 15.5%), and local government employees (36 | 7.9%) make up the most common classes of employment.
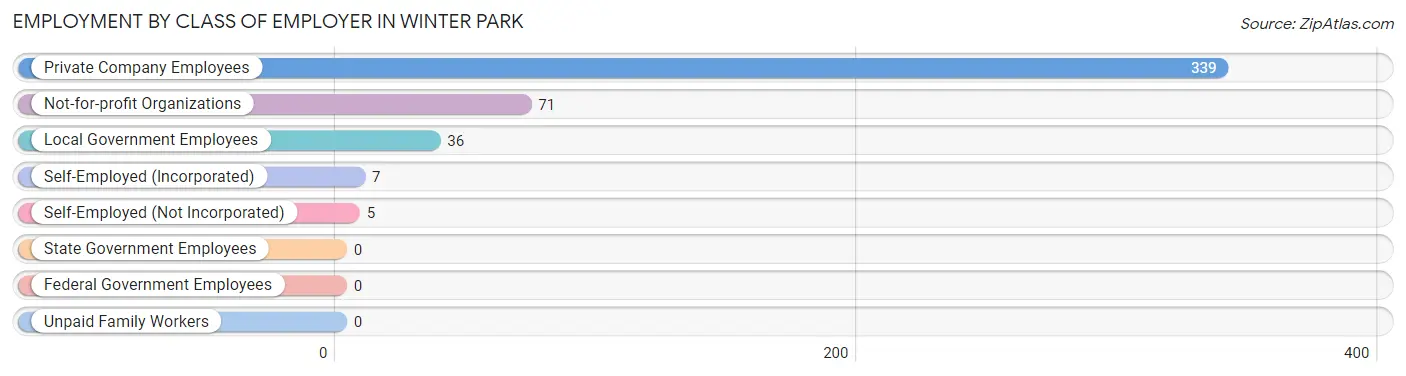
| Employer Class | # Employees | % Employees |
| Private Company Employees | 339 | 74.0% |
| Self-Employed (Incorporated) | 7 | 1.5% |
| Self-Employed (Not Incorporated) | 5 | 1.1% |
| Not-for-profit Organizations | 71 | 15.5% |
| Local Government Employees | 36 | 7.9% |
| State Government Employees | 0 | 0.0% |
| Federal Government Employees | 0 | 0.0% |
| Unpaid Family Workers | 0 | 0.0% |
| Total | 458 | 100.0% |
Employment Status by Age in Winter Park
According to the labor force statistics for Winter Park, out of the total population over 16 years of age (738), 66.4% or 490 individuals are in the labor force, with 6.5% or 32 of them unemployed. The age group with the highest labor force participation rate is 20 to 24 years, with 100.0% or 37 individuals in the labor force. Within the labor force, the 20 to 24 years age range has the highest percentage of unemployed individuals, with 54.1% or 20 of them being unemployed.
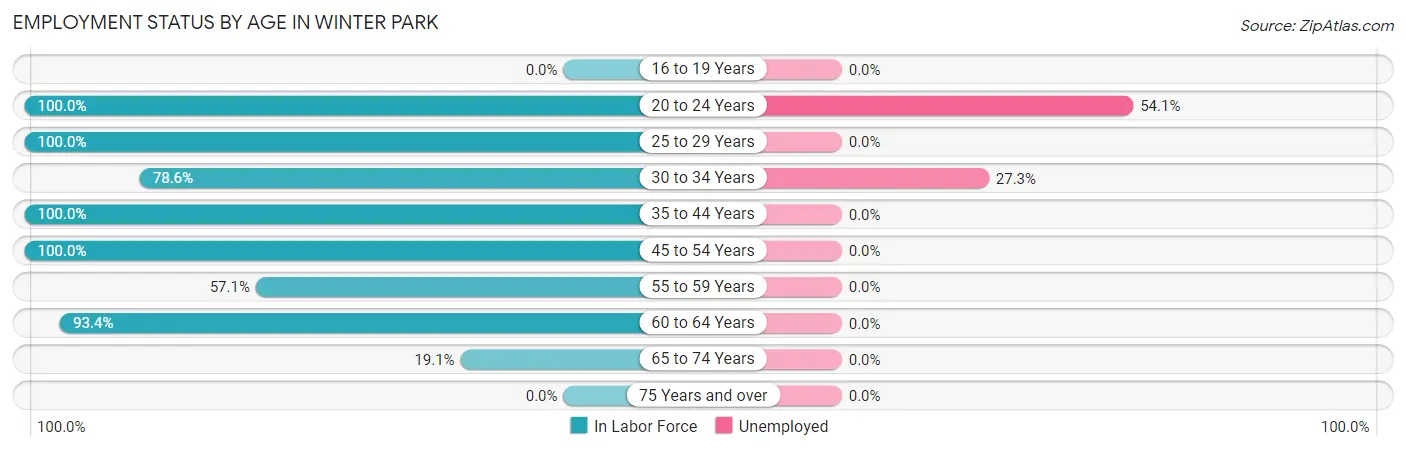
| Age Bracket | In Labor Force | Unemployed |
| 16 to 19 Years | 0 (0.0%) | 0 (0.0%) |
| 20 to 24 Years | 37 (100.0%) | 20 (54.1%) |
| 25 to 29 Years | 96 (100.0%) | 0 (0.0%) |
| 30 to 34 Years | 44 (78.6%) | 12 (27.3%) |
| 35 to 44 Years | 50 (100.0%) | 0 (0.0%) |
| 45 to 54 Years | 119 (100.0%) | 0 (0.0%) |
| 55 to 59 Years | 28 (57.1%) | 0 (0.0%) |
| 60 to 64 Years | 99 (93.4%) | 0 (0.0%) |
| 65 to 74 Years | 17 (19.1%) | 0 (0.0%) |
| 75 Years and over | 0 (0.0%) | 0 (0.0%) |
| Total | 490 (66.4%) | 32 (6.5%) |
Employment Status by Educational Attainment in Winter Park
According to labor force statistics for Winter Park, 91.6% of individuals (436) out of the total population between 25 and 64 years of age (476) are in the labor force, with 2.8% or 12 of them being unemployed. The group with the highest labor force participation rate are those with the educational attainment of college / associate degree, with 100.0% or 90 individuals in the labor force. Within the labor force, individuals with bachelor's degree or higher education have the highest percentage of unemployment, with 3.9% or 12 of them being unemployed.
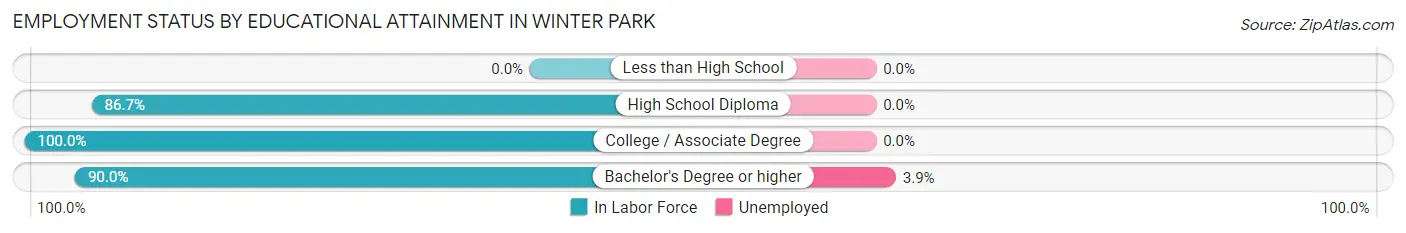
| Educational Attainment | In Labor Force | Unemployed |
| Less than High School | 0 (0.0%) | 0 (0.0%) |
| High School Diploma | 39 (86.7%) | 0 (0.0%) |
| College / Associate Degree | 90 (100.0%) | 0 (0.0%) |
| Bachelor's Degree or higher | 307 (90.0%) | 13 (3.9%) |
| Total | 436 (91.6%) | 13 (2.8%) |
Employment Occupations by Sex in Winter Park
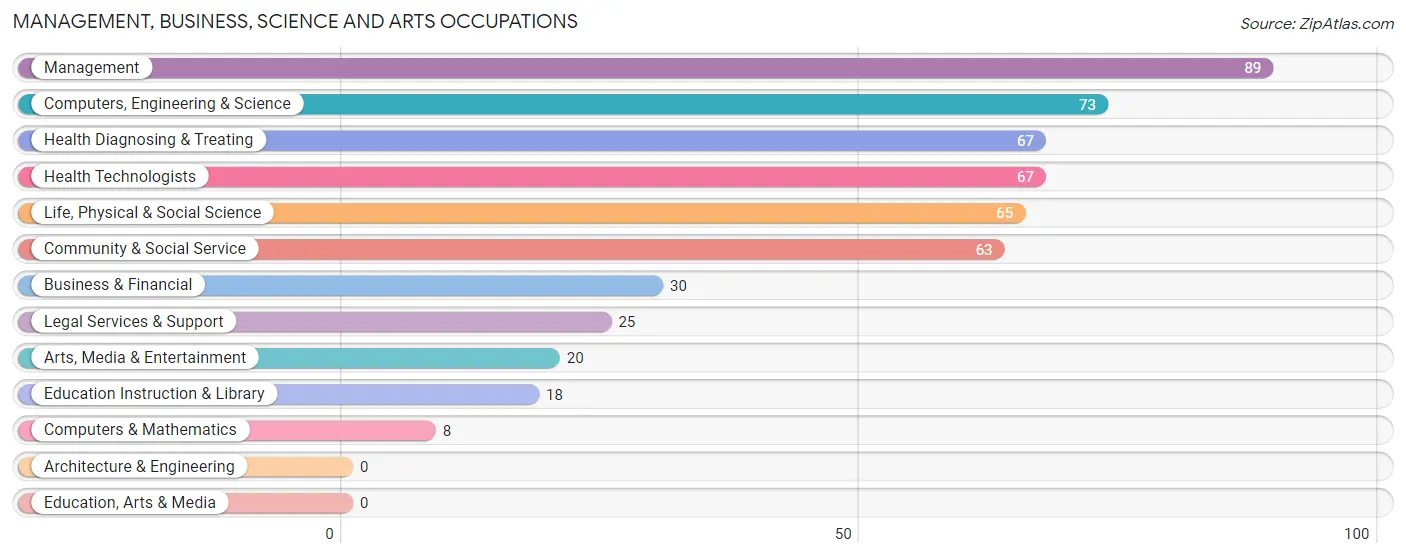
Management, Business, Science and Arts Occupations
The most common Management, Business, Science and Arts occupations in Winter Park are Management (89 | 19.4%), Computers, Engineering & Science (73 | 15.9%), Health Diagnosing & Treating (67 | 14.6%), Health Technologists (67 | 14.6%), and Life, Physical & Social Science (65 | 14.2%).
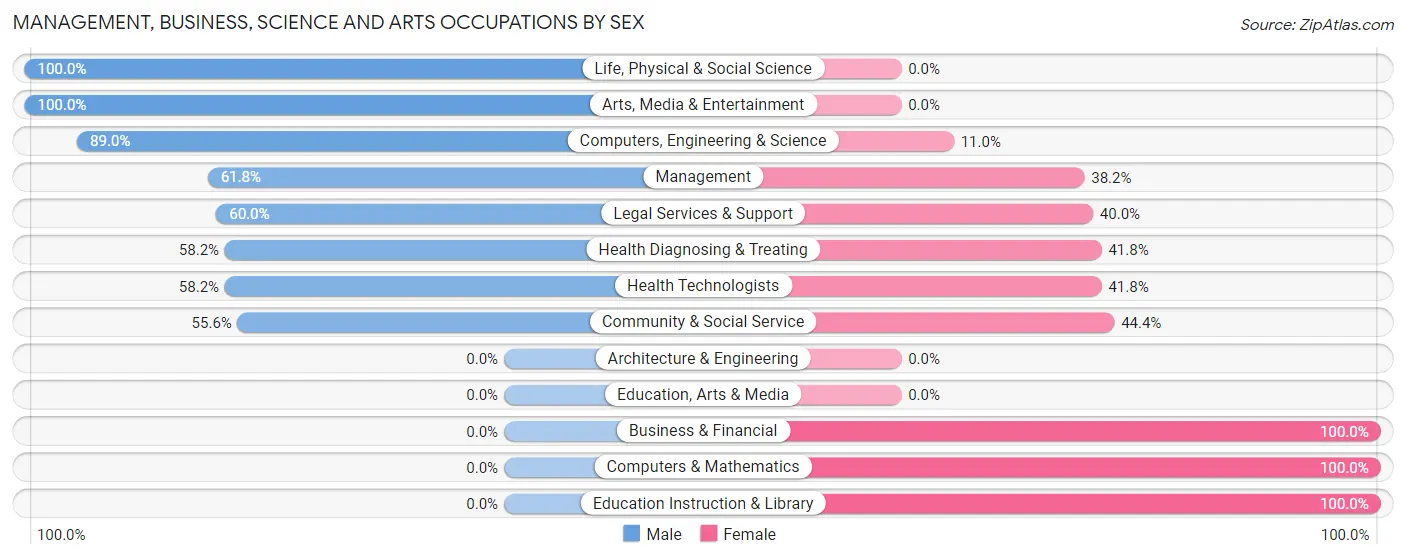
Management, Business, Science and Arts Occupations by Sex
Within the Management, Business, Science and Arts occupations in Winter Park, the most male-oriented occupations are Life, Physical & Social Science (100.0%), Arts, Media & Entertainment (100.0%), and Computers, Engineering & Science (89.0%), while the most female-oriented occupations are Business & Financial (100.0%), Computers & Mathematics (100.0%), and Education Instruction & Library (100.0%).
| Occupation | Male | Female |
| Management | 55 (61.8%) | 34 (38.2%) |
| Business & Financial | 0 (0.0%) | 30 (100.0%) |
| Computers, Engineering & Science | 65 (89.0%) | 8 (11.0%) |
| Computers & Mathematics | 0 (0.0%) | 8 (100.0%) |
| Architecture & Engineering | 0 (0.0%) | 0 (0.0%) |
| Life, Physical & Social Science | 65 (100.0%) | 0 (0.0%) |
| Community & Social Service | 35 (55.6%) | 28 (44.4%) |
| Education, Arts & Media | 0 (0.0%) | 0 (0.0%) |
| Legal Services & Support | 15 (60.0%) | 10 (40.0%) |
| Education Instruction & Library | 0 (0.0%) | 18 (100.0%) |
| Arts, Media & Entertainment | 20 (100.0%) | 0 (0.0%) |
| Health Diagnosing & Treating | 39 (58.2%) | 28 (41.8%) |
| Health Technologists | 39 (58.2%) | 28 (41.8%) |
| Total (Category) | 194 (60.3%) | 128 (39.8%) |
| Total (Overall) | 278 (60.7%) | 180 (39.3%) |
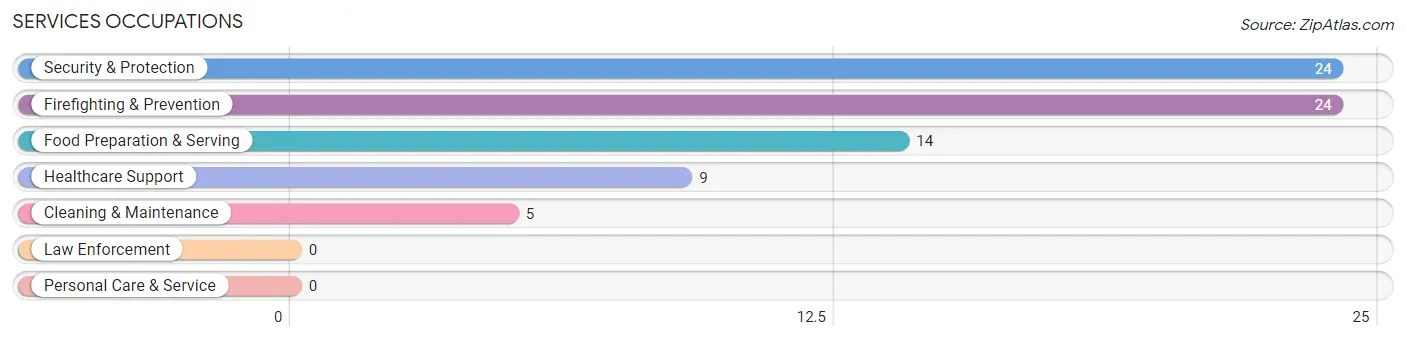
Services Occupations
The most common Services occupations in Winter Park are Security & Protection (24 | 5.2%), Firefighting & Prevention (24 | 5.2%), Food Preparation & Serving (14 | 3.1%), Healthcare Support (9 | 2.0%), and Cleaning & Maintenance (5 | 1.1%).
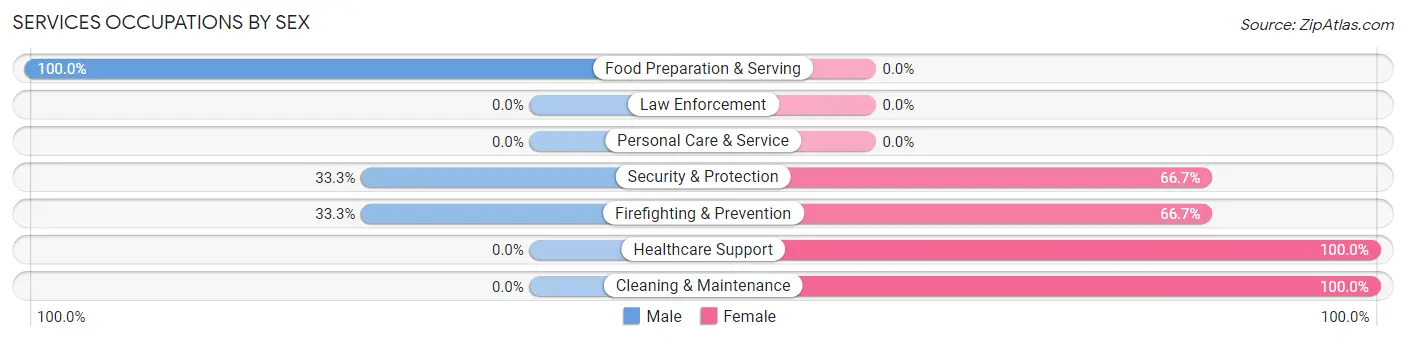
Services Occupations by Sex
Within the Services occupations in Winter Park, the most male-oriented occupations are Food Preparation & Serving (100.0%), Security & Protection (33.3%), and Firefighting & Prevention (33.3%), while the most female-oriented occupations are Healthcare Support (100.0%), Cleaning & Maintenance (100.0%), and Security & Protection (66.7%).
| Occupation | Male | Female |
| Healthcare Support | 0 (0.0%) | 9 (100.0%) |
| Security & Protection | 8 (33.3%) | 16 (66.7%) |
| Firefighting & Prevention | 8 (33.3%) | 16 (66.7%) |
| Law Enforcement | 0 (0.0%) | 0 (0.0%) |
| Food Preparation & Serving | 14 (100.0%) | 0 (0.0%) |
| Cleaning & Maintenance | 0 (0.0%) | 5 (100.0%) |
| Personal Care & Service | 0 (0.0%) | 0 (0.0%) |
| Total (Category) | 22 (42.3%) | 30 (57.7%) |
| Total (Overall) | 278 (60.7%) | 180 (39.3%) |
Sales and Office Occupations
The most common Sales and Office occupations in Winter Park are Office & Administration (14 | 3.1%), and Sales & Related (12 | 2.6%).
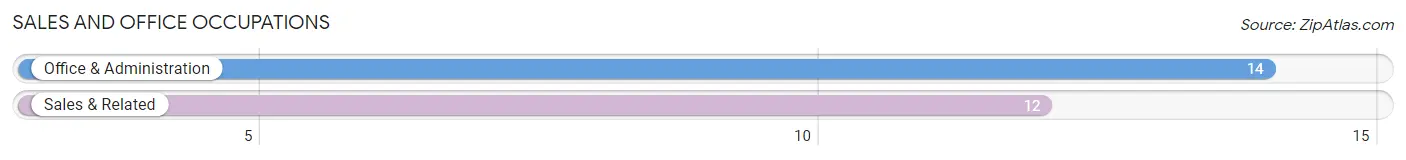
Sales and Office Occupations by Sex
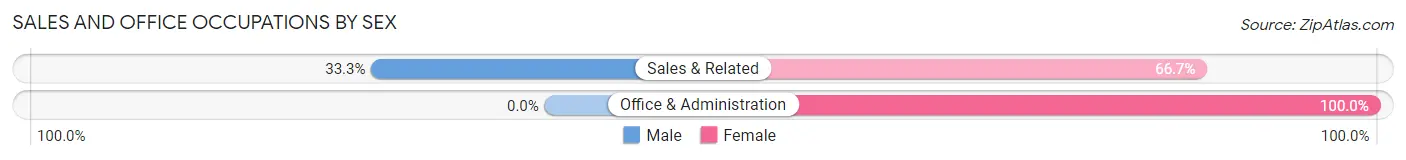
| Occupation | Male | Female |
| Sales & Related | 4 (33.3%) | 8 (66.7%) |
| Office & Administration | 0 (0.0%) | 14 (100.0%) |
| Total (Category) | 4 (15.4%) | 22 (84.6%) |
| Total (Overall) | 278 (60.7%) | 180 (39.3%) |
Natural Resources, Construction and Maintenance Occupations
The most common Natural Resources, Construction and Maintenance occupations in Winter Park are , and Construction & Extraction (27 | 5.9%).
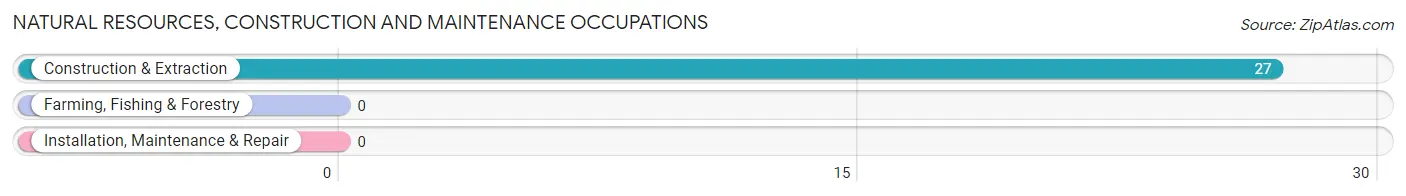
Natural Resources, Construction and Maintenance Occupations by Sex
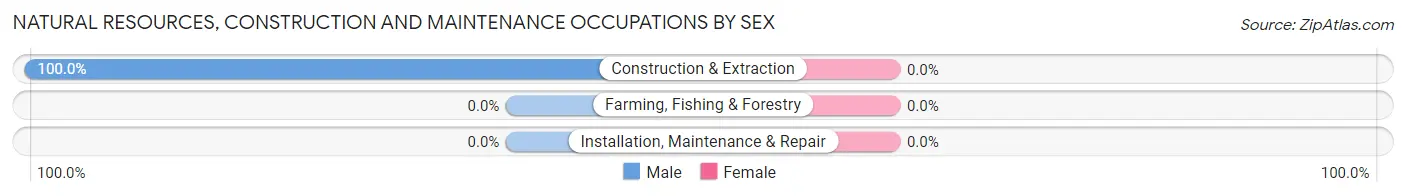
| Occupation | Male | Female |
| Farming, Fishing & Forestry | 0 (0.0%) | 0 (0.0%) |
| Construction & Extraction | 27 (100.0%) | 0 (0.0%) |
| Installation, Maintenance & Repair | 0 (0.0%) | 0 (0.0%) |
| Total (Category) | 27 (100.0%) | 0 (0.0%) |
| Total (Overall) | 278 (60.7%) | 180 (39.3%) |
Production, Transportation and Moving Occupations
The most common Production, Transportation and Moving occupations in Winter Park are , and Material Moving (31 | 6.8%).
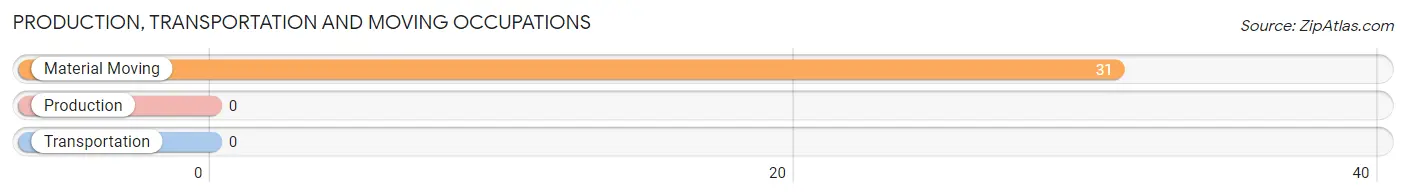
Production, Transportation and Moving Occupations by Sex
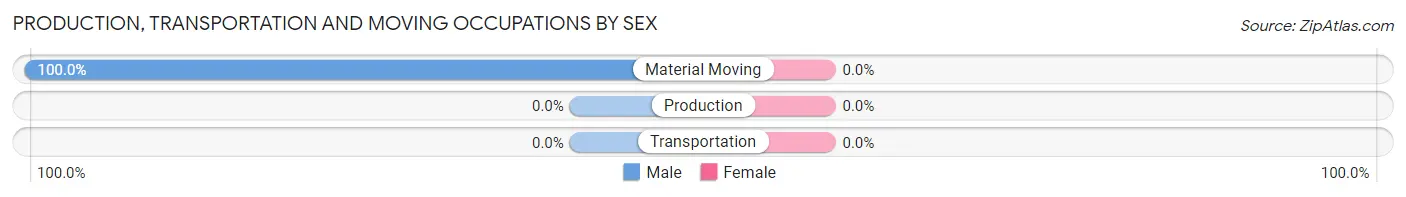
| Occupation | Male | Female |
| Production | 0 (0.0%) | 0 (0.0%) |
| Transportation | 0 (0.0%) | 0 (0.0%) |
| Material Moving | 31 (100.0%) | 0 (0.0%) |
| Total (Category) | 31 (100.0%) | 0 (0.0%) |
| Total (Overall) | 278 (60.7%) | 180 (39.3%) |
Employment Industries by Sex in Winter Park
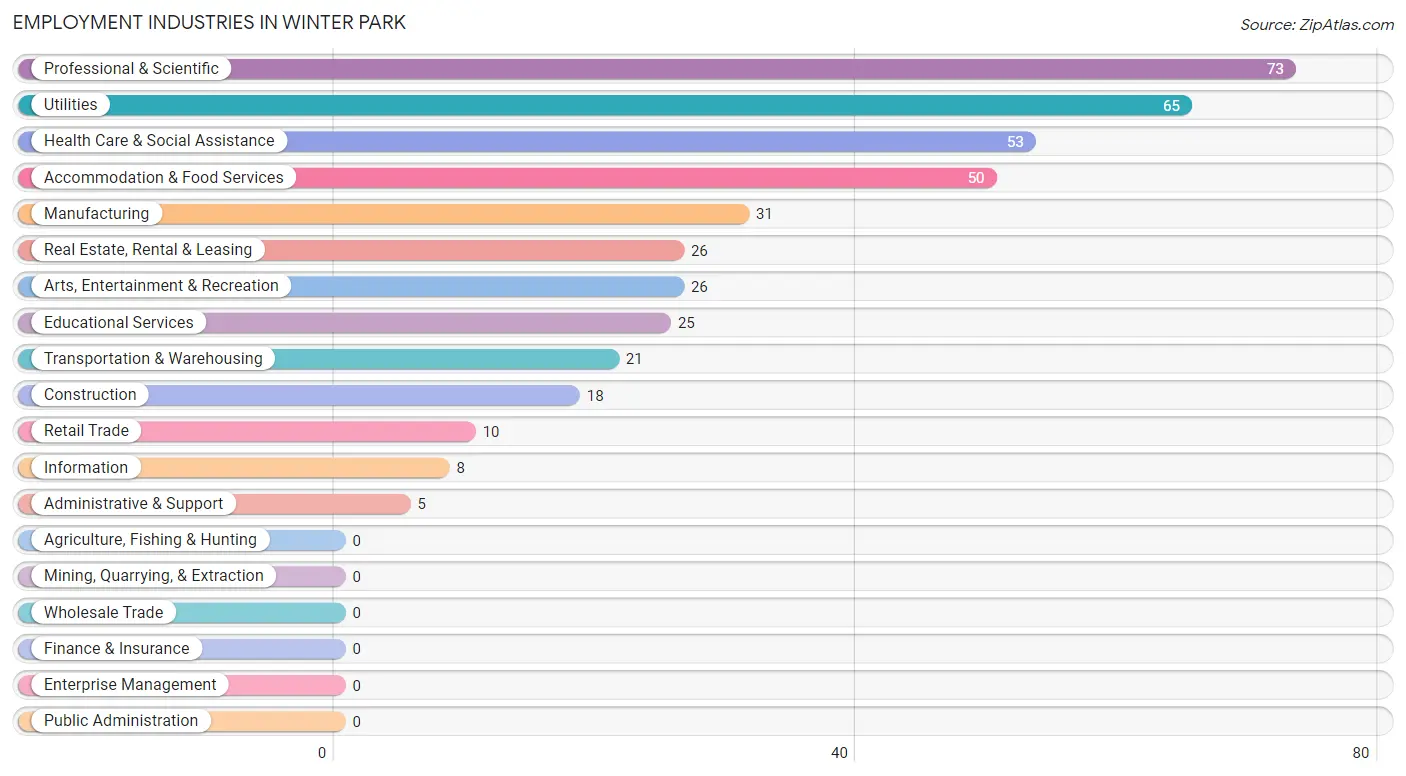
Employment Industries in Winter Park
The major employment industries in Winter Park include Professional & Scientific (73 | 15.9%), Utilities (65 | 14.2%), Health Care & Social Assistance (53 | 11.6%), Accommodation & Food Services (50 | 10.9%), and Manufacturing (31 | 6.8%).
Employment Industries by Sex in Winter Park
The Winter Park industries that see more men than women are Construction (100.0%), Manufacturing (100.0%), and Retail Trade (100.0%), whereas the industries that tend to have a higher number of women are Administrative & Support (100.0%), Educational Services (100.0%), and Health Care & Social Assistance (69.8%).
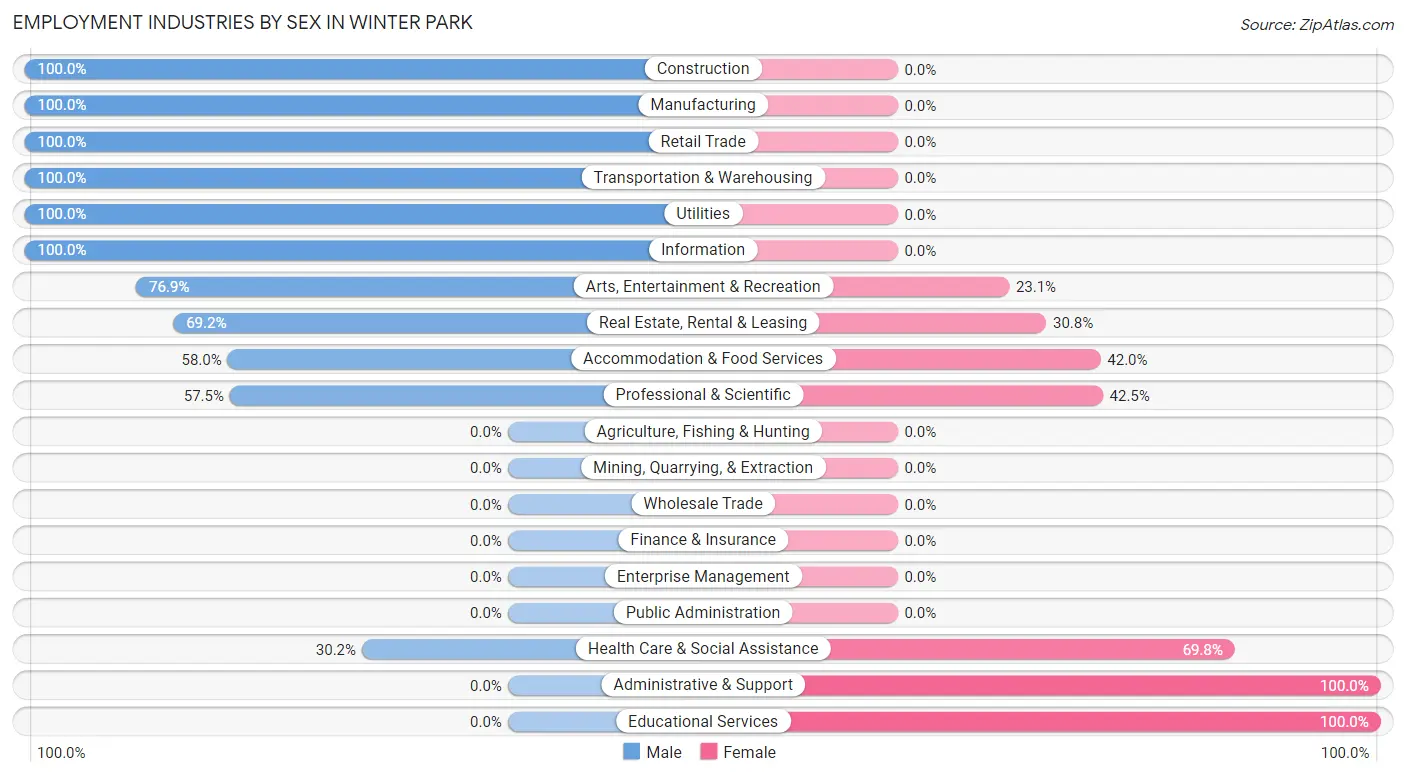
| Industry | Male | Female |
| Agriculture, Fishing & Hunting | 0 (0.0%) | 0 (0.0%) |
| Mining, Quarrying, & Extraction | 0 (0.0%) | 0 (0.0%) |
| Construction | 18 (100.0%) | 0 (0.0%) |
| Manufacturing | 31 (100.0%) | 0 (0.0%) |
| Wholesale Trade | 0 (0.0%) | 0 (0.0%) |
| Retail Trade | 10 (100.0%) | 0 (0.0%) |
| Transportation & Warehousing | 21 (100.0%) | 0 (0.0%) |
| Utilities | 65 (100.0%) | 0 (0.0%) |
| Information | 8 (100.0%) | 0 (0.0%) |
| Finance & Insurance | 0 (0.0%) | 0 (0.0%) |
| Real Estate, Rental & Leasing | 18 (69.2%) | 8 (30.8%) |
| Professional & Scientific | 42 (57.5%) | 31 (42.5%) |
| Enterprise Management | 0 (0.0%) | 0 (0.0%) |
| Administrative & Support | 0 (0.0%) | 5 (100.0%) |
| Educational Services | 0 (0.0%) | 25 (100.0%) |
| Health Care & Social Assistance | 16 (30.2%) | 37 (69.8%) |
| Arts, Entertainment & Recreation | 20 (76.9%) | 6 (23.1%) |
| Accommodation & Food Services | 29 (58.0%) | 21 (42.0%) |
| Public Administration | 0 (0.0%) | 0 (0.0%) |
| Total | 278 (60.7%) | 180 (39.3%) |
Education in Winter Park
School Enrollment in Winter Park
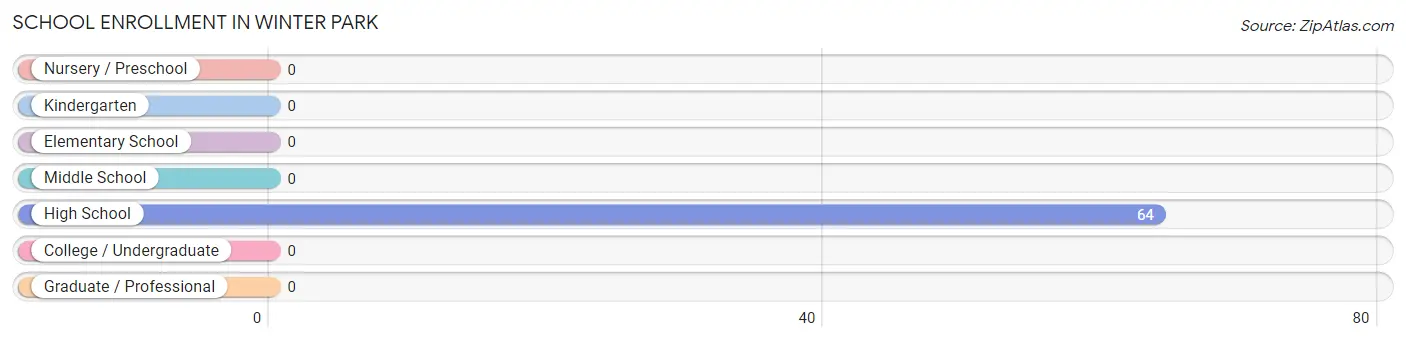
| School Level | # Students | % Students |
| Nursery / Preschool | 0 | 0.0% |
| Kindergarten | 0 | 0.0% |
| Elementary School | 0 | 0.0% |
| Middle School | 0 | 0.0% |
| High School | 64 | 100.0% |
| College / Undergraduate | 0 | 0.0% |
| Graduate / Professional | 0 | 0.0% |
| Total | 64 | 100.0% |
School Enrollment by Age by Funding Source in Winter Park
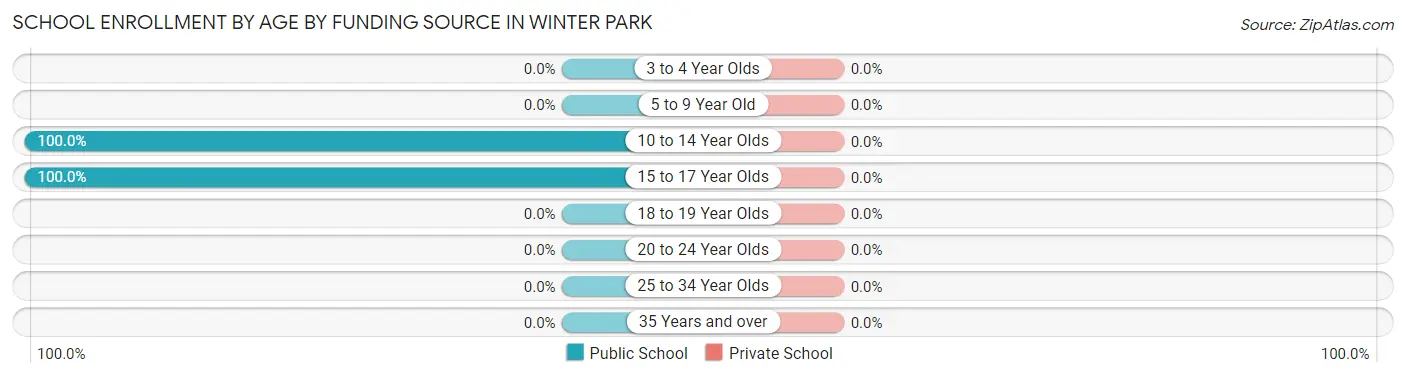
| Age Bracket | Public School | Private School |
| 3 to 4 Year Olds | 0 (0.0%) | 0 (0.0%) |
| 5 to 9 Year Old | 0 (0.0%) | 0 (0.0%) |
| 10 to 14 Year Olds | 11 (100.0%) | 0 (0.0%) |
| 15 to 17 Year Olds | 53 (100.0%) | 0 (0.0%) |
| 18 to 19 Year Olds | 0 (0.0%) | 0 (0.0%) |
| 20 to 24 Year Olds | 0 (0.0%) | 0 (0.0%) |
| 25 to 34 Year Olds | 0 (0.0%) | 0 (0.0%) |
| 35 Years and over | 0 (0.0%) | 0 (0.0%) |
| Total | 64 (100.0%) | 0 (0.0%) |
Educational Attainment by Field of Study in Winter Park
Science & technology (93 | 21.6%), physical & health sciences (86 | 20.0%), business (77 | 17.9%), bio, nature & agricultural (43 | 10.0%), and social sciences (35 | 8.1%) are the most common fields of study among 430 individuals in Winter Park who have obtained a bachelor's degree or higher.
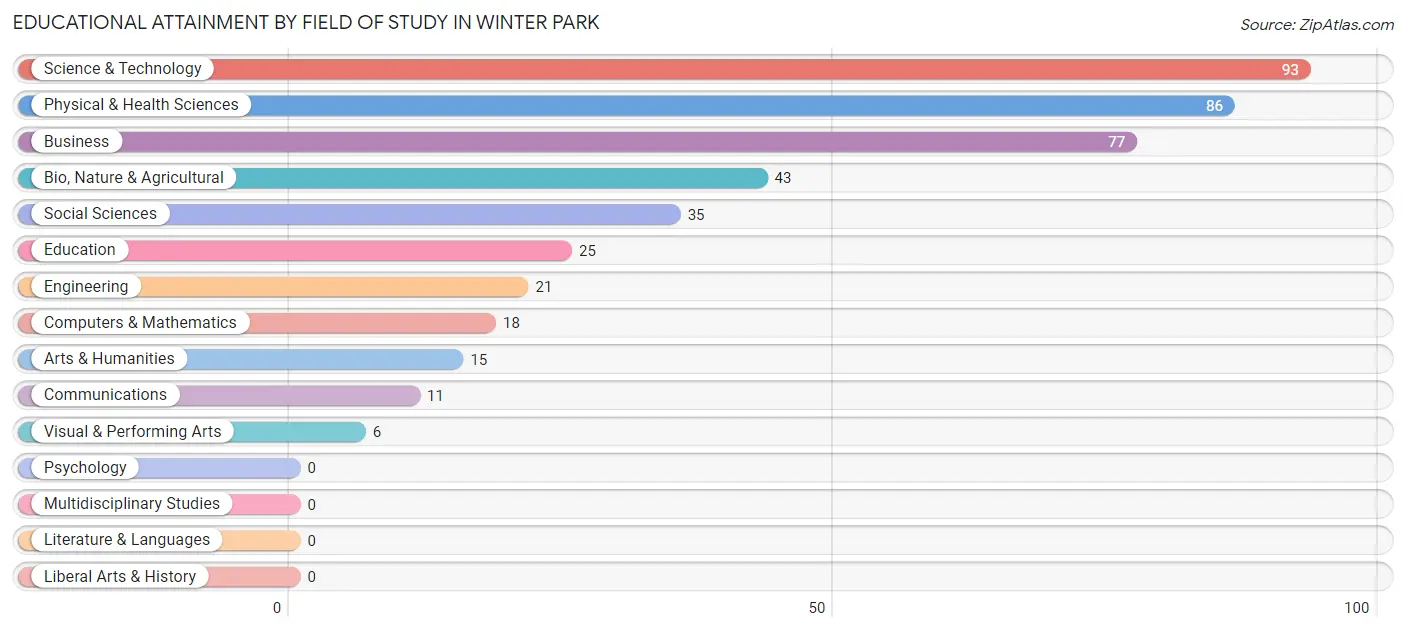
| Field of Study | # Graduates | % Graduates |
| Computers & Mathematics | 18 | 4.2% |
| Bio, Nature & Agricultural | 43 | 10.0% |
| Physical & Health Sciences | 86 | 20.0% |
| Psychology | 0 | 0.0% |
| Social Sciences | 35 | 8.1% |
| Engineering | 21 | 4.9% |
| Multidisciplinary Studies | 0 | 0.0% |
| Science & Technology | 93 | 21.6% |
| Business | 77 | 17.9% |
| Education | 25 | 5.8% |
| Literature & Languages | 0 | 0.0% |
| Liberal Arts & History | 0 | 0.0% |
| Visual & Performing Arts | 6 | 1.4% |
| Communications | 11 | 2.6% |
| Arts & Humanities | 15 | 3.5% |
| Total | 430 | 100.0% |
Transportation & Commute in Winter Park
Vehicle Availability by Sex in Winter Park
The most prevalent vehicle ownership categories in Winter Park are males with 2 vehicles (164, accounting for 59.0%) and females with 2 vehicles (89, making up 91.1%).
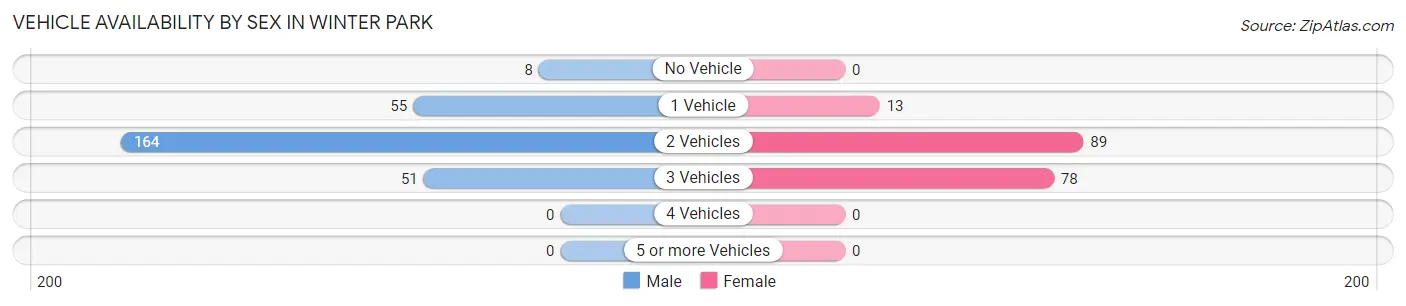
| Vehicles Available | Male | Female |
| No Vehicle | 8 (2.9%) | 0 (0.0%) |
| 1 Vehicle | 55 (19.8%) | 13 (7.2%) |
| 2 Vehicles | 164 (59.0%) | 89 (49.4%) |
| 3 Vehicles | 51 (18.3%) | 78 (43.3%) |
| 4 Vehicles | 0 (0.0%) | 0 (0.0%) |
| 5 or more Vehicles | 0 (0.0%) | 0 (0.0%) |
| Total | 278 (100.0%) | 180 (100.0%) |
Commute Time in Winter Park
The most frequently occuring commute durations in Winter Park are 30 to 34 minutes (76 commuters, 21.0%), 45 to 59 minutes (65 commuters, 18.0%), and 5 to 9 minutes (59 commuters, 16.3%).
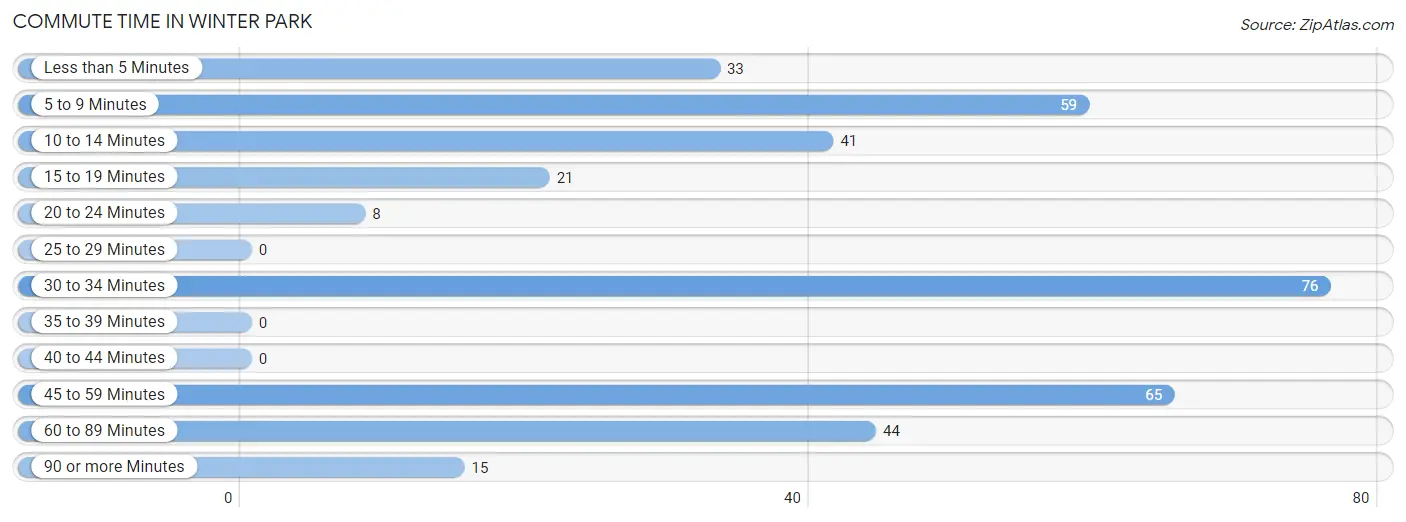
| Commute Time | # Commuters | % Commuters |
| Less than 5 Minutes | 33 | 9.1% |
| 5 to 9 Minutes | 59 | 16.3% |
| 10 to 14 Minutes | 41 | 11.3% |
| 15 to 19 Minutes | 21 | 5.8% |
| 20 to 24 Minutes | 8 | 2.2% |
| 25 to 29 Minutes | 0 | 0.0% |
| 30 to 34 Minutes | 76 | 21.0% |
| 35 to 39 Minutes | 0 | 0.0% |
| 40 to 44 Minutes | 0 | 0.0% |
| 45 to 59 Minutes | 65 | 18.0% |
| 60 to 89 Minutes | 44 | 12.1% |
| 90 or more Minutes | 15 | 4.1% |
Commute Time by Sex in Winter Park
The most common commute times in Winter Park are 45 to 59 minutes (65 commuters, 29.9%) for males and 30 to 34 minutes (58 commuters, 40.0%) for females.
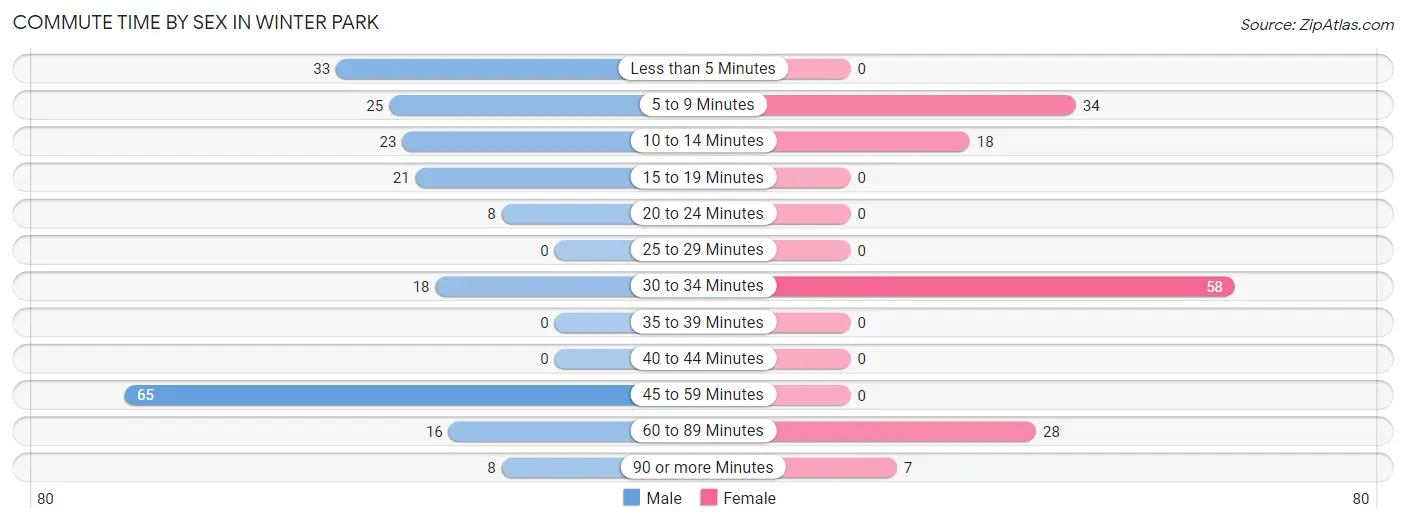
| Commute Time | Male | Female |
| Less than 5 Minutes | 33 (15.2%) | 0 (0.0%) |
| 5 to 9 Minutes | 25 (11.5%) | 34 (23.4%) |
| 10 to 14 Minutes | 23 (10.6%) | 18 (12.4%) |
| 15 to 19 Minutes | 21 (9.7%) | 0 (0.0%) |
| 20 to 24 Minutes | 8 (3.7%) | 0 (0.0%) |
| 25 to 29 Minutes | 0 (0.0%) | 0 (0.0%) |
| 30 to 34 Minutes | 18 (8.3%) | 58 (40.0%) |
| 35 to 39 Minutes | 0 (0.0%) | 0 (0.0%) |
| 40 to 44 Minutes | 0 (0.0%) | 0 (0.0%) |
| 45 to 59 Minutes | 65 (29.9%) | 0 (0.0%) |
| 60 to 89 Minutes | 16 (7.4%) | 28 (19.3%) |
| 90 or more Minutes | 8 (3.7%) | 7 (4.8%) |
Time of Departure to Work by Sex in Winter Park
The most frequent times of departure to work in Winter Park are 5:30 AM to 5:59 AM (73, 33.6%) for males and 8:00 AM to 8:29 AM (52, 35.9%) for females.
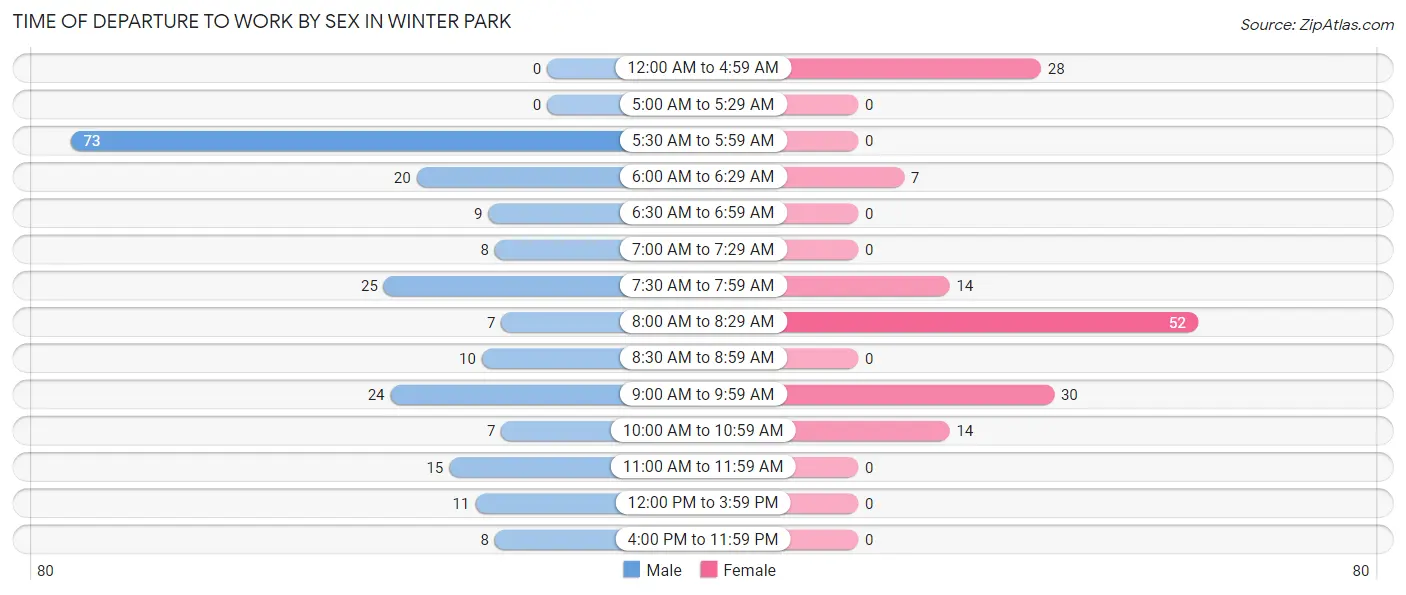
| Time of Departure | Male | Female |
| 12:00 AM to 4:59 AM | 0 (0.0%) | 28 (19.3%) |
| 5:00 AM to 5:29 AM | 0 (0.0%) | 0 (0.0%) |
| 5:30 AM to 5:59 AM | 73 (33.6%) | 0 (0.0%) |
| 6:00 AM to 6:29 AM | 20 (9.2%) | 7 (4.8%) |
| 6:30 AM to 6:59 AM | 9 (4.2%) | 0 (0.0%) |
| 7:00 AM to 7:29 AM | 8 (3.7%) | 0 (0.0%) |
| 7:30 AM to 7:59 AM | 25 (11.5%) | 14 (9.7%) |
| 8:00 AM to 8:29 AM | 7 (3.2%) | 52 (35.9%) |
| 8:30 AM to 8:59 AM | 10 (4.6%) | 0 (0.0%) |
| 9:00 AM to 9:59 AM | 24 (11.1%) | 30 (20.7%) |
| 10:00 AM to 10:59 AM | 7 (3.2%) | 14 (9.7%) |
| 11:00 AM to 11:59 AM | 15 (6.9%) | 0 (0.0%) |
| 12:00 PM to 3:59 PM | 11 (5.1%) | 0 (0.0%) |
| 4:00 PM to 11:59 PM | 8 (3.7%) | 0 (0.0%) |
| Total | 217 (100.0%) | 145 (100.0%) |
Housing Occupancy in Winter Park
Occupancy by Ownership in Winter Park
Of the total 360 dwellings in Winter Park, owner-occupied units account for 242 (67.2%), while renter-occupied units make up 118 (32.8%).
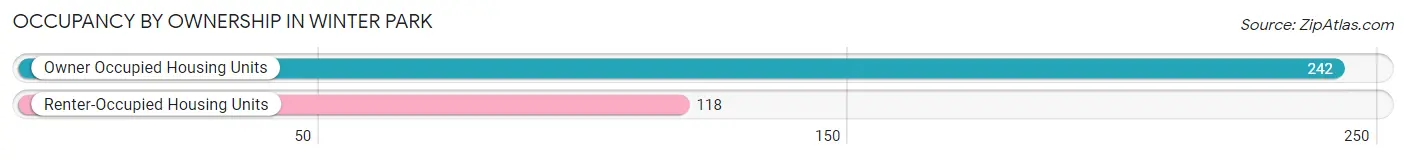
| Occupancy | # Housing Units | % Housing Units |
| Owner Occupied Housing Units | 242 | 67.2% |
| Renter-Occupied Housing Units | 118 | 32.8% |
| Total Occupied Housing Units | 360 | 100.0% |
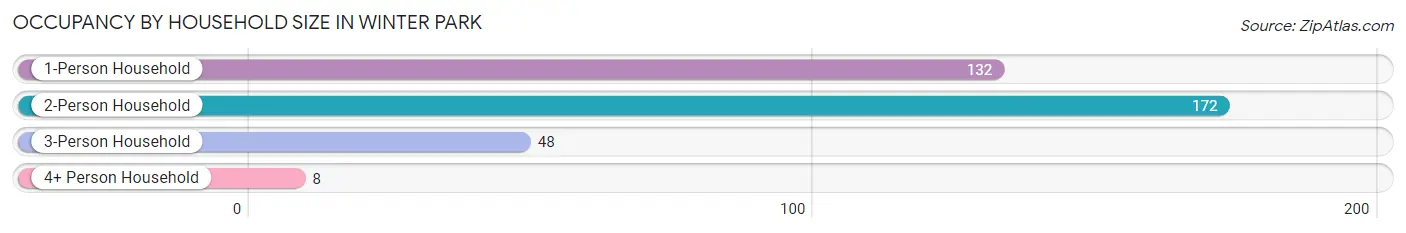
Occupancy by Household Size in Winter Park
| Household Size | # Housing Units | % Housing Units |
| 1-Person Household | 132 | 36.7% |
| 2-Person Household | 172 | 47.8% |
| 3-Person Household | 48 | 13.3% |
| 4+ Person Household | 8 | 2.2% |
| Total Housing Units | 360 | 100.0% |
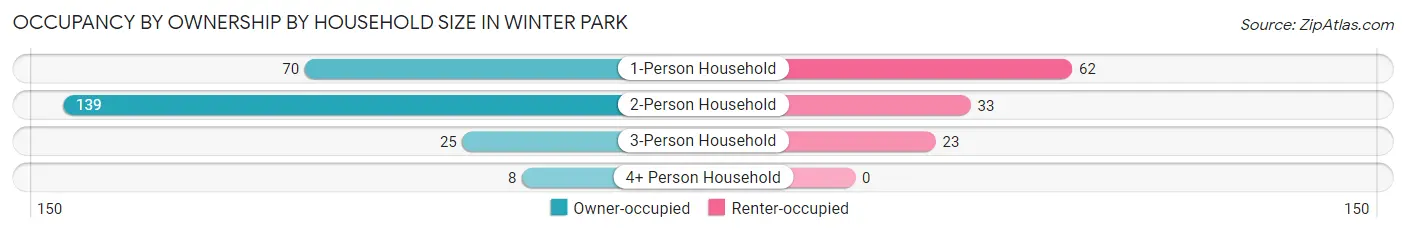
Occupancy by Ownership by Household Size in Winter Park
| Household Size | Owner-occupied | Renter-occupied |
| 1-Person Household | 70 (53.0%) | 62 (47.0%) |
| 2-Person Household | 139 (80.8%) | 33 (19.2%) |
| 3-Person Household | 25 (52.1%) | 23 (47.9%) |
| 4+ Person Household | 8 (100.0%) | 0 (0.0%) |
| Total Housing Units | 242 (67.2%) | 118 (32.8%) |
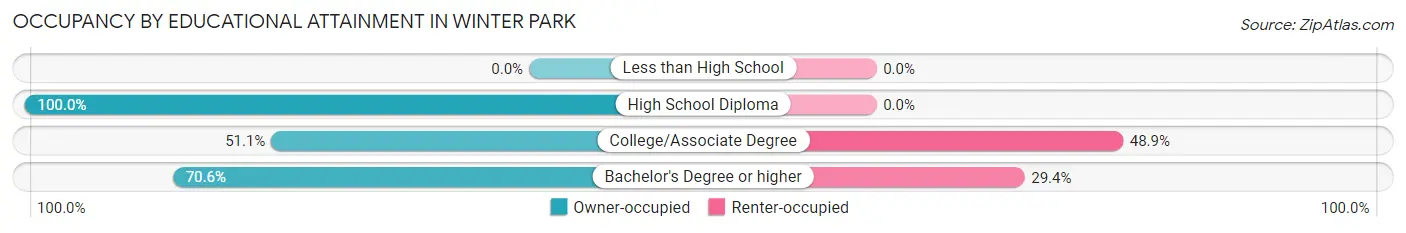
Occupancy by Educational Attainment in Winter Park
| Household Size | Owner-occupied | Renter-occupied |
| Less than High School | 0 (0.0%) | 0 (0.0%) |
| High School Diploma | 18 (100.0%) | 0 (0.0%) |
| College/Associate Degree | 46 (51.1%) | 44 (48.9%) |
| Bachelor's Degree or higher | 178 (70.6%) | 74 (29.4%) |
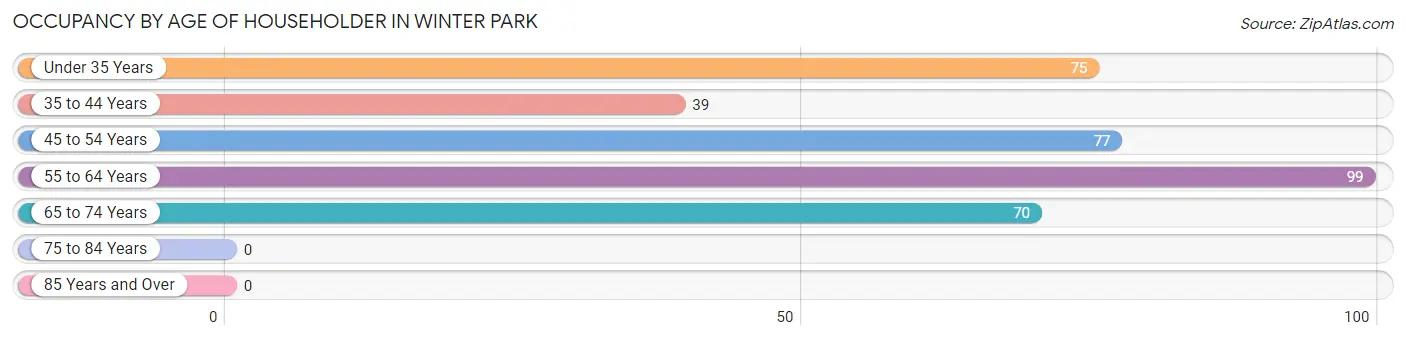
Occupancy by Age of Householder in Winter Park
| Age Bracket | # Households | % Households |
| Under 35 Years | 75 | 20.8% |
| 35 to 44 Years | 39 | 10.8% |
| 45 to 54 Years | 77 | 21.4% |
| 55 to 64 Years | 99 | 27.5% |
| 65 to 74 Years | 70 | 19.4% |
| 75 to 84 Years | 0 | 0.0% |
| 85 Years and Over | 0 | 0.0% |
| Total | 360 | 100.0% |
Housing Finances in Winter Park
Median Income by Occupancy in Winter Park
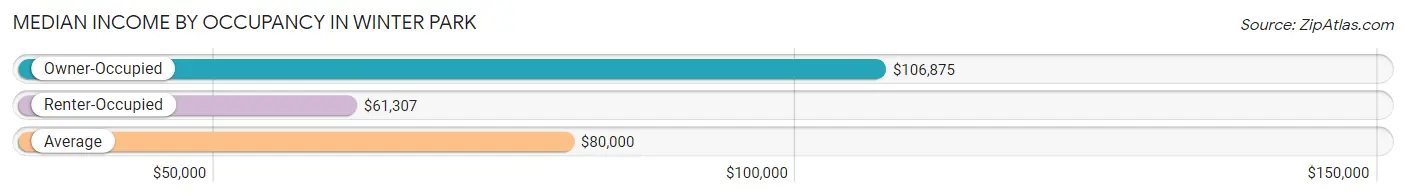
| Occupancy Type | # Households | Median Income |
| Owner-Occupied | 242 (67.2%) | $106,875 |
| Renter-Occupied | 118 (32.8%) | $61,307 |
| Average | 360 (100.0%) | $80,000 |
Occupancy by Householder Income Bracket in Winter Park
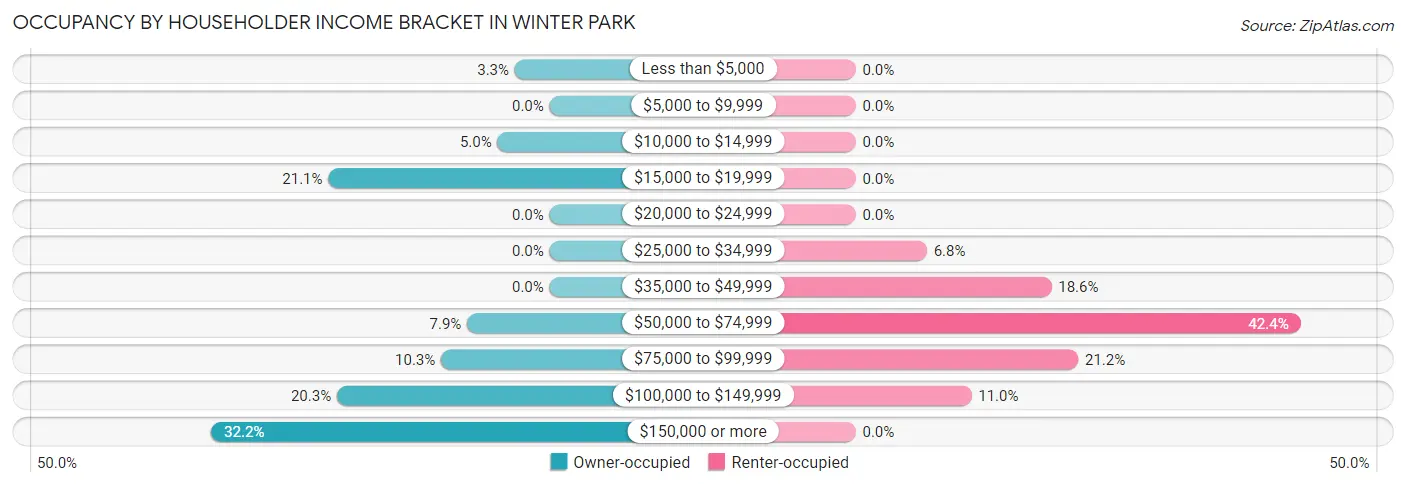
| Income Bracket | Owner-occupied | Renter-occupied |
| Less than $5,000 | 8 (3.3%) | 0 (0.0%) |
| $5,000 to $9,999 | 0 (0.0%) | 0 (0.0%) |
| $10,000 to $14,999 | 12 (5.0%) | 0 (0.0%) |
| $15,000 to $19,999 | 51 (21.1%) | 0 (0.0%) |
| $20,000 to $24,999 | 0 (0.0%) | 0 (0.0%) |
| $25,000 to $34,999 | 0 (0.0%) | 8 (6.8%) |
| $35,000 to $49,999 | 0 (0.0%) | 22 (18.6%) |
| $50,000 to $74,999 | 19 (7.9%) | 50 (42.4%) |
| $75,000 to $99,999 | 25 (10.3%) | 25 (21.2%) |
| $100,000 to $149,999 | 49 (20.3%) | 13 (11.0%) |
| $150,000 or more | 78 (32.2%) | 0 (0.0%) |
| Total | 242 (100.0%) | 118 (100.0%) |
Monthly Housing Cost Tiers in Winter Park
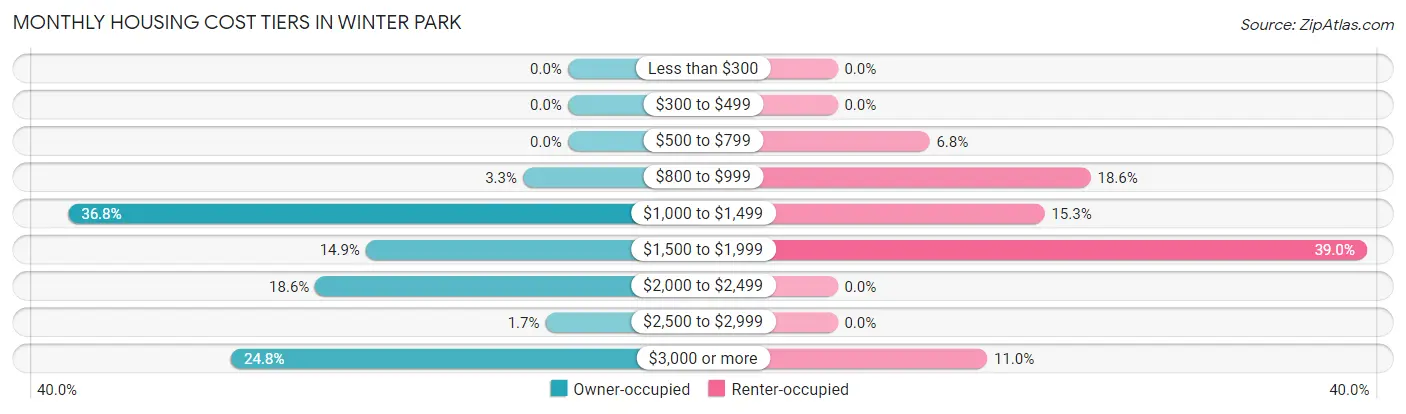
| Monthly Cost | Owner-occupied | Renter-occupied |
| Less than $300 | 0 (0.0%) | 0 (0.0%) |
| $300 to $499 | 0 (0.0%) | 0 (0.0%) |
| $500 to $799 | 0 (0.0%) | 8 (6.8%) |
| $800 to $999 | 8 (3.3%) | 22 (18.6%) |
| $1,000 to $1,499 | 89 (36.8%) | 18 (15.2%) |
| $1,500 to $1,999 | 36 (14.9%) | 46 (39.0%) |
| $2,000 to $2,499 | 45 (18.6%) | 0 (0.0%) |
| $2,500 to $2,999 | 4 (1.7%) | 0 (0.0%) |
| $3,000 or more | 60 (24.8%) | 13 (11.0%) |
| Total | 242 (100.0%) | 118 (100.0%) |
Physical Housing Characteristics in Winter Park
Housing Structures in Winter Park
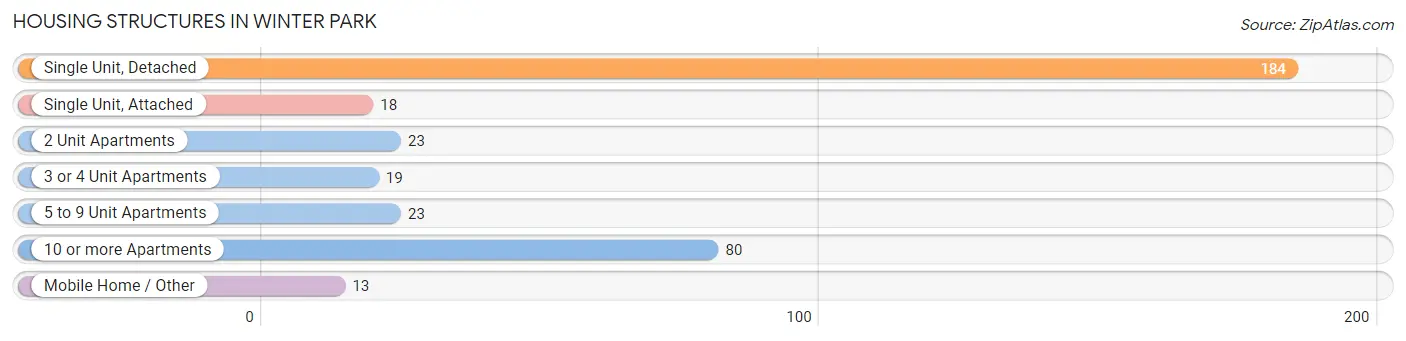
| Structure Type | # Housing Units | % Housing Units |
| Single Unit, Detached | 184 | 51.1% |
| Single Unit, Attached | 18 | 5.0% |
| 2 Unit Apartments | 23 | 6.4% |
| 3 or 4 Unit Apartments | 19 | 5.3% |
| 5 to 9 Unit Apartments | 23 | 6.4% |
| 10 or more Apartments | 80 | 22.2% |
| Mobile Home / Other | 13 | 3.6% |
| Total | 360 | 100.0% |
Housing Structures by Occupancy in Winter Park
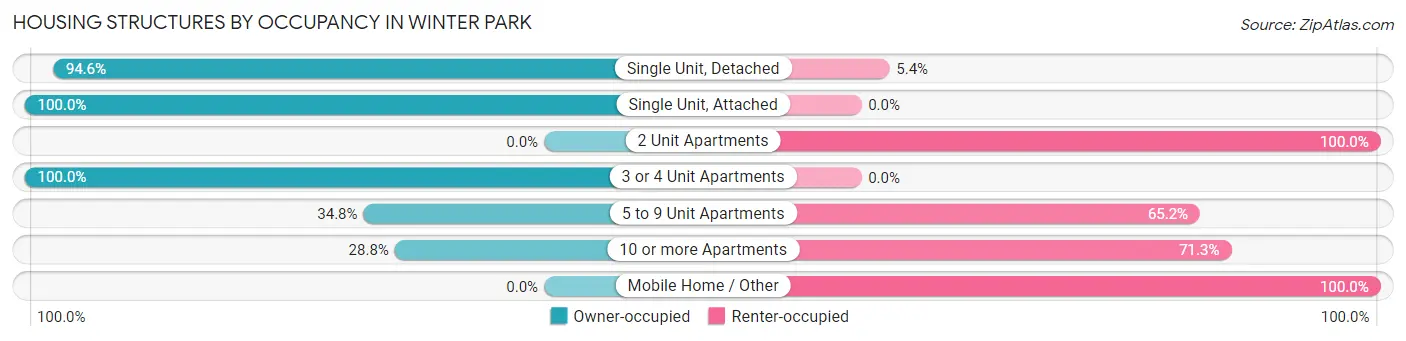
| Structure Type | Owner-occupied | Renter-occupied |
| Single Unit, Detached | 174 (94.6%) | 10 (5.4%) |
| Single Unit, Attached | 18 (100.0%) | 0 (0.0%) |
| 2 Unit Apartments | 0 (0.0%) | 23 (100.0%) |
| 3 or 4 Unit Apartments | 19 (100.0%) | 0 (0.0%) |
| 5 to 9 Unit Apartments | 8 (34.8%) | 15 (65.2%) |
| 10 or more Apartments | 23 (28.7%) | 57 (71.3%) |
| Mobile Home / Other | 0 (0.0%) | 13 (100.0%) |
| Total | 242 (67.2%) | 118 (32.8%) |
Housing Structures by Number of Rooms in Winter Park
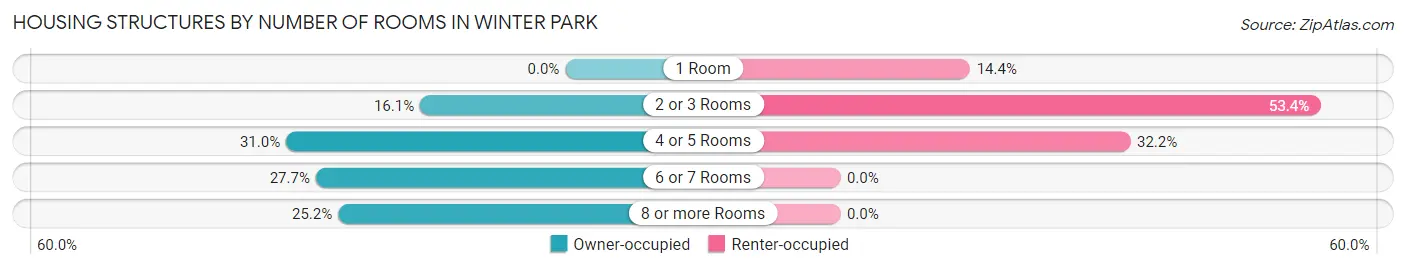
| Number of Rooms | Owner-occupied | Renter-occupied |
| 1 Room | 0 (0.0%) | 17 (14.4%) |
| 2 or 3 Rooms | 39 (16.1%) | 63 (53.4%) |
| 4 or 5 Rooms | 75 (31.0%) | 38 (32.2%) |
| 6 or 7 Rooms | 67 (27.7%) | 0 (0.0%) |
| 8 or more Rooms | 61 (25.2%) | 0 (0.0%) |
| Total | 242 (100.0%) | 118 (100.0%) |
Housing Structure by Heating Type in Winter Park
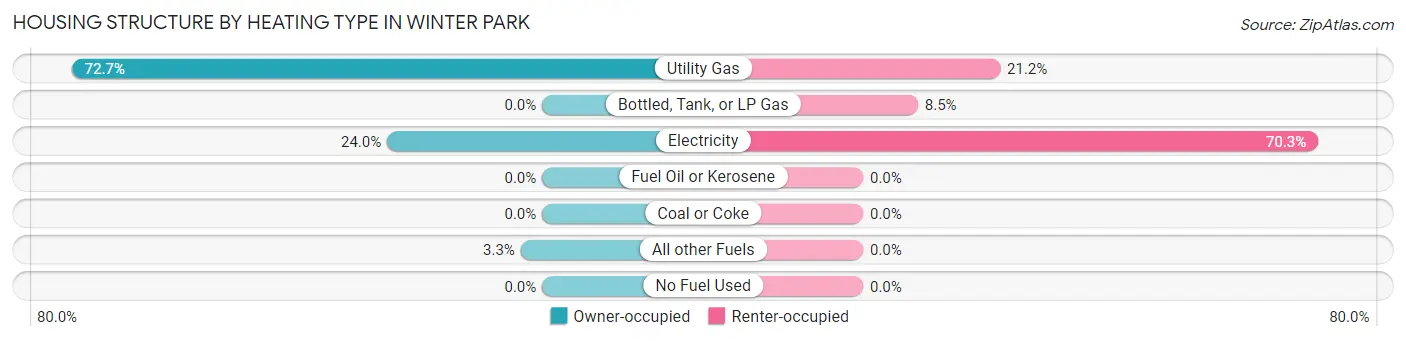
| Heating Type | Owner-occupied | Renter-occupied |
| Utility Gas | 176 (72.7%) | 25 (21.2%) |
| Bottled, Tank, or LP Gas | 0 (0.0%) | 10 (8.5%) |
| Electricity | 58 (24.0%) | 83 (70.3%) |
| Fuel Oil or Kerosene | 0 (0.0%) | 0 (0.0%) |
| Coal or Coke | 0 (0.0%) | 0 (0.0%) |
| All other Fuels | 8 (3.3%) | 0 (0.0%) |
| No Fuel Used | 0 (0.0%) | 0 (0.0%) |
| Total | 242 (100.0%) | 118 (100.0%) |
Household Vehicle Usage in Winter Park
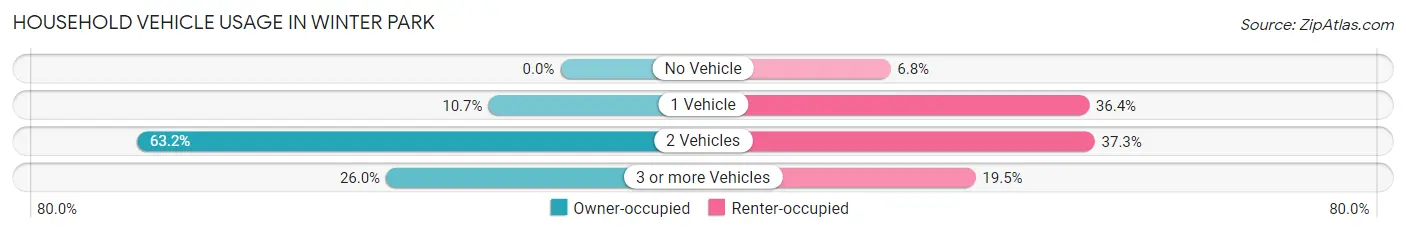
| Vehicles per Household | Owner-occupied | Renter-occupied |
| No Vehicle | 0 (0.0%) | 8 (6.8%) |
| 1 Vehicle | 26 (10.7%) | 43 (36.4%) |
| 2 Vehicles | 153 (63.2%) | 44 (37.3%) |
| 3 or more Vehicles | 63 (26.0%) | 23 (19.5%) |
| Total | 242 (100.0%) | 118 (100.0%) |
Real Estate & Mortgages in Winter Park
Real Estate and Mortgage Overview in Winter Park
| Characteristic | Without Mortgage | With Mortgage |
| Housing Units | 110 | 132 |
| Median Property Value | $361,800 | $875,000 |
| Median Household Income | - | - |
| Monthly Housing Costs | $1,333 | $60 |
| Real Estate Taxes | $5,802 | $0 |
Property Value by Mortgage Status in Winter Park
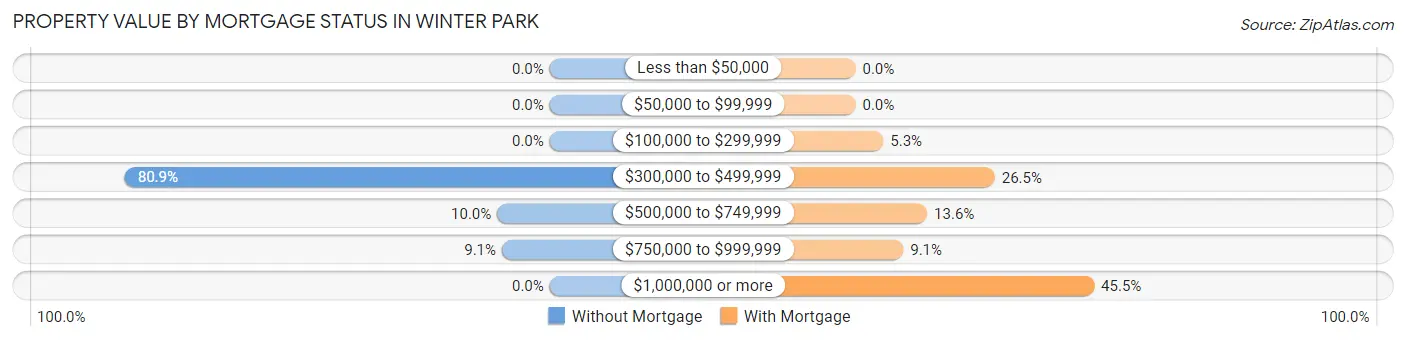
| Property Value | Without Mortgage | With Mortgage |
| Less than $50,000 | 0 (0.0%) | 0 (0.0%) |
| $50,000 to $99,999 | 0 (0.0%) | 0 (0.0%) |
| $100,000 to $299,999 | 0 (0.0%) | 7 (5.3%) |
| $300,000 to $499,999 | 89 (80.9%) | 35 (26.5%) |
| $500,000 to $749,999 | 11 (10.0%) | 18 (13.6%) |
| $750,000 to $999,999 | 10 (9.1%) | 12 (9.1%) |
| $1,000,000 or more | 0 (0.0%) | 60 (45.5%) |
| Total | 110 (100.0%) | 132 (100.0%) |
Household Income by Mortgage Status in Winter Park
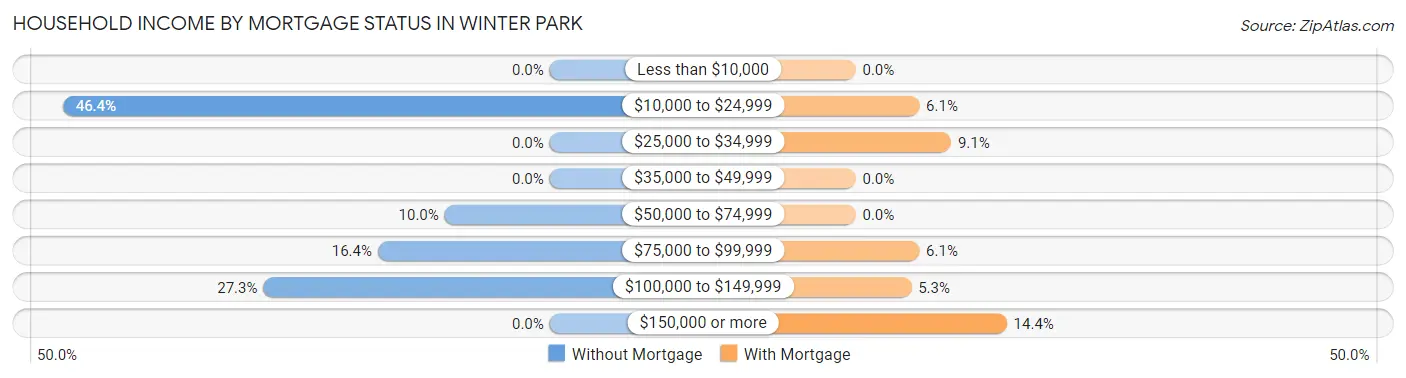
| Household Income | Without Mortgage | With Mortgage |
| Less than $10,000 | 0 (0.0%) | 0 (0.0%) |
| $10,000 to $24,999 | 51 (46.4%) | 8 (6.1%) |
| $25,000 to $34,999 | 0 (0.0%) | 12 (9.1%) |
| $35,000 to $49,999 | 0 (0.0%) | 0 (0.0%) |
| $50,000 to $74,999 | 11 (10.0%) | 0 (0.0%) |
| $75,000 to $99,999 | 18 (16.4%) | 8 (6.1%) |
| $100,000 to $149,999 | 30 (27.3%) | 7 (5.3%) |
| $150,000 or more | 0 (0.0%) | 19 (14.4%) |
| Total | 110 (100.0%) | 132 (100.0%) |
Property Value to Household Income Ratio in Winter Park
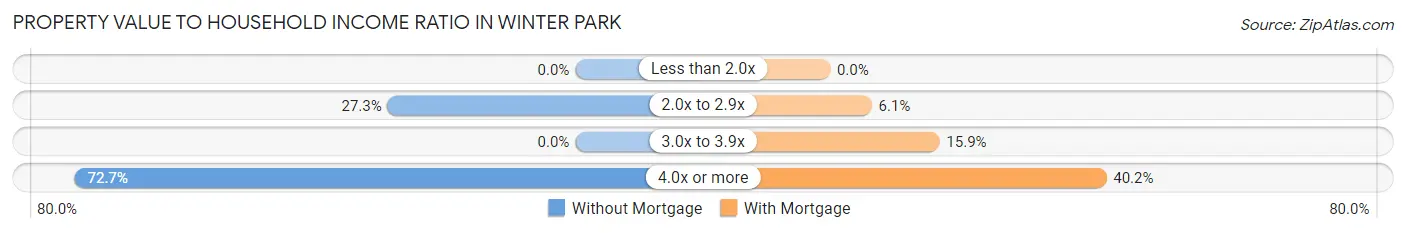
| Value-to-Income Ratio | Without Mortgage | With Mortgage |
| Less than 2.0x | 0 (0.0%) | 0 (0.0%) |
| 2.0x to 2.9x | 30 (27.3%) | 8 (6.1%) |
| 3.0x to 3.9x | 0 (0.0%) | 21 (15.9%) |
| 4.0x or more | 80 (72.7%) | 53 (40.2%) |
| Total | 110 (100.0%) | 132 (100.0%) |
Real Estate Taxes by Mortgage Status in Winter Park
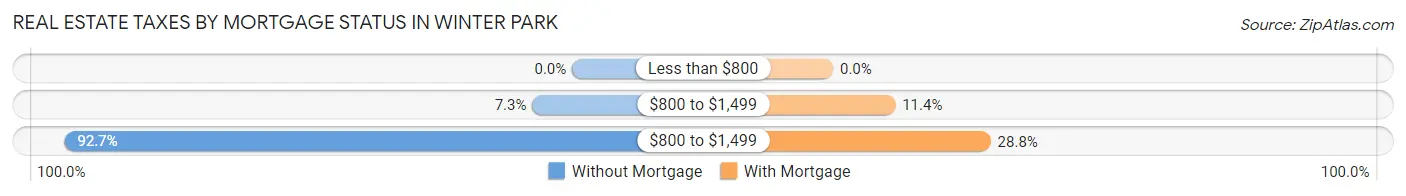
| Property Taxes | Without Mortgage | With Mortgage |
| Less than $800 | 0 (0.0%) | 0 (0.0%) |
| $800 to $1,499 | 8 (7.3%) | 15 (11.4%) |
| $800 to $1,499 | 102 (92.7%) | 38 (28.8%) |
| Total | 110 (100.0%) | 132 (100.0%) |
Health & Disability in Winter Park
Health Insurance Coverage by Age in Winter Park
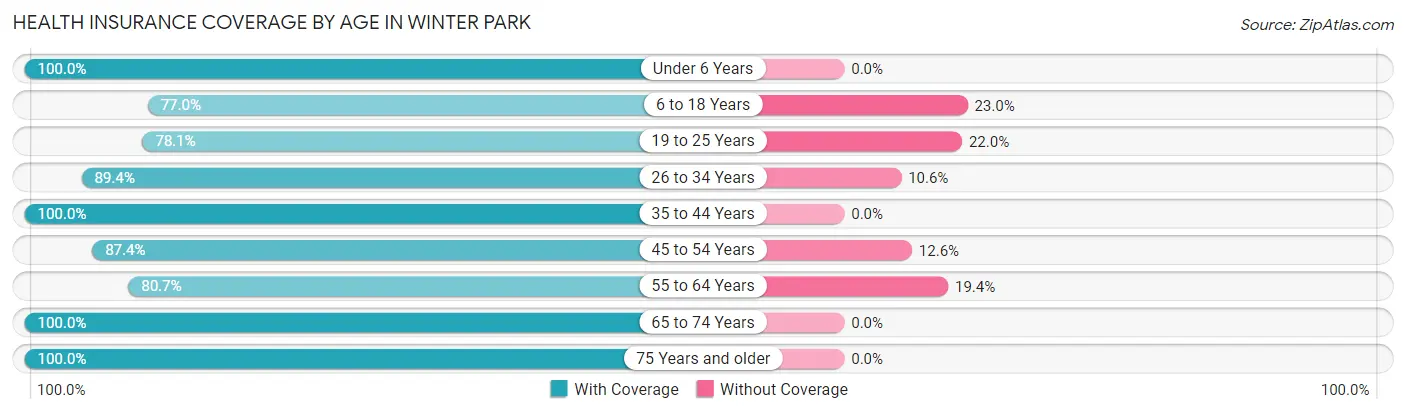
| Age Bracket | With Coverage | Without Coverage |
| Under 6 Years | 3 (100.0%) | 0 (0.0%) |
| 6 to 18 Years | 57 (77.0%) | 17 (23.0%) |
| 19 to 25 Years | 96 (78.0%) | 27 (22.0%) |
| 26 to 34 Years | 59 (89.4%) | 7 (10.6%) |
| 35 to 44 Years | 50 (100.0%) | 0 (0.0%) |
| 45 to 54 Years | 104 (87.4%) | 15 (12.6%) |
| 55 to 64 Years | 125 (80.6%) | 30 (19.4%) |
| 65 to 74 Years | 89 (100.0%) | 0 (0.0%) |
| 75 Years and older | 83 (100.0%) | 0 (0.0%) |
| Total | 666 (87.4%) | 96 (12.6%) |
Health Insurance Coverage by Citizenship Status in Winter Park
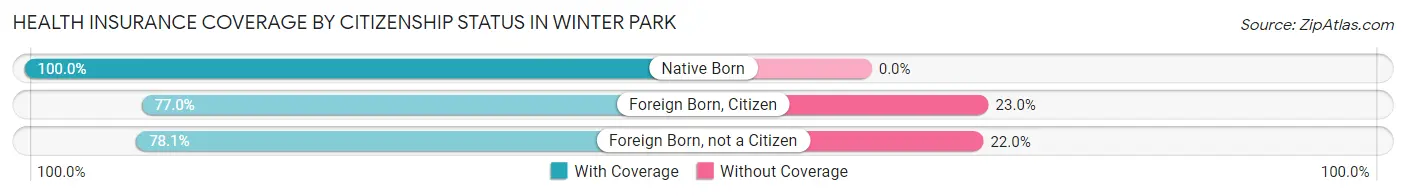
| Citizenship Status | With Coverage | Without Coverage |
| Native Born | 3 (100.0%) | 0 (0.0%) |
| Foreign Born, Citizen | 57 (77.0%) | 17 (23.0%) |
| Foreign Born, not a Citizen | 96 (78.0%) | 27 (22.0%) |
Health Insurance Coverage by Household Income in Winter Park
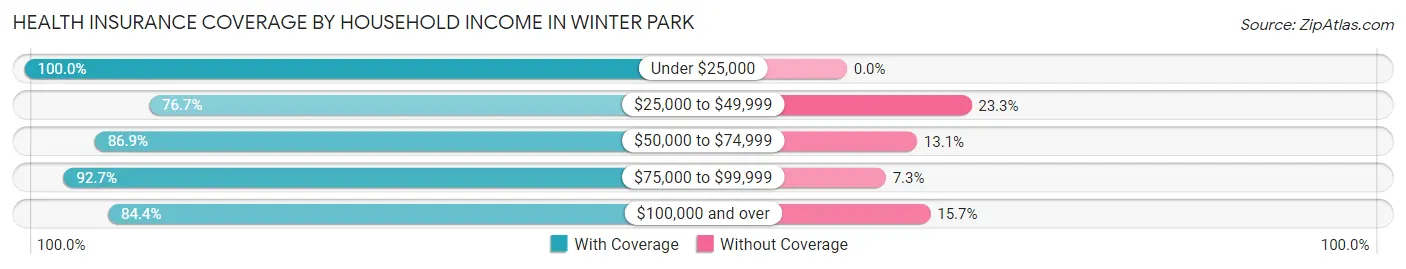
| Household Income | With Coverage | Without Coverage |
| Under $25,000 | 84 (100.0%) | 0 (0.0%) |
| $25,000 to $49,999 | 23 (76.7%) | 7 (23.3%) |
| $50,000 to $74,999 | 152 (86.9%) | 23 (13.1%) |
| $75,000 to $99,999 | 89 (92.7%) | 7 (7.3%) |
| $100,000 and over | 318 (84.4%) | 59 (15.7%) |
Public vs Private Health Insurance Coverage by Age in Winter Park
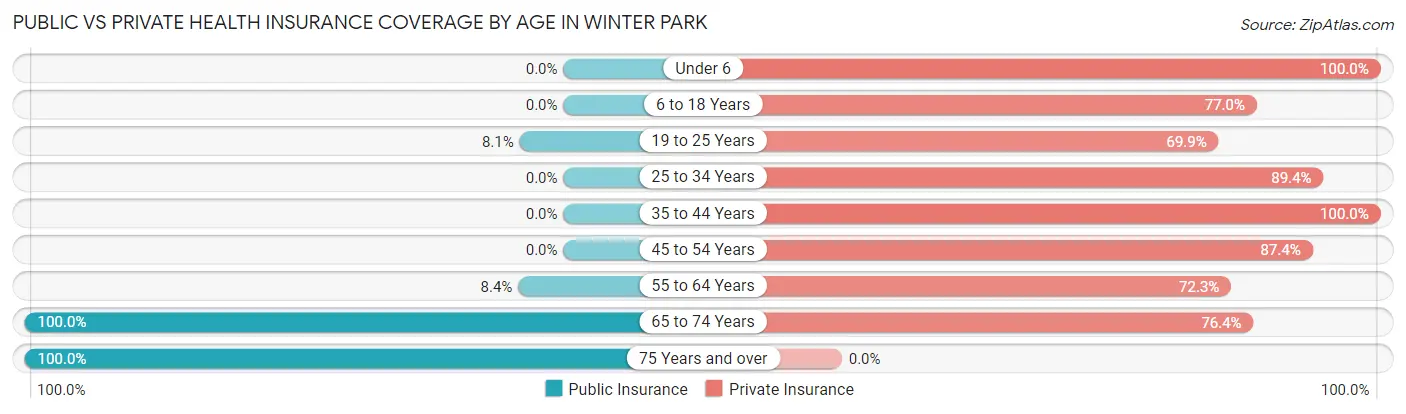
| Age Bracket | Public Insurance | Private Insurance |
| Under 6 | 0 (0.0%) | 3 (100.0%) |
| 6 to 18 Years | 0 (0.0%) | 57 (77.0%) |
| 19 to 25 Years | 10 (8.1%) | 86 (69.9%) |
| 25 to 34 Years | 0 (0.0%) | 59 (89.4%) |
| 35 to 44 Years | 0 (0.0%) | 50 (100.0%) |
| 45 to 54 Years | 0 (0.0%) | 104 (87.4%) |
| 55 to 64 Years | 13 (8.4%) | 112 (72.3%) |
| 65 to 74 Years | 89 (100.0%) | 68 (76.4%) |
| 75 Years and over | 83 (100.0%) | 0 (0.0%) |
| Total | 195 (25.6%) | 539 (70.7%) |
Disability Status by Sex by Age in Winter Park
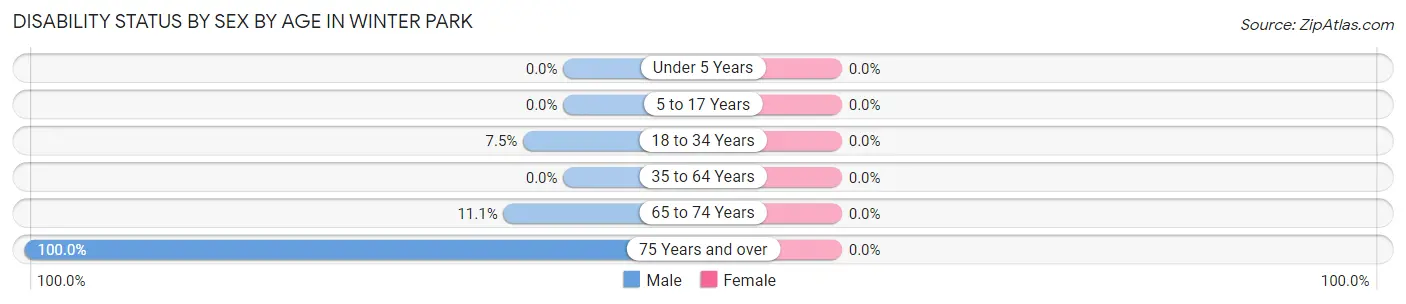
| Age Bracket | Male | Female |
| Under 5 Years | 0 (0.0%) | 0 (0.0%) |
| 5 to 17 Years | 0 (0.0%) | 0 (0.0%) |
| 18 to 34 Years | 10 (7.5%) | 0 (0.0%) |
| 35 to 64 Years | 0 (0.0%) | 0 (0.0%) |
| 65 to 74 Years | 9 (11.1%) | 0 (0.0%) |
| 75 Years and over | 83 (100.0%) | 0 (0.0%) |
Disability Class by Sex by Age in Winter Park
Disability Class: Hearing Difficulty
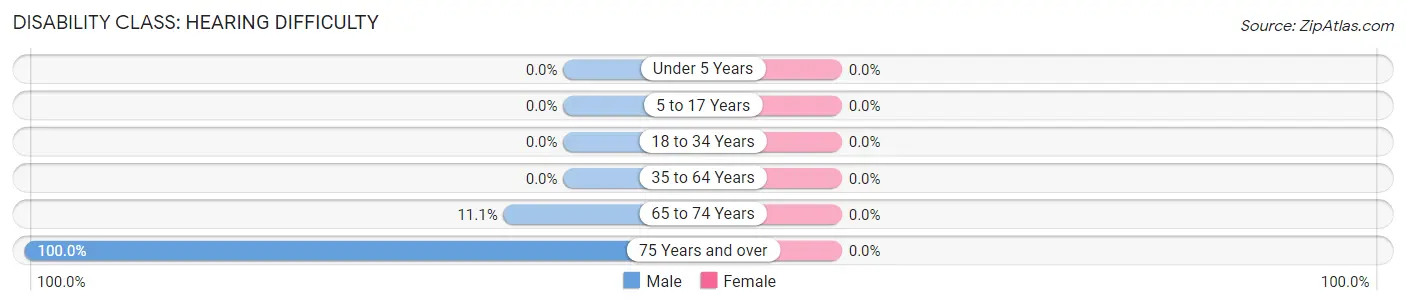
| Age Bracket | Male | Female |
| Under 5 Years | 0 (0.0%) | 0 (0.0%) |
| 5 to 17 Years | 0 (0.0%) | 0 (0.0%) |
| 18 to 34 Years | 0 (0.0%) | 0 (0.0%) |
| 35 to 64 Years | 0 (0.0%) | 0 (0.0%) |
| 65 to 74 Years | 9 (11.1%) | 0 (0.0%) |
| 75 Years and over | 83 (100.0%) | 0 (0.0%) |
Disability Class: Vision Difficulty
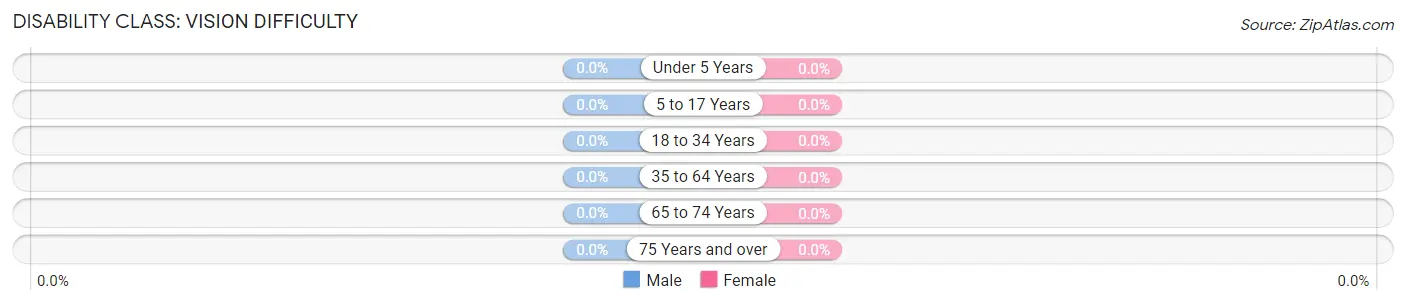
| Age Bracket | Male | Female |
| Under 5 Years | 0 (0.0%) | 0 (0.0%) |
| 5 to 17 Years | 0 (0.0%) | 0 (0.0%) |
| 18 to 34 Years | 0 (0.0%) | 0 (0.0%) |
| 35 to 64 Years | 0 (0.0%) | 0 (0.0%) |
| 65 to 74 Years | 0 (0.0%) | 0 (0.0%) |
| 75 Years and over | 0 (0.0%) | 0 (0.0%) |
Disability Class: Cognitive Difficulty
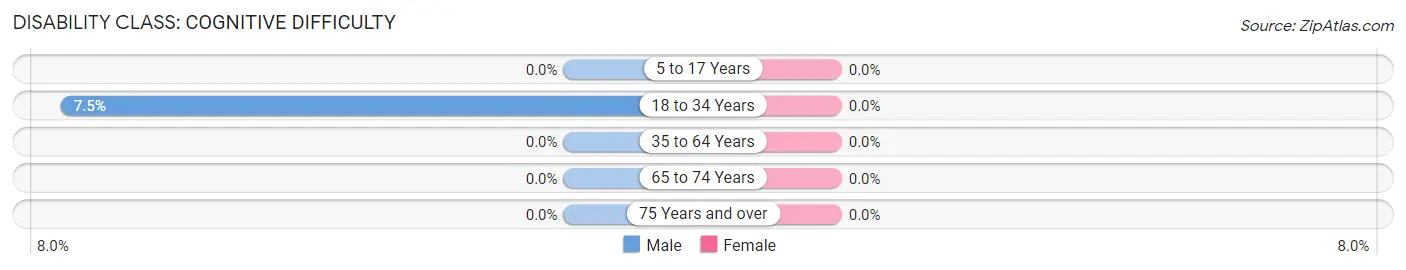
| Age Bracket | Male | Female |
| 5 to 17 Years | 0 (0.0%) | 0 (0.0%) |
| 18 to 34 Years | 10 (7.5%) | 0 (0.0%) |
| 35 to 64 Years | 0 (0.0%) | 0 (0.0%) |
| 65 to 74 Years | 0 (0.0%) | 0 (0.0%) |
| 75 Years and over | 0 (0.0%) | 0 (0.0%) |
Disability Class: Ambulatory Difficulty
| Age Bracket | Male | Female |
| 5 to 17 Years | 0 (0.0%) | 0 (0.0%) |
| 18 to 34 Years | 0 (0.0%) | 0 (0.0%) |
| 35 to 64 Years | 0 (0.0%) | 0 (0.0%) |
| 65 to 74 Years | 0 (0.0%) | 0 (0.0%) |
| 75 Years and over | 0 (0.0%) | 0 (0.0%) |
Disability Class: Self-Care Difficulty
| Age Bracket | Male | Female |
| 5 to 17 Years | 0 (0.0%) | 0 (0.0%) |
| 18 to 34 Years | 0 (0.0%) | 0 (0.0%) |
| 35 to 64 Years | 0 (0.0%) | 0 (0.0%) |
| 65 to 74 Years | 0 (0.0%) | 0 (0.0%) |
| 75 Years and over | 0 (0.0%) | 0 (0.0%) |
Technology Access in Winter Park
Computing Device Access in Winter Park
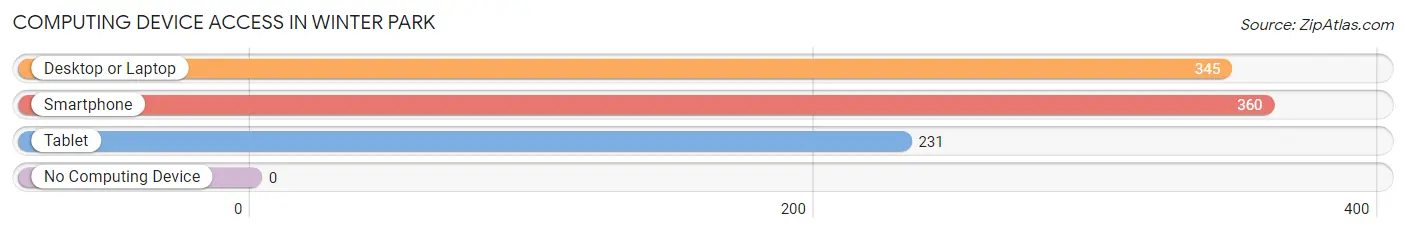
| Device Type | # Households | % Households |
| Desktop or Laptop | 345 | 95.8% |
| Smartphone | 360 | 100.0% |
| Tablet | 231 | 64.2% |
| No Computing Device | 0 | 0.0% |
| Total | 360 | 100.0% |
Internet Access in Winter Park
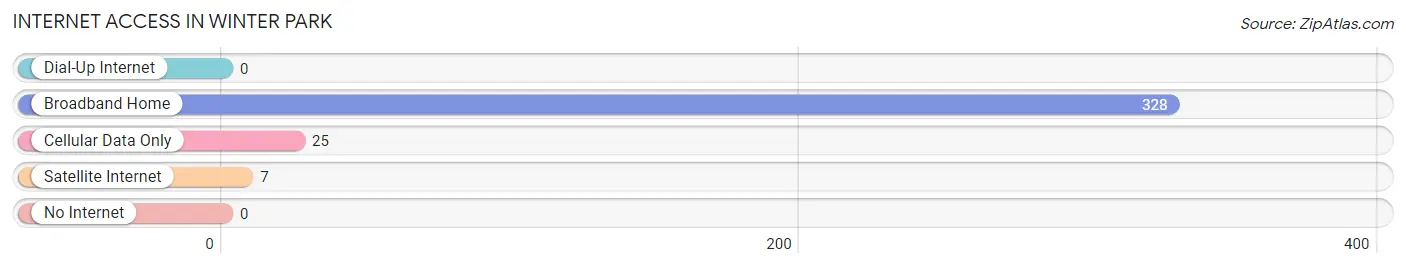
| Internet Type | # Households | % Households |
| Dial-Up Internet | 0 | 0.0% |
| Broadband Home | 328 | 91.1% |
| Cellular Data Only | 25 | 6.9% |
| Satellite Internet | 7 | 1.9% |
| No Internet | 0 | 0.0% |
| Total | 360 | 100.0% |
Winter Park Summary
Winter Park, Colorado is a small mountain town located in Grand County, Colorado. It is situated in the Rocky Mountains, approximately 90 miles northwest of Denver. The town is known for its skiing and snowboarding, and is home to the Winter Park Resort, one of the largest ski resorts in the United States. The town has a population of approximately 500 people, and is a popular tourist destination for those looking to enjoy the outdoors.
Geography
Winter Park is located in the Rocky Mountains, at an elevation of 9,078 feet. The town is situated in the Fraser Valley, which is surrounded by the Arapaho National Forest and the Indian Peaks Wilderness. The Fraser River runs through the town, and is a popular spot for fishing and rafting. The town is located in a high mountain valley, and is surrounded by mountains on all sides. The highest peak in the area is Mount Flora, which stands at an elevation of 12,324 feet.
Climate
Winter Park has a humid continental climate, with cold winters and warm summers. The average temperature in the winter is around 20 degrees Fahrenheit, and the average temperature in the summer is around 70 degrees Fahrenheit. The town receives an average of around 200 inches of snow each year, making it a popular destination for skiing and snowboarding.
Economy
Winter Park’s economy is largely based on tourism. The town is home to the Winter Park Resort, which is one of the largest ski resorts in the United States. The resort attracts thousands of visitors each year, and is a major source of revenue for the town. Other popular tourist attractions in the area include the Fraser River Trail, the YMCA of the Rockies, and the Winter Park Ski Area. The town also has a number of restaurants, bars, and shops that cater to tourists.
Demographics
As of the 2010 census, the population of Winter Park was 500 people. The racial makeup of the town was 95.2% White, 0.6% African American, 0.4% Native American, 0.4% Asian, 0.2% Pacific Islander, 1.2% from other races, and 2.0% from two or more races. The median household income in the town was $50,000, and the median family income was $60,000.
Conclusion
Winter Park, Colorado is a small mountain town located in Grand County, Colorado. It is situated in the Rocky Mountains, and is known for its skiing and snowboarding. The town has a population of approximately 500 people, and is a popular tourist destination for those looking to enjoy the outdoors. The town’s economy is largely based on tourism, and the town is home to the Winter Park Resort, one of the largest ski resorts in the United States. The town has a humid continental climate, with cold winters and warm summers. The racial makeup of the town is predominantly White, with a small percentage of African American, Native American, Asian, and Pacific Islander residents. The median household income in the town is $50,000, and the median family income is $60,000.
Common Questions
What is Per Capita Income in Winter Park?
Per Capita income in Winter Park is $66,619.
What is the Median Family Income in Winter Park?
Median Family Income in Winter Park is $138,500.
What is the Median Household income in Winter Park?
Median Household Income in Winter Park is $80,000.
What is Income or Wage Gap in Winter Park?
Income or Wage Gap in Winter Park is 2.3%.
Women in Winter Park earn 97.7 cents for every dollar earned by a man.
What is Inequality or Gini Index in Winter Park?
Inequality or Gini Index in Winter Park is 0.53.
What is the Total Population of Winter Park?
Total Population of Winter Park is 762.
What is the Total Male Population of Winter Park?
Total Male Population of Winter Park is 497.
What is the Total Female Population of Winter Park?
Total Female Population of Winter Park is 265.
What is the Ratio of Males per 100 Females in Winter Park?
There are 187.55 Males per 100 Females in Winter Park.
What is the Ratio of Females per 100 Males in Winter Park?
There are 53.32 Females per 100 Males in Winter Park.
What is the Median Population Age in Winter Park?
Median Population Age in Winter Park is 46.3 Years.
What is the Average Family Size in Winter Park
Average Family Size in Winter Park is 2.7 People.
What is the Average Household Size in Winter Park
Average Household Size in Winter Park is 2.1 People.
How Large is the Labor Force in Winter Park?
There are 490 People in the Labor Forcein in Winter Park.
What is the Percentage of People in the Labor Force in Winter Park?
66.4% of People are in the Labor Force in Winter Park.
What is the Unemployment Rate in Winter Park?
Unemployment Rate in Winter Park is 6.5%.