Stonegate, CO Map & Demographics
Stonegate Map
Stonegate Overview
$57,063
PER CAPITA INCOME
$163,920
AVG FAMILY INCOME
$150,741
AVG HOUSEHOLD INCOME
49.8%
WAGE / INCOME GAP [ % ]
50.2¢/ $1
WAGE / INCOME GAP [ $ ]
0.31
INEQUALITY / GINI INDEX
9,770
TOTAL POPULATION
4,656
MALE POPULATION
5,114
FEMALE POPULATION
91.04
MALES / 100 FEMALES
109.84
FEMALES / 100 MALES
38.2
MEDIAN AGE
3.1
AVG FAMILY SIZE
2.9
AVG HOUSEHOLD SIZE
5,492
LABOR FORCE [ PEOPLE ]
76.0%
PERCENT IN LABOR FORCE
3.5%
UNEMPLOYMENT RATE
Income in Stonegate
Income Overview in Stonegate
Per Capita Income in Stonegate is $57,063, while median incomes of families and households are $163,920 and $150,741 respectively.
| Characteristic | Number | Measure |
| Per Capita Income | 9,770 | $57,063 |
| Median Family Income | 2,883 | $163,920 |
| Mean Family Income | 2,883 | $173,172 |
| Median Household Income | 3,402 | $150,741 |
| Mean Household Income | 3,402 | $163,004 |
| Income Deficit | 2,883 | $0 |
| Wage / Income Gap (%) | 9,770 | 49.79% |
| Wage / Income Gap ($) | 9,770 | 50.21¢ per $1 |
| Gini / Inequality Index | 9,770 | 0.31 |
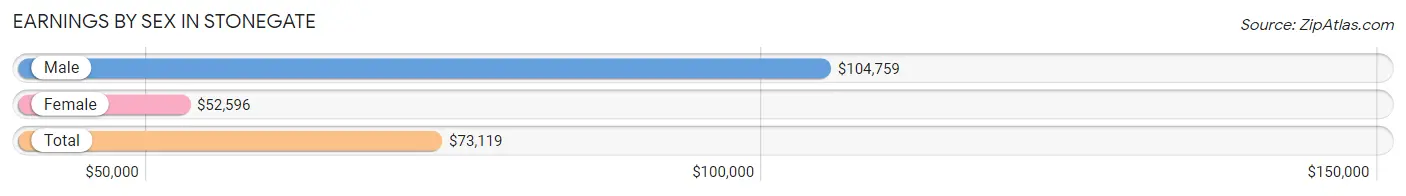
Earnings by Sex in Stonegate
Average Earnings in Stonegate are $73,119, $104,759 for men and $52,596 for women, a difference of 49.8%.
| Sex | Number | Average Earnings |
| Male | 2,839 (49.5%) | $104,759 |
| Female | 2,901 (50.5%) | $52,596 |
| Total | 5,740 (100.0%) | $73,119 |
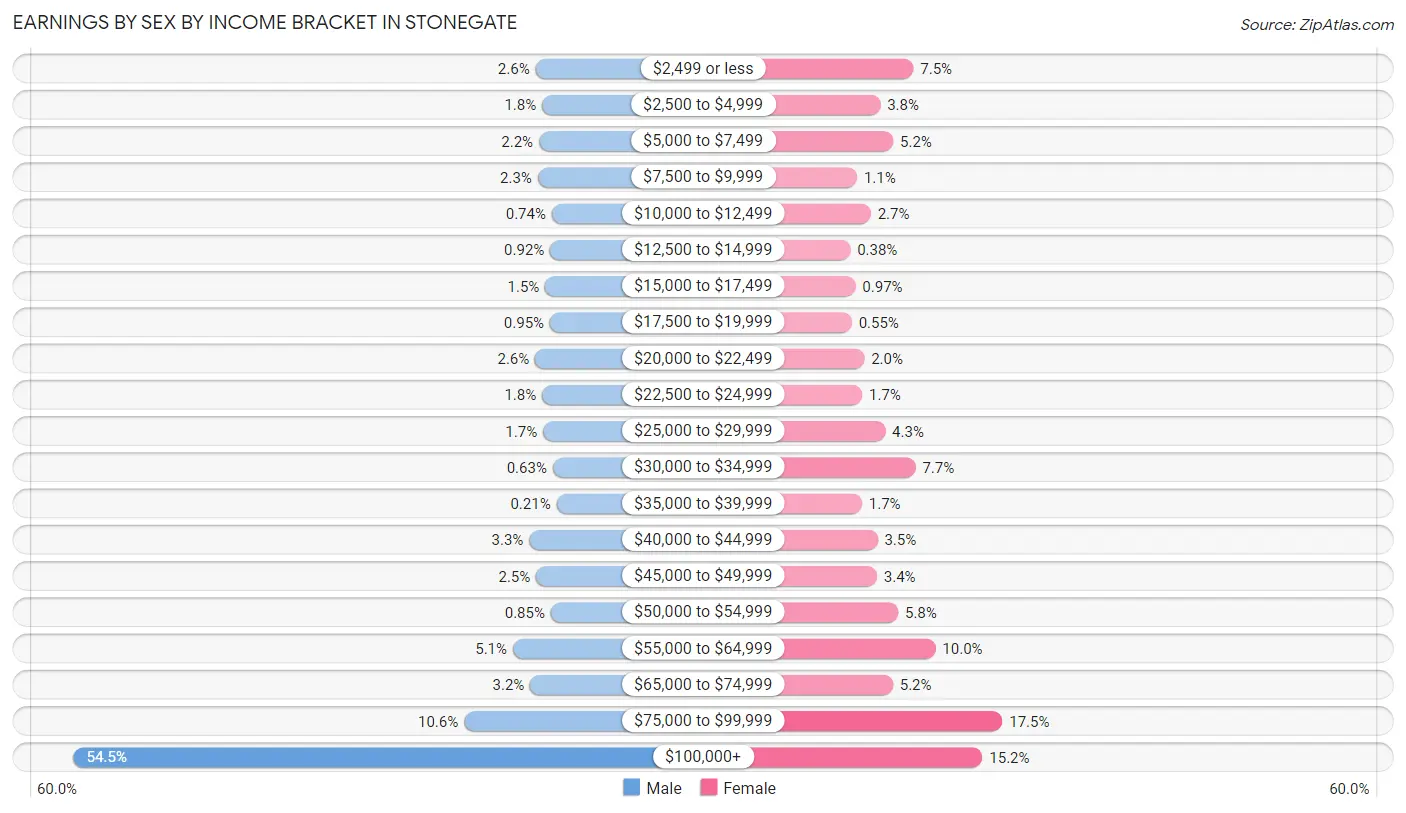
Earnings by Sex by Income Bracket in Stonegate
The most common earnings brackets in Stonegate are $100,000+ for men (1,547 | 54.5%) and $75,000 to $99,999 for women (507 | 17.5%).
| Income | Male | Female |
| $2,499 or less | 73 (2.6%) | 217 (7.5%) |
| $2,500 to $4,999 | 52 (1.8%) | 109 (3.8%) |
| $5,000 to $7,499 | 62 (2.2%) | 151 (5.2%) |
| $7,500 to $9,999 | 66 (2.3%) | 33 (1.1%) |
| $10,000 to $12,499 | 21 (0.7%) | 78 (2.7%) |
| $12,500 to $14,999 | 26 (0.9%) | 11 (0.4%) |
| $15,000 to $17,499 | 42 (1.5%) | 28 (1.0%) |
| $17,500 to $19,999 | 27 (0.9%) | 16 (0.5%) |
| $20,000 to $22,499 | 74 (2.6%) | 57 (2.0%) |
| $22,500 to $24,999 | 52 (1.8%) | 50 (1.7%) |
| $25,000 to $29,999 | 49 (1.7%) | 125 (4.3%) |
| $30,000 to $34,999 | 18 (0.6%) | 224 (7.7%) |
| $35,000 to $39,999 | 6 (0.2%) | 49 (1.7%) |
| $40,000 to $44,999 | 93 (3.3%) | 100 (3.5%) |
| $45,000 to $49,999 | 71 (2.5%) | 98 (3.4%) |
| $50,000 to $54,999 | 24 (0.9%) | 167 (5.8%) |
| $55,000 to $64,999 | 145 (5.1%) | 289 (10.0%) |
| $65,000 to $74,999 | 90 (3.2%) | 150 (5.2%) |
| $75,000 to $99,999 | 301 (10.6%) | 507 (17.5%) |
| $100,000+ | 1,547 (54.5%) | 442 (15.2%) |
| Total | 2,839 (100.0%) | 2,901 (100.0%) |
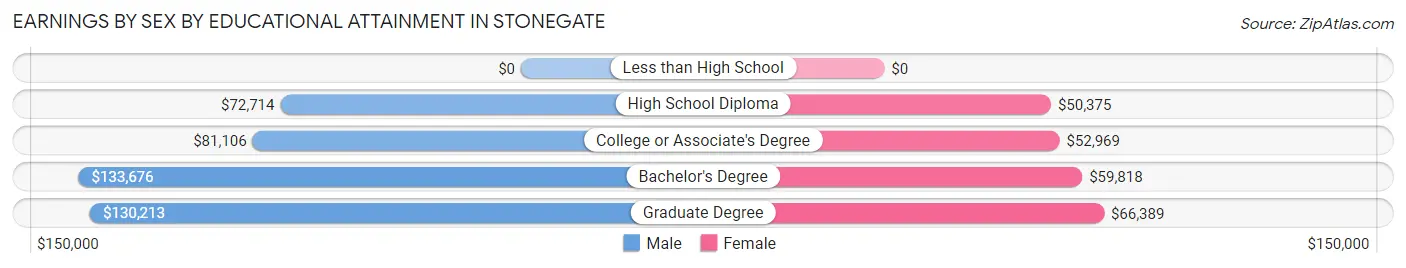
Earnings by Sex by Educational Attainment in Stonegate
Average earnings in Stonegate are $120,385 for men and $58,568 for women, a difference of 51.3%. Men with an educational attainment of bachelor's degree enjoy the highest average annual earnings of $133,676, while those with high school diploma education earn the least with $72,714. Women with an educational attainment of graduate degree earn the most with the average annual earnings of $66,389, while those with high school diploma education have the smallest earnings of $50,375.
| Educational Attainment | Male Income | Female Income |
| Less than High School | - | - |
| High School Diploma | $72,714 | $50,375 |
| College or Associate's Degree | $81,106 | $52,969 |
| Bachelor's Degree | $133,676 | $59,818 |
| Graduate Degree | $130,213 | $66,389 |
| Total | $120,385 | $58,568 |
Family Income in Stonegate
Family Income Brackets in Stonegate
According to the Stonegate family income data, there are 992 families falling into the $200,000+ income range, which is the most common income bracket and makes up 34.4% of all families.
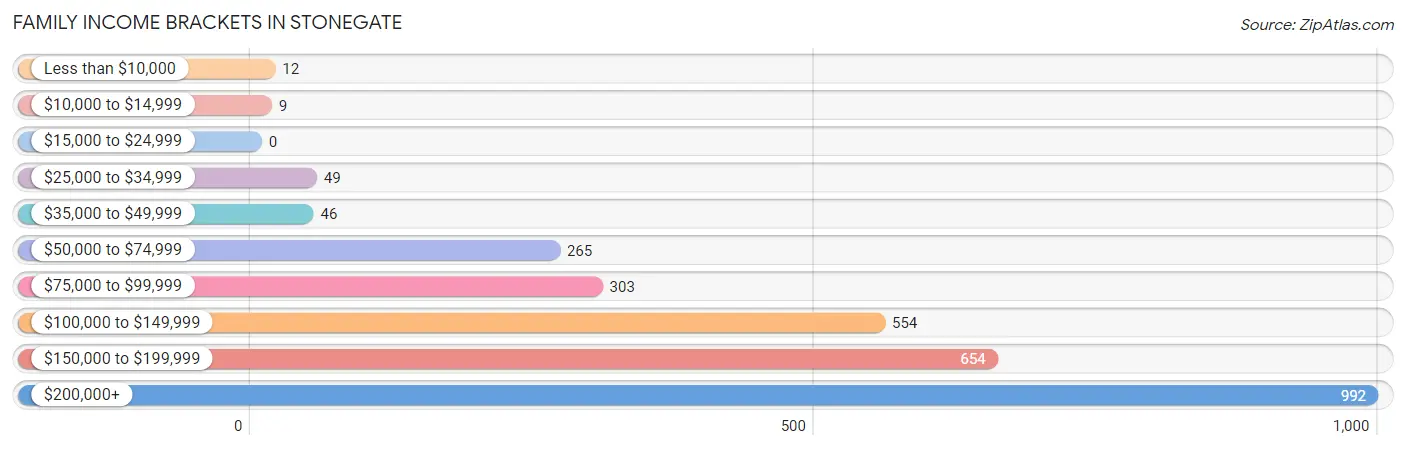
| Income Bracket | # Families | % Families |
| Less than $10,000 | 12 | 0.4% |
| $10,000 to $14,999 | 9 | 0.3% |
| $15,000 to $24,999 | 0 | 0.0% |
| $25,000 to $34,999 | 49 | 1.7% |
| $35,000 to $49,999 | 46 | 1.6% |
| $50,000 to $74,999 | 265 | 9.2% |
| $75,000 to $99,999 | 303 | 10.5% |
| $100,000 to $149,999 | 554 | 19.2% |
| $150,000 to $199,999 | 654 | 22.7% |
| $200,000+ | 992 | 34.4% |
Family Income by Famaliy Size in Stonegate
5-person families (237 | 8.2%) account for the highest median family income in Stonegate with $225,739 per family, while 2-person families (1,077 | 37.4%) have the highest median income of $68,980 per family member.
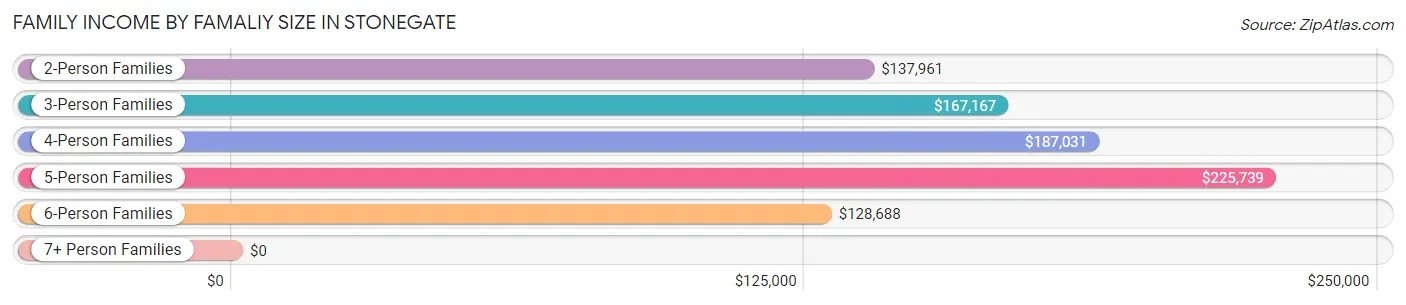
| Income Bracket | # Families | Median Income |
| 2-Person Families | 1,077 (37.4%) | $137,961 |
| 3-Person Families | 726 (25.2%) | $167,167 |
| 4-Person Families | 776 (26.9%) | $187,031 |
| 5-Person Families | 237 (8.2%) | $225,739 |
| 6-Person Families | 67 (2.3%) | $128,688 |
| 7+ Person Families | 0 (0.0%) | $0 |
| Total | 2,883 (100.0%) | $163,920 |
Family Income by Number of Earners in Stonegate
The median family income in Stonegate is $163,920, with families comprising 3+ earners (396) having the highest median family income of $208,214, while families with no earners (177) have the lowest median family income of $67,426, accounting for 13.7% and 6.1% of families, respectively.
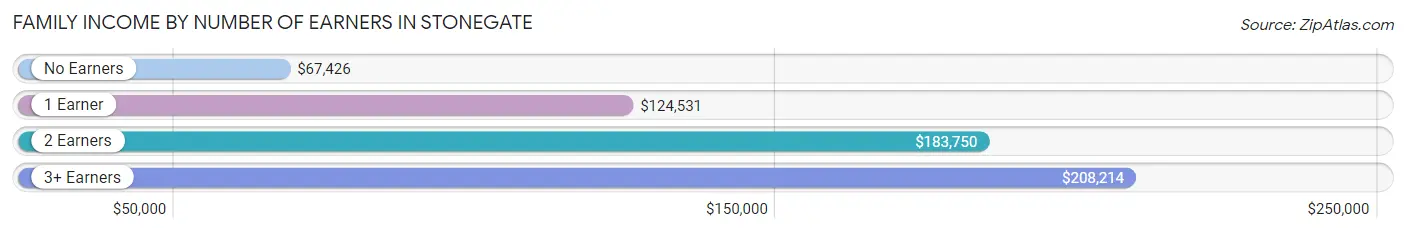
| Number of Earners | # Families | Median Income |
| No Earners | 177 (6.1%) | $67,426 |
| 1 Earner | 740 (25.7%) | $124,531 |
| 2 Earners | 1,570 (54.5%) | $183,750 |
| 3+ Earners | 396 (13.7%) | $208,214 |
| Total | 2,883 (100.0%) | $163,920 |
Household Income in Stonegate
Household Income Brackets in Stonegate
With 1,021 households falling in the category, the $200,000+ income range is the most frequent in Stonegate, accounting for 30.0% of all households. In contrast, only 7 households (0.2%) fall into the $10,000 to $14,999 income bracket, making it the least populous group.
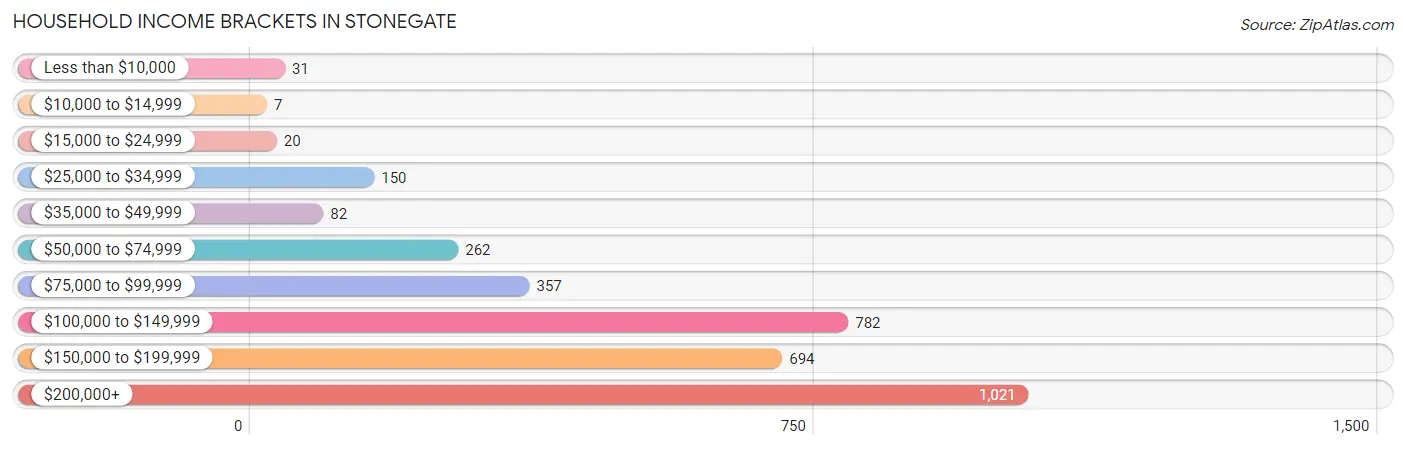
| Income Bracket | # Households | % Households |
| Less than $10,000 | 31 | 0.9% |
| $10,000 to $14,999 | 7 | 0.2% |
| $15,000 to $24,999 | 20 | 0.6% |
| $25,000 to $34,999 | 150 | 4.4% |
| $35,000 to $49,999 | 82 | 2.4% |
| $50,000 to $74,999 | 262 | 7.7% |
| $75,000 to $99,999 | 357 | 10.5% |
| $100,000 to $149,999 | 782 | 23.0% |
| $150,000 to $199,999 | 694 | 20.4% |
| $200,000+ | 1,021 | 30.0% |
Household Income by Householder Age in Stonegate
The median household income in Stonegate is $150,741, with the highest median household income of $162,892 found in the 25 to 44 years age bracket for the primary householder. A total of 1,204 households (35.4%) fall into this category. Meanwhile, the 15 to 24 years age bracket for the primary householder has the lowest median household income of $0, with 20 households (0.6%) in this group.
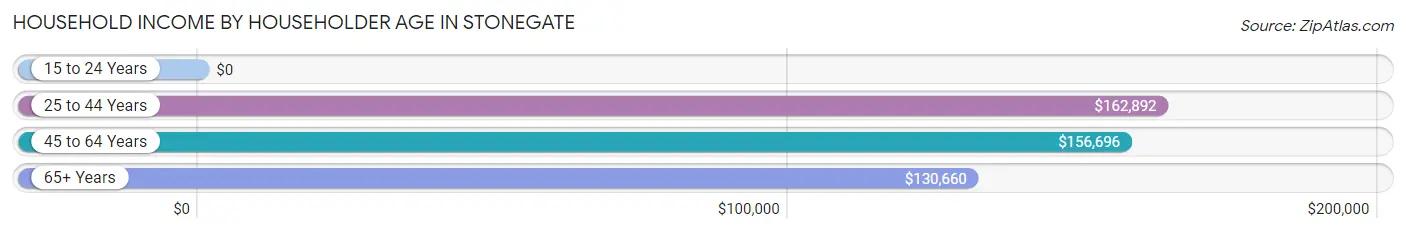
| Income Bracket | # Households | Median Income |
| 15 to 24 Years | 20 (0.6%) | $0 |
| 25 to 44 Years | 1,204 (35.4%) | $162,892 |
| 45 to 64 Years | 1,595 (46.9%) | $156,696 |
| 65+ Years | 583 (17.1%) | $130,660 |
| Total | 3,402 (100.0%) | $150,741 |
Poverty in Stonegate
Income Below Poverty by Sex and Age in Stonegate
With 0.9% poverty level for males and 2.2% for females among the residents of Stonegate, under 5 year old males and 25 to 34 year old females are the most vulnerable to poverty, with 24 males (5.8%) and 39 females (7.7%) in their respective age groups living below the poverty level.
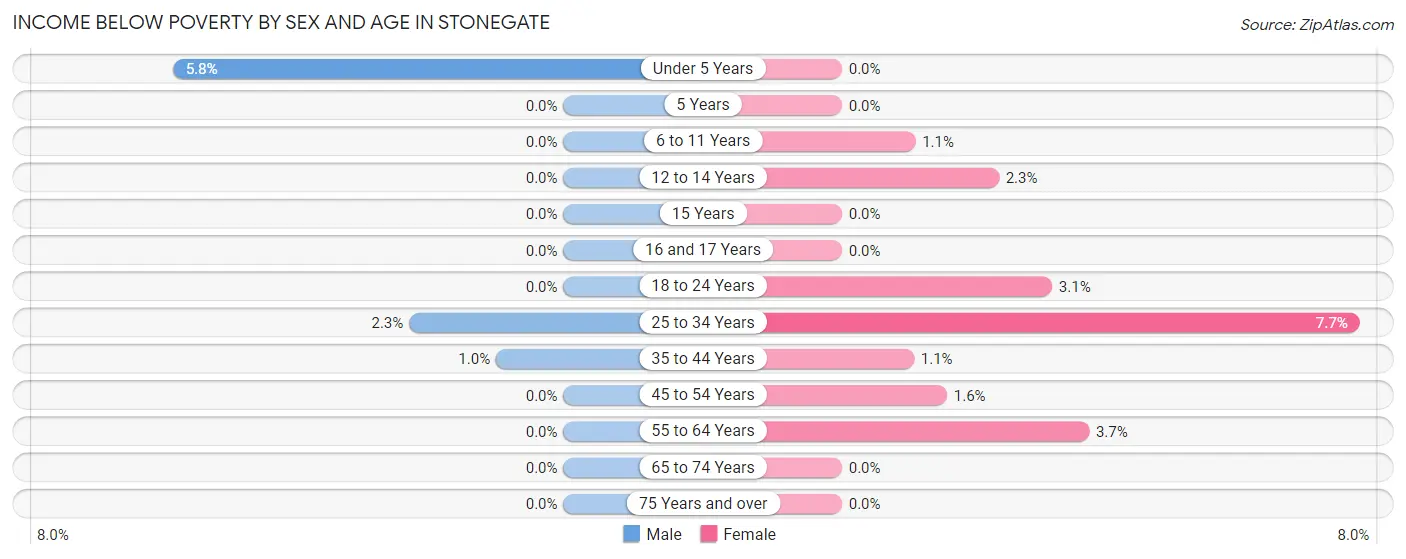
| Age Bracket | Male | Female |
| Under 5 Years | 24 (5.8%) | 0 (0.0%) |
| 5 Years | 0 (0.0%) | 0 (0.0%) |
| 6 to 11 Years | 0 (0.0%) | 7 (1.1%) |
| 12 to 14 Years | 0 (0.0%) | 7 (2.3%) |
| 15 Years | 0 (0.0%) | 0 (0.0%) |
| 16 and 17 Years | 0 (0.0%) | 0 (0.0%) |
| 18 to 24 Years | 0 (0.0%) | 10 (3.1%) |
| 25 to 34 Years | 11 (2.3%) | 39 (7.7%) |
| 35 to 44 Years | 8 (1.0%) | 8 (1.1%) |
| 45 to 54 Years | 0 (0.0%) | 13 (1.6%) |
| 55 to 64 Years | 0 (0.0%) | 27 (3.7%) |
| 65 to 74 Years | 0 (0.0%) | 0 (0.0%) |
| 75 Years and over | 0 (0.0%) | 0 (0.0%) |
| Total | 43 (0.9%) | 111 (2.2%) |
Income Above Poverty by Sex and Age in Stonegate
According to the poverty statistics in Stonegate, males aged 5 years and females aged under 5 years are the age groups that are most secure financially, with 100.0% of males and 100.0% of females in these age groups living above the poverty line.
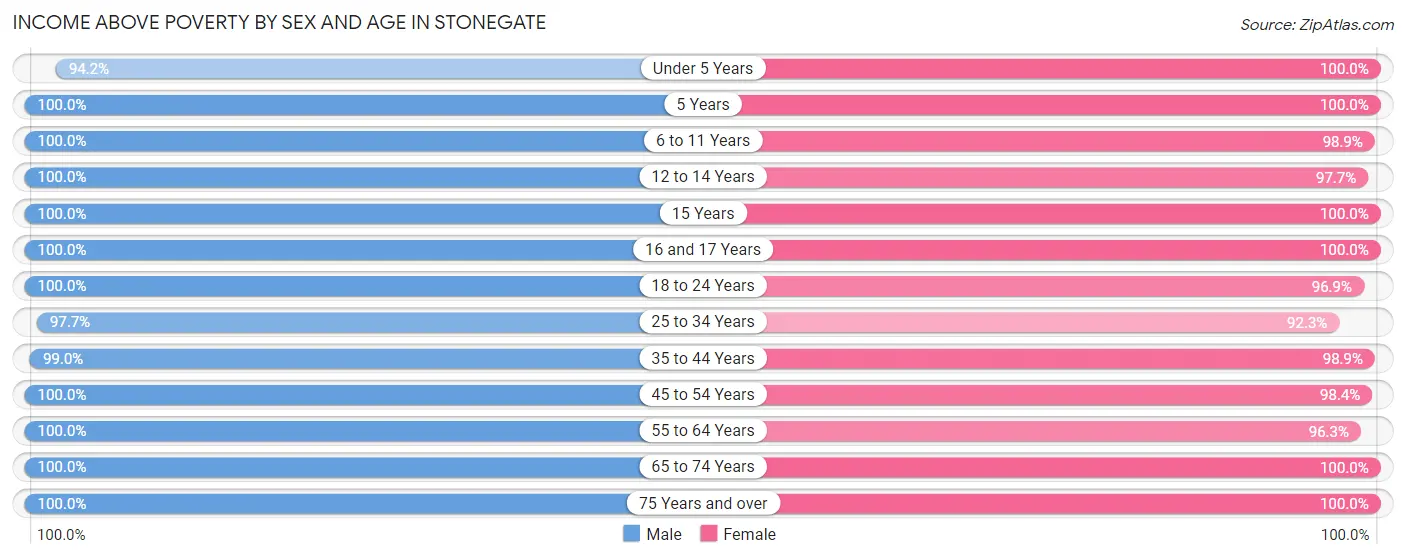
| Age Bracket | Male | Female |
| Under 5 Years | 390 (94.2%) | 159 (100.0%) |
| 5 Years | 67 (100.0%) | 53 (100.0%) |
| 6 to 11 Years | 456 (100.0%) | 638 (98.9%) |
| 12 to 14 Years | 252 (100.0%) | 294 (97.7%) |
| 15 Years | 103 (100.0%) | 80 (100.0%) |
| 16 and 17 Years | 74 (100.0%) | 212 (100.0%) |
| 18 to 24 Years | 294 (100.0%) | 311 (96.9%) |
| 25 to 34 Years | 470 (97.7%) | 468 (92.3%) |
| 35 to 44 Years | 796 (99.0%) | 738 (98.9%) |
| 45 to 54 Years | 891 (100.0%) | 822 (98.4%) |
| 55 to 64 Years | 438 (100.0%) | 709 (96.3%) |
| 65 to 74 Years | 325 (100.0%) | 386 (100.0%) |
| 75 Years and over | 43 (100.0%) | 133 (100.0%) |
| Total | 4,599 (99.1%) | 5,003 (97.8%) |
Income Below Poverty Among Married-Couple Families in Stonegate
The poverty statistics for married-couple families in Stonegate show that 0.8% or 19 of the total 2,484 families live below the poverty line. Families with 3 or 4 children have the highest poverty rate of 4.5%, comprising of 11 families. On the other hand, families with no children have the lowest poverty rate of 0.0%, which includes 0 families.
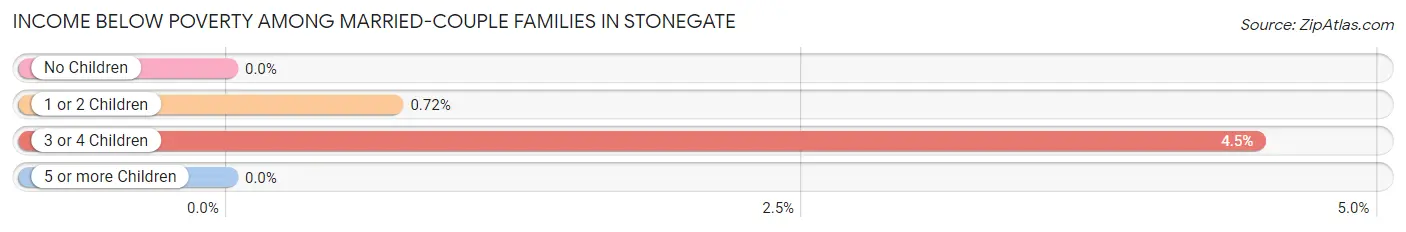
| Children | Above Poverty | Below Poverty |
| No Children | 1,134 (100.0%) | 0 (0.0%) |
| 1 or 2 Children | 1,096 (99.3%) | 8 (0.7%) |
| 3 or 4 Children | 235 (95.5%) | 11 (4.5%) |
| 5 or more Children | 0 (0.0%) | 0 (0.0%) |
| Total | 2,465 (99.2%) | 19 (0.8%) |
Income Below Poverty Among Single-Parent Households in Stonegate
| Children | Single Father | Single Mother |
| No Children | 0 (0.0%) | 0 (0.0%) |
| 1 or 2 Children | 0 (0.0%) | 0 (0.0%) |
| 3 or 4 Children | 0 (0.0%) | 0 (0.0%) |
| 5 or more Children | 0 (0.0%) | 0 (0.0%) |
| Total | 0 (0.0%) | 0 (0.0%) |
Income Below Poverty Among Married-Couple vs Single-Parent Households in Stonegate
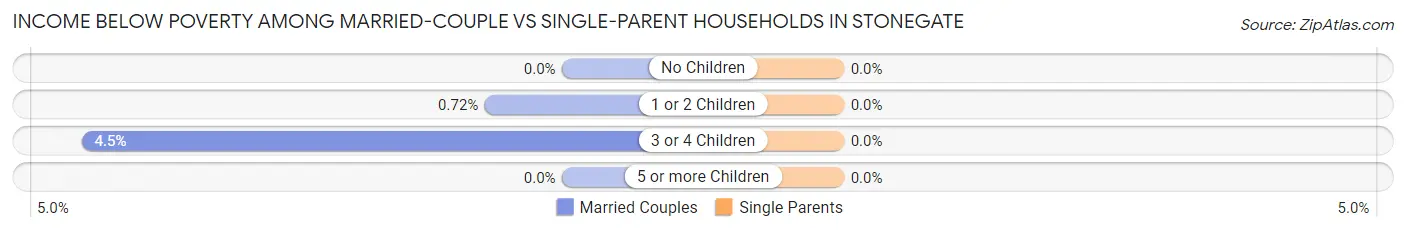
| Children | Married-Couple Families | Single-Parent Households |
| No Children | 0 (0.0%) | 0 (0.0%) |
| 1 or 2 Children | 8 (0.7%) | 0 (0.0%) |
| 3 or 4 Children | 11 (4.5%) | 0 (0.0%) |
| 5 or more Children | 0 (0.0%) | 0 (0.0%) |
| Total | 19 (0.8%) | 0 (0.0%) |
Race in Stonegate
The most populous races in Stonegate are White / Caucasian (8,631 | 88.3%), Hispanic or Latino (750 | 7.7%), and Two or more Races (679 | 7.0%).
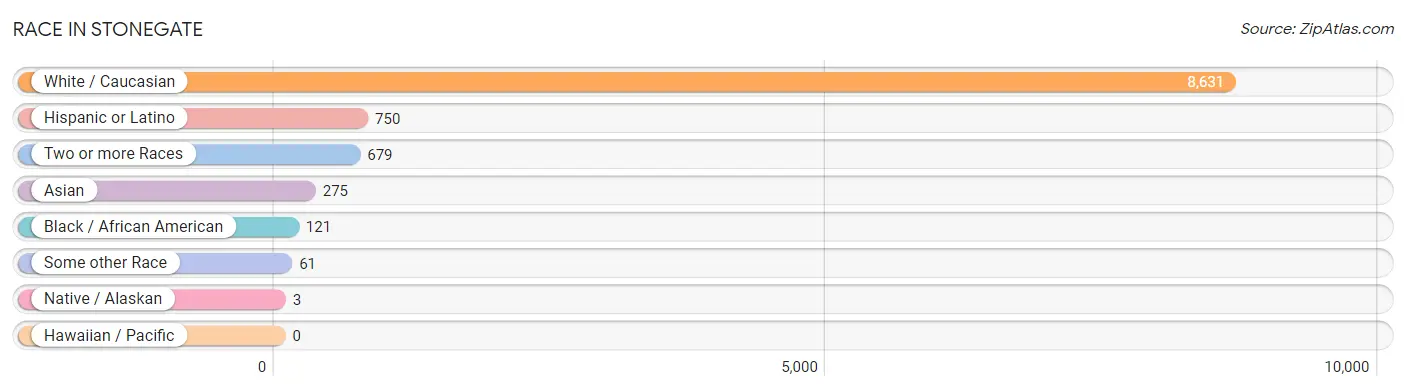
| Race | # Population | % Population |
| Asian | 275 | 2.8% |
| Black / African American | 121 | 1.2% |
| Hawaiian / Pacific | 0 | 0.0% |
| Hispanic or Latino | 750 | 7.7% |
| Native / Alaskan | 3 | 0.0% |
| White / Caucasian | 8,631 | 88.3% |
| Two or more Races | 679 | 7.0% |
| Some other Race | 61 | 0.6% |
| Total | 9,770 | 100.0% |
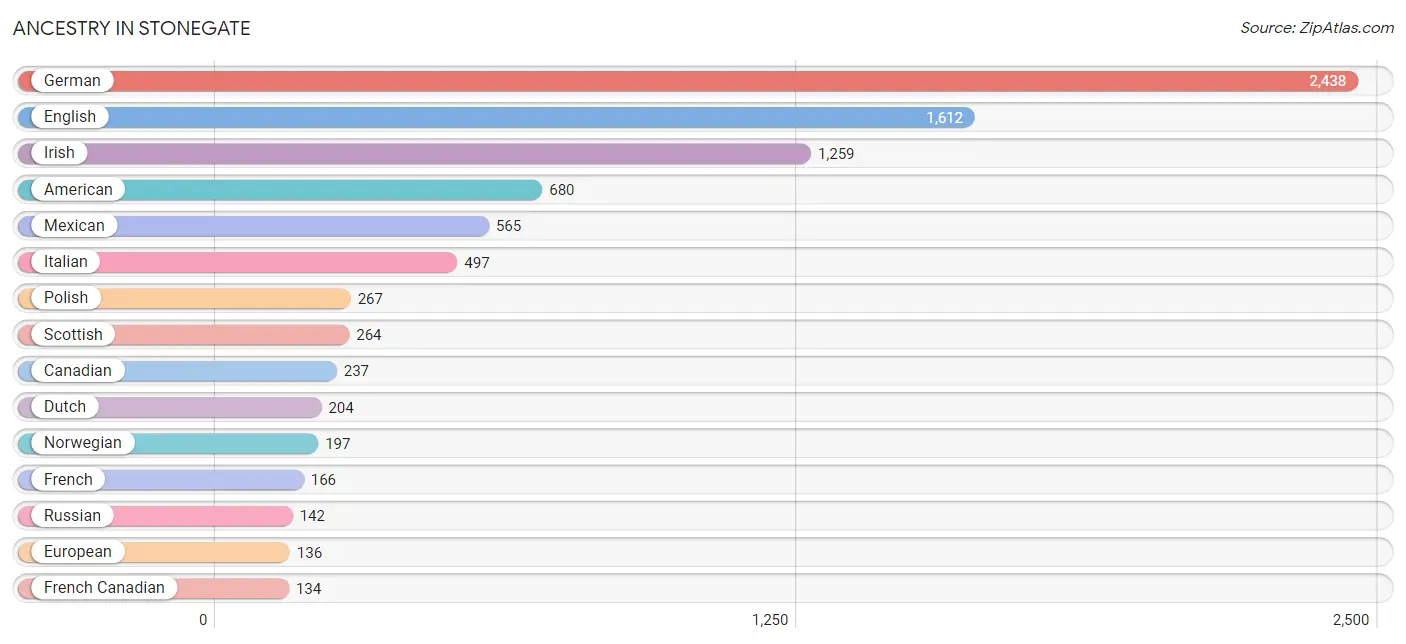
Ancestry in Stonegate
The most populous ancestries reported in Stonegate are German (2,438 | 24.9%), English (1,612 | 16.5%), Irish (1,259 | 12.9%), American (680 | 7.0%), and Mexican (565 | 5.8%), together accounting for 67.1% of all Stonegate residents.
| Ancestry | # Population | % Population |
| American | 680 | 7.0% |
| Arab | 13 | 0.1% |
| Australian | 38 | 0.4% |
| Austrian | 62 | 0.6% |
| Belgian | 8 | 0.1% |
| Bhutanese | 93 | 0.9% |
| Brazilian | 15 | 0.2% |
| British | 50 | 0.5% |
| Burmese | 77 | 0.8% |
| Canadian | 237 | 2.4% |
| Central American | 37 | 0.4% |
| Cherokee | 25 | 0.3% |
| Croatian | 12 | 0.1% |
| Cuban | 59 | 0.6% |
| Czech | 59 | 0.6% |
| Czechoslovakian | 9 | 0.1% |
| Danish | 84 | 0.9% |
| Dutch | 204 | 2.1% |
| Eastern European | 74 | 0.8% |
| Egyptian | 13 | 0.1% |
| English | 1,612 | 16.5% |
| European | 136 | 1.4% |
| Finnish | 17 | 0.2% |
| French | 166 | 1.7% |
| French Canadian | 134 | 1.4% |
| German | 2,438 | 24.9% |
| Greek | 14 | 0.1% |
| Guatemalan | 22 | 0.2% |
| Guyanese | 20 | 0.2% |
| Hungarian | 39 | 0.4% |
| Indian (Asian) | 109 | 1.1% |
| Iranian | 37 | 0.4% |
| Irish | 1,259 | 12.9% |
| Italian | 497 | 5.1% |
| Korean | 116 | 1.2% |
| Laotian | 9 | 0.1% |
| Lithuanian | 22 | 0.2% |
| Malaysian | 14 | 0.1% |
| Mexican | 565 | 5.8% |
| Mexican American Indian | 15 | 0.2% |
| Navajo | 15 | 0.2% |
| Nicaraguan | 15 | 0.2% |
| Northern European | 46 | 0.5% |
| Norwegian | 197 | 2.0% |
| Peruvian | 9 | 0.1% |
| Polish | 267 | 2.7% |
| Portuguese | 34 | 0.4% |
| Russian | 142 | 1.5% |
| Scandinavian | 39 | 0.4% |
| Scotch-Irish | 112 | 1.1% |
| Scottish | 264 | 2.7% |
| Sioux | 3 | 0.0% |
| Slavic | 15 | 0.2% |
| Slovak | 124 | 1.3% |
| South American | 9 | 0.1% |
| Spanish | 14 | 0.1% |
| Sri Lankan | 25 | 0.3% |
| Swedish | 95 | 1.0% |
| Swiss | 57 | 0.6% |
| Thai | 34 | 0.4% |
| Ukrainian | 49 | 0.5% |
| Welsh | 121 | 1.2% | View All 62 Rows |
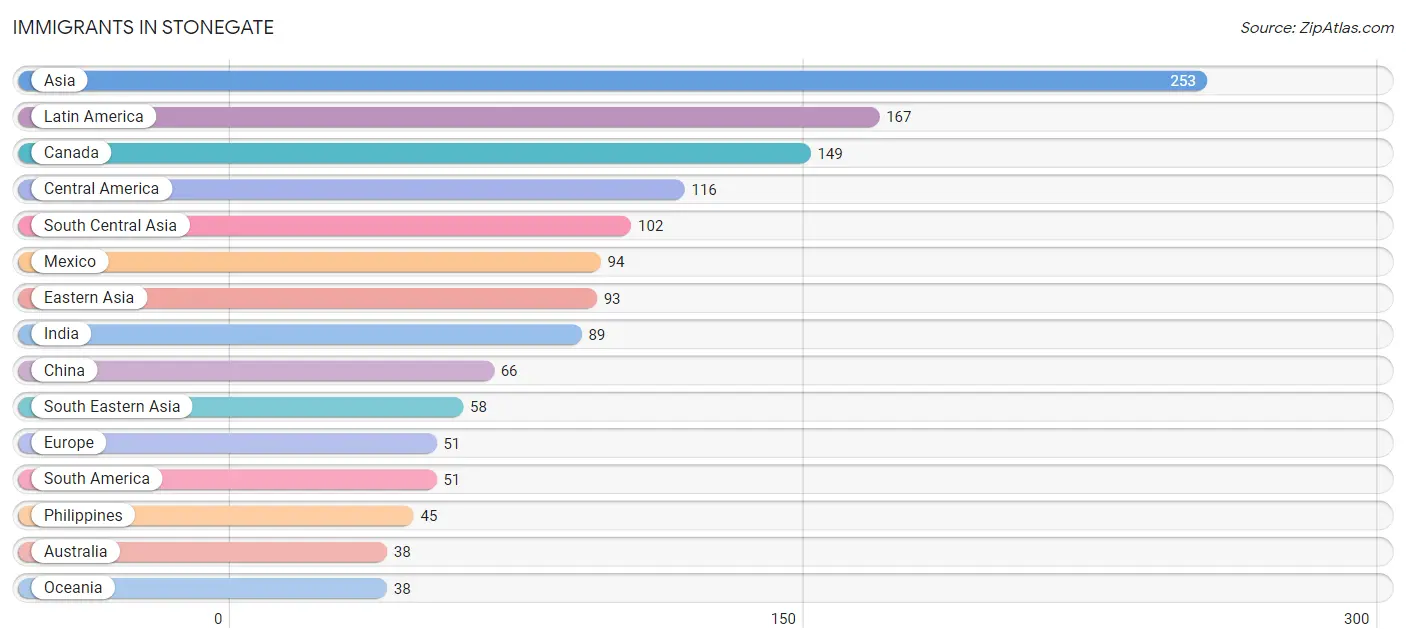
Immigrants in Stonegate
The most numerous immigrant groups reported in Stonegate came from Asia (253 | 2.6%), Latin America (167 | 1.7%), Canada (149 | 1.5%), Central America (116 | 1.2%), and South Central Asia (102 | 1.0%), together accounting for 8.1% of all Stonegate residents.
| Immigration Origin | # Population | % Population |
| Africa | 26 | 0.3% |
| Asia | 253 | 2.6% |
| Australia | 38 | 0.4% |
| Austria | 13 | 0.1% |
| Brazil | 31 | 0.3% |
| Canada | 149 | 1.5% |
| Central America | 116 | 1.2% |
| China | 66 | 0.7% |
| Czechoslovakia | 10 | 0.1% |
| Eastern Asia | 93 | 0.9% |
| Eastern Europe | 10 | 0.1% |
| Egypt | 13 | 0.1% |
| England | 15 | 0.2% |
| Europe | 51 | 0.5% |
| Germany | 13 | 0.1% |
| Guatemala | 22 | 0.2% |
| Guyana | 20 | 0.2% |
| India | 89 | 0.9% |
| Iran | 13 | 0.1% |
| Korea | 27 | 0.3% |
| Latin America | 167 | 1.7% |
| Mexico | 94 | 1.0% |
| Middle Africa | 13 | 0.1% |
| Northern Africa | 13 | 0.1% |
| Northern Europe | 15 | 0.2% |
| Oceania | 38 | 0.4% |
| Philippines | 45 | 0.5% |
| South America | 51 | 0.5% |
| South Central Asia | 102 | 1.0% |
| South Eastern Asia | 58 | 0.6% |
| Vietnam | 13 | 0.1% |
| Western Europe | 26 | 0.3% | View All 32 Rows |
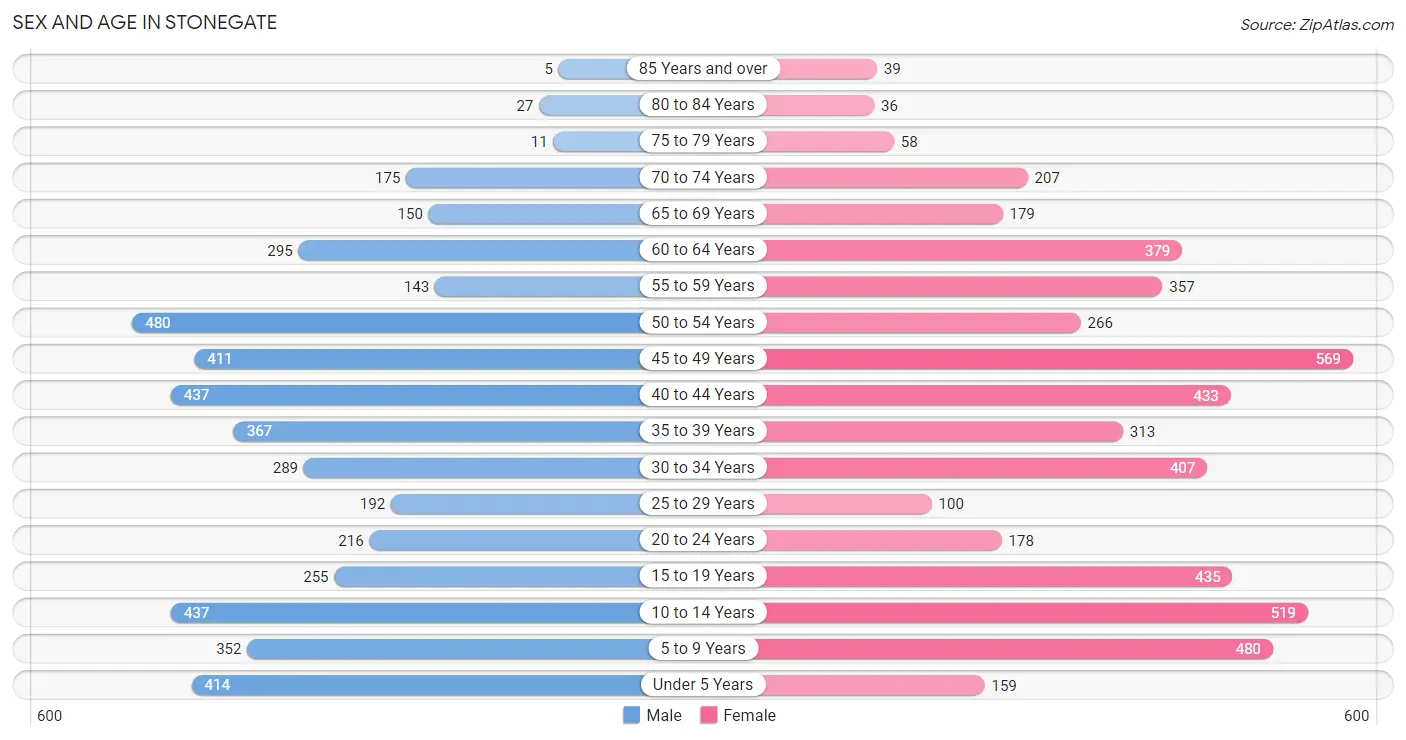
Sex and Age in Stonegate
Sex and Age in Stonegate
The most populous age groups in Stonegate are 50 to 54 Years (480 | 10.3%) for men and 45 to 49 Years (569 | 11.1%) for women.
| Age Bracket | Male | Female |
| Under 5 Years | 414 (8.9%) | 159 (3.1%) |
| 5 to 9 Years | 352 (7.6%) | 480 (9.4%) |
| 10 to 14 Years | 437 (9.4%) | 519 (10.2%) |
| 15 to 19 Years | 255 (5.5%) | 435 (8.5%) |
| 20 to 24 Years | 216 (4.6%) | 178 (3.5%) |
| 25 to 29 Years | 192 (4.1%) | 100 (2.0%) |
| 30 to 34 Years | 289 (6.2%) | 407 (8.0%) |
| 35 to 39 Years | 367 (7.9%) | 313 (6.1%) |
| 40 to 44 Years | 437 (9.4%) | 433 (8.5%) |
| 45 to 49 Years | 411 (8.8%) | 569 (11.1%) |
| 50 to 54 Years | 480 (10.3%) | 266 (5.2%) |
| 55 to 59 Years | 143 (3.1%) | 357 (7.0%) |
| 60 to 64 Years | 295 (6.3%) | 379 (7.4%) |
| 65 to 69 Years | 150 (3.2%) | 179 (3.5%) |
| 70 to 74 Years | 175 (3.8%) | 207 (4.1%) |
| 75 to 79 Years | 11 (0.2%) | 58 (1.1%) |
| 80 to 84 Years | 27 (0.6%) | 36 (0.7%) |
| 85 Years and over | 5 (0.1%) | 39 (0.8%) |
| Total | 4,656 (100.0%) | 5,114 (100.0%) |
Families and Households in Stonegate
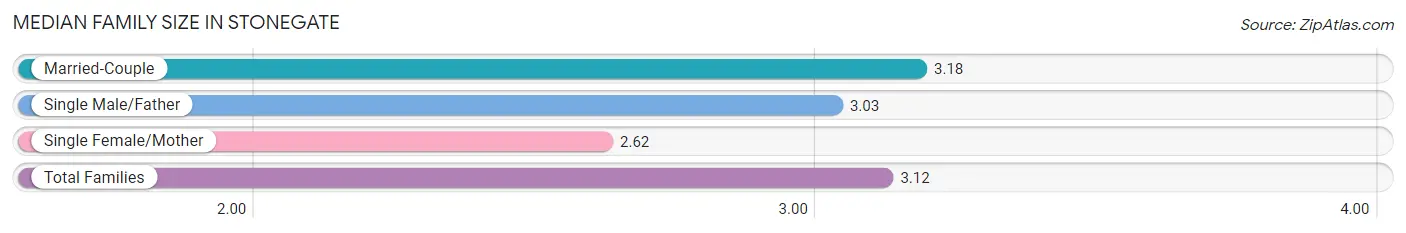
Median Family Size in Stonegate
The median family size in Stonegate is 3.12 persons per family, with married-couple families (2,484 | 86.2%) accounting for the largest median family size of 3.18 persons per family. On the other hand, single female/mother families (281 | 9.8%) represent the smallest median family size with 2.62 persons per family.
| Family Type | # Families | Family Size |
| Married-Couple | 2,484 (86.2%) | 3.18 |
| Single Male/Father | 118 (4.1%) | 3.03 |
| Single Female/Mother | 281 (9.8%) | 2.62 |
| Total Families | 2,883 (100.0%) | 3.12 |
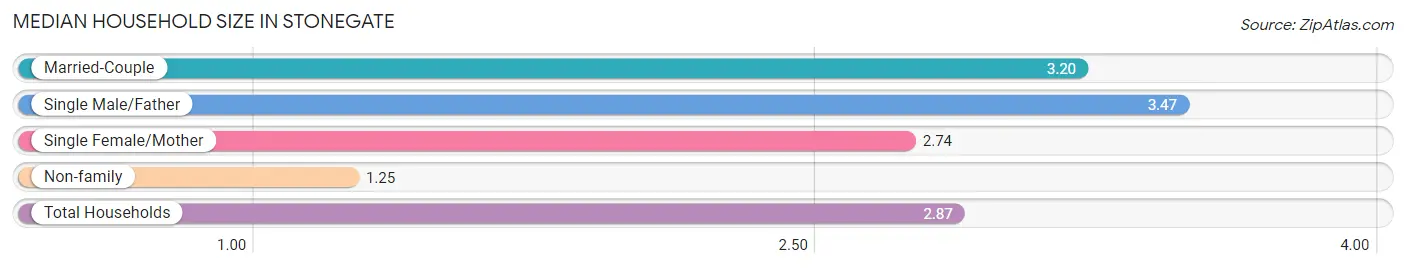
Median Household Size in Stonegate
The median household size in Stonegate is 2.87 persons per household, with single male/father households (118 | 3.5%) accounting for the largest median household size of 3.47 persons per household. non-family households (519 | 15.3%) represent the smallest median household size with 1.25 persons per household.
| Household Type | # Households | Household Size |
| Married-Couple | 2,484 (73.0%) | 3.20 |
| Single Male/Father | 118 (3.5%) | 3.47 |
| Single Female/Mother | 281 (8.3%) | 2.74 |
| Non-family | 519 (15.3%) | 1.25 |
| Total Households | 3,402 (100.0%) | 2.87 |
Household Size by Marriage Status in Stonegate
Out of a total of 3,402 households in Stonegate, 2,883 (84.7%) are family households, while 519 (15.3%) are nonfamily households. The most numerous type of family households are 2-person households, comprising 1,063, and the most common type of nonfamily households are 1-person households, comprising 433.
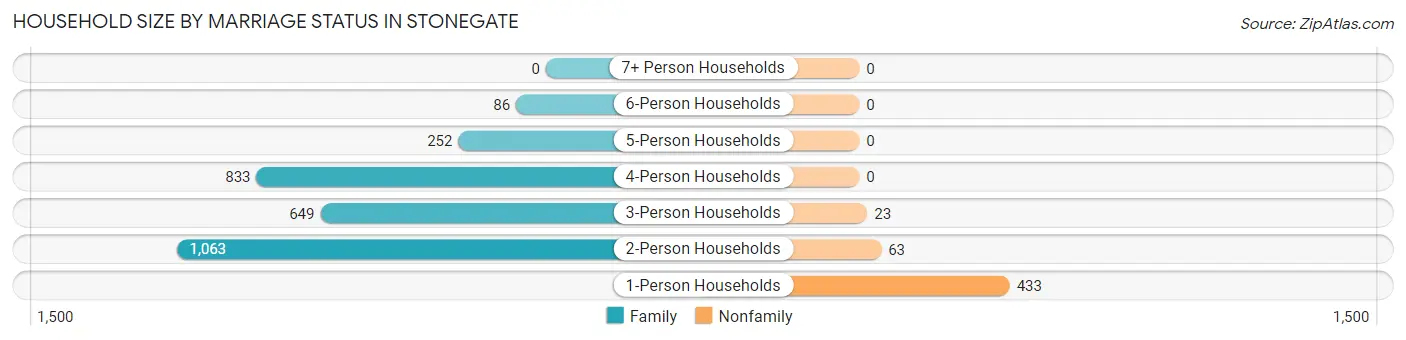
| Household Size | Family Households | Nonfamily Households |
| 1-Person Households | - | 433 (12.7%) |
| 2-Person Households | 1,063 (31.2%) | 63 (1.8%) |
| 3-Person Households | 649 (19.1%) | 23 (0.7%) |
| 4-Person Households | 833 (24.5%) | 0 (0.0%) |
| 5-Person Households | 252 (7.4%) | 0 (0.0%) |
| 6-Person Households | 86 (2.5%) | 0 (0.0%) |
| 7+ Person Households | 0 (0.0%) | 0 (0.0%) |
| Total | 2,883 (84.7%) | 519 (15.3%) |
Female Fertility in Stonegate
Fertility by Age in Stonegate
Average fertility rate in Stonegate is 37.0 births per 1,000 women. Women in the age bracket of 20 to 34 years have the highest fertility rate with 93.0 births per 1,000 women. Women in the age bracket of 20 to 34 years acount for 71.1% of all women with births.
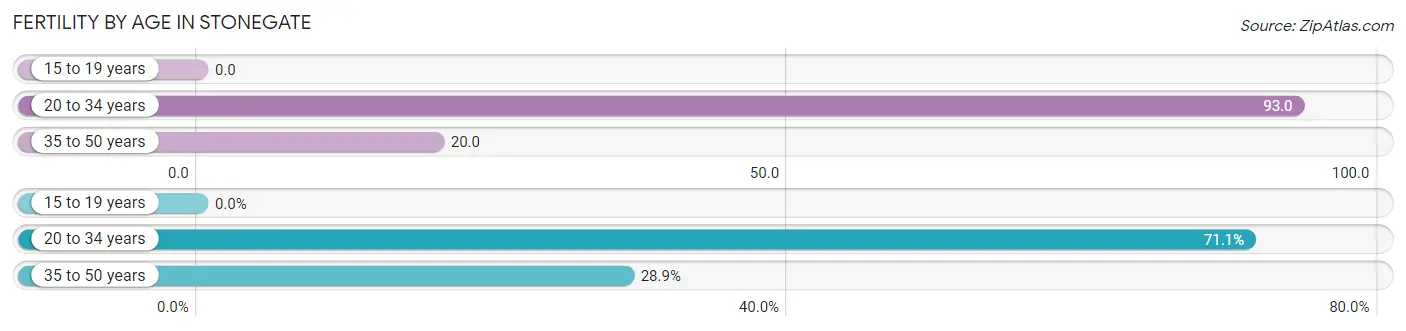
| Age Bracket | Women with Births | Births / 1,000 Women |
| 15 to 19 years | 0 (0.0%) | 0.0 |
| 20 to 34 years | 64 (71.1%) | 93.0 |
| 35 to 50 years | 26 (28.9%) | 20.0 |
| Total | 90 (100.0%) | 37.0 |
Fertility by Age by Marriage Status in Stonegate
85.6% of women with births (90) in Stonegate are married. The highest percentage of unmarried women with births falls into 20 to 34 years age bracket with 20.3% of them unmarried at the time of birth, while the lowest percentage of unmarried women with births belong to 35 to 50 years age bracket with 0.0% of them unmarried.
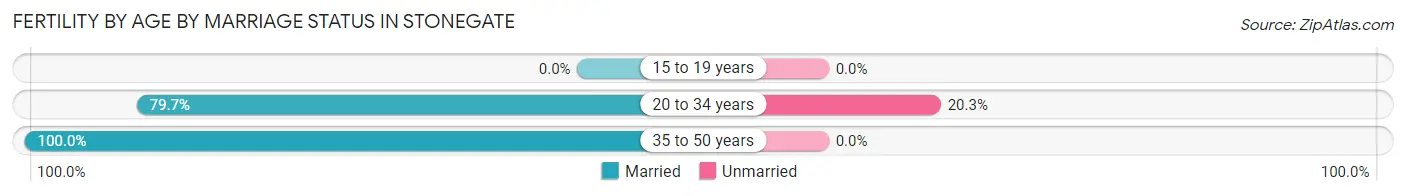
| Age Bracket | Married | Unmarried |
| 15 to 19 years | 0 (0.0%) | 0 (0.0%) |
| 20 to 34 years | 51 (79.7%) | 13 (20.3%) |
| 35 to 50 years | 26 (100.0%) | 0 (0.0%) |
| Total | 77 (85.6%) | 13 (14.4%) |
Fertility by Education in Stonegate
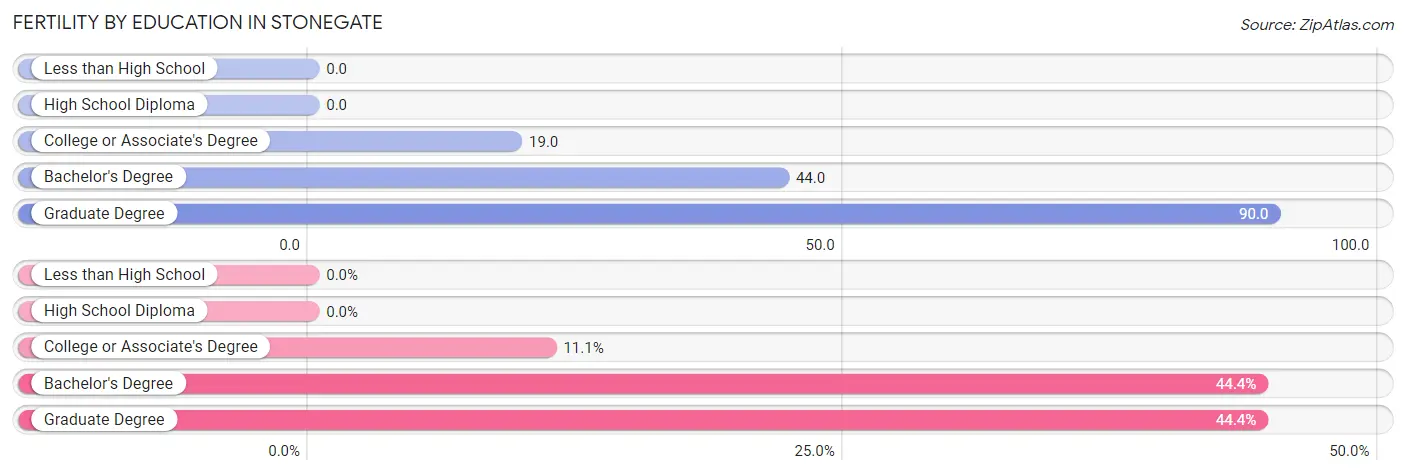
| Educational Attainment | Women with Births | Births / 1,000 Women |
| Less than High School | 0 (0.0%) | 0.0 |
| High School Diploma | 0 (0.0%) | 0.0 |
| College or Associate's Degree | 10 (11.1%) | 19.0 |
| Bachelor's Degree | 40 (44.4%) | 44.0 |
| Graduate Degree | 40 (44.4%) | 90.0 |
| Total | 90 (100.0%) | 37.0 |
Fertility by Education by Marriage Status in Stonegate
14.4% of women with births in Stonegate are unmarried. Women with the educational attainment of college or associate's degree are most likely to be married with 100.0% of them married at childbirth, while women with the educational attainment of graduate degree are least likely to be married with 32.5% of them unmarried at childbirth.
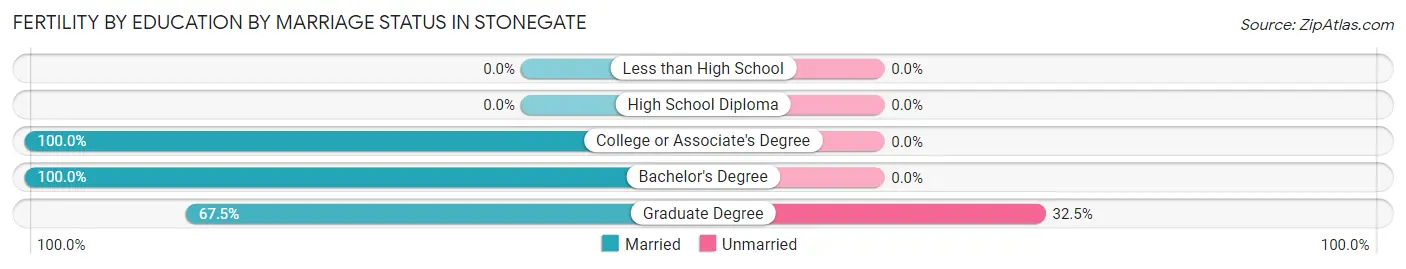
| Educational Attainment | Married | Unmarried |
| Less than High School | 0 (0.0%) | 0 (0.0%) |
| High School Diploma | 0 (0.0%) | 0 (0.0%) |
| College or Associate's Degree | 10 (100.0%) | 0 (0.0%) |
| Bachelor's Degree | 40 (100.0%) | 0 (0.0%) |
| Graduate Degree | 27 (67.5%) | 13 (32.5%) |
| Total | 77 (85.6%) | 13 (14.4%) |
Employment Characteristics in Stonegate
Employment by Class of Employer in Stonegate
Among the 5,244 employed individuals in Stonegate, private company employees (3,685 | 70.3%), self-employed (not incorporated) (336 | 6.4%), and self-employed (incorporated) (335 | 6.4%) make up the most common classes of employment.
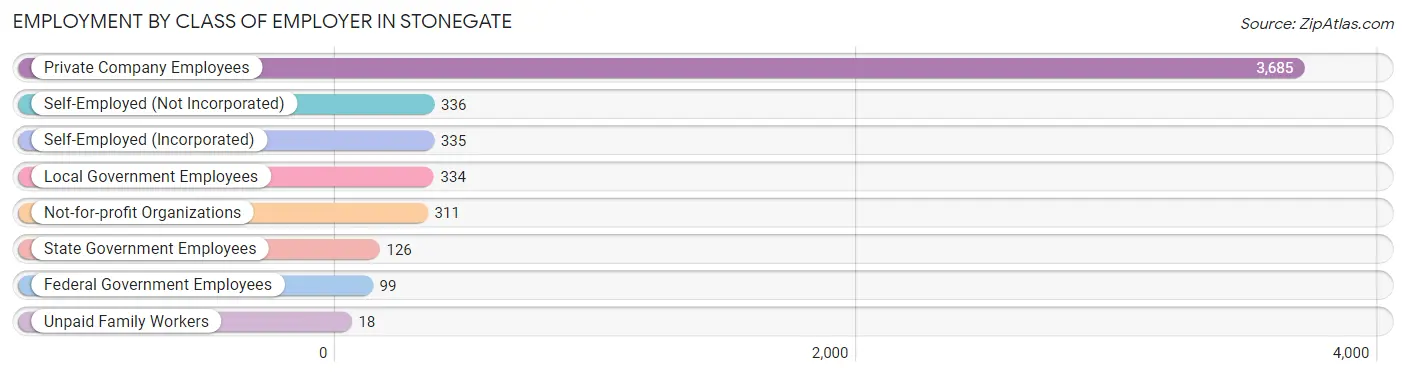
| Employer Class | # Employees | % Employees |
| Private Company Employees | 3,685 | 70.3% |
| Self-Employed (Incorporated) | 335 | 6.4% |
| Self-Employed (Not Incorporated) | 336 | 6.4% |
| Not-for-profit Organizations | 311 | 5.9% |
| Local Government Employees | 334 | 6.4% |
| State Government Employees | 126 | 2.4% |
| Federal Government Employees | 99 | 1.9% |
| Unpaid Family Workers | 18 | 0.3% |
| Total | 5,244 | 100.0% |
Employment Status by Age in Stonegate
According to the labor force statistics for Stonegate, out of the total population over 16 years of age (7,226), 76.0% or 5,492 individuals are in the labor force, with 3.5% or 192 of them unemployed. The age group with the highest labor force participation rate is 35 to 44 years, with 88.8% or 1,376 individuals in the labor force. Within the labor force, the 75 years and over age range has the highest percentage of unemployed individuals, with 54.5% or 18 of them being unemployed.
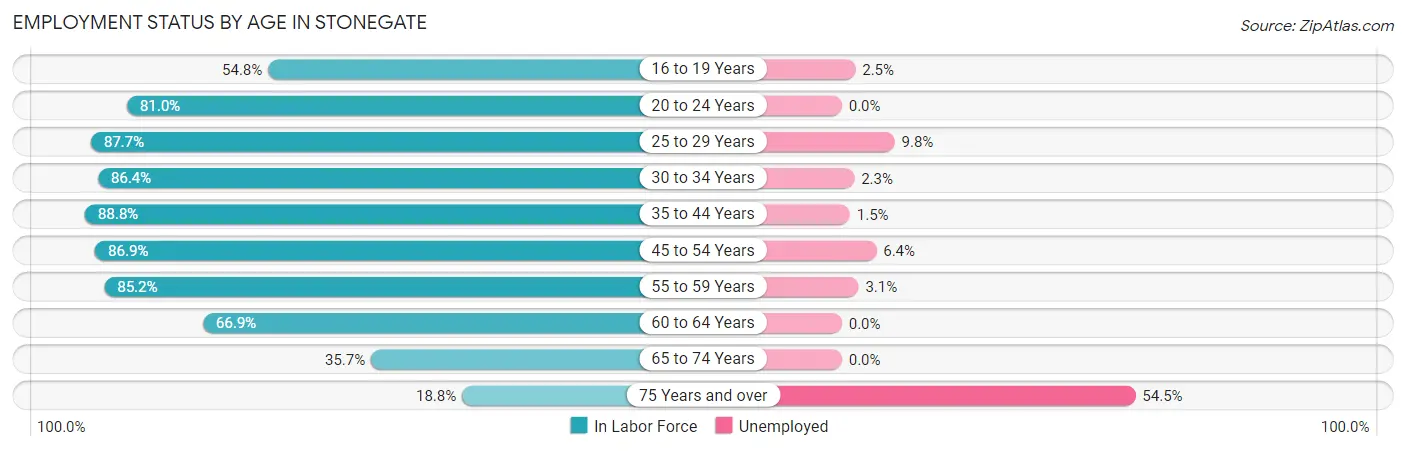
| Age Bracket | In Labor Force | Unemployed |
| 16 to 19 Years | 278 (54.8%) | 7 (2.5%) |
| 20 to 24 Years | 319 (81.0%) | 0 (0.0%) |
| 25 to 29 Years | 256 (87.7%) | 25 (9.8%) |
| 30 to 34 Years | 601 (86.4%) | 14 (2.3%) |
| 35 to 44 Years | 1,376 (88.8%) | 21 (1.5%) |
| 45 to 54 Years | 1,500 (86.9%) | 96 (6.4%) |
| 55 to 59 Years | 426 (85.2%) | 13 (3.1%) |
| 60 to 64 Years | 451 (66.9%) | 0 (0.0%) |
| 65 to 74 Years | 254 (35.7%) | 0 (0.0%) |
| 75 Years and over | 33 (18.8%) | 18 (54.5%) |
| Total | 5,492 (76.0%) | 192 (3.5%) |
Employment Status by Educational Attainment in Stonegate
According to labor force statistics for Stonegate, 84.8% of individuals (4,611) out of the total population between 25 and 64 years of age (5,438) are in the labor force, with 3.7% or 171 of them being unemployed. The group with the highest labor force participation rate are those with the educational attainment of less than high school, with 100.0% or 27 individuals in the labor force. Within the labor force, individuals with high school diploma education have the highest percentage of unemployment, with 6.0% or 25 of them being unemployed.
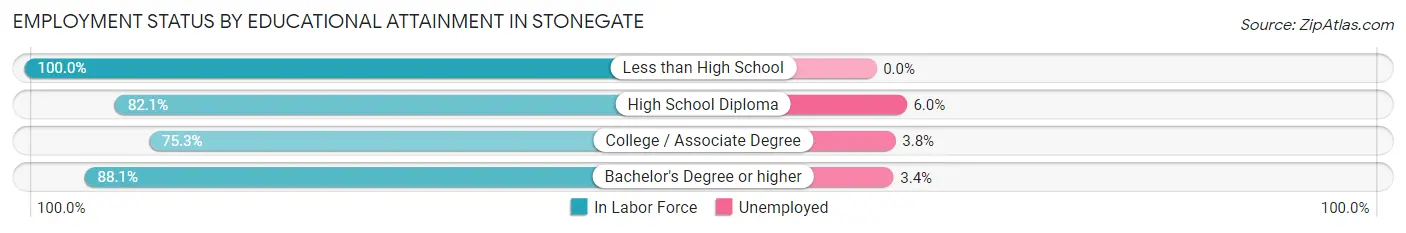
| Educational Attainment | In Labor Force | Unemployed |
| Less than High School | 27 (100.0%) | 0 (0.0%) |
| High School Diploma | 418 (82.1%) | 31 (6.0%) |
| College / Associate Degree | 901 (75.3%) | 45 (3.8%) |
| Bachelor's Degree or higher | 3,264 (88.1%) | 126 (3.4%) |
| Total | 4,611 (84.8%) | 201 (3.7%) |
Employment Occupations by Sex in Stonegate
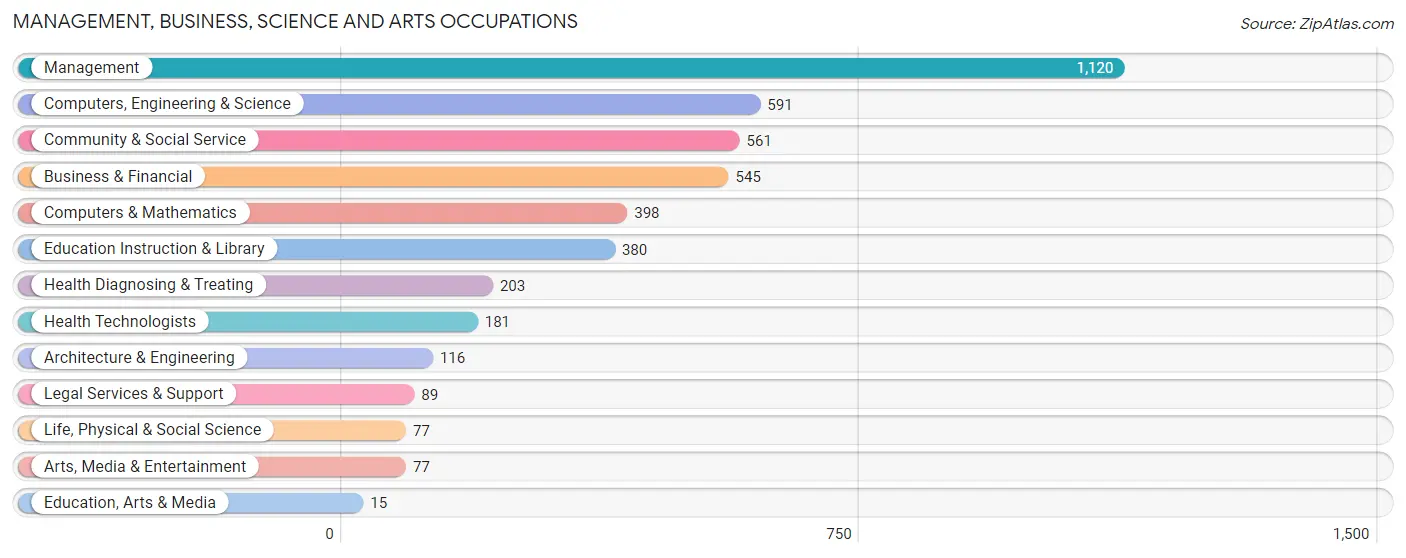
Management, Business, Science and Arts Occupations
The most common Management, Business, Science and Arts occupations in Stonegate are Management (1,120 | 21.3%), Computers, Engineering & Science (591 | 11.2%), Community & Social Service (561 | 10.7%), Business & Financial (545 | 10.4%), and Computers & Mathematics (398 | 7.6%).
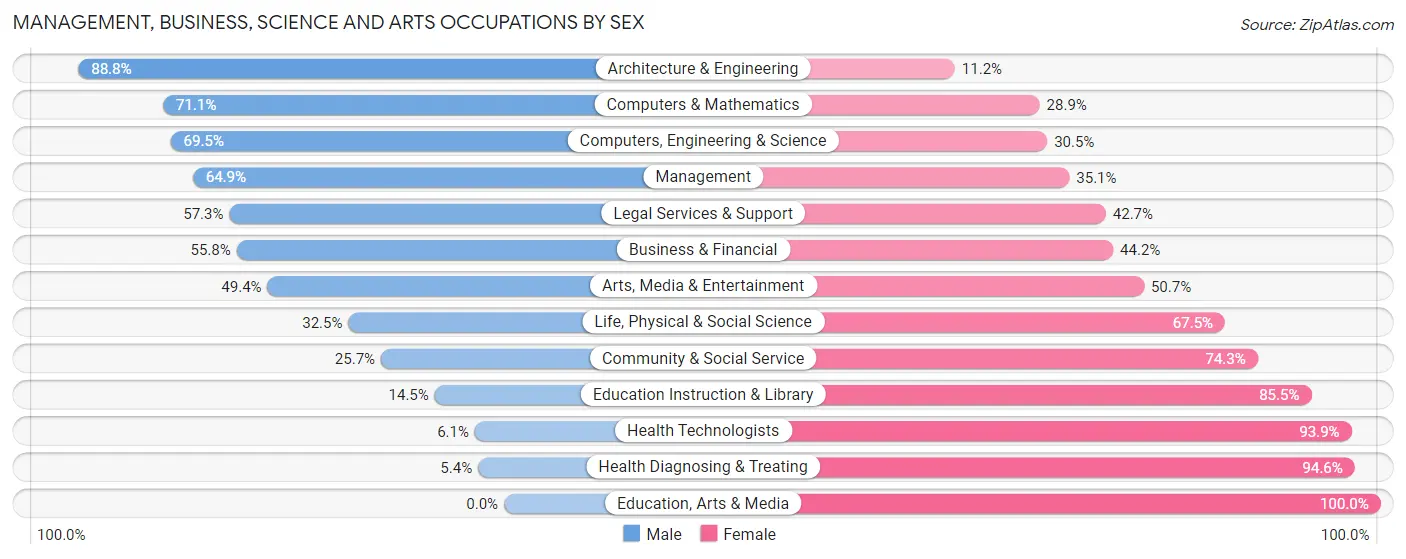
Management, Business, Science and Arts Occupations by Sex
Within the Management, Business, Science and Arts occupations in Stonegate, the most male-oriented occupations are Architecture & Engineering (88.8%), Computers & Mathematics (71.1%), and Computers, Engineering & Science (69.5%), while the most female-oriented occupations are Education, Arts & Media (100.0%), Health Diagnosing & Treating (94.6%), and Health Technologists (93.9%).
| Occupation | Male | Female |
| Management | 727 (64.9%) | 393 (35.1%) |
| Business & Financial | 304 (55.8%) | 241 (44.2%) |
| Computers, Engineering & Science | 411 (69.5%) | 180 (30.5%) |
| Computers & Mathematics | 283 (71.1%) | 115 (28.9%) |
| Architecture & Engineering | 103 (88.8%) | 13 (11.2%) |
| Life, Physical & Social Science | 25 (32.5%) | 52 (67.5%) |
| Community & Social Service | 144 (25.7%) | 417 (74.3%) |
| Education, Arts & Media | 0 (0.0%) | 15 (100.0%) |
| Legal Services & Support | 51 (57.3%) | 38 (42.7%) |
| Education Instruction & Library | 55 (14.5%) | 325 (85.5%) |
| Arts, Media & Entertainment | 38 (49.3%) | 39 (50.6%) |
| Health Diagnosing & Treating | 11 (5.4%) | 192 (94.6%) |
| Health Technologists | 11 (6.1%) | 170 (93.9%) |
| Total (Category) | 1,597 (52.9%) | 1,423 (47.1%) |
| Total (Overall) | 2,712 (51.6%) | 2,546 (48.4%) |
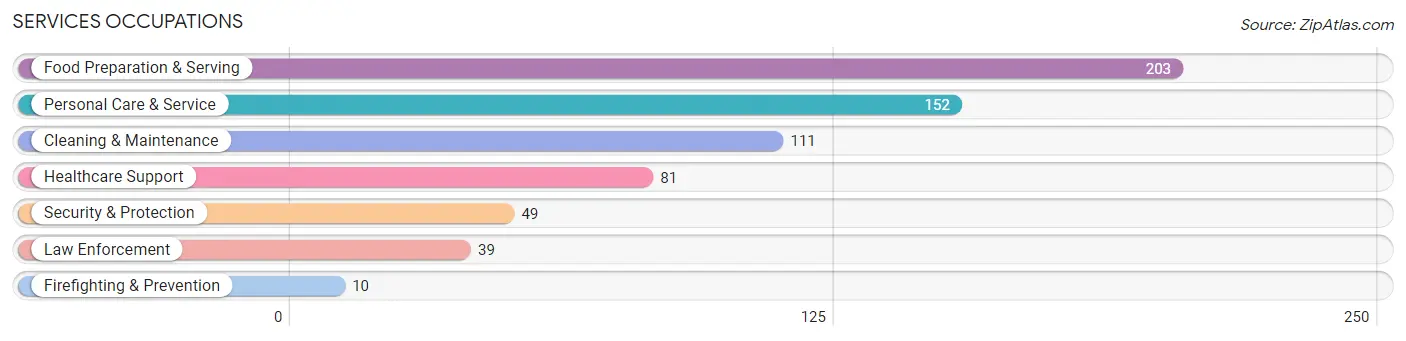
Services Occupations
The most common Services occupations in Stonegate are Food Preparation & Serving (203 | 3.9%), Personal Care & Service (152 | 2.9%), Cleaning & Maintenance (111 | 2.1%), Healthcare Support (81 | 1.5%), and Security & Protection (49 | 0.9%).
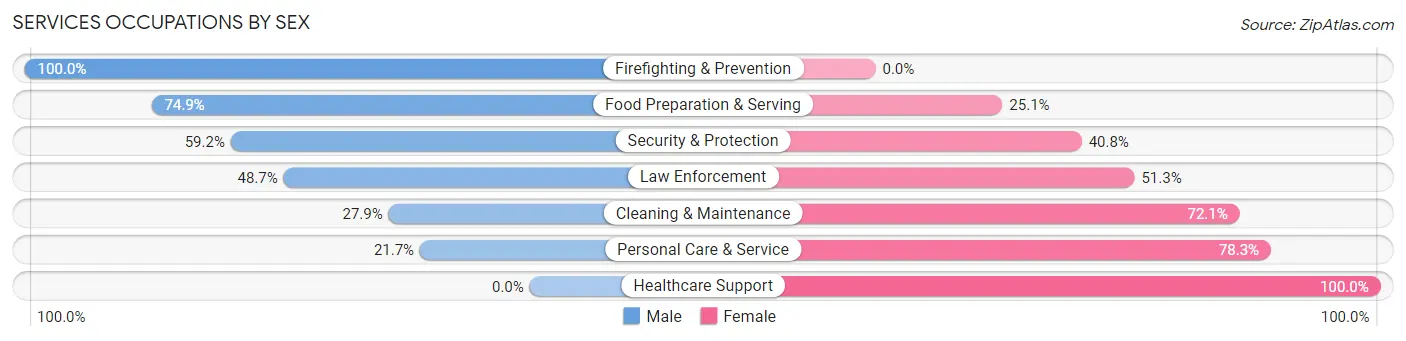
Services Occupations by Sex
Within the Services occupations in Stonegate, the most male-oriented occupations are Firefighting & Prevention (100.0%), Food Preparation & Serving (74.9%), and Security & Protection (59.2%), while the most female-oriented occupations are Healthcare Support (100.0%), Personal Care & Service (78.3%), and Cleaning & Maintenance (72.1%).
| Occupation | Male | Female |
| Healthcare Support | 0 (0.0%) | 81 (100.0%) |
| Security & Protection | 29 (59.2%) | 20 (40.8%) |
| Firefighting & Prevention | 10 (100.0%) | 0 (0.0%) |
| Law Enforcement | 19 (48.7%) | 20 (51.3%) |
| Food Preparation & Serving | 152 (74.9%) | 51 (25.1%) |
| Cleaning & Maintenance | 31 (27.9%) | 80 (72.1%) |
| Personal Care & Service | 33 (21.7%) | 119 (78.3%) |
| Total (Category) | 245 (41.1%) | 351 (58.9%) |
| Total (Overall) | 2,712 (51.6%) | 2,546 (48.4%) |
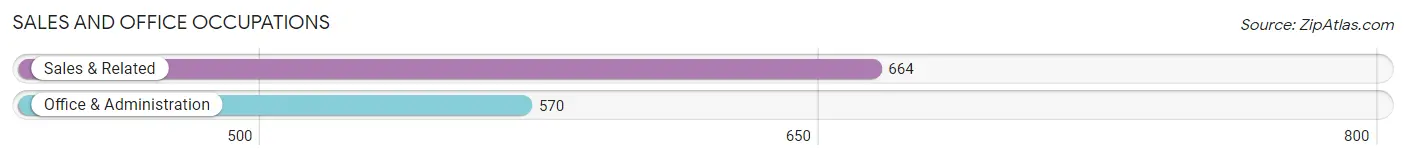
Sales and Office Occupations
The most common Sales and Office occupations in Stonegate are Sales & Related (664 | 12.6%), and Office & Administration (570 | 10.8%).
Sales and Office Occupations by Sex
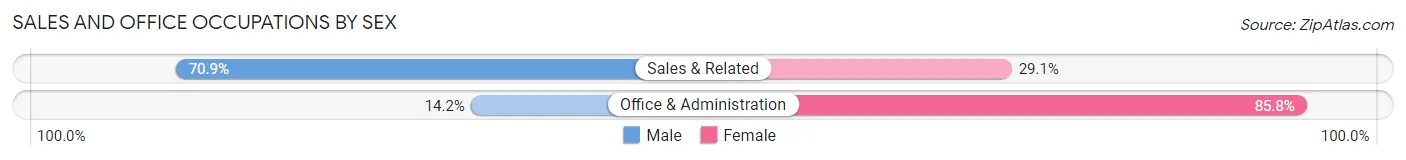
| Occupation | Male | Female |
| Sales & Related | 471 (70.9%) | 193 (29.1%) |
| Office & Administration | 81 (14.2%) | 489 (85.8%) |
| Total (Category) | 552 (44.7%) | 682 (55.3%) |
| Total (Overall) | 2,712 (51.6%) | 2,546 (48.4%) |
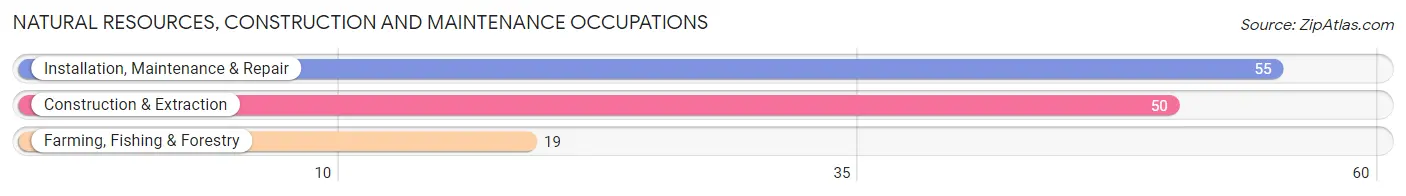
Natural Resources, Construction and Maintenance Occupations
The most common Natural Resources, Construction and Maintenance occupations in Stonegate are Installation, Maintenance & Repair (55 | 1.1%), Construction & Extraction (50 | 0.9%), and Farming, Fishing & Forestry (19 | 0.4%).
Natural Resources, Construction and Maintenance Occupations by Sex
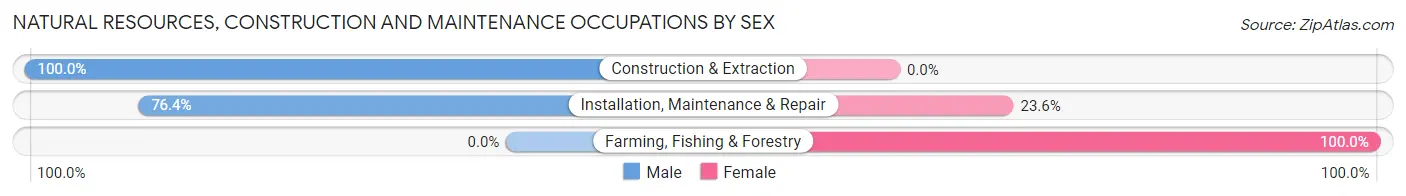
| Occupation | Male | Female |
| Farming, Fishing & Forestry | 0 (0.0%) | 19 (100.0%) |
| Construction & Extraction | 50 (100.0%) | 0 (0.0%) |
| Installation, Maintenance & Repair | 42 (76.4%) | 13 (23.6%) |
| Total (Category) | 92 (74.2%) | 32 (25.8%) |
| Total (Overall) | 2,712 (51.6%) | 2,546 (48.4%) |
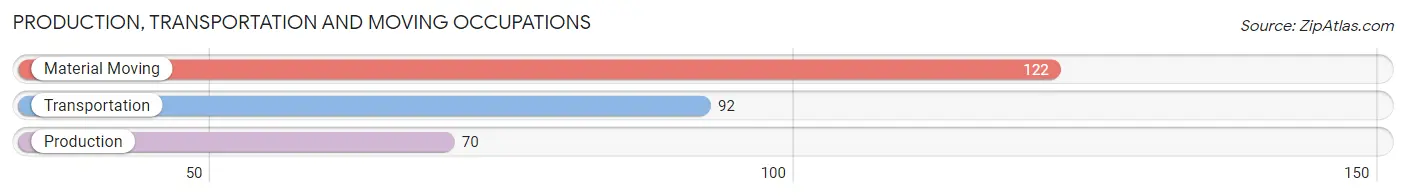
Production, Transportation and Moving Occupations
The most common Production, Transportation and Moving occupations in Stonegate are Material Moving (122 | 2.3%), Transportation (92 | 1.8%), and Production (70 | 1.3%).
Production, Transportation and Moving Occupations by Sex
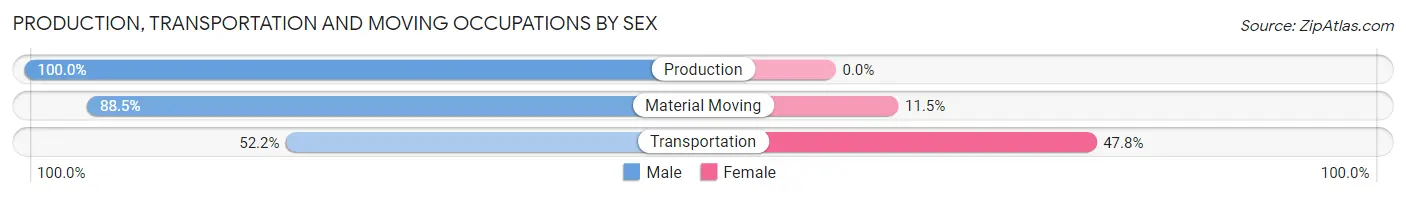
| Occupation | Male | Female |
| Production | 70 (100.0%) | 0 (0.0%) |
| Transportation | 48 (52.2%) | 44 (47.8%) |
| Material Moving | 108 (88.5%) | 14 (11.5%) |
| Total (Category) | 226 (79.6%) | 58 (20.4%) |
| Total (Overall) | 2,712 (51.6%) | 2,546 (48.4%) |
Employment Industries by Sex in Stonegate
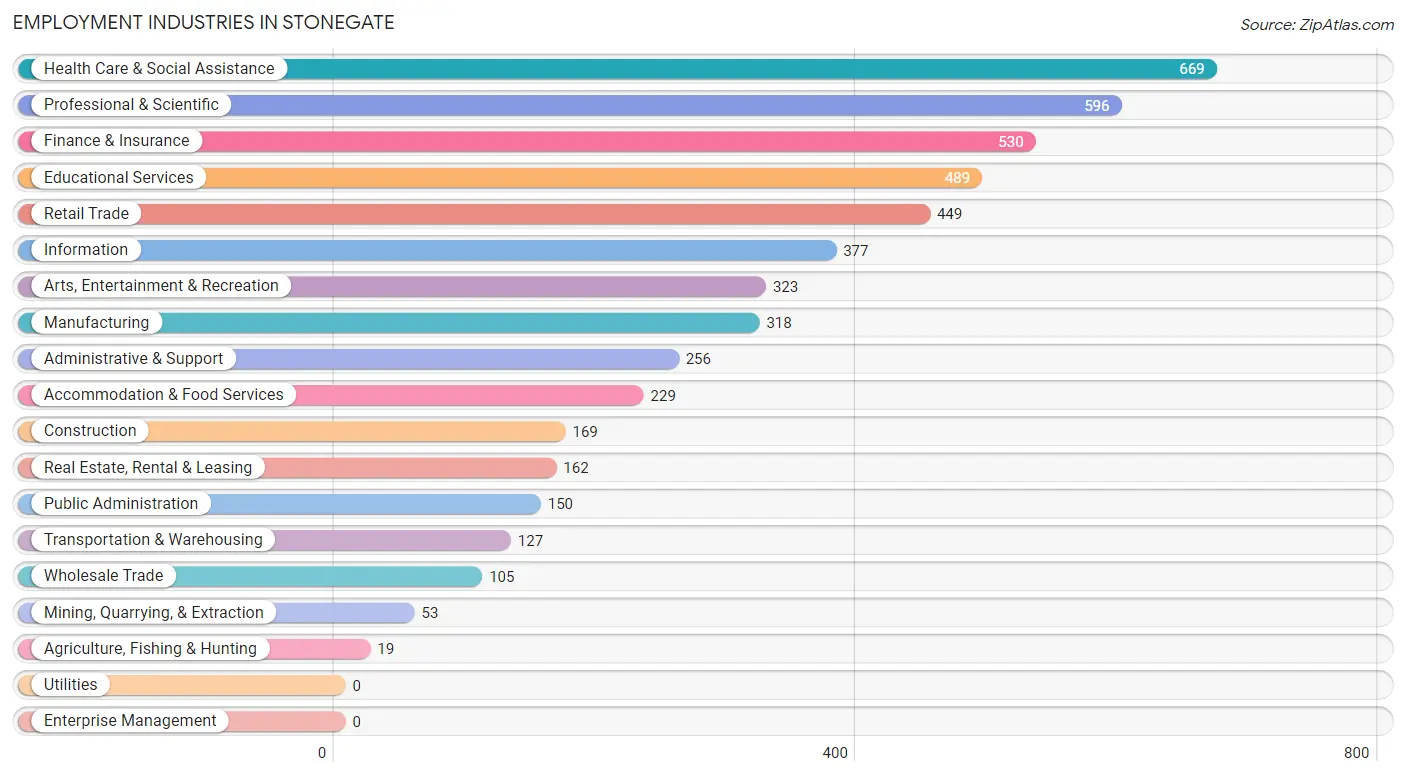
Employment Industries in Stonegate
The major employment industries in Stonegate include Health Care & Social Assistance (669 | 12.7%), Professional & Scientific (596 | 11.3%), Finance & Insurance (530 | 10.1%), Educational Services (489 | 9.3%), and Retail Trade (449 | 8.5%).
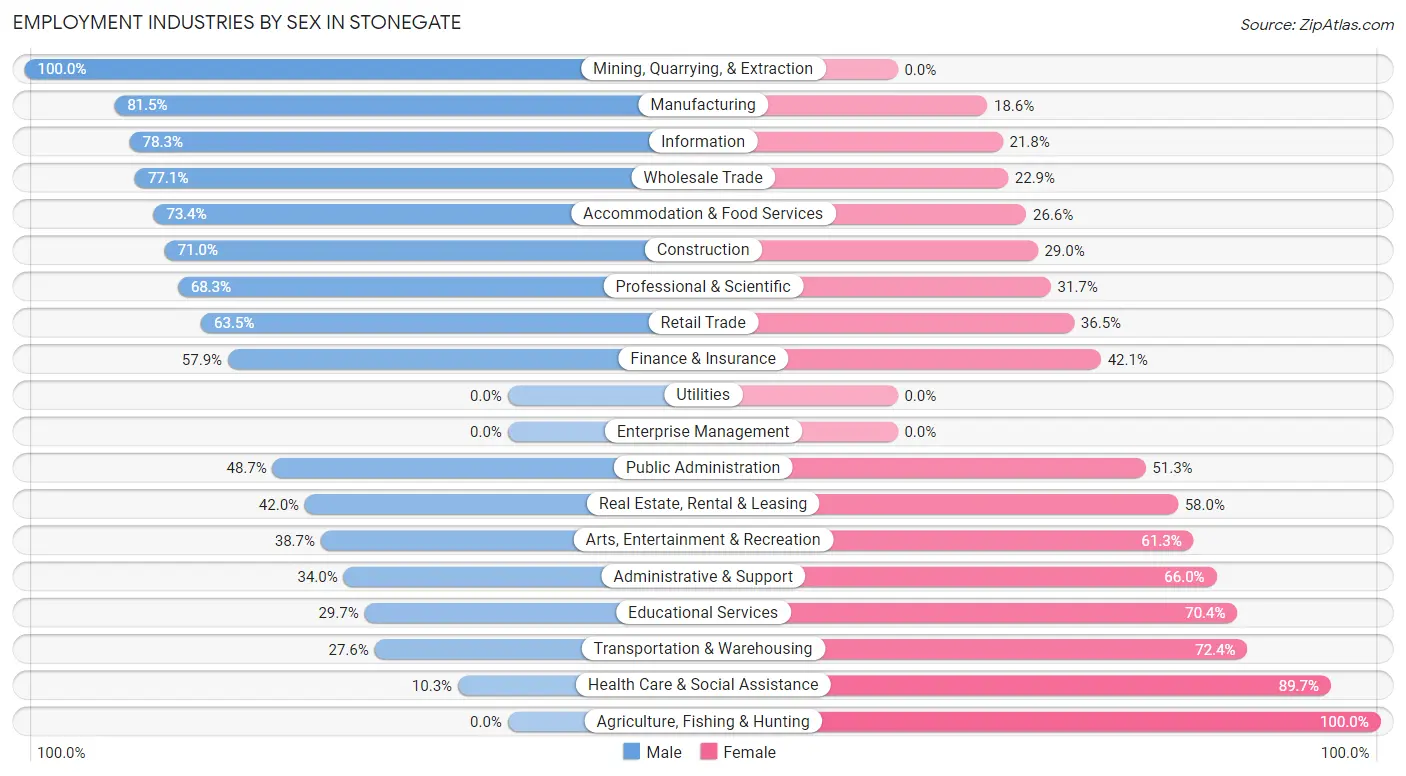
Employment Industries by Sex in Stonegate
The Stonegate industries that see more men than women are Mining, Quarrying, & Extraction (100.0%), Manufacturing (81.5%), and Information (78.2%), whereas the industries that tend to have a higher number of women are Agriculture, Fishing & Hunting (100.0%), Health Care & Social Assistance (89.7%), and Transportation & Warehousing (72.4%).
| Industry | Male | Female |
| Agriculture, Fishing & Hunting | 0 (0.0%) | 19 (100.0%) |
| Mining, Quarrying, & Extraction | 53 (100.0%) | 0 (0.0%) |
| Construction | 120 (71.0%) | 49 (29.0%) |
| Manufacturing | 259 (81.5%) | 59 (18.5%) |
| Wholesale Trade | 81 (77.1%) | 24 (22.9%) |
| Retail Trade | 285 (63.5%) | 164 (36.5%) |
| Transportation & Warehousing | 35 (27.6%) | 92 (72.4%) |
| Utilities | 0 (0.0%) | 0 (0.0%) |
| Information | 295 (78.2%) | 82 (21.7%) |
| Finance & Insurance | 307 (57.9%) | 223 (42.1%) |
| Real Estate, Rental & Leasing | 68 (42.0%) | 94 (58.0%) |
| Professional & Scientific | 407 (68.3%) | 189 (31.7%) |
| Enterprise Management | 0 (0.0%) | 0 (0.0%) |
| Administrative & Support | 87 (34.0%) | 169 (66.0%) |
| Educational Services | 145 (29.6%) | 344 (70.4%) |
| Health Care & Social Assistance | 69 (10.3%) | 600 (89.7%) |
| Arts, Entertainment & Recreation | 125 (38.7%) | 198 (61.3%) |
| Accommodation & Food Services | 168 (73.4%) | 61 (26.6%) |
| Public Administration | 73 (48.7%) | 77 (51.3%) |
| Total | 2,712 (51.6%) | 2,546 (48.4%) |
Education in Stonegate
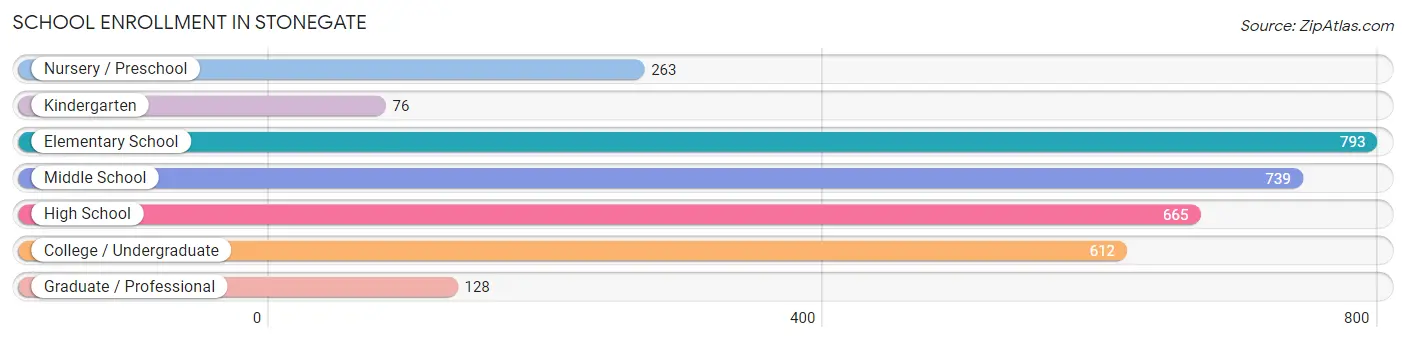
School Enrollment in Stonegate
The most common levels of schooling among the 3,276 students in Stonegate are elementary school (793 | 24.2%), middle school (739 | 22.6%), and high school (665 | 20.3%).
| School Level | # Students | % Students |
| Nursery / Preschool | 263 | 8.0% |
| Kindergarten | 76 | 2.3% |
| Elementary School | 793 | 24.2% |
| Middle School | 739 | 22.6% |
| High School | 665 | 20.3% |
| College / Undergraduate | 612 | 18.7% |
| Graduate / Professional | 128 | 3.9% |
| Total | 3,276 | 100.0% |
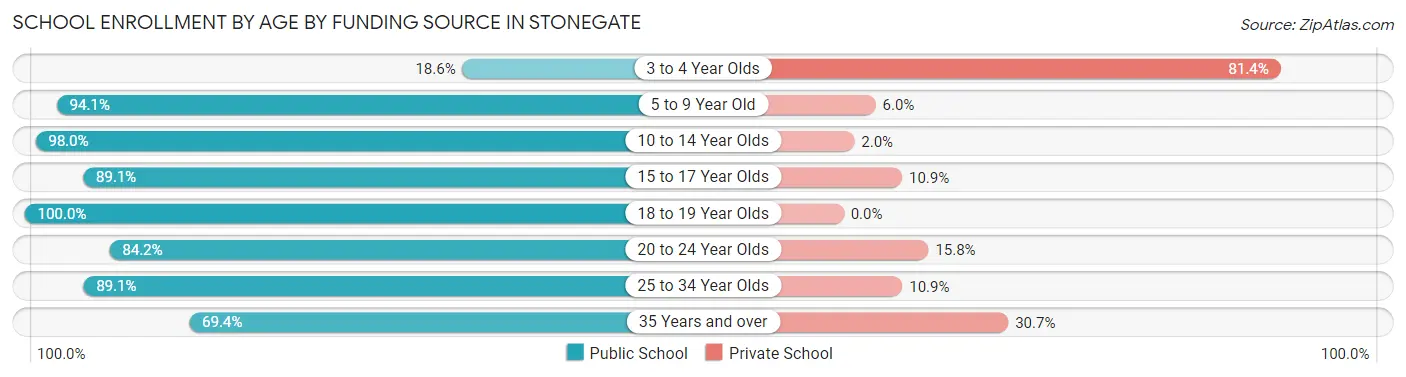
School Enrollment by Age by Funding Source in Stonegate
Out of a total of 3,276 students who are enrolled in schools in Stonegate, 396 (12.1%) attend a private institution, while the remaining 2,880 (87.9%) are enrolled in public schools. The age group of 3 to 4 year olds has the highest likelihood of being enrolled in private schools, with 153 (81.4% in the age bracket) enrolled. Conversely, the age group of 18 to 19 year olds has the lowest likelihood of being enrolled in a private school, with 147 (100.0% in the age bracket) attending a public institution.
| Age Bracket | Public School | Private School |
| 3 to 4 Year Olds | 35 (18.6%) | 153 (81.4%) |
| 5 to 9 Year Old | 775 (94.1%) | 49 (5.9%) |
| 10 to 14 Year Olds | 937 (98.0%) | 19 (2.0%) |
| 15 to 17 Year Olds | 418 (89.1%) | 51 (10.9%) |
| 18 to 19 Year Olds | 147 (100.0%) | 0 (0.0%) |
| 20 to 24 Year Olds | 176 (84.2%) | 33 (15.8%) |
| 25 to 34 Year Olds | 253 (89.1%) | 31 (10.9%) |
| 35 Years and over | 138 (69.4%) | 61 (30.6%) |
| Total | 2,880 (87.9%) | 396 (12.1%) |
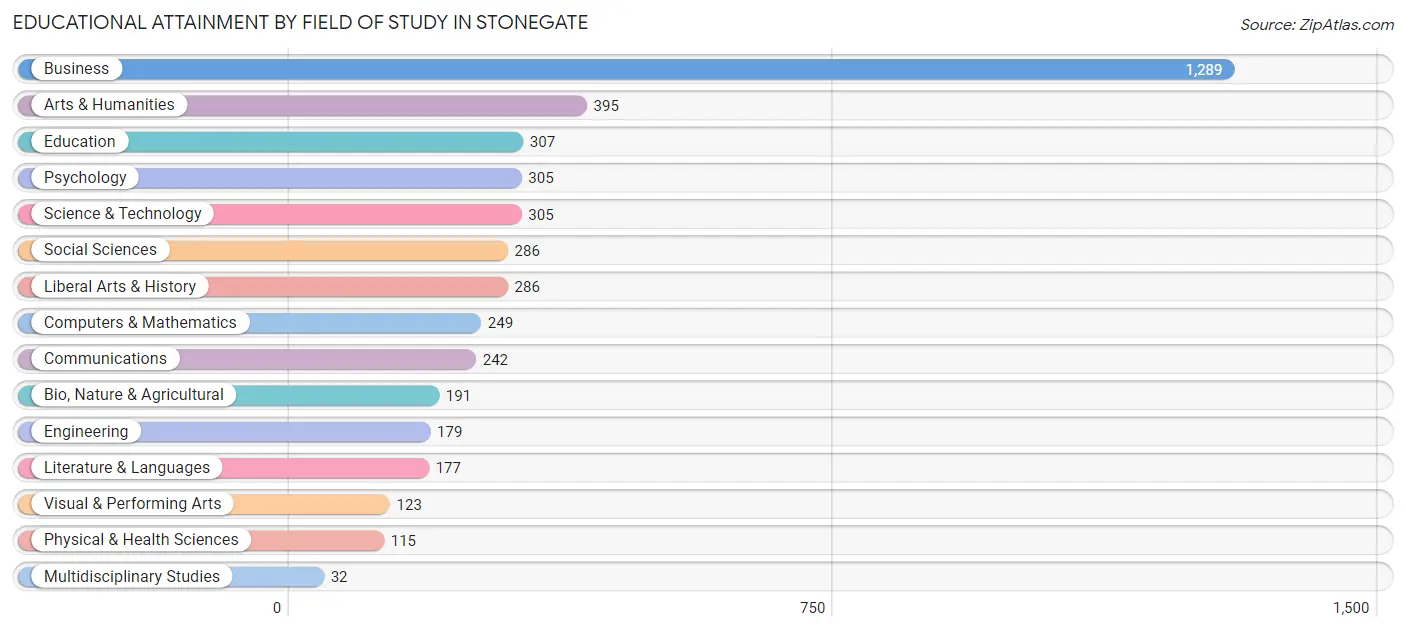
Educational Attainment by Field of Study in Stonegate
Business (1,289 | 28.8%), arts & humanities (395 | 8.8%), education (307 | 6.9%), psychology (305 | 6.8%), and science & technology (305 | 6.8%) are the most common fields of study among 4,481 individuals in Stonegate who have obtained a bachelor's degree or higher.
| Field of Study | # Graduates | % Graduates |
| Computers & Mathematics | 249 | 5.6% |
| Bio, Nature & Agricultural | 191 | 4.3% |
| Physical & Health Sciences | 115 | 2.6% |
| Psychology | 305 | 6.8% |
| Social Sciences | 286 | 6.4% |
| Engineering | 179 | 4.0% |
| Multidisciplinary Studies | 32 | 0.7% |
| Science & Technology | 305 | 6.8% |
| Business | 1,289 | 28.8% |
| Education | 307 | 6.9% |
| Literature & Languages | 177 | 4.0% |
| Liberal Arts & History | 286 | 6.4% |
| Visual & Performing Arts | 123 | 2.7% |
| Communications | 242 | 5.4% |
| Arts & Humanities | 395 | 8.8% |
| Total | 4,481 | 100.0% |
Transportation & Commute in Stonegate
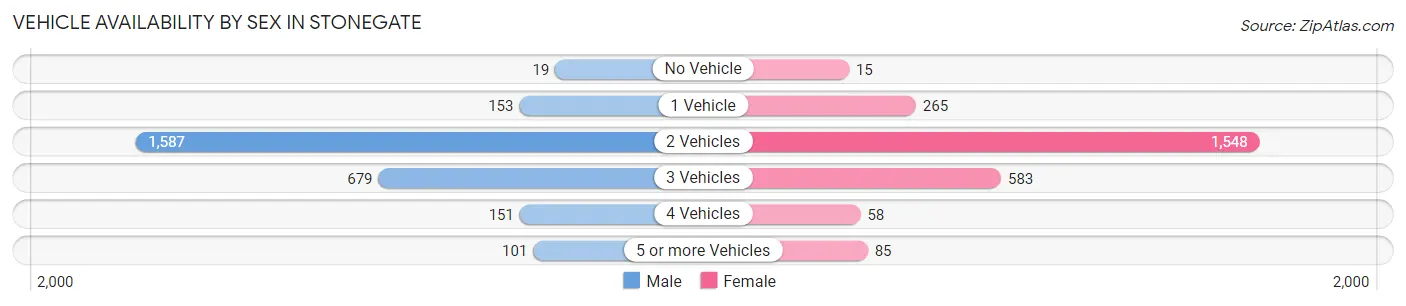
Vehicle Availability by Sex in Stonegate
The most prevalent vehicle ownership categories in Stonegate are males with 2 vehicles (1,587, accounting for 59.0%) and females with 2 vehicles (1,548, making up 62.1%).
| Vehicles Available | Male | Female |
| No Vehicle | 19 (0.7%) | 15 (0.6%) |
| 1 Vehicle | 153 (5.7%) | 265 (10.4%) |
| 2 Vehicles | 1,587 (59.0%) | 1,548 (60.6%) |
| 3 Vehicles | 679 (25.2%) | 583 (22.8%) |
| 4 Vehicles | 151 (5.6%) | 58 (2.3%) |
| 5 or more Vehicles | 101 (3.7%) | 85 (3.3%) |
| Total | 2,690 (100.0%) | 2,554 (100.0%) |
Commute Time in Stonegate
The most frequently occuring commute durations in Stonegate are 20 to 24 minutes (670 commuters, 17.0%), 15 to 19 minutes (597 commuters, 15.1%), and 30 to 34 minutes (572 commuters, 14.5%).
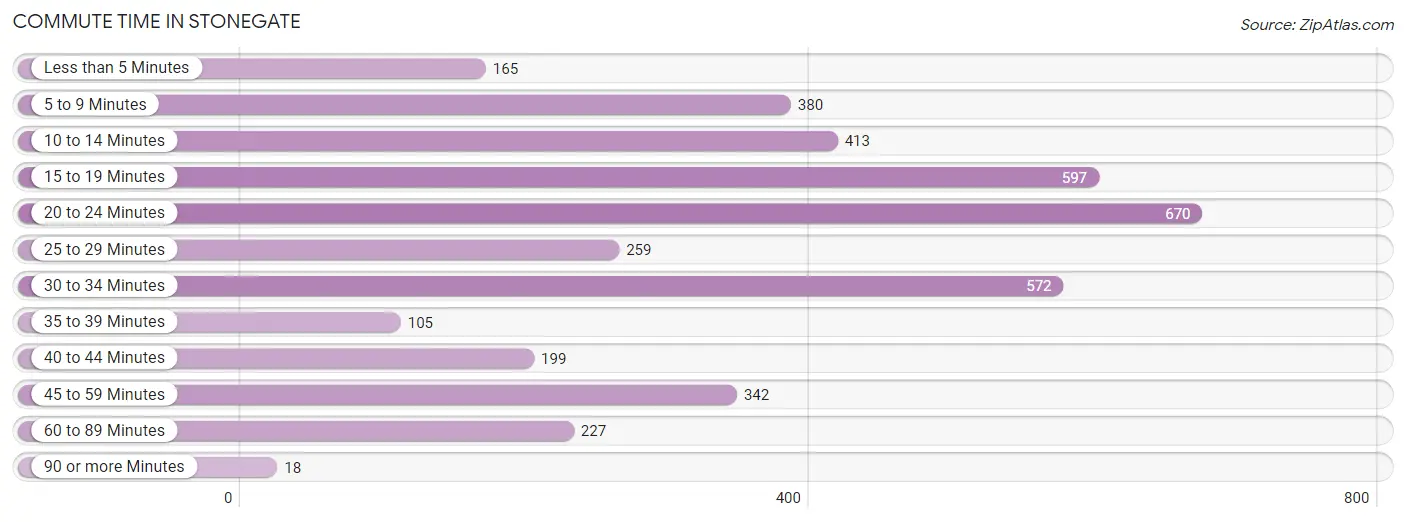
| Commute Time | # Commuters | % Commuters |
| Less than 5 Minutes | 165 | 4.2% |
| 5 to 9 Minutes | 380 | 9.6% |
| 10 to 14 Minutes | 413 | 10.5% |
| 15 to 19 Minutes | 597 | 15.1% |
| 20 to 24 Minutes | 670 | 17.0% |
| 25 to 29 Minutes | 259 | 6.6% |
| 30 to 34 Minutes | 572 | 14.5% |
| 35 to 39 Minutes | 105 | 2.7% |
| 40 to 44 Minutes | 199 | 5.0% |
| 45 to 59 Minutes | 342 | 8.7% |
| 60 to 89 Minutes | 227 | 5.8% |
| 90 or more Minutes | 18 | 0.5% |
Commute Time by Sex in Stonegate
The most common commute times in Stonegate are 20 to 24 minutes (307 commuters, 15.6%) for males and 15 to 19 minutes (434 commuters, 22.0%) for females.
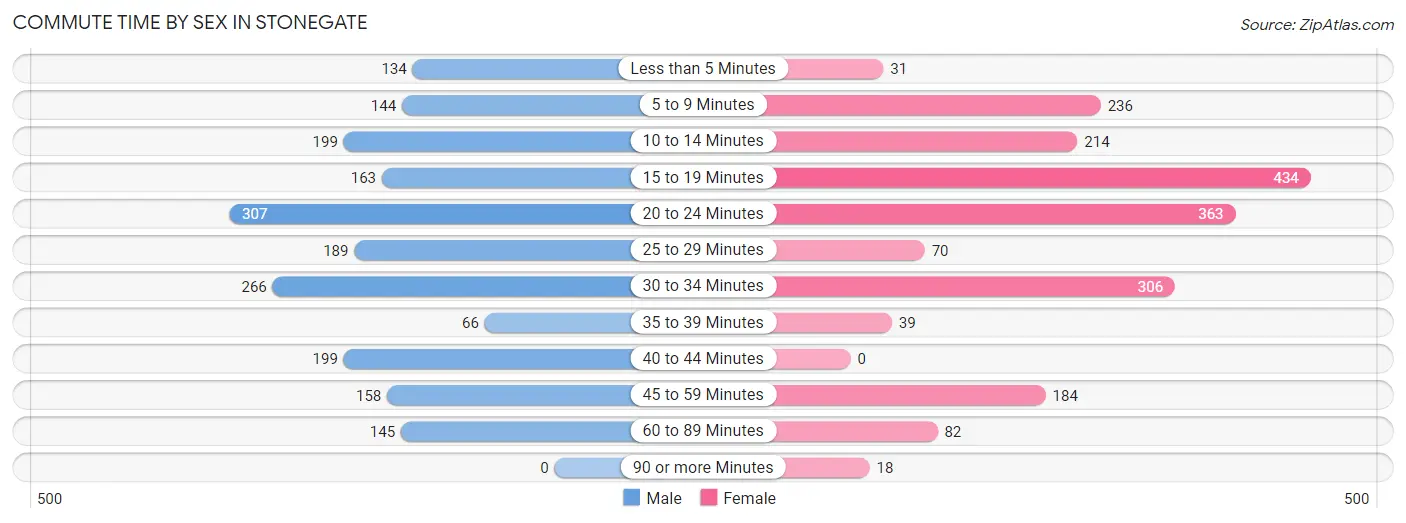
| Commute Time | Male | Female |
| Less than 5 Minutes | 134 (6.8%) | 31 (1.6%) |
| 5 to 9 Minutes | 144 (7.3%) | 236 (11.9%) |
| 10 to 14 Minutes | 199 (10.1%) | 214 (10.8%) |
| 15 to 19 Minutes | 163 (8.3%) | 434 (22.0%) |
| 20 to 24 Minutes | 307 (15.6%) | 363 (18.4%) |
| 25 to 29 Minutes | 189 (9.6%) | 70 (3.5%) |
| 30 to 34 Minutes | 266 (13.5%) | 306 (15.5%) |
| 35 to 39 Minutes | 66 (3.4%) | 39 (2.0%) |
| 40 to 44 Minutes | 199 (10.1%) | 0 (0.0%) |
| 45 to 59 Minutes | 158 (8.0%) | 184 (9.3%) |
| 60 to 89 Minutes | 145 (7.4%) | 82 (4.2%) |
| 90 or more Minutes | 0 (0.0%) | 18 (0.9%) |
Time of Departure to Work by Sex in Stonegate
The most frequent times of departure to work in Stonegate are 7:30 AM to 7:59 AM (301, 15.3%) for males and 8:00 AM to 8:29 AM (376, 19.0%) for females.
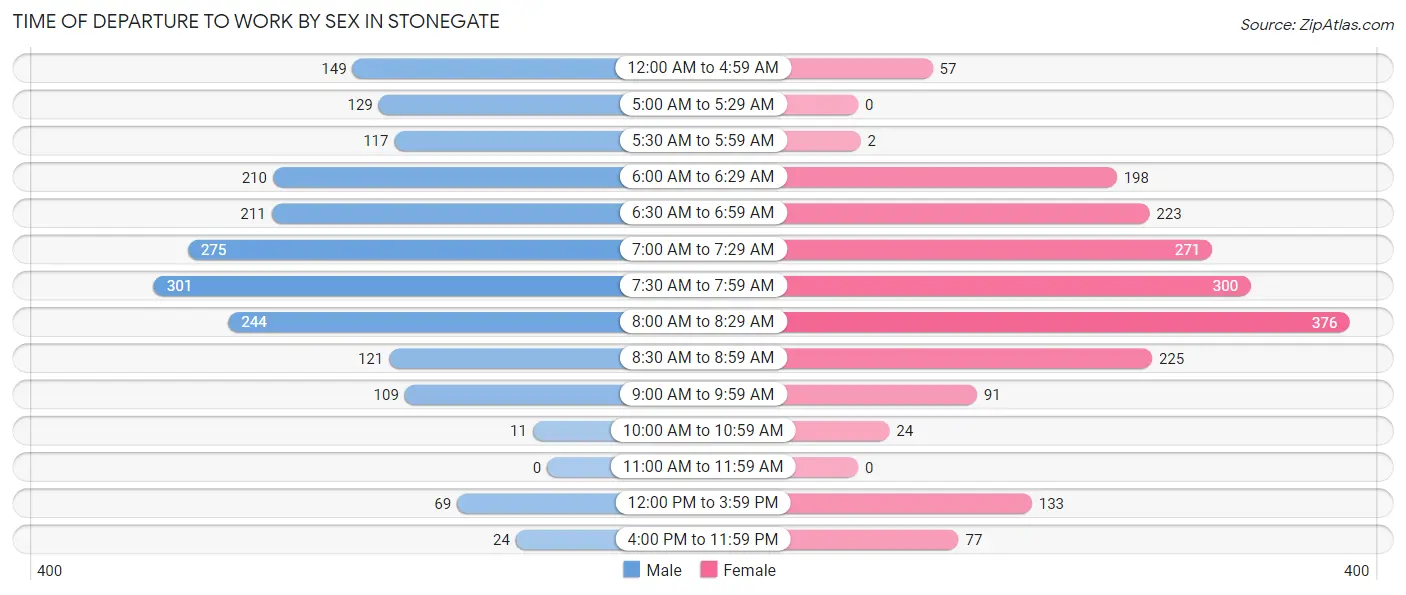
| Time of Departure | Male | Female |
| 12:00 AM to 4:59 AM | 149 (7.6%) | 57 (2.9%) |
| 5:00 AM to 5:29 AM | 129 (6.6%) | 0 (0.0%) |
| 5:30 AM to 5:59 AM | 117 (5.9%) | 2 (0.1%) |
| 6:00 AM to 6:29 AM | 210 (10.7%) | 198 (10.0%) |
| 6:30 AM to 6:59 AM | 211 (10.7%) | 223 (11.3%) |
| 7:00 AM to 7:29 AM | 275 (14.0%) | 271 (13.7%) |
| 7:30 AM to 7:59 AM | 301 (15.3%) | 300 (15.2%) |
| 8:00 AM to 8:29 AM | 244 (12.4%) | 376 (19.0%) |
| 8:30 AM to 8:59 AM | 121 (6.1%) | 225 (11.4%) |
| 9:00 AM to 9:59 AM | 109 (5.5%) | 91 (4.6%) |
| 10:00 AM to 10:59 AM | 11 (0.6%) | 24 (1.2%) |
| 11:00 AM to 11:59 AM | 0 (0.0%) | 0 (0.0%) |
| 12:00 PM to 3:59 PM | 69 (3.5%) | 133 (6.7%) |
| 4:00 PM to 11:59 PM | 24 (1.2%) | 77 (3.9%) |
| Total | 1,970 (100.0%) | 1,977 (100.0%) |
Housing Occupancy in Stonegate
Occupancy by Ownership in Stonegate
Of the total 3,402 dwellings in Stonegate, owner-occupied units account for 3,157 (92.8%), while renter-occupied units make up 245 (7.2%).
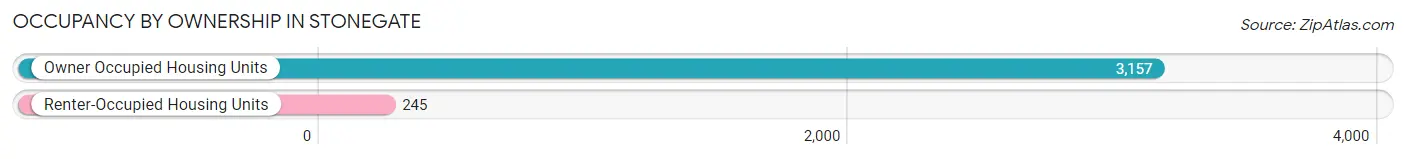
| Occupancy | # Housing Units | % Housing Units |
| Owner Occupied Housing Units | 3,157 | 92.8% |
| Renter-Occupied Housing Units | 245 | 7.2% |
| Total Occupied Housing Units | 3,402 | 100.0% |
Occupancy by Household Size in Stonegate
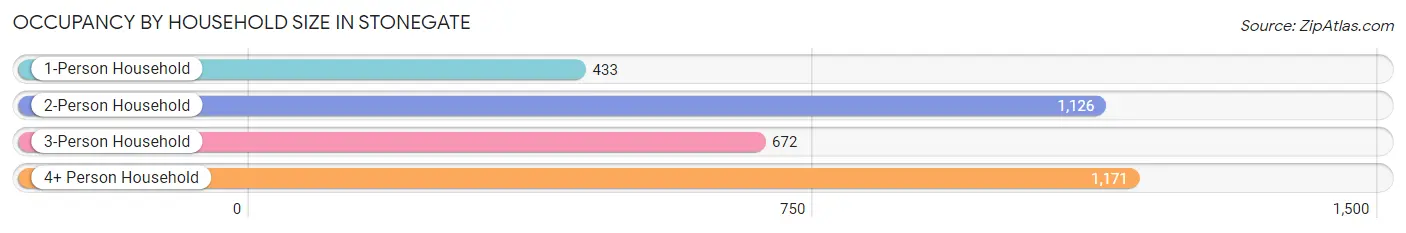
| Household Size | # Housing Units | % Housing Units |
| 1-Person Household | 433 | 12.7% |
| 2-Person Household | 1,126 | 33.1% |
| 3-Person Household | 672 | 19.8% |
| 4+ Person Household | 1,171 | 34.4% |
| Total Housing Units | 3,402 | 100.0% |
Occupancy by Ownership by Household Size in Stonegate
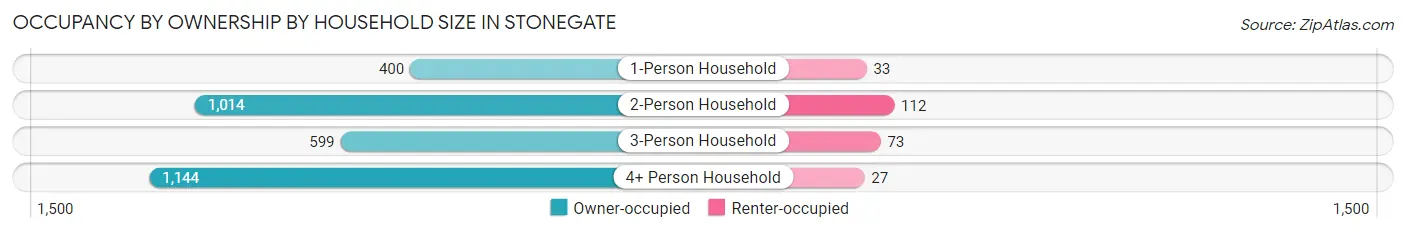
| Household Size | Owner-occupied | Renter-occupied |
| 1-Person Household | 400 (92.4%) | 33 (7.6%) |
| 2-Person Household | 1,014 (90.0%) | 112 (10.0%) |
| 3-Person Household | 599 (89.1%) | 73 (10.9%) |
| 4+ Person Household | 1,144 (97.7%) | 27 (2.3%) |
| Total Housing Units | 3,157 (92.8%) | 245 (7.2%) |
Occupancy by Educational Attainment in Stonegate
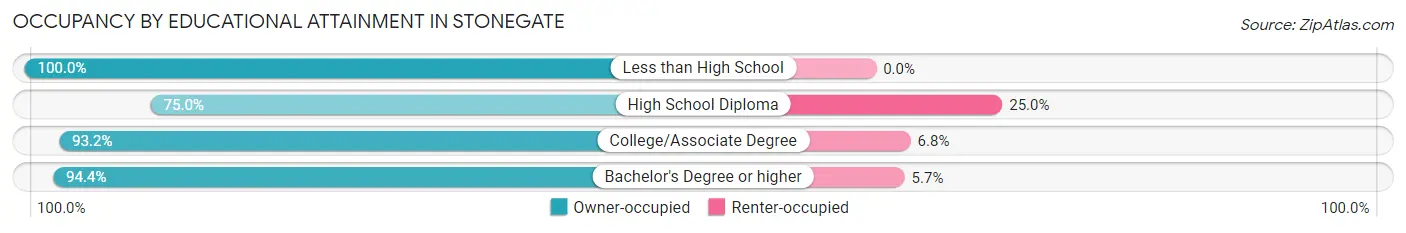
| Household Size | Owner-occupied | Renter-occupied |
| Less than High School | 9 (100.0%) | 0 (0.0%) |
| High School Diploma | 171 (75.0%) | 57 (25.0%) |
| College/Associate Degree | 722 (93.2%) | 53 (6.8%) |
| Bachelor's Degree or higher | 2,255 (94.4%) | 135 (5.7%) |
Occupancy by Age of Householder in Stonegate
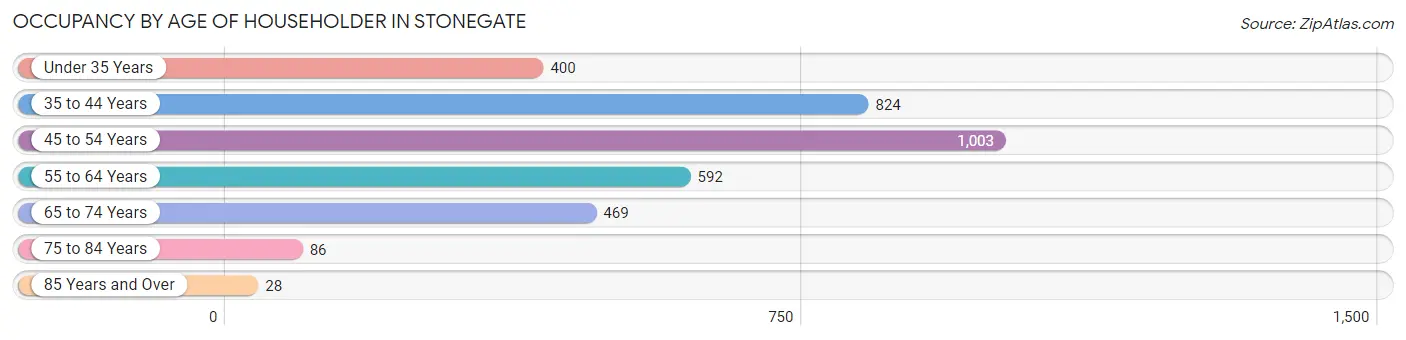
| Age Bracket | # Households | % Households |
| Under 35 Years | 400 | 11.8% |
| 35 to 44 Years | 824 | 24.2% |
| 45 to 54 Years | 1,003 | 29.5% |
| 55 to 64 Years | 592 | 17.4% |
| 65 to 74 Years | 469 | 13.8% |
| 75 to 84 Years | 86 | 2.5% |
| 85 Years and Over | 28 | 0.8% |
| Total | 3,402 | 100.0% |
Housing Finances in Stonegate
Median Income by Occupancy in Stonegate
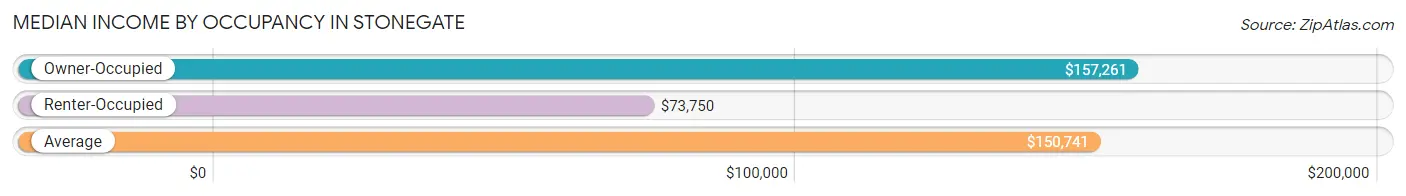
| Occupancy Type | # Households | Median Income |
| Owner-Occupied | 3,157 (92.8%) | $157,261 |
| Renter-Occupied | 245 (7.2%) | $73,750 |
| Average | 3,402 (100.0%) | $150,741 |
Occupancy by Householder Income Bracket in Stonegate
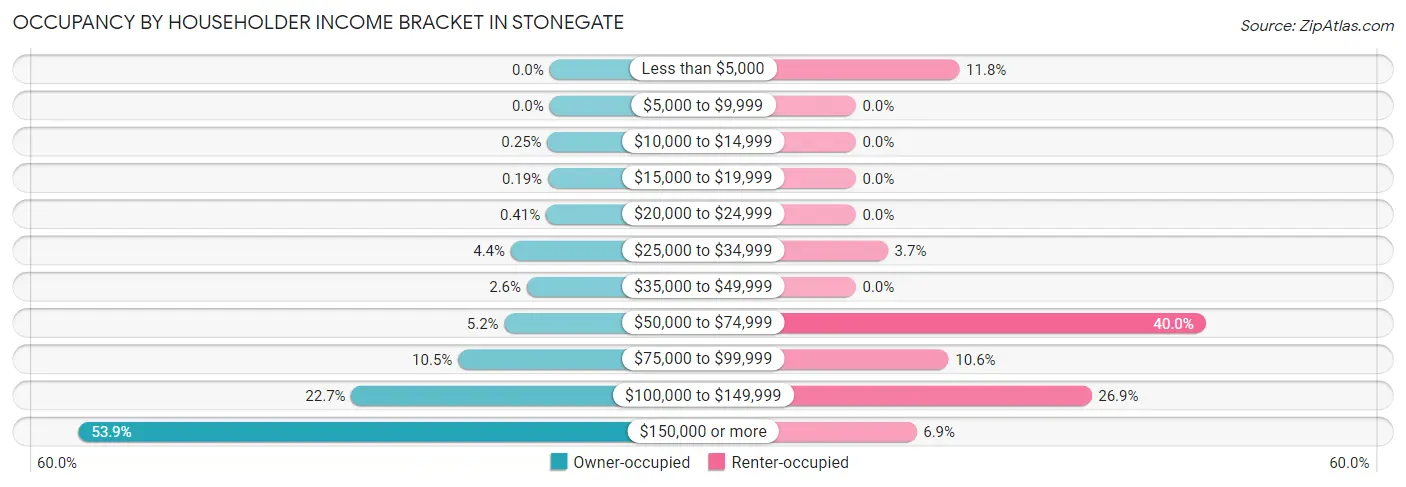
| Income Bracket | Owner-occupied | Renter-occupied |
| Less than $5,000 | 0 (0.0%) | 29 (11.8%) |
| $5,000 to $9,999 | 0 (0.0%) | 0 (0.0%) |
| $10,000 to $14,999 | 8 (0.3%) | 0 (0.0%) |
| $15,000 to $19,999 | 6 (0.2%) | 0 (0.0%) |
| $20,000 to $24,999 | 13 (0.4%) | 0 (0.0%) |
| $25,000 to $34,999 | 140 (4.4%) | 9 (3.7%) |
| $35,000 to $49,999 | 82 (2.6%) | 0 (0.0%) |
| $50,000 to $74,999 | 163 (5.2%) | 98 (40.0%) |
| $75,000 to $99,999 | 330 (10.4%) | 26 (10.6%) |
| $100,000 to $149,999 | 715 (22.7%) | 66 (26.9%) |
| $150,000 or more | 1,700 (53.8%) | 17 (6.9%) |
| Total | 3,157 (100.0%) | 245 (100.0%) |
Monthly Housing Cost Tiers in Stonegate
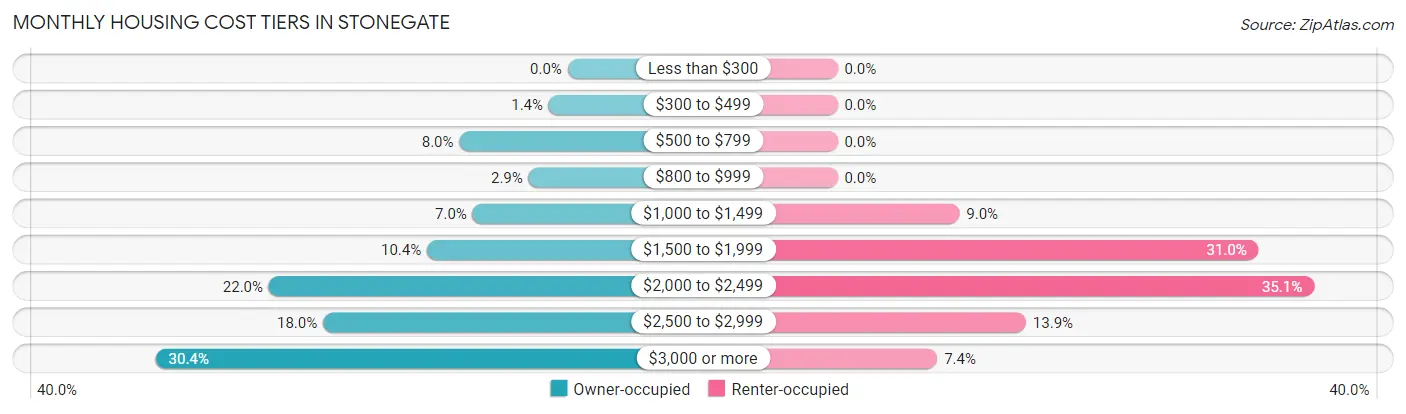
| Monthly Cost | Owner-occupied | Renter-occupied |
| Less than $300 | 0 (0.0%) | 0 (0.0%) |
| $300 to $499 | 44 (1.4%) | 0 (0.0%) |
| $500 to $799 | 252 (8.0%) | 0 (0.0%) |
| $800 to $999 | 91 (2.9%) | 0 (0.0%) |
| $1,000 to $1,499 | 221 (7.0%) | 22 (9.0%) |
| $1,500 to $1,999 | 327 (10.4%) | 76 (31.0%) |
| $2,000 to $2,499 | 695 (22.0%) | 86 (35.1%) |
| $2,500 to $2,999 | 569 (18.0%) | 34 (13.9%) |
| $3,000 or more | 958 (30.3%) | 18 (7.3%) |
| Total | 3,157 (100.0%) | 245 (100.0%) |
Physical Housing Characteristics in Stonegate
Housing Structures in Stonegate
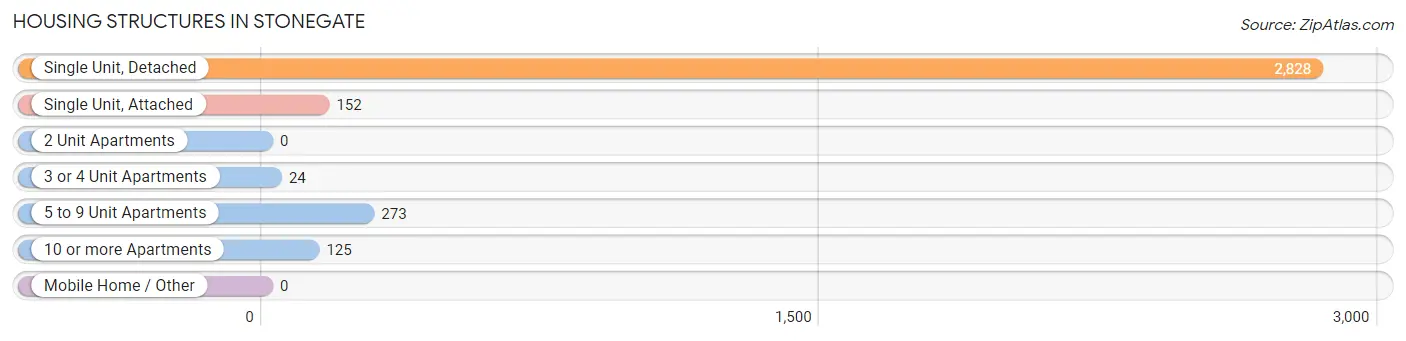
| Structure Type | # Housing Units | % Housing Units |
| Single Unit, Detached | 2,828 | 83.1% |
| Single Unit, Attached | 152 | 4.5% |
| 2 Unit Apartments | 0 | 0.0% |
| 3 or 4 Unit Apartments | 24 | 0.7% |
| 5 to 9 Unit Apartments | 273 | 8.0% |
| 10 or more Apartments | 125 | 3.7% |
| Mobile Home / Other | 0 | 0.0% |
| Total | 3,402 | 100.0% |
Housing Structures by Occupancy in Stonegate
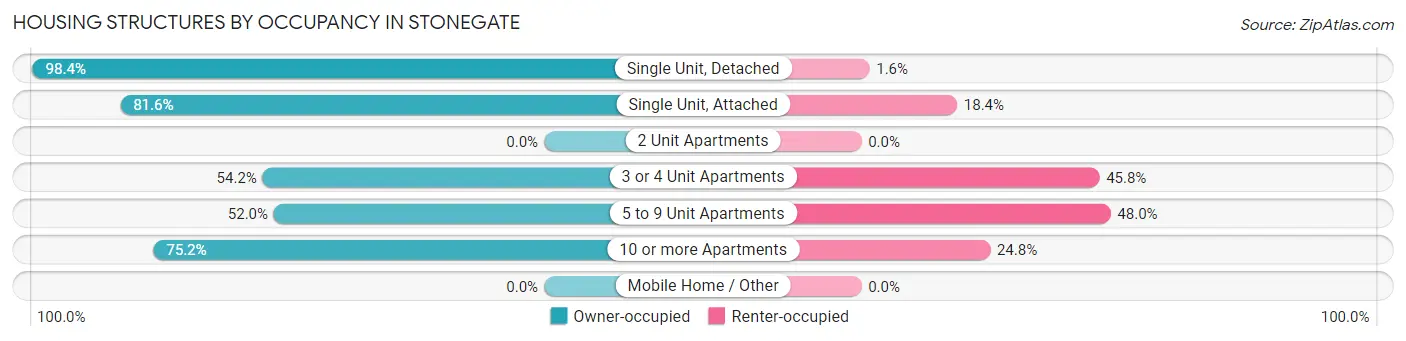
| Structure Type | Owner-occupied | Renter-occupied |
| Single Unit, Detached | 2,784 (98.4%) | 44 (1.6%) |
| Single Unit, Attached | 124 (81.6%) | 28 (18.4%) |
| 2 Unit Apartments | 0 (0.0%) | 0 (0.0%) |
| 3 or 4 Unit Apartments | 13 (54.2%) | 11 (45.8%) |
| 5 to 9 Unit Apartments | 142 (52.0%) | 131 (48.0%) |
| 10 or more Apartments | 94 (75.2%) | 31 (24.8%) |
| Mobile Home / Other | 0 (0.0%) | 0 (0.0%) |
| Total | 3,157 (92.8%) | 245 (7.2%) |
Housing Structures by Number of Rooms in Stonegate
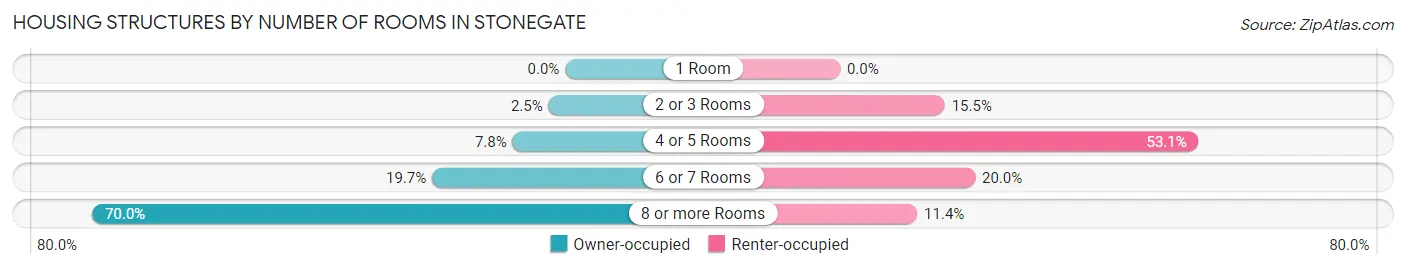
| Number of Rooms | Owner-occupied | Renter-occupied |
| 1 Room | 0 (0.0%) | 0 (0.0%) |
| 2 or 3 Rooms | 78 (2.5%) | 38 (15.5%) |
| 4 or 5 Rooms | 246 (7.8%) | 130 (53.1%) |
| 6 or 7 Rooms | 622 (19.7%) | 49 (20.0%) |
| 8 or more Rooms | 2,211 (70.0%) | 28 (11.4%) |
| Total | 3,157 (100.0%) | 245 (100.0%) |
Housing Structure by Heating Type in Stonegate
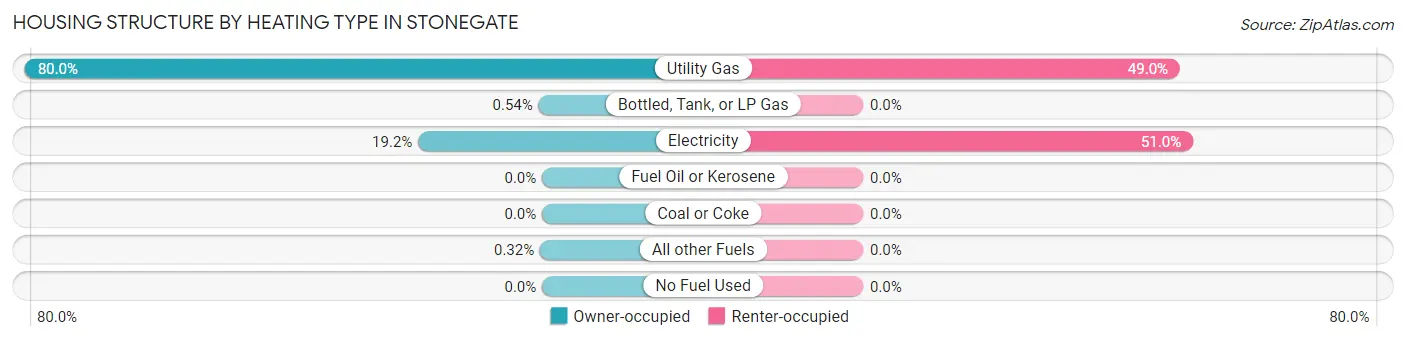
| Heating Type | Owner-occupied | Renter-occupied |
| Utility Gas | 2,525 (80.0%) | 120 (49.0%) |
| Bottled, Tank, or LP Gas | 17 (0.5%) | 0 (0.0%) |
| Electricity | 605 (19.2%) | 125 (51.0%) |
| Fuel Oil or Kerosene | 0 (0.0%) | 0 (0.0%) |
| Coal or Coke | 0 (0.0%) | 0 (0.0%) |
| All other Fuels | 10 (0.3%) | 0 (0.0%) |
| No Fuel Used | 0 (0.0%) | 0 (0.0%) |
| Total | 3,157 (100.0%) | 245 (100.0%) |
Household Vehicle Usage in Stonegate
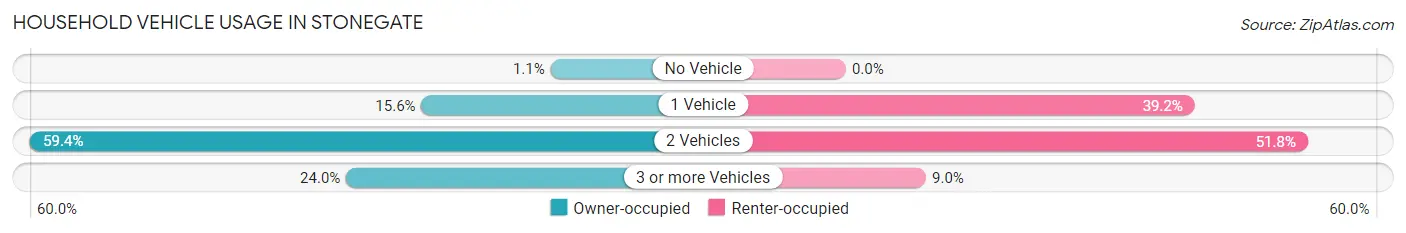
| Vehicles per Household | Owner-occupied | Renter-occupied |
| No Vehicle | 34 (1.1%) | 0 (0.0%) |
| 1 Vehicle | 491 (15.5%) | 96 (39.2%) |
| 2 Vehicles | 1,875 (59.4%) | 127 (51.8%) |
| 3 or more Vehicles | 757 (24.0%) | 22 (9.0%) |
| Total | 3,157 (100.0%) | 245 (100.0%) |
Real Estate & Mortgages in Stonegate
Real Estate and Mortgage Overview in Stonegate
| Characteristic | Without Mortgage | With Mortgage |
| Housing Units | 419 | 2,738 |
| Median Property Value | $552,100 | $601,100 |
| Median Household Income | $109,583 | $1,524 |
| Monthly Housing Costs | $722 | $943 |
| Real Estate Taxes | $3,159 | $21 |
Property Value by Mortgage Status in Stonegate
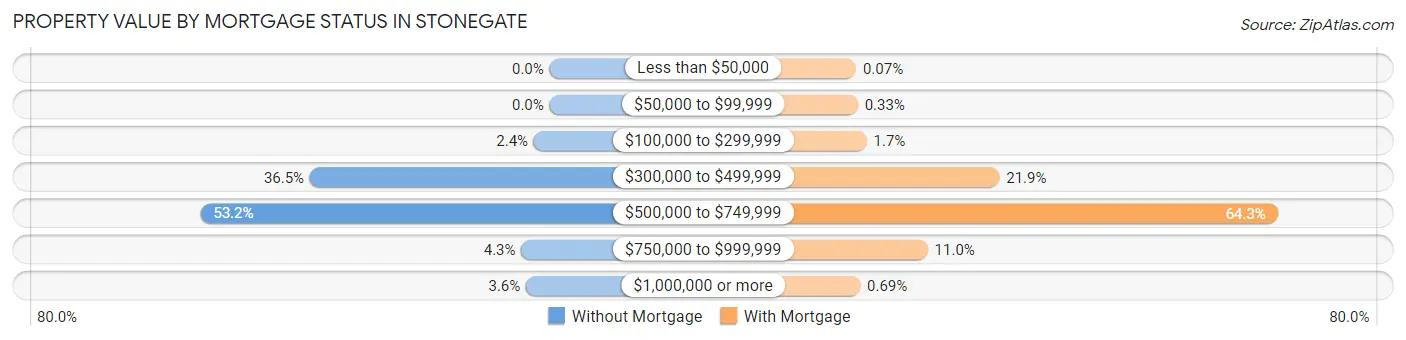
| Property Value | Without Mortgage | With Mortgage |
| Less than $50,000 | 0 (0.0%) | 2 (0.1%) |
| $50,000 to $99,999 | 0 (0.0%) | 9 (0.3%) |
| $100,000 to $299,999 | 10 (2.4%) | 46 (1.7%) |
| $300,000 to $499,999 | 153 (36.5%) | 600 (21.9%) |
| $500,000 to $749,999 | 223 (53.2%) | 1,761 (64.3%) |
| $750,000 to $999,999 | 18 (4.3%) | 301 (11.0%) |
| $1,000,000 or more | 15 (3.6%) | 19 (0.7%) |
| Total | 419 (100.0%) | 2,738 (100.0%) |
Household Income by Mortgage Status in Stonegate
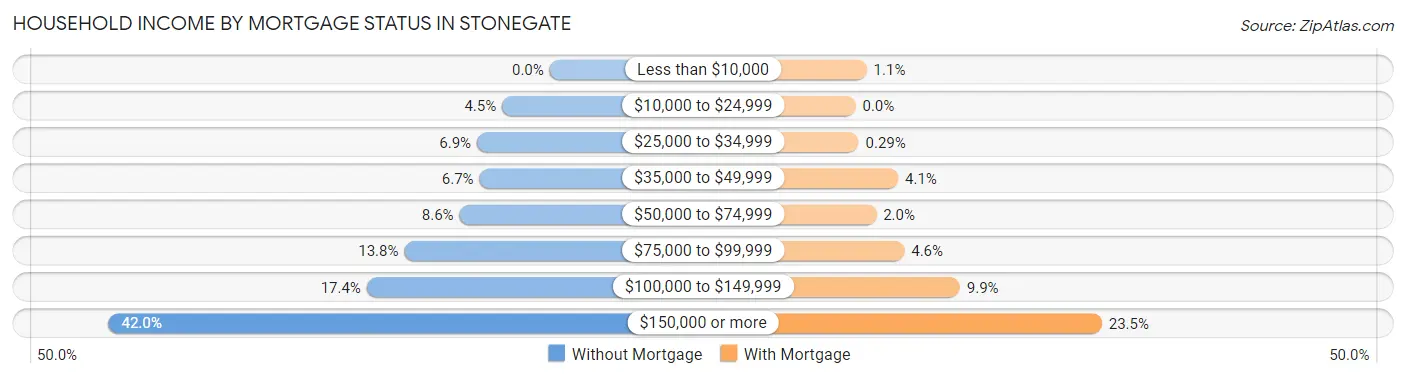
| Household Income | Without Mortgage | With Mortgage |
| Less than $10,000 | 0 (0.0%) | 29 (1.1%) |
| $10,000 to $24,999 | 19 (4.5%) | 0 (0.0%) |
| $25,000 to $34,999 | 29 (6.9%) | 8 (0.3%) |
| $35,000 to $49,999 | 28 (6.7%) | 111 (4.1%) |
| $50,000 to $74,999 | 36 (8.6%) | 54 (2.0%) |
| $75,000 to $99,999 | 58 (13.8%) | 127 (4.6%) |
| $100,000 to $149,999 | 73 (17.4%) | 272 (9.9%) |
| $150,000 or more | 176 (42.0%) | 642 (23.4%) |
| Total | 419 (100.0%) | 2,738 (100.0%) |
Property Value to Household Income Ratio in Stonegate
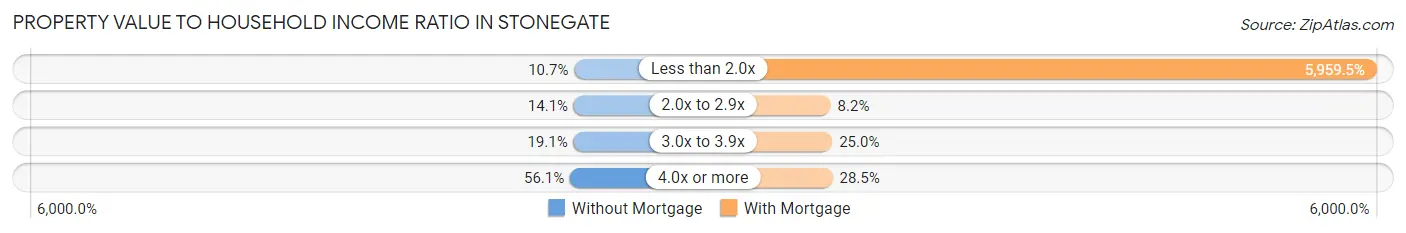
| Value-to-Income Ratio | Without Mortgage | With Mortgage |
| Less than 2.0x | 45 (10.7%) | 163,172 (5,959.5%) |
| 2.0x to 2.9x | 59 (14.1%) | 224 (8.2%) |
| 3.0x to 3.9x | 80 (19.1%) | 684 (25.0%) |
| 4.0x or more | 235 (56.1%) | 779 (28.4%) |
| Total | 419 (100.0%) | 2,738 (100.0%) |
Real Estate Taxes by Mortgage Status in Stonegate
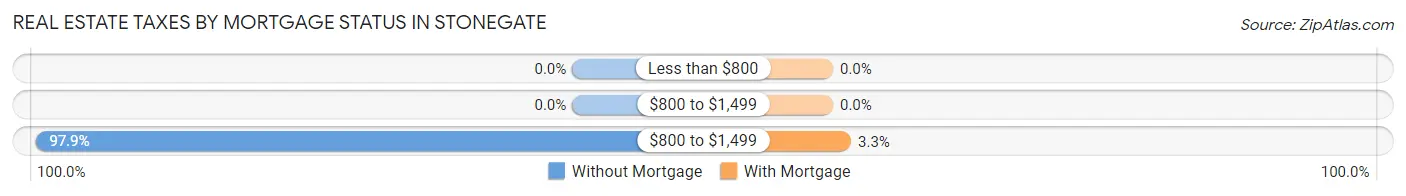
| Property Taxes | Without Mortgage | With Mortgage |
| Less than $800 | 0 (0.0%) | 0 (0.0%) |
| $800 to $1,499 | 0 (0.0%) | 0 (0.0%) |
| $800 to $1,499 | 410 (97.9%) | 90 (3.3%) |
| Total | 419 (100.0%) | 2,738 (100.0%) |
Health & Disability in Stonegate
Health Insurance Coverage by Age in Stonegate
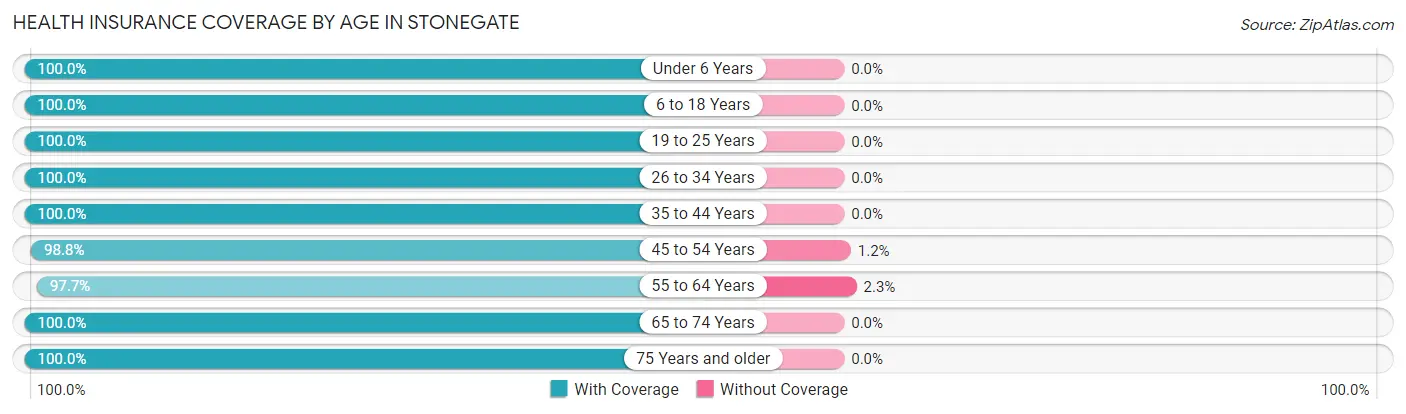
| Age Bracket | With Coverage | Without Coverage |
| Under 6 Years | 693 (100.0%) | 0 (0.0%) |
| 6 to 18 Years | 2,263 (100.0%) | 0 (0.0%) |
| 19 to 25 Years | 554 (100.0%) | 0 (0.0%) |
| 26 to 34 Years | 890 (100.0%) | 0 (0.0%) |
| 35 to 44 Years | 1,550 (100.0%) | 0 (0.0%) |
| 45 to 54 Years | 1,694 (98.8%) | 21 (1.2%) |
| 55 to 64 Years | 1,147 (97.7%) | 27 (2.3%) |
| 65 to 74 Years | 711 (100.0%) | 0 (0.0%) |
| 75 Years and older | 176 (100.0%) | 0 (0.0%) |
| Total | 9,678 (99.5%) | 48 (0.5%) |
Health Insurance Coverage by Citizenship Status in Stonegate
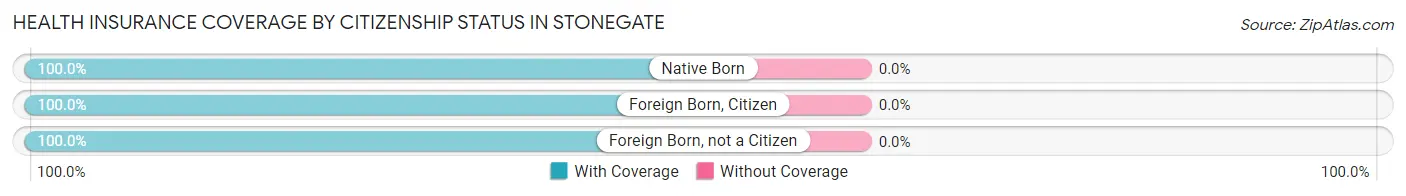
| Citizenship Status | With Coverage | Without Coverage |
| Native Born | 693 (100.0%) | 0 (0.0%) |
| Foreign Born, Citizen | 2,263 (100.0%) | 0 (0.0%) |
| Foreign Born, not a Citizen | 554 (100.0%) | 0 (0.0%) |
Health Insurance Coverage by Household Income in Stonegate
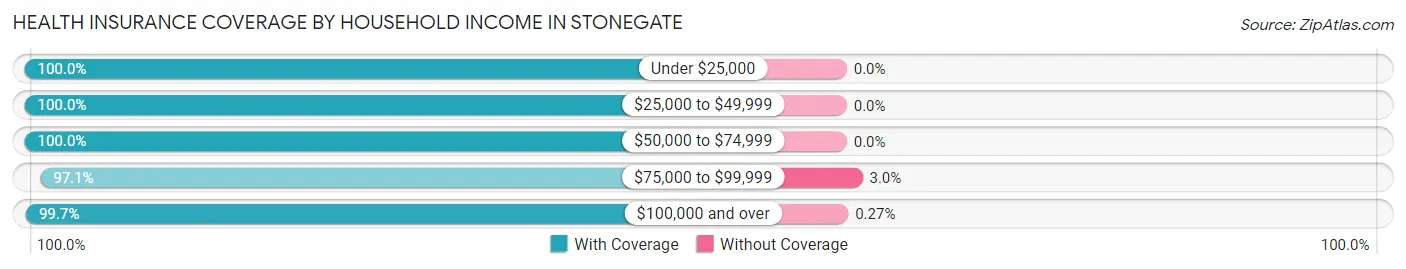
| Household Income | With Coverage | Without Coverage |
| Under $25,000 | 109 (100.0%) | 0 (0.0%) |
| $25,000 to $49,999 | 399 (100.0%) | 0 (0.0%) |
| $50,000 to $74,999 | 580 (100.0%) | 0 (0.0%) |
| $75,000 to $99,999 | 888 (97.1%) | 27 (2.9%) |
| $100,000 and over | 7,702 (99.7%) | 21 (0.3%) |
Public vs Private Health Insurance Coverage by Age in Stonegate
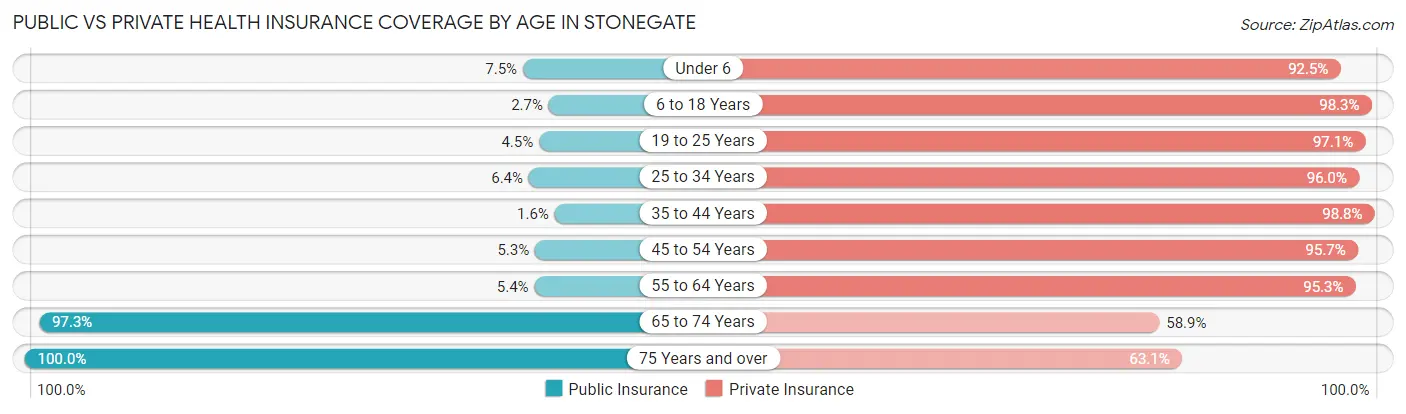
| Age Bracket | Public Insurance | Private Insurance |
| Under 6 | 52 (7.5%) | 641 (92.5%) |
| 6 to 18 Years | 61 (2.7%) | 2,224 (98.3%) |
| 19 to 25 Years | 25 (4.5%) | 538 (97.1%) |
| 25 to 34 Years | 57 (6.4%) | 854 (96.0%) |
| 35 to 44 Years | 25 (1.6%) | 1,532 (98.8%) |
| 45 to 54 Years | 90 (5.2%) | 1,642 (95.7%) |
| 55 to 64 Years | 63 (5.4%) | 1,119 (95.3%) |
| 65 to 74 Years | 692 (97.3%) | 419 (58.9%) |
| 75 Years and over | 176 (100.0%) | 111 (63.1%) |
| Total | 1,241 (12.8%) | 9,080 (93.4%) |
Disability Status by Sex by Age in Stonegate
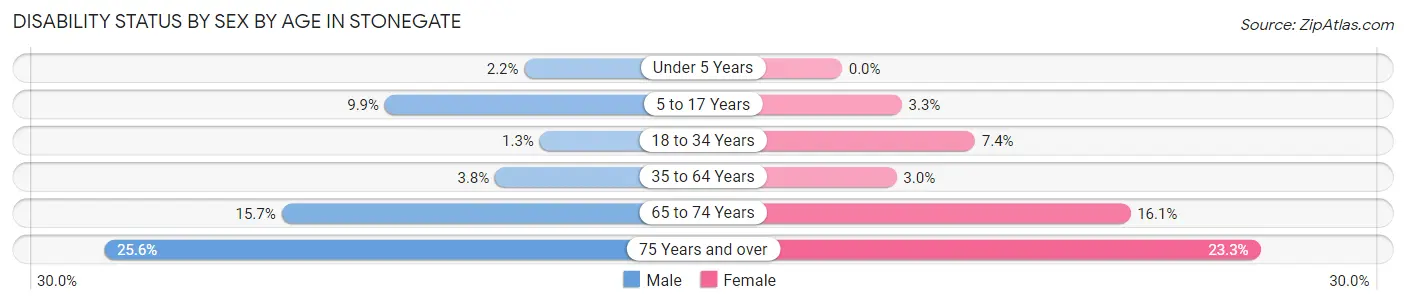
| Age Bracket | Male | Female |
| Under 5 Years | 9 (2.2%) | 0 (0.0%) |
| 5 to 17 Years | 96 (9.9%) | 43 (3.3%) |
| 18 to 34 Years | 10 (1.3%) | 60 (7.4%) |
| 35 to 64 Years | 81 (3.8%) | 70 (3.0%) |
| 65 to 74 Years | 51 (15.7%) | 62 (16.1%) |
| 75 Years and over | 11 (25.6%) | 31 (23.3%) |
Disability Class by Sex by Age in Stonegate
Disability Class: Hearing Difficulty
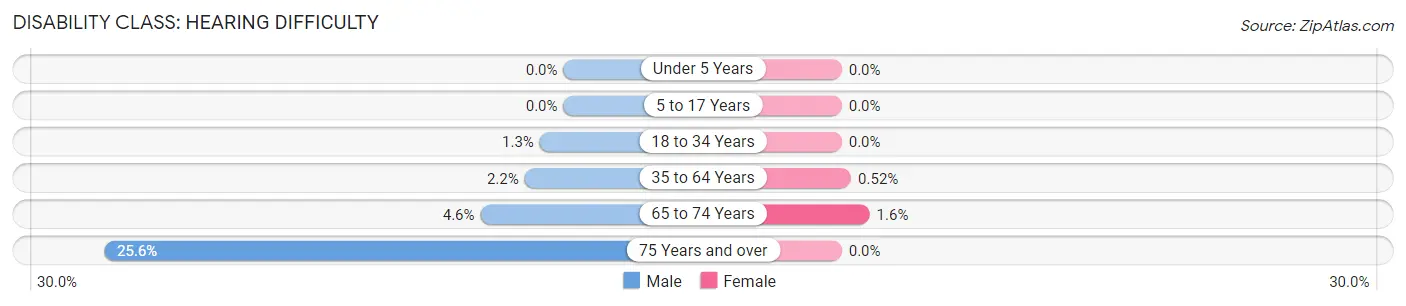
| Age Bracket | Male | Female |
| Under 5 Years | 0 (0.0%) | 0 (0.0%) |
| 5 to 17 Years | 0 (0.0%) | 0 (0.0%) |
| 18 to 34 Years | 10 (1.3%) | 0 (0.0%) |
| 35 to 64 Years | 46 (2.2%) | 12 (0.5%) |
| 65 to 74 Years | 15 (4.6%) | 6 (1.5%) |
| 75 Years and over | 11 (25.6%) | 0 (0.0%) |
Disability Class: Vision Difficulty
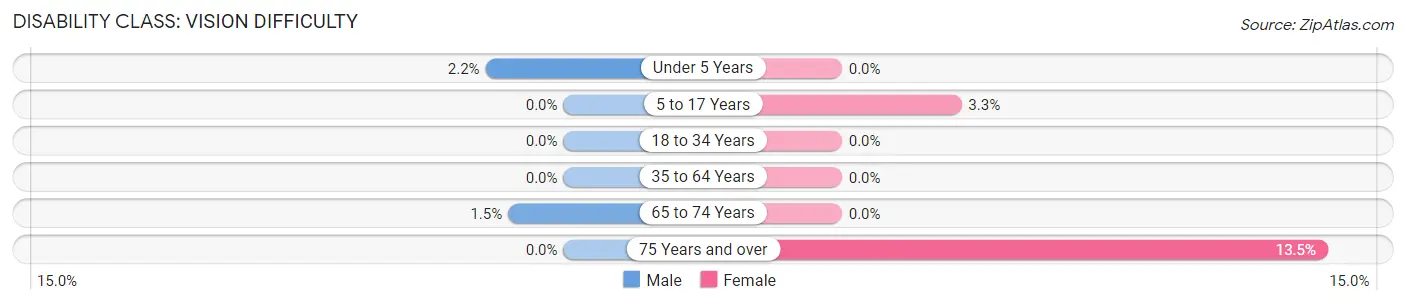
| Age Bracket | Male | Female |
| Under 5 Years | 9 (2.2%) | 0 (0.0%) |
| 5 to 17 Years | 0 (0.0%) | 43 (3.3%) |
| 18 to 34 Years | 0 (0.0%) | 0 (0.0%) |
| 35 to 64 Years | 0 (0.0%) | 0 (0.0%) |
| 65 to 74 Years | 5 (1.5%) | 0 (0.0%) |
| 75 Years and over | 0 (0.0%) | 18 (13.5%) |
Disability Class: Cognitive Difficulty
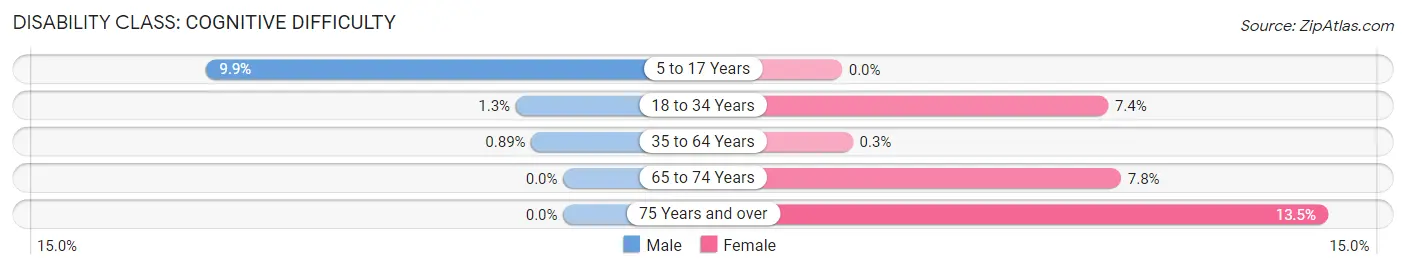
| Age Bracket | Male | Female |
| 5 to 17 Years | 96 (9.9%) | 0 (0.0%) |
| 18 to 34 Years | 10 (1.3%) | 60 (7.4%) |
| 35 to 64 Years | 19 (0.9%) | 7 (0.3%) |
| 65 to 74 Years | 0 (0.0%) | 30 (7.8%) |
| 75 Years and over | 0 (0.0%) | 18 (13.5%) |
Disability Class: Ambulatory Difficulty
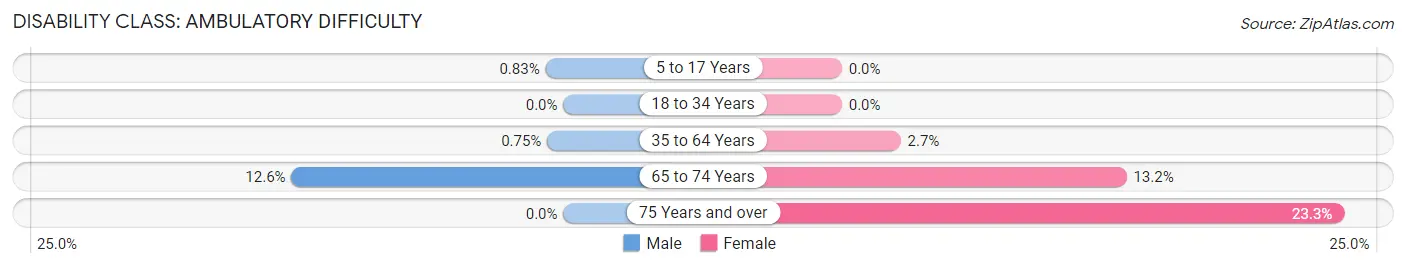
| Age Bracket | Male | Female |
| 5 to 17 Years | 8 (0.8%) | 0 (0.0%) |
| 18 to 34 Years | 0 (0.0%) | 0 (0.0%) |
| 35 to 64 Years | 16 (0.7%) | 63 (2.7%) |
| 65 to 74 Years | 41 (12.6%) | 51 (13.2%) |
| 75 Years and over | 0 (0.0%) | 31 (23.3%) |
Disability Class: Self-Care Difficulty
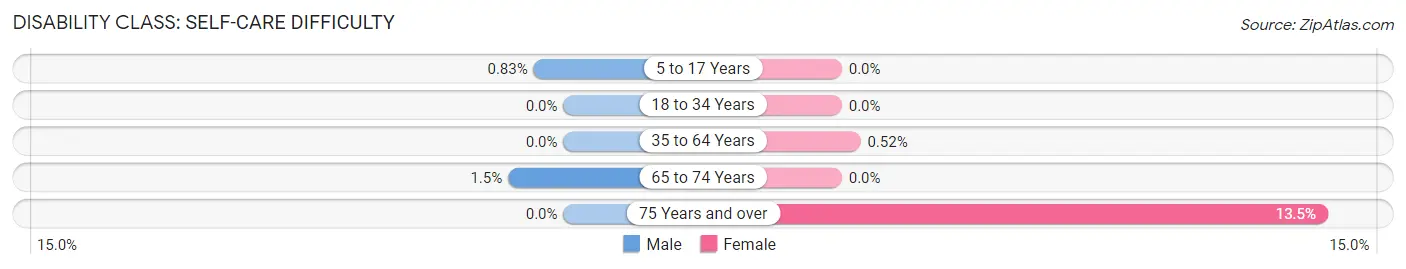
| Age Bracket | Male | Female |
| 5 to 17 Years | 8 (0.8%) | 0 (0.0%) |
| 18 to 34 Years | 0 (0.0%) | 0 (0.0%) |
| 35 to 64 Years | 0 (0.0%) | 12 (0.5%) |
| 65 to 74 Years | 5 (1.5%) | 0 (0.0%) |
| 75 Years and over | 0 (0.0%) | 18 (13.5%) |
Technology Access in Stonegate
Computing Device Access in Stonegate
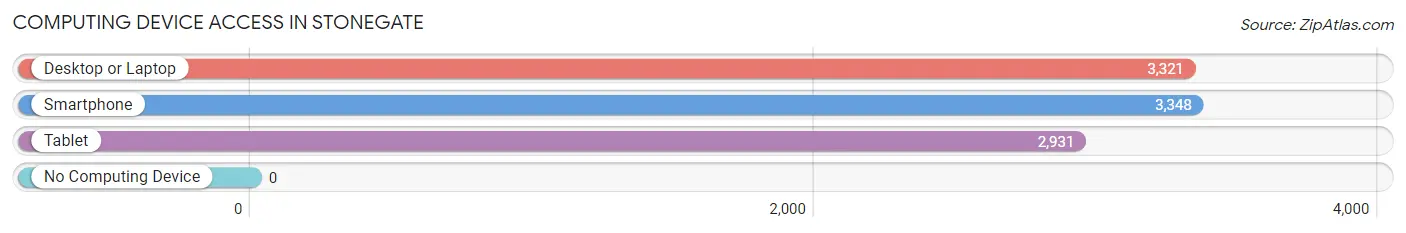
| Device Type | # Households | % Households |
| Desktop or Laptop | 3,321 | 97.6% |
| Smartphone | 3,348 | 98.4% |
| Tablet | 2,931 | 86.2% |
| No Computing Device | 0 | 0.0% |
| Total | 3,402 | 100.0% |
Internet Access in Stonegate
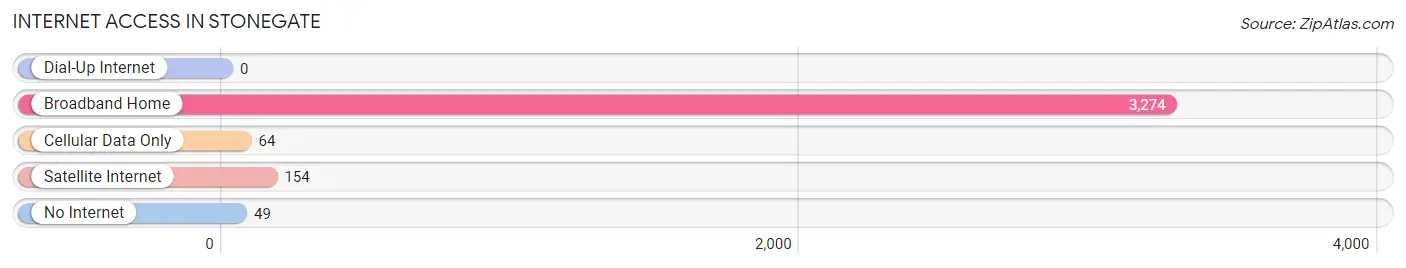
| Internet Type | # Households | % Households |
| Dial-Up Internet | 0 | 0.0% |
| Broadband Home | 3,274 | 96.2% |
| Cellular Data Only | 64 | 1.9% |
| Satellite Internet | 154 | 4.5% |
| No Internet | 49 | 1.4% |
| Total | 3,402 | 100.0% |
Stonegate Summary
Geography
Stonegate is a small, unincorporated community located in Douglas County, Colorado. It is situated in the foothills of the Rocky Mountains, approximately 25 miles south of Denver. The community is located in the northern part of the county, just south of the town of Castle Rock. The area is characterized by rolling hills, open meadows, and dense forests. The elevation of Stonegate is 6,400 feet above sea level.
The climate of Stonegate is typical of the Rocky Mountain region, with cold winters and mild summers. The average annual temperature is 45 degrees Fahrenheit, with an average high of 75 degrees in the summer and an average low of 25 degrees in the winter. The average annual precipitation is 16 inches, with most of the precipitation occurring in the spring and summer months.
Economy
The economy of Stonegate is largely based on agriculture and tourism. The area is home to several small farms, which produce a variety of crops, including hay, corn, wheat, and alfalfa. The area is also home to several wineries, which produce a variety of wines.
Tourism is an important part of the local economy. The area is home to several popular attractions, including the Castle Rock State Park, the Douglas County Fairgrounds, and the Stonegate Golf Course. The area is also home to several popular restaurants and shops.
Demographics
As of the 2010 census, the population of Stonegate was 1,845. The racial makeup of the community was 94.3% White, 0.7% African American, 0.3% Native American, 0.7% Asian, 0.1% Pacific Islander, 1.7% from other races, and 2.1% from two or more races. Hispanic or Latino of any race were 5.2% of the population.
The median household income in Stonegate was $76,250, and the median family income was $86,250. The per capita income was $31,945. About 4.3% of families and 5.7% of the population were below the poverty line, including 8.3% of those under age 18 and 4.2% of those age 65 or over.
History
Stonegate was first settled in the late 1800s by homesteaders who were attracted to the area by its fertile soil and abundant natural resources. The area was originally known as “Stonegate Ranch” and was home to several small farms. In the early 1900s, the area began to attract more settlers, and the community of Stonegate was officially established in 1912.
In the 1950s, the area began to experience rapid growth as more people moved to the area to take advantage of the area’s natural beauty and proximity to Denver. The population of Stonegate continued to grow throughout the 1960s and 1970s, and the area began to attract more businesses and services.
Today, Stonegate is a thriving community with a strong sense of community and a vibrant economy. The area is home to several popular attractions, including the Castle Rock State Park, the Douglas County Fairgrounds, and the Stonegate Golf Course. The area is also home to several popular restaurants and shops.
Common Questions
What is Per Capita Income in Stonegate?
Per Capita income in Stonegate is $57,063.
What is the Median Family Income in Stonegate?
Median Family Income in Stonegate is $163,920.
What is the Median Household income in Stonegate?
Median Household Income in Stonegate is $150,741.
What is Income or Wage Gap in Stonegate?
Income or Wage Gap in Stonegate is 49.8%.
Women in Stonegate earn 50.2 cents for every dollar earned by a man.
What is Inequality or Gini Index in Stonegate?
Inequality or Gini Index in Stonegate is 0.31.
What is the Total Population of Stonegate?
Total Population of Stonegate is 9,770.
What is the Total Male Population of Stonegate?
Total Male Population of Stonegate is 4,656.
What is the Total Female Population of Stonegate?
Total Female Population of Stonegate is 5,114.
What is the Ratio of Males per 100 Females in Stonegate?
There are 91.04 Males per 100 Females in Stonegate.
What is the Ratio of Females per 100 Males in Stonegate?
There are 109.84 Females per 100 Males in Stonegate.
What is the Median Population Age in Stonegate?
Median Population Age in Stonegate is 38.2 Years.
What is the Average Family Size in Stonegate
Average Family Size in Stonegate is 3.1 People.
What is the Average Household Size in Stonegate
Average Household Size in Stonegate is 2.9 People.
How Large is the Labor Force in Stonegate?
There are 5,492 People in the Labor Forcein in Stonegate.
What is the Percentage of People in the Labor Force in Stonegate?
76.0% of People are in the Labor Force in Stonegate.
What is the Unemployment Rate in Stonegate?
Unemployment Rate in Stonegate is 3.5%.