Rockvale, CO Map & Demographics
Rockvale Map
Rockvale Overview
$23,999
PER CAPITA INCOME
$56,600
AVG FAMILY INCOME
$54,091
AVG HOUSEHOLD INCOME
0.37
INEQUALITY / GINI INDEX
683
TOTAL POPULATION
426
MALE POPULATION
257
FEMALE POPULATION
165.76
MALES / 100 FEMALES
60.33
FEMALES / 100 MALES
45.0
MEDIAN AGE
3.2
AVG FAMILY SIZE
2.5
AVG HOUSEHOLD SIZE
276
LABOR FORCE [ PEOPLE ]
48.8%
PERCENT IN LABOR FORCE
7.6%
UNEMPLOYMENT RATE
Rockvale Zip Codes
Rockvale Area Codes
Income in Rockvale
Income Overview in Rockvale
Per Capita Income in Rockvale is $23,999, while median incomes of families and households are $56,600 and $54,091 respectively.
| Characteristic | Number | Measure |
| Per Capita Income | 683 | $23,999 |
| Median Family Income | 176 | $56,600 |
| Mean Family Income | 176 | $71,348 |
| Median Household Income | 272 | $54,091 |
| Mean Household Income | 272 | $57,028 |
| Income Deficit | 176 | $0 |
| Wage / Income Gap (%) | 683 | 0.00% |
| Wage / Income Gap ($) | 683 | 100.00¢ per $1 |
| Gini / Inequality Index | 683 | 0.37 |
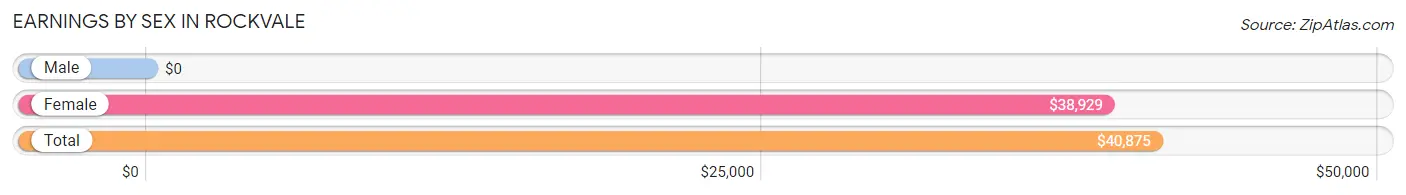
Earnings by Sex in Rockvale
| Sex | Number | Average Earnings |
| Male | 139 (48.8%) | $0 |
| Female | 146 (51.2%) | $38,929 |
| Total | 285 (100.0%) | $40,875 |
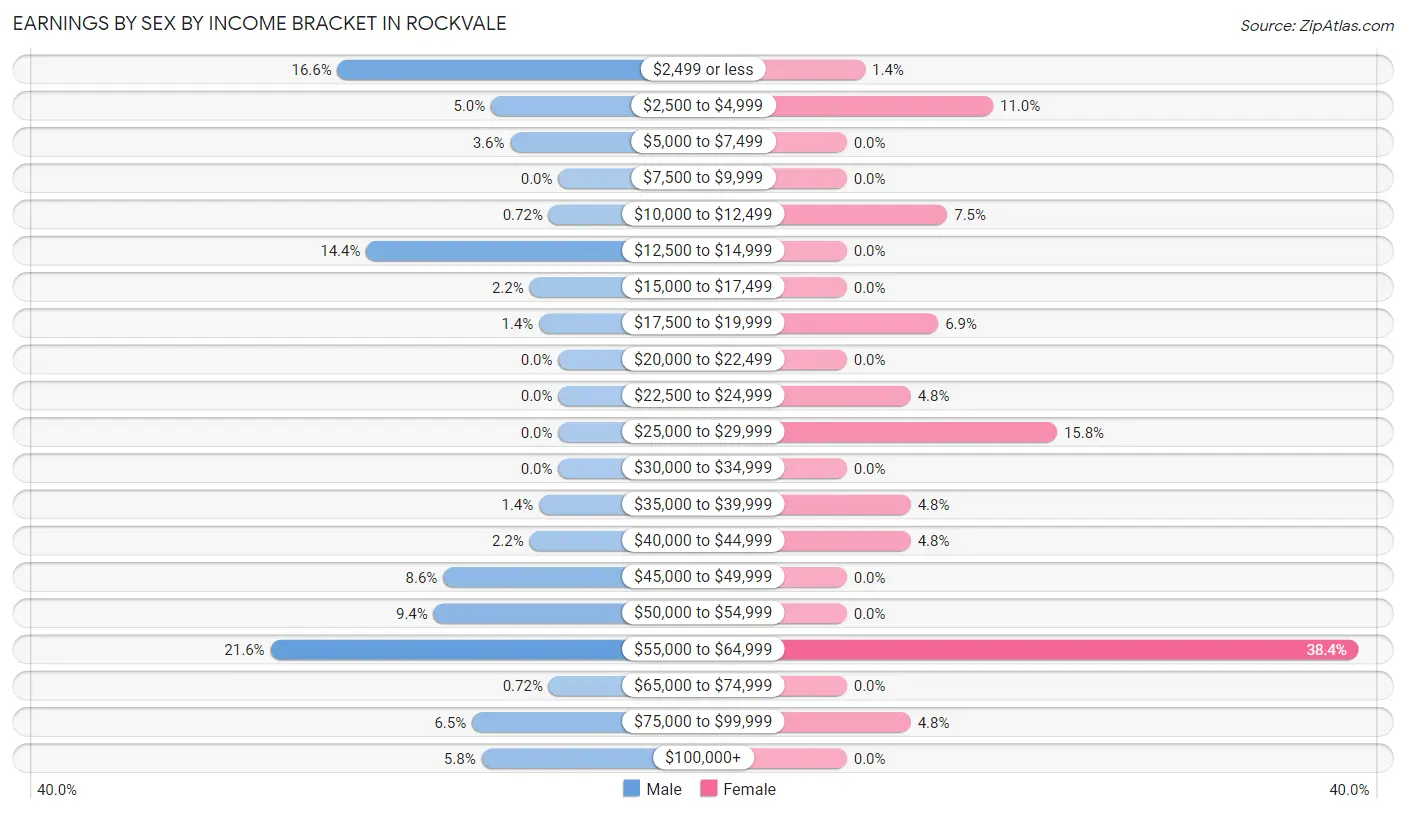
Earnings by Sex by Income Bracket in Rockvale
The most common earnings brackets in Rockvale are $55,000 to $64,999 for men (30 | 21.6%) and $55,000 to $64,999 for women (56 | 38.4%).
| Income | Male | Female |
| $2,499 or less | 23 (16.6%) | 2 (1.4%) |
| $2,500 to $4,999 | 7 (5.0%) | 16 (11.0%) |
| $5,000 to $7,499 | 5 (3.6%) | 0 (0.0%) |
| $7,500 to $9,999 | 0 (0.0%) | 0 (0.0%) |
| $10,000 to $12,499 | 1 (0.7%) | 11 (7.5%) |
| $12,500 to $14,999 | 20 (14.4%) | 0 (0.0%) |
| $15,000 to $17,499 | 3 (2.2%) | 0 (0.0%) |
| $17,500 to $19,999 | 2 (1.4%) | 10 (6.9%) |
| $20,000 to $22,499 | 0 (0.0%) | 0 (0.0%) |
| $22,500 to $24,999 | 0 (0.0%) | 7 (4.8%) |
| $25,000 to $29,999 | 0 (0.0%) | 23 (15.8%) |
| $30,000 to $34,999 | 0 (0.0%) | 0 (0.0%) |
| $35,000 to $39,999 | 2 (1.4%) | 7 (4.8%) |
| $40,000 to $44,999 | 3 (2.2%) | 7 (4.8%) |
| $45,000 to $49,999 | 12 (8.6%) | 0 (0.0%) |
| $50,000 to $54,999 | 13 (9.3%) | 0 (0.0%) |
| $55,000 to $64,999 | 30 (21.6%) | 56 (38.4%) |
| $65,000 to $74,999 | 1 (0.7%) | 0 (0.0%) |
| $75,000 to $99,999 | 9 (6.5%) | 7 (4.8%) |
| $100,000+ | 8 (5.8%) | 0 (0.0%) |
| Total | 139 (100.0%) | 146 (100.0%) |
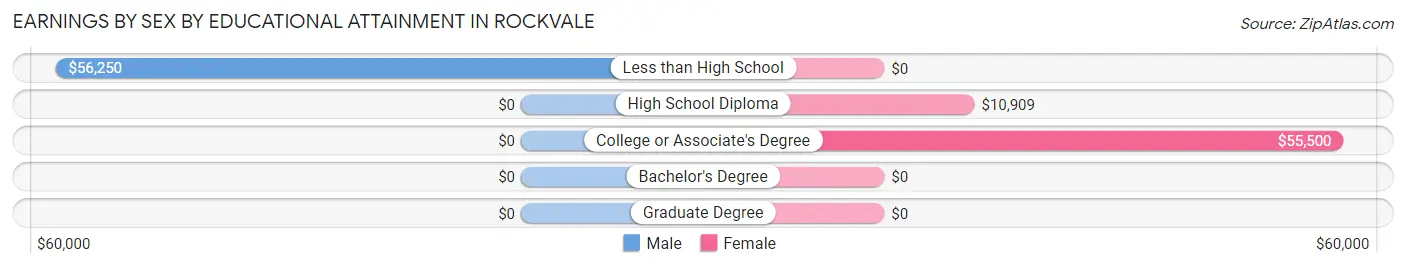
Earnings by Sex by Educational Attainment in Rockvale
Average earnings in Rockvale are $48,125 for men and $40,714 for women, a difference of 15.4%. Men with an educational attainment of less than high school enjoy the highest average annual earnings of $56,250, while those with less than high school education earn the least with $56,250. Women with an educational attainment of college or associate's degree earn the most with the average annual earnings of $55,500, while those with high school diploma education have the smallest earnings of $10,909.
| Educational Attainment | Male Income | Female Income |
| Less than High School | $56,250 | $0 |
| High School Diploma | - | - |
| College or Associate's Degree | - | - |
| Bachelor's Degree | - | - |
| Graduate Degree | - | - |
| Total | $48,125 | $40,714 |
Family Income in Rockvale
Family Income Brackets in Rockvale
According to the Rockvale family income data, there are 80 families falling into the $50,000 to $74,999 income range, which is the most common income bracket and makes up 45.5% of all families.
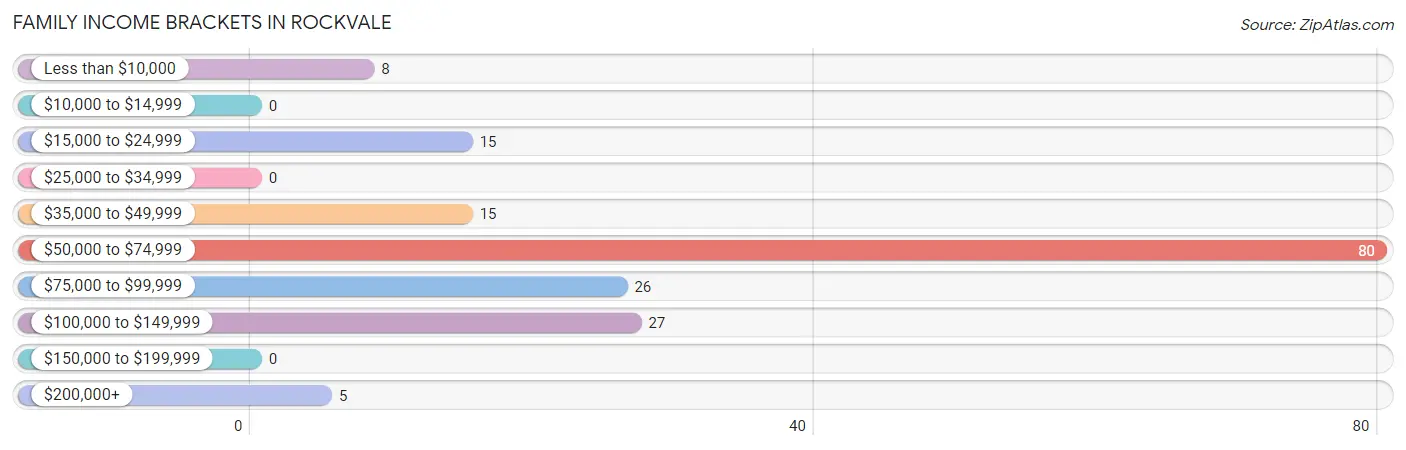
| Income Bracket | # Families | % Families |
| Less than $10,000 | 8 | 4.5% |
| $10,000 to $14,999 | 0 | 0.0% |
| $15,000 to $24,999 | 15 | 8.5% |
| $25,000 to $34,999 | 0 | 0.0% |
| $35,000 to $49,999 | 15 | 8.5% |
| $50,000 to $74,999 | 80 | 45.5% |
| $75,000 to $99,999 | 26 | 14.8% |
| $100,000 to $149,999 | 27 | 15.3% |
| $150,000 to $199,999 | 0 | 0.0% |
| $200,000+ | 5 | 2.8% |
Family Income by Famaliy Size in Rockvale
4-person families (16 | 9.1%) account for the highest median family income in Rockvale with $128,182 per family, while 4-person families (16 | 9.1%) have the highest median income of $32,046 per family member.
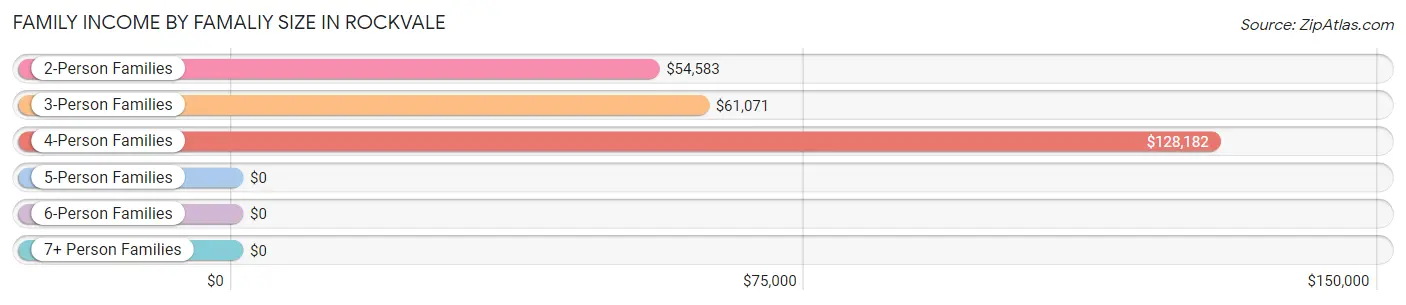
| Income Bracket | # Families | Median Income |
| 2-Person Families | 81 (46.0%) | $54,583 |
| 3-Person Families | 14 (8.0%) | $61,071 |
| 4-Person Families | 16 (9.1%) | $128,182 |
| 5-Person Families | 58 (33.0%) | $0 |
| 6-Person Families | 2 (1.1%) | $0 |
| 7+ Person Families | 5 (2.8%) | $0 |
| Total | 176 (100.0%) | $56,600 |
Family Income by Number of Earners in Rockvale
The median family income in Rockvale is $56,600, with families comprising 3+ earners (9) having the highest median family income of $250,001, while families with no earners (38) have the lowest median family income of $50,500, accounting for 5.1% and 21.6% of families, respectively.
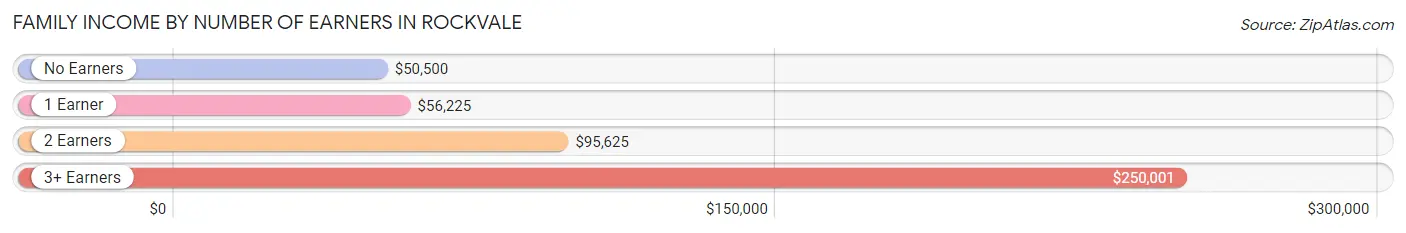
| Number of Earners | # Families | Median Income |
| No Earners | 38 (21.6%) | $50,500 |
| 1 Earner | 89 (50.6%) | $56,225 |
| 2 Earners | 40 (22.7%) | $95,625 |
| 3+ Earners | 9 (5.1%) | $250,001 |
| Total | 176 (100.0%) | $56,600 |
Household Income in Rockvale
Household Income Brackets in Rockvale
With 98 households falling in the category, the $50,000 to $74,999 income range is the most frequent in Rockvale, accounting for 36.0% of all households.
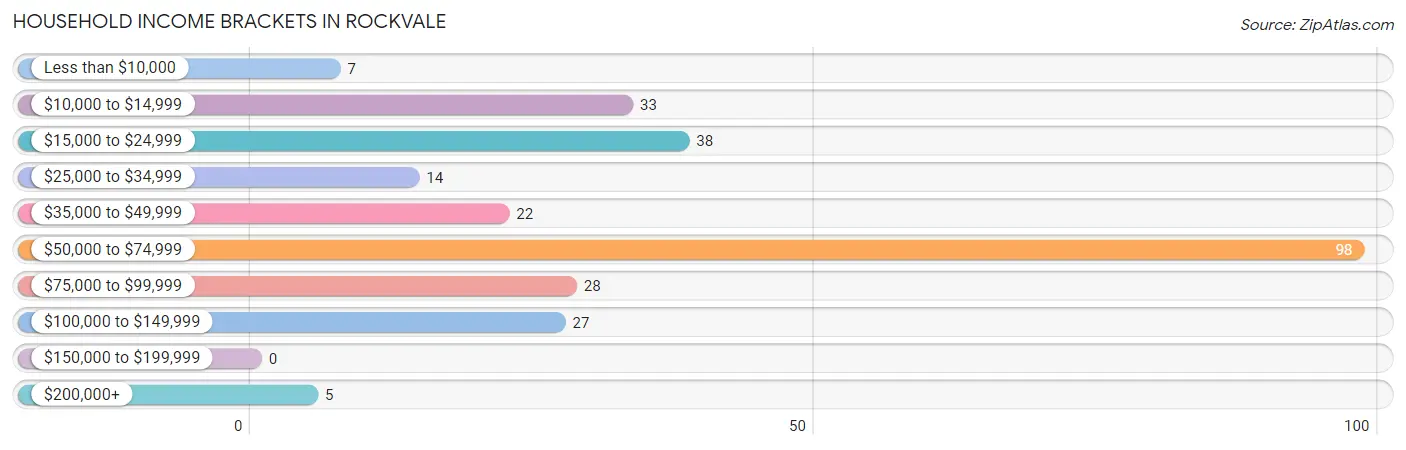
| Income Bracket | # Households | % Households |
| Less than $10,000 | 7 | 2.6% |
| $10,000 to $14,999 | 33 | 12.1% |
| $15,000 to $24,999 | 38 | 14.0% |
| $25,000 to $34,999 | 14 | 5.1% |
| $35,000 to $49,999 | 22 | 8.1% |
| $50,000 to $74,999 | 98 | 36.0% |
| $75,000 to $99,999 | 28 | 10.3% |
| $100,000 to $149,999 | 27 | 9.9% |
| $150,000 to $199,999 | 0 | 0.0% |
| $200,000+ | 5 | 1.8% |
Household Income by Householder Age in Rockvale
The median household income in Rockvale is $54,091, with the highest median household income of $55,550 found in the 25 to 44 years age bracket for the primary householder. A total of 86 households (31.6%) fall into this category.
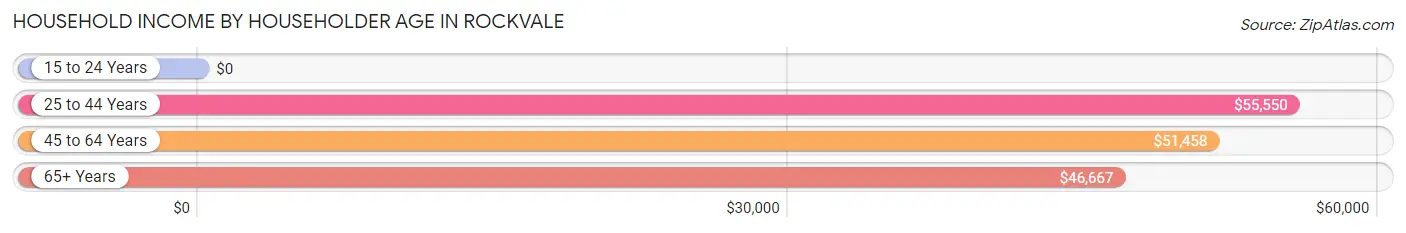
| Income Bracket | # Households | Median Income |
| 15 to 24 Years | 0 (0.0%) | $0 |
| 25 to 44 Years | 86 (31.6%) | $55,550 |
| 45 to 64 Years | 122 (44.9%) | $51,458 |
| 65+ Years | 64 (23.5%) | $46,667 |
| Total | 272 (100.0%) | $54,091 |
Poverty in Rockvale
Income Below Poverty by Sex and Age in Rockvale
With 18.1% poverty level for males and 14.4% for females among the residents of Rockvale, under 5 year old males and under 5 year old females are the most vulnerable to poverty, with 13 males (100.0%) and 8 females (100.0%) in their respective age groups living below the poverty level.
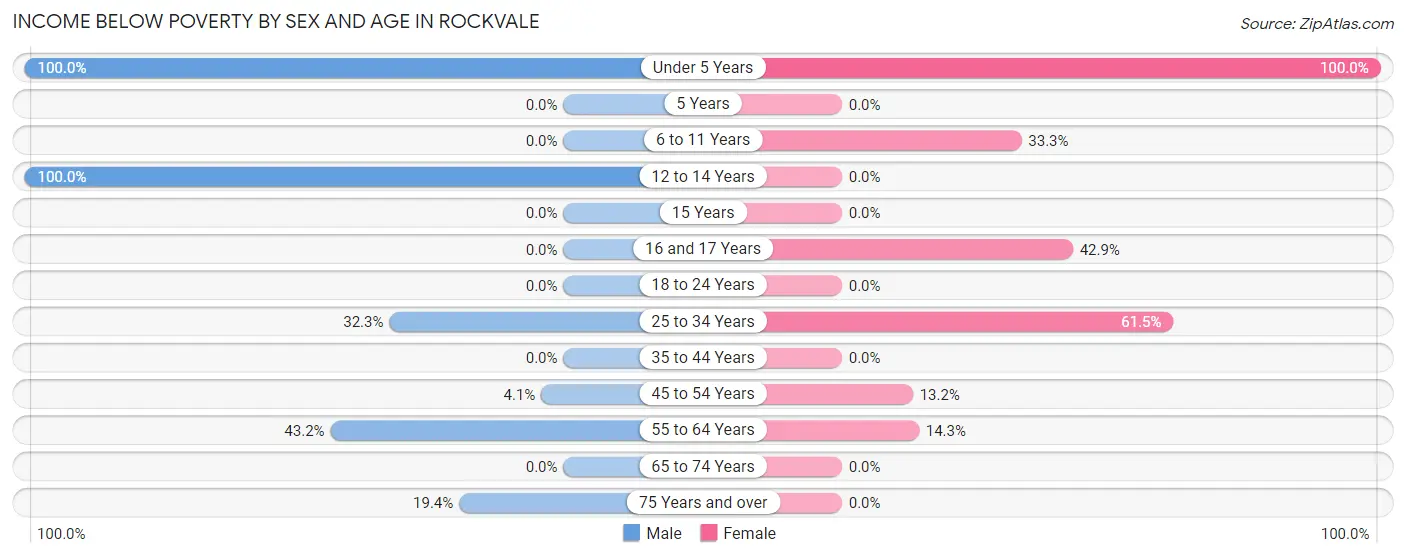
| Age Bracket | Male | Female |
| Under 5 Years | 13 (100.0%) | 8 (100.0%) |
| 5 Years | 0 (0.0%) | 0 (0.0%) |
| 6 to 11 Years | 0 (0.0%) | 6 (33.3%) |
| 12 to 14 Years | 2 (100.0%) | 0 (0.0%) |
| 15 Years | 0 (0.0%) | 0 (0.0%) |
| 16 and 17 Years | 0 (0.0%) | 3 (42.9%) |
| 18 to 24 Years | 0 (0.0%) | 0 (0.0%) |
| 25 to 34 Years | 21 (32.3%) | 8 (61.5%) |
| 35 to 44 Years | 0 (0.0%) | 0 (0.0%) |
| 45 to 54 Years | 3 (4.1%) | 5 (13.2%) |
| 55 to 64 Years | 32 (43.2%) | 7 (14.3%) |
| 65 to 74 Years | 0 (0.0%) | 0 (0.0%) |
| 75 Years and over | 6 (19.4%) | 0 (0.0%) |
| Total | 77 (18.1%) | 37 (14.4%) |
Income Above Poverty by Sex and Age in Rockvale
According to the poverty statistics in Rockvale, males aged 6 to 11 years and females aged 15 years are the age groups that are most secure financially, with 100.0% of males and 100.0% of females in these age groups living above the poverty line.
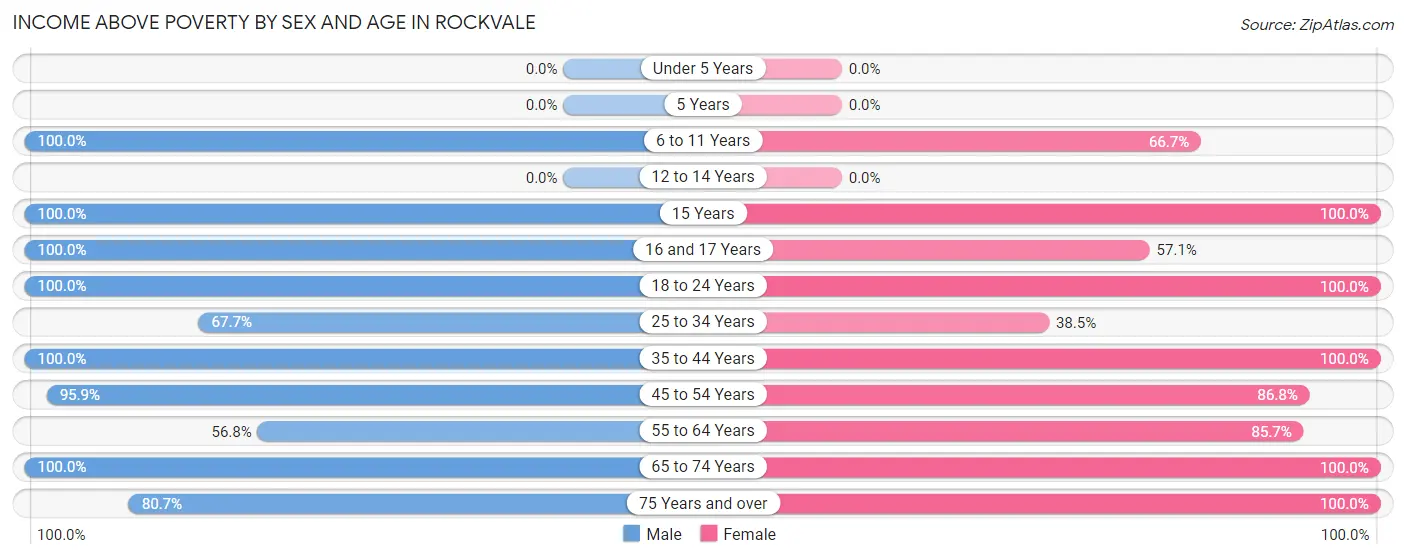
| Age Bracket | Male | Female |
| Under 5 Years | 0 (0.0%) | 0 (0.0%) |
| 5 Years | 0 (0.0%) | 0 (0.0%) |
| 6 to 11 Years | 64 (100.0%) | 12 (66.7%) |
| 12 to 14 Years | 0 (0.0%) | 0 (0.0%) |
| 15 Years | 9 (100.0%) | 3 (100.0%) |
| 16 and 17 Years | 53 (100.0%) | 4 (57.1%) |
| 18 to 24 Years | 8 (100.0%) | 10 (100.0%) |
| 25 to 34 Years | 44 (67.7%) | 5 (38.5%) |
| 35 to 44 Years | 7 (100.0%) | 61 (100.0%) |
| 45 to 54 Years | 70 (95.9%) | 33 (86.8%) |
| 55 to 64 Years | 42 (56.8%) | 42 (85.7%) |
| 65 to 74 Years | 27 (100.0%) | 41 (100.0%) |
| 75 Years and over | 25 (80.6%) | 9 (100.0%) |
| Total | 349 (81.9%) | 220 (85.6%) |
Income Below Poverty Among Married-Couple Families in Rockvale
The poverty statistics for married-couple families in Rockvale show that 2.0% or 3 of the total 153 families live below the poverty line. Families with 1 or 2 children have the highest poverty rate of 14.3%, comprising of 3 families. On the other hand, families with no children have the lowest poverty rate of 0.0%, which includes 0 families.
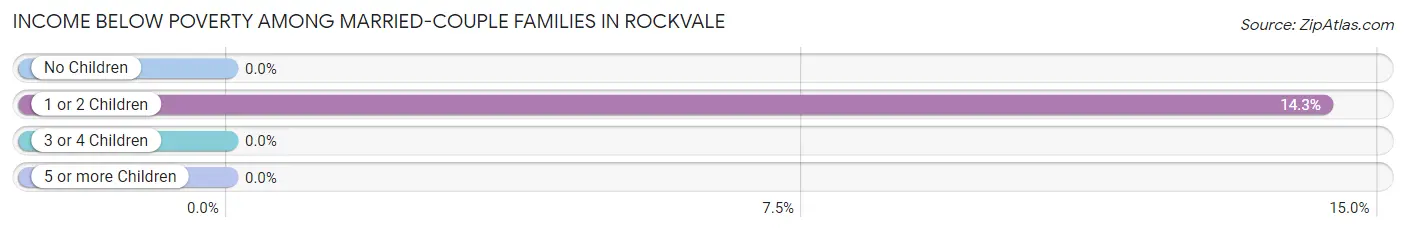
| Children | Above Poverty | Below Poverty |
| No Children | 82 (100.0%) | 0 (0.0%) |
| 1 or 2 Children | 18 (85.7%) | 3 (14.3%) |
| 3 or 4 Children | 50 (100.0%) | 0 (0.0%) |
| 5 or more Children | 0 (0.0%) | 0 (0.0%) |
| Total | 150 (98.0%) | 3 (2.0%) |
Income Below Poverty Among Single-Parent Households in Rockvale
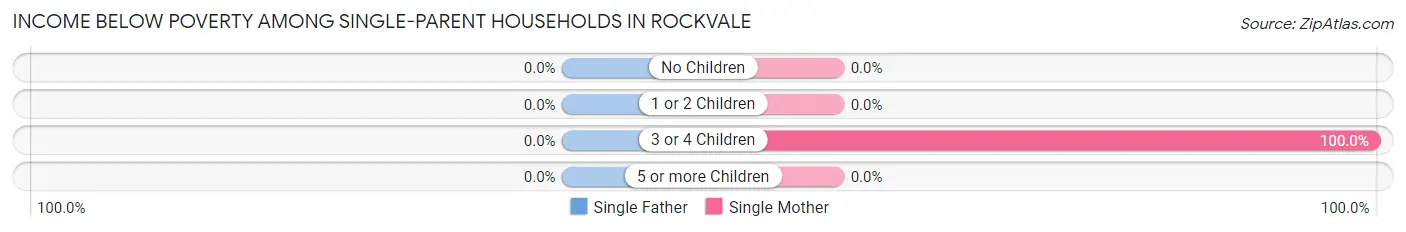
| Children | Single Father | Single Mother |
| No Children | 0 (0.0%) | 0 (0.0%) |
| 1 or 2 Children | 0 (0.0%) | 0 (0.0%) |
| 3 or 4 Children | 0 (0.0%) | 8 (100.0%) |
| 5 or more Children | 0 (0.0%) | 0 (0.0%) |
| Total | 0 (0.0%) | 8 (47.1%) |
Income Below Poverty Among Married-Couple vs Single-Parent Households in Rockvale
The poverty data for Rockvale shows that 3 of the married-couple family households (2.0%) and 8 of the single-parent households (34.8%) are living below the poverty level. Within the married-couple family households, those with 1 or 2 children have the highest poverty rate, with 3 households (14.3%) falling below the poverty line. Among the single-parent households, those with 3 or 4 children have the highest poverty rate, with 8 household (100.0%) living below poverty.
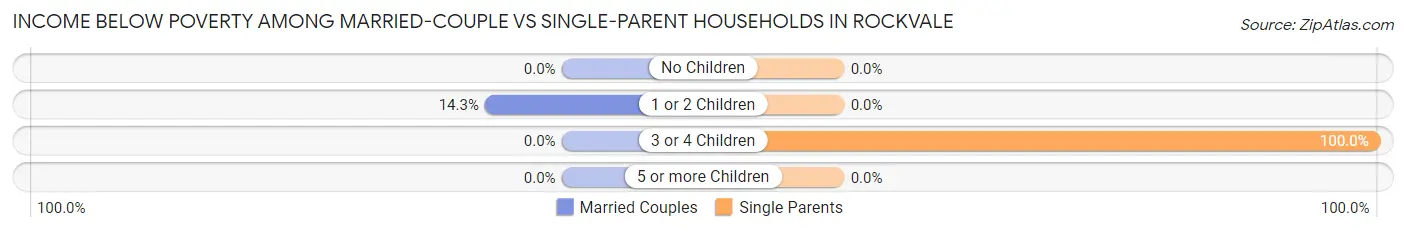
| Children | Married-Couple Families | Single-Parent Households |
| No Children | 0 (0.0%) | 0 (0.0%) |
| 1 or 2 Children | 3 (14.3%) | 0 (0.0%) |
| 3 or 4 Children | 0 (0.0%) | 8 (100.0%) |
| 5 or more Children | 0 (0.0%) | 0 (0.0%) |
| Total | 3 (2.0%) | 8 (34.8%) |
Race in Rockvale
The most populous races in Rockvale are White / Caucasian (650 | 95.2%), Hispanic or Latino (212 | 31.0%), and Two or more Races (29 | 4.3%).
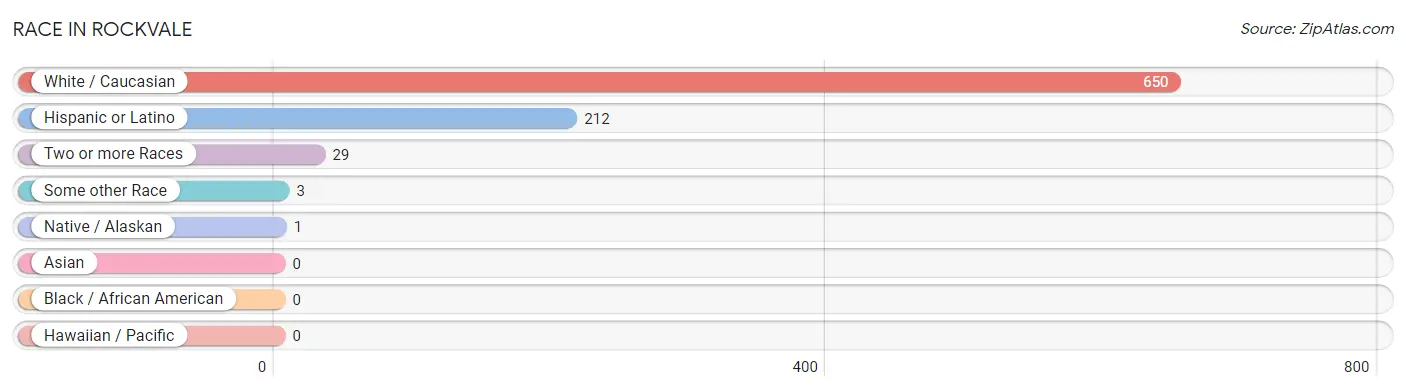
| Race | # Population | % Population |
| Asian | 0 | 0.0% |
| Black / African American | 0 | 0.0% |
| Hawaiian / Pacific | 0 | 0.0% |
| Hispanic or Latino | 212 | 31.0% |
| Native / Alaskan | 1 | 0.2% |
| White / Caucasian | 650 | 95.2% |
| Two or more Races | 29 | 4.3% |
| Some other Race | 3 | 0.4% |
| Total | 683 | 100.0% |
Ancestry in Rockvale
The most populous ancestries reported in Rockvale are German (171 | 25.0%), Puerto Rican (153 | 22.4%), Italian (101 | 14.8%), English (54 | 7.9%), and Spanish (42 | 6.1%), together accounting for 76.3% of all Rockvale residents.
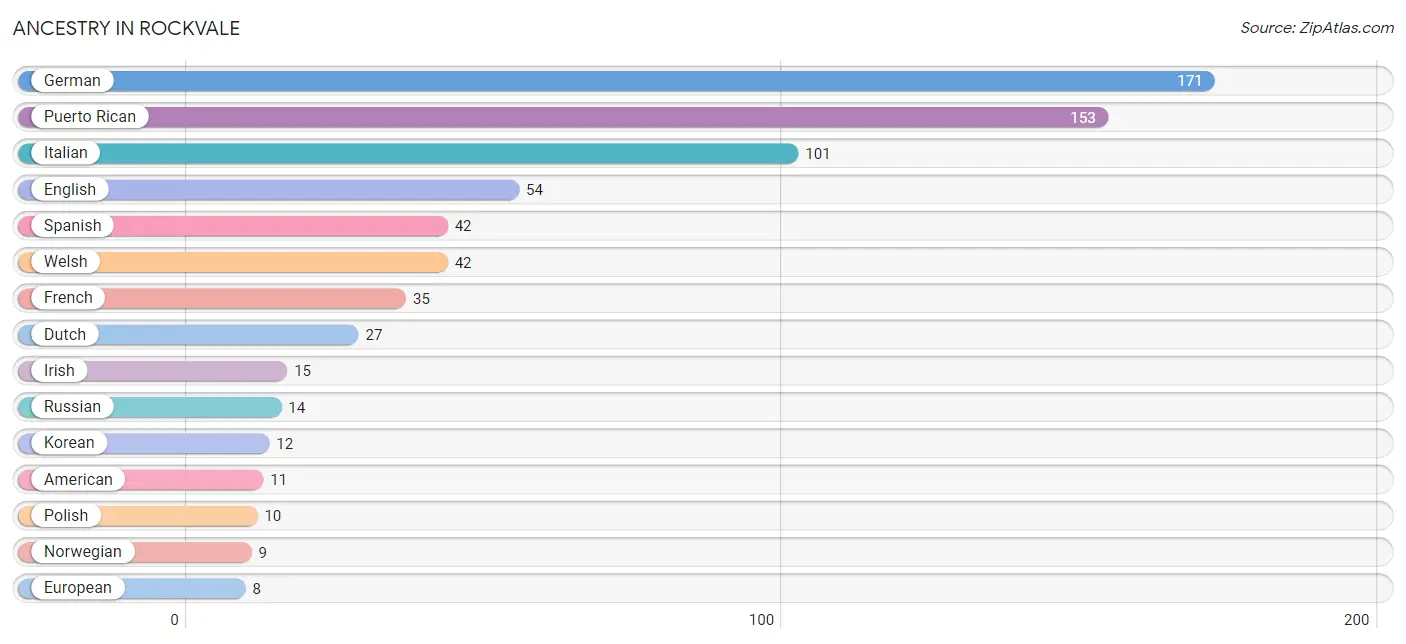
| Ancestry | # Population | % Population |
| American | 11 | 1.6% |
| Blackfeet | 1 | 0.2% |
| Canadian | 6 | 0.9% |
| Cherokee | 1 | 0.2% |
| Czech | 2 | 0.3% |
| Dutch | 27 | 4.0% |
| English | 54 | 7.9% |
| European | 8 | 1.2% |
| French | 35 | 5.1% |
| German | 171 | 25.0% |
| Hungarian | 3 | 0.4% |
| Irish | 15 | 2.2% |
| Italian | 101 | 14.8% |
| Korean | 12 | 1.8% |
| Mexican | 2 | 0.3% |
| Norwegian | 9 | 1.3% |
| Polish | 10 | 1.5% |
| Puerto Rican | 153 | 22.4% |
| Russian | 14 | 2.1% |
| Scotch-Irish | 3 | 0.4% |
| Spaniard | 3 | 0.4% |
| Spanish | 42 | 6.1% |
| Welsh | 42 | 6.1% | View All 23 Rows |
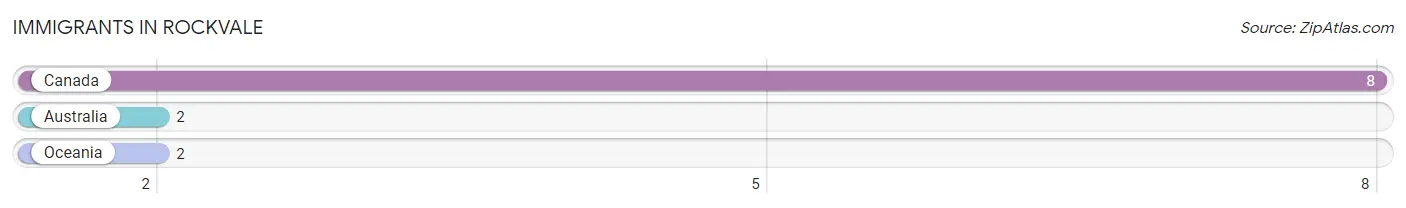
Immigrants in Rockvale
The most numerous immigrant groups reported in Rockvale came from Canada (8 | 1.2%), Australia (2 | 0.3%), and Oceania (2 | 0.3%), together accounting for 1.8% of all Rockvale residents.
| Immigration Origin | # Population | % Population |
| Australia | 2 | 0.3% |
| Canada | 8 | 1.2% |
| Oceania | 2 | 0.3% | View All 3 Rows |
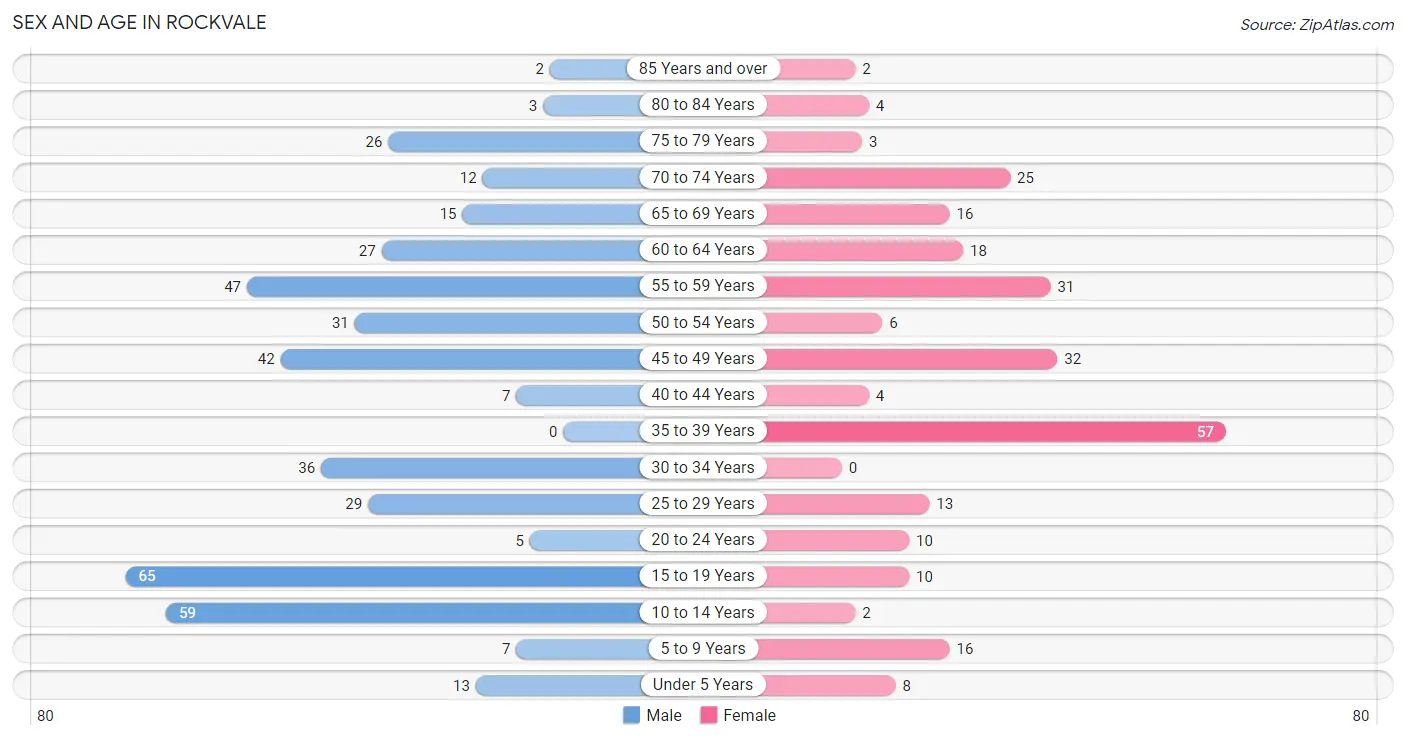
Sex and Age in Rockvale
Sex and Age in Rockvale
The most populous age groups in Rockvale are 15 to 19 Years (65 | 15.3%) for men and 35 to 39 Years (57 | 22.2%) for women.
| Age Bracket | Male | Female |
| Under 5 Years | 13 (3.0%) | 8 (3.1%) |
| 5 to 9 Years | 7 (1.6%) | 16 (6.2%) |
| 10 to 14 Years | 59 (13.9%) | 2 (0.8%) |
| 15 to 19 Years | 65 (15.3%) | 10 (3.9%) |
| 20 to 24 Years | 5 (1.2%) | 10 (3.9%) |
| 25 to 29 Years | 29 (6.8%) | 13 (5.1%) |
| 30 to 34 Years | 36 (8.5%) | 0 (0.0%) |
| 35 to 39 Years | 0 (0.0%) | 57 (22.2%) |
| 40 to 44 Years | 7 (1.6%) | 4 (1.6%) |
| 45 to 49 Years | 42 (9.9%) | 32 (12.4%) |
| 50 to 54 Years | 31 (7.3%) | 6 (2.3%) |
| 55 to 59 Years | 47 (11.0%) | 31 (12.1%) |
| 60 to 64 Years | 27 (6.3%) | 18 (7.0%) |
| 65 to 69 Years | 15 (3.5%) | 16 (6.2%) |
| 70 to 74 Years | 12 (2.8%) | 25 (9.7%) |
| 75 to 79 Years | 26 (6.1%) | 3 (1.2%) |
| 80 to 84 Years | 3 (0.7%) | 4 (1.6%) |
| 85 Years and over | 2 (0.5%) | 2 (0.8%) |
| Total | 426 (100.0%) | 257 (100.0%) |
Families and Households in Rockvale
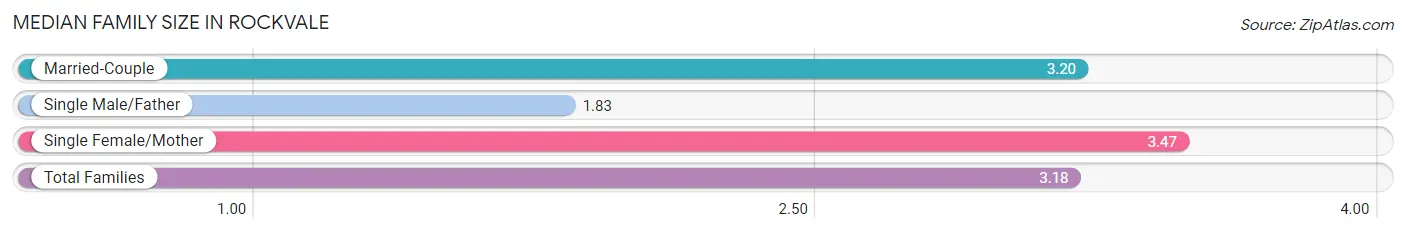
Median Family Size in Rockvale
The median family size in Rockvale is 3.18 persons per family, with single female/mother families (17 | 9.7%) accounting for the largest median family size of 3.47 persons per family. On the other hand, single male/father families (6 | 3.4%) represent the smallest median family size with 1.83 persons per family.
| Family Type | # Families | Family Size |
| Married-Couple | 153 (86.9%) | 3.20 |
| Single Male/Father | 6 (3.4%) | 1.83 |
| Single Female/Mother | 17 (9.7%) | 3.47 |
| Total Families | 176 (100.0%) | 3.18 |
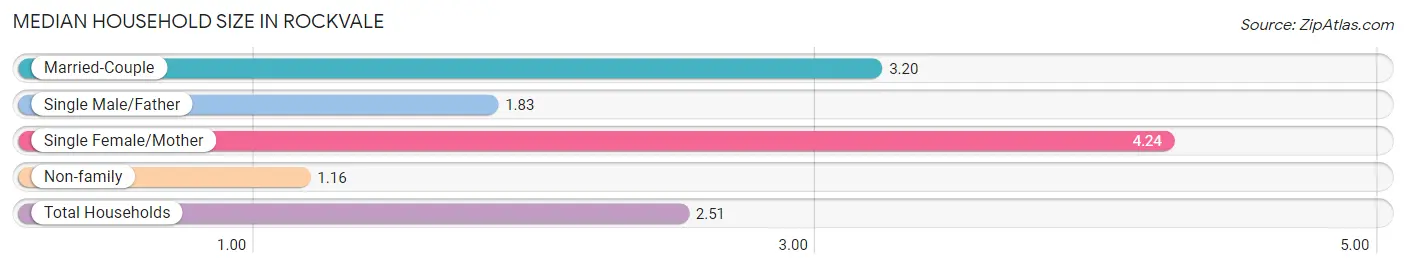
Median Household Size in Rockvale
The median household size in Rockvale is 2.51 persons per household, with single female/mother households (17 | 6.2%) accounting for the largest median household size of 4.24 persons per household. non-family households (96 | 35.3%) represent the smallest median household size with 1.16 persons per household.
| Household Type | # Households | Household Size |
| Married-Couple | 153 (56.2%) | 3.20 |
| Single Male/Father | 6 (2.2%) | 1.83 |
| Single Female/Mother | 17 (6.2%) | 4.24 |
| Non-family | 96 (35.3%) | 1.16 |
| Total Households | 272 (100.0%) | 2.51 |
Household Size by Marriage Status in Rockvale
Out of a total of 272 households in Rockvale, 176 (64.7%) are family households, while 96 (35.3%) are nonfamily households. The most numerous type of family households are 2-person households, comprising 81, and the most common type of nonfamily households are 1-person households, comprising 73.
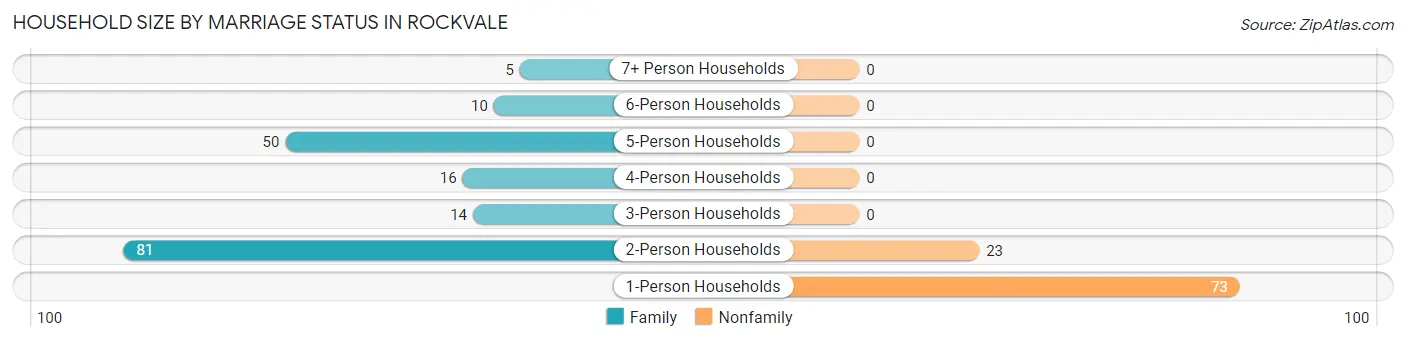
| Household Size | Family Households | Nonfamily Households |
| 1-Person Households | - | 73 (26.8%) |
| 2-Person Households | 81 (29.8%) | 23 (8.5%) |
| 3-Person Households | 14 (5.1%) | 0 (0.0%) |
| 4-Person Households | 16 (5.9%) | 0 (0.0%) |
| 5-Person Households | 50 (18.4%) | 0 (0.0%) |
| 6-Person Households | 10 (3.7%) | 0 (0.0%) |
| 7+ Person Households | 5 (1.8%) | 0 (0.0%) |
| Total | 176 (64.7%) | 96 (35.3%) |
Female Fertility in Rockvale
Fertility by Age in Rockvale
Average fertility rate in Rockvale is 63.0 births per 1,000 women. Women in the age bracket of 20 to 34 years have the highest fertility rate with 348.0 births per 1,000 women. Women in the age bracket of 20 to 34 years acount for 100.0% of all women with births.
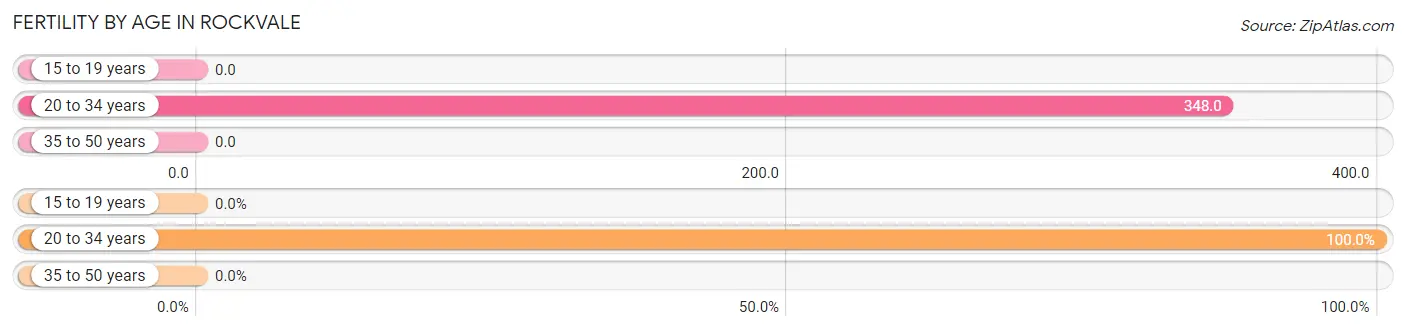
| Age Bracket | Women with Births | Births / 1,000 Women |
| 15 to 19 years | 0 (0.0%) | 0.0 |
| 20 to 34 years | 8 (100.0%) | 348.0 |
| 35 to 50 years | 0 (0.0%) | 0.0 |
| Total | 8 (100.0%) | 63.0 |
Fertility by Age by Marriage Status in Rockvale
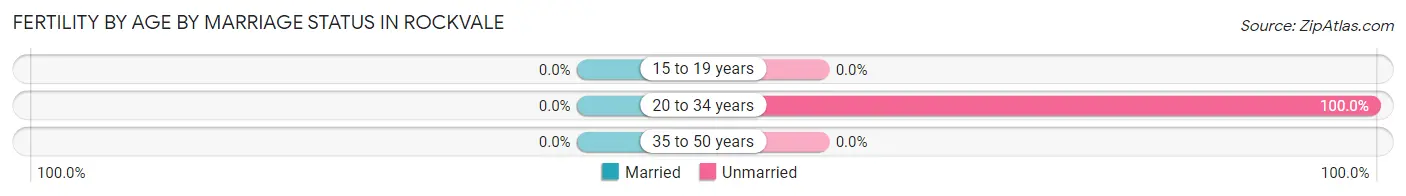
| Age Bracket | Married | Unmarried |
| 15 to 19 years | 0 (0.0%) | 0 (0.0%) |
| 20 to 34 years | 0 (0.0%) | 8 (100.0%) |
| 35 to 50 years | 0 (0.0%) | 0 (0.0%) |
| Total | 0 (0.0%) | 8 (100.0%) |
Fertility by Education in Rockvale
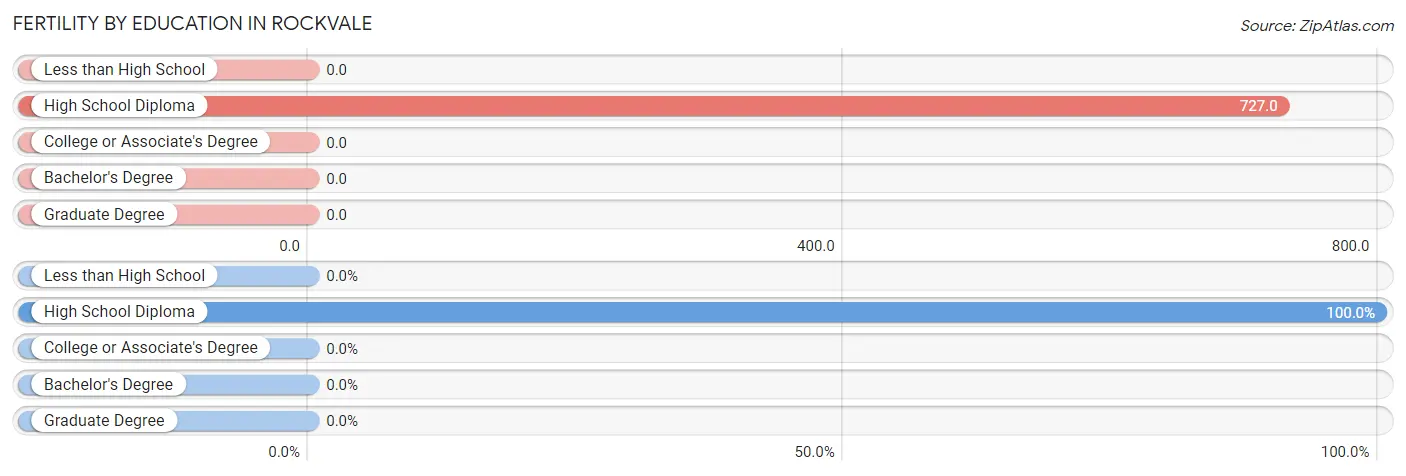
| Educational Attainment | Women with Births | Births / 1,000 Women |
| Less than High School | 0 (0.0%) | 0.0 |
| High School Diploma | 8 (100.0%) | 727.0 |
| College or Associate's Degree | 0 (0.0%) | 0.0 |
| Bachelor's Degree | 0 (0.0%) | 0.0 |
| Graduate Degree | 0 (0.0%) | 0.0 |
| Total | 8 (100.0%) | 63.0 |
Fertility by Education by Marriage Status in Rockvale
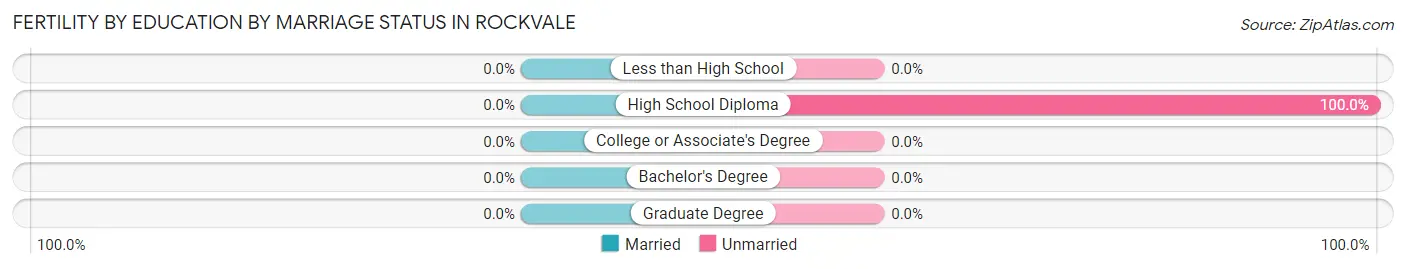
| Educational Attainment | Married | Unmarried |
| Less than High School | 0 (0.0%) | 0 (0.0%) |
| High School Diploma | 0 (0.0%) | 8 (100.0%) |
| College or Associate's Degree | 0 (0.0%) | 0 (0.0%) |
| Bachelor's Degree | 0 (0.0%) | 0 (0.0%) |
| Graduate Degree | 0 (0.0%) | 0 (0.0%) |
| Total | 0 (0.0%) | 8 (100.0%) |
Employment Characteristics in Rockvale
Employment by Class of Employer in Rockvale
Among the 255 employed individuals in Rockvale, private company employees (173 | 67.8%), self-employed (not incorporated) (33 | 12.9%), and local government employees (24 | 9.4%) make up the most common classes of employment.
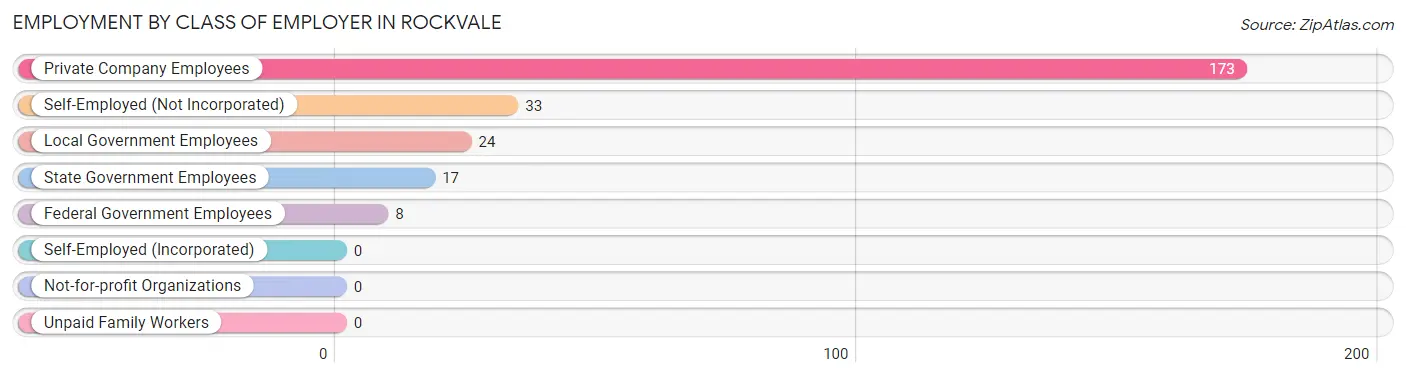
| Employer Class | # Employees | % Employees |
| Private Company Employees | 173 | 67.8% |
| Self-Employed (Incorporated) | 0 | 0.0% |
| Self-Employed (Not Incorporated) | 33 | 12.9% |
| Not-for-profit Organizations | 0 | 0.0% |
| Local Government Employees | 24 | 9.4% |
| State Government Employees | 17 | 6.7% |
| Federal Government Employees | 8 | 3.1% |
| Unpaid Family Workers | 0 | 0.0% |
| Total | 255 | 100.0% |
Employment Status by Age in Rockvale
According to the labor force statistics for Rockvale, out of the total population over 16 years of age (566), 48.8% or 276 individuals are in the labor force, with 7.6% or 21 of them unemployed. The age group with the highest labor force participation rate is 20 to 24 years, with 100.0% or 15 individuals in the labor force. Within the labor force, the 65 to 74 years age range has the highest percentage of unemployed individuals, with 23.1% or 3 of them being unemployed.
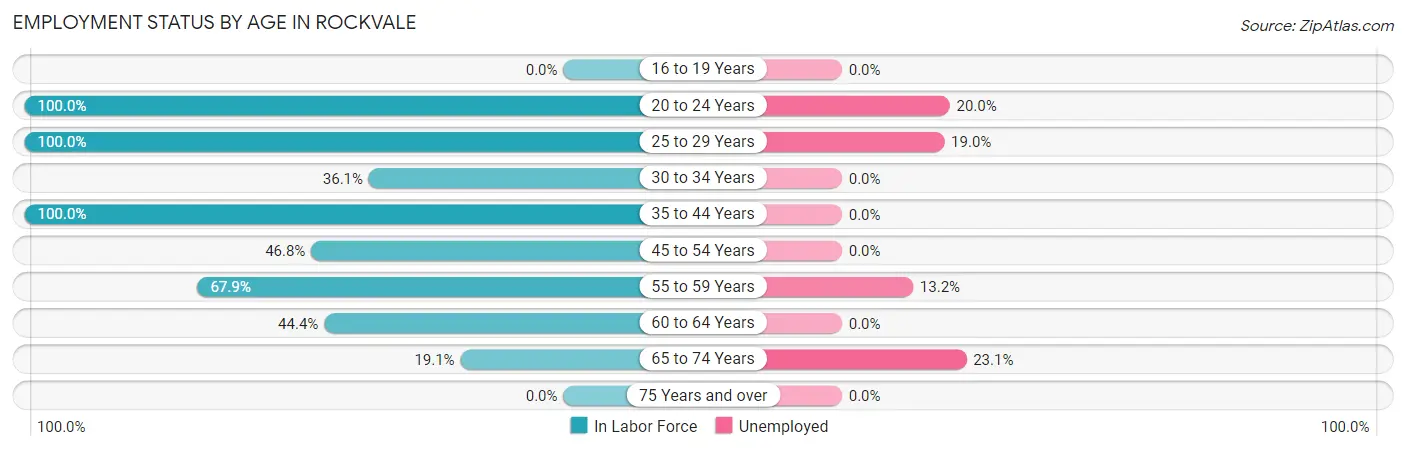
| Age Bracket | In Labor Force | Unemployed |
| 16 to 19 Years | 0 (0.0%) | 0 (0.0%) |
| 20 to 24 Years | 15 (100.0%) | 3 (20.0%) |
| 25 to 29 Years | 42 (100.0%) | 8 (19.0%) |
| 30 to 34 Years | 13 (36.1%) | 0 (0.0%) |
| 35 to 44 Years | 68 (100.0%) | 0 (0.0%) |
| 45 to 54 Years | 52 (46.8%) | 0 (0.0%) |
| 55 to 59 Years | 53 (67.9%) | 7 (13.2%) |
| 60 to 64 Years | 20 (44.4%) | 0 (0.0%) |
| 65 to 74 Years | 13 (19.1%) | 3 (23.1%) |
| 75 Years and over | 0 (0.0%) | 0 (0.0%) |
| Total | 276 (48.8%) | 21 (7.6%) |
Employment Status by Educational Attainment in Rockvale
According to labor force statistics for Rockvale, 65.3% of individuals (248) out of the total population between 25 and 64 years of age (380) are in the labor force, with 6.0% or 15 of them being unemployed. The group with the highest labor force participation rate are those with the educational attainment of bachelor's degree or higher, with 91.7% or 22 individuals in the labor force. Within the labor force, individuals with less than high school education have the highest percentage of unemployment, with 42.1% or 8 of them being unemployed.
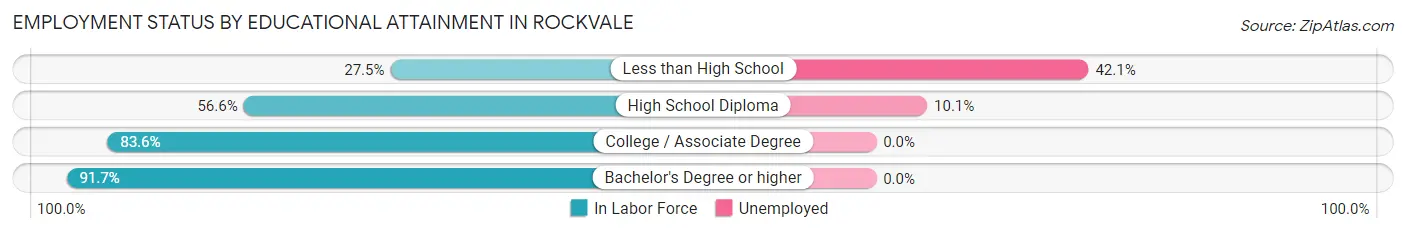
| Educational Attainment | In Labor Force | Unemployed |
| Less than High School | 19 (27.5%) | 29 (42.1%) |
| High School Diploma | 69 (56.6%) | 12 (10.1%) |
| College / Associate Degree | 138 (83.6%) | 0 (0.0%) |
| Bachelor's Degree or higher | 22 (91.7%) | 0 (0.0%) |
| Total | 248 (65.3%) | 23 (6.0%) |
Employment Occupations by Sex in Rockvale
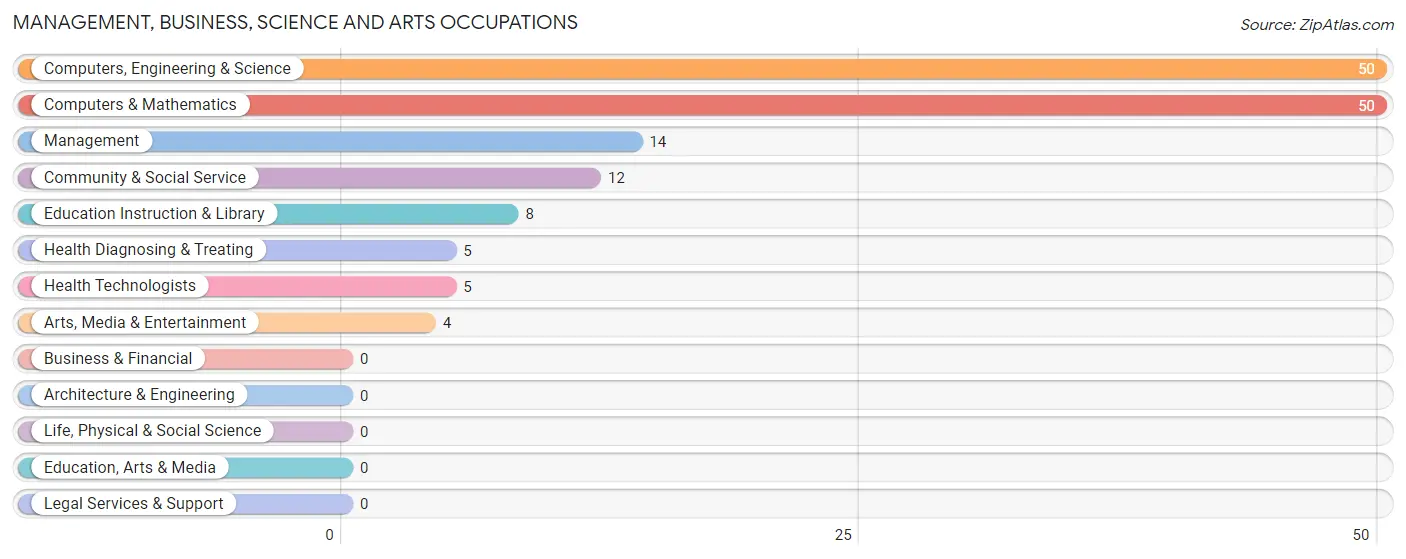
Management, Business, Science and Arts Occupations
The most common Management, Business, Science and Arts occupations in Rockvale are Computers, Engineering & Science (50 | 19.6%), Computers & Mathematics (50 | 19.6%), Management (14 | 5.5%), Community & Social Service (12 | 4.7%), and Education Instruction & Library (8 | 3.1%).
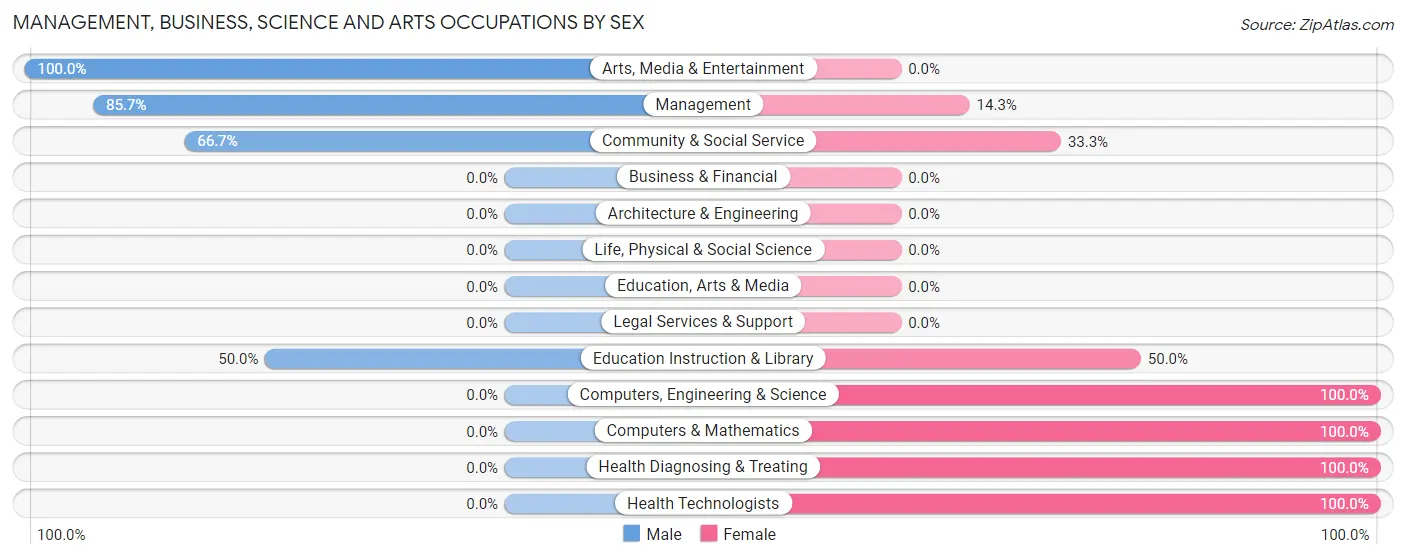
Management, Business, Science and Arts Occupations by Sex
Within the Management, Business, Science and Arts occupations in Rockvale, the most male-oriented occupations are Arts, Media & Entertainment (100.0%), Management (85.7%), and Community & Social Service (66.7%), while the most female-oriented occupations are Computers, Engineering & Science (100.0%), Computers & Mathematics (100.0%), and Health Diagnosing & Treating (100.0%).
| Occupation | Male | Female |
| Management | 12 (85.7%) | 2 (14.3%) |
| Business & Financial | 0 (0.0%) | 0 (0.0%) |
| Computers, Engineering & Science | 0 (0.0%) | 50 (100.0%) |
| Computers & Mathematics | 0 (0.0%) | 50 (100.0%) |
| Architecture & Engineering | 0 (0.0%) | 0 (0.0%) |
| Life, Physical & Social Science | 0 (0.0%) | 0 (0.0%) |
| Community & Social Service | 8 (66.7%) | 4 (33.3%) |
| Education, Arts & Media | 0 (0.0%) | 0 (0.0%) |
| Legal Services & Support | 0 (0.0%) | 0 (0.0%) |
| Education Instruction & Library | 4 (50.0%) | 4 (50.0%) |
| Arts, Media & Entertainment | 4 (100.0%) | 0 (0.0%) |
| Health Diagnosing & Treating | 0 (0.0%) | 5 (100.0%) |
| Health Technologists | 0 (0.0%) | 5 (100.0%) |
| Total (Category) | 20 (24.7%) | 61 (75.3%) |
| Total (Overall) | 114 (44.7%) | 141 (55.3%) |
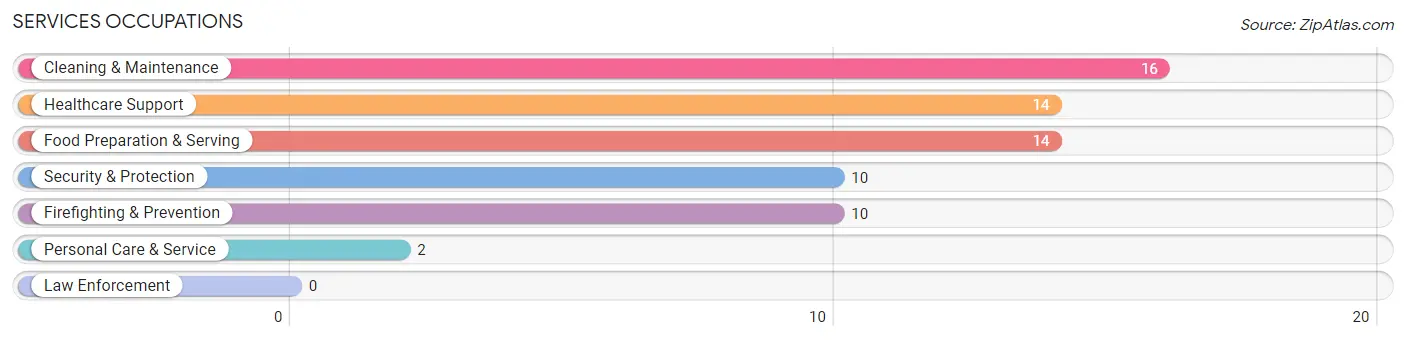
Services Occupations
The most common Services occupations in Rockvale are Cleaning & Maintenance (16 | 6.3%), Healthcare Support (14 | 5.5%), Food Preparation & Serving (14 | 5.5%), Security & Protection (10 | 3.9%), and Firefighting & Prevention (10 | 3.9%).
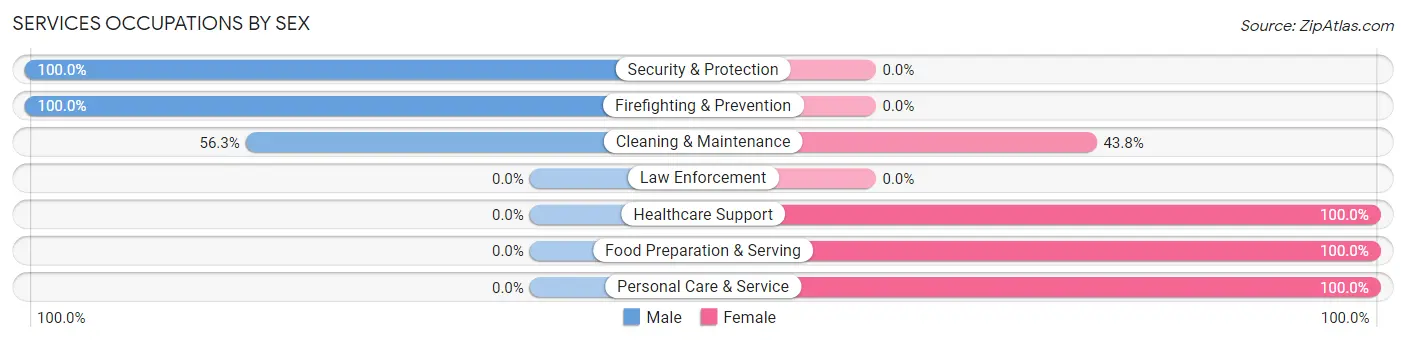
Services Occupations by Sex
Within the Services occupations in Rockvale, the most male-oriented occupations are Security & Protection (100.0%), Firefighting & Prevention (100.0%), and Cleaning & Maintenance (56.2%), while the most female-oriented occupations are Healthcare Support (100.0%), Food Preparation & Serving (100.0%), and Personal Care & Service (100.0%).
| Occupation | Male | Female |
| Healthcare Support | 0 (0.0%) | 14 (100.0%) |
| Security & Protection | 10 (100.0%) | 0 (0.0%) |
| Firefighting & Prevention | 10 (100.0%) | 0 (0.0%) |
| Law Enforcement | 0 (0.0%) | 0 (0.0%) |
| Food Preparation & Serving | 0 (0.0%) | 14 (100.0%) |
| Cleaning & Maintenance | 9 (56.2%) | 7 (43.8%) |
| Personal Care & Service | 0 (0.0%) | 2 (100.0%) |
| Total (Category) | 19 (33.9%) | 37 (66.1%) |
| Total (Overall) | 114 (44.7%) | 141 (55.3%) |
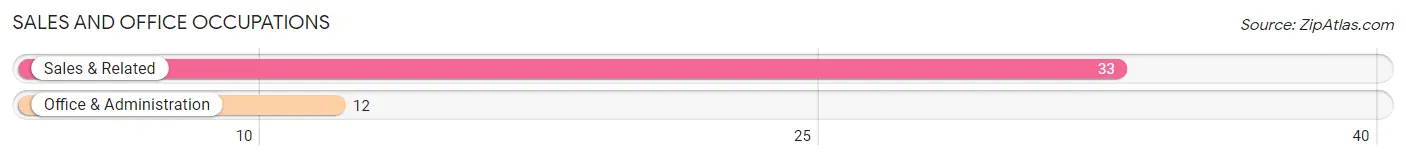
Sales and Office Occupations
The most common Sales and Office occupations in Rockvale are Sales & Related (33 | 12.9%), and Office & Administration (12 | 4.7%).
Sales and Office Occupations by Sex
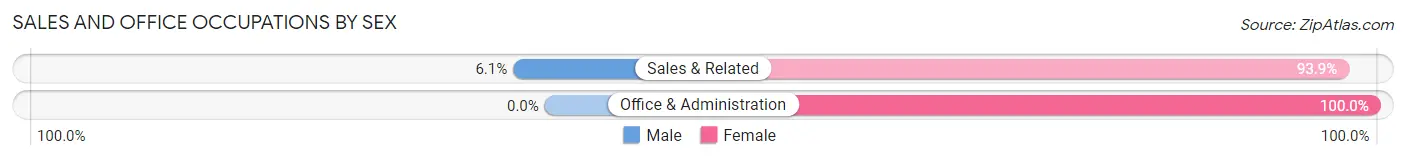
| Occupation | Male | Female |
| Sales & Related | 2 (6.1%) | 31 (93.9%) |
| Office & Administration | 0 (0.0%) | 12 (100.0%) |
| Total (Category) | 2 (4.4%) | 43 (95.6%) |
| Total (Overall) | 114 (44.7%) | 141 (55.3%) |
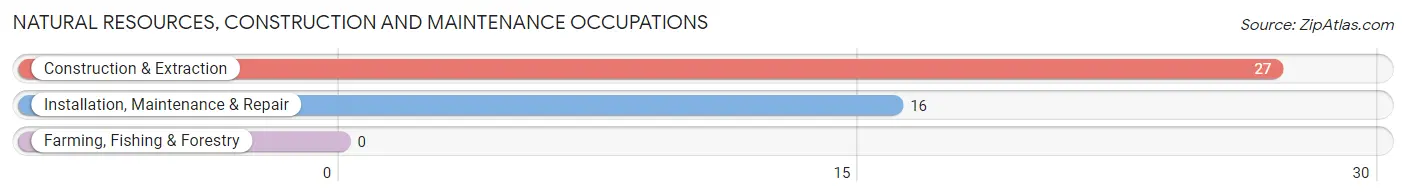
Natural Resources, Construction and Maintenance Occupations
The most common Natural Resources, Construction and Maintenance occupations in Rockvale are Construction & Extraction (27 | 10.6%), and Installation, Maintenance & Repair (16 | 6.3%).
Natural Resources, Construction and Maintenance Occupations by Sex
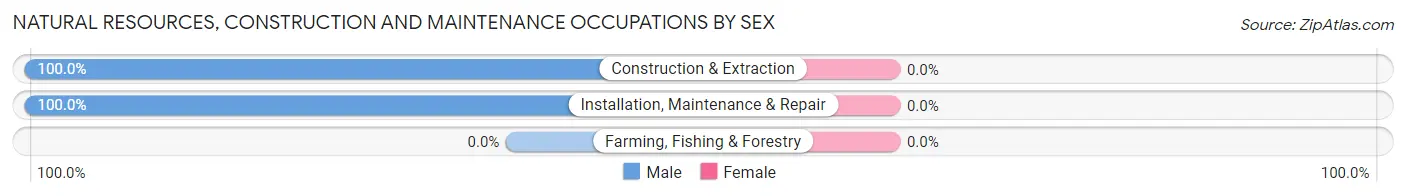
| Occupation | Male | Female |
| Farming, Fishing & Forestry | 0 (0.0%) | 0 (0.0%) |
| Construction & Extraction | 27 (100.0%) | 0 (0.0%) |
| Installation, Maintenance & Repair | 16 (100.0%) | 0 (0.0%) |
| Total (Category) | 43 (100.0%) | 0 (0.0%) |
| Total (Overall) | 114 (44.7%) | 141 (55.3%) |
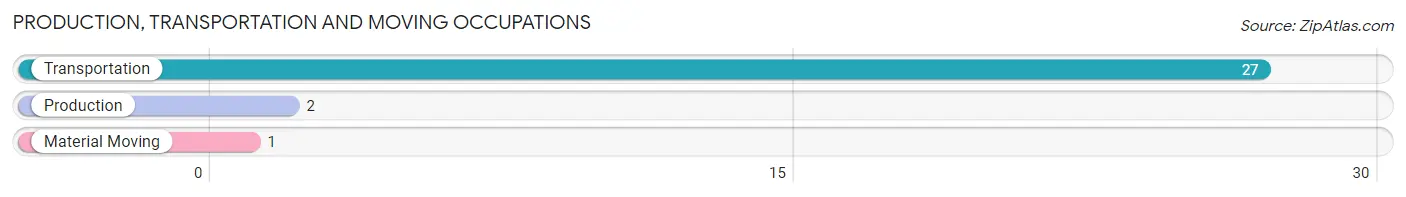
Production, Transportation and Moving Occupations
The most common Production, Transportation and Moving occupations in Rockvale are Transportation (27 | 10.6%), Production (2 | 0.8%), and Material Moving (1 | 0.4%).
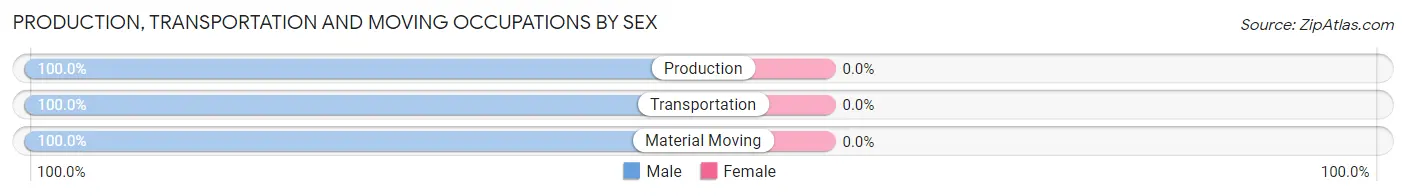
Production, Transportation and Moving Occupations by Sex
| Occupation | Male | Female |
| Production | 2 (100.0%) | 0 (0.0%) |
| Transportation | 27 (100.0%) | 0 (0.0%) |
| Material Moving | 1 (100.0%) | 0 (0.0%) |
| Total (Category) | 30 (100.0%) | 0 (0.0%) |
| Total (Overall) | 114 (44.7%) | 141 (55.3%) |
Employment Industries by Sex in Rockvale
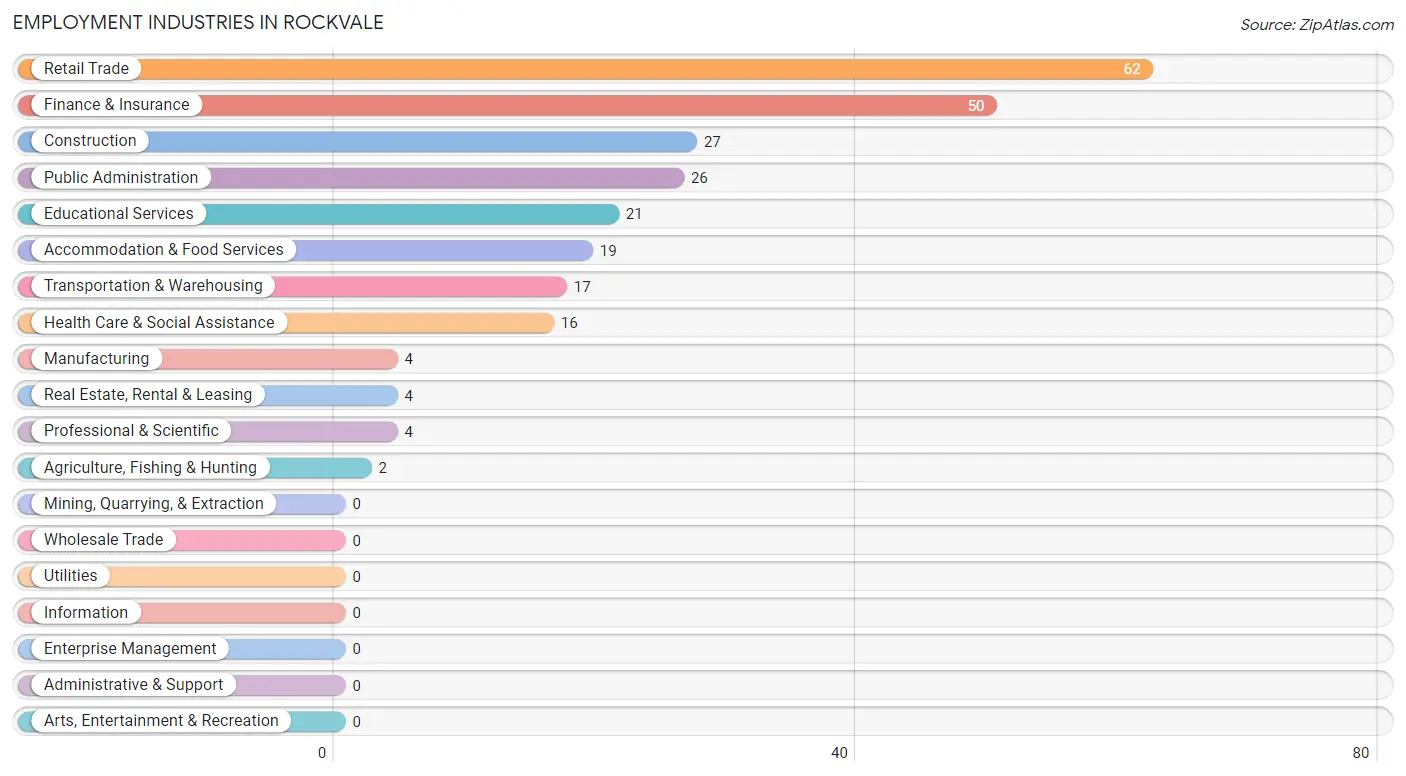
Employment Industries in Rockvale
The major employment industries in Rockvale include Retail Trade (62 | 24.3%), Finance & Insurance (50 | 19.6%), Construction (27 | 10.6%), Public Administration (26 | 10.2%), and Educational Services (21 | 8.2%).
Employment Industries by Sex in Rockvale
The Rockvale industries that see more men than women are Construction (100.0%), Manufacturing (100.0%), and Transportation & Warehousing (100.0%), whereas the industries that tend to have a higher number of women are Agriculture, Fishing & Hunting (100.0%), Finance & Insurance (100.0%), and Health Care & Social Assistance (100.0%).
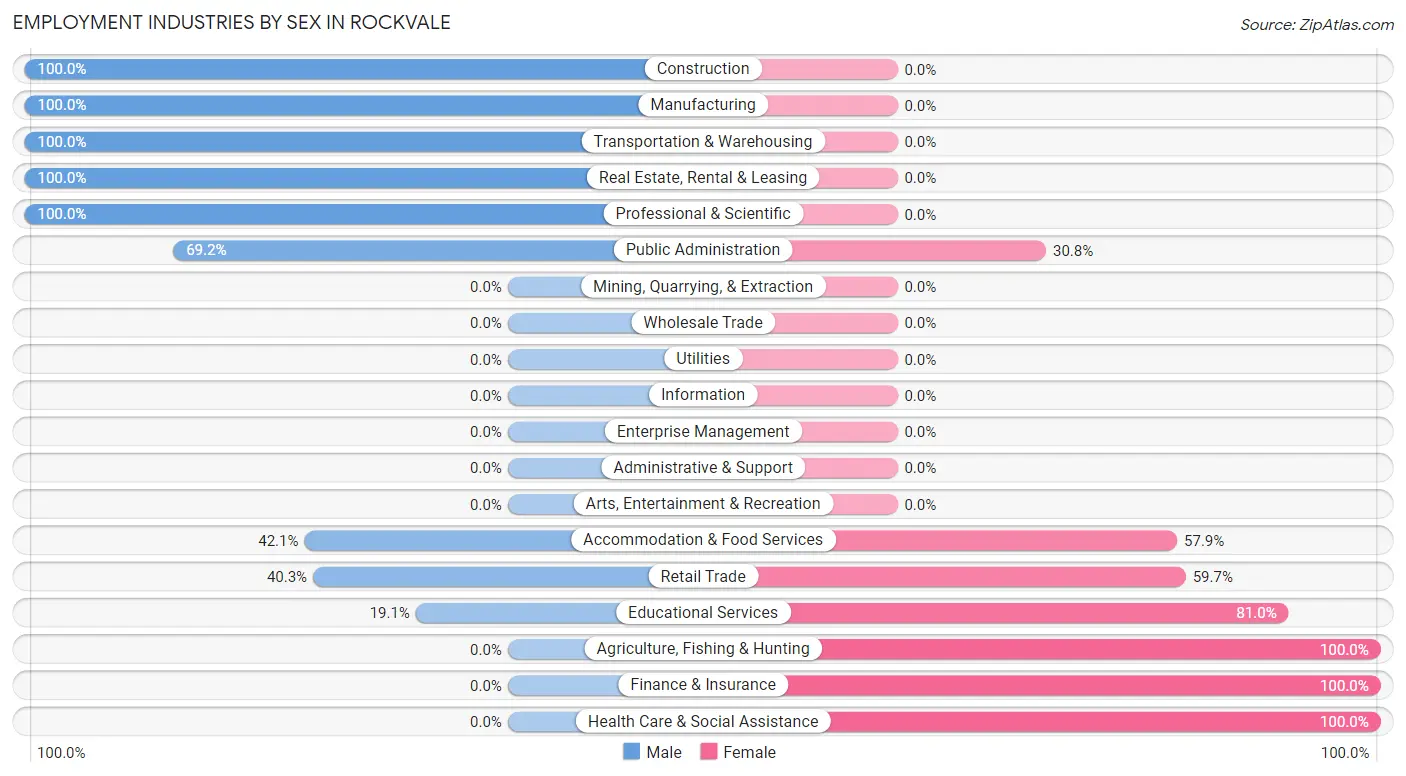
| Industry | Male | Female |
| Agriculture, Fishing & Hunting | 0 (0.0%) | 2 (100.0%) |
| Mining, Quarrying, & Extraction | 0 (0.0%) | 0 (0.0%) |
| Construction | 27 (100.0%) | 0 (0.0%) |
| Manufacturing | 4 (100.0%) | 0 (0.0%) |
| Wholesale Trade | 0 (0.0%) | 0 (0.0%) |
| Retail Trade | 25 (40.3%) | 37 (59.7%) |
| Transportation & Warehousing | 17 (100.0%) | 0 (0.0%) |
| Utilities | 0 (0.0%) | 0 (0.0%) |
| Information | 0 (0.0%) | 0 (0.0%) |
| Finance & Insurance | 0 (0.0%) | 50 (100.0%) |
| Real Estate, Rental & Leasing | 4 (100.0%) | 0 (0.0%) |
| Professional & Scientific | 4 (100.0%) | 0 (0.0%) |
| Enterprise Management | 0 (0.0%) | 0 (0.0%) |
| Administrative & Support | 0 (0.0%) | 0 (0.0%) |
| Educational Services | 4 (19.1%) | 17 (80.9%) |
| Health Care & Social Assistance | 0 (0.0%) | 16 (100.0%) |
| Arts, Entertainment & Recreation | 0 (0.0%) | 0 (0.0%) |
| Accommodation & Food Services | 8 (42.1%) | 11 (57.9%) |
| Public Administration | 18 (69.2%) | 8 (30.8%) |
| Total | 114 (44.7%) | 141 (55.3%) |
Education in Rockvale
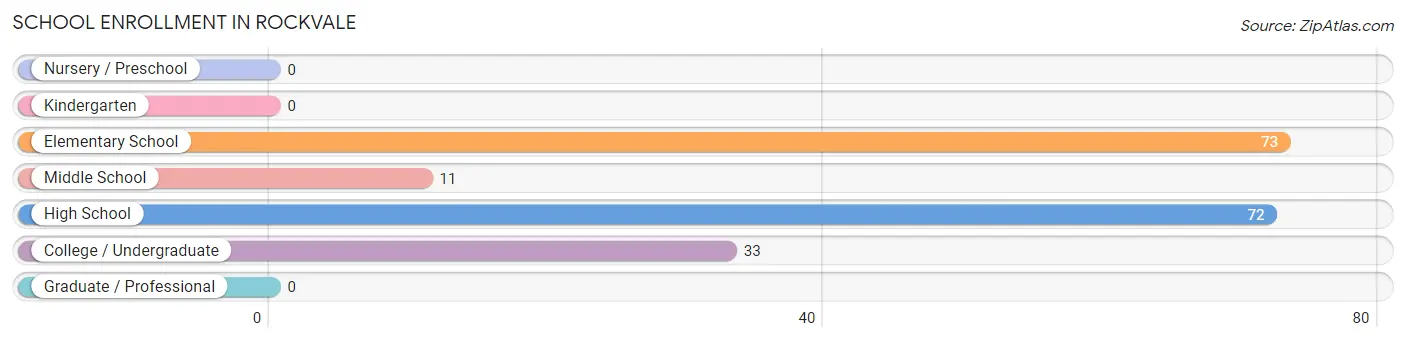
School Enrollment in Rockvale
The most common levels of schooling among the 189 students in Rockvale are elementary school (73 | 38.6%), high school (72 | 38.1%), and college / undergraduate (33 | 17.5%).
| School Level | # Students | % Students |
| Nursery / Preschool | 0 | 0.0% |
| Kindergarten | 0 | 0.0% |
| Elementary School | 73 | 38.6% |
| Middle School | 11 | 5.8% |
| High School | 72 | 38.1% |
| College / Undergraduate | 33 | 17.5% |
| Graduate / Professional | 0 | 0.0% |
| Total | 189 | 100.0% |
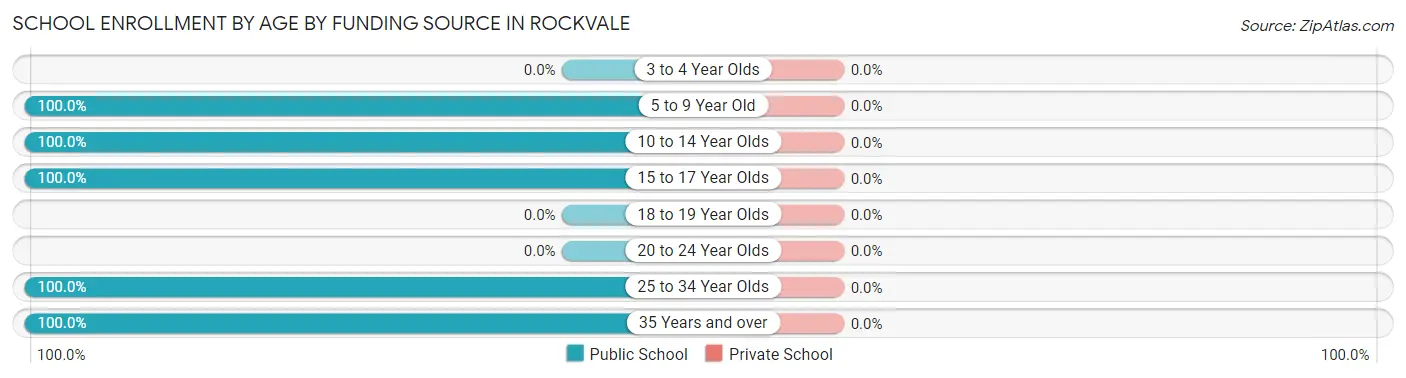
School Enrollment by Age by Funding Source in Rockvale
| Age Bracket | Public School | Private School |
| 3 to 4 Year Olds | 0 (0.0%) | 0 (0.0%) |
| 5 to 9 Year Old | 23 (100.0%) | 0 (0.0%) |
| 10 to 14 Year Olds | 61 (100.0%) | 0 (0.0%) |
| 15 to 17 Year Olds | 72 (100.0%) | 0 (0.0%) |
| 18 to 19 Year Olds | 0 (0.0%) | 0 (0.0%) |
| 20 to 24 Year Olds | 0 (0.0%) | 0 (0.0%) |
| 25 to 34 Year Olds | 21 (100.0%) | 0 (0.0%) |
| 35 Years and over | 12 (100.0%) | 0 (0.0%) |
| Total | 189 (100.0%) | 0 (0.0%) |
Educational Attainment by Field of Study in Rockvale
Education (19 | 33.3%), bio, nature & agricultural (11 | 19.3%), science & technology (10 | 17.5%), social sciences (4 | 7.0%), and visual & performing arts (4 | 7.0%) are the most common fields of study among 57 individuals in Rockvale who have obtained a bachelor's degree or higher.
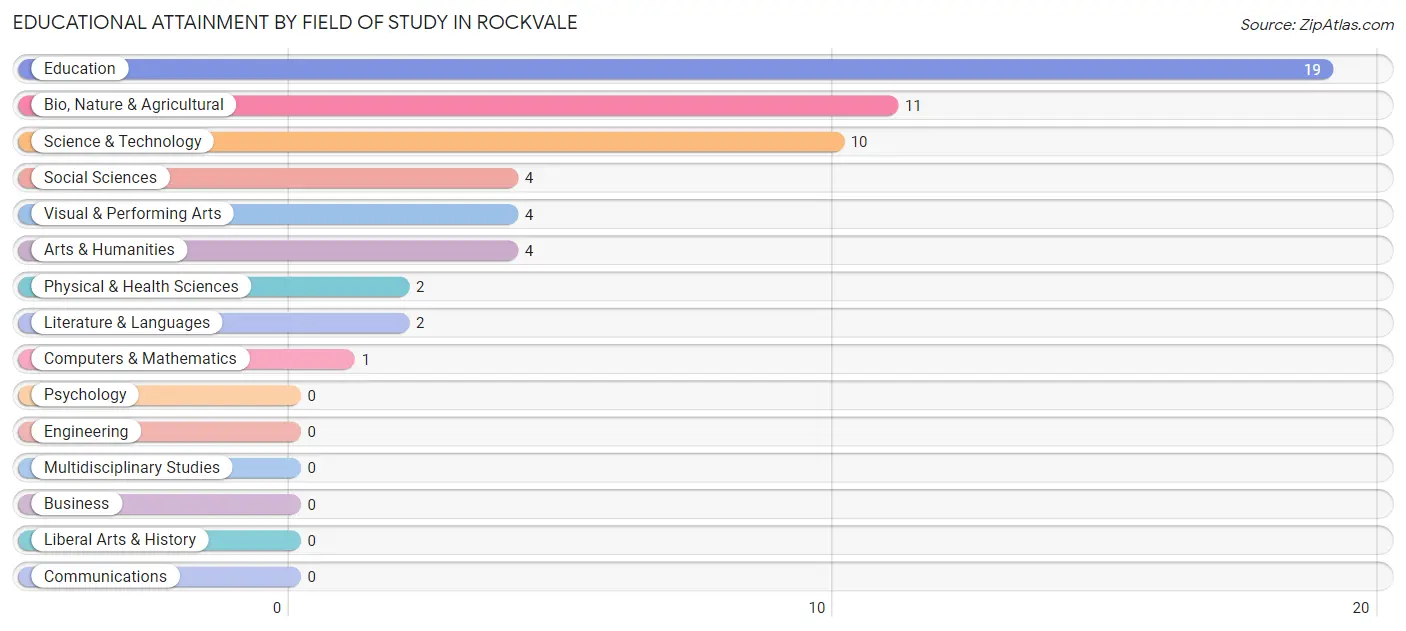
| Field of Study | # Graduates | % Graduates |
| Computers & Mathematics | 1 | 1.8% |
| Bio, Nature & Agricultural | 11 | 19.3% |
| Physical & Health Sciences | 2 | 3.5% |
| Psychology | 0 | 0.0% |
| Social Sciences | 4 | 7.0% |
| Engineering | 0 | 0.0% |
| Multidisciplinary Studies | 0 | 0.0% |
| Science & Technology | 10 | 17.5% |
| Business | 0 | 0.0% |
| Education | 19 | 33.3% |
| Literature & Languages | 2 | 3.5% |
| Liberal Arts & History | 0 | 0.0% |
| Visual & Performing Arts | 4 | 7.0% |
| Communications | 0 | 0.0% |
| Arts & Humanities | 4 | 7.0% |
| Total | 57 | 100.0% |
Transportation & Commute in Rockvale
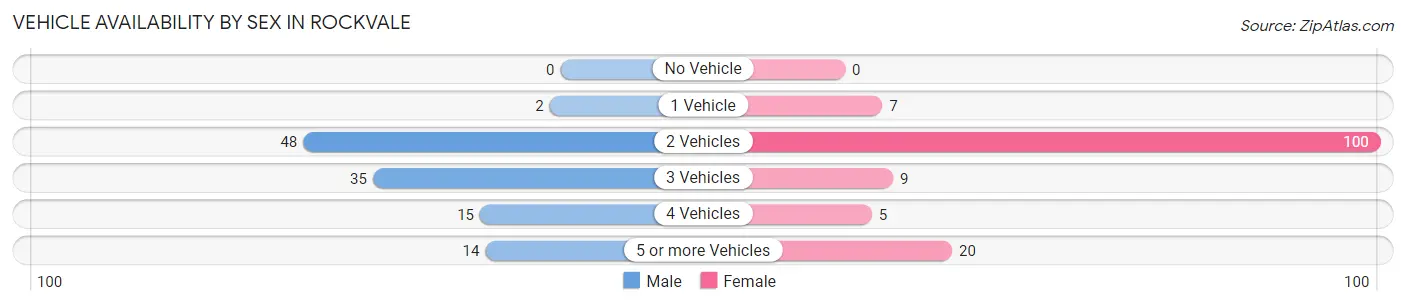
Vehicle Availability by Sex in Rockvale
The most prevalent vehicle ownership categories in Rockvale are males with 2 vehicles (48, accounting for 42.1%) and females with 2 vehicles (100, making up 34.0%).
| Vehicles Available | Male | Female |
| No Vehicle | 0 (0.0%) | 0 (0.0%) |
| 1 Vehicle | 2 (1.8%) | 7 (5.0%) |
| 2 Vehicles | 48 (42.1%) | 100 (70.9%) |
| 3 Vehicles | 35 (30.7%) | 9 (6.4%) |
| 4 Vehicles | 15 (13.2%) | 5 (3.5%) |
| 5 or more Vehicles | 14 (12.3%) | 20 (14.2%) |
| Total | 114 (100.0%) | 141 (100.0%) |
Commute Time in Rockvale
The most frequently occuring commute durations in Rockvale are 20 to 24 minutes (115 commuters, 56.9%), 10 to 14 minutes (30 commuters, 14.8%), and 15 to 19 minutes (19 commuters, 9.4%).
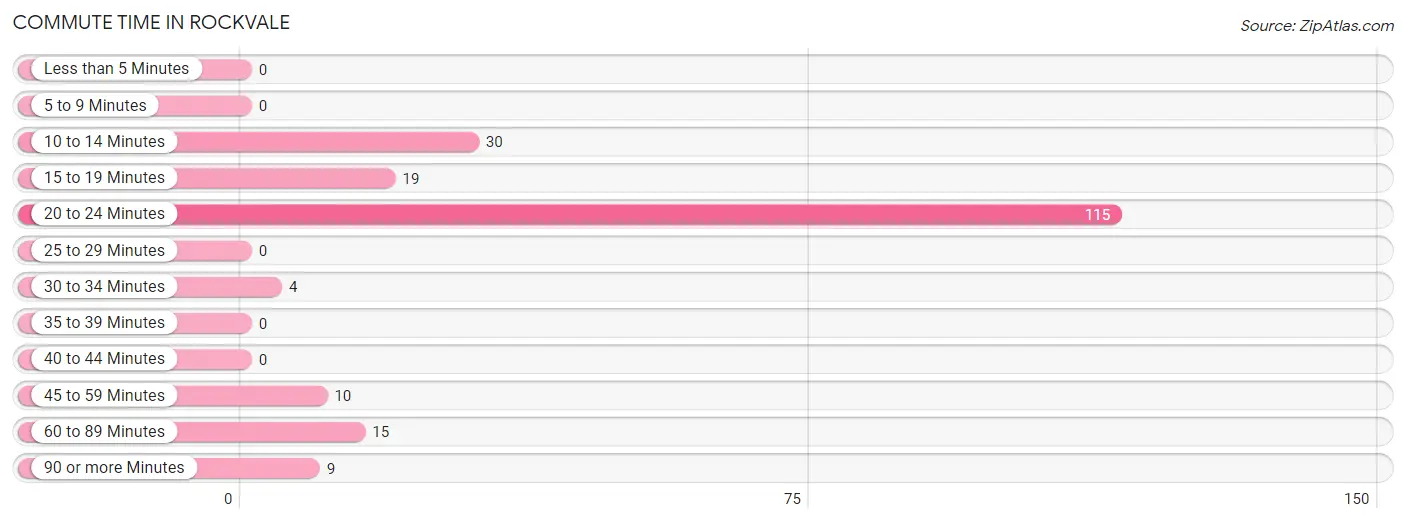
| Commute Time | # Commuters | % Commuters |
| Less than 5 Minutes | 0 | 0.0% |
| 5 to 9 Minutes | 0 | 0.0% |
| 10 to 14 Minutes | 30 | 14.8% |
| 15 to 19 Minutes | 19 | 9.4% |
| 20 to 24 Minutes | 115 | 56.9% |
| 25 to 29 Minutes | 0 | 0.0% |
| 30 to 34 Minutes | 4 | 2.0% |
| 35 to 39 Minutes | 0 | 0.0% |
| 40 to 44 Minutes | 0 | 0.0% |
| 45 to 59 Minutes | 10 | 5.0% |
| 60 to 89 Minutes | 15 | 7.4% |
| 90 or more Minutes | 9 | 4.5% |
Commute Time by Sex in Rockvale
The most common commute times in Rockvale are 20 to 24 minutes (75 commuters, 67.6%) for males and 20 to 24 minutes (40 commuters, 44.0%) for females.
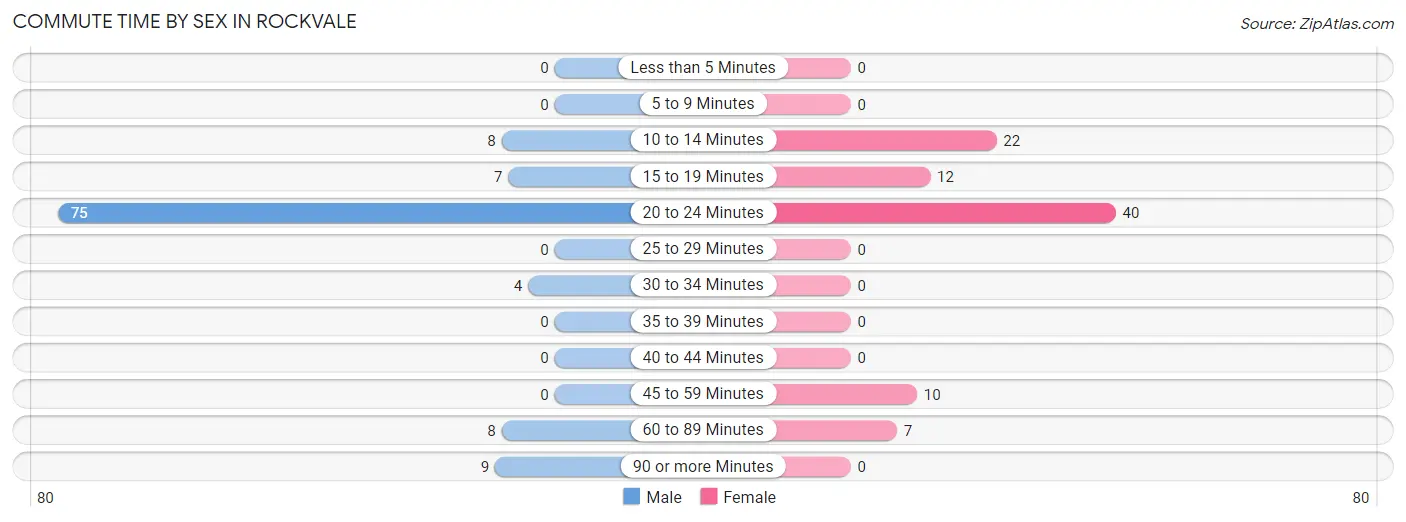
| Commute Time | Male | Female |
| Less than 5 Minutes | 0 (0.0%) | 0 (0.0%) |
| 5 to 9 Minutes | 0 (0.0%) | 0 (0.0%) |
| 10 to 14 Minutes | 8 (7.2%) | 22 (24.2%) |
| 15 to 19 Minutes | 7 (6.3%) | 12 (13.2%) |
| 20 to 24 Minutes | 75 (67.6%) | 40 (44.0%) |
| 25 to 29 Minutes | 0 (0.0%) | 0 (0.0%) |
| 30 to 34 Minutes | 4 (3.6%) | 0 (0.0%) |
| 35 to 39 Minutes | 0 (0.0%) | 0 (0.0%) |
| 40 to 44 Minutes | 0 (0.0%) | 0 (0.0%) |
| 45 to 59 Minutes | 0 (0.0%) | 10 (11.0%) |
| 60 to 89 Minutes | 8 (7.2%) | 7 (7.7%) |
| 90 or more Minutes | 9 (8.1%) | 0 (0.0%) |
Time of Departure to Work by Sex in Rockvale
The most frequent times of departure to work in Rockvale are 7:00 AM to 7:29 AM (45, 40.5%) for males and 6:30 AM to 6:59 AM (33, 36.3%) for females.
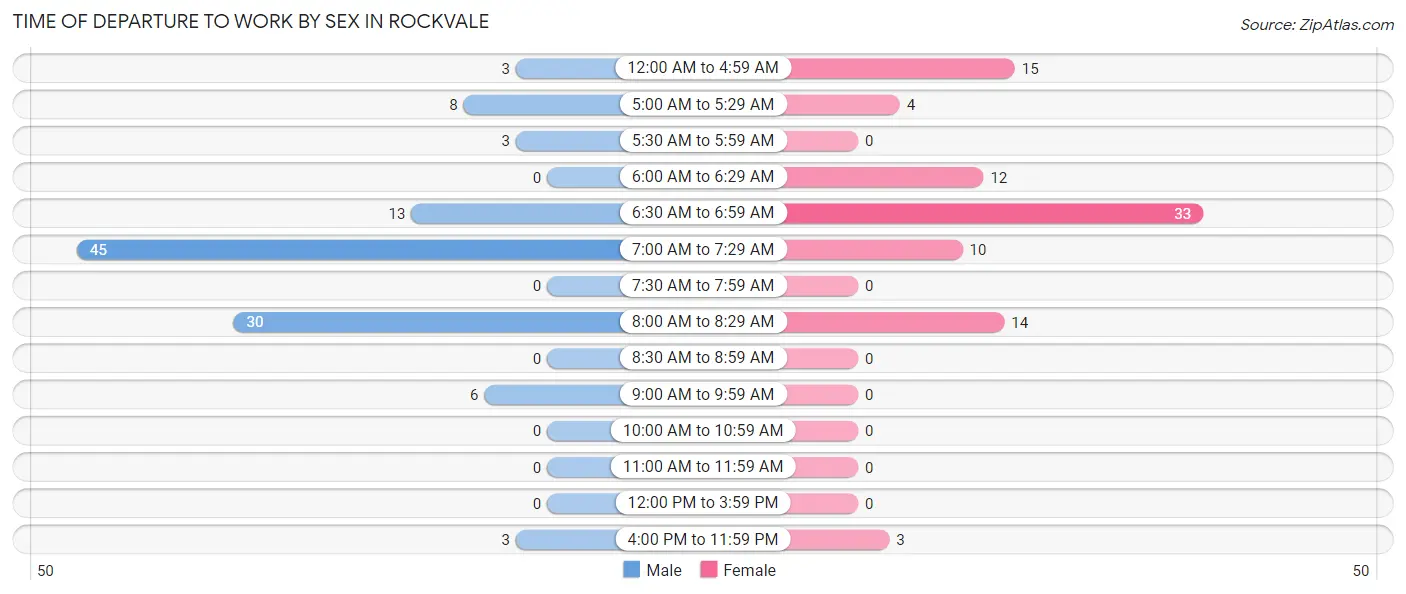
| Time of Departure | Male | Female |
| 12:00 AM to 4:59 AM | 3 (2.7%) | 15 (16.5%) |
| 5:00 AM to 5:29 AM | 8 (7.2%) | 4 (4.4%) |
| 5:30 AM to 5:59 AM | 3 (2.7%) | 0 (0.0%) |
| 6:00 AM to 6:29 AM | 0 (0.0%) | 12 (13.2%) |
| 6:30 AM to 6:59 AM | 13 (11.7%) | 33 (36.3%) |
| 7:00 AM to 7:29 AM | 45 (40.5%) | 10 (11.0%) |
| 7:30 AM to 7:59 AM | 0 (0.0%) | 0 (0.0%) |
| 8:00 AM to 8:29 AM | 30 (27.0%) | 14 (15.4%) |
| 8:30 AM to 8:59 AM | 0 (0.0%) | 0 (0.0%) |
| 9:00 AM to 9:59 AM | 6 (5.4%) | 0 (0.0%) |
| 10:00 AM to 10:59 AM | 0 (0.0%) | 0 (0.0%) |
| 11:00 AM to 11:59 AM | 0 (0.0%) | 0 (0.0%) |
| 12:00 PM to 3:59 PM | 0 (0.0%) | 0 (0.0%) |
| 4:00 PM to 11:59 PM | 3 (2.7%) | 3 (3.3%) |
| Total | 111 (100.0%) | 91 (100.0%) |
Housing Occupancy in Rockvale
Occupancy by Ownership in Rockvale
Of the total 272 dwellings in Rockvale, owner-occupied units account for 255 (93.8%), while renter-occupied units make up 17 (6.2%).
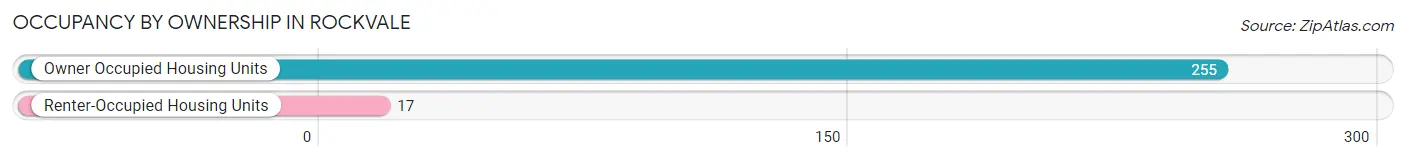
| Occupancy | # Housing Units | % Housing Units |
| Owner Occupied Housing Units | 255 | 93.8% |
| Renter-Occupied Housing Units | 17 | 6.2% |
| Total Occupied Housing Units | 272 | 100.0% |
Occupancy by Household Size in Rockvale
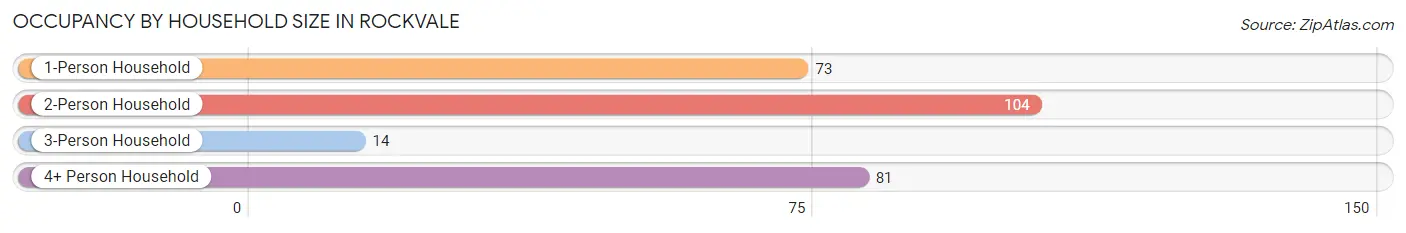
| Household Size | # Housing Units | % Housing Units |
| 1-Person Household | 73 | 26.8% |
| 2-Person Household | 104 | 38.2% |
| 3-Person Household | 14 | 5.1% |
| 4+ Person Household | 81 | 29.8% |
| Total Housing Units | 272 | 100.0% |
Occupancy by Ownership by Household Size in Rockvale
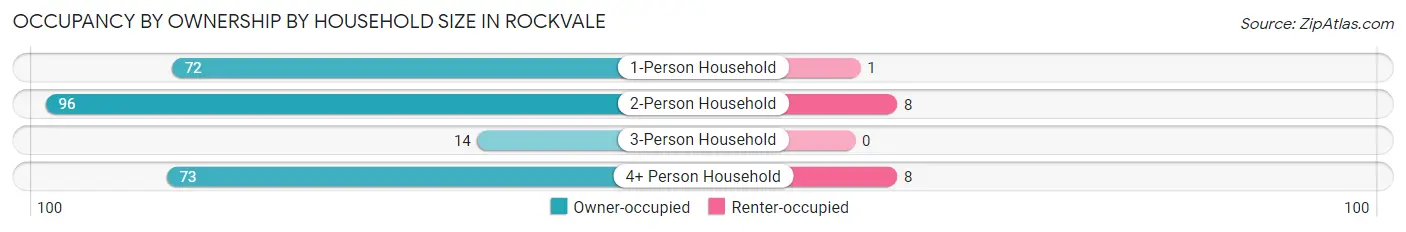
| Household Size | Owner-occupied | Renter-occupied |
| 1-Person Household | 72 (98.6%) | 1 (1.4%) |
| 2-Person Household | 96 (92.3%) | 8 (7.7%) |
| 3-Person Household | 14 (100.0%) | 0 (0.0%) |
| 4+ Person Household | 73 (90.1%) | 8 (9.9%) |
| Total Housing Units | 255 (93.8%) | 17 (6.2%) |
Occupancy by Educational Attainment in Rockvale
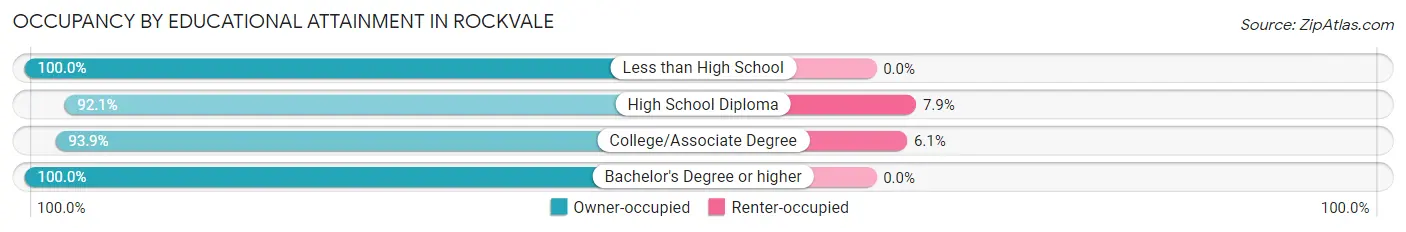
| Household Size | Owner-occupied | Renter-occupied |
| Less than High School | 6 (100.0%) | 0 (0.0%) |
| High School Diploma | 105 (92.1%) | 9 (7.9%) |
| College/Associate Degree | 123 (93.9%) | 8 (6.1%) |
| Bachelor's Degree or higher | 21 (100.0%) | 0 (0.0%) |
Occupancy by Age of Householder in Rockvale
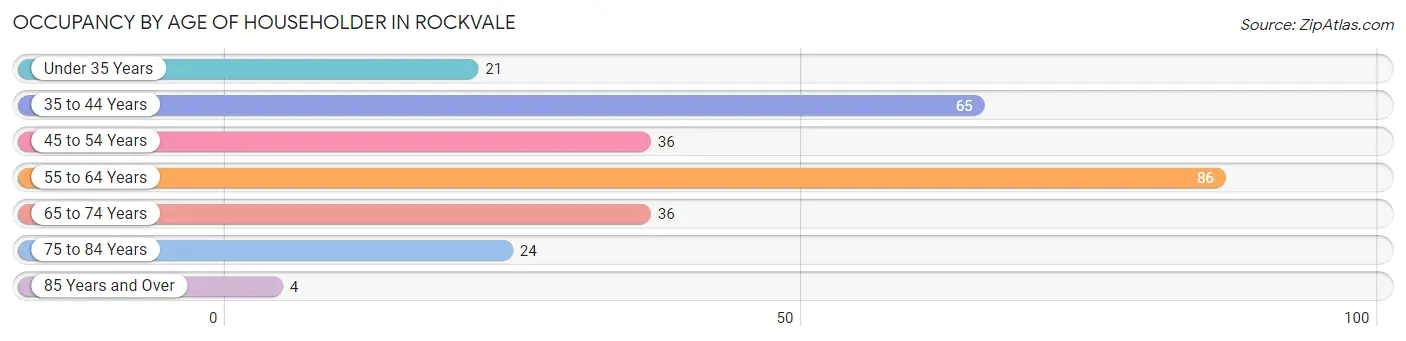
| Age Bracket | # Households | % Households |
| Under 35 Years | 21 | 7.7% |
| 35 to 44 Years | 65 | 23.9% |
| 45 to 54 Years | 36 | 13.2% |
| 55 to 64 Years | 86 | 31.6% |
| 65 to 74 Years | 36 | 13.2% |
| 75 to 84 Years | 24 | 8.8% |
| 85 Years and Over | 4 | 1.5% |
| Total | 272 | 100.0% |
Housing Finances in Rockvale
Median Income by Occupancy in Rockvale
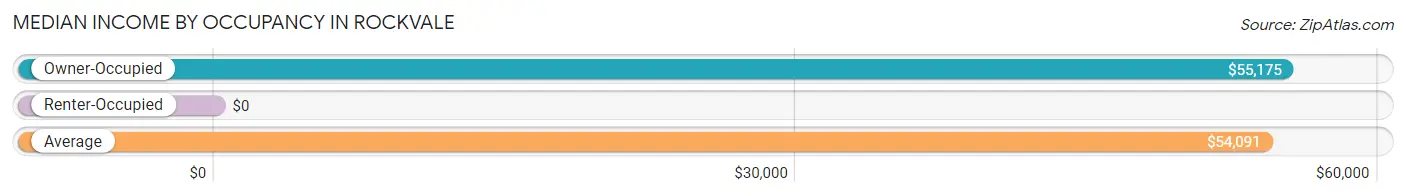
| Occupancy Type | # Households | Median Income |
| Owner-Occupied | 255 (93.8%) | $55,175 |
| Renter-Occupied | 17 (6.2%) | $0 |
| Average | 272 (100.0%) | $54,091 |
Occupancy by Householder Income Bracket in Rockvale
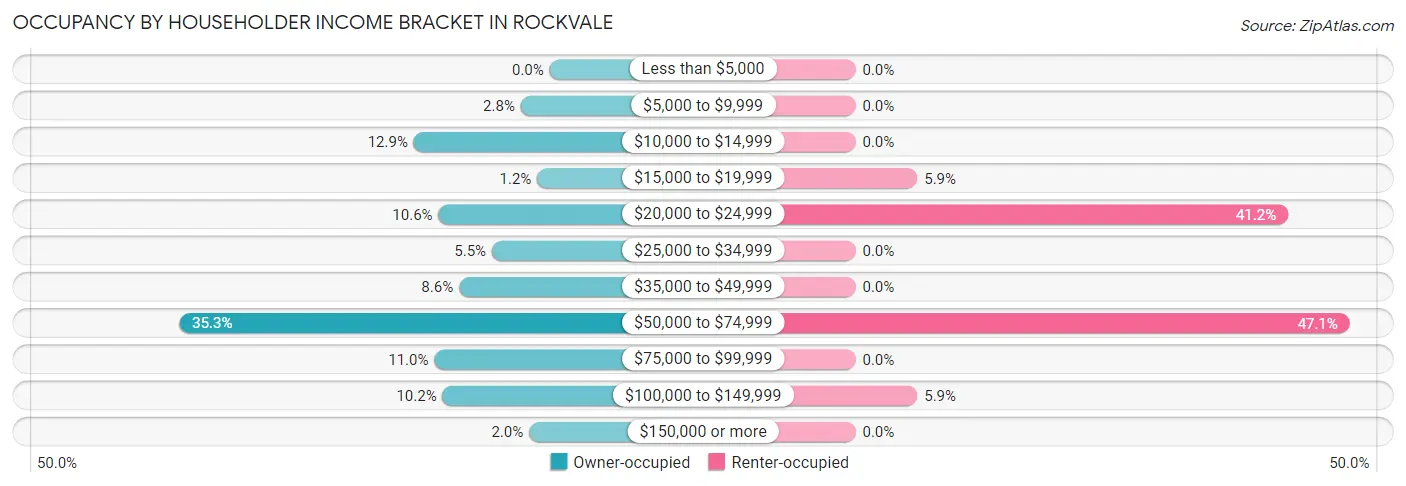
| Income Bracket | Owner-occupied | Renter-occupied |
| Less than $5,000 | 0 (0.0%) | 0 (0.0%) |
| $5,000 to $9,999 | 7 (2.8%) | 0 (0.0%) |
| $10,000 to $14,999 | 33 (12.9%) | 0 (0.0%) |
| $15,000 to $19,999 | 3 (1.2%) | 1 (5.9%) |
| $20,000 to $24,999 | 27 (10.6%) | 7 (41.2%) |
| $25,000 to $34,999 | 14 (5.5%) | 0 (0.0%) |
| $35,000 to $49,999 | 22 (8.6%) | 0 (0.0%) |
| $50,000 to $74,999 | 90 (35.3%) | 8 (47.1%) |
| $75,000 to $99,999 | 28 (11.0%) | 0 (0.0%) |
| $100,000 to $149,999 | 26 (10.2%) | 1 (5.9%) |
| $150,000 or more | 5 (2.0%) | 0 (0.0%) |
| Total | 255 (100.0%) | 17 (100.0%) |
Monthly Housing Cost Tiers in Rockvale
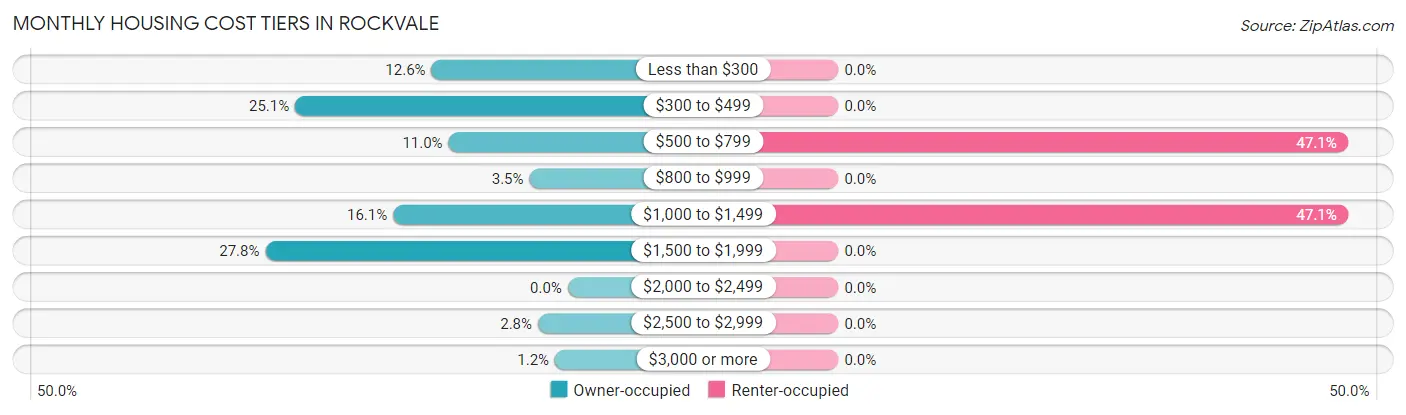
| Monthly Cost | Owner-occupied | Renter-occupied |
| Less than $300 | 32 (12.6%) | 0 (0.0%) |
| $300 to $499 | 64 (25.1%) | 0 (0.0%) |
| $500 to $799 | 28 (11.0%) | 8 (47.1%) |
| $800 to $999 | 9 (3.5%) | 0 (0.0%) |
| $1,000 to $1,499 | 41 (16.1%) | 8 (47.1%) |
| $1,500 to $1,999 | 71 (27.8%) | 0 (0.0%) |
| $2,000 to $2,499 | 0 (0.0%) | 0 (0.0%) |
| $2,500 to $2,999 | 7 (2.8%) | 0 (0.0%) |
| $3,000 or more | 3 (1.2%) | 0 (0.0%) |
| Total | 255 (100.0%) | 17 (100.0%) |
Physical Housing Characteristics in Rockvale
Housing Structures in Rockvale
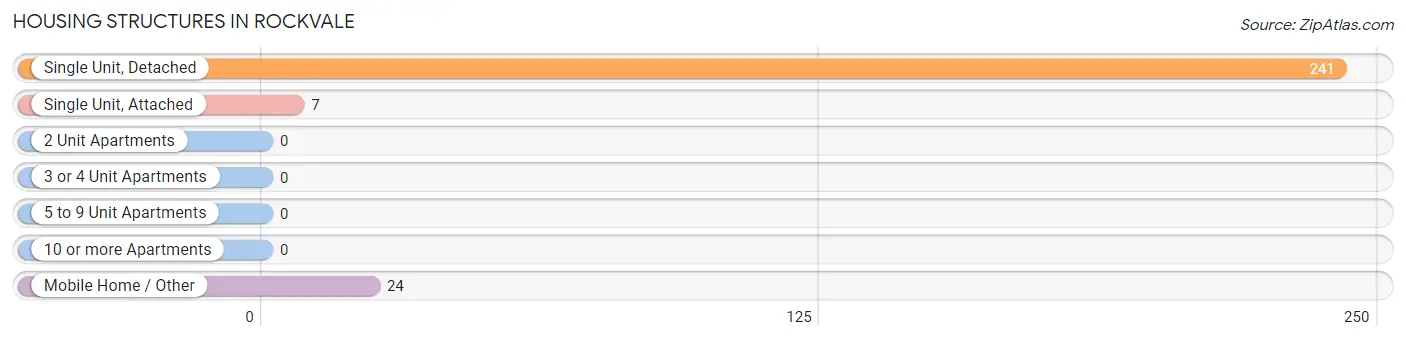
| Structure Type | # Housing Units | % Housing Units |
| Single Unit, Detached | 241 | 88.6% |
| Single Unit, Attached | 7 | 2.6% |
| 2 Unit Apartments | 0 | 0.0% |
| 3 or 4 Unit Apartments | 0 | 0.0% |
| 5 to 9 Unit Apartments | 0 | 0.0% |
| 10 or more Apartments | 0 | 0.0% |
| Mobile Home / Other | 24 | 8.8% |
| Total | 272 | 100.0% |
Housing Structures by Occupancy in Rockvale
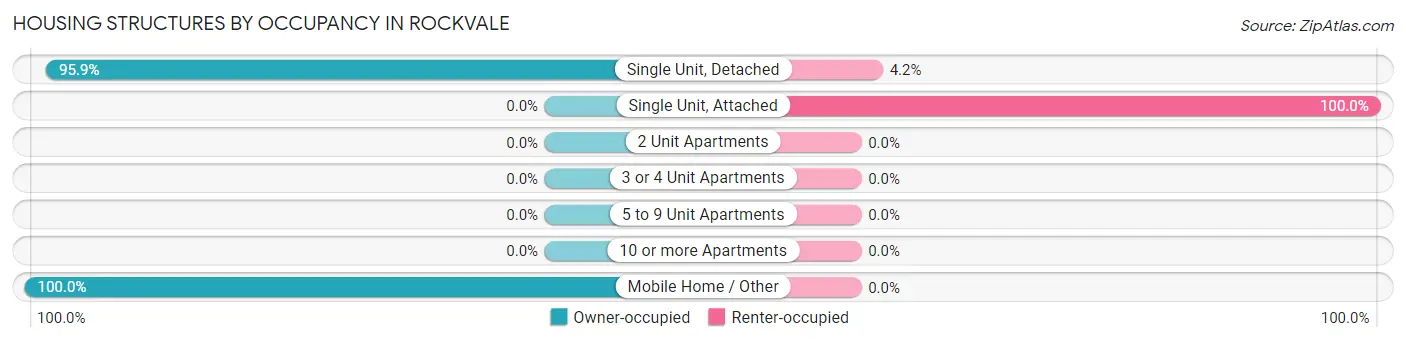
| Structure Type | Owner-occupied | Renter-occupied |
| Single Unit, Detached | 231 (95.9%) | 10 (4.2%) |
| Single Unit, Attached | 0 (0.0%) | 7 (100.0%) |
| 2 Unit Apartments | 0 (0.0%) | 0 (0.0%) |
| 3 or 4 Unit Apartments | 0 (0.0%) | 0 (0.0%) |
| 5 to 9 Unit Apartments | 0 (0.0%) | 0 (0.0%) |
| 10 or more Apartments | 0 (0.0%) | 0 (0.0%) |
| Mobile Home / Other | 24 (100.0%) | 0 (0.0%) |
| Total | 255 (93.8%) | 17 (6.2%) |
Housing Structures by Number of Rooms in Rockvale
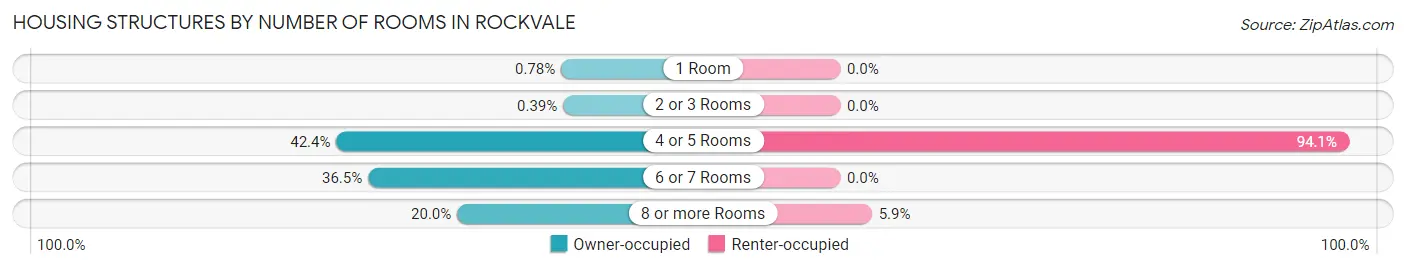
| Number of Rooms | Owner-occupied | Renter-occupied |
| 1 Room | 2 (0.8%) | 0 (0.0%) |
| 2 or 3 Rooms | 1 (0.4%) | 0 (0.0%) |
| 4 or 5 Rooms | 108 (42.3%) | 16 (94.1%) |
| 6 or 7 Rooms | 93 (36.5%) | 0 (0.0%) |
| 8 or more Rooms | 51 (20.0%) | 1 (5.9%) |
| Total | 255 (100.0%) | 17 (100.0%) |
Housing Structure by Heating Type in Rockvale
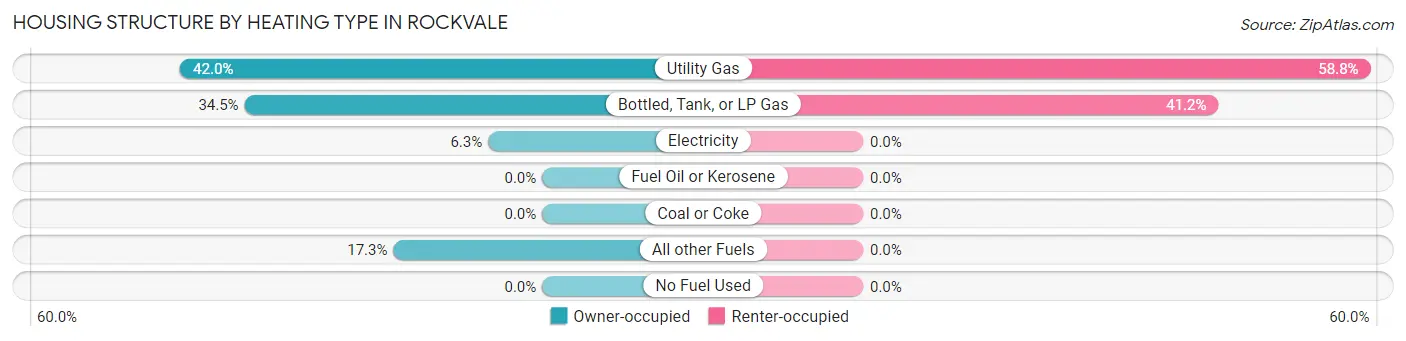
| Heating Type | Owner-occupied | Renter-occupied |
| Utility Gas | 107 (42.0%) | 10 (58.8%) |
| Bottled, Tank, or LP Gas | 88 (34.5%) | 7 (41.2%) |
| Electricity | 16 (6.3%) | 0 (0.0%) |
| Fuel Oil or Kerosene | 0 (0.0%) | 0 (0.0%) |
| Coal or Coke | 0 (0.0%) | 0 (0.0%) |
| All other Fuels | 44 (17.2%) | 0 (0.0%) |
| No Fuel Used | 0 (0.0%) | 0 (0.0%) |
| Total | 255 (100.0%) | 17 (100.0%) |
Household Vehicle Usage in Rockvale
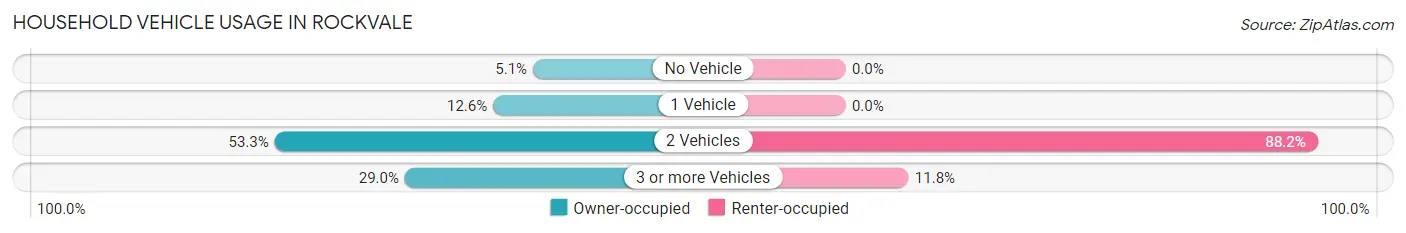
| Vehicles per Household | Owner-occupied | Renter-occupied |
| No Vehicle | 13 (5.1%) | 0 (0.0%) |
| 1 Vehicle | 32 (12.6%) | 0 (0.0%) |
| 2 Vehicles | 136 (53.3%) | 15 (88.2%) |
| 3 or more Vehicles | 74 (29.0%) | 2 (11.8%) |
| Total | 255 (100.0%) | 17 (100.0%) |
Real Estate & Mortgages in Rockvale
Real Estate and Mortgage Overview in Rockvale
| Characteristic | Without Mortgage | With Mortgage |
| Housing Units | 101 | 154 |
| Median Property Value | $153,500 | $172,700 |
| Median Household Income | $45,156 | $5 |
| Monthly Housing Costs | $327 | $3 |
| Real Estate Taxes | $524 | $0 |
Property Value by Mortgage Status in Rockvale
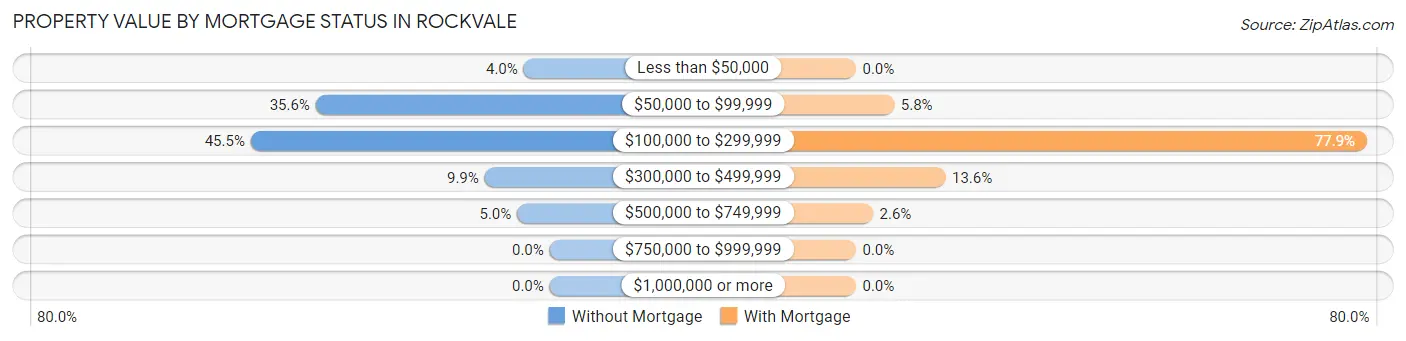
| Property Value | Without Mortgage | With Mortgage |
| Less than $50,000 | 4 (4.0%) | 0 (0.0%) |
| $50,000 to $99,999 | 36 (35.6%) | 9 (5.8%) |
| $100,000 to $299,999 | 46 (45.5%) | 120 (77.9%) |
| $300,000 to $499,999 | 10 (9.9%) | 21 (13.6%) |
| $500,000 to $749,999 | 5 (5.0%) | 4 (2.6%) |
| $750,000 to $999,999 | 0 (0.0%) | 0 (0.0%) |
| $1,000,000 or more | 0 (0.0%) | 0 (0.0%) |
| Total | 101 (100.0%) | 154 (100.0%) |
Household Income by Mortgage Status in Rockvale
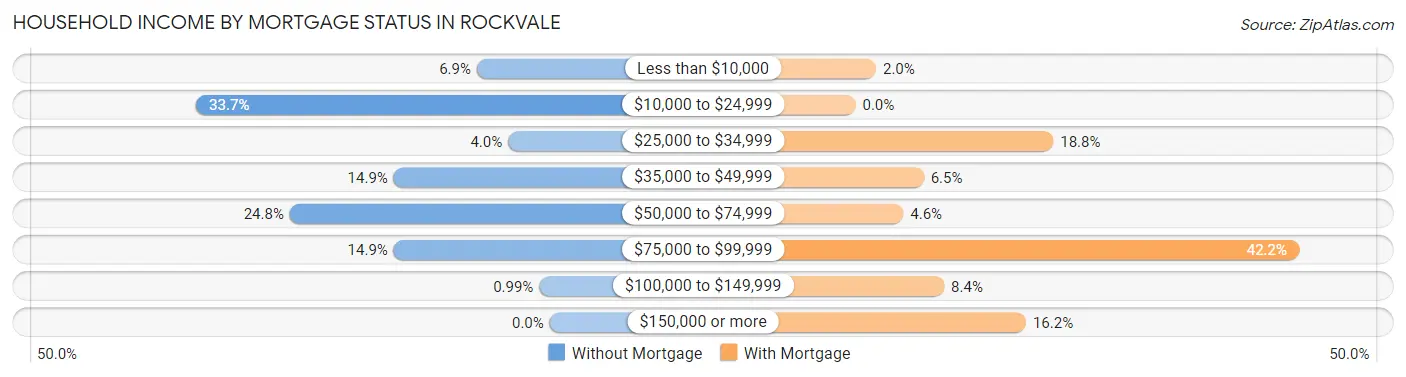
| Household Income | Without Mortgage | With Mortgage |
| Less than $10,000 | 7 (6.9%) | 3 (1.9%) |
| $10,000 to $24,999 | 34 (33.7%) | 0 (0.0%) |
| $25,000 to $34,999 | 4 (4.0%) | 29 (18.8%) |
| $35,000 to $49,999 | 15 (14.8%) | 10 (6.5%) |
| $50,000 to $74,999 | 25 (24.7%) | 7 (4.5%) |
| $75,000 to $99,999 | 15 (14.8%) | 65 (42.2%) |
| $100,000 to $149,999 | 1 (1.0%) | 13 (8.4%) |
| $150,000 or more | 0 (0.0%) | 25 (16.2%) |
| Total | 101 (100.0%) | 154 (100.0%) |
Property Value to Household Income Ratio in Rockvale
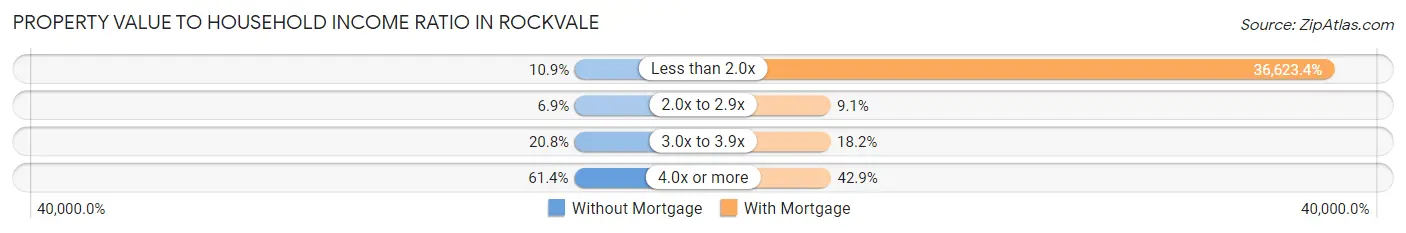
| Value-to-Income Ratio | Without Mortgage | With Mortgage |
| Less than 2.0x | 11 (10.9%) | 56,400 (36,623.4%) |
| 2.0x to 2.9x | 7 (6.9%) | 14 (9.1%) |
| 3.0x to 3.9x | 21 (20.8%) | 28 (18.2%) |
| 4.0x or more | 62 (61.4%) | 66 (42.9%) |
| Total | 101 (100.0%) | 154 (100.0%) |
Real Estate Taxes by Mortgage Status in Rockvale
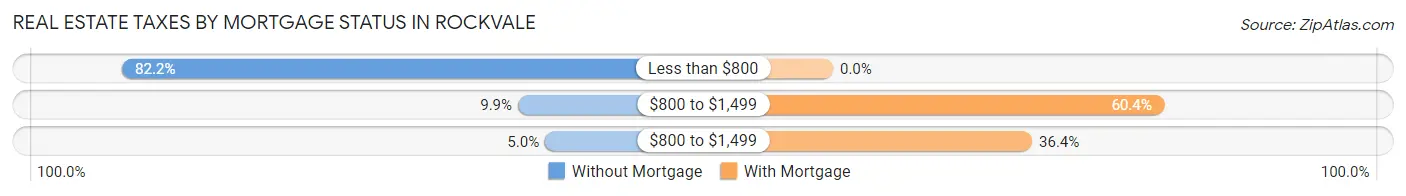
| Property Taxes | Without Mortgage | With Mortgage |
| Less than $800 | 83 (82.2%) | 0 (0.0%) |
| $800 to $1,499 | 10 (9.9%) | 93 (60.4%) |
| $800 to $1,499 | 5 (5.0%) | 56 (36.4%) |
| Total | 101 (100.0%) | 154 (100.0%) |
Health & Disability in Rockvale
Health Insurance Coverage by Age in Rockvale
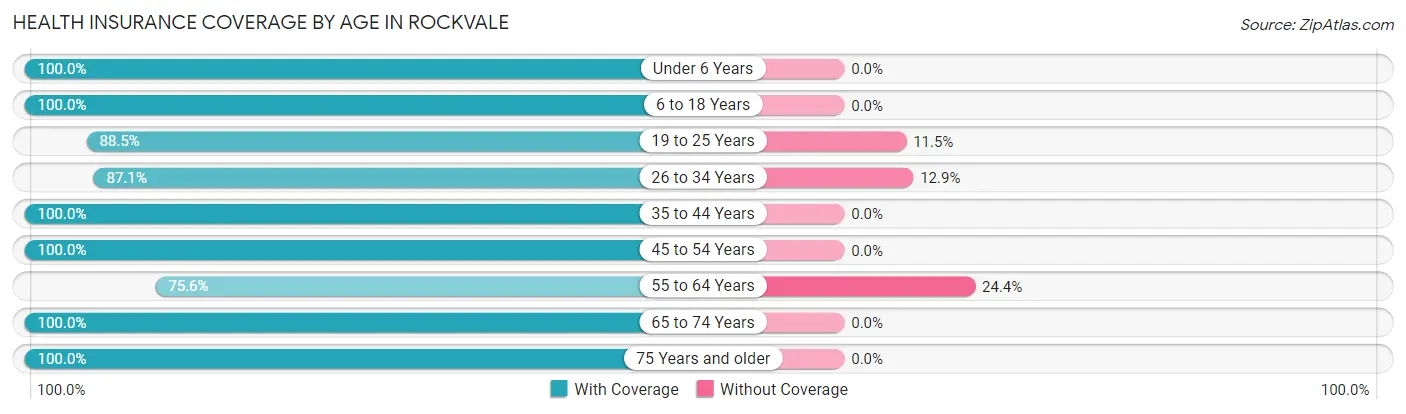
| Age Bracket | With Coverage | Without Coverage |
| Under 6 Years | 21 (100.0%) | 0 (0.0%) |
| 6 to 18 Years | 156 (100.0%) | 0 (0.0%) |
| 19 to 25 Years | 23 (88.5%) | 3 (11.5%) |
| 26 to 34 Years | 61 (87.1%) | 9 (12.9%) |
| 35 to 44 Years | 68 (100.0%) | 0 (0.0%) |
| 45 to 54 Years | 111 (100.0%) | 0 (0.0%) |
| 55 to 64 Years | 93 (75.6%) | 30 (24.4%) |
| 65 to 74 Years | 68 (100.0%) | 0 (0.0%) |
| 75 Years and older | 40 (100.0%) | 0 (0.0%) |
| Total | 641 (93.9%) | 42 (6.1%) |
Health Insurance Coverage by Citizenship Status in Rockvale
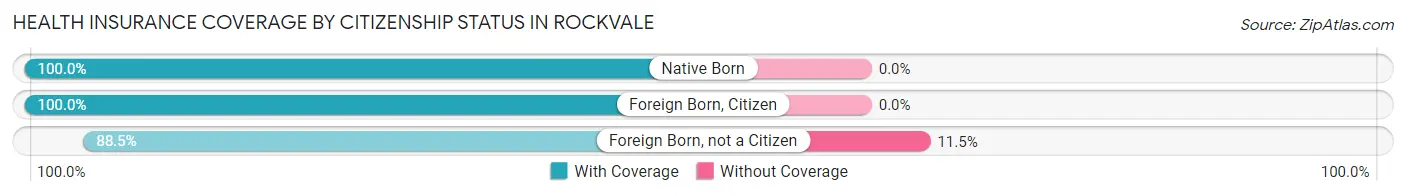
| Citizenship Status | With Coverage | Without Coverage |
| Native Born | 21 (100.0%) | 0 (0.0%) |
| Foreign Born, Citizen | 156 (100.0%) | 0 (0.0%) |
| Foreign Born, not a Citizen | 23 (88.5%) | 3 (11.5%) |
Health Insurance Coverage by Household Income in Rockvale
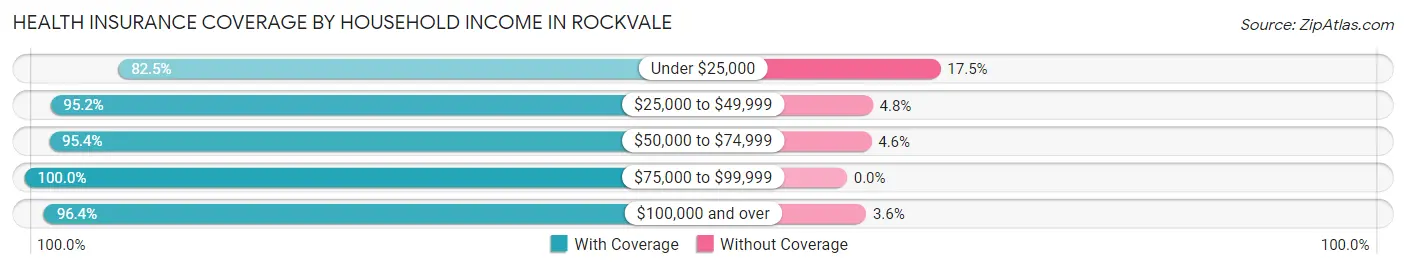
| Household Income | With Coverage | Without Coverage |
| Under $25,000 | 94 (82.5%) | 20 (17.5%) |
| $25,000 to $49,999 | 59 (95.2%) | 3 (4.8%) |
| $50,000 to $74,999 | 291 (95.4%) | 14 (4.6%) |
| $75,000 to $99,999 | 63 (100.0%) | 0 (0.0%) |
| $100,000 and over | 134 (96.4%) | 5 (3.6%) |
Public vs Private Health Insurance Coverage by Age in Rockvale
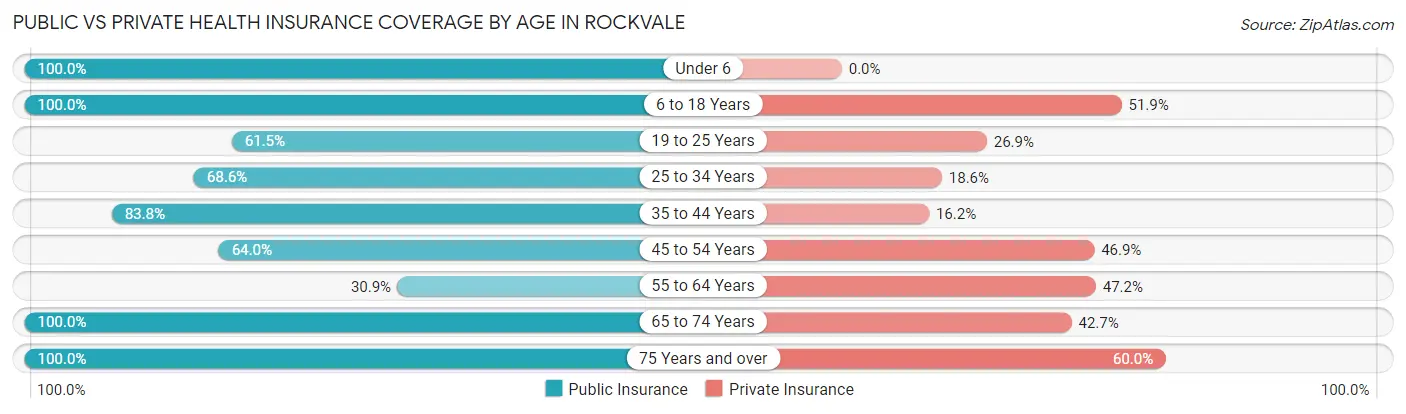
| Age Bracket | Public Insurance | Private Insurance |
| Under 6 | 21 (100.0%) | 0 (0.0%) |
| 6 to 18 Years | 156 (100.0%) | 81 (51.9%) |
| 19 to 25 Years | 16 (61.5%) | 7 (26.9%) |
| 25 to 34 Years | 48 (68.6%) | 13 (18.6%) |
| 35 to 44 Years | 57 (83.8%) | 11 (16.2%) |
| 45 to 54 Years | 71 (64.0%) | 52 (46.9%) |
| 55 to 64 Years | 38 (30.9%) | 58 (47.1%) |
| 65 to 74 Years | 68 (100.0%) | 29 (42.6%) |
| 75 Years and over | 40 (100.0%) | 24 (60.0%) |
| Total | 515 (75.4%) | 275 (40.3%) |
Disability Status by Sex by Age in Rockvale
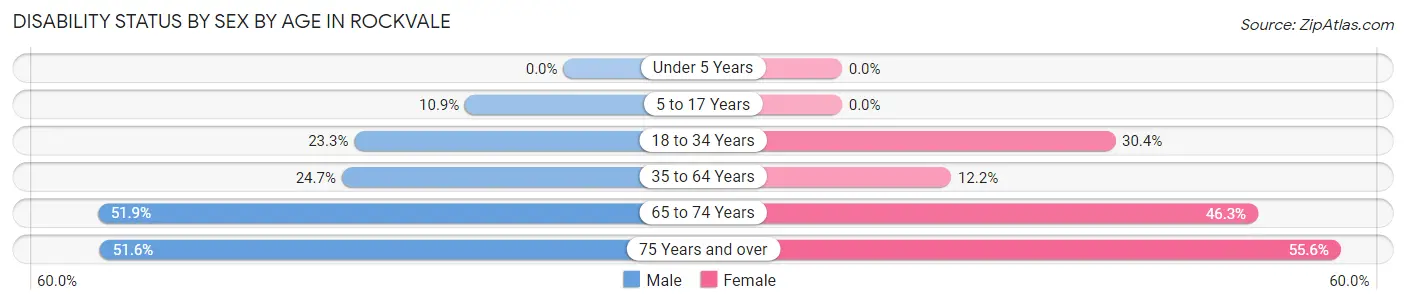
| Age Bracket | Male | Female |
| Under 5 Years | 0 (0.0%) | 0 (0.0%) |
| 5 to 17 Years | 14 (10.9%) | 0 (0.0%) |
| 18 to 34 Years | 17 (23.3%) | 7 (30.4%) |
| 35 to 64 Years | 38 (24.7%) | 18 (12.2%) |
| 65 to 74 Years | 14 (51.8%) | 19 (46.3%) |
| 75 Years and over | 16 (51.6%) | 5 (55.6%) |
Disability Class by Sex by Age in Rockvale
Disability Class: Hearing Difficulty
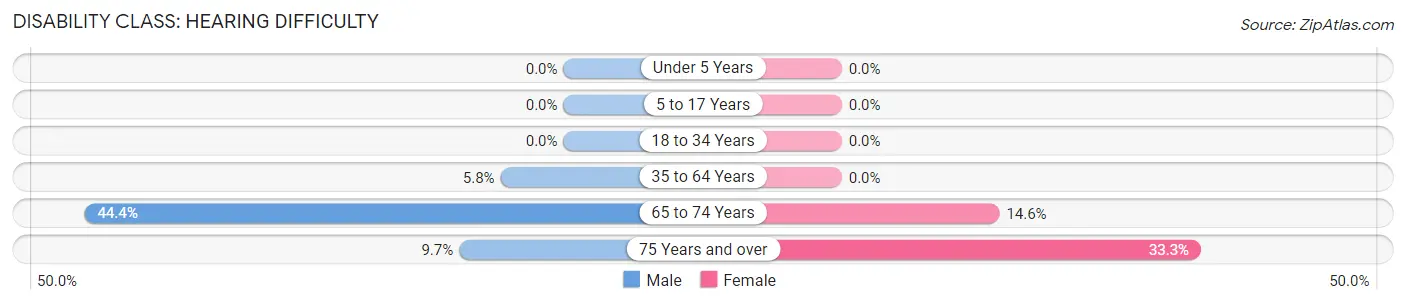
| Age Bracket | Male | Female |
| Under 5 Years | 0 (0.0%) | 0 (0.0%) |
| 5 to 17 Years | 0 (0.0%) | 0 (0.0%) |
| 18 to 34 Years | 0 (0.0%) | 0 (0.0%) |
| 35 to 64 Years | 9 (5.8%) | 0 (0.0%) |
| 65 to 74 Years | 12 (44.4%) | 6 (14.6%) |
| 75 Years and over | 3 (9.7%) | 3 (33.3%) |
Disability Class: Vision Difficulty
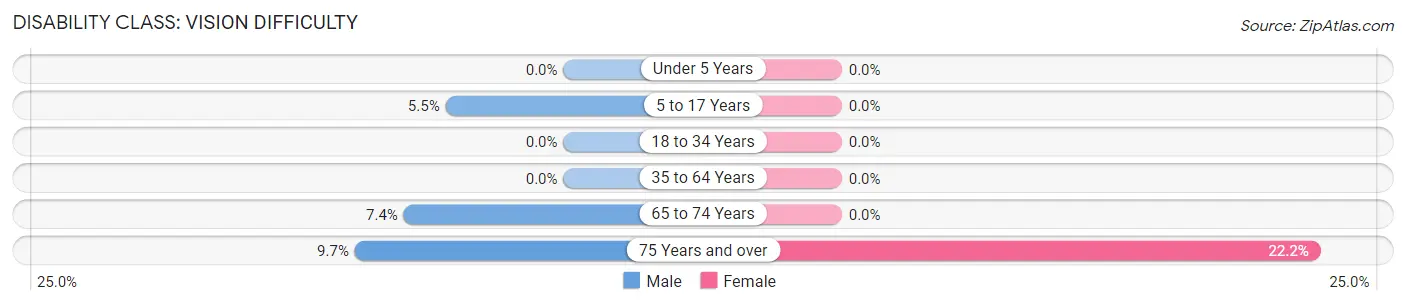
| Age Bracket | Male | Female |
| Under 5 Years | 0 (0.0%) | 0 (0.0%) |
| 5 to 17 Years | 7 (5.5%) | 0 (0.0%) |
| 18 to 34 Years | 0 (0.0%) | 0 (0.0%) |
| 35 to 64 Years | 0 (0.0%) | 0 (0.0%) |
| 65 to 74 Years | 2 (7.4%) | 0 (0.0%) |
| 75 Years and over | 3 (9.7%) | 2 (22.2%) |
Disability Class: Cognitive Difficulty
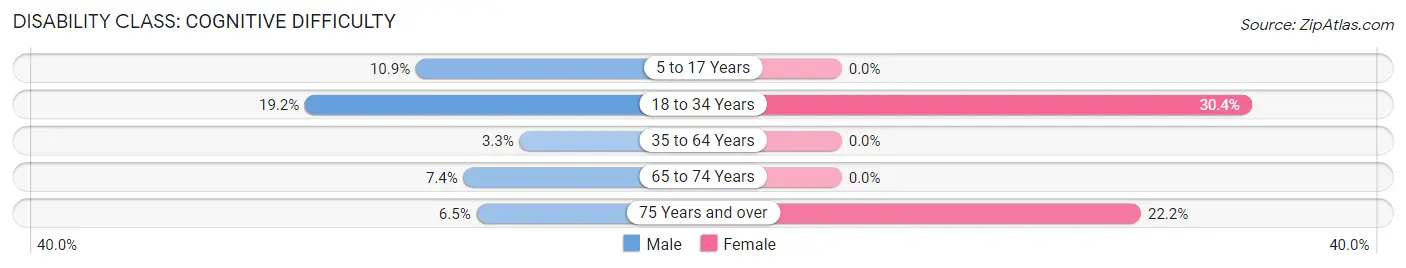
| Age Bracket | Male | Female |
| 5 to 17 Years | 14 (10.9%) | 0 (0.0%) |
| 18 to 34 Years | 14 (19.2%) | 7 (30.4%) |
| 35 to 64 Years | 5 (3.3%) | 0 (0.0%) |
| 65 to 74 Years | 2 (7.4%) | 0 (0.0%) |
| 75 Years and over | 2 (6.5%) | 2 (22.2%) |
Disability Class: Ambulatory Difficulty
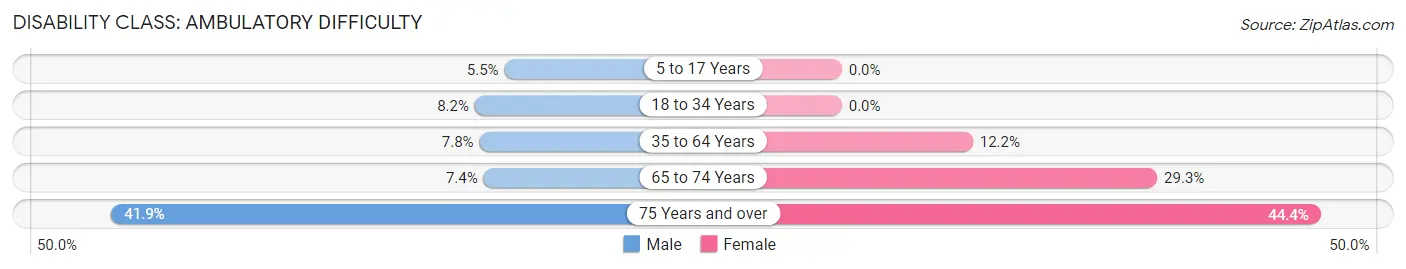
| Age Bracket | Male | Female |
| 5 to 17 Years | 7 (5.5%) | 0 (0.0%) |
| 18 to 34 Years | 6 (8.2%) | 0 (0.0%) |
| 35 to 64 Years | 12 (7.8%) | 18 (12.2%) |
| 65 to 74 Years | 2 (7.4%) | 12 (29.3%) |
| 75 Years and over | 13 (41.9%) | 4 (44.4%) |
Disability Class: Self-Care Difficulty
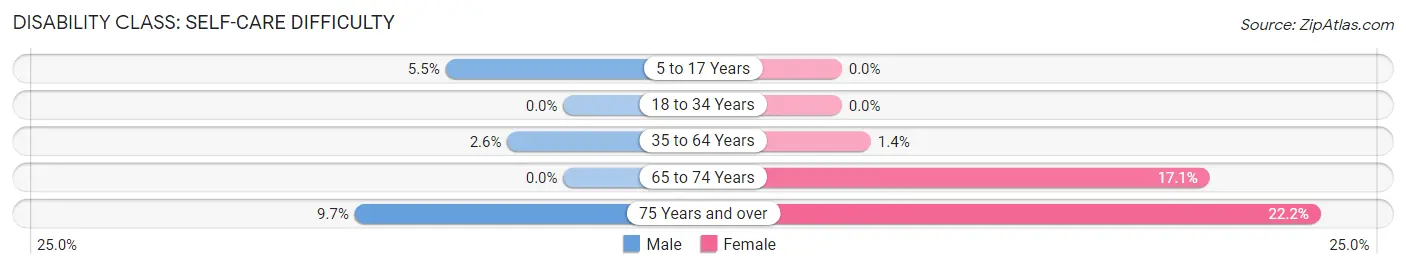
| Age Bracket | Male | Female |
| 5 to 17 Years | 7 (5.5%) | 0 (0.0%) |
| 18 to 34 Years | 0 (0.0%) | 0 (0.0%) |
| 35 to 64 Years | 4 (2.6%) | 2 (1.3%) |
| 65 to 74 Years | 0 (0.0%) | 7 (17.1%) |
| 75 Years and over | 3 (9.7%) | 2 (22.2%) |
Technology Access in Rockvale
Computing Device Access in Rockvale
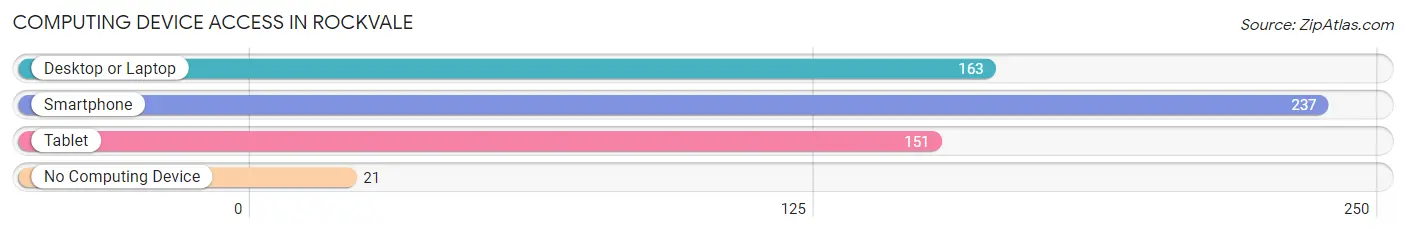
| Device Type | # Households | % Households |
| Desktop or Laptop | 163 | 59.9% |
| Smartphone | 237 | 87.1% |
| Tablet | 151 | 55.5% |
| No Computing Device | 21 | 7.7% |
| Total | 272 | 100.0% |
Internet Access in Rockvale
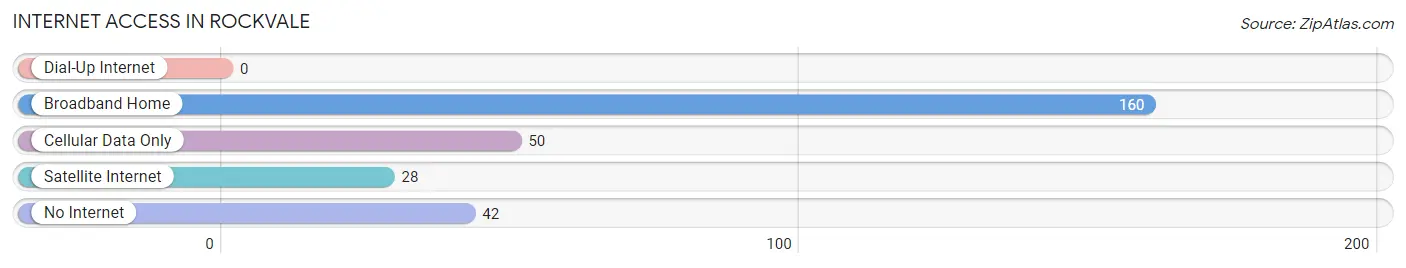
| Internet Type | # Households | % Households |
| Dial-Up Internet | 0 | 0.0% |
| Broadband Home | 160 | 58.8% |
| Cellular Data Only | 50 | 18.4% |
| Satellite Internet | 28 | 10.3% |
| No Internet | 42 | 15.4% |
| Total | 272 | 100.0% |
Rockvale Summary
Rockvale, Colorado is a small unincorporated community located in Fremont County, Colorado. It is situated in the Wet Mountain Valley, approximately 10 miles south of Canon City and 25 miles west of Pueblo. The population of Rockvale was estimated to be around 200 in 2020.
History
Rockvale was founded in 1881 by a group of miners who were searching for gold in the area. The town was named after the nearby rock formations. The miners found some gold, but it was not enough to sustain the town. The miners moved on, leaving the town behind.
In the early 1900s, Rockvale became a farming community. The town was home to several small farms, and the residents grew a variety of crops, including wheat, corn, and hay. The town also had a small sawmill and a general store.
In the 1950s, Rockvale began to experience a population decline as many of the residents moved away in search of better opportunities. The town was nearly abandoned by the 1970s, but a few residents remained.
Geography
Rockvale is located in the Wet Mountain Valley, which is part of the Rocky Mountains. The town is situated at an elevation of 6,890 feet above sea level. The area is known for its scenic beauty, with rolling hills, lush forests, and stunning mountain views.
The town is located near the Arkansas River, which provides a source of recreation for the residents. The river is also a popular spot for fishing and rafting.
Economy
Rockvale is a small, rural community with a limited economy. The town is home to a few small businesses, including a general store, a gas station, and a few restaurants. The town also has a post office and a library.
The town is also home to a few small farms, which produce hay, wheat, and other crops. The town is also home to a few small ranches, which raise cattle and horses.
Demographics
The population of Rockvale was estimated to be around 200 in 2020. The town is predominantly white, with a small Hispanic population. The median household income in Rockvale is around $35,000, which is lower than the national average.
Conclusion
Rockvale, Colorado is a small, rural community located in the Wet Mountain Valley. The town was founded in 1881 by miners searching for gold, but the town never flourished. In the early 1900s, the town became a farming community, and it has remained a small, rural community ever since. The town is home to a few small businesses, farms, and ranches, and the population is estimated to be around 200.
Common Questions
What is Per Capita Income in Rockvale?
Per Capita income in Rockvale is $23,999.
What is the Median Family Income in Rockvale?
Median Family Income in Rockvale is $56,600.
What is the Median Household income in Rockvale?
Median Household Income in Rockvale is $54,091.
What is Inequality or Gini Index in Rockvale?
Inequality or Gini Index in Rockvale is 0.37.
What is the Total Population of Rockvale?
Total Population of Rockvale is 683.
What is the Total Male Population of Rockvale?
Total Male Population of Rockvale is 426.
What is the Total Female Population of Rockvale?
Total Female Population of Rockvale is 257.
What is the Ratio of Males per 100 Females in Rockvale?
There are 165.76 Males per 100 Females in Rockvale.
What is the Ratio of Females per 100 Males in Rockvale?
There are 60.33 Females per 100 Males in Rockvale.
What is the Median Population Age in Rockvale?
Median Population Age in Rockvale is 45.0 Years.
What is the Average Family Size in Rockvale
Average Family Size in Rockvale is 3.2 People.
What is the Average Household Size in Rockvale
Average Household Size in Rockvale is 2.5 People.
How Large is the Labor Force in Rockvale?
There are 276 People in the Labor Forcein in Rockvale.
What is the Percentage of People in the Labor Force in Rockvale?
48.8% of People are in the Labor Force in Rockvale.
What is the Unemployment Rate in Rockvale?
Unemployment Rate in Rockvale is 7.6%.