Divide, CO Map & Demographics
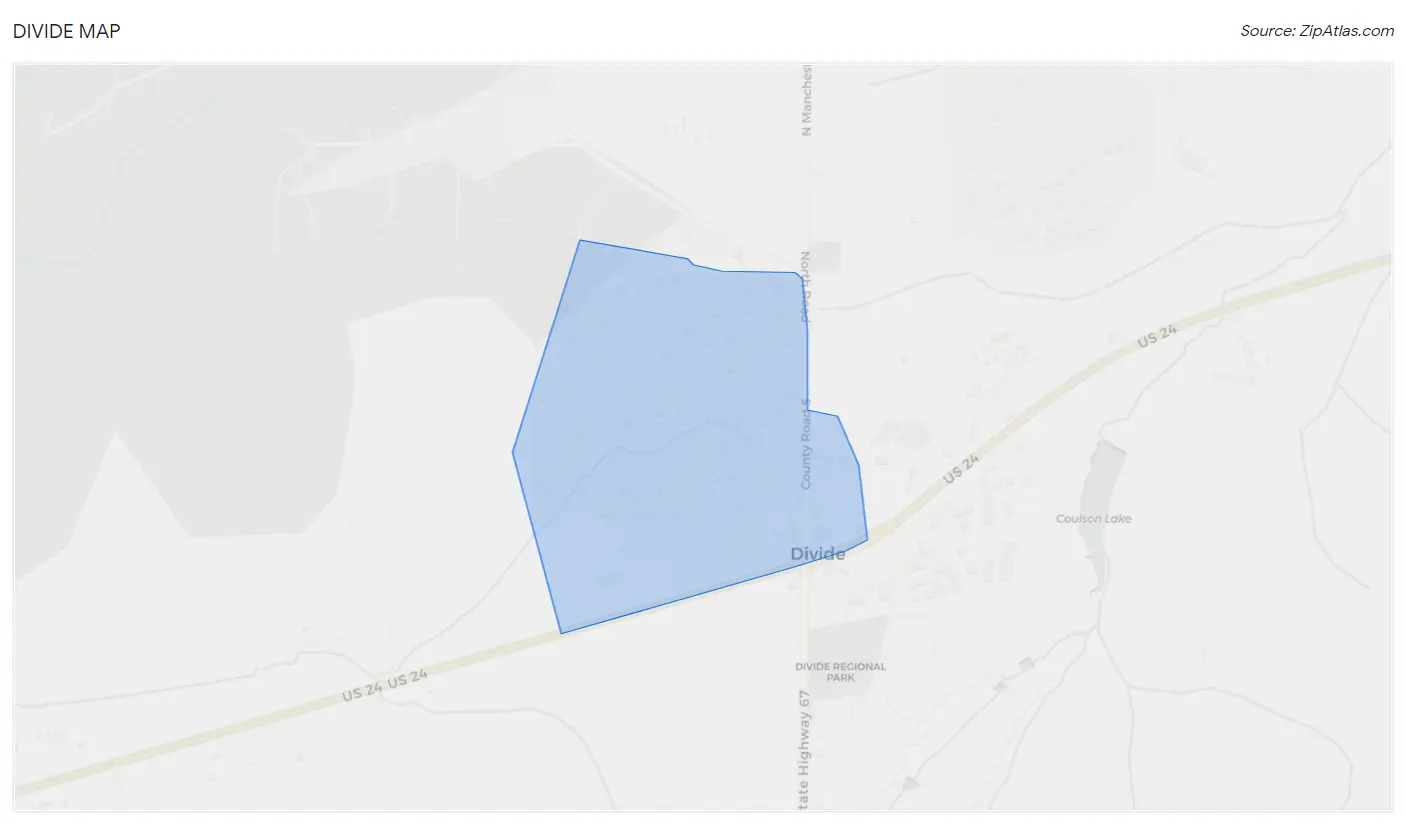
Divide Map
Divide Overview
$71,134
PER CAPITA INCOME
$70,294
AVG HOUSEHOLD INCOME
0.23
INEQUALITY / GINI INDEX
140
TOTAL POPULATION
131
MALE POPULATION
9
FEMALE POPULATION
1,455.56
MALES / 100 FEMALES
6.87
FEMALES / 100 MALES
46.7
MEDIAN AGE
21.0
AVG FAMILY SIZE
3.5
AVG HOUSEHOLD SIZE
113
LABOR FORCE [ PEOPLE ]
80.7%
PERCENT IN LABOR FORCE
Divide Zip Codes
Divide Area Codes
Income in Divide
Income Overview in Divide
| Characteristic | Number | Measure |
| Per Capita Income | 140 | $71,134 |
| Median Family Income | 5 | $0 |
| Mean Family Income | 5 | $0 |
| Median Household Income | 40 | $70,294 |
| Mean Household Income | 40 | $63,978 |
| Income Deficit | 5 | $0 |
| Wage / Income Gap (%) | 140 | 0.00% |
| Wage / Income Gap ($) | 140 | 100.00¢ per $1 |
| Gini / Inequality Index | 140 | 0.23 |
Earnings by Sex in Divide
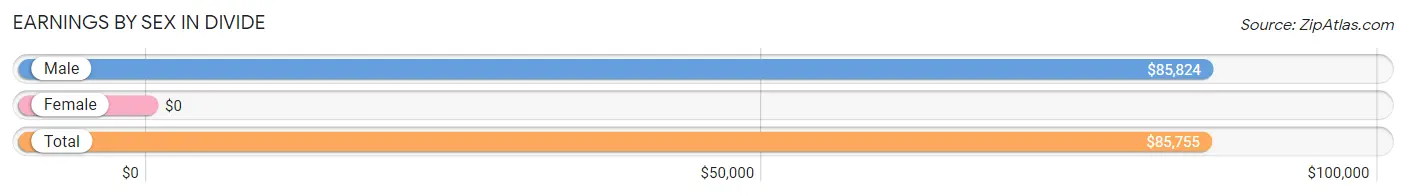
| Sex | Number | Average Earnings |
| Male | 122 (96.1%) | $85,824 |
| Female | 5 (3.9%) | $0 |
| Total | 127 (100.0%) | $85,755 |
Earnings by Sex by Income Bracket in Divide
The most common earnings brackets in Divide are $75,000 to $99,999 for men (91 | 74.6%) and $35,000 to $39,999 for women (5 | 100.0%).
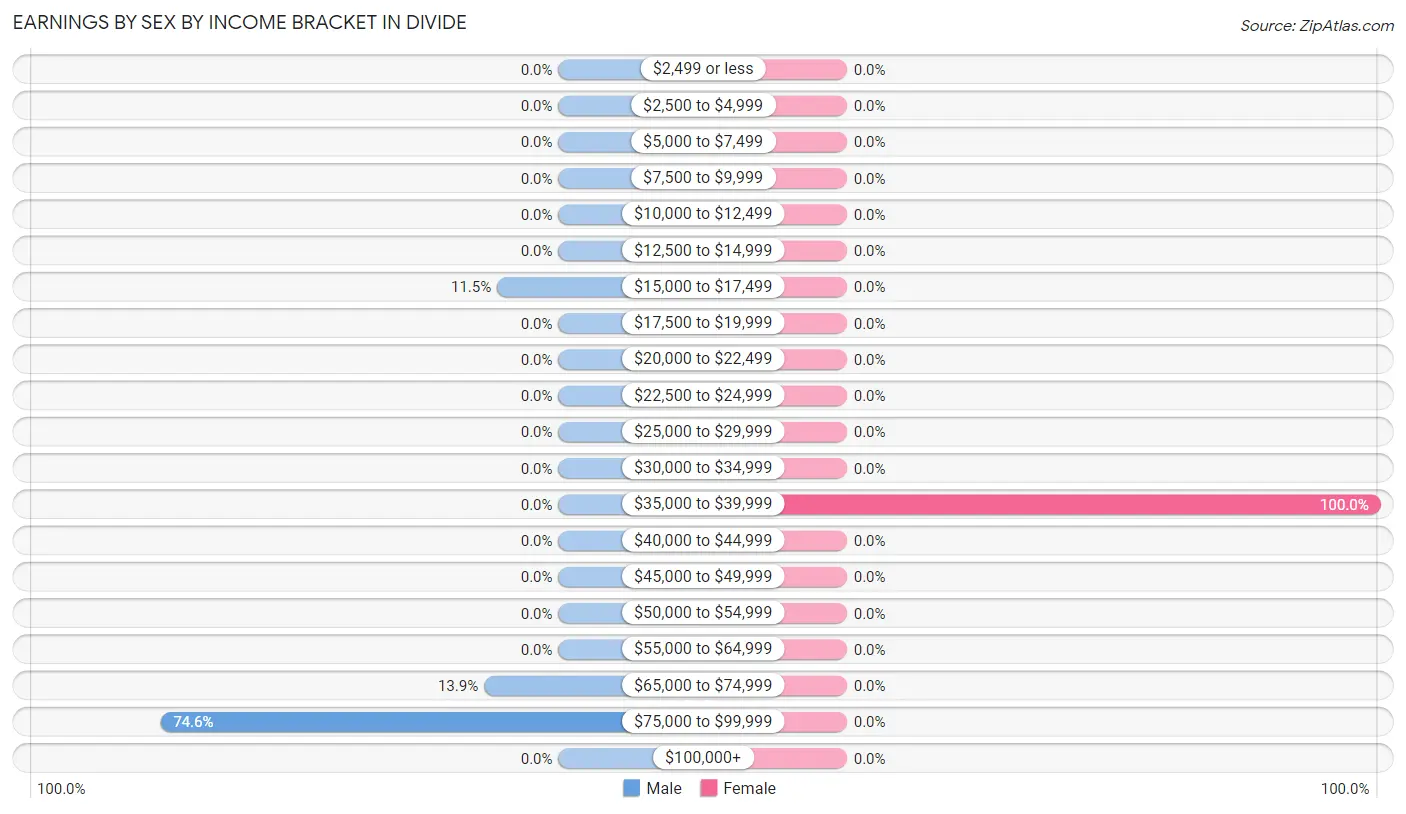
| Income | Male | Female |
| $2,499 or less | 0 (0.0%) | 0 (0.0%) |
| $2,500 to $4,999 | 0 (0.0%) | 0 (0.0%) |
| $5,000 to $7,499 | 0 (0.0%) | 0 (0.0%) |
| $7,500 to $9,999 | 0 (0.0%) | 0 (0.0%) |
| $10,000 to $12,499 | 0 (0.0%) | 0 (0.0%) |
| $12,500 to $14,999 | 0 (0.0%) | 0 (0.0%) |
| $15,000 to $17,499 | 14 (11.5%) | 0 (0.0%) |
| $17,500 to $19,999 | 0 (0.0%) | 0 (0.0%) |
| $20,000 to $22,499 | 0 (0.0%) | 0 (0.0%) |
| $22,500 to $24,999 | 0 (0.0%) | 0 (0.0%) |
| $25,000 to $29,999 | 0 (0.0%) | 0 (0.0%) |
| $30,000 to $34,999 | 0 (0.0%) | 0 (0.0%) |
| $35,000 to $39,999 | 0 (0.0%) | 5 (100.0%) |
| $40,000 to $44,999 | 0 (0.0%) | 0 (0.0%) |
| $45,000 to $49,999 | 0 (0.0%) | 0 (0.0%) |
| $50,000 to $54,999 | 0 (0.0%) | 0 (0.0%) |
| $55,000 to $64,999 | 0 (0.0%) | 0 (0.0%) |
| $65,000 to $74,999 | 17 (13.9%) | 0 (0.0%) |
| $75,000 to $99,999 | 91 (74.6%) | 0 (0.0%) |
| $100,000+ | 0 (0.0%) | 0 (0.0%) |
| Total | 122 (100.0%) | 5 (100.0%) |
Earnings by Sex by Educational Attainment in Divide
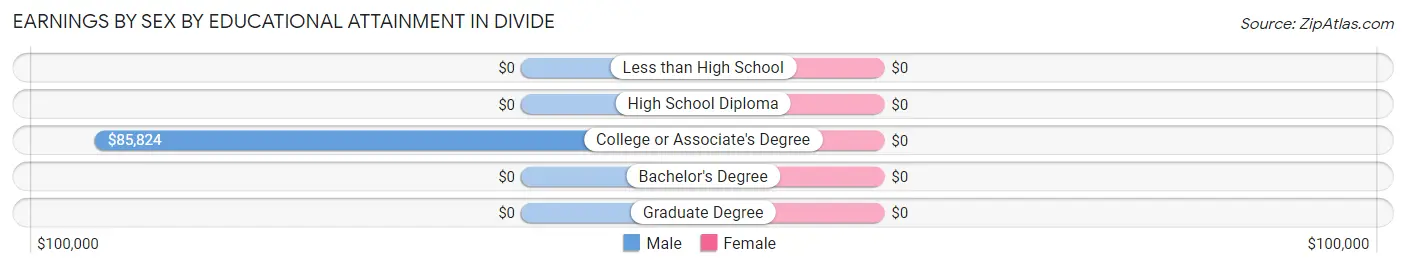
| Educational Attainment | Male Income | Female Income |
| Less than High School | - | - |
| High School Diploma | - | - |
| College or Associate's Degree | $85,824 | $0 |
| Bachelor's Degree | - | - |
| Graduate Degree | - | - |
| Total | $85,824 | $0 |
Family Income in Divide
Family Income Brackets in Divide
According to the Divide family income data, there are 5 families falling into the $100,000 to $149,999 income range, which is the most common income bracket and makes up 100.0% of all families.
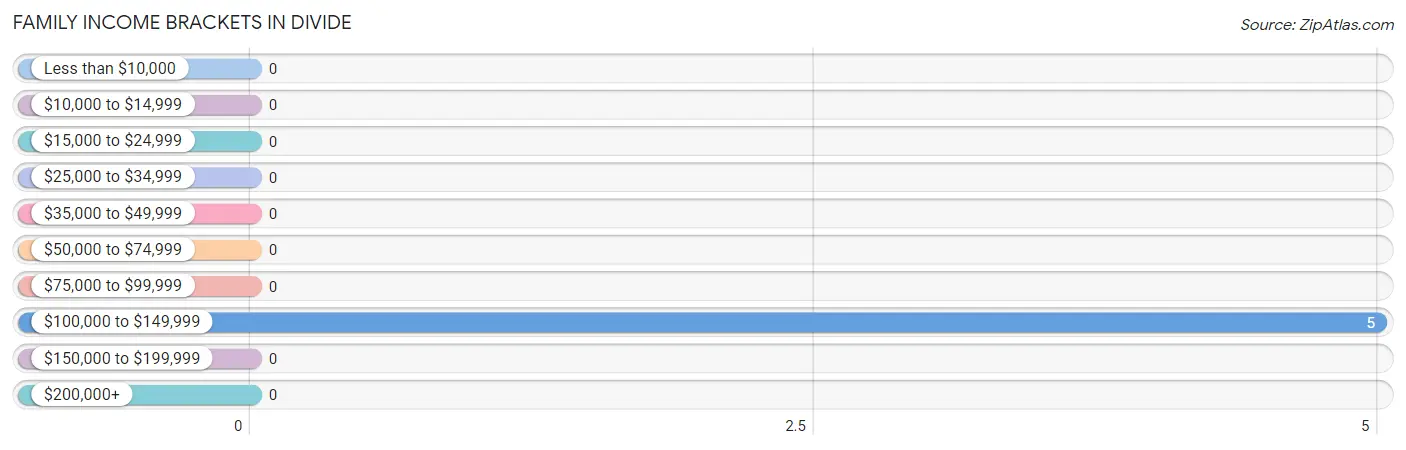
| Income Bracket | # Families | % Families |
| Less than $10,000 | 0 | 0.0% |
| $10,000 to $14,999 | 0 | 0.0% |
| $15,000 to $24,999 | 0 | 0.0% |
| $25,000 to $34,999 | 0 | 0.0% |
| $35,000 to $49,999 | 0 | 0.0% |
| $50,000 to $74,999 | 0 | 0.0% |
| $75,000 to $99,999 | 0 | 0.0% |
| $100,000 to $149,999 | 5 | 100.0% |
| $150,000 to $199,999 | 0 | 0.0% |
| $200,000+ | 0 | 0.0% |
Family Income by Famaliy Size in Divide
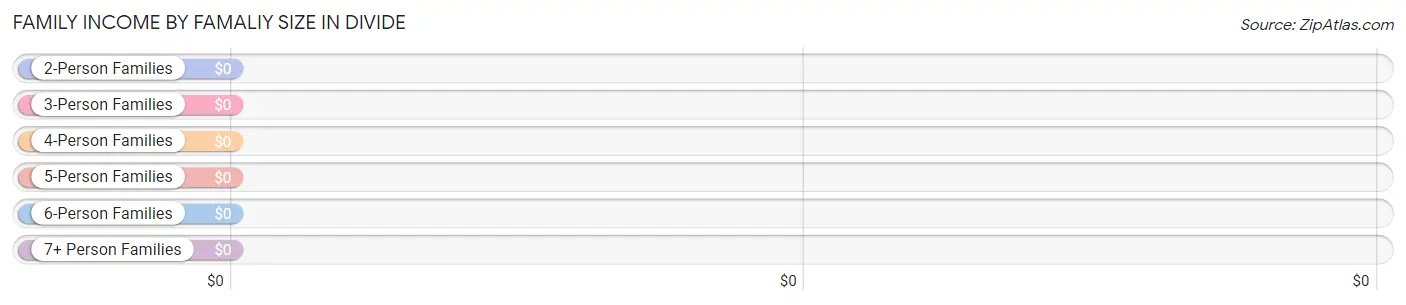
| Income Bracket | # Families | Median Income |
| 2-Person Families | 0 (0.0%) | $0 |
| 3-Person Families | 5 (100.0%) | $0 |
| 4-Person Families | 0 (0.0%) | $0 |
| 5-Person Families | 0 (0.0%) | $0 |
| 6-Person Families | 0 (0.0%) | $0 |
| 7+ Person Families | 0 (0.0%) | $0 |
| Total | 5 (100.0%) | $0 |
Family Income by Number of Earners in Divide
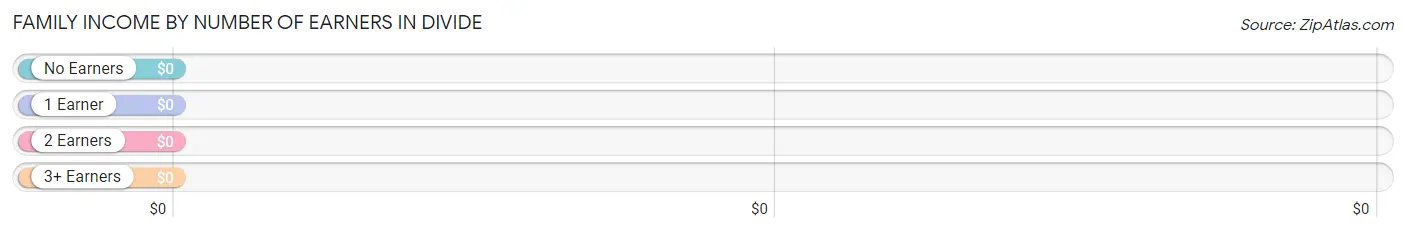
| Number of Earners | # Families | Median Income |
| No Earners | 0 (0.0%) | $0 |
| 1 Earner | 0 (0.0%) | $0 |
| 2 Earners | 5 (100.0%) | $0 |
| 3+ Earners | 0 (0.0%) | $0 |
| Total | 5 (100.0%) | $0 |
Household Income in Divide
Household Income Brackets in Divide
With 17 households falling in the category, the $50,000 to $74,999 income range is the most frequent in Divide, accounting for 42.5% of all households.
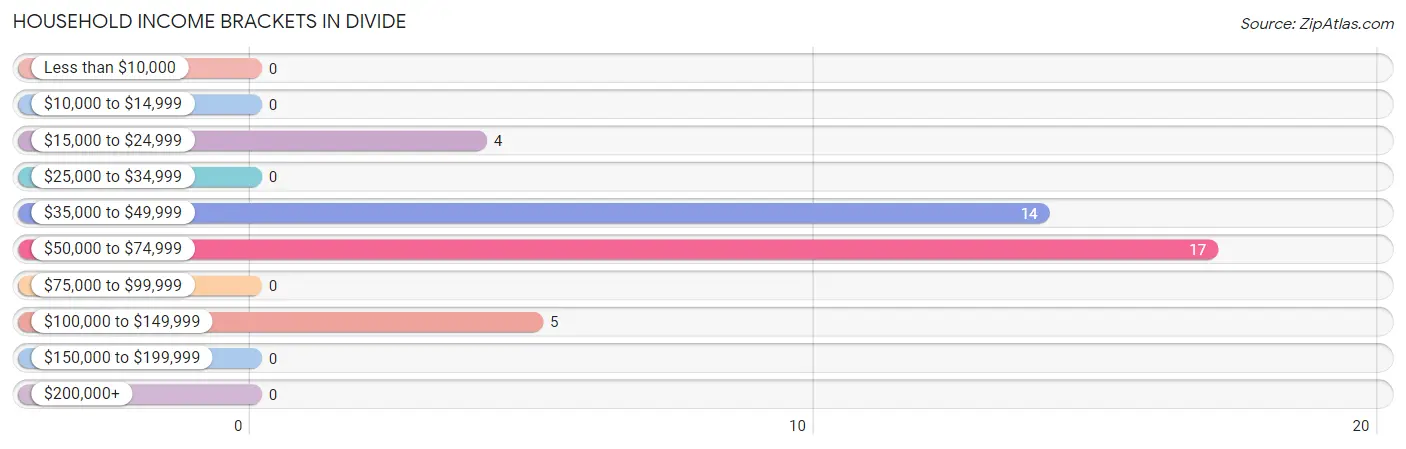
| Income Bracket | # Households | % Households |
| Less than $10,000 | 0 | 0.0% |
| $10,000 to $14,999 | 0 | 0.0% |
| $15,000 to $24,999 | 4 | 10.0% |
| $25,000 to $34,999 | 0 | 0.0% |
| $35,000 to $49,999 | 14 | 35.0% |
| $50,000 to $74,999 | 17 | 42.5% |
| $75,000 to $99,999 | 0 | 0.0% |
| $100,000 to $149,999 | 5 | 12.5% |
| $150,000 to $199,999 | 0 | 0.0% |
| $200,000+ | 0 | 0.0% |
Household Income by Householder Age in Divide
The median household income in Divide is $70,294, with the highest median household income of $49,911 found in the 65+ years age bracket for the primary householder. A total of 35 households (87.5%) fall into this category.
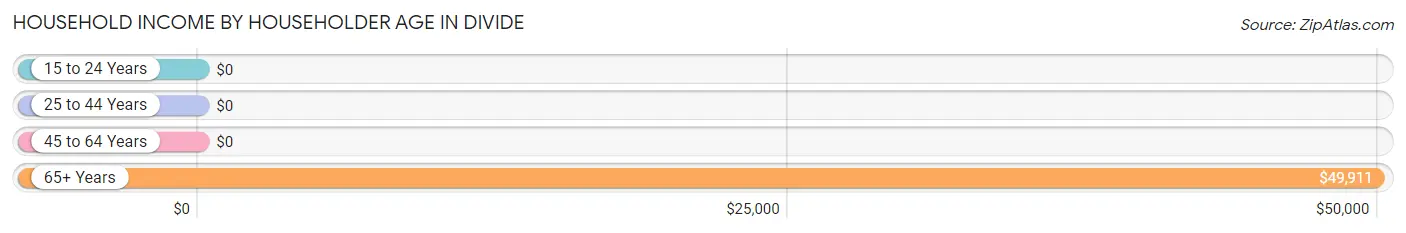
| Income Bracket | # Households | Median Income |
| 15 to 24 Years | 0 (0.0%) | $0 |
| 25 to 44 Years | 0 (0.0%) | $0 |
| 45 to 64 Years | 5 (12.5%) | $0 |
| 65+ Years | 35 (87.5%) | $49,911 |
| Total | 40 (100.0%) | $70,294 |
Poverty in Divide
Income Below Poverty by Sex and Age in Divide
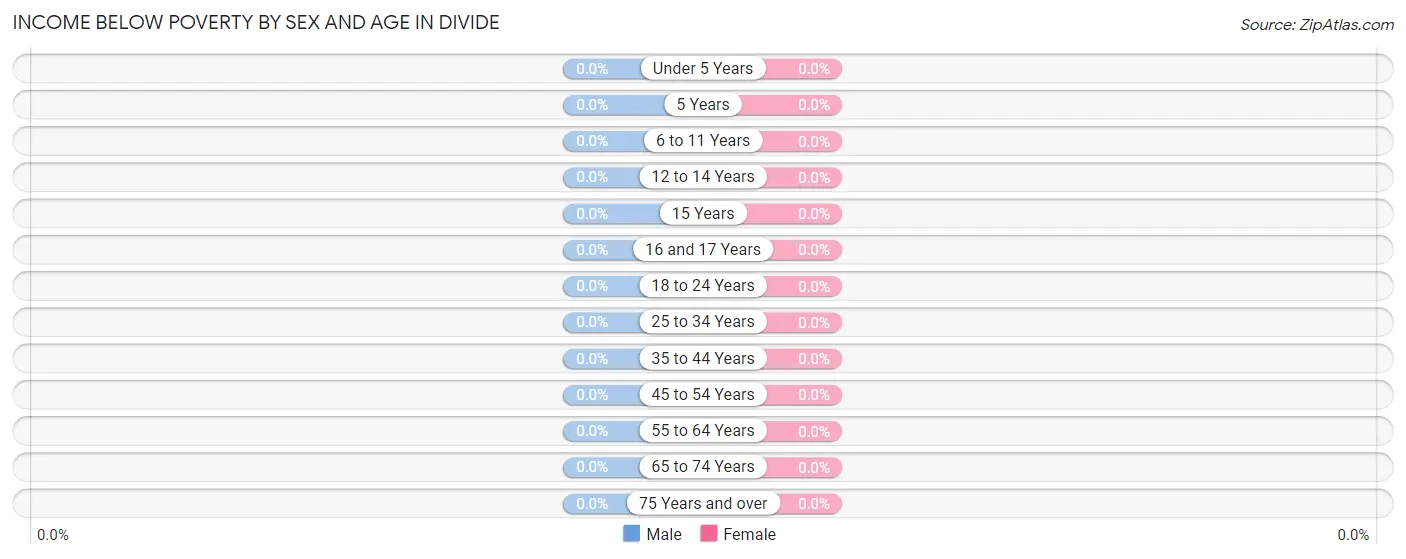
| Age Bracket | Male | Female |
| Under 5 Years | 0 (0.0%) | 0 (0.0%) |
| 5 Years | 0 (0.0%) | 0 (0.0%) |
| 6 to 11 Years | 0 (0.0%) | 0 (0.0%) |
| 12 to 14 Years | 0 (0.0%) | 0 (0.0%) |
| 15 Years | 0 (0.0%) | 0 (0.0%) |
| 16 and 17 Years | 0 (0.0%) | 0 (0.0%) |
| 18 to 24 Years | 0 (0.0%) | 0 (0.0%) |
| 25 to 34 Years | 0 (0.0%) | 0 (0.0%) |
| 35 to 44 Years | 0 (0.0%) | 0 (0.0%) |
| 45 to 54 Years | 0 (0.0%) | 0 (0.0%) |
| 55 to 64 Years | 0 (0.0%) | 0 (0.0%) |
| 65 to 74 Years | 0 (0.0%) | 0 (0.0%) |
| 75 Years and over | 0 (0.0%) | 0 (0.0%) |
| Total | 0 (0.0%) | 0 (0.0%) |
Income Above Poverty by Sex and Age in Divide
According to the poverty statistics in Divide, males aged 18 to 24 years and females aged 45 to 54 years are the age groups that are most secure financially, with 100.0% of males and 100.0% of females in these age groups living above the poverty line.
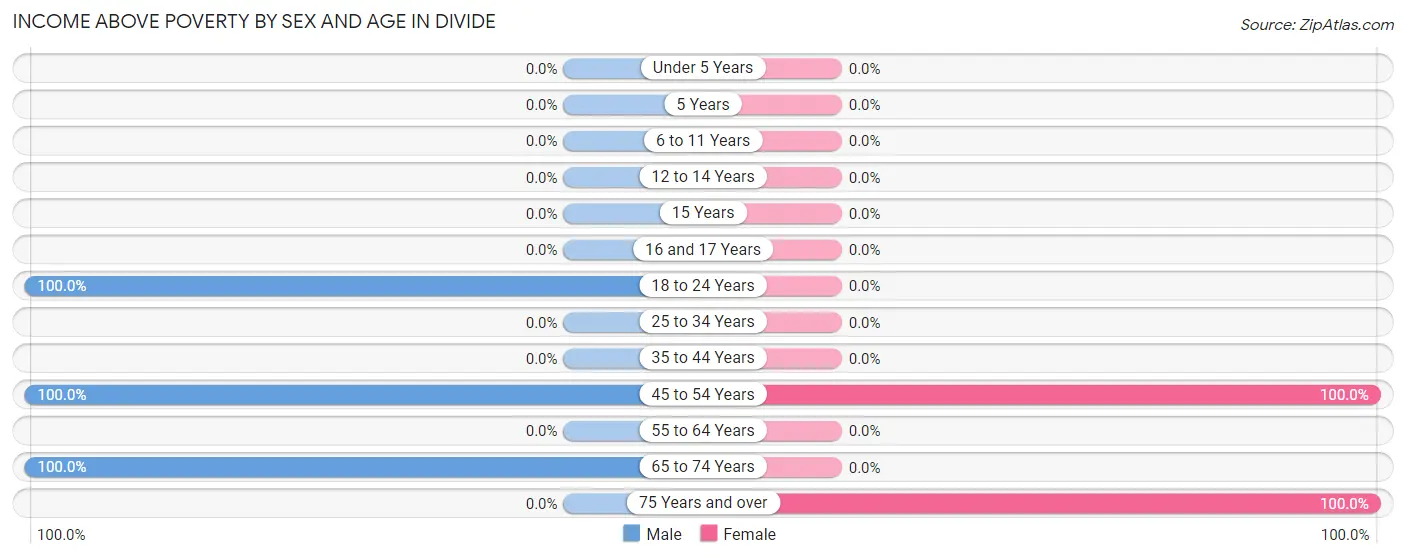
| Age Bracket | Male | Female |
| Under 5 Years | 0 (0.0%) | 0 (0.0%) |
| 5 Years | 0 (0.0%) | 0 (0.0%) |
| 6 to 11 Years | 0 (0.0%) | 0 (0.0%) |
| 12 to 14 Years | 0 (0.0%) | 0 (0.0%) |
| 15 Years | 0 (0.0%) | 0 (0.0%) |
| 16 and 17 Years | 0 (0.0%) | 0 (0.0%) |
| 18 to 24 Years | 9 (100.0%) | 0 (0.0%) |
| 25 to 34 Years | 0 (0.0%) | 0 (0.0%) |
| 35 to 44 Years | 0 (0.0%) | 0 (0.0%) |
| 45 to 54 Years | 91 (100.0%) | 5 (100.0%) |
| 55 to 64 Years | 0 (0.0%) | 0 (0.0%) |
| 65 to 74 Years | 31 (100.0%) | 0 (0.0%) |
| 75 Years and over | 0 (0.0%) | 4 (100.0%) |
| Total | 131 (100.0%) | 9 (100.0%) |
Income Below Poverty Among Married-Couple Families in Divide
| Children | Above Poverty | Below Poverty |
| No Children | 5 (100.0%) | 0 (0.0%) |
| 1 or 2 Children | 0 (0.0%) | 0 (0.0%) |
| 3 or 4 Children | 0 (0.0%) | 0 (0.0%) |
| 5 or more Children | 0 (0.0%) | 0 (0.0%) |
| Total | 5 (100.0%) | 0 (0.0%) |
Income Below Poverty Among Single-Parent Households in Divide
| Children | Single Father | Single Mother |
| No Children | 0 (0.0%) | 0 (0.0%) |
| 1 or 2 Children | 0 (0.0%) | 0 (0.0%) |
| 3 or 4 Children | 0 (0.0%) | 0 (0.0%) |
| 5 or more Children | 0 (0.0%) | 0 (0.0%) |
| Total | 0 (0.0%) | 0 (0.0%) |
Income Below Poverty Among Married-Couple vs Single-Parent Households in Divide
| Children | Married-Couple Families | Single-Parent Households |
| No Children | 0 (0.0%) | 0 (0.0%) |
| 1 or 2 Children | 0 (0.0%) | 0 (0.0%) |
| 3 or 4 Children | 0 (0.0%) | 0 (0.0%) |
| 5 or more Children | 0 (0.0%) | 0 (0.0%) |
| Total | 0 (0.0%) | 0 (0.0%) |
Race in Divide
The most populous races in Divide are Hispanic or Latino (91 | 65.0%), Native / Alaskan (91 | 65.0%), and White / Caucasian (49 | 35.0%).
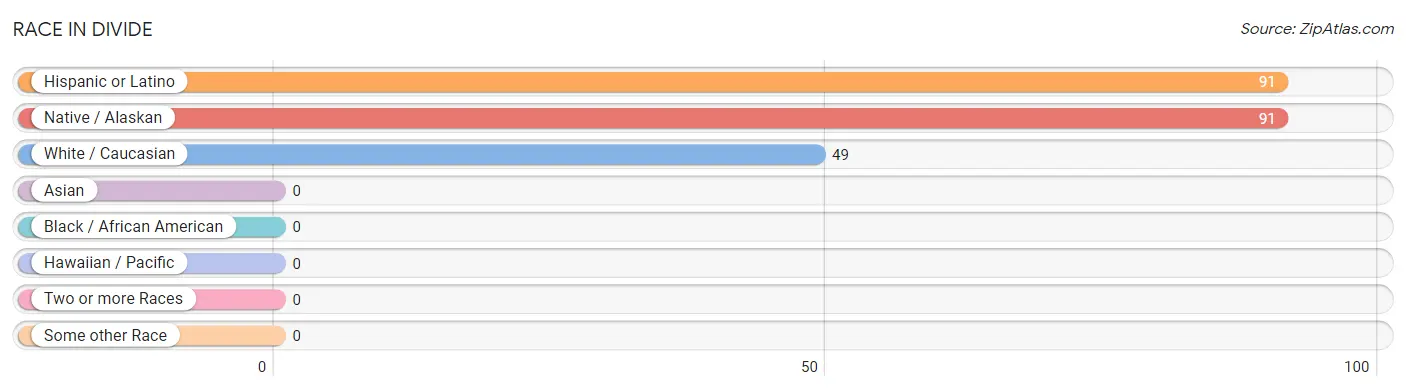
| Race | # Population | % Population |
| Asian | 0 | 0.0% |
| Black / African American | 0 | 0.0% |
| Hawaiian / Pacific | 0 | 0.0% |
| Hispanic or Latino | 91 | 65.0% |
| Native / Alaskan | 91 | 65.0% |
| White / Caucasian | 49 | 35.0% |
| Two or more Races | 0 | 0.0% |
| Some other Race | 0 | 0.0% |
| Total | 140 | 100.0% |
Ancestry in Divide
The most populous ancestries reported in Divide are English (17 | 12.1%), German (17 | 12.1%), Irish (14 | 10.0%), and Italian (14 | 10.0%), together accounting for 44.3% of all Divide residents.
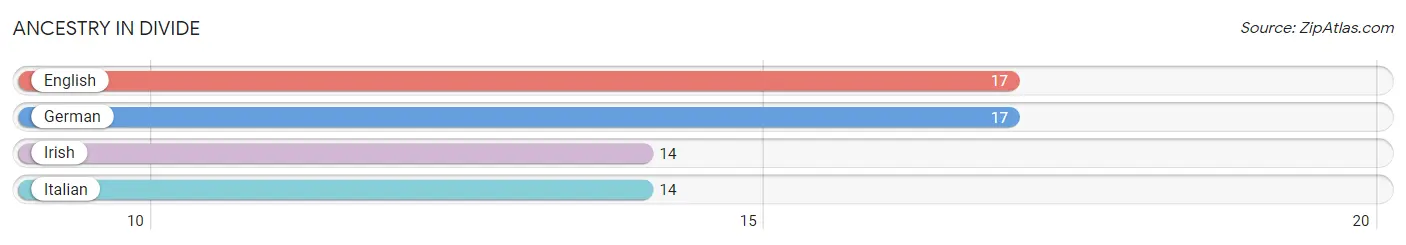
| Ancestry | # Population | % Population |
| English | 17 | 12.1% |
| German | 17 | 12.1% |
| Irish | 14 | 10.0% |
| Italian | 14 | 10.0% | View All 4 Rows |
Immigrants in Divide

| Immigration Origin | # Population | % Population | View All 0 Rows |
Sex and Age in Divide
Sex and Age in Divide
The most populous age groups in Divide are 45 to 49 Years (91 | 69.5%) for men and 45 to 49 Years (5 | 55.6%) for women.
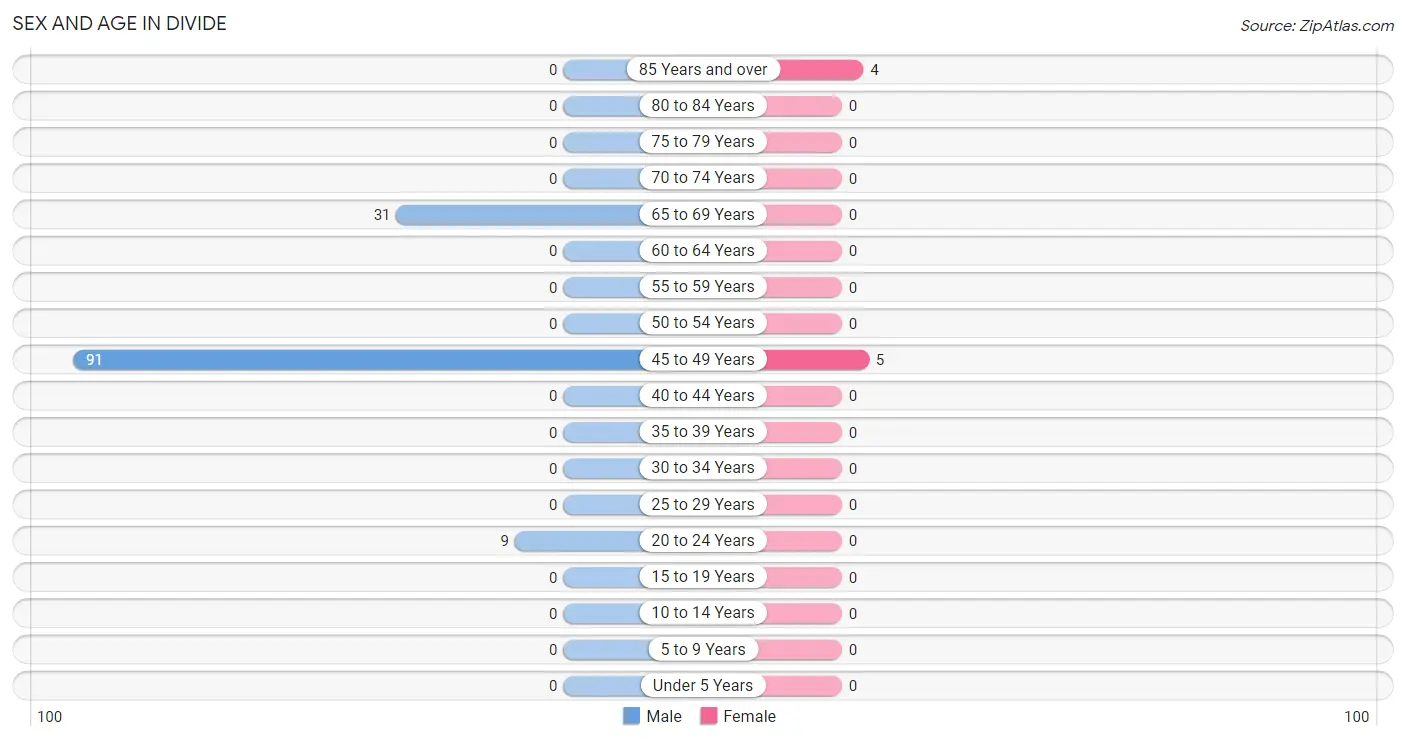
| Age Bracket | Male | Female |
| Under 5 Years | 0 (0.0%) | 0 (0.0%) |
| 5 to 9 Years | 0 (0.0%) | 0 (0.0%) |
| 10 to 14 Years | 0 (0.0%) | 0 (0.0%) |
| 15 to 19 Years | 0 (0.0%) | 0 (0.0%) |
| 20 to 24 Years | 9 (6.9%) | 0 (0.0%) |
| 25 to 29 Years | 0 (0.0%) | 0 (0.0%) |
| 30 to 34 Years | 0 (0.0%) | 0 (0.0%) |
| 35 to 39 Years | 0 (0.0%) | 0 (0.0%) |
| 40 to 44 Years | 0 (0.0%) | 0 (0.0%) |
| 45 to 49 Years | 91 (69.5%) | 5 (55.6%) |
| 50 to 54 Years | 0 (0.0%) | 0 (0.0%) |
| 55 to 59 Years | 0 (0.0%) | 0 (0.0%) |
| 60 to 64 Years | 0 (0.0%) | 0 (0.0%) |
| 65 to 69 Years | 31 (23.7%) | 0 (0.0%) |
| 70 to 74 Years | 0 (0.0%) | 0 (0.0%) |
| 75 to 79 Years | 0 (0.0%) | 0 (0.0%) |
| 80 to 84 Years | 0 (0.0%) | 0 (0.0%) |
| 85 Years and over | 0 (0.0%) | 4 (44.4%) |
| Total | 131 (100.0%) | 9 (100.0%) |
Families and Households in Divide
Median Family Size in Divide
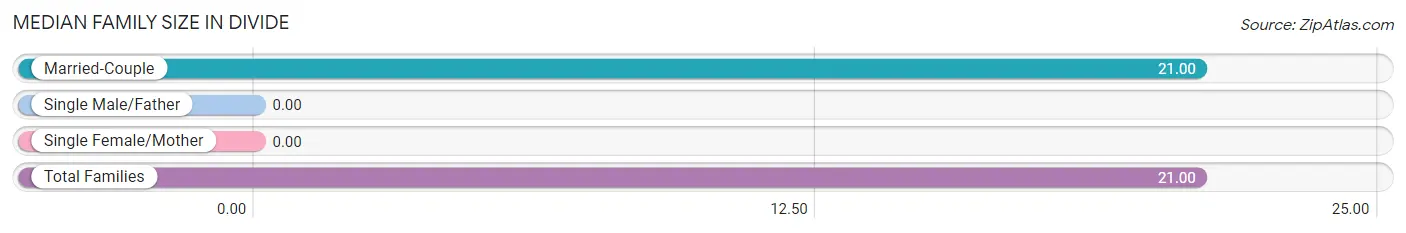
| Family Type | # Families | Family Size |
| Married-Couple | 5 (100.0%) | 21.00 |
| Single Male/Father | 0 (0.0%) | - |
| Single Female/Mother | 0 (0.0%) | - |
| Total Families | 5 (100.0%) | 21.00 |
Median Household Size in Divide
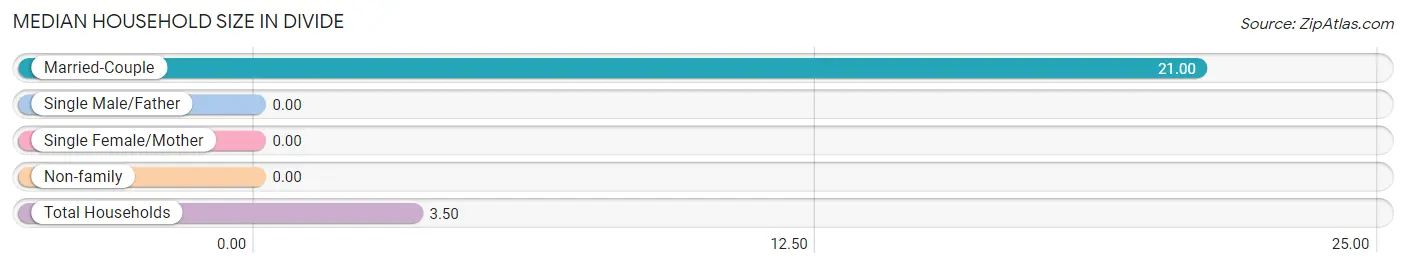
| Household Type | # Households | Household Size |
| Married-Couple | 5 (12.5%) | 21.00 |
| Single Male/Father | 0 (0.0%) | - |
| Single Female/Mother | 0 (0.0%) | - |
| Non-family | 35 (87.5%) | - |
| Total Households | 40 (100.0%) | 3.50 |
Household Size by Marriage Status in Divide
Out of a total of 40 households in Divide, 5 (12.5%) are family households, while 35 (87.5%) are nonfamily households. The most numerous type of family households are 3-person households, comprising 5, and the most common type of nonfamily households are 1-person households, comprising 35.
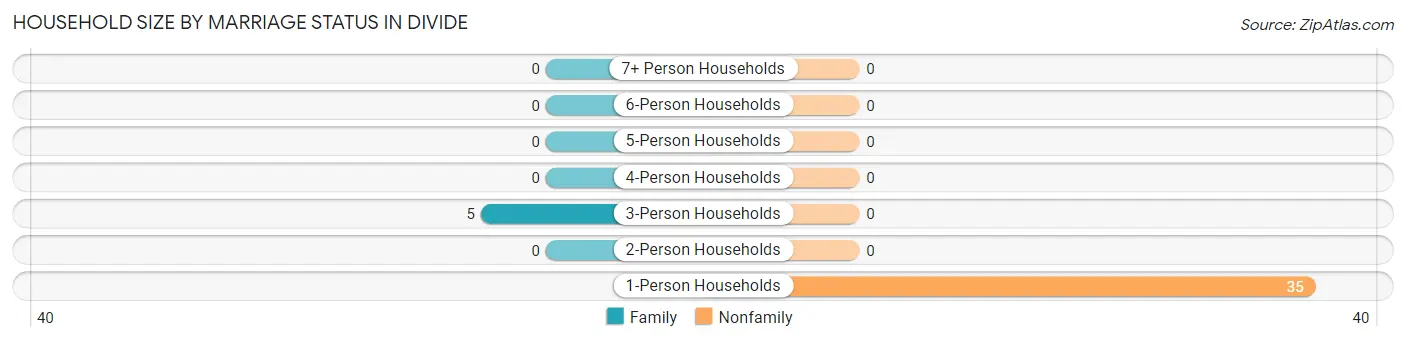
| Household Size | Family Households | Nonfamily Households |
| 1-Person Households | - | 35 (87.5%) |
| 2-Person Households | 0 (0.0%) | 0 (0.0%) |
| 3-Person Households | 5 (12.5%) | 0 (0.0%) |
| 4-Person Households | 0 (0.0%) | 0 (0.0%) |
| 5-Person Households | 0 (0.0%) | 0 (0.0%) |
| 6-Person Households | 0 (0.0%) | 0 (0.0%) |
| 7+ Person Households | 0 (0.0%) | 0 (0.0%) |
| Total | 5 (12.5%) | 35 (87.5%) |
Female Fertility in Divide
Fertility by Age in Divide
| Age Bracket | Women with Births | Births / 1,000 Women |
| 15 to 19 years | 0 (0.0%) | 0.0 |
| 20 to 34 years | 0 (0.0%) | 0.0 |
| 35 to 50 years | 0 (0.0%) | 0.0 |
| Total | 0 (0.0%) | 0.0 |
Fertility by Age by Marriage Status in Divide
| Age Bracket | Married | Unmarried |
| 15 to 19 years | 0 (0.0%) | 0 (0.0%) |
| 20 to 34 years | 0 (0.0%) | 0 (0.0%) |
| 35 to 50 years | 0 (0.0%) | 0 (0.0%) |
| Total | 0 (0.0%) | 0 (0.0%) |
Fertility by Education in Divide
| Educational Attainment | Women with Births | Births / 1,000 Women |
| Less than High School | 0 (0.0%) | 0.0 |
| High School Diploma | 0 (0.0%) | 0.0 |
| College or Associate's Degree | 0 (0.0%) | 0.0 |
| Bachelor's Degree | 0 (0.0%) | 0.0 |
| Graduate Degree | 0 (0.0%) | 0.0 |
| Total | 0 (0.0%) | 0.0 |
Fertility by Education by Marriage Status in Divide
| Educational Attainment | Married | Unmarried |
| Less than High School | 0 (0.0%) | 0 (0.0%) |
| High School Diploma | 0 (0.0%) | 0 (0.0%) |
| College or Associate's Degree | 0 (0.0%) | 0 (0.0%) |
| Bachelor's Degree | 0 (0.0%) | 0 (0.0%) |
| Graduate Degree | 0 (0.0%) | 0 (0.0%) |
| Total | 0 (0.0%) | 0 (0.0%) |
Employment Characteristics in Divide
Employment by Class of Employer in Divide
Among the 113 employed individuals in Divide, , and private company employees (113 | 100.0%) make up the most common classes of employment.
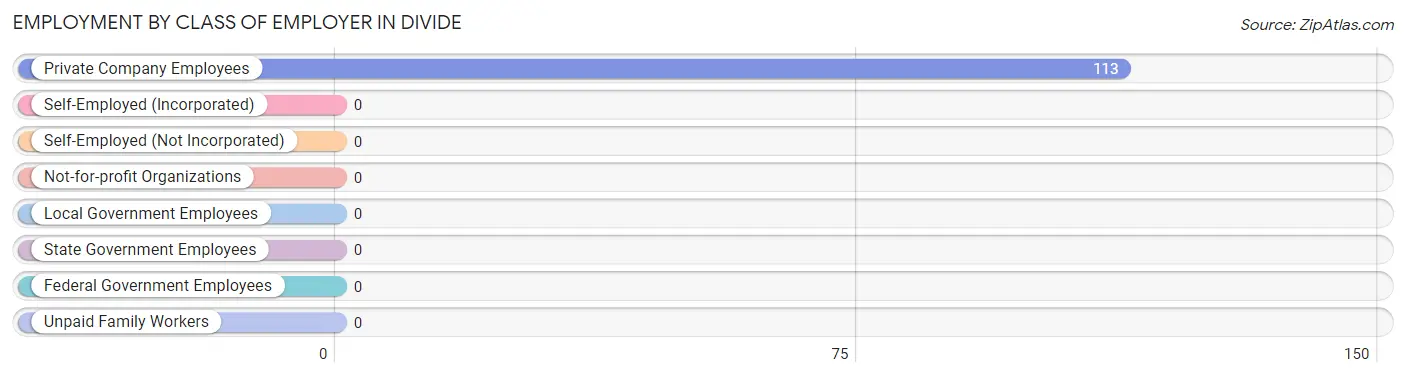
| Employer Class | # Employees | % Employees |
| Private Company Employees | 113 | 100.0% |
| Self-Employed (Incorporated) | 0 | 0.0% |
| Self-Employed (Not Incorporated) | 0 | 0.0% |
| Not-for-profit Organizations | 0 | 0.0% |
| Local Government Employees | 0 | 0.0% |
| State Government Employees | 0 | 0.0% |
| Federal Government Employees | 0 | 0.0% |
| Unpaid Family Workers | 0 | 0.0% |
| Total | 113 | 100.0% |
Employment Status by Age in Divide
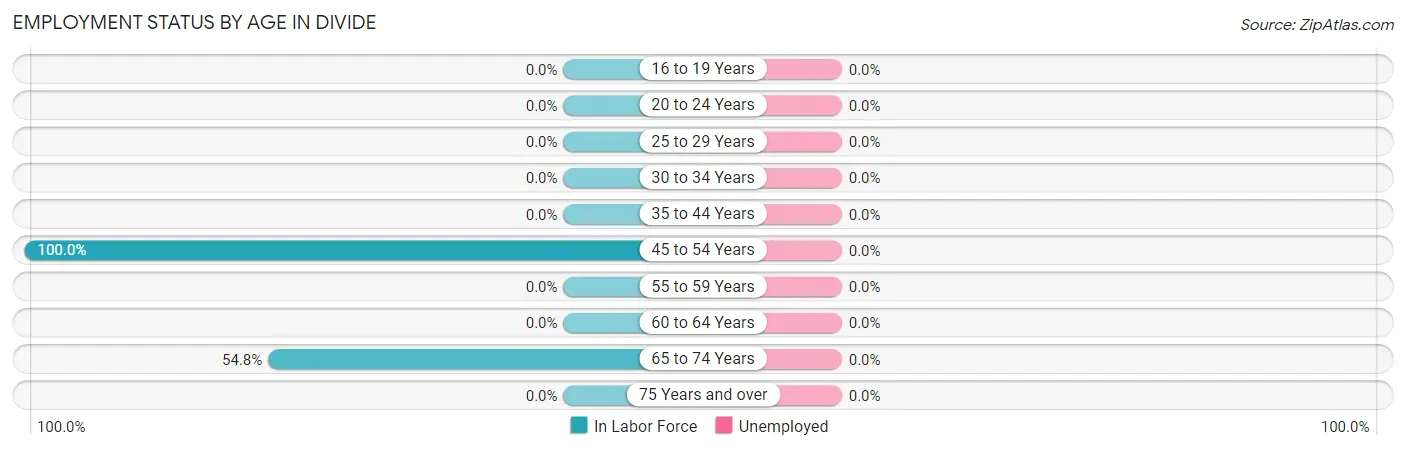
| Age Bracket | In Labor Force | Unemployed |
| 16 to 19 Years | 0 (0.0%) | 0 (0.0%) |
| 20 to 24 Years | 0 (0.0%) | 0 (0.0%) |
| 25 to 29 Years | 0 (0.0%) | 0 (0.0%) |
| 30 to 34 Years | 0 (0.0%) | 0 (0.0%) |
| 35 to 44 Years | 0 (0.0%) | 0 (0.0%) |
| 45 to 54 Years | 96 (100.0%) | 0 (0.0%) |
| 55 to 59 Years | 0 (0.0%) | 0 (0.0%) |
| 60 to 64 Years | 0 (0.0%) | 0 (0.0%) |
| 65 to 74 Years | 17 (54.8%) | 0 (0.0%) |
| 75 Years and over | 0 (0.0%) | 0 (0.0%) |
| Total | 113 (80.7%) | 0 (0.0%) |
Employment Status by Educational Attainment in Divide
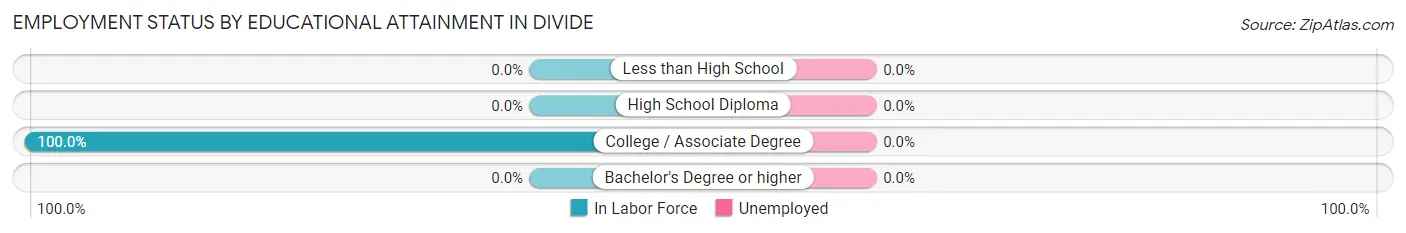
| Educational Attainment | In Labor Force | Unemployed |
| Less than High School | 0 (0.0%) | 0 (0.0%) |
| High School Diploma | 0 (0.0%) | 0 (0.0%) |
| College / Associate Degree | 96 (100.0%) | 0 (0.0%) |
| Bachelor's Degree or higher | 0 (0.0%) | 0 (0.0%) |
| Total | 96 (100.0%) | 0 (0.0%) |
Employment Occupations by Sex in Divide
Management, Business, Science and Arts Occupations
The most common Management, Business, Science and Arts occupations in Divide are Management (91 | 80.5%), Computers, Engineering & Science (17 | 15.0%), Computers & Mathematics (17 | 15.0%), and Business & Financial (5 | 4.4%).
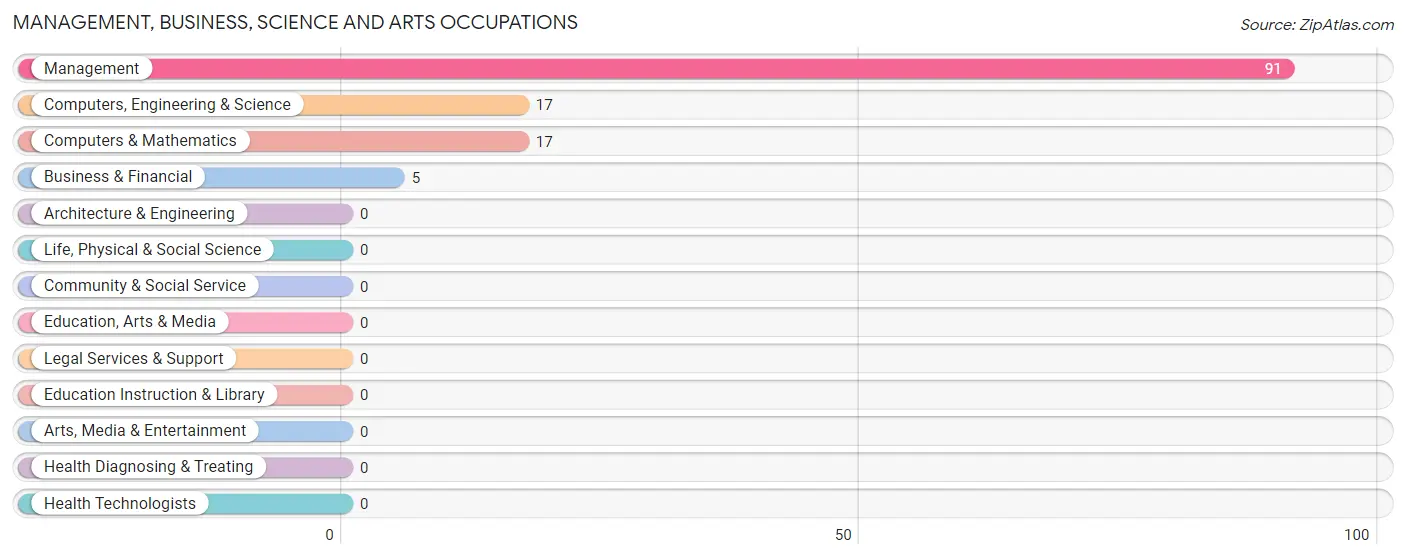
Management, Business, Science and Arts Occupations by Sex
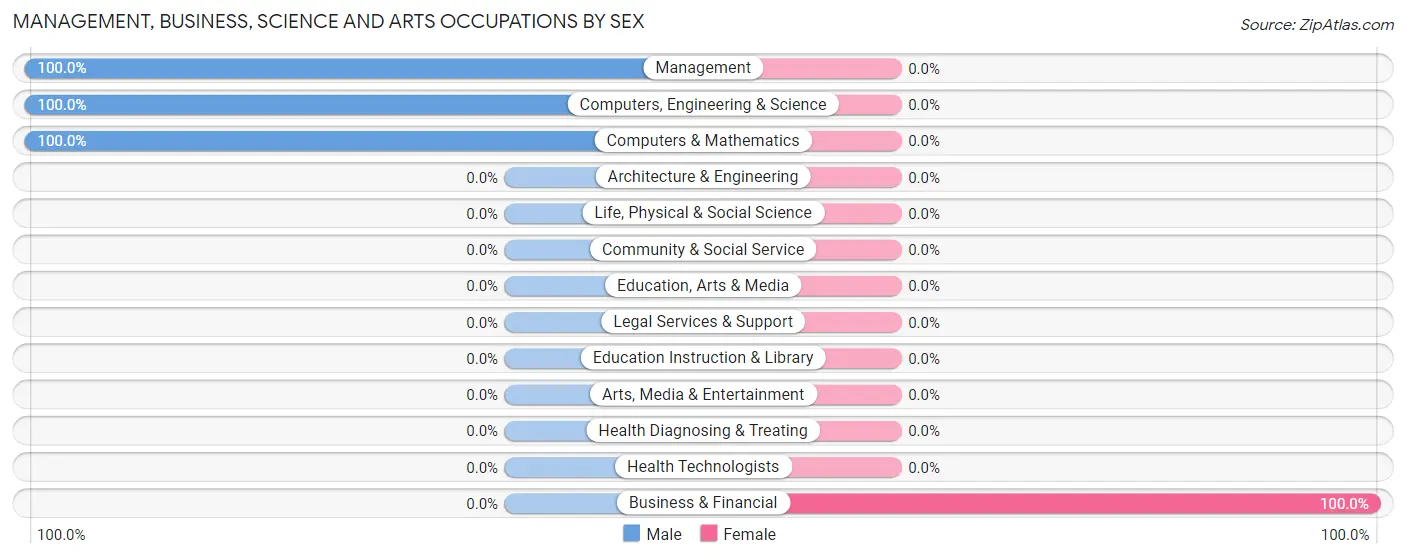
| Occupation | Male | Female |
| Management | 91 (100.0%) | 0 (0.0%) |
| Business & Financial | 0 (0.0%) | 5 (100.0%) |
| Computers, Engineering & Science | 17 (100.0%) | 0 (0.0%) |
| Computers & Mathematics | 17 (100.0%) | 0 (0.0%) |
| Architecture & Engineering | 0 (0.0%) | 0 (0.0%) |
| Life, Physical & Social Science | 0 (0.0%) | 0 (0.0%) |
| Community & Social Service | 0 (0.0%) | 0 (0.0%) |
| Education, Arts & Media | 0 (0.0%) | 0 (0.0%) |
| Legal Services & Support | 0 (0.0%) | 0 (0.0%) |
| Education Instruction & Library | 0 (0.0%) | 0 (0.0%) |
| Arts, Media & Entertainment | 0 (0.0%) | 0 (0.0%) |
| Health Diagnosing & Treating | 0 (0.0%) | 0 (0.0%) |
| Health Technologists | 0 (0.0%) | 0 (0.0%) |
| Total (Category) | 108 (95.6%) | 5 (4.4%) |
| Total (Overall) | 108 (95.6%) | 5 (4.4%) |
Services Occupations
Services Occupations by Sex
| Occupation | Male | Female |
| Healthcare Support | 0 (0.0%) | 0 (0.0%) |
| Security & Protection | 0 (0.0%) | 0 (0.0%) |
| Firefighting & Prevention | 0 (0.0%) | 0 (0.0%) |
| Law Enforcement | 0 (0.0%) | 0 (0.0%) |
| Food Preparation & Serving | 0 (0.0%) | 0 (0.0%) |
| Cleaning & Maintenance | 0 (0.0%) | 0 (0.0%) |
| Personal Care & Service | 0 (0.0%) | 0 (0.0%) |
| Total (Category) | 0 (0.0%) | 0 (0.0%) |
| Total (Overall) | 108 (95.6%) | 5 (4.4%) |
Sales and Office Occupations
Sales and Office Occupations by Sex
| Occupation | Male | Female |
| Sales & Related | 0 (0.0%) | 0 (0.0%) |
| Office & Administration | 0 (0.0%) | 0 (0.0%) |
| Total (Category) | 0 (0.0%) | 0 (0.0%) |
| Total (Overall) | 108 (95.6%) | 5 (4.4%) |
Natural Resources, Construction and Maintenance Occupations
Natural Resources, Construction and Maintenance Occupations by Sex
| Occupation | Male | Female |
| Farming, Fishing & Forestry | 0 (0.0%) | 0 (0.0%) |
| Construction & Extraction | 0 (0.0%) | 0 (0.0%) |
| Installation, Maintenance & Repair | 0 (0.0%) | 0 (0.0%) |
| Total (Category) | 0 (0.0%) | 0 (0.0%) |
| Total (Overall) | 108 (95.6%) | 5 (4.4%) |
Production, Transportation and Moving Occupations
Production, Transportation and Moving Occupations by Sex
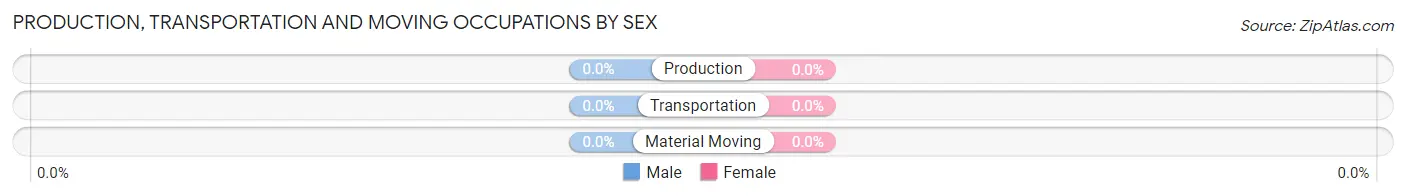
| Occupation | Male | Female |
| Production | 0 (0.0%) | 0 (0.0%) |
| Transportation | 0 (0.0%) | 0 (0.0%) |
| Material Moving | 0 (0.0%) | 0 (0.0%) |
| Total (Category) | 0 (0.0%) | 0 (0.0%) |
| Total (Overall) | 108 (95.6%) | 5 (4.4%) |
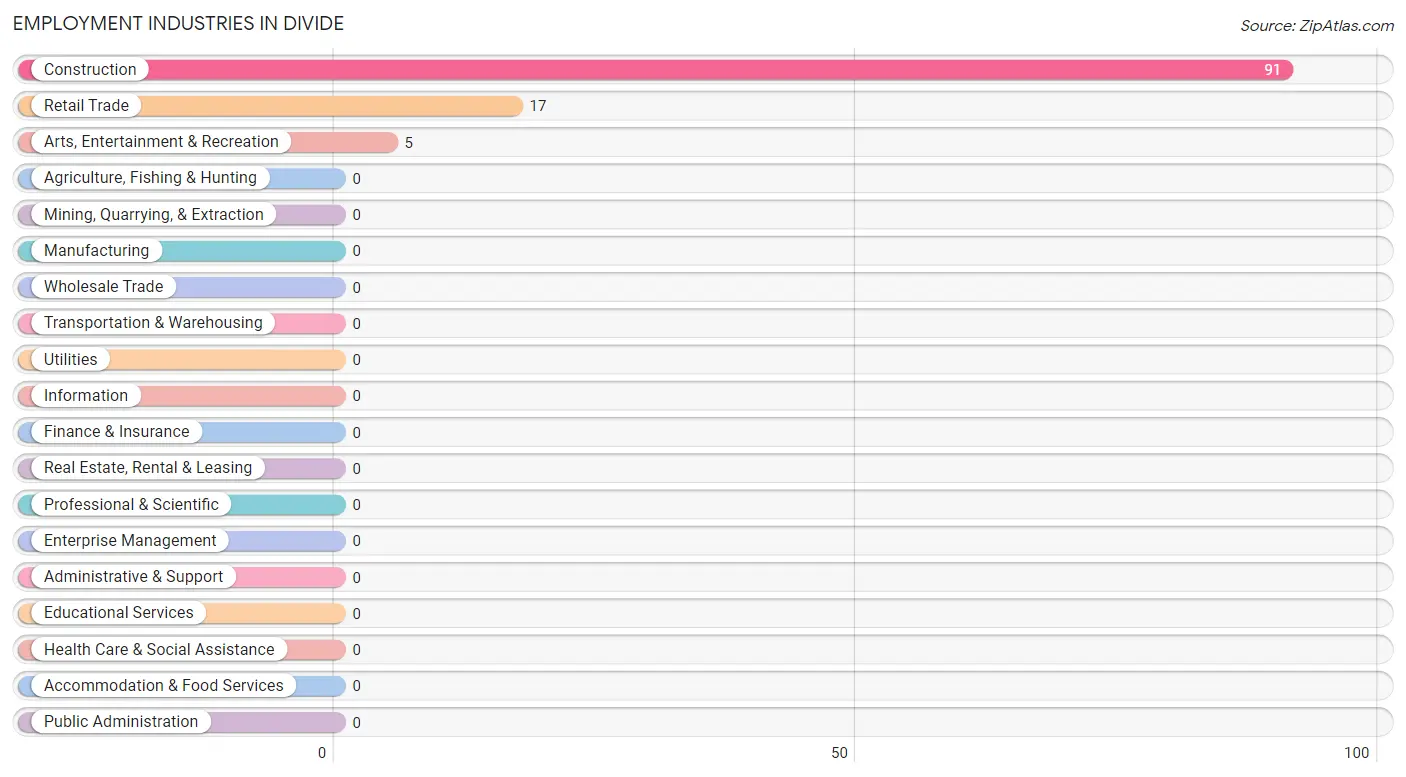
Employment Industries by Sex in Divide
Employment Industries in Divide
The major employment industries in Divide include Construction (91 | 80.5%), Retail Trade (17 | 15.0%), and Arts, Entertainment & Recreation (5 | 4.4%).
Employment Industries by Sex in Divide
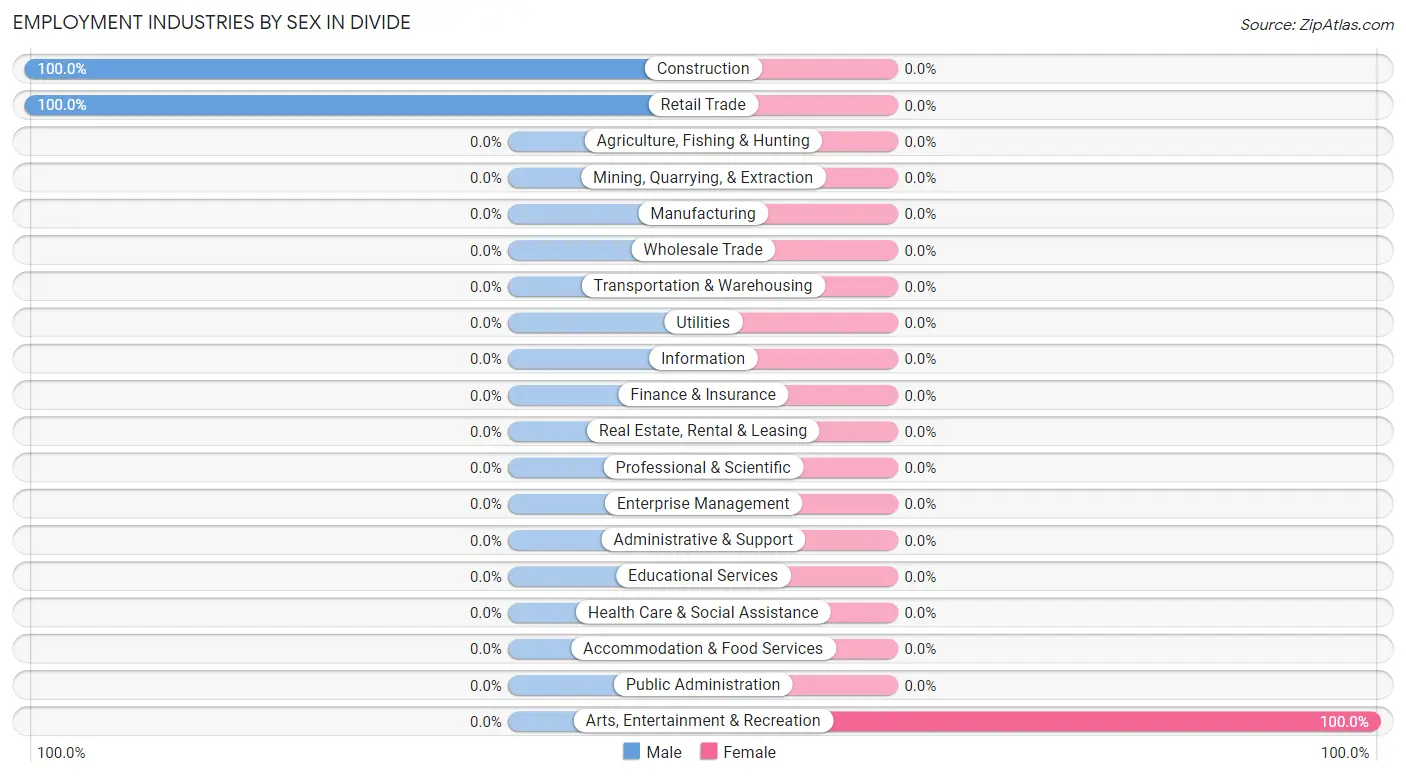
| Industry | Male | Female |
| Agriculture, Fishing & Hunting | 0 (0.0%) | 0 (0.0%) |
| Mining, Quarrying, & Extraction | 0 (0.0%) | 0 (0.0%) |
| Construction | 91 (100.0%) | 0 (0.0%) |
| Manufacturing | 0 (0.0%) | 0 (0.0%) |
| Wholesale Trade | 0 (0.0%) | 0 (0.0%) |
| Retail Trade | 17 (100.0%) | 0 (0.0%) |
| Transportation & Warehousing | 0 (0.0%) | 0 (0.0%) |
| Utilities | 0 (0.0%) | 0 (0.0%) |
| Information | 0 (0.0%) | 0 (0.0%) |
| Finance & Insurance | 0 (0.0%) | 0 (0.0%) |
| Real Estate, Rental & Leasing | 0 (0.0%) | 0 (0.0%) |
| Professional & Scientific | 0 (0.0%) | 0 (0.0%) |
| Enterprise Management | 0 (0.0%) | 0 (0.0%) |
| Administrative & Support | 0 (0.0%) | 0 (0.0%) |
| Educational Services | 0 (0.0%) | 0 (0.0%) |
| Health Care & Social Assistance | 0 (0.0%) | 0 (0.0%) |
| Arts, Entertainment & Recreation | 0 (0.0%) | 5 (100.0%) |
| Accommodation & Food Services | 0 (0.0%) | 0 (0.0%) |
| Public Administration | 0 (0.0%) | 0 (0.0%) |
| Total | 108 (95.6%) | 5 (4.4%) |
Education in Divide
School Enrollment in Divide
| School Level | # Students | % Students |
| Nursery / Preschool | 0 | 0.0% |
| Kindergarten | 0 | 0.0% |
| Elementary School | 0 | 0.0% |
| Middle School | 0 | 0.0% |
| High School | 0 | 0.0% |
| College / Undergraduate | 0 | 0.0% |
| Graduate / Professional | 0 | 0.0% |
| Total | 0 | 0.0% |
School Enrollment by Age by Funding Source in Divide
| Age Bracket | Public School | Private School |
| 3 to 4 Year Olds | 0 (0.0%) | 0 (0.0%) |
| 5 to 9 Year Old | 0 (0.0%) | 0 (0.0%) |
| 10 to 14 Year Olds | 0 (0.0%) | 0 (0.0%) |
| 15 to 17 Year Olds | 0 (0.0%) | 0 (0.0%) |
| 18 to 19 Year Olds | 0 (0.0%) | 0 (0.0%) |
| 20 to 24 Year Olds | 0 (0.0%) | 0 (0.0%) |
| 25 to 34 Year Olds | 0 (0.0%) | 0 (0.0%) |
| 35 Years and over | 0 (0.0%) | 0 (0.0%) |
| Total | 0 (0.0%) | 0 (0.0%) |
Educational Attainment by Field of Study in Divide
| Field of Study | # Graduates | % Graduates |
| Computers & Mathematics | 0 | 0.0% |
| Bio, Nature & Agricultural | 0 | 0.0% |
| Physical & Health Sciences | 0 | 0.0% |
| Psychology | 0 | 0.0% |
| Social Sciences | 0 | 0.0% |
| Engineering | 0 | 0.0% |
| Multidisciplinary Studies | 0 | 0.0% |
| Science & Technology | 0 | 0.0% |
| Business | 0 | 0.0% |
| Education | 0 | 0.0% |
| Literature & Languages | 0 | 0.0% |
| Liberal Arts & History | 0 | 0.0% |
| Visual & Performing Arts | 0 | 0.0% |
| Communications | 0 | 0.0% |
| Arts & Humanities | 0 | 0.0% |
| Total | 0 | 0.0% |
Transportation & Commute in Divide
Vehicle Availability by Sex in Divide
The most prevalent vehicle ownership categories in Divide are males with 4 vehicles (91, accounting for 84.3%) and females with 4 vehicles (5, making up 1,820.0%).
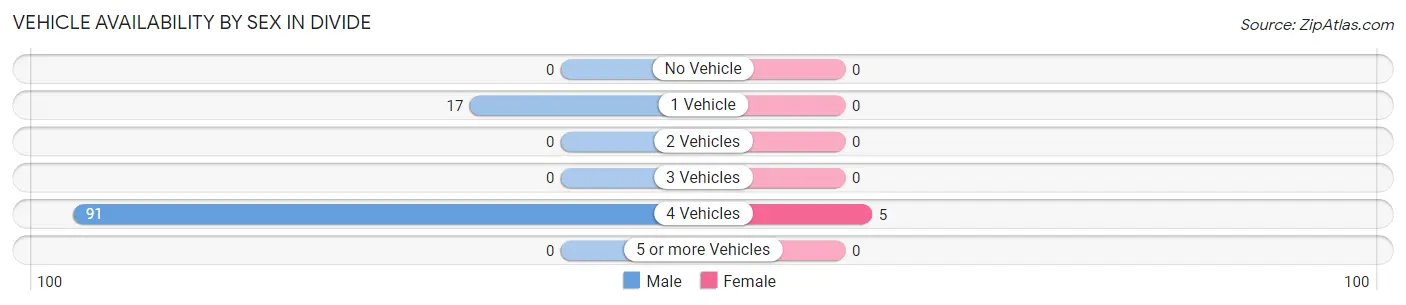
| Vehicles Available | Male | Female |
| No Vehicle | 0 (0.0%) | 0 (0.0%) |
| 1 Vehicle | 17 (15.7%) | 0 (0.0%) |
| 2 Vehicles | 0 (0.0%) | 0 (0.0%) |
| 3 Vehicles | 0 (0.0%) | 0 (0.0%) |
| 4 Vehicles | 91 (84.3%) | 5 (100.0%) |
| 5 or more Vehicles | 0 (0.0%) | 0 (0.0%) |
| Total | 108 (100.0%) | 5 (100.0%) |
Commute Time in Divide
The most frequently occuring commute durations in Divide are 60 to 89 minutes (91 commuters, 80.5%), 45 to 59 minutes (17 commuters, 15.0%), and 30 to 34 minutes (5 commuters, 4.4%).
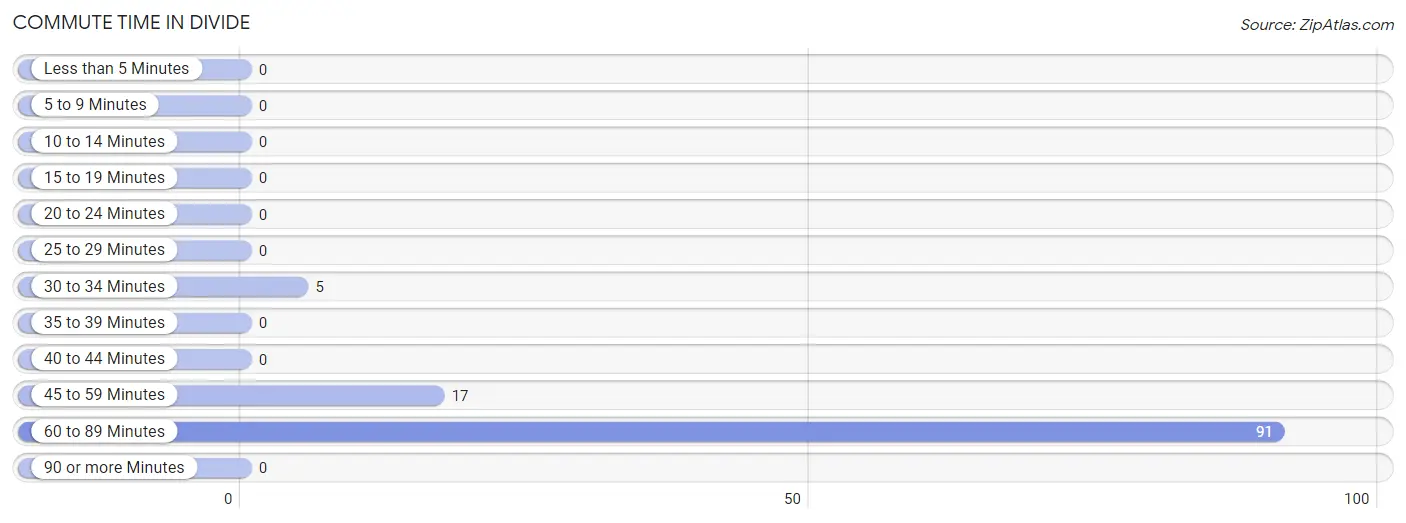
| Commute Time | # Commuters | % Commuters |
| Less than 5 Minutes | 0 | 0.0% |
| 5 to 9 Minutes | 0 | 0.0% |
| 10 to 14 Minutes | 0 | 0.0% |
| 15 to 19 Minutes | 0 | 0.0% |
| 20 to 24 Minutes | 0 | 0.0% |
| 25 to 29 Minutes | 0 | 0.0% |
| 30 to 34 Minutes | 5 | 4.4% |
| 35 to 39 Minutes | 0 | 0.0% |
| 40 to 44 Minutes | 0 | 0.0% |
| 45 to 59 Minutes | 17 | 15.0% |
| 60 to 89 Minutes | 91 | 80.5% |
| 90 or more Minutes | 0 | 0.0% |
Commute Time by Sex in Divide
The most common commute times in Divide are 60 to 89 minutes (91 commuters, 84.3%) for males and 30 to 34 minutes (5 commuters, 100.0%) for females.

| Commute Time | Male | Female |
| Less than 5 Minutes | 0 (0.0%) | 0 (0.0%) |
| 5 to 9 Minutes | 0 (0.0%) | 0 (0.0%) |
| 10 to 14 Minutes | 0 (0.0%) | 0 (0.0%) |
| 15 to 19 Minutes | 0 (0.0%) | 0 (0.0%) |
| 20 to 24 Minutes | 0 (0.0%) | 0 (0.0%) |
| 25 to 29 Minutes | 0 (0.0%) | 0 (0.0%) |
| 30 to 34 Minutes | 0 (0.0%) | 5 (100.0%) |
| 35 to 39 Minutes | 0 (0.0%) | 0 (0.0%) |
| 40 to 44 Minutes | 0 (0.0%) | 0 (0.0%) |
| 45 to 59 Minutes | 17 (15.7%) | 0 (0.0%) |
| 60 to 89 Minutes | 91 (84.3%) | 0 (0.0%) |
| 90 or more Minutes | 0 (0.0%) | 0 (0.0%) |
Time of Departure to Work by Sex in Divide
The most frequent times of departure to work in Divide are 6:30 AM to 6:59 AM (91, 84.3%) for males and 6:30 AM to 6:59 AM (5, 100.0%) for females.
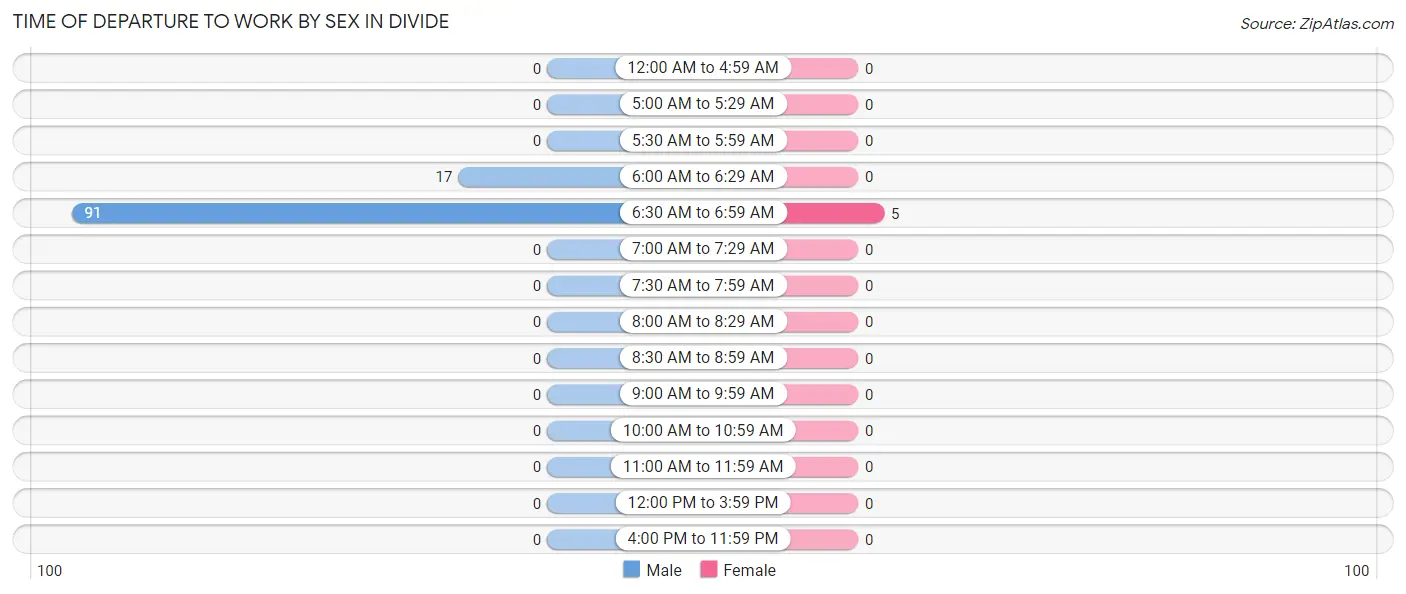
| Time of Departure | Male | Female |
| 12:00 AM to 4:59 AM | 0 (0.0%) | 0 (0.0%) |
| 5:00 AM to 5:29 AM | 0 (0.0%) | 0 (0.0%) |
| 5:30 AM to 5:59 AM | 0 (0.0%) | 0 (0.0%) |
| 6:00 AM to 6:29 AM | 17 (15.7%) | 0 (0.0%) |
| 6:30 AM to 6:59 AM | 91 (84.3%) | 5 (100.0%) |
| 7:00 AM to 7:29 AM | 0 (0.0%) | 0 (0.0%) |
| 7:30 AM to 7:59 AM | 0 (0.0%) | 0 (0.0%) |
| 8:00 AM to 8:29 AM | 0 (0.0%) | 0 (0.0%) |
| 8:30 AM to 8:59 AM | 0 (0.0%) | 0 (0.0%) |
| 9:00 AM to 9:59 AM | 0 (0.0%) | 0 (0.0%) |
| 10:00 AM to 10:59 AM | 0 (0.0%) | 0 (0.0%) |
| 11:00 AM to 11:59 AM | 0 (0.0%) | 0 (0.0%) |
| 12:00 PM to 3:59 PM | 0 (0.0%) | 0 (0.0%) |
| 4:00 PM to 11:59 PM | 0 (0.0%) | 0 (0.0%) |
| Total | 108 (100.0%) | 5 (100.0%) |
Housing Occupancy in Divide
Occupancy by Ownership in Divide
Of the total 40 dwellings in Divide, owner-occupied units account for 40 (100.0%), while renter-occupied units make up 0 (0.0%).
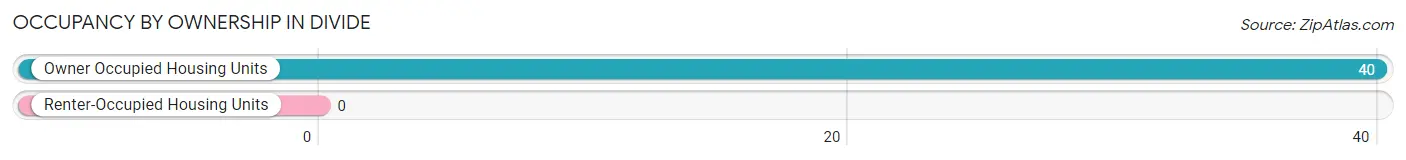
| Occupancy | # Housing Units | % Housing Units |
| Owner Occupied Housing Units | 40 | 100.0% |
| Renter-Occupied Housing Units | 0 | 0.0% |
| Total Occupied Housing Units | 40 | 100.0% |
Occupancy by Household Size in Divide
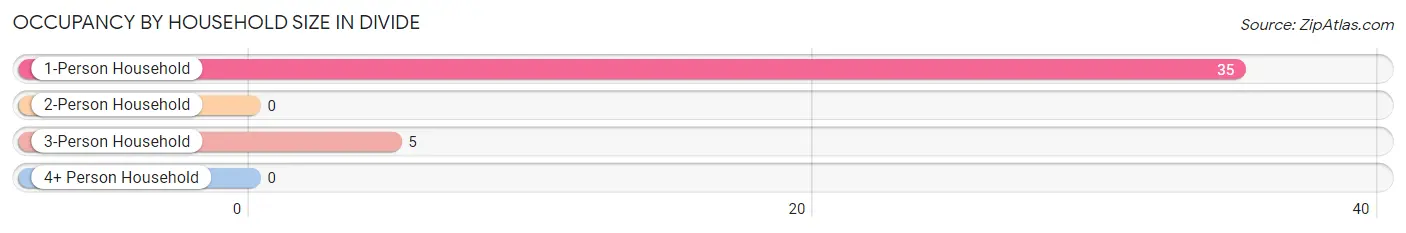
| Household Size | # Housing Units | % Housing Units |
| 1-Person Household | 35 | 87.5% |
| 2-Person Household | 0 | 0.0% |
| 3-Person Household | 5 | 12.5% |
| 4+ Person Household | 0 | 0.0% |
| Total Housing Units | 40 | 100.0% |
Occupancy by Ownership by Household Size in Divide
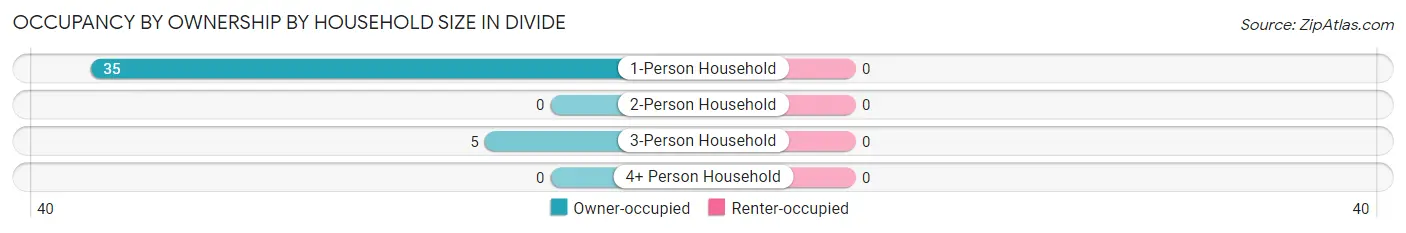
| Household Size | Owner-occupied | Renter-occupied |
| 1-Person Household | 35 (100.0%) | 0 (0.0%) |
| 2-Person Household | 0 (0.0%) | 0 (0.0%) |
| 3-Person Household | 5 (100.0%) | 0 (0.0%) |
| 4+ Person Household | 0 (0.0%) | 0 (0.0%) |
| Total Housing Units | 40 (100.0%) | 0 (0.0%) |
Occupancy by Educational Attainment in Divide
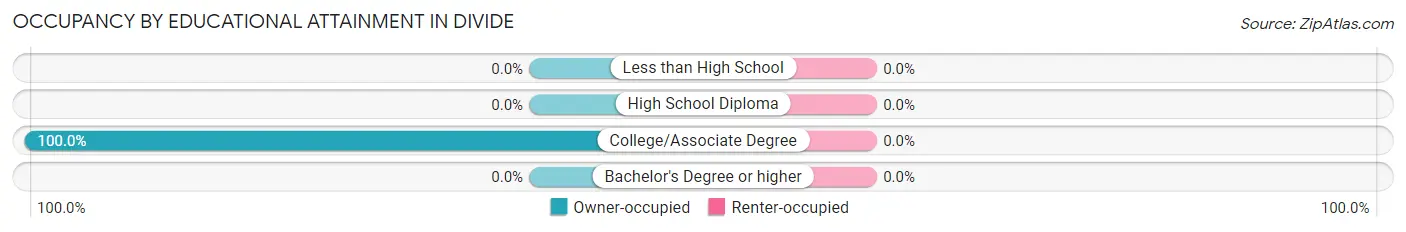
| Household Size | Owner-occupied | Renter-occupied |
| Less than High School | 0 (0.0%) | 0 (0.0%) |
| High School Diploma | 0 (0.0%) | 0 (0.0%) |
| College/Associate Degree | 40 (100.0%) | 0 (0.0%) |
| Bachelor's Degree or higher | 0 (0.0%) | 0 (0.0%) |
Occupancy by Age of Householder in Divide
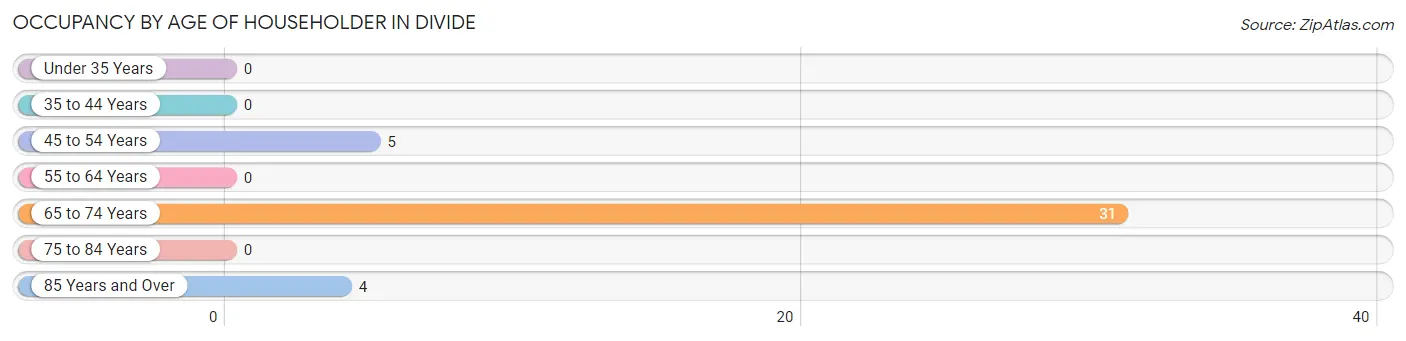
| Age Bracket | # Households | % Households |
| Under 35 Years | 0 | 0.0% |
| 35 to 44 Years | 0 | 0.0% |
| 45 to 54 Years | 5 | 12.5% |
| 55 to 64 Years | 0 | 0.0% |
| 65 to 74 Years | 31 | 77.5% |
| 75 to 84 Years | 0 | 0.0% |
| 85 Years and Over | 4 | 10.0% |
| Total | 40 | 100.0% |
Housing Finances in Divide
Median Income by Occupancy in Divide
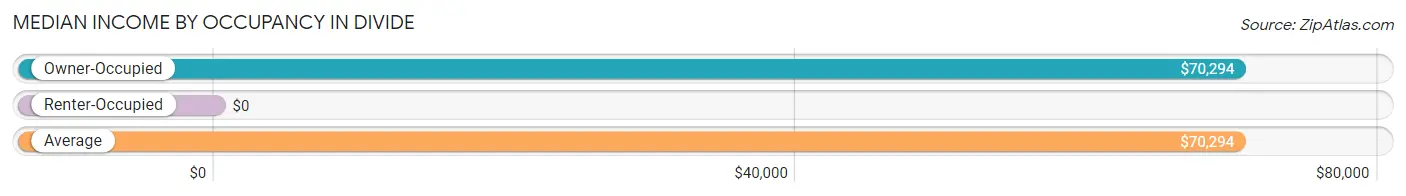
| Occupancy Type | # Households | Median Income |
| Owner-Occupied | 40 (100.0%) | $70,294 |
| Renter-Occupied | 0 (0.0%) | $0 |
| Average | 40 (100.0%) | $70,294 |
Occupancy by Householder Income Bracket in Divide
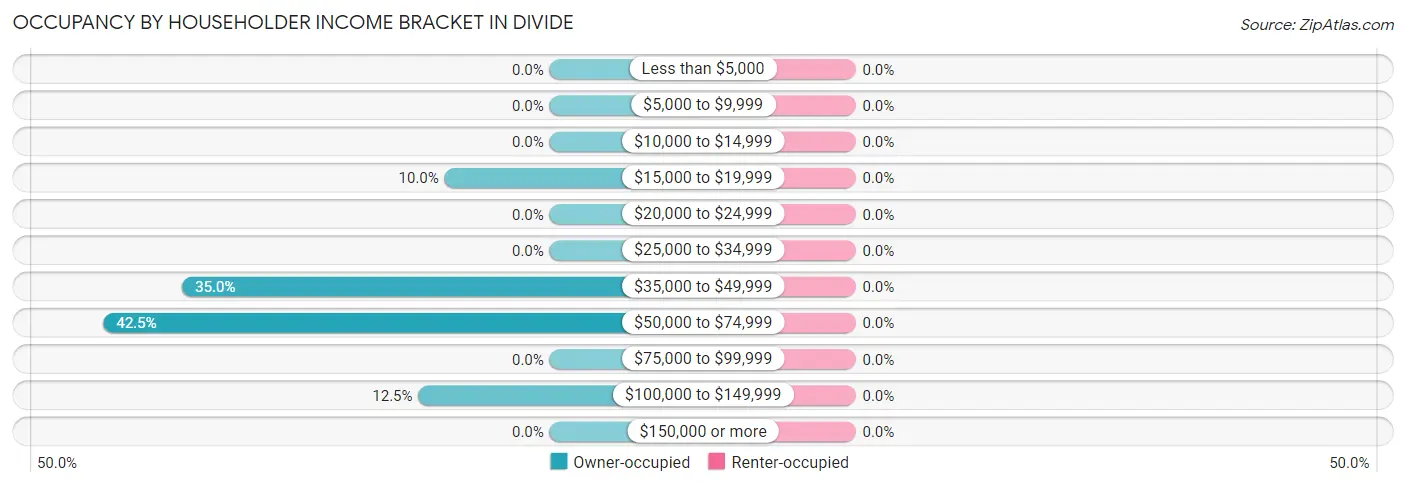
| Income Bracket | Owner-occupied | Renter-occupied |
| Less than $5,000 | 0 (0.0%) | 0 (0.0%) |
| $5,000 to $9,999 | 0 (0.0%) | 0 (0.0%) |
| $10,000 to $14,999 | 0 (0.0%) | 0 (0.0%) |
| $15,000 to $19,999 | 4 (10.0%) | 0 (0.0%) |
| $20,000 to $24,999 | 0 (0.0%) | 0 (0.0%) |
| $25,000 to $34,999 | 0 (0.0%) | 0 (0.0%) |
| $35,000 to $49,999 | 14 (35.0%) | 0 (0.0%) |
| $50,000 to $74,999 | 17 (42.5%) | 0 (0.0%) |
| $75,000 to $99,999 | 0 (0.0%) | 0 (0.0%) |
| $100,000 to $149,999 | 5 (12.5%) | 0 (0.0%) |
| $150,000 or more | 0 (0.0%) | 0 (0.0%) |
| Total | 40 (100.0%) | 0 (0.0%) |
Monthly Housing Cost Tiers in Divide
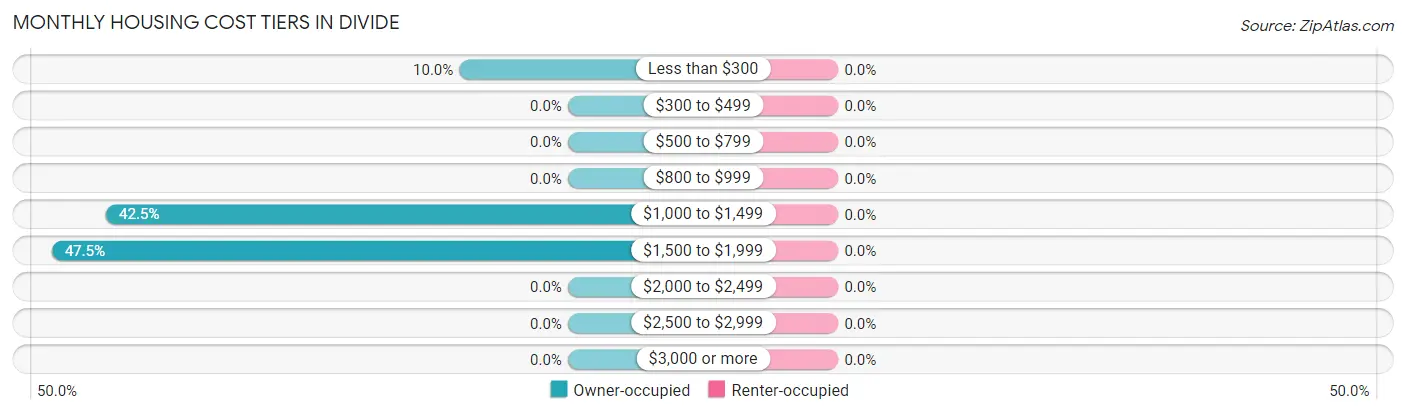
| Monthly Cost | Owner-occupied | Renter-occupied |
| Less than $300 | 4 (10.0%) | 0 (0.0%) |
| $300 to $499 | 0 (0.0%) | 0 (0.0%) |
| $500 to $799 | 0 (0.0%) | 0 (0.0%) |
| $800 to $999 | 0 (0.0%) | 0 (0.0%) |
| $1,000 to $1,499 | 17 (42.5%) | 0 (0.0%) |
| $1,500 to $1,999 | 19 (47.5%) | 0 (0.0%) |
| $2,000 to $2,499 | 0 (0.0%) | 0 (0.0%) |
| $2,500 to $2,999 | 0 (0.0%) | 0 (0.0%) |
| $3,000 or more | 0 (0.0%) | 0 (0.0%) |
| Total | 40 (100.0%) | 0 (0.0%) |
Physical Housing Characteristics in Divide
Housing Structures in Divide
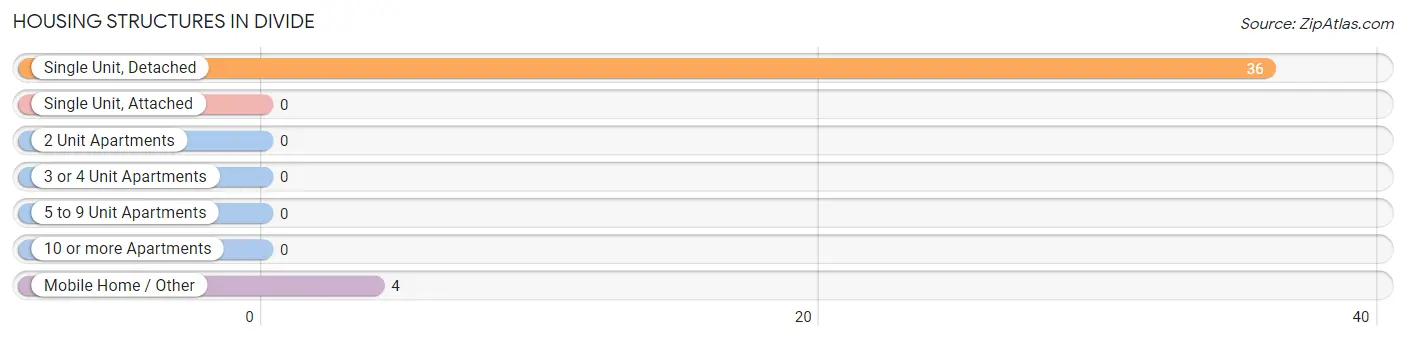
| Structure Type | # Housing Units | % Housing Units |
| Single Unit, Detached | 36 | 90.0% |
| Single Unit, Attached | 0 | 0.0% |
| 2 Unit Apartments | 0 | 0.0% |
| 3 or 4 Unit Apartments | 0 | 0.0% |
| 5 to 9 Unit Apartments | 0 | 0.0% |
| 10 or more Apartments | 0 | 0.0% |
| Mobile Home / Other | 4 | 10.0% |
| Total | 40 | 100.0% |
Housing Structures by Occupancy in Divide
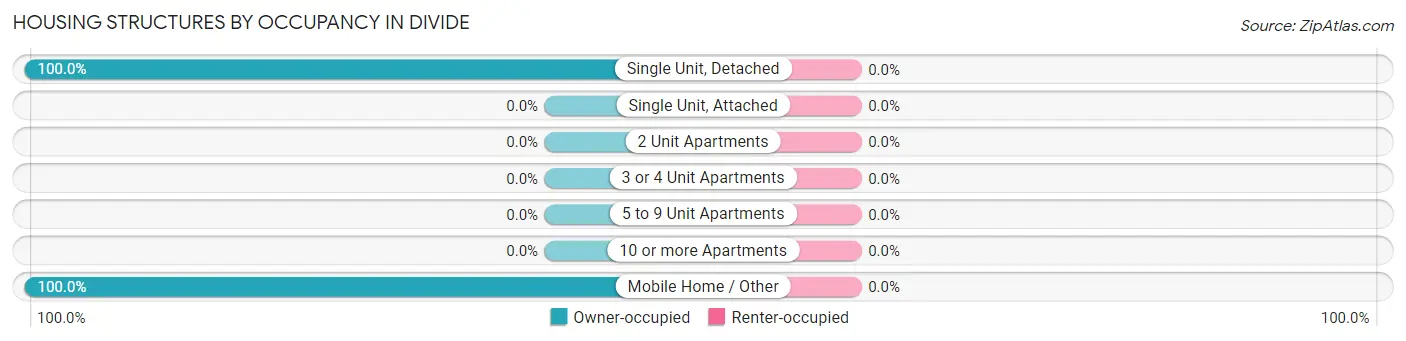
| Structure Type | Owner-occupied | Renter-occupied |
| Single Unit, Detached | 36 (100.0%) | 0 (0.0%) |
| Single Unit, Attached | 0 (0.0%) | 0 (0.0%) |
| 2 Unit Apartments | 0 (0.0%) | 0 (0.0%) |
| 3 or 4 Unit Apartments | 0 (0.0%) | 0 (0.0%) |
| 5 to 9 Unit Apartments | 0 (0.0%) | 0 (0.0%) |
| 10 or more Apartments | 0 (0.0%) | 0 (0.0%) |
| Mobile Home / Other | 4 (100.0%) | 0 (0.0%) |
| Total | 40 (100.0%) | 0 (0.0%) |
Housing Structures by Number of Rooms in Divide
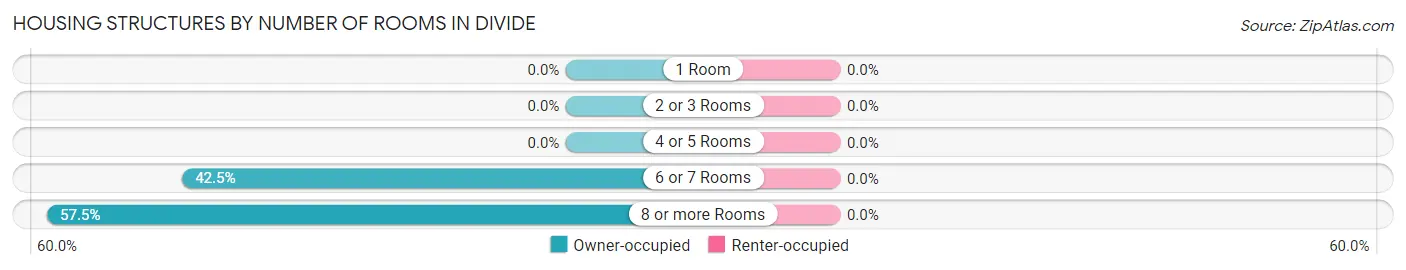
| Number of Rooms | Owner-occupied | Renter-occupied |
| 1 Room | 0 (0.0%) | 0 (0.0%) |
| 2 or 3 Rooms | 0 (0.0%) | 0 (0.0%) |
| 4 or 5 Rooms | 0 (0.0%) | 0 (0.0%) |
| 6 or 7 Rooms | 17 (42.5%) | 0 (0.0%) |
| 8 or more Rooms | 23 (57.5%) | 0 (0.0%) |
| Total | 40 (100.0%) | 0 (0.0%) |
Housing Structure by Heating Type in Divide
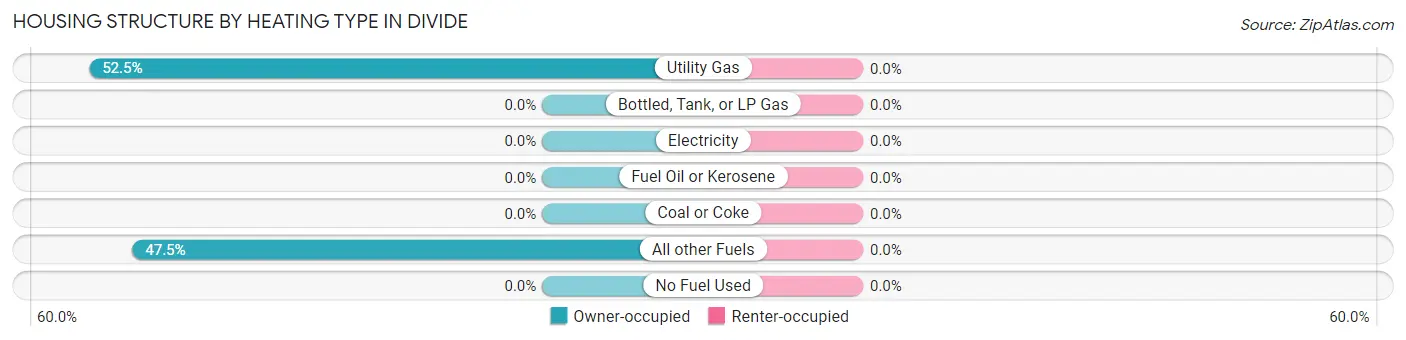
| Heating Type | Owner-occupied | Renter-occupied |
| Utility Gas | 21 (52.5%) | 0 (0.0%) |
| Bottled, Tank, or LP Gas | 0 (0.0%) | 0 (0.0%) |
| Electricity | 0 (0.0%) | 0 (0.0%) |
| Fuel Oil or Kerosene | 0 (0.0%) | 0 (0.0%) |
| Coal or Coke | 0 (0.0%) | 0 (0.0%) |
| All other Fuels | 19 (47.5%) | 0 (0.0%) |
| No Fuel Used | 0 (0.0%) | 0 (0.0%) |
| Total | 40 (100.0%) | 0 (0.0%) |
Household Vehicle Usage in Divide
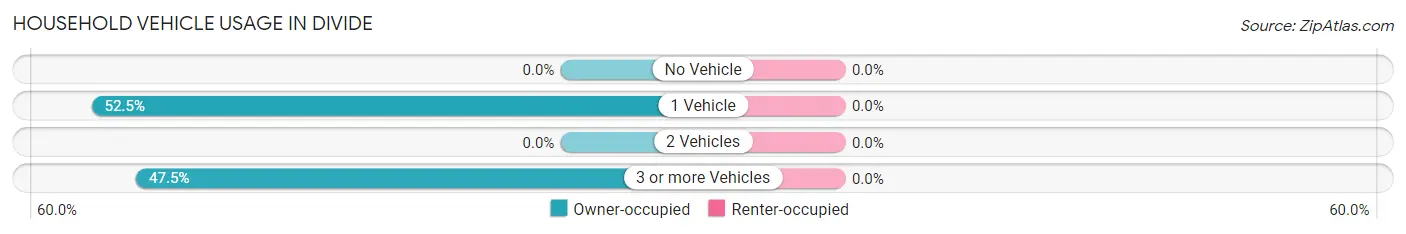
| Vehicles per Household | Owner-occupied | Renter-occupied |
| No Vehicle | 0 (0.0%) | 0 (0.0%) |
| 1 Vehicle | 21 (52.5%) | 0 (0.0%) |
| 2 Vehicles | 0 (0.0%) | 0 (0.0%) |
| 3 or more Vehicles | 19 (47.5%) | 0 (0.0%) |
| Total | 40 (100.0%) | 0 (0.0%) |
Real Estate & Mortgages in Divide
Real Estate and Mortgage Overview in Divide
| Characteristic | Without Mortgage | With Mortgage |
| Housing Units | 4 | 36 |
| Median Property Value | - | - |
| Median Household Income | - | - |
| Monthly Housing Costs | - | - |
| Real Estate Taxes | - | - |
Property Value by Mortgage Status in Divide
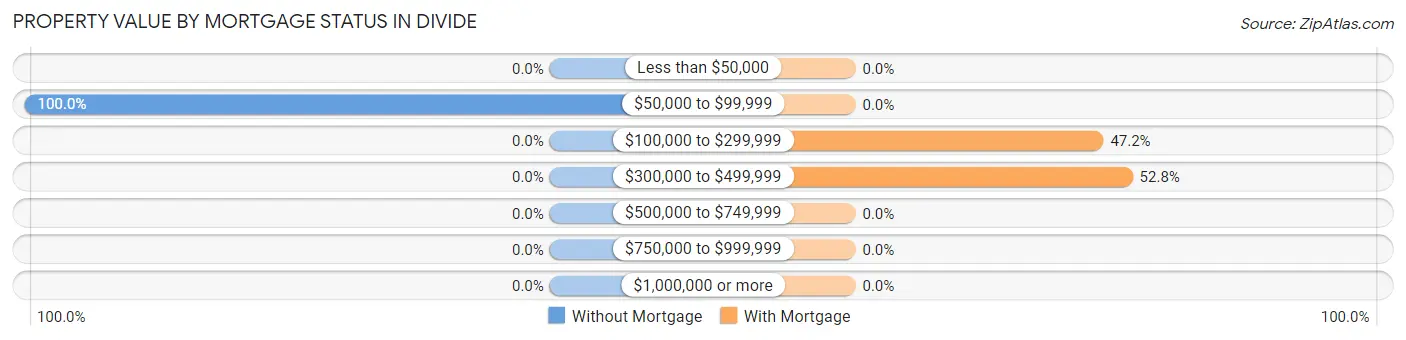
| Property Value | Without Mortgage | With Mortgage |
| Less than $50,000 | 0 (0.0%) | 0 (0.0%) |
| $50,000 to $99,999 | 4 (100.0%) | 0 (0.0%) |
| $100,000 to $299,999 | 0 (0.0%) | 17 (47.2%) |
| $300,000 to $499,999 | 0 (0.0%) | 19 (52.8%) |
| $500,000 to $749,999 | 0 (0.0%) | 0 (0.0%) |
| $750,000 to $999,999 | 0 (0.0%) | 0 (0.0%) |
| $1,000,000 or more | 0 (0.0%) | 0 (0.0%) |
| Total | 4 (100.0%) | 36 (100.0%) |
Household Income by Mortgage Status in Divide
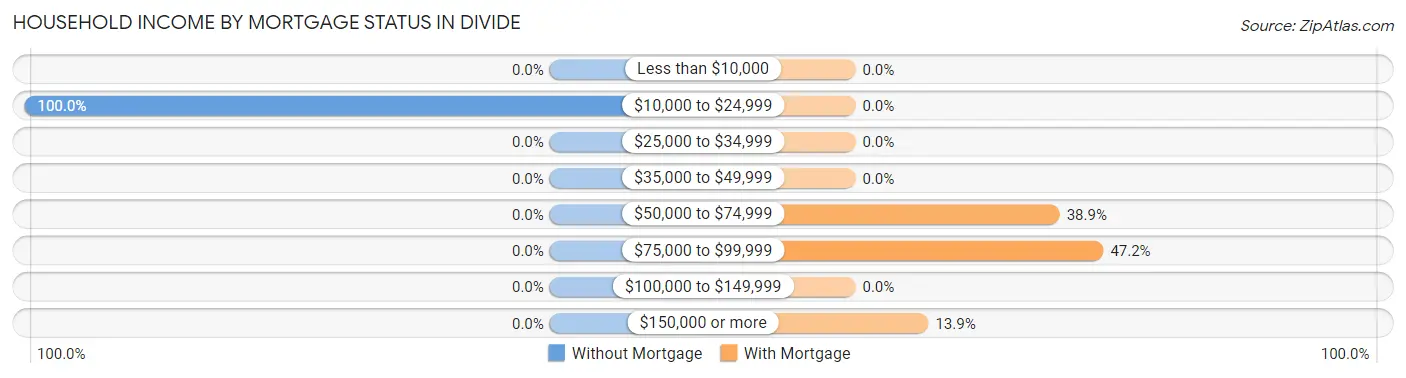
| Household Income | Without Mortgage | With Mortgage |
| Less than $10,000 | 0 (0.0%) | 0 (0.0%) |
| $10,000 to $24,999 | 4 (100.0%) | 0 (0.0%) |
| $25,000 to $34,999 | 0 (0.0%) | 0 (0.0%) |
| $35,000 to $49,999 | 0 (0.0%) | 0 (0.0%) |
| $50,000 to $74,999 | 0 (0.0%) | 14 (38.9%) |
| $75,000 to $99,999 | 0 (0.0%) | 17 (47.2%) |
| $100,000 to $149,999 | 0 (0.0%) | 0 (0.0%) |
| $150,000 or more | 0 (0.0%) | 5 (13.9%) |
| Total | 4 (100.0%) | 36 (100.0%) |
Property Value to Household Income Ratio in Divide
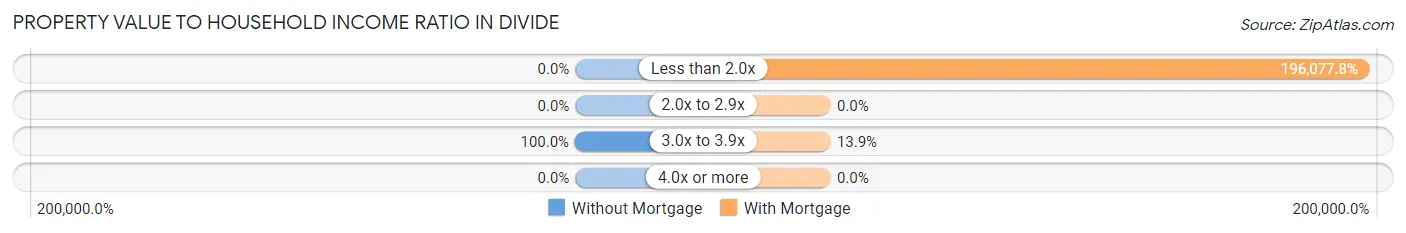
| Value-to-Income Ratio | Without Mortgage | With Mortgage |
| Less than 2.0x | 0 (0.0%) | 70,588 (196,077.8%) |
| 2.0x to 2.9x | 0 (0.0%) | 0 (0.0%) |
| 3.0x to 3.9x | 4 (100.0%) | 5 (13.9%) |
| 4.0x or more | 0 (0.0%) | 0 (0.0%) |
| Total | 4 (100.0%) | 36 (100.0%) |
Real Estate Taxes by Mortgage Status in Divide
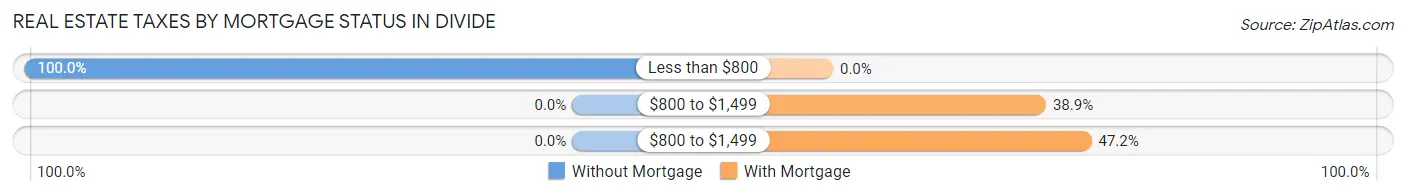
| Property Taxes | Without Mortgage | With Mortgage |
| Less than $800 | 4 (100.0%) | 0 (0.0%) |
| $800 to $1,499 | 0 (0.0%) | 14 (38.9%) |
| $800 to $1,499 | 0 (0.0%) | 17 (47.2%) |
| Total | 4 (100.0%) | 36 (100.0%) |
Health & Disability in Divide
Health Insurance Coverage by Age in Divide
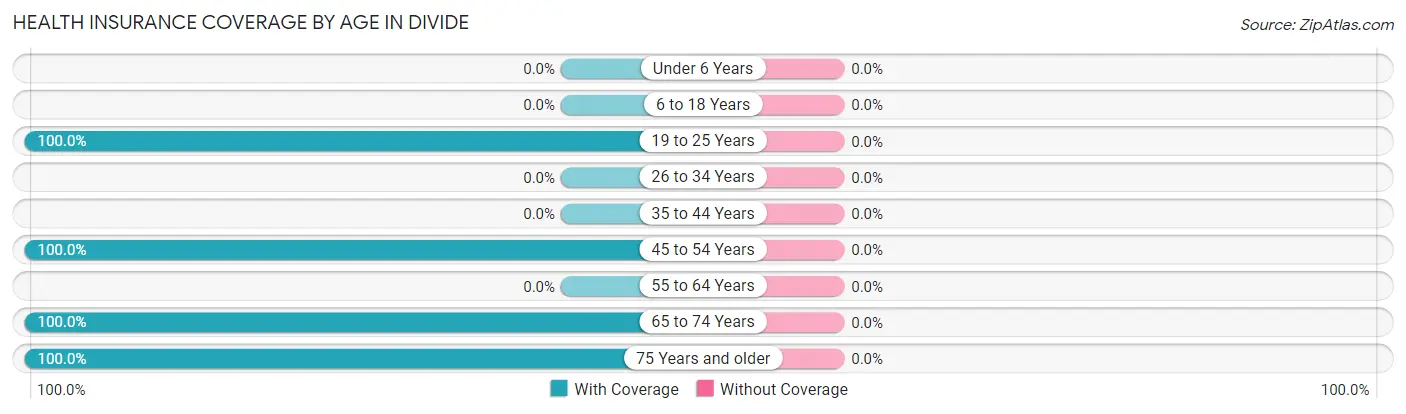
| Age Bracket | With Coverage | Without Coverage |
| Under 6 Years | 0 (0.0%) | 0 (0.0%) |
| 6 to 18 Years | 0 (0.0%) | 0 (0.0%) |
| 19 to 25 Years | 9 (100.0%) | 0 (0.0%) |
| 26 to 34 Years | 0 (0.0%) | 0 (0.0%) |
| 35 to 44 Years | 0 (0.0%) | 0 (0.0%) |
| 45 to 54 Years | 96 (100.0%) | 0 (0.0%) |
| 55 to 64 Years | 0 (0.0%) | 0 (0.0%) |
| 65 to 74 Years | 31 (100.0%) | 0 (0.0%) |
| 75 Years and older | 4 (100.0%) | 0 (0.0%) |
| Total | 140 (100.0%) | 0 (0.0%) |
Health Insurance Coverage by Citizenship Status in Divide
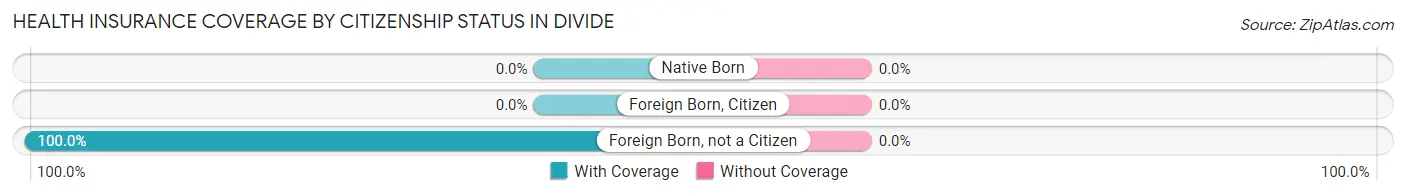
| Citizenship Status | With Coverage | Without Coverage |
| Native Born | 0 (0.0%) | 0 (0.0%) |
| Foreign Born, Citizen | 0 (0.0%) | 0 (0.0%) |
| Foreign Born, not a Citizen | 9 (100.0%) | 0 (0.0%) |
Health Insurance Coverage by Household Income in Divide
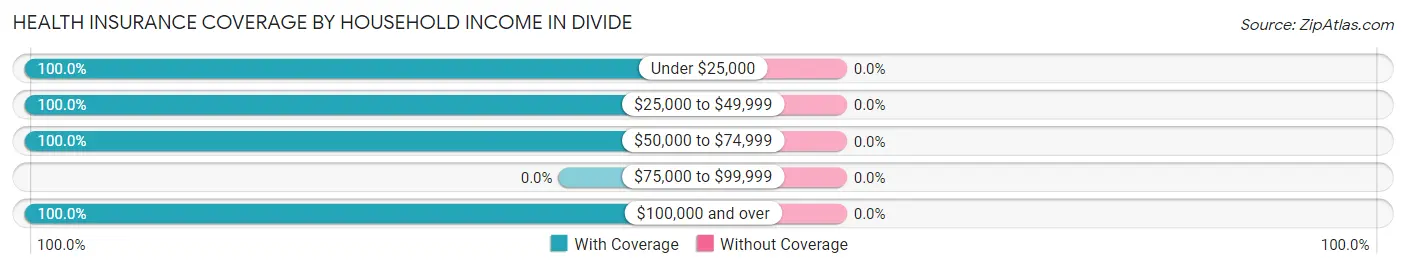
| Household Income | With Coverage | Without Coverage |
| Under $25,000 | 4 (100.0%) | 0 (0.0%) |
| $25,000 to $49,999 | 14 (100.0%) | 0 (0.0%) |
| $50,000 to $74,999 | 17 (100.0%) | 0 (0.0%) |
| $75,000 to $99,999 | 0 (0.0%) | 0 (0.0%) |
| $100,000 and over | 105 (100.0%) | 0 (0.0%) |
Public vs Private Health Insurance Coverage by Age in Divide
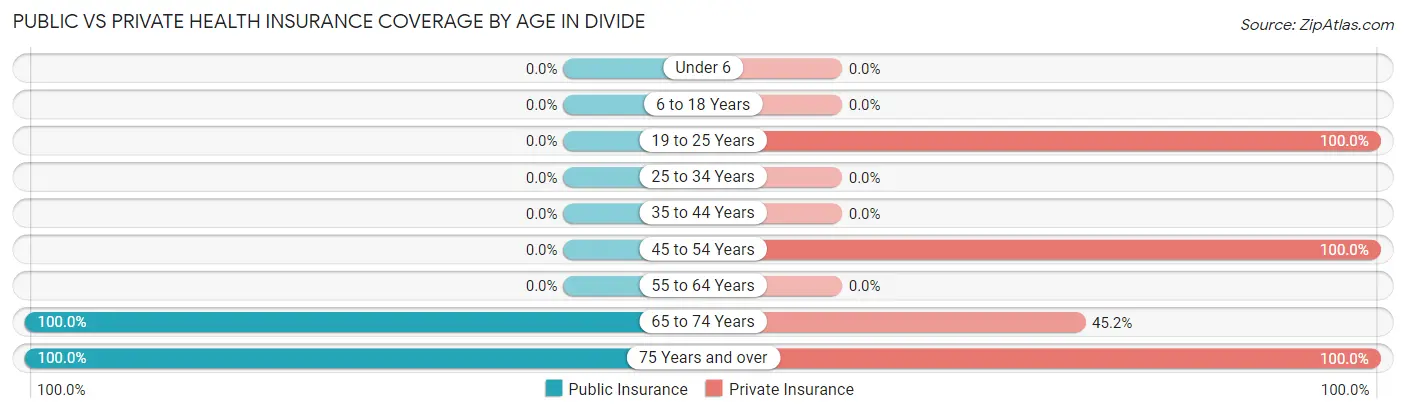
| Age Bracket | Public Insurance | Private Insurance |
| Under 6 | 0 (0.0%) | 0 (0.0%) |
| 6 to 18 Years | 0 (0.0%) | 0 (0.0%) |
| 19 to 25 Years | 0 (0.0%) | 9 (100.0%) |
| 25 to 34 Years | 0 (0.0%) | 0 (0.0%) |
| 35 to 44 Years | 0 (0.0%) | 0 (0.0%) |
| 45 to 54 Years | 0 (0.0%) | 96 (100.0%) |
| 55 to 64 Years | 0 (0.0%) | 0 (0.0%) |
| 65 to 74 Years | 31 (100.0%) | 14 (45.2%) |
| 75 Years and over | 4 (100.0%) | 4 (100.0%) |
| Total | 35 (25.0%) | 123 (87.9%) |
Disability Status by Sex by Age in Divide
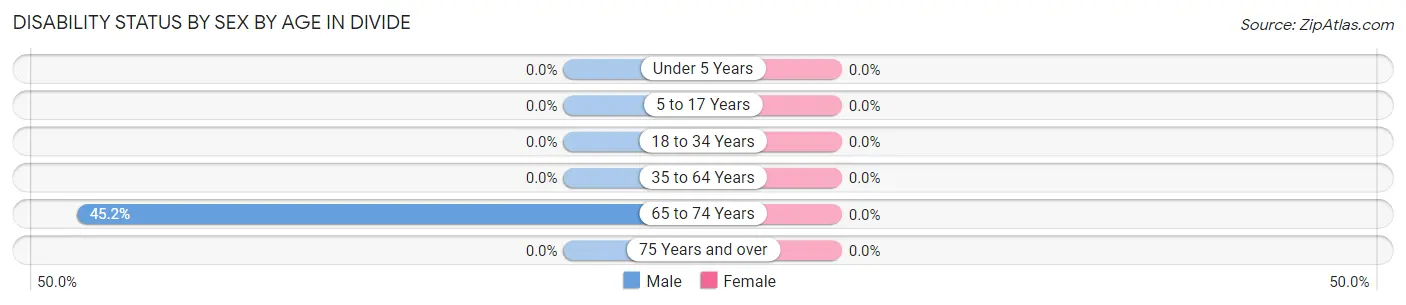
| Age Bracket | Male | Female |
| Under 5 Years | 0 (0.0%) | 0 (0.0%) |
| 5 to 17 Years | 0 (0.0%) | 0 (0.0%) |
| 18 to 34 Years | 0 (0.0%) | 0 (0.0%) |
| 35 to 64 Years | 0 (0.0%) | 0 (0.0%) |
| 65 to 74 Years | 14 (45.2%) | 0 (0.0%) |
| 75 Years and over | 0 (0.0%) | 0 (0.0%) |
Disability Class by Sex by Age in Divide
Disability Class: Hearing Difficulty
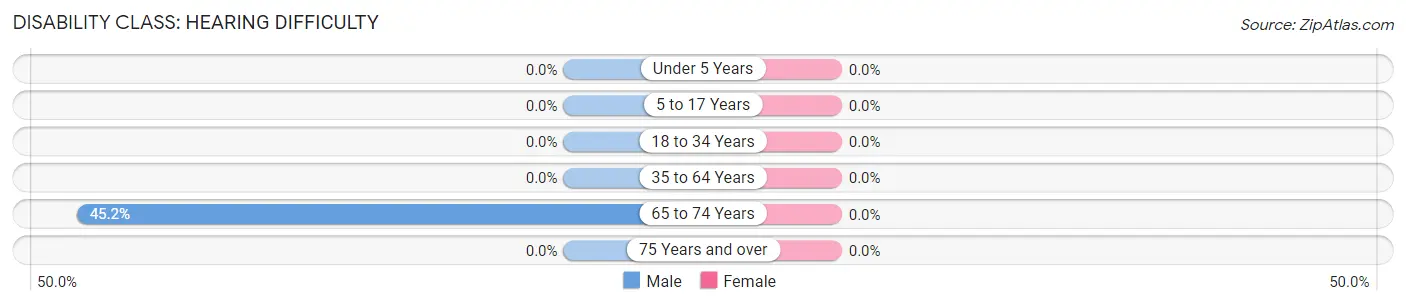
| Age Bracket | Male | Female |
| Under 5 Years | 0 (0.0%) | 0 (0.0%) |
| 5 to 17 Years | 0 (0.0%) | 0 (0.0%) |
| 18 to 34 Years | 0 (0.0%) | 0 (0.0%) |
| 35 to 64 Years | 0 (0.0%) | 0 (0.0%) |
| 65 to 74 Years | 14 (45.2%) | 0 (0.0%) |
| 75 Years and over | 0 (0.0%) | 0 (0.0%) |
Disability Class: Vision Difficulty
| Age Bracket | Male | Female |
| Under 5 Years | 0 (0.0%) | 0 (0.0%) |
| 5 to 17 Years | 0 (0.0%) | 0 (0.0%) |
| 18 to 34 Years | 0 (0.0%) | 0 (0.0%) |
| 35 to 64 Years | 0 (0.0%) | 0 (0.0%) |
| 65 to 74 Years | 0 (0.0%) | 0 (0.0%) |
| 75 Years and over | 0 (0.0%) | 0 (0.0%) |
Disability Class: Cognitive Difficulty

| Age Bracket | Male | Female |
| 5 to 17 Years | 0 (0.0%) | 0 (0.0%) |
| 18 to 34 Years | 0 (0.0%) | 0 (0.0%) |
| 35 to 64 Years | 0 (0.0%) | 0 (0.0%) |
| 65 to 74 Years | 0 (0.0%) | 0 (0.0%) |
| 75 Years and over | 0 (0.0%) | 0 (0.0%) |
Disability Class: Ambulatory Difficulty
| Age Bracket | Male | Female |
| 5 to 17 Years | 0 (0.0%) | 0 (0.0%) |
| 18 to 34 Years | 0 (0.0%) | 0 (0.0%) |
| 35 to 64 Years | 0 (0.0%) | 0 (0.0%) |
| 65 to 74 Years | 0 (0.0%) | 0 (0.0%) |
| 75 Years and over | 0 (0.0%) | 0 (0.0%) |
Disability Class: Self-Care Difficulty
| Age Bracket | Male | Female |
| 5 to 17 Years | 0 (0.0%) | 0 (0.0%) |
| 18 to 34 Years | 0 (0.0%) | 0 (0.0%) |
| 35 to 64 Years | 0 (0.0%) | 0 (0.0%) |
| 65 to 74 Years | 0 (0.0%) | 0 (0.0%) |
| 75 Years and over | 0 (0.0%) | 0 (0.0%) |
Technology Access in Divide
Computing Device Access in Divide
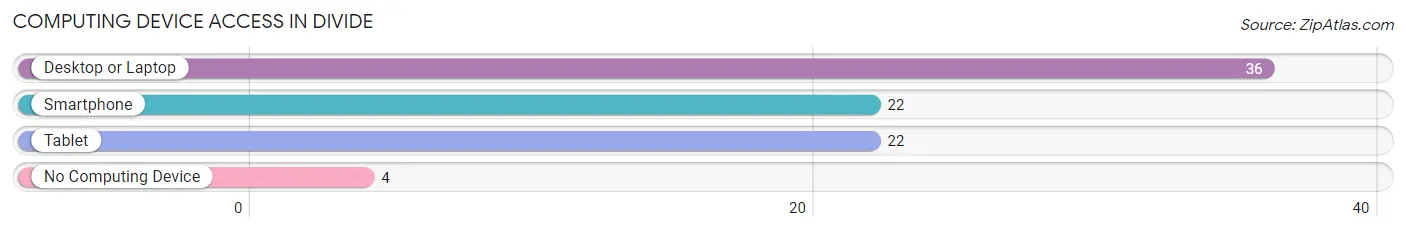
| Device Type | # Households | % Households |
| Desktop or Laptop | 36 | 90.0% |
| Smartphone | 22 | 55.0% |
| Tablet | 22 | 55.0% |
| No Computing Device | 4 | 10.0% |
| Total | 40 | 100.0% |
Internet Access in Divide
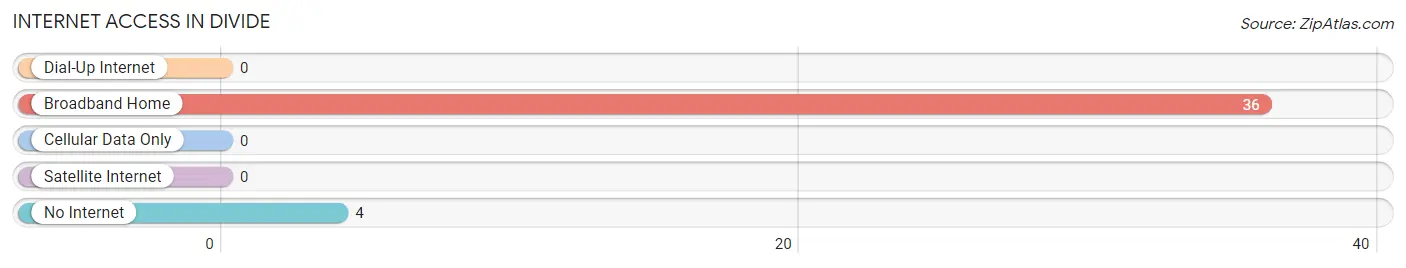
| Internet Type | # Households | % Households |
| Dial-Up Internet | 0 | 0.0% |
| Broadband Home | 36 | 90.0% |
| Cellular Data Only | 0 | 0.0% |
| Satellite Internet | 0 | 0.0% |
| No Internet | 4 | 10.0% |
| Total | 40 | 100.0% |
Divide Summary
History
Divide is a small unincorporated community located in Teller County, Colorado. It is situated in the foothills of the Rocky Mountains, approximately 10 miles west of Colorado Springs. The area was first settled in the late 1800s by miners and ranchers, and the town was officially established in 1891.
Divide was originally known as “Divide City” due to its location at the divide between the Arkansas and South Platte Rivers. The town was a popular stop for travelers and miners, and it quickly grew to become a bustling community. In the early 1900s, the town was home to several businesses, including a hotel, saloon, general store, and post office.
The town’s economy was largely based on mining and ranching, and it was also a popular tourist destination. In the 1920s, the town was home to a ski resort, which attracted visitors from all over the country. The resort closed in the 1950s, but the town still remains a popular destination for outdoor recreation.
Geography
Divide is located in the foothills of the Rocky Mountains, approximately 10 miles west of Colorado Springs. The town is situated at an elevation of 8,000 feet, and it is surrounded by mountains and forests. The town is located in a valley, and it is bordered by the Arkansas River to the north and the South Platte River to the south.
The town is located in a temperate climate, and it receives an average of 300 days of sunshine each year. The area is known for its mild winters and warm summers, and it is a popular destination for outdoor recreation.
Economy
Divide’s economy is largely based on tourism and outdoor recreation. The town is home to several popular attractions, including the nearby Mueller State Park and the historic Divide Hotel. The town is also home to several small businesses, including restaurants, shops, and galleries.
The town is also home to several small-scale farms and ranches, and it is a popular destination for hunting and fishing. The town is also home to several small manufacturing businesses, and it is a popular destination for retirees.
Demographics
As of the 2010 census, the population of Divide was 1,073. The town is predominantly white, with approximately 95% of the population identifying as Caucasian. The town is also home to a small Hispanic population, with approximately 4% of the population identifying as Hispanic or Latino.
The median household income in Divide is $50,000, and the median home value is $200,000. The town has a low unemployment rate, and it is a popular destination for retirees.
Conclusion
Divide is a small unincorporated community located in Teller County, Colorado. The town is situated in the foothills of the Rocky Mountains, and it is a popular destination for outdoor recreation. The town’s economy is largely based on tourism and outdoor recreation, and it is also home to several small businesses and farms. The town is predominantly white, with a small Hispanic population, and the median household income is $50,000.
Common Questions
What is Per Capita Income in Divide?
Per Capita income in Divide is $71,134.
What is the Median Household income in Divide?
Median Household Income in Divide is $70,294.
What is Inequality or Gini Index in Divide?
Inequality or Gini Index in Divide is 0.23.
What is the Total Population of Divide?
Total Population of Divide is 140.
What is the Total Male Population of Divide?
Total Male Population of Divide is 131.
What is the Total Female Population of Divide?
Total Female Population of Divide is 9.
What is the Ratio of Males per 100 Females in Divide?
There are 1,455.56 Males per 100 Females in Divide.
What is the Ratio of Females per 100 Males in Divide?
There are 6.87 Females per 100 Males in Divide.
What is the Median Population Age in Divide?
Median Population Age in Divide is 46.7 Years.
What is the Average Family Size in Divide
Average Family Size in Divide is 21.0 People.
What is the Average Household Size in Divide
Average Household Size in Divide is 3.5 People.
How Large is the Labor Force in Divide?
There are 113 People in the Labor Forcein in Divide.
What is the Percentage of People in the Labor Force in Divide?
80.7% of People are in the Labor Force in Divide.