Superior, CO Map & Demographics
Superior Map
Superior Overview
$65,498
PER CAPITA INCOME
$173,563
AVG FAMILY INCOME
$149,464
AVG HOUSEHOLD INCOME
25.7%
WAGE / INCOME GAP [ % ]
74.3¢/ $1
WAGE / INCOME GAP [ $ ]
$12,349
FAMILY INCOME DEFICIT
0.39
INEQUALITY / GINI INDEX
13,146
TOTAL POPULATION
6,831
MALE POPULATION
6,315
FEMALE POPULATION
108.17
MALES / 100 FEMALES
92.45
FEMALES / 100 MALES
36.9
MEDIAN AGE
3.3
AVG FAMILY SIZE
2.9
AVG HOUSEHOLD SIZE
7,419
LABOR FORCE [ PEOPLE ]
73.9%
PERCENT IN LABOR FORCE
3.3%
UNEMPLOYMENT RATE
Superior Area Codes
Income in Superior
Income Overview in Superior
Per Capita Income in Superior is $65,498, while median incomes of families and households are $173,563 and $149,464 respectively.
| Characteristic | Number | Measure |
| Per Capita Income | 13,146 | $65,498 |
| Median Family Income | 3,527 | $173,563 |
| Mean Family Income | 3,527 | $203,121 |
| Median Household Income | 4,504 | $149,464 |
| Mean Household Income | 4,504 | $187,077 |
| Income Deficit | 3,527 | $12,349 |
| Wage / Income Gap (%) | 13,146 | 25.73% |
| Wage / Income Gap ($) | 13,146 | 74.27¢ per $1 |
| Gini / Inequality Index | 13,146 | 0.39 |
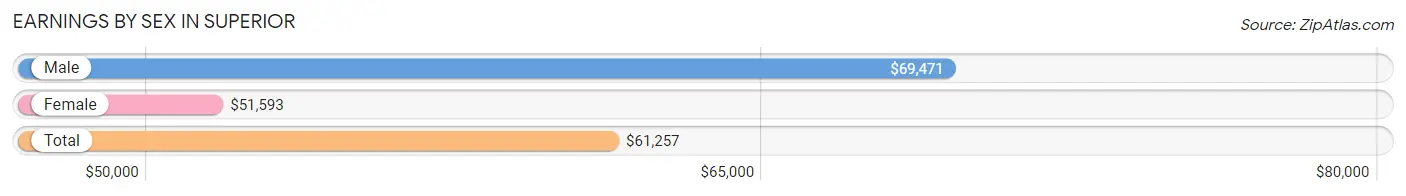
Earnings by Sex in Superior
Average Earnings in Superior are $61,257, $69,471 for men and $51,593 for women, a difference of 25.7%.
| Sex | Number | Average Earnings |
| Male | 4,539 (56.3%) | $69,471 |
| Female | 3,525 (43.7%) | $51,593 |
| Total | 8,064 (100.0%) | $61,257 |
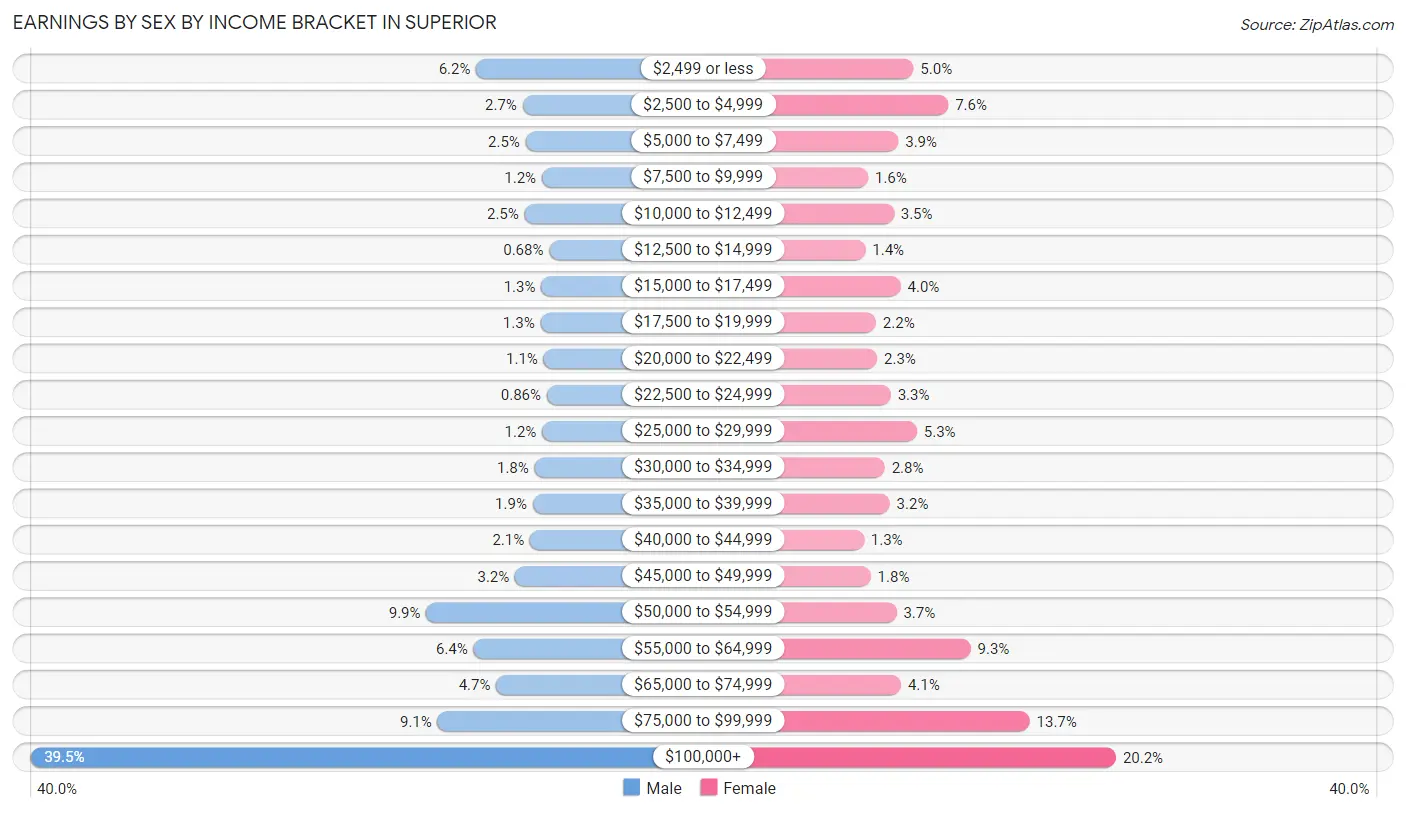
Earnings by Sex by Income Bracket in Superior
The most common earnings brackets in Superior are $100,000+ for men (1,793 | 39.5%) and $100,000+ for women (711 | 20.2%).
| Income | Male | Female |
| $2,499 or less | 279 (6.1%) | 176 (5.0%) |
| $2,500 to $4,999 | 121 (2.7%) | 268 (7.6%) |
| $5,000 to $7,499 | 111 (2.5%) | 136 (3.9%) |
| $7,500 to $9,999 | 56 (1.2%) | 56 (1.6%) |
| $10,000 to $12,499 | 115 (2.5%) | 124 (3.5%) |
| $12,500 to $14,999 | 31 (0.7%) | 49 (1.4%) |
| $15,000 to $17,499 | 58 (1.3%) | 142 (4.0%) |
| $17,500 to $19,999 | 61 (1.3%) | 77 (2.2%) |
| $20,000 to $22,499 | 50 (1.1%) | 80 (2.3%) |
| $22,500 to $24,999 | 39 (0.9%) | 116 (3.3%) |
| $25,000 to $29,999 | 55 (1.2%) | 185 (5.2%) |
| $30,000 to $34,999 | 81 (1.8%) | 100 (2.8%) |
| $35,000 to $39,999 | 87 (1.9%) | 113 (3.2%) |
| $40,000 to $44,999 | 96 (2.1%) | 45 (1.3%) |
| $45,000 to $49,999 | 147 (3.2%) | 63 (1.8%) |
| $50,000 to $54,999 | 449 (9.9%) | 131 (3.7%) |
| $55,000 to $64,999 | 288 (6.4%) | 327 (9.3%) |
| $65,000 to $74,999 | 211 (4.6%) | 143 (4.1%) |
| $75,000 to $99,999 | 411 (9.0%) | 483 (13.7%) |
| $100,000+ | 1,793 (39.5%) | 711 (20.2%) |
| Total | 4,539 (100.0%) | 3,525 (100.0%) |
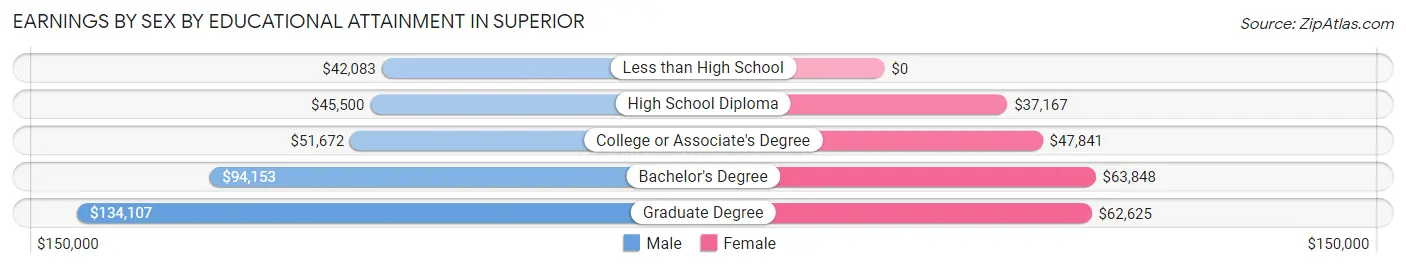
Earnings by Sex by Educational Attainment in Superior
Average earnings in Superior are $85,347 for men and $61,092 for women, a difference of 28.4%. Men with an educational attainment of graduate degree enjoy the highest average annual earnings of $134,107, while those with less than high school education earn the least with $42,083. Women with an educational attainment of bachelor's degree earn the most with the average annual earnings of $63,848, while those with high school diploma education have the smallest earnings of $37,167.
| Educational Attainment | Male Income | Female Income |
| Less than High School | $42,083 | $0 |
| High School Diploma | $45,500 | $37,167 |
| College or Associate's Degree | $51,672 | $47,841 |
| Bachelor's Degree | $94,153 | $63,848 |
| Graduate Degree | $134,107 | $62,625 |
| Total | $85,347 | $61,092 |
Family Income in Superior
Family Income Brackets in Superior
According to the Superior family income data, there are 1,316 families falling into the $200,000+ income range, which is the most common income bracket and makes up 37.3% of all families. Conversely, the less than $10,000 income bracket is the least frequent group with only 11 families (0.3%) belonging to this category.
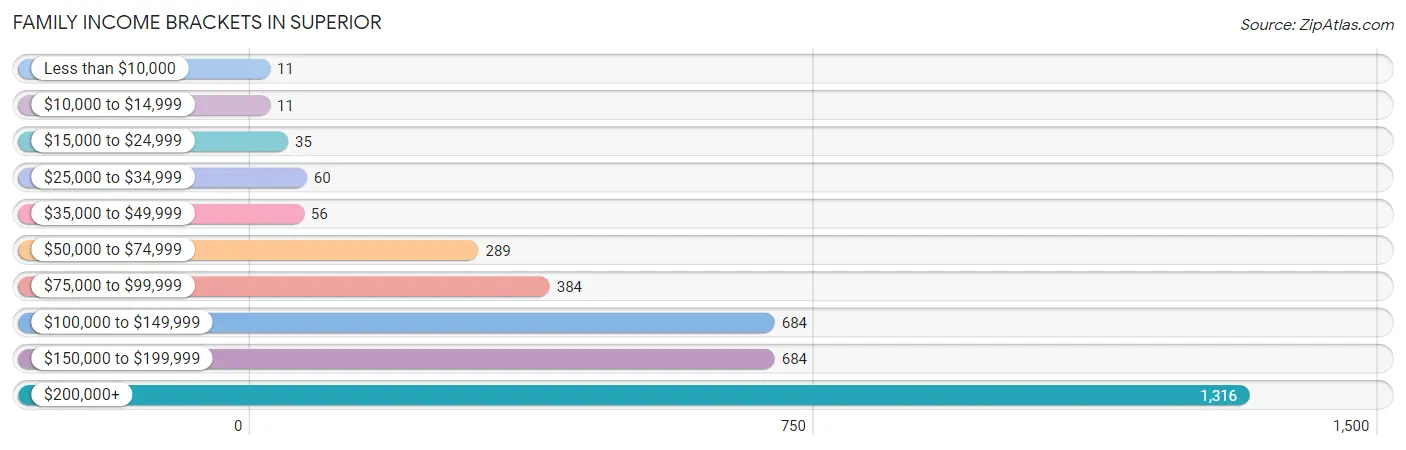
| Income Bracket | # Families | % Families |
| Less than $10,000 | 11 | 0.3% |
| $10,000 to $14,999 | 11 | 0.3% |
| $15,000 to $24,999 | 35 | 1.0% |
| $25,000 to $34,999 | 60 | 1.7% |
| $35,000 to $49,999 | 56 | 1.6% |
| $50,000 to $74,999 | 289 | 8.2% |
| $75,000 to $99,999 | 384 | 10.9% |
| $100,000 to $149,999 | 684 | 19.4% |
| $150,000 to $199,999 | 684 | 19.4% |
| $200,000+ | 1,316 | 37.3% |
Family Income by Famaliy Size in Superior
6-person families (83 | 2.4%) account for the highest median family income in Superior with $190,547 per family, while 2-person families (1,222 | 34.6%) have the highest median income of $71,160 per family member.
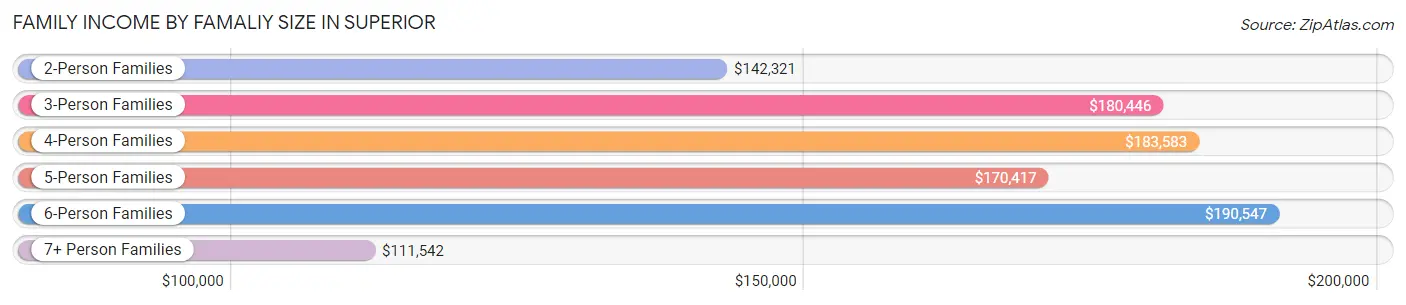
| Income Bracket | # Families | Median Income |
| 2-Person Families | 1,222 (34.6%) | $142,321 |
| 3-Person Families | 933 (26.5%) | $180,446 |
| 4-Person Families | 1,035 (29.3%) | $183,583 |
| 5-Person Families | 217 (6.1%) | $170,417 |
| 6-Person Families | 83 (2.4%) | $190,547 |
| 7+ Person Families | 37 (1.1%) | $111,542 |
| Total | 3,527 (100.0%) | $173,563 |
Family Income by Number of Earners in Superior
The median family income in Superior is $173,563, with families comprising 3+ earners (462) having the highest median family income of $225,714, while families with 1 earner (886) have the lowest median family income of $137,679, accounting for 13.1% and 25.1% of families, respectively.
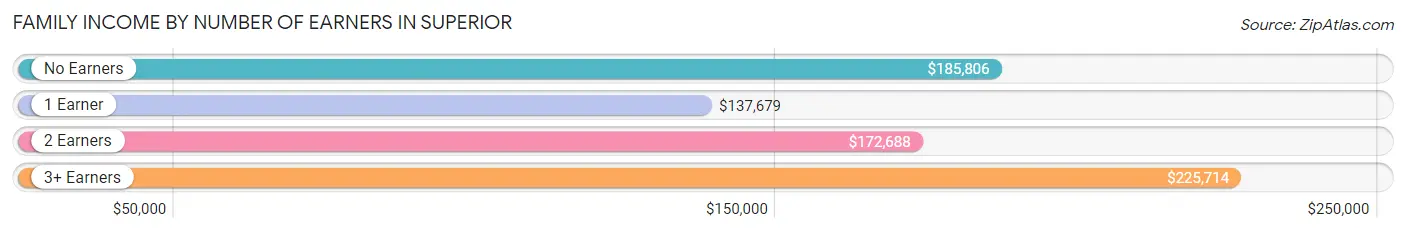
| Number of Earners | # Families | Median Income |
| No Earners | 192 (5.4%) | $185,806 |
| 1 Earner | 886 (25.1%) | $137,679 |
| 2 Earners | 1,987 (56.3%) | $172,688 |
| 3+ Earners | 462 (13.1%) | $225,714 |
| Total | 3,527 (100.0%) | $173,563 |
Household Income in Superior
Household Income Brackets in Superior
With 1,477 households falling in the category, the $200,000+ income range is the most frequent in Superior, accounting for 32.8% of all households. In contrast, only 14 households (0.3%) fall into the $10,000 to $14,999 income bracket, making it the least populous group.
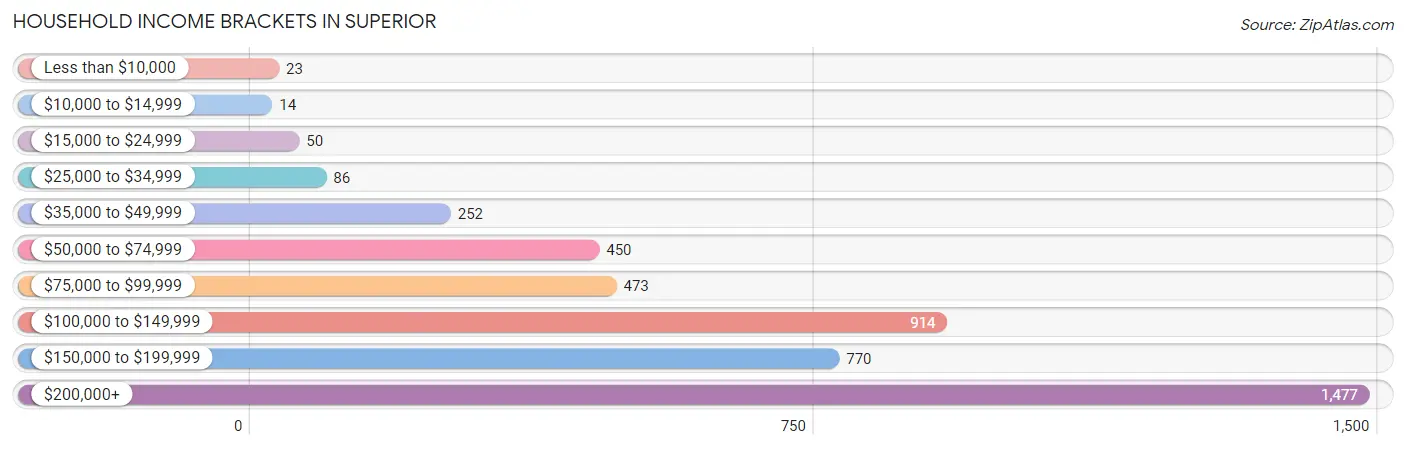
| Income Bracket | # Households | % Households |
| Less than $10,000 | 23 | 0.5% |
| $10,000 to $14,999 | 14 | 0.3% |
| $15,000 to $24,999 | 50 | 1.1% |
| $25,000 to $34,999 | 86 | 1.9% |
| $35,000 to $49,999 | 252 | 5.6% |
| $50,000 to $74,999 | 450 | 10.0% |
| $75,000 to $99,999 | 473 | 10.5% |
| $100,000 to $149,999 | 914 | 20.3% |
| $150,000 to $199,999 | 770 | 17.1% |
| $200,000+ | 1,477 | 32.8% |
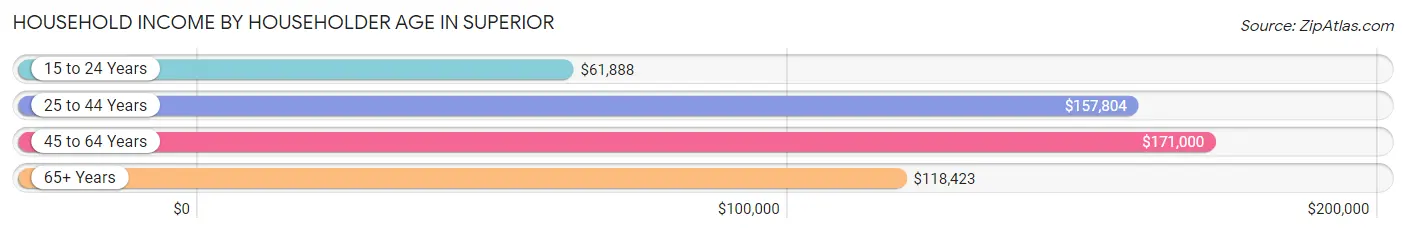
Household Income by Householder Age in Superior
The median household income in Superior is $149,464, with the highest median household income of $171,000 found in the 45 to 64 years age bracket for the primary householder. A total of 1,844 households (40.9%) fall into this category. Meanwhile, the 15 to 24 years age bracket for the primary householder has the lowest median household income of $61,888, with 129 households (2.9%) in this group.
| Income Bracket | # Households | Median Income |
| 15 to 24 Years | 129 (2.9%) | $61,888 |
| 25 to 44 Years | 1,888 (41.9%) | $157,804 |
| 45 to 64 Years | 1,844 (40.9%) | $171,000 |
| 65+ Years | 643 (14.3%) | $118,423 |
| Total | 4,504 (100.0%) | $149,464 |
Poverty in Superior
Income Below Poverty by Sex and Age in Superior
With 2.0% poverty level for males and 2.5% for females among the residents of Superior, 18 to 24 year old males and 18 to 24 year old females are the most vulnerable to poverty, with 45 males (12.2%) and 53 females (11.9%) in their respective age groups living below the poverty level.
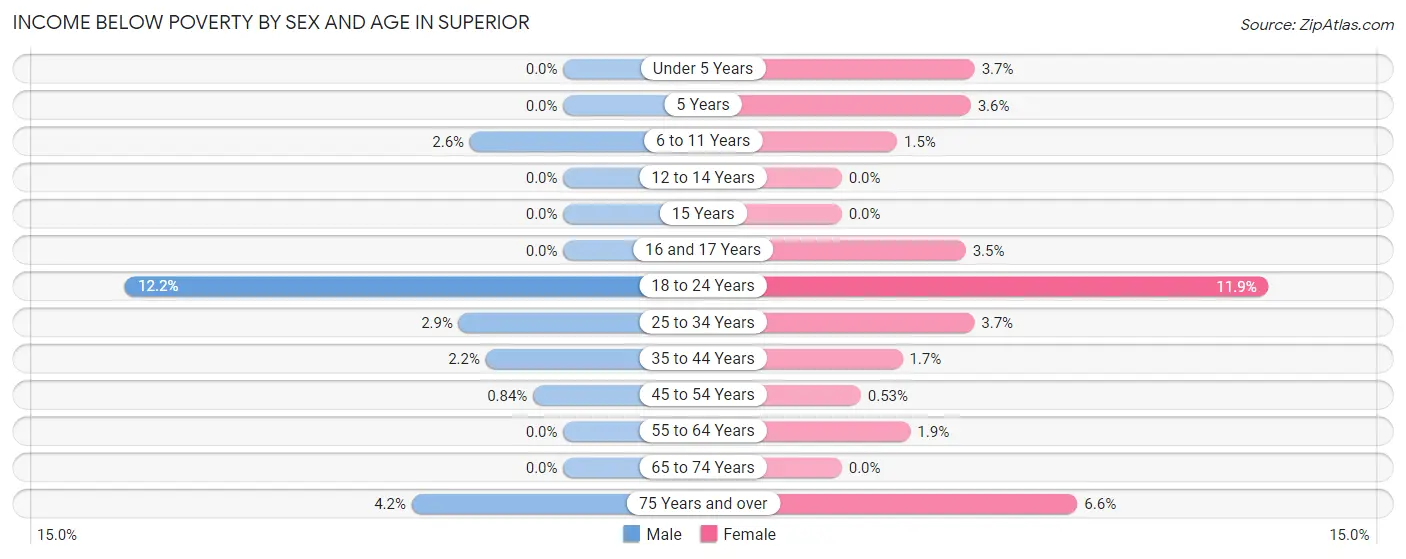
| Age Bracket | Male | Female |
| Under 5 Years | 0 (0.0%) | 13 (3.7%) |
| 5 Years | 0 (0.0%) | 8 (3.6%) |
| 6 to 11 Years | 17 (2.6%) | 8 (1.5%) |
| 12 to 14 Years | 0 (0.0%) | 0 (0.0%) |
| 15 Years | 0 (0.0%) | 0 (0.0%) |
| 16 and 17 Years | 0 (0.0%) | 7 (3.5%) |
| 18 to 24 Years | 45 (12.2%) | 53 (11.9%) |
| 25 to 34 Years | 31 (2.9%) | 20 (3.7%) |
| 35 to 44 Years | 26 (2.2%) | 21 (1.7%) |
| 45 to 54 Years | 8 (0.8%) | 6 (0.5%) |
| 55 to 64 Years | 0 (0.0%) | 12 (1.9%) |
| 65 to 74 Years | 0 (0.0%) | 0 (0.0%) |
| 75 Years and over | 7 (4.2%) | 8 (6.6%) |
| Total | 134 (2.0%) | 156 (2.5%) |
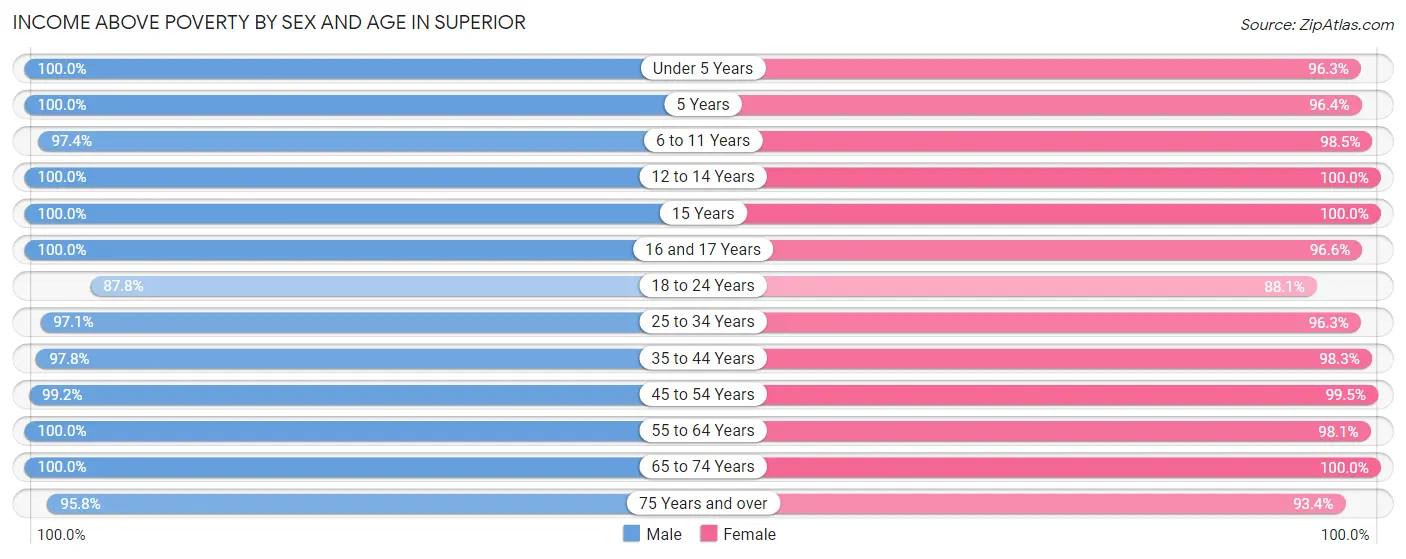
Income Above Poverty by Sex and Age in Superior
According to the poverty statistics in Superior, males aged under 5 years and females aged 12 to 14 years are the age groups that are most secure financially, with 100.0% of males and 100.0% of females in these age groups living above the poverty line.
| Age Bracket | Male | Female |
| Under 5 Years | 344 (100.0%) | 338 (96.3%) |
| 5 Years | 22 (100.0%) | 215 (96.4%) |
| 6 to 11 Years | 638 (97.4%) | 510 (98.5%) |
| 12 to 14 Years | 385 (100.0%) | 309 (100.0%) |
| 15 Years | 90 (100.0%) | 134 (100.0%) |
| 16 and 17 Years | 291 (100.0%) | 196 (96.6%) |
| 18 to 24 Years | 324 (87.8%) | 393 (88.1%) |
| 25 to 34 Years | 1,034 (97.1%) | 522 (96.3%) |
| 35 to 44 Years | 1,179 (97.8%) | 1,224 (98.3%) |
| 45 to 54 Years | 946 (99.2%) | 1,123 (99.5%) |
| 55 to 64 Years | 747 (100.0%) | 615 (98.1%) |
| 65 to 74 Years | 462 (100.0%) | 466 (100.0%) |
| 75 Years and over | 159 (95.8%) | 114 (93.4%) |
| Total | 6,621 (98.0%) | 6,159 (97.5%) |
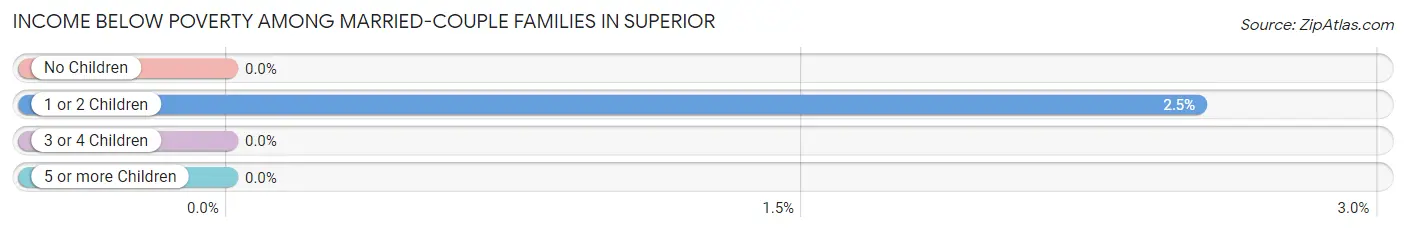
Income Below Poverty Among Married-Couple Families in Superior
The poverty statistics for married-couple families in Superior show that 1.3% or 41 of the total 3,053 families live below the poverty line. Families with 1 or 2 children have the highest poverty rate of 2.5%, comprising of 41 families. On the other hand, families with no children have the lowest poverty rate of 0.0%, which includes 0 families.
| Children | Above Poverty | Below Poverty |
| No Children | 1,267 (100.0%) | 0 (0.0%) |
| 1 or 2 Children | 1,578 (97.5%) | 41 (2.5%) |
| 3 or 4 Children | 164 (100.0%) | 0 (0.0%) |
| 5 or more Children | 3 (100.0%) | 0 (0.0%) |
| Total | 3,012 (98.7%) | 41 (1.3%) |
Income Below Poverty Among Single-Parent Households in Superior
| Children | Single Father | Single Mother |
| No Children | 0 (0.0%) | 0 (0.0%) |
| 1 or 2 Children | 0 (0.0%) | 0 (0.0%) |
| 3 or 4 Children | 0 (0.0%) | 0 (0.0%) |
| 5 or more Children | 0 (0.0%) | 0 (0.0%) |
| Total | 0 (0.0%) | 0 (0.0%) |
Income Below Poverty Among Married-Couple vs Single-Parent Households in Superior
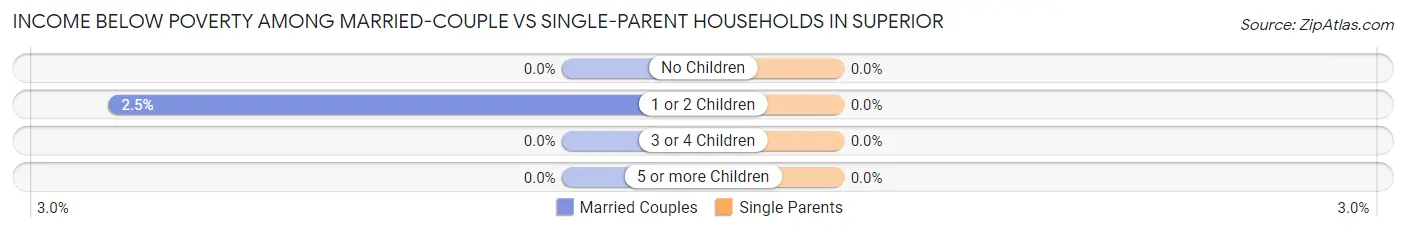
| Children | Married-Couple Families | Single-Parent Households |
| No Children | 0 (0.0%) | 0 (0.0%) |
| 1 or 2 Children | 41 (2.5%) | 0 (0.0%) |
| 3 or 4 Children | 0 (0.0%) | 0 (0.0%) |
| 5 or more Children | 0 (0.0%) | 0 (0.0%) |
| Total | 41 (1.3%) | 0 (0.0%) |
Race in Superior
The most populous races in Superior are White / Caucasian (9,640 | 73.3%), Asian (2,211 | 16.8%), and Hispanic or Latino (1,065 | 8.1%).
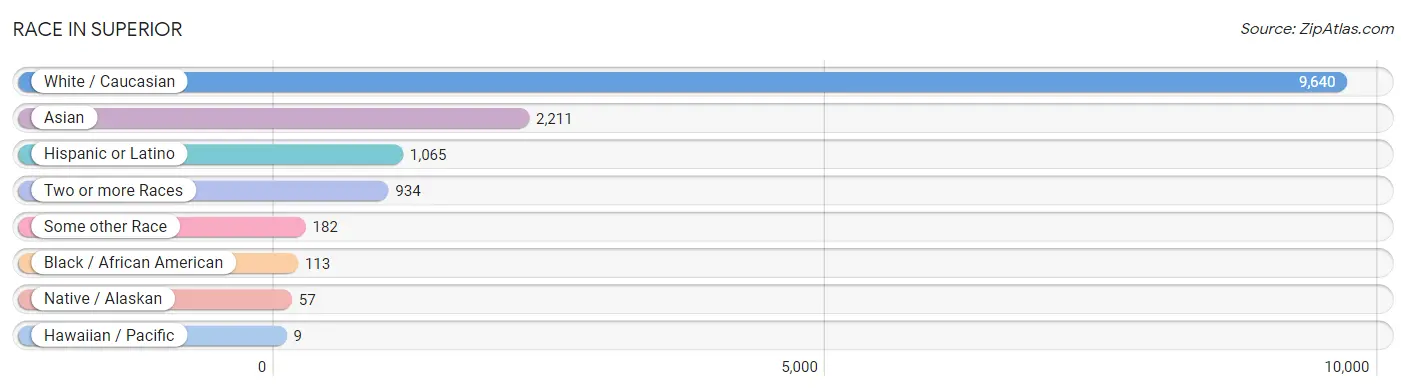
| Race | # Population | % Population |
| Asian | 2,211 | 16.8% |
| Black / African American | 113 | 0.9% |
| Hawaiian / Pacific | 9 | 0.1% |
| Hispanic or Latino | 1,065 | 8.1% |
| Native / Alaskan | 57 | 0.4% |
| White / Caucasian | 9,640 | 73.3% |
| Two or more Races | 934 | 7.1% |
| Some other Race | 182 | 1.4% |
| Total | 13,146 | 100.0% |
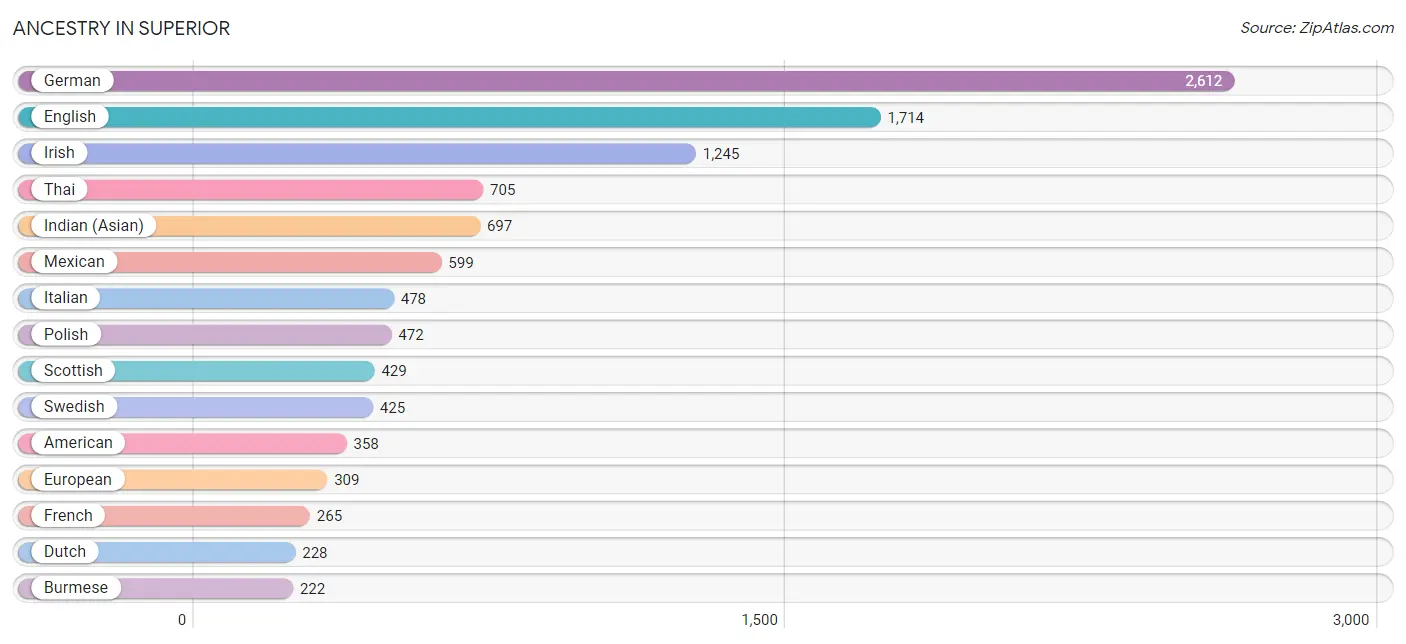
Ancestry in Superior
The most populous ancestries reported in Superior are German (2,612 | 19.9%), English (1,714 | 13.0%), Irish (1,245 | 9.5%), Thai (705 | 5.4%), and Indian (Asian) (697 | 5.3%), together accounting for 53.0% of all Superior residents.
| Ancestry | # Population | % Population |
| American | 358 | 2.7% |
| Arab | 90 | 0.7% |
| Argentinean | 115 | 0.9% |
| Australian | 43 | 0.3% |
| Austrian | 56 | 0.4% |
| Bangladeshi | 84 | 0.6% |
| Belgian | 102 | 0.8% |
| Bhutanese | 213 | 1.6% |
| Brazilian | 40 | 0.3% |
| British | 112 | 0.9% |
| Bulgarian | 6 | 0.1% |
| Burmese | 222 | 1.7% |
| Canadian | 86 | 0.6% |
| Central American | 66 | 0.5% |
| Cherokee | 68 | 0.5% |
| Choctaw | 75 | 0.6% |
| Colombian | 48 | 0.4% |
| Croatian | 39 | 0.3% |
| Czech | 61 | 0.5% |
| Czechoslovakian | 14 | 0.1% |
| Danish | 103 | 0.8% |
| Dutch | 228 | 1.7% |
| Eastern European | 79 | 0.6% |
| English | 1,714 | 13.0% |
| Ethiopian | 9 | 0.1% |
| European | 309 | 2.4% |
| Filipino | 12 | 0.1% |
| Finnish | 28 | 0.2% |
| French | 265 | 2.0% |
| French Canadian | 18 | 0.1% |
| German | 2,612 | 19.9% |
| Ghanaian | 8 | 0.1% |
| Greek | 40 | 0.3% |
| Guamanian / Chamorro | 17 | 0.1% |
| Guatemalan | 46 | 0.4% |
| Hungarian | 43 | 0.3% |
| Indian (Asian) | 697 | 5.3% |
| Iranian | 29 | 0.2% |
| Irish | 1,245 | 9.5% |
| Israeli | 32 | 0.2% |
| Italian | 478 | 3.6% |
| Korean | 42 | 0.3% |
| Lebanese | 25 | 0.2% |
| Lithuanian | 100 | 0.8% |
| Mexican | 599 | 4.6% |
| Northern European | 93 | 0.7% |
| Norwegian | 167 | 1.3% |
| Okinawan | 13 | 0.1% |
| Pakistani | 21 | 0.2% |
| Panamanian | 20 | 0.2% |
| Peruvian | 35 | 0.3% |
| Polish | 472 | 3.6% |
| Portuguese | 80 | 0.6% |
| Potawatomi | 22 | 0.2% |
| Puerto Rican | 38 | 0.3% |
| Romanian | 34 | 0.3% |
| Russian | 42 | 0.3% |
| Scandinavian | 116 | 0.9% |
| Scotch-Irish | 62 | 0.5% |
| Scottish | 429 | 3.3% |
| Serbian | 10 | 0.1% |
| Sioux | 5 | 0.0% |
| Slovak | 76 | 0.6% |
| South American | 198 | 1.5% |
| Spaniard | 91 | 0.7% |
| Spanish | 16 | 0.1% |
| Sri Lankan | 106 | 0.8% |
| Subsaharan African | 17 | 0.1% |
| Swedish | 425 | 3.2% |
| Swiss | 23 | 0.2% |
| Syrian | 7 | 0.1% |
| Thai | 705 | 5.4% |
| Trinidadian and Tobagonian | 25 | 0.2% |
| Turkish | 19 | 0.1% |
| Ukrainian | 94 | 0.7% |
| Welsh | 117 | 0.9% | View All 76 Rows |
Immigrants in Superior
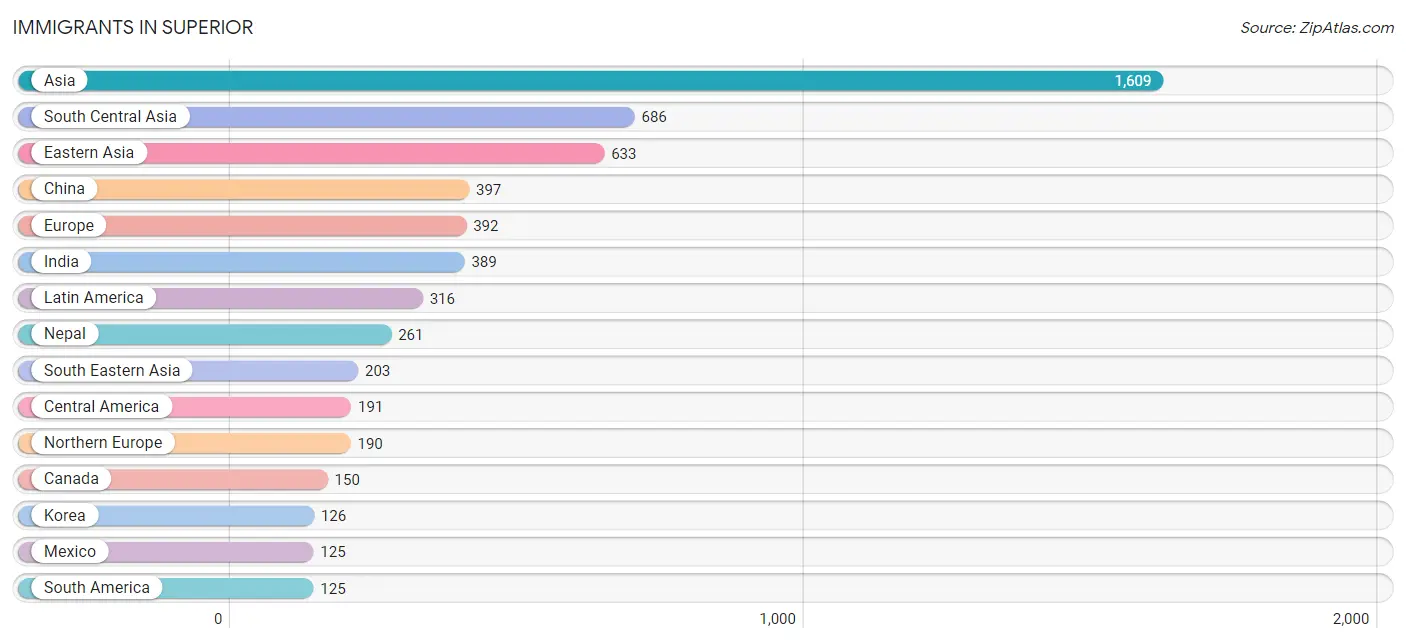
The most numerous immigrant groups reported in Superior came from Asia (1,609 | 12.2%), South Central Asia (686 | 5.2%), Eastern Asia (633 | 4.8%), China (397 | 3.0%), and Europe (392 | 3.0%), together accounting for 28.3% of all Superior residents.
| Immigration Origin | # Population | % Population |
| Africa | 24 | 0.2% |
| Argentina | 73 | 0.6% |
| Asia | 1,609 | 12.2% |
| Australia | 43 | 0.3% |
| Brazil | 52 | 0.4% |
| Bulgaria | 6 | 0.1% |
| Canada | 150 | 1.1% |
| Central America | 191 | 1.5% |
| China | 397 | 3.0% |
| Eastern Asia | 633 | 4.8% |
| Eastern Europe | 81 | 0.6% |
| England | 25 | 0.2% |
| Europe | 392 | 3.0% |
| France | 41 | 0.3% |
| Germany | 58 | 0.4% |
| Ghana | 8 | 0.1% |
| Guatemala | 46 | 0.4% |
| Hong Kong | 15 | 0.1% |
| India | 389 | 3.0% |
| Iran | 15 | 0.1% |
| Israel | 24 | 0.2% |
| Japan | 110 | 0.8% |
| Korea | 126 | 1.0% |
| Laos | 43 | 0.3% |
| Latin America | 316 | 2.4% |
| Lebanon | 38 | 0.3% |
| Malaysia | 32 | 0.2% |
| Mexico | 125 | 0.9% |
| Nepal | 261 | 2.0% |
| Northern Africa | 16 | 0.1% |
| Northern Europe | 190 | 1.5% |
| Oceania | 43 | 0.3% |
| Pakistan | 21 | 0.2% |
| Panama | 20 | 0.2% |
| Philippines | 42 | 0.3% |
| Poland | 23 | 0.2% |
| Portugal | 6 | 0.1% |
| Romania | 52 | 0.4% |
| Singapore | 13 | 0.1% |
| South America | 125 | 0.9% |
| South Central Asia | 686 | 5.2% |
| South Eastern Asia | 203 | 1.5% |
| Southern Europe | 6 | 0.1% |
| Sweden | 58 | 0.4% |
| Switzerland | 16 | 0.1% |
| Taiwan | 26 | 0.2% |
| Thailand | 5 | 0.0% |
| Turkey | 25 | 0.2% |
| Vietnam | 68 | 0.5% |
| Western Africa | 8 | 0.1% |
| Western Asia | 87 | 0.7% |
| Western Europe | 115 | 0.9% | View All 52 Rows |
Sex and Age in Superior
Sex and Age in Superior
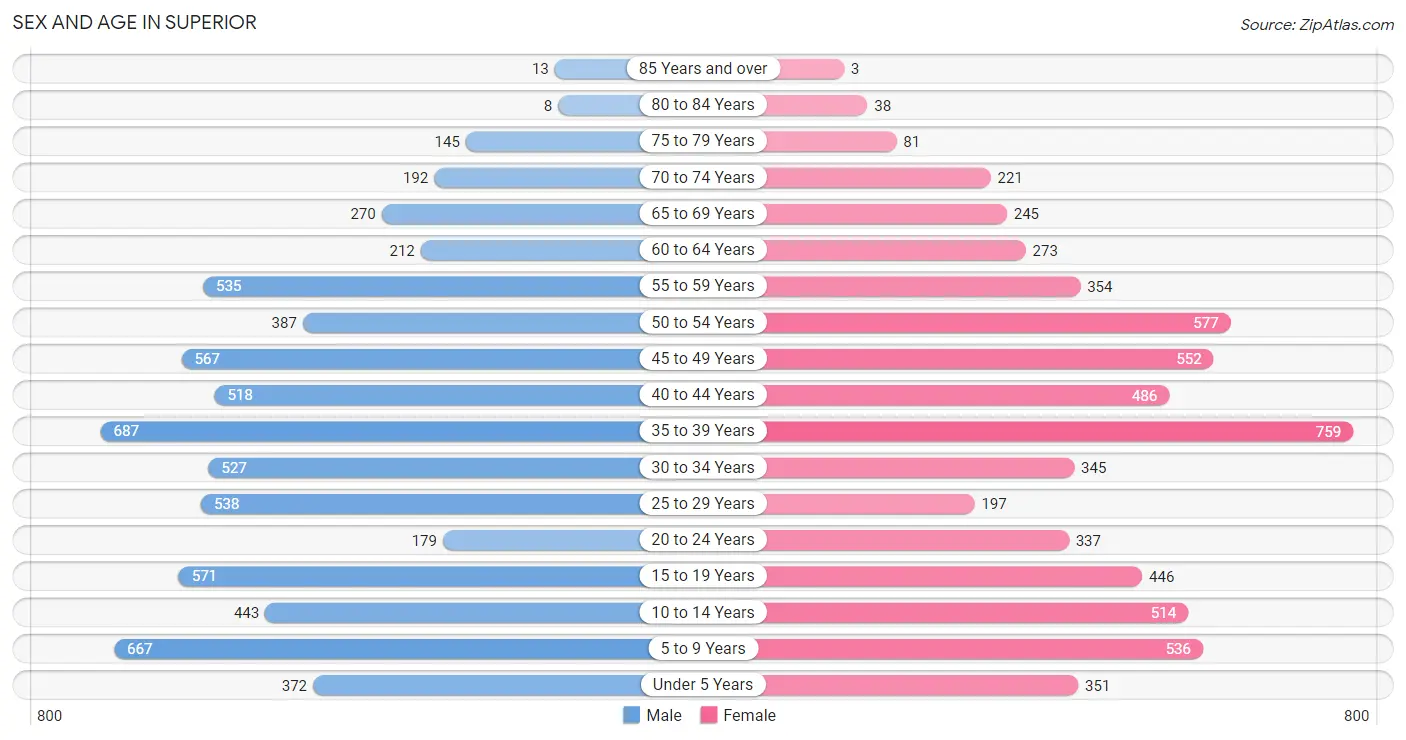
The most populous age groups in Superior are 35 to 39 Years (687 | 10.1%) for men and 35 to 39 Years (759 | 12.0%) for women.
| Age Bracket | Male | Female |
| Under 5 Years | 372 (5.4%) | 351 (5.6%) |
| 5 to 9 Years | 667 (9.8%) | 536 (8.5%) |
| 10 to 14 Years | 443 (6.5%) | 514 (8.1%) |
| 15 to 19 Years | 571 (8.4%) | 446 (7.1%) |
| 20 to 24 Years | 179 (2.6%) | 337 (5.3%) |
| 25 to 29 Years | 538 (7.9%) | 197 (3.1%) |
| 30 to 34 Years | 527 (7.7%) | 345 (5.5%) |
| 35 to 39 Years | 687 (10.1%) | 759 (12.0%) |
| 40 to 44 Years | 518 (7.6%) | 486 (7.7%) |
| 45 to 49 Years | 567 (8.3%) | 552 (8.7%) |
| 50 to 54 Years | 387 (5.7%) | 577 (9.1%) |
| 55 to 59 Years | 535 (7.8%) | 354 (5.6%) |
| 60 to 64 Years | 212 (3.1%) | 273 (4.3%) |
| 65 to 69 Years | 270 (4.0%) | 245 (3.9%) |
| 70 to 74 Years | 192 (2.8%) | 221 (3.5%) |
| 75 to 79 Years | 145 (2.1%) | 81 (1.3%) |
| 80 to 84 Years | 8 (0.1%) | 38 (0.6%) |
| 85 Years and over | 13 (0.2%) | 3 (0.1%) |
| Total | 6,831 (100.0%) | 6,315 (100.0%) |
Families and Households in Superior
Median Family Size in Superior
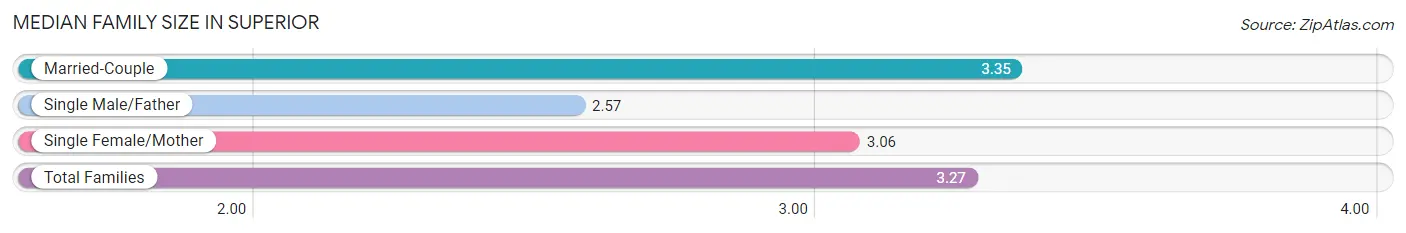
The median family size in Superior is 3.27 persons per family, with married-couple families (3,053 | 86.6%) accounting for the largest median family size of 3.35 persons per family. On the other hand, single male/father families (275 | 7.8%) represent the smallest median family size with 2.57 persons per family.
| Family Type | # Families | Family Size |
| Married-Couple | 3,053 (86.6%) | 3.35 |
| Single Male/Father | 275 (7.8%) | 2.57 |
| Single Female/Mother | 199 (5.6%) | 3.06 |
| Total Families | 3,527 (100.0%) | 3.27 |
Median Household Size in Superior
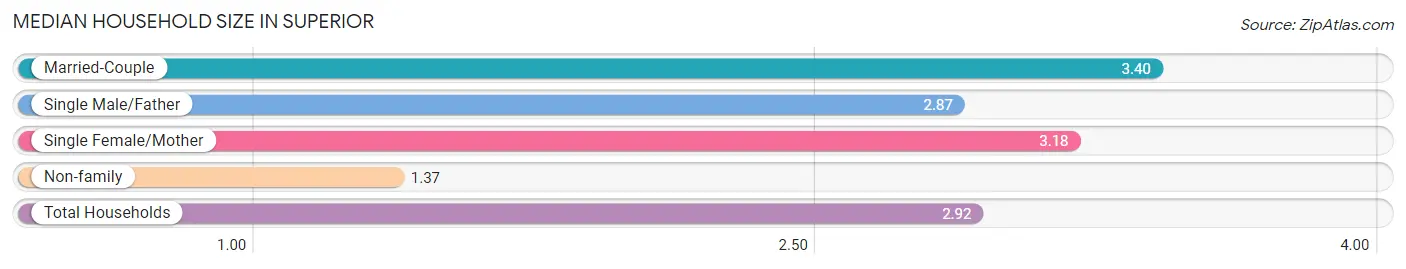
The median household size in Superior is 2.92 persons per household, with married-couple households (3,053 | 67.8%) accounting for the largest median household size of 3.4 persons per household. non-family households (977 | 21.7%) represent the smallest median household size with 1.37 persons per household.
| Household Type | # Households | Household Size |
| Married-Couple | 3,053 (67.8%) | 3.40 |
| Single Male/Father | 275 (6.1%) | 2.87 |
| Single Female/Mother | 199 (4.4%) | 3.18 |
| Non-family | 977 (21.7%) | 1.37 |
| Total Households | 4,504 (100.0%) | 2.92 |
Household Size by Marriage Status in Superior
Out of a total of 4,504 households in Superior, 3,527 (78.3%) are family households, while 977 (21.7%) are nonfamily households. The most numerous type of family households are 2-person households, comprising 1,119, and the most common type of nonfamily households are 1-person households, comprising 703.
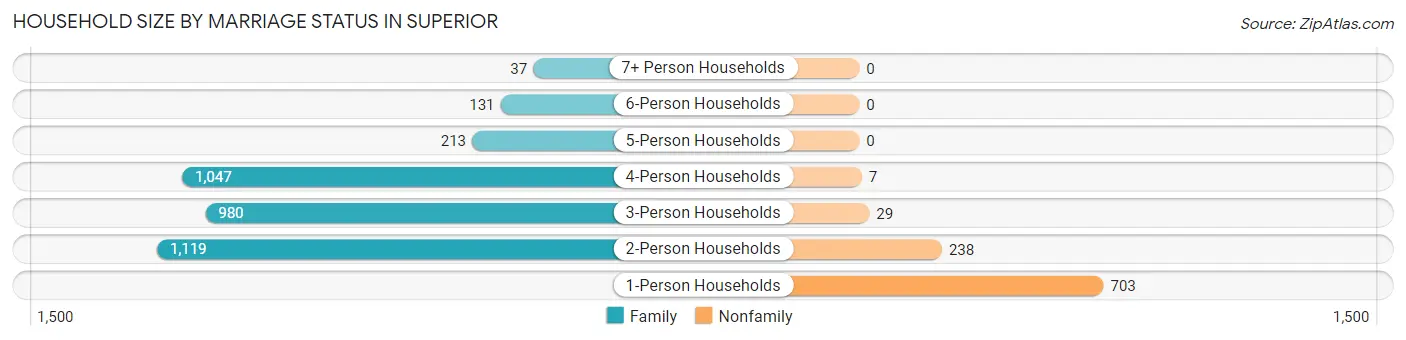
| Household Size | Family Households | Nonfamily Households |
| 1-Person Households | - | 703 (15.6%) |
| 2-Person Households | 1,119 (24.8%) | 238 (5.3%) |
| 3-Person Households | 980 (21.8%) | 29 (0.6%) |
| 4-Person Households | 1,047 (23.3%) | 7 (0.2%) |
| 5-Person Households | 213 (4.7%) | 0 (0.0%) |
| 6-Person Households | 131 (2.9%) | 0 (0.0%) |
| 7+ Person Households | 37 (0.8%) | 0 (0.0%) |
| Total | 3,527 (78.3%) | 977 (21.7%) |
Female Fertility in Superior
Fertility by Age in Superior
Average fertility rate in Superior is 99.0 births per 1,000 women. Women in the age bracket of 35 to 50 years have the highest fertility rate with 143.0 births per 1,000 women. Women in the age bracket of 35 to 50 years acount for 86.2% of all women with births.
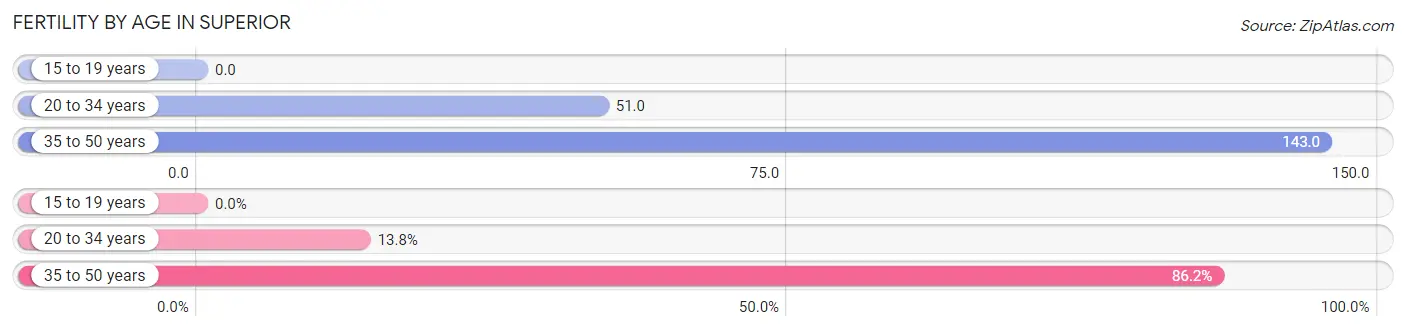
| Age Bracket | Women with Births | Births / 1,000 Women |
| 15 to 19 years | 0 (0.0%) | 0.0 |
| 20 to 34 years | 45 (13.8%) | 51.0 |
| 35 to 50 years | 281 (86.2%) | 143.0 |
| Total | 326 (100.0%) | 99.0 |
Fertility by Age by Marriage Status in Superior
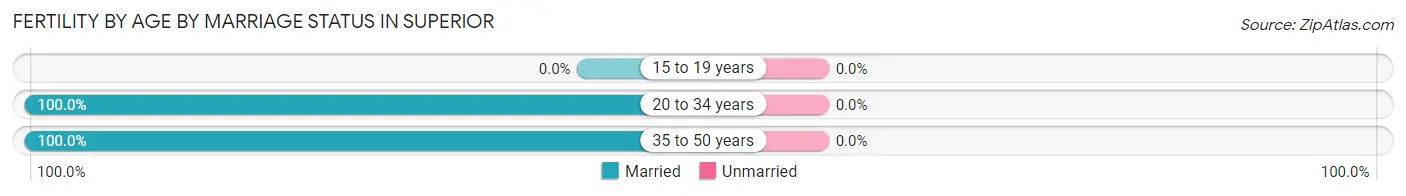
| Age Bracket | Married | Unmarried |
| 15 to 19 years | 0 (0.0%) | 0 (0.0%) |
| 20 to 34 years | 45 (100.0%) | 0 (0.0%) |
| 35 to 50 years | 281 (100.0%) | 0 (0.0%) |
| Total | 326 (100.0%) | 0 (0.0%) |
Fertility by Education in Superior
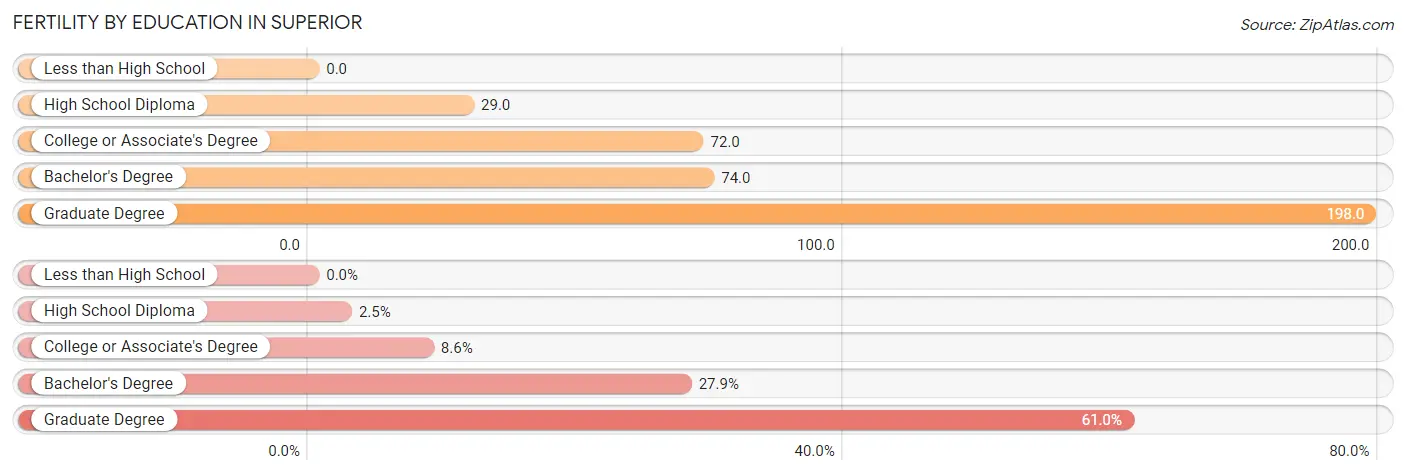
| Educational Attainment | Women with Births | Births / 1,000 Women |
| Less than High School | 0 (0.0%) | 0.0 |
| High School Diploma | 8 (2.5%) | 29.0 |
| College or Associate's Degree | 28 (8.6%) | 72.0 |
| Bachelor's Degree | 91 (27.9%) | 74.0 |
| Graduate Degree | 199 (61.0%) | 198.0 |
| Total | 326 (100.0%) | 99.0 |
Fertility by Education by Marriage Status in Superior
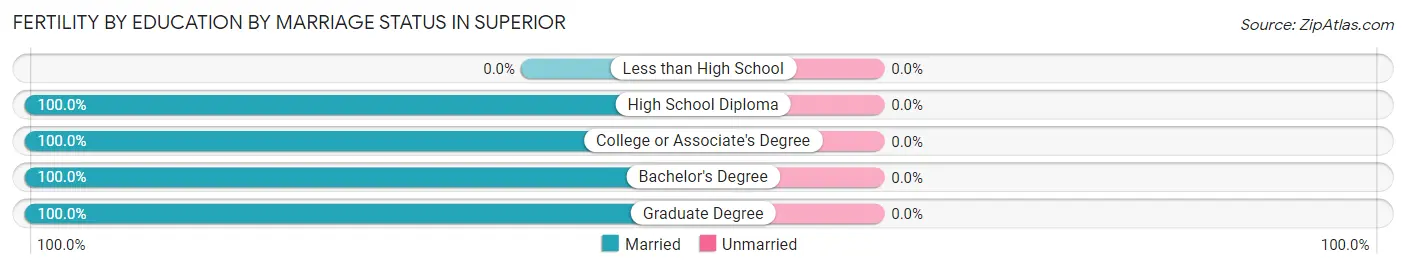
| Educational Attainment | Married | Unmarried |
| Less than High School | 0 (0.0%) | 0 (0.0%) |
| High School Diploma | 8 (100.0%) | 0 (0.0%) |
| College or Associate's Degree | 28 (100.0%) | 0 (0.0%) |
| Bachelor's Degree | 91 (100.0%) | 0 (0.0%) |
| Graduate Degree | 199 (100.0%) | 0 (0.0%) |
| Total | 326 (100.0%) | 0 (0.0%) |
Employment Characteristics in Superior
Employment by Class of Employer in Superior
Among the 7,060 employed individuals in Superior, private company employees (4,790 | 67.8%), not-for-profit organizations (581 | 8.2%), and self-employed (not incorporated) (452 | 6.4%) make up the most common classes of employment.
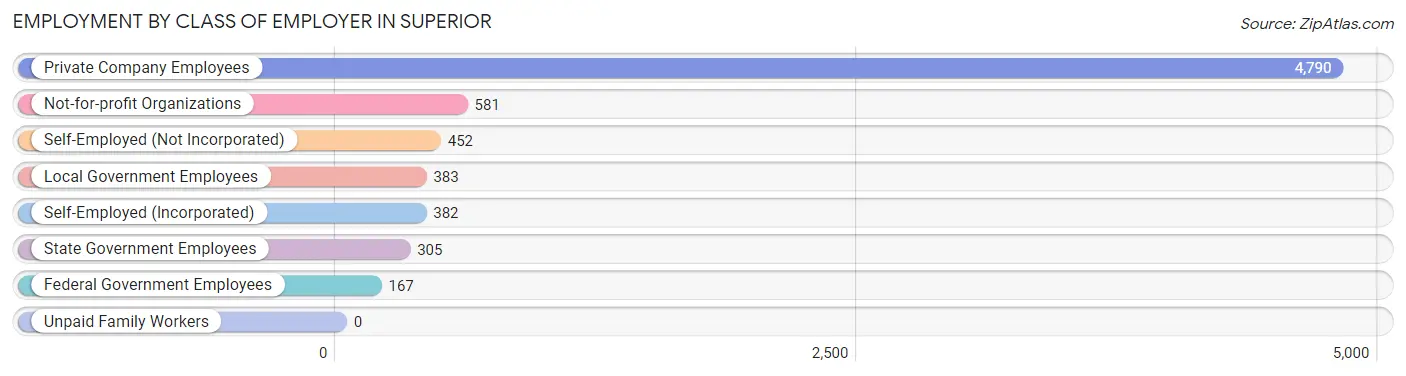
| Employer Class | # Employees | % Employees |
| Private Company Employees | 4,790 | 67.8% |
| Self-Employed (Incorporated) | 382 | 5.4% |
| Self-Employed (Not Incorporated) | 452 | 6.4% |
| Not-for-profit Organizations | 581 | 8.2% |
| Local Government Employees | 383 | 5.4% |
| State Government Employees | 305 | 4.3% |
| Federal Government Employees | 167 | 2.4% |
| Unpaid Family Workers | 0 | 0.0% |
| Total | 7,060 | 100.0% |
Employment Status by Age in Superior
According to the labor force statistics for Superior, out of the total population over 16 years of age (10,039), 73.9% or 7,419 individuals are in the labor force, with 3.3% or 245 of them unemployed. The age group with the highest labor force participation rate is 45 to 54 years, with 86.3% or 1,798 individuals in the labor force. Within the labor force, the 16 to 19 years age range has the highest percentage of unemployed individuals, with 15.3% or 53 of them being unemployed.
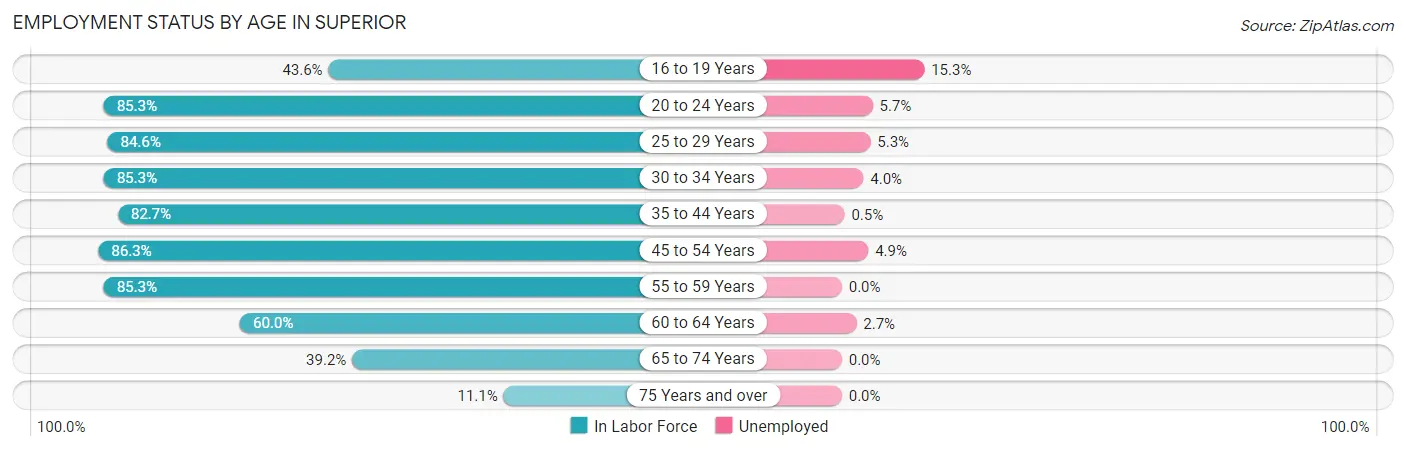
| Age Bracket | In Labor Force | Unemployed |
| 16 to 19 Years | 346 (43.6%) | 53 (15.3%) |
| 20 to 24 Years | 440 (85.3%) | 25 (5.7%) |
| 25 to 29 Years | 622 (84.6%) | 33 (5.3%) |
| 30 to 34 Years | 744 (85.3%) | 30 (4.0%) |
| 35 to 44 Years | 2,026 (82.7%) | 10 (0.5%) |
| 45 to 54 Years | 1,798 (86.3%) | 88 (4.9%) |
| 55 to 59 Years | 758 (85.3%) | 0 (0.0%) |
| 60 to 64 Years | 291 (60.0%) | 8 (2.7%) |
| 65 to 74 Years | 364 (39.2%) | 0 (0.0%) |
| 75 Years and over | 32 (11.1%) | 0 (0.0%) |
| Total | 7,419 (73.9%) | 245 (3.3%) |
Employment Status by Educational Attainment in Superior
According to labor force statistics for Superior, 83.0% of individuals (6,237) out of the total population between 25 and 64 years of age (7,514) are in the labor force, with 2.7% or 168 of them being unemployed. The group with the highest labor force participation rate are those with the educational attainment of less than high school, with 100.0% or 136 individuals in the labor force. Within the labor force, individuals with high school diploma education have the highest percentage of unemployment, with 15.4% or 31 of them being unemployed.
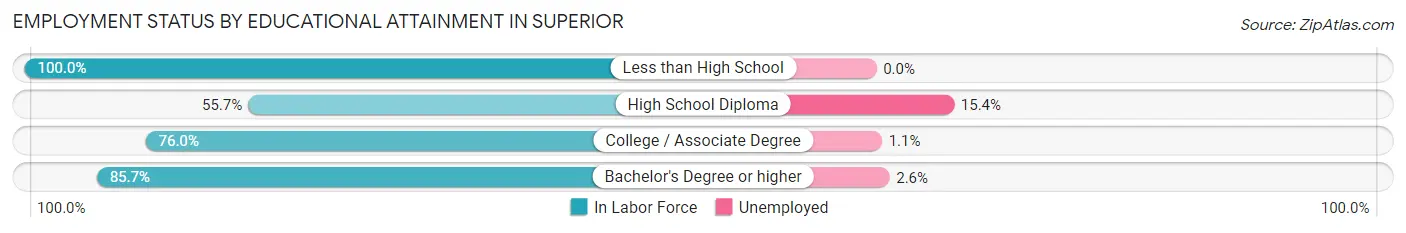
| Educational Attainment | In Labor Force | Unemployed |
| Less than High School | 136 (100.0%) | 0 (0.0%) |
| High School Diploma | 201 (55.7%) | 56 (15.4%) |
| College / Associate Degree | 898 (76.0%) | 13 (1.1%) |
| Bachelor's Degree or higher | 5,001 (85.7%) | 152 (2.6%) |
| Total | 6,237 (83.0%) | 203 (2.7%) |
Employment Occupations by Sex in Superior
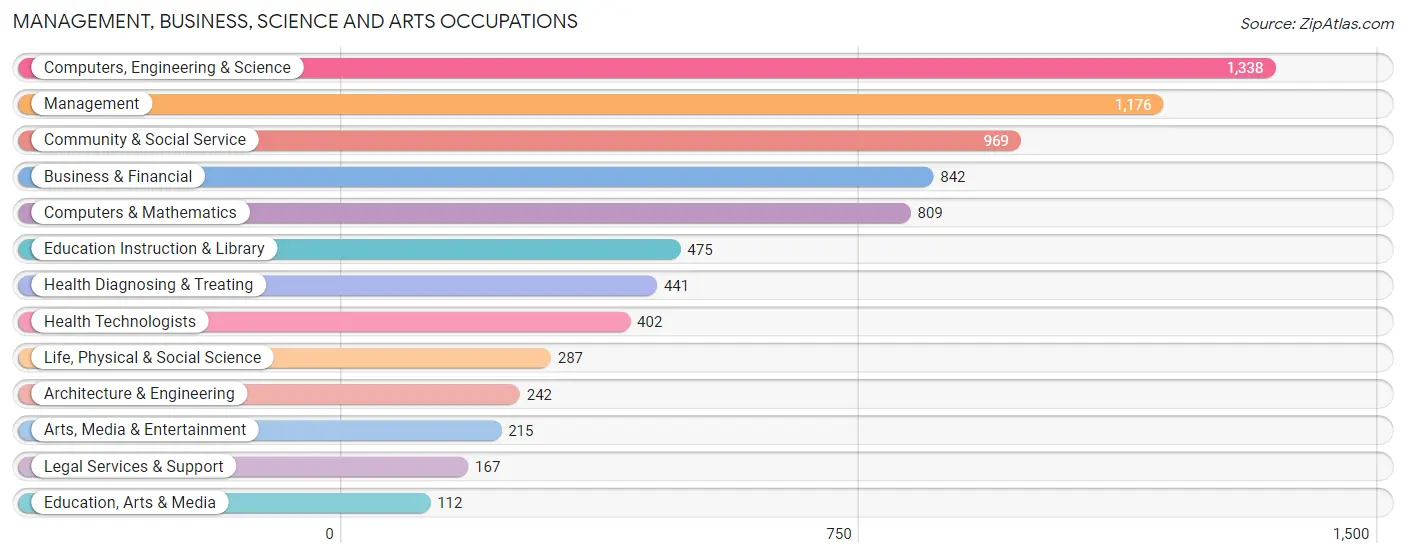
Management, Business, Science and Arts Occupations
The most common Management, Business, Science and Arts occupations in Superior are Computers, Engineering & Science (1,338 | 18.7%), Management (1,176 | 16.4%), Community & Social Service (969 | 13.5%), Business & Financial (842 | 11.8%), and Computers & Mathematics (809 | 11.3%).
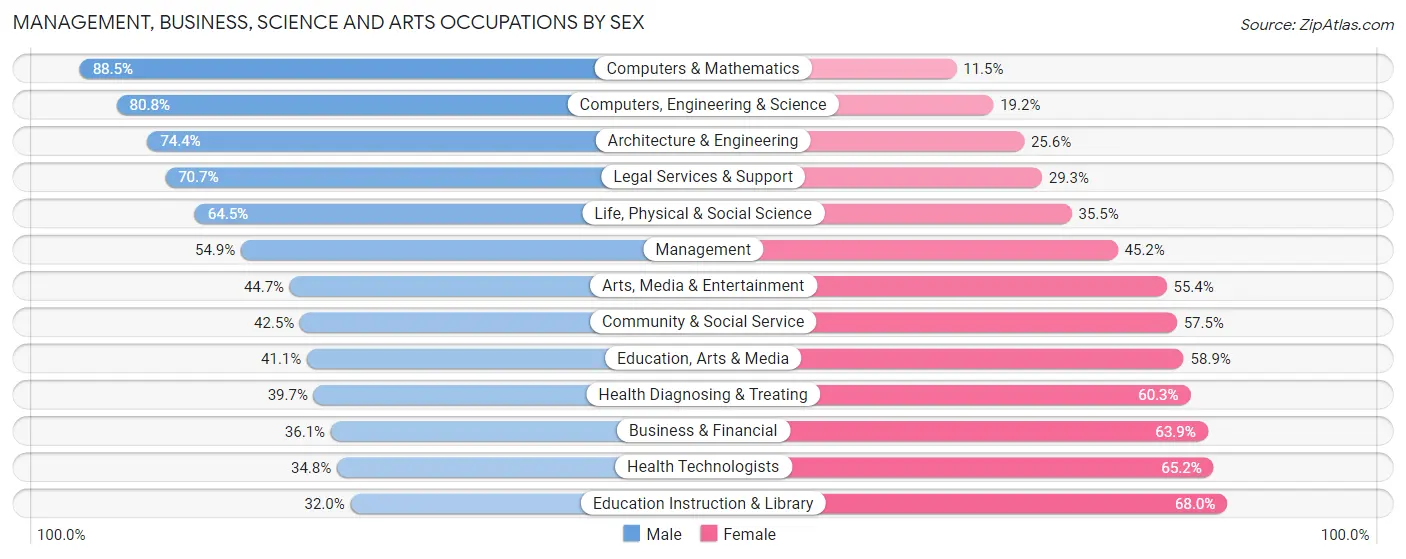
Management, Business, Science and Arts Occupations by Sex
Within the Management, Business, Science and Arts occupations in Superior, the most male-oriented occupations are Computers & Mathematics (88.5%), Computers, Engineering & Science (80.8%), and Architecture & Engineering (74.4%), while the most female-oriented occupations are Education Instruction & Library (68.0%), Health Technologists (65.2%), and Business & Financial (63.9%).
| Occupation | Male | Female |
| Management | 645 (54.8%) | 531 (45.2%) |
| Business & Financial | 304 (36.1%) | 538 (63.9%) |
| Computers, Engineering & Science | 1,081 (80.8%) | 257 (19.2%) |
| Computers & Mathematics | 716 (88.5%) | 93 (11.5%) |
| Architecture & Engineering | 180 (74.4%) | 62 (25.6%) |
| Life, Physical & Social Science | 185 (64.5%) | 102 (35.5%) |
| Community & Social Service | 412 (42.5%) | 557 (57.5%) |
| Education, Arts & Media | 46 (41.1%) | 66 (58.9%) |
| Legal Services & Support | 118 (70.7%) | 49 (29.3%) |
| Education Instruction & Library | 152 (32.0%) | 323 (68.0%) |
| Arts, Media & Entertainment | 96 (44.7%) | 119 (55.3%) |
| Health Diagnosing & Treating | 175 (39.7%) | 266 (60.3%) |
| Health Technologists | 140 (34.8%) | 262 (65.2%) |
| Total (Category) | 2,617 (54.9%) | 2,149 (45.1%) |
| Total (Overall) | 4,119 (57.5%) | 3,042 (42.5%) |
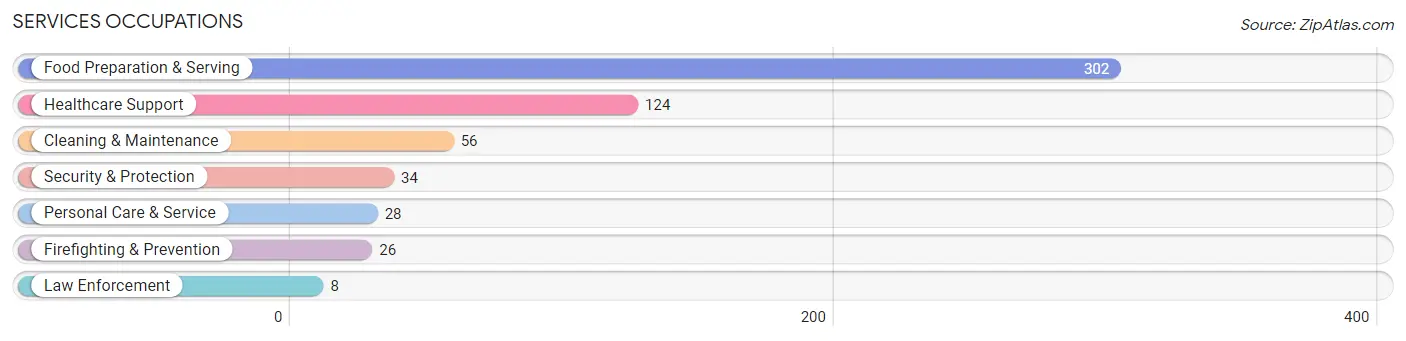
Services Occupations
The most common Services occupations in Superior are Food Preparation & Serving (302 | 4.2%), Healthcare Support (124 | 1.7%), Cleaning & Maintenance (56 | 0.8%), Security & Protection (34 | 0.5%), and Personal Care & Service (28 | 0.4%).
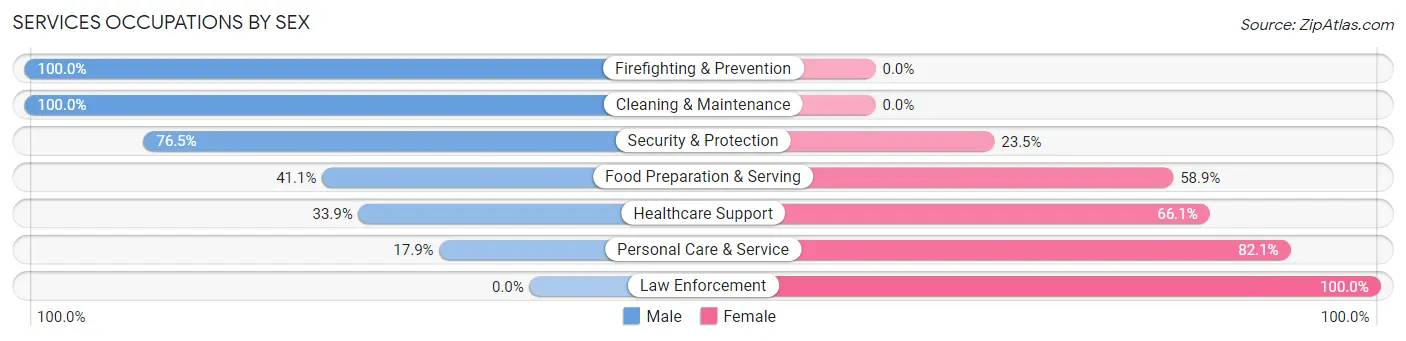
Services Occupations by Sex
Within the Services occupations in Superior, the most male-oriented occupations are Firefighting & Prevention (100.0%), Cleaning & Maintenance (100.0%), and Security & Protection (76.5%), while the most female-oriented occupations are Law Enforcement (100.0%), Personal Care & Service (82.1%), and Healthcare Support (66.1%).
| Occupation | Male | Female |
| Healthcare Support | 42 (33.9%) | 82 (66.1%) |
| Security & Protection | 26 (76.5%) | 8 (23.5%) |
| Firefighting & Prevention | 26 (100.0%) | 0 (0.0%) |
| Law Enforcement | 0 (0.0%) | 8 (100.0%) |
| Food Preparation & Serving | 124 (41.1%) | 178 (58.9%) |
| Cleaning & Maintenance | 56 (100.0%) | 0 (0.0%) |
| Personal Care & Service | 5 (17.9%) | 23 (82.1%) |
| Total (Category) | 253 (46.5%) | 291 (53.5%) |
| Total (Overall) | 4,119 (57.5%) | 3,042 (42.5%) |
Sales and Office Occupations
The most common Sales and Office occupations in Superior are Sales & Related (661 | 9.2%), and Office & Administration (439 | 6.1%).
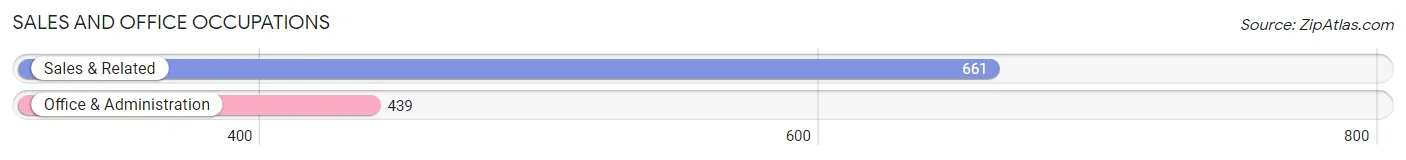
Sales and Office Occupations by Sex
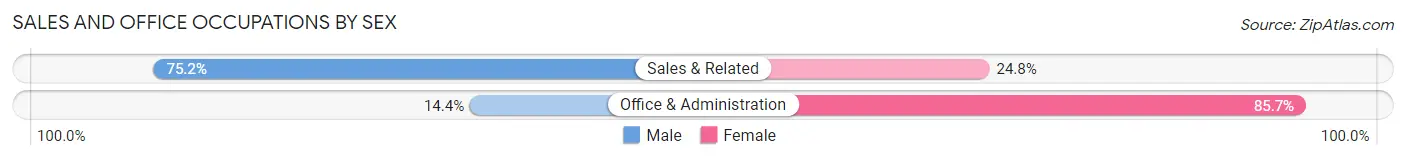
| Occupation | Male | Female |
| Sales & Related | 497 (75.2%) | 164 (24.8%) |
| Office & Administration | 63 (14.3%) | 376 (85.7%) |
| Total (Category) | 560 (50.9%) | 540 (49.1%) |
| Total (Overall) | 4,119 (57.5%) | 3,042 (42.5%) |
Natural Resources, Construction and Maintenance Occupations
The most common Natural Resources, Construction and Maintenance occupations in Superior are Construction & Extraction (276 | 3.8%), and Installation, Maintenance & Repair (84 | 1.2%).
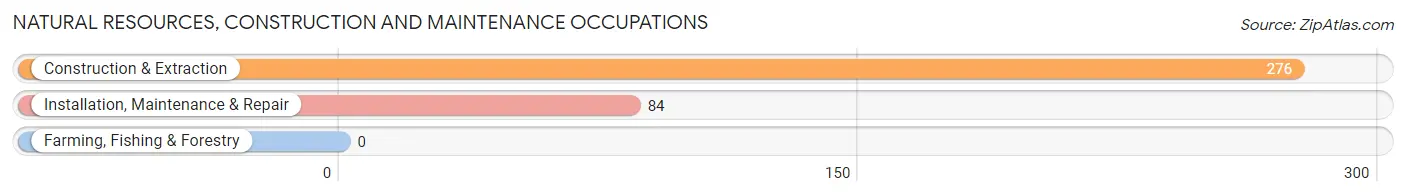
Natural Resources, Construction and Maintenance Occupations by Sex
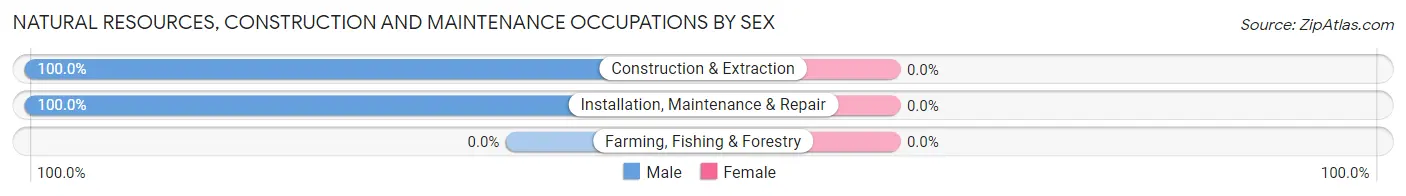
| Occupation | Male | Female |
| Farming, Fishing & Forestry | 0 (0.0%) | 0 (0.0%) |
| Construction & Extraction | 276 (100.0%) | 0 (0.0%) |
| Installation, Maintenance & Repair | 84 (100.0%) | 0 (0.0%) |
| Total (Category) | 360 (100.0%) | 0 (0.0%) |
| Total (Overall) | 4,119 (57.5%) | 3,042 (42.5%) |
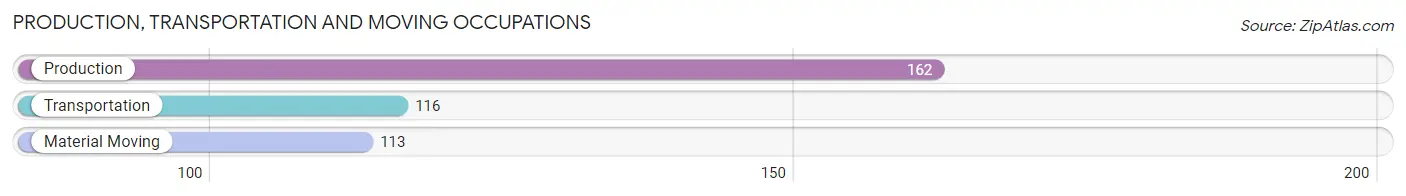
Production, Transportation and Moving Occupations
The most common Production, Transportation and Moving occupations in Superior are Production (162 | 2.3%), Transportation (116 | 1.6%), and Material Moving (113 | 1.6%).
Production, Transportation and Moving Occupations by Sex
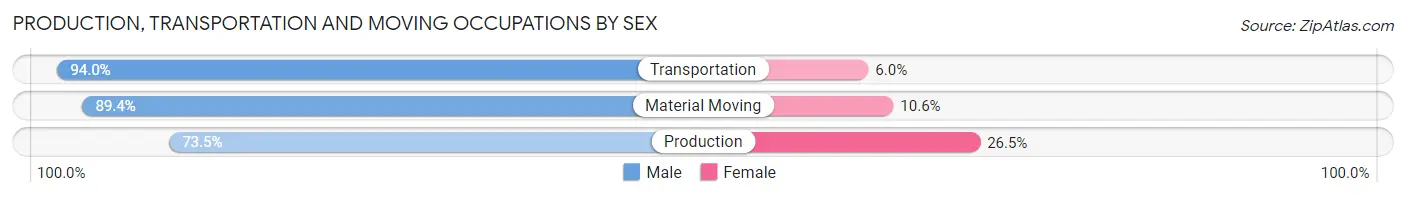
| Occupation | Male | Female |
| Production | 119 (73.5%) | 43 (26.5%) |
| Transportation | 109 (94.0%) | 7 (6.0%) |
| Material Moving | 101 (89.4%) | 12 (10.6%) |
| Total (Category) | 329 (84.1%) | 62 (15.9%) |
| Total (Overall) | 4,119 (57.5%) | 3,042 (42.5%) |
Employment Industries by Sex in Superior
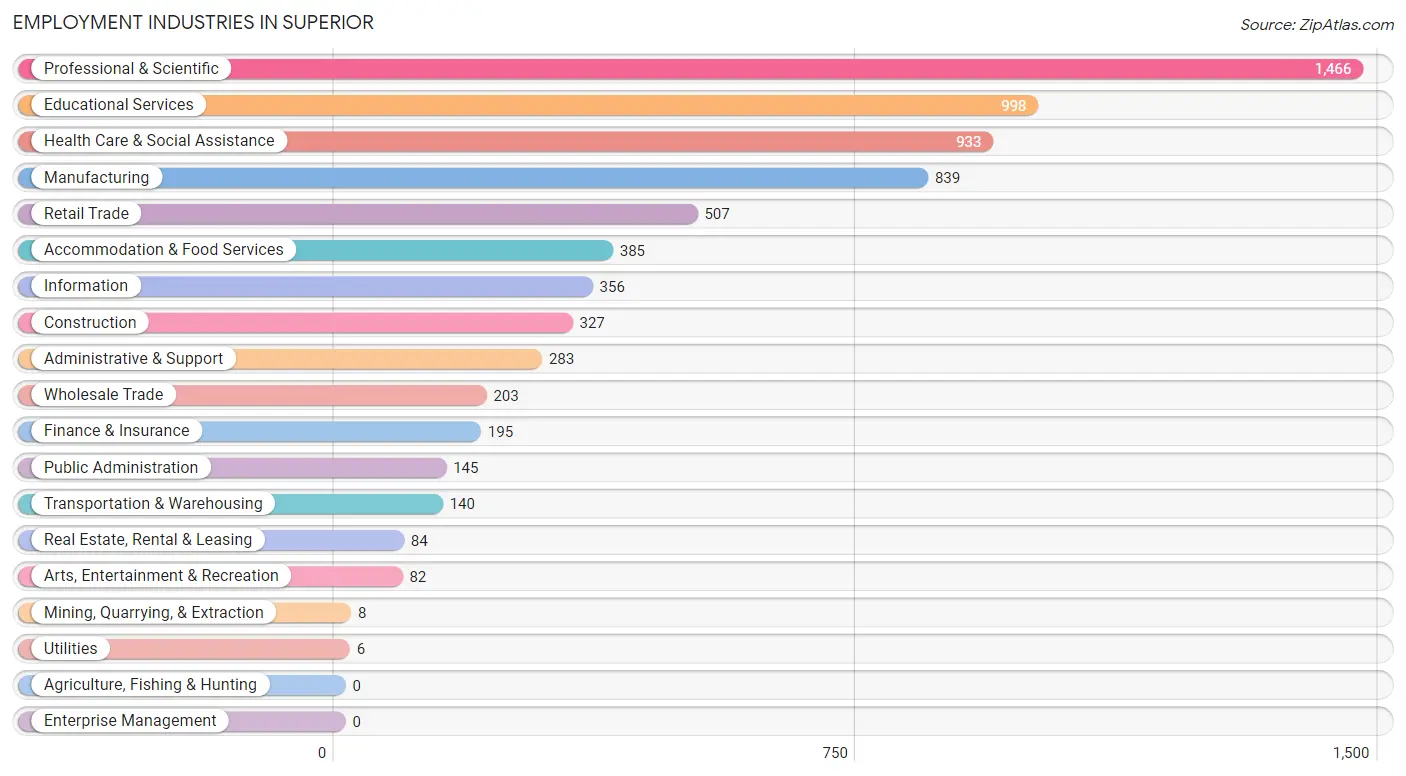
Employment Industries in Superior
The major employment industries in Superior include Professional & Scientific (1,466 | 20.5%), Educational Services (998 | 13.9%), Health Care & Social Assistance (933 | 13.0%), Manufacturing (839 | 11.7%), and Retail Trade (507 | 7.1%).
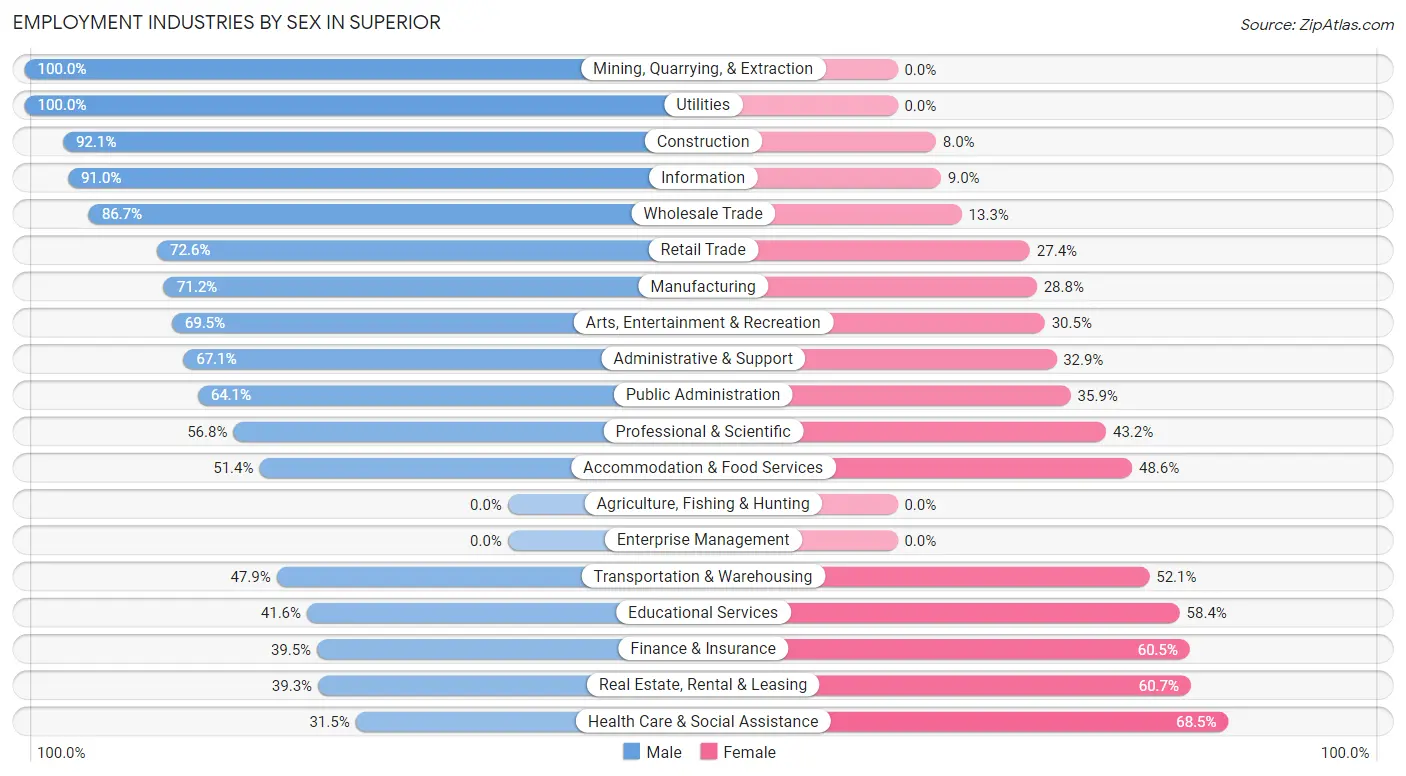
Employment Industries by Sex in Superior
The Superior industries that see more men than women are Mining, Quarrying, & Extraction (100.0%), Utilities (100.0%), and Construction (92.0%), whereas the industries that tend to have a higher number of women are Health Care & Social Assistance (68.5%), Real Estate, Rental & Leasing (60.7%), and Finance & Insurance (60.5%).
| Industry | Male | Female |
| Agriculture, Fishing & Hunting | 0 (0.0%) | 0 (0.0%) |
| Mining, Quarrying, & Extraction | 8 (100.0%) | 0 (0.0%) |
| Construction | 301 (92.0%) | 26 (8.0%) |
| Manufacturing | 597 (71.2%) | 242 (28.8%) |
| Wholesale Trade | 176 (86.7%) | 27 (13.3%) |
| Retail Trade | 368 (72.6%) | 139 (27.4%) |
| Transportation & Warehousing | 67 (47.9%) | 73 (52.1%) |
| Utilities | 6 (100.0%) | 0 (0.0%) |
| Information | 324 (91.0%) | 32 (9.0%) |
| Finance & Insurance | 77 (39.5%) | 118 (60.5%) |
| Real Estate, Rental & Leasing | 33 (39.3%) | 51 (60.7%) |
| Professional & Scientific | 833 (56.8%) | 633 (43.2%) |
| Enterprise Management | 0 (0.0%) | 0 (0.0%) |
| Administrative & Support | 190 (67.1%) | 93 (32.9%) |
| Educational Services | 415 (41.6%) | 583 (58.4%) |
| Health Care & Social Assistance | 294 (31.5%) | 639 (68.5%) |
| Arts, Entertainment & Recreation | 57 (69.5%) | 25 (30.5%) |
| Accommodation & Food Services | 198 (51.4%) | 187 (48.6%) |
| Public Administration | 93 (64.1%) | 52 (35.9%) |
| Total | 4,119 (57.5%) | 3,042 (42.5%) |
Education in Superior
School Enrollment in Superior
The most common levels of schooling among the 3,837 students in Superior are high school (851 | 22.2%), elementary school (847 | 22.1%), and middle school (782 | 20.4%).
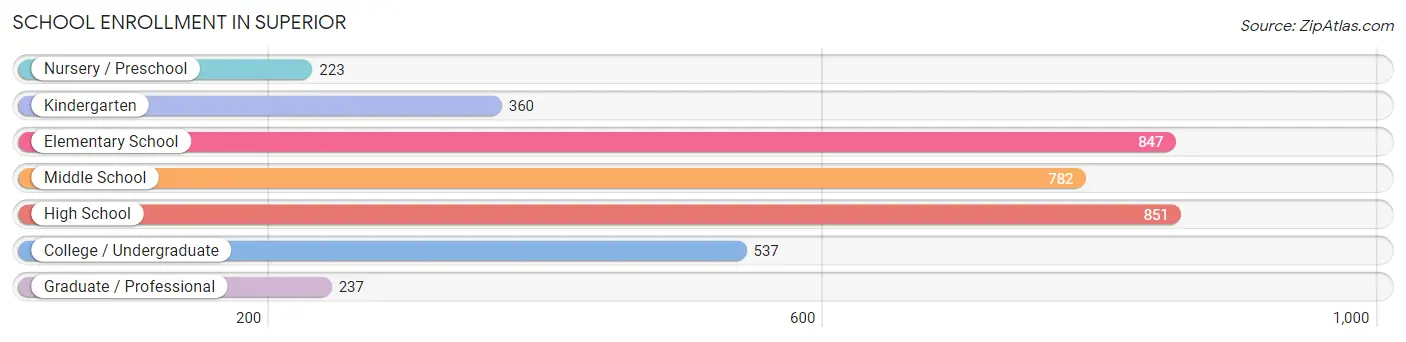
| School Level | # Students | % Students |
| Nursery / Preschool | 223 | 5.8% |
| Kindergarten | 360 | 9.4% |
| Elementary School | 847 | 22.1% |
| Middle School | 782 | 20.4% |
| High School | 851 | 22.2% |
| College / Undergraduate | 537 | 14.0% |
| Graduate / Professional | 237 | 6.2% |
| Total | 3,837 | 100.0% |
School Enrollment by Age by Funding Source in Superior
Out of a total of 3,837 students who are enrolled in schools in Superior, 445 (11.6%) attend a private institution, while the remaining 3,392 (88.4%) are enrolled in public schools. The age group of 3 to 4 year olds has the highest likelihood of being enrolled in private schools, with 81 (57.0% in the age bracket) enrolled. Conversely, the age group of 15 to 17 year olds has the lowest likelihood of being enrolled in a private school, with 703 (98.6% in the age bracket) attending a public institution.
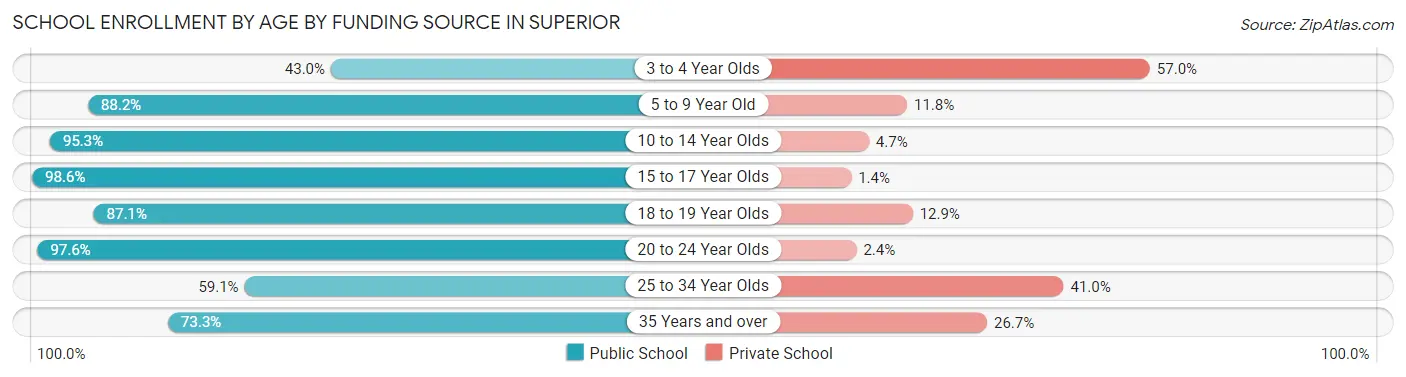
| Age Bracket | Public School | Private School |
| 3 to 4 Year Olds | 61 (43.0%) | 81 (57.0%) |
| 5 to 9 Year Old | 1,061 (88.2%) | 142 (11.8%) |
| 10 to 14 Year Olds | 912 (95.3%) | 45 (4.7%) |
| 15 to 17 Year Olds | 703 (98.6%) | 10 (1.4%) |
| 18 to 19 Year Olds | 122 (87.1%) | 18 (12.9%) |
| 20 to 24 Year Olds | 245 (97.6%) | 6 (2.4%) |
| 25 to 34 Year Olds | 124 (59.1%) | 86 (40.9%) |
| 35 Years and over | 162 (73.3%) | 59 (26.7%) |
| Total | 3,392 (88.4%) | 445 (11.6%) |
Educational Attainment by Field of Study in Superior
Business (1,152 | 16.1%), engineering (923 | 12.9%), bio, nature & agricultural (737 | 10.3%), social sciences (663 | 9.2%), and computers & mathematics (601 | 8.4%) are the most common fields of study among 7,169 individuals in Superior who have obtained a bachelor's degree or higher.
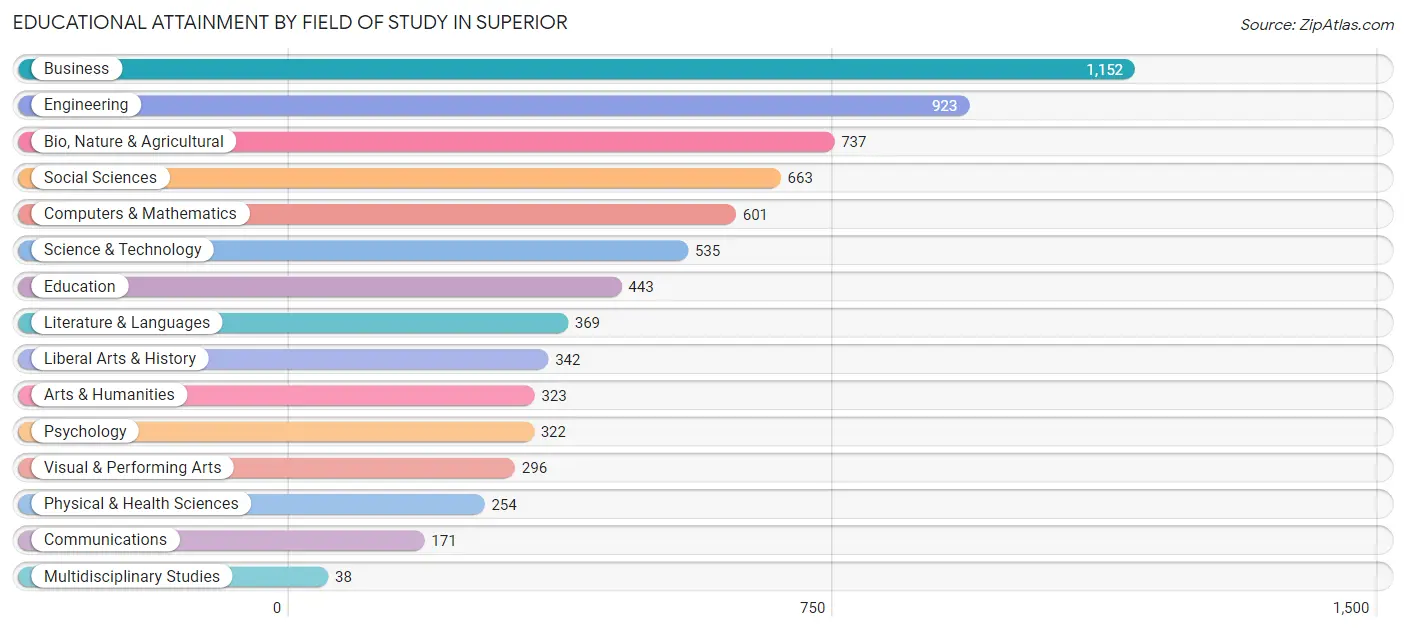
| Field of Study | # Graduates | % Graduates |
| Computers & Mathematics | 601 | 8.4% |
| Bio, Nature & Agricultural | 737 | 10.3% |
| Physical & Health Sciences | 254 | 3.5% |
| Psychology | 322 | 4.5% |
| Social Sciences | 663 | 9.2% |
| Engineering | 923 | 12.9% |
| Multidisciplinary Studies | 38 | 0.5% |
| Science & Technology | 535 | 7.5% |
| Business | 1,152 | 16.1% |
| Education | 443 | 6.2% |
| Literature & Languages | 369 | 5.1% |
| Liberal Arts & History | 342 | 4.8% |
| Visual & Performing Arts | 296 | 4.1% |
| Communications | 171 | 2.4% |
| Arts & Humanities | 323 | 4.5% |
| Total | 7,169 | 100.0% |
Transportation & Commute in Superior
Vehicle Availability by Sex in Superior
The most prevalent vehicle ownership categories in Superior are males with 2 vehicles (1,728, accounting for 42.8%) and females with 2 vehicles (1,302, making up 57.2%).
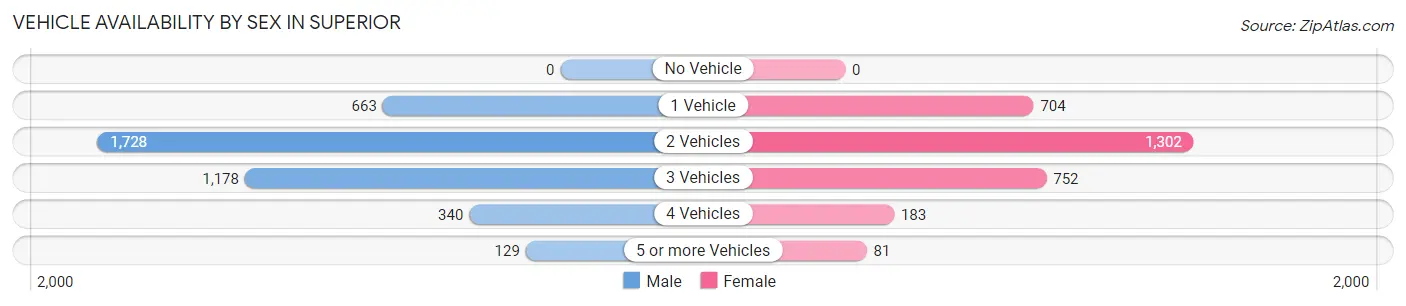
| Vehicles Available | Male | Female |
| No Vehicle | 0 (0.0%) | 0 (0.0%) |
| 1 Vehicle | 663 (16.4%) | 704 (23.3%) |
| 2 Vehicles | 1,728 (42.8%) | 1,302 (43.1%) |
| 3 Vehicles | 1,178 (29.2%) | 752 (24.9%) |
| 4 Vehicles | 340 (8.4%) | 183 (6.1%) |
| 5 or more Vehicles | 129 (3.2%) | 81 (2.7%) |
| Total | 4,038 (100.0%) | 3,022 (100.0%) |
Commute Time in Superior
The most frequently occuring commute durations in Superior are 15 to 19 minutes (908 commuters, 17.5%), 10 to 14 minutes (904 commuters, 17.4%), and 20 to 24 minutes (855 commuters, 16.5%).
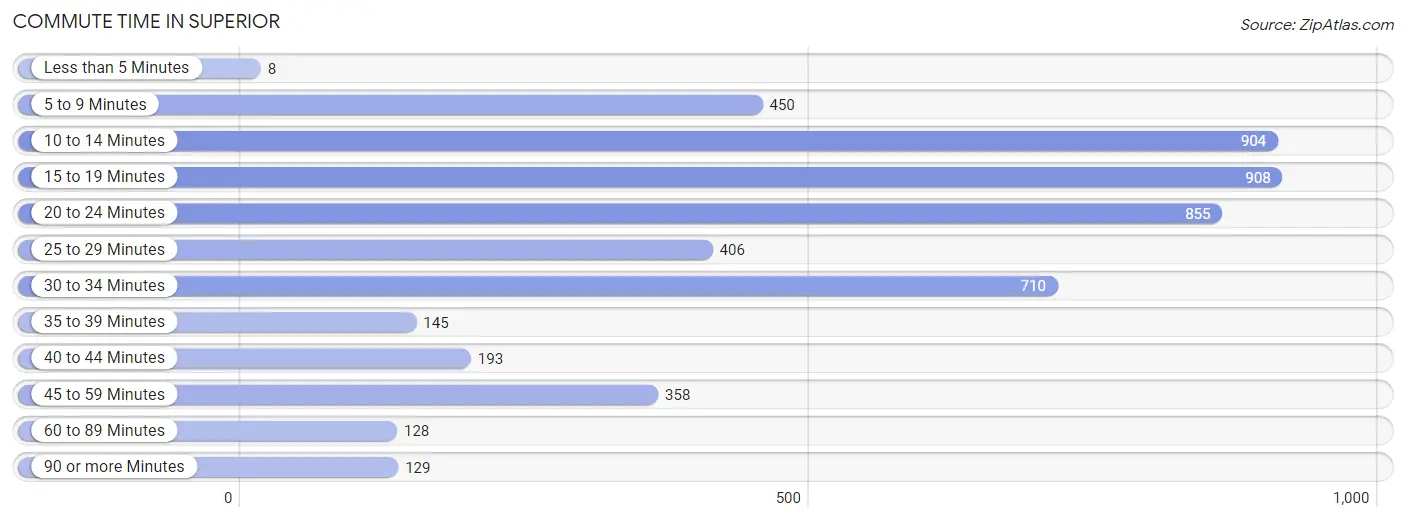
| Commute Time | # Commuters | % Commuters |
| Less than 5 Minutes | 8 | 0.2% |
| 5 to 9 Minutes | 450 | 8.7% |
| 10 to 14 Minutes | 904 | 17.4% |
| 15 to 19 Minutes | 908 | 17.5% |
| 20 to 24 Minutes | 855 | 16.5% |
| 25 to 29 Minutes | 406 | 7.8% |
| 30 to 34 Minutes | 710 | 13.7% |
| 35 to 39 Minutes | 145 | 2.8% |
| 40 to 44 Minutes | 193 | 3.7% |
| 45 to 59 Minutes | 358 | 6.9% |
| 60 to 89 Minutes | 128 | 2.5% |
| 90 or more Minutes | 129 | 2.5% |
Commute Time by Sex in Superior
The most common commute times in Superior are 30 to 34 minutes (569 commuters, 18.6%) for males and 10 to 14 minutes (478 commuters, 22.4%) for females.
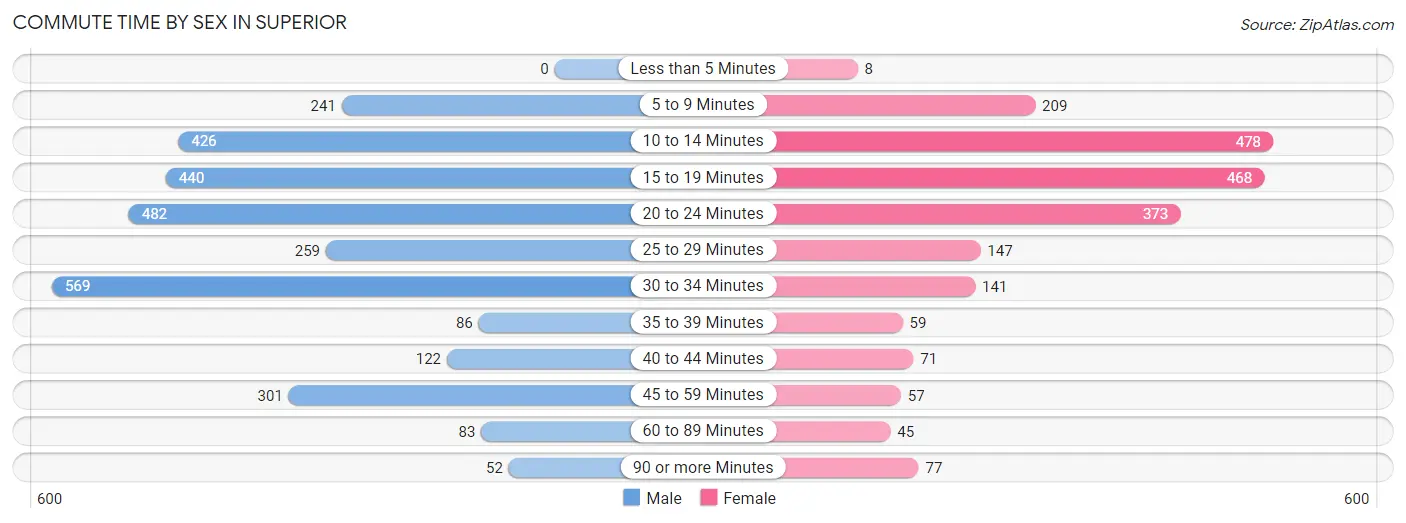
| Commute Time | Male | Female |
| Less than 5 Minutes | 0 (0.0%) | 8 (0.4%) |
| 5 to 9 Minutes | 241 (7.9%) | 209 (9.8%) |
| 10 to 14 Minutes | 426 (13.9%) | 478 (22.4%) |
| 15 to 19 Minutes | 440 (14.4%) | 468 (21.9%) |
| 20 to 24 Minutes | 482 (15.8%) | 373 (17.5%) |
| 25 to 29 Minutes | 259 (8.5%) | 147 (6.9%) |
| 30 to 34 Minutes | 569 (18.6%) | 141 (6.6%) |
| 35 to 39 Minutes | 86 (2.8%) | 59 (2.8%) |
| 40 to 44 Minutes | 122 (4.0%) | 71 (3.3%) |
| 45 to 59 Minutes | 301 (9.8%) | 57 (2.7%) |
| 60 to 89 Minutes | 83 (2.7%) | 45 (2.1%) |
| 90 or more Minutes | 52 (1.7%) | 77 (3.6%) |
Time of Departure to Work by Sex in Superior
The most frequent times of departure to work in Superior are 8:00 AM to 8:29 AM (541, 17.7%) for males and 8:00 AM to 8:29 AM (419, 19.6%) for females.
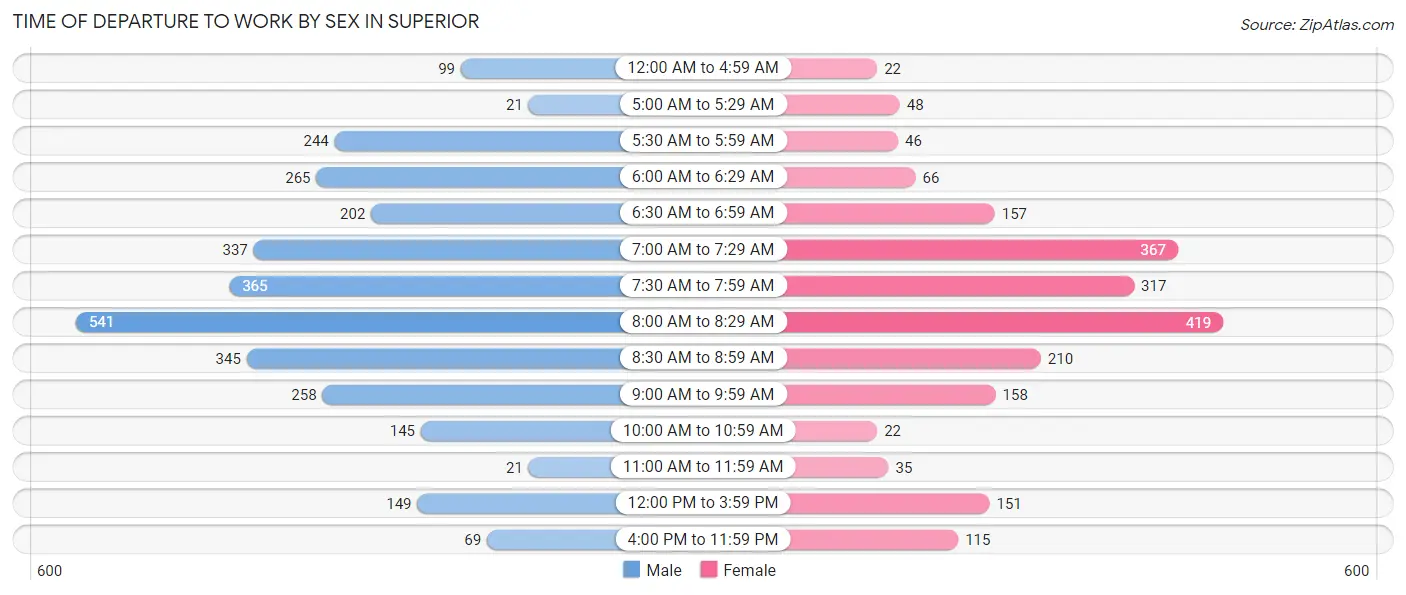
| Time of Departure | Male | Female |
| 12:00 AM to 4:59 AM | 99 (3.2%) | 22 (1.0%) |
| 5:00 AM to 5:29 AM | 21 (0.7%) | 48 (2.2%) |
| 5:30 AM to 5:59 AM | 244 (8.0%) | 46 (2.2%) |
| 6:00 AM to 6:29 AM | 265 (8.7%) | 66 (3.1%) |
| 6:30 AM to 6:59 AM | 202 (6.6%) | 157 (7.4%) |
| 7:00 AM to 7:29 AM | 337 (11.0%) | 367 (17.2%) |
| 7:30 AM to 7:59 AM | 365 (11.9%) | 317 (14.9%) |
| 8:00 AM to 8:29 AM | 541 (17.7%) | 419 (19.6%) |
| 8:30 AM to 8:59 AM | 345 (11.3%) | 210 (9.9%) |
| 9:00 AM to 9:59 AM | 258 (8.4%) | 158 (7.4%) |
| 10:00 AM to 10:59 AM | 145 (4.7%) | 22 (1.0%) |
| 11:00 AM to 11:59 AM | 21 (0.7%) | 35 (1.6%) |
| 12:00 PM to 3:59 PM | 149 (4.9%) | 151 (7.1%) |
| 4:00 PM to 11:59 PM | 69 (2.2%) | 115 (5.4%) |
| Total | 3,061 (100.0%) | 2,133 (100.0%) |
Housing Occupancy in Superior
Occupancy by Ownership in Superior
Of the total 4,504 dwellings in Superior, owner-occupied units account for 2,692 (59.8%), while renter-occupied units make up 1,812 (40.2%).
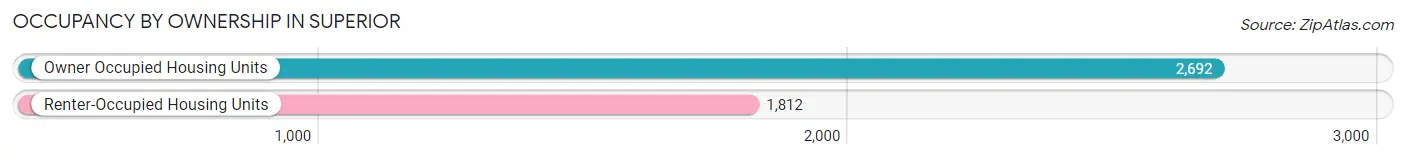
| Occupancy | # Housing Units | % Housing Units |
| Owner Occupied Housing Units | 2,692 | 59.8% |
| Renter-Occupied Housing Units | 1,812 | 40.2% |
| Total Occupied Housing Units | 4,504 | 100.0% |
Occupancy by Household Size in Superior
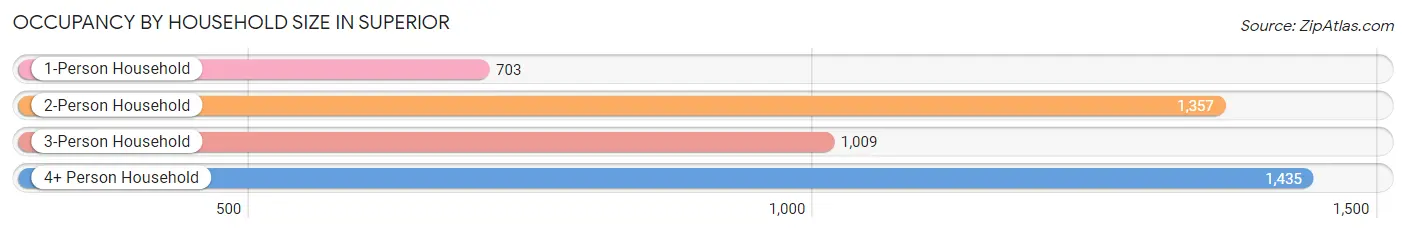
| Household Size | # Housing Units | % Housing Units |
| 1-Person Household | 703 | 15.6% |
| 2-Person Household | 1,357 | 30.1% |
| 3-Person Household | 1,009 | 22.4% |
| 4+ Person Household | 1,435 | 31.9% |
| Total Housing Units | 4,504 | 100.0% |
Occupancy by Ownership by Household Size in Superior
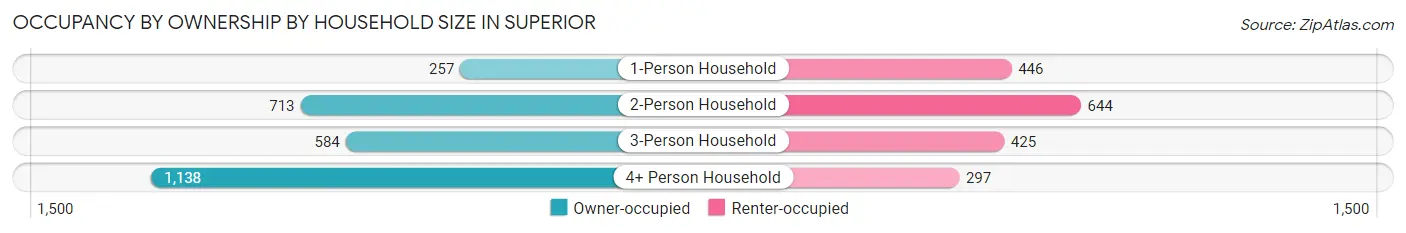
| Household Size | Owner-occupied | Renter-occupied |
| 1-Person Household | 257 (36.6%) | 446 (63.4%) |
| 2-Person Household | 713 (52.5%) | 644 (47.5%) |
| 3-Person Household | 584 (57.9%) | 425 (42.1%) |
| 4+ Person Household | 1,138 (79.3%) | 297 (20.7%) |
| Total Housing Units | 2,692 (59.8%) | 1,812 (40.2%) |
Occupancy by Educational Attainment in Superior
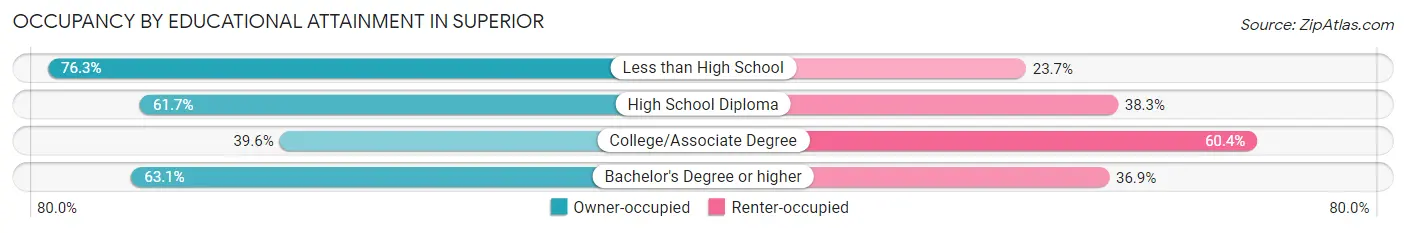
| Household Size | Owner-occupied | Renter-occupied |
| Less than High School | 45 (76.3%) | 14 (23.7%) |
| High School Diploma | 74 (61.7%) | 46 (38.3%) |
| College/Associate Degree | 260 (39.6%) | 397 (60.4%) |
| Bachelor's Degree or higher | 2,313 (63.1%) | 1,355 (36.9%) |
Occupancy by Age of Householder in Superior
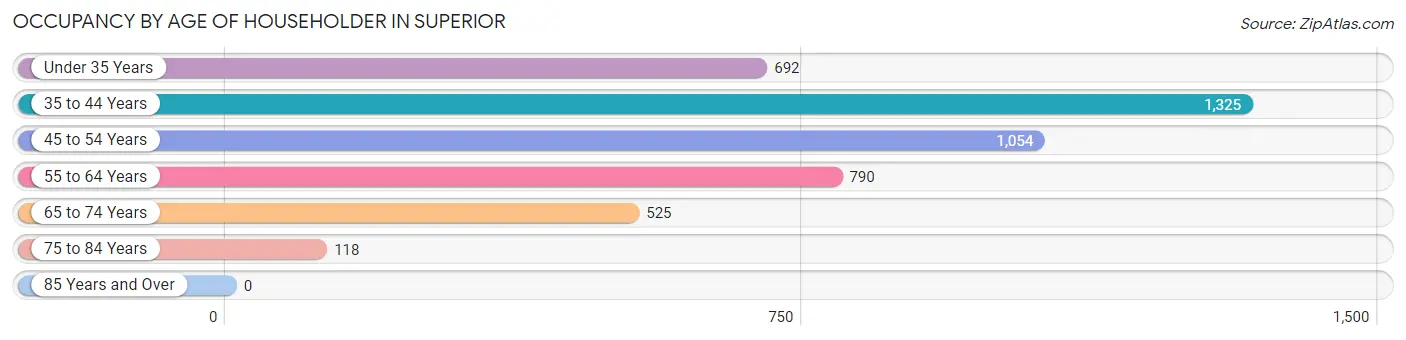
| Age Bracket | # Households | % Households |
| Under 35 Years | 692 | 15.4% |
| 35 to 44 Years | 1,325 | 29.4% |
| 45 to 54 Years | 1,054 | 23.4% |
| 55 to 64 Years | 790 | 17.5% |
| 65 to 74 Years | 525 | 11.7% |
| 75 to 84 Years | 118 | 2.6% |
| 85 Years and Over | 0 | 0.0% |
| Total | 4,504 | 100.0% |
Housing Finances in Superior
Median Income by Occupancy in Superior
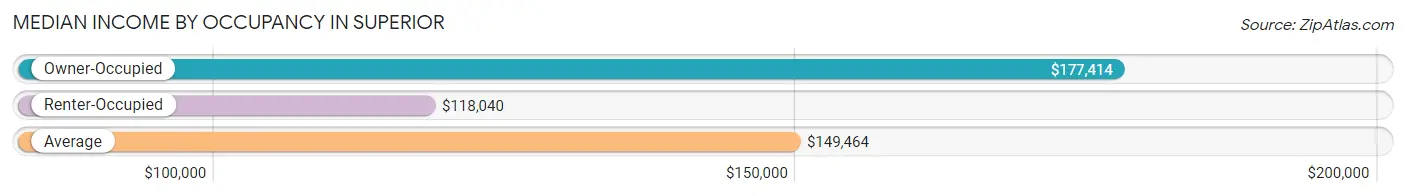
| Occupancy Type | # Households | Median Income |
| Owner-Occupied | 2,692 (59.8%) | $177,414 |
| Renter-Occupied | 1,812 (40.2%) | $118,040 |
| Average | 4,504 (100.0%) | $149,464 |
Occupancy by Householder Income Bracket in Superior
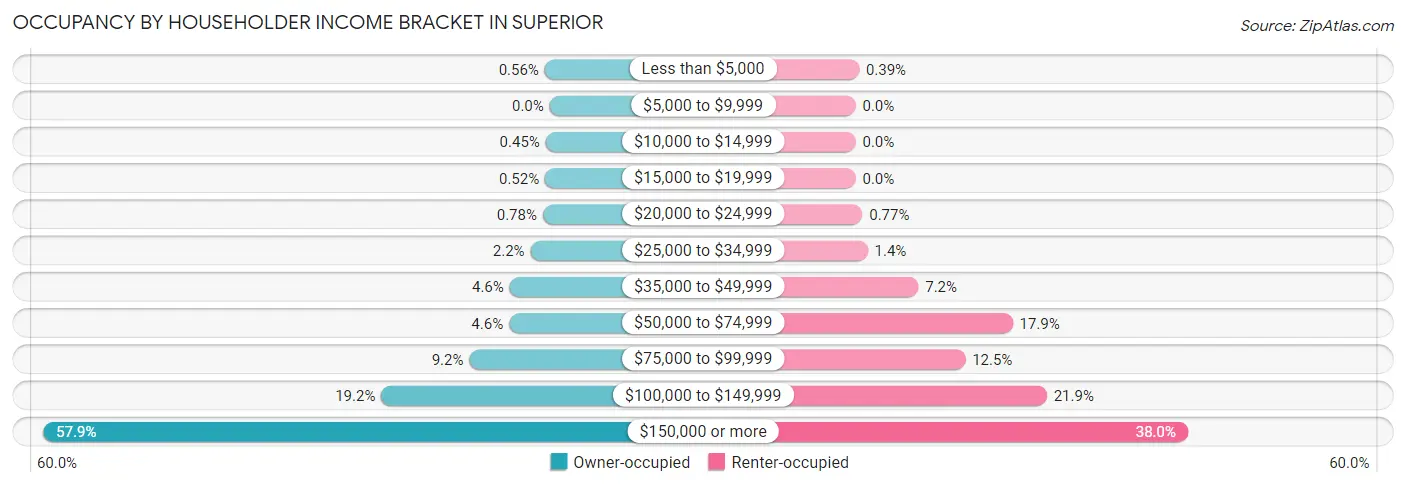
| Income Bracket | Owner-occupied | Renter-occupied |
| Less than $5,000 | 15 (0.6%) | 7 (0.4%) |
| $5,000 to $9,999 | 0 (0.0%) | 0 (0.0%) |
| $10,000 to $14,999 | 12 (0.4%) | 0 (0.0%) |
| $15,000 to $19,999 | 14 (0.5%) | 0 (0.0%) |
| $20,000 to $24,999 | 21 (0.8%) | 14 (0.8%) |
| $25,000 to $34,999 | 59 (2.2%) | 25 (1.4%) |
| $35,000 to $49,999 | 123 (4.6%) | 130 (7.2%) |
| $50,000 to $74,999 | 125 (4.6%) | 325 (17.9%) |
| $75,000 to $99,999 | 247 (9.2%) | 227 (12.5%) |
| $100,000 to $149,999 | 518 (19.2%) | 396 (21.8%) |
| $150,000 or more | 1,558 (57.9%) | 688 (38.0%) |
| Total | 2,692 (100.0%) | 1,812 (100.0%) |
Monthly Housing Cost Tiers in Superior
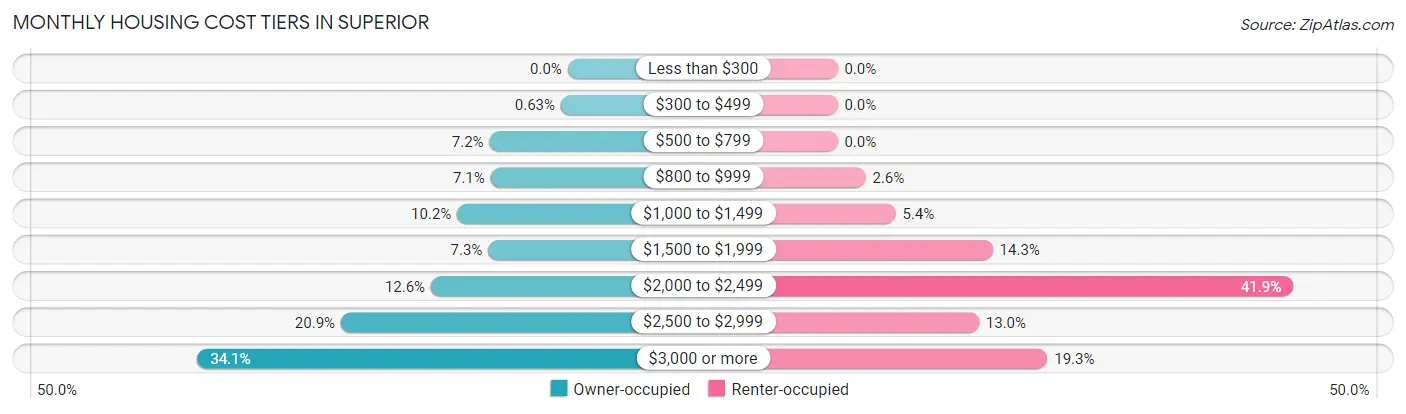
| Monthly Cost | Owner-occupied | Renter-occupied |
| Less than $300 | 0 (0.0%) | 0 (0.0%) |
| $300 to $499 | 17 (0.6%) | 0 (0.0%) |
| $500 to $799 | 194 (7.2%) | 0 (0.0%) |
| $800 to $999 | 191 (7.1%) | 47 (2.6%) |
| $1,000 to $1,499 | 274 (10.2%) | 97 (5.3%) |
| $1,500 to $1,999 | 197 (7.3%) | 259 (14.3%) |
| $2,000 to $2,499 | 339 (12.6%) | 760 (41.9%) |
| $2,500 to $2,999 | 562 (20.9%) | 236 (13.0%) |
| $3,000 or more | 918 (34.1%) | 350 (19.3%) |
| Total | 2,692 (100.0%) | 1,812 (100.0%) |
Physical Housing Characteristics in Superior
Housing Structures in Superior
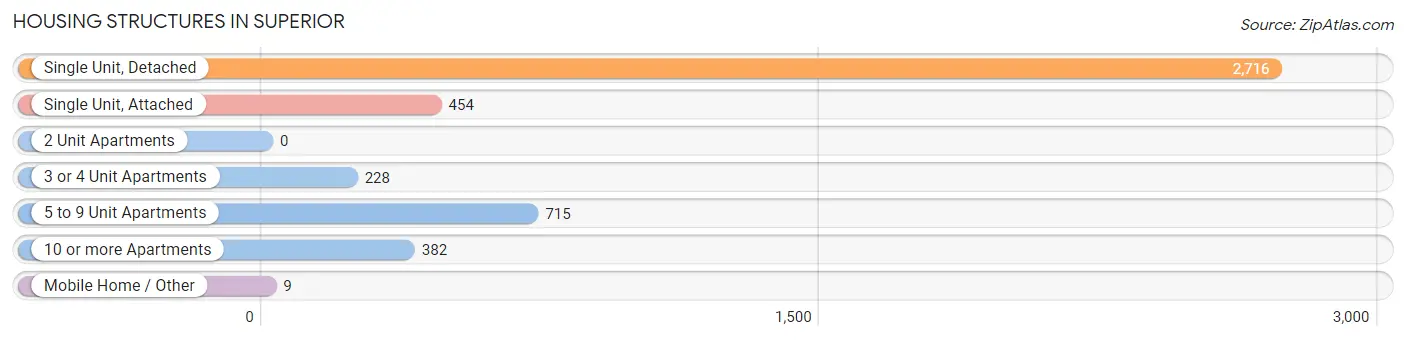
| Structure Type | # Housing Units | % Housing Units |
| Single Unit, Detached | 2,716 | 60.3% |
| Single Unit, Attached | 454 | 10.1% |
| 2 Unit Apartments | 0 | 0.0% |
| 3 or 4 Unit Apartments | 228 | 5.1% |
| 5 to 9 Unit Apartments | 715 | 15.9% |
| 10 or more Apartments | 382 | 8.5% |
| Mobile Home / Other | 9 | 0.2% |
| Total | 4,504 | 100.0% |
Housing Structures by Occupancy in Superior
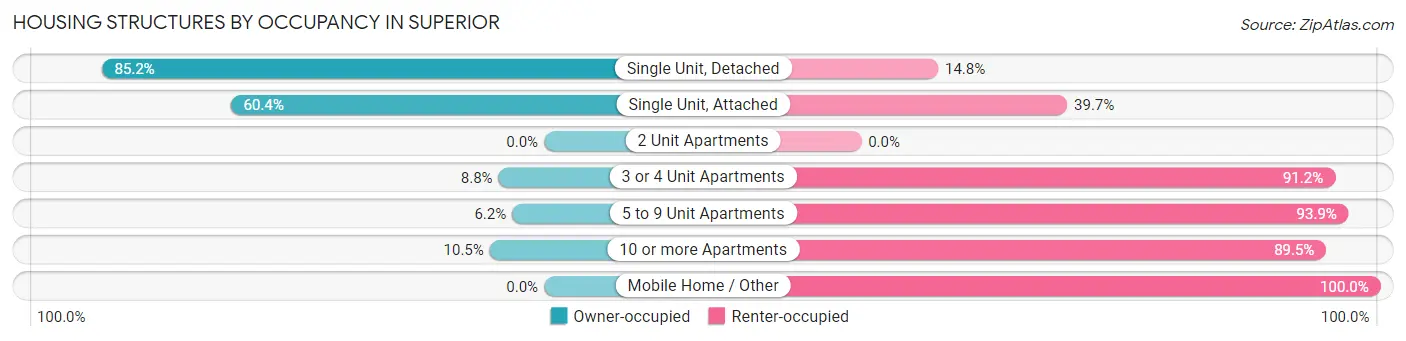
| Structure Type | Owner-occupied | Renter-occupied |
| Single Unit, Detached | 2,314 (85.2%) | 402 (14.8%) |
| Single Unit, Attached | 274 (60.4%) | 180 (39.7%) |
| 2 Unit Apartments | 0 (0.0%) | 0 (0.0%) |
| 3 or 4 Unit Apartments | 20 (8.8%) | 208 (91.2%) |
| 5 to 9 Unit Apartments | 44 (6.1%) | 671 (93.9%) |
| 10 or more Apartments | 40 (10.5%) | 342 (89.5%) |
| Mobile Home / Other | 0 (0.0%) | 9 (100.0%) |
| Total | 2,692 (59.8%) | 1,812 (40.2%) |
Housing Structures by Number of Rooms in Superior
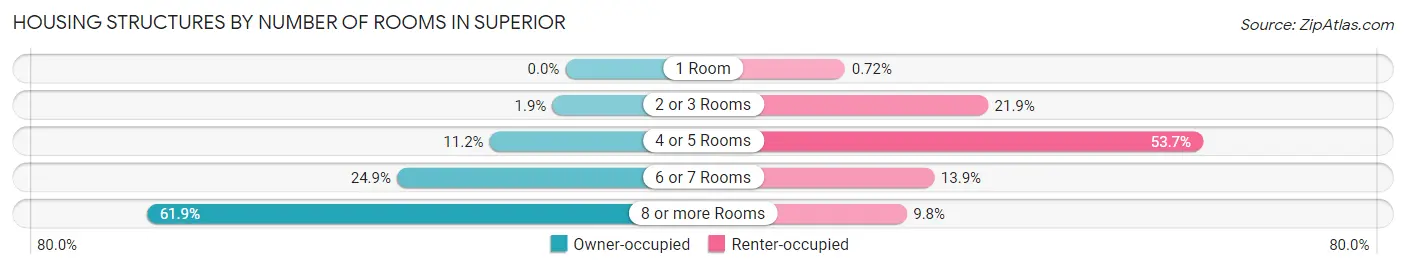
| Number of Rooms | Owner-occupied | Renter-occupied |
| 1 Room | 0 (0.0%) | 13 (0.7%) |
| 2 or 3 Rooms | 52 (1.9%) | 396 (21.8%) |
| 4 or 5 Rooms | 302 (11.2%) | 973 (53.7%) |
| 6 or 7 Rooms | 671 (24.9%) | 252 (13.9%) |
| 8 or more Rooms | 1,667 (61.9%) | 178 (9.8%) |
| Total | 2,692 (100.0%) | 1,812 (100.0%) |
Housing Structure by Heating Type in Superior
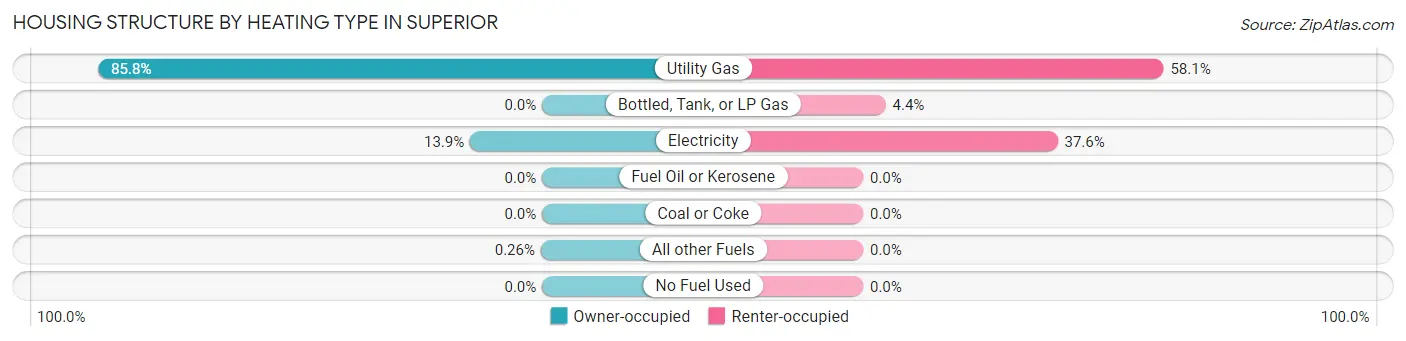
| Heating Type | Owner-occupied | Renter-occupied |
| Utility Gas | 2,310 (85.8%) | 1,052 (58.1%) |
| Bottled, Tank, or LP Gas | 0 (0.0%) | 79 (4.4%) |
| Electricity | 375 (13.9%) | 681 (37.6%) |
| Fuel Oil or Kerosene | 0 (0.0%) | 0 (0.0%) |
| Coal or Coke | 0 (0.0%) | 0 (0.0%) |
| All other Fuels | 7 (0.3%) | 0 (0.0%) |
| No Fuel Used | 0 (0.0%) | 0 (0.0%) |
| Total | 2,692 (100.0%) | 1,812 (100.0%) |
Household Vehicle Usage in Superior
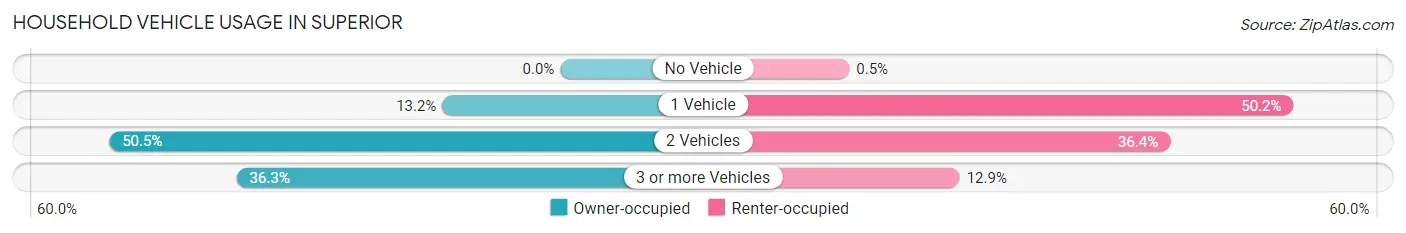
| Vehicles per Household | Owner-occupied | Renter-occupied |
| No Vehicle | 0 (0.0%) | 9 (0.5%) |
| 1 Vehicle | 356 (13.2%) | 910 (50.2%) |
| 2 Vehicles | 1,360 (50.5%) | 660 (36.4%) |
| 3 or more Vehicles | 976 (36.3%) | 233 (12.9%) |
| Total | 2,692 (100.0%) | 1,812 (100.0%) |
Real Estate & Mortgages in Superior
Real Estate and Mortgage Overview in Superior
| Characteristic | Without Mortgage | With Mortgage |
| Housing Units | 589 | 2,103 |
| Median Property Value | $787,600 | $729,300 |
| Median Household Income | $187,218 | $1,152 |
| Monthly Housing Costs | $864 | $911 |
| Real Estate Taxes | $5,446 | $5 |
Property Value by Mortgage Status in Superior
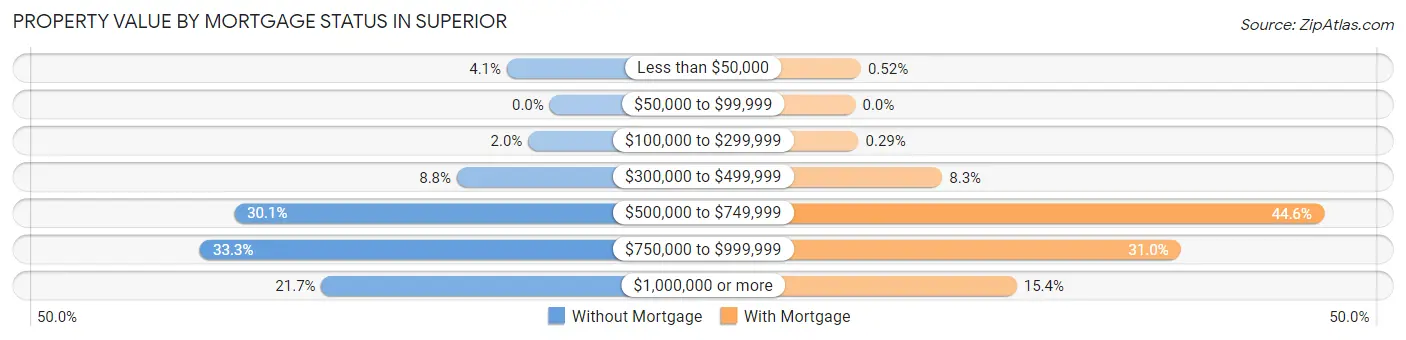
| Property Value | Without Mortgage | With Mortgage |
| Less than $50,000 | 24 (4.1%) | 11 (0.5%) |
| $50,000 to $99,999 | 0 (0.0%) | 0 (0.0%) |
| $100,000 to $299,999 | 12 (2.0%) | 6 (0.3%) |
| $300,000 to $499,999 | 52 (8.8%) | 174 (8.3%) |
| $500,000 to $749,999 | 177 (30.0%) | 938 (44.6%) |
| $750,000 to $999,999 | 196 (33.3%) | 651 (31.0%) |
| $1,000,000 or more | 128 (21.7%) | 323 (15.4%) |
| Total | 589 (100.0%) | 2,103 (100.0%) |
Household Income by Mortgage Status in Superior
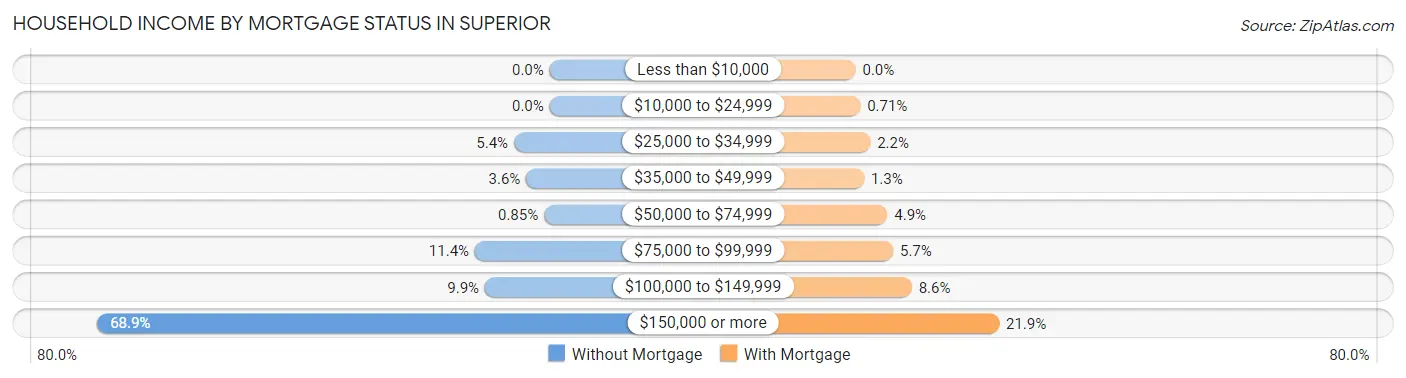
| Household Income | Without Mortgage | With Mortgage |
| Less than $10,000 | 0 (0.0%) | 0 (0.0%) |
| $10,000 to $24,999 | 0 (0.0%) | 15 (0.7%) |
| $25,000 to $34,999 | 32 (5.4%) | 47 (2.2%) |
| $35,000 to $49,999 | 21 (3.6%) | 27 (1.3%) |
| $50,000 to $74,999 | 5 (0.9%) | 102 (4.9%) |
| $75,000 to $99,999 | 67 (11.4%) | 120 (5.7%) |
| $100,000 to $149,999 | 58 (9.9%) | 180 (8.6%) |
| $150,000 or more | 406 (68.9%) | 460 (21.9%) |
| Total | 589 (100.0%) | 2,103 (100.0%) |
Property Value to Household Income Ratio in Superior
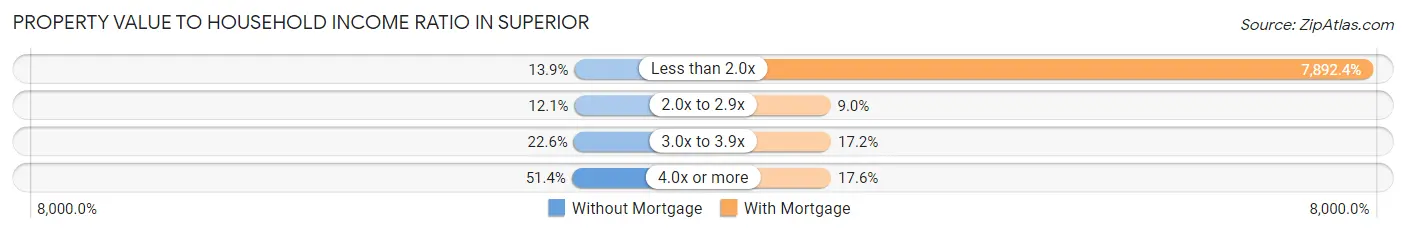
| Value-to-Income Ratio | Without Mortgage | With Mortgage |
| Less than 2.0x | 82 (13.9%) | 165,977 (7,892.4%) |
| 2.0x to 2.9x | 71 (12.0%) | 189 (9.0%) |
| 3.0x to 3.9x | 133 (22.6%) | 362 (17.2%) |
| 4.0x or more | 303 (51.4%) | 371 (17.6%) |
| Total | 589 (100.0%) | 2,103 (100.0%) |
Real Estate Taxes by Mortgage Status in Superior
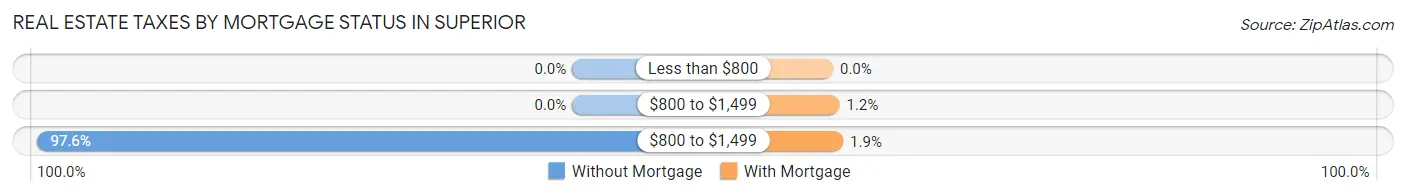
| Property Taxes | Without Mortgage | With Mortgage |
| Less than $800 | 0 (0.0%) | 0 (0.0%) |
| $800 to $1,499 | 0 (0.0%) | 25 (1.2%) |
| $800 to $1,499 | 575 (97.6%) | 39 (1.8%) |
| Total | 589 (100.0%) | 2,103 (100.0%) |
Health & Disability in Superior
Health Insurance Coverage by Age in Superior
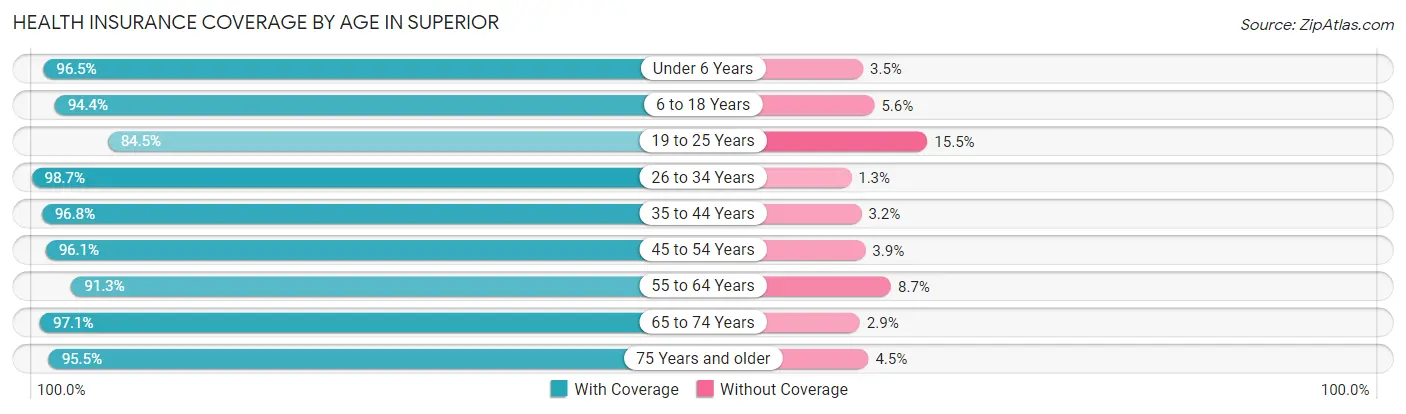
| Age Bracket | With Coverage | Without Coverage |
| Under 6 Years | 934 (96.5%) | 34 (3.5%) |
| 6 to 18 Years | 2,555 (94.4%) | 152 (5.6%) |
| 19 to 25 Years | 747 (84.5%) | 137 (15.5%) |
| 26 to 34 Years | 1,445 (98.7%) | 19 (1.3%) |
| 35 to 44 Years | 2,360 (96.8%) | 78 (3.2%) |
| 45 to 54 Years | 2,001 (96.1%) | 82 (3.9%) |
| 55 to 64 Years | 1,254 (91.3%) | 120 (8.7%) |
| 65 to 74 Years | 901 (97.1%) | 27 (2.9%) |
| 75 Years and older | 275 (95.5%) | 13 (4.5%) |
| Total | 12,472 (95.0%) | 662 (5.0%) |
Health Insurance Coverage by Citizenship Status in Superior
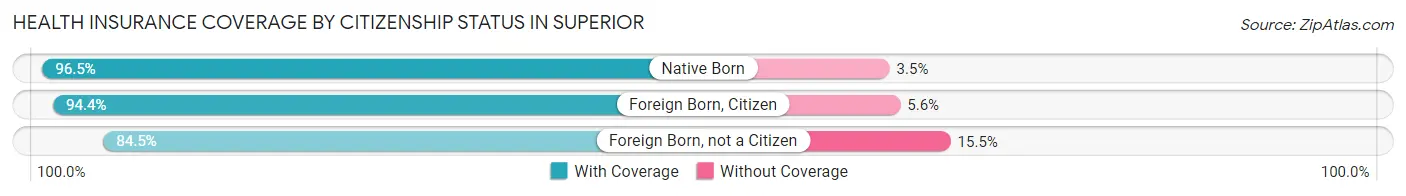
| Citizenship Status | With Coverage | Without Coverage |
| Native Born | 934 (96.5%) | 34 (3.5%) |
| Foreign Born, Citizen | 2,555 (94.4%) | 152 (5.6%) |
| Foreign Born, not a Citizen | 747 (84.5%) | 137 (15.5%) |
Health Insurance Coverage by Household Income in Superior
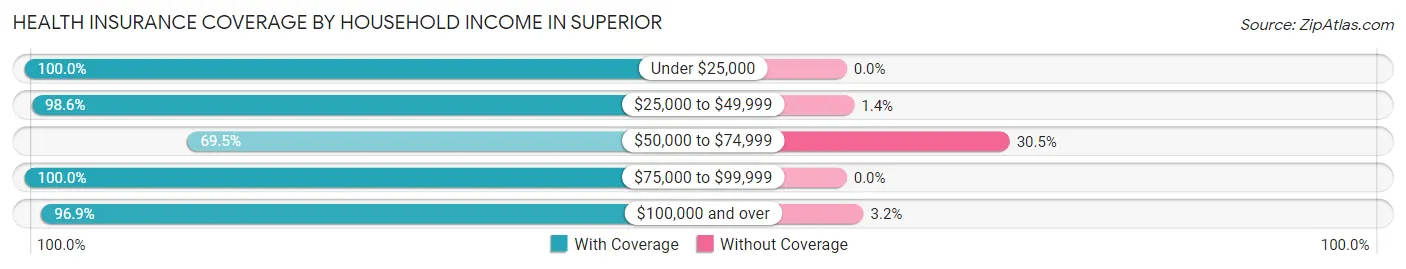
| Household Income | With Coverage | Without Coverage |
| Under $25,000 | 226 (100.0%) | 0 (0.0%) |
| $25,000 to $49,999 | 628 (98.6%) | 9 (1.4%) |
| $50,000 to $74,999 | 758 (69.5%) | 333 (30.5%) |
| $75,000 to $99,999 | 1,036 (100.0%) | 0 (0.0%) |
| $100,000 and over | 9,824 (96.9%) | 320 (3.2%) |
Public vs Private Health Insurance Coverage by Age in Superior
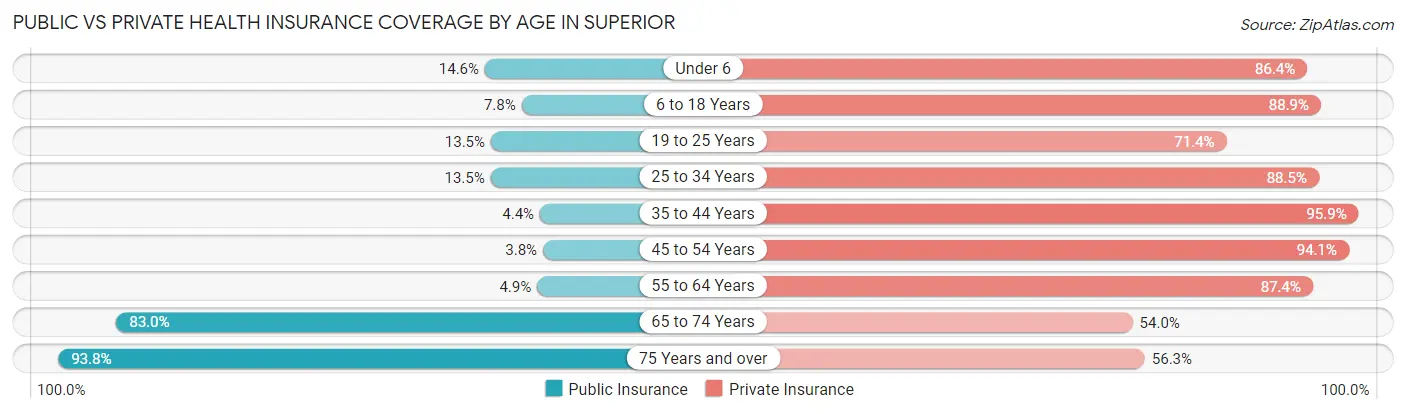
| Age Bracket | Public Insurance | Private Insurance |
| Under 6 | 141 (14.6%) | 836 (86.4%) |
| 6 to 18 Years | 210 (7.8%) | 2,407 (88.9%) |
| 19 to 25 Years | 119 (13.5%) | 631 (71.4%) |
| 25 to 34 Years | 198 (13.5%) | 1,296 (88.5%) |
| 35 to 44 Years | 106 (4.3%) | 2,338 (95.9%) |
| 45 to 54 Years | 79 (3.8%) | 1,960 (94.1%) |
| 55 to 64 Years | 67 (4.9%) | 1,201 (87.4%) |
| 65 to 74 Years | 770 (83.0%) | 501 (54.0%) |
| 75 Years and over | 270 (93.8%) | 162 (56.2%) |
| Total | 1,960 (14.9%) | 11,332 (86.3%) |
Disability Status by Sex by Age in Superior
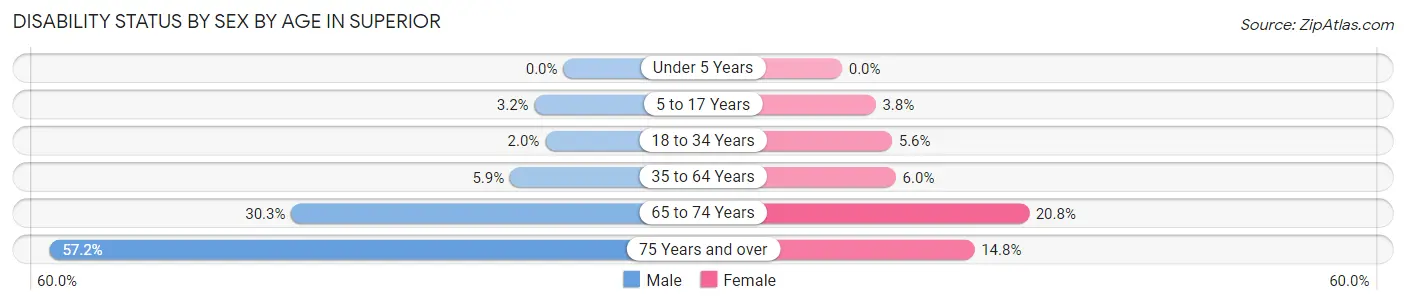
| Age Bracket | Male | Female |
| Under 5 Years | 0 (0.0%) | 0 (0.0%) |
| 5 to 17 Years | 48 (3.2%) | 52 (3.7%) |
| 18 to 34 Years | 29 (2.0%) | 55 (5.6%) |
| 35 to 64 Years | 172 (5.9%) | 180 (6.0%) |
| 65 to 74 Years | 140 (30.3%) | 97 (20.8%) |
| 75 Years and over | 95 (57.2%) | 18 (14.7%) |
Disability Class by Sex by Age in Superior
Disability Class: Hearing Difficulty
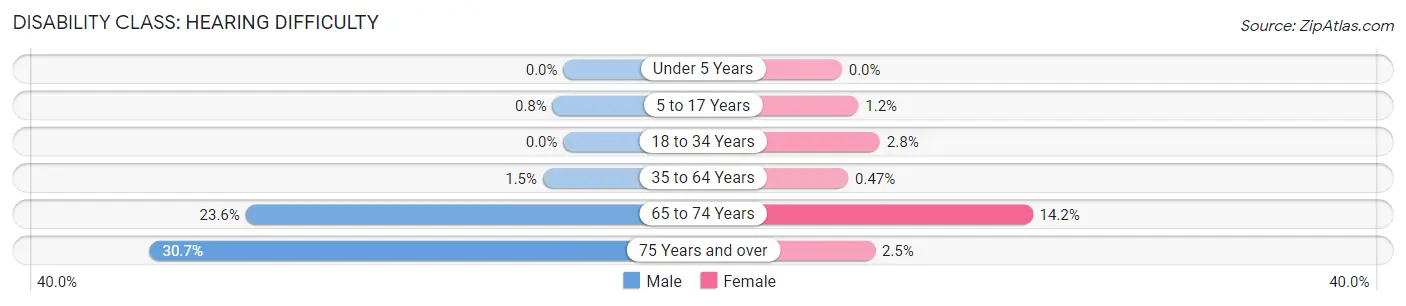
| Age Bracket | Male | Female |
| Under 5 Years | 0 (0.0%) | 0 (0.0%) |
| 5 to 17 Years | 12 (0.8%) | 17 (1.2%) |
| 18 to 34 Years | 0 (0.0%) | 28 (2.8%) |
| 35 to 64 Years | 44 (1.5%) | 14 (0.5%) |
| 65 to 74 Years | 109 (23.6%) | 66 (14.2%) |
| 75 Years and over | 51 (30.7%) | 3 (2.5%) |
Disability Class: Vision Difficulty
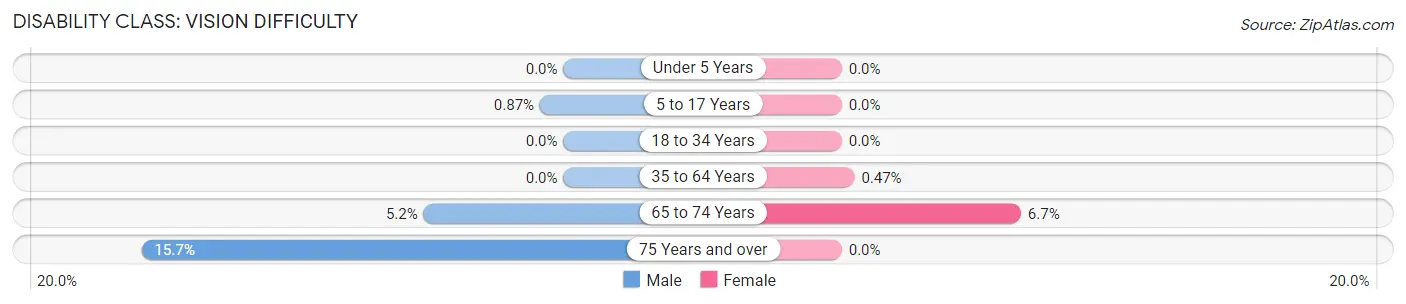
| Age Bracket | Male | Female |
| Under 5 Years | 0 (0.0%) | 0 (0.0%) |
| 5 to 17 Years | 13 (0.9%) | 0 (0.0%) |
| 18 to 34 Years | 0 (0.0%) | 0 (0.0%) |
| 35 to 64 Years | 0 (0.0%) | 14 (0.5%) |
| 65 to 74 Years | 24 (5.2%) | 31 (6.7%) |
| 75 Years and over | 26 (15.7%) | 0 (0.0%) |
Disability Class: Cognitive Difficulty
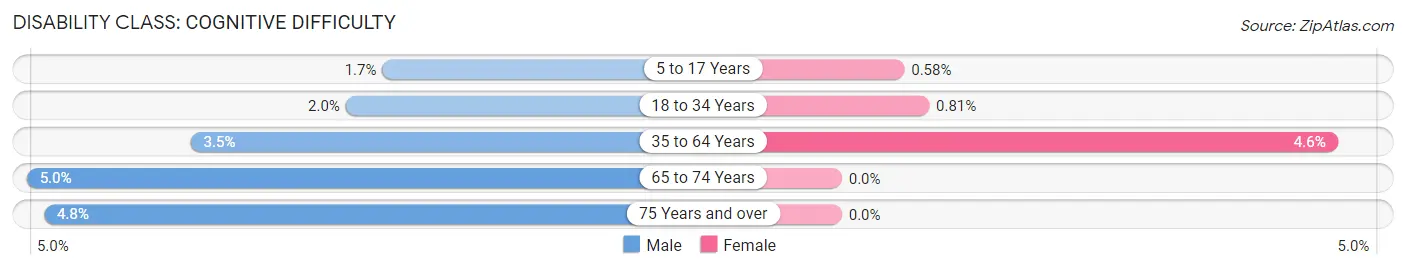
| Age Bracket | Male | Female |
| 5 to 17 Years | 25 (1.7%) | 8 (0.6%) |
| 18 to 34 Years | 29 (2.0%) | 8 (0.8%) |
| 35 to 64 Years | 100 (3.5%) | 138 (4.6%) |
| 65 to 74 Years | 23 (5.0%) | 0 (0.0%) |
| 75 Years and over | 8 (4.8%) | 0 (0.0%) |
Disability Class: Ambulatory Difficulty
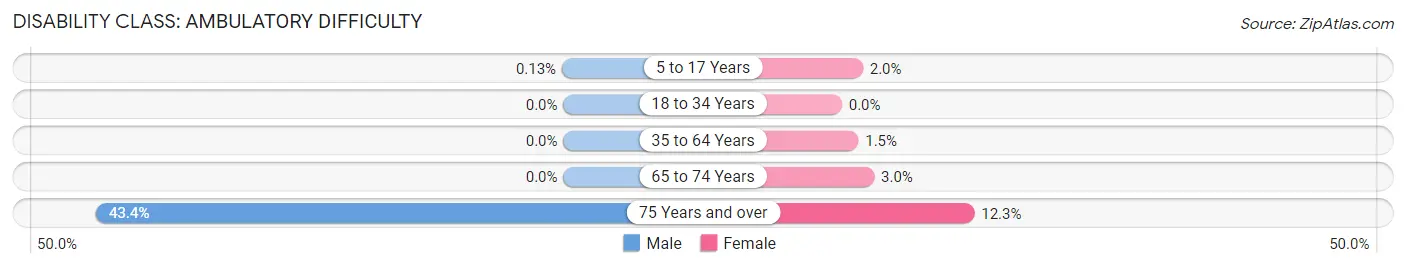
| Age Bracket | Male | Female |
| 5 to 17 Years | 2 (0.1%) | 27 (1.9%) |
| 18 to 34 Years | 0 (0.0%) | 0 (0.0%) |
| 35 to 64 Years | 0 (0.0%) | 46 (1.5%) |
| 65 to 74 Years | 0 (0.0%) | 14 (3.0%) |
| 75 Years and over | 72 (43.4%) | 15 (12.3%) |
Disability Class: Self-Care Difficulty
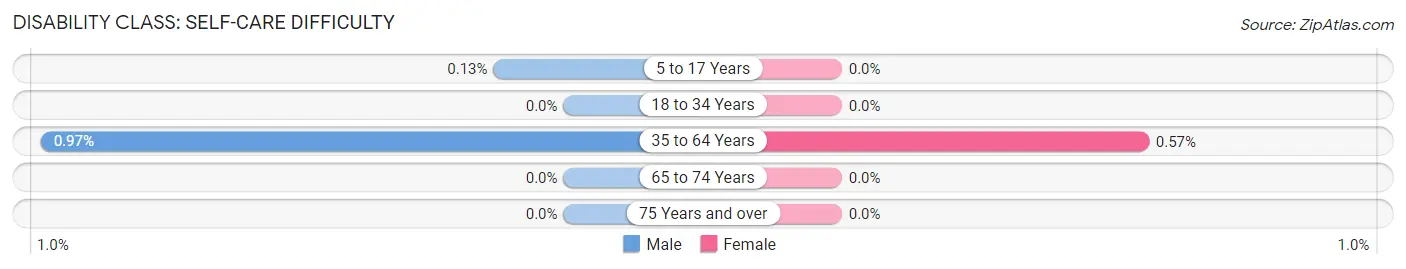
| Age Bracket | Male | Female |
| 5 to 17 Years | 2 (0.1%) | 0 (0.0%) |
| 18 to 34 Years | 0 (0.0%) | 0 (0.0%) |
| 35 to 64 Years | 28 (1.0%) | 17 (0.6%) |
| 65 to 74 Years | 0 (0.0%) | 0 (0.0%) |
| 75 Years and over | 0 (0.0%) | 0 (0.0%) |
Technology Access in Superior
Computing Device Access in Superior
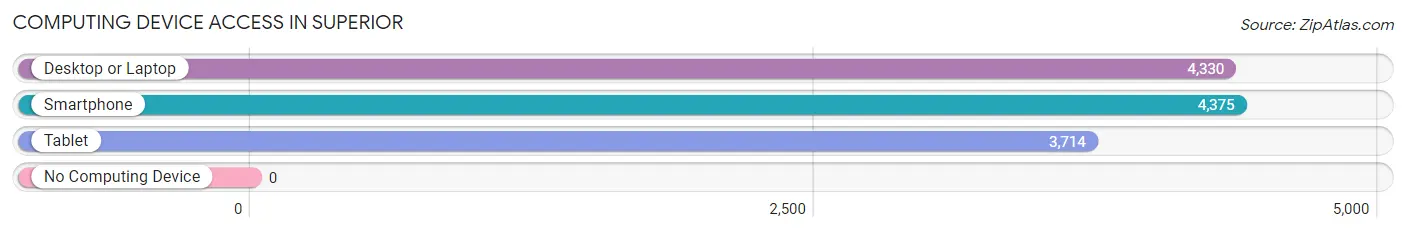
| Device Type | # Households | % Households |
| Desktop or Laptop | 4,330 | 96.1% |
| Smartphone | 4,375 | 97.1% |
| Tablet | 3,714 | 82.5% |
| No Computing Device | 0 | 0.0% |
| Total | 4,504 | 100.0% |
Internet Access in Superior
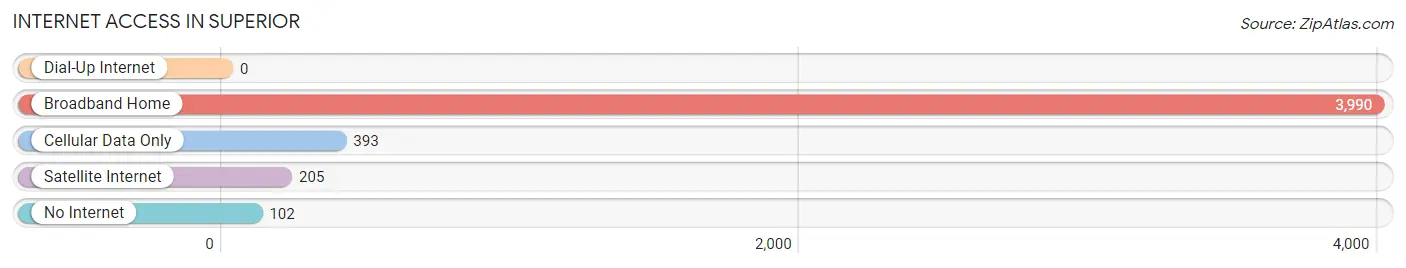
| Internet Type | # Households | % Households |
| Dial-Up Internet | 0 | 0.0% |
| Broadband Home | 3,990 | 88.6% |
| Cellular Data Only | 393 | 8.7% |
| Satellite Internet | 205 | 4.5% |
| No Internet | 102 | 2.3% |
| Total | 4,504 | 100.0% |
Superior Summary
History
Superior, Colorado is a small town located in Boulder County, Colorado. It is situated between Boulder and Denver, and is part of the Denver-Aurora-Lakewood Metropolitan Statistical Area. The town was founded in 1881 by a group of miners who were looking for gold and silver in the area. The town was named after the nearby Superior Mine, which was the largest and most successful mine in the area.
The town grew quickly, and by the early 1900s, it had become a bustling mining town with a population of over 1,000 people. The town was home to several businesses, including a hotel, a bank, a post office, and a school. The town also had a railroad station, which allowed for easy transportation of goods and people.
The town experienced a period of decline in the early 20th century, as the mining industry began to decline. The population dropped to just over 500 people by the 1950s. However, the town experienced a resurgence in the late 20th century, as it became a popular bedroom community for people who worked in nearby Boulder and Denver. The population has grown steadily since then, and as of 2020, the town has a population of over 12,000 people.
Geography
Superior is located in Boulder County, Colorado, and is situated between Boulder and Denver. The town is located at the base of the Rocky Mountains, and is surrounded by rolling hills and open space. The town is located at an elevation of 5,400 feet, and has a total area of 8.2 square miles.
The town is located in a semi-arid climate, with hot summers and cold winters. The average annual temperature is around 50 degrees Fahrenheit, and the average annual precipitation is around 16 inches.
Economy
The economy of Superior is largely based on the service industry. The town is home to several businesses, including restaurants, retail stores, and professional services. The town is also home to several technology companies, including Oracle, Google, and Microsoft.
The town is also home to several educational institutions, including the University of Colorado Boulder, the University of Denver, and the University of Northern Colorado.
Demographics
As of 2020, the population of Superior is 12,000 people. The town has a median age of 37.7 years, and the median household income is $90,000. The town is predominantly white, with a population that is 79.3% white, 8.2% Hispanic, 5.3% Asian, and 4.2% African American. The town is also home to a large number of immigrants, with a population that is 11.2% foreign-born.
Common Questions
What is Per Capita Income in Superior?
Per Capita income in Superior is $65,498.
What is the Median Family Income in Superior?
Median Family Income in Superior is $173,563.
What is the Median Household income in Superior?
Median Household Income in Superior is $149,464.
What is Income or Wage Gap in Superior?
Income or Wage Gap in Superior is 25.7%.
Women in Superior earn 74.3 cents for every dollar earned by a man.
What is Family Income Deficit in Superior?
Family Income Deficit in Superior is $12,349.
Families that are below poverty line in Superior earn $12,349 less on average than the poverty threshold level.
What is Inequality or Gini Index in Superior?
Inequality or Gini Index in Superior is 0.39.
What is the Total Population of Superior?
Total Population of Superior is 13,146.
What is the Total Male Population of Superior?
Total Male Population of Superior is 6,831.
What is the Total Female Population of Superior?
Total Female Population of Superior is 6,315.
What is the Ratio of Males per 100 Females in Superior?
There are 108.17 Males per 100 Females in Superior.
What is the Ratio of Females per 100 Males in Superior?
There are 92.45 Females per 100 Males in Superior.
What is the Median Population Age in Superior?
Median Population Age in Superior is 36.9 Years.
What is the Average Family Size in Superior
Average Family Size in Superior is 3.3 People.
What is the Average Household Size in Superior
Average Household Size in Superior is 2.9 People.
How Large is the Labor Force in Superior?
There are 7,419 People in the Labor Forcein in Superior.
What is the Percentage of People in the Labor Force in Superior?
73.9% of People are in the Labor Force in Superior.
What is the Unemployment Rate in Superior?
Unemployment Rate in Superior is 3.3%.