Blue River, CO Map & Demographics
Blue River Map
Blue River Overview
$63,076
PER CAPITA INCOME
$135,179
AVG FAMILY INCOME
$150,074
AVG HOUSEHOLD INCOME
25.0%
WAGE / INCOME GAP [ % ]
75.0¢/ $1
WAGE / INCOME GAP [ $ ]
0.43
INEQUALITY / GINI INDEX
1,238
TOTAL POPULATION
602
MALE POPULATION
636
FEMALE POPULATION
94.65
MALES / 100 FEMALES
105.65
FEMALES / 100 MALES
33.5
MEDIAN AGE
3.2
AVG FAMILY SIZE
3.2
AVG HOUSEHOLD SIZE
744
LABOR FORCE [ PEOPLE ]
72.3%
PERCENT IN LABOR FORCE
0.8%
UNEMPLOYMENT RATE
Blue River Area Codes
Income in Blue River
Income Overview in Blue River
Per Capita Income in Blue River is $63,076, while median incomes of families and households are $135,179 and $150,074 respectively.
| Characteristic | Number | Measure |
| Per Capita Income | 1,238 | $63,076 |
| Median Family Income | 275 | $135,179 |
| Mean Family Income | 275 | $163,219 |
| Median Household Income | 381 | $150,074 |
| Mean Household Income | 381 | $185,735 |
| Income Deficit | 275 | $0 |
| Wage / Income Gap (%) | 1,238 | 25.01% |
| Wage / Income Gap ($) | 1,238 | 74.99¢ per $1 |
| Gini / Inequality Index | 1,238 | 0.43 |
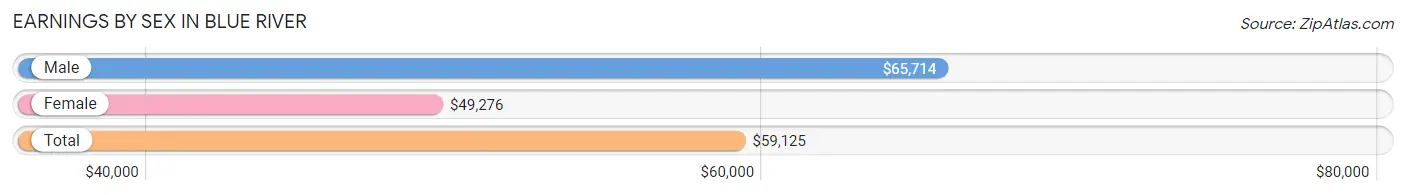
Earnings by Sex in Blue River
Average Earnings in Blue River are $59,125, $65,714 for men and $49,276 for women, a difference of 25.0%.
| Sex | Number | Average Earnings |
| Male | 458 (60.2%) | $65,714 |
| Female | 303 (39.8%) | $49,276 |
| Total | 761 (100.0%) | $59,125 |
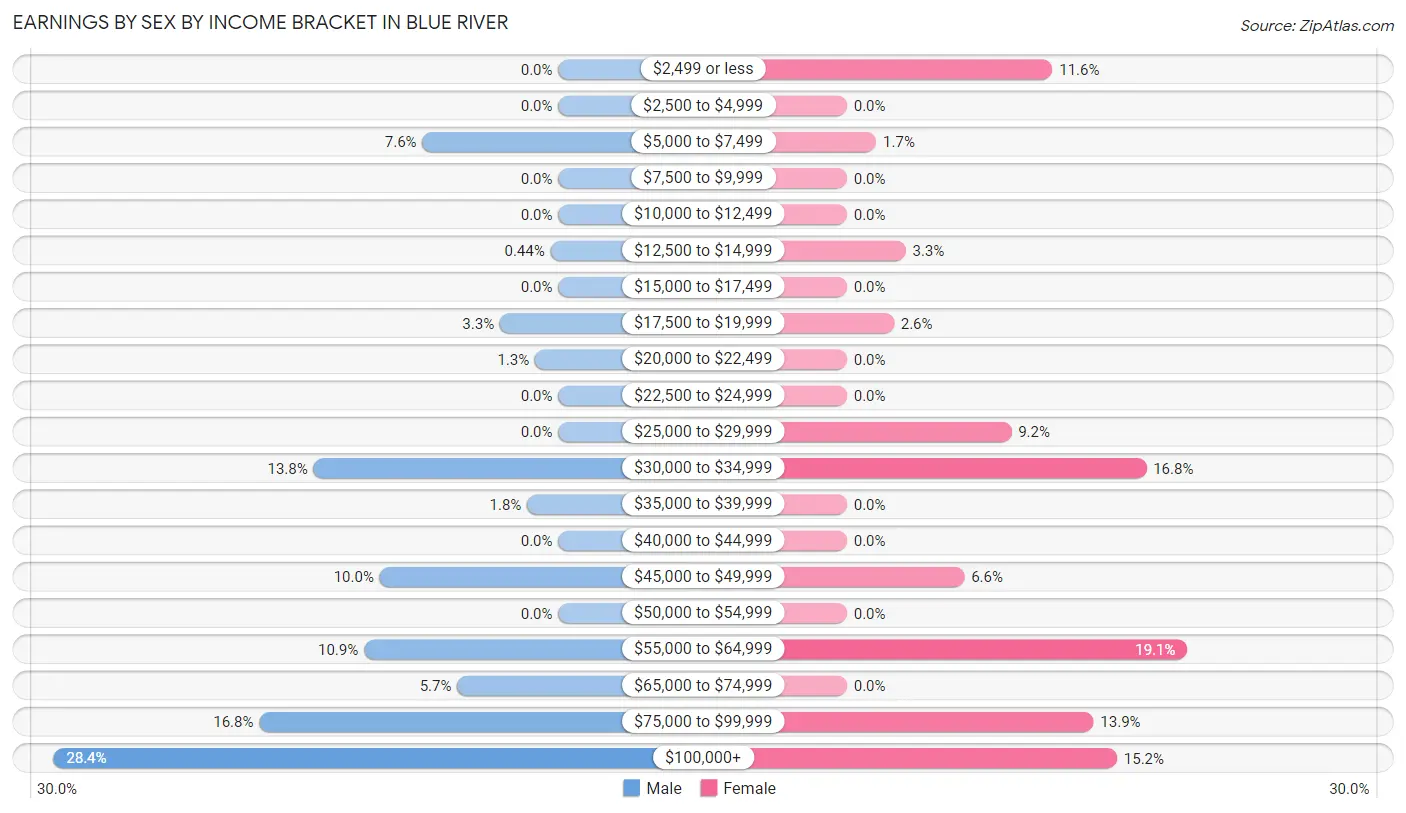
Earnings by Sex by Income Bracket in Blue River
The most common earnings brackets in Blue River are $100,000+ for men (130 | 28.4%) and $55,000 to $64,999 for women (58 | 19.1%).
| Income | Male | Female |
| $2,499 or less | 0 (0.0%) | 35 (11.6%) |
| $2,500 to $4,999 | 0 (0.0%) | 0 (0.0%) |
| $5,000 to $7,499 | 35 (7.6%) | 5 (1.7%) |
| $7,500 to $9,999 | 0 (0.0%) | 0 (0.0%) |
| $10,000 to $12,499 | 0 (0.0%) | 0 (0.0%) |
| $12,500 to $14,999 | 2 (0.4%) | 10 (3.3%) |
| $15,000 to $17,499 | 0 (0.0%) | 0 (0.0%) |
| $17,500 to $19,999 | 15 (3.3%) | 8 (2.6%) |
| $20,000 to $22,499 | 6 (1.3%) | 0 (0.0%) |
| $22,500 to $24,999 | 0 (0.0%) | 0 (0.0%) |
| $25,000 to $29,999 | 0 (0.0%) | 28 (9.2%) |
| $30,000 to $34,999 | 63 (13.8%) | 51 (16.8%) |
| $35,000 to $39,999 | 8 (1.8%) | 0 (0.0%) |
| $40,000 to $44,999 | 0 (0.0%) | 0 (0.0%) |
| $45,000 to $49,999 | 46 (10.0%) | 20 (6.6%) |
| $50,000 to $54,999 | 0 (0.0%) | 0 (0.0%) |
| $55,000 to $64,999 | 50 (10.9%) | 58 (19.1%) |
| $65,000 to $74,999 | 26 (5.7%) | 0 (0.0%) |
| $75,000 to $99,999 | 77 (16.8%) | 42 (13.9%) |
| $100,000+ | 130 (28.4%) | 46 (15.2%) |
| Total | 458 (100.0%) | 303 (100.0%) |
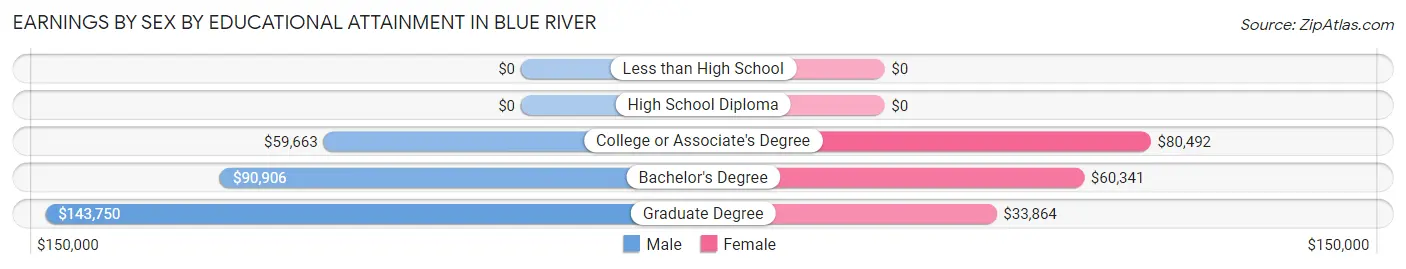
Earnings by Sex by Educational Attainment in Blue River
Average earnings in Blue River are $81,146 for men and $55,859 for women, a difference of 31.2%. Men with an educational attainment of graduate degree enjoy the highest average annual earnings of $143,750, while those with college or associate's degree education earn the least with $59,663. Women with an educational attainment of college or associate's degree earn the most with the average annual earnings of $80,492, while those with graduate degree education have the smallest earnings of $33,864.
| Educational Attainment | Male Income | Female Income |
| Less than High School | - | - |
| High School Diploma | - | - |
| College or Associate's Degree | $59,663 | $80,492 |
| Bachelor's Degree | $90,906 | $60,341 |
| Graduate Degree | $143,750 | $33,864 |
| Total | $81,146 | $55,859 |
Family Income in Blue River
Family Income Brackets in Blue River
According to the Blue River family income data, there are 82 families falling into the $200,000+ income range, which is the most common income bracket and makes up 29.8% of all families.
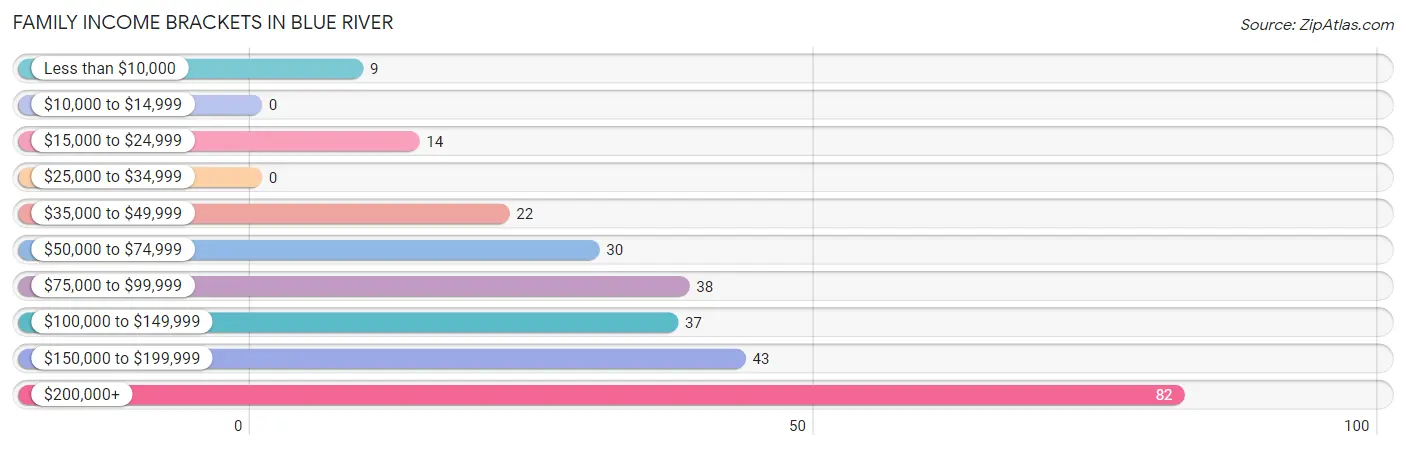
| Income Bracket | # Families | % Families |
| Less than $10,000 | 9 | 3.3% |
| $10,000 to $14,999 | 0 | 0.0% |
| $15,000 to $24,999 | 14 | 5.1% |
| $25,000 to $34,999 | 0 | 0.0% |
| $35,000 to $49,999 | 22 | 8.0% |
| $50,000 to $74,999 | 30 | 10.9% |
| $75,000 to $99,999 | 38 | 13.8% |
| $100,000 to $149,999 | 37 | 13.5% |
| $150,000 to $199,999 | 43 | 15.6% |
| $200,000+ | 82 | 29.8% |
Family Income by Famaliy Size in Blue River
2-person families (160 | 58.2%) account for the highest median family income in Blue River with $135,714 per family, while 2-person families (160 | 58.2%) have the highest median income of $67,857 per family member.
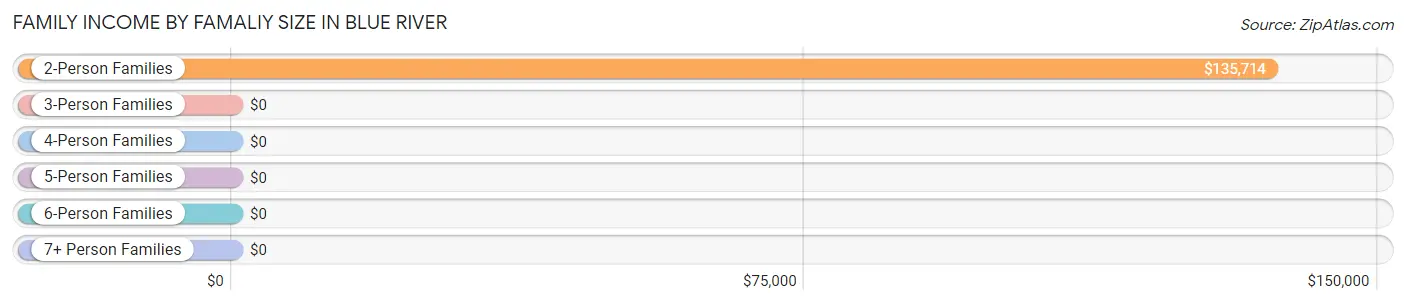
| Income Bracket | # Families | Median Income |
| 2-Person Families | 160 (58.2%) | $135,714 |
| 3-Person Families | 44 (16.0%) | $0 |
| 4-Person Families | 64 (23.3%) | $0 |
| 5-Person Families | 7 (2.5%) | $0 |
| 6-Person Families | 0 (0.0%) | $0 |
| 7+ Person Families | 0 (0.0%) | $0 |
| Total | 275 (100.0%) | $135,179 |
Family Income by Number of Earners in Blue River
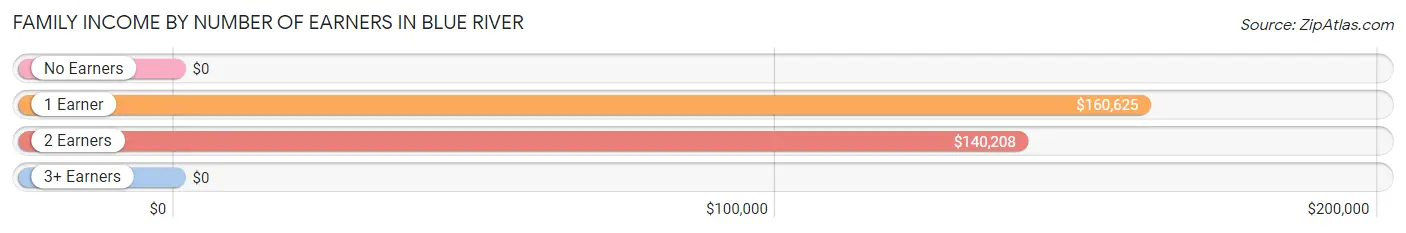
| Number of Earners | # Families | Median Income |
| No Earners | 49 (17.8%) | $0 |
| 1 Earner | 87 (31.6%) | $160,625 |
| 2 Earners | 123 (44.7%) | $140,208 |
| 3+ Earners | 16 (5.8%) | $0 |
| Total | 275 (100.0%) | $135,179 |
Household Income in Blue River
Household Income Brackets in Blue River
With 129 households falling in the category, the $200,000+ income range is the most frequent in Blue River, accounting for 33.9% of all households.
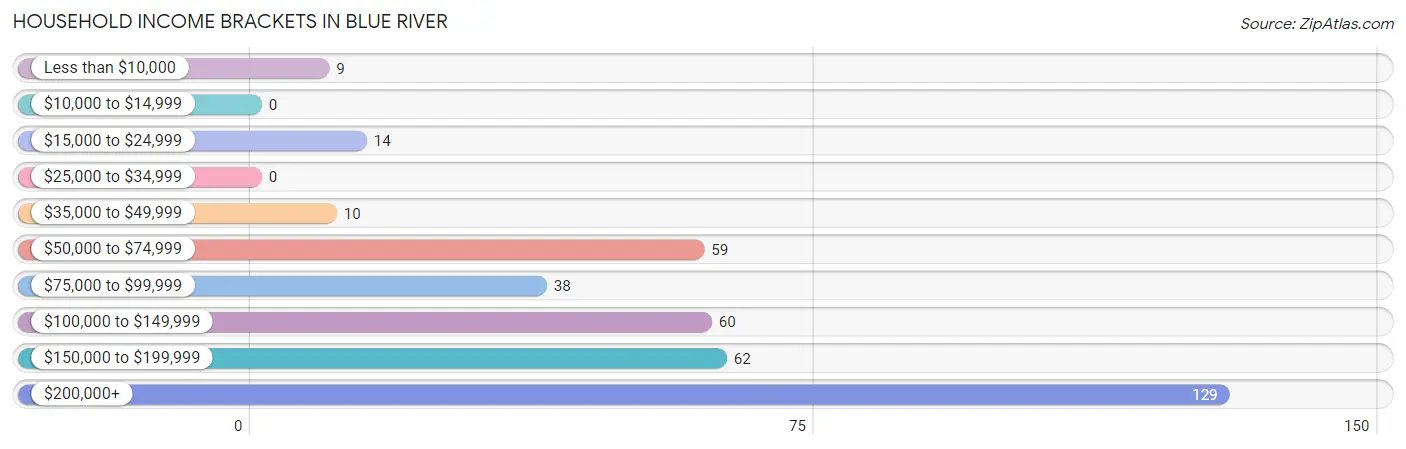
| Income Bracket | # Households | % Households |
| Less than $10,000 | 9 | 2.4% |
| $10,000 to $14,999 | 0 | 0.0% |
| $15,000 to $24,999 | 14 | 3.7% |
| $25,000 to $34,999 | 0 | 0.0% |
| $35,000 to $49,999 | 10 | 2.6% |
| $50,000 to $74,999 | 59 | 15.5% |
| $75,000 to $99,999 | 38 | 10.0% |
| $100,000 to $149,999 | 60 | 15.7% |
| $150,000 to $199,999 | 62 | 16.3% |
| $200,000+ | 129 | 33.9% |
Household Income by Householder Age in Blue River
The median household income in Blue River is $150,074, with the highest median household income of $167,344 found in the 65+ years age bracket for the primary householder. A total of 63 households (16.5%) fall into this category. Meanwhile, the 15 to 24 years age bracket for the primary householder has the lowest median household income of $126,071, with 20 households (5.2%) in this group.
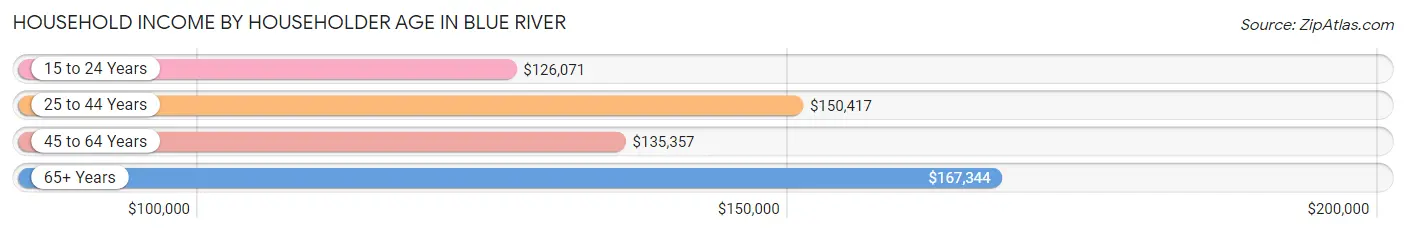
| Income Bracket | # Households | Median Income |
| 15 to 24 Years | 20 (5.2%) | $126,071 |
| 25 to 44 Years | 104 (27.3%) | $150,417 |
| 45 to 64 Years | 194 (50.9%) | $135,357 |
| 65+ Years | 63 (16.5%) | $167,344 |
| Total | 381 (100.0%) | $150,074 |
Poverty in Blue River
Income Below Poverty by Sex and Age in Blue River
With 5.0% poverty level for males and 3.5% for females among the residents of Blue River, 18 to 24 year old males and 6 to 11 year old females are the most vulnerable to poverty, with 24 males (43.6%) and 13 females (12.1%) in their respective age groups living below the poverty level.
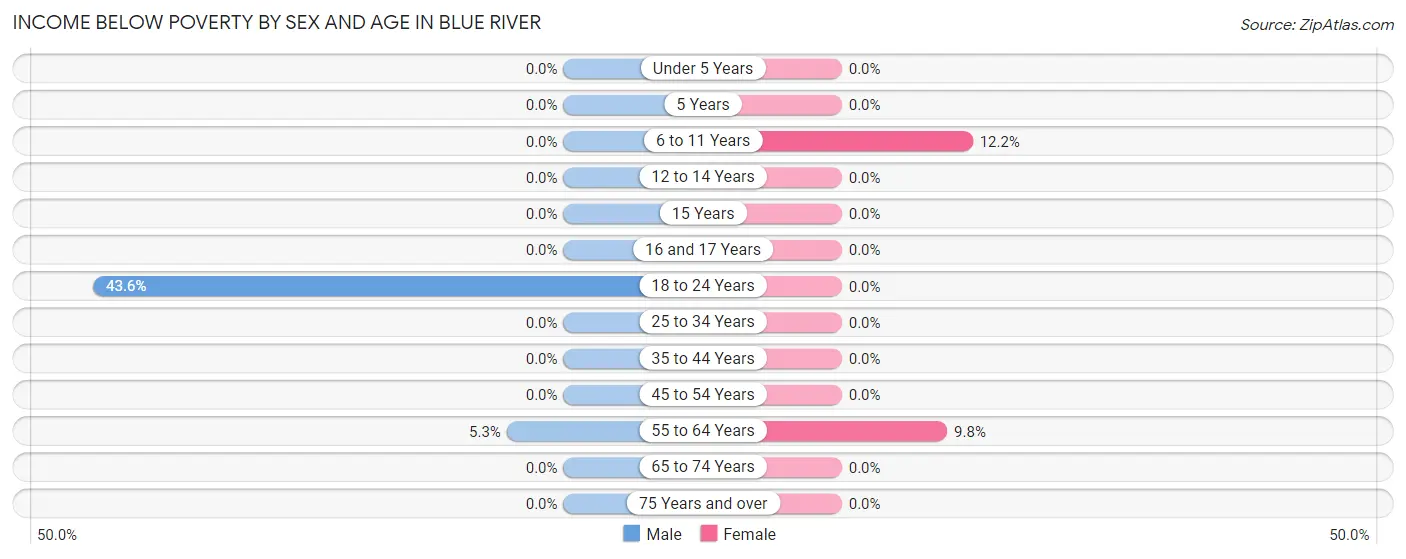
| Age Bracket | Male | Female |
| Under 5 Years | 0 (0.0%) | 0 (0.0%) |
| 5 Years | 0 (0.0%) | 0 (0.0%) |
| 6 to 11 Years | 0 (0.0%) | 13 (12.1%) |
| 12 to 14 Years | 0 (0.0%) | 0 (0.0%) |
| 15 Years | 0 (0.0%) | 0 (0.0%) |
| 16 and 17 Years | 0 (0.0%) | 0 (0.0%) |
| 18 to 24 Years | 24 (43.6%) | 0 (0.0%) |
| 25 to 34 Years | 0 (0.0%) | 0 (0.0%) |
| 35 to 44 Years | 0 (0.0%) | 0 (0.0%) |
| 45 to 54 Years | 0 (0.0%) | 0 (0.0%) |
| 55 to 64 Years | 6 (5.3%) | 9 (9.8%) |
| 65 to 74 Years | 0 (0.0%) | 0 (0.0%) |
| 75 Years and over | 0 (0.0%) | 0 (0.0%) |
| Total | 30 (5.0%) | 22 (3.5%) |
Income Above Poverty by Sex and Age in Blue River
According to the poverty statistics in Blue River, males aged under 5 years and females aged under 5 years are the age groups that are most secure financially, with 100.0% of males and 100.0% of females in these age groups living above the poverty line.
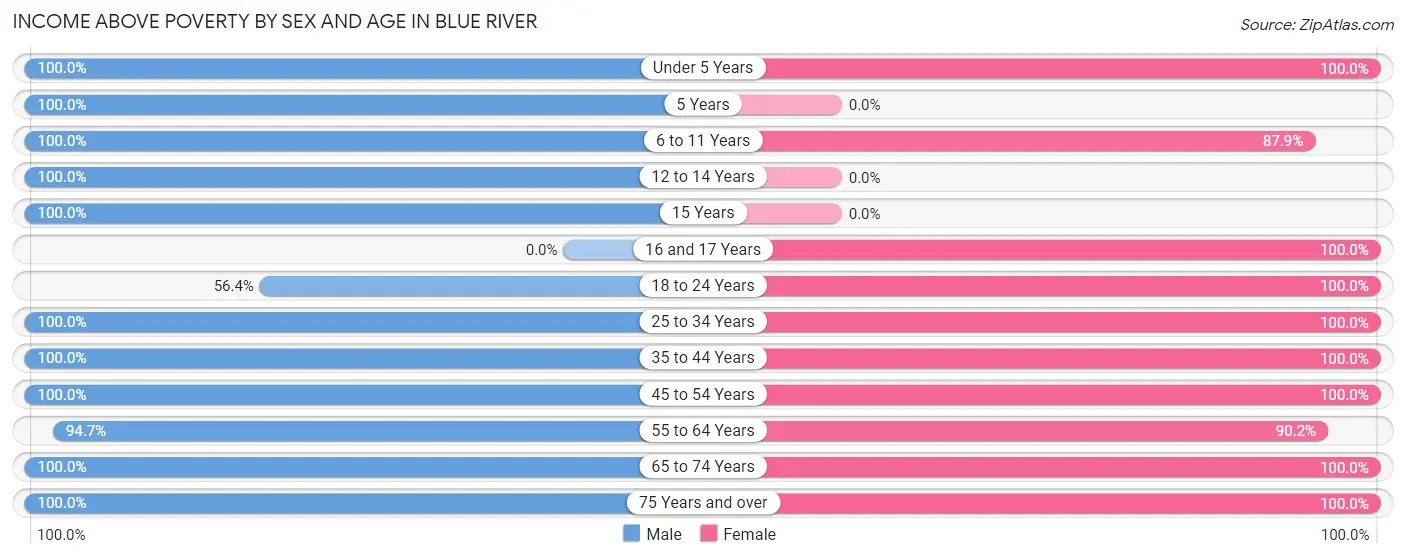
| Age Bracket | Male | Female |
| Under 5 Years | 36 (100.0%) | 14 (100.0%) |
| 5 Years | 8 (100.0%) | 0 (0.0%) |
| 6 to 11 Years | 24 (100.0%) | 94 (87.8%) |
| 12 to 14 Years | 8 (100.0%) | 0 (0.0%) |
| 15 Years | 12 (100.0%) | 0 (0.0%) |
| 16 and 17 Years | 0 (0.0%) | 5 (100.0%) |
| 18 to 24 Years | 31 (56.4%) | 17 (100.0%) |
| 25 to 34 Years | 149 (100.0%) | 203 (100.0%) |
| 35 to 44 Years | 51 (100.0%) | 79 (100.0%) |
| 45 to 54 Years | 88 (100.0%) | 47 (100.0%) |
| 55 to 64 Years | 108 (94.7%) | 83 (90.2%) |
| 65 to 74 Years | 38 (100.0%) | 57 (100.0%) |
| 75 Years and over | 19 (100.0%) | 15 (100.0%) |
| Total | 572 (95.0%) | 614 (96.5%) |
Income Below Poverty Among Married-Couple Families in Blue River
The poverty statistics for married-couple families in Blue River show that 3.6% or 9 of the total 250 families live below the poverty line. Families with 1 or 2 children have the highest poverty rate of 15.5%, comprising of 9 families. On the other hand, families with no children have the lowest poverty rate of 0.0%, which includes 0 families.
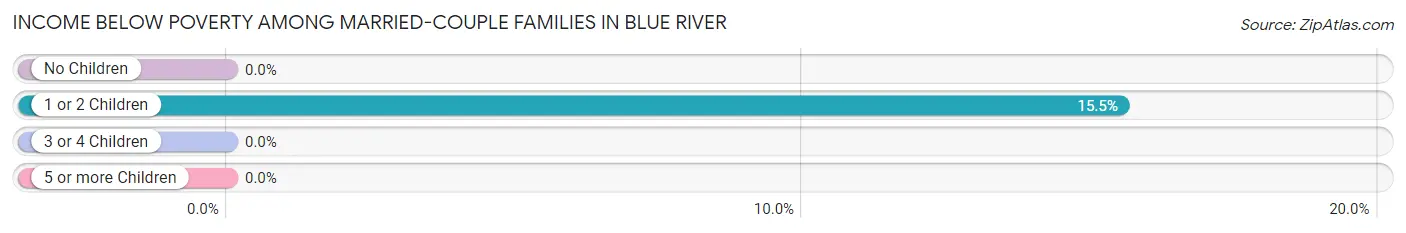
| Children | Above Poverty | Below Poverty |
| No Children | 185 (100.0%) | 0 (0.0%) |
| 1 or 2 Children | 49 (84.5%) | 9 (15.5%) |
| 3 or 4 Children | 7 (100.0%) | 0 (0.0%) |
| 5 or more Children | 0 (0.0%) | 0 (0.0%) |
| Total | 241 (96.4%) | 9 (3.6%) |
Income Below Poverty Among Single-Parent Households in Blue River
| Children | Single Father | Single Mother |
| No Children | 0 (0.0%) | 0 (0.0%) |
| 1 or 2 Children | 0 (0.0%) | 0 (0.0%) |
| 3 or 4 Children | 0 (0.0%) | 0 (0.0%) |
| 5 or more Children | 0 (0.0%) | 0 (0.0%) |
| Total | 0 (0.0%) | 0 (0.0%) |
Income Below Poverty Among Married-Couple vs Single-Parent Households in Blue River
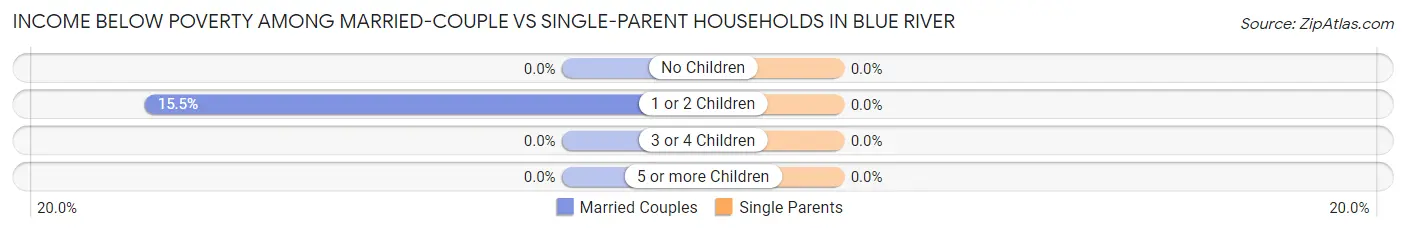
| Children | Married-Couple Families | Single-Parent Households |
| No Children | 0 (0.0%) | 0 (0.0%) |
| 1 or 2 Children | 9 (15.5%) | 0 (0.0%) |
| 3 or 4 Children | 0 (0.0%) | 0 (0.0%) |
| 5 or more Children | 0 (0.0%) | 0 (0.0%) |
| Total | 9 (3.6%) | 0 (0.0%) |
Race in Blue River
The most populous races in Blue River are White / Caucasian (1,154 | 93.2%), Two or more Races (55 | 4.4%), and Hispanic or Latino (29 | 2.3%).
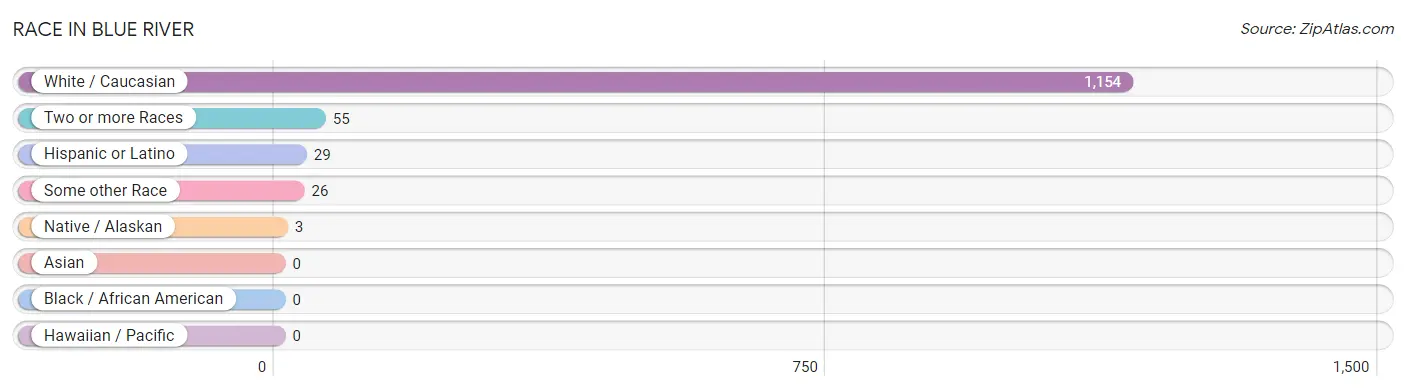
| Race | # Population | % Population |
| Asian | 0 | 0.0% |
| Black / African American | 0 | 0.0% |
| Hawaiian / Pacific | 0 | 0.0% |
| Hispanic or Latino | 29 | 2.3% |
| Native / Alaskan | 3 | 0.2% |
| White / Caucasian | 1,154 | 93.2% |
| Two or more Races | 55 | 4.4% |
| Some other Race | 26 | 2.1% |
| Total | 1,238 | 100.0% |
Ancestry in Blue River
The most populous ancestries reported in Blue River are German (237 | 19.1%), Swedish (111 | 9.0%), Irish (102 | 8.2%), American (94 | 7.6%), and Polish (75 | 6.1%), together accounting for 50.0% of all Blue River residents.
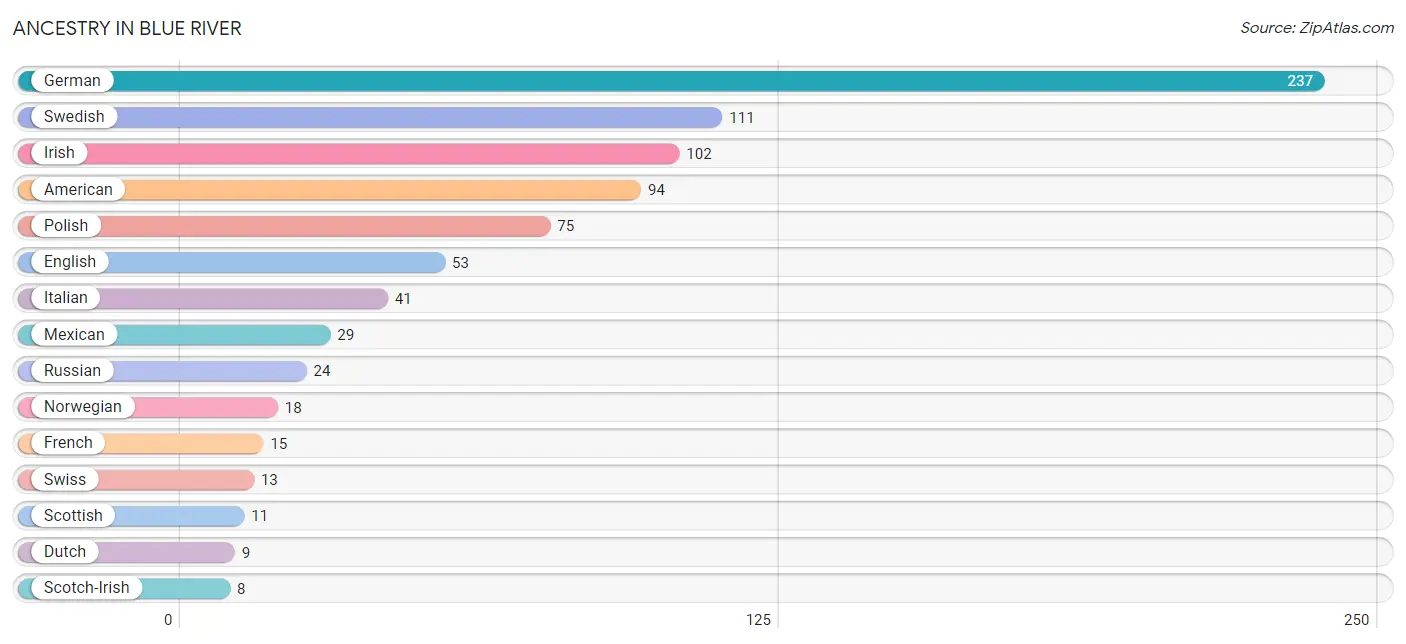
| Ancestry | # Population | % Population |
| American | 94 | 7.6% |
| Austrian | 6 | 0.5% |
| British | 7 | 0.6% |
| Czech | 7 | 0.6% |
| Dutch | 9 | 0.7% |
| English | 53 | 4.3% |
| European | 7 | 0.6% |
| French | 15 | 1.2% |
| German | 237 | 19.1% |
| Irish | 102 | 8.2% |
| Italian | 41 | 3.3% |
| Mexican | 29 | 2.3% |
| Norwegian | 18 | 1.5% |
| Polish | 75 | 6.1% |
| Russian | 24 | 1.9% |
| Scotch-Irish | 8 | 0.6% |
| Scottish | 11 | 0.9% |
| Slavic | 8 | 0.6% |
| Slovak | 6 | 0.5% |
| Swedish | 111 | 9.0% |
| Swiss | 13 | 1.1% |
| Welsh | 6 | 0.5% | View All 22 Rows |
Immigrants in Blue River
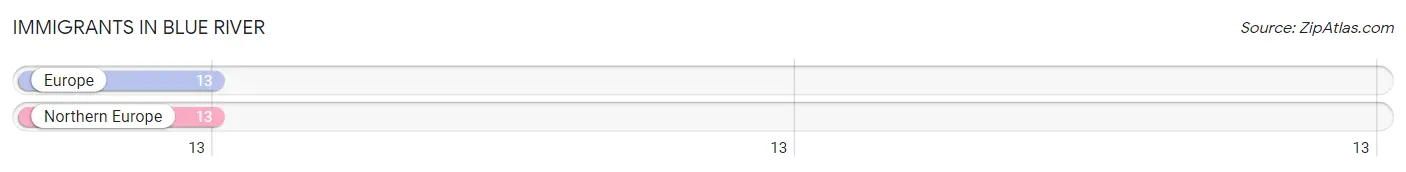
The most numerous immigrant groups reported in Blue River came from Europe (13 | 1.1%), and Northern Europe (13 | 1.1%), together accounting for 2.1% of all Blue River residents.
| Immigration Origin | # Population | % Population |
| Europe | 13 | 1.1% |
| Northern Europe | 13 | 1.1% | View All 2 Rows |
Sex and Age in Blue River
Sex and Age in Blue River
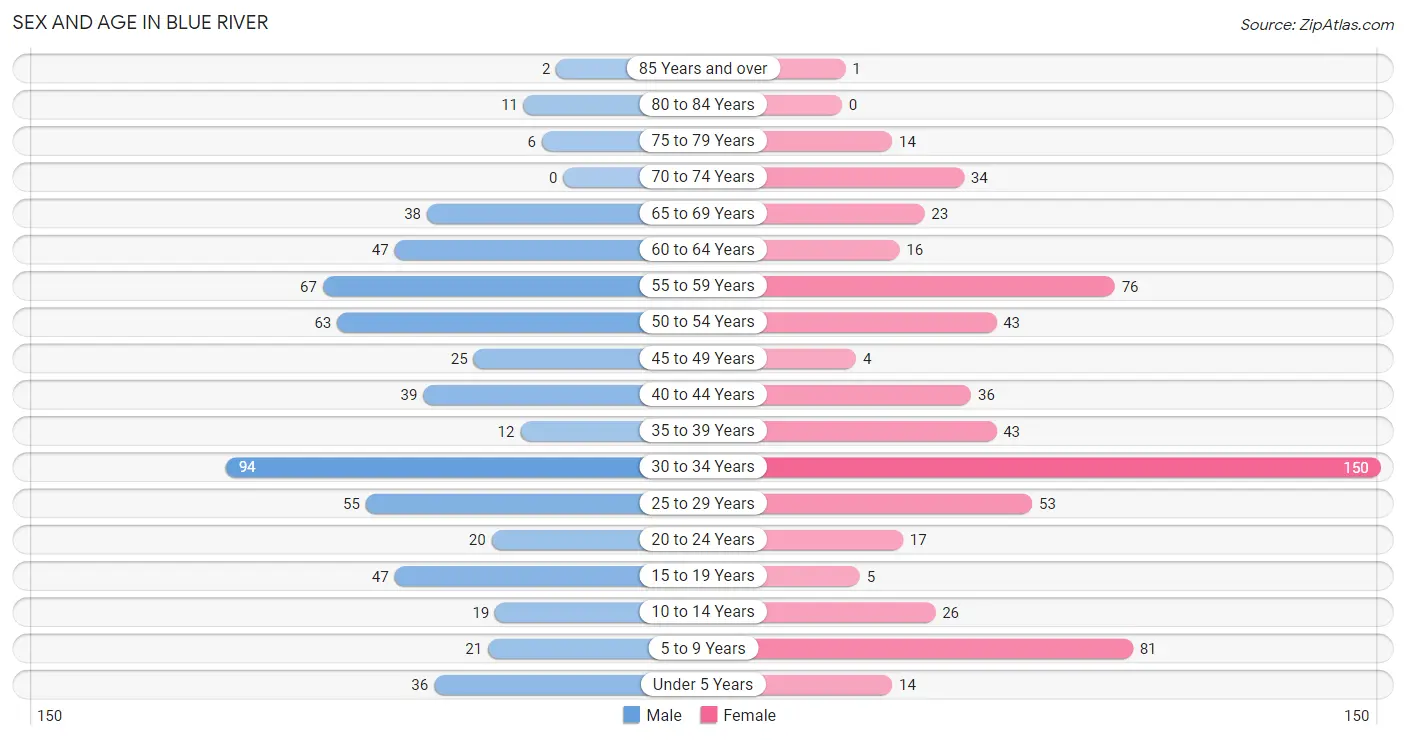
The most populous age groups in Blue River are 30 to 34 Years (94 | 15.6%) for men and 30 to 34 Years (150 | 23.6%) for women.
| Age Bracket | Male | Female |
| Under 5 Years | 36 (6.0%) | 14 (2.2%) |
| 5 to 9 Years | 21 (3.5%) | 81 (12.7%) |
| 10 to 14 Years | 19 (3.2%) | 26 (4.1%) |
| 15 to 19 Years | 47 (7.8%) | 5 (0.8%) |
| 20 to 24 Years | 20 (3.3%) | 17 (2.7%) |
| 25 to 29 Years | 55 (9.1%) | 53 (8.3%) |
| 30 to 34 Years | 94 (15.6%) | 150 (23.6%) |
| 35 to 39 Years | 12 (2.0%) | 43 (6.8%) |
| 40 to 44 Years | 39 (6.5%) | 36 (5.7%) |
| 45 to 49 Years | 25 (4.2%) | 4 (0.6%) |
| 50 to 54 Years | 63 (10.5%) | 43 (6.8%) |
| 55 to 59 Years | 67 (11.1%) | 76 (11.9%) |
| 60 to 64 Years | 47 (7.8%) | 16 (2.5%) |
| 65 to 69 Years | 38 (6.3%) | 23 (3.6%) |
| 70 to 74 Years | 0 (0.0%) | 34 (5.3%) |
| 75 to 79 Years | 6 (1.0%) | 14 (2.2%) |
| 80 to 84 Years | 11 (1.8%) | 0 (0.0%) |
| 85 Years and over | 2 (0.3%) | 1 (0.2%) |
| Total | 602 (100.0%) | 636 (100.0%) |
Families and Households in Blue River
Median Family Size in Blue River
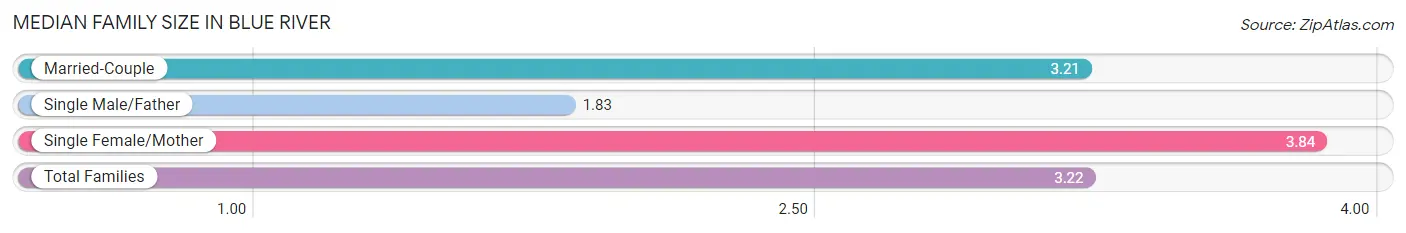
The median family size in Blue River is 3.22 persons per family, with single female/mother families (19 | 6.9%) accounting for the largest median family size of 3.84 persons per family. On the other hand, single male/father families (6 | 2.2%) represent the smallest median family size with 1.83 persons per family.
| Family Type | # Families | Family Size |
| Married-Couple | 250 (90.9%) | 3.21 |
| Single Male/Father | 6 (2.2%) | 1.83 |
| Single Female/Mother | 19 (6.9%) | 3.84 |
| Total Families | 275 (100.0%) | 3.22 |
Median Household Size in Blue River
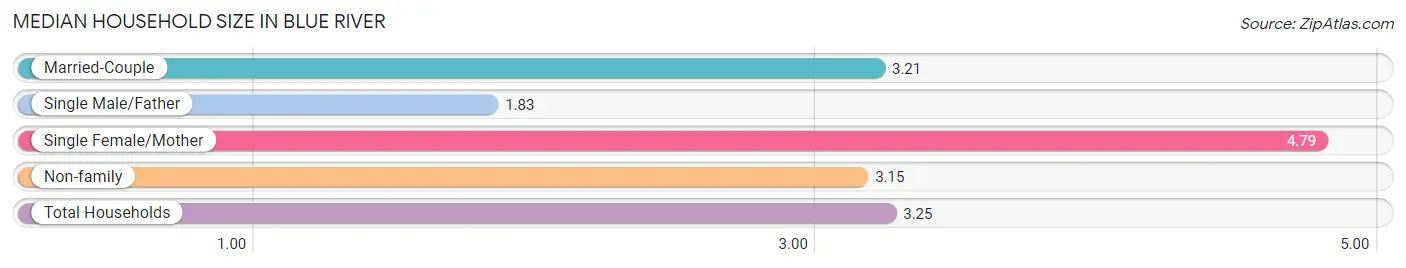
The median household size in Blue River is 3.25 persons per household, with single female/mother households (19 | 5.0%) accounting for the largest median household size of 4.79 persons per household. single male/father households (6 | 1.6%) represent the smallest median household size with 1.83 persons per household.
| Household Type | # Households | Household Size |
| Married-Couple | 250 (65.6%) | 3.21 |
| Single Male/Father | 6 (1.6%) | 1.83 |
| Single Female/Mother | 19 (5.0%) | 4.79 |
| Non-family | 106 (27.8%) | 3.15 |
| Total Households | 381 (100.0%) | 3.25 |
Household Size by Marriage Status in Blue River
Out of a total of 381 households in Blue River, 275 (72.2%) are family households, while 106 (27.8%) are nonfamily households. The most numerous type of family households are 2-person households, comprising 160, and the most common type of nonfamily households are 1-person households, comprising 44.
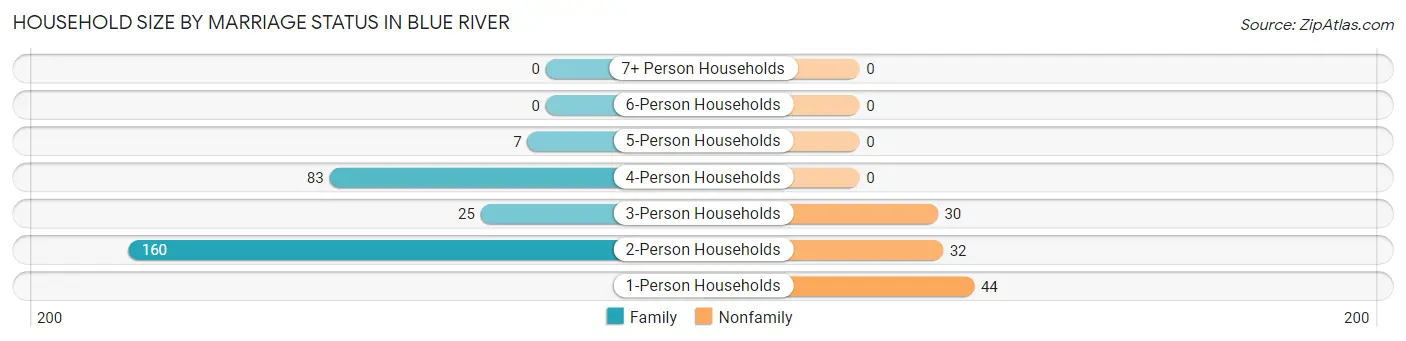
| Household Size | Family Households | Nonfamily Households |
| 1-Person Households | - | 44 (11.6%) |
| 2-Person Households | 160 (42.0%) | 32 (8.4%) |
| 3-Person Households | 25 (6.6%) | 30 (7.9%) |
| 4-Person Households | 83 (21.8%) | 0 (0.0%) |
| 5-Person Households | 7 (1.8%) | 0 (0.0%) |
| 6-Person Households | 0 (0.0%) | 0 (0.0%) |
| 7+ Person Households | 0 (0.0%) | 0 (0.0%) |
| Total | 275 (72.2%) | 106 (27.8%) |
Female Fertility in Blue River
Fertility by Age in Blue River
| Age Bracket | Women with Births | Births / 1,000 Women |
| 15 to 19 years | 0 (0.0%) | 0.0 |
| 20 to 34 years | 0 (0.0%) | 0.0 |
| 35 to 50 years | 0 (0.0%) | 0.0 |
| Total | 0 (0.0%) | 0.0 |
Fertility by Age by Marriage Status in Blue River
| Age Bracket | Married | Unmarried |
| 15 to 19 years | 0 (0.0%) | 0 (0.0%) |
| 20 to 34 years | 0 (0.0%) | 0 (0.0%) |
| 35 to 50 years | 0 (0.0%) | 0 (0.0%) |
| Total | 0 (0.0%) | 0 (0.0%) |
Fertility by Education in Blue River
| Educational Attainment | Women with Births | Births / 1,000 Women |
| Less than High School | 0 (0.0%) | 0.0 |
| High School Diploma | 0 (0.0%) | 0.0 |
| College or Associate's Degree | 0 (0.0%) | 0.0 |
| Bachelor's Degree | 0 (0.0%) | 0.0 |
| Graduate Degree | 0 (0.0%) | 0.0 |
| Total | 0 (0.0%) | 0.0 |
Fertility by Education by Marriage Status in Blue River
| Educational Attainment | Married | Unmarried |
| Less than High School | 0 (0.0%) | 0 (0.0%) |
| High School Diploma | 0 (0.0%) | 0 (0.0%) |
| College or Associate's Degree | 0 (0.0%) | 0 (0.0%) |
| Bachelor's Degree | 0 (0.0%) | 0 (0.0%) |
| Graduate Degree | 0 (0.0%) | 0 (0.0%) |
| Total | 0 (0.0%) | 0 (0.0%) |
Employment Characteristics in Blue River
Employment by Class of Employer in Blue River
Among the 694 employed individuals in Blue River, private company employees (462 | 66.6%), self-employed (not incorporated) (53 | 7.6%), and self-employed (incorporated) (51 | 7.3%) make up the most common classes of employment.
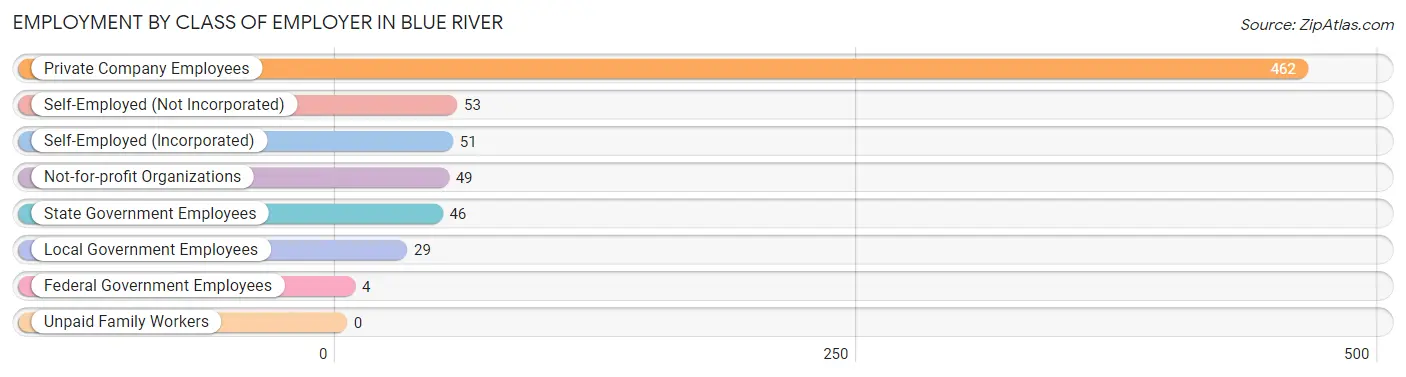
| Employer Class | # Employees | % Employees |
| Private Company Employees | 462 | 66.6% |
| Self-Employed (Incorporated) | 51 | 7.3% |
| Self-Employed (Not Incorporated) | 53 | 7.6% |
| Not-for-profit Organizations | 49 | 7.1% |
| Local Government Employees | 29 | 4.2% |
| State Government Employees | 46 | 6.6% |
| Federal Government Employees | 4 | 0.6% |
| Unpaid Family Workers | 0 | 0.0% |
| Total | 694 | 100.0% |
Employment Status by Age in Blue River
According to the labor force statistics for Blue River, out of the total population over 16 years of age (1,029), 72.3% or 744 individuals are in the labor force, with 0.8% or 6 of them unemployed. The age group with the highest labor force participation rate is 16 to 19 years, with 100.0% or 40 individuals in the labor force. Within the labor force, the 45 to 54 years age range has the highest percentage of unemployed individuals, with 4.4% or 6 of them being unemployed.
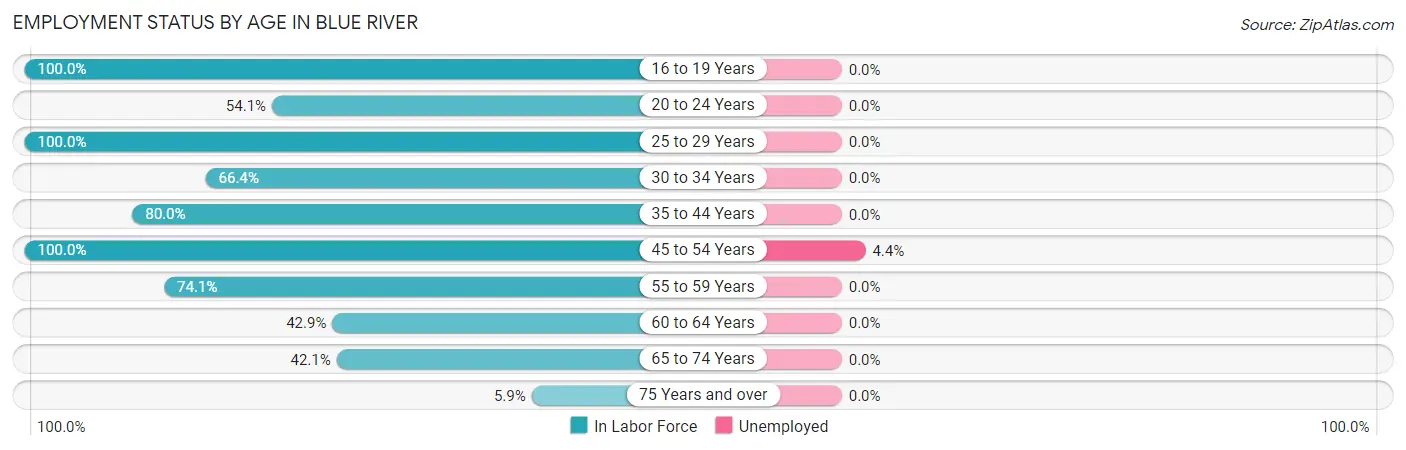
| Age Bracket | In Labor Force | Unemployed |
| 16 to 19 Years | 40 (100.0%) | 0 (0.0%) |
| 20 to 24 Years | 20 (54.1%) | 0 (0.0%) |
| 25 to 29 Years | 108 (100.0%) | 0 (0.0%) |
| 30 to 34 Years | 162 (66.4%) | 0 (0.0%) |
| 35 to 44 Years | 104 (80.0%) | 0 (0.0%) |
| 45 to 54 Years | 135 (100.0%) | 6 (4.4%) |
| 55 to 59 Years | 106 (74.1%) | 0 (0.0%) |
| 60 to 64 Years | 27 (42.9%) | 0 (0.0%) |
| 65 to 74 Years | 40 (42.1%) | 0 (0.0%) |
| 75 Years and over | 2 (5.9%) | 0 (0.0%) |
| Total | 744 (72.3%) | 6 (0.8%) |
Employment Status by Educational Attainment in Blue River
According to labor force statistics for Blue River, 78.0% of individuals (642) out of the total population between 25 and 64 years of age (823) are in the labor force, with 0.9% or 6 of them being unemployed. The group with the highest labor force participation rate are those with the educational attainment of high school diploma, with 89.0% or 65 individuals in the labor force. Within the labor force, individuals with bachelor's degree or higher education have the highest percentage of unemployment, with 1.6% or 6 of them being unemployed.
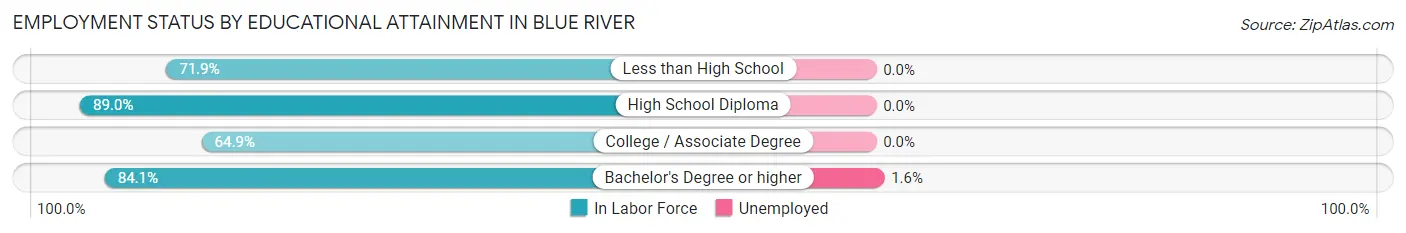
| Educational Attainment | In Labor Force | Unemployed |
| Less than High School | 23 (71.9%) | 0 (0.0%) |
| High School Diploma | 65 (89.0%) | 0 (0.0%) |
| College / Associate Degree | 168 (64.9%) | 0 (0.0%) |
| Bachelor's Degree or higher | 386 (84.1%) | 7 (1.6%) |
| Total | 642 (78.0%) | 7 (0.9%) |
Employment Occupations by Sex in Blue River
Management, Business, Science and Arts Occupations
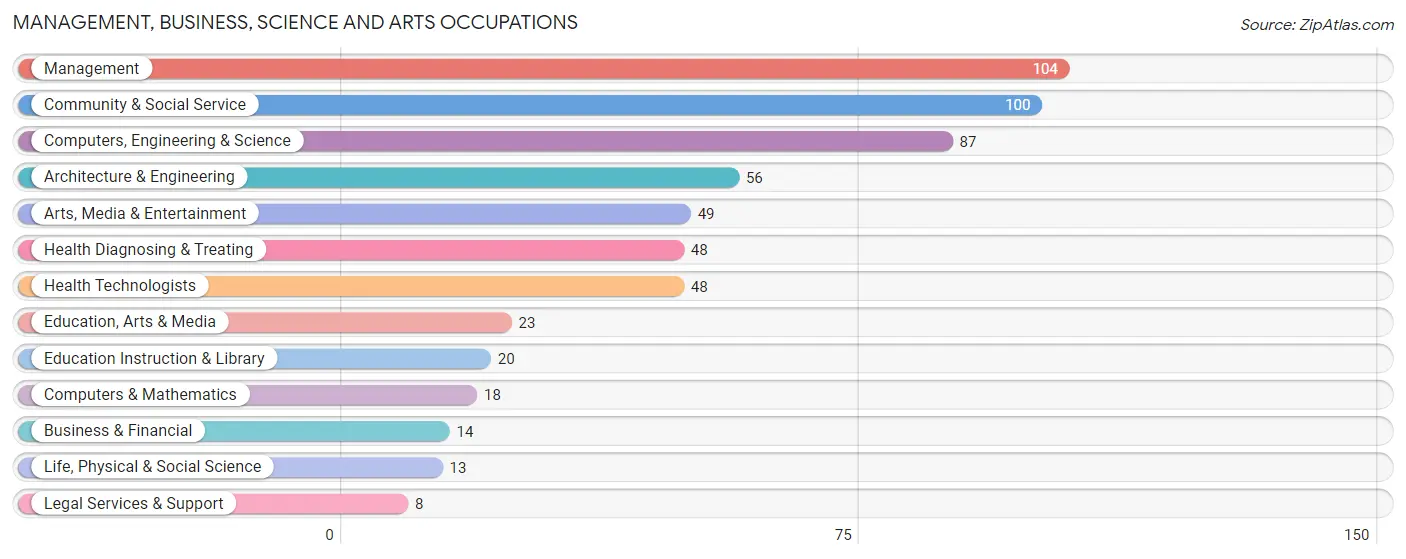
The most common Management, Business, Science and Arts occupations in Blue River are Management (104 | 14.1%), Community & Social Service (100 | 13.6%), Computers, Engineering & Science (87 | 11.8%), Architecture & Engineering (56 | 7.6%), and Arts, Media & Entertainment (49 | 6.6%).
Management, Business, Science and Arts Occupations by Sex
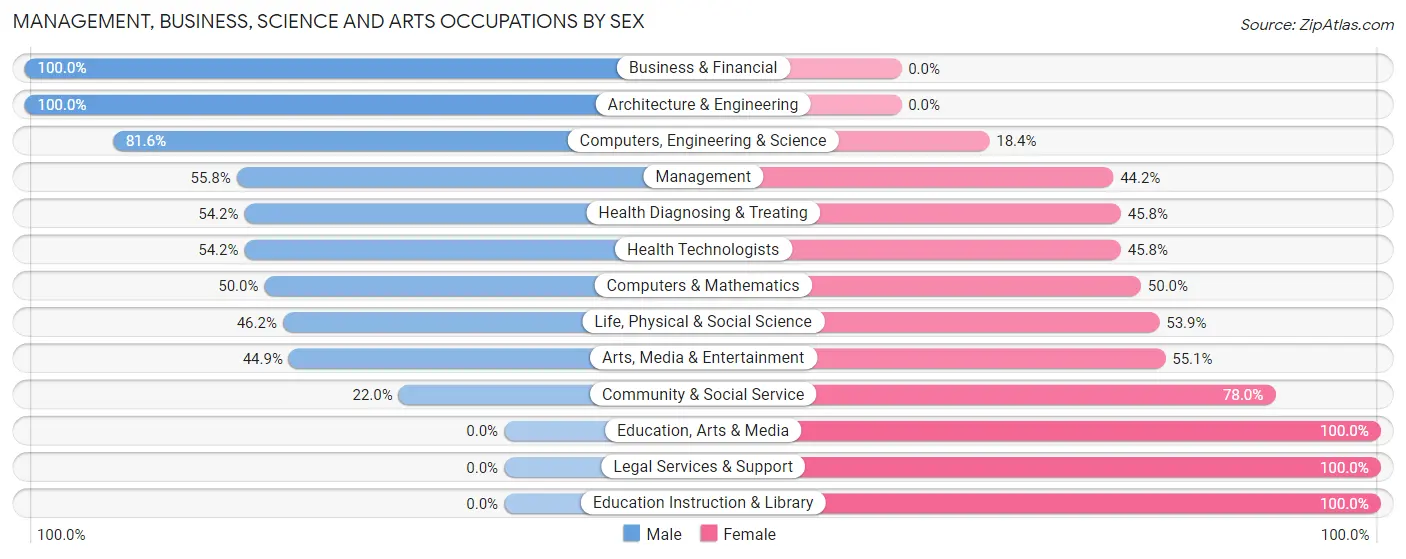
Within the Management, Business, Science and Arts occupations in Blue River, the most male-oriented occupations are Business & Financial (100.0%), Architecture & Engineering (100.0%), and Computers, Engineering & Science (81.6%), while the most female-oriented occupations are Education, Arts & Media (100.0%), Legal Services & Support (100.0%), and Education Instruction & Library (100.0%).
| Occupation | Male | Female |
| Management | 58 (55.8%) | 46 (44.2%) |
| Business & Financial | 14 (100.0%) | 0 (0.0%) |
| Computers, Engineering & Science | 71 (81.6%) | 16 (18.4%) |
| Computers & Mathematics | 9 (50.0%) | 9 (50.0%) |
| Architecture & Engineering | 56 (100.0%) | 0 (0.0%) |
| Life, Physical & Social Science | 6 (46.2%) | 7 (53.8%) |
| Community & Social Service | 22 (22.0%) | 78 (78.0%) |
| Education, Arts & Media | 0 (0.0%) | 23 (100.0%) |
| Legal Services & Support | 0 (0.0%) | 8 (100.0%) |
| Education Instruction & Library | 0 (0.0%) | 20 (100.0%) |
| Arts, Media & Entertainment | 22 (44.9%) | 27 (55.1%) |
| Health Diagnosing & Treating | 26 (54.2%) | 22 (45.8%) |
| Health Technologists | 26 (54.2%) | 22 (45.8%) |
| Total (Category) | 191 (54.1%) | 162 (45.9%) |
| Total (Overall) | 452 (61.3%) | 286 (38.8%) |
Services Occupations
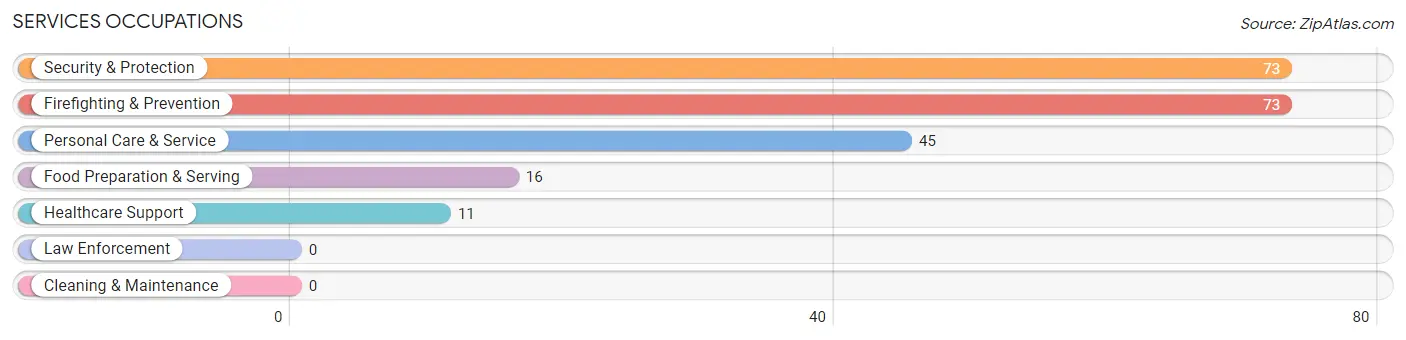
The most common Services occupations in Blue River are Security & Protection (73 | 9.9%), Firefighting & Prevention (73 | 9.9%), Personal Care & Service (45 | 6.1%), Food Preparation & Serving (16 | 2.2%), and Healthcare Support (11 | 1.5%).
Services Occupations by Sex
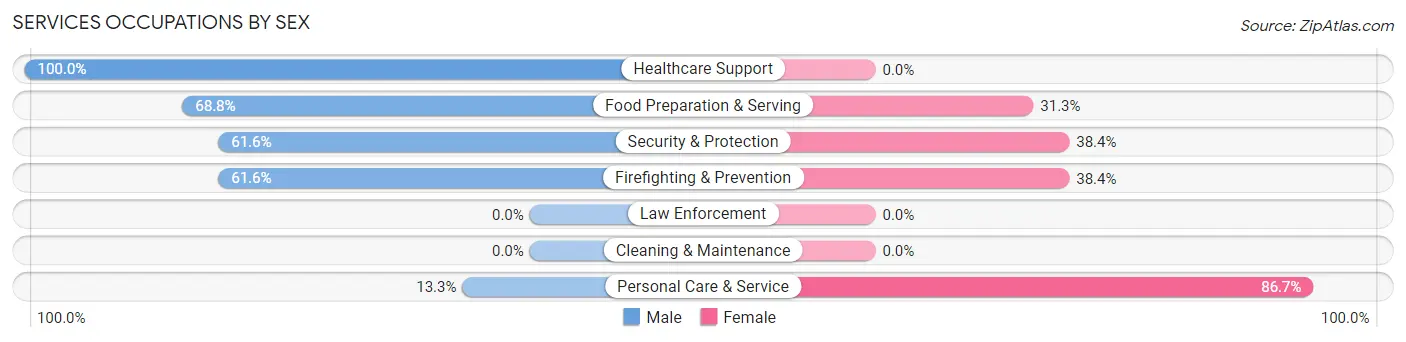
Within the Services occupations in Blue River, the most male-oriented occupations are Healthcare Support (100.0%), Food Preparation & Serving (68.8%), and Security & Protection (61.6%), while the most female-oriented occupations are Personal Care & Service (86.7%), Security & Protection (38.4%), and Firefighting & Prevention (38.4%).
| Occupation | Male | Female |
| Healthcare Support | 11 (100.0%) | 0 (0.0%) |
| Security & Protection | 45 (61.6%) | 28 (38.4%) |
| Firefighting & Prevention | 45 (61.6%) | 28 (38.4%) |
| Law Enforcement | 0 (0.0%) | 0 (0.0%) |
| Food Preparation & Serving | 11 (68.8%) | 5 (31.2%) |
| Cleaning & Maintenance | 0 (0.0%) | 0 (0.0%) |
| Personal Care & Service | 6 (13.3%) | 39 (86.7%) |
| Total (Category) | 73 (50.3%) | 72 (49.7%) |
| Total (Overall) | 452 (61.3%) | 286 (38.8%) |
Sales and Office Occupations
The most common Sales and Office occupations in Blue River are Sales & Related (95 | 12.9%), and Office & Administration (38 | 5.1%).
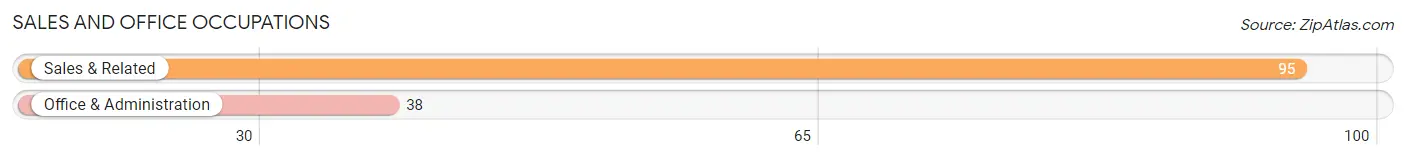
Sales and Office Occupations by Sex
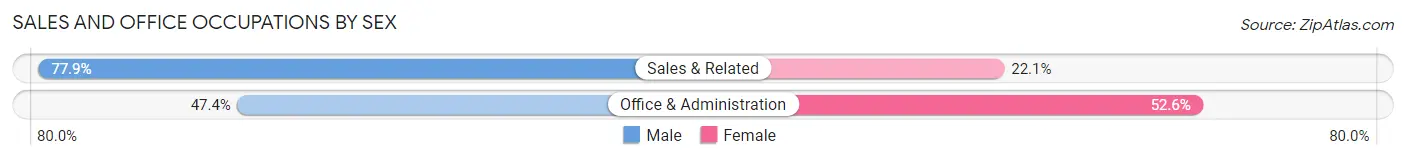
| Occupation | Male | Female |
| Sales & Related | 74 (77.9%) | 21 (22.1%) |
| Office & Administration | 18 (47.4%) | 20 (52.6%) |
| Total (Category) | 92 (69.2%) | 41 (30.8%) |
| Total (Overall) | 452 (61.3%) | 286 (38.8%) |
Natural Resources, Construction and Maintenance Occupations
The most common Natural Resources, Construction and Maintenance occupations in Blue River are Construction & Extraction (46 | 6.2%), Installation, Maintenance & Repair (29 | 3.9%), and Farming, Fishing & Forestry (4 | 0.5%).
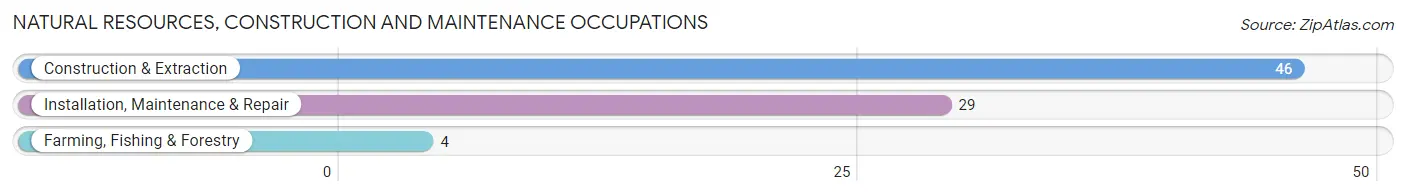
Natural Resources, Construction and Maintenance Occupations by Sex
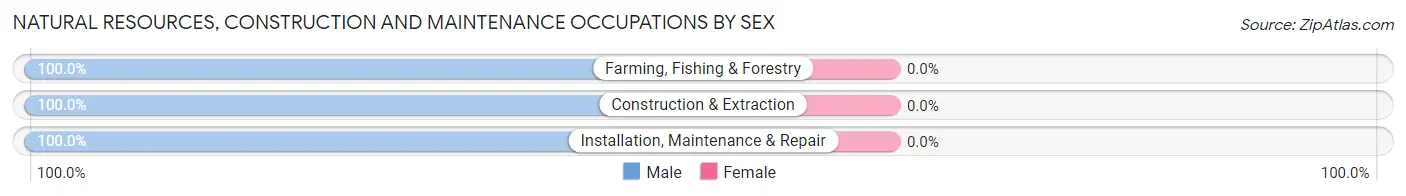
| Occupation | Male | Female |
| Farming, Fishing & Forestry | 4 (100.0%) | 0 (0.0%) |
| Construction & Extraction | 46 (100.0%) | 0 (0.0%) |
| Installation, Maintenance & Repair | 29 (100.0%) | 0 (0.0%) |
| Total (Category) | 79 (100.0%) | 0 (0.0%) |
| Total (Overall) | 452 (61.3%) | 286 (38.8%) |
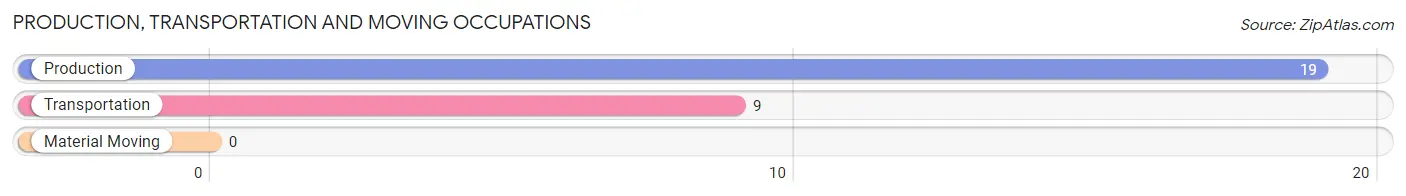
Production, Transportation and Moving Occupations
The most common Production, Transportation and Moving occupations in Blue River are Production (19 | 2.6%), and Transportation (9 | 1.2%).
Production, Transportation and Moving Occupations by Sex
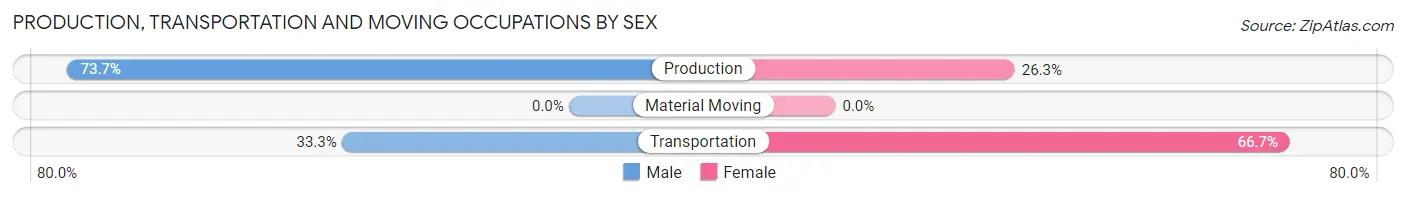
| Occupation | Male | Female |
| Production | 14 (73.7%) | 5 (26.3%) |
| Transportation | 3 (33.3%) | 6 (66.7%) |
| Material Moving | 0 (0.0%) | 0 (0.0%) |
| Total (Category) | 17 (60.7%) | 11 (39.3%) |
| Total (Overall) | 452 (61.3%) | 286 (38.8%) |
Employment Industries by Sex in Blue River
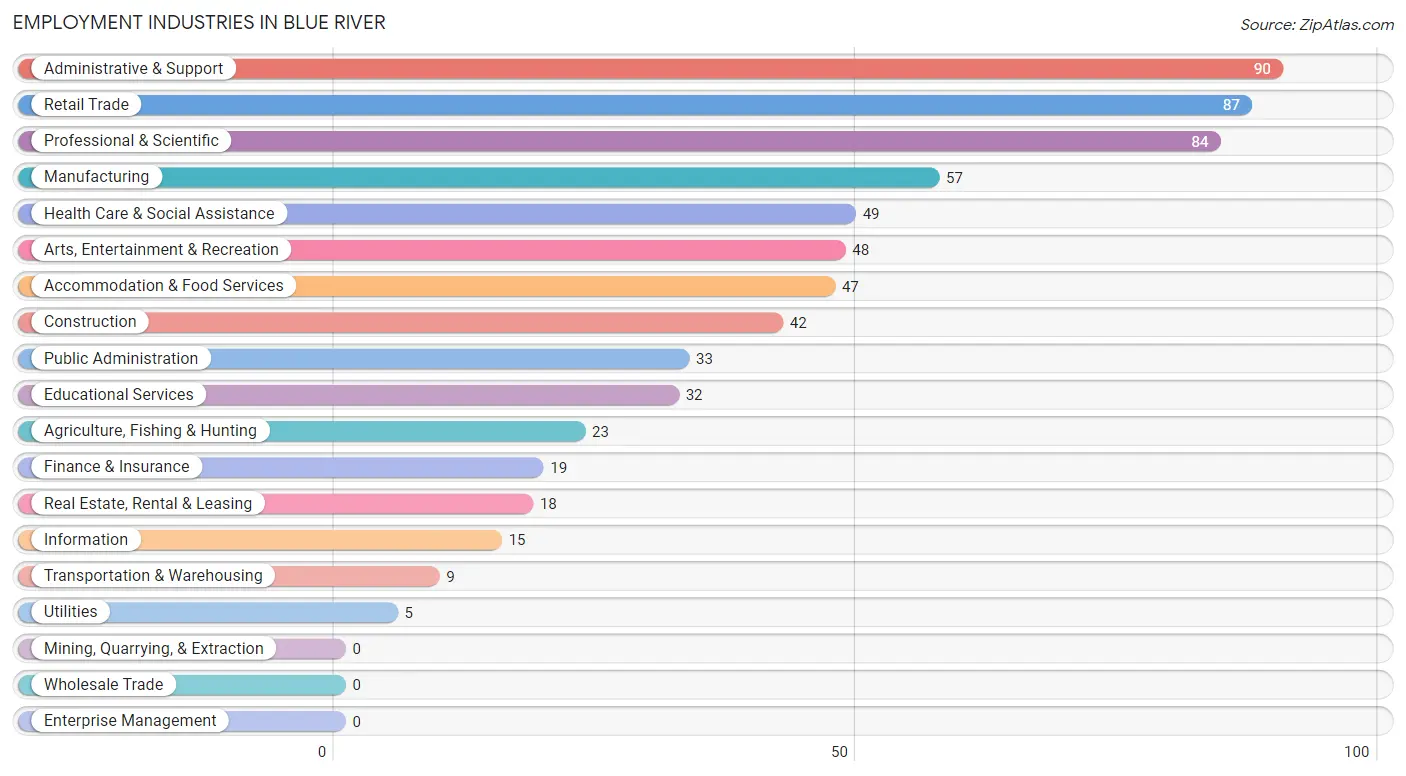
Employment Industries in Blue River
The major employment industries in Blue River include Administrative & Support (90 | 12.2%), Retail Trade (87 | 11.8%), Professional & Scientific (84 | 11.4%), Manufacturing (57 | 7.7%), and Health Care & Social Assistance (49 | 6.6%).
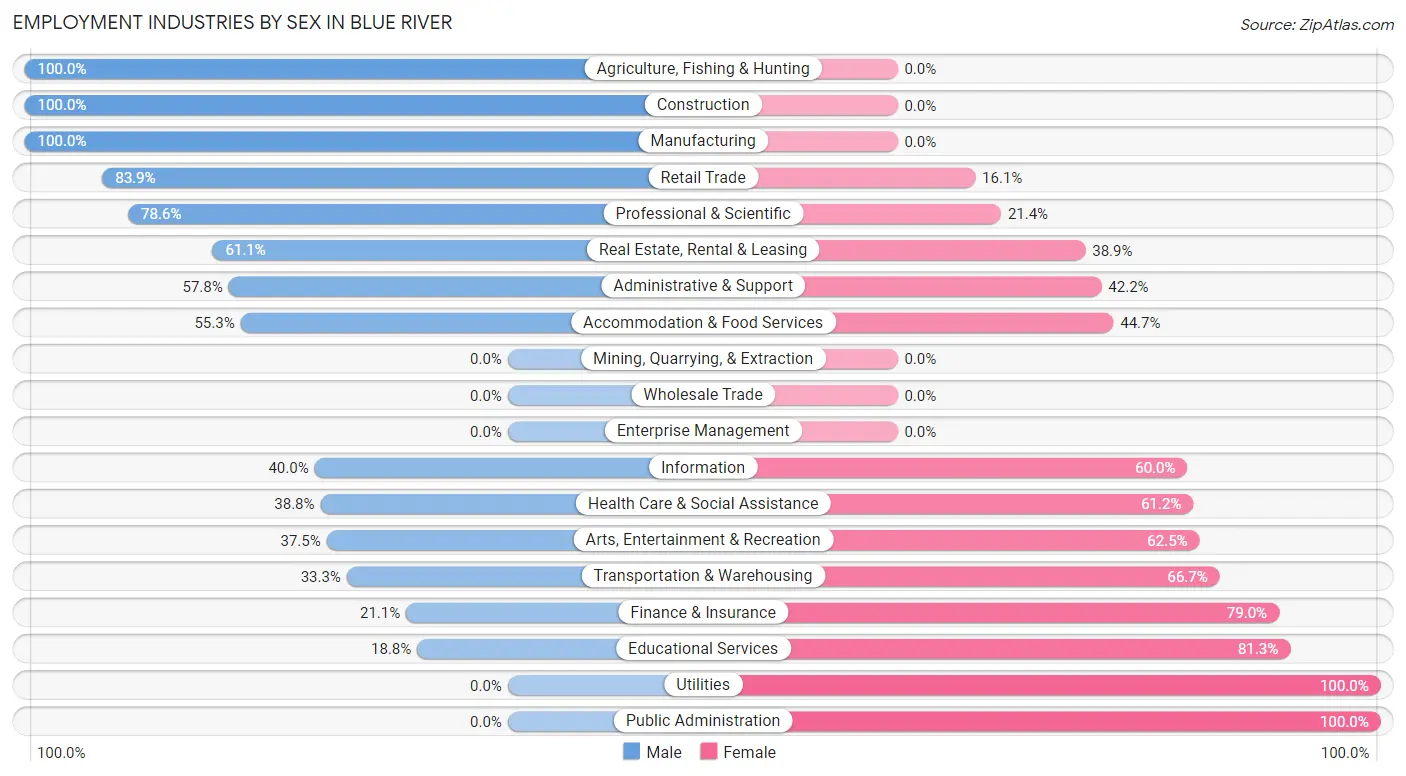
Employment Industries by Sex in Blue River
The Blue River industries that see more men than women are Agriculture, Fishing & Hunting (100.0%), Construction (100.0%), and Manufacturing (100.0%), whereas the industries that tend to have a higher number of women are Utilities (100.0%), Public Administration (100.0%), and Educational Services (81.2%).
| Industry | Male | Female |
| Agriculture, Fishing & Hunting | 23 (100.0%) | 0 (0.0%) |
| Mining, Quarrying, & Extraction | 0 (0.0%) | 0 (0.0%) |
| Construction | 42 (100.0%) | 0 (0.0%) |
| Manufacturing | 57 (100.0%) | 0 (0.0%) |
| Wholesale Trade | 0 (0.0%) | 0 (0.0%) |
| Retail Trade | 73 (83.9%) | 14 (16.1%) |
| Transportation & Warehousing | 3 (33.3%) | 6 (66.7%) |
| Utilities | 0 (0.0%) | 5 (100.0%) |
| Information | 6 (40.0%) | 9 (60.0%) |
| Finance & Insurance | 4 (21.0%) | 15 (78.9%) |
| Real Estate, Rental & Leasing | 11 (61.1%) | 7 (38.9%) |
| Professional & Scientific | 66 (78.6%) | 18 (21.4%) |
| Enterprise Management | 0 (0.0%) | 0 (0.0%) |
| Administrative & Support | 52 (57.8%) | 38 (42.2%) |
| Educational Services | 6 (18.8%) | 26 (81.2%) |
| Health Care & Social Assistance | 19 (38.8%) | 30 (61.2%) |
| Arts, Entertainment & Recreation | 18 (37.5%) | 30 (62.5%) |
| Accommodation & Food Services | 26 (55.3%) | 21 (44.7%) |
| Public Administration | 0 (0.0%) | 33 (100.0%) |
| Total | 452 (61.3%) | 286 (38.8%) |
Education in Blue River
School Enrollment in Blue River
The most common levels of schooling among the 343 students in Blue River are college / undergraduate (149 | 43.4%), elementary school (102 | 29.7%), and middle school (55 | 16.0%).
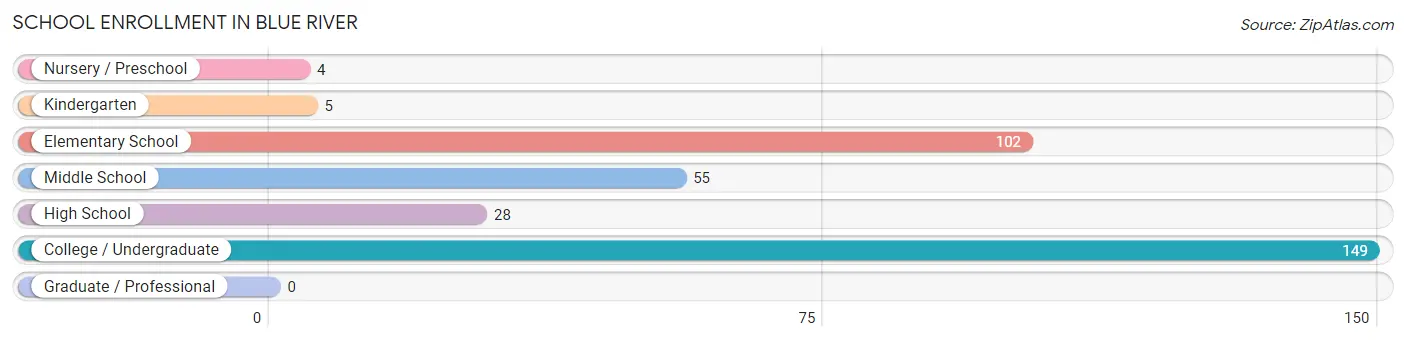
| School Level | # Students | % Students |
| Nursery / Preschool | 4 | 1.2% |
| Kindergarten | 5 | 1.5% |
| Elementary School | 102 | 29.7% |
| Middle School | 55 | 16.0% |
| High School | 28 | 8.2% |
| College / Undergraduate | 149 | 43.4% |
| Graduate / Professional | 0 | 0.0% |
| Total | 343 | 100.0% |
School Enrollment by Age by Funding Source in Blue River
Out of a total of 343 students who are enrolled in schools in Blue River, 10 (2.9%) attend a private institution, while the remaining 333 (97.1%) are enrolled in public schools. The age group of 3 to 4 year olds has the highest likelihood of being enrolled in private schools, with 4 (100.0% in the age bracket) enrolled. Conversely, the age group of 10 to 14 year olds has the lowest likelihood of being enrolled in a private school, with 45 (100.0% in the age bracket) attending a public institution.
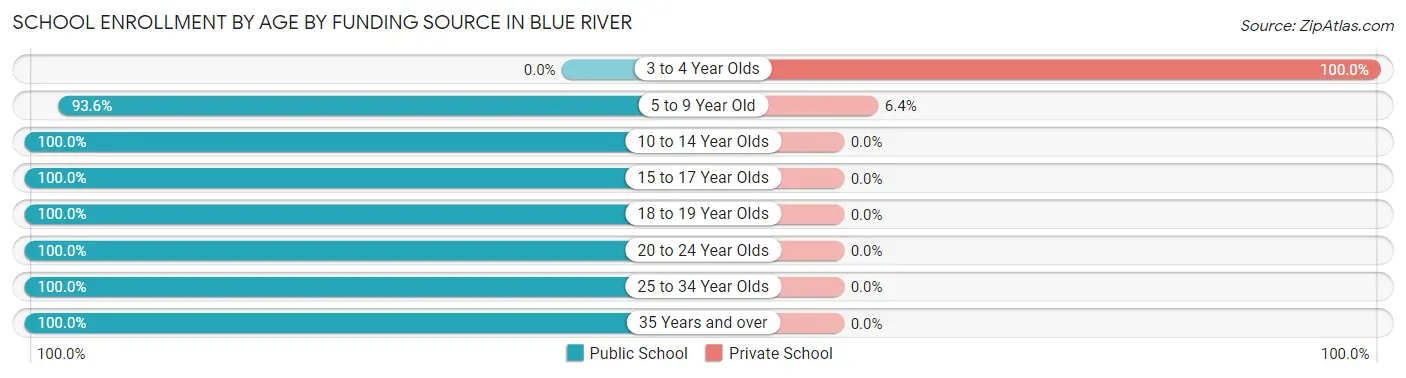
| Age Bracket | Public School | Private School |
| 3 to 4 Year Olds | 0 (0.0%) | 4 (100.0%) |
| 5 to 9 Year Old | 88 (93.6%) | 6 (6.4%) |
| 10 to 14 Year Olds | 45 (100.0%) | 0 (0.0%) |
| 15 to 17 Year Olds | 17 (100.0%) | 0 (0.0%) |
| 18 to 19 Year Olds | 35 (100.0%) | 0 (0.0%) |
| 20 to 24 Year Olds | 17 (100.0%) | 0 (0.0%) |
| 25 to 34 Year Olds | 108 (100.0%) | 0 (0.0%) |
| 35 Years and over | 23 (100.0%) | 0 (0.0%) |
| Total | 333 (97.1%) | 10 (2.9%) |
Educational Attainment by Field of Study in Blue River
Business (91 | 15.9%), bio, nature & agricultural (85 | 14.8%), education (62 | 10.8%), literature & languages (60 | 10.4%), and psychology (53 | 9.2%) are the most common fields of study among 574 individuals in Blue River who have obtained a bachelor's degree or higher.
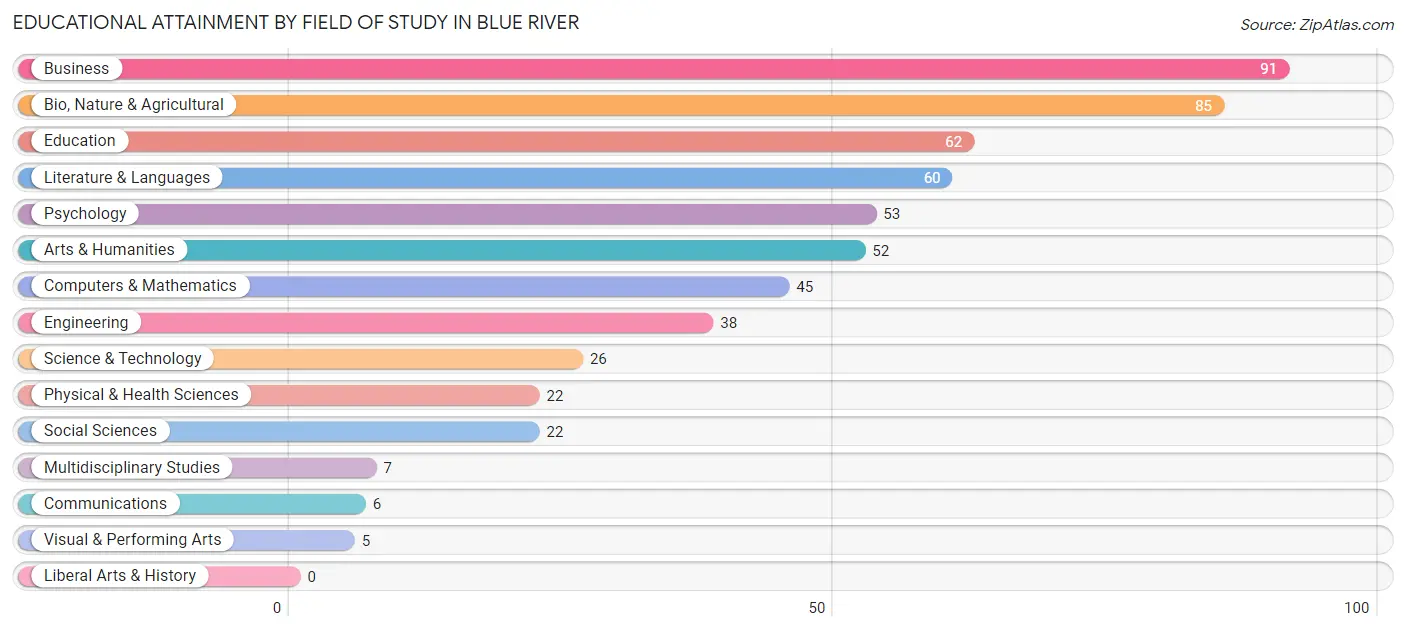
| Field of Study | # Graduates | % Graduates |
| Computers & Mathematics | 45 | 7.8% |
| Bio, Nature & Agricultural | 85 | 14.8% |
| Physical & Health Sciences | 22 | 3.8% |
| Psychology | 53 | 9.2% |
| Social Sciences | 22 | 3.8% |
| Engineering | 38 | 6.6% |
| Multidisciplinary Studies | 7 | 1.2% |
| Science & Technology | 26 | 4.5% |
| Business | 91 | 15.9% |
| Education | 62 | 10.8% |
| Literature & Languages | 60 | 10.4% |
| Liberal Arts & History | 0 | 0.0% |
| Visual & Performing Arts | 5 | 0.9% |
| Communications | 6 | 1.1% |
| Arts & Humanities | 52 | 9.1% |
| Total | 574 | 100.0% |
Transportation & Commute in Blue River
Vehicle Availability by Sex in Blue River
The most prevalent vehicle ownership categories in Blue River are males with 2 vehicles (143, accounting for 31.6%) and females with 2 vehicles (129, making up 59.1%).
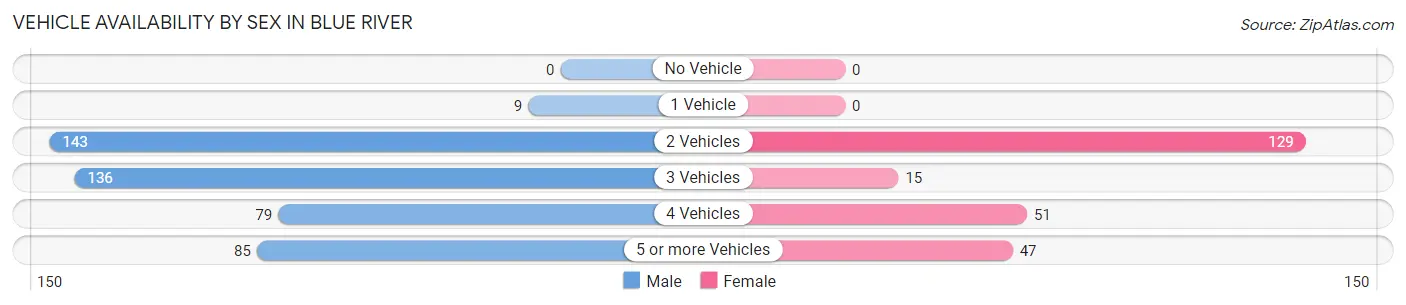
| Vehicles Available | Male | Female |
| No Vehicle | 0 (0.0%) | 0 (0.0%) |
| 1 Vehicle | 9 (2.0%) | 0 (0.0%) |
| 2 Vehicles | 143 (31.6%) | 129 (53.3%) |
| 3 Vehicles | 136 (30.1%) | 15 (6.2%) |
| 4 Vehicles | 79 (17.5%) | 51 (21.1%) |
| 5 or more Vehicles | 85 (18.8%) | 47 (19.4%) |
| Total | 452 (100.0%) | 242 (100.0%) |
Commute Time in Blue River
The most frequently occuring commute durations in Blue River are 10 to 14 minutes (222 commuters, 47.0%), 15 to 19 minutes (64 commuters, 13.6%), and 30 to 34 minutes (61 commuters, 12.9%).
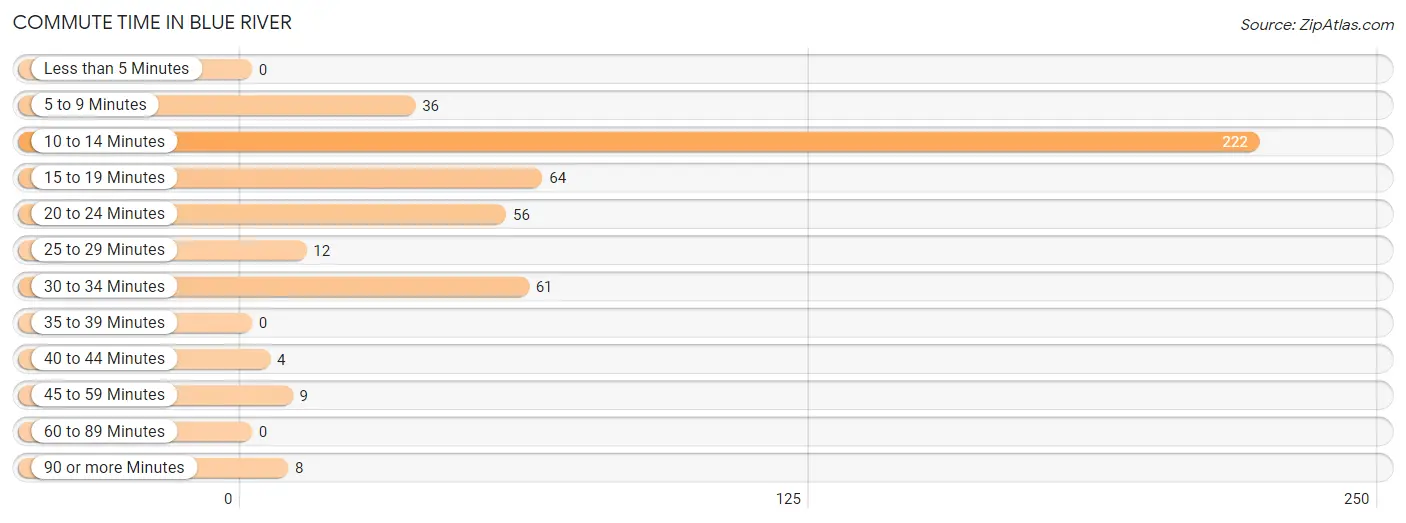
| Commute Time | # Commuters | % Commuters |
| Less than 5 Minutes | 0 | 0.0% |
| 5 to 9 Minutes | 36 | 7.6% |
| 10 to 14 Minutes | 222 | 47.0% |
| 15 to 19 Minutes | 64 | 13.6% |
| 20 to 24 Minutes | 56 | 11.9% |
| 25 to 29 Minutes | 12 | 2.5% |
| 30 to 34 Minutes | 61 | 12.9% |
| 35 to 39 Minutes | 0 | 0.0% |
| 40 to 44 Minutes | 4 | 0.9% |
| 45 to 59 Minutes | 9 | 1.9% |
| 60 to 89 Minutes | 0 | 0.0% |
| 90 or more Minutes | 8 | 1.7% |
Commute Time by Sex in Blue River
The most common commute times in Blue River are 10 to 14 minutes (131 commuters, 46.9%) for males and 10 to 14 minutes (91 commuters, 47.1%) for females.
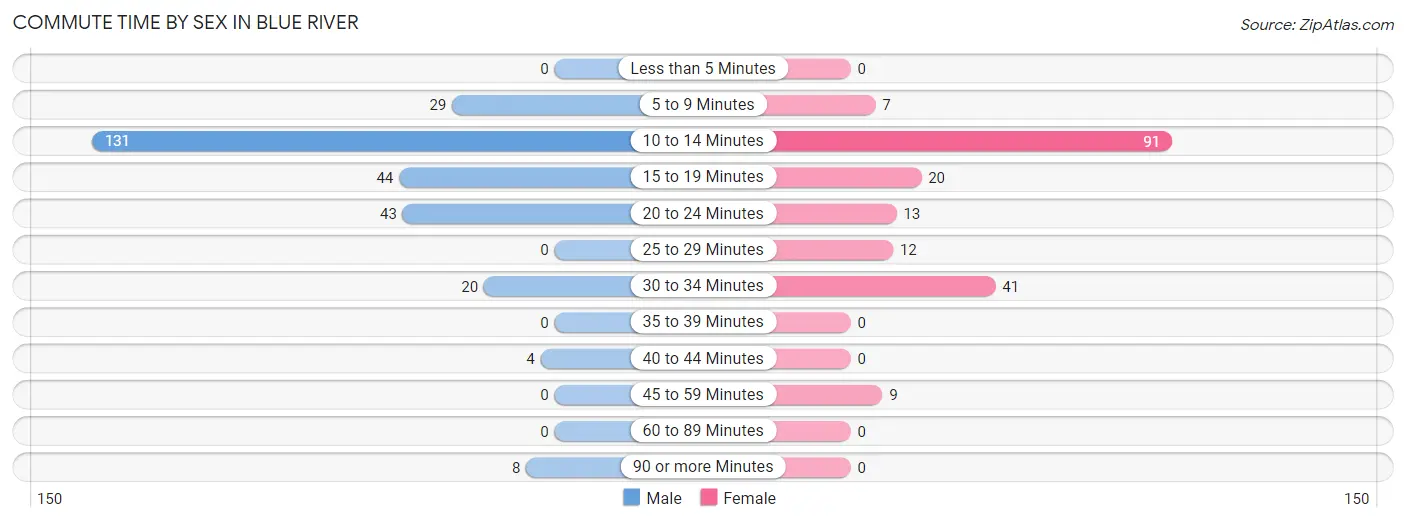
| Commute Time | Male | Female |
| Less than 5 Minutes | 0 (0.0%) | 0 (0.0%) |
| 5 to 9 Minutes | 29 (10.4%) | 7 (3.6%) |
| 10 to 14 Minutes | 131 (46.9%) | 91 (47.1%) |
| 15 to 19 Minutes | 44 (15.8%) | 20 (10.4%) |
| 20 to 24 Minutes | 43 (15.4%) | 13 (6.7%) |
| 25 to 29 Minutes | 0 (0.0%) | 12 (6.2%) |
| 30 to 34 Minutes | 20 (7.2%) | 41 (21.2%) |
| 35 to 39 Minutes | 0 (0.0%) | 0 (0.0%) |
| 40 to 44 Minutes | 4 (1.4%) | 0 (0.0%) |
| 45 to 59 Minutes | 0 (0.0%) | 9 (4.7%) |
| 60 to 89 Minutes | 0 (0.0%) | 0 (0.0%) |
| 90 or more Minutes | 8 (2.9%) | 0 (0.0%) |
Time of Departure to Work by Sex in Blue River
The most frequent times of departure to work in Blue River are 8:00 AM to 8:29 AM (83, 29.7%) for males and 8:00 AM to 8:29 AM (61, 31.6%) for females.
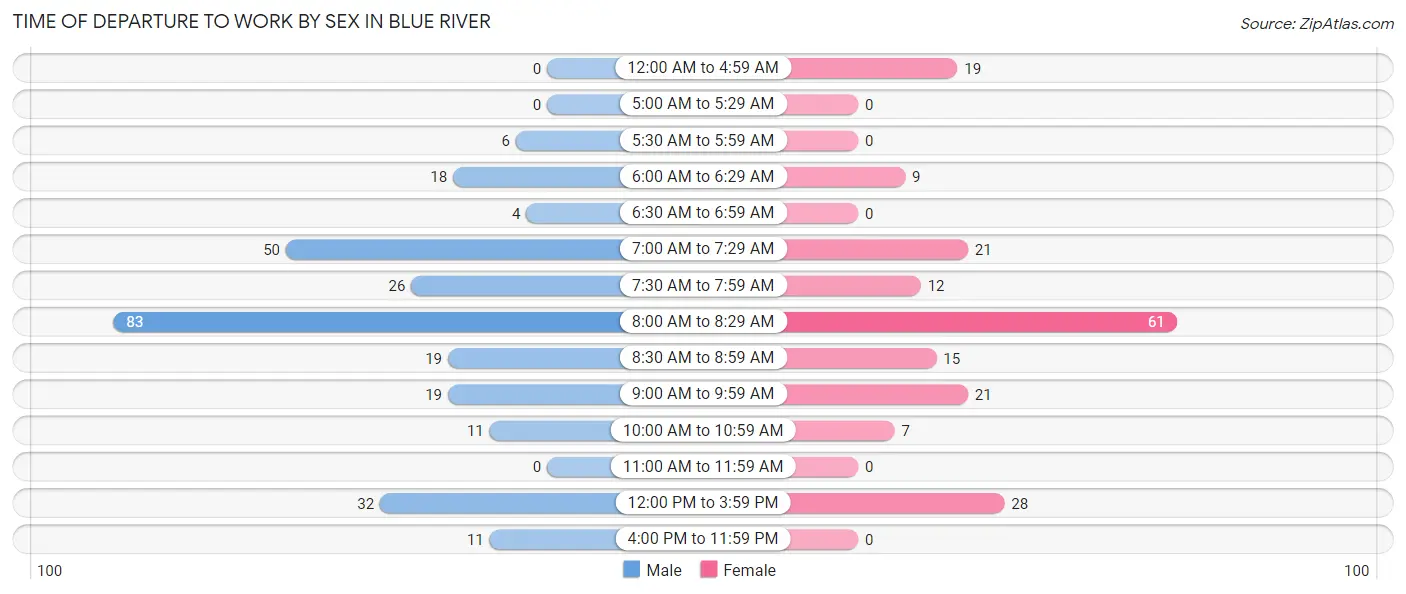
| Time of Departure | Male | Female |
| 12:00 AM to 4:59 AM | 0 (0.0%) | 19 (9.8%) |
| 5:00 AM to 5:29 AM | 0 (0.0%) | 0 (0.0%) |
| 5:30 AM to 5:59 AM | 6 (2.1%) | 0 (0.0%) |
| 6:00 AM to 6:29 AM | 18 (6.5%) | 9 (4.7%) |
| 6:30 AM to 6:59 AM | 4 (1.4%) | 0 (0.0%) |
| 7:00 AM to 7:29 AM | 50 (17.9%) | 21 (10.9%) |
| 7:30 AM to 7:59 AM | 26 (9.3%) | 12 (6.2%) |
| 8:00 AM to 8:29 AM | 83 (29.7%) | 61 (31.6%) |
| 8:30 AM to 8:59 AM | 19 (6.8%) | 15 (7.8%) |
| 9:00 AM to 9:59 AM | 19 (6.8%) | 21 (10.9%) |
| 10:00 AM to 10:59 AM | 11 (3.9%) | 7 (3.6%) |
| 11:00 AM to 11:59 AM | 0 (0.0%) | 0 (0.0%) |
| 12:00 PM to 3:59 PM | 32 (11.5%) | 28 (14.5%) |
| 4:00 PM to 11:59 PM | 11 (3.9%) | 0 (0.0%) |
| Total | 279 (100.0%) | 193 (100.0%) |
Housing Occupancy in Blue River
Occupancy by Ownership in Blue River
Of the total 381 dwellings in Blue River, owner-occupied units account for 307 (80.6%), while renter-occupied units make up 74 (19.4%).
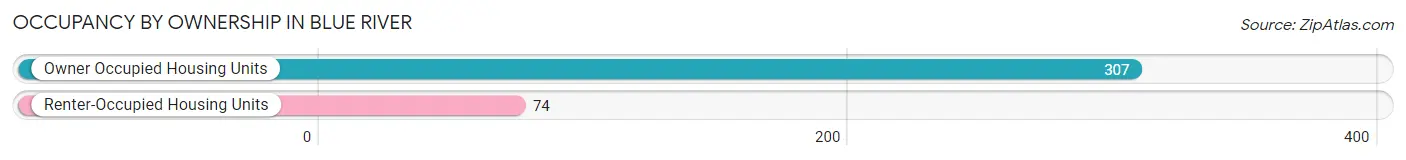
| Occupancy | # Housing Units | % Housing Units |
| Owner Occupied Housing Units | 307 | 80.6% |
| Renter-Occupied Housing Units | 74 | 19.4% |
| Total Occupied Housing Units | 381 | 100.0% |
Occupancy by Household Size in Blue River
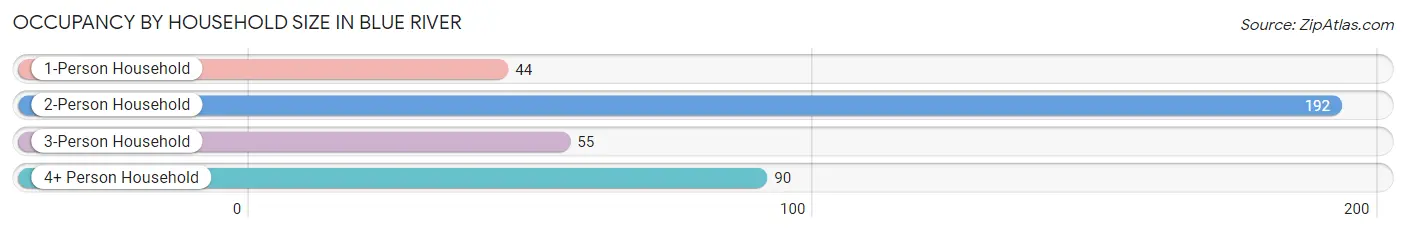
| Household Size | # Housing Units | % Housing Units |
| 1-Person Household | 44 | 11.6% |
| 2-Person Household | 192 | 50.4% |
| 3-Person Household | 55 | 14.4% |
| 4+ Person Household | 90 | 23.6% |
| Total Housing Units | 381 | 100.0% |
Occupancy by Ownership by Household Size in Blue River
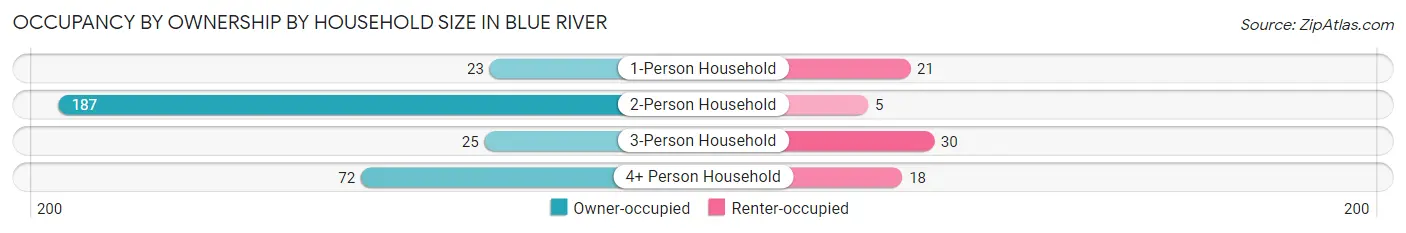
| Household Size | Owner-occupied | Renter-occupied |
| 1-Person Household | 23 (52.3%) | 21 (47.7%) |
| 2-Person Household | 187 (97.4%) | 5 (2.6%) |
| 3-Person Household | 25 (45.5%) | 30 (54.5%) |
| 4+ Person Household | 72 (80.0%) | 18 (20.0%) |
| Total Housing Units | 307 (80.6%) | 74 (19.4%) |
Occupancy by Educational Attainment in Blue River
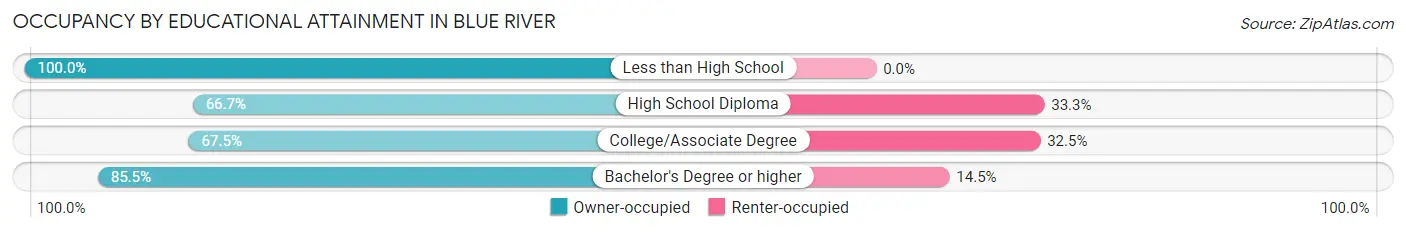
| Household Size | Owner-occupied | Renter-occupied |
| Less than High School | 17 (100.0%) | 0 (0.0%) |
| High School Diploma | 22 (66.7%) | 11 (33.3%) |
| College/Associate Degree | 56 (67.5%) | 27 (32.5%) |
| Bachelor's Degree or higher | 212 (85.5%) | 36 (14.5%) |
Occupancy by Age of Householder in Blue River
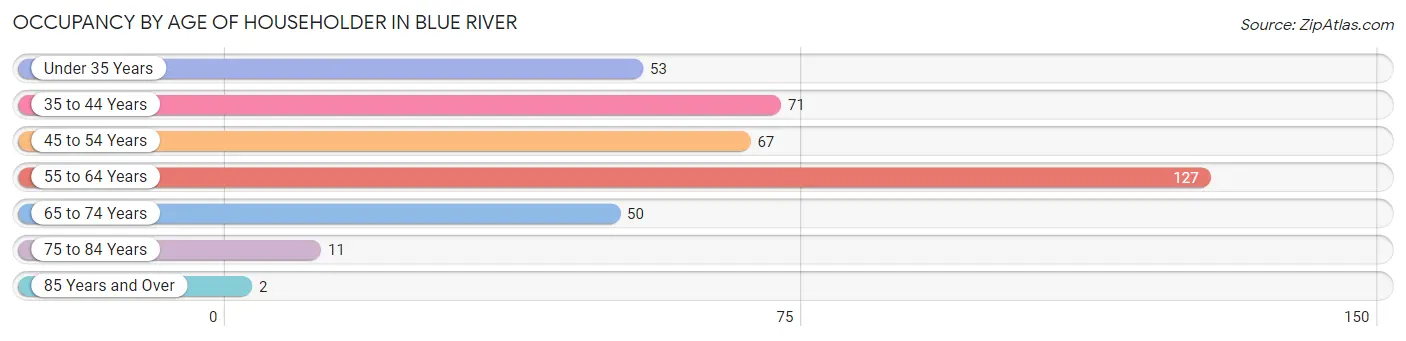
| Age Bracket | # Households | % Households |
| Under 35 Years | 53 | 13.9% |
| 35 to 44 Years | 71 | 18.6% |
| 45 to 54 Years | 67 | 17.6% |
| 55 to 64 Years | 127 | 33.3% |
| 65 to 74 Years | 50 | 13.1% |
| 75 to 84 Years | 11 | 2.9% |
| 85 Years and Over | 2 | 0.5% |
| Total | 381 | 100.0% |
Housing Finances in Blue River
Median Income by Occupancy in Blue River
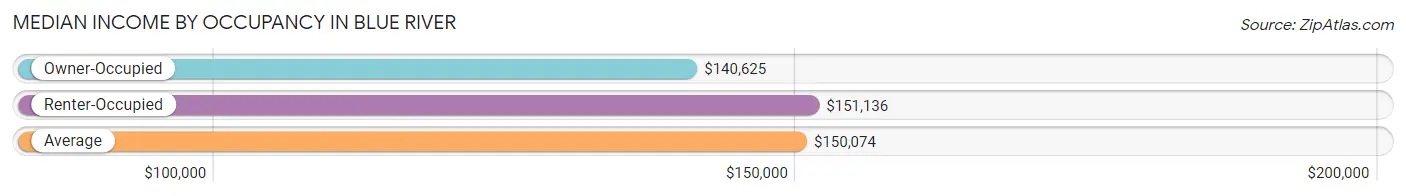
| Occupancy Type | # Households | Median Income |
| Owner-Occupied | 307 (80.6%) | $140,625 |
| Renter-Occupied | 74 (19.4%) | $151,136 |
| Average | 381 (100.0%) | $150,074 |
Occupancy by Householder Income Bracket in Blue River
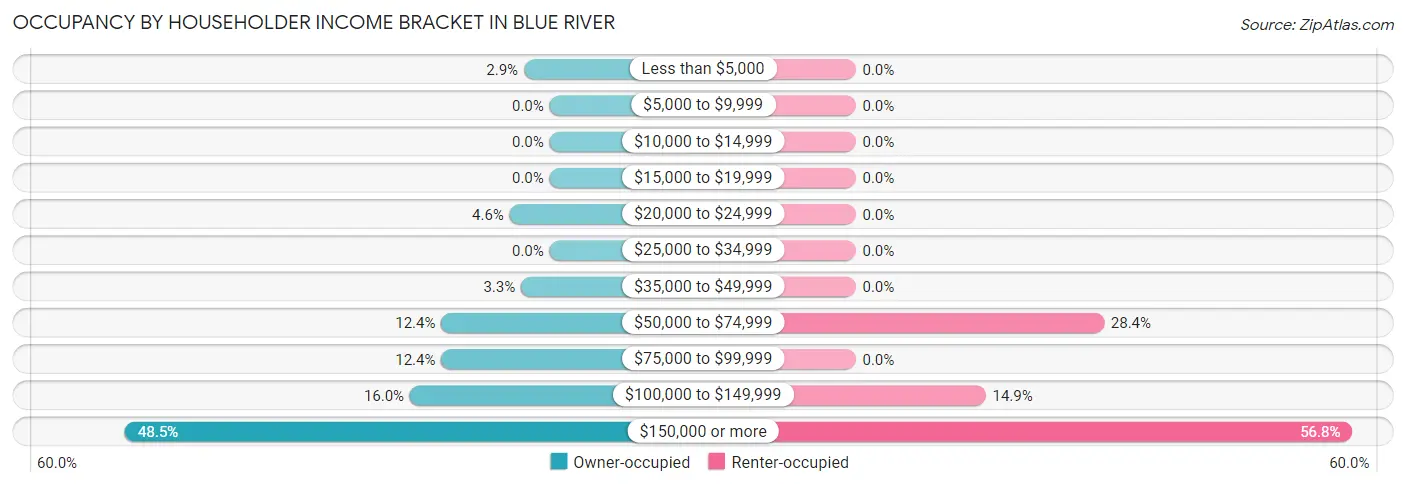
| Income Bracket | Owner-occupied | Renter-occupied |
| Less than $5,000 | 9 (2.9%) | 0 (0.0%) |
| $5,000 to $9,999 | 0 (0.0%) | 0 (0.0%) |
| $10,000 to $14,999 | 0 (0.0%) | 0 (0.0%) |
| $15,000 to $19,999 | 0 (0.0%) | 0 (0.0%) |
| $20,000 to $24,999 | 14 (4.6%) | 0 (0.0%) |
| $25,000 to $34,999 | 0 (0.0%) | 0 (0.0%) |
| $35,000 to $49,999 | 10 (3.3%) | 0 (0.0%) |
| $50,000 to $74,999 | 38 (12.4%) | 21 (28.4%) |
| $75,000 to $99,999 | 38 (12.4%) | 0 (0.0%) |
| $100,000 to $149,999 | 49 (16.0%) | 11 (14.9%) |
| $150,000 or more | 149 (48.5%) | 42 (56.8%) |
| Total | 307 (100.0%) | 74 (100.0%) |
Monthly Housing Cost Tiers in Blue River
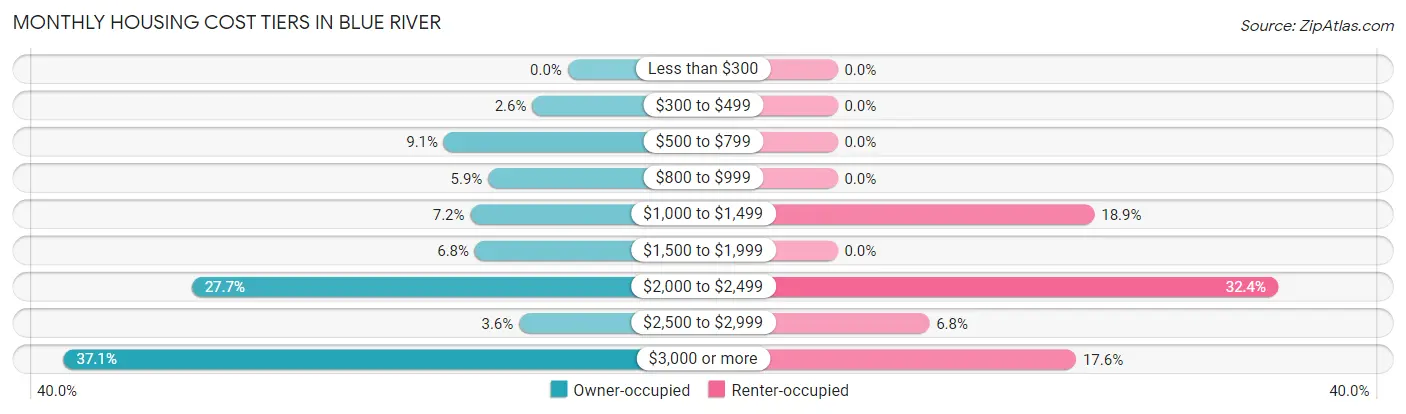
| Monthly Cost | Owner-occupied | Renter-occupied |
| Less than $300 | 0 (0.0%) | 0 (0.0%) |
| $300 to $499 | 8 (2.6%) | 0 (0.0%) |
| $500 to $799 | 28 (9.1%) | 0 (0.0%) |
| $800 to $999 | 18 (5.9%) | 0 (0.0%) |
| $1,000 to $1,499 | 22 (7.2%) | 14 (18.9%) |
| $1,500 to $1,999 | 21 (6.8%) | 0 (0.0%) |
| $2,000 to $2,499 | 85 (27.7%) | 24 (32.4%) |
| $2,500 to $2,999 | 11 (3.6%) | 5 (6.8%) |
| $3,000 or more | 114 (37.1%) | 13 (17.6%) |
| Total | 307 (100.0%) | 74 (100.0%) |
Physical Housing Characteristics in Blue River
Housing Structures in Blue River
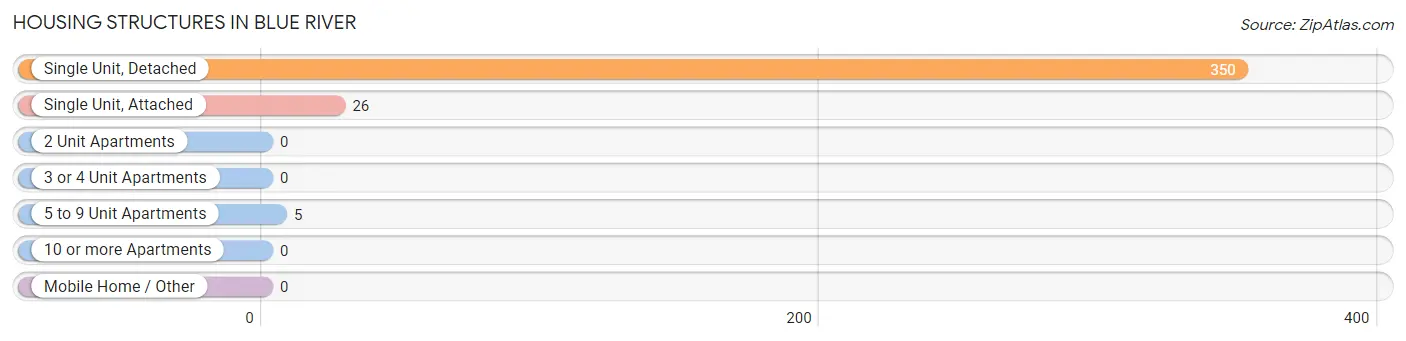
| Structure Type | # Housing Units | % Housing Units |
| Single Unit, Detached | 350 | 91.9% |
| Single Unit, Attached | 26 | 6.8% |
| 2 Unit Apartments | 0 | 0.0% |
| 3 or 4 Unit Apartments | 0 | 0.0% |
| 5 to 9 Unit Apartments | 5 | 1.3% |
| 10 or more Apartments | 0 | 0.0% |
| Mobile Home / Other | 0 | 0.0% |
| Total | 381 | 100.0% |
Housing Structures by Occupancy in Blue River
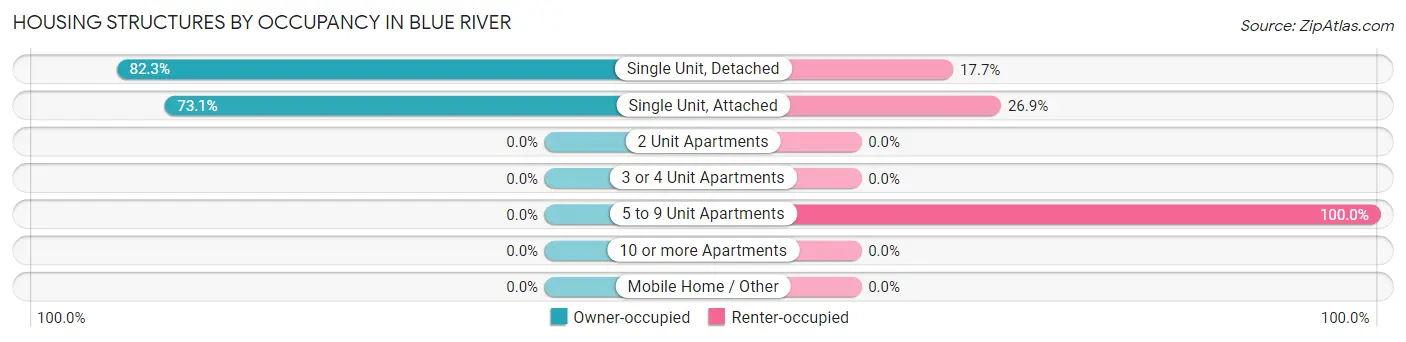
| Structure Type | Owner-occupied | Renter-occupied |
| Single Unit, Detached | 288 (82.3%) | 62 (17.7%) |
| Single Unit, Attached | 19 (73.1%) | 7 (26.9%) |
| 2 Unit Apartments | 0 (0.0%) | 0 (0.0%) |
| 3 or 4 Unit Apartments | 0 (0.0%) | 0 (0.0%) |
| 5 to 9 Unit Apartments | 0 (0.0%) | 5 (100.0%) |
| 10 or more Apartments | 0 (0.0%) | 0 (0.0%) |
| Mobile Home / Other | 0 (0.0%) | 0 (0.0%) |
| Total | 307 (80.6%) | 74 (19.4%) |
Housing Structures by Number of Rooms in Blue River
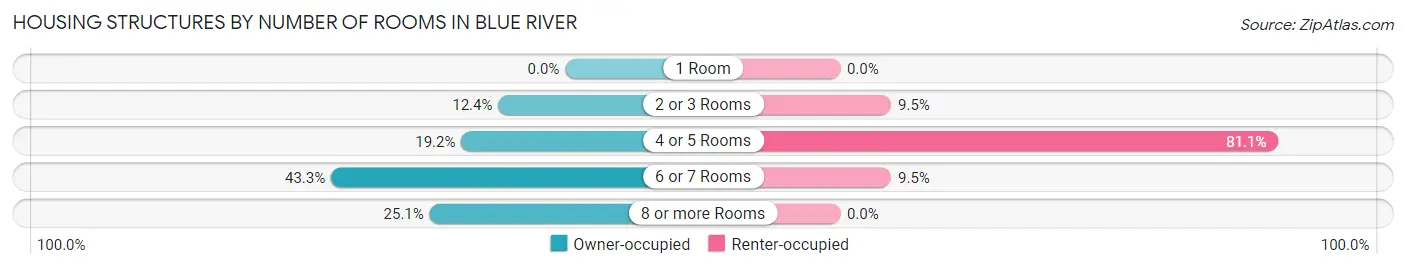
| Number of Rooms | Owner-occupied | Renter-occupied |
| 1 Room | 0 (0.0%) | 0 (0.0%) |
| 2 or 3 Rooms | 38 (12.4%) | 7 (9.5%) |
| 4 or 5 Rooms | 59 (19.2%) | 60 (81.1%) |
| 6 or 7 Rooms | 133 (43.3%) | 7 (9.5%) |
| 8 or more Rooms | 77 (25.1%) | 0 (0.0%) |
| Total | 307 (100.0%) | 74 (100.0%) |
Housing Structure by Heating Type in Blue River
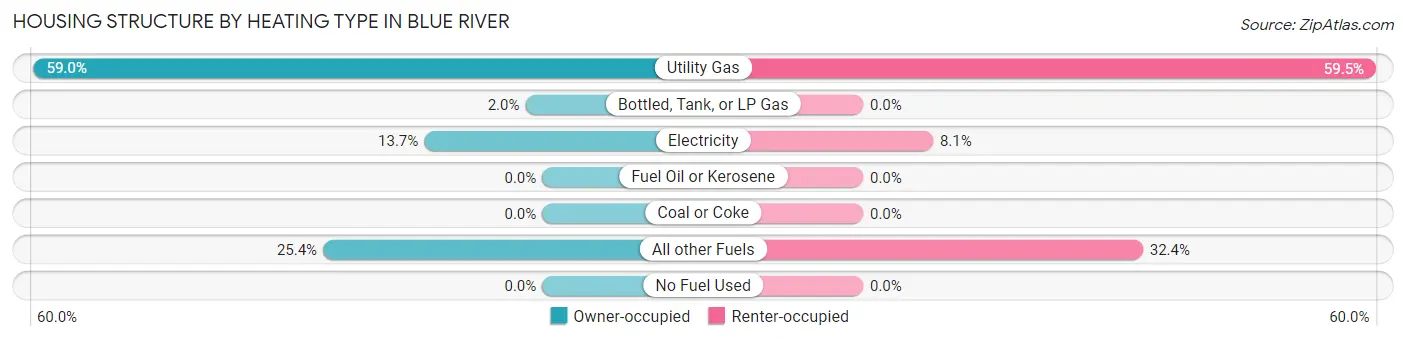
| Heating Type | Owner-occupied | Renter-occupied |
| Utility Gas | 181 (59.0%) | 44 (59.5%) |
| Bottled, Tank, or LP Gas | 6 (1.9%) | 0 (0.0%) |
| Electricity | 42 (13.7%) | 6 (8.1%) |
| Fuel Oil or Kerosene | 0 (0.0%) | 0 (0.0%) |
| Coal or Coke | 0 (0.0%) | 0 (0.0%) |
| All other Fuels | 78 (25.4%) | 24 (32.4%) |
| No Fuel Used | 0 (0.0%) | 0 (0.0%) |
| Total | 307 (100.0%) | 74 (100.0%) |
Household Vehicle Usage in Blue River
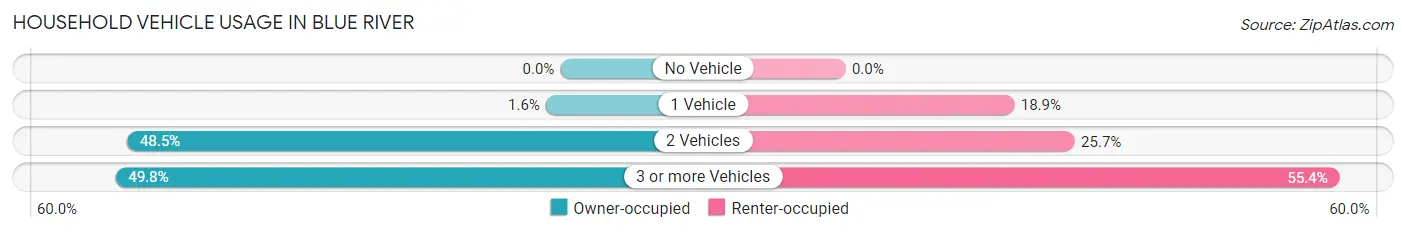
| Vehicles per Household | Owner-occupied | Renter-occupied |
| No Vehicle | 0 (0.0%) | 0 (0.0%) |
| 1 Vehicle | 5 (1.6%) | 14 (18.9%) |
| 2 Vehicles | 149 (48.5%) | 19 (25.7%) |
| 3 or more Vehicles | 153 (49.8%) | 41 (55.4%) |
| Total | 307 (100.0%) | 74 (100.0%) |
Real Estate & Mortgages in Blue River
Real Estate and Mortgage Overview in Blue River
| Characteristic | Without Mortgage | With Mortgage |
| Housing Units | 76 | 231 |
| Median Property Value | $1,045,500 | $1,112,300 |
| Median Household Income | $96,786 | $119 |
| Monthly Housing Costs | $820 | $114 |
| Real Estate Taxes | $2,600 | $0 |
Property Value by Mortgage Status in Blue River
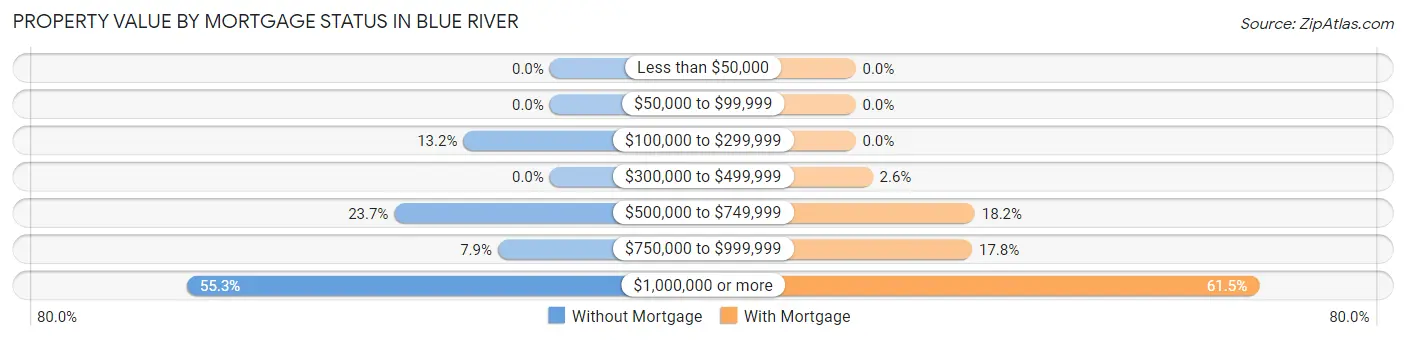
| Property Value | Without Mortgage | With Mortgage |
| Less than $50,000 | 0 (0.0%) | 0 (0.0%) |
| $50,000 to $99,999 | 0 (0.0%) | 0 (0.0%) |
| $100,000 to $299,999 | 10 (13.2%) | 0 (0.0%) |
| $300,000 to $499,999 | 0 (0.0%) | 6 (2.6%) |
| $500,000 to $749,999 | 18 (23.7%) | 42 (18.2%) |
| $750,000 to $999,999 | 6 (7.9%) | 41 (17.7%) |
| $1,000,000 or more | 42 (55.3%) | 142 (61.5%) |
| Total | 76 (100.0%) | 231 (100.0%) |
Household Income by Mortgage Status in Blue River
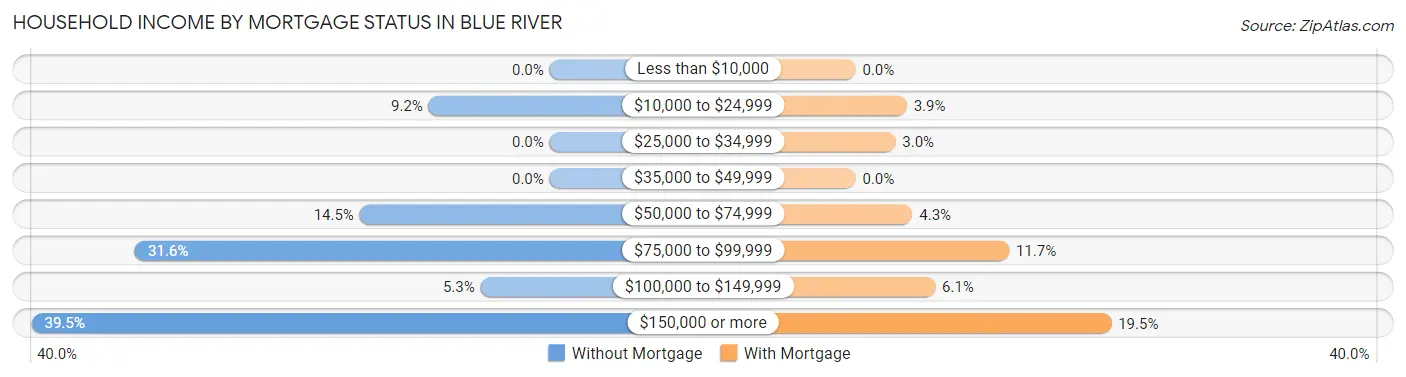
| Household Income | Without Mortgage | With Mortgage |
| Less than $10,000 | 0 (0.0%) | 0 (0.0%) |
| $10,000 to $24,999 | 7 (9.2%) | 9 (3.9%) |
| $25,000 to $34,999 | 0 (0.0%) | 7 (3.0%) |
| $35,000 to $49,999 | 0 (0.0%) | 0 (0.0%) |
| $50,000 to $74,999 | 11 (14.5%) | 10 (4.3%) |
| $75,000 to $99,999 | 24 (31.6%) | 27 (11.7%) |
| $100,000 to $149,999 | 4 (5.3%) | 14 (6.1%) |
| $150,000 or more | 30 (39.5%) | 45 (19.5%) |
| Total | 76 (100.0%) | 231 (100.0%) |
Property Value to Household Income Ratio in Blue River
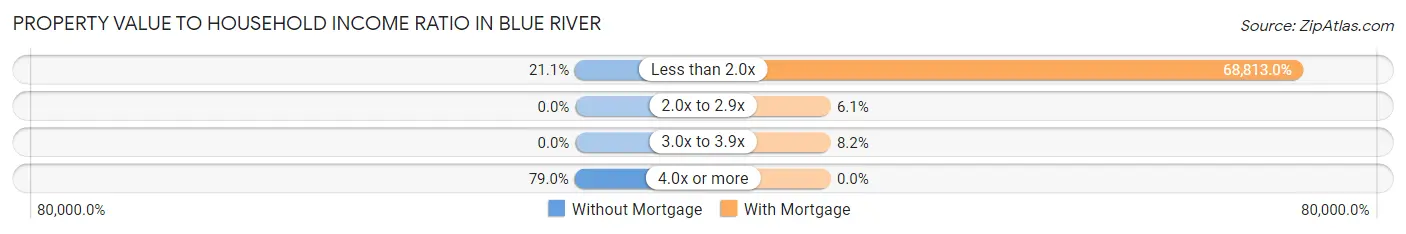
| Value-to-Income Ratio | Without Mortgage | With Mortgage |
| Less than 2.0x | 16 (21.0%) | 158,958 (68,813.0%) |
| 2.0x to 2.9x | 0 (0.0%) | 14 (6.1%) |
| 3.0x to 3.9x | 0 (0.0%) | 19 (8.2%) |
| 4.0x or more | 60 (78.9%) | 0 (0.0%) |
| Total | 76 (100.0%) | 231 (100.0%) |
Real Estate Taxes by Mortgage Status in Blue River
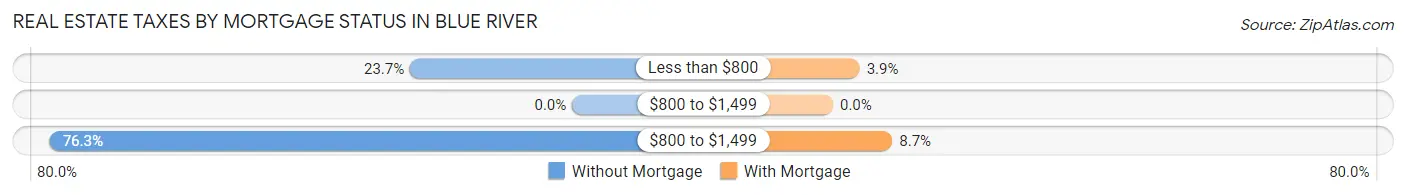
| Property Taxes | Without Mortgage | With Mortgage |
| Less than $800 | 18 (23.7%) | 9 (3.9%) |
| $800 to $1,499 | 0 (0.0%) | 0 (0.0%) |
| $800 to $1,499 | 58 (76.3%) | 20 (8.7%) |
| Total | 76 (100.0%) | 231 (100.0%) |
Health & Disability in Blue River
Health Insurance Coverage by Age in Blue River
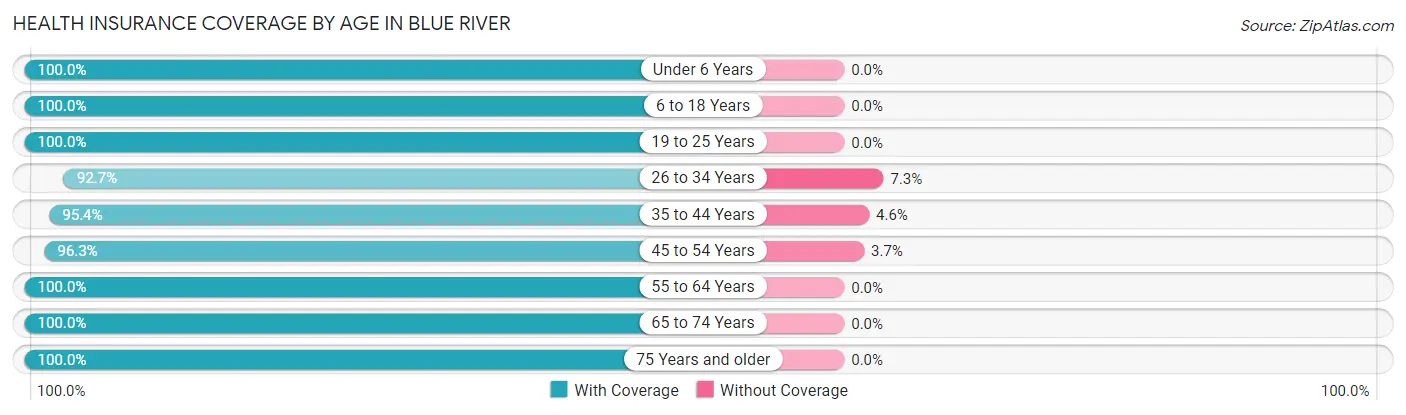
| Age Bracket | With Coverage | Without Coverage |
| Under 6 Years | 58 (100.0%) | 0 (0.0%) |
| 6 to 18 Years | 167 (100.0%) | 0 (0.0%) |
| 19 to 25 Years | 112 (100.0%) | 0 (0.0%) |
| 26 to 34 Years | 279 (92.7%) | 22 (7.3%) |
| 35 to 44 Years | 124 (95.4%) | 6 (4.6%) |
| 45 to 54 Years | 130 (96.3%) | 5 (3.7%) |
| 55 to 64 Years | 206 (100.0%) | 0 (0.0%) |
| 65 to 74 Years | 95 (100.0%) | 0 (0.0%) |
| 75 Years and older | 34 (100.0%) | 0 (0.0%) |
| Total | 1,205 (97.3%) | 33 (2.7%) |
Health Insurance Coverage by Citizenship Status in Blue River
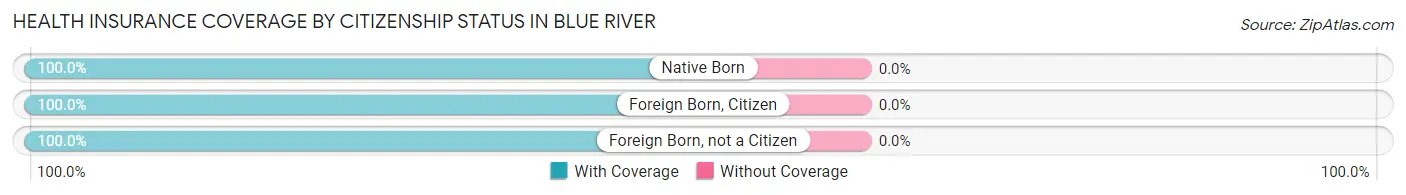
| Citizenship Status | With Coverage | Without Coverage |
| Native Born | 58 (100.0%) | 0 (0.0%) |
| Foreign Born, Citizen | 167 (100.0%) | 0 (0.0%) |
| Foreign Born, not a Citizen | 112 (100.0%) | 0 (0.0%) |
Health Insurance Coverage by Household Income in Blue River
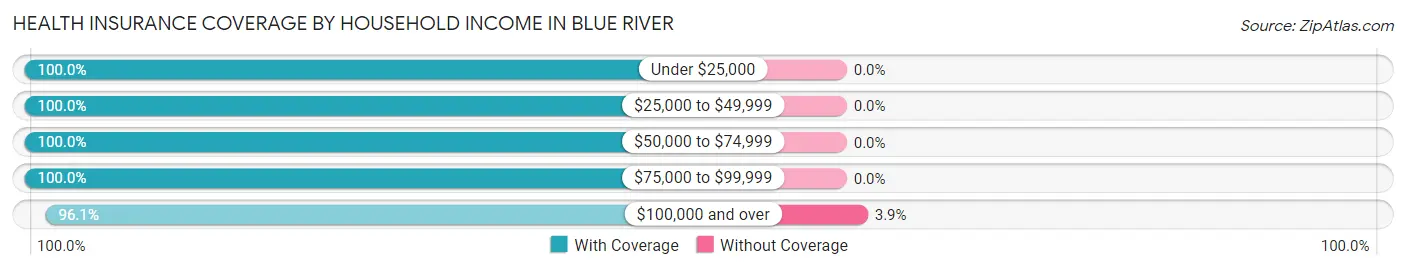
| Household Income | With Coverage | Without Coverage |
| Under $25,000 | 58 (100.0%) | 0 (0.0%) |
| $25,000 to $49,999 | 43 (100.0%) | 0 (0.0%) |
| $50,000 to $74,999 | 175 (100.0%) | 0 (0.0%) |
| $75,000 to $99,999 | 122 (100.0%) | 0 (0.0%) |
| $100,000 and over | 807 (96.1%) | 33 (3.9%) |
Public vs Private Health Insurance Coverage by Age in Blue River
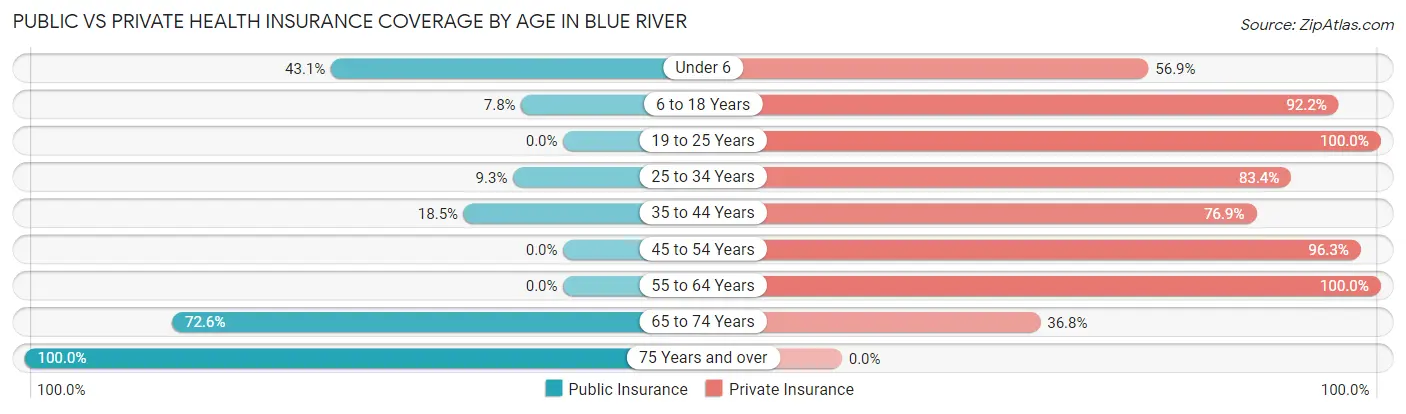
| Age Bracket | Public Insurance | Private Insurance |
| Under 6 | 25 (43.1%) | 33 (56.9%) |
| 6 to 18 Years | 13 (7.8%) | 154 (92.2%) |
| 19 to 25 Years | 0 (0.0%) | 112 (100.0%) |
| 25 to 34 Years | 28 (9.3%) | 251 (83.4%) |
| 35 to 44 Years | 24 (18.5%) | 100 (76.9%) |
| 45 to 54 Years | 0 (0.0%) | 130 (96.3%) |
| 55 to 64 Years | 0 (0.0%) | 206 (100.0%) |
| 65 to 74 Years | 69 (72.6%) | 35 (36.8%) |
| 75 Years and over | 34 (100.0%) | 0 (0.0%) |
| Total | 193 (15.6%) | 1,021 (82.5%) |
Disability Status by Sex by Age in Blue River
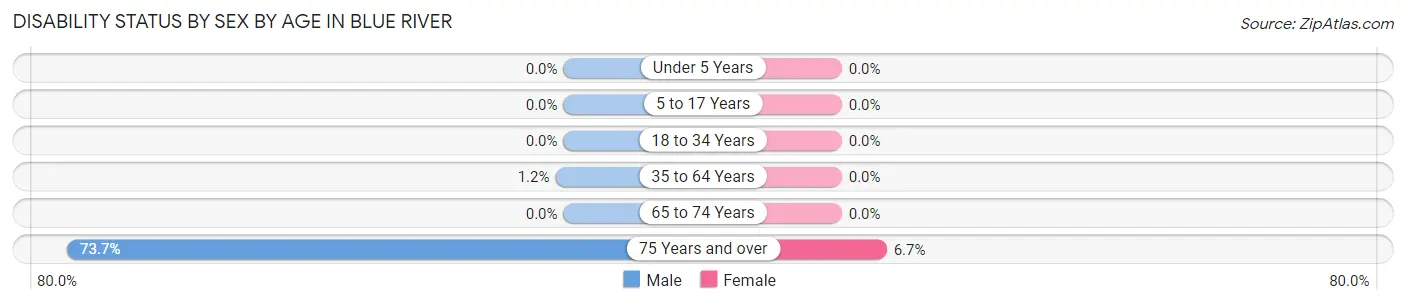
| Age Bracket | Male | Female |
| Under 5 Years | 0 (0.0%) | 0 (0.0%) |
| 5 to 17 Years | 0 (0.0%) | 0 (0.0%) |
| 18 to 34 Years | 0 (0.0%) | 0 (0.0%) |
| 35 to 64 Years | 3 (1.2%) | 0 (0.0%) |
| 65 to 74 Years | 0 (0.0%) | 0 (0.0%) |
| 75 Years and over | 14 (73.7%) | 1 (6.7%) |
Disability Class by Sex by Age in Blue River
Disability Class: Hearing Difficulty
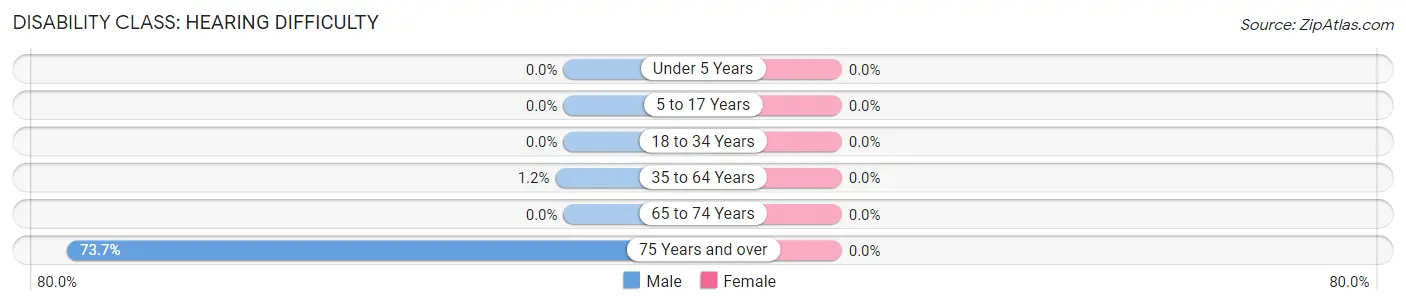
| Age Bracket | Male | Female |
| Under 5 Years | 0 (0.0%) | 0 (0.0%) |
| 5 to 17 Years | 0 (0.0%) | 0 (0.0%) |
| 18 to 34 Years | 0 (0.0%) | 0 (0.0%) |
| 35 to 64 Years | 3 (1.2%) | 0 (0.0%) |
| 65 to 74 Years | 0 (0.0%) | 0 (0.0%) |
| 75 Years and over | 14 (73.7%) | 0 (0.0%) |
Disability Class: Vision Difficulty

| Age Bracket | Male | Female |
| Under 5 Years | 0 (0.0%) | 0 (0.0%) |
| 5 to 17 Years | 0 (0.0%) | 0 (0.0%) |
| 18 to 34 Years | 0 (0.0%) | 0 (0.0%) |
| 35 to 64 Years | 0 (0.0%) | 0 (0.0%) |
| 65 to 74 Years | 0 (0.0%) | 0 (0.0%) |
| 75 Years and over | 14 (73.7%) | 0 (0.0%) |
Disability Class: Cognitive Difficulty
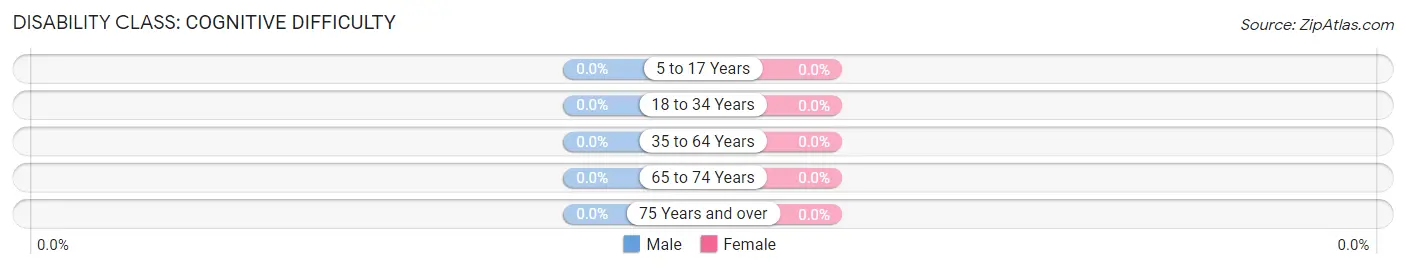
| Age Bracket | Male | Female |
| 5 to 17 Years | 0 (0.0%) | 0 (0.0%) |
| 18 to 34 Years | 0 (0.0%) | 0 (0.0%) |
| 35 to 64 Years | 0 (0.0%) | 0 (0.0%) |
| 65 to 74 Years | 0 (0.0%) | 0 (0.0%) |
| 75 Years and over | 0 (0.0%) | 0 (0.0%) |
Disability Class: Ambulatory Difficulty
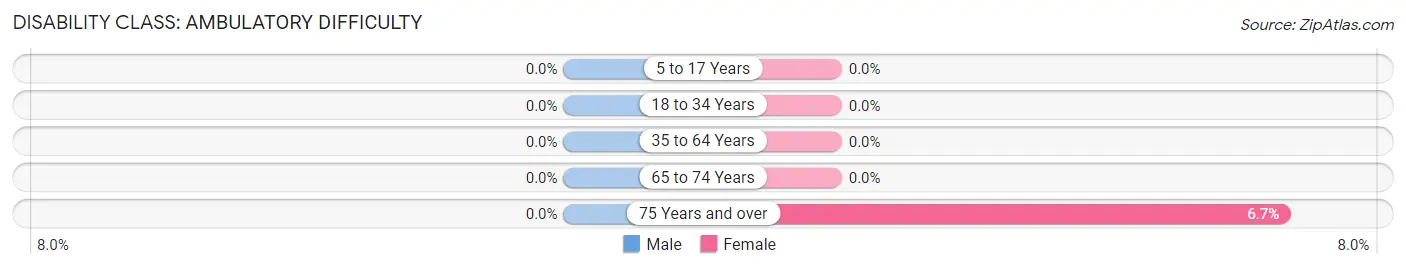
| Age Bracket | Male | Female |
| 5 to 17 Years | 0 (0.0%) | 0 (0.0%) |
| 18 to 34 Years | 0 (0.0%) | 0 (0.0%) |
| 35 to 64 Years | 0 (0.0%) | 0 (0.0%) |
| 65 to 74 Years | 0 (0.0%) | 0 (0.0%) |
| 75 Years and over | 0 (0.0%) | 1 (6.7%) |
Disability Class: Self-Care Difficulty
| Age Bracket | Male | Female |
| 5 to 17 Years | 0 (0.0%) | 0 (0.0%) |
| 18 to 34 Years | 0 (0.0%) | 0 (0.0%) |
| 35 to 64 Years | 0 (0.0%) | 0 (0.0%) |
| 65 to 74 Years | 0 (0.0%) | 0 (0.0%) |
| 75 Years and over | 0 (0.0%) | 0 (0.0%) |
Technology Access in Blue River
Computing Device Access in Blue River
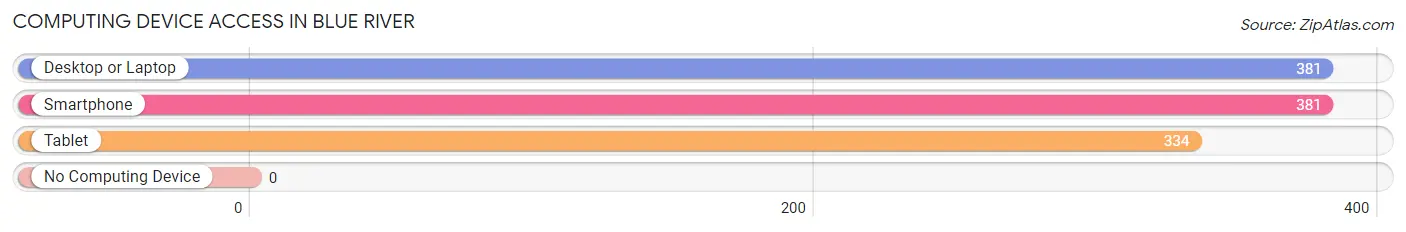
| Device Type | # Households | % Households |
| Desktop or Laptop | 381 | 100.0% |
| Smartphone | 381 | 100.0% |
| Tablet | 334 | 87.7% |
| No Computing Device | 0 | 0.0% |
| Total | 381 | 100.0% |
Internet Access in Blue River
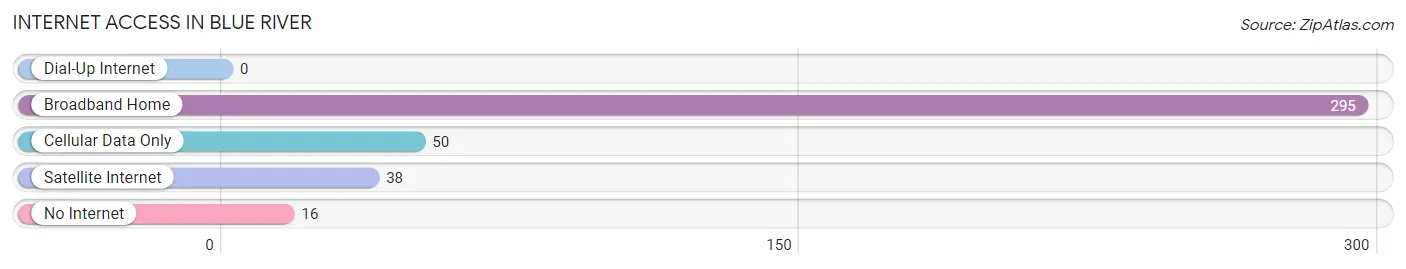
| Internet Type | # Households | % Households |
| Dial-Up Internet | 0 | 0.0% |
| Broadband Home | 295 | 77.4% |
| Cellular Data Only | 50 | 13.1% |
| Satellite Internet | 38 | 10.0% |
| No Internet | 16 | 4.2% |
| Total | 381 | 100.0% |
Blue River Summary
River Blue is a small town located in the heart of the Rocky Mountains in Colorado. It is situated in Summit County, approximately two hours west of Denver. The town is surrounded by the White River National Forest and is home to a population of just over 1,000 people.
Geography
River Blue is located in the heart of the Rocky Mountains in Colorado. It is situated in Summit County, approximately two hours west of Denver. The town is surrounded by the White River National Forest and is home to a population of just over 1,000 people. The town is situated at an elevation of 8,400 feet and is surrounded by the Gore Range to the north, the Tenmile Range to the south, and the Williams Fork Mountains to the east. The town is located on the Blue River, which is a tributary of the Colorado River. The town is also located near the headwaters of the Colorado River, which is the source of the river’s water.
The town is located in a temperate climate, with temperatures ranging from the low 30s in the winter to the high 80s in the summer. The town receives an average of 20 inches of precipitation annually, with most of it falling in the form of snow.
Economy
The economy of River Blue is largely based on tourism. The town is a popular destination for outdoor enthusiasts, as it is surrounded by the White River National Forest and is home to a variety of outdoor activities, such as skiing, snowboarding, hiking, fishing, and camping. The town is also home to a number of restaurants, bars, and shops, which cater to the needs of tourists and locals alike.
The town is also home to a number of businesses, such as a grocery store, a hardware store, a gas station, and a post office. The town is also home to a number of small businesses, such as a bakery, a coffee shop, and a gift shop.
Demographics
As of the 2010 census, the population of River Blue was 1,072. The town is predominantly white, with the majority of the population being of European descent. The town also has a small Hispanic population, as well as a small Native American population. The median age of the population is 43.7 years, with the majority of the population being between the ages of 25 and 44.
The median household income in River Blue is $50,000, which is slightly higher than the national average. The town has a poverty rate of 8.3%, which is slightly lower than the national average.
History
River Blue was founded in 1876 by a group of prospectors who were searching for gold in the area. The town was originally named “Blue River” after the river that runs through it. The town quickly grew in size and by the early 1900s, it had become a popular destination for tourists and outdoor enthusiasts.
In the late 1950s, the town was incorporated and the name was changed to “River Blue”. The town has since become a popular destination for outdoor enthusiasts, as it is surrounded by the White River National Forest and is home to a variety of outdoor activities, such as skiing, snowboarding, hiking, fishing, and camping. The town is also home to a number of restaurants, bars, and shops, which cater to the needs of tourists and locals alike.
Common Questions
What is Per Capita Income in Blue River?
Per Capita income in Blue River is $63,076.
What is the Median Family Income in Blue River?
Median Family Income in Blue River is $135,179.
What is the Median Household income in Blue River?
Median Household Income in Blue River is $150,074.
What is Income or Wage Gap in Blue River?
Income or Wage Gap in Blue River is 25.0%.
Women in Blue River earn 75.0 cents for every dollar earned by a man.
What is Inequality or Gini Index in Blue River?
Inequality or Gini Index in Blue River is 0.43.
What is the Total Population of Blue River?
Total Population of Blue River is 1,238.
What is the Total Male Population of Blue River?
Total Male Population of Blue River is 602.
What is the Total Female Population of Blue River?
Total Female Population of Blue River is 636.
What is the Ratio of Males per 100 Females in Blue River?
There are 94.65 Males per 100 Females in Blue River.
What is the Ratio of Females per 100 Males in Blue River?
There are 105.65 Females per 100 Males in Blue River.
What is the Median Population Age in Blue River?
Median Population Age in Blue River is 33.5 Years.
What is the Average Family Size in Blue River
Average Family Size in Blue River is 3.2 People.
What is the Average Household Size in Blue River
Average Household Size in Blue River is 3.2 People.
How Large is the Labor Force in Blue River?
There are 744 People in the Labor Forcein in Blue River.
What is the Percentage of People in the Labor Force in Blue River?
72.3% of People are in the Labor Force in Blue River.
What is the Unemployment Rate in Blue River?
Unemployment Rate in Blue River is 0.8%.