Zip Codes with the Highest Percentage of Population Employed in Computer, Engineering & Science in Colorado
RELATED REPORTS & OPTIONS
Computer, Engineering & Science
Colorado
Compare Zip Codes
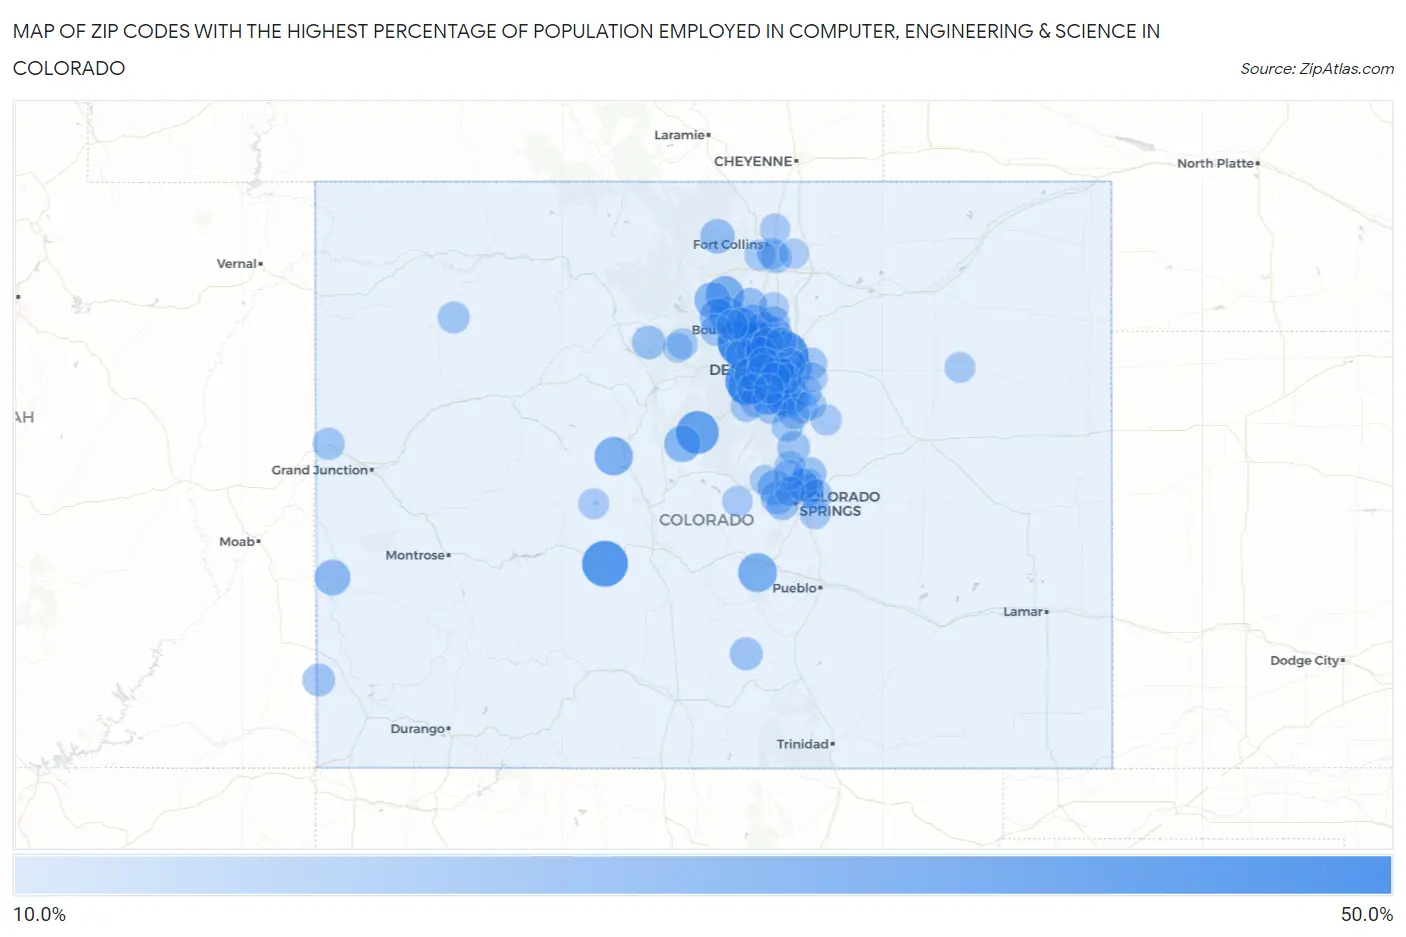
Map of Zip Codes with the Highest Percentage of Population Employed in Computer, Engineering & Science in Colorado
10.0%
50.0%
Zip Codes with the Highest Percentage of Population Employed in Computer, Engineering & Science in Colorado
| Zip Code | % Employed | vs State | vs National | |
| 1. | 80025 | 42.9% | 9.0%(+33.9)#1 | 6.8%(+36.1)#62 |
| 2. | 80024 | 38.2% | 9.0%(+29.2)#2 | 6.8%(+31.5)#95 |
| 3. | 80453 | 38.2% | 9.0%(+29.2)#3 | 6.8%(+31.4)#96 |
| 4. | 81248 | 36.4% | 9.0%(+27.4)#4 | 6.8%(+29.7)#119 |
| 5. | 80456 | 31.0% | 9.0%(+22.1)#5 | 6.8%(+24.3)#163 |
| 6. | 81244 | 25.0% | 9.0%(+16.0)#6 | 6.8%(+18.2)#275 |
| 7. | 80454 | 25.0% | 9.0%(+16.0)#7 | 6.8%(+18.2)#279 |
| 8. | 81251 | 23.8% | 9.0%(+14.9)#8 | 6.8%(+17.1)#304 |
| 9. | 80540 | 23.2% | 9.0%(+14.2)#9 | 6.8%(+16.4)#337 |
| 10. | 80301 | 22.5% | 9.0%(+13.5)#10 | 6.8%(+15.8)#369 |
| 11. | 80305 | 21.4% | 9.0%(+12.4)#11 | 6.8%(+14.7)#408 |
| 12. | 80432 | 20.9% | 9.0%(+11.9)#12 | 6.8%(+14.2)#443 |
| 13. | 80045 | 20.6% | 9.0%(+11.6)#13 | 6.8%(+13.8)#463 |
| 14. | 80455 | 20.6% | 9.0%(+11.6)#14 | 6.8%(+13.8)#469 |
| 15. | 80510 | 20.2% | 9.0%(+11.2)#15 | 6.8%(+13.4)#494 |
| 16. | 80481 | 19.7% | 9.0%(+10.7)#16 | 6.8%(+13.0)#528 |
| 17. | 80303 | 19.6% | 9.0%(+10.6)#17 | 6.8%(+12.9)#541 |
| 18. | 81429 | 19.5% | 9.0%(+10.5)#18 | 6.8%(+12.7)#551 |
| 19. | 80819 | 18.3% | 9.0%(+9.27)#19 | 6.8%(+11.5)#652 |
| 20. | 80023 | 18.1% | 9.0%(+9.14)#20 | 6.8%(+11.4)#667 |
| 21. | 80202 | 17.7% | 9.0%(+8.68)#21 | 6.8%(+10.9)#729 |
| 22. | 80512 | 17.3% | 9.0%(+8.32)#22 | 6.8%(+10.6)#775 |
| 23. | 80503 | 17.3% | 9.0%(+8.31)#23 | 6.8%(+10.5)#778 |
| 24. | 80026 | 16.6% | 9.0%(+7.60)#24 | 6.8%(+9.83)#871 |
| 25. | 80112 | 16.5% | 9.0%(+7.51)#25 | 6.8%(+9.74)#883 |
| 26. | 80007 | 16.3% | 9.0%(+7.35)#26 | 6.8%(+9.58)#910 |
| 27. | 80809 | 16.2% | 9.0%(+7.19)#27 | 6.8%(+9.42)#928 |
| 28. | 80027 | 16.2% | 9.0%(+7.16)#28 | 6.8%(+9.39)#933 |
| 29. | 80021 | 16.1% | 9.0%(+7.11)#29 | 6.8%(+9.34)#940 |
| 30. | 80403 | 16.0% | 9.0%(+6.99)#30 | 6.8%(+9.22)#958 |
| 31. | 80468 | 16.0% | 9.0%(+6.96)#31 | 6.8%(+9.19)#964 |
| 32. | 80228 | 15.9% | 9.0%(+6.89)#32 | 6.8%(+9.12)#977 |
| 33. | 80924 | 15.5% | 9.0%(+6.50)#33 | 6.8%(+8.73)#1,028 |
| 34. | 80129 | 15.1% | 9.0%(+6.13)#34 | 6.8%(+8.36)#1,100 |
| 35. | 80125 | 15.0% | 9.0%(+5.98)#35 | 6.8%(+8.21)#1,126 |
| 36. | 80908 | 14.9% | 9.0%(+5.93)#36 | 6.8%(+8.16)#1,133 |
| 37. | 80304 | 14.9% | 9.0%(+5.87)#37 | 6.8%(+8.10)#1,139 |
| 38. | 81040 | 14.9% | 9.0%(+5.86)#38 | 6.8%(+8.09)#1,143 |
| 39. | 80124 | 14.7% | 9.0%(+5.74)#39 | 6.8%(+7.97)#1,166 |
| 40. | 81324 | 14.5% | 9.0%(+5.49)#40 | 6.8%(+7.72)#1,228 |
| 41. | 80829 | 14.3% | 9.0%(+5.34)#41 | 6.8%(+7.57)#1,256 |
| 42. | 80516 | 14.3% | 9.0%(+5.33)#42 | 6.8%(+7.56)#1,259 |
| 43. | 80118 | 14.2% | 9.0%(+5.19)#43 | 6.8%(+7.42)#1,292 |
| 44. | 80111 | 13.9% | 9.0%(+4.91)#44 | 6.8%(+7.14)#1,371 |
| 45. | 80130 | 13.9% | 9.0%(+4.86)#45 | 6.8%(+7.09)#1,387 |
| 46. | 80923 | 13.8% | 9.0%(+4.84)#46 | 6.8%(+7.07)#1,390 |
| 47. | 80211 | 13.7% | 9.0%(+4.71)#47 | 6.8%(+6.94)#1,430 |
| 48. | 80020 | 13.7% | 9.0%(+4.66)#48 | 6.8%(+6.89)#1,443 |
| 49. | 80127 | 13.6% | 9.0%(+4.59)#49 | 6.8%(+6.82)#1,455 |
| 50. | 80209 | 13.6% | 9.0%(+4.57)#50 | 6.8%(+6.80)#1,457 |
| 51. | 81525 | 13.5% | 9.0%(+4.55)#51 | 6.8%(+6.78)#1,462 |
| 52. | 80019 | 13.5% | 9.0%(+4.54)#52 | 6.8%(+6.77)#1,465 |
| 53. | 80920 | 13.5% | 9.0%(+4.52)#53 | 6.8%(+6.76)#1,472 |
| 54. | 80401 | 13.3% | 9.0%(+4.34)#54 | 6.8%(+6.57)#1,523 |
| 55. | 81641 | 13.2% | 9.0%(+4.23)#55 | 6.8%(+6.46)#1,563 |
| 56. | 80466 | 13.2% | 9.0%(+4.20)#56 | 6.8%(+6.43)#1,570 |
| 57. | 80203 | 13.1% | 9.0%(+4.09)#57 | 6.8%(+6.32)#1,615 |
| 58. | 80109 | 13.0% | 9.0%(+4.03)#58 | 6.8%(+6.26)#1,640 |
| 59. | 80122 | 13.0% | 9.0%(+4.01)#59 | 6.8%(+6.24)#1,646 |
| 60. | 80237 | 12.9% | 9.0%(+3.87)#60 | 6.8%(+6.10)#1,692 |
| 61. | 80951 | 12.8% | 9.0%(+3.81)#61 | 6.8%(+6.04)#1,713 |
| 62. | 80212 | 12.7% | 9.0%(+3.75)#62 | 6.8%(+5.98)#1,730 |
| 63. | 80528 | 12.7% | 9.0%(+3.72)#63 | 6.8%(+5.95)#1,743 |
| 64. | 80302 | 12.6% | 9.0%(+3.57)#64 | 6.8%(+5.80)#1,797 |
| 65. | 80230 | 12.5% | 9.0%(+3.51)#65 | 6.8%(+5.74)#1,815 |
| 66. | 80526 | 12.5% | 9.0%(+3.50)#66 | 6.8%(+5.73)#1,825 |
| 67. | 80126 | 12.3% | 9.0%(+3.34)#67 | 6.8%(+5.57)#1,882 |
| 68. | 80134 | 12.3% | 9.0%(+3.28)#68 | 6.8%(+5.51)#1,910 |
| 69. | 80433 | 12.2% | 9.0%(+3.24)#69 | 6.8%(+5.47)#1,928 |
| 70. | 80525 | 12.1% | 9.0%(+3.13)#70 | 6.8%(+5.36)#1,973 |
| 71. | 80482 | 12.1% | 9.0%(+3.07)#71 | 6.8%(+5.30)#2,006 |
| 72. | 80108 | 12.0% | 9.0%(+2.97)#72 | 6.8%(+5.20)#2,055 |
| 73. | 80205 | 11.9% | 9.0%(+2.95)#73 | 6.8%(+5.18)#2,058 |
| 74. | 80132 | 11.9% | 9.0%(+2.94)#74 | 6.8%(+5.17)#2,063 |
| 75. | 80921 | 11.9% | 9.0%(+2.88)#75 | 6.8%(+5.11)#2,099 |
| 76. | 80107 | 11.8% | 9.0%(+2.77)#76 | 6.8%(+5.01)#2,143 |
| 77. | 80005 | 11.7% | 9.0%(+2.75)#77 | 6.8%(+4.98)#2,156 |
| 78. | 80238 | 11.7% | 9.0%(+2.73)#78 | 6.8%(+4.96)#2,165 |
| 79. | 80016 | 11.7% | 9.0%(+2.68)#79 | 6.8%(+4.91)#2,191 |
| 80. | 80218 | 11.6% | 9.0%(+2.64)#80 | 6.8%(+4.87)#2,218 |
| 81. | 80215 | 11.6% | 9.0%(+2.60)#81 | 6.8%(+4.83)#2,242 |
| 82. | 80241 | 11.6% | 9.0%(+2.59)#82 | 6.8%(+4.82)#2,248 |
| 83. | 80740 | 11.5% | 9.0%(+2.54)#83 | 6.8%(+4.77)#2,280 |
| 84. | 80925 | 11.5% | 9.0%(+2.52)#84 | 6.8%(+4.75)#2,289 |
| 85. | 81210 | 11.3% | 9.0%(+2.31)#85 | 6.8%(+4.54)#2,406 |
| 86. | 80816 | 11.3% | 9.0%(+2.30)#86 | 6.8%(+4.53)#2,412 |
| 87. | 80224 | 11.3% | 9.0%(+2.27)#87 | 6.8%(+4.50)#2,427 |
| 88. | 80919 | 11.2% | 9.0%(+2.17)#88 | 6.8%(+4.40)#2,483 |
| 89. | 80504 | 11.2% | 9.0%(+2.16)#89 | 6.8%(+4.39)#2,488 |
| 90. | 80002 | 11.1% | 9.0%(+2.06)#90 | 6.8%(+4.29)#2,538 |
| 91. | 80128 | 11.0% | 9.0%(+2.04)#91 | 6.8%(+4.27)#2,548 |
| 92. | 80524 | 11.0% | 9.0%(+2.03)#92 | 6.8%(+4.26)#2,556 |
| 93. | 80223 | 10.9% | 9.0%(+1.88)#93 | 6.8%(+4.11)#2,640 |
| 94. | 80465 | 10.9% | 9.0%(+1.86)#94 | 6.8%(+4.09)#2,650 |
| 95. | 80138 | 10.8% | 9.0%(+1.79)#95 | 6.8%(+4.02)#2,688 |
| 96. | 80018 | 10.6% | 9.0%(+1.62)#96 | 6.8%(+3.85)#2,790 |
| 97. | 80546 | 10.6% | 9.0%(+1.60)#97 | 6.8%(+3.83)#2,800 |
| 98. | 80863 | 10.6% | 9.0%(+1.57)#98 | 6.8%(+3.80)#2,822 |
| 99. | 80123 | 10.5% | 9.0%(+1.55)#99 | 6.8%(+3.78)#2,838 |
| 100. | 80442 | 10.5% | 9.0%(+1.54)#100 | 6.8%(+3.77)#2,847 |
Common Questions
What are the Top 10 Zip Codes with the Highest Percentage of Population Employed in Computer, Engineering & Science in Colorado?
Top 10 Zip Codes with the Highest Percentage of Population Employed in Computer, Engineering & Science in Colorado are:
What zip code has the Highest Percentage of Population Employed in Computer, Engineering & Science in Colorado?
80025 has the Highest Percentage of Population Employed in Computer, Engineering & Science in Colorado with 42.9%.
What is the Percentage of Population Employed in Computer, Engineering & Science in the State of Colorado?
Percentage of Population Employed in Computer, Engineering & Science in Colorado is 9.0%.
What is the Percentage of Population Employed in Computer, Engineering & Science in the United States?
Percentage of Population Employed in Computer, Engineering & Science in the United States is 6.8%.