The Pinery, CO Map & Demographics
The Pinery Map
The Pinery Overview
$67,401
PER CAPITA INCOME
$163,693
AVG FAMILY INCOME
$154,404
AVG HOUSEHOLD INCOME
40.3%
WAGE / INCOME GAP [ % ]
59.7¢/ $1
WAGE / INCOME GAP [ $ ]
$16,048
FAMILY INCOME DEFICIT
0.38
INEQUALITY / GINI INDEX
10,534
TOTAL POPULATION
5,193
MALE POPULATION
5,341
FEMALE POPULATION
97.23
MALES / 100 FEMALES
102.85
FEMALES / 100 MALES
45.6
MEDIAN AGE
3.1
AVG FAMILY SIZE
2.9
AVG HOUSEHOLD SIZE
5,712
LABOR FORCE [ PEOPLE ]
67.6%
PERCENT IN LABOR FORCE
3.0%
UNEMPLOYMENT RATE
Income in The Pinery
Income Overview in The Pinery
Per Capita Income in The Pinery is $67,401, while median incomes of families and households are $163,693 and $154,404 respectively.
| Characteristic | Number | Measure |
| Per Capita Income | 10,534 | $67,401 |
| Median Family Income | 3,275 | $163,693 |
| Mean Family Income | 3,275 | $193,327 |
| Median Household Income | 3,669 | $154,404 |
| Mean Household Income | 3,669 | $191,272 |
| Income Deficit | 3,275 | $16,048 |
| Wage / Income Gap (%) | 10,534 | 40.31% |
| Wage / Income Gap ($) | 10,534 | 59.69¢ per $1 |
| Gini / Inequality Index | 10,534 | 0.38 |
Earnings by Sex in The Pinery
Average Earnings in The Pinery are $74,563, $89,264 for men and $53,283 for women, a difference of 40.3%.
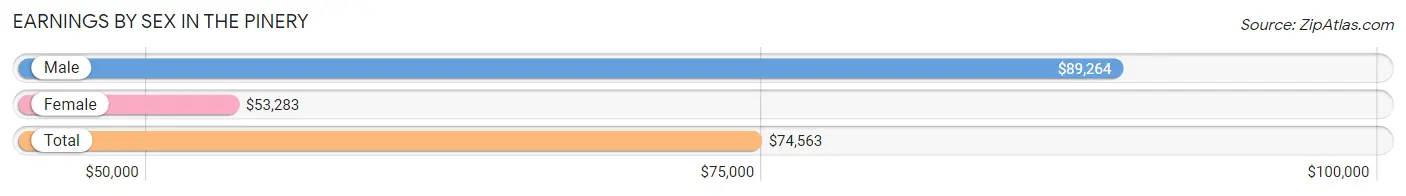
| Sex | Number | Average Earnings |
| Male | 3,261 (54.4%) | $89,264 |
| Female | 2,734 (45.6%) | $53,283 |
| Total | 5,995 (100.0%) | $74,563 |
Earnings by Sex by Income Bracket in The Pinery
The most common earnings brackets in The Pinery are $100,000+ for men (1,440 | 44.2%) and $100,000+ for women (663 | 24.2%).
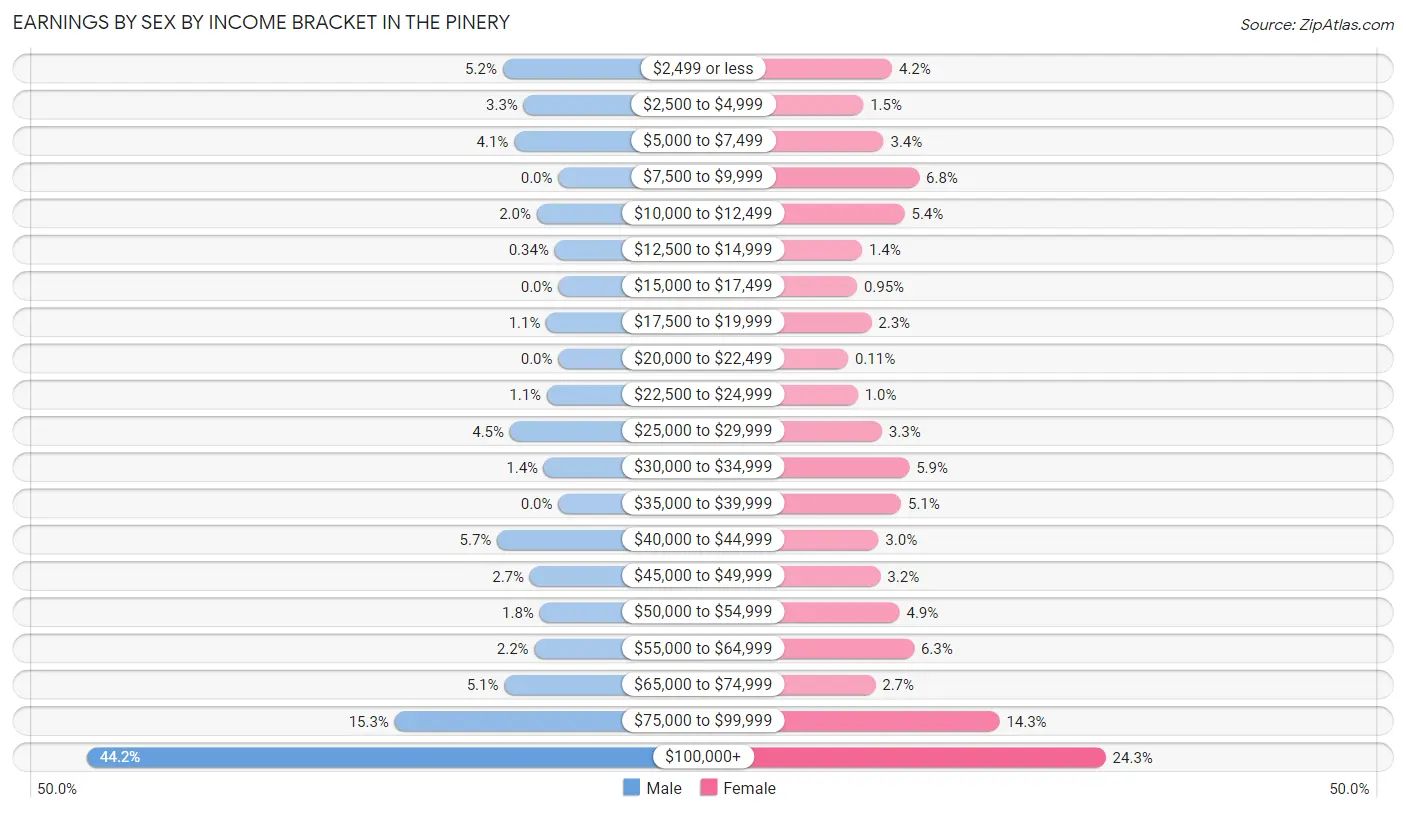
| Income | Male | Female |
| $2,499 or less | 170 (5.2%) | 116 (4.2%) |
| $2,500 to $4,999 | 106 (3.3%) | 42 (1.5%) |
| $5,000 to $7,499 | 135 (4.1%) | 94 (3.4%) |
| $7,500 to $9,999 | 0 (0.0%) | 185 (6.8%) |
| $10,000 to $12,499 | 66 (2.0%) | 148 (5.4%) |
| $12,500 to $14,999 | 11 (0.3%) | 39 (1.4%) |
| $15,000 to $17,499 | 0 (0.0%) | 26 (0.9%) |
| $17,500 to $19,999 | 37 (1.1%) | 63 (2.3%) |
| $20,000 to $22,499 | 0 (0.0%) | 3 (0.1%) |
| $22,500 to $24,999 | 35 (1.1%) | 28 (1.0%) |
| $25,000 to $29,999 | 148 (4.5%) | 90 (3.3%) |
| $30,000 to $34,999 | 44 (1.3%) | 160 (5.9%) |
| $35,000 to $39,999 | 0 (0.0%) | 139 (5.1%) |
| $40,000 to $44,999 | 187 (5.7%) | 81 (3.0%) |
| $45,000 to $49,999 | 87 (2.7%) | 86 (3.2%) |
| $50,000 to $54,999 | 57 (1.8%) | 135 (4.9%) |
| $55,000 to $64,999 | 73 (2.2%) | 172 (6.3%) |
| $65,000 to $74,999 | 165 (5.1%) | 73 (2.7%) |
| $75,000 to $99,999 | 500 (15.3%) | 391 (14.3%) |
| $100,000+ | 1,440 (44.2%) | 663 (24.2%) |
| Total | 3,261 (100.0%) | 2,734 (100.0%) |
Earnings by Sex by Educational Attainment in The Pinery
Average earnings in The Pinery are $105,077 for men and $60,409 for women, a difference of 42.5%. Men with an educational attainment of graduate degree enjoy the highest average annual earnings of $130,441, while those with less than high school education earn the least with $33,125. Women with an educational attainment of bachelor's degree earn the most with the average annual earnings of $88,854, while those with high school diploma education have the smallest earnings of $31,250.
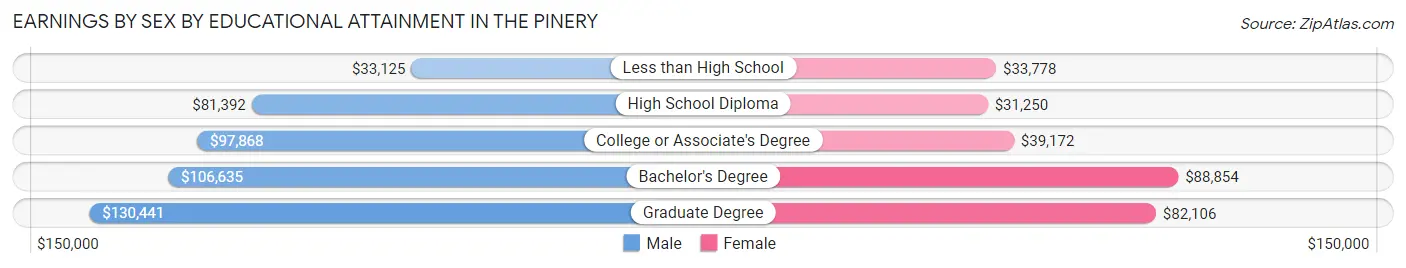
| Educational Attainment | Male Income | Female Income |
| Less than High School | $33,125 | $33,778 |
| High School Diploma | $81,392 | $31,250 |
| College or Associate's Degree | $97,868 | $39,172 |
| Bachelor's Degree | $106,635 | $88,854 |
| Graduate Degree | $130,441 | $82,106 |
| Total | $105,077 | $60,409 |
Family Income in The Pinery
Family Income Brackets in The Pinery
According to the The Pinery family income data, there are 1,261 families falling into the $200,000+ income range, which is the most common income bracket and makes up 38.5% of all families.
| Income Bracket | # Families | % Families |
| Less than $10,000 | 59 | 1.8% |
| $10,000 to $14,999 | 0 | 0.0% |
| $15,000 to $24,999 | 36 | 1.1% |
| $25,000 to $34,999 | 59 | 1.8% |
| $35,000 to $49,999 | 59 | 1.8% |
| $50,000 to $74,999 | 219 | 6.7% |
| $75,000 to $99,999 | 288 | 8.8% |
| $100,000 to $149,999 | 740 | 22.6% |
| $150,000 to $199,999 | 557 | 17.0% |
| $200,000+ | 1,261 | 38.5% |
Family Income by Famaliy Size in The Pinery
5-person families (308 | 9.4%) account for the highest median family income in The Pinery with $250,001 per family, while 2-person families (1,602 | 48.9%) have the highest median income of $67,218 per family member.
| Income Bracket | # Families | Median Income |
| 2-Person Families | 1,602 (48.9%) | $134,435 |
| 3-Person Families | 560 (17.1%) | $183,929 |
| 4-Person Families | 740 (22.6%) | $154,350 |
| 5-Person Families | 308 (9.4%) | $250,001 |
| 6-Person Families | 54 (1.7%) | $109,375 |
| 7+ Person Families | 11 (0.3%) | $0 |
| Total | 3,275 (100.0%) | $163,693 |
Family Income by Number of Earners in The Pinery
The median family income in The Pinery is $163,693, with families comprising 3+ earners (459) having the highest median family income of $209,139, while families with no earners (623) have the lowest median family income of $85,516, accounting for 14.0% and 19.0% of families, respectively.
| Number of Earners | # Families | Median Income |
| No Earners | 623 (19.0%) | $85,516 |
| 1 Earner | 587 (17.9%) | $138,365 |
| 2 Earners | 1,606 (49.0%) | $181,471 |
| 3+ Earners | 459 (14.0%) | $209,139 |
| Total | 3,275 (100.0%) | $163,693 |
Household Income in The Pinery
Household Income Brackets in The Pinery
With 1,339 households falling in the category, the $200,000+ income range is the most frequent in The Pinery, accounting for 36.5% of all households. In contrast, only 18 households (0.5%) fall into the $10,000 to $14,999 income bracket, making it the least populous group.
| Income Bracket | # Households | % Households |
| Less than $10,000 | 81 | 2.2% |
| $10,000 to $14,999 | 18 | 0.5% |
| $15,000 to $24,999 | 37 | 1.0% |
| $25,000 to $34,999 | 81 | 2.2% |
| $35,000 to $49,999 | 73 | 2.0% |
| $50,000 to $74,999 | 290 | 7.9% |
| $75,000 to $99,999 | 312 | 8.5% |
| $100,000 to $149,999 | 829 | 22.6% |
| $150,000 to $199,999 | 605 | 16.5% |
| $200,000+ | 1,339 | 36.5% |
Household Income by Householder Age in The Pinery
The median household income in The Pinery is $154,404, with the highest median household income of $185,732 found in the 45 to 64 years age bracket for the primary householder. A total of 1,854 households (50.5%) fall into this category. Meanwhile, the 15 to 24 years age bracket for the primary householder has the lowest median household income of $0, with 22 households (0.6%) in this group.
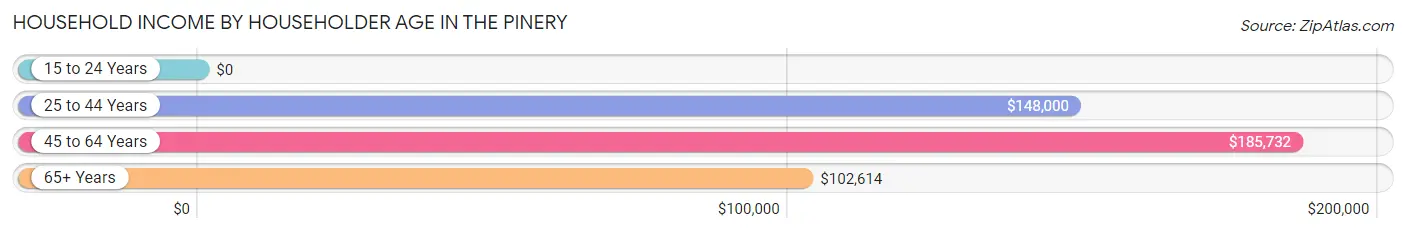
| Income Bracket | # Households | Median Income |
| 15 to 24 Years | 22 (0.6%) | $0 |
| 25 to 44 Years | 826 (22.5%) | $148,000 |
| 45 to 64 Years | 1,854 (50.5%) | $185,732 |
| 65+ Years | 967 (26.4%) | $102,614 |
| Total | 3,669 (100.0%) | $154,404 |
Poverty in The Pinery
Income Below Poverty by Sex and Age in The Pinery
With 2.0% poverty level for males and 1.2% for females among the residents of The Pinery, 25 to 34 year old males and 65 to 74 year old females are the most vulnerable to poverty, with 41 males (10.6%) and 20 females (3.4%) in their respective age groups living below the poverty level.
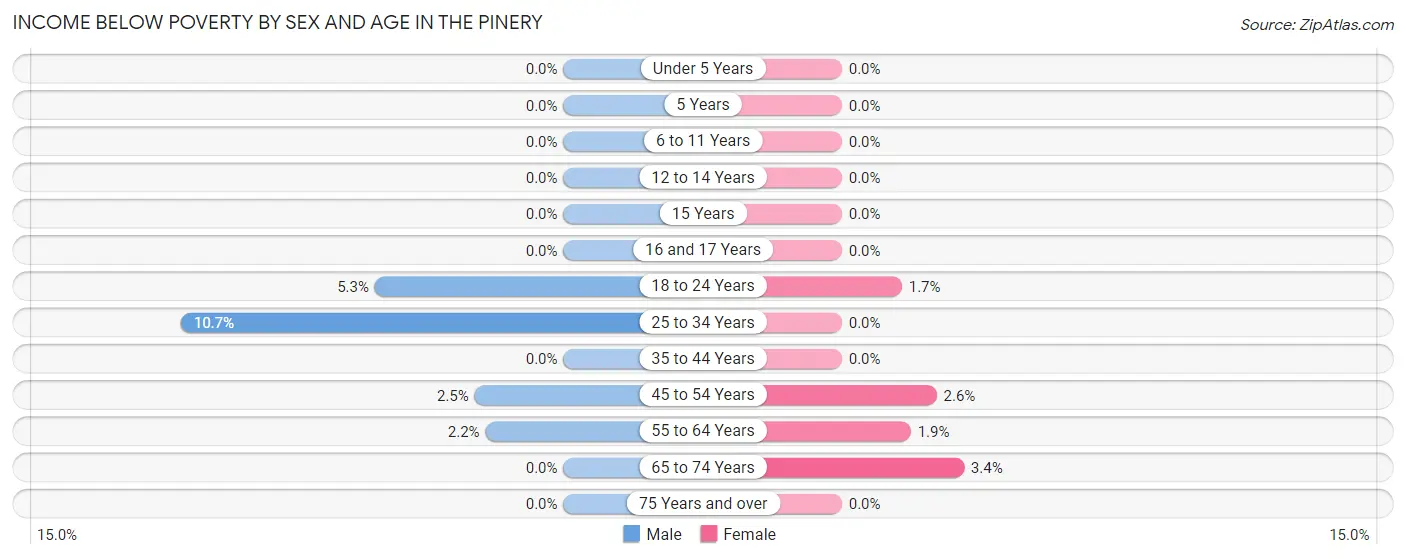
| Age Bracket | Male | Female |
| Under 5 Years | 0 (0.0%) | 0 (0.0%) |
| 5 Years | 0 (0.0%) | 0 (0.0%) |
| 6 to 11 Years | 0 (0.0%) | 0 (0.0%) |
| 12 to 14 Years | 0 (0.0%) | 0 (0.0%) |
| 15 Years | 0 (0.0%) | 0 (0.0%) |
| 16 and 17 Years | 0 (0.0%) | 0 (0.0%) |
| 18 to 24 Years | 22 (5.2%) | 5 (1.7%) |
| 25 to 34 Years | 41 (10.6%) | 0 (0.0%) |
| 35 to 44 Years | 0 (0.0%) | 0 (0.0%) |
| 45 to 54 Years | 24 (2.5%) | 21 (2.6%) |
| 55 to 64 Years | 19 (2.2%) | 19 (1.9%) |
| 65 to 74 Years | 0 (0.0%) | 20 (3.4%) |
| 75 Years and over | 0 (0.0%) | 0 (0.0%) |
| Total | 106 (2.0%) | 65 (1.2%) |
Income Above Poverty by Sex and Age in The Pinery
According to the poverty statistics in The Pinery, males aged under 5 years and females aged under 5 years are the age groups that are most secure financially, with 100.0% of males and 100.0% of females in these age groups living above the poverty line.
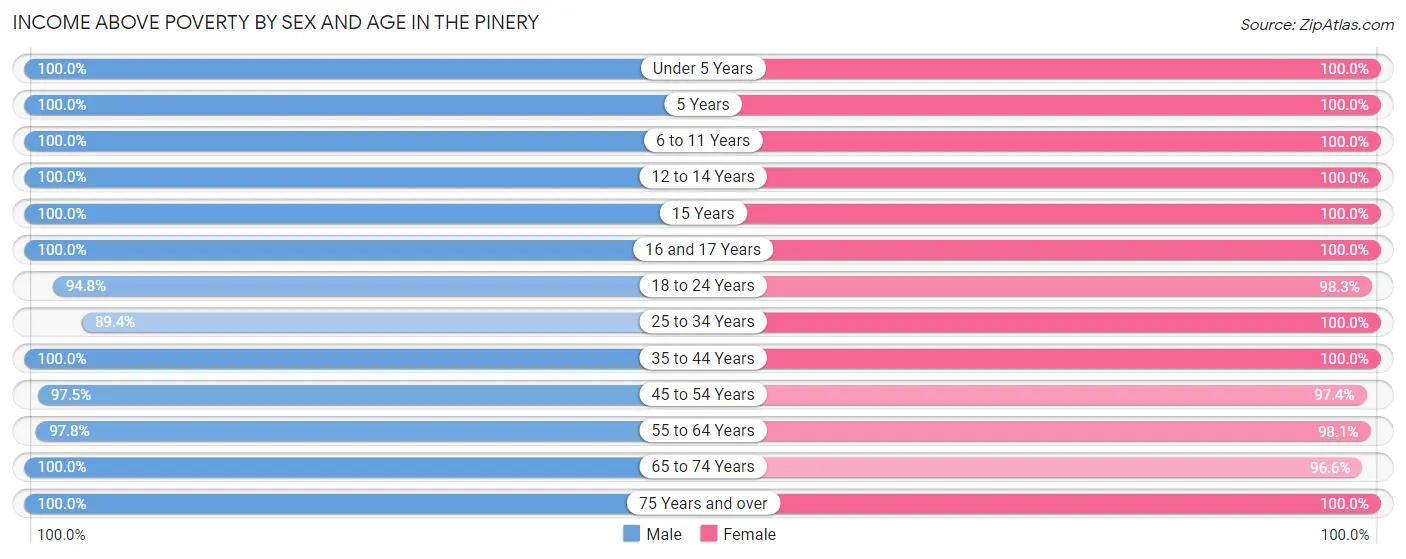
| Age Bracket | Male | Female |
| Under 5 Years | 251 (100.0%) | 115 (100.0%) |
| 5 Years | 42 (100.0%) | 30 (100.0%) |
| 6 to 11 Years | 328 (100.0%) | 607 (100.0%) |
| 12 to 14 Years | 277 (100.0%) | 201 (100.0%) |
| 15 Years | 71 (100.0%) | 146 (100.0%) |
| 16 and 17 Years | 92 (100.0%) | 213 (100.0%) |
| 18 to 24 Years | 397 (94.8%) | 295 (98.3%) |
| 25 to 34 Years | 344 (89.3%) | 193 (100.0%) |
| 35 to 44 Years | 558 (100.0%) | 891 (100.0%) |
| 45 to 54 Years | 948 (97.5%) | 774 (97.4%) |
| 55 to 64 Years | 856 (97.8%) | 970 (98.1%) |
| 65 to 74 Years | 606 (100.0%) | 569 (96.6%) |
| 75 Years and over | 317 (100.0%) | 256 (100.0%) |
| Total | 5,087 (98.0%) | 5,260 (98.8%) |
Income Below Poverty Among Married-Couple Families in The Pinery
The poverty statistics for married-couple families in The Pinery show that 1.9% or 58 of the total 2,977 families live below the poverty line. Families with no children have the highest poverty rate of 3.2%, comprising of 58 families. On the other hand, families with 1 or 2 children have the lowest poverty rate of 0.0%, which includes 0 families.
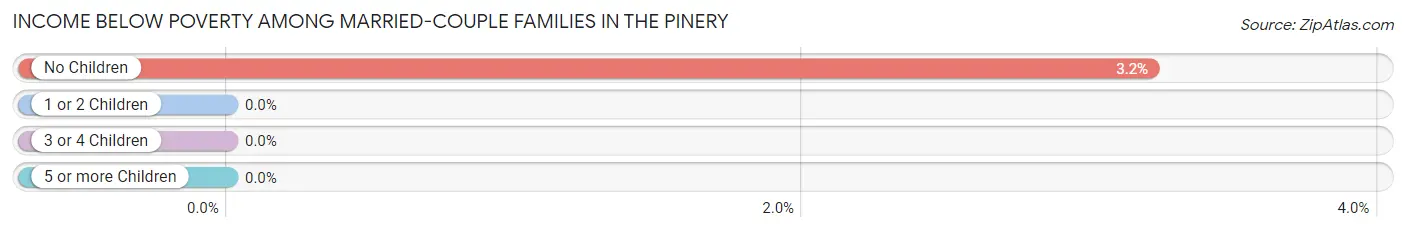
| Children | Above Poverty | Below Poverty |
| No Children | 1,748 (96.8%) | 58 (3.2%) |
| 1 or 2 Children | 883 (100.0%) | 0 (0.0%) |
| 3 or 4 Children | 277 (100.0%) | 0 (0.0%) |
| 5 or more Children | 11 (100.0%) | 0 (0.0%) |
| Total | 2,919 (98.1%) | 58 (1.9%) |
Income Below Poverty Among Single-Parent Households in The Pinery
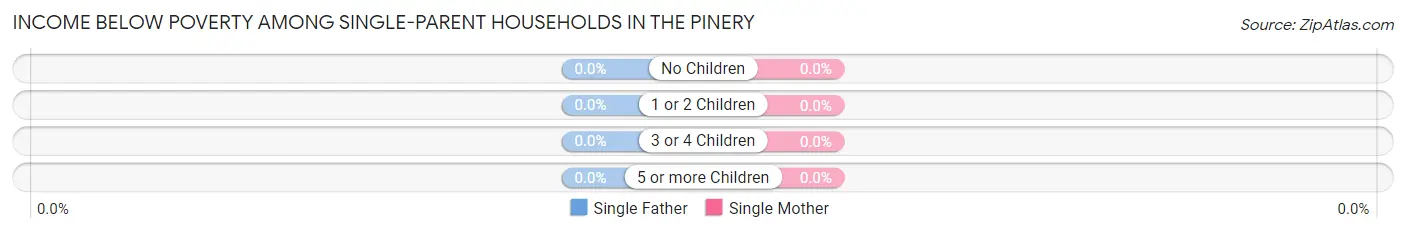
| Children | Single Father | Single Mother |
| No Children | 0 (0.0%) | 0 (0.0%) |
| 1 or 2 Children | 0 (0.0%) | 0 (0.0%) |
| 3 or 4 Children | 0 (0.0%) | 0 (0.0%) |
| 5 or more Children | 0 (0.0%) | 0 (0.0%) |
| Total | 0 (0.0%) | 0 (0.0%) |
Income Below Poverty Among Married-Couple vs Single-Parent Households in The Pinery
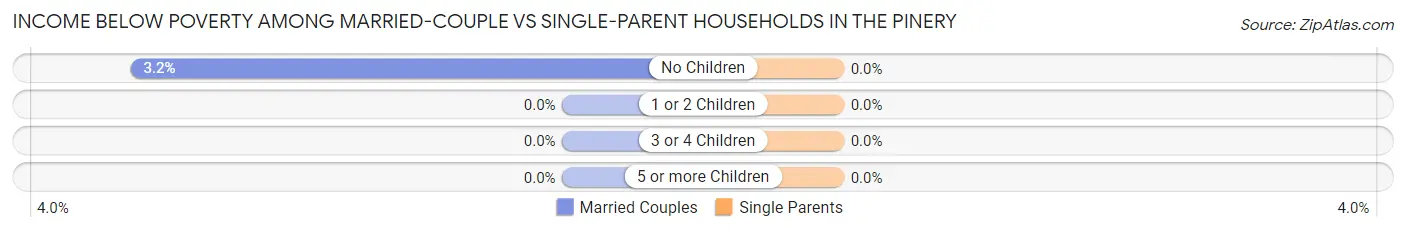
| Children | Married-Couple Families | Single-Parent Households |
| No Children | 58 (3.2%) | 0 (0.0%) |
| 1 or 2 Children | 0 (0.0%) | 0 (0.0%) |
| 3 or 4 Children | 0 (0.0%) | 0 (0.0%) |
| 5 or more Children | 0 (0.0%) | 0 (0.0%) |
| Total | 58 (1.9%) | 0 (0.0%) |
Race in The Pinery
The most populous races in The Pinery are White / Caucasian (8,764 | 83.2%), Hispanic or Latino (974 | 9.2%), and Two or more Races (850 | 8.1%).
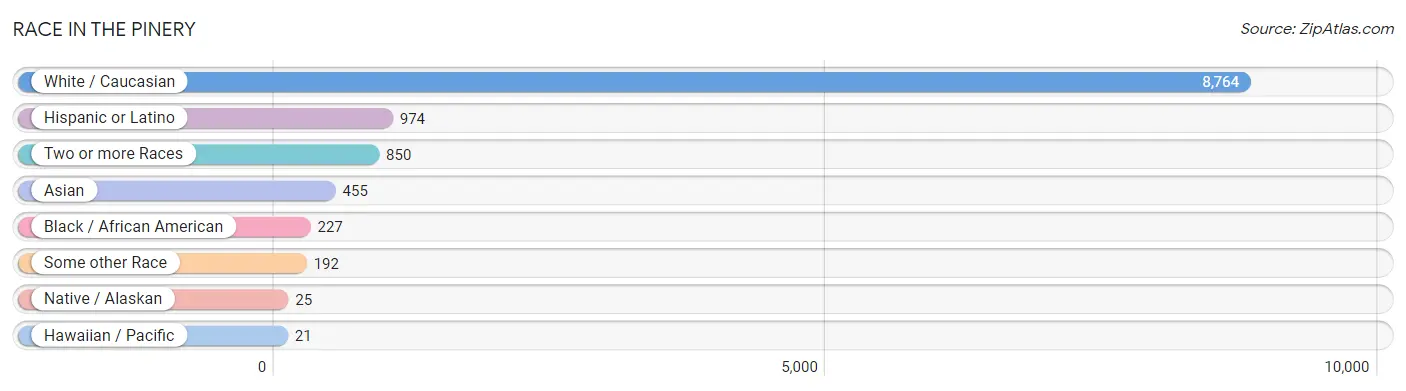
| Race | # Population | % Population |
| Asian | 455 | 4.3% |
| Black / African American | 227 | 2.1% |
| Hawaiian / Pacific | 21 | 0.2% |
| Hispanic or Latino | 974 | 9.2% |
| Native / Alaskan | 25 | 0.2% |
| White / Caucasian | 8,764 | 83.2% |
| Two or more Races | 850 | 8.1% |
| Some other Race | 192 | 1.8% |
| Total | 10,534 | 100.0% |
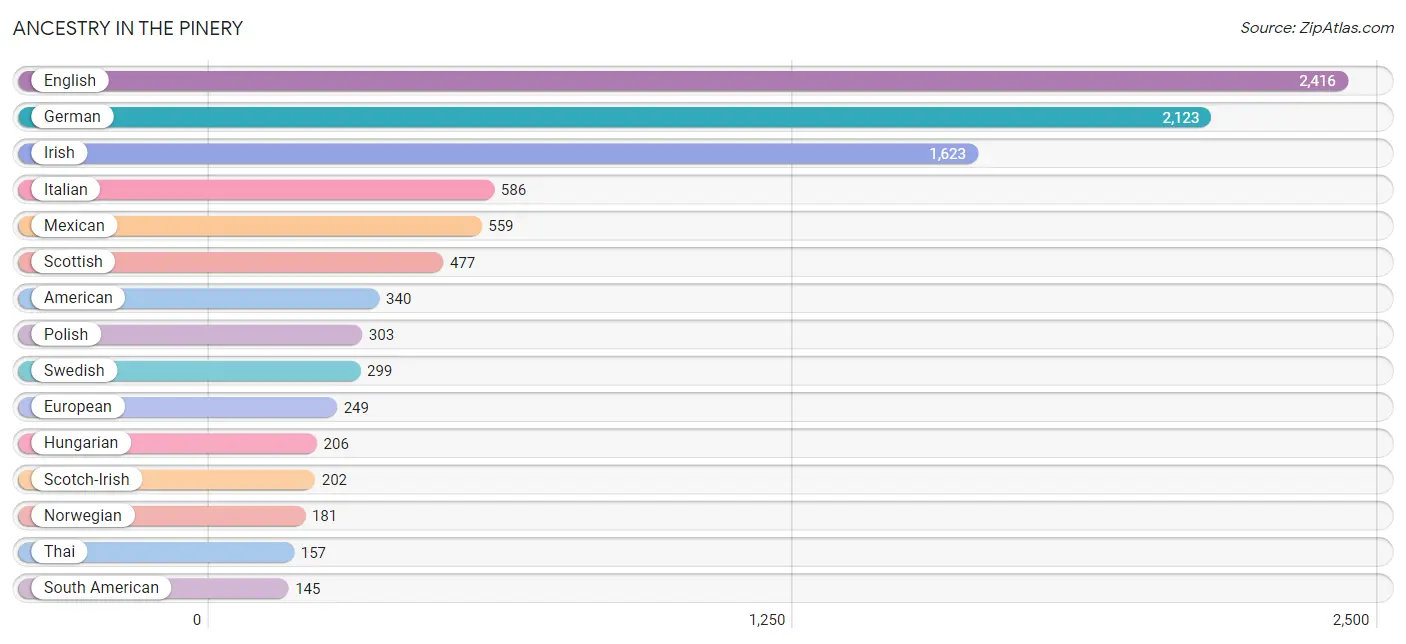
Ancestry in The Pinery
The most populous ancestries reported in The Pinery are English (2,416 | 22.9%), German (2,123 | 20.2%), Irish (1,623 | 15.4%), Italian (586 | 5.6%), and Mexican (559 | 5.3%), together accounting for 69.4% of all The Pinery residents.
| Ancestry | # Population | % Population |
| American | 340 | 3.2% |
| Arab | 98 | 0.9% |
| Austrian | 12 | 0.1% |
| Belgian | 26 | 0.3% |
| Bhutanese | 34 | 0.3% |
| British | 71 | 0.7% |
| Burmese | 36 | 0.3% |
| Central American | 37 | 0.4% |
| Cherokee | 92 | 0.9% |
| Choctaw | 10 | 0.1% |
| Creek | 33 | 0.3% |
| Croatian | 33 | 0.3% |
| Cuban | 63 | 0.6% |
| Czech | 104 | 1.0% |
| Czechoslovakian | 24 | 0.2% |
| Danish | 24 | 0.2% |
| Dutch | 36 | 0.3% |
| Eastern European | 18 | 0.2% |
| English | 2,416 | 22.9% |
| European | 249 | 2.4% |
| Finnish | 24 | 0.2% |
| French | 112 | 1.1% |
| French Canadian | 18 | 0.2% |
| German | 2,123 | 20.2% |
| Greek | 8 | 0.1% |
| Guatemalan | 37 | 0.4% |
| Hungarian | 206 | 2.0% |
| Indian (Asian) | 97 | 0.9% |
| Irish | 1,623 | 15.4% |
| Italian | 586 | 5.6% |
| Korean | 75 | 0.7% |
| Mexican | 559 | 5.3% |
| Moroccan | 79 | 0.7% |
| Native Hawaiian | 21 | 0.2% |
| Northern European | 15 | 0.1% |
| Norwegian | 181 | 1.7% |
| Pennsylvania German | 12 | 0.1% |
| Peruvian | 38 | 0.4% |
| Polish | 303 | 2.9% |
| Portuguese | 28 | 0.3% |
| Puerto Rican | 87 | 0.8% |
| Romanian | 57 | 0.5% |
| Russian | 57 | 0.5% |
| Scandinavian | 24 | 0.2% |
| Scotch-Irish | 202 | 1.9% |
| Scottish | 477 | 4.5% |
| Slavic | 31 | 0.3% |
| Slovene | 6 | 0.1% |
| South American | 145 | 1.4% |
| Spaniard | 16 | 0.2% |
| Spanish | 53 | 0.5% |
| Sri Lankan | 10 | 0.1% |
| Swedish | 299 | 2.8% |
| Swiss | 26 | 0.3% |
| Syrian | 19 | 0.2% |
| Thai | 157 | 1.5% |
| Ukrainian | 54 | 0.5% |
| Welsh | 61 | 0.6% |
| Yugoslavian | 90 | 0.9% | View All 59 Rows |
Immigrants in The Pinery
The most numerous immigrant groups reported in The Pinery came from Asia (362 | 3.4%), South Eastern Asia (150 | 1.4%), South Central Asia (132 | 1.3%), Singapore (113 | 1.1%), and Latin America (88 | 0.8%), together accounting for 8.0% of all The Pinery residents.
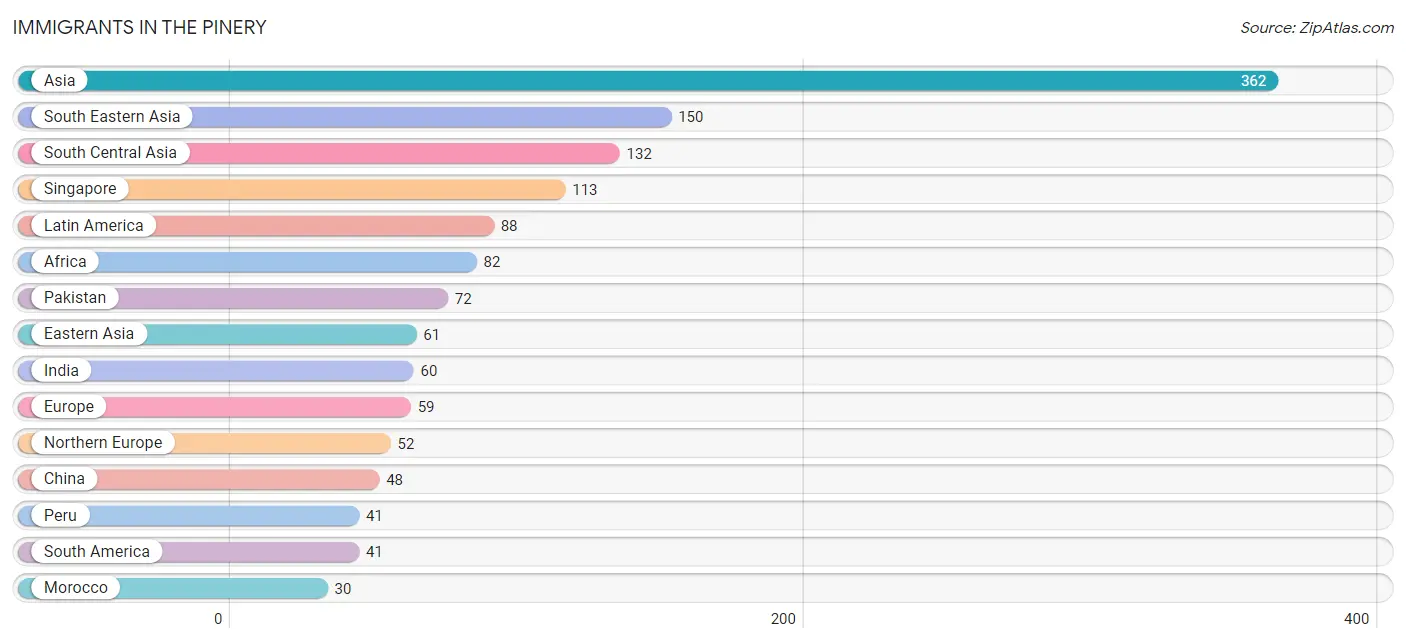
| Immigration Origin | # Population | % Population |
| Africa | 82 | 0.8% |
| Asia | 362 | 3.4% |
| Canada | 24 | 0.2% |
| Caribbean | 19 | 0.2% |
| Central America | 28 | 0.3% |
| China | 48 | 0.5% |
| Cuba | 19 | 0.2% |
| Eastern Africa | 16 | 0.2% |
| Eastern Asia | 61 | 0.6% |
| Europe | 59 | 0.6% |
| Germany | 7 | 0.1% |
| India | 60 | 0.6% |
| Kenya | 16 | 0.2% |
| Korea | 13 | 0.1% |
| Laos | 15 | 0.1% |
| Latin America | 88 | 0.8% |
| Mexico | 28 | 0.3% |
| Morocco | 30 | 0.3% |
| Northern Africa | 30 | 0.3% |
| Northern Europe | 52 | 0.5% |
| Pakistan | 72 | 0.7% |
| Peru | 41 | 0.4% |
| Scotland | 29 | 0.3% |
| Singapore | 113 | 1.1% |
| South America | 41 | 0.4% |
| South Central Asia | 132 | 1.3% |
| South Eastern Asia | 150 | 1.4% |
| Syria | 19 | 0.2% |
| Taiwan | 20 | 0.2% |
| Thailand | 12 | 0.1% |
| Vietnam | 10 | 0.1% |
| Western Asia | 19 | 0.2% |
| Western Europe | 7 | 0.1% | View All 33 Rows |
Sex and Age in The Pinery
Sex and Age in The Pinery
The most populous age groups in The Pinery are 60 to 64 Years (489 | 9.4%) for men and 55 to 59 Years (661 | 12.4%) for women.
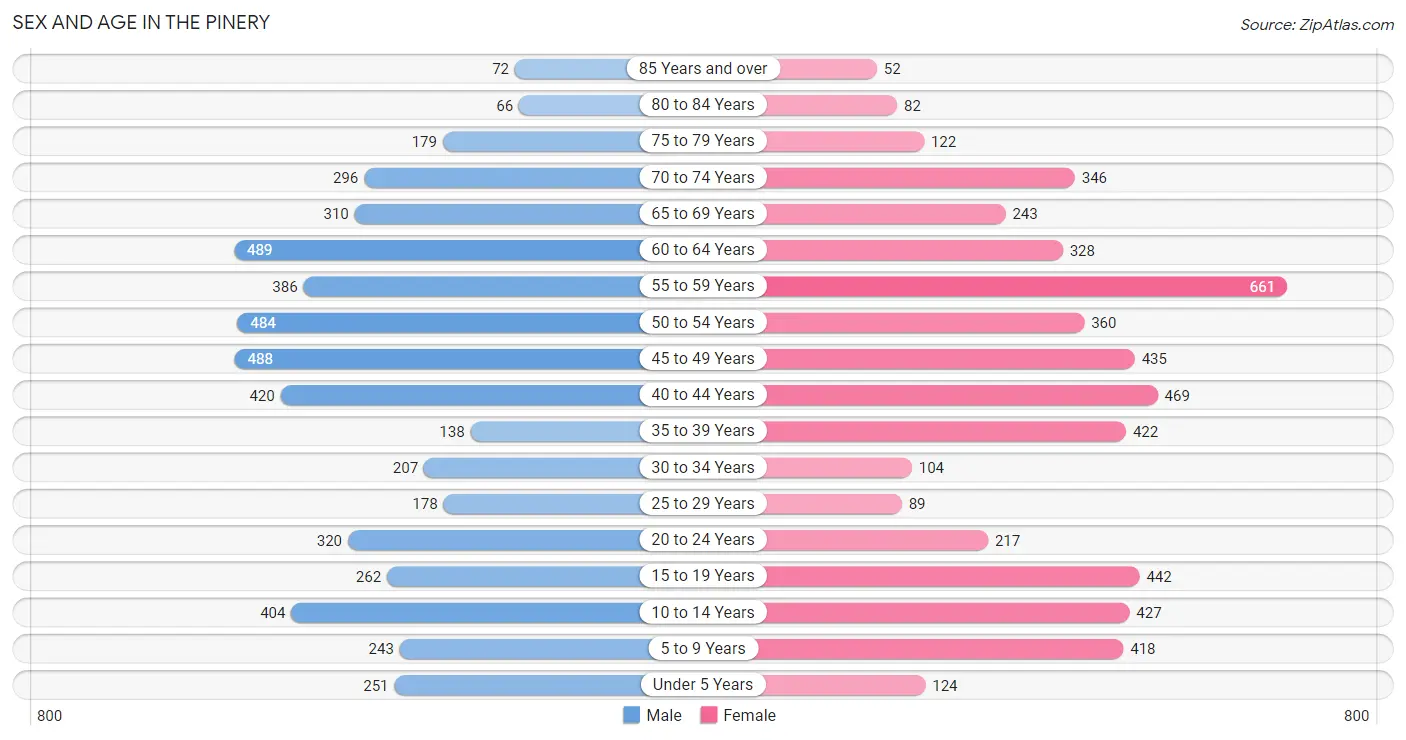
| Age Bracket | Male | Female |
| Under 5 Years | 251 (4.8%) | 124 (2.3%) |
| 5 to 9 Years | 243 (4.7%) | 418 (7.8%) |
| 10 to 14 Years | 404 (7.8%) | 427 (8.0%) |
| 15 to 19 Years | 262 (5.1%) | 442 (8.3%) |
| 20 to 24 Years | 320 (6.2%) | 217 (4.1%) |
| 25 to 29 Years | 178 (3.4%) | 89 (1.7%) |
| 30 to 34 Years | 207 (4.0%) | 104 (1.9%) |
| 35 to 39 Years | 138 (2.7%) | 422 (7.9%) |
| 40 to 44 Years | 420 (8.1%) | 469 (8.8%) |
| 45 to 49 Years | 488 (9.4%) | 435 (8.1%) |
| 50 to 54 Years | 484 (9.3%) | 360 (6.7%) |
| 55 to 59 Years | 386 (7.4%) | 661 (12.4%) |
| 60 to 64 Years | 489 (9.4%) | 328 (6.1%) |
| 65 to 69 Years | 310 (6.0%) | 243 (4.5%) |
| 70 to 74 Years | 296 (5.7%) | 346 (6.5%) |
| 75 to 79 Years | 179 (3.5%) | 122 (2.3%) |
| 80 to 84 Years | 66 (1.3%) | 82 (1.5%) |
| 85 Years and over | 72 (1.4%) | 52 (1.0%) |
| Total | 5,193 (100.0%) | 5,341 (100.0%) |
Families and Households in The Pinery
Median Family Size in The Pinery
The median family size in The Pinery is 3.06 persons per family, with single male/father families (102 | 3.1%) accounting for the largest median family size of 3.26 persons per family. On the other hand, single female/mother families (196 | 6.0%) represent the smallest median family size with 2.76 persons per family.
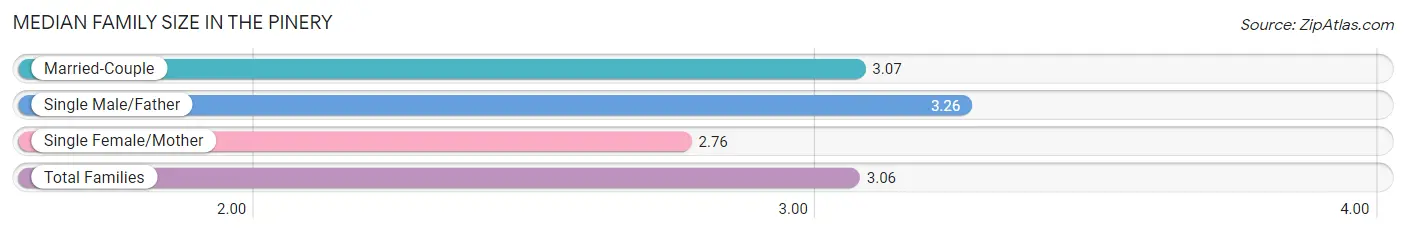
| Family Type | # Families | Family Size |
| Married-Couple | 2,977 (90.9%) | 3.07 |
| Single Male/Father | 102 (3.1%) | 3.26 |
| Single Female/Mother | 196 (6.0%) | 2.76 |
| Total Families | 3,275 (100.0%) | 3.06 |
Median Household Size in The Pinery
The median household size in The Pinery is 2.87 persons per household, with single male/father households (102 | 2.8%) accounting for the largest median household size of 3.26 persons per household. non-family households (394 | 10.7%) represent the smallest median household size with 1.21 persons per household.
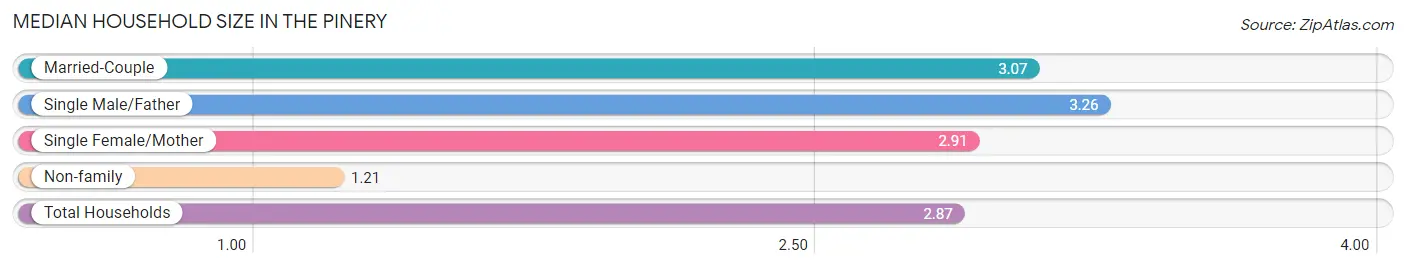
| Household Type | # Households | Household Size |
| Married-Couple | 2,977 (81.1%) | 3.07 |
| Single Male/Father | 102 (2.8%) | 3.26 |
| Single Female/Mother | 196 (5.3%) | 2.91 |
| Non-family | 394 (10.7%) | 1.21 |
| Total Households | 3,669 (100.0%) | 2.87 |
Household Size by Marriage Status in The Pinery
Out of a total of 3,669 households in The Pinery, 3,275 (89.3%) are family households, while 394 (10.7%) are nonfamily households. The most numerous type of family households are 2-person households, comprising 1,589, and the most common type of nonfamily households are 1-person households, comprising 314.
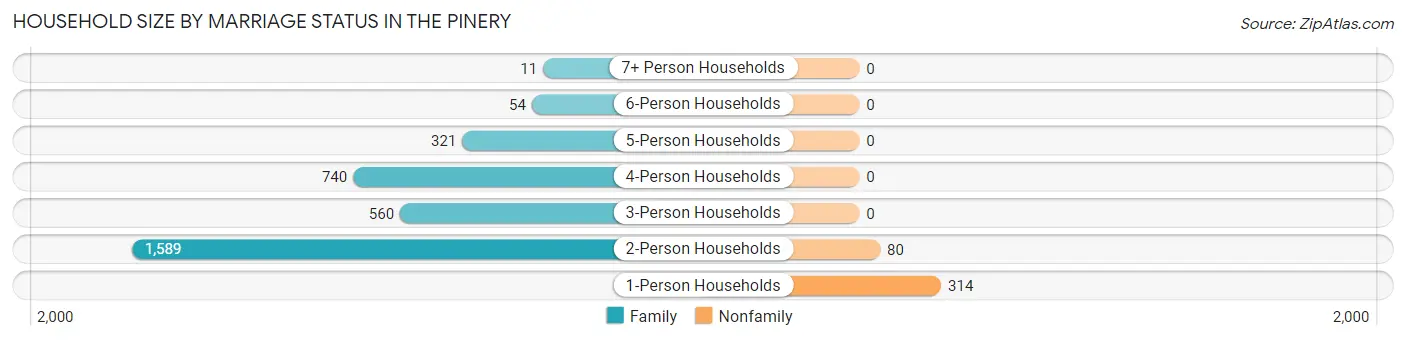
| Household Size | Family Households | Nonfamily Households |
| 1-Person Households | - | 314 (8.6%) |
| 2-Person Households | 1,589 (43.3%) | 80 (2.2%) |
| 3-Person Households | 560 (15.3%) | 0 (0.0%) |
| 4-Person Households | 740 (20.2%) | 0 (0.0%) |
| 5-Person Households | 321 (8.7%) | 0 (0.0%) |
| 6-Person Households | 54 (1.5%) | 0 (0.0%) |
| 7+ Person Households | 11 (0.3%) | 0 (0.0%) |
| Total | 3,275 (89.3%) | 394 (10.7%) |
Female Fertility in The Pinery
Fertility by Age in The Pinery
Average fertility rate in The Pinery is 24.0 births per 1,000 women. Women in the age bracket of 20 to 34 years have the highest fertility rate with 54.0 births per 1,000 women. Women in the age bracket of 35 to 50 years acount for 58.5% of all women with births.
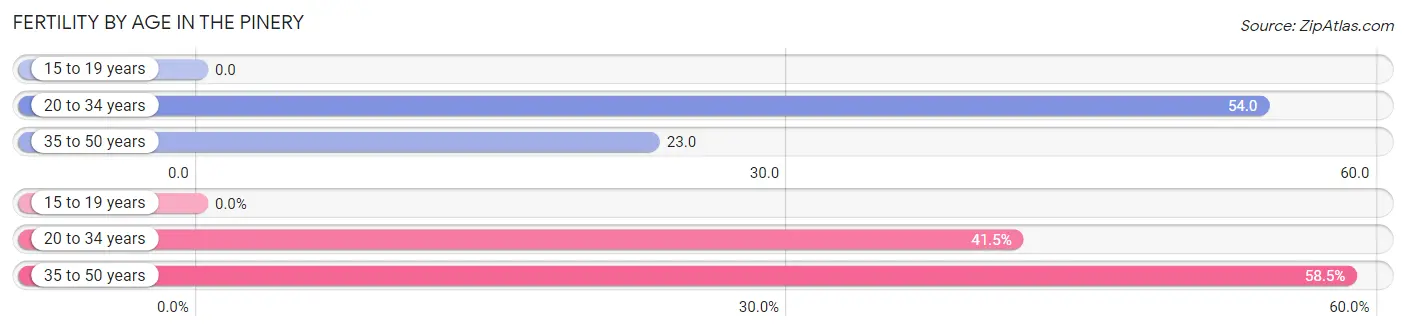
| Age Bracket | Women with Births | Births / 1,000 Women |
| 15 to 19 years | 0 (0.0%) | 0.0 |
| 20 to 34 years | 22 (41.5%) | 54.0 |
| 35 to 50 years | 31 (58.5%) | 23.0 |
| Total | 53 (100.0%) | 24.0 |
Fertility by Age by Marriage Status in The Pinery
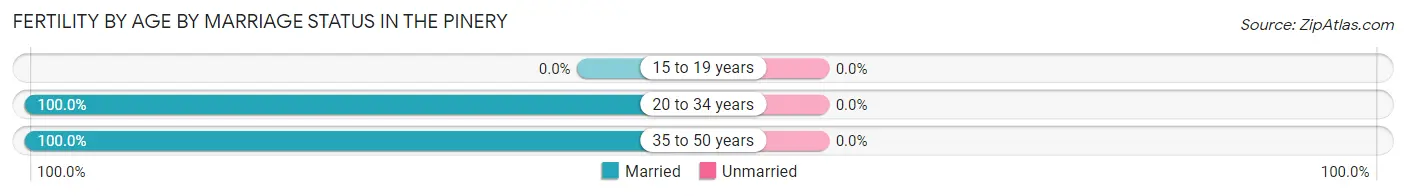
| Age Bracket | Married | Unmarried |
| 15 to 19 years | 0 (0.0%) | 0 (0.0%) |
| 20 to 34 years | 22 (100.0%) | 0 (0.0%) |
| 35 to 50 years | 31 (100.0%) | 0 (0.0%) |
| Total | 53 (100.0%) | 0 (0.0%) |
Fertility by Education in The Pinery
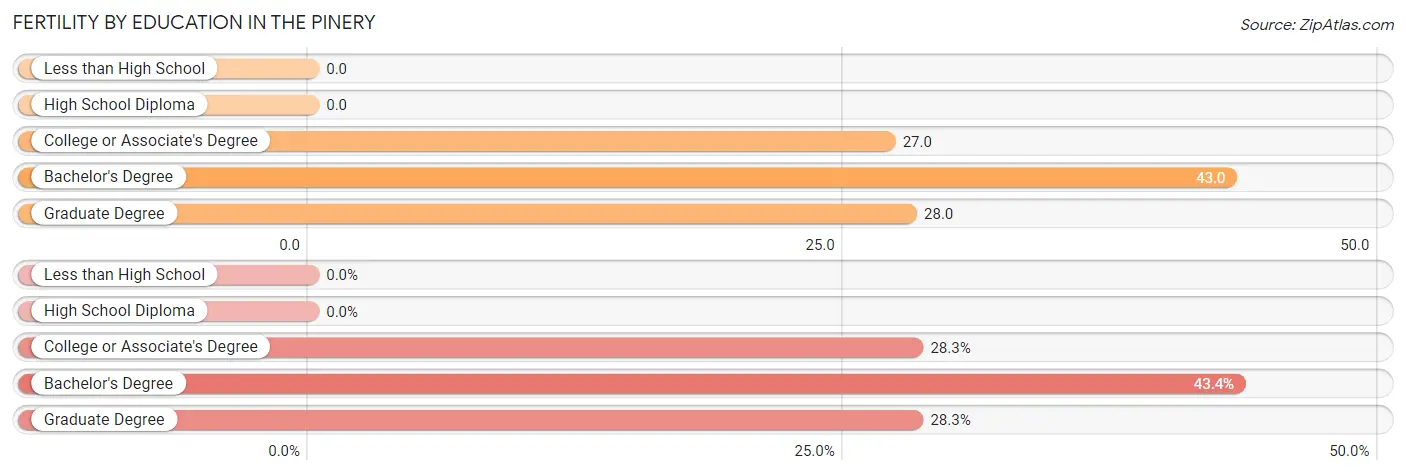
| Educational Attainment | Women with Births | Births / 1,000 Women |
| Less than High School | 0 (0.0%) | 0.0 |
| High School Diploma | 0 (0.0%) | 0.0 |
| College or Associate's Degree | 15 (28.3%) | 27.0 |
| Bachelor's Degree | 23 (43.4%) | 43.0 |
| Graduate Degree | 15 (28.3%) | 28.0 |
| Total | 53 (100.0%) | 24.0 |
Fertility by Education by Marriage Status in The Pinery
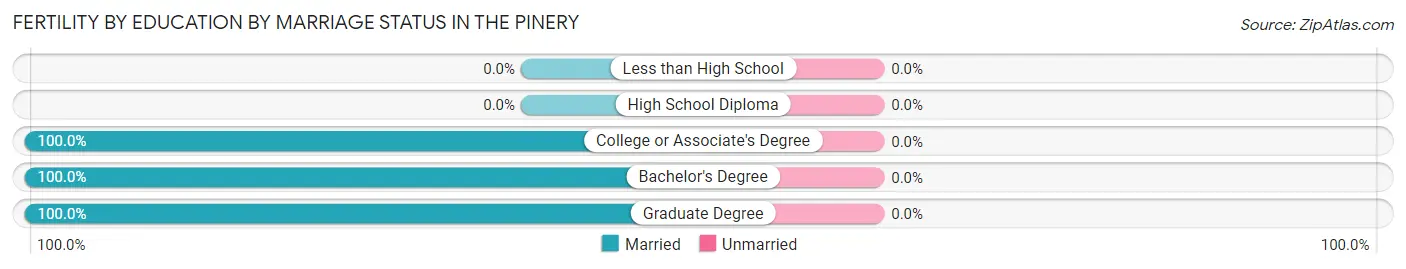
| Educational Attainment | Married | Unmarried |
| Less than High School | 0 (0.0%) | 0 (0.0%) |
| High School Diploma | 0 (0.0%) | 0 (0.0%) |
| College or Associate's Degree | 15 (100.0%) | 0 (0.0%) |
| Bachelor's Degree | 23 (100.0%) | 0 (0.0%) |
| Graduate Degree | 15 (100.0%) | 0 (0.0%) |
| Total | 53 (100.0%) | 0 (0.0%) |
Employment Characteristics in The Pinery
Employment by Class of Employer in The Pinery
Among the 5,424 employed individuals in The Pinery, private company employees (3,528 | 65.0%), not-for-profit organizations (474 | 8.7%), and local government employees (429 | 7.9%) make up the most common classes of employment.
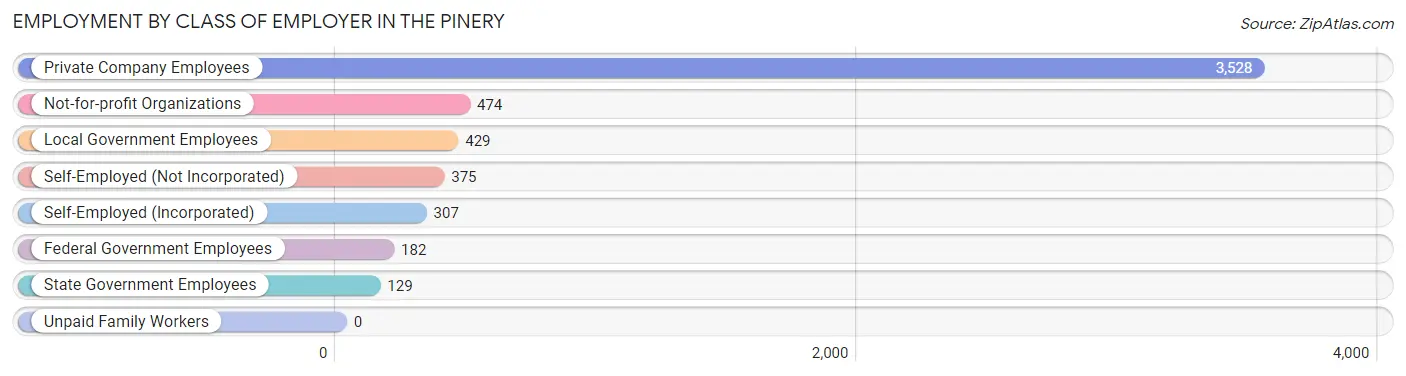
| Employer Class | # Employees | % Employees |
| Private Company Employees | 3,528 | 65.0% |
| Self-Employed (Incorporated) | 307 | 5.7% |
| Self-Employed (Not Incorporated) | 375 | 6.9% |
| Not-for-profit Organizations | 474 | 8.7% |
| Local Government Employees | 429 | 7.9% |
| State Government Employees | 129 | 2.4% |
| Federal Government Employees | 182 | 3.4% |
| Unpaid Family Workers | 0 | 0.0% |
| Total | 5,424 | 100.0% |
Employment Status by Age in The Pinery
According to the labor force statistics for The Pinery, out of the total population over 16 years of age (8,450), 67.6% or 5,712 individuals are in the labor force, with 3.0% or 171 of them unemployed. The age group with the highest labor force participation rate is 35 to 44 years, with 95.6% or 1,385 individuals in the labor force. Within the labor force, the 16 to 19 years age range has the highest percentage of unemployed individuals, with 22.4% or 41 of them being unemployed.
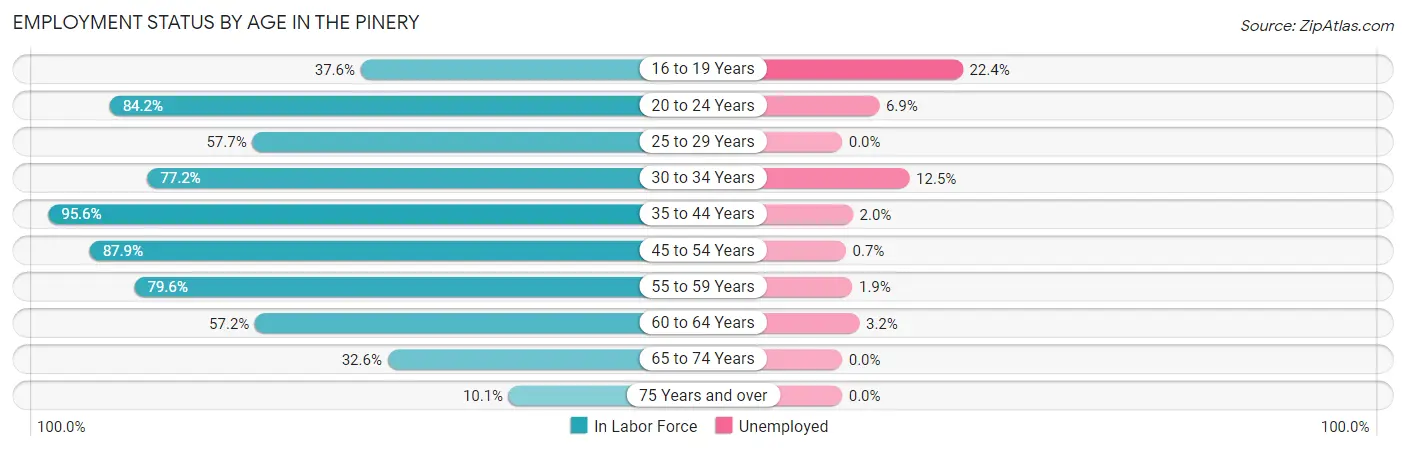
| Age Bracket | In Labor Force | Unemployed |
| 16 to 19 Years | 183 (37.6%) | 41 (22.4%) |
| 20 to 24 Years | 452 (84.2%) | 31 (6.9%) |
| 25 to 29 Years | 154 (57.7%) | 0 (0.0%) |
| 30 to 34 Years | 240 (77.2%) | 30 (12.5%) |
| 35 to 44 Years | 1,385 (95.6%) | 28 (2.0%) |
| 45 to 54 Years | 1,553 (87.9%) | 11 (0.7%) |
| 55 to 59 Years | 833 (79.6%) | 16 (1.9%) |
| 60 to 64 Years | 467 (57.2%) | 15 (3.2%) |
| 65 to 74 Years | 390 (32.6%) | 0 (0.0%) |
| 75 Years and over | 58 (10.1%) | 0 (0.0%) |
| Total | 5,712 (67.6%) | 171 (3.0%) |
Employment Status by Educational Attainment in The Pinery
According to labor force statistics for The Pinery, 81.9% of individuals (4,634) out of the total population between 25 and 64 years of age (5,658) are in the labor force, with 2.1% or 97 of them being unemployed. The group with the highest labor force participation rate are those with the educational attainment of bachelor's degree or higher, with 82.9% or 2,719 individuals in the labor force. Within the labor force, individuals with high school diploma education have the highest percentage of unemployment, with 3.1% or 14 of them being unemployed.
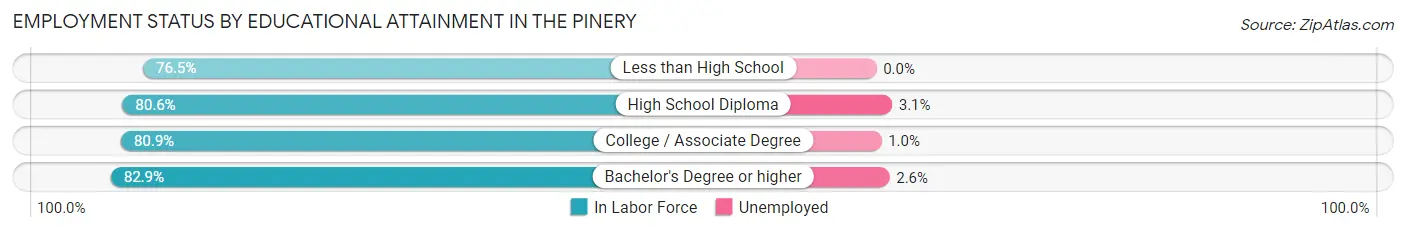
| Educational Attainment | In Labor Force | Unemployed |
| Less than High School | 153 (76.5%) | 0 (0.0%) |
| High School Diploma | 448 (80.6%) | 17 (3.1%) |
| College / Associate Degree | 1,312 (80.9%) | 16 (1.0%) |
| Bachelor's Degree or higher | 2,719 (82.9%) | 85 (2.6%) |
| Total | 4,634 (81.9%) | 119 (2.1%) |
Employment Occupations by Sex in The Pinery
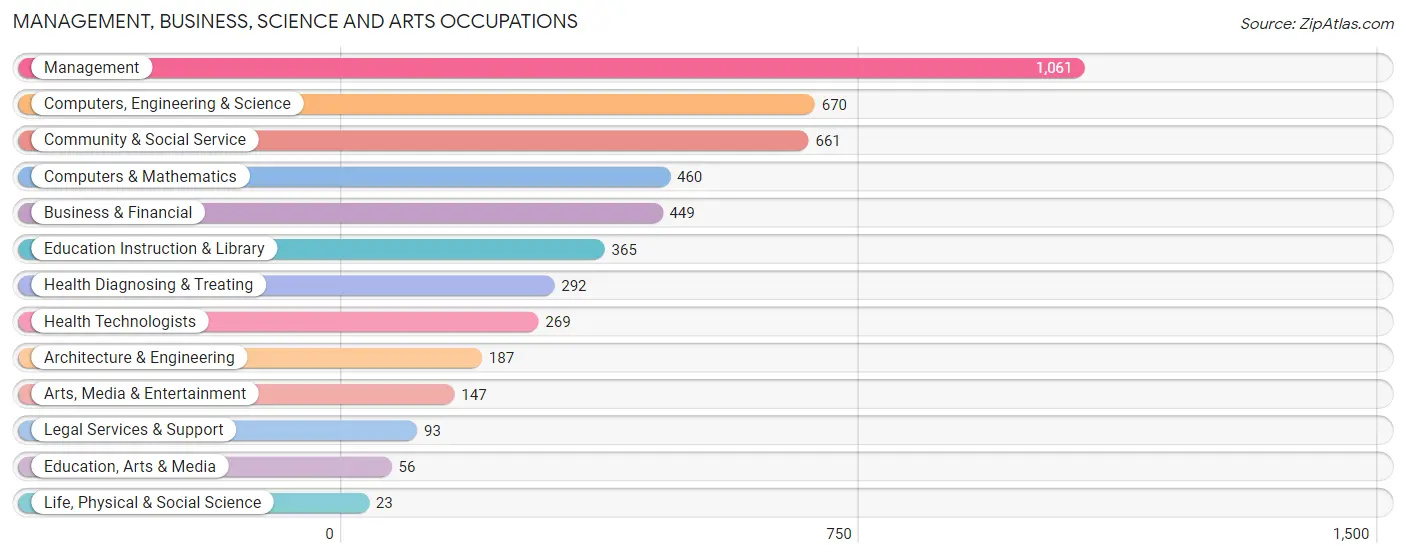
Management, Business, Science and Arts Occupations
The most common Management, Business, Science and Arts occupations in The Pinery are Management (1,061 | 19.4%), Computers, Engineering & Science (670 | 12.2%), Community & Social Service (661 | 12.1%), Computers & Mathematics (460 | 8.4%), and Business & Financial (449 | 8.2%).
Management, Business, Science and Arts Occupations by Sex
Within the Management, Business, Science and Arts occupations in The Pinery, the most male-oriented occupations are Life, Physical & Social Science (100.0%), Computers & Mathematics (83.5%), and Computers, Engineering & Science (81.5%), while the most female-oriented occupations are Education Instruction & Library (95.9%), Health Technologists (83.3%), and Health Diagnosing & Treating (80.5%).
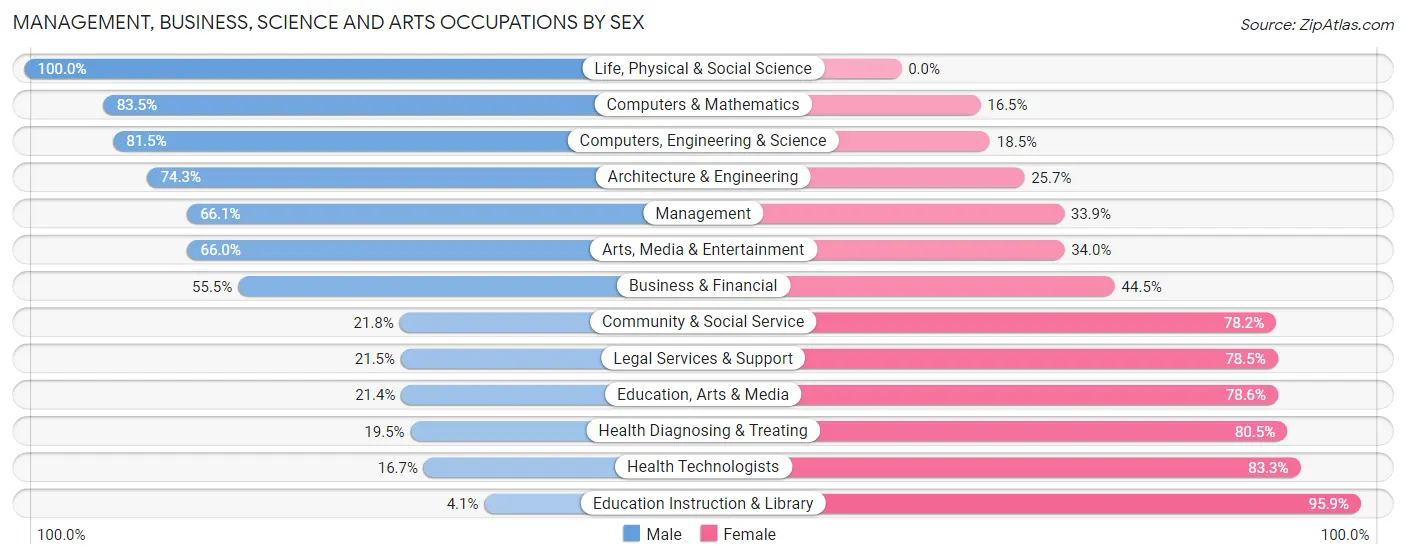
| Occupation | Male | Female |
| Management | 701 (66.1%) | 360 (33.9%) |
| Business & Financial | 249 (55.5%) | 200 (44.5%) |
| Computers, Engineering & Science | 546 (81.5%) | 124 (18.5%) |
| Computers & Mathematics | 384 (83.5%) | 76 (16.5%) |
| Architecture & Engineering | 139 (74.3%) | 48 (25.7%) |
| Life, Physical & Social Science | 23 (100.0%) | 0 (0.0%) |
| Community & Social Service | 144 (21.8%) | 517 (78.2%) |
| Education, Arts & Media | 12 (21.4%) | 44 (78.6%) |
| Legal Services & Support | 20 (21.5%) | 73 (78.5%) |
| Education Instruction & Library | 15 (4.1%) | 350 (95.9%) |
| Arts, Media & Entertainment | 97 (66.0%) | 50 (34.0%) |
| Health Diagnosing & Treating | 57 (19.5%) | 235 (80.5%) |
| Health Technologists | 45 (16.7%) | 224 (83.3%) |
| Total (Category) | 1,697 (54.2%) | 1,436 (45.8%) |
| Total (Overall) | 2,938 (53.7%) | 2,535 (46.3%) |
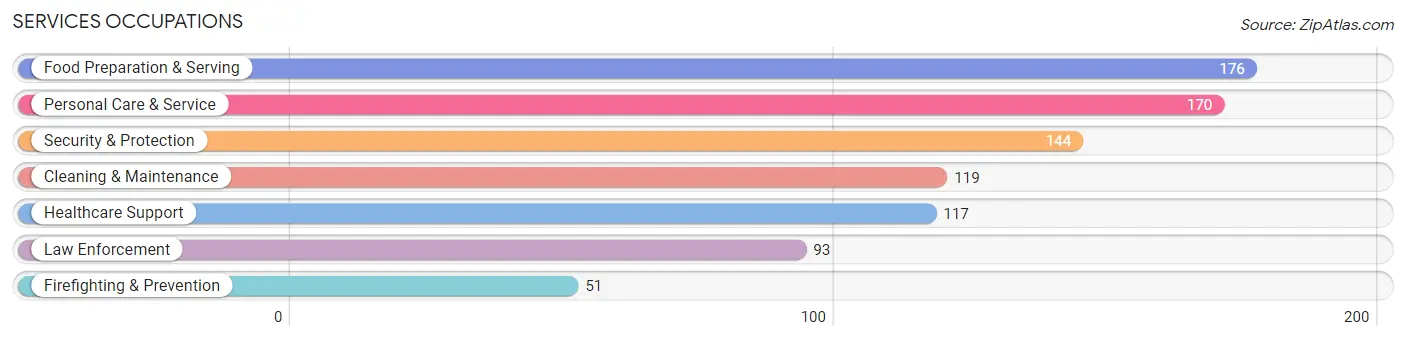
Services Occupations
The most common Services occupations in The Pinery are Food Preparation & Serving (176 | 3.2%), Personal Care & Service (170 | 3.1%), Security & Protection (144 | 2.6%), Cleaning & Maintenance (119 | 2.2%), and Healthcare Support (117 | 2.1%).
Services Occupations by Sex
Within the Services occupations in The Pinery, the most male-oriented occupations are Law Enforcement (100.0%), Security & Protection (93.1%), and Cleaning & Maintenance (85.7%), while the most female-oriented occupations are Healthcare Support (100.0%), Food Preparation & Serving (69.3%), and Personal Care & Service (67.6%).
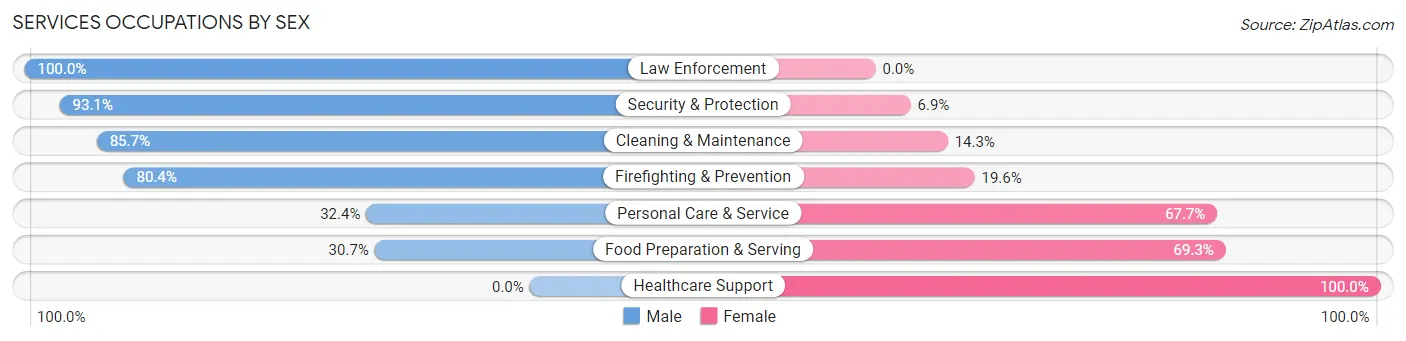
| Occupation | Male | Female |
| Healthcare Support | 0 (0.0%) | 117 (100.0%) |
| Security & Protection | 134 (93.1%) | 10 (6.9%) |
| Firefighting & Prevention | 41 (80.4%) | 10 (19.6%) |
| Law Enforcement | 93 (100.0%) | 0 (0.0%) |
| Food Preparation & Serving | 54 (30.7%) | 122 (69.3%) |
| Cleaning & Maintenance | 102 (85.7%) | 17 (14.3%) |
| Personal Care & Service | 55 (32.4%) | 115 (67.6%) |
| Total (Category) | 345 (47.5%) | 381 (52.5%) |
| Total (Overall) | 2,938 (53.7%) | 2,535 (46.3%) |
Sales and Office Occupations
The most common Sales and Office occupations in The Pinery are Sales & Related (624 | 11.4%), and Office & Administration (467 | 8.5%).

Sales and Office Occupations by Sex
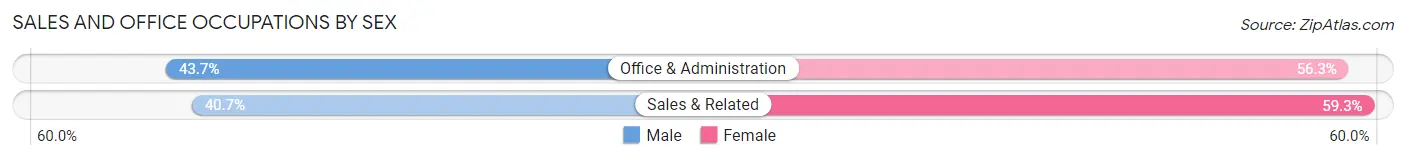
| Occupation | Male | Female |
| Sales & Related | 254 (40.7%) | 370 (59.3%) |
| Office & Administration | 204 (43.7%) | 263 (56.3%) |
| Total (Category) | 458 (42.0%) | 633 (58.0%) |
| Total (Overall) | 2,938 (53.7%) | 2,535 (46.3%) |
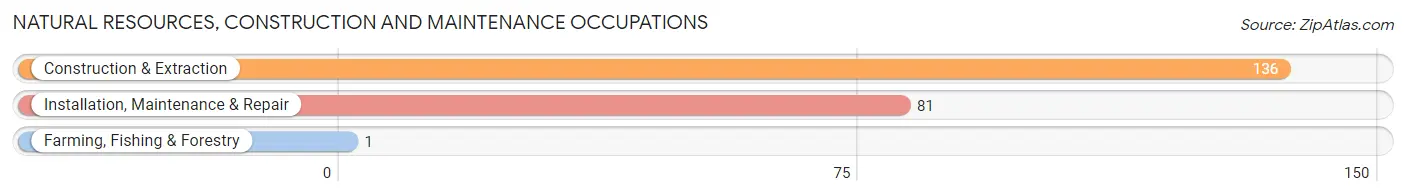
Natural Resources, Construction and Maintenance Occupations
The most common Natural Resources, Construction and Maintenance occupations in The Pinery are Construction & Extraction (136 | 2.5%), Installation, Maintenance & Repair (81 | 1.5%), and Farming, Fishing & Forestry (1 | 0.0%).
Natural Resources, Construction and Maintenance Occupations by Sex
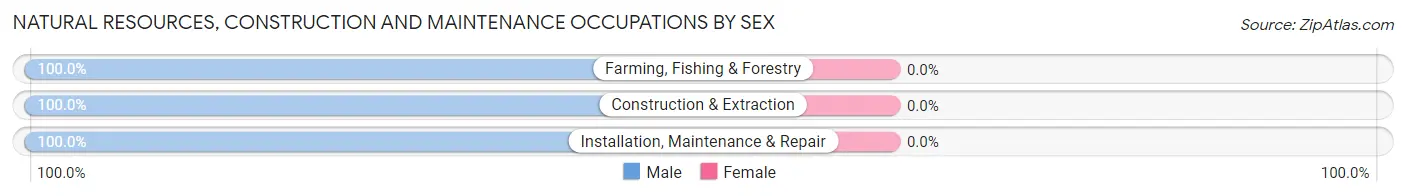
| Occupation | Male | Female |
| Farming, Fishing & Forestry | 1 (100.0%) | 0 (0.0%) |
| Construction & Extraction | 136 (100.0%) | 0 (0.0%) |
| Installation, Maintenance & Repair | 81 (100.0%) | 0 (0.0%) |
| Total (Category) | 218 (100.0%) | 0 (0.0%) |
| Total (Overall) | 2,938 (53.7%) | 2,535 (46.3%) |
Production, Transportation and Moving Occupations
The most common Production, Transportation and Moving occupations in The Pinery are Transportation (144 | 2.6%), Material Moving (116 | 2.1%), and Production (45 | 0.8%).
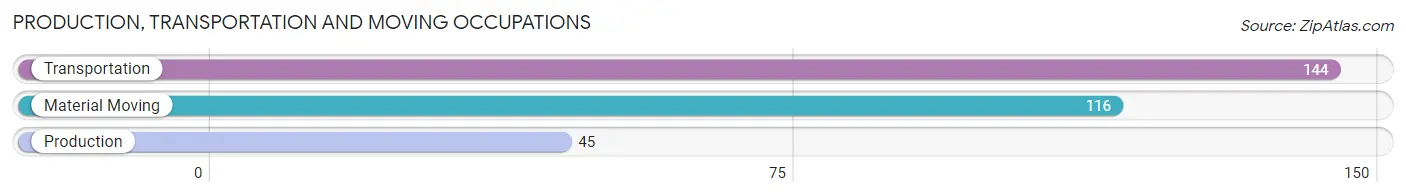
Production, Transportation and Moving Occupations by Sex
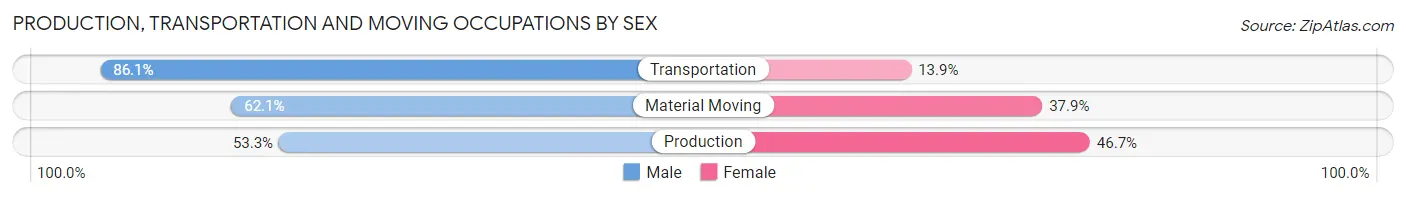
| Occupation | Male | Female |
| Production | 24 (53.3%) | 21 (46.7%) |
| Transportation | 124 (86.1%) | 20 (13.9%) |
| Material Moving | 72 (62.1%) | 44 (37.9%) |
| Total (Category) | 220 (72.1%) | 85 (27.9%) |
| Total (Overall) | 2,938 (53.7%) | 2,535 (46.3%) |
Employment Industries by Sex in The Pinery
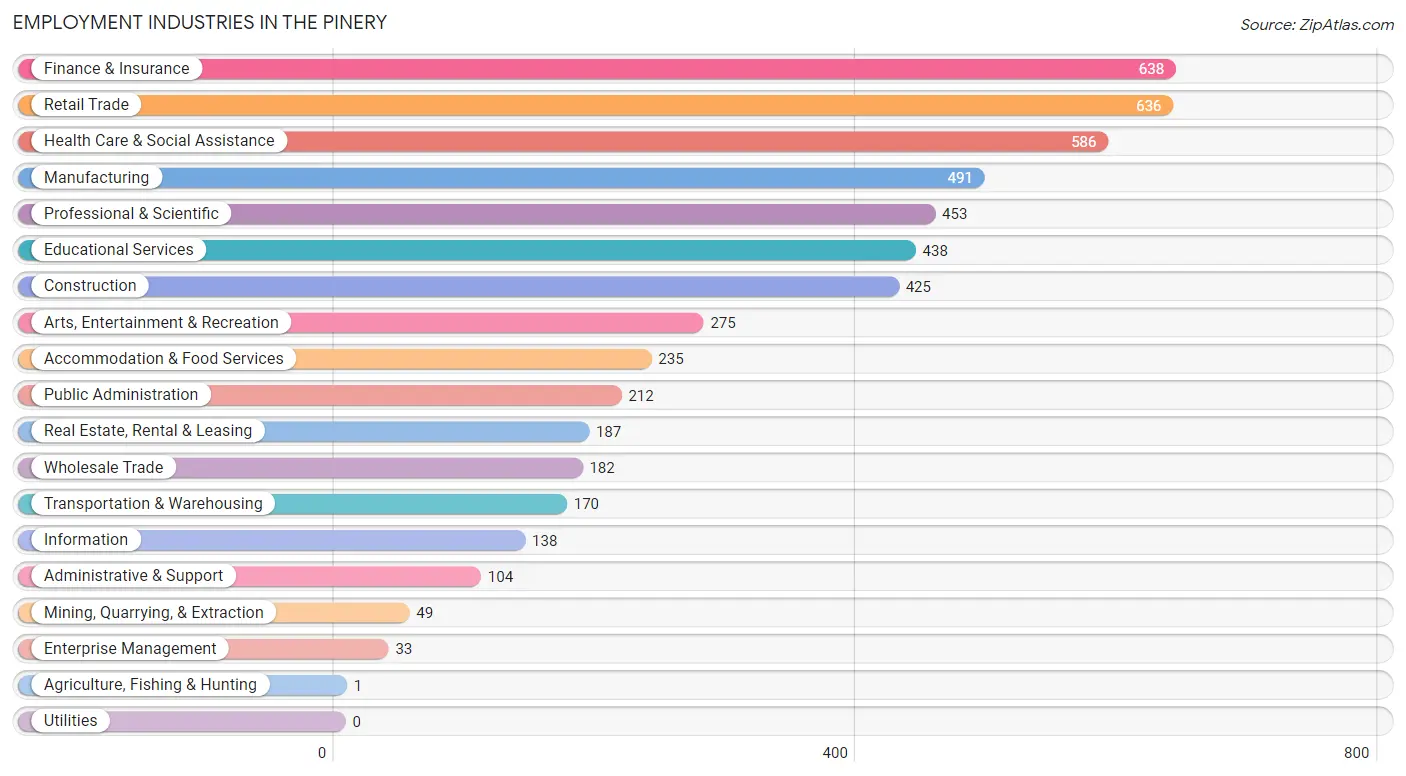
Employment Industries in The Pinery
The major employment industries in The Pinery include Finance & Insurance (638 | 11.7%), Retail Trade (636 | 11.6%), Health Care & Social Assistance (586 | 10.7%), Manufacturing (491 | 9.0%), and Professional & Scientific (453 | 8.3%).
Employment Industries by Sex in The Pinery
The The Pinery industries that see more men than women are Agriculture, Fishing & Hunting (100.0%), Enterprise Management (100.0%), and Real Estate, Rental & Leasing (98.9%), whereas the industries that tend to have a higher number of women are Health Care & Social Assistance (84.6%), Educational Services (81.5%), and Retail Trade (73.9%).
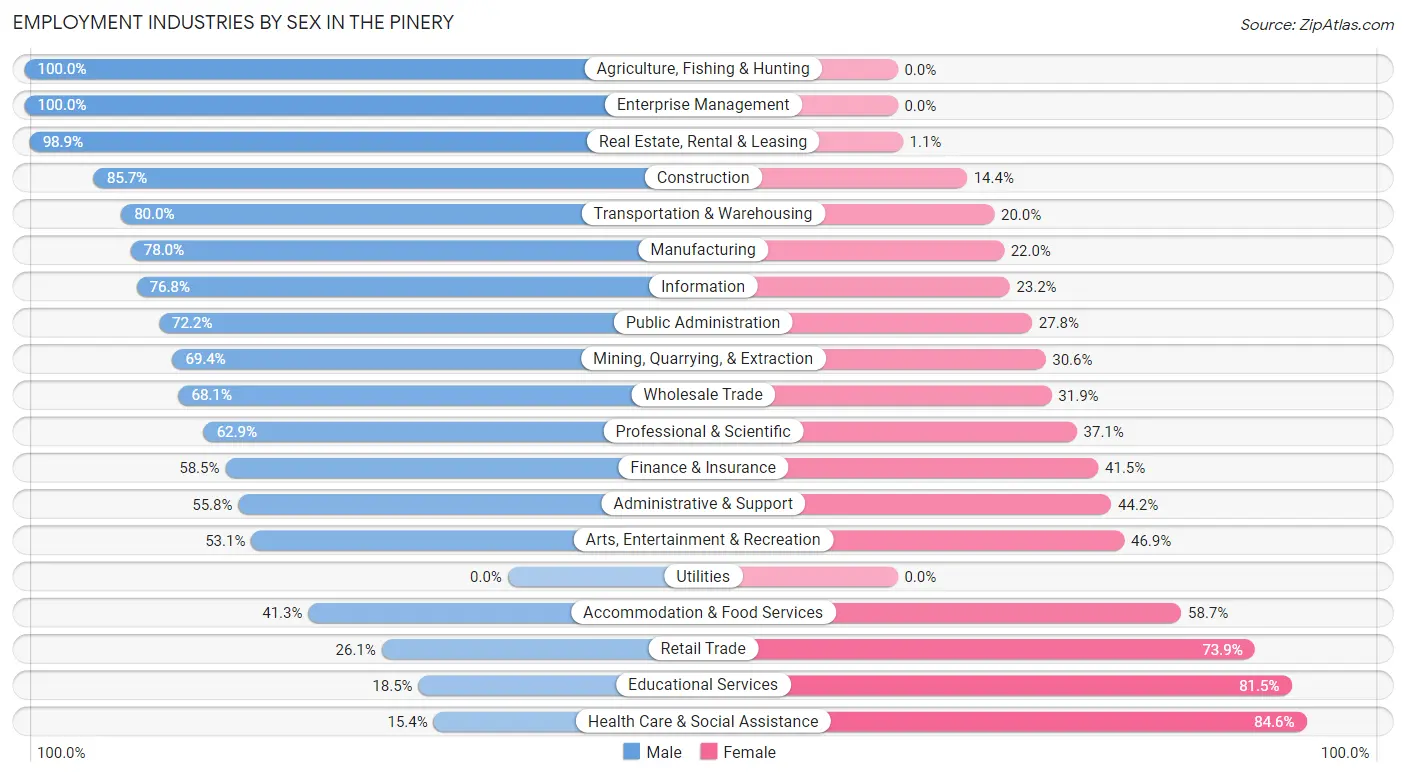
| Industry | Male | Female |
| Agriculture, Fishing & Hunting | 1 (100.0%) | 0 (0.0%) |
| Mining, Quarrying, & Extraction | 34 (69.4%) | 15 (30.6%) |
| Construction | 364 (85.7%) | 61 (14.3%) |
| Manufacturing | 383 (78.0%) | 108 (22.0%) |
| Wholesale Trade | 124 (68.1%) | 58 (31.9%) |
| Retail Trade | 166 (26.1%) | 470 (73.9%) |
| Transportation & Warehousing | 136 (80.0%) | 34 (20.0%) |
| Utilities | 0 (0.0%) | 0 (0.0%) |
| Information | 106 (76.8%) | 32 (23.2%) |
| Finance & Insurance | 373 (58.5%) | 265 (41.5%) |
| Real Estate, Rental & Leasing | 185 (98.9%) | 2 (1.1%) |
| Professional & Scientific | 285 (62.9%) | 168 (37.1%) |
| Enterprise Management | 33 (100.0%) | 0 (0.0%) |
| Administrative & Support | 58 (55.8%) | 46 (44.2%) |
| Educational Services | 81 (18.5%) | 357 (81.5%) |
| Health Care & Social Assistance | 90 (15.4%) | 496 (84.6%) |
| Arts, Entertainment & Recreation | 146 (53.1%) | 129 (46.9%) |
| Accommodation & Food Services | 97 (41.3%) | 138 (58.7%) |
| Public Administration | 153 (72.2%) | 59 (27.8%) |
| Total | 2,938 (53.7%) | 2,535 (46.3%) |
Education in The Pinery
School Enrollment in The Pinery
The most common levels of schooling among the 2,759 students in The Pinery are high school (651 | 23.6%), middle school (614 | 22.3%), and elementary school (578 | 20.9%).
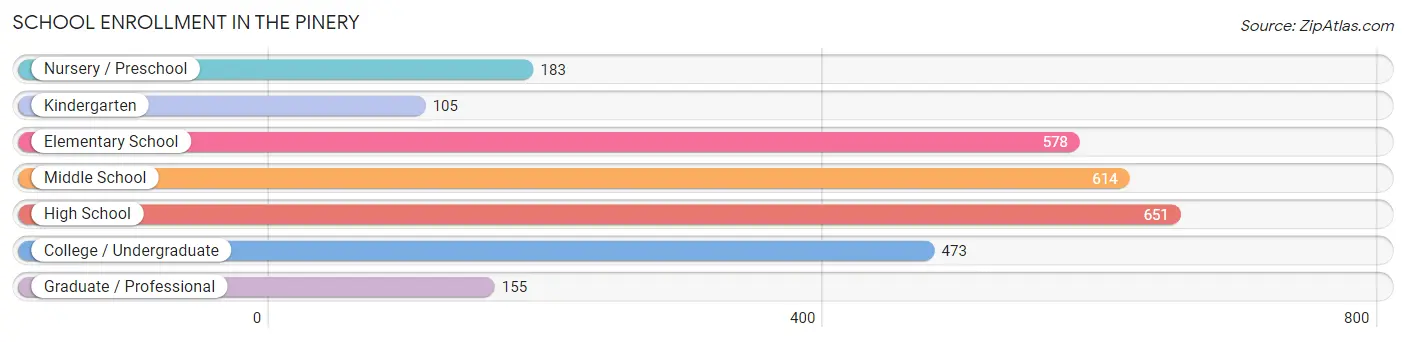
| School Level | # Students | % Students |
| Nursery / Preschool | 183 | 6.6% |
| Kindergarten | 105 | 3.8% |
| Elementary School | 578 | 20.9% |
| Middle School | 614 | 22.3% |
| High School | 651 | 23.6% |
| College / Undergraduate | 473 | 17.1% |
| Graduate / Professional | 155 | 5.6% |
| Total | 2,759 | 100.0% |
School Enrollment by Age by Funding Source in The Pinery
Out of a total of 2,759 students who are enrolled in schools in The Pinery, 461 (16.7%) attend a private institution, while the remaining 2,298 (83.3%) are enrolled in public schools. The age group of 25 to 34 year olds has the highest likelihood of being enrolled in private schools, with 24 (64.9% in the age bracket) enrolled. Conversely, the age group of 10 to 14 year olds has the lowest likelihood of being enrolled in a private school, with 692 (91.3% in the age bracket) attending a public institution.
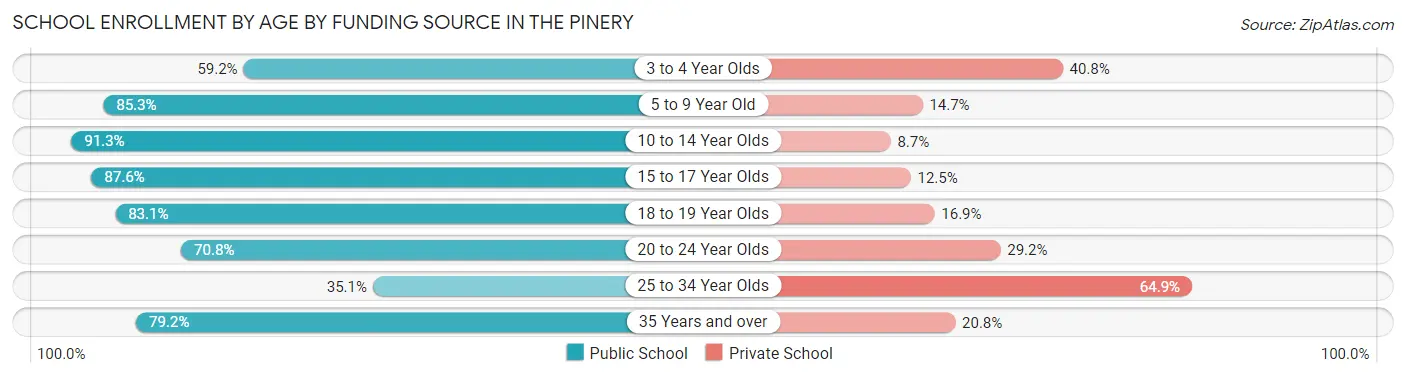
| Age Bracket | Public School | Private School |
| 3 to 4 Year Olds | 93 (59.2%) | 64 (40.8%) |
| 5 to 9 Year Old | 564 (85.3%) | 97 (14.7%) |
| 10 to 14 Year Olds | 692 (91.3%) | 66 (8.7%) |
| 15 to 17 Year Olds | 457 (87.5%) | 65 (12.4%) |
| 18 to 19 Year Olds | 123 (83.1%) | 25 (16.9%) |
| 20 to 24 Year Olds | 170 (70.8%) | 70 (29.2%) |
| 25 to 34 Year Olds | 13 (35.1%) | 24 (64.9%) |
| 35 Years and over | 187 (79.2%) | 49 (20.8%) |
| Total | 2,298 (83.3%) | 461 (16.7%) |
Educational Attainment by Field of Study in The Pinery
Business (1,115 | 23.6%), education (497 | 10.5%), bio, nature & agricultural (423 | 9.0%), social sciences (393 | 8.3%), and science & technology (365 | 7.7%) are the most common fields of study among 4,716 individuals in The Pinery who have obtained a bachelor's degree or higher.
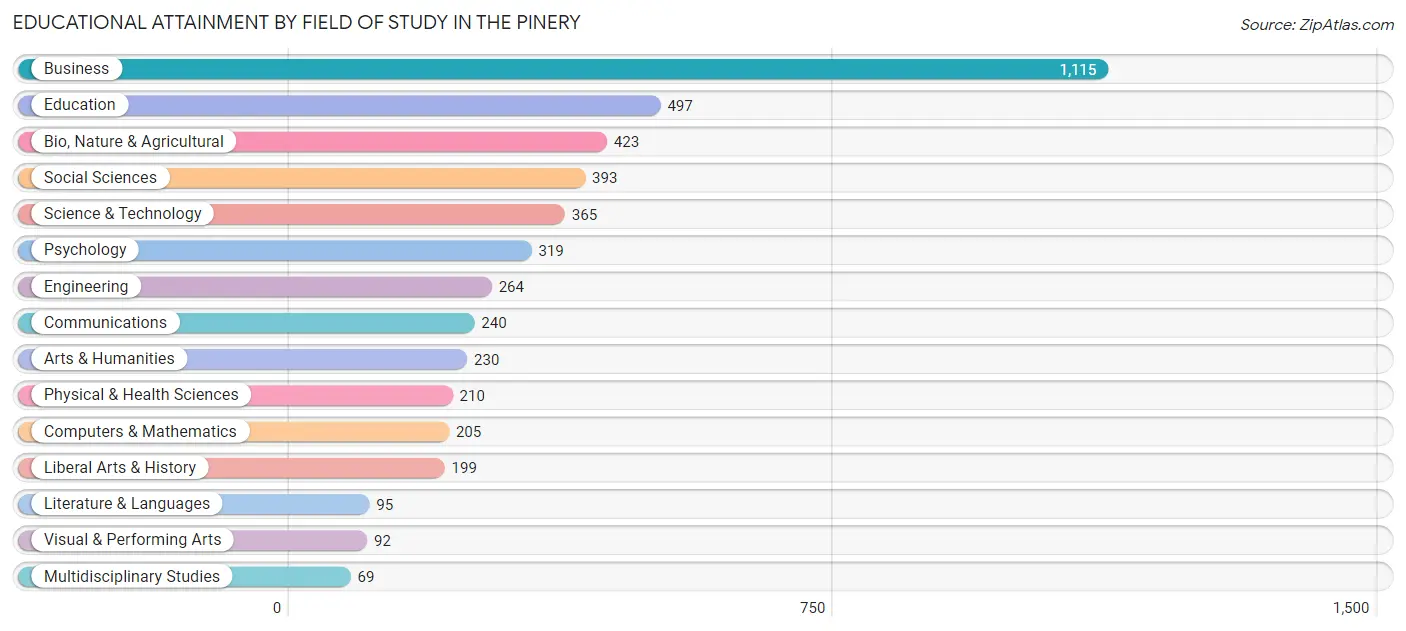
| Field of Study | # Graduates | % Graduates |
| Computers & Mathematics | 205 | 4.3% |
| Bio, Nature & Agricultural | 423 | 9.0% |
| Physical & Health Sciences | 210 | 4.4% |
| Psychology | 319 | 6.8% |
| Social Sciences | 393 | 8.3% |
| Engineering | 264 | 5.6% |
| Multidisciplinary Studies | 69 | 1.5% |
| Science & Technology | 365 | 7.7% |
| Business | 1,115 | 23.6% |
| Education | 497 | 10.5% |
| Literature & Languages | 95 | 2.0% |
| Liberal Arts & History | 199 | 4.2% |
| Visual & Performing Arts | 92 | 1.9% |
| Communications | 240 | 5.1% |
| Arts & Humanities | 230 | 4.9% |
| Total | 4,716 | 100.0% |
Transportation & Commute in The Pinery
Vehicle Availability by Sex in The Pinery
The most prevalent vehicle ownership categories in The Pinery are males with 2 vehicles (1,143, accounting for 39.1%) and females with 2 vehicles (815, making up 45.8%).
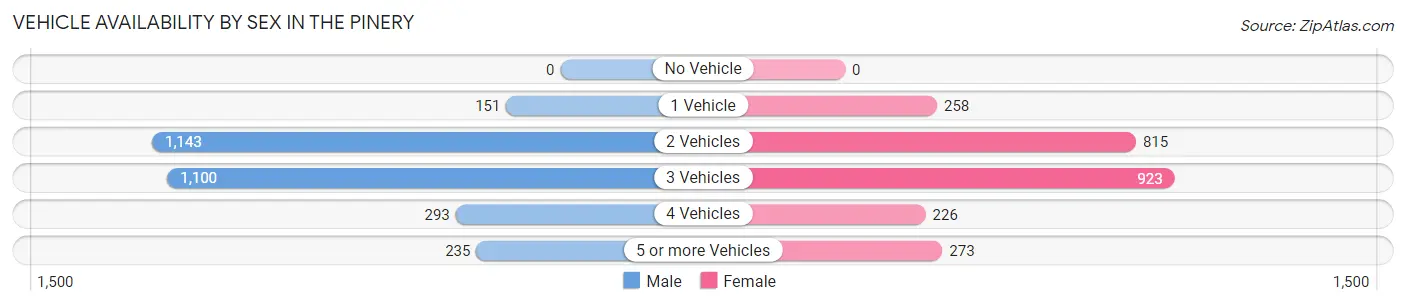
| Vehicles Available | Male | Female |
| No Vehicle | 0 (0.0%) | 0 (0.0%) |
| 1 Vehicle | 151 (5.2%) | 258 (10.3%) |
| 2 Vehicles | 1,143 (39.1%) | 815 (32.7%) |
| 3 Vehicles | 1,100 (37.7%) | 923 (37.0%) |
| 4 Vehicles | 293 (10.0%) | 226 (9.1%) |
| 5 or more Vehicles | 235 (8.0%) | 273 (10.9%) |
| Total | 2,922 (100.0%) | 2,495 (100.0%) |
Commute Time in The Pinery
The most frequently occuring commute durations in The Pinery are 30 to 34 minutes (651 commuters, 16.4%), 45 to 59 minutes (606 commuters, 15.2%), and 20 to 24 minutes (512 commuters, 12.9%).
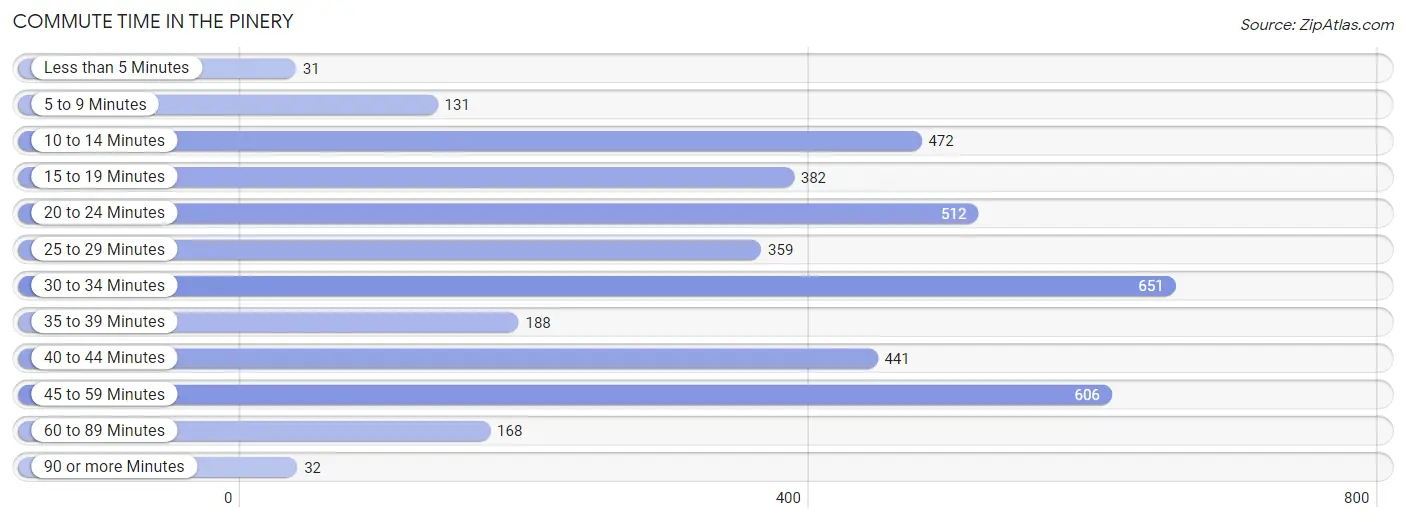
| Commute Time | # Commuters | % Commuters |
| Less than 5 Minutes | 31 | 0.8% |
| 5 to 9 Minutes | 131 | 3.3% |
| 10 to 14 Minutes | 472 | 11.9% |
| 15 to 19 Minutes | 382 | 9.6% |
| 20 to 24 Minutes | 512 | 12.9% |
| 25 to 29 Minutes | 359 | 9.0% |
| 30 to 34 Minutes | 651 | 16.4% |
| 35 to 39 Minutes | 188 | 4.7% |
| 40 to 44 Minutes | 441 | 11.1% |
| 45 to 59 Minutes | 606 | 15.2% |
| 60 to 89 Minutes | 168 | 4.2% |
| 90 or more Minutes | 32 | 0.8% |
Commute Time by Sex in The Pinery
The most common commute times in The Pinery are 40 to 44 minutes (378 commuters, 18.4%) for males and 30 to 34 minutes (349 commuters, 18.2%) for females.
| Commute Time | Male | Female |
| Less than 5 Minutes | 29 (1.4%) | 2 (0.1%) |
| 5 to 9 Minutes | 30 (1.5%) | 101 (5.3%) |
| 10 to 14 Minutes | 162 (7.9%) | 310 (16.2%) |
| 15 to 19 Minutes | 130 (6.3%) | 252 (13.2%) |
| 20 to 24 Minutes | 190 (9.2%) | 322 (16.8%) |
| 25 to 29 Minutes | 243 (11.8%) | 116 (6.1%) |
| 30 to 34 Minutes | 302 (14.7%) | 349 (18.2%) |
| 35 to 39 Minutes | 85 (4.1%) | 103 (5.4%) |
| 40 to 44 Minutes | 378 (18.4%) | 63 (3.3%) |
| 45 to 59 Minutes | 371 (18.0%) | 235 (12.3%) |
| 60 to 89 Minutes | 118 (5.7%) | 50 (2.6%) |
| 90 or more Minutes | 20 (1.0%) | 12 (0.6%) |
Time of Departure to Work by Sex in The Pinery
The most frequent times of departure to work in The Pinery are 6:30 AM to 6:59 AM (339, 16.5%) for males and 7:00 AM to 7:29 AM (393, 20.5%) for females.
| Time of Departure | Male | Female |
| 12:00 AM to 4:59 AM | 152 (7.4%) | 78 (4.1%) |
| 5:00 AM to 5:29 AM | 137 (6.7%) | 44 (2.3%) |
| 5:30 AM to 5:59 AM | 155 (7.5%) | 130 (6.8%) |
| 6:00 AM to 6:29 AM | 192 (9.3%) | 136 (7.1%) |
| 6:30 AM to 6:59 AM | 339 (16.5%) | 147 (7.7%) |
| 7:00 AM to 7:29 AM | 277 (13.5%) | 393 (20.5%) |
| 7:30 AM to 7:59 AM | 217 (10.5%) | 199 (10.4%) |
| 8:00 AM to 8:29 AM | 269 (13.1%) | 344 (18.0%) |
| 8:30 AM to 8:59 AM | 60 (2.9%) | 29 (1.5%) |
| 9:00 AM to 9:59 AM | 111 (5.4%) | 163 (8.5%) |
| 10:00 AM to 10:59 AM | 0 (0.0%) | 44 (2.3%) |
| 11:00 AM to 11:59 AM | 37 (1.8%) | 61 (3.2%) |
| 12:00 PM to 3:59 PM | 100 (4.9%) | 64 (3.3%) |
| 4:00 PM to 11:59 PM | 12 (0.6%) | 83 (4.3%) |
| Total | 2,058 (100.0%) | 1,915 (100.0%) |
Housing Occupancy in The Pinery
Occupancy by Ownership in The Pinery
Of the total 3,669 dwellings in The Pinery, owner-occupied units account for 3,452 (94.1%), while renter-occupied units make up 217 (5.9%).
| Occupancy | # Housing Units | % Housing Units |
| Owner Occupied Housing Units | 3,452 | 94.1% |
| Renter-Occupied Housing Units | 217 | 5.9% |
| Total Occupied Housing Units | 3,669 | 100.0% |
Occupancy by Household Size in The Pinery
| Household Size | # Housing Units | % Housing Units |
| 1-Person Household | 314 | 8.6% |
| 2-Person Household | 1,669 | 45.5% |
| 3-Person Household | 560 | 15.3% |
| 4+ Person Household | 1,126 | 30.7% |
| Total Housing Units | 3,669 | 100.0% |
Occupancy by Ownership by Household Size in The Pinery
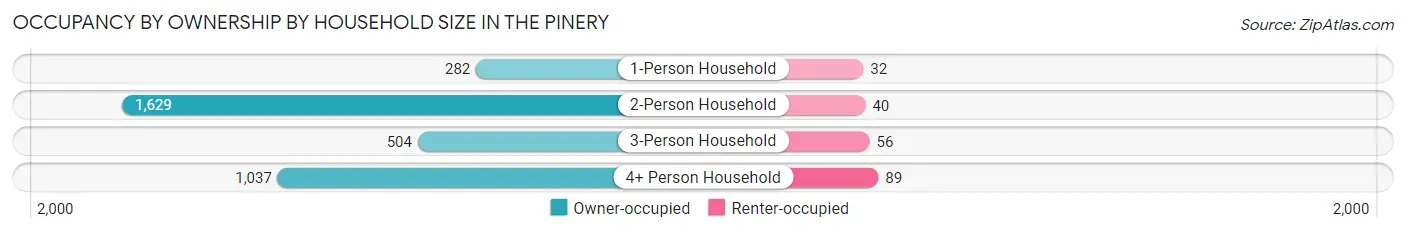
| Household Size | Owner-occupied | Renter-occupied |
| 1-Person Household | 282 (89.8%) | 32 (10.2%) |
| 2-Person Household | 1,629 (97.6%) | 40 (2.4%) |
| 3-Person Household | 504 (90.0%) | 56 (10.0%) |
| 4+ Person Household | 1,037 (92.1%) | 89 (7.9%) |
| Total Housing Units | 3,452 (94.1%) | 217 (5.9%) |
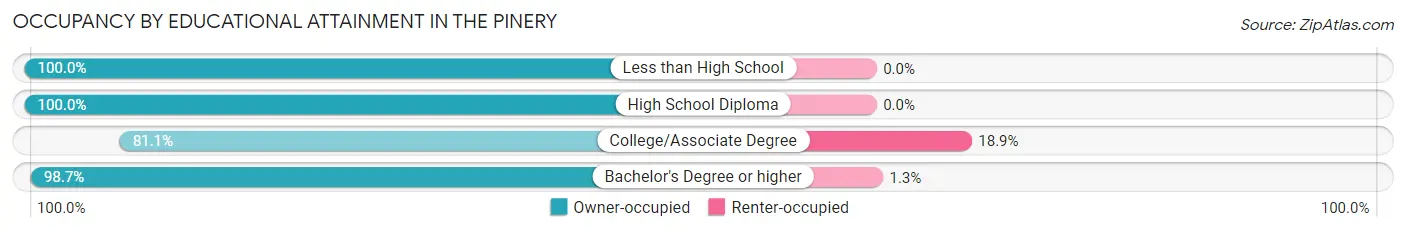
Occupancy by Educational Attainment in The Pinery
| Household Size | Owner-occupied | Renter-occupied |
| Less than High School | 40 (100.0%) | 0 (0.0%) |
| High School Diploma | 249 (100.0%) | 0 (0.0%) |
| College/Associate Degree | 804 (81.1%) | 187 (18.9%) |
| Bachelor's Degree or higher | 2,359 (98.7%) | 30 (1.3%) |
Occupancy by Age of Householder in The Pinery
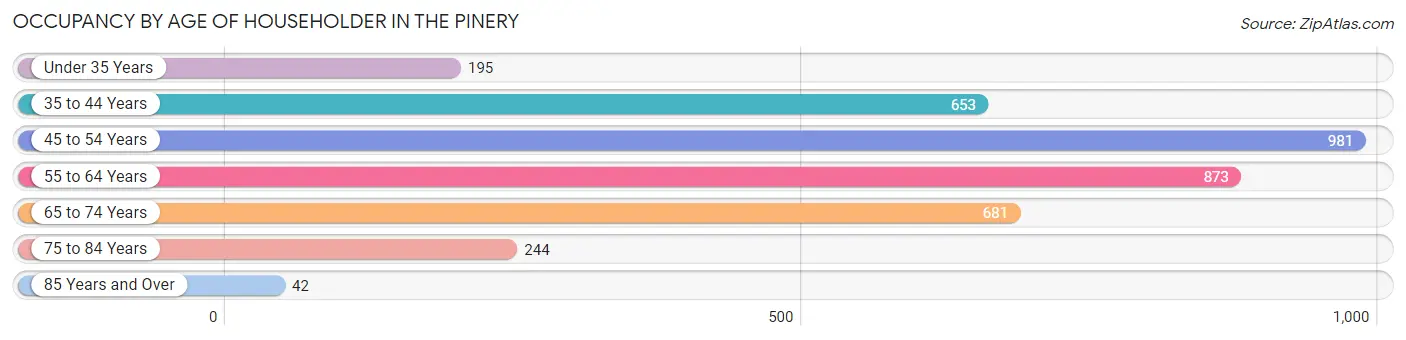
| Age Bracket | # Households | % Households |
| Under 35 Years | 195 | 5.3% |
| 35 to 44 Years | 653 | 17.8% |
| 45 to 54 Years | 981 | 26.7% |
| 55 to 64 Years | 873 | 23.8% |
| 65 to 74 Years | 681 | 18.6% |
| 75 to 84 Years | 244 | 6.7% |
| 85 Years and Over | 42 | 1.1% |
| Total | 3,669 | 100.0% |
Housing Finances in The Pinery
Median Income by Occupancy in The Pinery
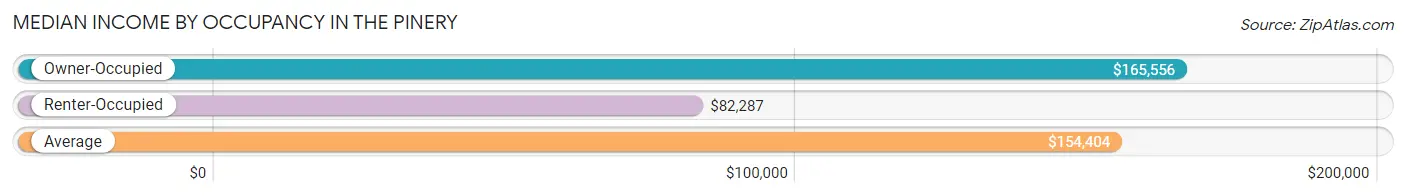
| Occupancy Type | # Households | Median Income |
| Owner-Occupied | 3,452 (94.1%) | $165,556 |
| Renter-Occupied | 217 (5.9%) | $82,287 |
| Average | 3,669 (100.0%) | $154,404 |
Occupancy by Householder Income Bracket in The Pinery
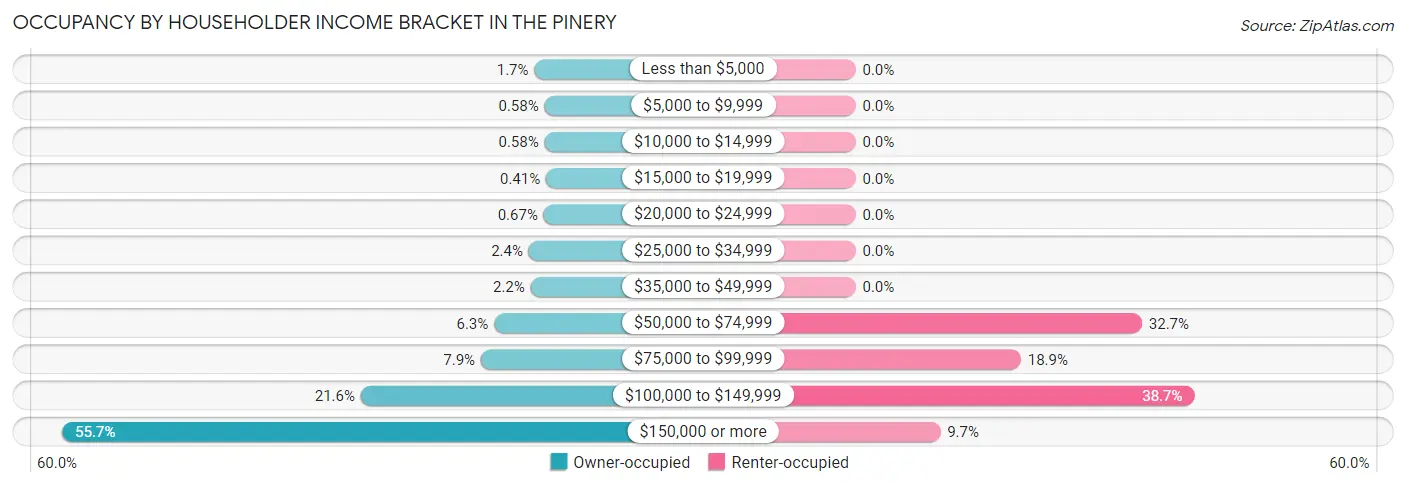
| Income Bracket | Owner-occupied | Renter-occupied |
| Less than $5,000 | 60 (1.7%) | 0 (0.0%) |
| $5,000 to $9,999 | 20 (0.6%) | 0 (0.0%) |
| $10,000 to $14,999 | 20 (0.6%) | 0 (0.0%) |
| $15,000 to $19,999 | 14 (0.4%) | 0 (0.0%) |
| $20,000 to $24,999 | 23 (0.7%) | 0 (0.0%) |
| $25,000 to $34,999 | 82 (2.4%) | 0 (0.0%) |
| $35,000 to $49,999 | 75 (2.2%) | 0 (0.0%) |
| $50,000 to $74,999 | 219 (6.3%) | 71 (32.7%) |
| $75,000 to $99,999 | 271 (7.9%) | 41 (18.9%) |
| $100,000 to $149,999 | 745 (21.6%) | 84 (38.7%) |
| $150,000 or more | 1,923 (55.7%) | 21 (9.7%) |
| Total | 3,452 (100.0%) | 217 (100.0%) |
Monthly Housing Cost Tiers in The Pinery
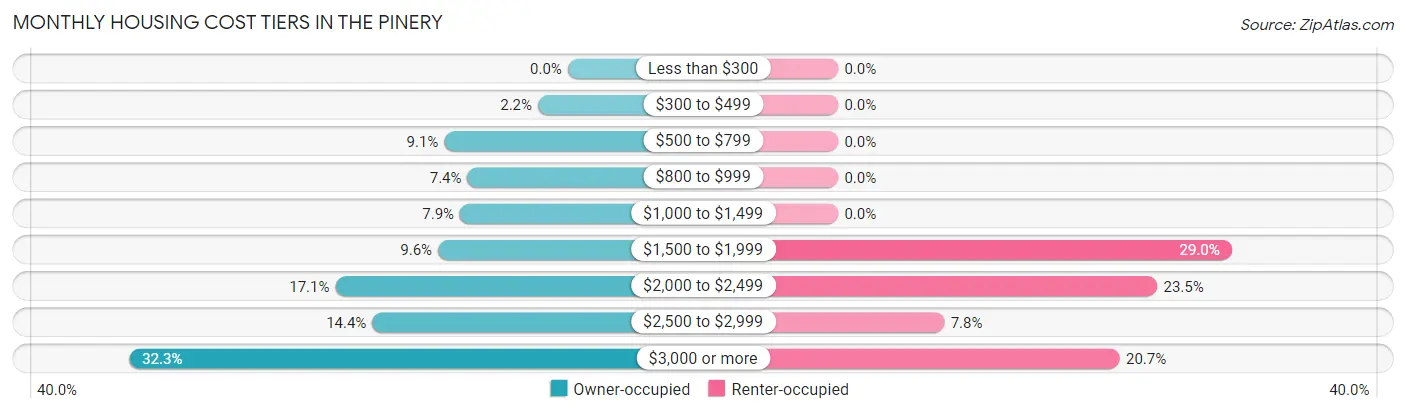
| Monthly Cost | Owner-occupied | Renter-occupied |
| Less than $300 | 0 (0.0%) | 0 (0.0%) |
| $300 to $499 | 76 (2.2%) | 0 (0.0%) |
| $500 to $799 | 314 (9.1%) | 0 (0.0%) |
| $800 to $999 | 255 (7.4%) | 0 (0.0%) |
| $1,000 to $1,499 | 274 (7.9%) | 0 (0.0%) |
| $1,500 to $1,999 | 330 (9.6%) | 63 (29.0%) |
| $2,000 to $2,499 | 591 (17.1%) | 51 (23.5%) |
| $2,500 to $2,999 | 497 (14.4%) | 17 (7.8%) |
| $3,000 or more | 1,115 (32.3%) | 45 (20.7%) |
| Total | 3,452 (100.0%) | 217 (100.0%) |
Physical Housing Characteristics in The Pinery
Housing Structures in The Pinery
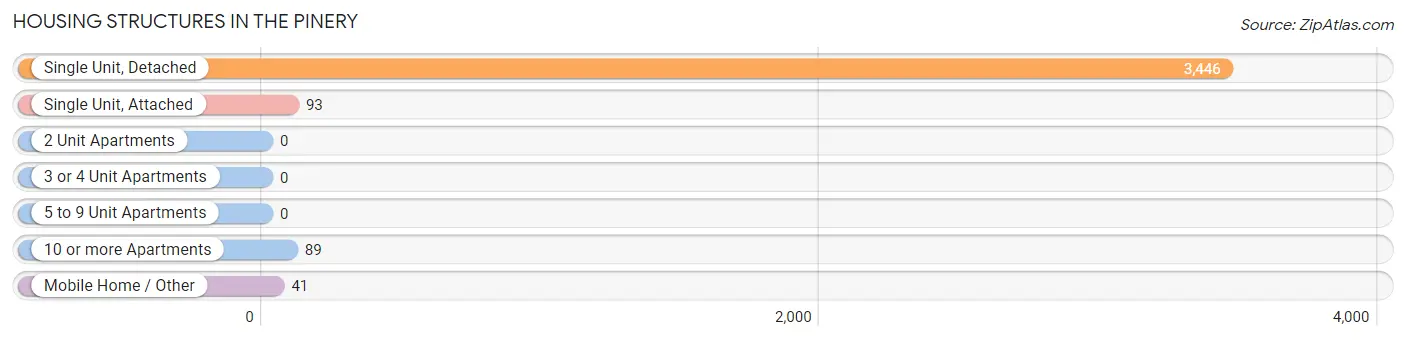
| Structure Type | # Housing Units | % Housing Units |
| Single Unit, Detached | 3,446 | 93.9% |
| Single Unit, Attached | 93 | 2.5% |
| 2 Unit Apartments | 0 | 0.0% |
| 3 or 4 Unit Apartments | 0 | 0.0% |
| 5 to 9 Unit Apartments | 0 | 0.0% |
| 10 or more Apartments | 89 | 2.4% |
| Mobile Home / Other | 41 | 1.1% |
| Total | 3,669 | 100.0% |
Housing Structures by Occupancy in The Pinery
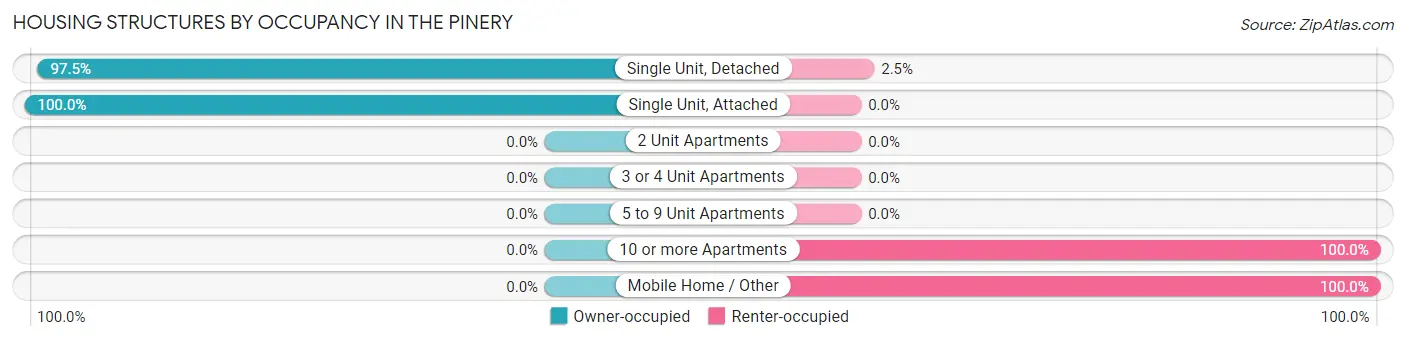
| Structure Type | Owner-occupied | Renter-occupied |
| Single Unit, Detached | 3,359 (97.5%) | 87 (2.5%) |
| Single Unit, Attached | 93 (100.0%) | 0 (0.0%) |
| 2 Unit Apartments | 0 (0.0%) | 0 (0.0%) |
| 3 or 4 Unit Apartments | 0 (0.0%) | 0 (0.0%) |
| 5 to 9 Unit Apartments | 0 (0.0%) | 0 (0.0%) |
| 10 or more Apartments | 0 (0.0%) | 89 (100.0%) |
| Mobile Home / Other | 0 (0.0%) | 41 (100.0%) |
| Total | 3,452 (94.1%) | 217 (5.9%) |
Housing Structures by Number of Rooms in The Pinery
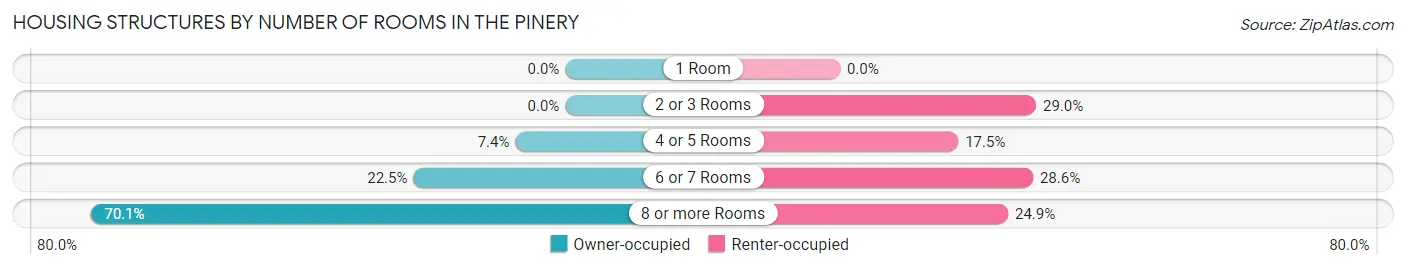
| Number of Rooms | Owner-occupied | Renter-occupied |
| 1 Room | 0 (0.0%) | 0 (0.0%) |
| 2 or 3 Rooms | 0 (0.0%) | 63 (29.0%) |
| 4 or 5 Rooms | 255 (7.4%) | 38 (17.5%) |
| 6 or 7 Rooms | 776 (22.5%) | 62 (28.6%) |
| 8 or more Rooms | 2,421 (70.1%) | 54 (24.9%) |
| Total | 3,452 (100.0%) | 217 (100.0%) |
Housing Structure by Heating Type in The Pinery
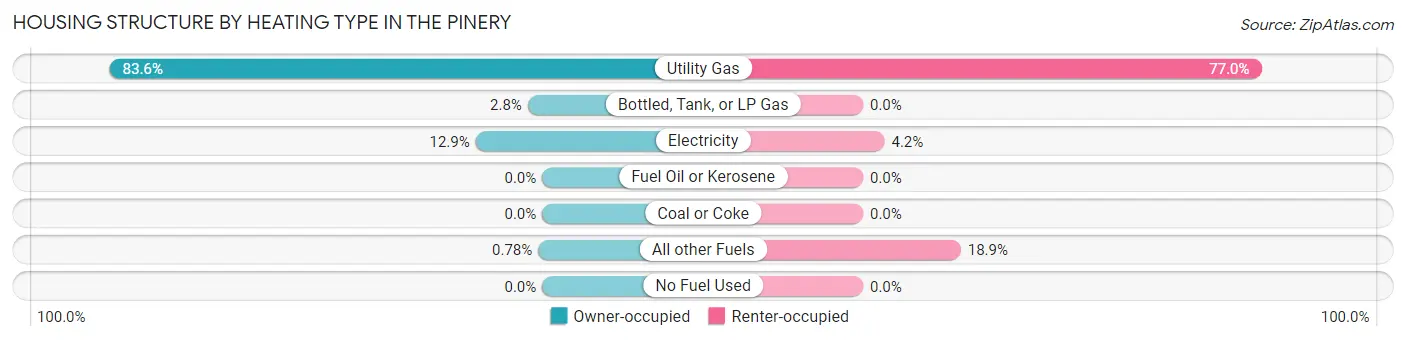
| Heating Type | Owner-occupied | Renter-occupied |
| Utility Gas | 2,885 (83.6%) | 167 (77.0%) |
| Bottled, Tank, or LP Gas | 96 (2.8%) | 0 (0.0%) |
| Electricity | 444 (12.9%) | 9 (4.2%) |
| Fuel Oil or Kerosene | 0 (0.0%) | 0 (0.0%) |
| Coal or Coke | 0 (0.0%) | 0 (0.0%) |
| All other Fuels | 27 (0.8%) | 41 (18.9%) |
| No Fuel Used | 0 (0.0%) | 0 (0.0%) |
| Total | 3,452 (100.0%) | 217 (100.0%) |
Household Vehicle Usage in The Pinery
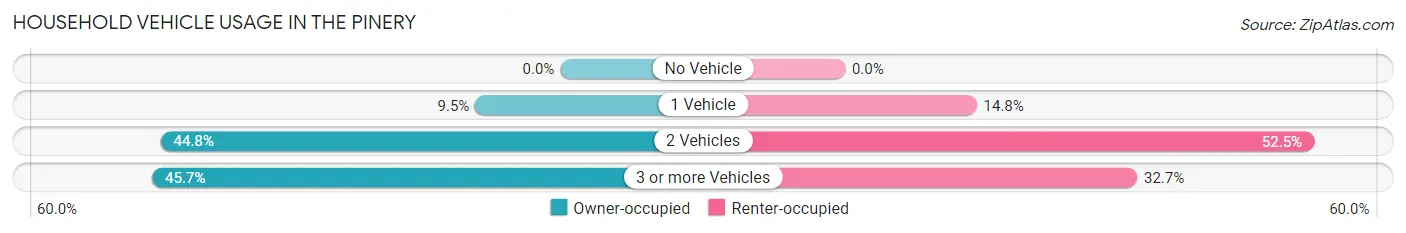
| Vehicles per Household | Owner-occupied | Renter-occupied |
| No Vehicle | 0 (0.0%) | 0 (0.0%) |
| 1 Vehicle | 329 (9.5%) | 32 (14.7%) |
| 2 Vehicles | 1,545 (44.8%) | 114 (52.5%) |
| 3 or more Vehicles | 1,578 (45.7%) | 71 (32.7%) |
| Total | 3,452 (100.0%) | 217 (100.0%) |
Real Estate & Mortgages in The Pinery
Real Estate and Mortgage Overview in The Pinery
| Characteristic | Without Mortgage | With Mortgage |
| Housing Units | 773 | 2,679 |
| Median Property Value | $653,500 | $670,400 |
| Median Household Income | $132,607 | $1,581 |
| Monthly Housing Costs | $797 | $1,115 |
| Real Estate Taxes | $3,192 | $32 |
Property Value by Mortgage Status in The Pinery
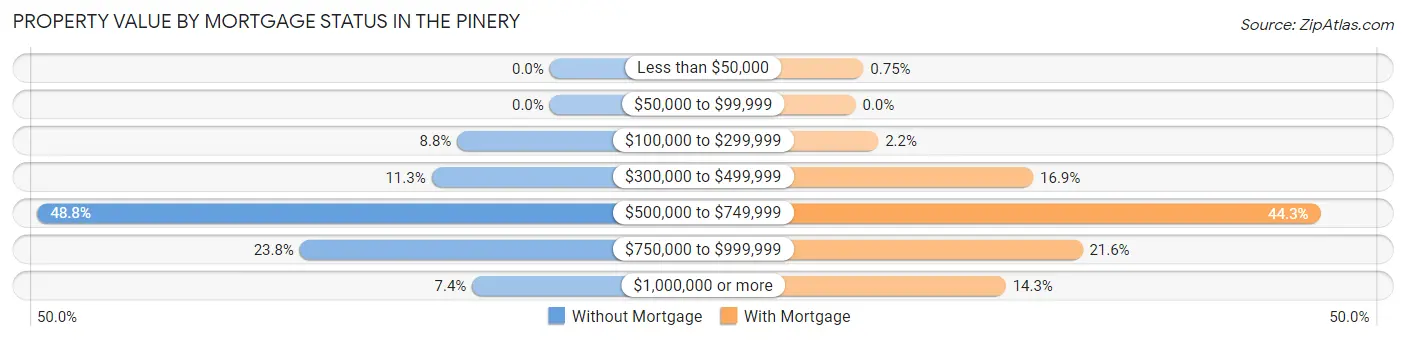
| Property Value | Without Mortgage | With Mortgage |
| Less than $50,000 | 0 (0.0%) | 20 (0.7%) |
| $50,000 to $99,999 | 0 (0.0%) | 0 (0.0%) |
| $100,000 to $299,999 | 68 (8.8%) | 58 (2.2%) |
| $300,000 to $499,999 | 87 (11.3%) | 453 (16.9%) |
| $500,000 to $749,999 | 377 (48.8%) | 1,186 (44.3%) |
| $750,000 to $999,999 | 184 (23.8%) | 579 (21.6%) |
| $1,000,000 or more | 57 (7.4%) | 383 (14.3%) |
| Total | 773 (100.0%) | 2,679 (100.0%) |
Household Income by Mortgage Status in The Pinery
| Household Income | Without Mortgage | With Mortgage |
| Less than $10,000 | 19 (2.5%) | 33 (1.2%) |
| $10,000 to $24,999 | 43 (5.6%) | 61 (2.3%) |
| $25,000 to $34,999 | 48 (6.2%) | 14 (0.5%) |
| $35,000 to $49,999 | 16 (2.1%) | 34 (1.3%) |
| $50,000 to $74,999 | 68 (8.8%) | 59 (2.2%) |
| $75,000 to $99,999 | 92 (11.9%) | 151 (5.6%) |
| $100,000 to $149,999 | 145 (18.8%) | 179 (6.7%) |
| $150,000 or more | 342 (44.2%) | 600 (22.4%) |
| Total | 773 (100.0%) | 2,679 (100.0%) |
Property Value to Household Income Ratio in The Pinery
| Value-to-Income Ratio | Without Mortgage | With Mortgage |
| Less than 2.0x | 86 (11.1%) | 170,428 (6,361.6%) |
| 2.0x to 2.9x | 101 (13.1%) | 315 (11.8%) |
| 3.0x to 3.9x | 112 (14.5%) | 625 (23.3%) |
| 4.0x or more | 455 (58.9%) | 573 (21.4%) |
| Total | 773 (100.0%) | 2,679 (100.0%) |
Real Estate Taxes by Mortgage Status in The Pinery
| Property Taxes | Without Mortgage | With Mortgage |
| Less than $800 | 24 (3.1%) | 19 (0.7%) |
| $800 to $1,499 | 37 (4.8%) | 85 (3.2%) |
| $800 to $1,499 | 712 (92.1%) | 101 (3.8%) |
| Total | 773 (100.0%) | 2,679 (100.0%) |
Health & Disability in The Pinery
Health Insurance Coverage by Age in The Pinery
| Age Bracket | With Coverage | Without Coverage |
| Under 6 Years | 447 (100.0%) | 0 (0.0%) |
| 6 to 18 Years | 1,995 (98.5%) | 31 (1.5%) |
| 19 to 25 Years | 625 (96.5%) | 23 (3.5%) |
| 26 to 34 Years | 527 (93.3%) | 38 (6.7%) |
| 35 to 44 Years | 1,359 (98.6%) | 19 (1.4%) |
| 45 to 54 Years | 1,699 (96.2%) | 68 (3.8%) |
| 55 to 64 Years | 1,864 (100.0%) | 0 (0.0%) |
| 65 to 74 Years | 1,195 (100.0%) | 0 (0.0%) |
| 75 Years and older | 573 (100.0%) | 0 (0.0%) |
| Total | 10,284 (98.3%) | 179 (1.7%) |
Health Insurance Coverage by Citizenship Status in The Pinery
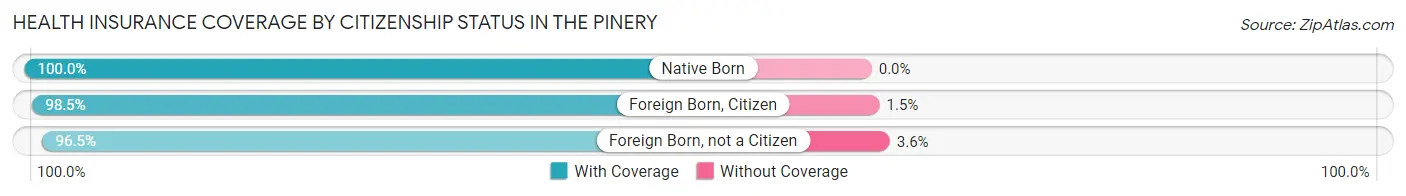
| Citizenship Status | With Coverage | Without Coverage |
| Native Born | 447 (100.0%) | 0 (0.0%) |
| Foreign Born, Citizen | 1,995 (98.5%) | 31 (1.5%) |
| Foreign Born, not a Citizen | 625 (96.5%) | 23 (3.5%) |
Health Insurance Coverage by Household Income in The Pinery
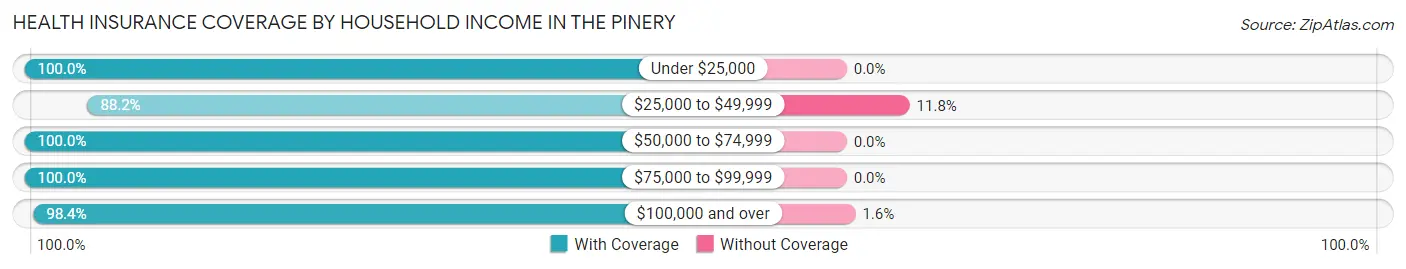
| Household Income | With Coverage | Without Coverage |
| Under $25,000 | 231 (100.0%) | 0 (0.0%) |
| $25,000 to $49,999 | 292 (88.2%) | 39 (11.8%) |
| $50,000 to $74,999 | 574 (100.0%) | 0 (0.0%) |
| $75,000 to $99,999 | 771 (100.0%) | 0 (0.0%) |
| $100,000 and over | 8,403 (98.4%) | 139 (1.6%) |
Public vs Private Health Insurance Coverage by Age in The Pinery
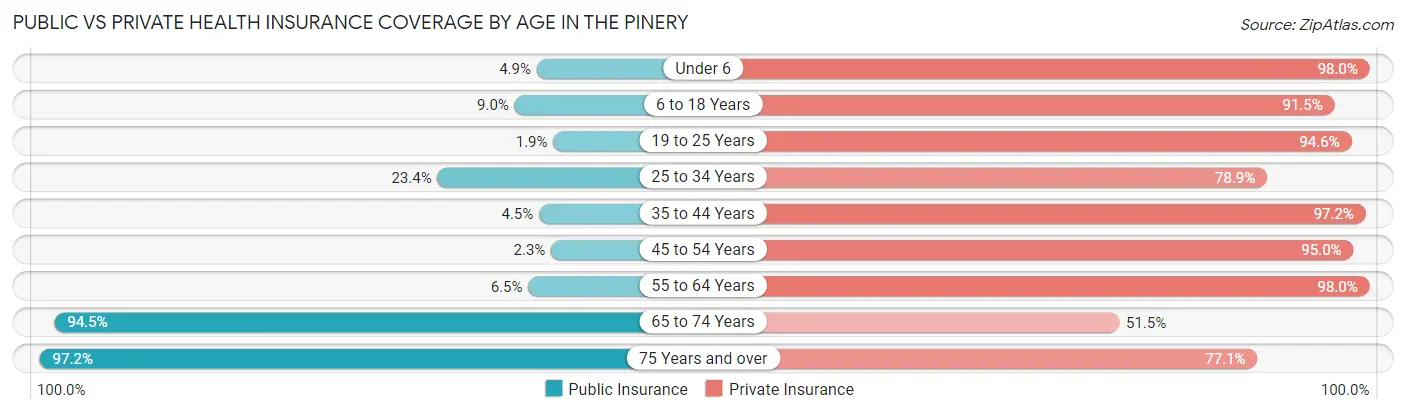
| Age Bracket | Public Insurance | Private Insurance |
| Under 6 | 22 (4.9%) | 438 (98.0%) |
| 6 to 18 Years | 183 (9.0%) | 1,853 (91.5%) |
| 19 to 25 Years | 12 (1.8%) | 613 (94.6%) |
| 25 to 34 Years | 132 (23.4%) | 446 (78.9%) |
| 35 to 44 Years | 62 (4.5%) | 1,340 (97.2%) |
| 45 to 54 Years | 40 (2.3%) | 1,678 (95.0%) |
| 55 to 64 Years | 121 (6.5%) | 1,826 (98.0%) |
| 65 to 74 Years | 1,129 (94.5%) | 615 (51.5%) |
| 75 Years and over | 557 (97.2%) | 442 (77.1%) |
| Total | 2,258 (21.6%) | 9,251 (88.4%) |
Disability Status by Sex by Age in The Pinery
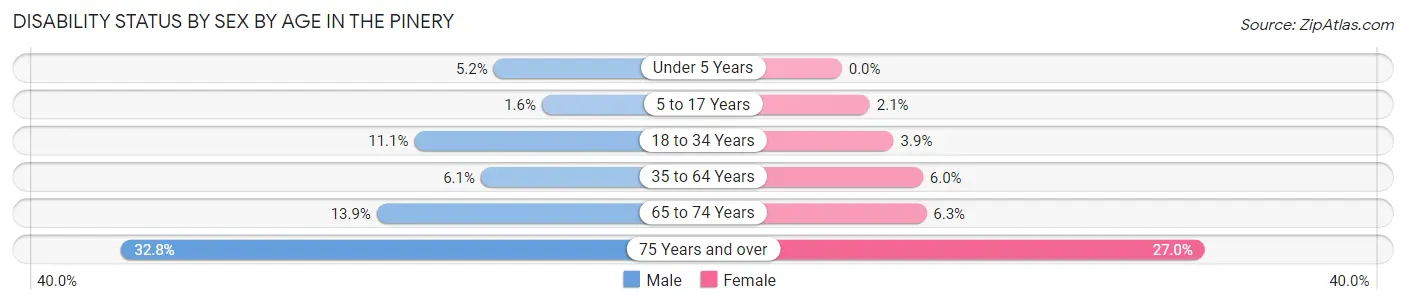
| Age Bracket | Male | Female |
| Under 5 Years | 13 (5.2%) | 0 (0.0%) |
| 5 to 17 Years | 13 (1.6%) | 25 (2.1%) |
| 18 to 34 Years | 89 (11.1%) | 19 (3.8%) |
| 35 to 64 Years | 143 (6.1%) | 161 (6.0%) |
| 65 to 74 Years | 84 (13.9%) | 37 (6.3%) |
| 75 Years and over | 104 (32.8%) | 69 (27.0%) |
Disability Class by Sex by Age in The Pinery
Disability Class: Hearing Difficulty
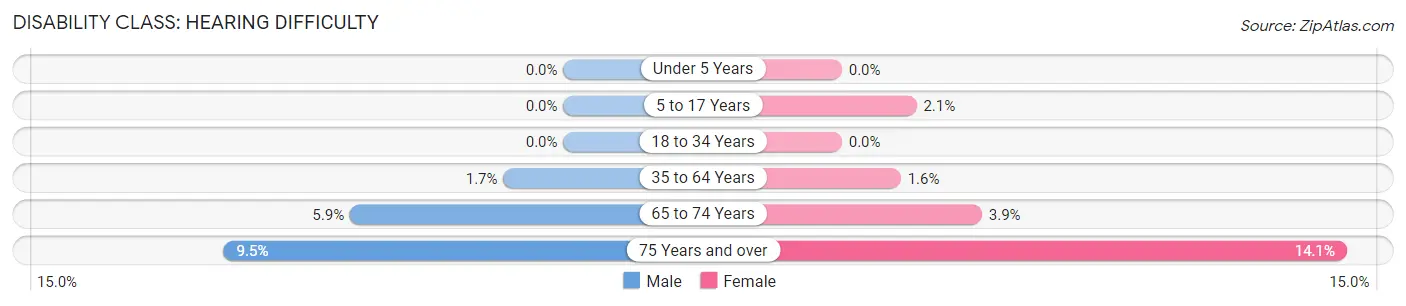
| Age Bracket | Male | Female |
| Under 5 Years | 0 (0.0%) | 0 (0.0%) |
| 5 to 17 Years | 0 (0.0%) | 25 (2.1%) |
| 18 to 34 Years | 0 (0.0%) | 0 (0.0%) |
| 35 to 64 Years | 39 (1.7%) | 44 (1.6%) |
| 65 to 74 Years | 36 (5.9%) | 23 (3.9%) |
| 75 Years and over | 30 (9.5%) | 36 (14.1%) |
Disability Class: Vision Difficulty
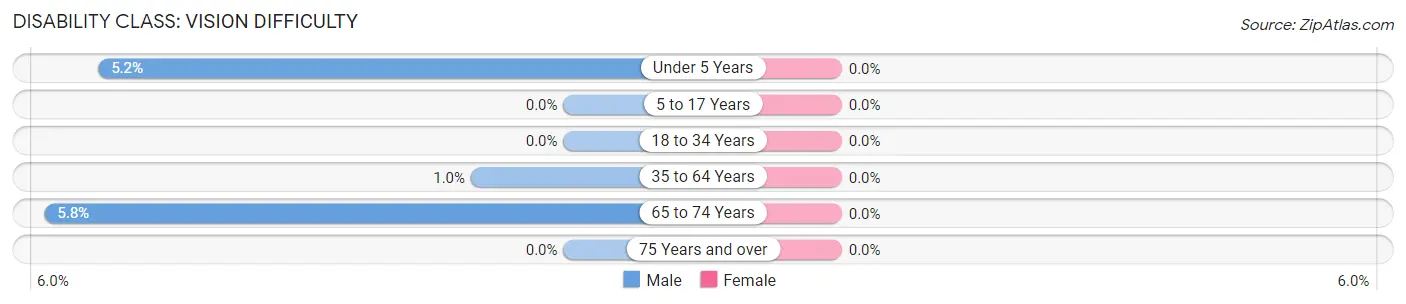
| Age Bracket | Male | Female |
| Under 5 Years | 13 (5.2%) | 0 (0.0%) |
| 5 to 17 Years | 0 (0.0%) | 0 (0.0%) |
| 18 to 34 Years | 0 (0.0%) | 0 (0.0%) |
| 35 to 64 Years | 24 (1.0%) | 0 (0.0%) |
| 65 to 74 Years | 35 (5.8%) | 0 (0.0%) |
| 75 Years and over | 0 (0.0%) | 0 (0.0%) |
Disability Class: Cognitive Difficulty
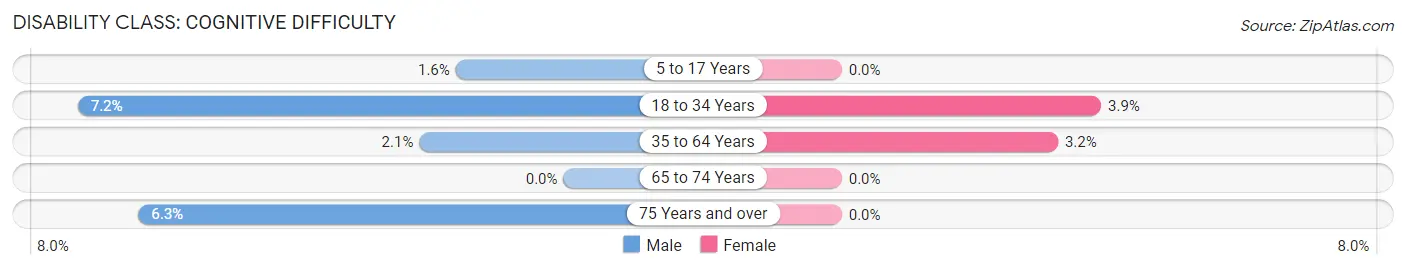
| Age Bracket | Male | Female |
| 5 to 17 Years | 13 (1.6%) | 0 (0.0%) |
| 18 to 34 Years | 58 (7.2%) | 19 (3.8%) |
| 35 to 64 Years | 50 (2.1%) | 86 (3.2%) |
| 65 to 74 Years | 0 (0.0%) | 0 (0.0%) |
| 75 Years and over | 20 (6.3%) | 0 (0.0%) |
Disability Class: Ambulatory Difficulty
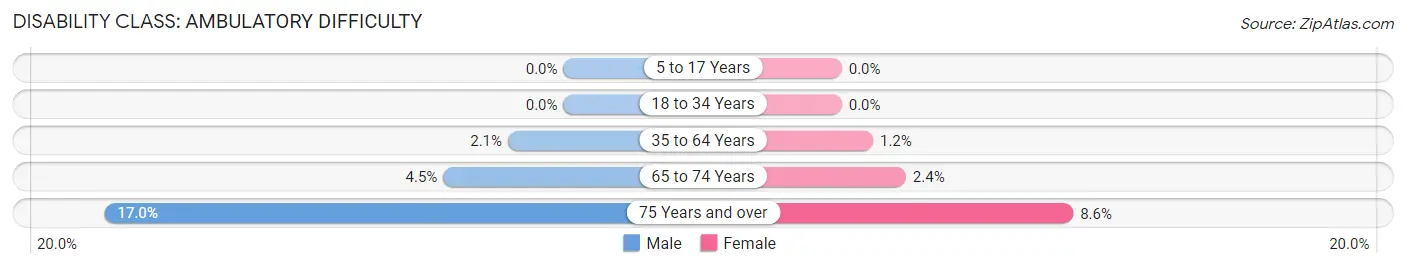
| Age Bracket | Male | Female |
| 5 to 17 Years | 0 (0.0%) | 0 (0.0%) |
| 18 to 34 Years | 0 (0.0%) | 0 (0.0%) |
| 35 to 64 Years | 48 (2.1%) | 31 (1.2%) |
| 65 to 74 Years | 27 (4.5%) | 14 (2.4%) |
| 75 Years and over | 54 (17.0%) | 22 (8.6%) |
Disability Class: Self-Care Difficulty
| Age Bracket | Male | Female |
| 5 to 17 Years | 0 (0.0%) | 0 (0.0%) |
| 18 to 34 Years | 0 (0.0%) | 0 (0.0%) |
| 35 to 64 Years | 0 (0.0%) | 0 (0.0%) |
| 65 to 74 Years | 0 (0.0%) | 0 (0.0%) |
| 75 Years and over | 34 (10.7%) | 9 (3.5%) |
Technology Access in The Pinery
Computing Device Access in The Pinery
| Device Type | # Households | % Households |
| Desktop or Laptop | 3,565 | 97.2% |
| Smartphone | 3,556 | 96.9% |
| Tablet | 3,144 | 85.7% |
| No Computing Device | 41 | 1.1% |
| Total | 3,669 | 100.0% |
Internet Access in The Pinery
| Internet Type | # Households | % Households |
| Dial-Up Internet | 0 | 0.0% |
| Broadband Home | 3,386 | 92.3% |
| Cellular Data Only | 133 | 3.6% |
| Satellite Internet | 294 | 8.0% |
| No Internet | 70 | 1.9% |
| Total | 3,669 | 100.0% |
The Pinery Summary
The Pinery, Colorado is a small unincorporated community located in Douglas County, Colorado. It is situated in the foothills of the Rocky Mountains, approximately 25 miles south of Denver. The Pinery is a rural community with a population of approximately 1,000 people.
History
The Pinery was first settled in the late 1800s by homesteaders who were attracted to the area by its abundant natural resources. The area was originally known as “Pinery Park” and was home to a number of small farms and ranches. In the early 1900s, the area was developed as a resort community, with a number of cabins and lodges being built. The Pinery was officially incorporated as a town in 1921.
In the 1950s, the Pinery began to experience a period of growth and development. The town was home to a number of businesses, including a grocery store, a gas station, and a post office. The Pinery also had its own school district, which served the local community.
In the late 1970s, the Pinery experienced a period of decline as the local economy shifted away from agriculture and towards tourism. The town’s population began to decline, and many of the businesses closed. In the early 2000s, the Pinery began to experience a resurgence as the local economy shifted back towards agriculture and the town began to attract new residents.
Geography
The Pinery is located in the foothills of the Rocky Mountains, approximately 25 miles south of Denver. The town is situated at an elevation of 6,400 feet above sea level. The area is characterized by rolling hills, open meadows, and dense forests. The Pinery is located in a semi-arid climate, with hot summers and cold winters.
Economy
The Pinery’s economy is largely based on agriculture and tourism. The area is home to a number of small farms and ranches, which produce a variety of crops, including hay, corn, and wheat. The Pinery is also home to a number of tourist attractions, including the Pinery State Park, which offers camping, fishing, and hiking opportunities.
Demographics
As of the 2010 census, the Pinery had a population of 1,000 people. The population is largely white (94.2%), with small percentages of Hispanic (2.2%), African American (1.2%), and Asian (1.2%) residents. The median household income in the Pinery is $50,000, and the median home value is $250,000.
Conclusion
The Pinery, Colorado is a small unincorporated community located in Douglas County, Colorado. It is situated in the foothills of the Rocky Mountains, approximately 25 miles south of Denver. The Pinery is a rural community with a population of approximately 1,000 people. The area is characterized by rolling hills, open meadows, and dense forests. The Pinery’s economy is largely based on agriculture and tourism, and the population is largely white. The Pinery is a unique and beautiful community that offers its residents a peaceful and tranquil lifestyle.
Common Questions
What is Per Capita Income in The Pinery?
Per Capita income in The Pinery is $67,401.
What is the Median Family Income in The Pinery?
Median Family Income in The Pinery is $163,693.
What is the Median Household income in The Pinery?
Median Household Income in The Pinery is $154,404.
What is Income or Wage Gap in The Pinery?
Income or Wage Gap in The Pinery is 40.3%.
Women in The Pinery earn 59.7 cents for every dollar earned by a man.
What is Family Income Deficit in The Pinery?
Family Income Deficit in The Pinery is $16,048.
Families that are below poverty line in The Pinery earn $16,048 less on average than the poverty threshold level.
What is Inequality or Gini Index in The Pinery?
Inequality or Gini Index in The Pinery is 0.38.
What is the Total Population of The Pinery?
Total Population of The Pinery is 10,534.
What is the Total Male Population of The Pinery?
Total Male Population of The Pinery is 5,193.
What is the Total Female Population of The Pinery?
Total Female Population of The Pinery is 5,341.
What is the Ratio of Males per 100 Females in The Pinery?
There are 97.23 Males per 100 Females in The Pinery.
What is the Ratio of Females per 100 Males in The Pinery?
There are 102.85 Females per 100 Males in The Pinery.
What is the Median Population Age in The Pinery?
Median Population Age in The Pinery is 45.6 Years.
What is the Average Family Size in The Pinery
Average Family Size in The Pinery is 3.1 People.
What is the Average Household Size in The Pinery
Average Household Size in The Pinery is 2.9 People.
How Large is the Labor Force in The Pinery?
There are 5,712 People in the Labor Forcein in The Pinery.
What is the Percentage of People in the Labor Force in The Pinery?
67.6% of People are in the Labor Force in The Pinery.
What is the Unemployment Rate in The Pinery?
Unemployment Rate in The Pinery is 3.0%.