Black Forest, CO Map & Demographics
Black Forest Map
Black Forest Overview
$59,736
PER CAPITA INCOME
$150,618
AVG FAMILY INCOME
$135,859
AVG HOUSEHOLD INCOME
56.1%
WAGE / INCOME GAP [ % ]
43.9¢/ $1
WAGE / INCOME GAP [ $ ]
$11,247
FAMILY INCOME DEFICIT
0.41
INEQUALITY / GINI INDEX
14,437
TOTAL POPULATION
7,132
MALE POPULATION
7,305
FEMALE POPULATION
97.63
MALES / 100 FEMALES
102.43
FEMALES / 100 MALES
49.0
MEDIAN AGE
3.1
AVG FAMILY SIZE
2.8
AVG HOUSEHOLD SIZE
7,159
LABOR FORCE [ PEOPLE ]
60.9%
PERCENT IN LABOR FORCE
6.2%
UNEMPLOYMENT RATE
Income in Black Forest
Income Overview in Black Forest
Per Capita Income in Black Forest is $59,736, while median incomes of families and households are $150,618 and $135,859 respectively.
| Characteristic | Number | Measure |
| Per Capita Income | 14,437 | $59,736 |
| Median Family Income | 4,134 | $150,618 |
| Mean Family Income | 4,134 | $185,334 |
| Median Household Income | 5,150 | $135,859 |
| Mean Household Income | 5,150 | $165,650 |
| Income Deficit | 4,134 | $11,247 |
| Wage / Income Gap (%) | 14,437 | 56.13% |
| Wage / Income Gap ($) | 14,437 | 43.87¢ per $1 |
| Gini / Inequality Index | 14,437 | 0.41 |
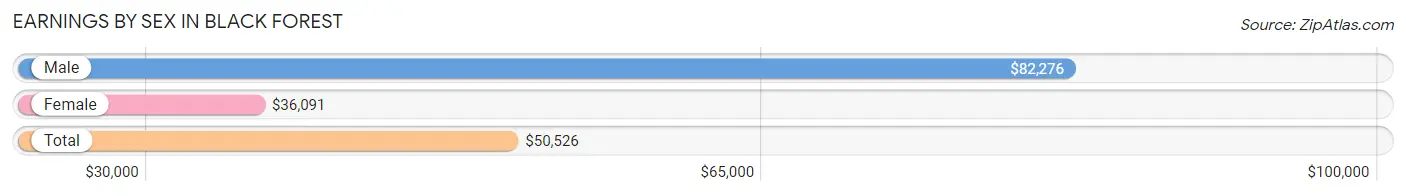
Earnings by Sex in Black Forest
Average Earnings in Black Forest are $50,526, $82,276 for men and $36,091 for women, a difference of 56.1%.
| Sex | Number | Average Earnings |
| Male | 3,998 (53.3%) | $82,276 |
| Female | 3,504 (46.7%) | $36,091 |
| Total | 7,502 (100.0%) | $50,526 |
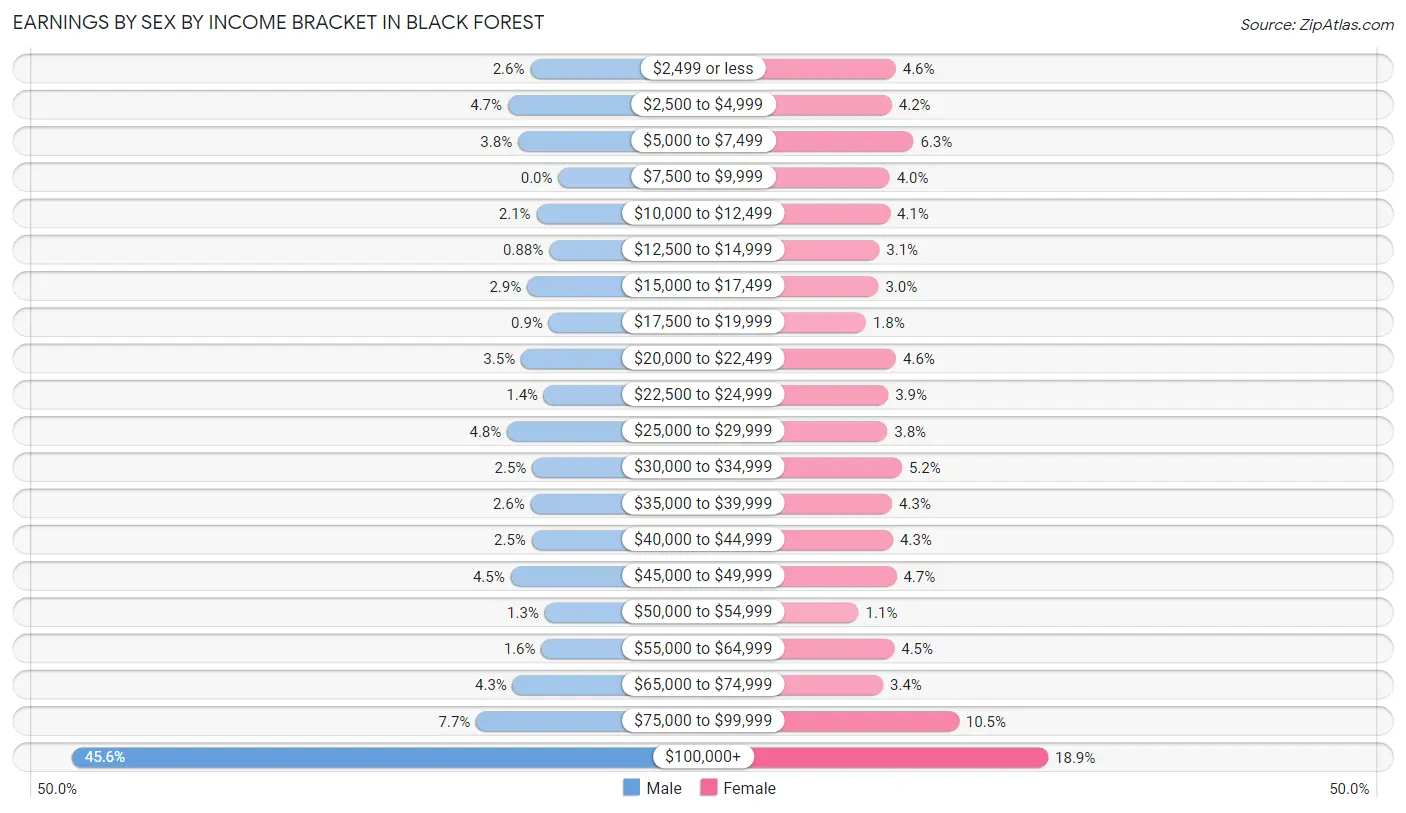
Earnings by Sex by Income Bracket in Black Forest
The most common earnings brackets in Black Forest are $100,000+ for men (1,822 | 45.6%) and $100,000+ for women (661 | 18.9%).
| Income | Male | Female |
| $2,499 or less | 105 (2.6%) | 161 (4.6%) |
| $2,500 to $4,999 | 189 (4.7%) | 148 (4.2%) |
| $5,000 to $7,499 | 151 (3.8%) | 219 (6.2%) |
| $7,500 to $9,999 | 0 (0.0%) | 141 (4.0%) |
| $10,000 to $12,499 | 82 (2.1%) | 142 (4.1%) |
| $12,500 to $14,999 | 35 (0.9%) | 107 (3.0%) |
| $15,000 to $17,499 | 117 (2.9%) | 104 (3.0%) |
| $17,500 to $19,999 | 36 (0.9%) | 63 (1.8%) |
| $20,000 to $22,499 | 140 (3.5%) | 162 (4.6%) |
| $22,500 to $24,999 | 54 (1.3%) | 136 (3.9%) |
| $25,000 to $29,999 | 192 (4.8%) | 133 (3.8%) |
| $30,000 to $34,999 | 98 (2.5%) | 181 (5.2%) |
| $35,000 to $39,999 | 104 (2.6%) | 149 (4.3%) |
| $40,000 to $44,999 | 100 (2.5%) | 152 (4.3%) |
| $45,000 to $49,999 | 179 (4.5%) | 163 (4.6%) |
| $50,000 to $54,999 | 51 (1.3%) | 39 (1.1%) |
| $55,000 to $64,999 | 64 (1.6%) | 156 (4.4%) |
| $65,000 to $74,999 | 171 (4.3%) | 119 (3.4%) |
| $75,000 to $99,999 | 308 (7.7%) | 368 (10.5%) |
| $100,000+ | 1,822 (45.6%) | 661 (18.9%) |
| Total | 3,998 (100.0%) | 3,504 (100.0%) |
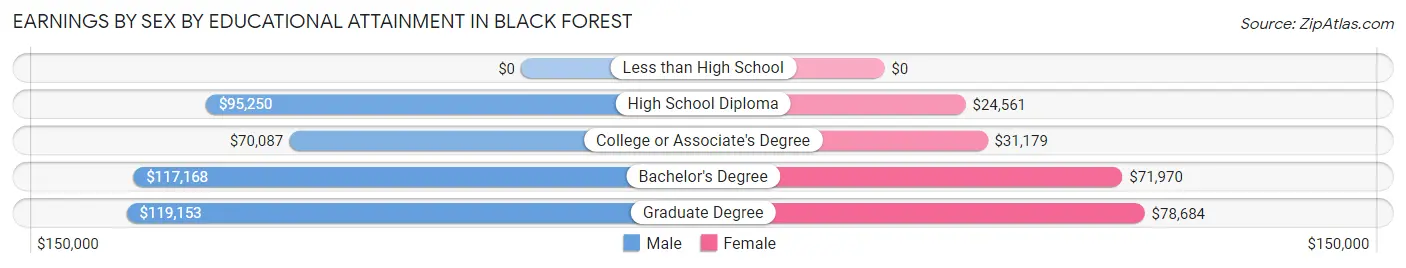
Earnings by Sex by Educational Attainment in Black Forest
Average earnings in Black Forest are $99,921 for men and $45,697 for women, a difference of 54.3%. Men with an educational attainment of graduate degree enjoy the highest average annual earnings of $119,153, while those with college or associate's degree education earn the least with $70,087. Women with an educational attainment of graduate degree earn the most with the average annual earnings of $78,684, while those with high school diploma education have the smallest earnings of $24,561.
| Educational Attainment | Male Income | Female Income |
| Less than High School | - | - |
| High School Diploma | $95,250 | $24,561 |
| College or Associate's Degree | $70,087 | $31,179 |
| Bachelor's Degree | $117,168 | $71,970 |
| Graduate Degree | $119,153 | $78,684 |
| Total | $99,921 | $45,697 |
Family Income in Black Forest
Family Income Brackets in Black Forest
According to the Black Forest family income data, there are 1,348 families falling into the $200,000+ income range, which is the most common income bracket and makes up 32.6% of all families.
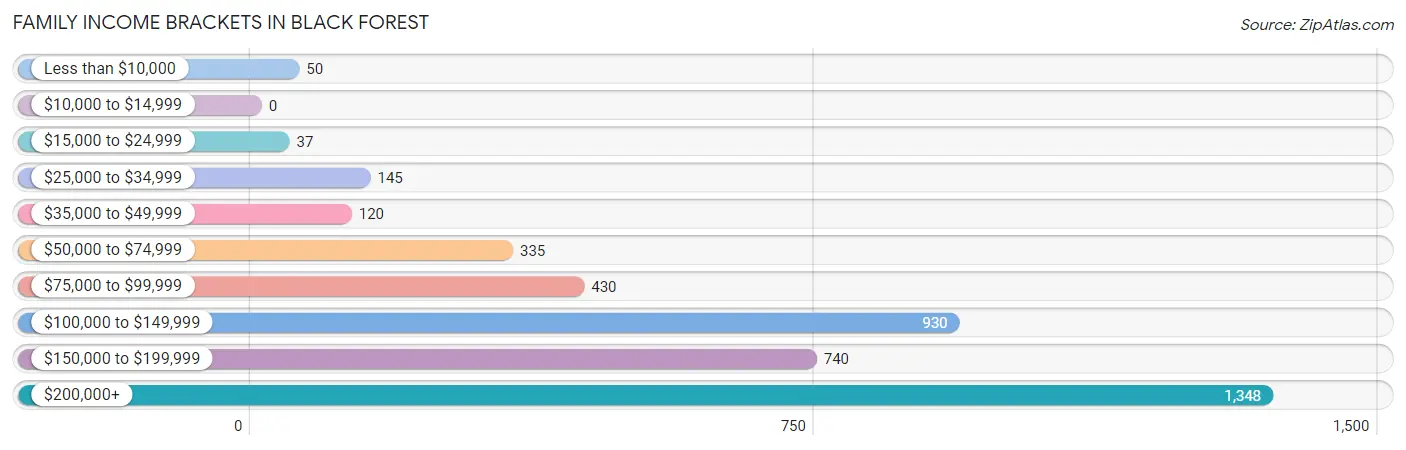
| Income Bracket | # Families | % Families |
| Less than $10,000 | 50 | 1.2% |
| $10,000 to $14,999 | 0 | 0.0% |
| $15,000 to $24,999 | 37 | 0.9% |
| $25,000 to $34,999 | 145 | 3.5% |
| $35,000 to $49,999 | 120 | 2.9% |
| $50,000 to $74,999 | 335 | 8.1% |
| $75,000 to $99,999 | 430 | 10.4% |
| $100,000 to $149,999 | 930 | 22.5% |
| $150,000 to $199,999 | 740 | 17.9% |
| $200,000+ | 1,348 | 32.6% |
Family Income by Famaliy Size in Black Forest
6-person families (124 | 3.0%) account for the highest median family income in Black Forest with $208,889 per family, while 2-person families (1,923 | 46.5%) have the highest median income of $66,292 per family member.
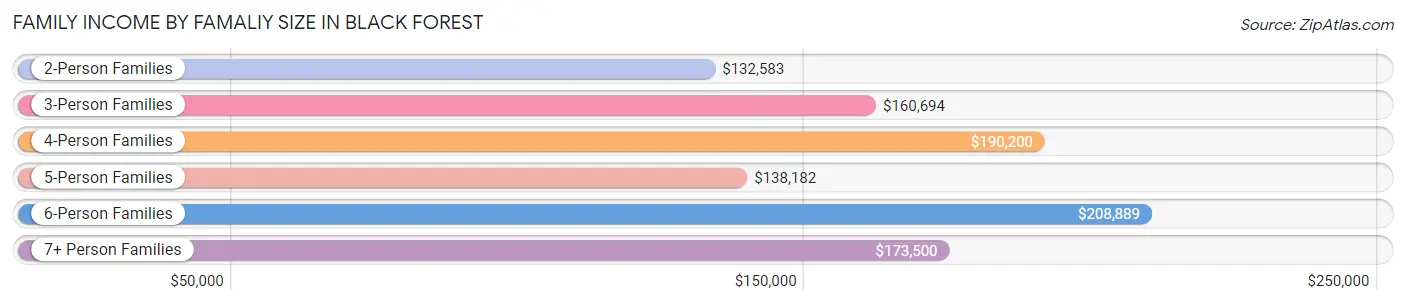
| Income Bracket | # Families | Median Income |
| 2-Person Families | 1,923 (46.5%) | $132,583 |
| 3-Person Families | 949 (23.0%) | $160,694 |
| 4-Person Families | 702 (17.0%) | $190,200 |
| 5-Person Families | 324 (7.8%) | $138,182 |
| 6-Person Families | 124 (3.0%) | $208,889 |
| 7+ Person Families | 112 (2.7%) | $173,500 |
| Total | 4,134 (100.0%) | $150,618 |
Family Income by Number of Earners in Black Forest
The median family income in Black Forest is $150,618, with families comprising 3+ earners (696) having the highest median family income of $205,500, while families with no earners (640) have the lowest median family income of $92,813, accounting for 16.8% and 15.5% of families, respectively.
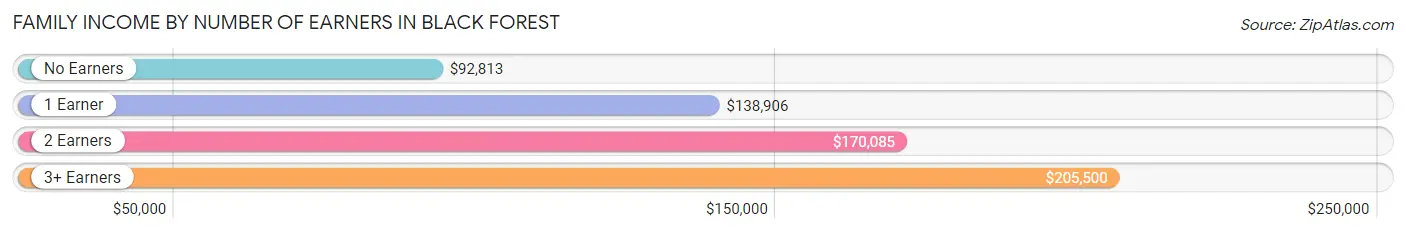
| Number of Earners | # Families | Median Income |
| No Earners | 640 (15.5%) | $92,813 |
| 1 Earner | 1,201 (29.0%) | $138,906 |
| 2 Earners | 1,597 (38.6%) | $170,085 |
| 3+ Earners | 696 (16.8%) | $205,500 |
| Total | 4,134 (100.0%) | $150,618 |
Household Income in Black Forest
Household Income Brackets in Black Forest
With 1,427 households falling in the category, the $200,000+ income range is the most frequent in Black Forest, accounting for 27.7% of all households. In contrast, only 15 households (0.3%) fall into the $10,000 to $14,999 income bracket, making it the least populous group.
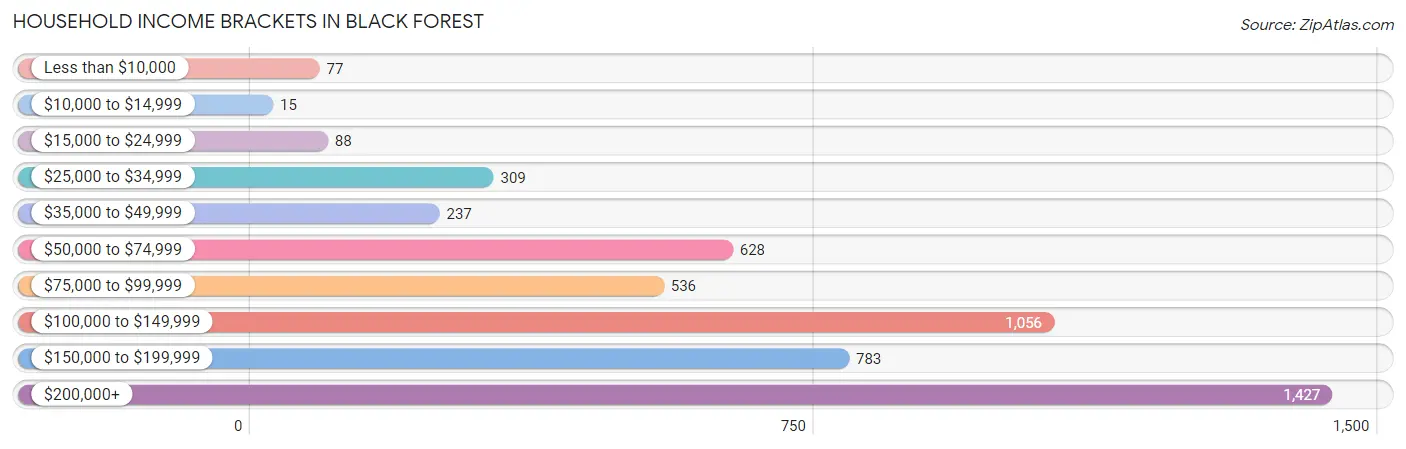
| Income Bracket | # Households | % Households |
| Less than $10,000 | 77 | 1.5% |
| $10,000 to $14,999 | 15 | 0.3% |
| $15,000 to $24,999 | 88 | 1.7% |
| $25,000 to $34,999 | 309 | 6.0% |
| $35,000 to $49,999 | 237 | 4.6% |
| $50,000 to $74,999 | 628 | 12.2% |
| $75,000 to $99,999 | 536 | 10.4% |
| $100,000 to $149,999 | 1,056 | 20.5% |
| $150,000 to $199,999 | 783 | 15.2% |
| $200,000+ | 1,427 | 27.7% |
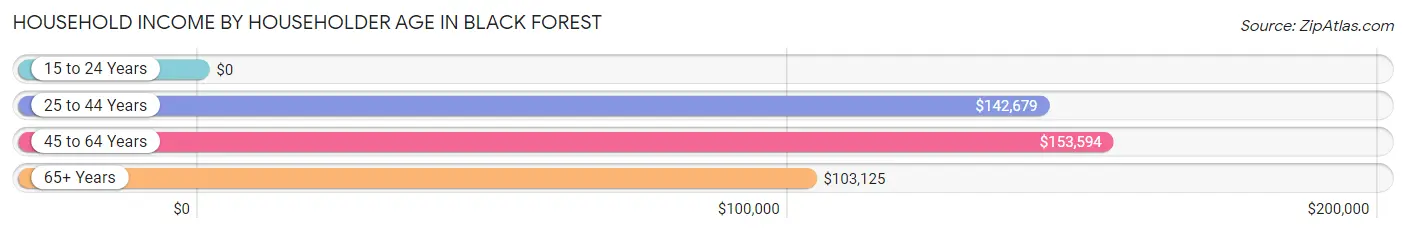
Household Income by Householder Age in Black Forest
The median household income in Black Forest is $135,859, with the highest median household income of $153,594 found in the 45 to 64 years age bracket for the primary householder. A total of 2,737 households (53.1%) fall into this category.
| Income Bracket | # Households | Median Income |
| 15 to 24 Years | 0 (0.0%) | $0 |
| 25 to 44 Years | 758 (14.7%) | $142,679 |
| 45 to 64 Years | 2,737 (53.1%) | $153,594 |
| 65+ Years | 1,655 (32.1%) | $103,125 |
| Total | 5,150 (100.0%) | $135,859 |
Poverty in Black Forest
Income Below Poverty by Sex and Age in Black Forest
With 2.5% poverty level for males and 1.6% for females among the residents of Black Forest, under 5 year old males and 15 year old females are the most vulnerable to poverty, with 26 males (12.7%) and 17 females (8.7%) in their respective age groups living below the poverty level.
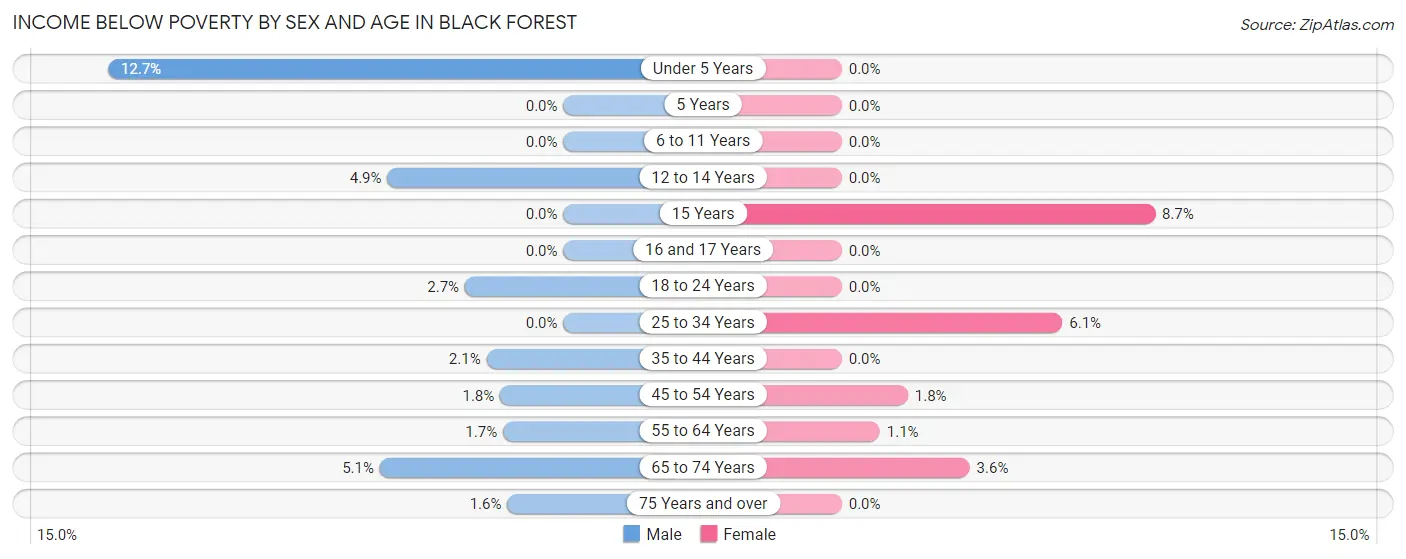
| Age Bracket | Male | Female |
| Under 5 Years | 26 (12.7%) | 0 (0.0%) |
| 5 Years | 0 (0.0%) | 0 (0.0%) |
| 6 to 11 Years | 0 (0.0%) | 0 (0.0%) |
| 12 to 14 Years | 20 (4.9%) | 0 (0.0%) |
| 15 Years | 0 (0.0%) | 17 (8.7%) |
| 16 and 17 Years | 0 (0.0%) | 0 (0.0%) |
| 18 to 24 Years | 11 (2.7%) | 0 (0.0%) |
| 25 to 34 Years | 0 (0.0%) | 25 (6.1%) |
| 35 to 44 Years | 16 (2.1%) | 0 (0.0%) |
| 45 to 54 Years | 20 (1.8%) | 24 (1.8%) |
| 55 to 64 Years | 25 (1.7%) | 15 (1.1%) |
| 65 to 74 Years | 51 (5.1%) | 37 (3.6%) |
| 75 Years and over | 6 (1.6%) | 0 (0.0%) |
| Total | 175 (2.5%) | 118 (1.6%) |
Income Above Poverty by Sex and Age in Black Forest
According to the poverty statistics in Black Forest, males aged 5 years and females aged under 5 years are the age groups that are most secure financially, with 100.0% of males and 100.0% of females in these age groups living above the poverty line.
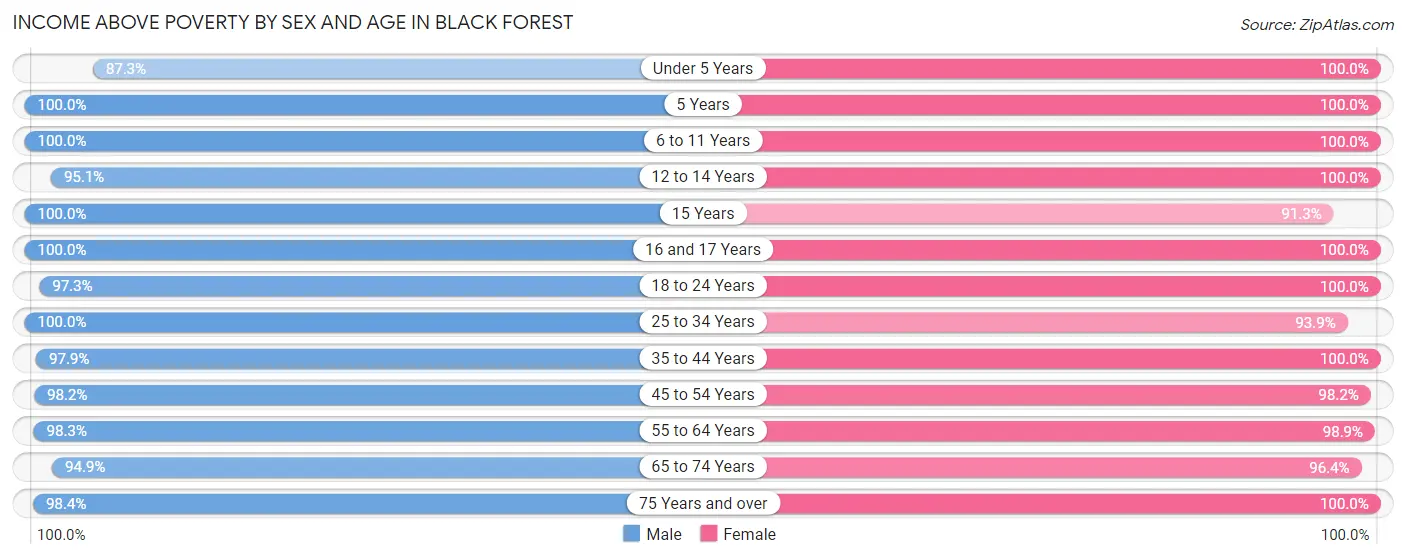
| Age Bracket | Male | Female |
| Under 5 Years | 179 (87.3%) | 320 (100.0%) |
| 5 Years | 105 (100.0%) | 30 (100.0%) |
| 6 to 11 Years | 450 (100.0%) | 467 (100.0%) |
| 12 to 14 Years | 388 (95.1%) | 301 (100.0%) |
| 15 Years | 119 (100.0%) | 178 (91.3%) |
| 16 and 17 Years | 257 (100.0%) | 242 (100.0%) |
| 18 to 24 Years | 390 (97.3%) | 518 (100.0%) |
| 25 to 34 Years | 381 (100.0%) | 382 (93.9%) |
| 35 to 44 Years | 730 (97.9%) | 700 (100.0%) |
| 45 to 54 Years | 1,116 (98.2%) | 1,278 (98.2%) |
| 55 to 64 Years | 1,463 (98.3%) | 1,405 (98.9%) |
| 65 to 74 Years | 948 (94.9%) | 1,003 (96.4%) |
| 75 Years and over | 378 (98.4%) | 334 (100.0%) |
| Total | 6,904 (97.5%) | 7,158 (98.4%) |
Income Below Poverty Among Married-Couple Families in Black Forest
The poverty statistics for married-couple families in Black Forest show that 1.0% or 38 of the total 3,720 families live below the poverty line. Families with no children have the highest poverty rate of 1.6%, comprising of 38 families. On the other hand, families with 1 or 2 children have the lowest poverty rate of 0.0%, which includes 0 families.
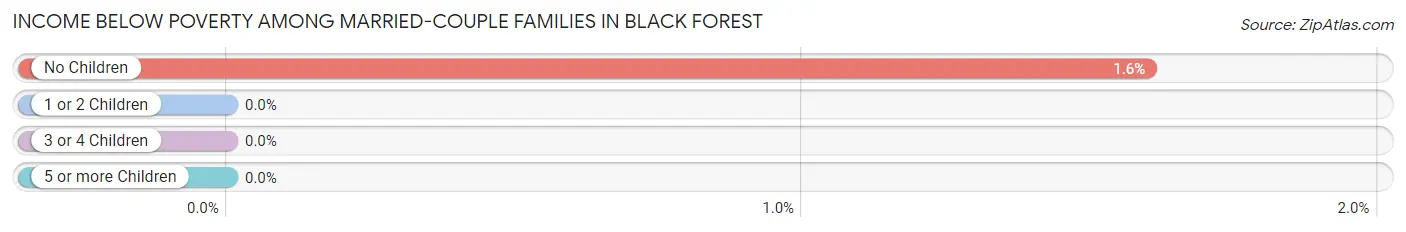
| Children | Above Poverty | Below Poverty |
| No Children | 2,331 (98.4%) | 38 (1.6%) |
| 1 or 2 Children | 1,004 (100.0%) | 0 (0.0%) |
| 3 or 4 Children | 273 (100.0%) | 0 (0.0%) |
| 5 or more Children | 74 (100.0%) | 0 (0.0%) |
| Total | 3,682 (99.0%) | 38 (1.0%) |
Income Below Poverty Among Single-Parent Households in Black Forest
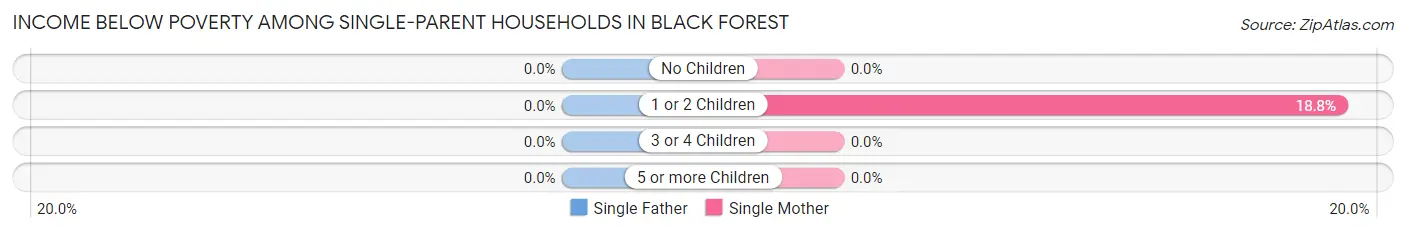
| Children | Single Father | Single Mother |
| No Children | 0 (0.0%) | 0 (0.0%) |
| 1 or 2 Children | 0 (0.0%) | 34 (18.8%) |
| 3 or 4 Children | 0 (0.0%) | 0 (0.0%) |
| 5 or more Children | 0 (0.0%) | 0 (0.0%) |
| Total | 0 (0.0%) | 34 (9.2%) |
Income Below Poverty Among Married-Couple vs Single-Parent Households in Black Forest
The poverty data for Black Forest shows that 38 of the married-couple family households (1.0%) and 34 of the single-parent households (8.2%) are living below the poverty level. Within the married-couple family households, those with no children have the highest poverty rate, with 38 households (1.6%) falling below the poverty line. Among the single-parent households, those with 1 or 2 children have the highest poverty rate, with 34 household (17.0%) living below poverty.
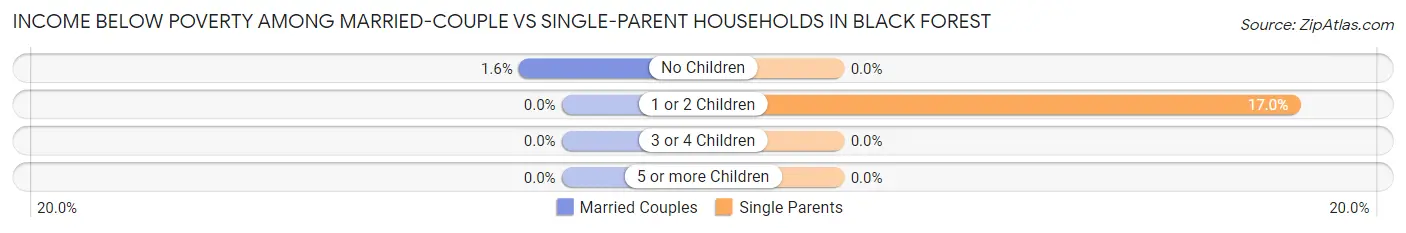
| Children | Married-Couple Families | Single-Parent Households |
| No Children | 38 (1.6%) | 0 (0.0%) |
| 1 or 2 Children | 0 (0.0%) | 34 (17.0%) |
| 3 or 4 Children | 0 (0.0%) | 0 (0.0%) |
| 5 or more Children | 0 (0.0%) | 0 (0.0%) |
| Total | 38 (1.0%) | 34 (8.2%) |
Race in Black Forest
The most populous races in Black Forest are White / Caucasian (12,834 | 88.9%), Hispanic or Latino (861 | 6.0%), and Two or more Races (708 | 4.9%).
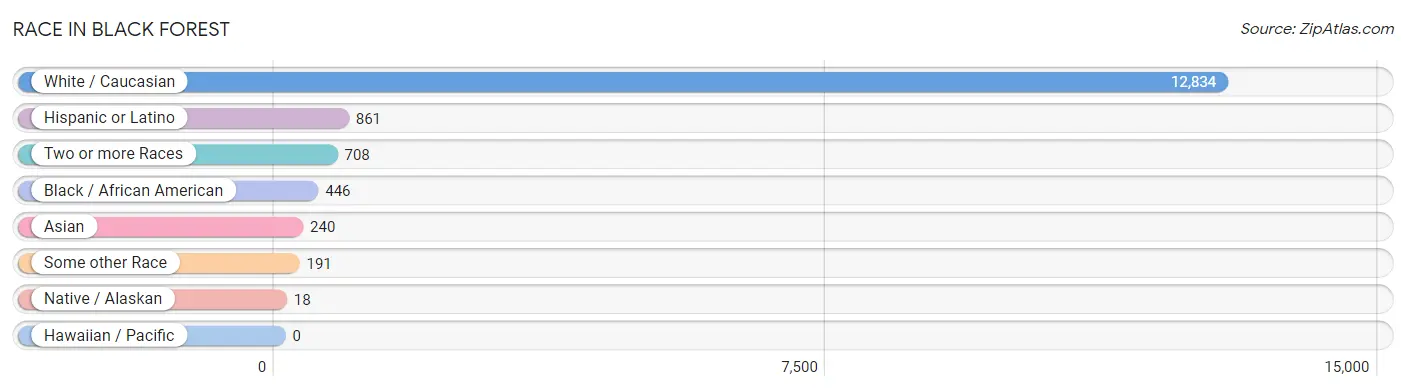
| Race | # Population | % Population |
| Asian | 240 | 1.7% |
| Black / African American | 446 | 3.1% |
| Hawaiian / Pacific | 0 | 0.0% |
| Hispanic or Latino | 861 | 6.0% |
| Native / Alaskan | 18 | 0.1% |
| White / Caucasian | 12,834 | 88.9% |
| Two or more Races | 708 | 4.9% |
| Some other Race | 191 | 1.3% |
| Total | 14,437 | 100.0% |
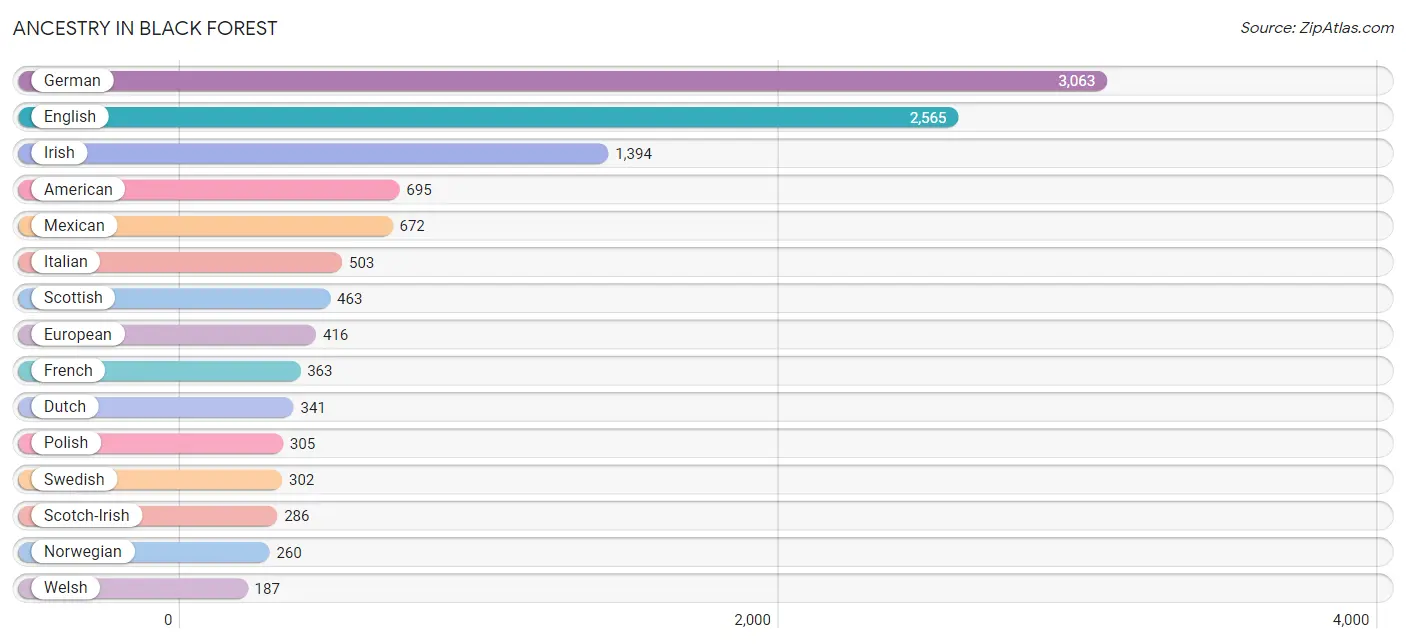
Ancestry in Black Forest
The most populous ancestries reported in Black Forest are German (3,063 | 21.2%), English (2,565 | 17.8%), Irish (1,394 | 9.7%), American (695 | 4.8%), and Mexican (672 | 4.6%), together accounting for 58.1% of all Black Forest residents.
| Ancestry | # Population | % Population |
| American | 695 | 4.8% |
| Apache | 8 | 0.1% |
| Arab | 24 | 0.2% |
| Austrian | 48 | 0.3% |
| Belizean | 45 | 0.3% |
| Bhutanese | 94 | 0.6% |
| Blackfeet | 27 | 0.2% |
| British | 133 | 0.9% |
| Burmese | 114 | 0.8% |
| Canadian | 105 | 0.7% |
| Central American | 68 | 0.5% |
| Central American Indian | 9 | 0.1% |
| Cherokee | 36 | 0.3% |
| Croatian | 14 | 0.1% |
| Czech | 91 | 0.6% |
| Czechoslovakian | 26 | 0.2% |
| Danish | 49 | 0.3% |
| Delaware | 22 | 0.2% |
| Dutch | 341 | 2.4% |
| Eastern European | 107 | 0.7% |
| English | 2,565 | 17.8% |
| Estonian | 17 | 0.1% |
| Ethiopian | 21 | 0.2% |
| European | 416 | 2.9% |
| Finnish | 71 | 0.5% |
| French | 363 | 2.5% |
| French Canadian | 120 | 0.8% |
| German | 3,063 | 21.2% |
| Greek | 19 | 0.1% |
| Guatemalan | 15 | 0.1% |
| Honduran | 53 | 0.4% |
| Hungarian | 11 | 0.1% |
| Indian (Asian) | 97 | 0.7% |
| Inupiat | 4 | 0.0% |
| Irish | 1,394 | 9.7% |
| Italian | 503 | 3.5% |
| Korean | 35 | 0.2% |
| Laotian | 10 | 0.1% |
| Lebanese | 24 | 0.2% |
| Liberian | 65 | 0.4% |
| Lithuanian | 48 | 0.3% |
| Mexican | 672 | 4.6% |
| New Zealander | 9 | 0.1% |
| Northern European | 17 | 0.1% |
| Norwegian | 260 | 1.8% |
| Polish | 305 | 2.1% |
| Portuguese | 24 | 0.2% |
| Puerto Rican | 27 | 0.2% |
| Russian | 43 | 0.3% |
| Scandinavian | 125 | 0.9% |
| Scotch-Irish | 286 | 2.0% |
| Scottish | 463 | 3.2% |
| Serbian | 29 | 0.2% |
| Slovak | 10 | 0.1% |
| Slovene | 19 | 0.1% |
| Spaniard | 16 | 0.1% |
| Spanish | 72 | 0.5% |
| Sri Lankan | 30 | 0.2% |
| Subsaharan African | 98 | 0.7% |
| Swedish | 302 | 2.1% |
| Swiss | 63 | 0.4% |
| Thai | 13 | 0.1% |
| Turkish | 24 | 0.2% |
| Ukrainian | 121 | 0.8% |
| Ute | 23 | 0.2% |
| Welsh | 187 | 1.3% |
| Yaqui | 8 | 0.1% |
| Yugoslavian | 22 | 0.2% | View All 68 Rows |
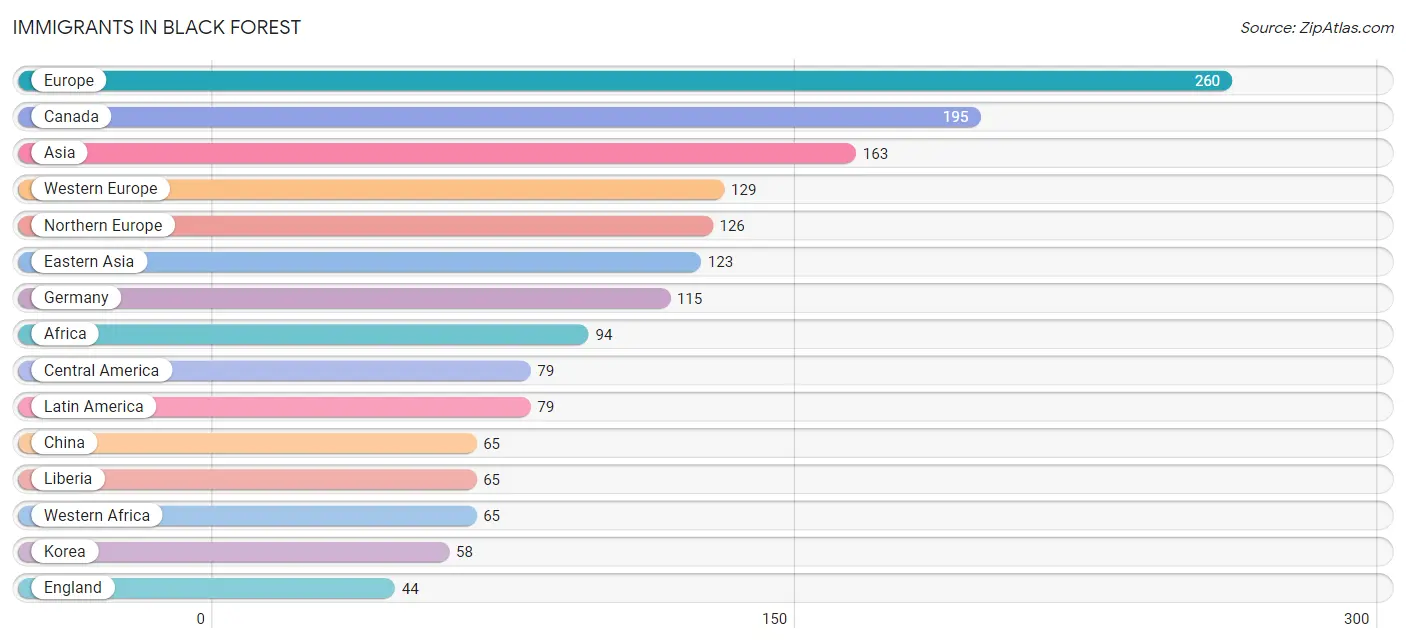
Immigrants in Black Forest
The most numerous immigrant groups reported in Black Forest came from Europe (260 | 1.8%), Canada (195 | 1.3%), Asia (163 | 1.1%), Western Europe (129 | 0.9%), and Northern Europe (126 | 0.9%), together accounting for 6.0% of all Black Forest residents.
| Immigration Origin | # Population | % Population |
| Africa | 94 | 0.6% |
| Asia | 163 | 1.1% |
| Canada | 195 | 1.3% |
| Central America | 79 | 0.5% |
| China | 65 | 0.4% |
| Denmark | 10 | 0.1% |
| Eastern Africa | 21 | 0.2% |
| Eastern Asia | 123 | 0.9% |
| England | 44 | 0.3% |
| Ethiopia | 21 | 0.2% |
| Europe | 260 | 1.8% |
| Germany | 115 | 0.8% |
| Guatemala | 15 | 0.1% |
| Honduras | 26 | 0.2% |
| Indonesia | 10 | 0.1% |
| Ireland | 40 | 0.3% |
| Italy | 5 | 0.0% |
| Korea | 58 | 0.4% |
| Latin America | 79 | 0.5% |
| Liberia | 65 | 0.4% |
| Mexico | 38 | 0.3% |
| Northern Europe | 126 | 0.9% |
| Scotland | 18 | 0.1% |
| South Africa | 8 | 0.1% |
| South Eastern Asia | 40 | 0.3% |
| Southern Europe | 5 | 0.0% |
| Switzerland | 14 | 0.1% |
| Vietnam | 30 | 0.2% |
| Western Africa | 65 | 0.4% |
| Western Europe | 129 | 0.9% | View All 30 Rows |
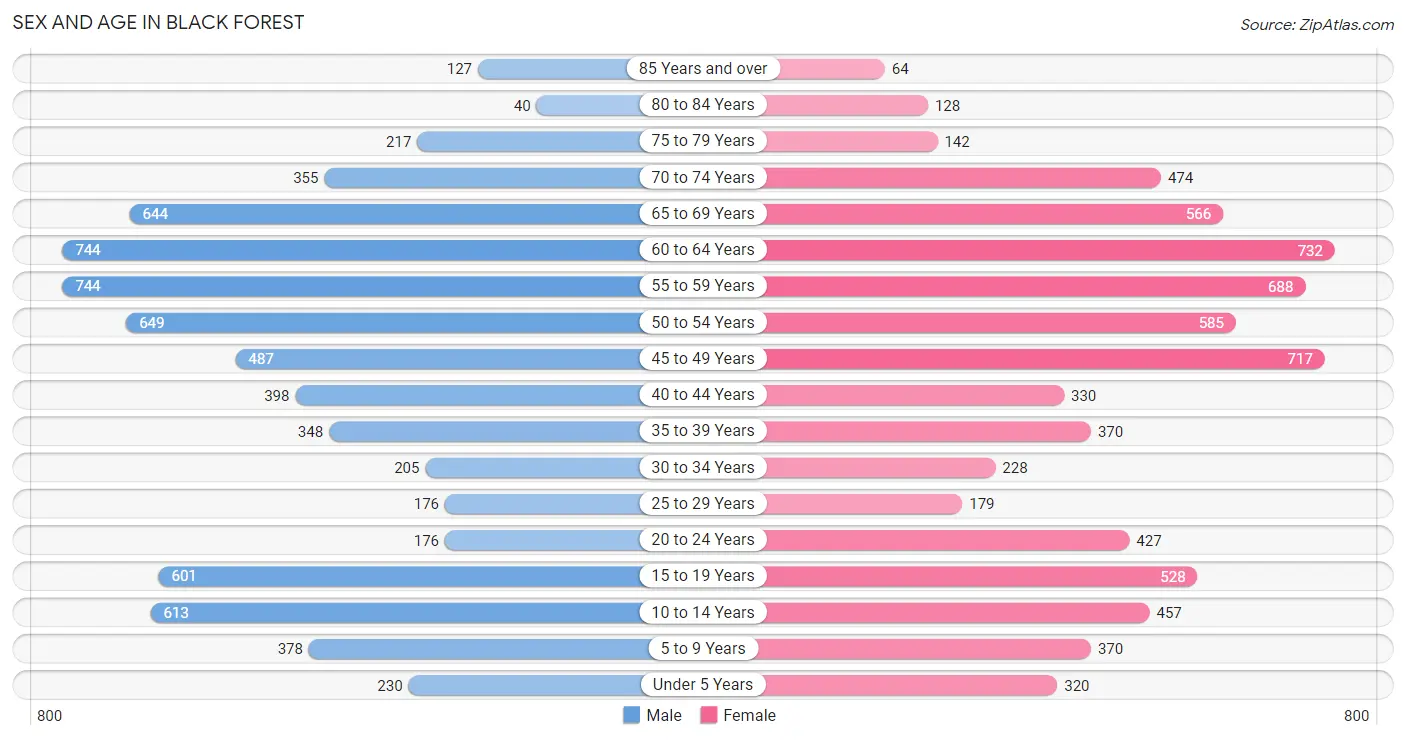
Sex and Age in Black Forest
Sex and Age in Black Forest
The most populous age groups in Black Forest are 55 to 59 Years (744 | 10.4%) for men and 60 to 64 Years (732 | 10.0%) for women.
| Age Bracket | Male | Female |
| Under 5 Years | 230 (3.2%) | 320 (4.4%) |
| 5 to 9 Years | 378 (5.3%) | 370 (5.1%) |
| 10 to 14 Years | 613 (8.6%) | 457 (6.3%) |
| 15 to 19 Years | 601 (8.4%) | 528 (7.2%) |
| 20 to 24 Years | 176 (2.5%) | 427 (5.9%) |
| 25 to 29 Years | 176 (2.5%) | 179 (2.5%) |
| 30 to 34 Years | 205 (2.9%) | 228 (3.1%) |
| 35 to 39 Years | 348 (4.9%) | 370 (5.1%) |
| 40 to 44 Years | 398 (5.6%) | 330 (4.5%) |
| 45 to 49 Years | 487 (6.8%) | 717 (9.8%) |
| 50 to 54 Years | 649 (9.1%) | 585 (8.0%) |
| 55 to 59 Years | 744 (10.4%) | 688 (9.4%) |
| 60 to 64 Years | 744 (10.4%) | 732 (10.0%) |
| 65 to 69 Years | 644 (9.0%) | 566 (7.7%) |
| 70 to 74 Years | 355 (5.0%) | 474 (6.5%) |
| 75 to 79 Years | 217 (3.0%) | 142 (1.9%) |
| 80 to 84 Years | 40 (0.6%) | 128 (1.8%) |
| 85 Years and over | 127 (1.8%) | 64 (0.9%) |
| Total | 7,132 (100.0%) | 7,305 (100.0%) |
Families and Households in Black Forest
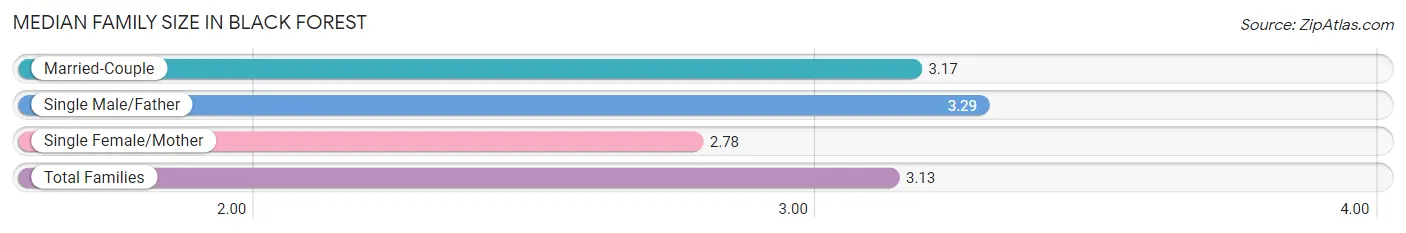
Median Family Size in Black Forest
The median family size in Black Forest is 3.13 persons per family, with single male/father families (45 | 1.1%) accounting for the largest median family size of 3.29 persons per family. On the other hand, single female/mother families (369 | 8.9%) represent the smallest median family size with 2.78 persons per family.
| Family Type | # Families | Family Size |
| Married-Couple | 3,720 (90.0%) | 3.17 |
| Single Male/Father | 45 (1.1%) | 3.29 |
| Single Female/Mother | 369 (8.9%) | 2.78 |
| Total Families | 4,134 (100.0%) | 3.13 |
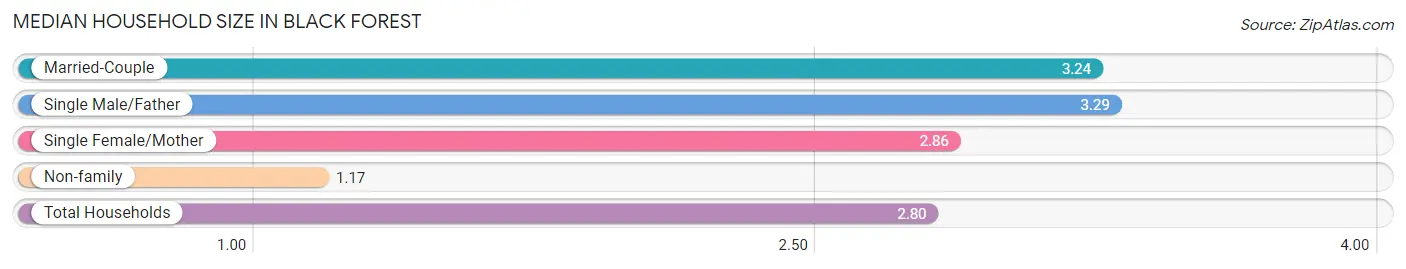
Median Household Size in Black Forest
The median household size in Black Forest is 2.80 persons per household, with single male/father households (45 | 0.9%) accounting for the largest median household size of 3.29 persons per household. non-family households (1,016 | 19.7%) represent the smallest median household size with 1.17 persons per household.
| Household Type | # Households | Household Size |
| Married-Couple | 3,720 (72.2%) | 3.24 |
| Single Male/Father | 45 (0.9%) | 3.29 |
| Single Female/Mother | 369 (7.2%) | 2.86 |
| Non-family | 1,016 (19.7%) | 1.17 |
| Total Households | 5,150 (100.0%) | 2.80 |
Household Size by Marriage Status in Black Forest
Out of a total of 5,150 households in Black Forest, 4,134 (80.3%) are family households, while 1,016 (19.7%) are nonfamily households. The most numerous type of family households are 2-person households, comprising 1,900, and the most common type of nonfamily households are 1-person households, comprising 866.
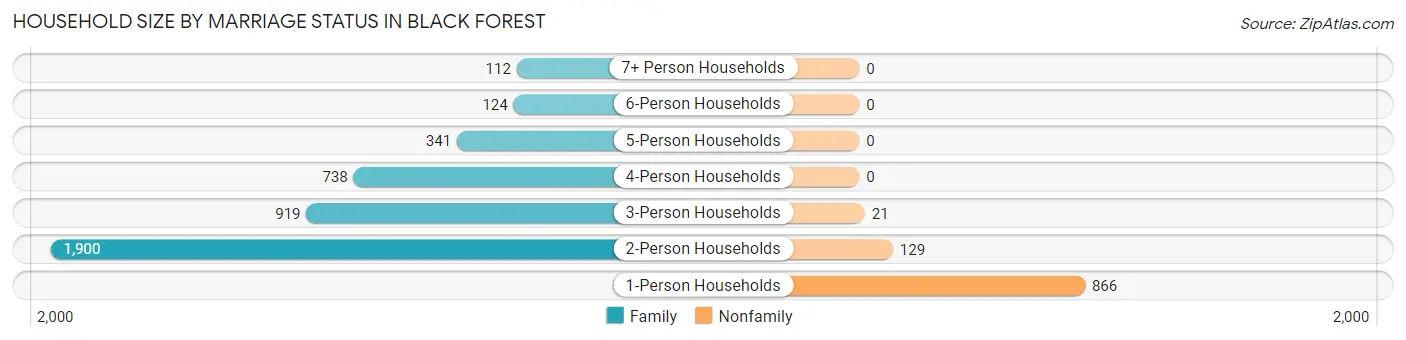
| Household Size | Family Households | Nonfamily Households |
| 1-Person Households | - | 866 (16.8%) |
| 2-Person Households | 1,900 (36.9%) | 129 (2.5%) |
| 3-Person Households | 919 (17.8%) | 21 (0.4%) |
| 4-Person Households | 738 (14.3%) | 0 (0.0%) |
| 5-Person Households | 341 (6.6%) | 0 (0.0%) |
| 6-Person Households | 124 (2.4%) | 0 (0.0%) |
| 7+ Person Households | 112 (2.2%) | 0 (0.0%) |
| Total | 4,134 (80.3%) | 1,016 (19.7%) |
Female Fertility in Black Forest
Fertility by Age in Black Forest
Average fertility rate in Black Forest is 19.0 births per 1,000 women. Women in the age bracket of 20 to 34 years have the highest fertility rate with 26.0 births per 1,000 women. Women in the age bracket of 35 to 50 years acount for 59.3% of all women with births.
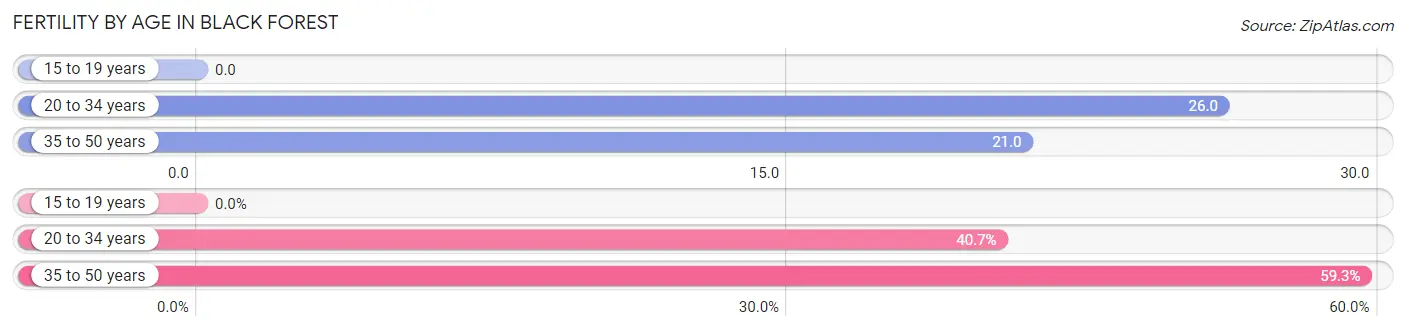
| Age Bracket | Women with Births | Births / 1,000 Women |
| 15 to 19 years | 0 (0.0%) | 0.0 |
| 20 to 34 years | 22 (40.7%) | 26.0 |
| 35 to 50 years | 32 (59.3%) | 21.0 |
| Total | 54 (100.0%) | 19.0 |
Fertility by Age by Marriage Status in Black Forest
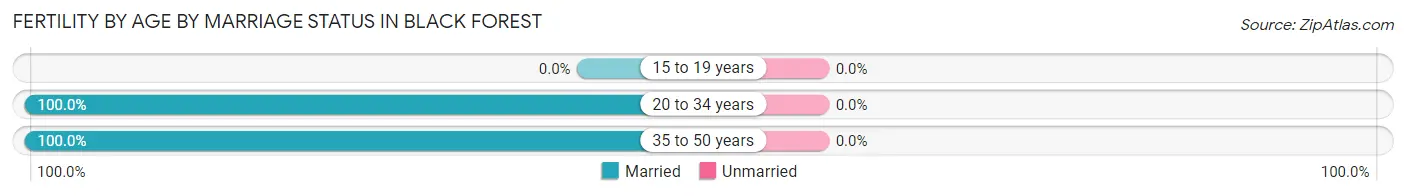
| Age Bracket | Married | Unmarried |
| 15 to 19 years | 0 (0.0%) | 0 (0.0%) |
| 20 to 34 years | 22 (100.0%) | 0 (0.0%) |
| 35 to 50 years | 32 (100.0%) | 0 (0.0%) |
| Total | 54 (100.0%) | 0 (0.0%) |
Fertility by Education in Black Forest
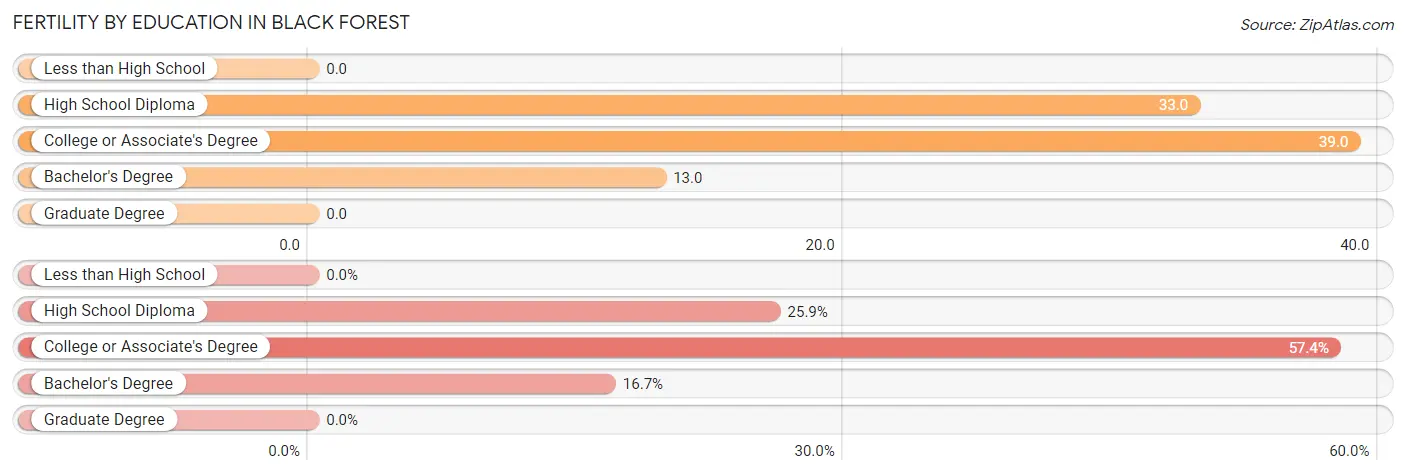
| Educational Attainment | Women with Births | Births / 1,000 Women |
| Less than High School | 0 (0.0%) | 0.0 |
| High School Diploma | 14 (25.9%) | 33.0 |
| College or Associate's Degree | 31 (57.4%) | 39.0 |
| Bachelor's Degree | 9 (16.7%) | 13.0 |
| Graduate Degree | 0 (0.0%) | 0.0 |
| Total | 54 (100.0%) | 19.0 |
Fertility by Education by Marriage Status in Black Forest
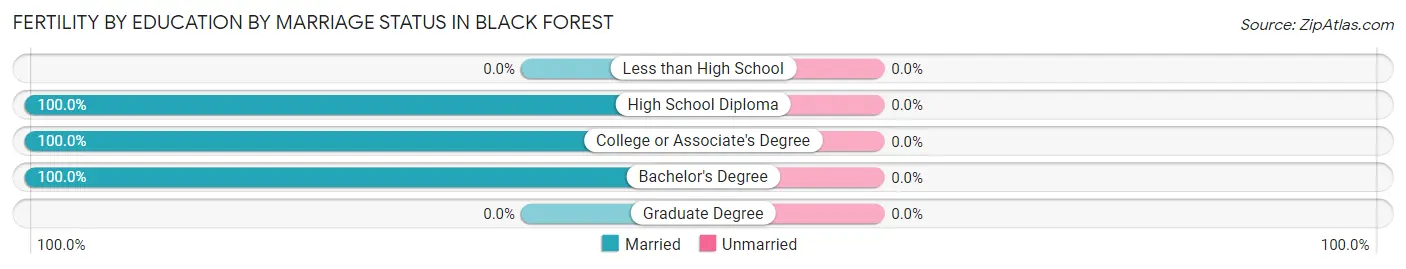
| Educational Attainment | Married | Unmarried |
| Less than High School | 0 (0.0%) | 0 (0.0%) |
| High School Diploma | 14 (100.0%) | 0 (0.0%) |
| College or Associate's Degree | 31 (100.0%) | 0 (0.0%) |
| Bachelor's Degree | 9 (100.0%) | 0 (0.0%) |
| Graduate Degree | 0 (0.0%) | 0 (0.0%) |
| Total | 54 (100.0%) | 0 (0.0%) |
Employment Characteristics in Black Forest
Employment by Class of Employer in Black Forest
Among the 6,669 employed individuals in Black Forest, private company employees (4,129 | 61.9%), self-employed (incorporated) (740 | 11.1%), and not-for-profit organizations (534 | 8.0%) make up the most common classes of employment.
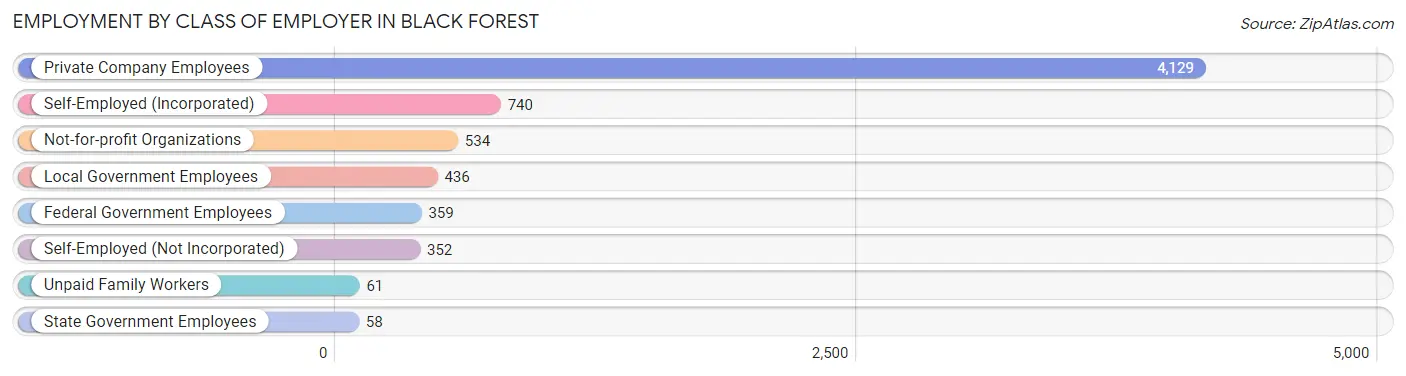
| Employer Class | # Employees | % Employees |
| Private Company Employees | 4,129 | 61.9% |
| Self-Employed (Incorporated) | 740 | 11.1% |
| Self-Employed (Not Incorporated) | 352 | 5.3% |
| Not-for-profit Organizations | 534 | 8.0% |
| Local Government Employees | 436 | 6.5% |
| State Government Employees | 58 | 0.9% |
| Federal Government Employees | 359 | 5.4% |
| Unpaid Family Workers | 61 | 0.9% |
| Total | 6,669 | 100.0% |
Employment Status by Age in Black Forest
According to the labor force statistics for Black Forest, out of the total population over 16 years of age (11,755), 60.9% or 7,159 individuals are in the labor force, with 6.2% or 444 of them unemployed. The age group with the highest labor force participation rate is 25 to 29 years, with 90.1% or 320 individuals in the labor force. Within the labor force, the 30 to 34 years age range has the highest percentage of unemployed individuals, with 25.5% or 78 of them being unemployed.
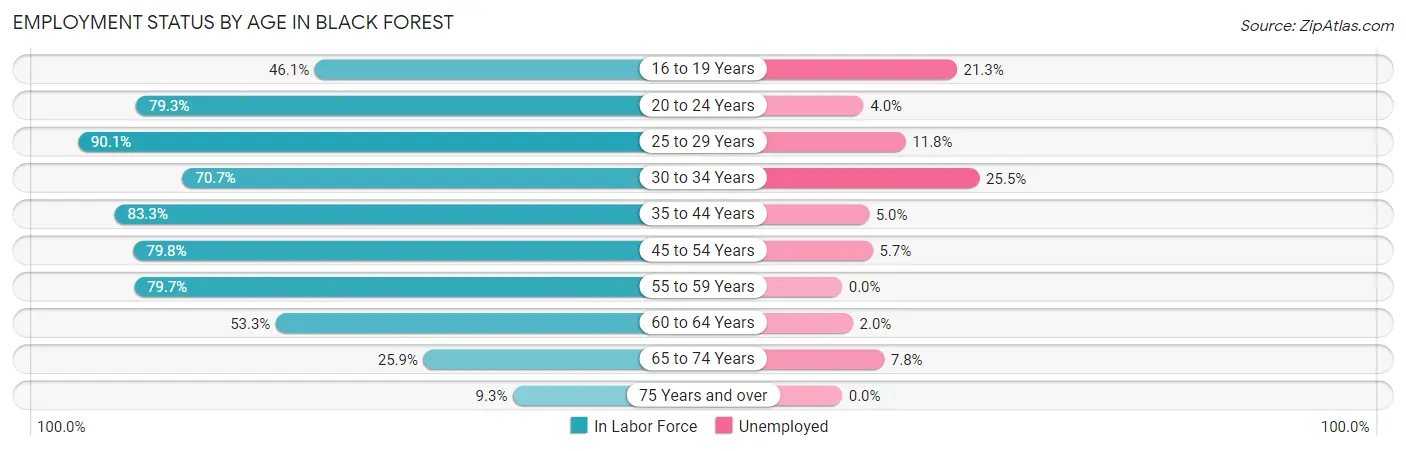
| Age Bracket | In Labor Force | Unemployed |
| 16 to 19 Years | 376 (46.1%) | 80 (21.3%) |
| 20 to 24 Years | 478 (79.3%) | 19 (4.0%) |
| 25 to 29 Years | 320 (90.1%) | 38 (11.8%) |
| 30 to 34 Years | 306 (70.7%) | 78 (25.5%) |
| 35 to 44 Years | 1,205 (83.3%) | 60 (5.0%) |
| 45 to 54 Years | 1,946 (79.8%) | 111 (5.7%) |
| 55 to 59 Years | 1,141 (79.7%) | 0 (0.0%) |
| 60 to 64 Years | 787 (53.3%) | 16 (2.0%) |
| 65 to 74 Years | 528 (25.9%) | 41 (7.8%) |
| 75 Years and over | 67 (9.3%) | 0 (0.0%) |
| Total | 7,159 (60.9%) | 444 (6.2%) |
Employment Status by Educational Attainment in Black Forest
According to labor force statistics for Black Forest, 75.3% of individuals (5,708) out of the total population between 25 and 64 years of age (7,580) are in the labor force, with 5.3% or 303 of them being unemployed. The group with the highest labor force participation rate are those with the educational attainment of high school diploma, with 86.0% or 904 individuals in the labor force. Within the labor force, individuals with high school diploma education have the highest percentage of unemployment, with 9.5% or 86 of them being unemployed.
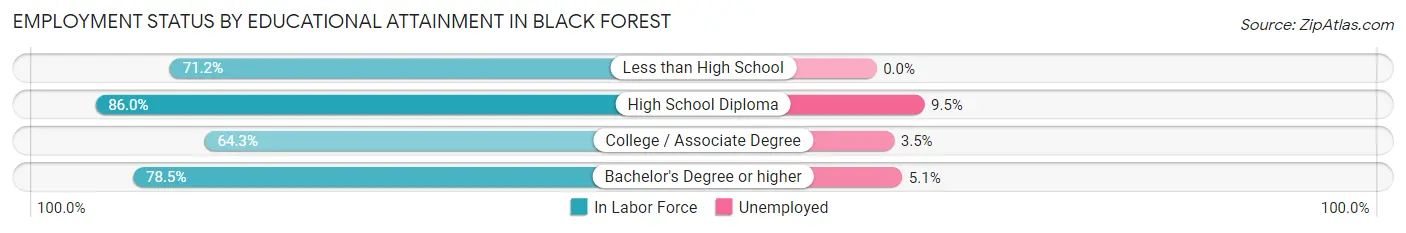
| Educational Attainment | In Labor Force | Unemployed |
| Less than High School | 99 (71.2%) | 0 (0.0%) |
| High School Diploma | 904 (86.0%) | 100 (9.5%) |
| College / Associate Degree | 1,421 (64.3%) | 77 (3.5%) |
| Bachelor's Degree or higher | 3,281 (78.5%) | 213 (5.1%) |
| Total | 5,708 (75.3%) | 402 (5.3%) |
Employment Occupations by Sex in Black Forest
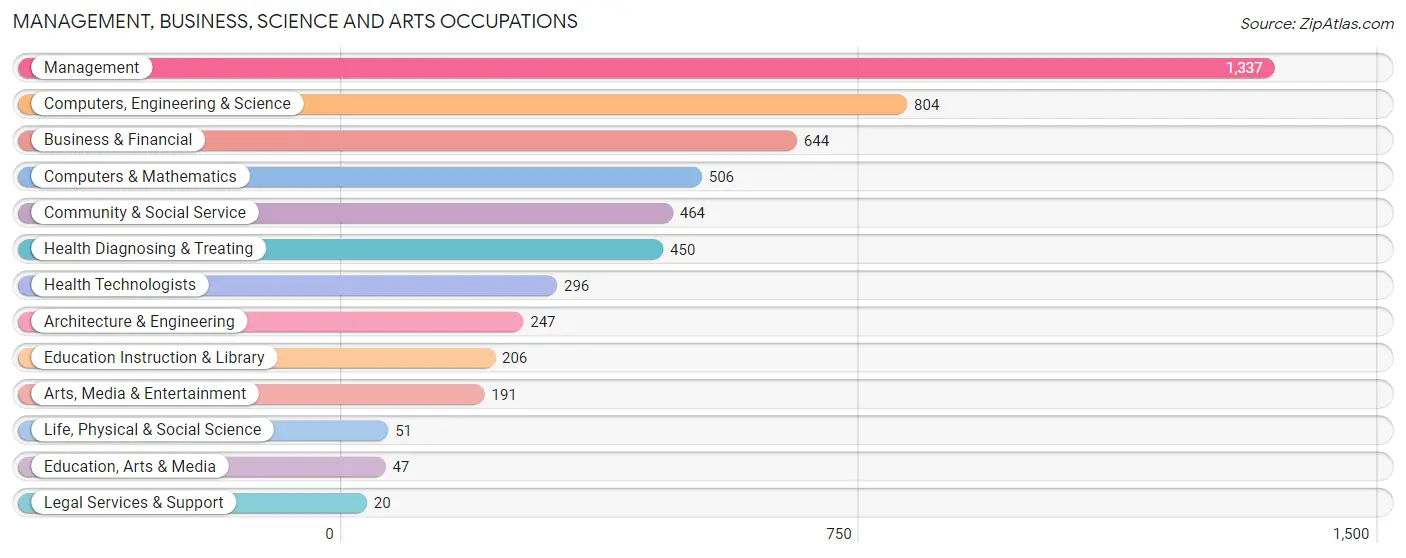
Management, Business, Science and Arts Occupations
The most common Management, Business, Science and Arts occupations in Black Forest are Management (1,337 | 20.1%), Computers, Engineering & Science (804 | 12.1%), Business & Financial (644 | 9.7%), Computers & Mathematics (506 | 7.6%), and Community & Social Service (464 | 7.0%).
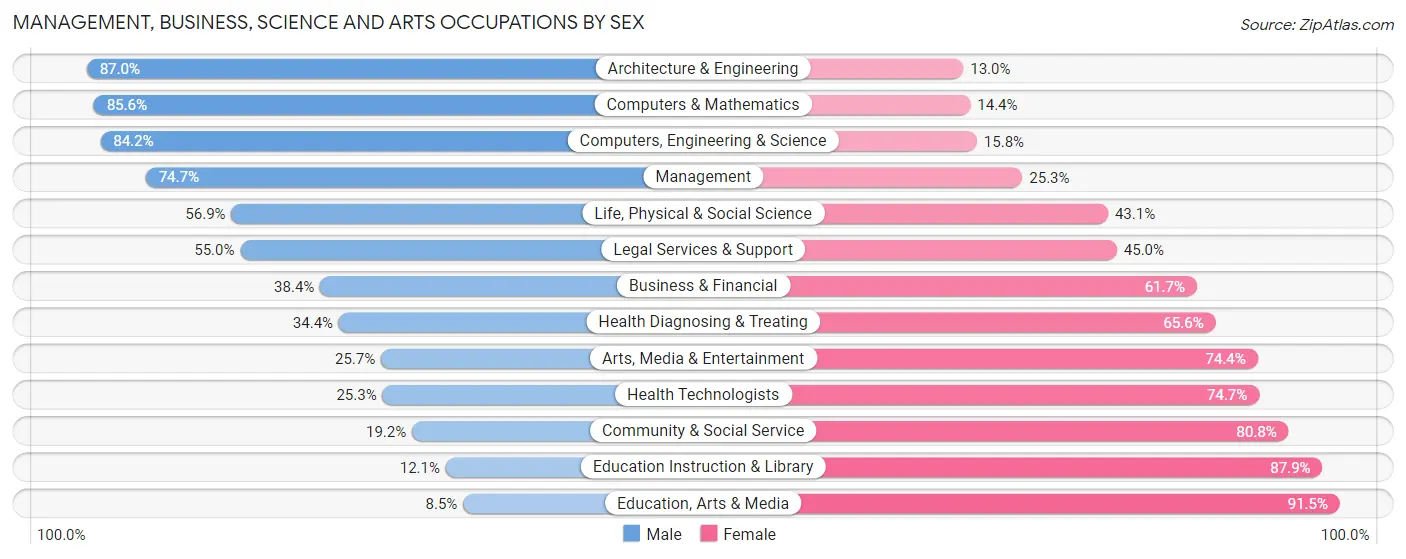
Management, Business, Science and Arts Occupations by Sex
Within the Management, Business, Science and Arts occupations in Black Forest, the most male-oriented occupations are Architecture & Engineering (87.0%), Computers & Mathematics (85.6%), and Computers, Engineering & Science (84.2%), while the most female-oriented occupations are Education, Arts & Media (91.5%), Education Instruction & Library (87.9%), and Community & Social Service (80.8%).
| Occupation | Male | Female |
| Management | 999 (74.7%) | 338 (25.3%) |
| Business & Financial | 247 (38.4%) | 397 (61.7%) |
| Computers, Engineering & Science | 677 (84.2%) | 127 (15.8%) |
| Computers & Mathematics | 433 (85.6%) | 73 (14.4%) |
| Architecture & Engineering | 215 (87.0%) | 32 (13.0%) |
| Life, Physical & Social Science | 29 (56.9%) | 22 (43.1%) |
| Community & Social Service | 89 (19.2%) | 375 (80.8%) |
| Education, Arts & Media | 4 (8.5%) | 43 (91.5%) |
| Legal Services & Support | 11 (55.0%) | 9 (45.0%) |
| Education Instruction & Library | 25 (12.1%) | 181 (87.9%) |
| Arts, Media & Entertainment | 49 (25.7%) | 142 (74.4%) |
| Health Diagnosing & Treating | 155 (34.4%) | 295 (65.6%) |
| Health Technologists | 75 (25.3%) | 221 (74.7%) |
| Total (Category) | 2,167 (58.6%) | 1,532 (41.4%) |
| Total (Overall) | 3,633 (54.5%) | 3,029 (45.5%) |
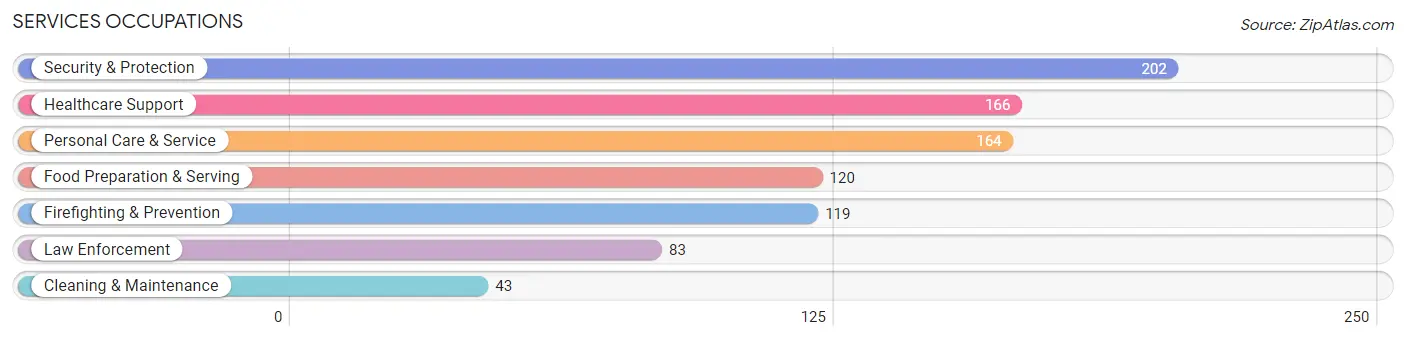
Services Occupations
The most common Services occupations in Black Forest are Security & Protection (202 | 3.0%), Healthcare Support (166 | 2.5%), Personal Care & Service (164 | 2.5%), Food Preparation & Serving (120 | 1.8%), and Firefighting & Prevention (119 | 1.8%).
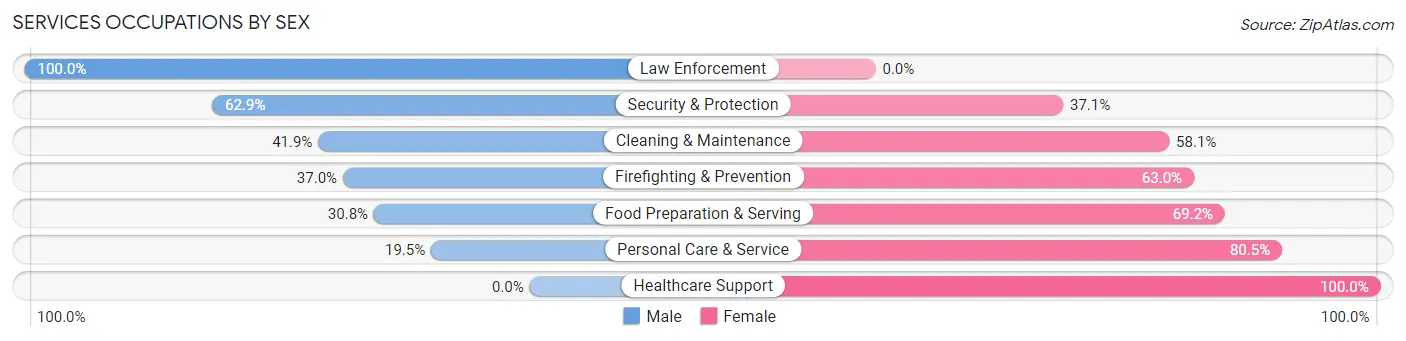
Services Occupations by Sex
Within the Services occupations in Black Forest, the most male-oriented occupations are Law Enforcement (100.0%), Security & Protection (62.9%), and Cleaning & Maintenance (41.9%), while the most female-oriented occupations are Healthcare Support (100.0%), Personal Care & Service (80.5%), and Food Preparation & Serving (69.2%).
| Occupation | Male | Female |
| Healthcare Support | 0 (0.0%) | 166 (100.0%) |
| Security & Protection | 127 (62.9%) | 75 (37.1%) |
| Firefighting & Prevention | 44 (37.0%) | 75 (63.0%) |
| Law Enforcement | 83 (100.0%) | 0 (0.0%) |
| Food Preparation & Serving | 37 (30.8%) | 83 (69.2%) |
| Cleaning & Maintenance | 18 (41.9%) | 25 (58.1%) |
| Personal Care & Service | 32 (19.5%) | 132 (80.5%) |
| Total (Category) | 214 (30.8%) | 481 (69.2%) |
| Total (Overall) | 3,633 (54.5%) | 3,029 (45.5%) |
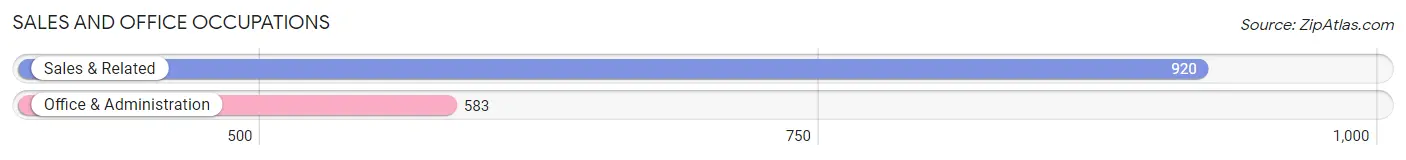
Sales and Office Occupations
The most common Sales and Office occupations in Black Forest are Sales & Related (920 | 13.8%), and Office & Administration (583 | 8.7%).
Sales and Office Occupations by Sex
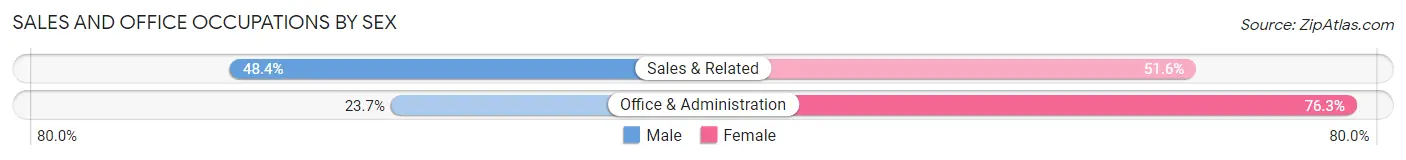
| Occupation | Male | Female |
| Sales & Related | 445 (48.4%) | 475 (51.6%) |
| Office & Administration | 138 (23.7%) | 445 (76.3%) |
| Total (Category) | 583 (38.8%) | 920 (61.2%) |
| Total (Overall) | 3,633 (54.5%) | 3,029 (45.5%) |
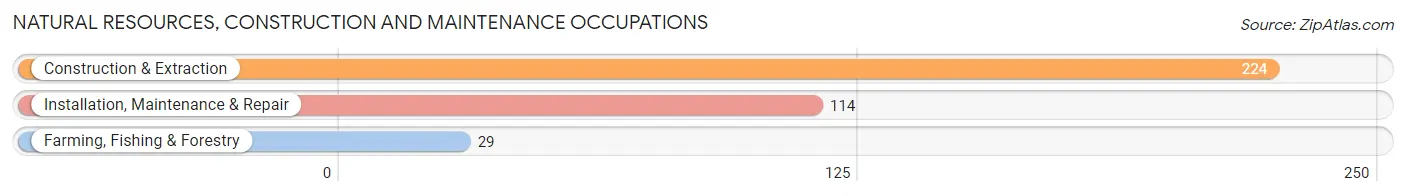
Natural Resources, Construction and Maintenance Occupations
The most common Natural Resources, Construction and Maintenance occupations in Black Forest are Construction & Extraction (224 | 3.4%), Installation, Maintenance & Repair (114 | 1.7%), and Farming, Fishing & Forestry (29 | 0.4%).
Natural Resources, Construction and Maintenance Occupations by Sex
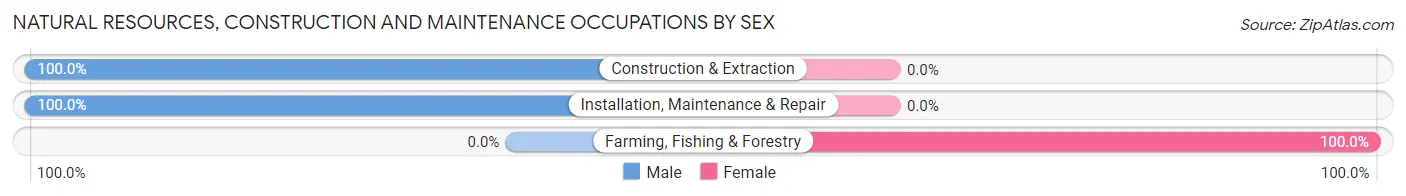
| Occupation | Male | Female |
| Farming, Fishing & Forestry | 0 (0.0%) | 29 (100.0%) |
| Construction & Extraction | 224 (100.0%) | 0 (0.0%) |
| Installation, Maintenance & Repair | 114 (100.0%) | 0 (0.0%) |
| Total (Category) | 338 (92.1%) | 29 (7.9%) |
| Total (Overall) | 3,633 (54.5%) | 3,029 (45.5%) |
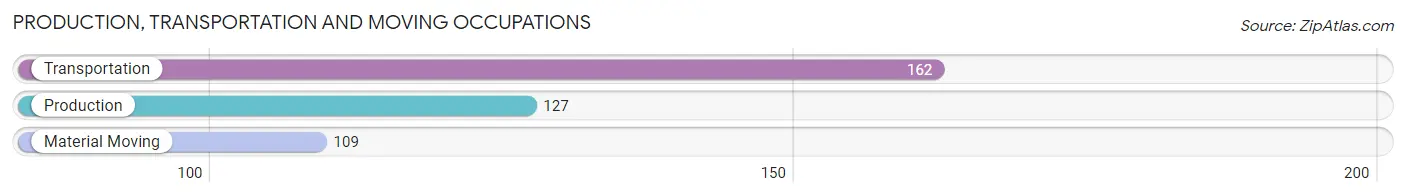
Production, Transportation and Moving Occupations
The most common Production, Transportation and Moving occupations in Black Forest are Transportation (162 | 2.4%), Production (127 | 1.9%), and Material Moving (109 | 1.6%).
Production, Transportation and Moving Occupations by Sex
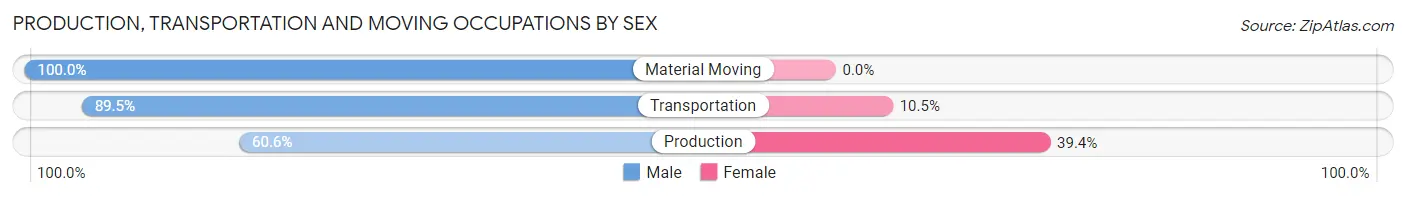
| Occupation | Male | Female |
| Production | 77 (60.6%) | 50 (39.4%) |
| Transportation | 145 (89.5%) | 17 (10.5%) |
| Material Moving | 109 (100.0%) | 0 (0.0%) |
| Total (Category) | 331 (83.2%) | 67 (16.8%) |
| Total (Overall) | 3,633 (54.5%) | 3,029 (45.5%) |
Employment Industries by Sex in Black Forest
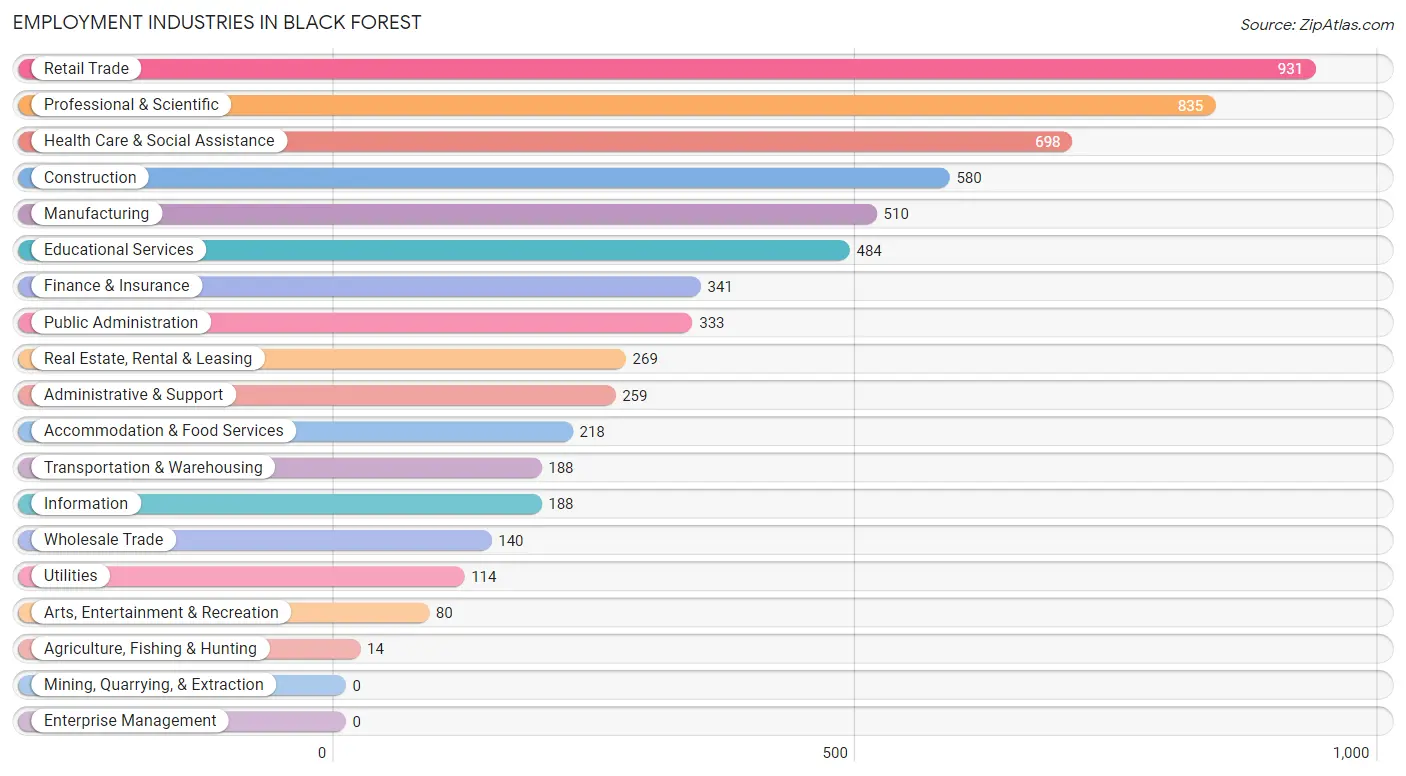
Employment Industries in Black Forest
The major employment industries in Black Forest include Retail Trade (931 | 14.0%), Professional & Scientific (835 | 12.5%), Health Care & Social Assistance (698 | 10.5%), Construction (580 | 8.7%), and Manufacturing (510 | 7.7%).
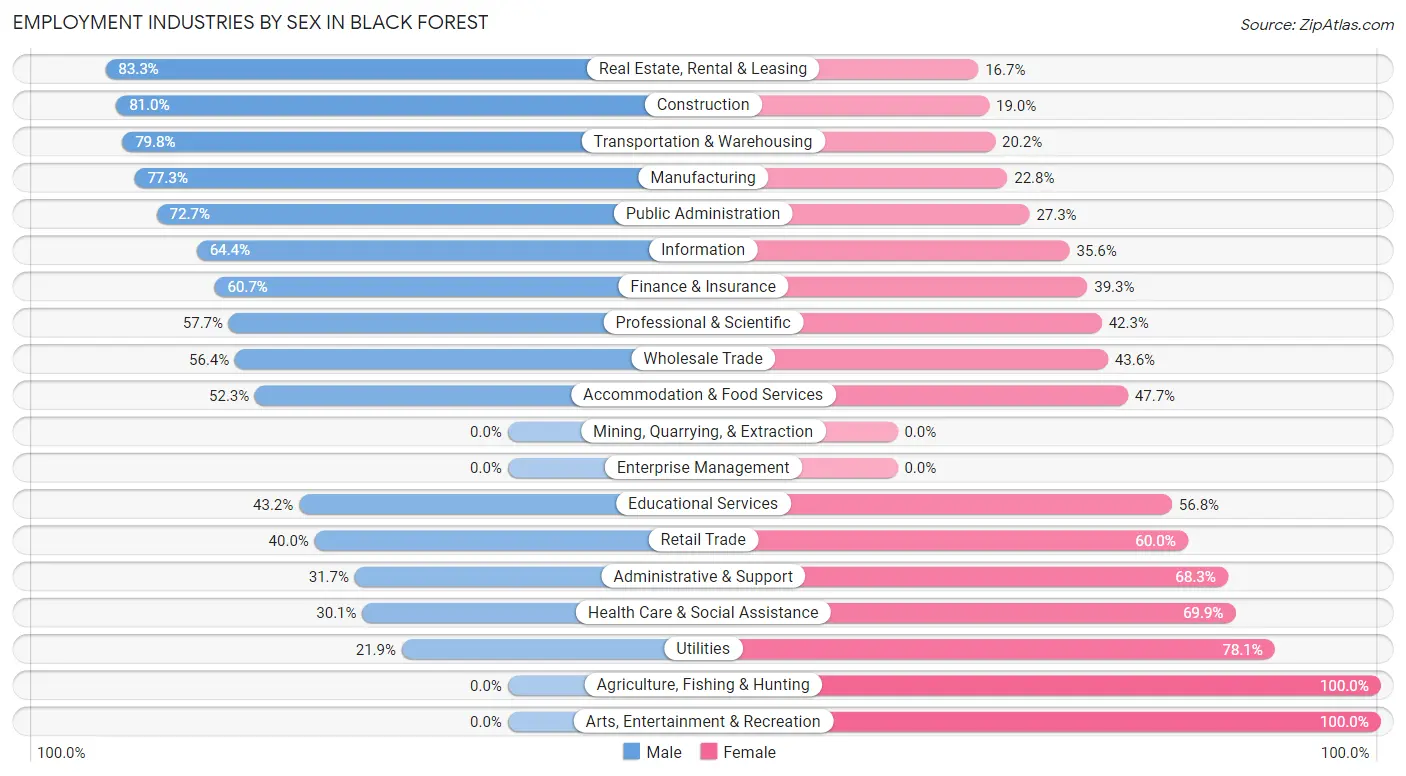
Employment Industries by Sex in Black Forest
The Black Forest industries that see more men than women are Real Estate, Rental & Leasing (83.3%), Construction (81.0%), and Transportation & Warehousing (79.8%), whereas the industries that tend to have a higher number of women are Agriculture, Fishing & Hunting (100.0%), Arts, Entertainment & Recreation (100.0%), and Utilities (78.1%).
| Industry | Male | Female |
| Agriculture, Fishing & Hunting | 0 (0.0%) | 14 (100.0%) |
| Mining, Quarrying, & Extraction | 0 (0.0%) | 0 (0.0%) |
| Construction | 470 (81.0%) | 110 (19.0%) |
| Manufacturing | 394 (77.2%) | 116 (22.8%) |
| Wholesale Trade | 79 (56.4%) | 61 (43.6%) |
| Retail Trade | 372 (40.0%) | 559 (60.0%) |
| Transportation & Warehousing | 150 (79.8%) | 38 (20.2%) |
| Utilities | 25 (21.9%) | 89 (78.1%) |
| Information | 121 (64.4%) | 67 (35.6%) |
| Finance & Insurance | 207 (60.7%) | 134 (39.3%) |
| Real Estate, Rental & Leasing | 224 (83.3%) | 45 (16.7%) |
| Professional & Scientific | 482 (57.7%) | 353 (42.3%) |
| Enterprise Management | 0 (0.0%) | 0 (0.0%) |
| Administrative & Support | 82 (31.7%) | 177 (68.3%) |
| Educational Services | 209 (43.2%) | 275 (56.8%) |
| Health Care & Social Assistance | 210 (30.1%) | 488 (69.9%) |
| Arts, Entertainment & Recreation | 0 (0.0%) | 80 (100.0%) |
| Accommodation & Food Services | 114 (52.3%) | 104 (47.7%) |
| Public Administration | 242 (72.7%) | 91 (27.3%) |
| Total | 3,633 (54.5%) | 3,029 (45.5%) |
Education in Black Forest
School Enrollment in Black Forest
The most common levels of schooling among the 3,400 students in Black Forest are high school (1,054 | 31.0%), middle school (856 | 25.2%), and elementary school (756 | 22.2%).
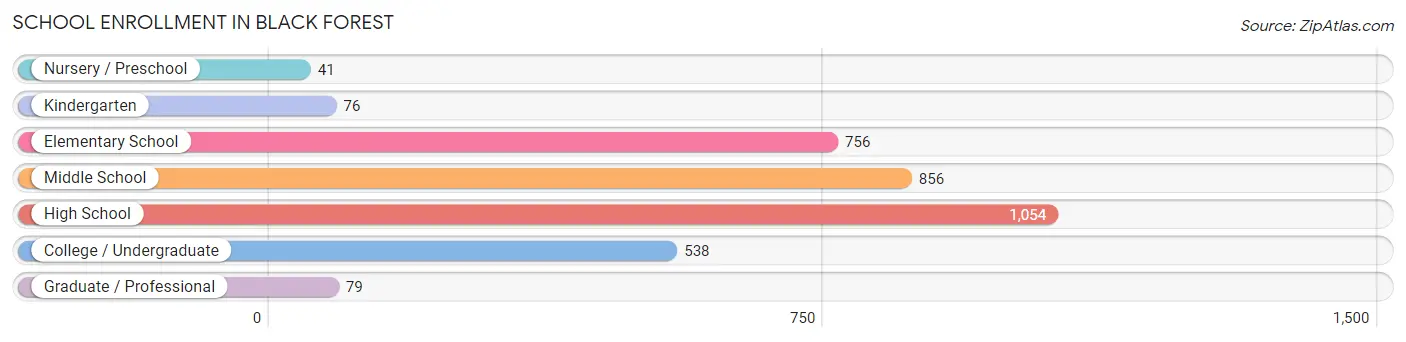
| School Level | # Students | % Students |
| Nursery / Preschool | 41 | 1.2% |
| Kindergarten | 76 | 2.2% |
| Elementary School | 756 | 22.2% |
| Middle School | 856 | 25.2% |
| High School | 1,054 | 31.0% |
| College / Undergraduate | 538 | 15.8% |
| Graduate / Professional | 79 | 2.3% |
| Total | 3,400 | 100.0% |
School Enrollment by Age by Funding Source in Black Forest
Out of a total of 3,400 students who are enrolled in schools in Black Forest, 666 (19.6%) attend a private institution, while the remaining 2,734 (80.4%) are enrolled in public schools. The age group of 35 years and over has the highest likelihood of being enrolled in private schools, with 82 (44.1% in the age bracket) enrolled. Conversely, the age group of 3 to 4 year olds has the lowest likelihood of being enrolled in a private school, with 23 (100.0% in the age bracket) attending a public institution.
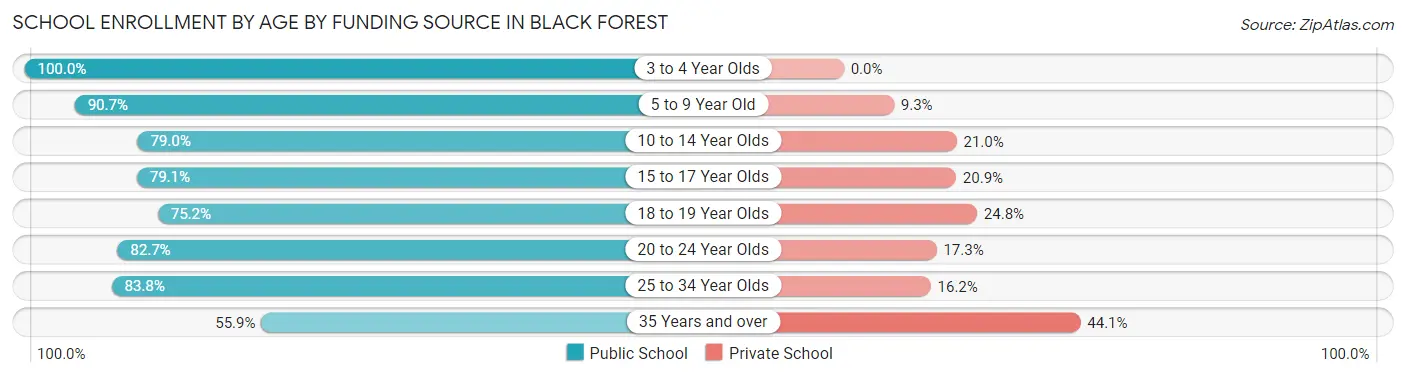
| Age Bracket | Public School | Private School |
| 3 to 4 Year Olds | 23 (100.0%) | 0 (0.0%) |
| 5 to 9 Year Old | 641 (90.7%) | 66 (9.3%) |
| 10 to 14 Year Olds | 845 (79.0%) | 225 (21.0%) |
| 15 to 17 Year Olds | 643 (79.1%) | 170 (20.9%) |
| 18 to 19 Year Olds | 212 (75.2%) | 70 (24.8%) |
| 20 to 24 Year Olds | 177 (82.7%) | 37 (17.3%) |
| 25 to 34 Year Olds | 88 (83.8%) | 17 (16.2%) |
| 35 Years and over | 104 (55.9%) | 82 (44.1%) |
| Total | 2,734 (80.4%) | 666 (19.6%) |
Educational Attainment by Field of Study in Black Forest
Business (1,227 | 20.1%), science & technology (726 | 11.9%), engineering (585 | 9.6%), computers & mathematics (562 | 9.2%), and education (560 | 9.2%) are the most common fields of study among 6,102 individuals in Black Forest who have obtained a bachelor's degree or higher.
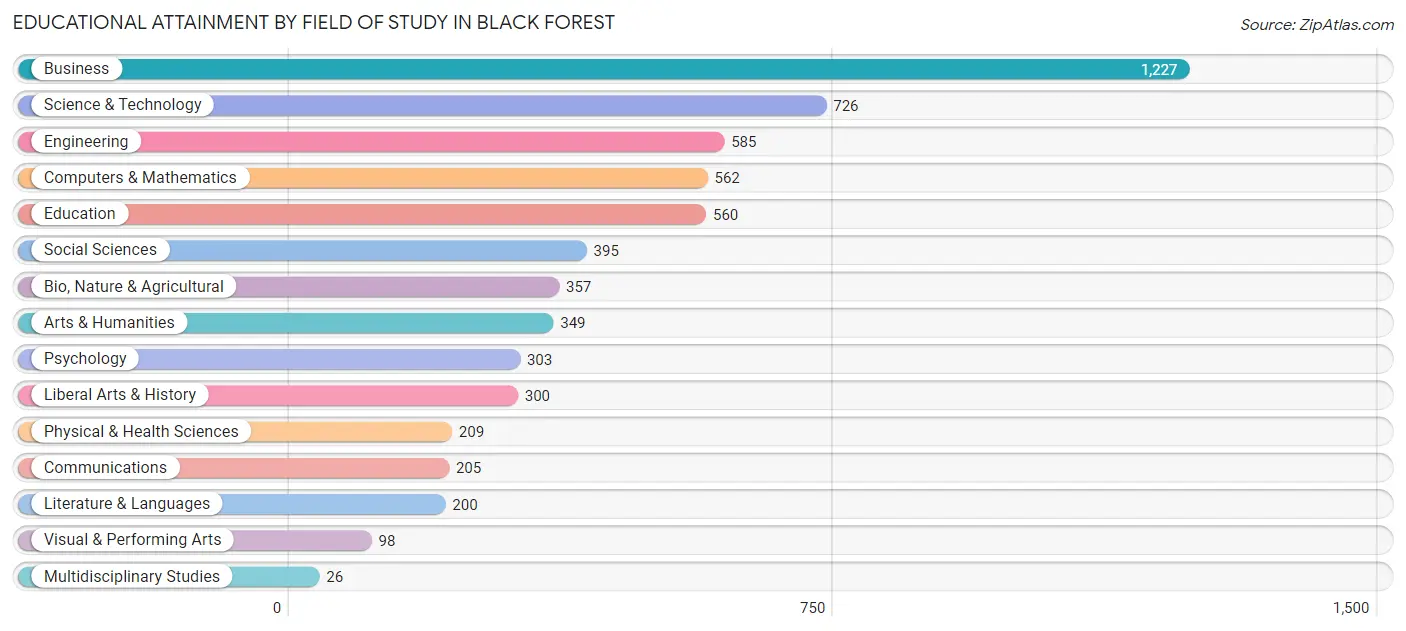
| Field of Study | # Graduates | % Graduates |
| Computers & Mathematics | 562 | 9.2% |
| Bio, Nature & Agricultural | 357 | 5.9% |
| Physical & Health Sciences | 209 | 3.4% |
| Psychology | 303 | 5.0% |
| Social Sciences | 395 | 6.5% |
| Engineering | 585 | 9.6% |
| Multidisciplinary Studies | 26 | 0.4% |
| Science & Technology | 726 | 11.9% |
| Business | 1,227 | 20.1% |
| Education | 560 | 9.2% |
| Literature & Languages | 200 | 3.3% |
| Liberal Arts & History | 300 | 4.9% |
| Visual & Performing Arts | 98 | 1.6% |
| Communications | 205 | 3.4% |
| Arts & Humanities | 349 | 5.7% |
| Total | 6,102 | 100.0% |
Transportation & Commute in Black Forest
Vehicle Availability by Sex in Black Forest
The most prevalent vehicle ownership categories in Black Forest are males with 3 vehicles (1,378, accounting for 37.8%) and females with 3 vehicles (1,212, making up 45.5%).
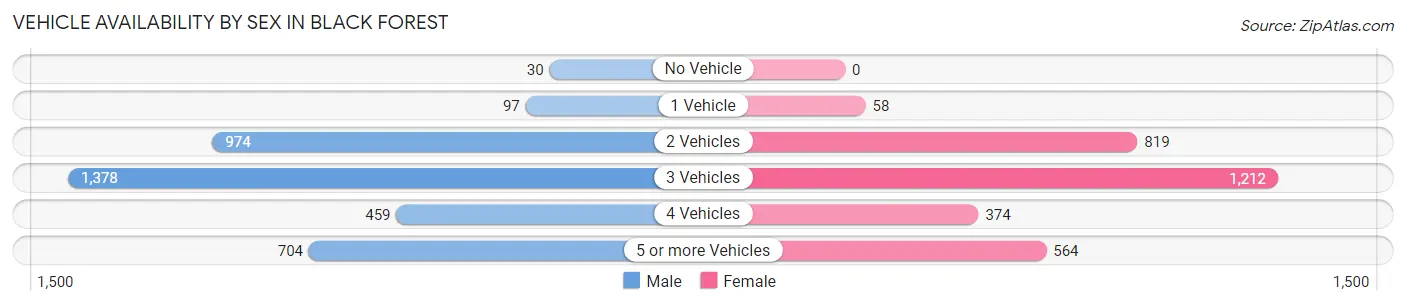
| Vehicles Available | Male | Female |
| No Vehicle | 30 (0.8%) | 0 (0.0%) |
| 1 Vehicle | 97 (2.7%) | 58 (1.9%) |
| 2 Vehicles | 974 (26.7%) | 819 (27.1%) |
| 3 Vehicles | 1,378 (37.8%) | 1,212 (40.0%) |
| 4 Vehicles | 459 (12.6%) | 374 (12.4%) |
| 5 or more Vehicles | 704 (19.3%) | 564 (18.6%) |
| Total | 3,642 (100.0%) | 3,027 (100.0%) |
Commute Time in Black Forest
The most frequently occuring commute durations in Black Forest are 30 to 34 minutes (1,047 commuters, 21.8%), 20 to 24 minutes (559 commuters, 11.6%), and 25 to 29 minutes (544 commuters, 11.3%).
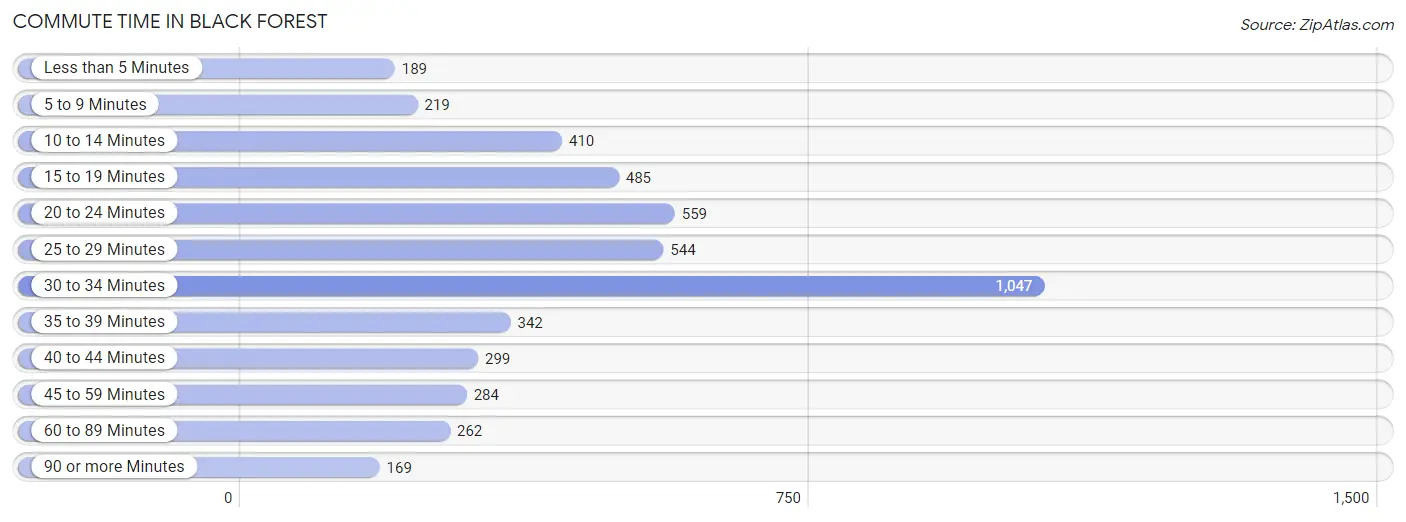
| Commute Time | # Commuters | % Commuters |
| Less than 5 Minutes | 189 | 3.9% |
| 5 to 9 Minutes | 219 | 4.5% |
| 10 to 14 Minutes | 410 | 8.5% |
| 15 to 19 Minutes | 485 | 10.1% |
| 20 to 24 Minutes | 559 | 11.6% |
| 25 to 29 Minutes | 544 | 11.3% |
| 30 to 34 Minutes | 1,047 | 21.8% |
| 35 to 39 Minutes | 342 | 7.1% |
| 40 to 44 Minutes | 299 | 6.2% |
| 45 to 59 Minutes | 284 | 5.9% |
| 60 to 89 Minutes | 262 | 5.4% |
| 90 or more Minutes | 169 | 3.5% |
Commute Time by Sex in Black Forest
The most common commute times in Black Forest are 30 to 34 minutes (492 commuters, 18.0%) for males and 30 to 34 minutes (555 commuters, 26.7%) for females.
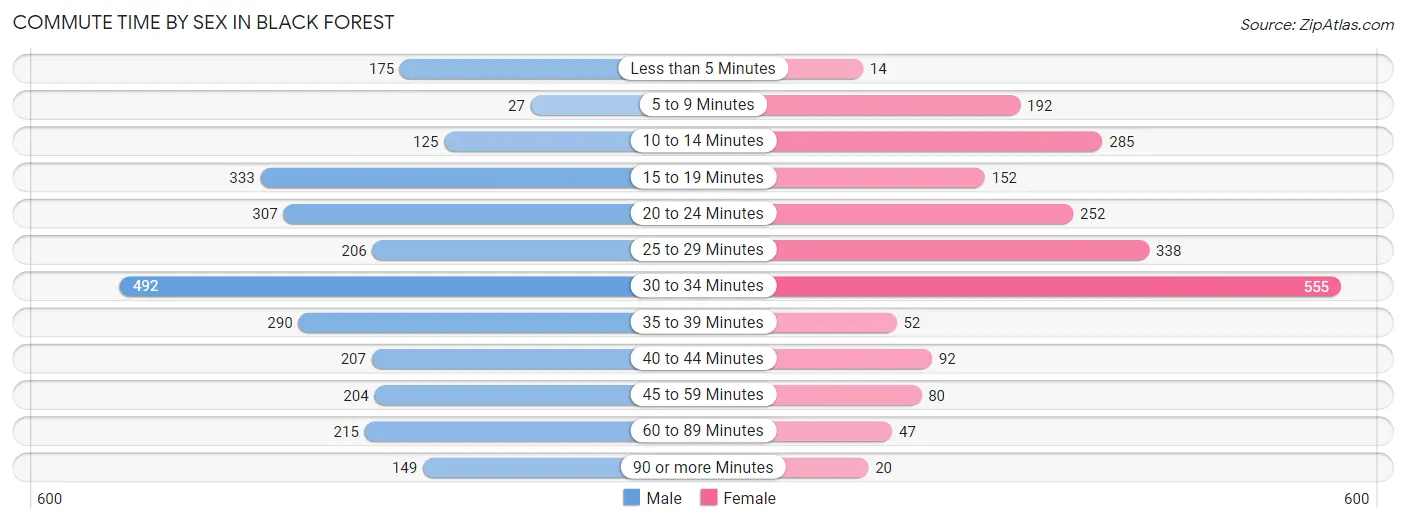
| Commute Time | Male | Female |
| Less than 5 Minutes | 175 (6.4%) | 14 (0.7%) |
| 5 to 9 Minutes | 27 (1.0%) | 192 (9.2%) |
| 10 to 14 Minutes | 125 (4.6%) | 285 (13.7%) |
| 15 to 19 Minutes | 333 (12.2%) | 152 (7.3%) |
| 20 to 24 Minutes | 307 (11.3%) | 252 (12.1%) |
| 25 to 29 Minutes | 206 (7.5%) | 338 (16.3%) |
| 30 to 34 Minutes | 492 (18.0%) | 555 (26.7%) |
| 35 to 39 Minutes | 290 (10.6%) | 52 (2.5%) |
| 40 to 44 Minutes | 207 (7.6%) | 92 (4.4%) |
| 45 to 59 Minutes | 204 (7.5%) | 80 (3.8%) |
| 60 to 89 Minutes | 215 (7.9%) | 47 (2.3%) |
| 90 or more Minutes | 149 (5.5%) | 20 (1.0%) |
Time of Departure to Work by Sex in Black Forest
The most frequent times of departure to work in Black Forest are 7:30 AM to 7:59 AM (387, 14.2%) for males and 7:30 AM to 7:59 AM (464, 22.3%) for females.
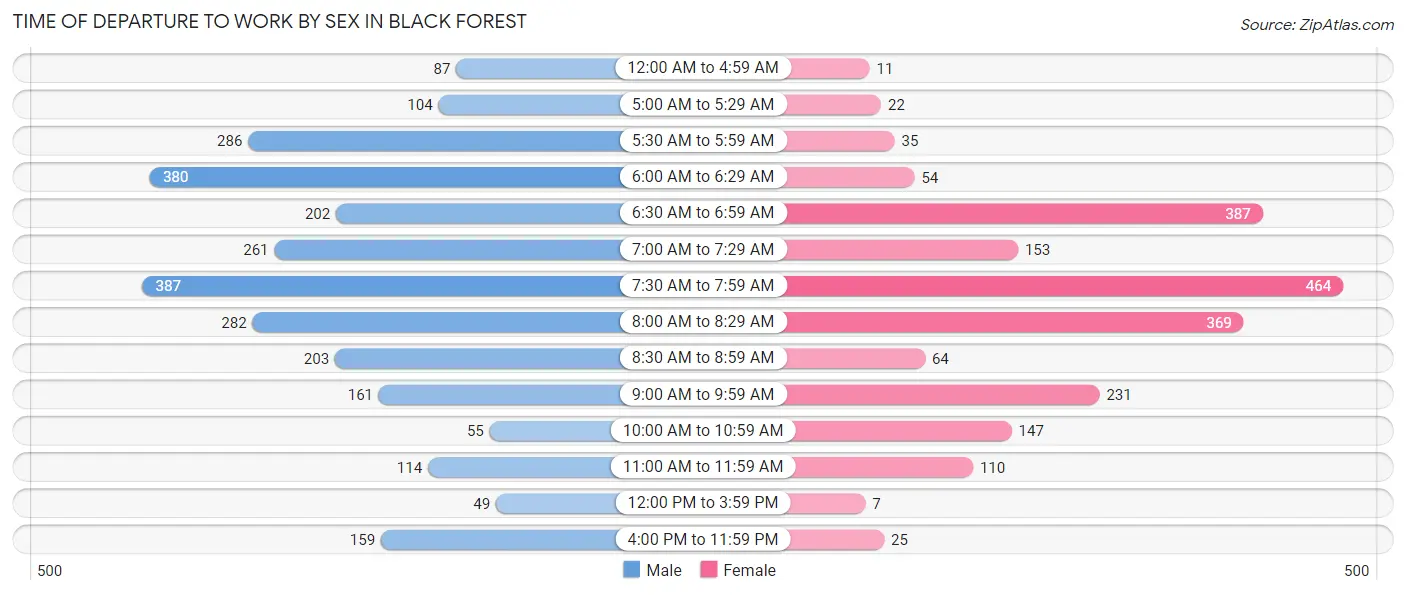
| Time of Departure | Male | Female |
| 12:00 AM to 4:59 AM | 87 (3.2%) | 11 (0.5%) |
| 5:00 AM to 5:29 AM | 104 (3.8%) | 22 (1.1%) |
| 5:30 AM to 5:59 AM | 286 (10.5%) | 35 (1.7%) |
| 6:00 AM to 6:29 AM | 380 (13.9%) | 54 (2.6%) |
| 6:30 AM to 6:59 AM | 202 (7.4%) | 387 (18.6%) |
| 7:00 AM to 7:29 AM | 261 (9.6%) | 153 (7.4%) |
| 7:30 AM to 7:59 AM | 387 (14.2%) | 464 (22.3%) |
| 8:00 AM to 8:29 AM | 282 (10.3%) | 369 (17.7%) |
| 8:30 AM to 8:59 AM | 203 (7.4%) | 64 (3.1%) |
| 9:00 AM to 9:59 AM | 161 (5.9%) | 231 (11.1%) |
| 10:00 AM to 10:59 AM | 55 (2.0%) | 147 (7.1%) |
| 11:00 AM to 11:59 AM | 114 (4.2%) | 110 (5.3%) |
| 12:00 PM to 3:59 PM | 49 (1.8%) | 7 (0.3%) |
| 4:00 PM to 11:59 PM | 159 (5.8%) | 25 (1.2%) |
| Total | 2,730 (100.0%) | 2,079 (100.0%) |
Housing Occupancy in Black Forest
Occupancy by Ownership in Black Forest
Of the total 5,150 dwellings in Black Forest, owner-occupied units account for 4,848 (94.1%), while renter-occupied units make up 302 (5.9%).
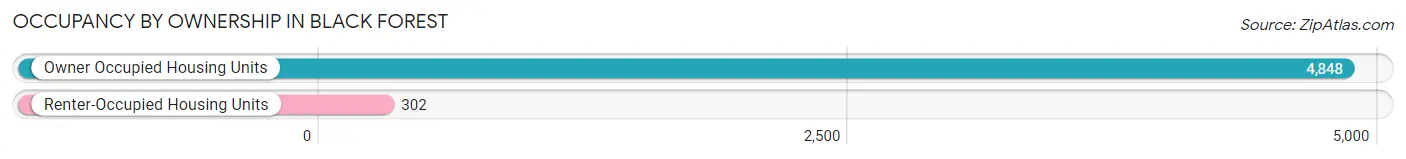
| Occupancy | # Housing Units | % Housing Units |
| Owner Occupied Housing Units | 4,848 | 94.1% |
| Renter-Occupied Housing Units | 302 | 5.9% |
| Total Occupied Housing Units | 5,150 | 100.0% |
Occupancy by Household Size in Black Forest
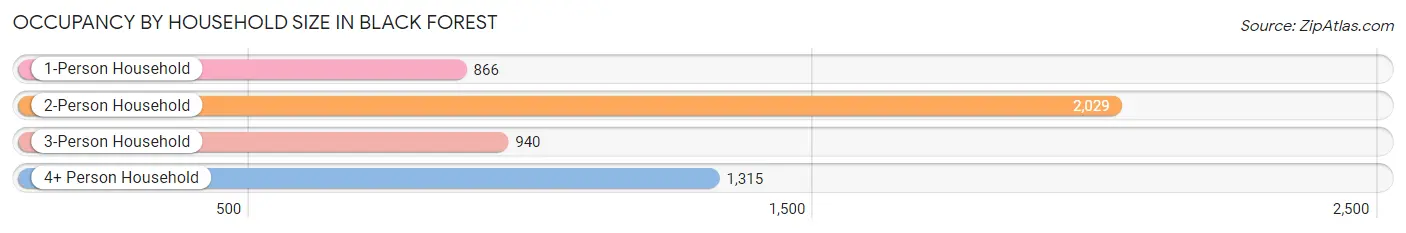
| Household Size | # Housing Units | % Housing Units |
| 1-Person Household | 866 | 16.8% |
| 2-Person Household | 2,029 | 39.4% |
| 3-Person Household | 940 | 18.2% |
| 4+ Person Household | 1,315 | 25.5% |
| Total Housing Units | 5,150 | 100.0% |
Occupancy by Ownership by Household Size in Black Forest
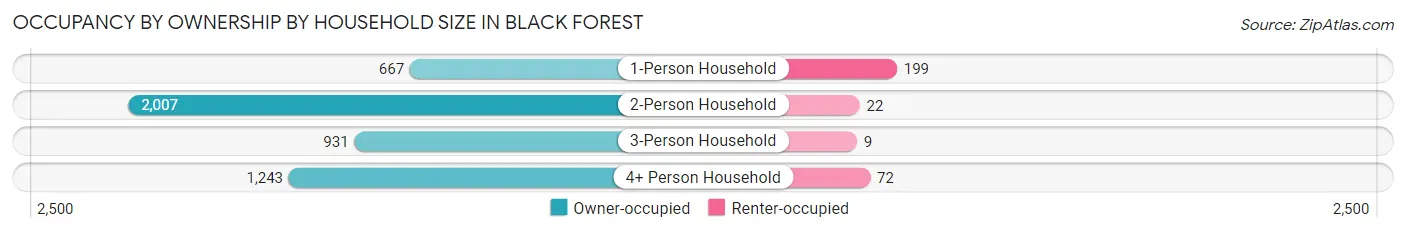
| Household Size | Owner-occupied | Renter-occupied |
| 1-Person Household | 667 (77.0%) | 199 (23.0%) |
| 2-Person Household | 2,007 (98.9%) | 22 (1.1%) |
| 3-Person Household | 931 (99.0%) | 9 (1.0%) |
| 4+ Person Household | 1,243 (94.5%) | 72 (5.5%) |
| Total Housing Units | 4,848 (94.1%) | 302 (5.9%) |
Occupancy by Educational Attainment in Black Forest
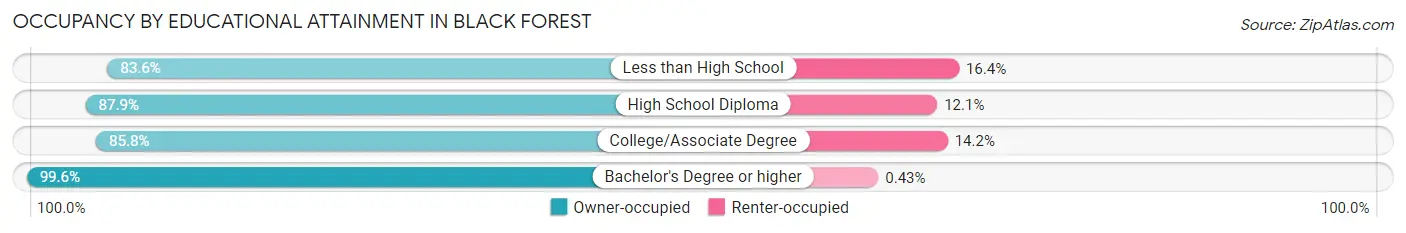
| Household Size | Owner-occupied | Renter-occupied |
| Less than High School | 56 (83.6%) | 11 (16.4%) |
| High School Diploma | 450 (87.9%) | 62 (12.1%) |
| College/Associate Degree | 1,306 (85.8%) | 216 (14.2%) |
| Bachelor's Degree or higher | 3,036 (99.6%) | 13 (0.4%) |
Occupancy by Age of Householder in Black Forest
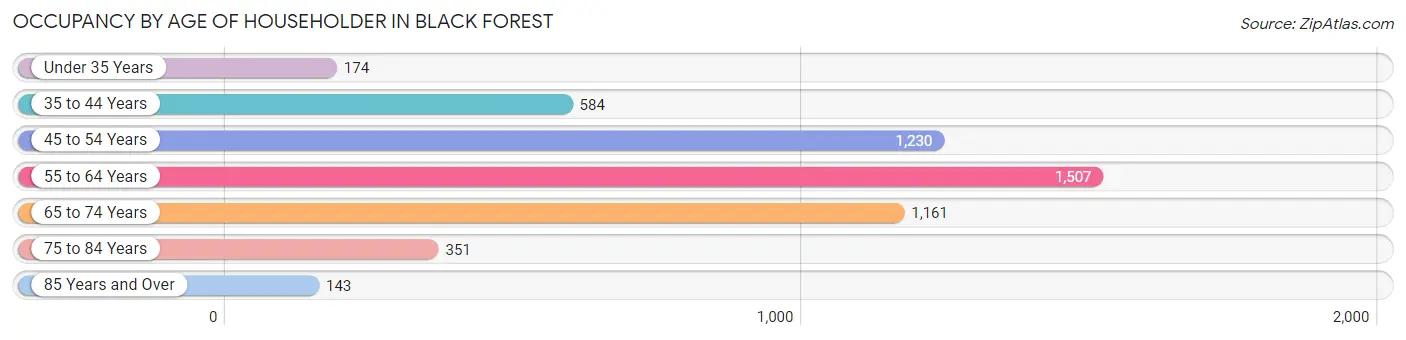
| Age Bracket | # Households | % Households |
| Under 35 Years | 174 | 3.4% |
| 35 to 44 Years | 584 | 11.3% |
| 45 to 54 Years | 1,230 | 23.9% |
| 55 to 64 Years | 1,507 | 29.3% |
| 65 to 74 Years | 1,161 | 22.5% |
| 75 to 84 Years | 351 | 6.8% |
| 85 Years and Over | 143 | 2.8% |
| Total | 5,150 | 100.0% |
Housing Finances in Black Forest
Median Income by Occupancy in Black Forest
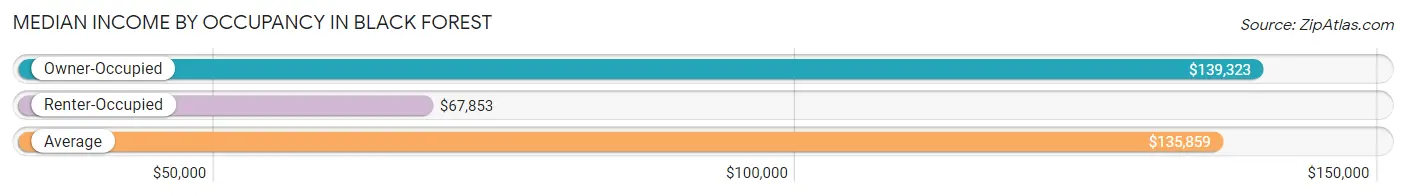
| Occupancy Type | # Households | Median Income |
| Owner-Occupied | 4,848 (94.1%) | $139,323 |
| Renter-Occupied | 302 (5.9%) | $67,853 |
| Average | 5,150 (100.0%) | $135,859 |
Occupancy by Householder Income Bracket in Black Forest
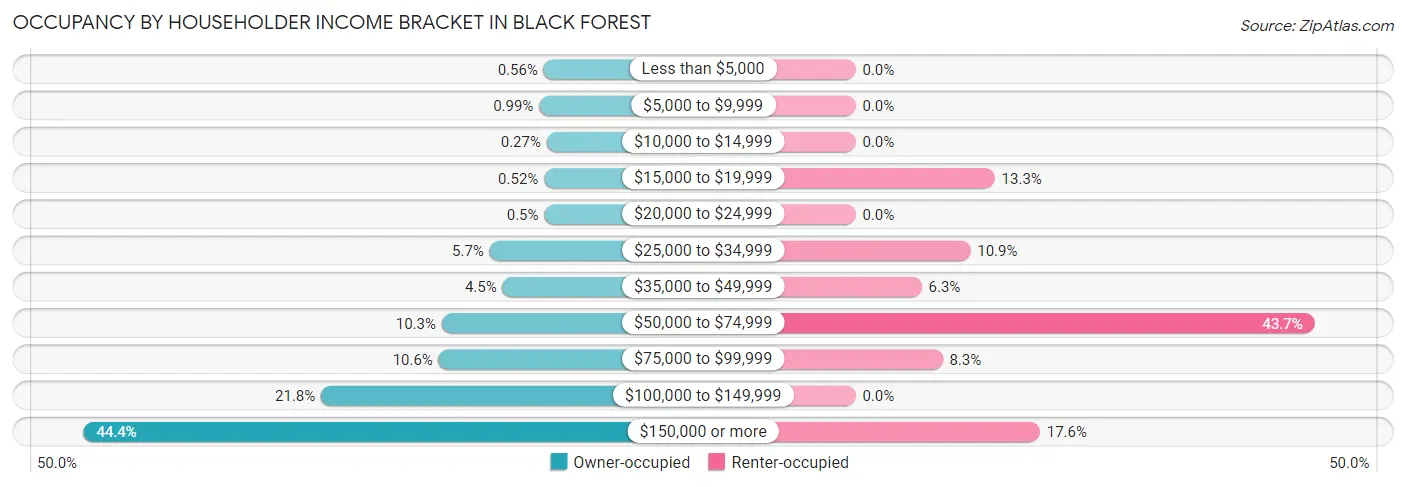
| Income Bracket | Owner-occupied | Renter-occupied |
| Less than $5,000 | 27 (0.6%) | 0 (0.0%) |
| $5,000 to $9,999 | 48 (1.0%) | 0 (0.0%) |
| $10,000 to $14,999 | 13 (0.3%) | 0 (0.0%) |
| $15,000 to $19,999 | 25 (0.5%) | 40 (13.3%) |
| $20,000 to $24,999 | 24 (0.5%) | 0 (0.0%) |
| $25,000 to $34,999 | 277 (5.7%) | 33 (10.9%) |
| $35,000 to $49,999 | 217 (4.5%) | 19 (6.3%) |
| $50,000 to $74,999 | 498 (10.3%) | 132 (43.7%) |
| $75,000 to $99,999 | 512 (10.6%) | 25 (8.3%) |
| $100,000 to $149,999 | 1,055 (21.8%) | 0 (0.0%) |
| $150,000 or more | 2,152 (44.4%) | 53 (17.5%) |
| Total | 4,848 (100.0%) | 302 (100.0%) |
Monthly Housing Cost Tiers in Black Forest
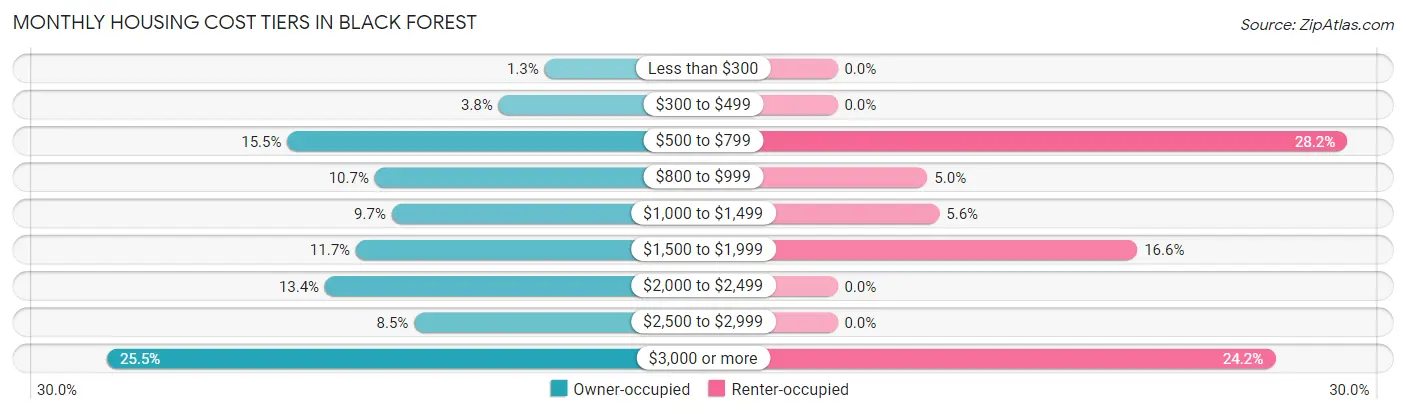
| Monthly Cost | Owner-occupied | Renter-occupied |
| Less than $300 | 62 (1.3%) | 0 (0.0%) |
| $300 to $499 | 185 (3.8%) | 0 (0.0%) |
| $500 to $799 | 751 (15.5%) | 85 (28.1%) |
| $800 to $999 | 517 (10.7%) | 15 (5.0%) |
| $1,000 to $1,499 | 471 (9.7%) | 17 (5.6%) |
| $1,500 to $1,999 | 567 (11.7%) | 50 (16.6%) |
| $2,000 to $2,499 | 650 (13.4%) | 0 (0.0%) |
| $2,500 to $2,999 | 411 (8.5%) | 0 (0.0%) |
| $3,000 or more | 1,234 (25.5%) | 73 (24.2%) |
| Total | 4,848 (100.0%) | 302 (100.0%) |
Physical Housing Characteristics in Black Forest
Housing Structures in Black Forest
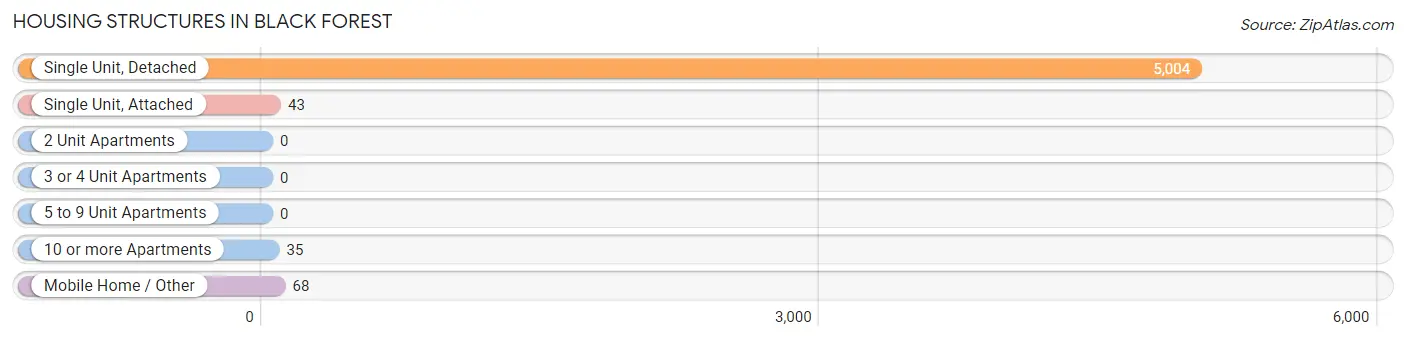
| Structure Type | # Housing Units | % Housing Units |
| Single Unit, Detached | 5,004 | 97.2% |
| Single Unit, Attached | 43 | 0.8% |
| 2 Unit Apartments | 0 | 0.0% |
| 3 or 4 Unit Apartments | 0 | 0.0% |
| 5 to 9 Unit Apartments | 0 | 0.0% |
| 10 or more Apartments | 35 | 0.7% |
| Mobile Home / Other | 68 | 1.3% |
| Total | 5,150 | 100.0% |
Housing Structures by Occupancy in Black Forest
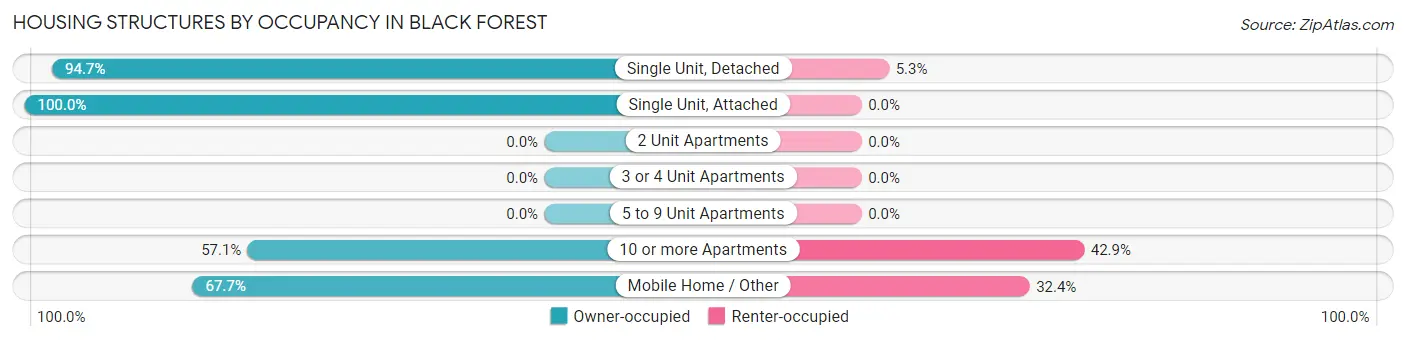
| Structure Type | Owner-occupied | Renter-occupied |
| Single Unit, Detached | 4,739 (94.7%) | 265 (5.3%) |
| Single Unit, Attached | 43 (100.0%) | 0 (0.0%) |
| 2 Unit Apartments | 0 (0.0%) | 0 (0.0%) |
| 3 or 4 Unit Apartments | 0 (0.0%) | 0 (0.0%) |
| 5 to 9 Unit Apartments | 0 (0.0%) | 0 (0.0%) |
| 10 or more Apartments | 20 (57.1%) | 15 (42.9%) |
| Mobile Home / Other | 46 (67.6%) | 22 (32.4%) |
| Total | 4,848 (94.1%) | 302 (5.9%) |
Housing Structures by Number of Rooms in Black Forest
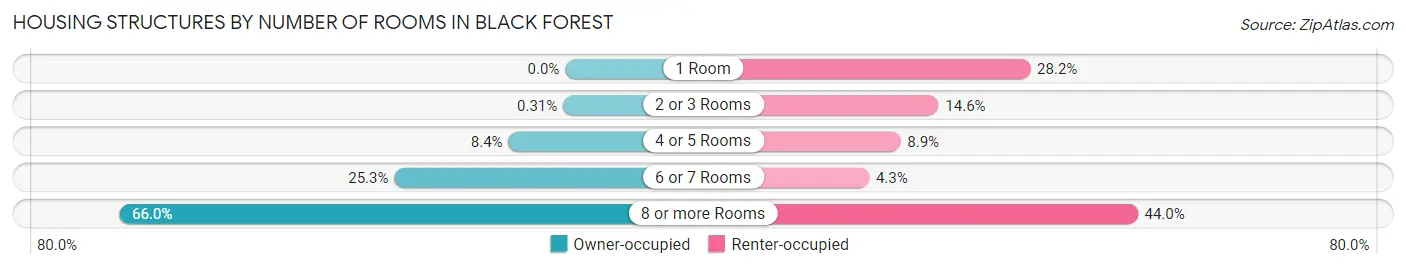
| Number of Rooms | Owner-occupied | Renter-occupied |
| 1 Room | 0 (0.0%) | 85 (28.1%) |
| 2 or 3 Rooms | 15 (0.3%) | 44 (14.6%) |
| 4 or 5 Rooms | 407 (8.4%) | 27 (8.9%) |
| 6 or 7 Rooms | 1,226 (25.3%) | 13 (4.3%) |
| 8 or more Rooms | 3,200 (66.0%) | 133 (44.0%) |
| Total | 4,848 (100.0%) | 302 (100.0%) |
Housing Structure by Heating Type in Black Forest
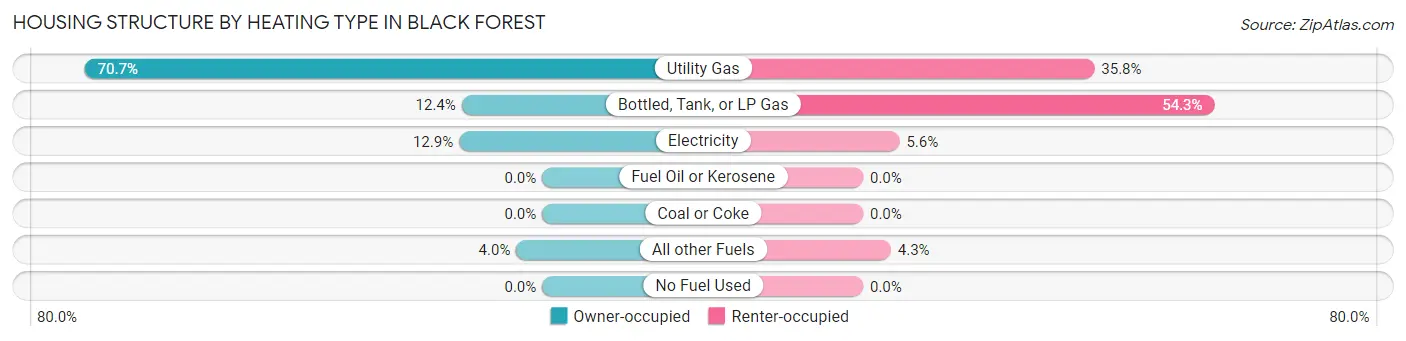
| Heating Type | Owner-occupied | Renter-occupied |
| Utility Gas | 3,428 (70.7%) | 108 (35.8%) |
| Bottled, Tank, or LP Gas | 603 (12.4%) | 164 (54.3%) |
| Electricity | 623 (12.9%) | 17 (5.6%) |
| Fuel Oil or Kerosene | 0 (0.0%) | 0 (0.0%) |
| Coal or Coke | 0 (0.0%) | 0 (0.0%) |
| All other Fuels | 194 (4.0%) | 13 (4.3%) |
| No Fuel Used | 0 (0.0%) | 0 (0.0%) |
| Total | 4,848 (100.0%) | 302 (100.0%) |
Household Vehicle Usage in Black Forest
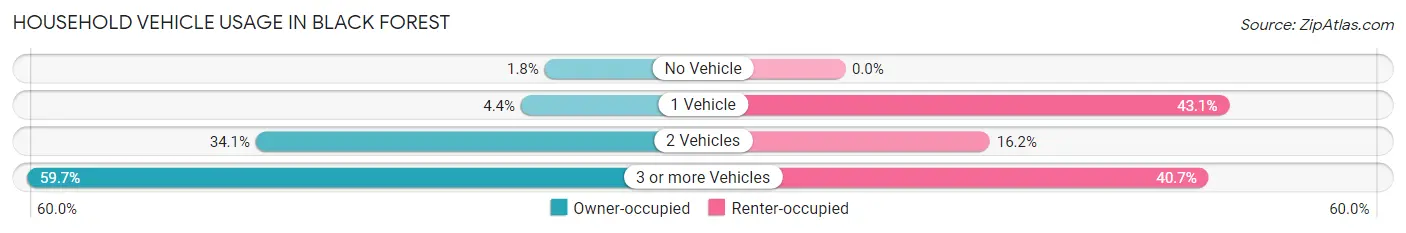
| Vehicles per Household | Owner-occupied | Renter-occupied |
| No Vehicle | 85 (1.8%) | 0 (0.0%) |
| 1 Vehicle | 214 (4.4%) | 130 (43.0%) |
| 2 Vehicles | 1,653 (34.1%) | 49 (16.2%) |
| 3 or more Vehicles | 2,896 (59.7%) | 123 (40.7%) |
| Total | 4,848 (100.0%) | 302 (100.0%) |
Real Estate & Mortgages in Black Forest
Real Estate and Mortgage Overview in Black Forest
| Characteristic | Without Mortgage | With Mortgage |
| Housing Units | 1,792 | 3,056 |
| Median Property Value | $750,900 | $739,100 |
| Median Household Income | $127,823 | $1,383 |
| Monthly Housing Costs | $737 | $1,234 |
| Real Estate Taxes | $3,056 | $27 |
Property Value by Mortgage Status in Black Forest
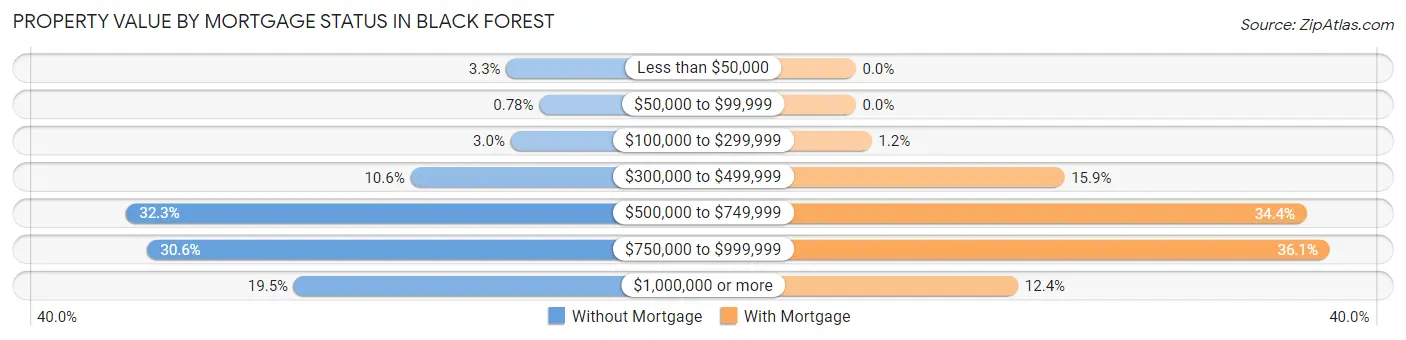
| Property Value | Without Mortgage | With Mortgage |
| Less than $50,000 | 59 (3.3%) | 0 (0.0%) |
| $50,000 to $99,999 | 14 (0.8%) | 0 (0.0%) |
| $100,000 to $299,999 | 53 (3.0%) | 37 (1.2%) |
| $300,000 to $499,999 | 190 (10.6%) | 486 (15.9%) |
| $500,000 to $749,999 | 578 (32.3%) | 1,051 (34.4%) |
| $750,000 to $999,999 | 549 (30.6%) | 1,104 (36.1%) |
| $1,000,000 or more | 349 (19.5%) | 378 (12.4%) |
| Total | 1,792 (100.0%) | 3,056 (100.0%) |
Household Income by Mortgage Status in Black Forest
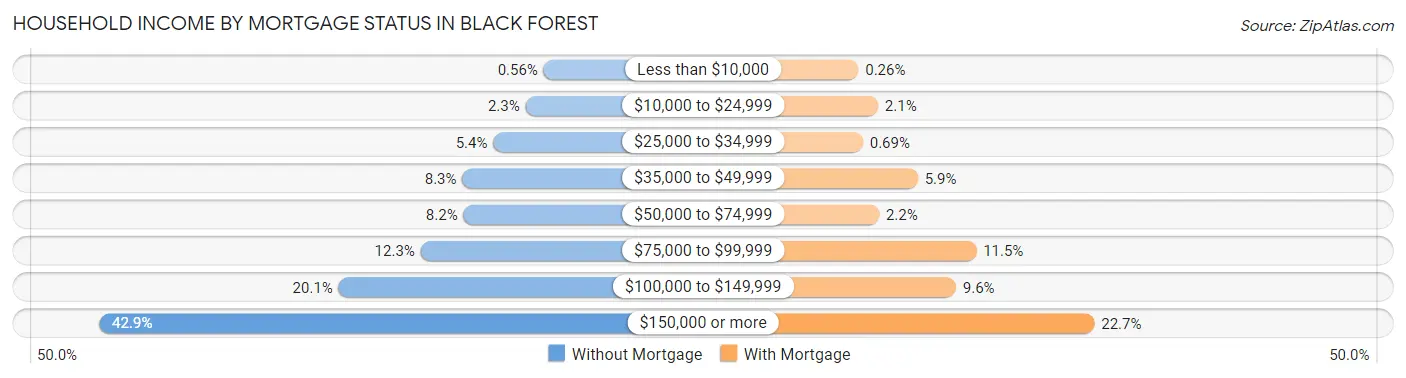
| Household Income | Without Mortgage | With Mortgage |
| Less than $10,000 | 10 (0.6%) | 8 (0.3%) |
| $10,000 to $24,999 | 41 (2.3%) | 65 (2.1%) |
| $25,000 to $34,999 | 96 (5.4%) | 21 (0.7%) |
| $35,000 to $49,999 | 149 (8.3%) | 181 (5.9%) |
| $50,000 to $74,999 | 147 (8.2%) | 68 (2.2%) |
| $75,000 to $99,999 | 220 (12.3%) | 351 (11.5%) |
| $100,000 to $149,999 | 360 (20.1%) | 292 (9.6%) |
| $150,000 or more | 769 (42.9%) | 695 (22.7%) |
| Total | 1,792 (100.0%) | 3,056 (100.0%) |
Property Value to Household Income Ratio in Black Forest
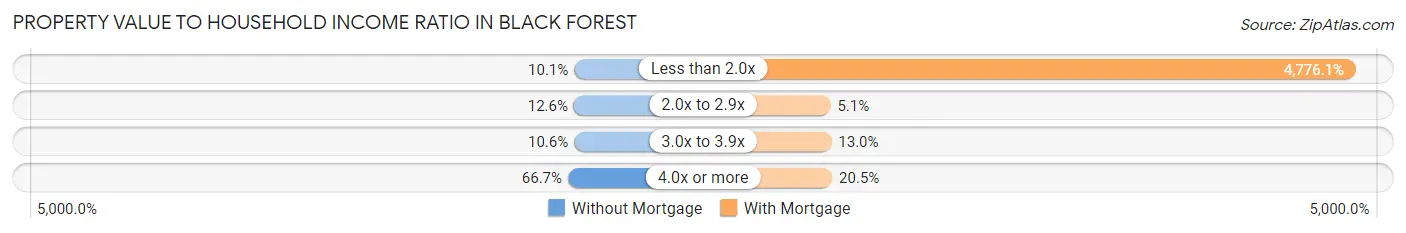
| Value-to-Income Ratio | Without Mortgage | With Mortgage |
| Less than 2.0x | 181 (10.1%) | 145,956 (4,776.1%) |
| 2.0x to 2.9x | 226 (12.6%) | 156 (5.1%) |
| 3.0x to 3.9x | 189 (10.5%) | 398 (13.0%) |
| 4.0x or more | 1,196 (66.7%) | 627 (20.5%) |
| Total | 1,792 (100.0%) | 3,056 (100.0%) |
Real Estate Taxes by Mortgage Status in Black Forest
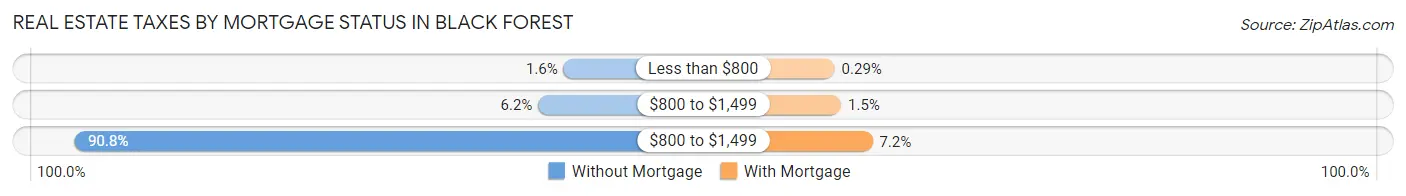
| Property Taxes | Without Mortgage | With Mortgage |
| Less than $800 | 28 (1.6%) | 9 (0.3%) |
| $800 to $1,499 | 111 (6.2%) | 45 (1.5%) |
| $800 to $1,499 | 1,627 (90.8%) | 220 (7.2%) |
| Total | 1,792 (100.0%) | 3,056 (100.0%) |
Health & Disability in Black Forest
Health Insurance Coverage by Age in Black Forest
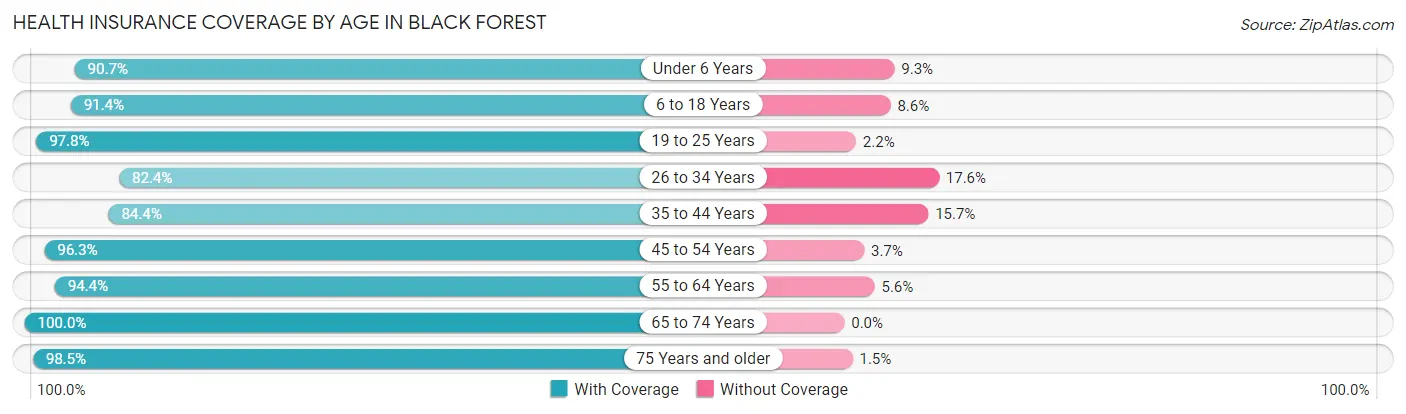
| Age Bracket | With Coverage | Without Coverage |
| Under 6 Years | 621 (90.7%) | 64 (9.3%) |
| 6 to 18 Years | 2,432 (91.4%) | 229 (8.6%) |
| 19 to 25 Years | 766 (97.8%) | 17 (2.2%) |
| 26 to 34 Years | 612 (82.4%) | 131 (17.6%) |
| 35 to 44 Years | 1,207 (84.4%) | 224 (15.7%) |
| 45 to 54 Years | 2,328 (96.3%) | 89 (3.7%) |
| 55 to 64 Years | 2,744 (94.4%) | 164 (5.6%) |
| 65 to 74 Years | 2,039 (100.0%) | 0 (0.0%) |
| 75 Years and older | 707 (98.5%) | 11 (1.5%) |
| Total | 13,456 (93.5%) | 929 (6.5%) |
Health Insurance Coverage by Citizenship Status in Black Forest
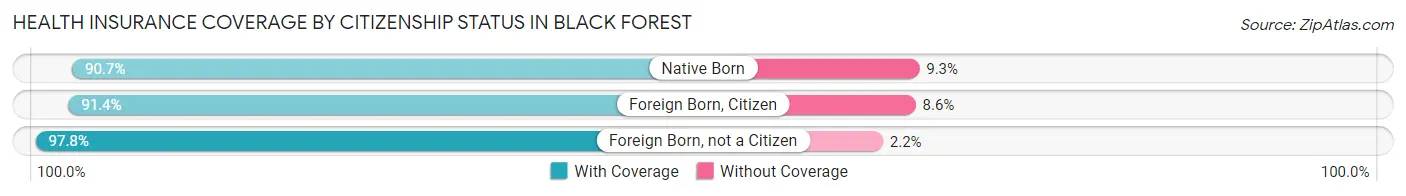
| Citizenship Status | With Coverage | Without Coverage |
| Native Born | 621 (90.7%) | 64 (9.3%) |
| Foreign Born, Citizen | 2,432 (91.4%) | 229 (8.6%) |
| Foreign Born, not a Citizen | 766 (97.8%) | 17 (2.2%) |
Health Insurance Coverage by Household Income in Black Forest
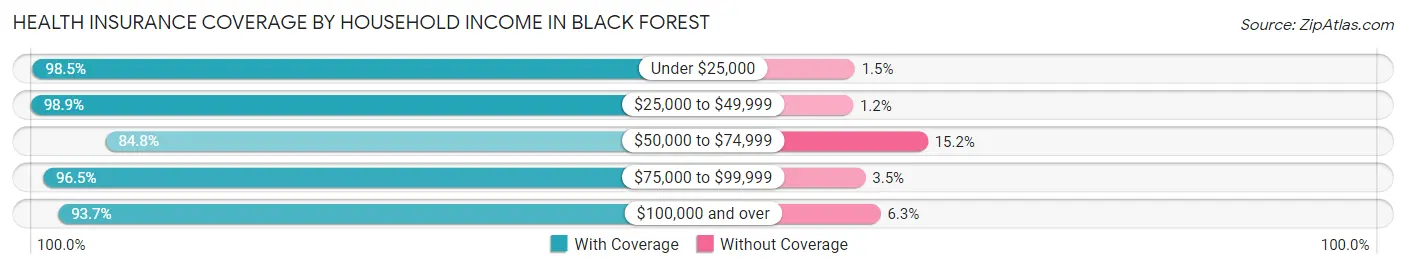
| Household Income | With Coverage | Without Coverage |
| Under $25,000 | 265 (98.5%) | 4 (1.5%) |
| $25,000 to $49,999 | 860 (98.9%) | 10 (1.1%) |
| $50,000 to $74,999 | 1,086 (84.8%) | 194 (15.2%) |
| $75,000 to $99,999 | 1,336 (96.5%) | 48 (3.5%) |
| $100,000 and over | 9,908 (93.7%) | 667 (6.3%) |
Public vs Private Health Insurance Coverage by Age in Black Forest
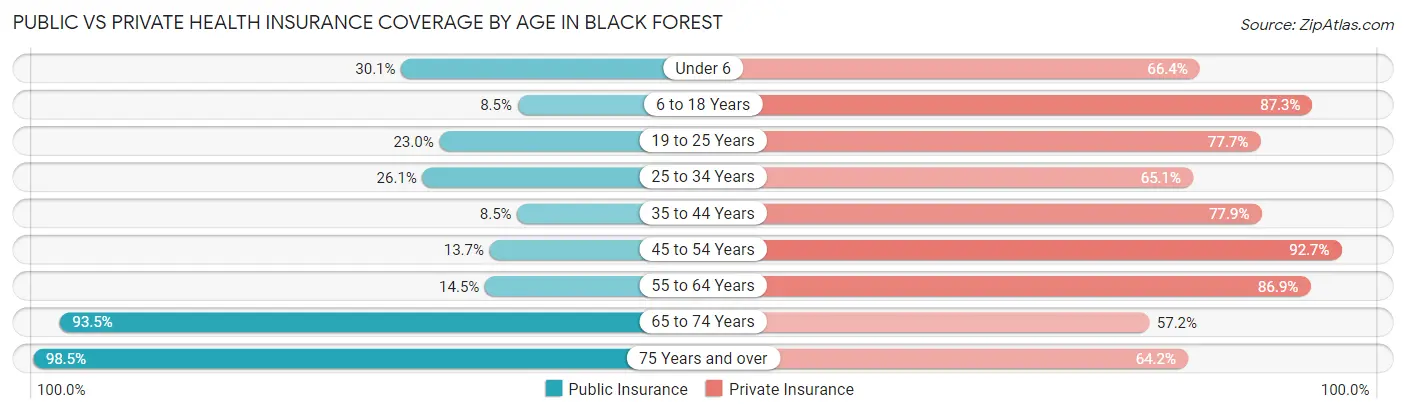
| Age Bracket | Public Insurance | Private Insurance |
| Under 6 | 206 (30.1%) | 455 (66.4%) |
| 6 to 18 Years | 225 (8.5%) | 2,324 (87.3%) |
| 19 to 25 Years | 180 (23.0%) | 608 (77.6%) |
| 25 to 34 Years | 194 (26.1%) | 484 (65.1%) |
| 35 to 44 Years | 122 (8.5%) | 1,114 (77.8%) |
| 45 to 54 Years | 330 (13.7%) | 2,241 (92.7%) |
| 55 to 64 Years | 422 (14.5%) | 2,528 (86.9%) |
| 65 to 74 Years | 1,907 (93.5%) | 1,166 (57.2%) |
| 75 Years and over | 707 (98.5%) | 461 (64.2%) |
| Total | 4,293 (29.8%) | 11,381 (79.1%) |
Disability Status by Sex by Age in Black Forest
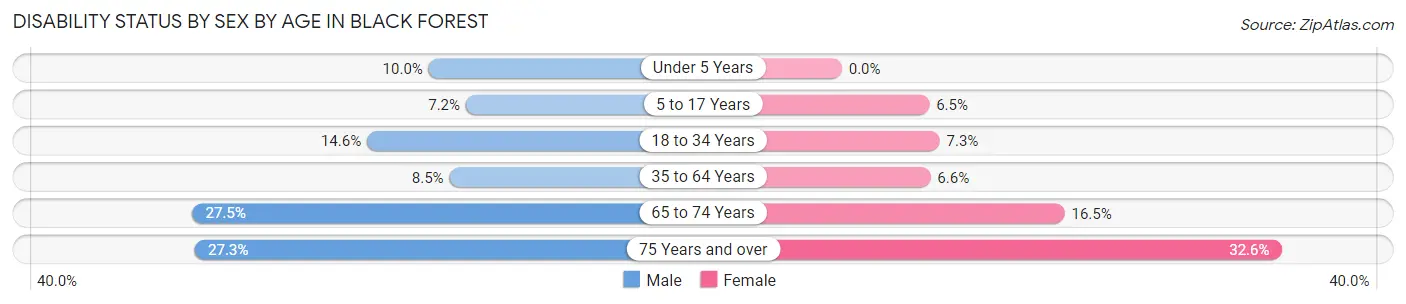
| Age Bracket | Male | Female |
| Under 5 Years | 23 (10.0%) | 0 (0.0%) |
| 5 to 17 Years | 99 (7.2%) | 82 (6.5%) |
| 18 to 34 Years | 114 (14.6%) | 66 (7.3%) |
| 35 to 64 Years | 282 (8.5%) | 225 (6.6%) |
| 65 to 74 Years | 275 (27.5%) | 172 (16.5%) |
| 75 Years and over | 105 (27.3%) | 109 (32.6%) |
Disability Class by Sex by Age in Black Forest
Disability Class: Hearing Difficulty
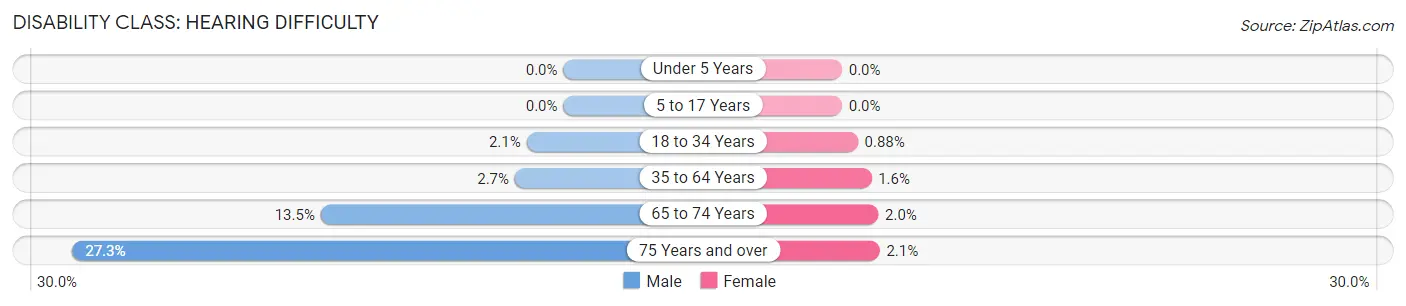
| Age Bracket | Male | Female |
| Under 5 Years | 0 (0.0%) | 0 (0.0%) |
| 5 to 17 Years | 0 (0.0%) | 0 (0.0%) |
| 18 to 34 Years | 16 (2.1%) | 8 (0.9%) |
| 35 to 64 Years | 90 (2.7%) | 56 (1.6%) |
| 65 to 74 Years | 135 (13.5%) | 21 (2.0%) |
| 75 Years and over | 105 (27.3%) | 7 (2.1%) |
Disability Class: Vision Difficulty
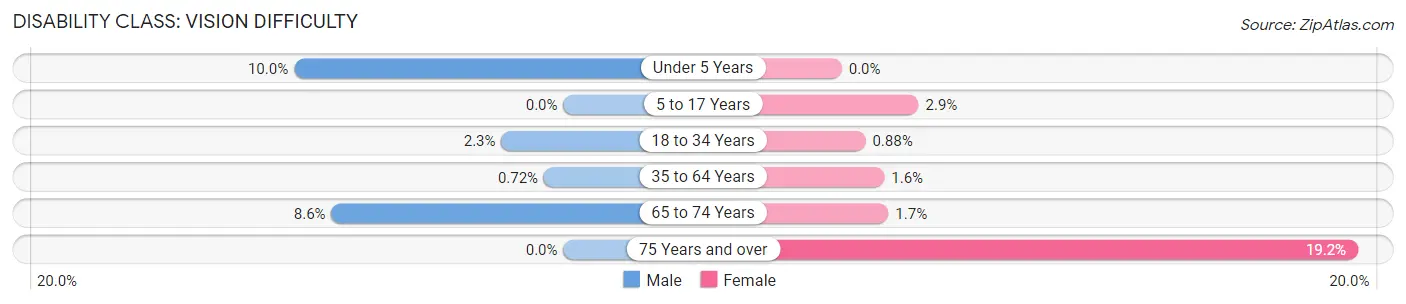
| Age Bracket | Male | Female |
| Under 5 Years | 23 (10.0%) | 0 (0.0%) |
| 5 to 17 Years | 0 (0.0%) | 36 (2.9%) |
| 18 to 34 Years | 18 (2.3%) | 8 (0.9%) |
| 35 to 64 Years | 24 (0.7%) | 54 (1.6%) |
| 65 to 74 Years | 86 (8.6%) | 18 (1.7%) |
| 75 Years and over | 0 (0.0%) | 64 (19.2%) |
Disability Class: Cognitive Difficulty
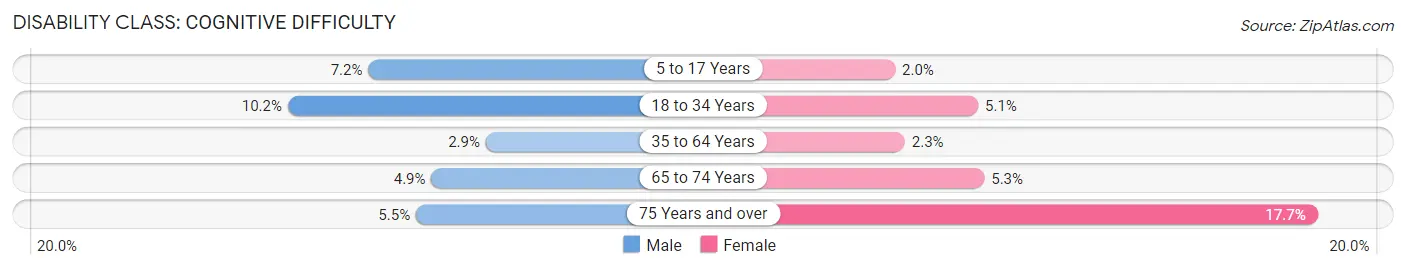
| Age Bracket | Male | Female |
| 5 to 17 Years | 99 (7.2%) | 25 (2.0%) |
| 18 to 34 Years | 80 (10.2%) | 46 (5.1%) |
| 35 to 64 Years | 96 (2.9%) | 80 (2.3%) |
| 65 to 74 Years | 49 (4.9%) | 55 (5.3%) |
| 75 Years and over | 21 (5.5%) | 59 (17.7%) |
Disability Class: Ambulatory Difficulty
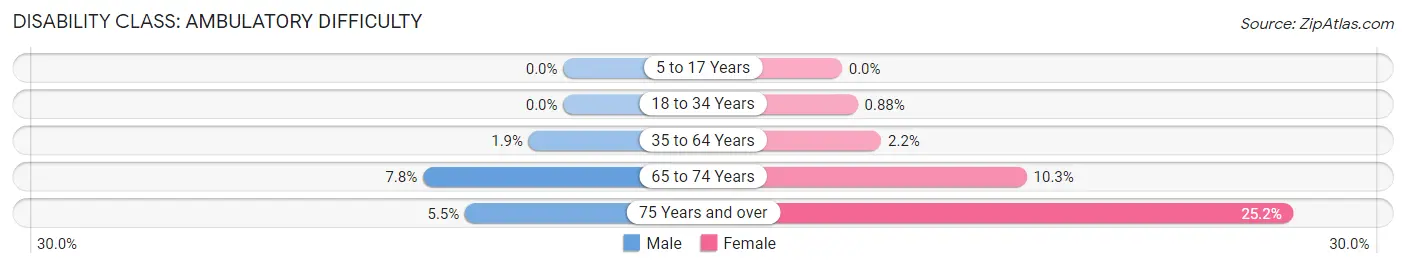
| Age Bracket | Male | Female |
| 5 to 17 Years | 0 (0.0%) | 0 (0.0%) |
| 18 to 34 Years | 0 (0.0%) | 8 (0.9%) |
| 35 to 64 Years | 64 (1.9%) | 75 (2.2%) |
| 65 to 74 Years | 78 (7.8%) | 107 (10.3%) |
| 75 Years and over | 21 (5.5%) | 84 (25.2%) |
Disability Class: Self-Care Difficulty
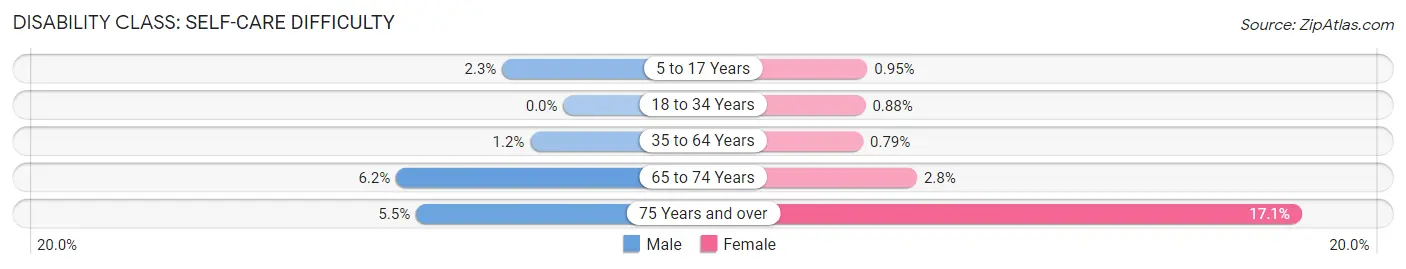
| Age Bracket | Male | Female |
| 5 to 17 Years | 31 (2.3%) | 12 (0.9%) |
| 18 to 34 Years | 0 (0.0%) | 8 (0.9%) |
| 35 to 64 Years | 41 (1.2%) | 27 (0.8%) |
| 65 to 74 Years | 62 (6.2%) | 29 (2.8%) |
| 75 Years and over | 21 (5.5%) | 57 (17.1%) |
Technology Access in Black Forest
Computing Device Access in Black Forest
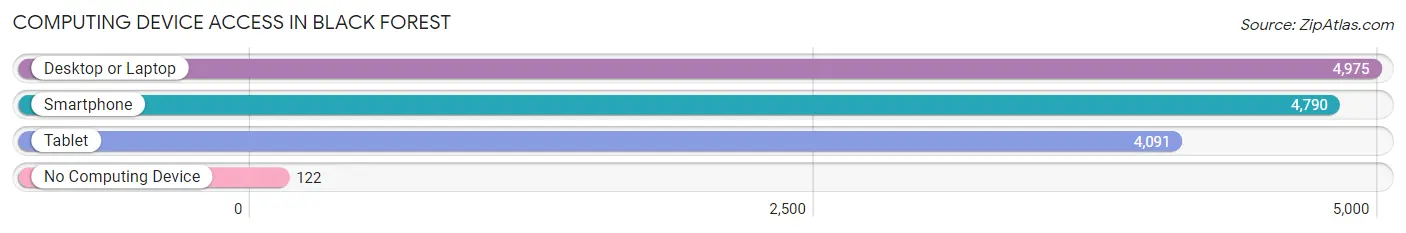
| Device Type | # Households | % Households |
| Desktop or Laptop | 4,975 | 96.6% |
| Smartphone | 4,790 | 93.0% |
| Tablet | 4,091 | 79.4% |
| No Computing Device | 122 | 2.4% |
| Total | 5,150 | 100.0% |
Internet Access in Black Forest
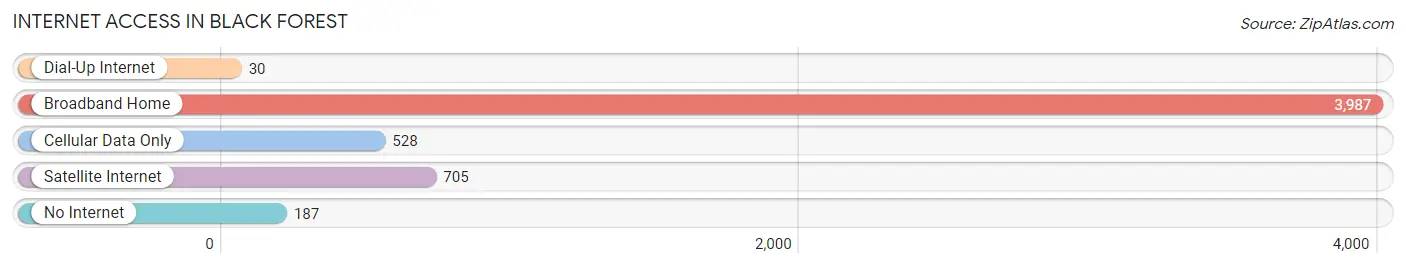
| Internet Type | # Households | % Households |
| Dial-Up Internet | 30 | 0.6% |
| Broadband Home | 3,987 | 77.4% |
| Cellular Data Only | 528 | 10.2% |
| Satellite Internet | 705 | 13.7% |
| No Internet | 187 | 3.6% |
| Total | 5,150 | 100.0% |
Black Forest Summary
Black Forest is an unincorporated community located in El Paso County, Colorado, United States. It is situated in the foothills of the Rocky Mountains, approximately 20 miles northeast of Colorado Springs. The area is known for its dense stands of ponderosa pine trees, which give the area its name.
History
The area now known as Black Forest was first settled in the late 1800s by German immigrants. The settlers were attracted to the area by its abundant natural resources, including timber, water, and wildlife. The area was originally known as "Kleine Wald," which translates to "Little Forest" in German. The name was eventually changed to Black Forest, and the area was officially recognized as a community in 1891.
In the early 1900s, the area was home to several sawmills and lumber companies, which harvested the abundant stands of ponderosa pine. The lumber industry was the primary source of employment in the area until the 1950s, when the mills began to close due to a decline in demand for lumber.
Geography
Black Forest is located in the foothills of the Rocky Mountains, approximately 20 miles northeast of Colorado Springs. The area is characterized by rolling hills, dense stands of ponderosa pine, and open meadows. The elevation of the area ranges from 6,000 to 8,000 feet above sea level.
The area is home to several creeks and streams, including Monument Creek, which flows through the center of the community. The area is also home to several small lakes, including Black Forest Lake and Monument Lake.
Economy
The primary source of employment in Black Forest is the service sector, which includes retail, hospitality, and healthcare. The area is also home to several small businesses, including a winery, a brewery, and a distillery.
The area is also home to several farms and ranches, which produce hay, cattle, and other agricultural products. The area is also home to several nurseries, which produce trees and shrubs for landscaping.
Demographics
As of the 2010 census, the population of Black Forest was 13,116. The racial makeup of the area was 94.3% White, 1.2% African American, 0.7% Native American, 0.7% Asian, 0.1% Pacific Islander, 1.2% from other races, and 2.0% from two or more races. Hispanic or Latino of any race were 4.3% of the population.
The median household income in Black Forest was $77,837, and the median family income was $87,837. The per capita income was $35,837. About 4.3% of families and 5.7% of the population were below the poverty line, including 8.3% of those under age 18 and 4.3% of those age 65 or over.
Common Questions
What is Per Capita Income in Black Forest?
Per Capita income in Black Forest is $59,736.
What is the Median Family Income in Black Forest?
Median Family Income in Black Forest is $150,618.
What is the Median Household income in Black Forest?
Median Household Income in Black Forest is $135,859.
What is Income or Wage Gap in Black Forest?
Income or Wage Gap in Black Forest is 56.1%.
Women in Black Forest earn 43.9 cents for every dollar earned by a man.
What is Family Income Deficit in Black Forest?
Family Income Deficit in Black Forest is $11,247.
Families that are below poverty line in Black Forest earn $11,247 less on average than the poverty threshold level.
What is Inequality or Gini Index in Black Forest?
Inequality or Gini Index in Black Forest is 0.41.
What is the Total Population of Black Forest?
Total Population of Black Forest is 14,437.
What is the Total Male Population of Black Forest?
Total Male Population of Black Forest is 7,132.
What is the Total Female Population of Black Forest?
Total Female Population of Black Forest is 7,305.
What is the Ratio of Males per 100 Females in Black Forest?
There are 97.63 Males per 100 Females in Black Forest.
What is the Ratio of Females per 100 Males in Black Forest?
There are 102.43 Females per 100 Males in Black Forest.
What is the Median Population Age in Black Forest?
Median Population Age in Black Forest is 49.0 Years.
What is the Average Family Size in Black Forest
Average Family Size in Black Forest is 3.1 People.
What is the Average Household Size in Black Forest
Average Household Size in Black Forest is 2.8 People.
How Large is the Labor Force in Black Forest?
There are 7,159 People in the Labor Forcein in Black Forest.
What is the Percentage of People in the Labor Force in Black Forest?
60.9% of People are in the Labor Force in Black Forest.
What is the Unemployment Rate in Black Forest?
Unemployment Rate in Black Forest is 6.2%.