Eldorado Springs, CO Map & Demographics
Eldorado Springs Map
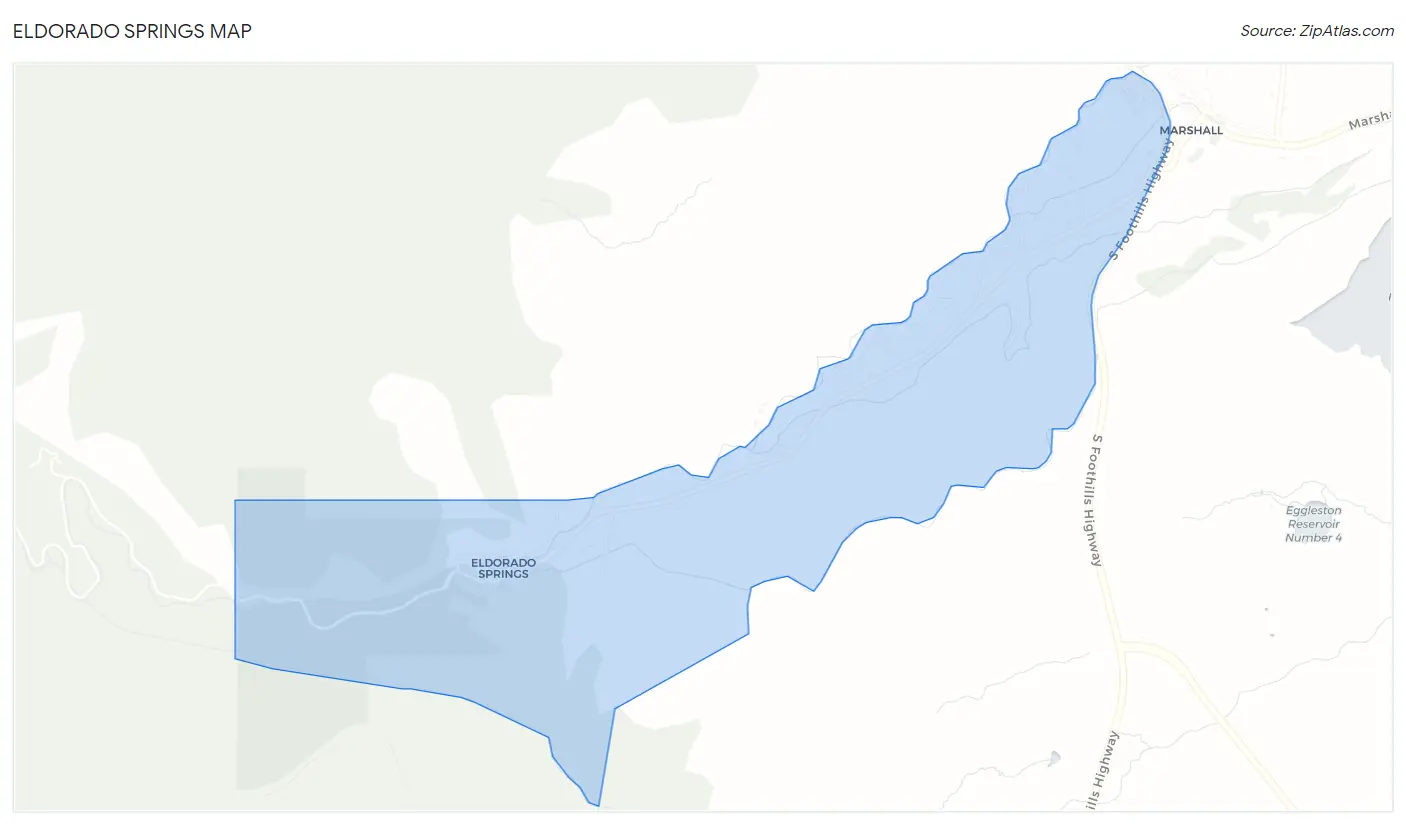
Eldorado Springs Overview
$66,021
PER CAPITA INCOME
$138,889
AVG FAMILY INCOME
$100,139
AVG HOUSEHOLD INCOME
0.52
INEQUALITY / GINI INDEX
284
TOTAL POPULATION
150
MALE POPULATION
134
FEMALE POPULATION
111.94
MALES / 100 FEMALES
89.33
FEMALES / 100 MALES
62.1
MEDIAN AGE
2.6
AVG FAMILY SIZE
1.8
AVG HOUSEHOLD SIZE
131
LABOR FORCE [ PEOPLE ]
50.2%
PERCENT IN LABOR FORCE
6.1%
UNEMPLOYMENT RATE
Eldorado Springs Zip Codes
Eldorado Springs Area Codes
Income in Eldorado Springs
Income Overview in Eldorado Springs
Per Capita Income in Eldorado Springs is $66,021, while median incomes of families and households are $138,889 and $100,139 respectively.
| Characteristic | Number | Measure |
| Per Capita Income | 284 | $66,021 |
| Median Family Income | 72 | $138,889 |
| Mean Family Income | 72 | $211,506 |
| Median Household Income | 139 | $100,139 |
| Mean Household Income | 139 | $131,495 |
| Income Deficit | 72 | $0 |
| Wage / Income Gap (%) | 284 | 0.00% |
| Wage / Income Gap ($) | 284 | 100.00¢ per $1 |
| Gini / Inequality Index | 284 | 0.52 |
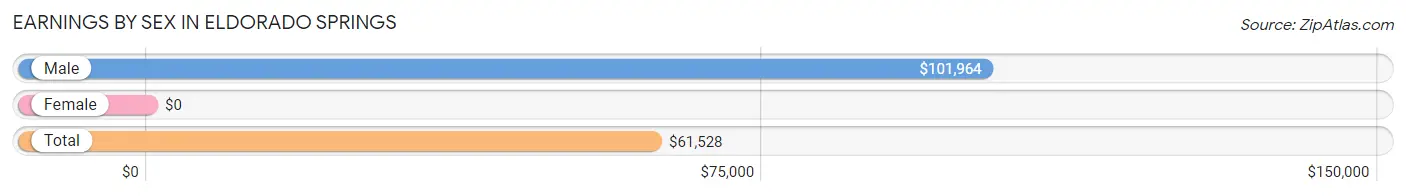
Earnings by Sex in Eldorado Springs
| Sex | Number | Average Earnings |
| Male | 75 (57.3%) | $101,964 |
| Female | 56 (42.7%) | $0 |
| Total | 131 (100.0%) | $61,528 |
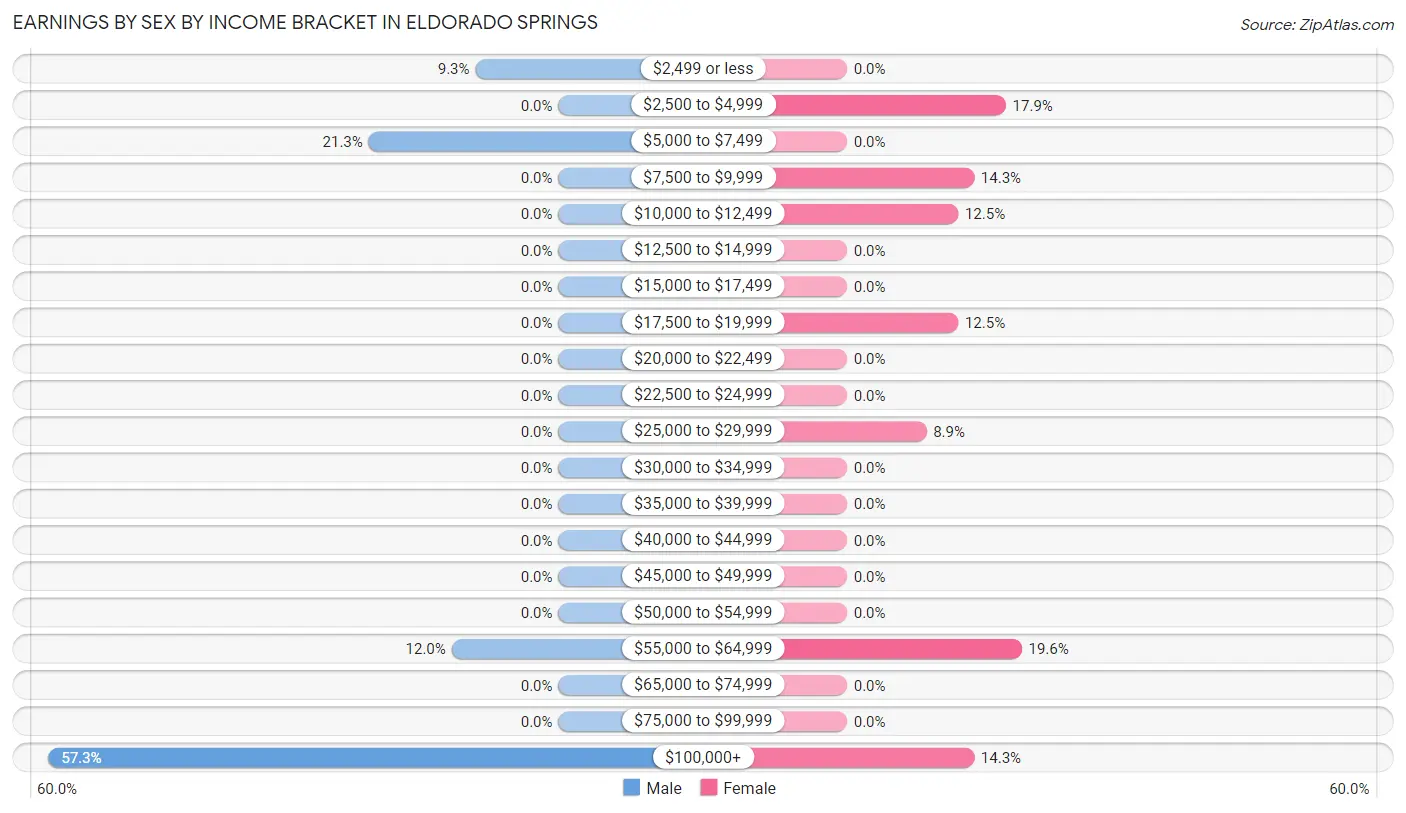
Earnings by Sex by Income Bracket in Eldorado Springs
The most common earnings brackets in Eldorado Springs are $100,000+ for men (43 | 57.3%) and $55,000 to $64,999 for women (11 | 19.6%).
| Income | Male | Female |
| $2,499 or less | 7 (9.3%) | 0 (0.0%) |
| $2,500 to $4,999 | 0 (0.0%) | 10 (17.9%) |
| $5,000 to $7,499 | 16 (21.3%) | 0 (0.0%) |
| $7,500 to $9,999 | 0 (0.0%) | 8 (14.3%) |
| $10,000 to $12,499 | 0 (0.0%) | 7 (12.5%) |
| $12,500 to $14,999 | 0 (0.0%) | 0 (0.0%) |
| $15,000 to $17,499 | 0 (0.0%) | 0 (0.0%) |
| $17,500 to $19,999 | 0 (0.0%) | 7 (12.5%) |
| $20,000 to $22,499 | 0 (0.0%) | 0 (0.0%) |
| $22,500 to $24,999 | 0 (0.0%) | 0 (0.0%) |
| $25,000 to $29,999 | 0 (0.0%) | 5 (8.9%) |
| $30,000 to $34,999 | 0 (0.0%) | 0 (0.0%) |
| $35,000 to $39,999 | 0 (0.0%) | 0 (0.0%) |
| $40,000 to $44,999 | 0 (0.0%) | 0 (0.0%) |
| $45,000 to $49,999 | 0 (0.0%) | 0 (0.0%) |
| $50,000 to $54,999 | 0 (0.0%) | 0 (0.0%) |
| $55,000 to $64,999 | 9 (12.0%) | 11 (19.6%) |
| $65,000 to $74,999 | 0 (0.0%) | 0 (0.0%) |
| $75,000 to $99,999 | 0 (0.0%) | 0 (0.0%) |
| $100,000+ | 43 (57.3%) | 8 (14.3%) |
| Total | 75 (100.0%) | 56 (100.0%) |
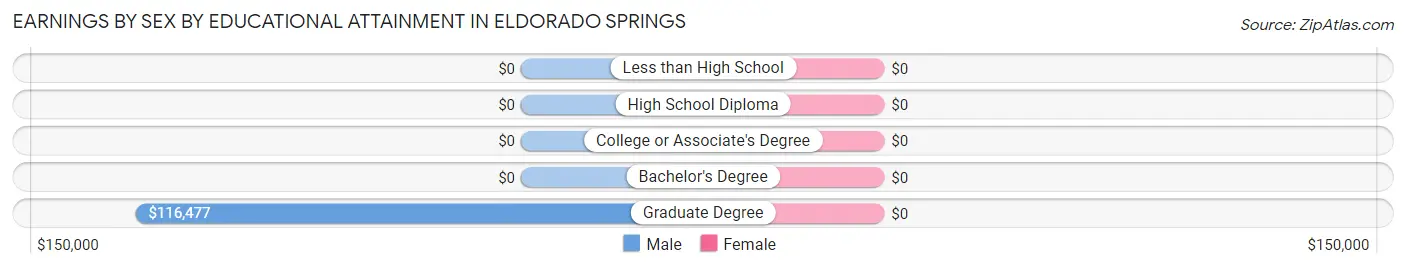
Earnings by Sex by Educational Attainment in Eldorado Springs
| Educational Attainment | Male Income | Female Income |
| Less than High School | - | - |
| High School Diploma | - | - |
| College or Associate's Degree | - | - |
| Bachelor's Degree | - | - |
| Graduate Degree | $116,477 | $0 |
| Total | $101,964 | $0 |
Family Income in Eldorado Springs
Family Income Brackets in Eldorado Springs
According to the Eldorado Springs family income data, there are 27 families falling into the $100,000 to $149,999 income range, which is the most common income bracket and makes up 37.5% of all families.
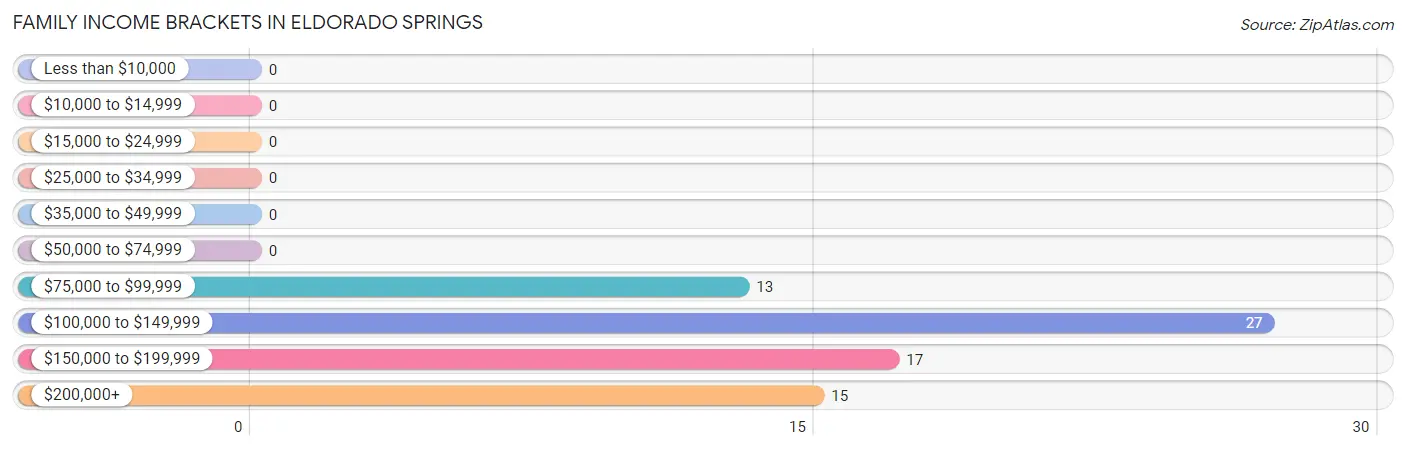
| Income Bracket | # Families | % Families |
| Less than $10,000 | 0 | 0.0% |
| $10,000 to $14,999 | 0 | 0.0% |
| $15,000 to $24,999 | 0 | 0.0% |
| $25,000 to $34,999 | 0 | 0.0% |
| $35,000 to $49,999 | 0 | 0.0% |
| $50,000 to $74,999 | 0 | 0.0% |
| $75,000 to $99,999 | 13 | 18.1% |
| $100,000 to $149,999 | 27 | 37.5% |
| $150,000 to $199,999 | 17 | 23.6% |
| $200,000+ | 15 | 20.8% |
Family Income by Famaliy Size in Eldorado Springs
2-person families (54 | 75.0%) account for the highest median family income in Eldorado Springs with $136,389 per family, while 2-person families (54 | 75.0%) have the highest median income of $68,194 per family member.
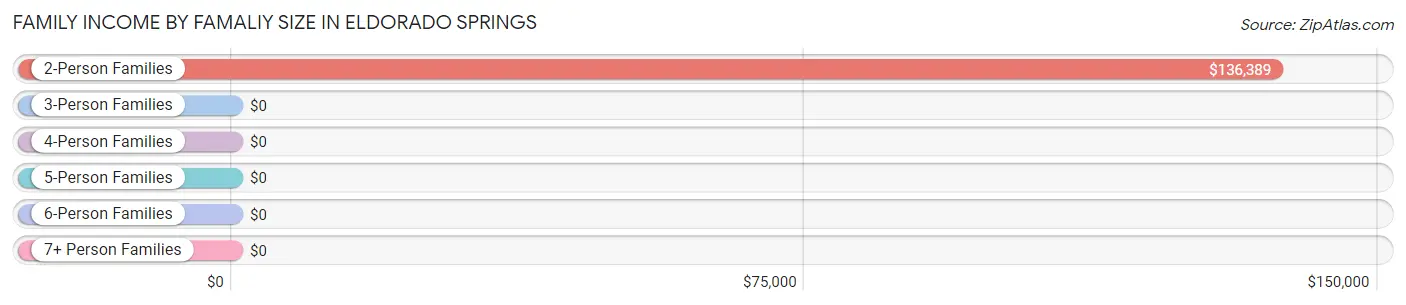
| Income Bracket | # Families | Median Income |
| 2-Person Families | 54 (75.0%) | $136,389 |
| 3-Person Families | 8 (11.1%) | $0 |
| 4-Person Families | 0 (0.0%) | $0 |
| 5-Person Families | 10 (13.9%) | $0 |
| 6-Person Families | 0 (0.0%) | $0 |
| 7+ Person Families | 0 (0.0%) | $0 |
| Total | 72 (100.0%) | $138,889 |
Family Income by Number of Earners in Eldorado Springs
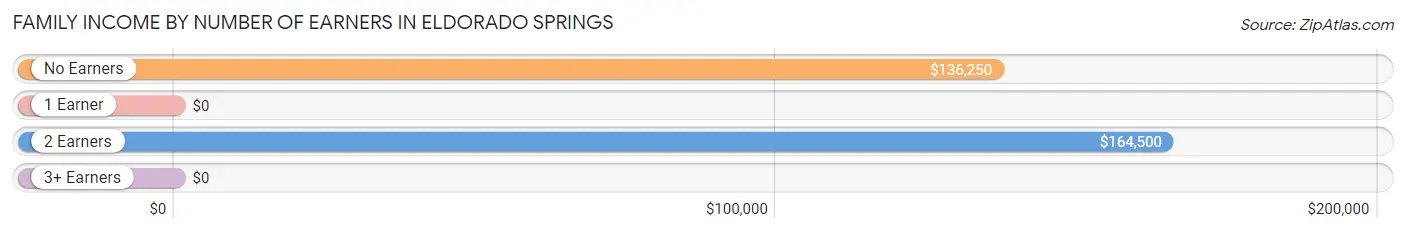
| Number of Earners | # Families | Median Income |
| No Earners | 27 (37.5%) | $136,250 |
| 1 Earner | 13 (18.1%) | $0 |
| 2 Earners | 32 (44.4%) | $164,500 |
| 3+ Earners | 0 (0.0%) | $0 |
| Total | 72 (100.0%) | $138,889 |
Household Income in Eldorado Springs
Household Income Brackets in Eldorado Springs
With 38 households falling in the category, the $100,000 to $149,999 income range is the most frequent in Eldorado Springs, accounting for 27.3% of all households.
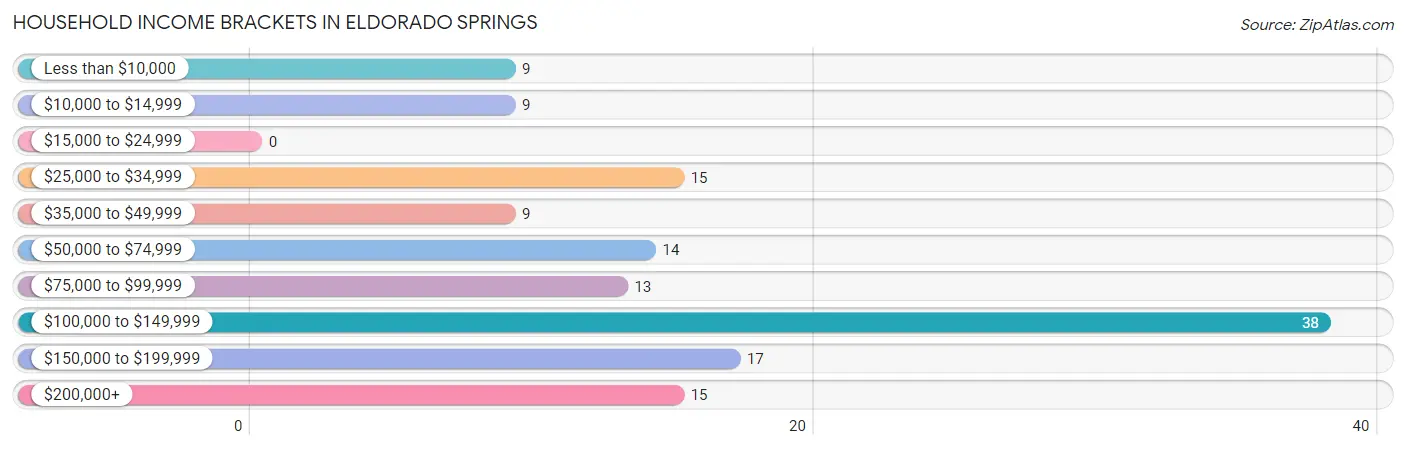
| Income Bracket | # Households | % Households |
| Less than $10,000 | 9 | 6.5% |
| $10,000 to $14,999 | 9 | 6.5% |
| $15,000 to $24,999 | 0 | 0.0% |
| $25,000 to $34,999 | 15 | 10.8% |
| $35,000 to $49,999 | 9 | 6.5% |
| $50,000 to $74,999 | 14 | 10.1% |
| $75,000 to $99,999 | 13 | 9.4% |
| $100,000 to $149,999 | 38 | 27.3% |
| $150,000 to $199,999 | 17 | 12.2% |
| $200,000+ | 15 | 10.8% |
Household Income by Householder Age in Eldorado Springs
The median household income in Eldorado Springs is $100,139, with the highest median household income of $100,278 found in the 65+ years age bracket for the primary householder. A total of 74 households (53.2%) fall into this category.
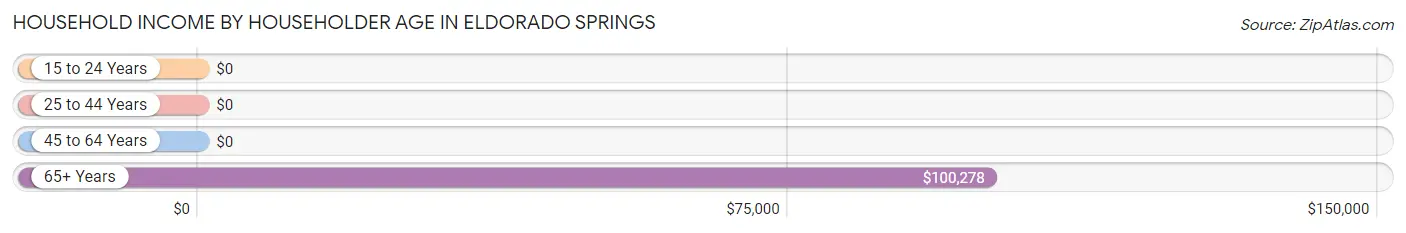
| Income Bracket | # Households | Median Income |
| 15 to 24 Years | 0 (0.0%) | $0 |
| 25 to 44 Years | 14 (10.1%) | $0 |
| 45 to 64 Years | 51 (36.7%) | $0 |
| 65+ Years | 74 (53.2%) | $100,278 |
| Total | 139 (100.0%) | $100,139 |
Poverty in Eldorado Springs
Income Below Poverty by Sex and Age in Eldorado Springs
With 17.2% poverty level for males and 14.2% for females among the residents of Eldorado Springs, 55 to 64 year old males and 18 to 24 year old females are the most vulnerable to poverty, with 9 males (34.6%) and 8 females (100.0%) in their respective age groups living below the poverty level.
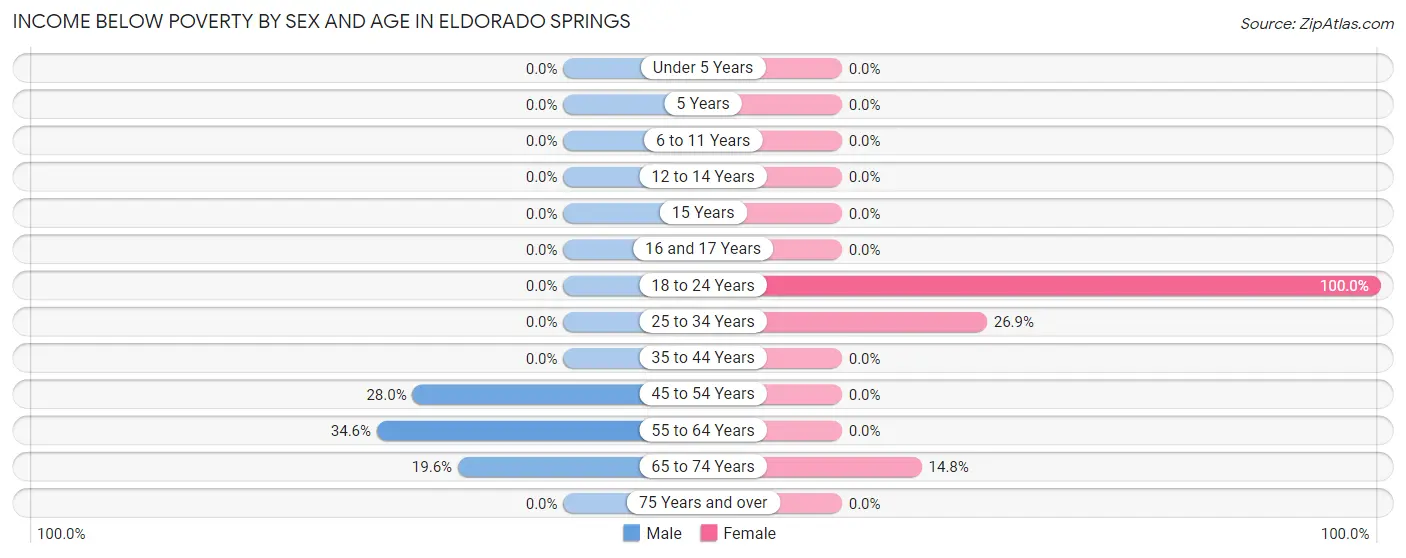
| Age Bracket | Male | Female |
| Under 5 Years | 0 (0.0%) | 0 (0.0%) |
| 5 Years | 0 (0.0%) | 0 (0.0%) |
| 6 to 11 Years | 0 (0.0%) | 0 (0.0%) |
| 12 to 14 Years | 0 (0.0%) | 0 (0.0%) |
| 15 Years | 0 (0.0%) | 0 (0.0%) |
| 16 and 17 Years | 0 (0.0%) | 0 (0.0%) |
| 18 to 24 Years | 0 (0.0%) | 8 (100.0%) |
| 25 to 34 Years | 0 (0.0%) | 7 (26.9%) |
| 35 to 44 Years | 0 (0.0%) | 0 (0.0%) |
| 45 to 54 Years | 7 (28.0%) | 0 (0.0%) |
| 55 to 64 Years | 9 (34.6%) | 0 (0.0%) |
| 65 to 74 Years | 9 (19.6%) | 4 (14.8%) |
| 75 Years and over | 0 (0.0%) | 0 (0.0%) |
| Total | 25 (17.2%) | 19 (14.2%) |
Income Above Poverty by Sex and Age in Eldorado Springs
According to the poverty statistics in Eldorado Springs, males aged 12 to 14 years and females aged 16 and 17 years are the age groups that are most secure financially, with 100.0% of males and 100.0% of females in these age groups living above the poverty line.
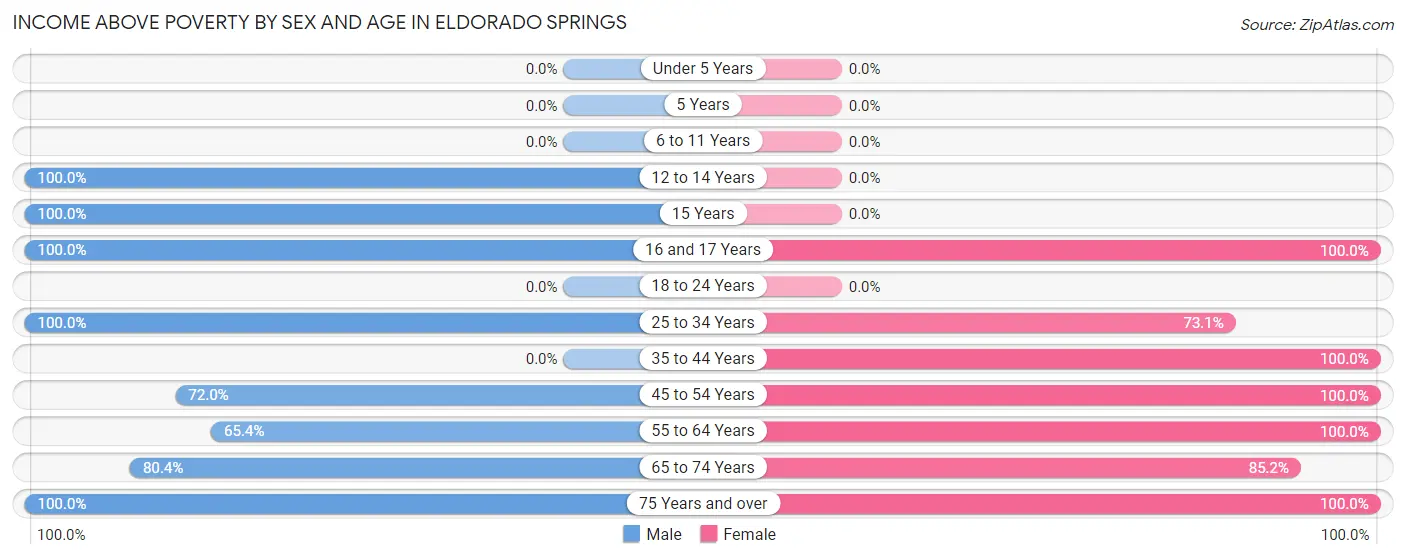
| Age Bracket | Male | Female |
| Under 5 Years | 0 (0.0%) | 0 (0.0%) |
| 5 Years | 0 (0.0%) | 0 (0.0%) |
| 6 to 11 Years | 0 (0.0%) | 0 (0.0%) |
| 12 to 14 Years | 9 (100.0%) | 0 (0.0%) |
| 15 Years | 9 (100.0%) | 0 (0.0%) |
| 16 and 17 Years | 8 (100.0%) | 10 (100.0%) |
| 18 to 24 Years | 0 (0.0%) | 0 (0.0%) |
| 25 to 34 Years | 7 (100.0%) | 19 (73.1%) |
| 35 to 44 Years | 0 (0.0%) | 7 (100.0%) |
| 45 to 54 Years | 18 (72.0%) | 18 (100.0%) |
| 55 to 64 Years | 17 (65.4%) | 15 (100.0%) |
| 65 to 74 Years | 37 (80.4%) | 23 (85.2%) |
| 75 Years and over | 15 (100.0%) | 23 (100.0%) |
| Total | 120 (82.8%) | 115 (85.8%) |
Income Below Poverty Among Married-Couple Families in Eldorado Springs
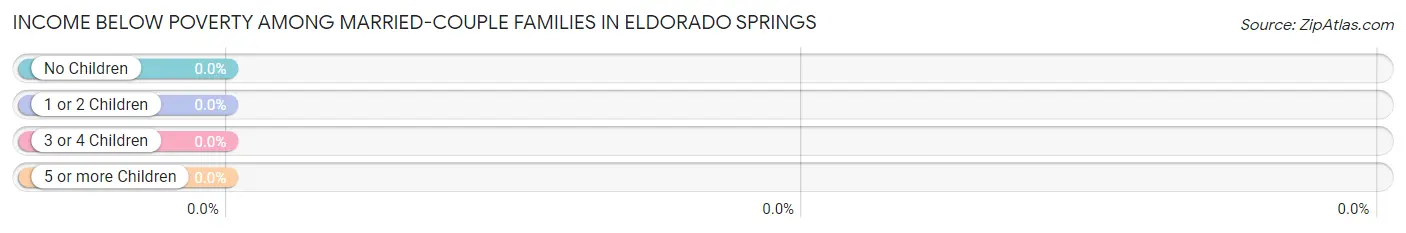
| Children | Above Poverty | Below Poverty |
| No Children | 41 (100.0%) | 0 (0.0%) |
| 1 or 2 Children | 8 (100.0%) | 0 (0.0%) |
| 3 or 4 Children | 10 (100.0%) | 0 (0.0%) |
| 5 or more Children | 0 (0.0%) | 0 (0.0%) |
| Total | 59 (100.0%) | 0 (0.0%) |
Income Below Poverty Among Single-Parent Households in Eldorado Springs
| Children | Single Father | Single Mother |
| No Children | 0 (0.0%) | 0 (0.0%) |
| 1 or 2 Children | 0 (0.0%) | 0 (0.0%) |
| 3 or 4 Children | 0 (0.0%) | 0 (0.0%) |
| 5 or more Children | 0 (0.0%) | 0 (0.0%) |
| Total | 0 (0.0%) | 0 (0.0%) |
Income Below Poverty Among Married-Couple vs Single-Parent Households in Eldorado Springs
| Children | Married-Couple Families | Single-Parent Households |
| No Children | 0 (0.0%) | 0 (0.0%) |
| 1 or 2 Children | 0 (0.0%) | 0 (0.0%) |
| 3 or 4 Children | 0 (0.0%) | 0 (0.0%) |
| 5 or more Children | 0 (0.0%) | 0 (0.0%) |
| Total | 0 (0.0%) | 0 (0.0%) |
Race in Eldorado Springs
The most populous races in Eldorado Springs are White / Caucasian (270 | 95.1%), Native / Alaskan (7 | 2.5%), and Two or more Races (7 | 2.5%).
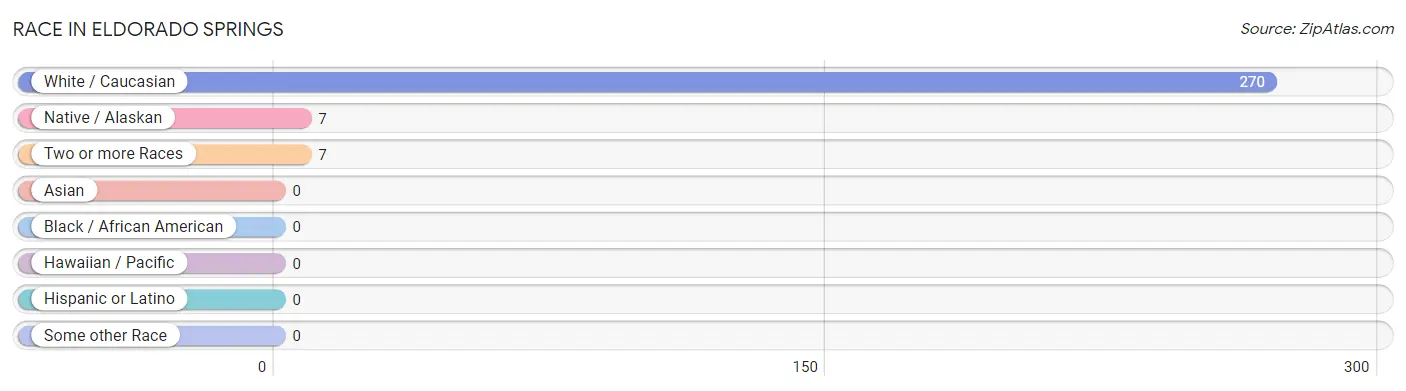
| Race | # Population | % Population |
| Asian | 0 | 0.0% |
| Black / African American | 0 | 0.0% |
| Hawaiian / Pacific | 0 | 0.0% |
| Hispanic or Latino | 0 | 0.0% |
| Native / Alaskan | 7 | 2.5% |
| White / Caucasian | 270 | 95.1% |
| Two or more Races | 7 | 2.5% |
| Some other Race | 0 | 0.0% |
| Total | 284 | 100.0% |
Ancestry in Eldorado Springs
The most populous ancestries reported in Eldorado Springs are English (60 | 21.1%), German (53 | 18.7%), Scottish (37 | 13.0%), Scotch-Irish (19 | 6.7%), and French (16 | 5.6%), together accounting for 65.1% of all Eldorado Springs residents.
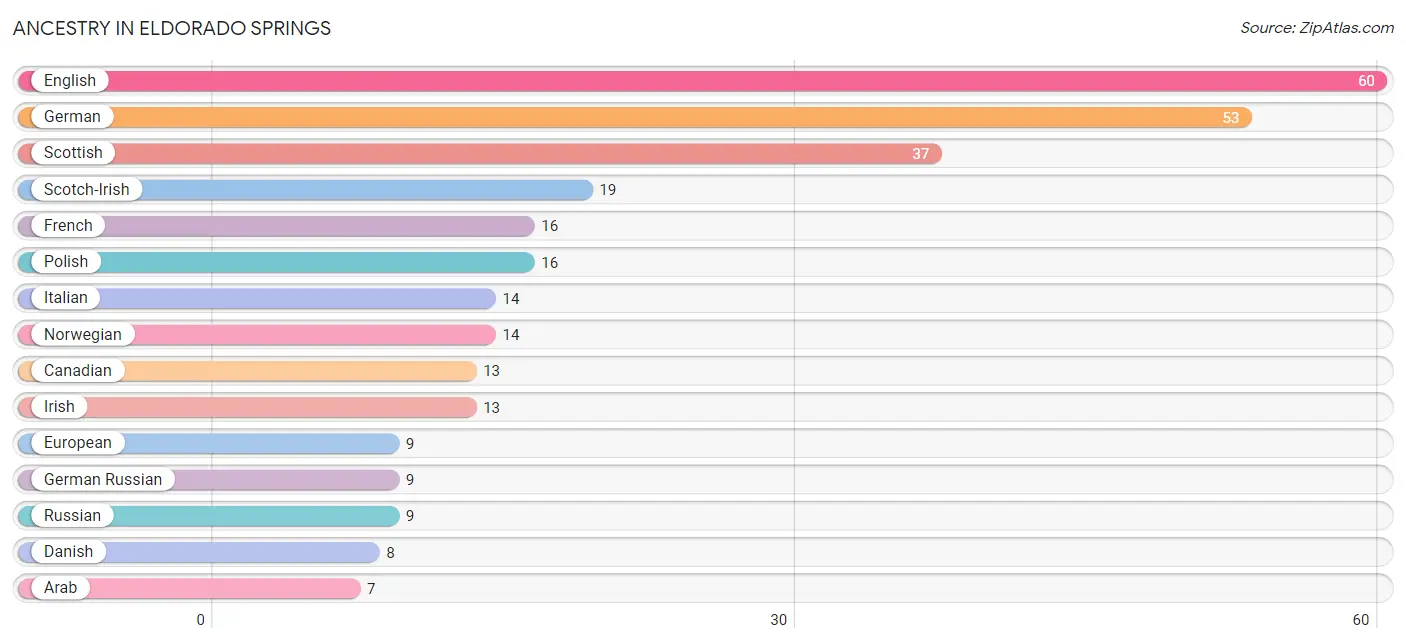
| Ancestry | # Population | % Population |
| Arab | 7 | 2.5% |
| Canadian | 13 | 4.6% |
| Danish | 8 | 2.8% |
| English | 60 | 21.1% |
| European | 9 | 3.2% |
| French | 16 | 5.6% |
| German | 53 | 18.7% |
| German Russian | 9 | 3.2% |
| Irish | 13 | 4.6% |
| Italian | 14 | 4.9% |
| Korean | 7 | 2.5% |
| Lebanese | 7 | 2.5% |
| Norwegian | 14 | 4.9% |
| Polish | 16 | 5.6% |
| Russian | 9 | 3.2% |
| Scotch-Irish | 19 | 6.7% |
| Scottish | 37 | 13.0% | View All 17 Rows |
Immigrants in Eldorado Springs
The most numerous immigrant groups reported in Eldorado Springs came from Europe (12 | 4.2%), Asia (7 | 2.5%), France (7 | 2.5%), Lebanon (7 | 2.5%), and Western Asia (7 | 2.5%), together accounting for 14.1% of all Eldorado Springs residents.
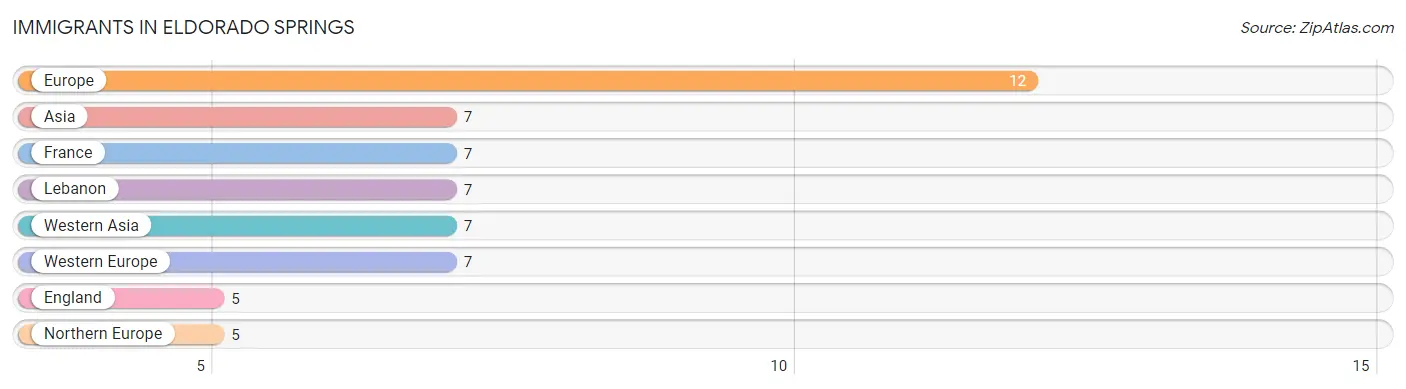
| Immigration Origin | # Population | % Population |
| Asia | 7 | 2.5% |
| England | 5 | 1.8% |
| Europe | 12 | 4.2% |
| France | 7 | 2.5% |
| Lebanon | 7 | 2.5% |
| Northern Europe | 5 | 1.8% |
| Western Asia | 7 | 2.5% |
| Western Europe | 7 | 2.5% | View All 8 Rows |
Sex and Age in Eldorado Springs
Sex and Age in Eldorado Springs
The most populous age groups in Eldorado Springs are 65 to 69 Years (28 | 18.7%) for men and 30 to 34 Years (19 | 14.2%) for women.
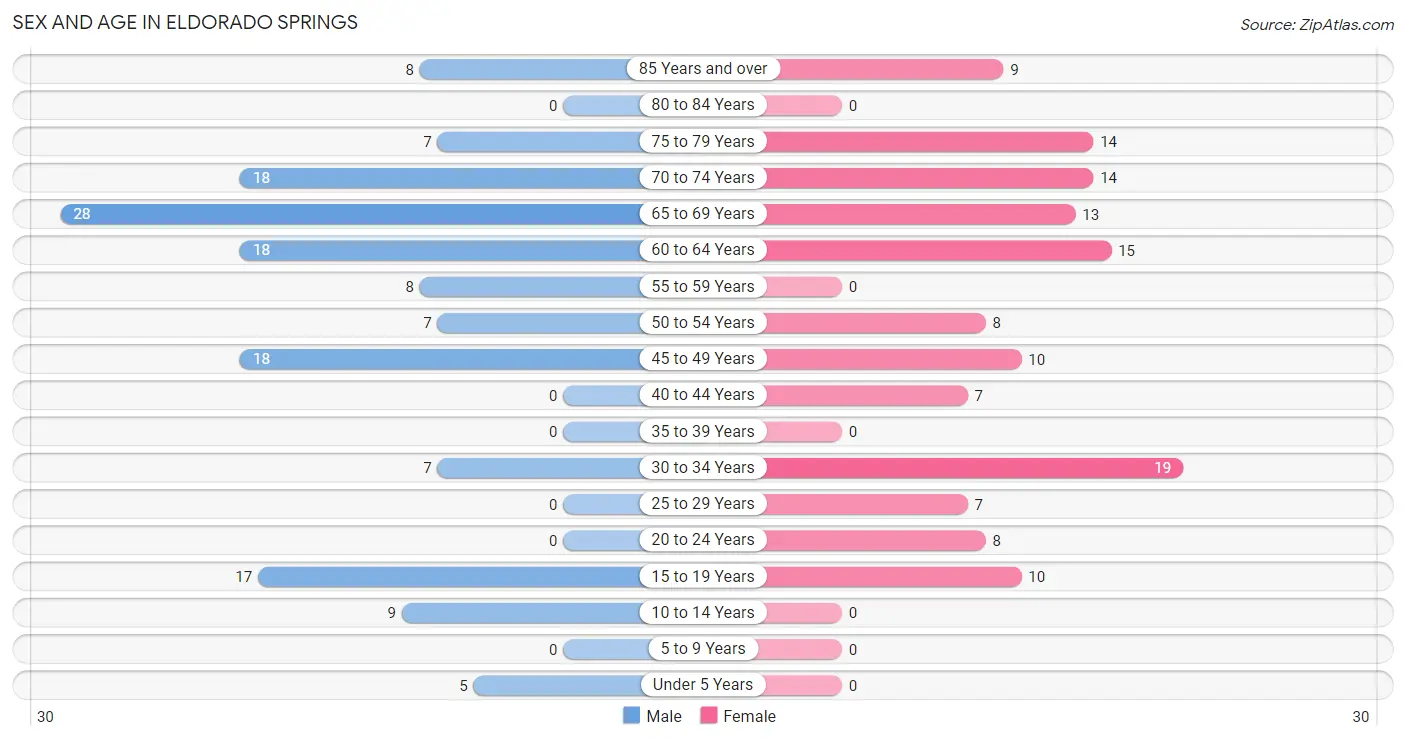
| Age Bracket | Male | Female |
| Under 5 Years | 5 (3.3%) | 0 (0.0%) |
| 5 to 9 Years | 0 (0.0%) | 0 (0.0%) |
| 10 to 14 Years | 9 (6.0%) | 0 (0.0%) |
| 15 to 19 Years | 17 (11.3%) | 10 (7.5%) |
| 20 to 24 Years | 0 (0.0%) | 8 (6.0%) |
| 25 to 29 Years | 0 (0.0%) | 7 (5.2%) |
| 30 to 34 Years | 7 (4.7%) | 19 (14.2%) |
| 35 to 39 Years | 0 (0.0%) | 0 (0.0%) |
| 40 to 44 Years | 0 (0.0%) | 7 (5.2%) |
| 45 to 49 Years | 18 (12.0%) | 10 (7.5%) |
| 50 to 54 Years | 7 (4.7%) | 8 (6.0%) |
| 55 to 59 Years | 8 (5.3%) | 0 (0.0%) |
| 60 to 64 Years | 18 (12.0%) | 15 (11.2%) |
| 65 to 69 Years | 28 (18.7%) | 13 (9.7%) |
| 70 to 74 Years | 18 (12.0%) | 14 (10.4%) |
| 75 to 79 Years | 7 (4.7%) | 14 (10.4%) |
| 80 to 84 Years | 0 (0.0%) | 0 (0.0%) |
| 85 Years and over | 8 (5.3%) | 9 (6.7%) |
| Total | 150 (100.0%) | 134 (100.0%) |
Families and Households in Eldorado Springs
Median Family Size in Eldorado Springs
The median family size in Eldorado Springs is 2.58 persons per family, with married-couple families (59 | 81.9%) accounting for the largest median family size of 2.61 persons per family. On the other hand, single male/father families (8 | 11.1%) represent the smallest median family size with 2.38 persons per family.
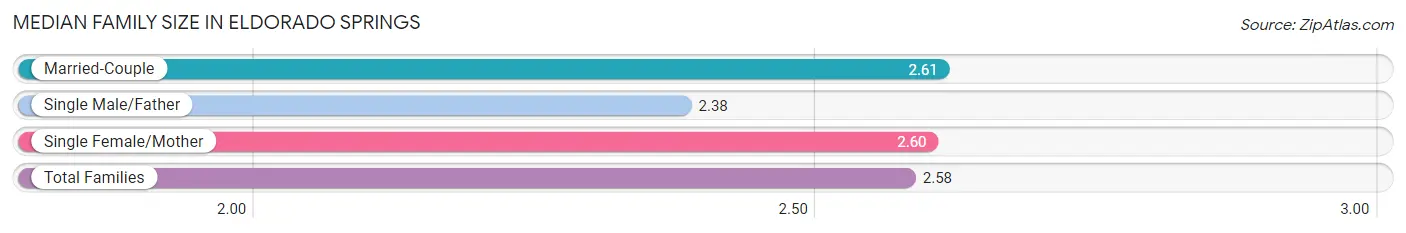
| Family Type | # Families | Family Size |
| Married-Couple | 59 (81.9%) | 2.61 |
| Single Male/Father | 8 (11.1%) | 2.38 |
| Single Female/Mother | 5 (6.9%) | 2.60 |
| Total Families | 72 (100.0%) | 2.58 |
Median Household Size in Eldorado Springs
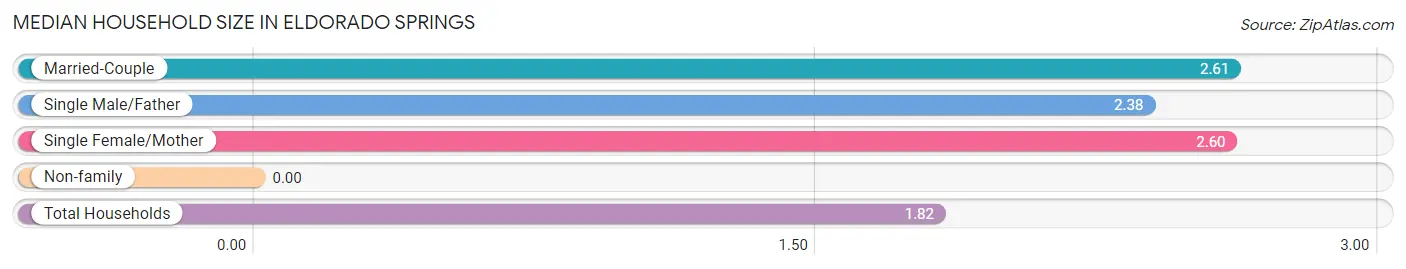
| Household Type | # Households | Household Size |
| Married-Couple | 59 (42.4%) | 2.61 |
| Single Male/Father | 8 (5.8%) | 2.38 |
| Single Female/Mother | 5 (3.6%) | 2.60 |
| Non-family | 67 (48.2%) | - |
| Total Households | 139 (100.0%) | 1.82 |
Household Size by Marriage Status in Eldorado Springs
Out of a total of 139 households in Eldorado Springs, 72 (51.8%) are family households, while 67 (48.2%) are nonfamily households. The most numerous type of family households are 2-person households, comprising 54, and the most common type of nonfamily households are 1-person households, comprising 67.
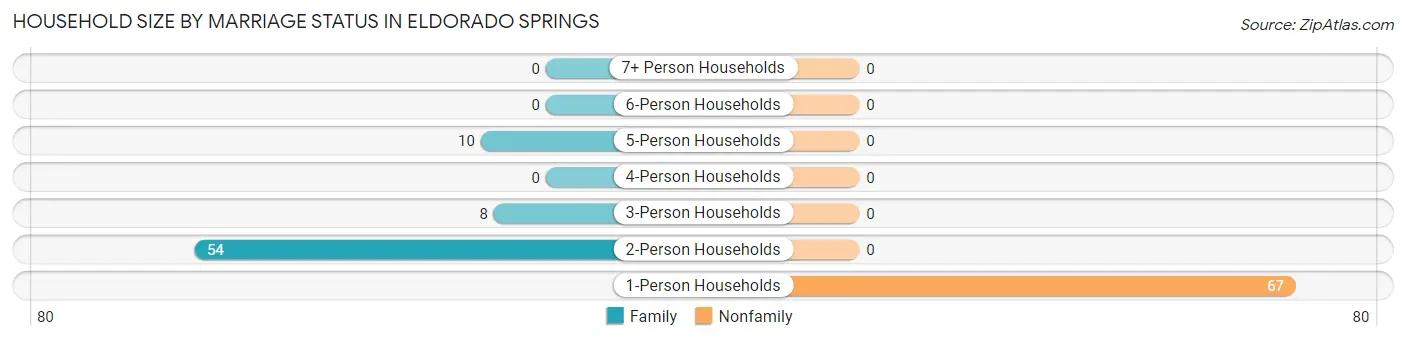
| Household Size | Family Households | Nonfamily Households |
| 1-Person Households | - | 67 (48.2%) |
| 2-Person Households | 54 (38.9%) | 0 (0.0%) |
| 3-Person Households | 8 (5.8%) | 0 (0.0%) |
| 4-Person Households | 0 (0.0%) | 0 (0.0%) |
| 5-Person Households | 10 (7.2%) | 0 (0.0%) |
| 6-Person Households | 0 (0.0%) | 0 (0.0%) |
| 7+ Person Households | 0 (0.0%) | 0 (0.0%) |
| Total | 72 (51.8%) | 67 (48.2%) |
Female Fertility in Eldorado Springs
Fertility by Age in Eldorado Springs
| Age Bracket | Women with Births | Births / 1,000 Women |
| 15 to 19 years | 0 (0.0%) | 0.0 |
| 20 to 34 years | 0 (0.0%) | 0.0 |
| 35 to 50 years | 0 (0.0%) | 0.0 |
| Total | 0 (0.0%) | 0.0 |
Fertility by Age by Marriage Status in Eldorado Springs
| Age Bracket | Married | Unmarried |
| 15 to 19 years | 0 (0.0%) | 0 (0.0%) |
| 20 to 34 years | 0 (0.0%) | 0 (0.0%) |
| 35 to 50 years | 0 (0.0%) | 0 (0.0%) |
| Total | 0 (0.0%) | 0 (0.0%) |
Fertility by Education in Eldorado Springs
| Educational Attainment | Women with Births | Births / 1,000 Women |
| Less than High School | 0 (0.0%) | 0.0 |
| High School Diploma | 0 (0.0%) | 0.0 |
| College or Associate's Degree | 0 (0.0%) | 0.0 |
| Bachelor's Degree | 0 (0.0%) | 0.0 |
| Graduate Degree | 0 (0.0%) | 0.0 |
| Total | 0 (0.0%) | 0.0 |
Fertility by Education by Marriage Status in Eldorado Springs
| Educational Attainment | Married | Unmarried |
| Less than High School | 0 (0.0%) | 0 (0.0%) |
| High School Diploma | 0 (0.0%) | 0 (0.0%) |
| College or Associate's Degree | 0 (0.0%) | 0 (0.0%) |
| Bachelor's Degree | 0 (0.0%) | 0 (0.0%) |
| Graduate Degree | 0 (0.0%) | 0 (0.0%) |
| Total | 0 (0.0%) | 0 (0.0%) |
Employment Characteristics in Eldorado Springs
Employment by Class of Employer in Eldorado Springs
Among the 123 employed individuals in Eldorado Springs, private company employees (47 | 38.2%), self-employed (not incorporated) (28 | 22.8%), and self-employed (incorporated) (21 | 17.1%) make up the most common classes of employment.
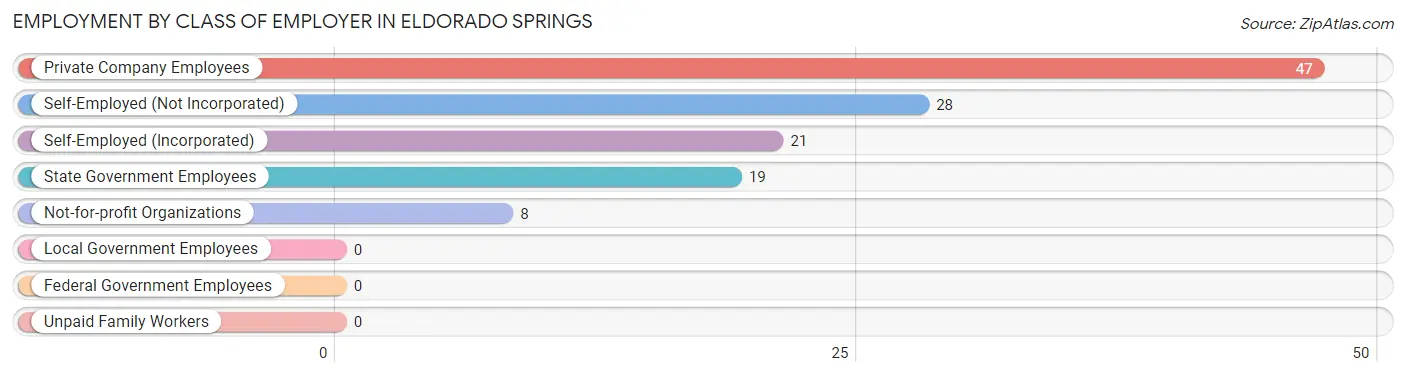
| Employer Class | # Employees | % Employees |
| Private Company Employees | 47 | 38.2% |
| Self-Employed (Incorporated) | 21 | 17.1% |
| Self-Employed (Not Incorporated) | 28 | 22.8% |
| Not-for-profit Organizations | 8 | 6.5% |
| Local Government Employees | 0 | 0.0% |
| State Government Employees | 19 | 15.4% |
| Federal Government Employees | 0 | 0.0% |
| Unpaid Family Workers | 0 | 0.0% |
| Total | 123 | 100.0% |
Employment Status by Age in Eldorado Springs
According to the labor force statistics for Eldorado Springs, out of the total population over 16 years of age (261), 50.2% or 131 individuals are in the labor force, with 6.1% or 8 of them unemployed. The age group with the highest labor force participation rate is 30 to 34 years, with 100.0% or 26 individuals in the labor force. Within the labor force, the 65 to 74 years age range has the highest percentage of unemployed individuals, with 33.3% or 8 of them being unemployed.
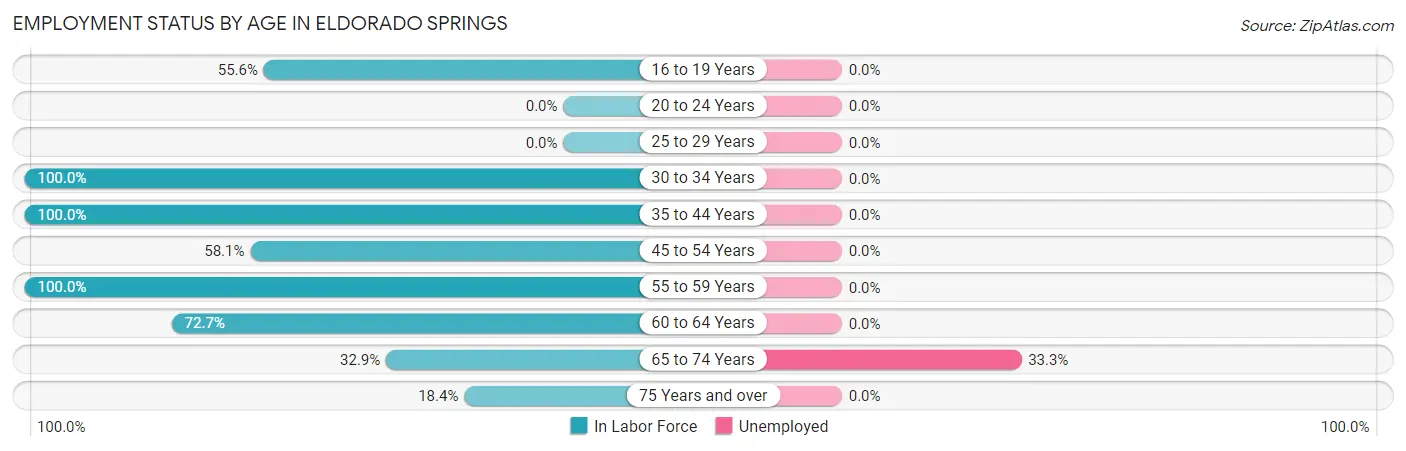
| Age Bracket | In Labor Force | Unemployed |
| 16 to 19 Years | 10 (55.6%) | 0 (0.0%) |
| 20 to 24 Years | 0 (0.0%) | 0 (0.0%) |
| 25 to 29 Years | 0 (0.0%) | 0 (0.0%) |
| 30 to 34 Years | 26 (100.0%) | 0 (0.0%) |
| 35 to 44 Years | 7 (100.0%) | 0 (0.0%) |
| 45 to 54 Years | 25 (58.1%) | 0 (0.0%) |
| 55 to 59 Years | 8 (100.0%) | 0 (0.0%) |
| 60 to 64 Years | 24 (72.7%) | 0 (0.0%) |
| 65 to 74 Years | 24 (32.9%) | 8 (33.3%) |
| 75 Years and over | 7 (18.4%) | 0 (0.0%) |
| Total | 131 (50.2%) | 8 (6.1%) |
Employment Status by Educational Attainment in Eldorado Springs
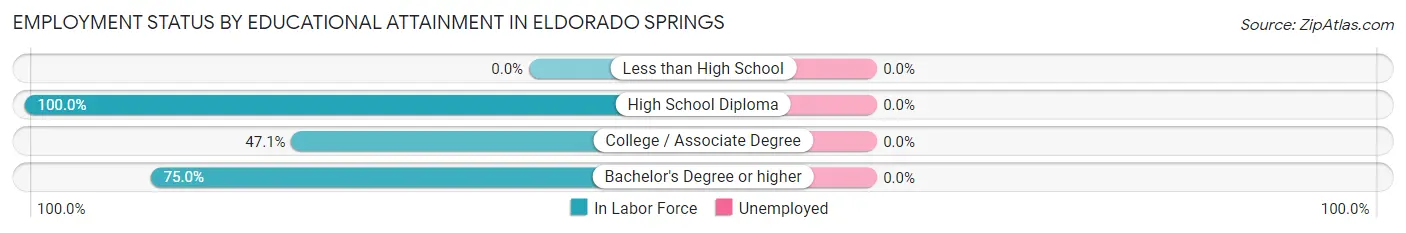
| Educational Attainment | In Labor Force | Unemployed |
| Less than High School | 0 (0.0%) | 0 (0.0%) |
| High School Diploma | 7 (100.0%) | 0 (0.0%) |
| College / Associate Degree | 8 (47.1%) | 0 (0.0%) |
| Bachelor's Degree or higher | 75 (75.0%) | 0 (0.0%) |
| Total | 90 (72.6%) | 0 (0.0%) |
Employment Occupations by Sex in Eldorado Springs
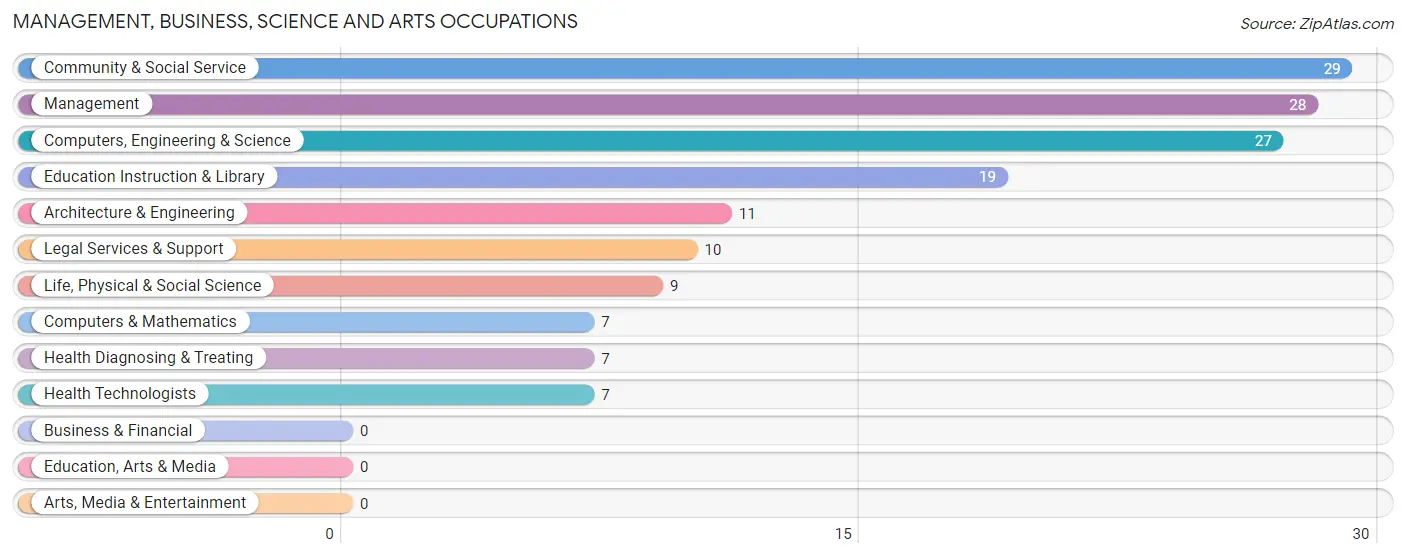
Management, Business, Science and Arts Occupations
The most common Management, Business, Science and Arts occupations in Eldorado Springs are Community & Social Service (29 | 23.6%), Management (28 | 22.8%), Computers, Engineering & Science (27 | 22.0%), Education Instruction & Library (19 | 15.4%), and Architecture & Engineering (11 | 8.9%).
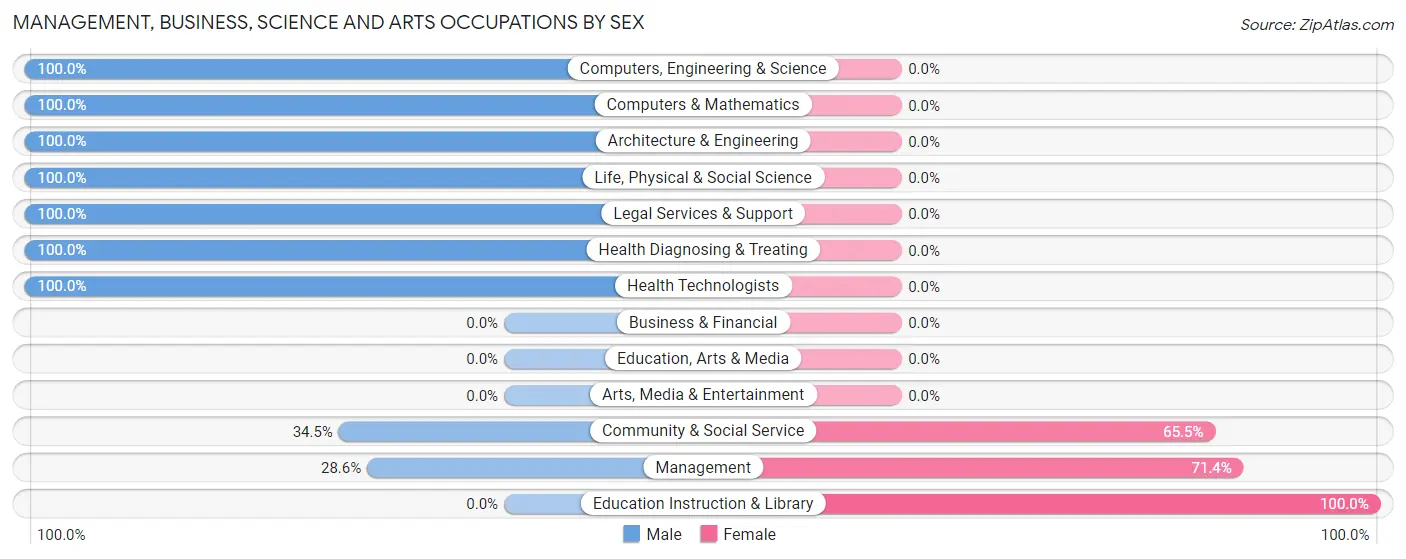
Management, Business, Science and Arts Occupations by Sex
Within the Management, Business, Science and Arts occupations in Eldorado Springs, the most male-oriented occupations are Computers, Engineering & Science (100.0%), Computers & Mathematics (100.0%), and Architecture & Engineering (100.0%), while the most female-oriented occupations are Education Instruction & Library (100.0%), Management (71.4%), and Community & Social Service (65.5%).
| Occupation | Male | Female |
| Management | 8 (28.6%) | 20 (71.4%) |
| Business & Financial | 0 (0.0%) | 0 (0.0%) |
| Computers, Engineering & Science | 27 (100.0%) | 0 (0.0%) |
| Computers & Mathematics | 7 (100.0%) | 0 (0.0%) |
| Architecture & Engineering | 11 (100.0%) | 0 (0.0%) |
| Life, Physical & Social Science | 9 (100.0%) | 0 (0.0%) |
| Community & Social Service | 10 (34.5%) | 19 (65.5%) |
| Education, Arts & Media | 0 (0.0%) | 0 (0.0%) |
| Legal Services & Support | 10 (100.0%) | 0 (0.0%) |
| Education Instruction & Library | 0 (0.0%) | 19 (100.0%) |
| Arts, Media & Entertainment | 0 (0.0%) | 0 (0.0%) |
| Health Diagnosing & Treating | 7 (100.0%) | 0 (0.0%) |
| Health Technologists | 7 (100.0%) | 0 (0.0%) |
| Total (Category) | 52 (57.1%) | 39 (42.9%) |
| Total (Overall) | 67 (54.5%) | 56 (45.5%) |
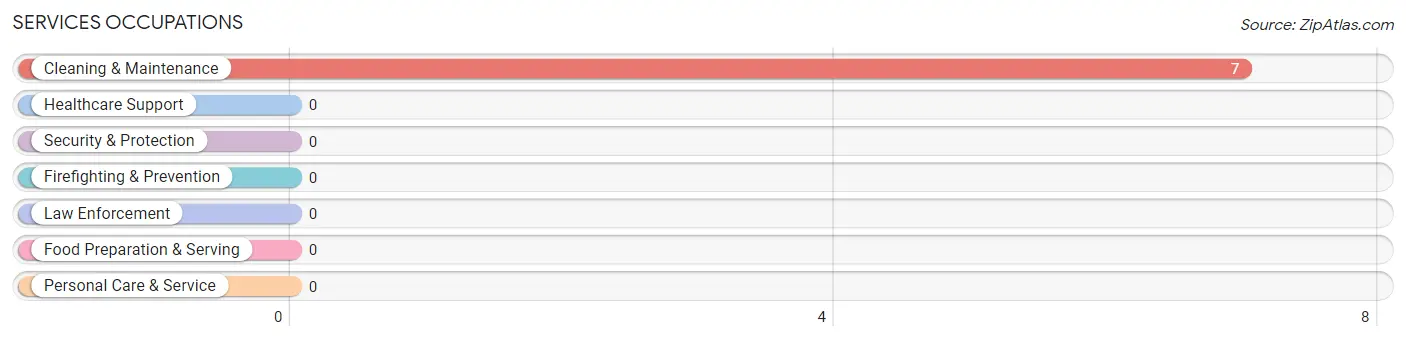
Services Occupations
The most common Services occupations in Eldorado Springs are , and Cleaning & Maintenance (7 | 5.7%).
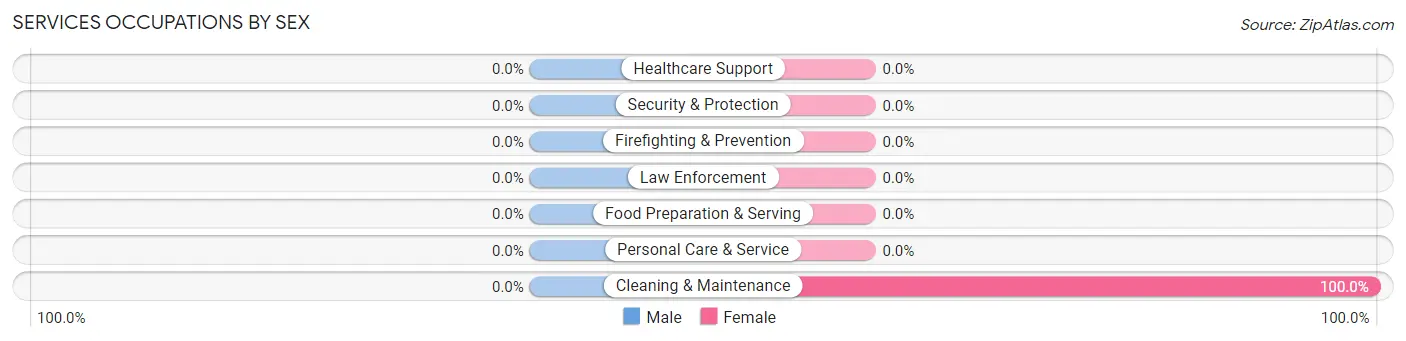
Services Occupations by Sex
| Occupation | Male | Female |
| Healthcare Support | 0 (0.0%) | 0 (0.0%) |
| Security & Protection | 0 (0.0%) | 0 (0.0%) |
| Firefighting & Prevention | 0 (0.0%) | 0 (0.0%) |
| Law Enforcement | 0 (0.0%) | 0 (0.0%) |
| Food Preparation & Serving | 0 (0.0%) | 0 (0.0%) |
| Cleaning & Maintenance | 0 (0.0%) | 7 (100.0%) |
| Personal Care & Service | 0 (0.0%) | 0 (0.0%) |
| Total (Category) | 0 (0.0%) | 7 (100.0%) |
| Total (Overall) | 67 (54.5%) | 56 (45.5%) |
Sales and Office Occupations
The most common Sales and Office occupations in Eldorado Springs are , and Sales & Related (10 | 8.1%).
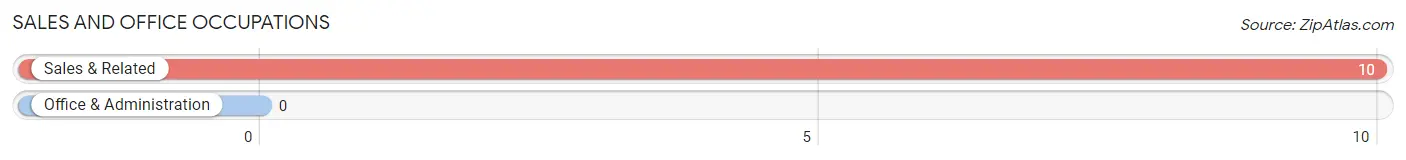
Sales and Office Occupations by Sex
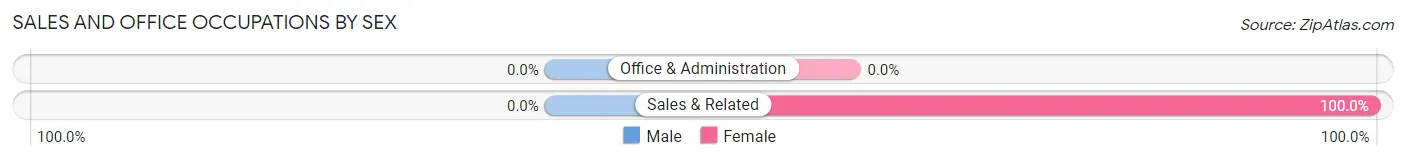
| Occupation | Male | Female |
| Sales & Related | 0 (0.0%) | 10 (100.0%) |
| Office & Administration | 0 (0.0%) | 0 (0.0%) |
| Total (Category) | 0 (0.0%) | 10 (100.0%) |
| Total (Overall) | 67 (54.5%) | 56 (45.5%) |
Natural Resources, Construction and Maintenance Occupations
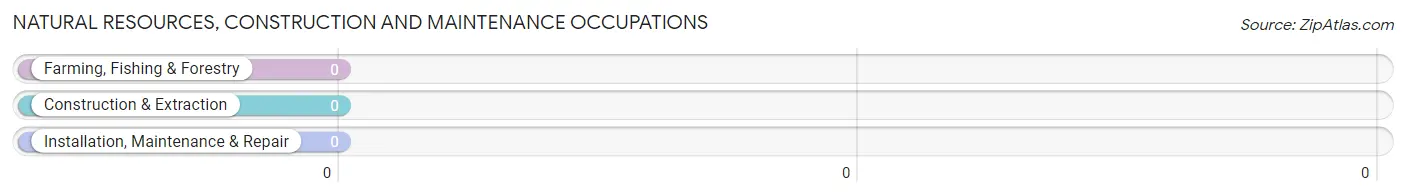
Natural Resources, Construction and Maintenance Occupations by Sex
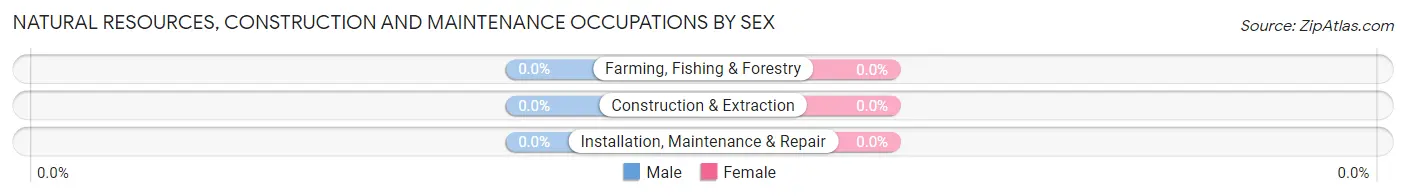
| Occupation | Male | Female |
| Farming, Fishing & Forestry | 0 (0.0%) | 0 (0.0%) |
| Construction & Extraction | 0 (0.0%) | 0 (0.0%) |
| Installation, Maintenance & Repair | 0 (0.0%) | 0 (0.0%) |
| Total (Category) | 0 (0.0%) | 0 (0.0%) |
| Total (Overall) | 67 (54.5%) | 56 (45.5%) |
Production, Transportation and Moving Occupations
The most common Production, Transportation and Moving occupations in Eldorado Springs are , and Transportation (15 | 12.2%).
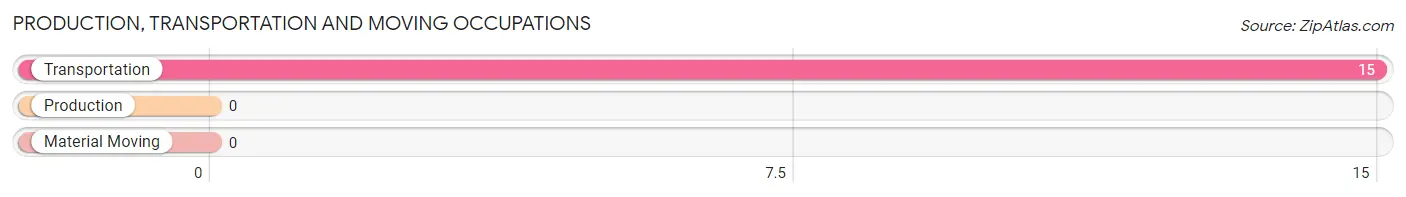
Production, Transportation and Moving Occupations by Sex
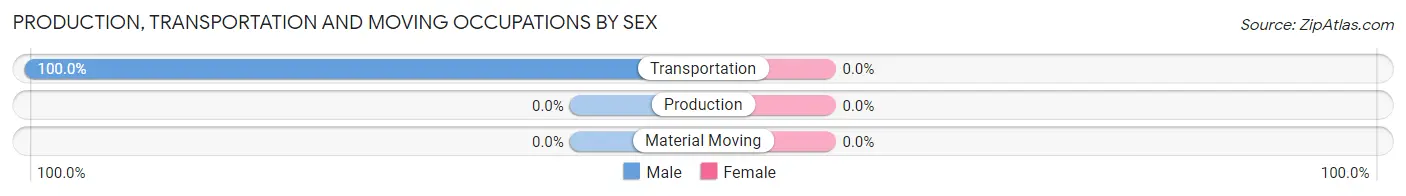
| Occupation | Male | Female |
| Production | 0 (0.0%) | 0 (0.0%) |
| Transportation | 15 (100.0%) | 0 (0.0%) |
| Material Moving | 0 (0.0%) | 0 (0.0%) |
| Total (Category) | 15 (100.0%) | 0 (0.0%) |
| Total (Overall) | 67 (54.5%) | 56 (45.5%) |
Employment Industries by Sex in Eldorado Springs
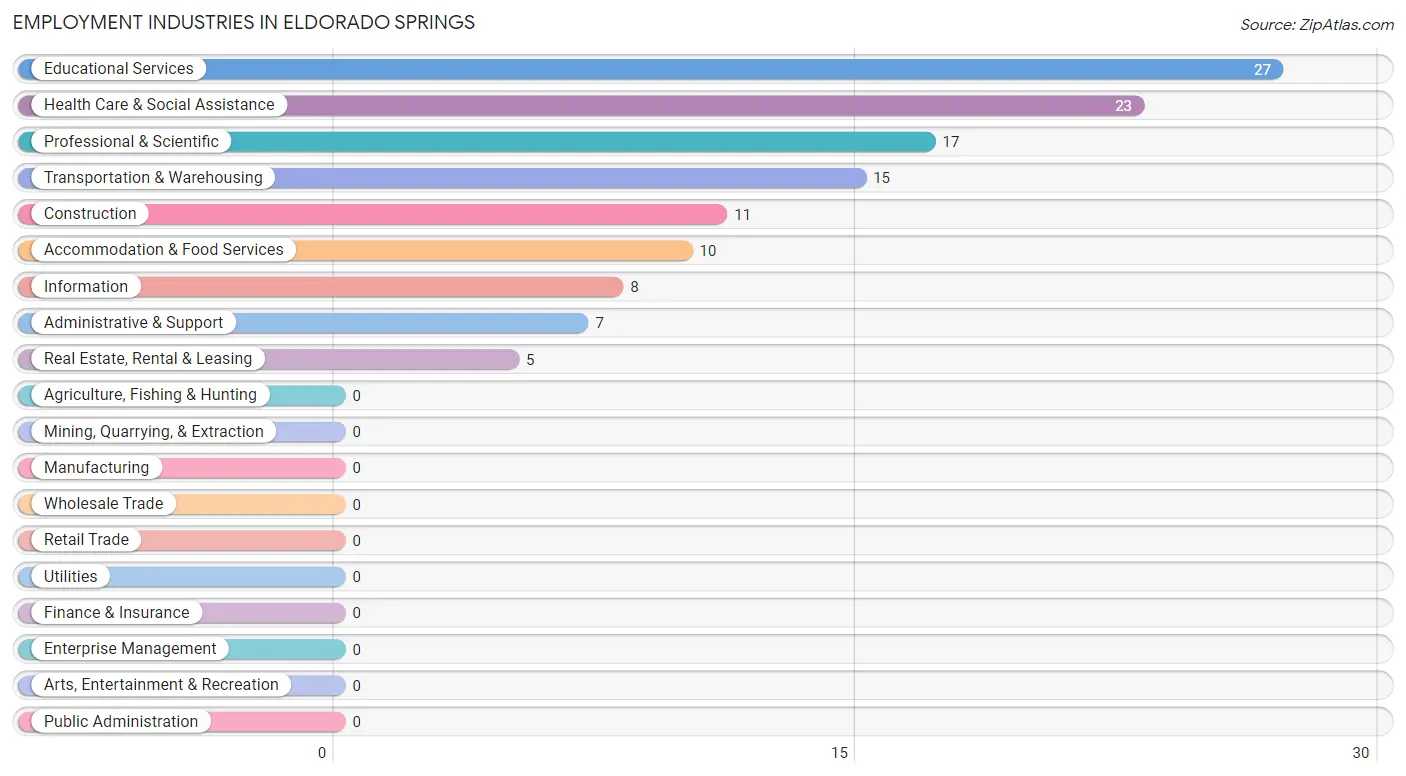
Employment Industries in Eldorado Springs
The major employment industries in Eldorado Springs include Educational Services (27 | 22.0%), Health Care & Social Assistance (23 | 18.7%), Professional & Scientific (17 | 13.8%), Transportation & Warehousing (15 | 12.2%), and Construction (11 | 8.9%).
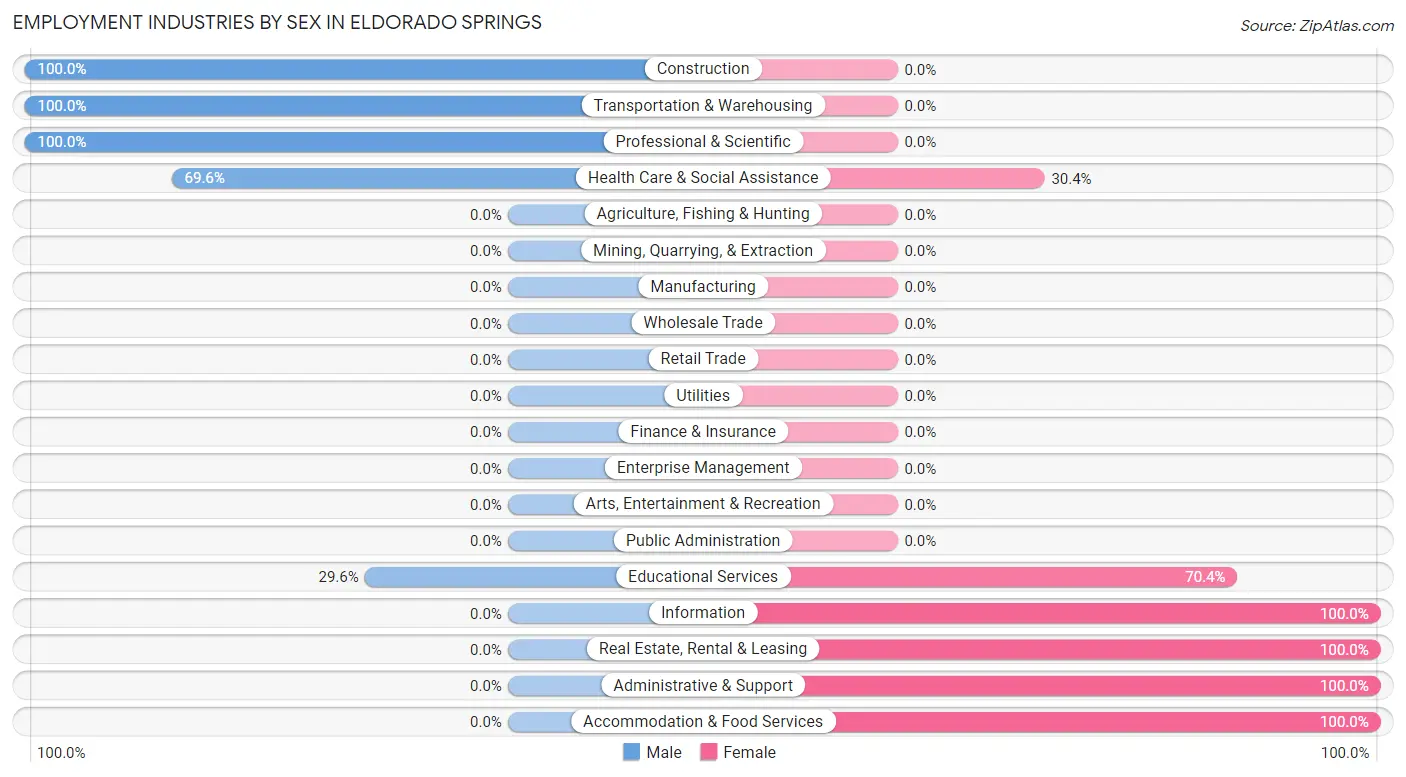
Employment Industries by Sex in Eldorado Springs
The Eldorado Springs industries that see more men than women are Construction (100.0%), Transportation & Warehousing (100.0%), and Professional & Scientific (100.0%), whereas the industries that tend to have a higher number of women are Information (100.0%), Real Estate, Rental & Leasing (100.0%), and Administrative & Support (100.0%).
| Industry | Male | Female |
| Agriculture, Fishing & Hunting | 0 (0.0%) | 0 (0.0%) |
| Mining, Quarrying, & Extraction | 0 (0.0%) | 0 (0.0%) |
| Construction | 11 (100.0%) | 0 (0.0%) |
| Manufacturing | 0 (0.0%) | 0 (0.0%) |
| Wholesale Trade | 0 (0.0%) | 0 (0.0%) |
| Retail Trade | 0 (0.0%) | 0 (0.0%) |
| Transportation & Warehousing | 15 (100.0%) | 0 (0.0%) |
| Utilities | 0 (0.0%) | 0 (0.0%) |
| Information | 0 (0.0%) | 8 (100.0%) |
| Finance & Insurance | 0 (0.0%) | 0 (0.0%) |
| Real Estate, Rental & Leasing | 0 (0.0%) | 5 (100.0%) |
| Professional & Scientific | 17 (100.0%) | 0 (0.0%) |
| Enterprise Management | 0 (0.0%) | 0 (0.0%) |
| Administrative & Support | 0 (0.0%) | 7 (100.0%) |
| Educational Services | 8 (29.6%) | 19 (70.4%) |
| Health Care & Social Assistance | 16 (69.6%) | 7 (30.4%) |
| Arts, Entertainment & Recreation | 0 (0.0%) | 0 (0.0%) |
| Accommodation & Food Services | 0 (0.0%) | 10 (100.0%) |
| Public Administration | 0 (0.0%) | 0 (0.0%) |
| Total | 67 (54.5%) | 56 (45.5%) |
Education in Eldorado Springs
School Enrollment in Eldorado Springs
The most common levels of schooling among the 47 students in Eldorado Springs are high school (27 | 57.5%), graduate / professional (11 | 23.4%), and middle school (9 | 19.2%).
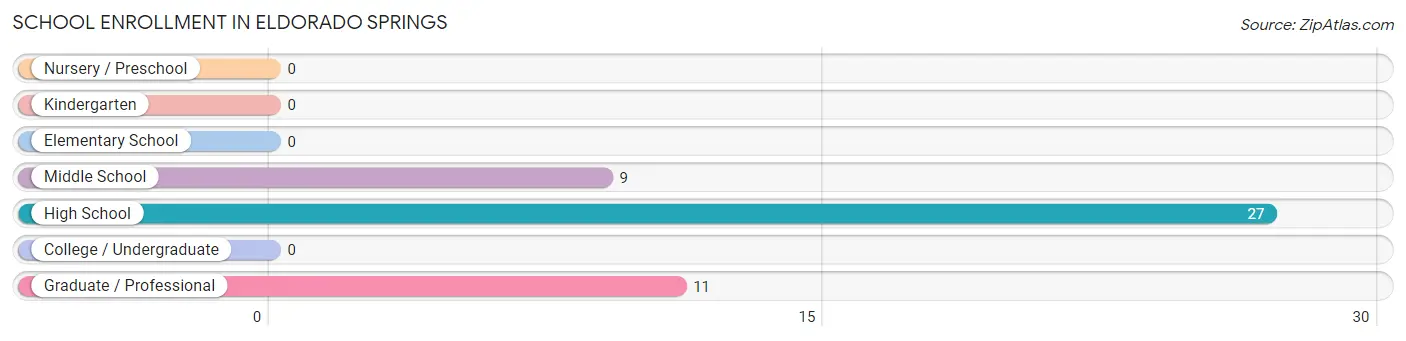
| School Level | # Students | % Students |
| Nursery / Preschool | 0 | 0.0% |
| Kindergarten | 0 | 0.0% |
| Elementary School | 0 | 0.0% |
| Middle School | 9 | 19.2% |
| High School | 27 | 57.5% |
| College / Undergraduate | 0 | 0.0% |
| Graduate / Professional | 11 | 23.4% |
| Total | 47 | 100.0% |
School Enrollment by Age by Funding Source in Eldorado Springs
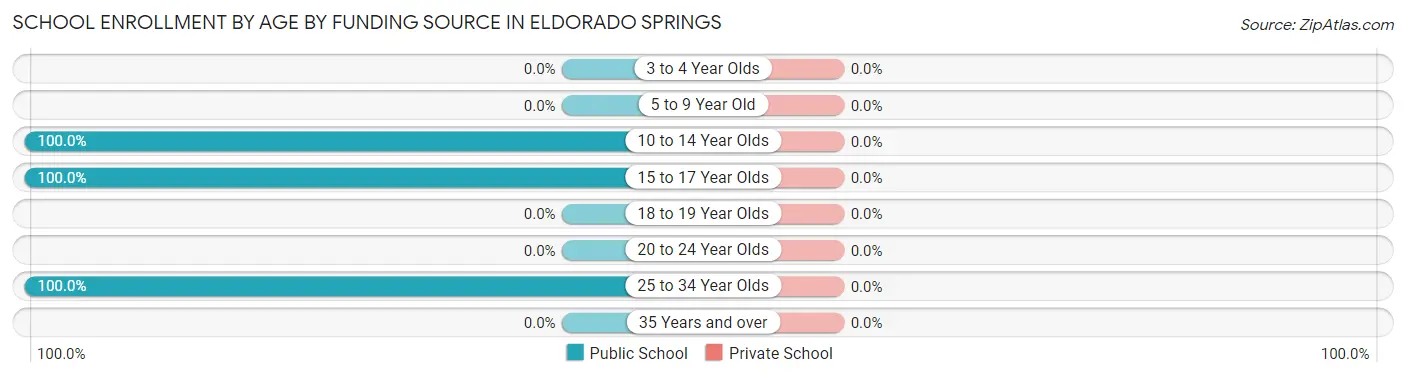
| Age Bracket | Public School | Private School |
| 3 to 4 Year Olds | 0 (0.0%) | 0 (0.0%) |
| 5 to 9 Year Old | 0 (0.0%) | 0 (0.0%) |
| 10 to 14 Year Olds | 9 (100.0%) | 0 (0.0%) |
| 15 to 17 Year Olds | 27 (100.0%) | 0 (0.0%) |
| 18 to 19 Year Olds | 0 (0.0%) | 0 (0.0%) |
| 20 to 24 Year Olds | 0 (0.0%) | 0 (0.0%) |
| 25 to 34 Year Olds | 11 (100.0%) | 0 (0.0%) |
| 35 Years and over | 0 (0.0%) | 0 (0.0%) |
| Total | 47 (100.0%) | 0 (0.0%) |
Educational Attainment by Field of Study in Eldorado Springs
Literature & languages (35 | 16.8%), liberal arts & history (31 | 14.8%), engineering (29 | 13.9%), science & technology (22 | 10.5%), and education (21 | 10.1%) are the most common fields of study among 209 individuals in Eldorado Springs who have obtained a bachelor's degree or higher.
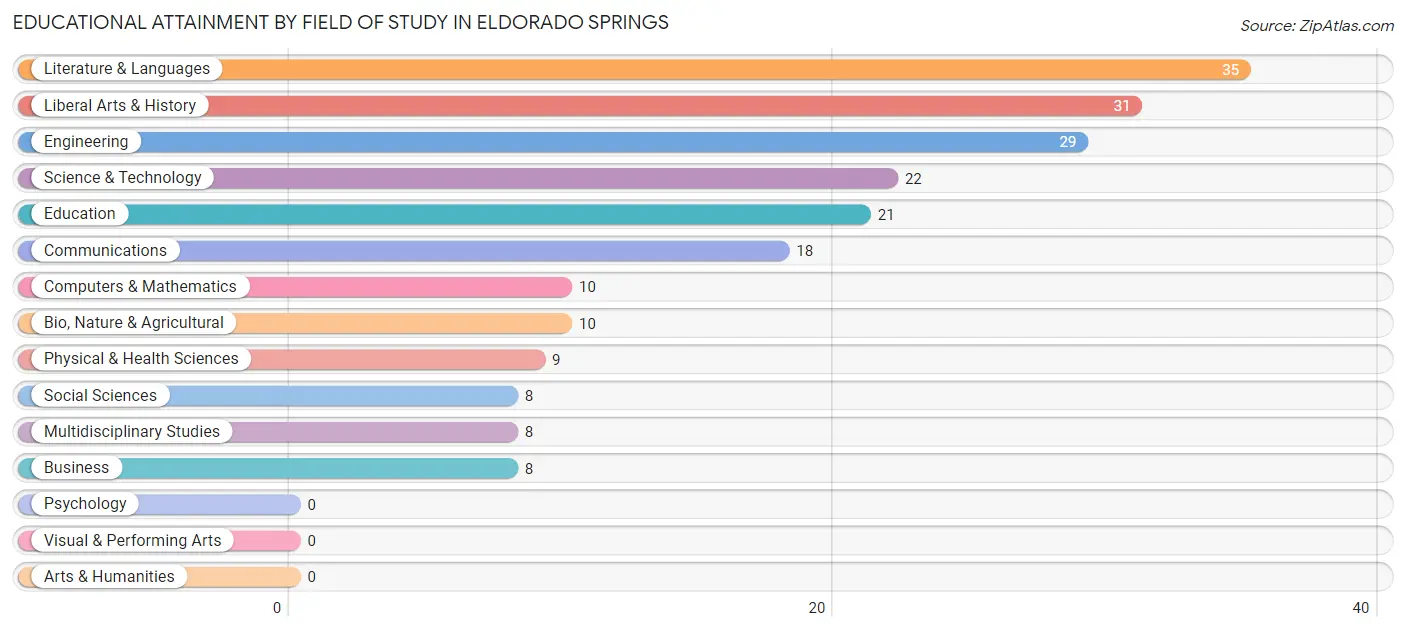
| Field of Study | # Graduates | % Graduates |
| Computers & Mathematics | 10 | 4.8% |
| Bio, Nature & Agricultural | 10 | 4.8% |
| Physical & Health Sciences | 9 | 4.3% |
| Psychology | 0 | 0.0% |
| Social Sciences | 8 | 3.8% |
| Engineering | 29 | 13.9% |
| Multidisciplinary Studies | 8 | 3.8% |
| Science & Technology | 22 | 10.5% |
| Business | 8 | 3.8% |
| Education | 21 | 10.1% |
| Literature & Languages | 35 | 16.8% |
| Liberal Arts & History | 31 | 14.8% |
| Visual & Performing Arts | 0 | 0.0% |
| Communications | 18 | 8.6% |
| Arts & Humanities | 0 | 0.0% |
| Total | 209 | 100.0% |
Transportation & Commute in Eldorado Springs
Vehicle Availability by Sex in Eldorado Springs
The most prevalent vehicle ownership categories in Eldorado Springs are males with 2 vehicles (29, accounting for 48.3%) and females with 2 vehicles (21, making up 51.8%).
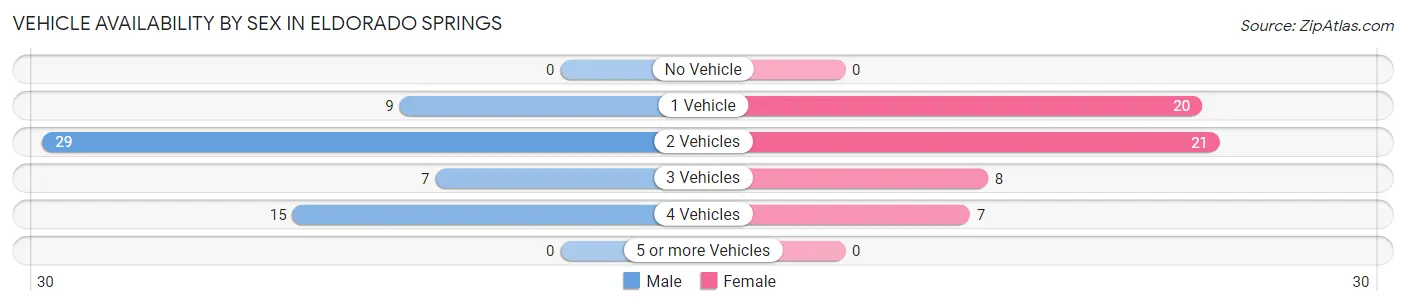
| Vehicles Available | Male | Female |
| No Vehicle | 0 (0.0%) | 0 (0.0%) |
| 1 Vehicle | 9 (15.0%) | 20 (35.7%) |
| 2 Vehicles | 29 (48.3%) | 21 (37.5%) |
| 3 Vehicles | 7 (11.7%) | 8 (14.3%) |
| 4 Vehicles | 15 (25.0%) | 7 (12.5%) |
| 5 or more Vehicles | 0 (0.0%) | 0 (0.0%) |
| Total | 60 (100.0%) | 56 (100.0%) |
Commute Time in Eldorado Springs
The most frequently occuring commute durations in Eldorado Springs are 20 to 24 minutes (23 commuters, 41.1%), 60 to 89 minutes (10 commuters, 17.9%), and 40 to 44 minutes (8 commuters, 14.3%).
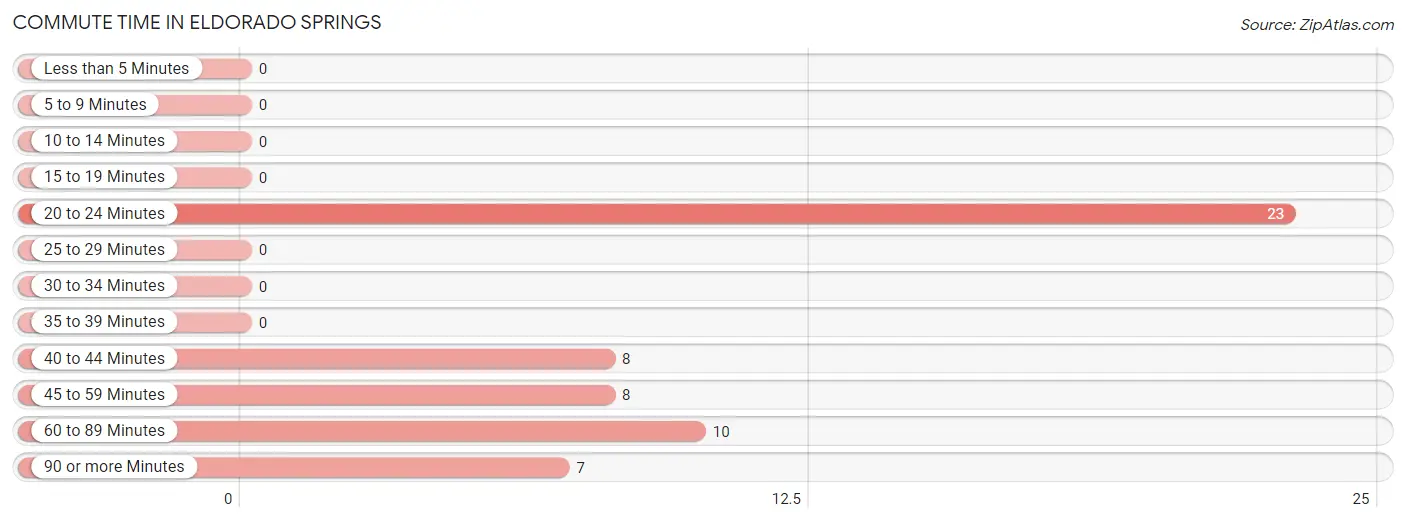
| Commute Time | # Commuters | % Commuters |
| Less than 5 Minutes | 0 | 0.0% |
| 5 to 9 Minutes | 0 | 0.0% |
| 10 to 14 Minutes | 0 | 0.0% |
| 15 to 19 Minutes | 0 | 0.0% |
| 20 to 24 Minutes | 23 | 41.1% |
| 25 to 29 Minutes | 0 | 0.0% |
| 30 to 34 Minutes | 0 | 0.0% |
| 35 to 39 Minutes | 0 | 0.0% |
| 40 to 44 Minutes | 8 | 14.3% |
| 45 to 59 Minutes | 8 | 14.3% |
| 60 to 89 Minutes | 10 | 17.9% |
| 90 or more Minutes | 7 | 12.5% |
Commute Time by Sex in Eldorado Springs
The most common commute times in Eldorado Springs are 20 to 24 minutes (16 commuters, 41.0%) for males and 60 to 89 minutes (10 commuters, 58.8%) for females.
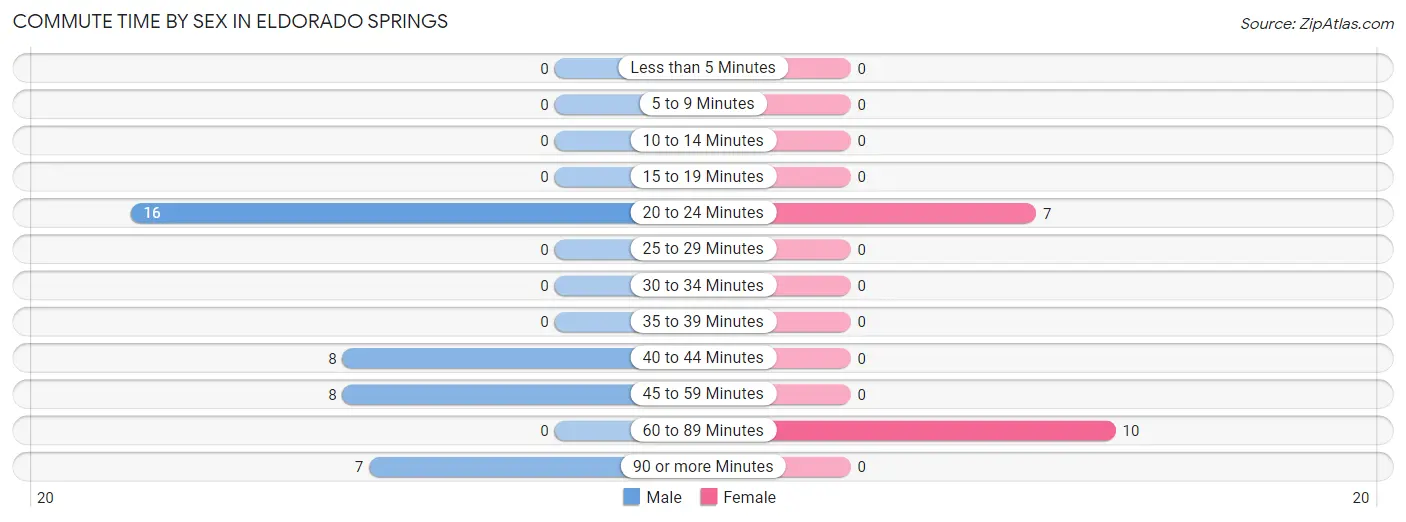
| Commute Time | Male | Female |
| Less than 5 Minutes | 0 (0.0%) | 0 (0.0%) |
| 5 to 9 Minutes | 0 (0.0%) | 0 (0.0%) |
| 10 to 14 Minutes | 0 (0.0%) | 0 (0.0%) |
| 15 to 19 Minutes | 0 (0.0%) | 0 (0.0%) |
| 20 to 24 Minutes | 16 (41.0%) | 7 (41.2%) |
| 25 to 29 Minutes | 0 (0.0%) | 0 (0.0%) |
| 30 to 34 Minutes | 0 (0.0%) | 0 (0.0%) |
| 35 to 39 Minutes | 0 (0.0%) | 0 (0.0%) |
| 40 to 44 Minutes | 8 (20.5%) | 0 (0.0%) |
| 45 to 59 Minutes | 8 (20.5%) | 0 (0.0%) |
| 60 to 89 Minutes | 0 (0.0%) | 10 (58.8%) |
| 90 or more Minutes | 7 (17.9%) | 0 (0.0%) |
Time of Departure to Work by Sex in Eldorado Springs
The most frequent times of departure to work in Eldorado Springs are 7:00 AM to 7:29 AM (16, 41.0%) for males and 6:30 AM to 6:59 AM (10, 58.8%) for females.
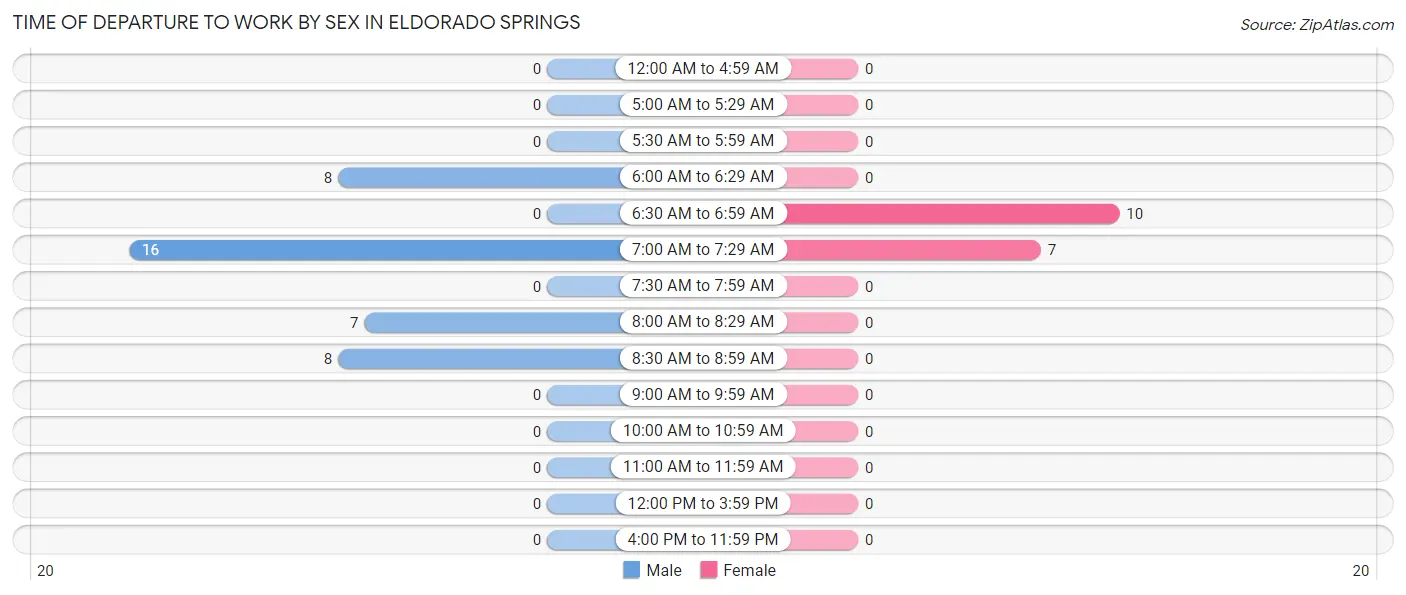
| Time of Departure | Male | Female |
| 12:00 AM to 4:59 AM | 0 (0.0%) | 0 (0.0%) |
| 5:00 AM to 5:29 AM | 0 (0.0%) | 0 (0.0%) |
| 5:30 AM to 5:59 AM | 0 (0.0%) | 0 (0.0%) |
| 6:00 AM to 6:29 AM | 8 (20.5%) | 0 (0.0%) |
| 6:30 AM to 6:59 AM | 0 (0.0%) | 10 (58.8%) |
| 7:00 AM to 7:29 AM | 16 (41.0%) | 7 (41.2%) |
| 7:30 AM to 7:59 AM | 0 (0.0%) | 0 (0.0%) |
| 8:00 AM to 8:29 AM | 7 (17.9%) | 0 (0.0%) |
| 8:30 AM to 8:59 AM | 8 (20.5%) | 0 (0.0%) |
| 9:00 AM to 9:59 AM | 0 (0.0%) | 0 (0.0%) |
| 10:00 AM to 10:59 AM | 0 (0.0%) | 0 (0.0%) |
| 11:00 AM to 11:59 AM | 0 (0.0%) | 0 (0.0%) |
| 12:00 PM to 3:59 PM | 0 (0.0%) | 0 (0.0%) |
| 4:00 PM to 11:59 PM | 0 (0.0%) | 0 (0.0%) |
| Total | 39 (100.0%) | 17 (100.0%) |
Housing Occupancy in Eldorado Springs
Occupancy by Ownership in Eldorado Springs
Of the total 139 dwellings in Eldorado Springs, owner-occupied units account for 139 (100.0%), while renter-occupied units make up 0 (0.0%).
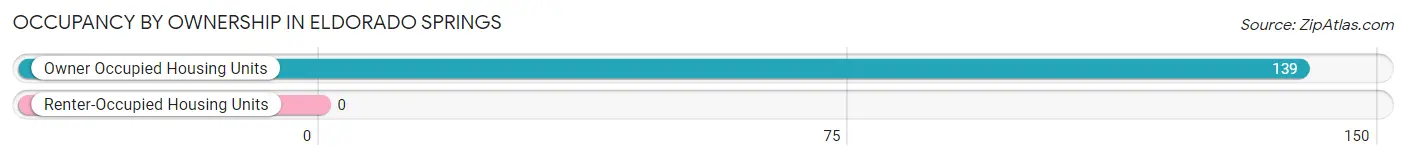
| Occupancy | # Housing Units | % Housing Units |
| Owner Occupied Housing Units | 139 | 100.0% |
| Renter-Occupied Housing Units | 0 | 0.0% |
| Total Occupied Housing Units | 139 | 100.0% |
Occupancy by Household Size in Eldorado Springs
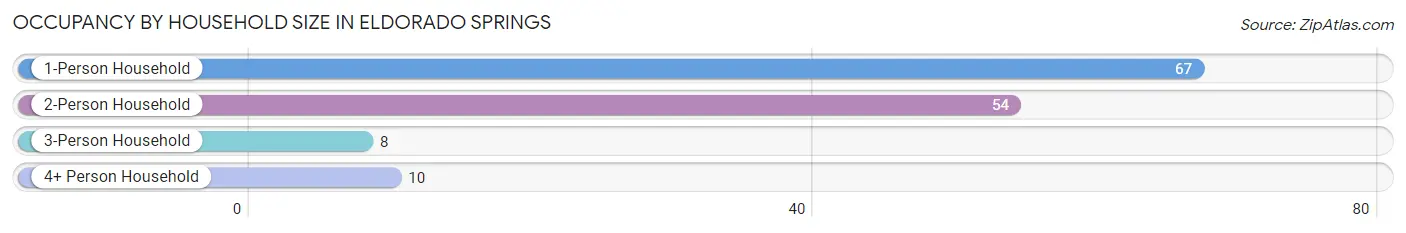
| Household Size | # Housing Units | % Housing Units |
| 1-Person Household | 67 | 48.2% |
| 2-Person Household | 54 | 38.9% |
| 3-Person Household | 8 | 5.8% |
| 4+ Person Household | 10 | 7.2% |
| Total Housing Units | 139 | 100.0% |
Occupancy by Ownership by Household Size in Eldorado Springs
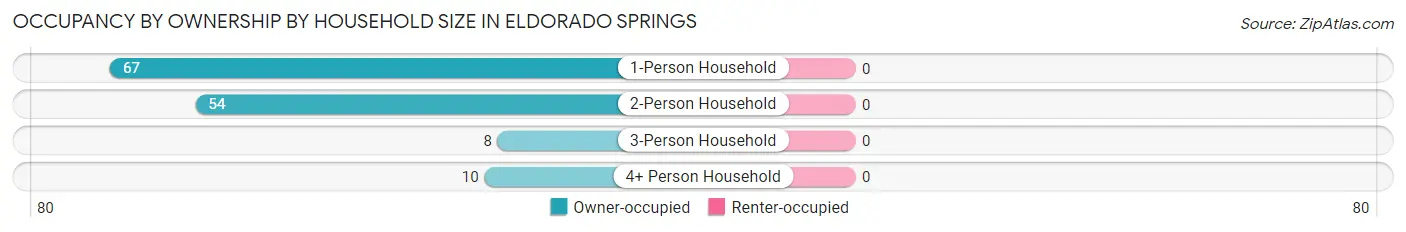
| Household Size | Owner-occupied | Renter-occupied |
| 1-Person Household | 67 (100.0%) | 0 (0.0%) |
| 2-Person Household | 54 (100.0%) | 0 (0.0%) |
| 3-Person Household | 8 (100.0%) | 0 (0.0%) |
| 4+ Person Household | 10 (100.0%) | 0 (0.0%) |
| Total Housing Units | 139 (100.0%) | 0 (0.0%) |
Occupancy by Educational Attainment in Eldorado Springs
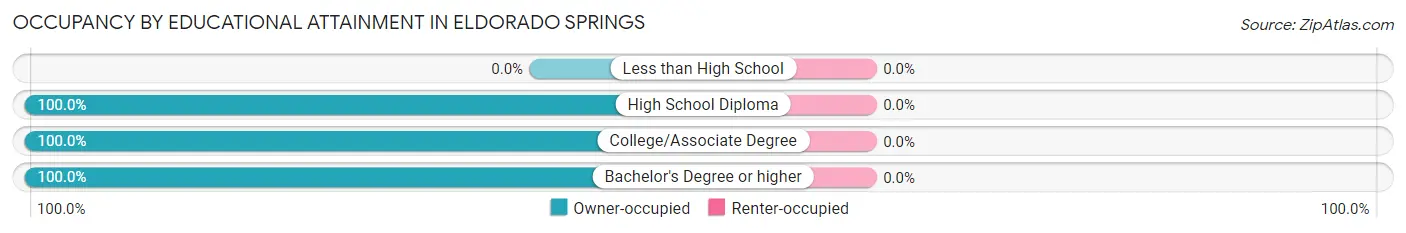
| Household Size | Owner-occupied | Renter-occupied |
| Less than High School | 0 (0.0%) | 0 (0.0%) |
| High School Diploma | 9 (100.0%) | 0 (0.0%) |
| College/Associate Degree | 9 (100.0%) | 0 (0.0%) |
| Bachelor's Degree or higher | 121 (100.0%) | 0 (0.0%) |
Occupancy by Age of Householder in Eldorado Springs
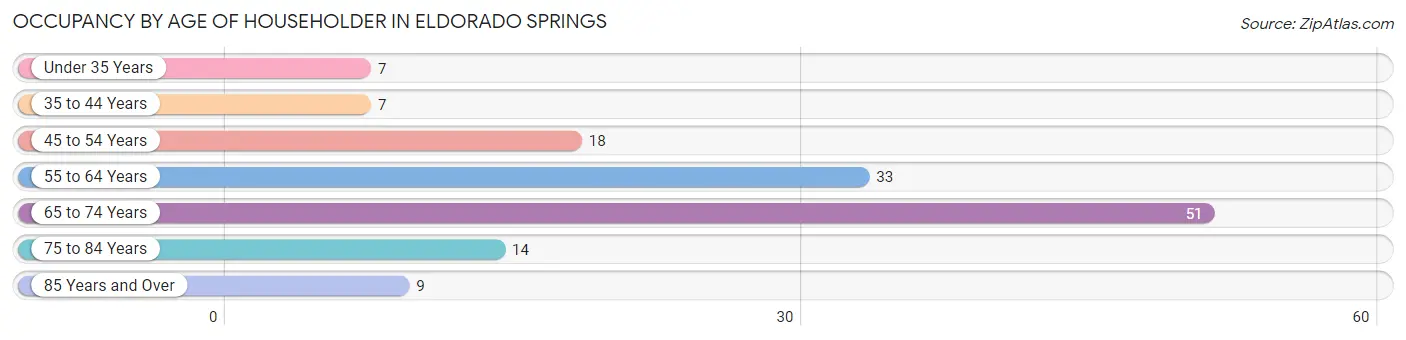
| Age Bracket | # Households | % Households |
| Under 35 Years | 7 | 5.0% |
| 35 to 44 Years | 7 | 5.0% |
| 45 to 54 Years | 18 | 13.0% |
| 55 to 64 Years | 33 | 23.7% |
| 65 to 74 Years | 51 | 36.7% |
| 75 to 84 Years | 14 | 10.1% |
| 85 Years and Over | 9 | 6.5% |
| Total | 139 | 100.0% |
Housing Finances in Eldorado Springs
Median Income by Occupancy in Eldorado Springs
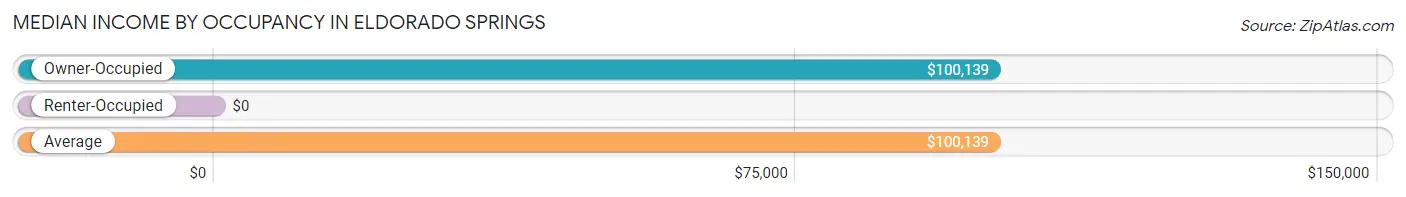
| Occupancy Type | # Households | Median Income |
| Owner-Occupied | 139 (100.0%) | $100,139 |
| Renter-Occupied | 0 (0.0%) | $0 |
| Average | 139 (100.0%) | $100,139 |
Occupancy by Householder Income Bracket in Eldorado Springs
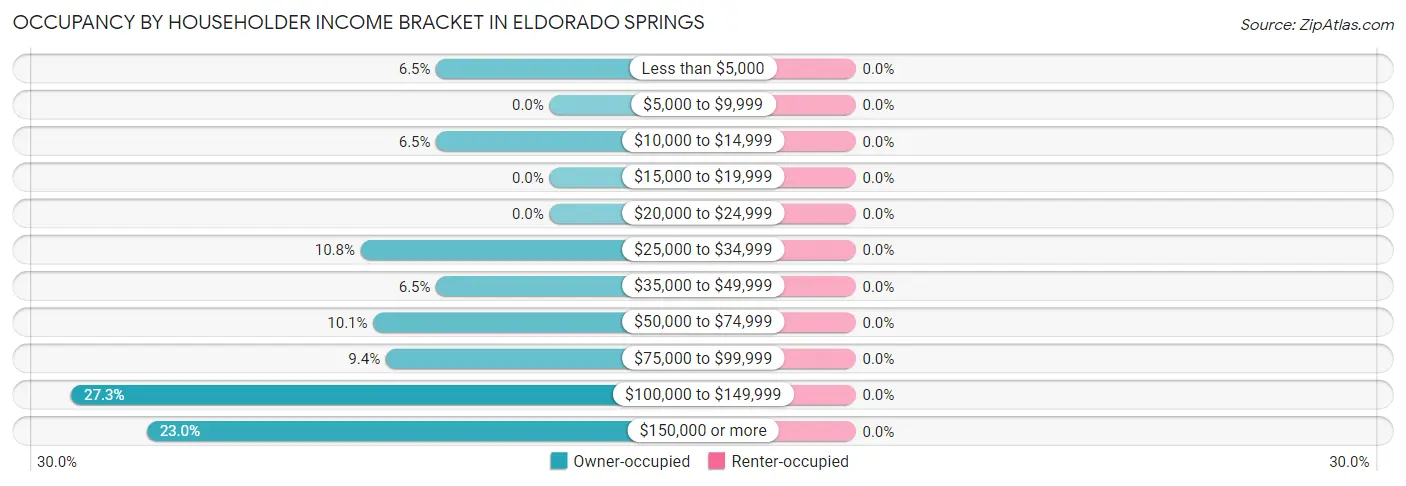
| Income Bracket | Owner-occupied | Renter-occupied |
| Less than $5,000 | 9 (6.5%) | 0 (0.0%) |
| $5,000 to $9,999 | 0 (0.0%) | 0 (0.0%) |
| $10,000 to $14,999 | 9 (6.5%) | 0 (0.0%) |
| $15,000 to $19,999 | 0 (0.0%) | 0 (0.0%) |
| $20,000 to $24,999 | 0 (0.0%) | 0 (0.0%) |
| $25,000 to $34,999 | 15 (10.8%) | 0 (0.0%) |
| $35,000 to $49,999 | 9 (6.5%) | 0 (0.0%) |
| $50,000 to $74,999 | 14 (10.1%) | 0 (0.0%) |
| $75,000 to $99,999 | 13 (9.3%) | 0 (0.0%) |
| $100,000 to $149,999 | 38 (27.3%) | 0 (0.0%) |
| $150,000 or more | 32 (23.0%) | 0 (0.0%) |
| Total | 139 (100.0%) | 0 (0.0%) |
Monthly Housing Cost Tiers in Eldorado Springs
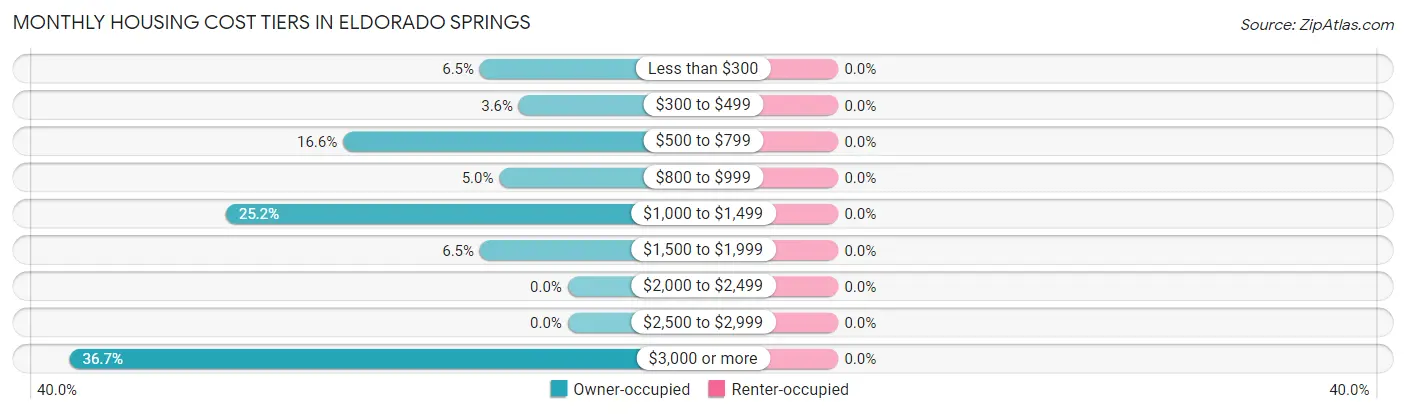
| Monthly Cost | Owner-occupied | Renter-occupied |
| Less than $300 | 9 (6.5%) | 0 (0.0%) |
| $300 to $499 | 5 (3.6%) | 0 (0.0%) |
| $500 to $799 | 23 (16.6%) | 0 (0.0%) |
| $800 to $999 | 7 (5.0%) | 0 (0.0%) |
| $1,000 to $1,499 | 35 (25.2%) | 0 (0.0%) |
| $1,500 to $1,999 | 9 (6.5%) | 0 (0.0%) |
| $2,000 to $2,499 | 0 (0.0%) | 0 (0.0%) |
| $2,500 to $2,999 | 0 (0.0%) | 0 (0.0%) |
| $3,000 or more | 51 (36.7%) | 0 (0.0%) |
| Total | 139 (100.0%) | 0 (0.0%) |
Physical Housing Characteristics in Eldorado Springs
Housing Structures in Eldorado Springs
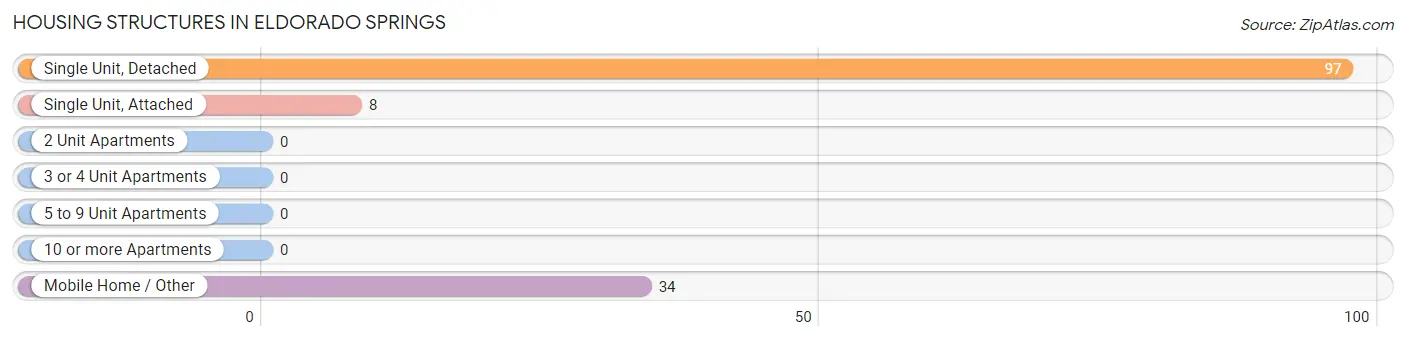
| Structure Type | # Housing Units | % Housing Units |
| Single Unit, Detached | 97 | 69.8% |
| Single Unit, Attached | 8 | 5.8% |
| 2 Unit Apartments | 0 | 0.0% |
| 3 or 4 Unit Apartments | 0 | 0.0% |
| 5 to 9 Unit Apartments | 0 | 0.0% |
| 10 or more Apartments | 0 | 0.0% |
| Mobile Home / Other | 34 | 24.5% |
| Total | 139 | 100.0% |
Housing Structures by Occupancy in Eldorado Springs
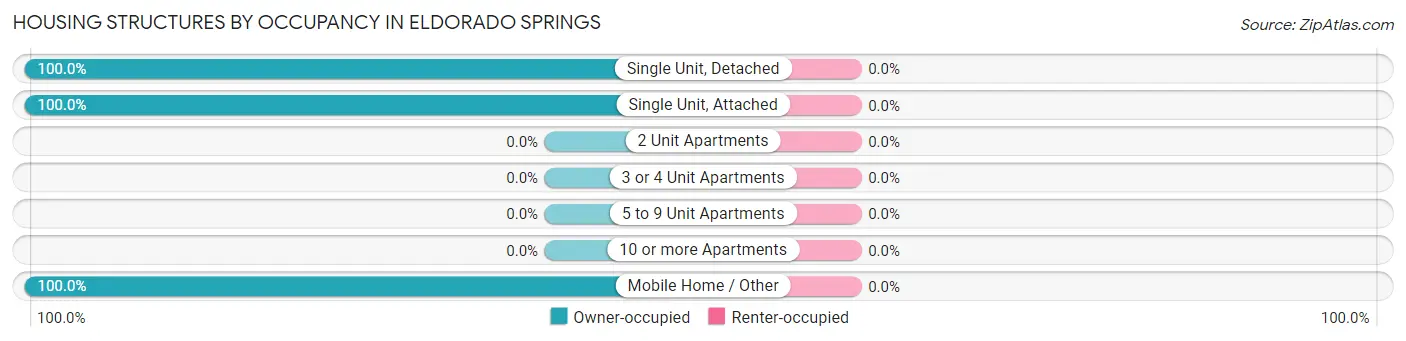
| Structure Type | Owner-occupied | Renter-occupied |
| Single Unit, Detached | 97 (100.0%) | 0 (0.0%) |
| Single Unit, Attached | 8 (100.0%) | 0 (0.0%) |
| 2 Unit Apartments | 0 (0.0%) | 0 (0.0%) |
| 3 or 4 Unit Apartments | 0 (0.0%) | 0 (0.0%) |
| 5 to 9 Unit Apartments | 0 (0.0%) | 0 (0.0%) |
| 10 or more Apartments | 0 (0.0%) | 0 (0.0%) |
| Mobile Home / Other | 34 (100.0%) | 0 (0.0%) |
| Total | 139 (100.0%) | 0 (0.0%) |
Housing Structures by Number of Rooms in Eldorado Springs
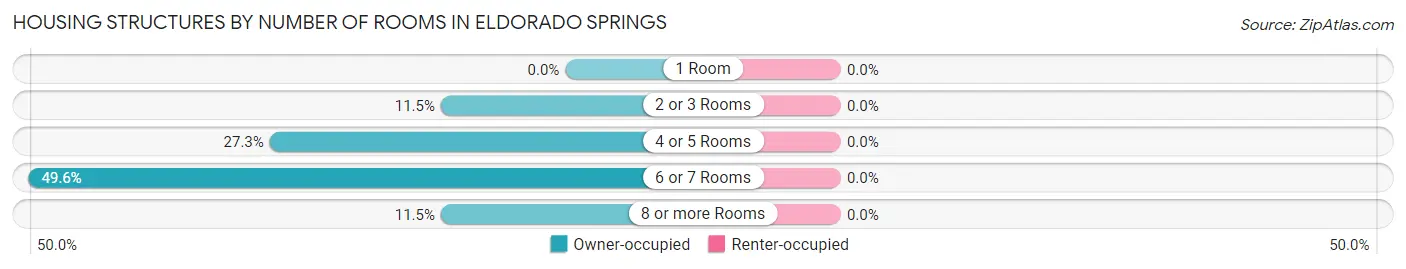
| Number of Rooms | Owner-occupied | Renter-occupied |
| 1 Room | 0 (0.0%) | 0 (0.0%) |
| 2 or 3 Rooms | 16 (11.5%) | 0 (0.0%) |
| 4 or 5 Rooms | 38 (27.3%) | 0 (0.0%) |
| 6 or 7 Rooms | 69 (49.6%) | 0 (0.0%) |
| 8 or more Rooms | 16 (11.5%) | 0 (0.0%) |
| Total | 139 (100.0%) | 0 (0.0%) |
Housing Structure by Heating Type in Eldorado Springs
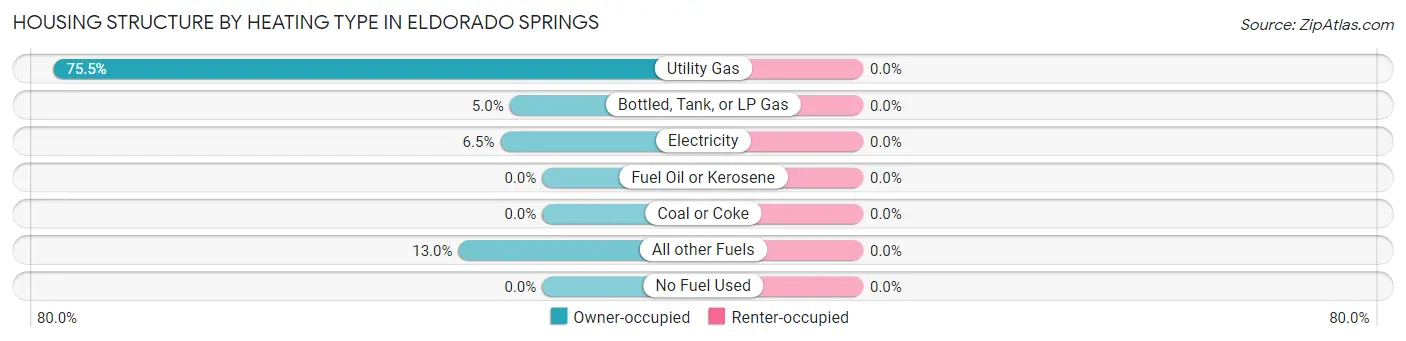
| Heating Type | Owner-occupied | Renter-occupied |
| Utility Gas | 105 (75.5%) | 0 (0.0%) |
| Bottled, Tank, or LP Gas | 7 (5.0%) | 0 (0.0%) |
| Electricity | 9 (6.5%) | 0 (0.0%) |
| Fuel Oil or Kerosene | 0 (0.0%) | 0 (0.0%) |
| Coal or Coke | 0 (0.0%) | 0 (0.0%) |
| All other Fuels | 18 (13.0%) | 0 (0.0%) |
| No Fuel Used | 0 (0.0%) | 0 (0.0%) |
| Total | 139 (100.0%) | 0 (0.0%) |
Household Vehicle Usage in Eldorado Springs
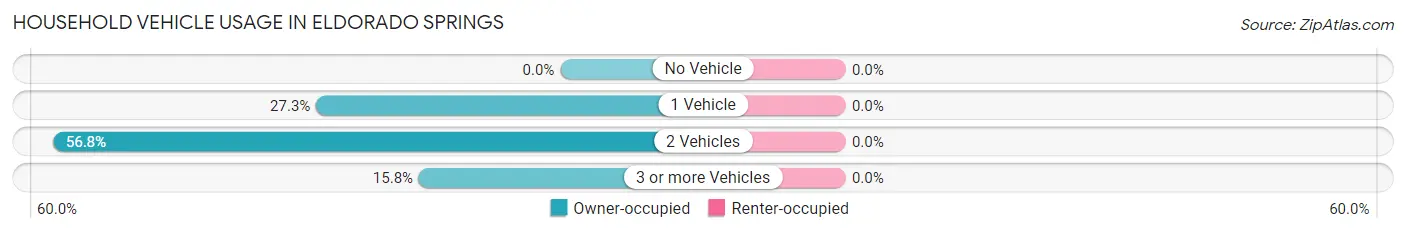
| Vehicles per Household | Owner-occupied | Renter-occupied |
| No Vehicle | 0 (0.0%) | 0 (0.0%) |
| 1 Vehicle | 38 (27.3%) | 0 (0.0%) |
| 2 Vehicles | 79 (56.8%) | 0 (0.0%) |
| 3 or more Vehicles | 22 (15.8%) | 0 (0.0%) |
| Total | 139 (100.0%) | 0 (0.0%) |
Real Estate & Mortgages in Eldorado Springs
Real Estate and Mortgage Overview in Eldorado Springs
| Characteristic | Without Mortgage | With Mortgage |
| Housing Units | 70 | 69 |
| Median Property Value | - | - |
| Median Household Income | $40,556 | $32 |
| Monthly Housing Costs | $778 | $51 |
| Real Estate Taxes | - | - |
Property Value by Mortgage Status in Eldorado Springs
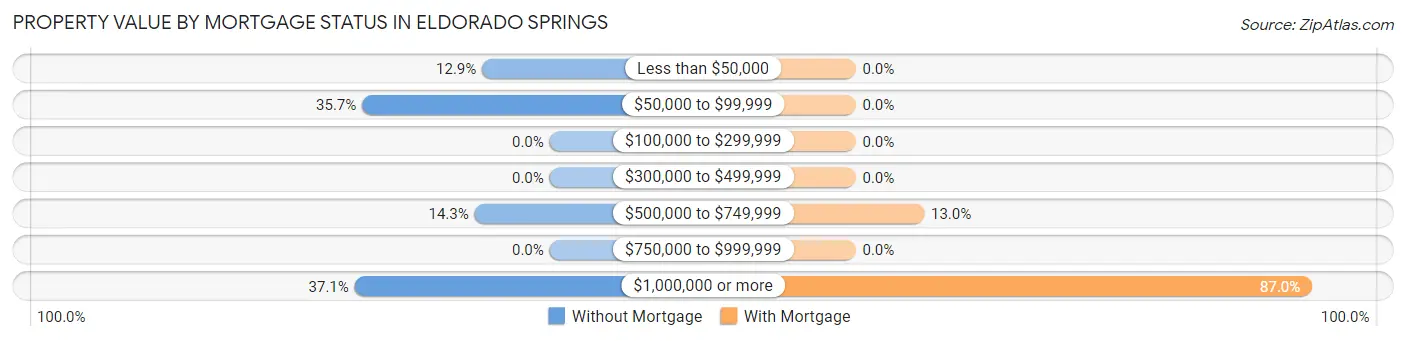
| Property Value | Without Mortgage | With Mortgage |
| Less than $50,000 | 9 (12.9%) | 0 (0.0%) |
| $50,000 to $99,999 | 25 (35.7%) | 0 (0.0%) |
| $100,000 to $299,999 | 0 (0.0%) | 0 (0.0%) |
| $300,000 to $499,999 | 0 (0.0%) | 0 (0.0%) |
| $500,000 to $749,999 | 10 (14.3%) | 9 (13.0%) |
| $750,000 to $999,999 | 0 (0.0%) | 0 (0.0%) |
| $1,000,000 or more | 26 (37.1%) | 60 (87.0%) |
| Total | 70 (100.0%) | 69 (100.0%) |
Household Income by Mortgage Status in Eldorado Springs
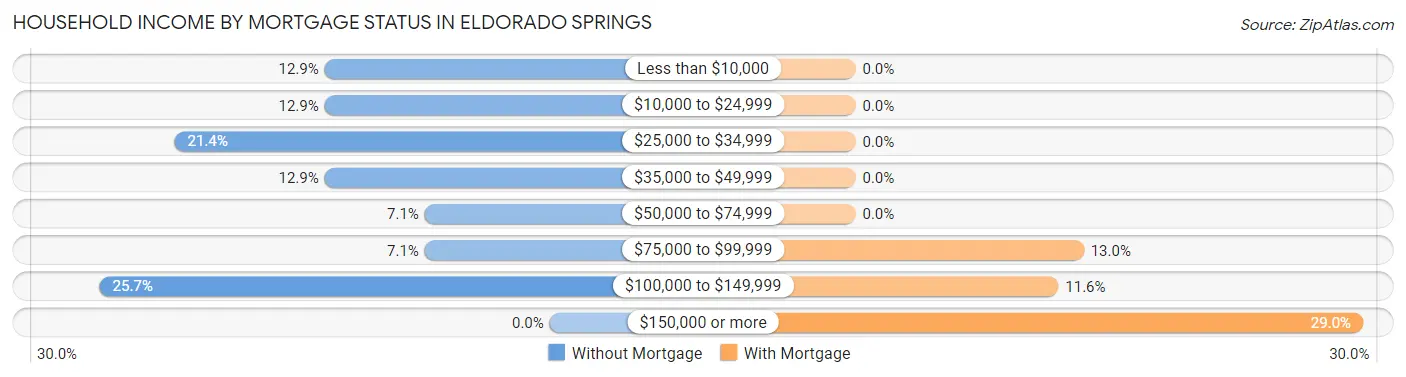
| Household Income | Without Mortgage | With Mortgage |
| Less than $10,000 | 9 (12.9%) | 0 (0.0%) |
| $10,000 to $24,999 | 9 (12.9%) | 0 (0.0%) |
| $25,000 to $34,999 | 15 (21.4%) | 0 (0.0%) |
| $35,000 to $49,999 | 9 (12.9%) | 0 (0.0%) |
| $50,000 to $74,999 | 5 (7.1%) | 0 (0.0%) |
| $75,000 to $99,999 | 5 (7.1%) | 9 (13.0%) |
| $100,000 to $149,999 | 18 (25.7%) | 8 (11.6%) |
| $150,000 or more | 0 (0.0%) | 20 (29.0%) |
| Total | 70 (100.0%) | 69 (100.0%) |
Property Value to Household Income Ratio in Eldorado Springs
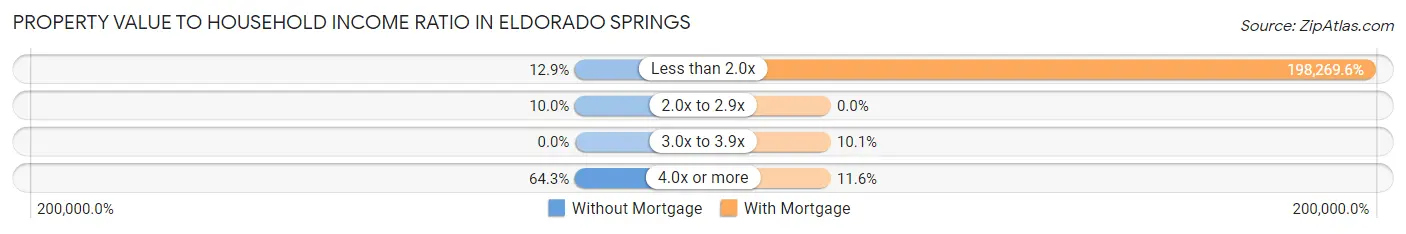
| Value-to-Income Ratio | Without Mortgage | With Mortgage |
| Less than 2.0x | 9 (12.9%) | 136,806 (198,269.6%) |
| 2.0x to 2.9x | 7 (10.0%) | 0 (0.0%) |
| 3.0x to 3.9x | 0 (0.0%) | 7 (10.1%) |
| 4.0x or more | 45 (64.3%) | 8 (11.6%) |
| Total | 70 (100.0%) | 69 (100.0%) |
Real Estate Taxes by Mortgage Status in Eldorado Springs
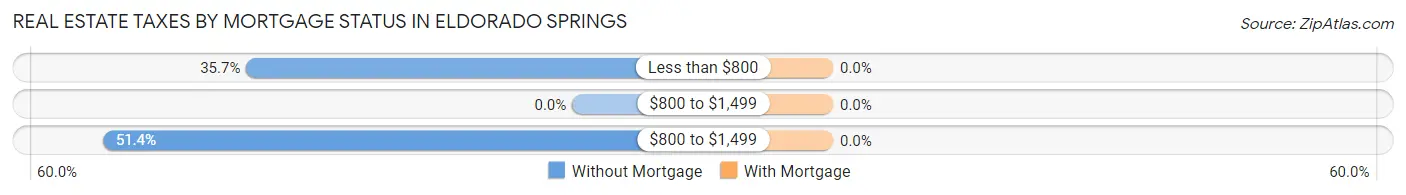
| Property Taxes | Without Mortgage | With Mortgage |
| Less than $800 | 25 (35.7%) | 0 (0.0%) |
| $800 to $1,499 | 0 (0.0%) | 0 (0.0%) |
| $800 to $1,499 | 36 (51.4%) | 0 (0.0%) |
| Total | 70 (100.0%) | 69 (100.0%) |
Health & Disability in Eldorado Springs
Health Insurance Coverage by Age in Eldorado Springs
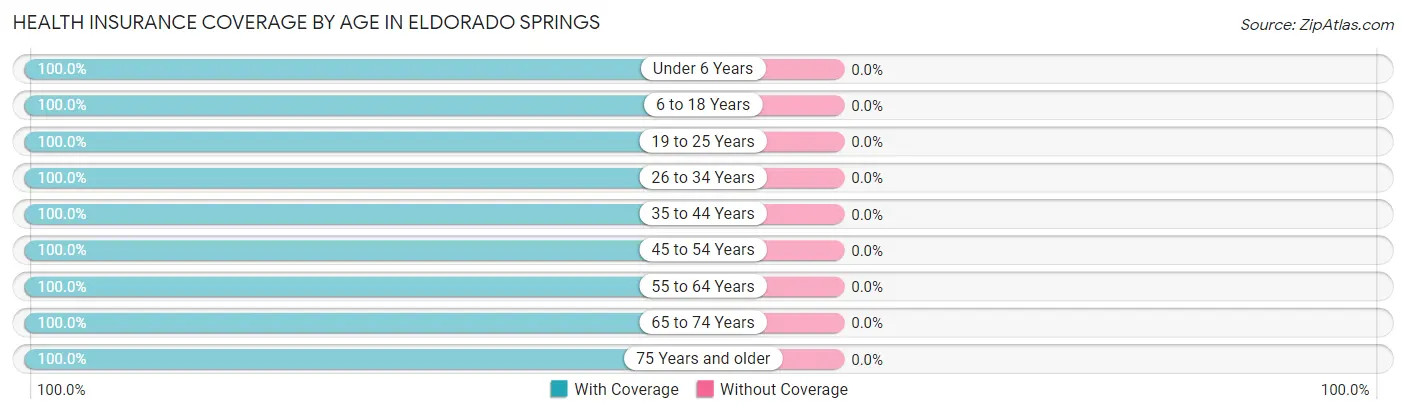
| Age Bracket | With Coverage | Without Coverage |
| Under 6 Years | 5 (100.0%) | 0 (0.0%) |
| 6 to 18 Years | 36 (100.0%) | 0 (0.0%) |
| 19 to 25 Years | 8 (100.0%) | 0 (0.0%) |
| 26 to 34 Years | 33 (100.0%) | 0 (0.0%) |
| 35 to 44 Years | 7 (100.0%) | 0 (0.0%) |
| 45 to 54 Years | 43 (100.0%) | 0 (0.0%) |
| 55 to 64 Years | 41 (100.0%) | 0 (0.0%) |
| 65 to 74 Years | 73 (100.0%) | 0 (0.0%) |
| 75 Years and older | 38 (100.0%) | 0 (0.0%) |
| Total | 284 (100.0%) | 0 (0.0%) |
Health Insurance Coverage by Citizenship Status in Eldorado Springs
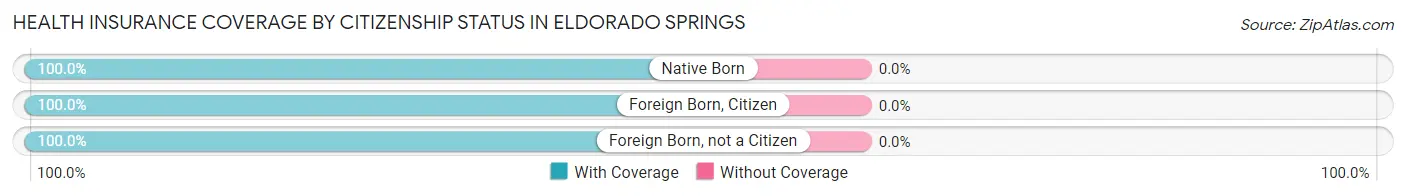
| Citizenship Status | With Coverage | Without Coverage |
| Native Born | 5 (100.0%) | 0 (0.0%) |
| Foreign Born, Citizen | 36 (100.0%) | 0 (0.0%) |
| Foreign Born, not a Citizen | 8 (100.0%) | 0 (0.0%) |
Health Insurance Coverage by Household Income in Eldorado Springs
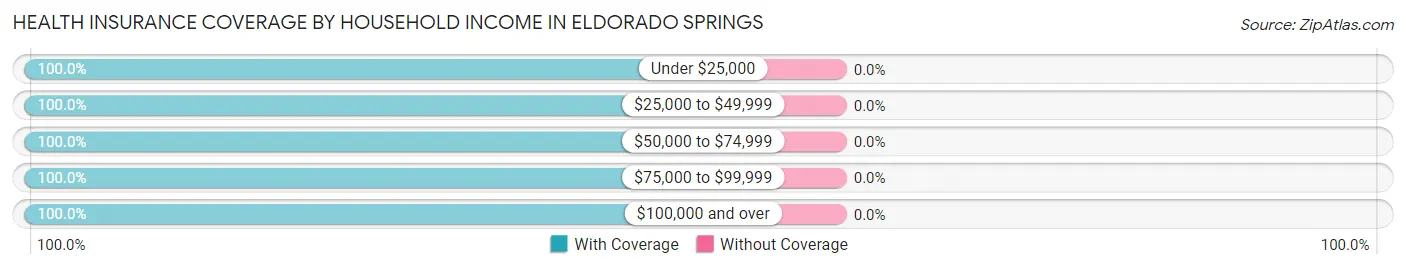
| Household Income | With Coverage | Without Coverage |
| Under $25,000 | 18 (100.0%) | 0 (0.0%) |
| $25,000 to $49,999 | 24 (100.0%) | 0 (0.0%) |
| $50,000 to $74,999 | 14 (100.0%) | 0 (0.0%) |
| $75,000 to $99,999 | 32 (100.0%) | 0 (0.0%) |
| $100,000 and over | 165 (100.0%) | 0 (0.0%) |
Public vs Private Health Insurance Coverage by Age in Eldorado Springs
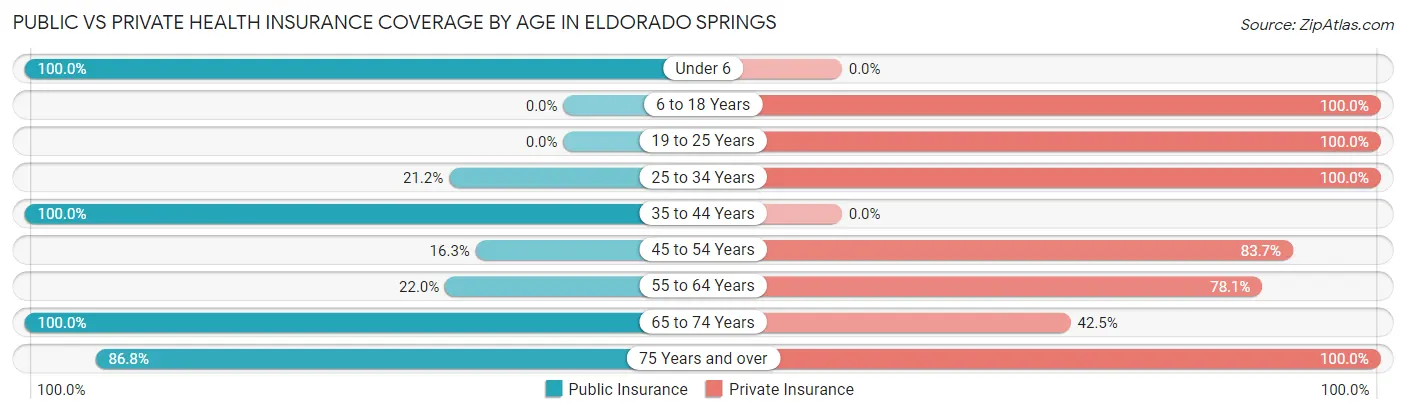
| Age Bracket | Public Insurance | Private Insurance |
| Under 6 | 5 (100.0%) | 0 (0.0%) |
| 6 to 18 Years | 0 (0.0%) | 36 (100.0%) |
| 19 to 25 Years | 0 (0.0%) | 8 (100.0%) |
| 25 to 34 Years | 7 (21.2%) | 33 (100.0%) |
| 35 to 44 Years | 7 (100.0%) | 0 (0.0%) |
| 45 to 54 Years | 7 (16.3%) | 36 (83.7%) |
| 55 to 64 Years | 9 (22.0%) | 32 (78.0%) |
| 65 to 74 Years | 73 (100.0%) | 31 (42.5%) |
| 75 Years and over | 33 (86.8%) | 38 (100.0%) |
| Total | 141 (49.6%) | 214 (75.3%) |
Disability Status by Sex by Age in Eldorado Springs
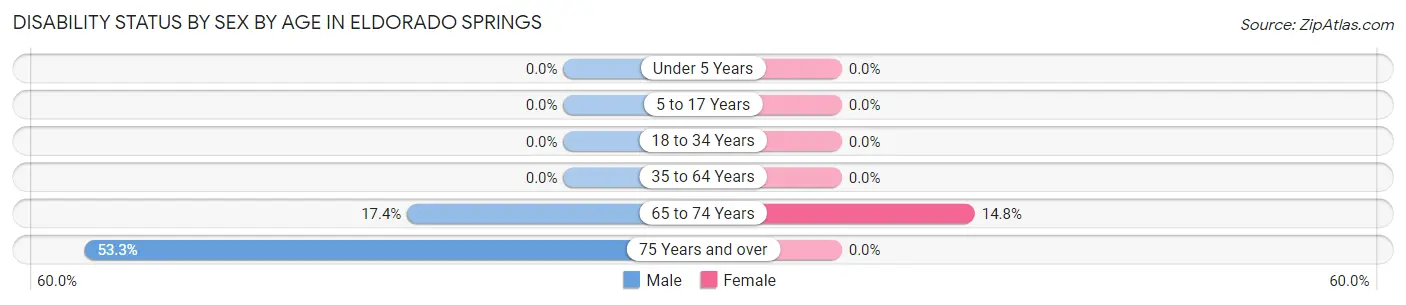
| Age Bracket | Male | Female |
| Under 5 Years | 0 (0.0%) | 0 (0.0%) |
| 5 to 17 Years | 0 (0.0%) | 0 (0.0%) |
| 18 to 34 Years | 0 (0.0%) | 0 (0.0%) |
| 35 to 64 Years | 0 (0.0%) | 0 (0.0%) |
| 65 to 74 Years | 8 (17.4%) | 4 (14.8%) |
| 75 Years and over | 8 (53.3%) | 0 (0.0%) |
Disability Class by Sex by Age in Eldorado Springs
Disability Class: Hearing Difficulty
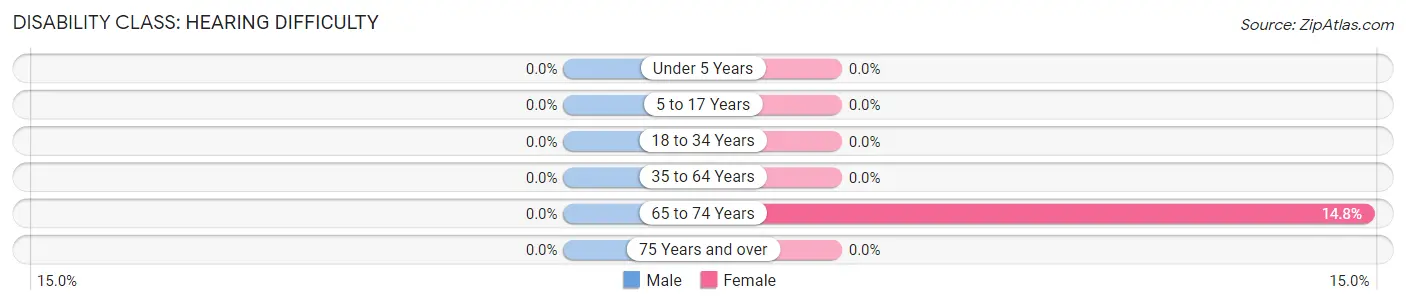
| Age Bracket | Male | Female |
| Under 5 Years | 0 (0.0%) | 0 (0.0%) |
| 5 to 17 Years | 0 (0.0%) | 0 (0.0%) |
| 18 to 34 Years | 0 (0.0%) | 0 (0.0%) |
| 35 to 64 Years | 0 (0.0%) | 0 (0.0%) |
| 65 to 74 Years | 0 (0.0%) | 4 (14.8%) |
| 75 Years and over | 0 (0.0%) | 0 (0.0%) |
Disability Class: Vision Difficulty
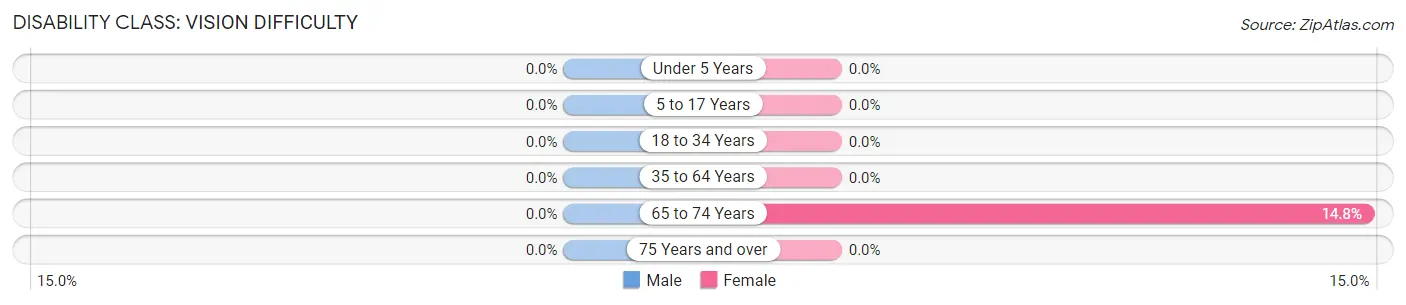
| Age Bracket | Male | Female |
| Under 5 Years | 0 (0.0%) | 0 (0.0%) |
| 5 to 17 Years | 0 (0.0%) | 0 (0.0%) |
| 18 to 34 Years | 0 (0.0%) | 0 (0.0%) |
| 35 to 64 Years | 0 (0.0%) | 0 (0.0%) |
| 65 to 74 Years | 0 (0.0%) | 4 (14.8%) |
| 75 Years and over | 0 (0.0%) | 0 (0.0%) |
Disability Class: Cognitive Difficulty
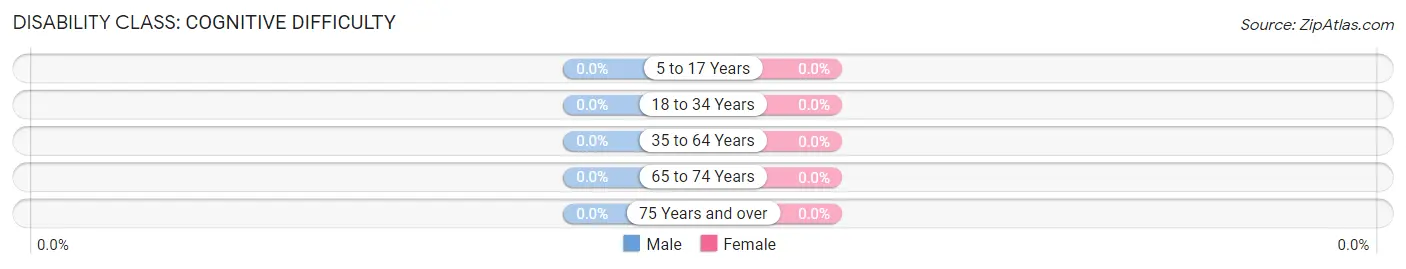
| Age Bracket | Male | Female |
| 5 to 17 Years | 0 (0.0%) | 0 (0.0%) |
| 18 to 34 Years | 0 (0.0%) | 0 (0.0%) |
| 35 to 64 Years | 0 (0.0%) | 0 (0.0%) |
| 65 to 74 Years | 0 (0.0%) | 0 (0.0%) |
| 75 Years and over | 0 (0.0%) | 0 (0.0%) |
Disability Class: Ambulatory Difficulty
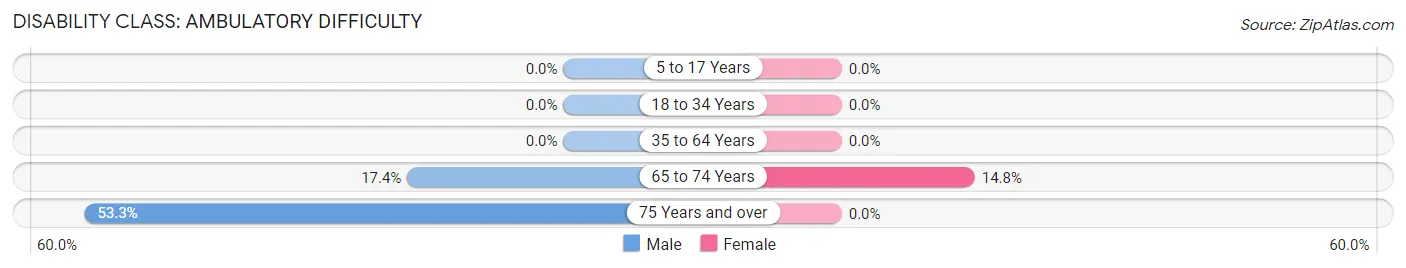
| Age Bracket | Male | Female |
| 5 to 17 Years | 0 (0.0%) | 0 (0.0%) |
| 18 to 34 Years | 0 (0.0%) | 0 (0.0%) |
| 35 to 64 Years | 0 (0.0%) | 0 (0.0%) |
| 65 to 74 Years | 8 (17.4%) | 4 (14.8%) |
| 75 Years and over | 8 (53.3%) | 0 (0.0%) |
Disability Class: Self-Care Difficulty
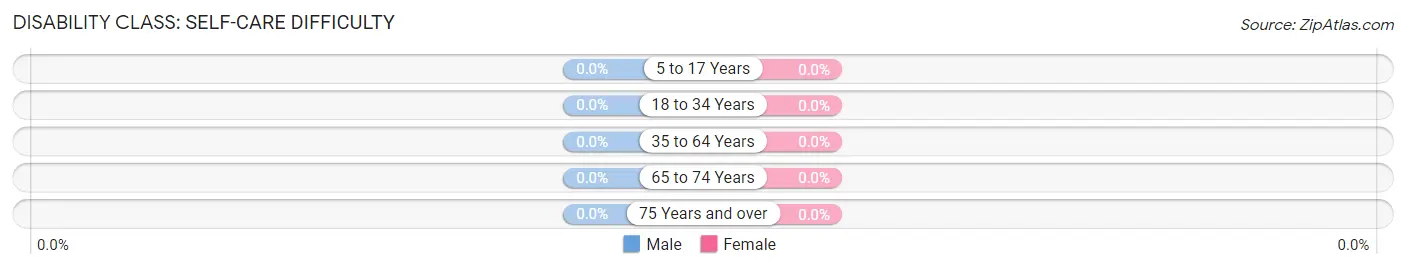
| Age Bracket | Male | Female |
| 5 to 17 Years | 0 (0.0%) | 0 (0.0%) |
| 18 to 34 Years | 0 (0.0%) | 0 (0.0%) |
| 35 to 64 Years | 0 (0.0%) | 0 (0.0%) |
| 65 to 74 Years | 0 (0.0%) | 0 (0.0%) |
| 75 Years and over | 0 (0.0%) | 0 (0.0%) |
Technology Access in Eldorado Springs
Computing Device Access in Eldorado Springs
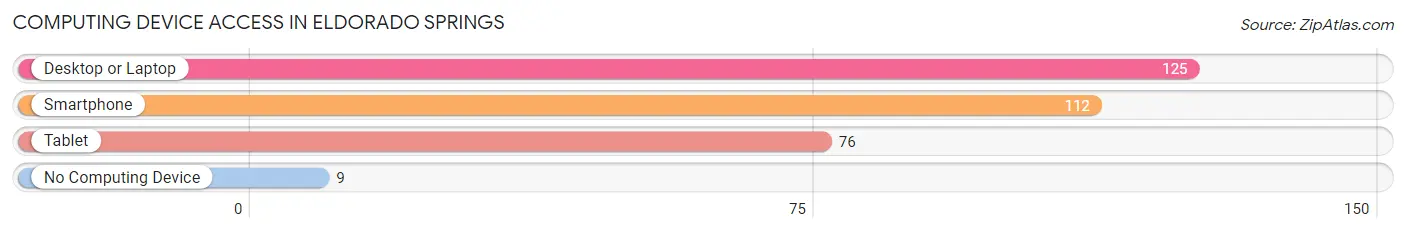
| Device Type | # Households | % Households |
| Desktop or Laptop | 125 | 89.9% |
| Smartphone | 112 | 80.6% |
| Tablet | 76 | 54.7% |
| No Computing Device | 9 | 6.5% |
| Total | 139 | 100.0% |
Internet Access in Eldorado Springs
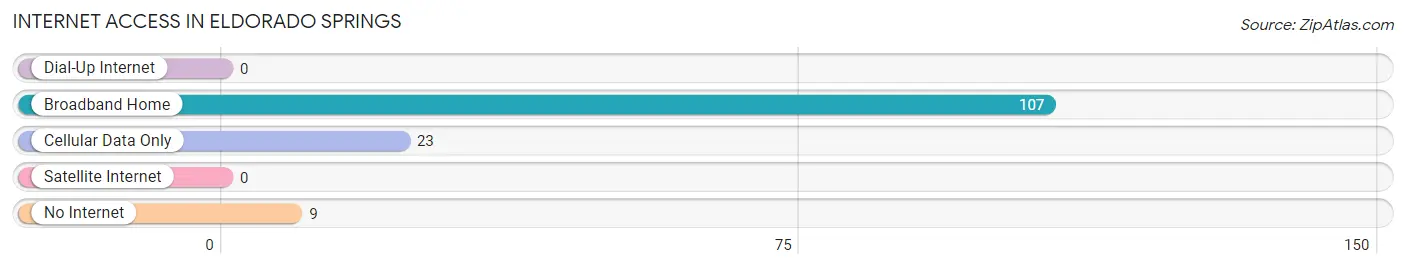
| Internet Type | # Households | % Households |
| Dial-Up Internet | 0 | 0.0% |
| Broadband Home | 107 | 77.0% |
| Cellular Data Only | 23 | 16.6% |
| Satellite Internet | 0 | 0.0% |
| No Internet | 9 | 6.5% |
| Total | 139 | 100.0% |
Eldorado Springs Summary
Eldorado Springs is a small town located in Boulder County, Colorado. It is situated in the foothills of the Rocky Mountains, just west of Boulder. The town was founded in 1859 and has a population of approximately 1,000 people.
History
Eldorado Springs was founded in 1859 by a group of prospectors who were searching for gold. The town was named after the nearby Eldorado Springs, which were believed to contain gold. The town quickly grew and by the late 1800s, it had become a popular destination for tourists. The town was home to several hotels, saloons, and other businesses.
In the early 1900s, the town began to decline as the gold rush ended and the population dwindled. However, in the 1920s, the town was revitalized when the Eldorado Springs Resort was built. The resort was a popular destination for tourists and locals alike. The resort was home to a swimming pool, tennis courts, and a golf course.
In the 1950s, the town began to decline again as the resort closed and the population dwindled. However, in the 1970s, the town was revitalized again when the Eldorado Springs State Park was established. The park is home to a variety of outdoor activities, including hiking, camping, fishing, and more.
Geography
Eldorado Springs is located in the foothills of the Rocky Mountains, just west of Boulder. The town is situated at an elevation of 5,890 feet and is surrounded by mountains and forests. The town is located near several popular attractions, including Eldorado Canyon State Park, Eldorado Springs Resort, and the Boulder Reservoir.
Economy
Eldorado Springs is a small town with a limited economy. The town is home to several small businesses, including restaurants, shops, and a few tourist attractions. The town is also home to a few small farms and ranches.
Demographics
As of the 2010 census, the population of Eldorado Springs was 1,000 people. The town is predominantly white, with a small Hispanic population. The median household income is $50,000 and the median home value is $250,000. The town has a low unemployment rate and a high rate of homeownership.
Common Questions
What is Per Capita Income in Eldorado Springs?
Per Capita income in Eldorado Springs is $66,021.
What is the Median Family Income in Eldorado Springs?
Median Family Income in Eldorado Springs is $138,889.
What is the Median Household income in Eldorado Springs?
Median Household Income in Eldorado Springs is $100,139.
What is Inequality or Gini Index in Eldorado Springs?
Inequality or Gini Index in Eldorado Springs is 0.52.
What is the Total Population of Eldorado Springs?
Total Population of Eldorado Springs is 284.
What is the Total Male Population of Eldorado Springs?
Total Male Population of Eldorado Springs is 150.
What is the Total Female Population of Eldorado Springs?
Total Female Population of Eldorado Springs is 134.
What is the Ratio of Males per 100 Females in Eldorado Springs?
There are 111.94 Males per 100 Females in Eldorado Springs.
What is the Ratio of Females per 100 Males in Eldorado Springs?
There are 89.33 Females per 100 Males in Eldorado Springs.
What is the Median Population Age in Eldorado Springs?
Median Population Age in Eldorado Springs is 62.1 Years.
What is the Average Family Size in Eldorado Springs
Average Family Size in Eldorado Springs is 2.6 People.
What is the Average Household Size in Eldorado Springs
Average Household Size in Eldorado Springs is 1.8 People.
How Large is the Labor Force in Eldorado Springs?
There are 131 People in the Labor Forcein in Eldorado Springs.
What is the Percentage of People in the Labor Force in Eldorado Springs?
50.2% of People are in the Labor Force in Eldorado Springs.
What is the Unemployment Rate in Eldorado Springs?
Unemployment Rate in Eldorado Springs is 6.1%.