Grand View Estates, CO Map & Demographics
Grand View Estates Map
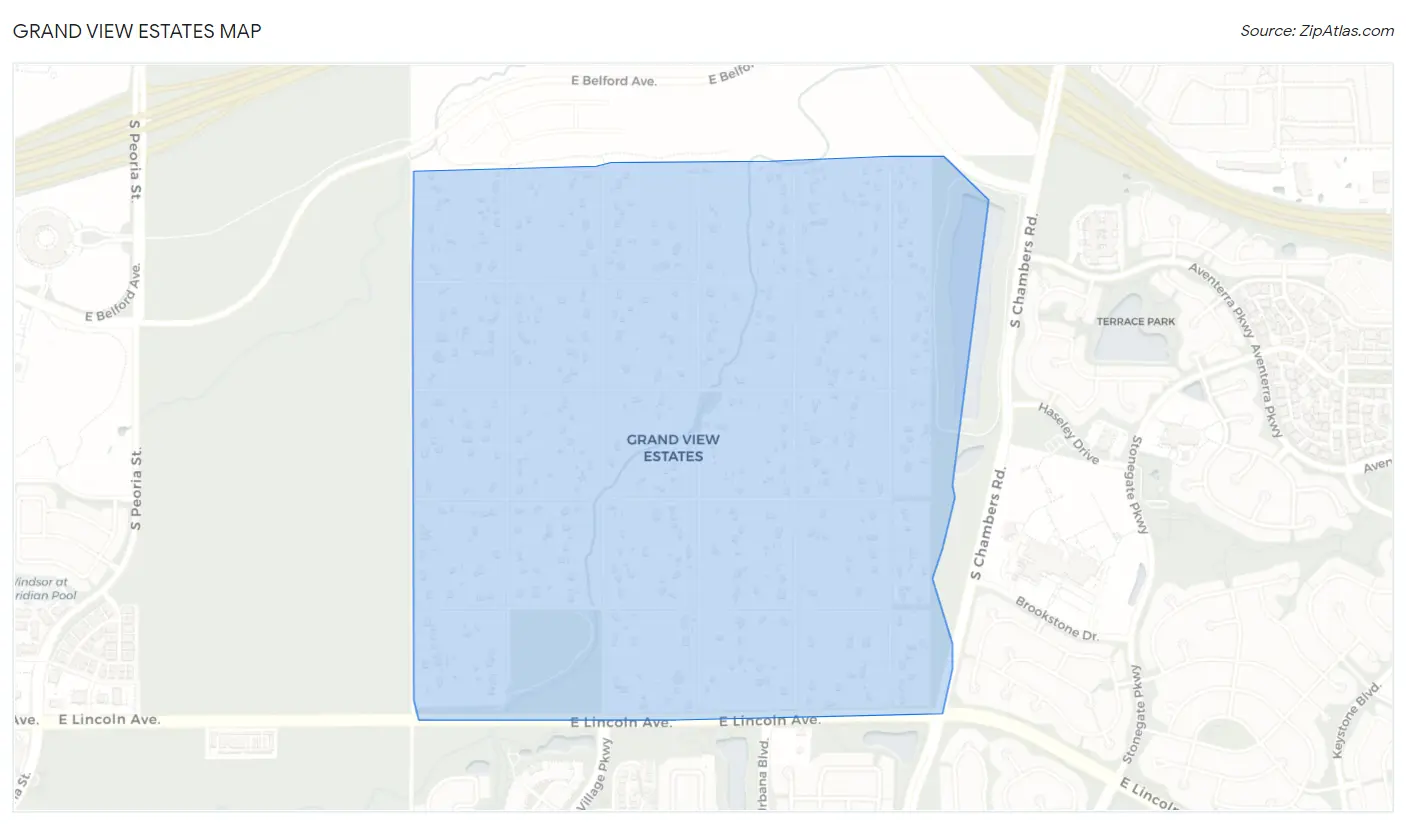
Grand View Estates Overview
$52,437
PER CAPITA INCOME
$169,167
AVG FAMILY INCOME
$144,583
AVG HOUSEHOLD INCOME
0.32
INEQUALITY / GINI INDEX
788
TOTAL POPULATION
396
MALE POPULATION
392
FEMALE POPULATION
101.02
MALES / 100 FEMALES
98.99
FEMALES / 100 MALES
47.3
MEDIAN AGE
3.1
AVG FAMILY SIZE
3.2
AVG HOUSEHOLD SIZE
473
LABOR FORCE [ PEOPLE ]
74.0%
PERCENT IN LABOR FORCE
4.4%
UNEMPLOYMENT RATE
Income in Grand View Estates
Income Overview in Grand View Estates
Per Capita Income in Grand View Estates is $52,437, while median incomes of families and households are $169,167 and $144,583 respectively.
| Characteristic | Number | Measure |
| Per Capita Income | 788 | $52,437 |
| Median Family Income | 226 | $169,167 |
| Mean Family Income | 226 | $168,411 |
| Median Household Income | 241 | $144,583 |
| Mean Household Income | 241 | $169,002 |
| Income Deficit | 226 | $0 |
| Wage / Income Gap (%) | 788 | 0.00% |
| Wage / Income Gap ($) | 788 | 100.00¢ per $1 |
| Gini / Inequality Index | 788 | 0.32 |
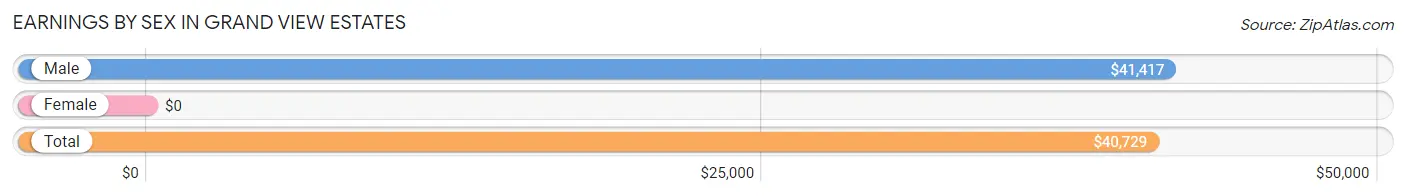
Earnings by Sex in Grand View Estates
| Sex | Number | Average Earnings |
| Male | 295 (54.8%) | $41,417 |
| Female | 243 (45.2%) | $0 |
| Total | 538 (100.0%) | $40,729 |
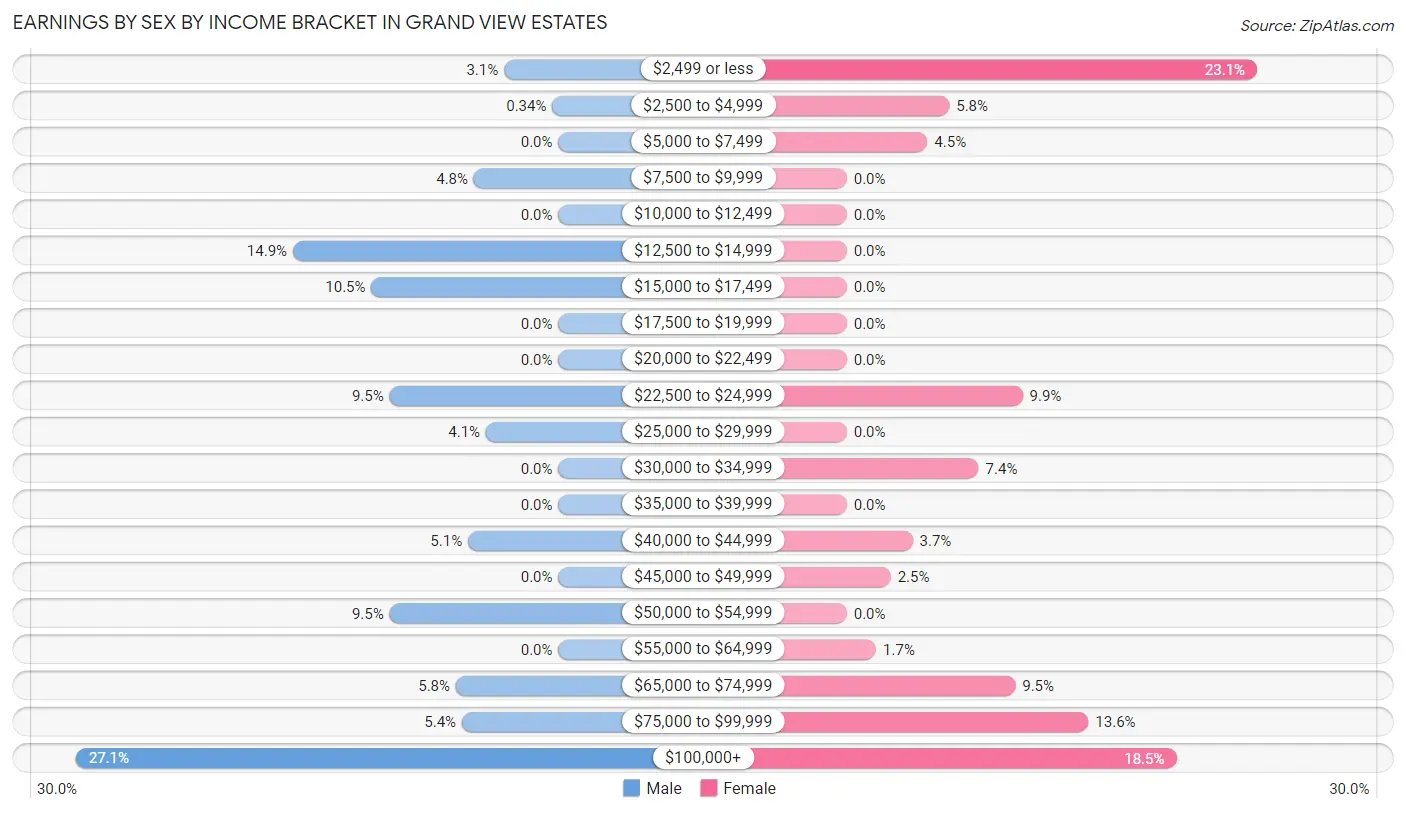
Earnings by Sex by Income Bracket in Grand View Estates
The most common earnings brackets in Grand View Estates are $100,000+ for men (80 | 27.1%) and $2,499 or less for women (56 | 23.1%).
| Income | Male | Female |
| $2,499 or less | 9 (3.0%) | 56 (23.1%) |
| $2,500 to $4,999 | 1 (0.3%) | 14 (5.8%) |
| $5,000 to $7,499 | 0 (0.0%) | 11 (4.5%) |
| $7,500 to $9,999 | 14 (4.8%) | 0 (0.0%) |
| $10,000 to $12,499 | 0 (0.0%) | 0 (0.0%) |
| $12,500 to $14,999 | 44 (14.9%) | 0 (0.0%) |
| $15,000 to $17,499 | 31 (10.5%) | 0 (0.0%) |
| $17,500 to $19,999 | 0 (0.0%) | 0 (0.0%) |
| $20,000 to $22,499 | 0 (0.0%) | 0 (0.0%) |
| $22,500 to $24,999 | 28 (9.5%) | 24 (9.9%) |
| $25,000 to $29,999 | 12 (4.1%) | 0 (0.0%) |
| $30,000 to $34,999 | 0 (0.0%) | 18 (7.4%) |
| $35,000 to $39,999 | 0 (0.0%) | 0 (0.0%) |
| $40,000 to $44,999 | 15 (5.1%) | 9 (3.7%) |
| $45,000 to $49,999 | 0 (0.0%) | 6 (2.5%) |
| $50,000 to $54,999 | 28 (9.5%) | 0 (0.0%) |
| $55,000 to $64,999 | 0 (0.0%) | 4 (1.7%) |
| $65,000 to $74,999 | 17 (5.8%) | 23 (9.5%) |
| $75,000 to $99,999 | 16 (5.4%) | 33 (13.6%) |
| $100,000+ | 80 (27.1%) | 45 (18.5%) |
| Total | 295 (100.0%) | 243 (100.0%) |
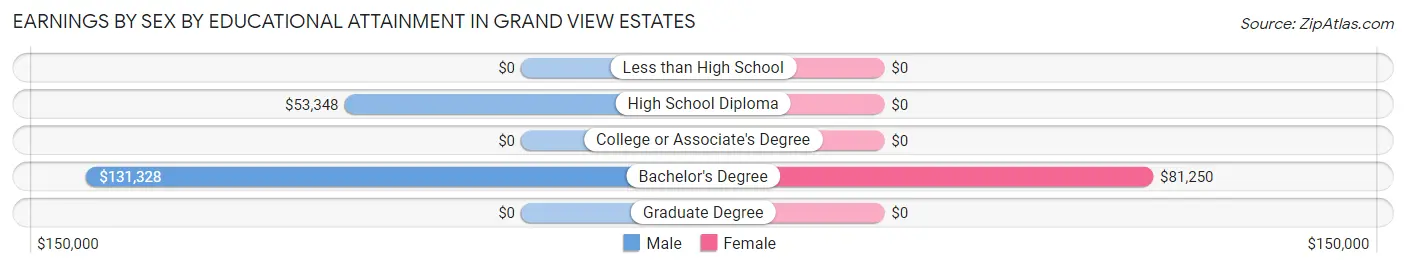
Earnings by Sex by Educational Attainment in Grand View Estates
Average earnings in Grand View Estates are $54,063 for men and $63,438 for women, a difference of 14.8%. Men with an educational attainment of bachelor's degree enjoy the highest average annual earnings of $131,328, while those with high school diploma education earn the least with $53,348. Women with an educational attainment of bachelor's degree earn the most with the average annual earnings of $81,250, while those with bachelor's degree education have the smallest earnings of $81,250.
| Educational Attainment | Male Income | Female Income |
| Less than High School | - | - |
| High School Diploma | $53,348 | $0 |
| College or Associate's Degree | - | - |
| Bachelor's Degree | $131,328 | $81,250 |
| Graduate Degree | - | - |
| Total | $54,063 | $63,438 |
Family Income in Grand View Estates
Family Income Brackets in Grand View Estates
According to the Grand View Estates family income data, there are 100 families falling into the $200,000+ income range, which is the most common income bracket and makes up 44.3% of all families.
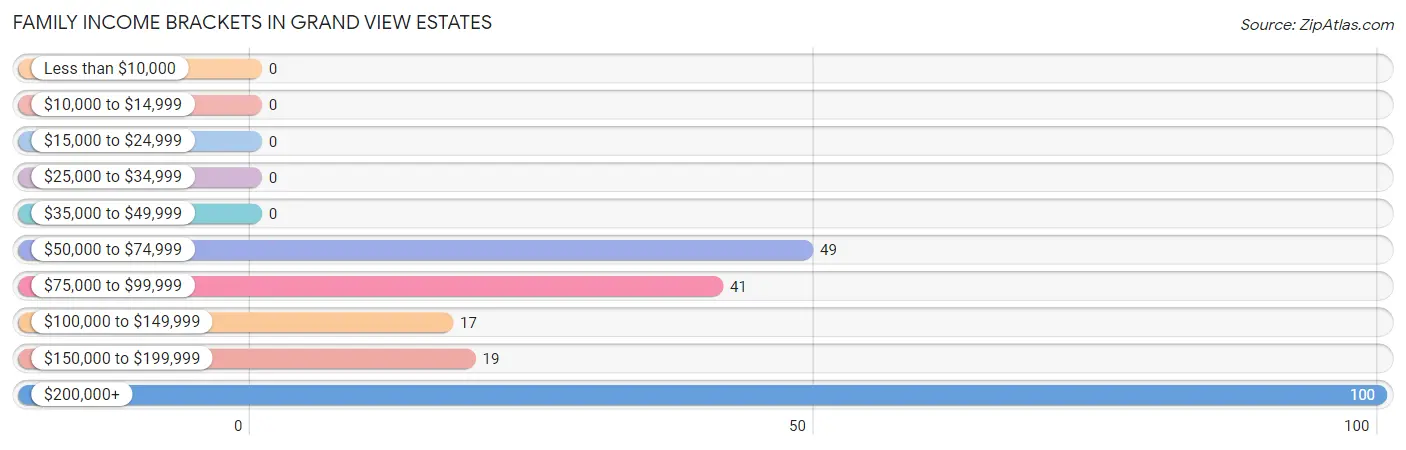
| Income Bracket | # Families | % Families |
| Less than $10,000 | 0 | 0.0% |
| $10,000 to $14,999 | 0 | 0.0% |
| $15,000 to $24,999 | 0 | 0.0% |
| $25,000 to $34,999 | 0 | 0.0% |
| $35,000 to $49,999 | 0 | 0.0% |
| $50,000 to $74,999 | 49 | 21.7% |
| $75,000 to $99,999 | 41 | 18.1% |
| $100,000 to $149,999 | 17 | 7.5% |
| $150,000 to $199,999 | 19 | 8.4% |
| $200,000+ | 100 | 44.2% |
Family Income by Famaliy Size in Grand View Estates
4-person families (34 | 15.0%) account for the highest median family income in Grand View Estates with $225,682 per family, while 3-person families (49 | 21.7%) have the highest median income of $71,641 per family member.
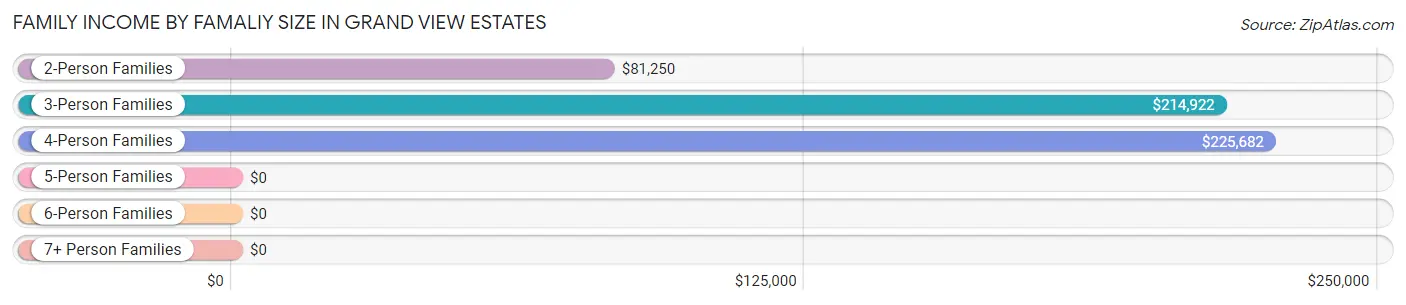
| Income Bracket | # Families | Median Income |
| 2-Person Families | 113 (50.0%) | $81,250 |
| 3-Person Families | 49 (21.7%) | $214,922 |
| 4-Person Families | 34 (15.0%) | $225,682 |
| 5-Person Families | 20 (8.8%) | $0 |
| 6-Person Families | 0 (0.0%) | $0 |
| 7+ Person Families | 10 (4.4%) | $0 |
| Total | 226 (100.0%) | $169,167 |
Family Income by Number of Earners in Grand View Estates
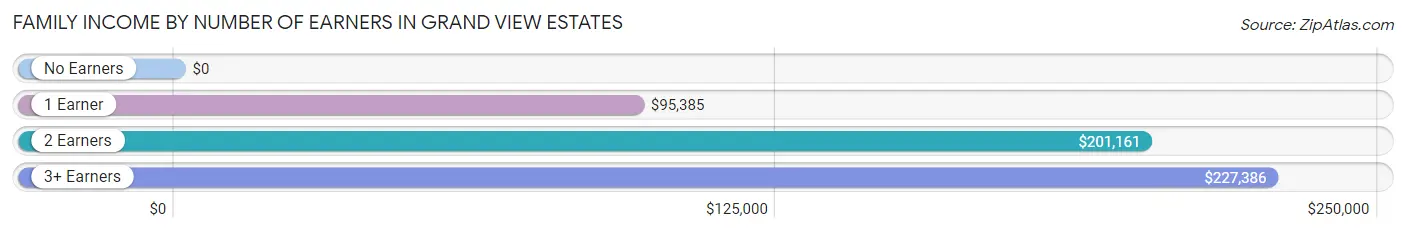
| Number of Earners | # Families | Median Income |
| No Earners | 0 (0.0%) | $0 |
| 1 Earner | 60 (26.6%) | $95,385 |
| 2 Earners | 125 (55.3%) | $201,161 |
| 3+ Earners | 41 (18.1%) | $227,386 |
| Total | 226 (100.0%) | $169,167 |
Household Income in Grand View Estates
Household Income Brackets in Grand View Estates
With 100 households falling in the category, the $200,000+ income range is the most frequent in Grand View Estates, accounting for 41.5% of all households.
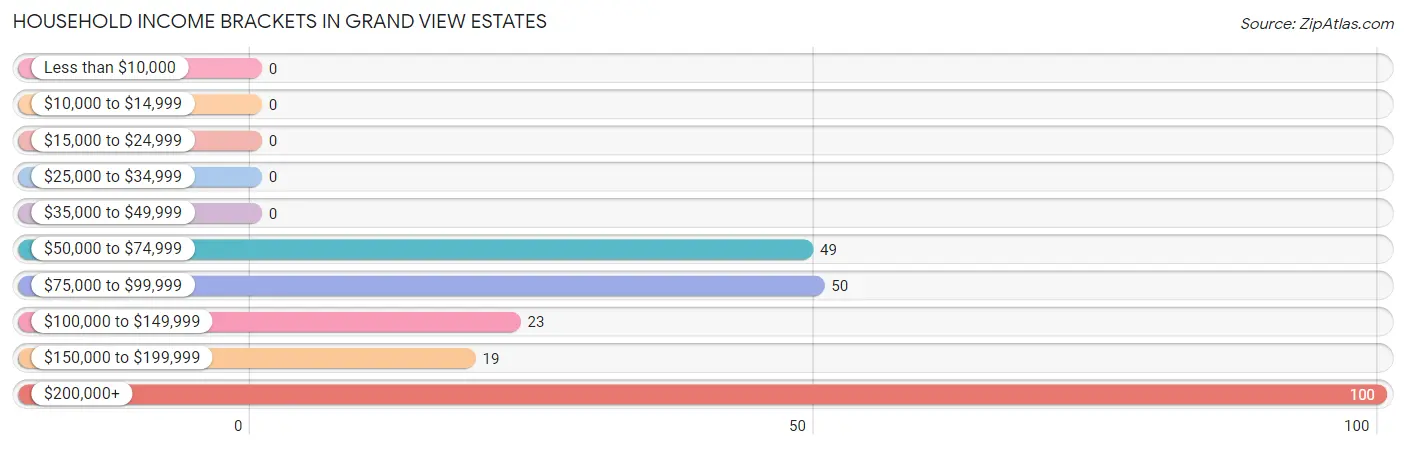
| Income Bracket | # Households | % Households |
| Less than $10,000 | 0 | 0.0% |
| $10,000 to $14,999 | 0 | 0.0% |
| $15,000 to $24,999 | 0 | 0.0% |
| $25,000 to $34,999 | 0 | 0.0% |
| $35,000 to $49,999 | 0 | 0.0% |
| $50,000 to $74,999 | 49 | 20.3% |
| $75,000 to $99,999 | 50 | 20.7% |
| $100,000 to $149,999 | 23 | 9.5% |
| $150,000 to $199,999 | 19 | 7.9% |
| $200,000+ | 100 | 41.5% |
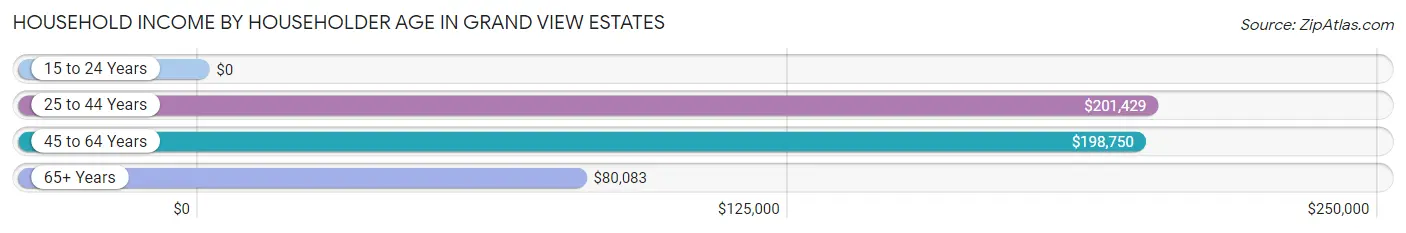
Household Income by Householder Age in Grand View Estates
The median household income in Grand View Estates is $144,583, with the highest median household income of $201,429 found in the 25 to 44 years age bracket for the primary householder. A total of 60 households (24.9%) fall into this category.
| Income Bracket | # Households | Median Income |
| 15 to 24 Years | 0 (0.0%) | $0 |
| 25 to 44 Years | 60 (24.9%) | $201,429 |
| 45 to 64 Years | 104 (43.1%) | $198,750 |
| 65+ Years | 77 (32.0%) | $80,083 |
| Total | 241 (100.0%) | $144,583 |
Poverty in Grand View Estates
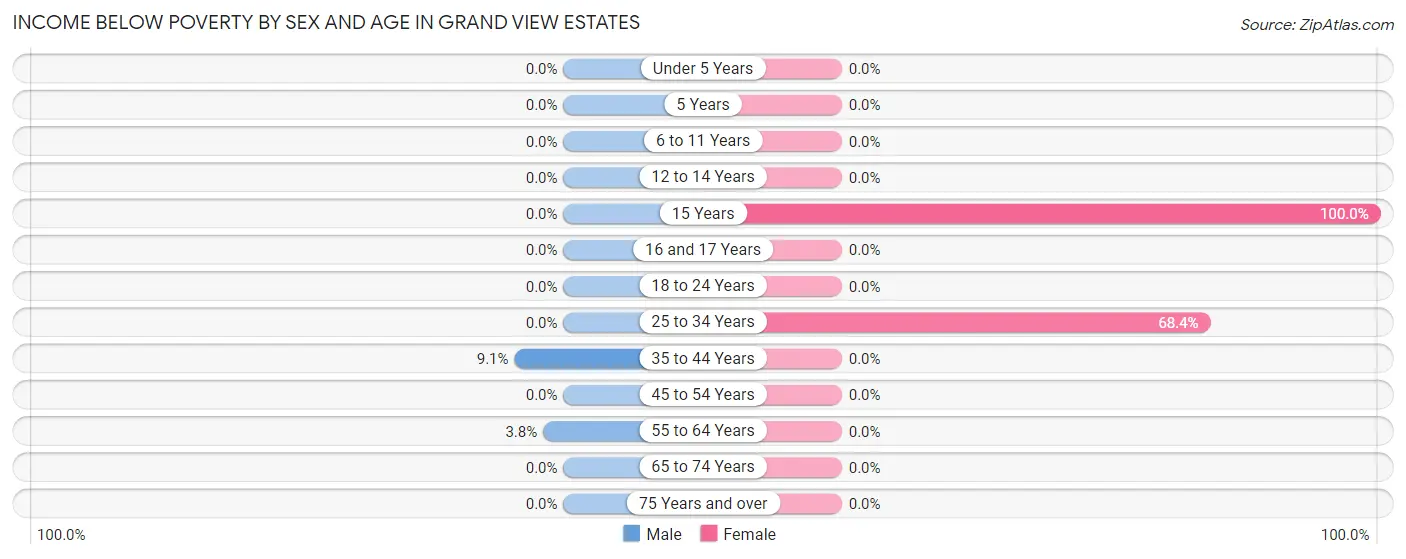
Income Below Poverty by Sex and Age in Grand View Estates
With 1.5% poverty level for males and 5.9% for females among the residents of Grand View Estates, 35 to 44 year old males and 15 year old females are the most vulnerable to poverty, with 4 males (9.1%) and 10 females (100.0%) in their respective age groups living below the poverty level.
| Age Bracket | Male | Female |
| Under 5 Years | 0 (0.0%) | 0 (0.0%) |
| 5 Years | 0 (0.0%) | 0 (0.0%) |
| 6 to 11 Years | 0 (0.0%) | 0 (0.0%) |
| 12 to 14 Years | 0 (0.0%) | 0 (0.0%) |
| 15 Years | 0 (0.0%) | 10 (100.0%) |
| 16 and 17 Years | 0 (0.0%) | 0 (0.0%) |
| 18 to 24 Years | 0 (0.0%) | 0 (0.0%) |
| 25 to 34 Years | 0 (0.0%) | 13 (68.4%) |
| 35 to 44 Years | 4 (9.1%) | 0 (0.0%) |
| 45 to 54 Years | 0 (0.0%) | 0 (0.0%) |
| 55 to 64 Years | 2 (3.8%) | 0 (0.0%) |
| 65 to 74 Years | 0 (0.0%) | 0 (0.0%) |
| 75 Years and over | 0 (0.0%) | 0 (0.0%) |
| Total | 6 (1.5%) | 23 (5.9%) |
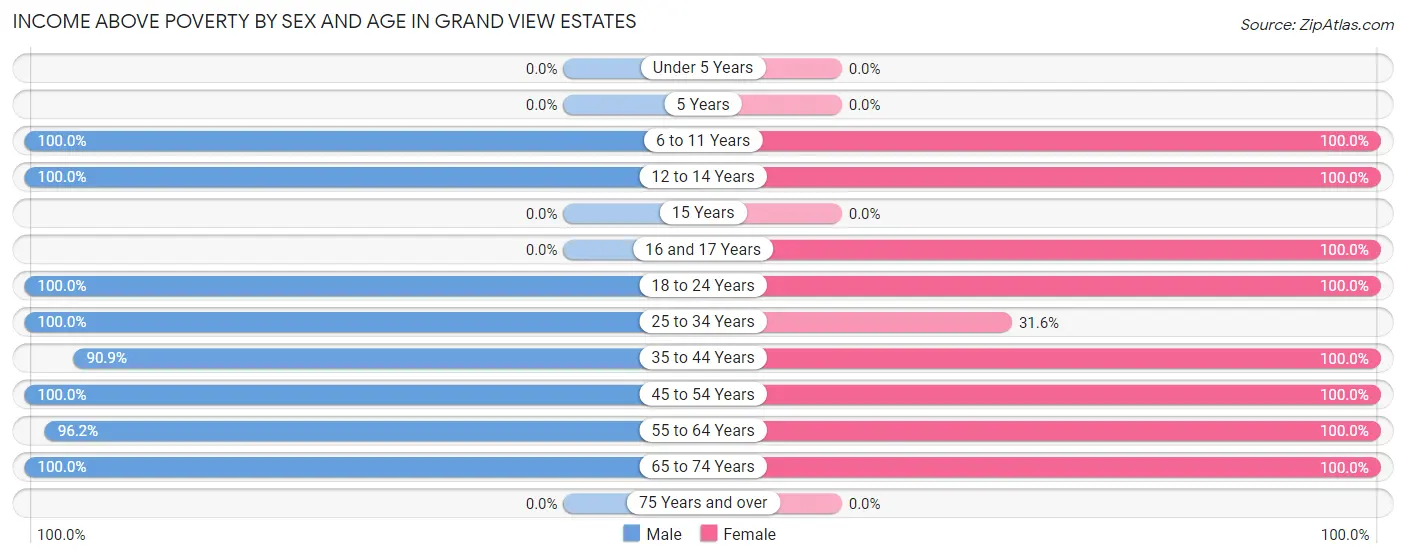
Income Above Poverty by Sex and Age in Grand View Estates
According to the poverty statistics in Grand View Estates, males aged 6 to 11 years and females aged 6 to 11 years are the age groups that are most secure financially, with 100.0% of males and 100.0% of females in these age groups living above the poverty line.
| Age Bracket | Male | Female |
| Under 5 Years | 0 (0.0%) | 0 (0.0%) |
| 5 Years | 0 (0.0%) | 0 (0.0%) |
| 6 to 11 Years | 29 (100.0%) | 46 (100.0%) |
| 12 to 14 Years | 32 (100.0%) | 32 (100.0%) |
| 15 Years | 0 (0.0%) | 0 (0.0%) |
| 16 and 17 Years | 0 (0.0%) | 29 (100.0%) |
| 18 to 24 Years | 48 (100.0%) | 37 (100.0%) |
| 25 to 34 Years | 28 (100.0%) | 6 (31.6%) |
| 35 to 44 Years | 40 (90.9%) | 14 (100.0%) |
| 45 to 54 Years | 73 (100.0%) | 96 (100.0%) |
| 55 to 64 Years | 51 (96.2%) | 33 (100.0%) |
| 65 to 74 Years | 89 (100.0%) | 76 (100.0%) |
| 75 Years and over | 0 (0.0%) | 0 (0.0%) |
| Total | 390 (98.5%) | 369 (94.1%) |
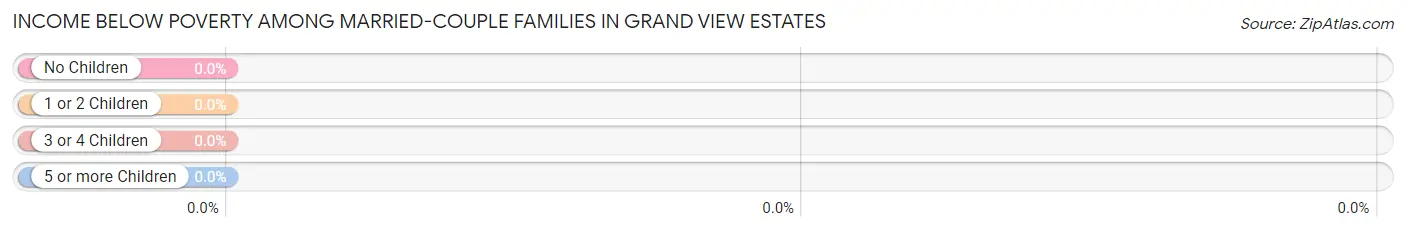
Income Below Poverty Among Married-Couple Families in Grand View Estates
| Children | Above Poverty | Below Poverty |
| No Children | 112 (100.0%) | 0 (0.0%) |
| 1 or 2 Children | 60 (100.0%) | 0 (0.0%) |
| 3 or 4 Children | 19 (100.0%) | 0 (0.0%) |
| 5 or more Children | 0 (0.0%) | 0 (0.0%) |
| Total | 191 (100.0%) | 0 (0.0%) |
Income Below Poverty Among Single-Parent Households in Grand View Estates
| Children | Single Father | Single Mother |
| No Children | 0 (0.0%) | 0 (0.0%) |
| 1 or 2 Children | 0 (0.0%) | 0 (0.0%) |
| 3 or 4 Children | 0 (0.0%) | 0 (0.0%) |
| 5 or more Children | 0 (0.0%) | 0 (0.0%) |
| Total | 0 (0.0%) | 0 (0.0%) |
Income Below Poverty Among Married-Couple vs Single-Parent Households in Grand View Estates
| Children | Married-Couple Families | Single-Parent Households |
| No Children | 0 (0.0%) | 0 (0.0%) |
| 1 or 2 Children | 0 (0.0%) | 0 (0.0%) |
| 3 or 4 Children | 0 (0.0%) | 0 (0.0%) |
| 5 or more Children | 0 (0.0%) | 0 (0.0%) |
| Total | 0 (0.0%) | 0 (0.0%) |
Race in Grand View Estates
The most populous races in Grand View Estates are White / Caucasian (655 | 83.1%), Hispanic or Latino (101 | 12.8%), and Two or more Races (98 | 12.4%).
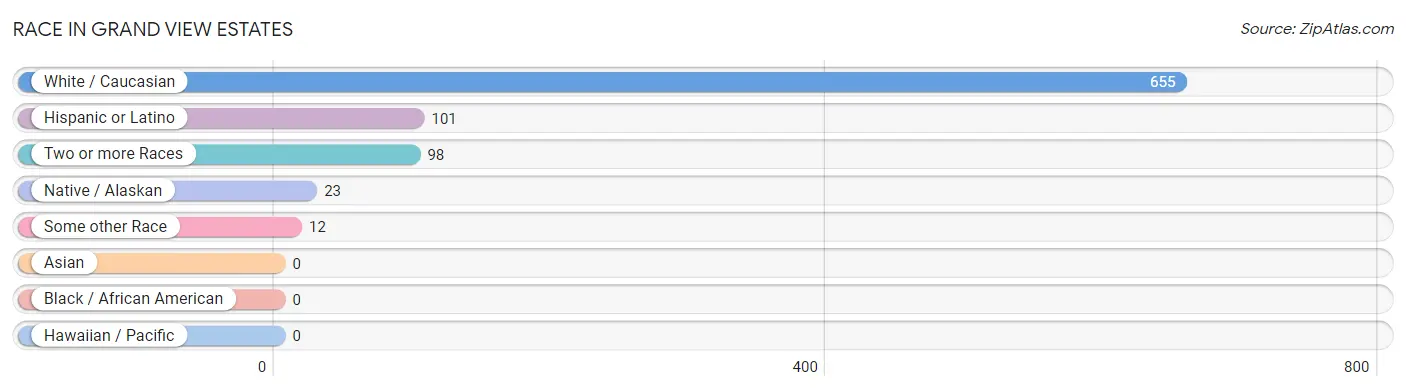
| Race | # Population | % Population |
| Asian | 0 | 0.0% |
| Black / African American | 0 | 0.0% |
| Hawaiian / Pacific | 0 | 0.0% |
| Hispanic or Latino | 101 | 12.8% |
| Native / Alaskan | 23 | 2.9% |
| White / Caucasian | 655 | 83.1% |
| Two or more Races | 98 | 12.4% |
| Some other Race | 12 | 1.5% |
| Total | 788 | 100.0% |
Ancestry in Grand View Estates
The most populous ancestries reported in Grand View Estates are English (217 | 27.5%), Irish (161 | 20.4%), German (125 | 15.9%), American (106 | 13.5%), and French (65 | 8.3%), together accounting for 85.5% of all Grand View Estates residents.
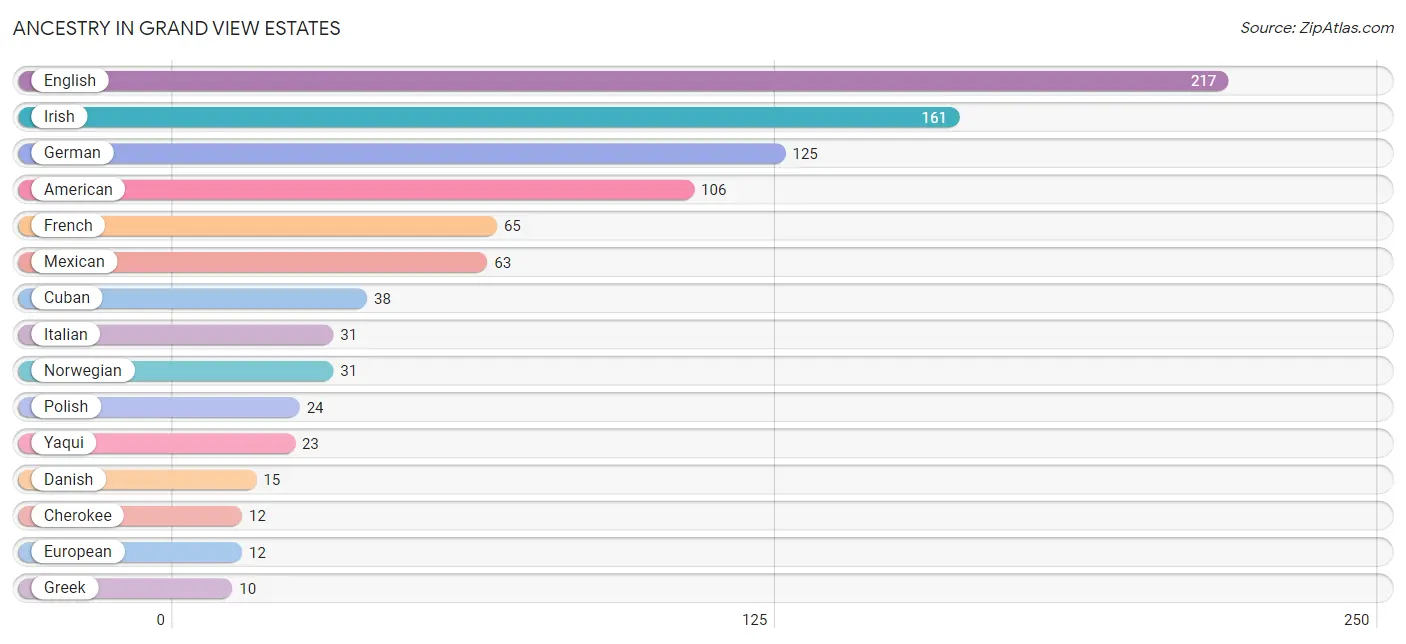
| Ancestry | # Population | % Population |
| American | 106 | 13.5% |
| British | 8 | 1.0% |
| Cherokee | 12 | 1.5% |
| Cuban | 38 | 4.8% |
| Danish | 15 | 1.9% |
| English | 217 | 27.5% |
| European | 12 | 1.5% |
| French | 65 | 8.3% |
| German | 125 | 15.9% |
| Greek | 10 | 1.3% |
| Irish | 161 | 20.4% |
| Italian | 31 | 3.9% |
| Mexican | 63 | 8.0% |
| Mexican American Indian | 1 | 0.1% |
| Norwegian | 31 | 3.9% |
| Polish | 24 | 3.0% |
| Russian | 9 | 1.1% |
| Scottish | 9 | 1.1% |
| Yaqui | 23 | 2.9% | View All 19 Rows |
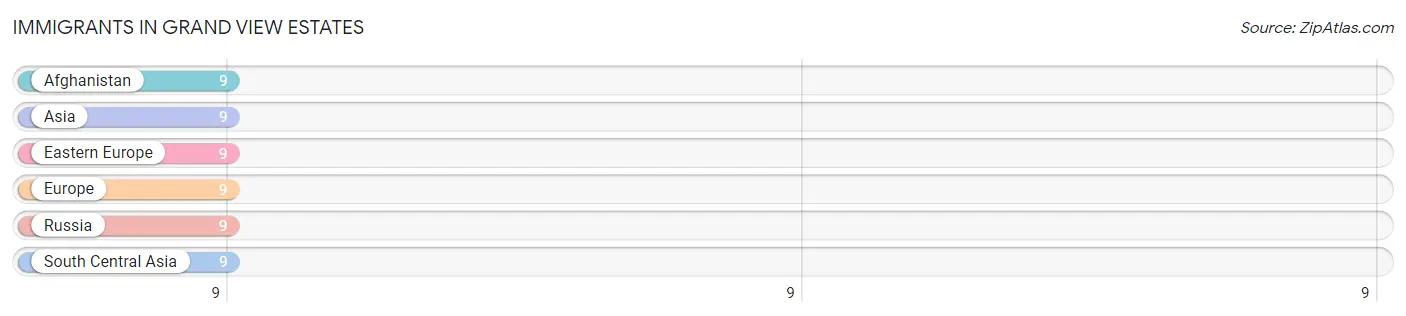
Immigrants in Grand View Estates
The most numerous immigrant groups reported in Grand View Estates came from Afghanistan (9 | 1.1%), Asia (9 | 1.1%), Eastern Europe (9 | 1.1%), Europe (9 | 1.1%), and Russia (9 | 1.1%), together accounting for 5.7% of all Grand View Estates residents.
| Immigration Origin | # Population | % Population |
| Afghanistan | 9 | 1.1% |
| Asia | 9 | 1.1% |
| Eastern Europe | 9 | 1.1% |
| Europe | 9 | 1.1% |
| Russia | 9 | 1.1% |
| South Central Asia | 9 | 1.1% | View All 6 Rows |
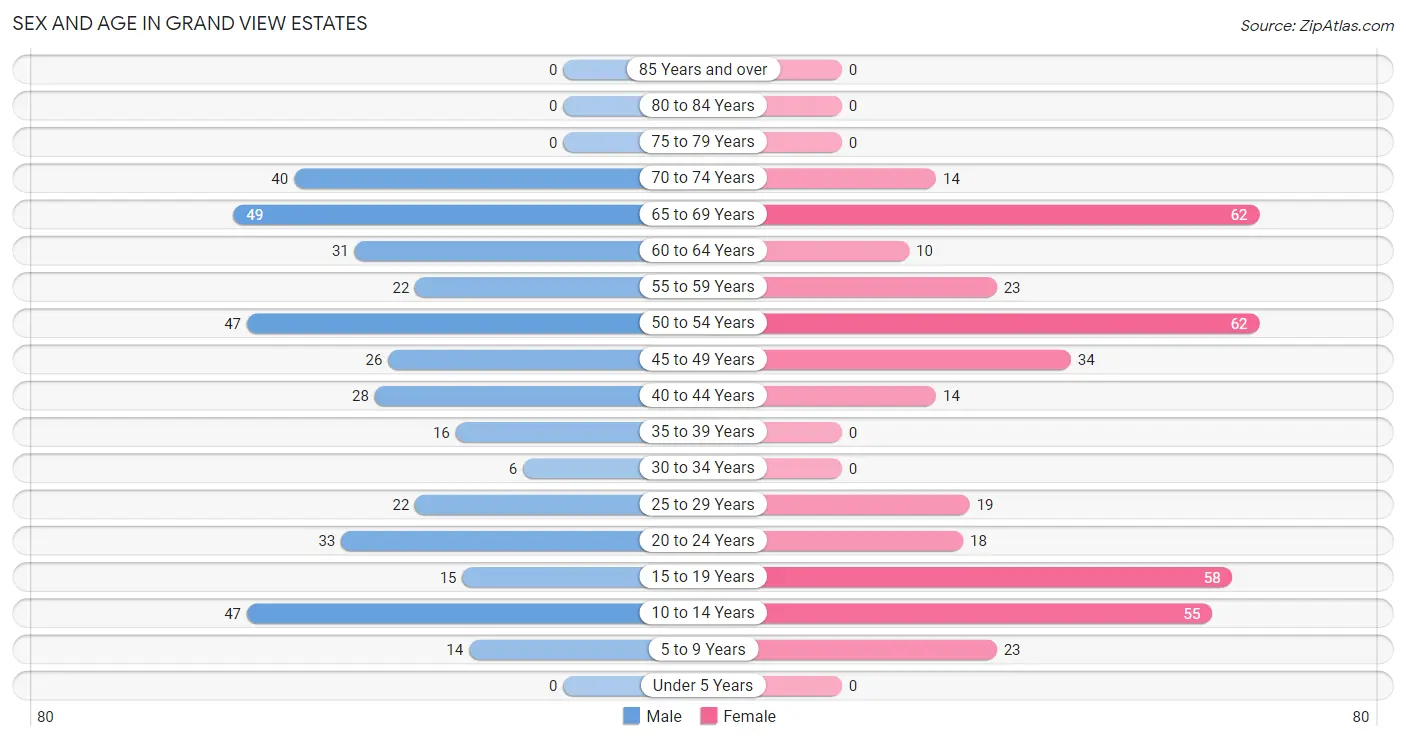
Sex and Age in Grand View Estates
Sex and Age in Grand View Estates
The most populous age groups in Grand View Estates are 65 to 69 Years (49 | 12.4%) for men and 50 to 54 Years (62 | 15.8%) for women.
| Age Bracket | Male | Female |
| Under 5 Years | 0 (0.0%) | 0 (0.0%) |
| 5 to 9 Years | 14 (3.5%) | 23 (5.9%) |
| 10 to 14 Years | 47 (11.9%) | 55 (14.0%) |
| 15 to 19 Years | 15 (3.8%) | 58 (14.8%) |
| 20 to 24 Years | 33 (8.3%) | 18 (4.6%) |
| 25 to 29 Years | 22 (5.6%) | 19 (4.9%) |
| 30 to 34 Years | 6 (1.5%) | 0 (0.0%) |
| 35 to 39 Years | 16 (4.0%) | 0 (0.0%) |
| 40 to 44 Years | 28 (7.1%) | 14 (3.6%) |
| 45 to 49 Years | 26 (6.6%) | 34 (8.7%) |
| 50 to 54 Years | 47 (11.9%) | 62 (15.8%) |
| 55 to 59 Years | 22 (5.6%) | 23 (5.9%) |
| 60 to 64 Years | 31 (7.8%) | 10 (2.5%) |
| 65 to 69 Years | 49 (12.4%) | 62 (15.8%) |
| 70 to 74 Years | 40 (10.1%) | 14 (3.6%) |
| 75 to 79 Years | 0 (0.0%) | 0 (0.0%) |
| 80 to 84 Years | 0 (0.0%) | 0 (0.0%) |
| 85 Years and over | 0 (0.0%) | 0 (0.0%) |
| Total | 396 (100.0%) | 392 (100.0%) |
Families and Households in Grand View Estates
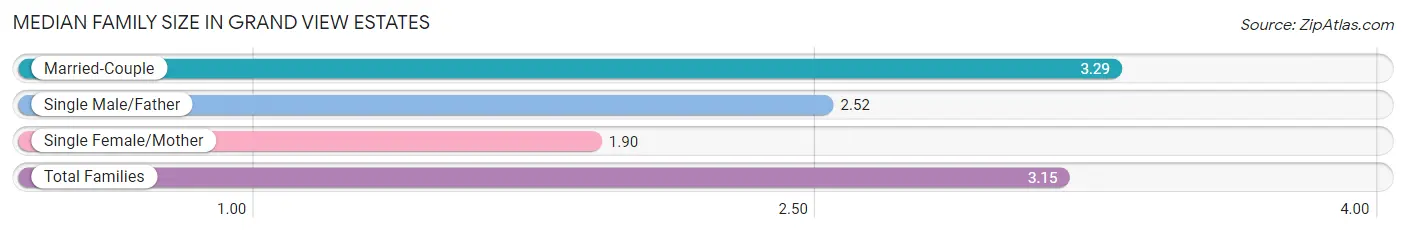
Median Family Size in Grand View Estates
The median family size in Grand View Estates is 3.15 persons per family, with married-couple families (191 | 84.5%) accounting for the largest median family size of 3.29 persons per family. On the other hand, single female/mother families (10 | 4.4%) represent the smallest median family size with 1.90 persons per family.
| Family Type | # Families | Family Size |
| Married-Couple | 191 (84.5%) | 3.29 |
| Single Male/Father | 25 (11.1%) | 2.52 |
| Single Female/Mother | 10 (4.4%) | 1.90 |
| Total Families | 226 (100.0%) | 3.15 |
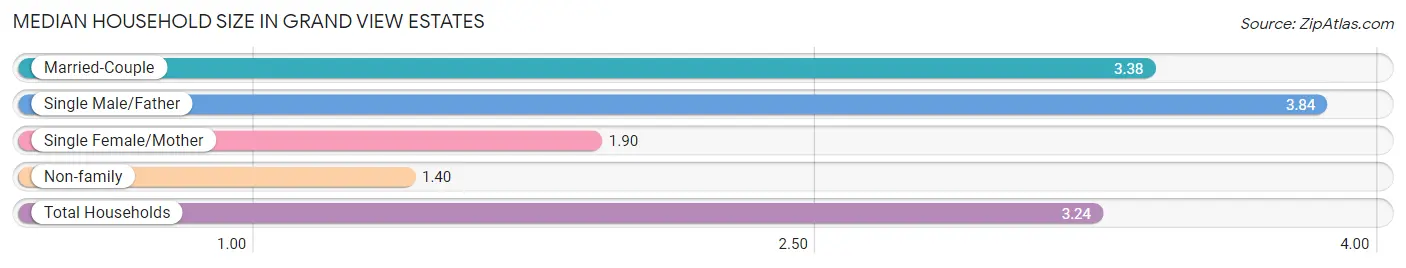
Median Household Size in Grand View Estates
The median household size in Grand View Estates is 3.24 persons per household, with single male/father households (25 | 10.4%) accounting for the largest median household size of 3.84 persons per household. non-family households (15 | 6.2%) represent the smallest median household size with 1.40 persons per household.
| Household Type | # Households | Household Size |
| Married-Couple | 191 (79.2%) | 3.38 |
| Single Male/Father | 25 (10.4%) | 3.84 |
| Single Female/Mother | 10 (4.2%) | 1.90 |
| Non-family | 15 (6.2%) | 1.40 |
| Total Households | 241 (100.0%) | 3.24 |
Household Size by Marriage Status in Grand View Estates
Out of a total of 241 households in Grand View Estates, 226 (93.8%) are family households, while 15 (6.2%) are nonfamily households. The most numerous type of family households are 2-person households, comprising 98, and the most common type of nonfamily households are 1-person households, comprising 9.
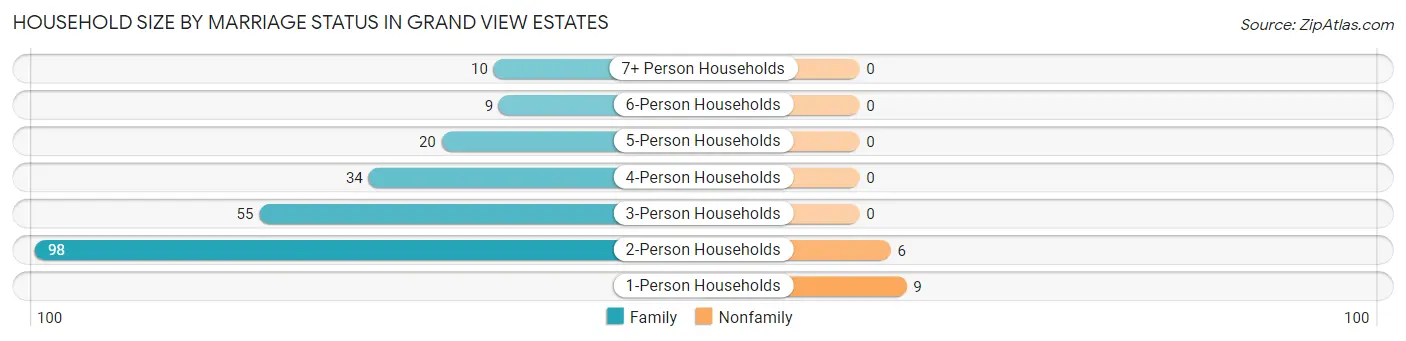
| Household Size | Family Households | Nonfamily Households |
| 1-Person Households | - | 9 (3.7%) |
| 2-Person Households | 98 (40.7%) | 6 (2.5%) |
| 3-Person Households | 55 (22.8%) | 0 (0.0%) |
| 4-Person Households | 34 (14.1%) | 0 (0.0%) |
| 5-Person Households | 20 (8.3%) | 0 (0.0%) |
| 6-Person Households | 9 (3.7%) | 0 (0.0%) |
| 7+ Person Households | 10 (4.2%) | 0 (0.0%) |
| Total | 226 (93.8%) | 15 (6.2%) |
Female Fertility in Grand View Estates
Fertility by Age in Grand View Estates
Average fertility rate in Grand View Estates is 6.0 births per 1,000 women. Women in the age bracket of 20 to 34 years have the highest fertility rate with 27.0 births per 1,000 women. Women in the age bracket of 20 to 34 years acount for 100.0% of all women with births.
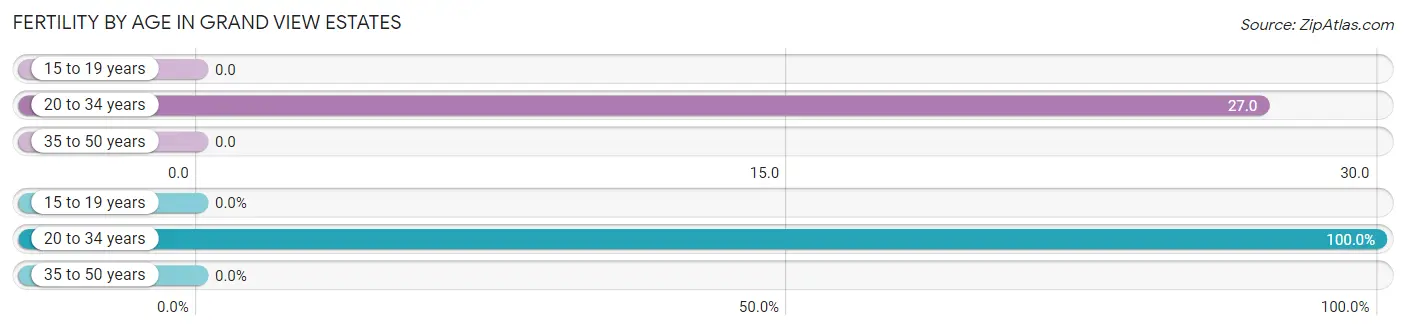
| Age Bracket | Women with Births | Births / 1,000 Women |
| 15 to 19 years | 0 (0.0%) | 0.0 |
| 20 to 34 years | 1 (100.0%) | 27.0 |
| 35 to 50 years | 0 (0.0%) | 0.0 |
| Total | 1 (100.0%) | 6.0 |
Fertility by Age by Marriage Status in Grand View Estates
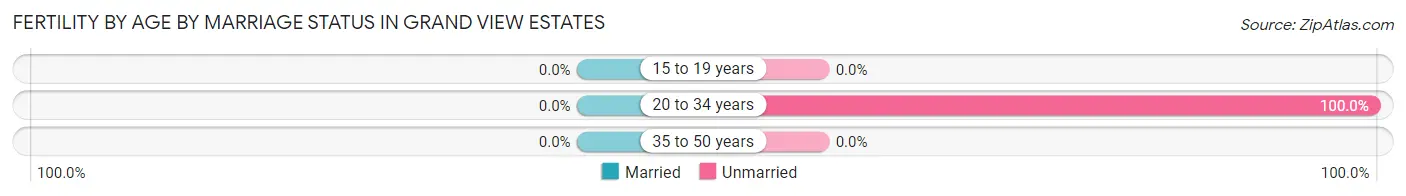
| Age Bracket | Married | Unmarried |
| 15 to 19 years | 0 (0.0%) | 0 (0.0%) |
| 20 to 34 years | 0 (0.0%) | 1 (100.0%) |
| 35 to 50 years | 0 (0.0%) | 0 (0.0%) |
| Total | 0 (0.0%) | 1 (100.0%) |
Fertility by Education in Grand View Estates
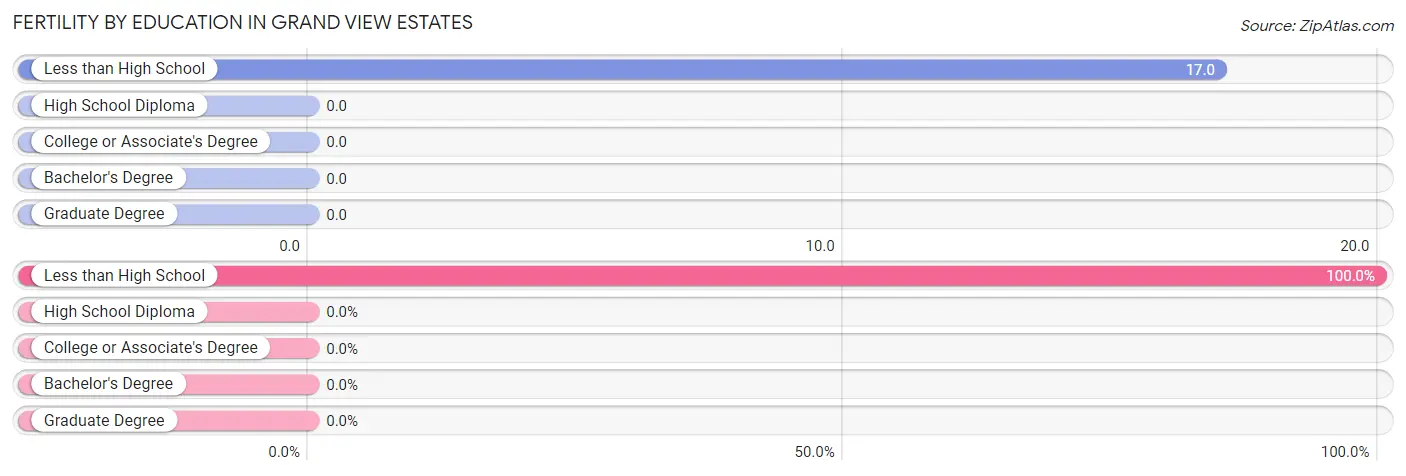
| Educational Attainment | Women with Births | Births / 1,000 Women |
| Less than High School | 1 (100.0%) | 17.0 |
| High School Diploma | 0 (0.0%) | 0.0 |
| College or Associate's Degree | 0 (0.0%) | 0.0 |
| Bachelor's Degree | 0 (0.0%) | 0.0 |
| Graduate Degree | 0 (0.0%) | 0.0 |
| Total | 1 (100.0%) | 6.0 |
Fertility by Education by Marriage Status in Grand View Estates
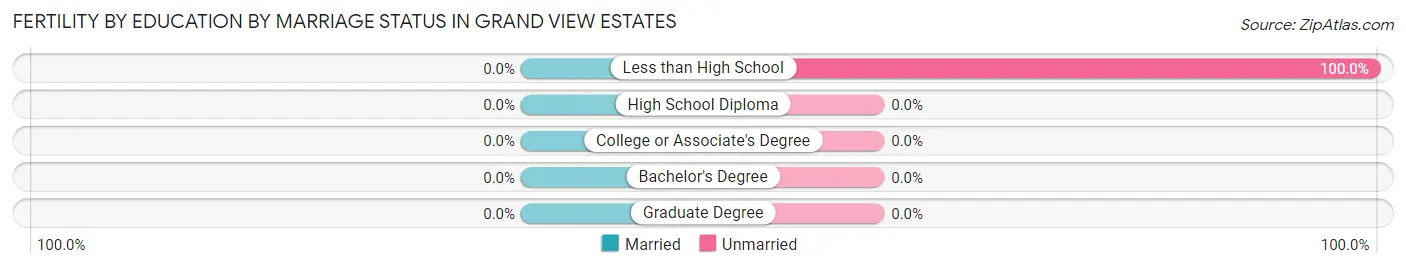
| Educational Attainment | Married | Unmarried |
| Less than High School | 0 (0.0%) | 1 (100.0%) |
| High School Diploma | 0 (0.0%) | 0 (0.0%) |
| College or Associate's Degree | 0 (0.0%) | 0 (0.0%) |
| Bachelor's Degree | 0 (0.0%) | 0 (0.0%) |
| Graduate Degree | 0 (0.0%) | 0 (0.0%) |
| Total | 0 (0.0%) | 1 (100.0%) |
Employment Characteristics in Grand View Estates
Employment by Class of Employer in Grand View Estates
Among the 441 employed individuals in Grand View Estates, private company employees (253 | 57.4%), not-for-profit organizations (100 | 22.7%), and self-employed (incorporated) (31 | 7.0%) make up the most common classes of employment.
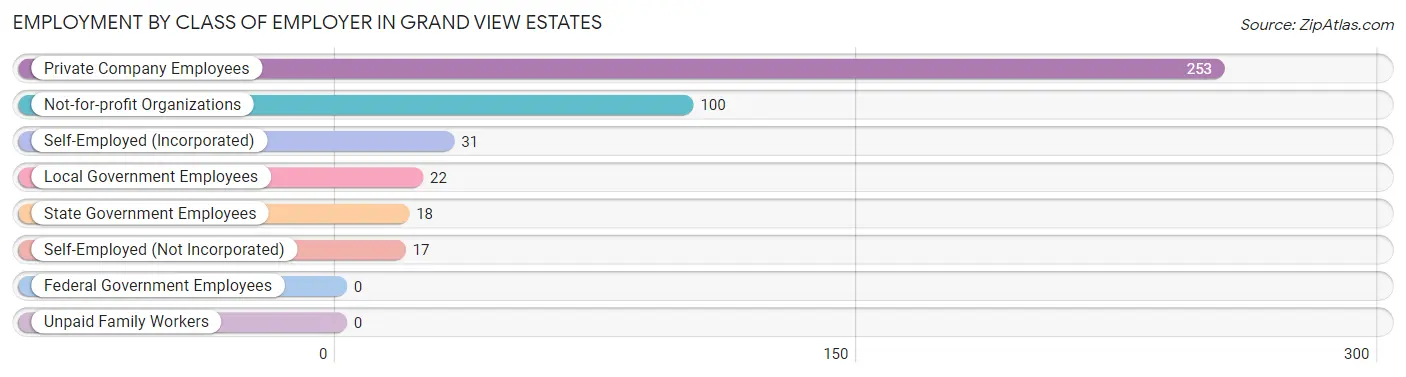
| Employer Class | # Employees | % Employees |
| Private Company Employees | 253 | 57.4% |
| Self-Employed (Incorporated) | 31 | 7.0% |
| Self-Employed (Not Incorporated) | 17 | 3.8% |
| Not-for-profit Organizations | 100 | 22.7% |
| Local Government Employees | 22 | 5.0% |
| State Government Employees | 18 | 4.1% |
| Federal Government Employees | 0 | 0.0% |
| Unpaid Family Workers | 0 | 0.0% |
| Total | 441 | 100.0% |
Employment Status by Age in Grand View Estates
According to the labor force statistics for Grand View Estates, out of the total population over 16 years of age (639), 74.0% or 473 individuals are in the labor force, with 4.4% or 21 of them unemployed. The age group with the highest labor force participation rate is 30 to 34 years, with 100.0% or 6 individuals in the labor force. Within the labor force, the 55 to 59 years age range has the highest percentage of unemployed individuals, with 23.3% or 10 of them being unemployed.
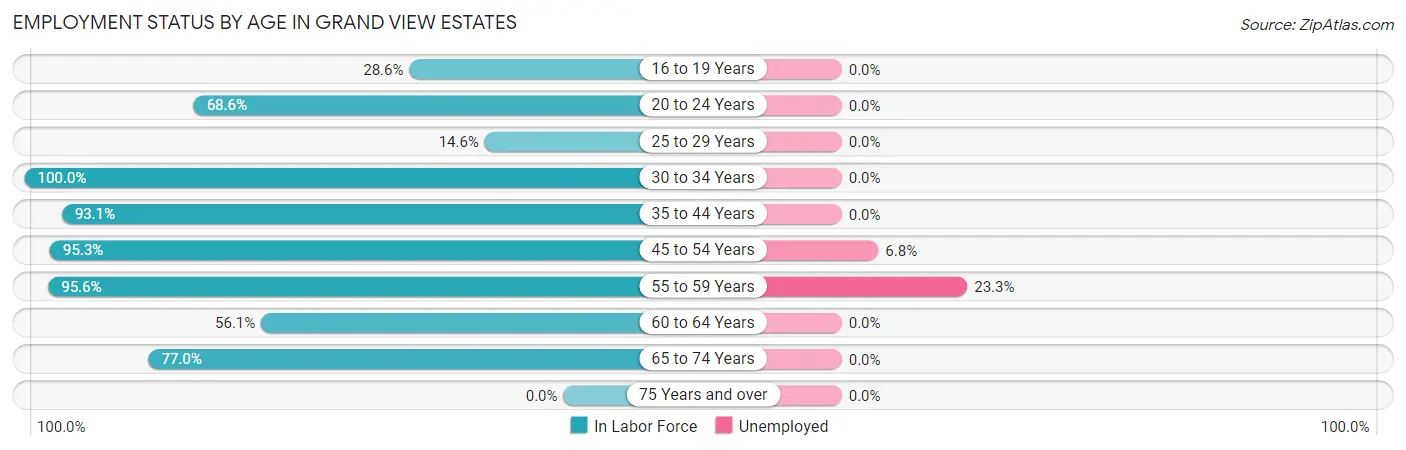
| Age Bracket | In Labor Force | Unemployed |
| 16 to 19 Years | 18 (28.6%) | 0 (0.0%) |
| 20 to 24 Years | 35 (68.6%) | 0 (0.0%) |
| 25 to 29 Years | 6 (14.6%) | 0 (0.0%) |
| 30 to 34 Years | 6 (100.0%) | 0 (0.0%) |
| 35 to 44 Years | 54 (93.1%) | 0 (0.0%) |
| 45 to 54 Years | 161 (95.3%) | 11 (6.8%) |
| 55 to 59 Years | 43 (95.6%) | 10 (23.3%) |
| 60 to 64 Years | 23 (56.1%) | 0 (0.0%) |
| 65 to 74 Years | 127 (77.0%) | 0 (0.0%) |
| 75 Years and over | 0 (0.0%) | 0 (0.0%) |
| Total | 473 (74.0%) | 21 (4.4%) |
Employment Status by Educational Attainment in Grand View Estates
According to labor force statistics for Grand View Estates, 81.4% of individuals (293) out of the total population between 25 and 64 years of age (360) are in the labor force, with 7.2% or 21 of them being unemployed. The group with the highest labor force participation rate are those with the educational attainment of bachelor's degree or higher, with 100.0% or 150 individuals in the labor force. Within the labor force, individuals with bachelor's degree or higher education have the highest percentage of unemployment, with 14.0% or 21 of them being unemployed.
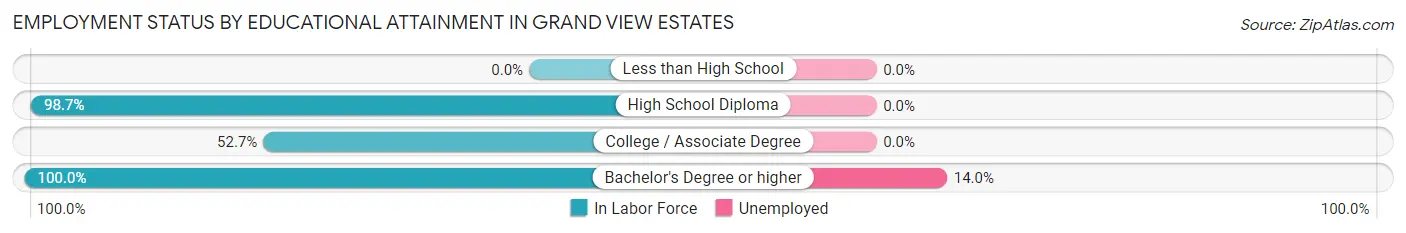
| Educational Attainment | In Labor Force | Unemployed |
| Less than High School | 0 (0.0%) | 0 (0.0%) |
| High School Diploma | 74 (98.7%) | 0 (0.0%) |
| College / Associate Degree | 69 (52.7%) | 0 (0.0%) |
| Bachelor's Degree or higher | 150 (100.0%) | 21 (14.0%) |
| Total | 293 (81.4%) | 26 (7.2%) |
Employment Occupations by Sex in Grand View Estates
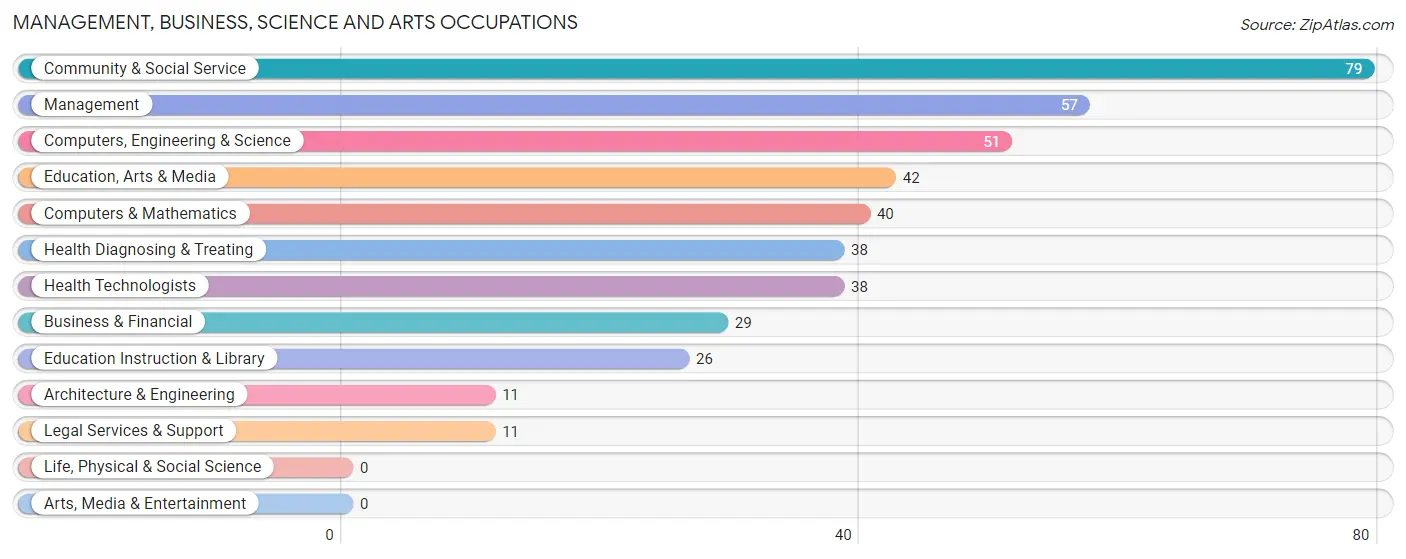
Management, Business, Science and Arts Occupations
The most common Management, Business, Science and Arts occupations in Grand View Estates are Community & Social Service (79 | 17.5%), Management (57 | 12.6%), Computers, Engineering & Science (51 | 11.3%), Education, Arts & Media (42 | 9.3%), and Computers & Mathematics (40 | 8.8%).
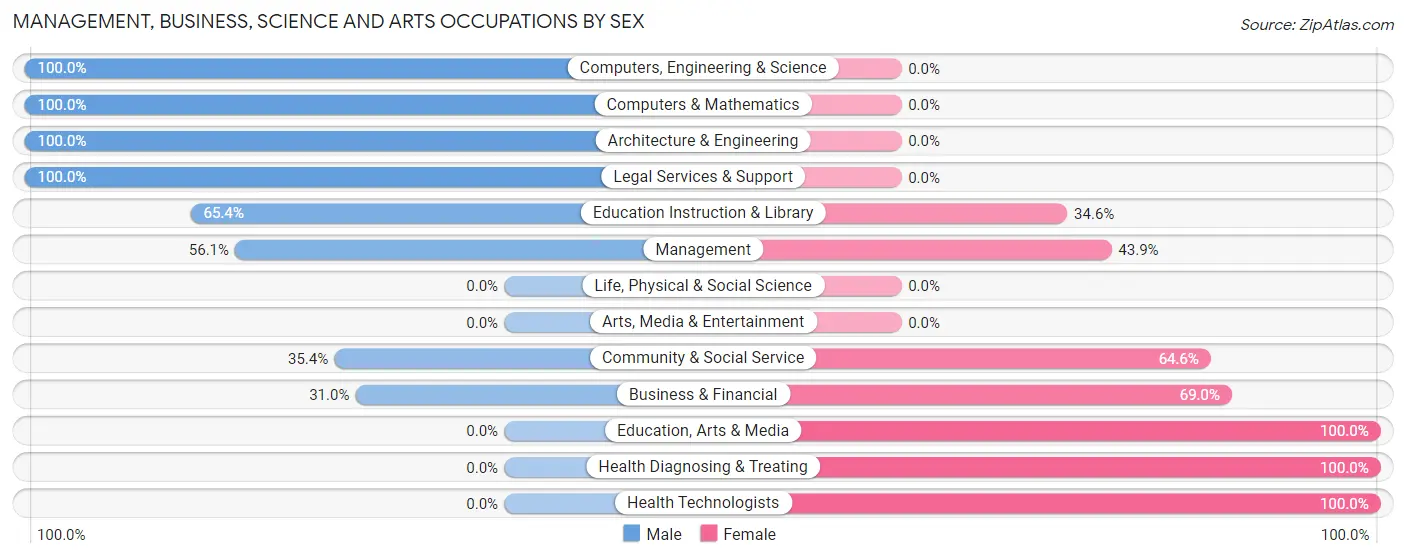
Management, Business, Science and Arts Occupations by Sex
Within the Management, Business, Science and Arts occupations in Grand View Estates, the most male-oriented occupations are Computers, Engineering & Science (100.0%), Computers & Mathematics (100.0%), and Architecture & Engineering (100.0%), while the most female-oriented occupations are Education, Arts & Media (100.0%), Health Diagnosing & Treating (100.0%), and Health Technologists (100.0%).
| Occupation | Male | Female |
| Management | 32 (56.1%) | 25 (43.9%) |
| Business & Financial | 9 (31.0%) | 20 (69.0%) |
| Computers, Engineering & Science | 51 (100.0%) | 0 (0.0%) |
| Computers & Mathematics | 40 (100.0%) | 0 (0.0%) |
| Architecture & Engineering | 11 (100.0%) | 0 (0.0%) |
| Life, Physical & Social Science | 0 (0.0%) | 0 (0.0%) |
| Community & Social Service | 28 (35.4%) | 51 (64.6%) |
| Education, Arts & Media | 0 (0.0%) | 42 (100.0%) |
| Legal Services & Support | 11 (100.0%) | 0 (0.0%) |
| Education Instruction & Library | 17 (65.4%) | 9 (34.6%) |
| Arts, Media & Entertainment | 0 (0.0%) | 0 (0.0%) |
| Health Diagnosing & Treating | 0 (0.0%) | 38 (100.0%) |
| Health Technologists | 0 (0.0%) | 38 (100.0%) |
| Total (Category) | 120 (47.2%) | 134 (52.8%) |
| Total (Overall) | 244 (54.0%) | 208 (46.0%) |
Services Occupations
Services Occupations by Sex
| Occupation | Male | Female |
| Healthcare Support | 0 (0.0%) | 0 (0.0%) |
| Security & Protection | 0 (0.0%) | 0 (0.0%) |
| Firefighting & Prevention | 0 (0.0%) | 0 (0.0%) |
| Law Enforcement | 0 (0.0%) | 0 (0.0%) |
| Food Preparation & Serving | 0 (0.0%) | 0 (0.0%) |
| Cleaning & Maintenance | 0 (0.0%) | 0 (0.0%) |
| Personal Care & Service | 0 (0.0%) | 0 (0.0%) |
| Total (Category) | 0 (0.0%) | 0 (0.0%) |
| Total (Overall) | 244 (54.0%) | 208 (46.0%) |
Sales and Office Occupations
The most common Sales and Office occupations in Grand View Estates are Sales & Related (37 | 8.2%), and Office & Administration (24 | 5.3%).

Sales and Office Occupations by Sex

| Occupation | Male | Female |
| Sales & Related | 10 (27.0%) | 27 (73.0%) |
| Office & Administration | 0 (0.0%) | 24 (100.0%) |
| Total (Category) | 10 (16.4%) | 51 (83.6%) |
| Total (Overall) | 244 (54.0%) | 208 (46.0%) |
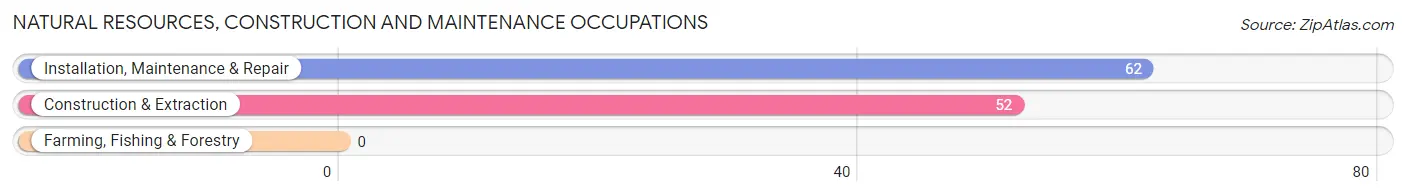
Natural Resources, Construction and Maintenance Occupations
The most common Natural Resources, Construction and Maintenance occupations in Grand View Estates are Installation, Maintenance & Repair (62 | 13.7%), and Construction & Extraction (52 | 11.5%).
Natural Resources, Construction and Maintenance Occupations by Sex
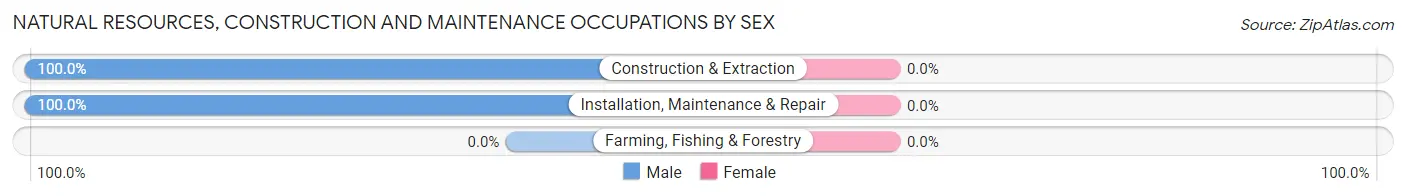
| Occupation | Male | Female |
| Farming, Fishing & Forestry | 0 (0.0%) | 0 (0.0%) |
| Construction & Extraction | 52 (100.0%) | 0 (0.0%) |
| Installation, Maintenance & Repair | 62 (100.0%) | 0 (0.0%) |
| Total (Category) | 114 (100.0%) | 0 (0.0%) |
| Total (Overall) | 244 (54.0%) | 208 (46.0%) |
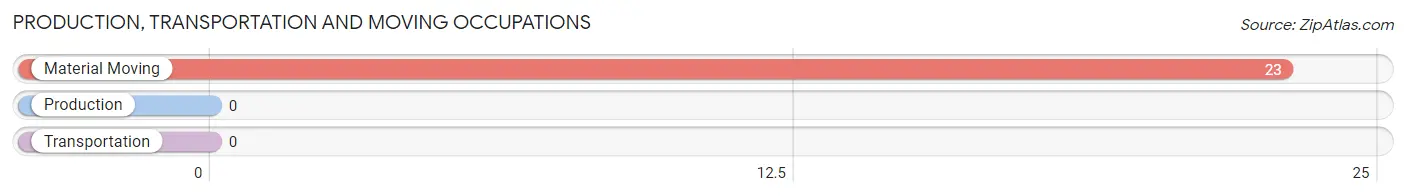
Production, Transportation and Moving Occupations
The most common Production, Transportation and Moving occupations in Grand View Estates are , and Material Moving (23 | 5.1%).
Production, Transportation and Moving Occupations by Sex
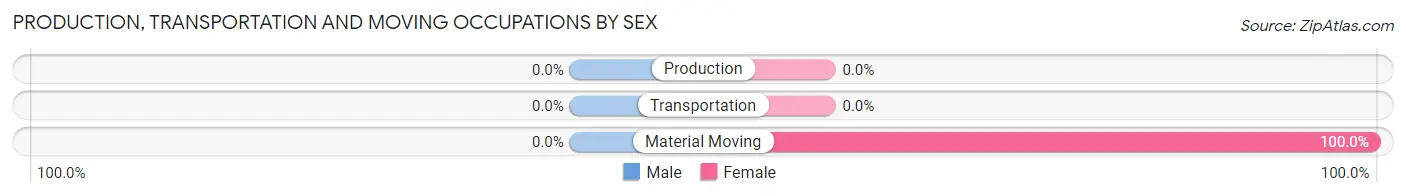
| Occupation | Male | Female |
| Production | 0 (0.0%) | 0 (0.0%) |
| Transportation | 0 (0.0%) | 0 (0.0%) |
| Material Moving | 0 (0.0%) | 23 (100.0%) |
| Total (Category) | 0 (0.0%) | 23 (100.0%) |
| Total (Overall) | 244 (54.0%) | 208 (46.0%) |
Employment Industries by Sex in Grand View Estates
Employment Industries in Grand View Estates
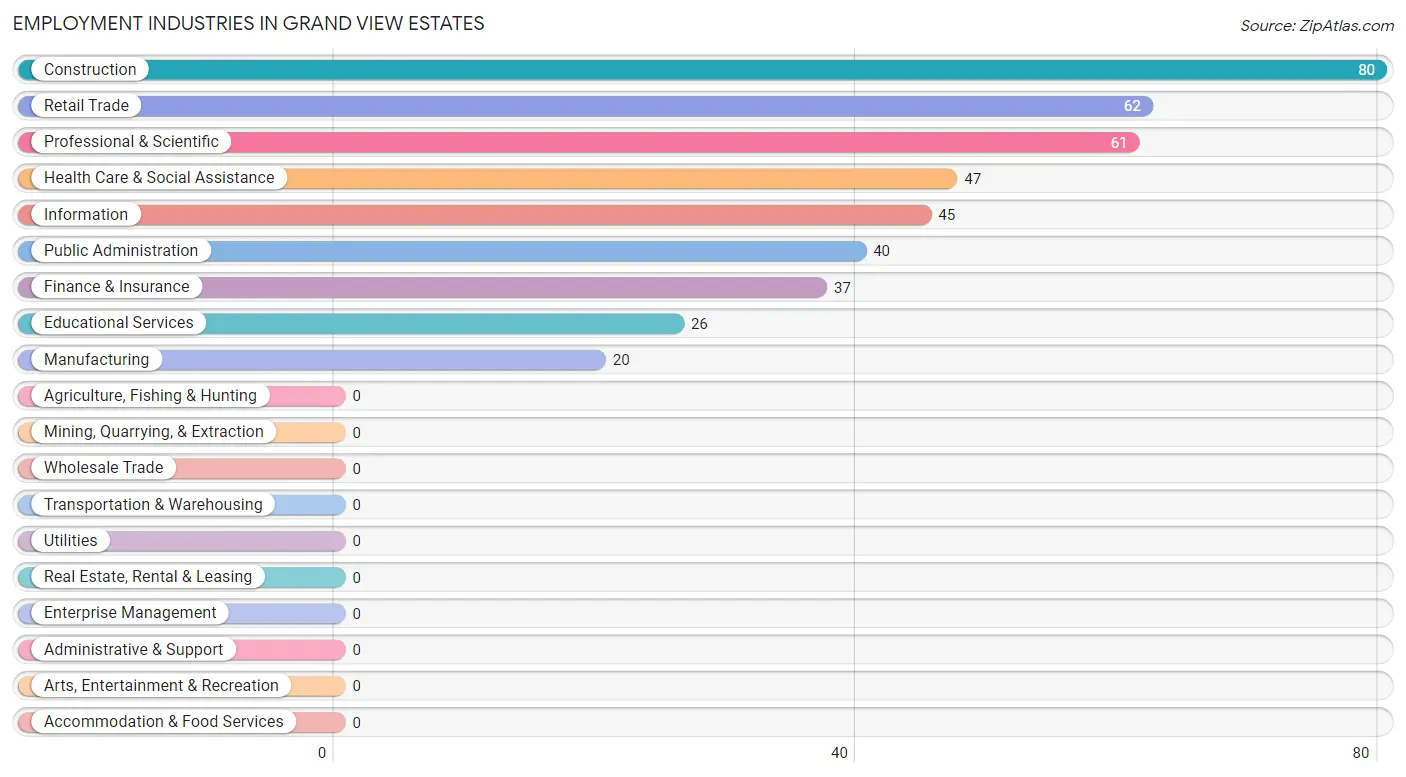
The major employment industries in Grand View Estates include Construction (80 | 17.7%), Retail Trade (62 | 13.7%), Professional & Scientific (61 | 13.5%), Health Care & Social Assistance (47 | 10.4%), and Information (45 | 10.0%).
Employment Industries by Sex in Grand View Estates
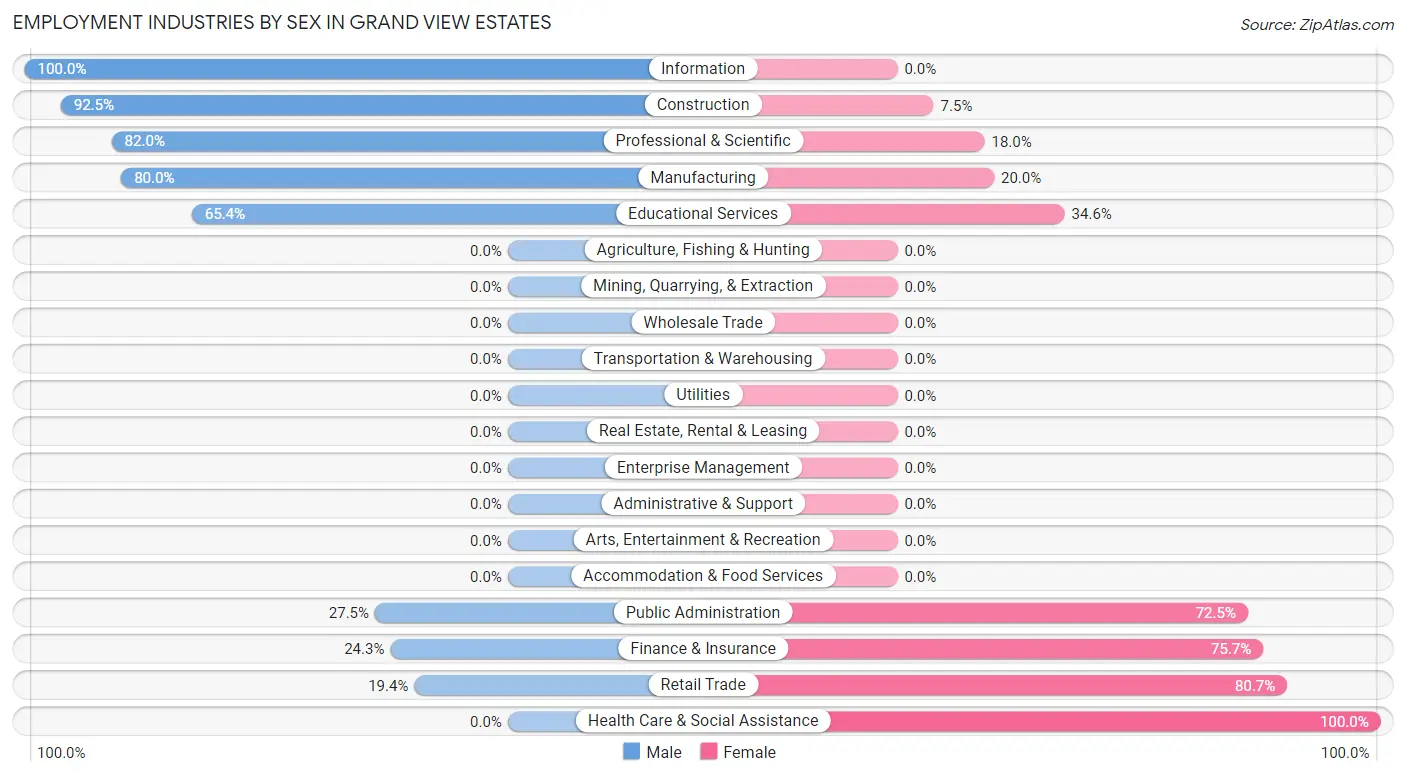
The Grand View Estates industries that see more men than women are Information (100.0%), Construction (92.5%), and Professional & Scientific (82.0%), whereas the industries that tend to have a higher number of women are Health Care & Social Assistance (100.0%), Retail Trade (80.6%), and Finance & Insurance (75.7%).
| Industry | Male | Female |
| Agriculture, Fishing & Hunting | 0 (0.0%) | 0 (0.0%) |
| Mining, Quarrying, & Extraction | 0 (0.0%) | 0 (0.0%) |
| Construction | 74 (92.5%) | 6 (7.5%) |
| Manufacturing | 16 (80.0%) | 4 (20.0%) |
| Wholesale Trade | 0 (0.0%) | 0 (0.0%) |
| Retail Trade | 12 (19.4%) | 50 (80.6%) |
| Transportation & Warehousing | 0 (0.0%) | 0 (0.0%) |
| Utilities | 0 (0.0%) | 0 (0.0%) |
| Information | 45 (100.0%) | 0 (0.0%) |
| Finance & Insurance | 9 (24.3%) | 28 (75.7%) |
| Real Estate, Rental & Leasing | 0 (0.0%) | 0 (0.0%) |
| Professional & Scientific | 50 (82.0%) | 11 (18.0%) |
| Enterprise Management | 0 (0.0%) | 0 (0.0%) |
| Administrative & Support | 0 (0.0%) | 0 (0.0%) |
| Educational Services | 17 (65.4%) | 9 (34.6%) |
| Health Care & Social Assistance | 0 (0.0%) | 47 (100.0%) |
| Arts, Entertainment & Recreation | 0 (0.0%) | 0 (0.0%) |
| Accommodation & Food Services | 0 (0.0%) | 0 (0.0%) |
| Public Administration | 11 (27.5%) | 29 (72.5%) |
| Total | 244 (54.0%) | 208 (46.0%) |
Education in Grand View Estates
School Enrollment in Grand View Estates
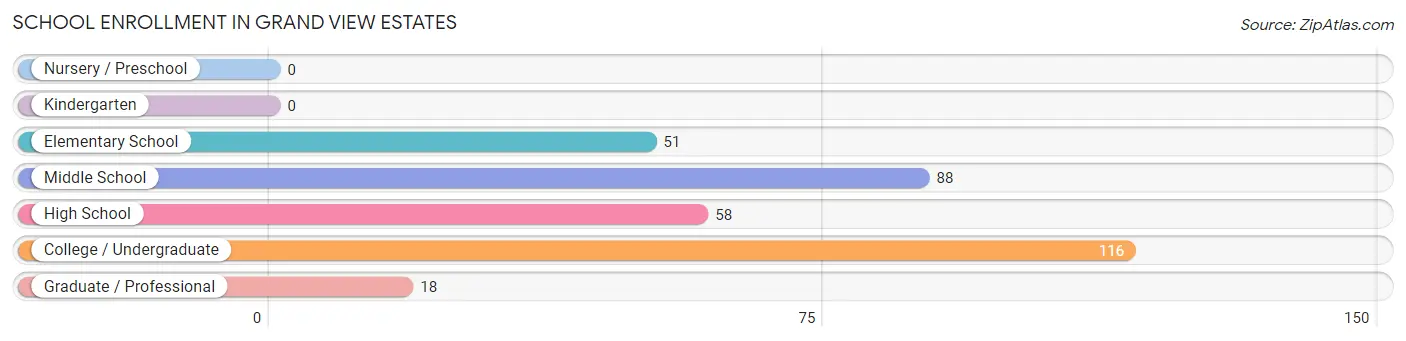
The most common levels of schooling among the 331 students in Grand View Estates are college / undergraduate (116 | 35.0%), middle school (88 | 26.6%), and high school (58 | 17.5%).
| School Level | # Students | % Students |
| Nursery / Preschool | 0 | 0.0% |
| Kindergarten | 0 | 0.0% |
| Elementary School | 51 | 15.4% |
| Middle School | 88 | 26.6% |
| High School | 58 | 17.5% |
| College / Undergraduate | 116 | 35.0% |
| Graduate / Professional | 18 | 5.4% |
| Total | 331 | 100.0% |
School Enrollment by Age by Funding Source in Grand View Estates
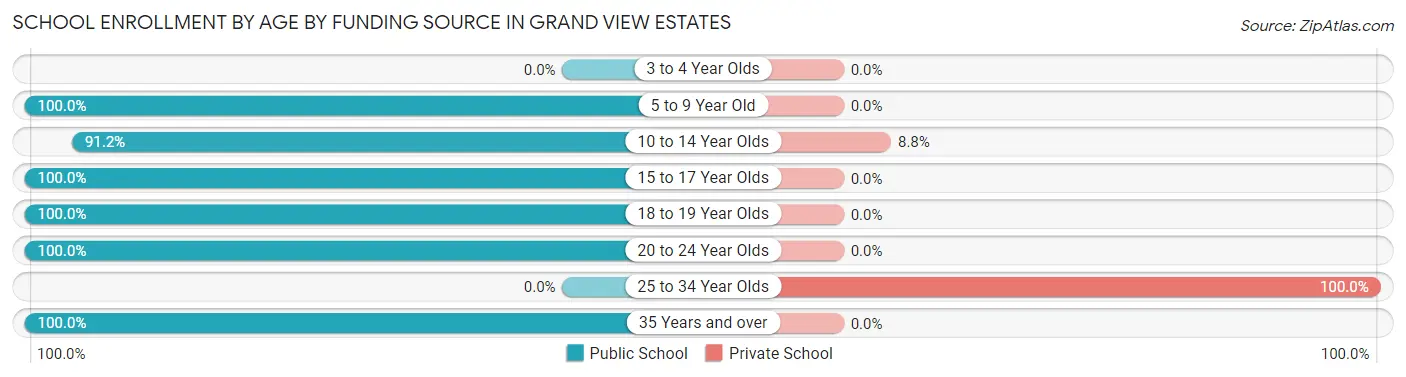
Out of a total of 331 students who are enrolled in schools in Grand View Estates, 21 (6.3%) attend a private institution, while the remaining 310 (93.7%) are enrolled in public schools. The age group of 25 to 34 year olds has the highest likelihood of being enrolled in private schools, with 12 (100.0% in the age bracket) enrolled. Conversely, the age group of 5 to 9 year old has the lowest likelihood of being enrolled in a private school, with 37 (100.0% in the age bracket) attending a public institution.
| Age Bracket | Public School | Private School |
| 3 to 4 Year Olds | 0 (0.0%) | 0 (0.0%) |
| 5 to 9 Year Old | 37 (100.0%) | 0 (0.0%) |
| 10 to 14 Year Olds | 93 (91.2%) | 9 (8.8%) |
| 15 to 17 Year Olds | 39 (100.0%) | 0 (0.0%) |
| 18 to 19 Year Olds | 34 (100.0%) | 0 (0.0%) |
| 20 to 24 Year Olds | 35 (100.0%) | 0 (0.0%) |
| 25 to 34 Year Olds | 0 (0.0%) | 12 (100.0%) |
| 35 Years and over | 72 (100.0%) | 0 (0.0%) |
| Total | 310 (93.7%) | 21 (6.3%) |
Educational Attainment by Field of Study in Grand View Estates
Business (66 | 30.1%), science & technology (52 | 23.7%), physical & health sciences (25 | 11.4%), bio, nature & agricultural (21 | 9.6%), and arts & humanities (15 | 6.9%) are the most common fields of study among 219 individuals in Grand View Estates who have obtained a bachelor's degree or higher.
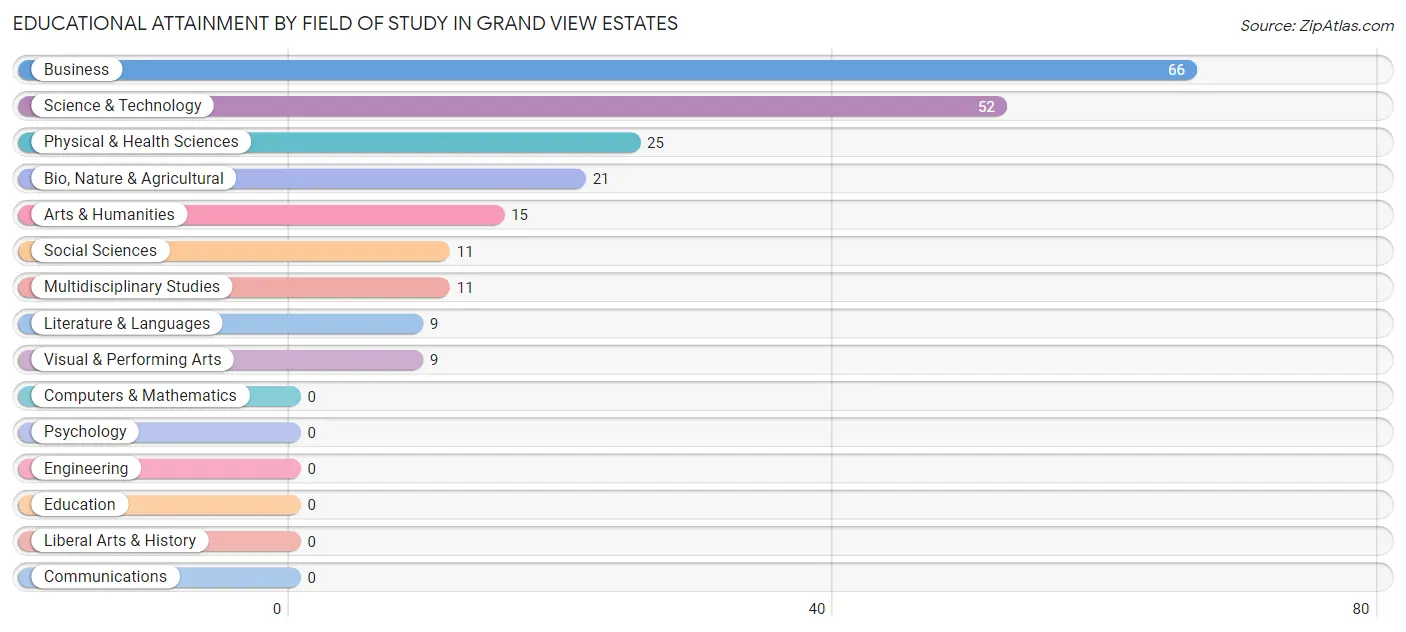
| Field of Study | # Graduates | % Graduates |
| Computers & Mathematics | 0 | 0.0% |
| Bio, Nature & Agricultural | 21 | 9.6% |
| Physical & Health Sciences | 25 | 11.4% |
| Psychology | 0 | 0.0% |
| Social Sciences | 11 | 5.0% |
| Engineering | 0 | 0.0% |
| Multidisciplinary Studies | 11 | 5.0% |
| Science & Technology | 52 | 23.7% |
| Business | 66 | 30.1% |
| Education | 0 | 0.0% |
| Literature & Languages | 9 | 4.1% |
| Liberal Arts & History | 0 | 0.0% |
| Visual & Performing Arts | 9 | 4.1% |
| Communications | 0 | 0.0% |
| Arts & Humanities | 15 | 6.9% |
| Total | 219 | 100.0% |
Transportation & Commute in Grand View Estates
Vehicle Availability by Sex in Grand View Estates
The most prevalent vehicle ownership categories in Grand View Estates are males with 2 vehicles (91, accounting for 39.1%) and females with 2 vehicles (32, making up 43.8%).
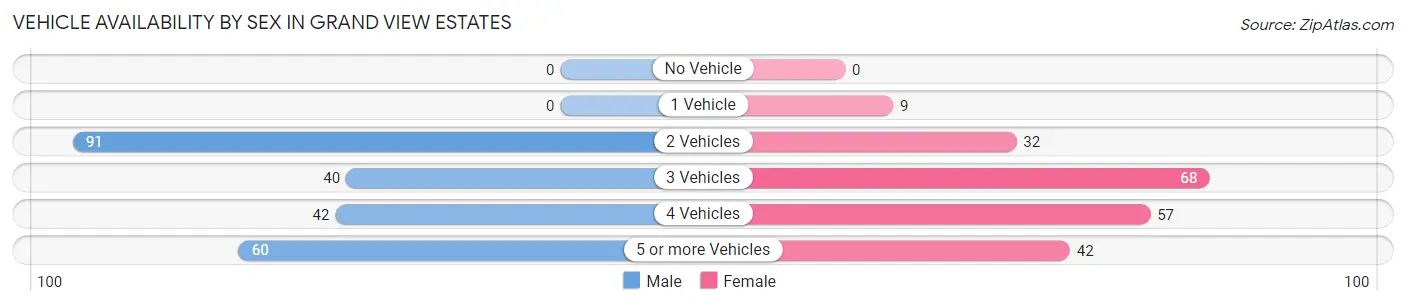
| Vehicles Available | Male | Female |
| No Vehicle | 0 (0.0%) | 0 (0.0%) |
| 1 Vehicle | 0 (0.0%) | 9 (4.3%) |
| 2 Vehicles | 91 (39.1%) | 32 (15.4%) |
| 3 Vehicles | 40 (17.2%) | 68 (32.7%) |
| 4 Vehicles | 42 (18.0%) | 57 (27.4%) |
| 5 or more Vehicles | 60 (25.8%) | 42 (20.2%) |
| Total | 233 (100.0%) | 208 (100.0%) |
Commute Time in Grand View Estates
The most frequently occuring commute durations in Grand View Estates are 10 to 14 minutes (125 commuters, 32.6%), 15 to 19 minutes (80 commuters, 20.9%), and 20 to 24 minutes (78 commuters, 20.4%).
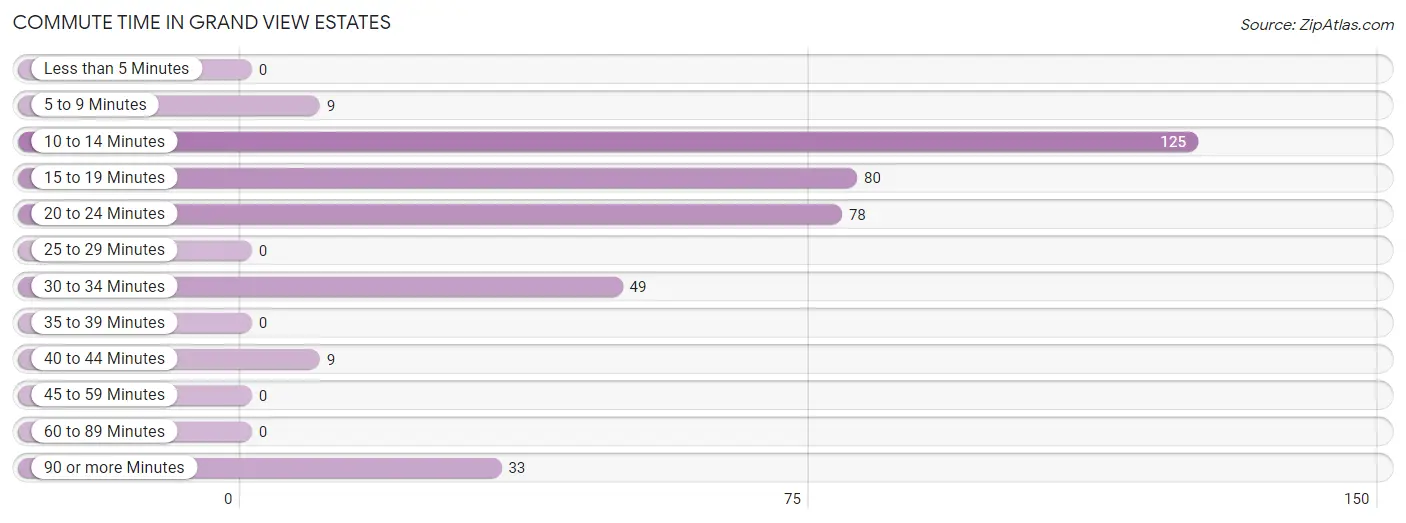
| Commute Time | # Commuters | % Commuters |
| Less than 5 Minutes | 0 | 0.0% |
| 5 to 9 Minutes | 9 | 2.4% |
| 10 to 14 Minutes | 125 | 32.6% |
| 15 to 19 Minutes | 80 | 20.9% |
| 20 to 24 Minutes | 78 | 20.4% |
| 25 to 29 Minutes | 0 | 0.0% |
| 30 to 34 Minutes | 49 | 12.8% |
| 35 to 39 Minutes | 0 | 0.0% |
| 40 to 44 Minutes | 9 | 2.4% |
| 45 to 59 Minutes | 0 | 0.0% |
| 60 to 89 Minutes | 0 | 0.0% |
| 90 or more Minutes | 33 | 8.6% |
Commute Time by Sex in Grand View Estates
The most common commute times in Grand View Estates are 10 to 14 minutes (69 commuters, 34.5%) for males and 10 to 14 minutes (56 commuters, 30.6%) for females.
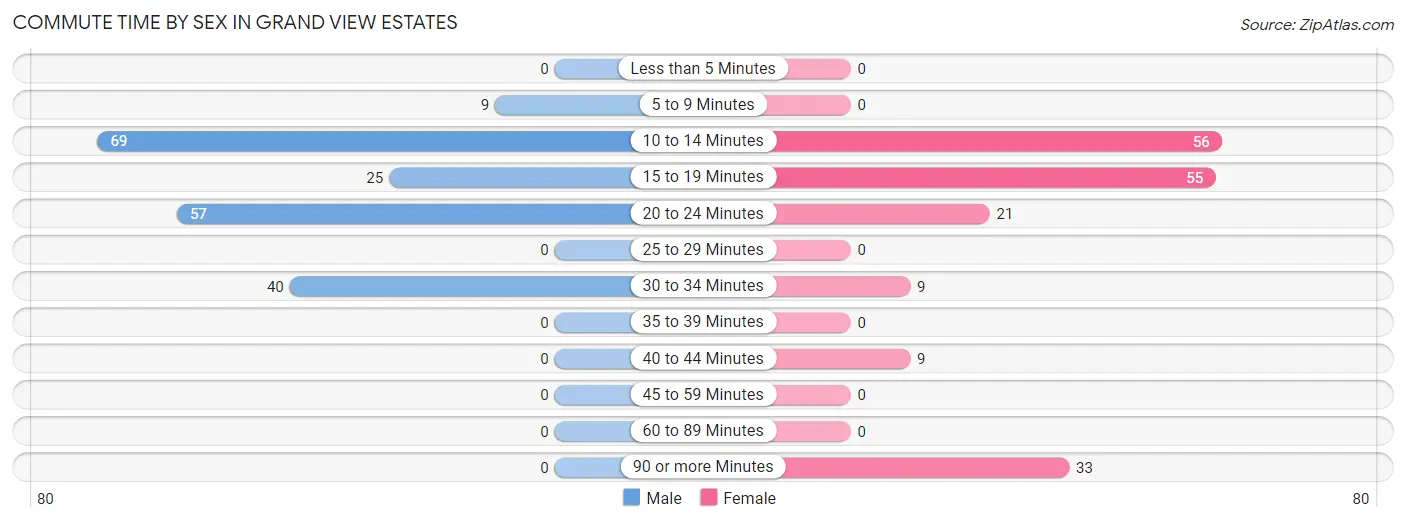
| Commute Time | Male | Female |
| Less than 5 Minutes | 0 (0.0%) | 0 (0.0%) |
| 5 to 9 Minutes | 9 (4.5%) | 0 (0.0%) |
| 10 to 14 Minutes | 69 (34.5%) | 56 (30.6%) |
| 15 to 19 Minutes | 25 (12.5%) | 55 (30.0%) |
| 20 to 24 Minutes | 57 (28.5%) | 21 (11.5%) |
| 25 to 29 Minutes | 0 (0.0%) | 0 (0.0%) |
| 30 to 34 Minutes | 40 (20.0%) | 9 (4.9%) |
| 35 to 39 Minutes | 0 (0.0%) | 0 (0.0%) |
| 40 to 44 Minutes | 0 (0.0%) | 9 (4.9%) |
| 45 to 59 Minutes | 0 (0.0%) | 0 (0.0%) |
| 60 to 89 Minutes | 0 (0.0%) | 0 (0.0%) |
| 90 or more Minutes | 0 (0.0%) | 33 (18.0%) |
Time of Departure to Work by Sex in Grand View Estates
The most frequent times of departure to work in Grand View Estates are 7:30 AM to 7:59 AM (66, 33.0%) for males and 9:00 AM to 9:59 AM (62, 33.9%) for females.
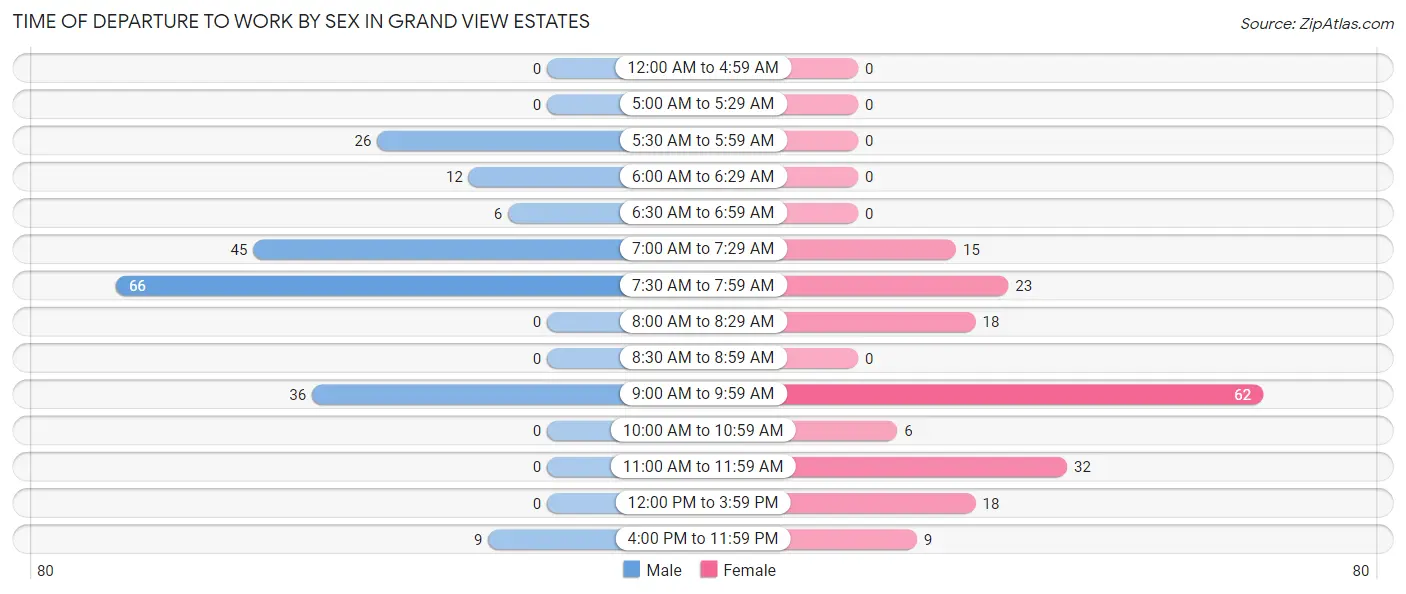
| Time of Departure | Male | Female |
| 12:00 AM to 4:59 AM | 0 (0.0%) | 0 (0.0%) |
| 5:00 AM to 5:29 AM | 0 (0.0%) | 0 (0.0%) |
| 5:30 AM to 5:59 AM | 26 (13.0%) | 0 (0.0%) |
| 6:00 AM to 6:29 AM | 12 (6.0%) | 0 (0.0%) |
| 6:30 AM to 6:59 AM | 6 (3.0%) | 0 (0.0%) |
| 7:00 AM to 7:29 AM | 45 (22.5%) | 15 (8.2%) |
| 7:30 AM to 7:59 AM | 66 (33.0%) | 23 (12.6%) |
| 8:00 AM to 8:29 AM | 0 (0.0%) | 18 (9.8%) |
| 8:30 AM to 8:59 AM | 0 (0.0%) | 0 (0.0%) |
| 9:00 AM to 9:59 AM | 36 (18.0%) | 62 (33.9%) |
| 10:00 AM to 10:59 AM | 0 (0.0%) | 6 (3.3%) |
| 11:00 AM to 11:59 AM | 0 (0.0%) | 32 (17.5%) |
| 12:00 PM to 3:59 PM | 0 (0.0%) | 18 (9.8%) |
| 4:00 PM to 11:59 PM | 9 (4.5%) | 9 (4.9%) |
| Total | 200 (100.0%) | 183 (100.0%) |
Housing Occupancy in Grand View Estates
Occupancy by Ownership in Grand View Estates
Of the total 241 dwellings in Grand View Estates, owner-occupied units account for 235 (97.5%), while renter-occupied units make up 6 (2.5%).
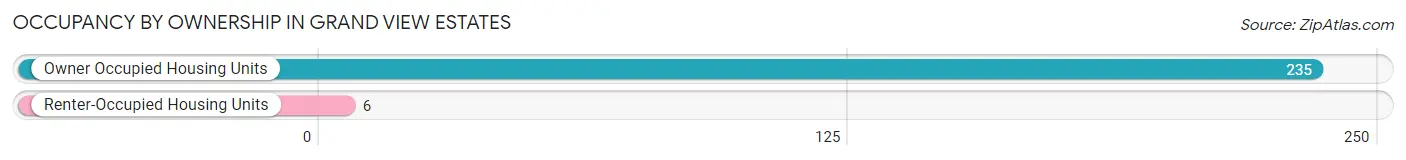
| Occupancy | # Housing Units | % Housing Units |
| Owner Occupied Housing Units | 235 | 97.5% |
| Renter-Occupied Housing Units | 6 | 2.5% |
| Total Occupied Housing Units | 241 | 100.0% |
Occupancy by Household Size in Grand View Estates
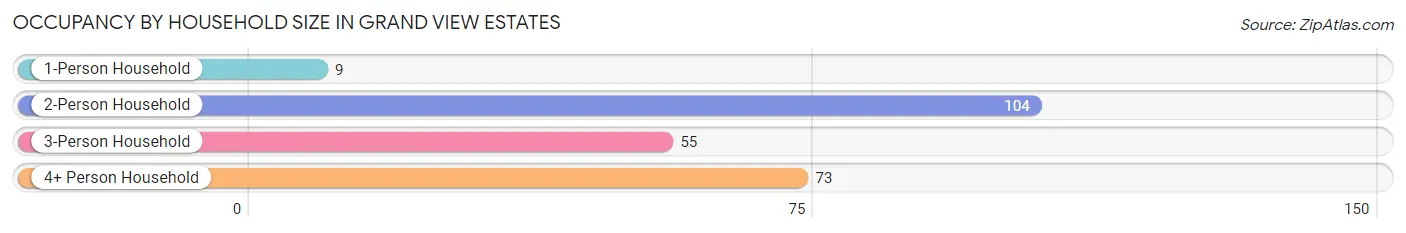
| Household Size | # Housing Units | % Housing Units |
| 1-Person Household | 9 | 3.7% |
| 2-Person Household | 104 | 43.1% |
| 3-Person Household | 55 | 22.8% |
| 4+ Person Household | 73 | 30.3% |
| Total Housing Units | 241 | 100.0% |
Occupancy by Ownership by Household Size in Grand View Estates
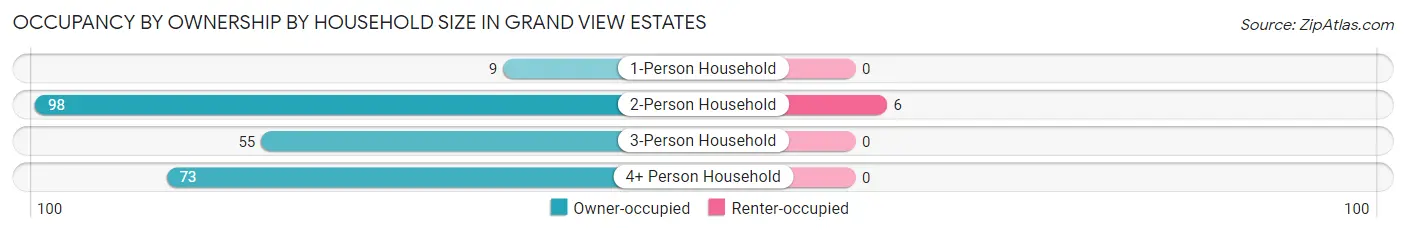
| Household Size | Owner-occupied | Renter-occupied |
| 1-Person Household | 9 (100.0%) | 0 (0.0%) |
| 2-Person Household | 98 (94.2%) | 6 (5.8%) |
| 3-Person Household | 55 (100.0%) | 0 (0.0%) |
| 4+ Person Household | 73 (100.0%) | 0 (0.0%) |
| Total Housing Units | 235 (97.5%) | 6 (2.5%) |
Occupancy by Educational Attainment in Grand View Estates
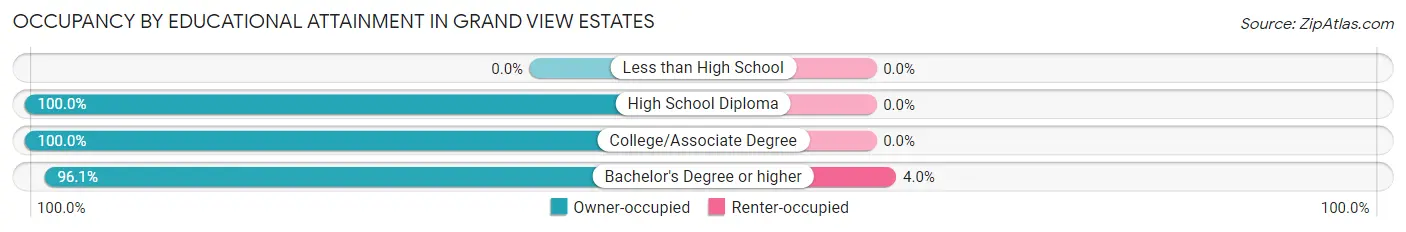
| Household Size | Owner-occupied | Renter-occupied |
| Less than High School | 0 (0.0%) | 0 (0.0%) |
| High School Diploma | 26 (100.0%) | 0 (0.0%) |
| College/Associate Degree | 63 (100.0%) | 0 (0.0%) |
| Bachelor's Degree or higher | 146 (96.1%) | 6 (4.0%) |
Occupancy by Age of Householder in Grand View Estates
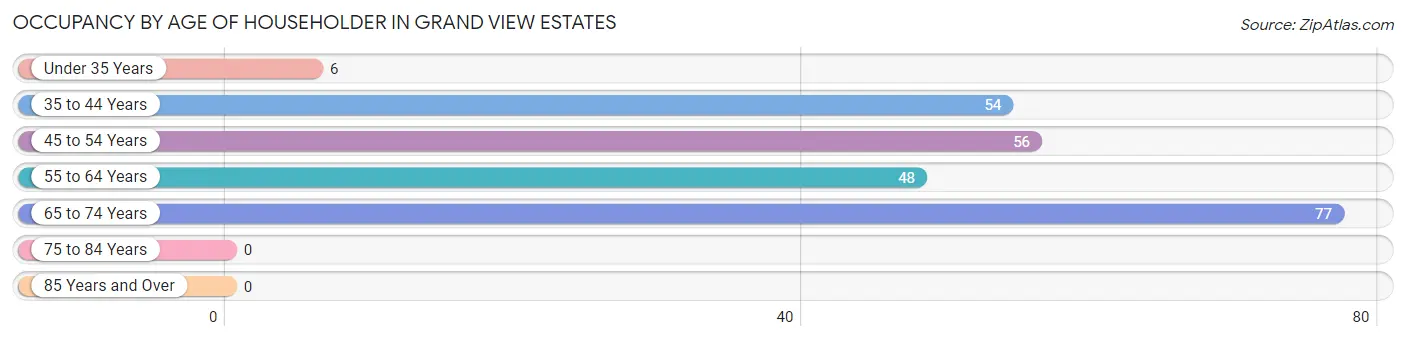
| Age Bracket | # Households | % Households |
| Under 35 Years | 6 | 2.5% |
| 35 to 44 Years | 54 | 22.4% |
| 45 to 54 Years | 56 | 23.2% |
| 55 to 64 Years | 48 | 19.9% |
| 65 to 74 Years | 77 | 32.0% |
| 75 to 84 Years | 0 | 0.0% |
| 85 Years and Over | 0 | 0.0% |
| Total | 241 | 100.0% |
Housing Finances in Grand View Estates
Median Income by Occupancy in Grand View Estates
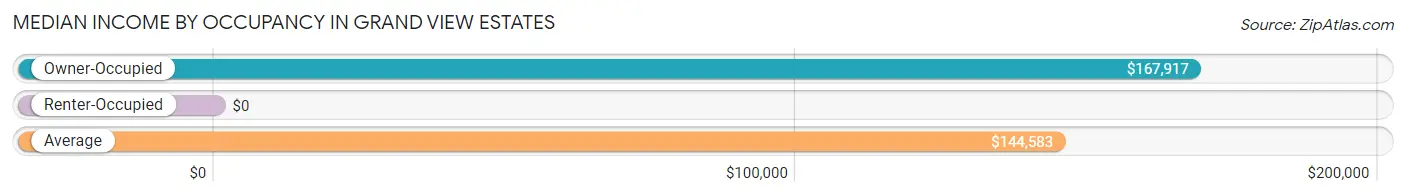
| Occupancy Type | # Households | Median Income |
| Owner-Occupied | 235 (97.5%) | $167,917 |
| Renter-Occupied | 6 (2.5%) | $0 |
| Average | 241 (100.0%) | $144,583 |
Occupancy by Householder Income Bracket in Grand View Estates
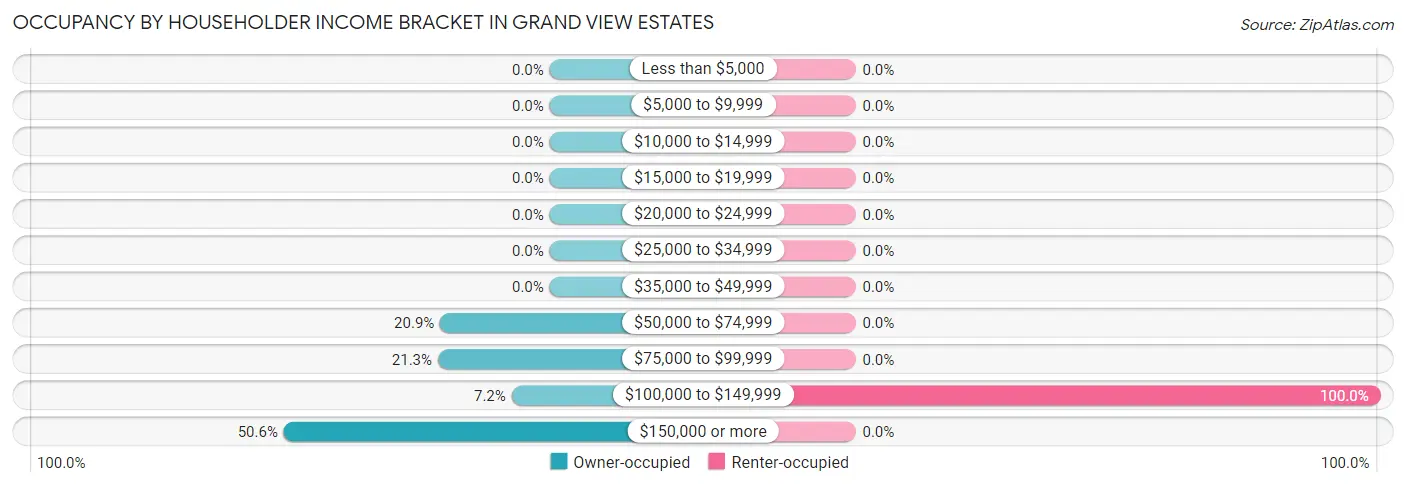
| Income Bracket | Owner-occupied | Renter-occupied |
| Less than $5,000 | 0 (0.0%) | 0 (0.0%) |
| $5,000 to $9,999 | 0 (0.0%) | 0 (0.0%) |
| $10,000 to $14,999 | 0 (0.0%) | 0 (0.0%) |
| $15,000 to $19,999 | 0 (0.0%) | 0 (0.0%) |
| $20,000 to $24,999 | 0 (0.0%) | 0 (0.0%) |
| $25,000 to $34,999 | 0 (0.0%) | 0 (0.0%) |
| $35,000 to $49,999 | 0 (0.0%) | 0 (0.0%) |
| $50,000 to $74,999 | 49 (20.8%) | 0 (0.0%) |
| $75,000 to $99,999 | 50 (21.3%) | 0 (0.0%) |
| $100,000 to $149,999 | 17 (7.2%) | 6 (100.0%) |
| $150,000 or more | 119 (50.6%) | 0 (0.0%) |
| Total | 235 (100.0%) | 6 (100.0%) |
Monthly Housing Cost Tiers in Grand View Estates
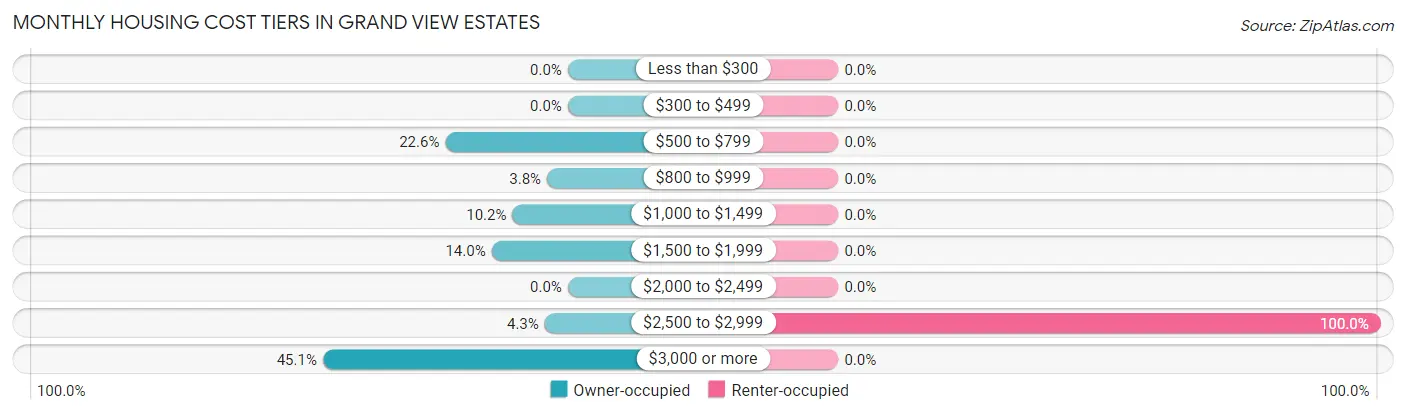
| Monthly Cost | Owner-occupied | Renter-occupied |
| Less than $300 | 0 (0.0%) | 0 (0.0%) |
| $300 to $499 | 0 (0.0%) | 0 (0.0%) |
| $500 to $799 | 53 (22.6%) | 0 (0.0%) |
| $800 to $999 | 9 (3.8%) | 0 (0.0%) |
| $1,000 to $1,499 | 24 (10.2%) | 0 (0.0%) |
| $1,500 to $1,999 | 33 (14.0%) | 0 (0.0%) |
| $2,000 to $2,499 | 0 (0.0%) | 0 (0.0%) |
| $2,500 to $2,999 | 10 (4.3%) | 6 (100.0%) |
| $3,000 or more | 106 (45.1%) | 0 (0.0%) |
| Total | 235 (100.0%) | 6 (100.0%) |
Physical Housing Characteristics in Grand View Estates
Housing Structures in Grand View Estates
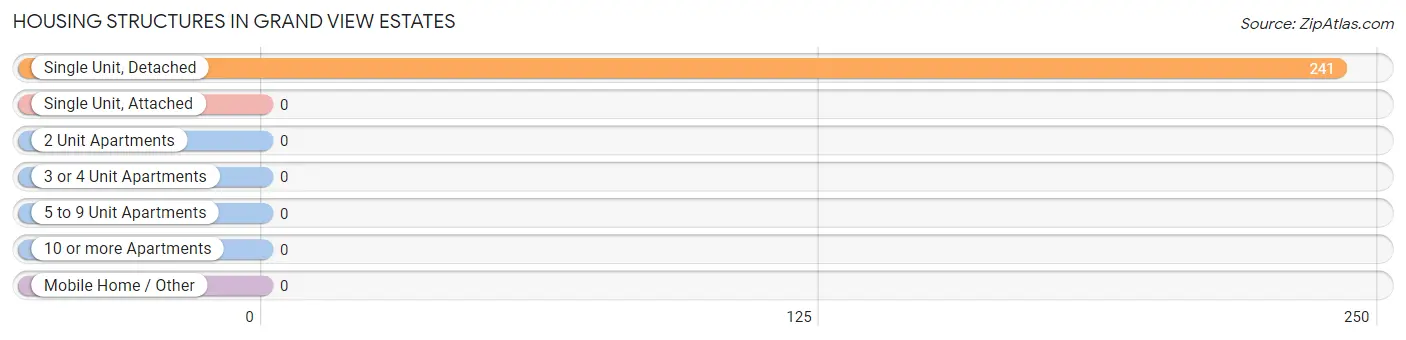
| Structure Type | # Housing Units | % Housing Units |
| Single Unit, Detached | 241 | 100.0% |
| Single Unit, Attached | 0 | 0.0% |
| 2 Unit Apartments | 0 | 0.0% |
| 3 or 4 Unit Apartments | 0 | 0.0% |
| 5 to 9 Unit Apartments | 0 | 0.0% |
| 10 or more Apartments | 0 | 0.0% |
| Mobile Home / Other | 0 | 0.0% |
| Total | 241 | 100.0% |
Housing Structures by Occupancy in Grand View Estates
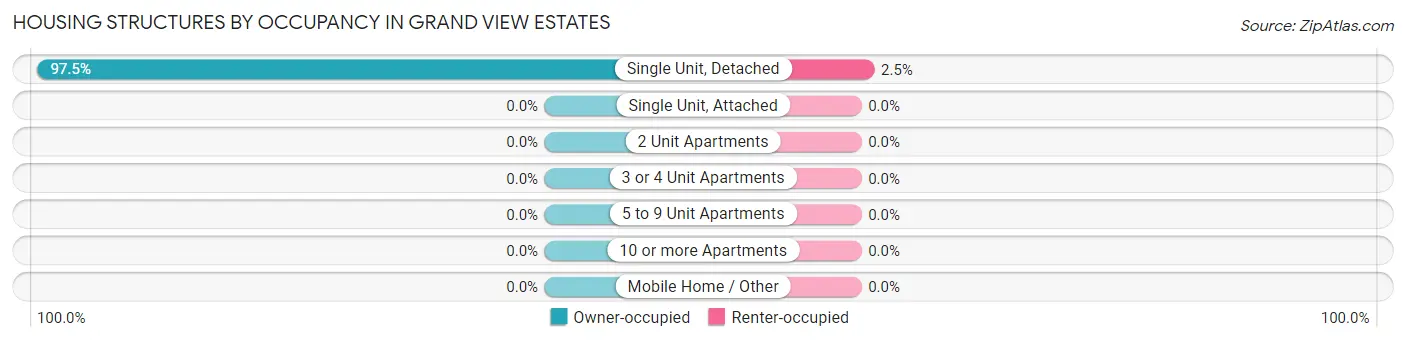
| Structure Type | Owner-occupied | Renter-occupied |
| Single Unit, Detached | 235 (97.5%) | 6 (2.5%) |
| Single Unit, Attached | 0 (0.0%) | 0 (0.0%) |
| 2 Unit Apartments | 0 (0.0%) | 0 (0.0%) |
| 3 or 4 Unit Apartments | 0 (0.0%) | 0 (0.0%) |
| 5 to 9 Unit Apartments | 0 (0.0%) | 0 (0.0%) |
| 10 or more Apartments | 0 (0.0%) | 0 (0.0%) |
| Mobile Home / Other | 0 (0.0%) | 0 (0.0%) |
| Total | 235 (97.5%) | 6 (2.5%) |
Housing Structures by Number of Rooms in Grand View Estates
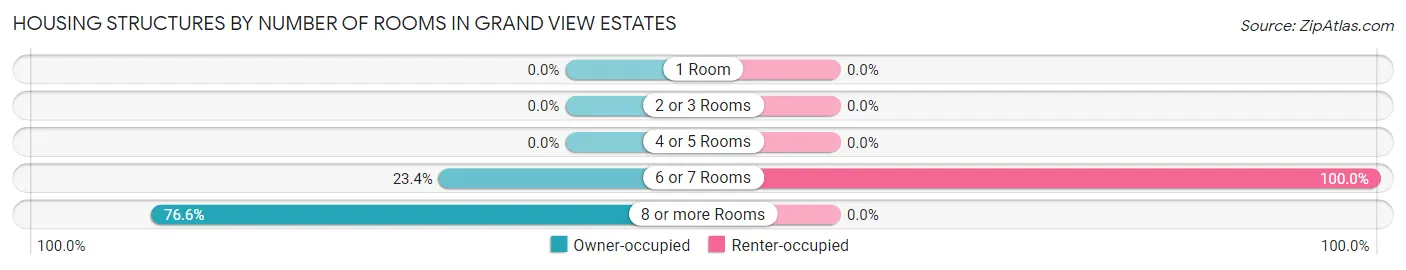
| Number of Rooms | Owner-occupied | Renter-occupied |
| 1 Room | 0 (0.0%) | 0 (0.0%) |
| 2 or 3 Rooms | 0 (0.0%) | 0 (0.0%) |
| 4 or 5 Rooms | 0 (0.0%) | 0 (0.0%) |
| 6 or 7 Rooms | 55 (23.4%) | 6 (100.0%) |
| 8 or more Rooms | 180 (76.6%) | 0 (0.0%) |
| Total | 235 (100.0%) | 6 (100.0%) |
Housing Structure by Heating Type in Grand View Estates
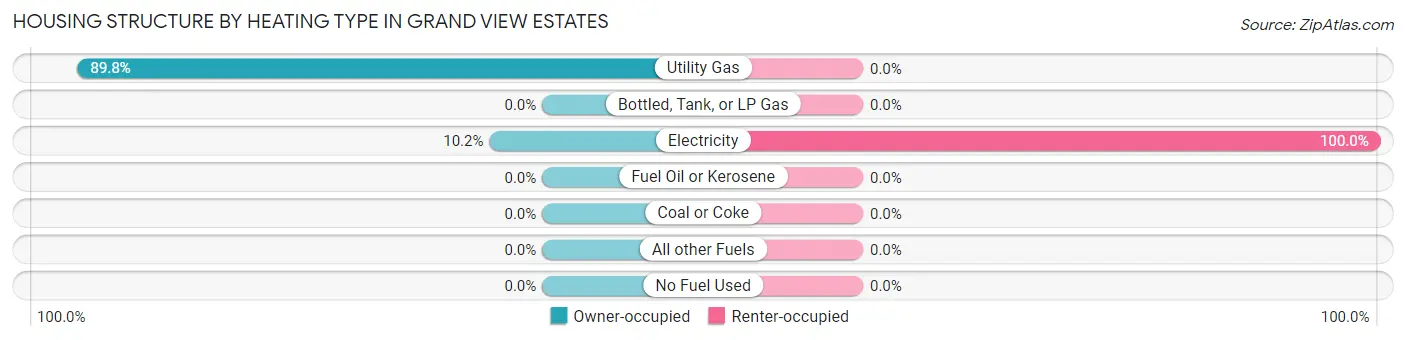
| Heating Type | Owner-occupied | Renter-occupied |
| Utility Gas | 211 (89.8%) | 0 (0.0%) |
| Bottled, Tank, or LP Gas | 0 (0.0%) | 0 (0.0%) |
| Electricity | 24 (10.2%) | 6 (100.0%) |
| Fuel Oil or Kerosene | 0 (0.0%) | 0 (0.0%) |
| Coal or Coke | 0 (0.0%) | 0 (0.0%) |
| All other Fuels | 0 (0.0%) | 0 (0.0%) |
| No Fuel Used | 0 (0.0%) | 0 (0.0%) |
| Total | 235 (100.0%) | 6 (100.0%) |
Household Vehicle Usage in Grand View Estates
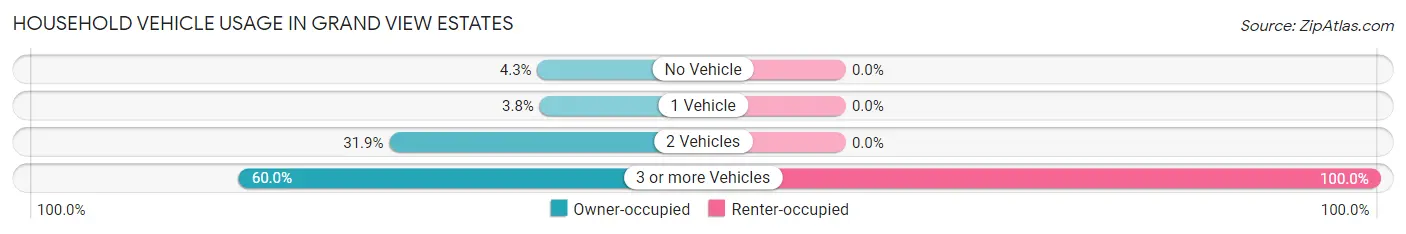
| Vehicles per Household | Owner-occupied | Renter-occupied |
| No Vehicle | 10 (4.3%) | 0 (0.0%) |
| 1 Vehicle | 9 (3.8%) | 0 (0.0%) |
| 2 Vehicles | 75 (31.9%) | 0 (0.0%) |
| 3 or more Vehicles | 141 (60.0%) | 6 (100.0%) |
| Total | 235 (100.0%) | 6 (100.0%) |
Real Estate & Mortgages in Grand View Estates
Real Estate and Mortgage Overview in Grand View Estates
| Characteristic | Without Mortgage | With Mortgage |
| Housing Units | 62 | 173 |
| Median Property Value | $855,300 | $662,700 |
| Median Household Income | - | - |
| Monthly Housing Costs | $582 | $106 |
| Real Estate Taxes | $3,415 | $0 |
Property Value by Mortgage Status in Grand View Estates
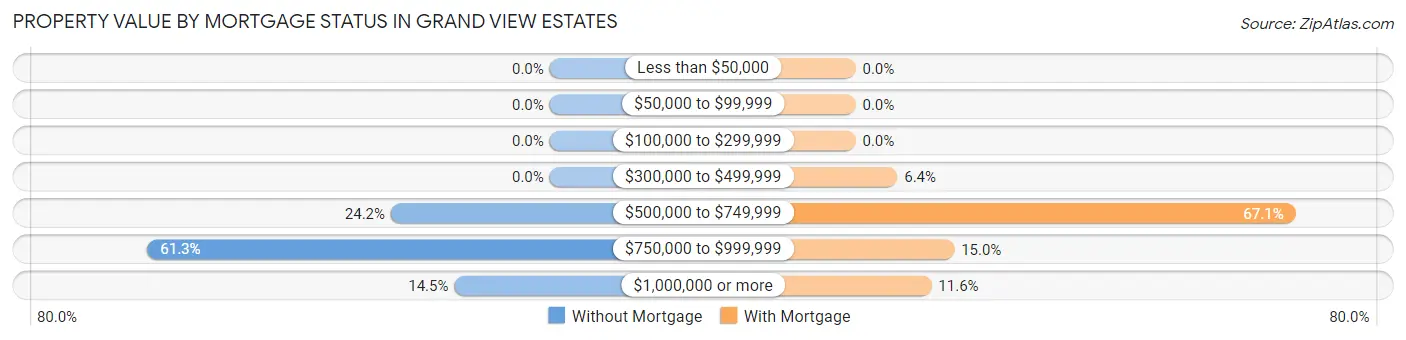
| Property Value | Without Mortgage | With Mortgage |
| Less than $50,000 | 0 (0.0%) | 0 (0.0%) |
| $50,000 to $99,999 | 0 (0.0%) | 0 (0.0%) |
| $100,000 to $299,999 | 0 (0.0%) | 0 (0.0%) |
| $300,000 to $499,999 | 0 (0.0%) | 11 (6.4%) |
| $500,000 to $749,999 | 15 (24.2%) | 116 (67.0%) |
| $750,000 to $999,999 | 38 (61.3%) | 26 (15.0%) |
| $1,000,000 or more | 9 (14.5%) | 20 (11.6%) |
| Total | 62 (100.0%) | 173 (100.0%) |
Household Income by Mortgage Status in Grand View Estates
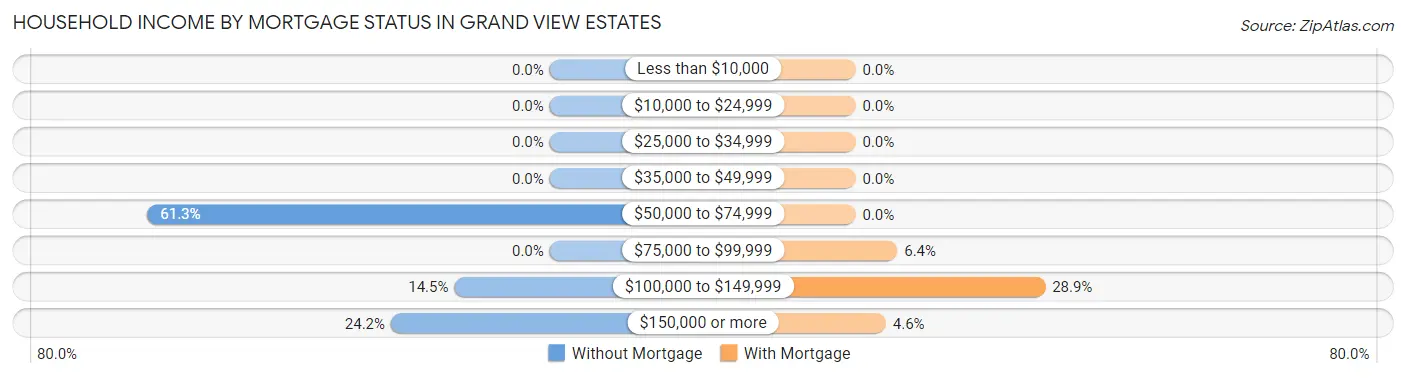
| Household Income | Without Mortgage | With Mortgage |
| Less than $10,000 | 0 (0.0%) | 0 (0.0%) |
| $10,000 to $24,999 | 0 (0.0%) | 0 (0.0%) |
| $25,000 to $34,999 | 0 (0.0%) | 0 (0.0%) |
| $35,000 to $49,999 | 0 (0.0%) | 0 (0.0%) |
| $50,000 to $74,999 | 38 (61.3%) | 0 (0.0%) |
| $75,000 to $99,999 | 0 (0.0%) | 11 (6.4%) |
| $100,000 to $149,999 | 9 (14.5%) | 50 (28.9%) |
| $150,000 or more | 15 (24.2%) | 8 (4.6%) |
| Total | 62 (100.0%) | 173 (100.0%) |
Property Value to Household Income Ratio in Grand View Estates
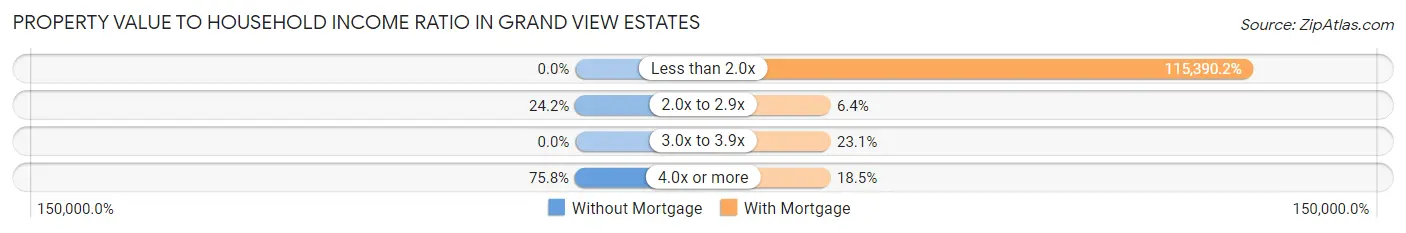
| Value-to-Income Ratio | Without Mortgage | With Mortgage |
| Less than 2.0x | 0 (0.0%) | 199,625 (115,390.2%) |
| 2.0x to 2.9x | 15 (24.2%) | 11 (6.4%) |
| 3.0x to 3.9x | 0 (0.0%) | 40 (23.1%) |
| 4.0x or more | 47 (75.8%) | 32 (18.5%) |
| Total | 62 (100.0%) | 173 (100.0%) |
Real Estate Taxes by Mortgage Status in Grand View Estates
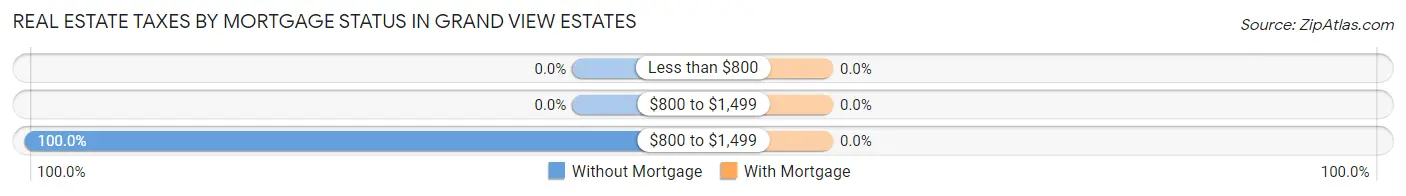
| Property Taxes | Without Mortgage | With Mortgage |
| Less than $800 | 0 (0.0%) | 0 (0.0%) |
| $800 to $1,499 | 0 (0.0%) | 0 (0.0%) |
| $800 to $1,499 | 62 (100.0%) | 0 (0.0%) |
| Total | 62 (100.0%) | 173 (100.0%) |
Health & Disability in Grand View Estates
Health Insurance Coverage by Age in Grand View Estates
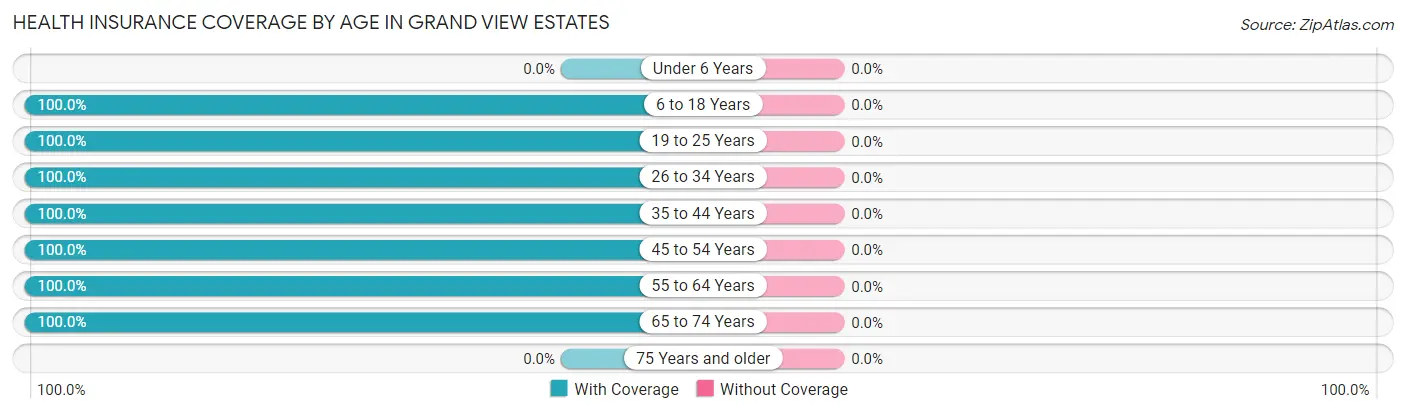
| Age Bracket | With Coverage | Without Coverage |
| Under 6 Years | 0 (0.0%) | 0 (0.0%) |
| 6 to 18 Years | 212 (100.0%) | 0 (0.0%) |
| 19 to 25 Years | 63 (100.0%) | 0 (0.0%) |
| 26 to 34 Years | 35 (100.0%) | 0 (0.0%) |
| 35 to 44 Years | 58 (100.0%) | 0 (0.0%) |
| 45 to 54 Years | 169 (100.0%) | 0 (0.0%) |
| 55 to 64 Years | 86 (100.0%) | 0 (0.0%) |
| 65 to 74 Years | 165 (100.0%) | 0 (0.0%) |
| 75 Years and older | 0 (0.0%) | 0 (0.0%) |
| Total | 788 (100.0%) | 0 (0.0%) |
Health Insurance Coverage by Citizenship Status in Grand View Estates

| Citizenship Status | With Coverage | Without Coverage |
| Native Born | 0 (0.0%) | 0 (0.0%) |
| Foreign Born, Citizen | 212 (100.0%) | 0 (0.0%) |
| Foreign Born, not a Citizen | 63 (100.0%) | 0 (0.0%) |
Health Insurance Coverage by Household Income in Grand View Estates
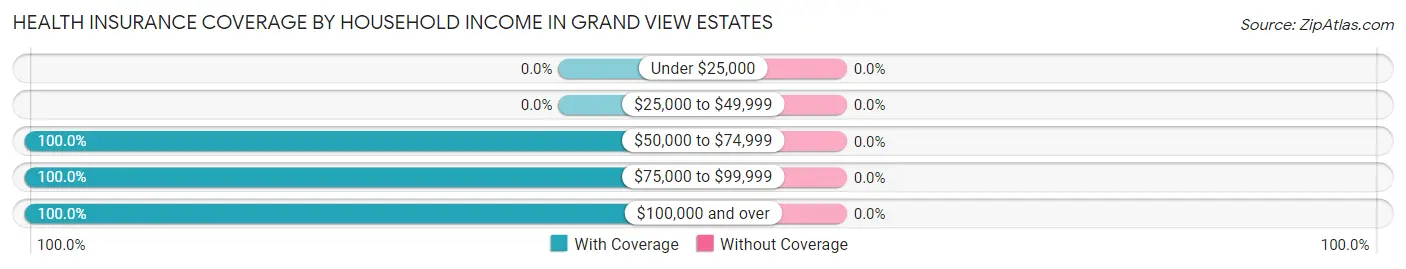
| Household Income | With Coverage | Without Coverage |
| Under $25,000 | 0 (0.0%) | 0 (0.0%) |
| $25,000 to $49,999 | 0 (0.0%) | 0 (0.0%) |
| $50,000 to $74,999 | 93 (100.0%) | 0 (0.0%) |
| $75,000 to $99,999 | 98 (100.0%) | 0 (0.0%) |
| $100,000 and over | 590 (100.0%) | 0 (0.0%) |
Public vs Private Health Insurance Coverage by Age in Grand View Estates
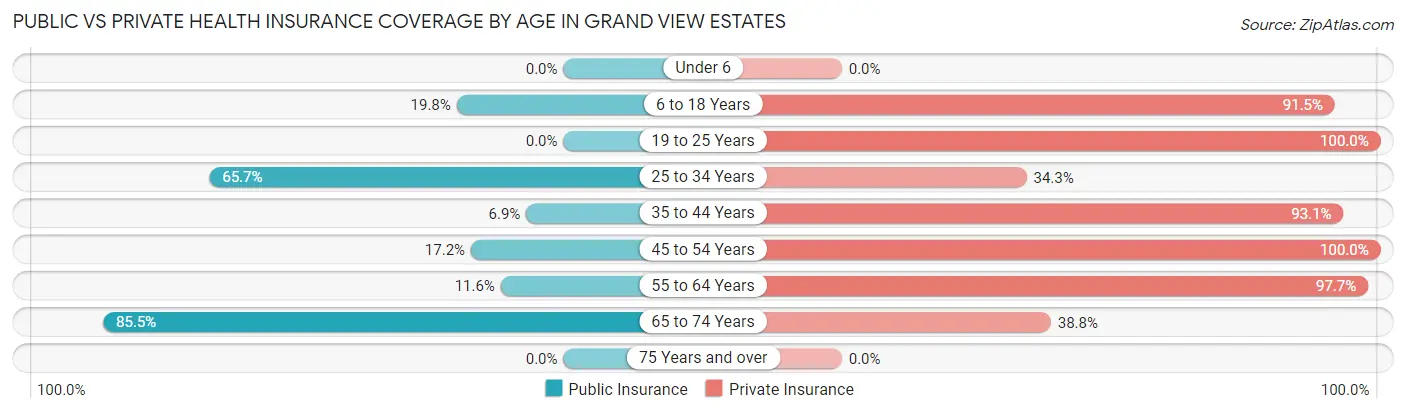
| Age Bracket | Public Insurance | Private Insurance |
| Under 6 | 0 (0.0%) | 0 (0.0%) |
| 6 to 18 Years | 42 (19.8%) | 194 (91.5%) |
| 19 to 25 Years | 0 (0.0%) | 63 (100.0%) |
| 25 to 34 Years | 23 (65.7%) | 12 (34.3%) |
| 35 to 44 Years | 4 (6.9%) | 54 (93.1%) |
| 45 to 54 Years | 29 (17.2%) | 169 (100.0%) |
| 55 to 64 Years | 10 (11.6%) | 84 (97.7%) |
| 65 to 74 Years | 141 (85.5%) | 64 (38.8%) |
| 75 Years and over | 0 (0.0%) | 0 (0.0%) |
| Total | 249 (31.6%) | 640 (81.2%) |
Disability Status by Sex by Age in Grand View Estates
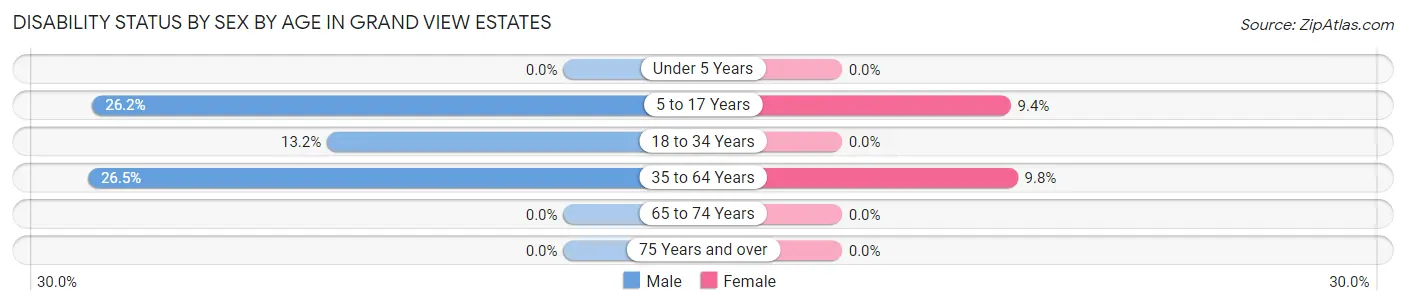
| Age Bracket | Male | Female |
| Under 5 Years | 0 (0.0%) | 0 (0.0%) |
| 5 to 17 Years | 16 (26.2%) | 11 (9.4%) |
| 18 to 34 Years | 10 (13.2%) | 0 (0.0%) |
| 35 to 64 Years | 45 (26.5%) | 14 (9.8%) |
| 65 to 74 Years | 0 (0.0%) | 0 (0.0%) |
| 75 Years and over | 0 (0.0%) | 0 (0.0%) |
Disability Class by Sex by Age in Grand View Estates
Disability Class: Hearing Difficulty
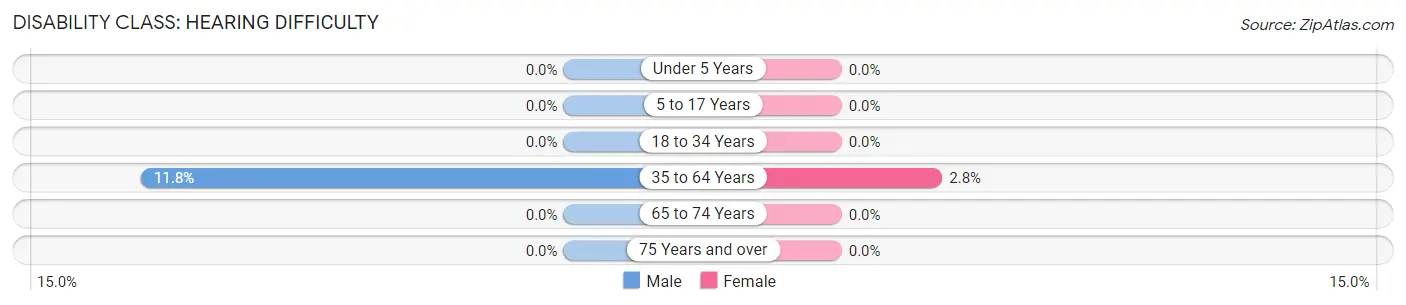
| Age Bracket | Male | Female |
| Under 5 Years | 0 (0.0%) | 0 (0.0%) |
| 5 to 17 Years | 0 (0.0%) | 0 (0.0%) |
| 18 to 34 Years | 0 (0.0%) | 0 (0.0%) |
| 35 to 64 Years | 20 (11.8%) | 4 (2.8%) |
| 65 to 74 Years | 0 (0.0%) | 0 (0.0%) |
| 75 Years and over | 0 (0.0%) | 0 (0.0%) |
Disability Class: Vision Difficulty
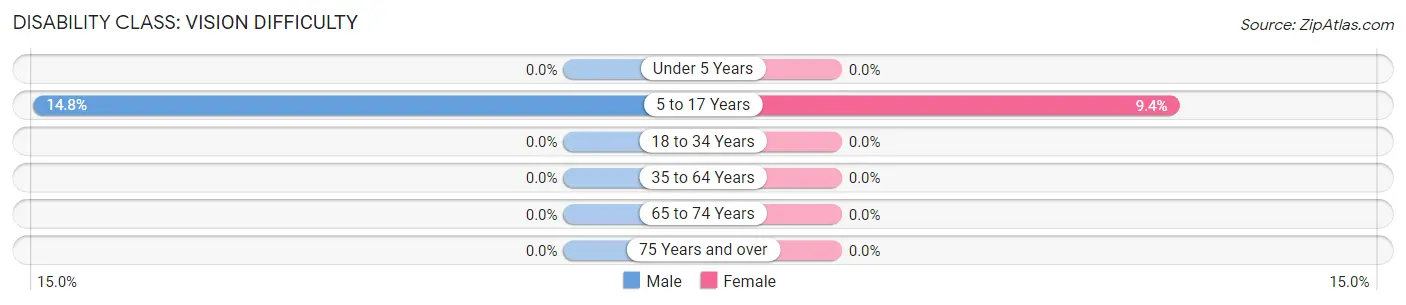
| Age Bracket | Male | Female |
| Under 5 Years | 0 (0.0%) | 0 (0.0%) |
| 5 to 17 Years | 9 (14.7%) | 11 (9.4%) |
| 18 to 34 Years | 0 (0.0%) | 0 (0.0%) |
| 35 to 64 Years | 0 (0.0%) | 0 (0.0%) |
| 65 to 74 Years | 0 (0.0%) | 0 (0.0%) |
| 75 Years and over | 0 (0.0%) | 0 (0.0%) |
Disability Class: Cognitive Difficulty
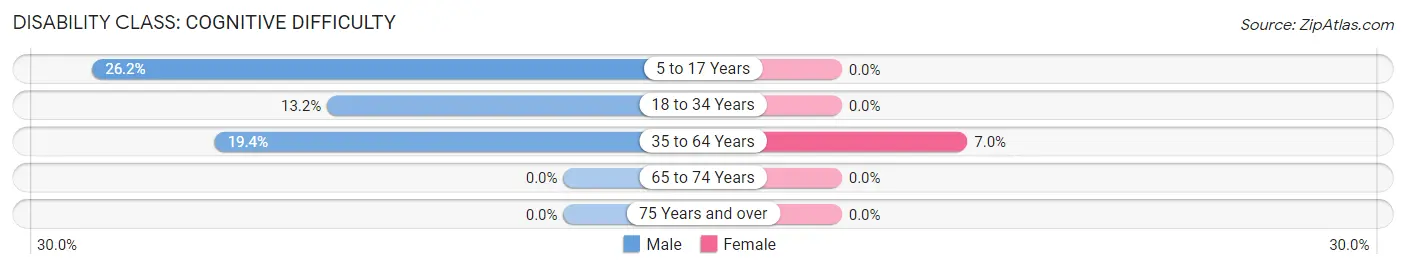
| Age Bracket | Male | Female |
| 5 to 17 Years | 16 (26.2%) | 0 (0.0%) |
| 18 to 34 Years | 10 (13.2%) | 0 (0.0%) |
| 35 to 64 Years | 33 (19.4%) | 10 (7.0%) |
| 65 to 74 Years | 0 (0.0%) | 0 (0.0%) |
| 75 Years and over | 0 (0.0%) | 0 (0.0%) |
Disability Class: Ambulatory Difficulty
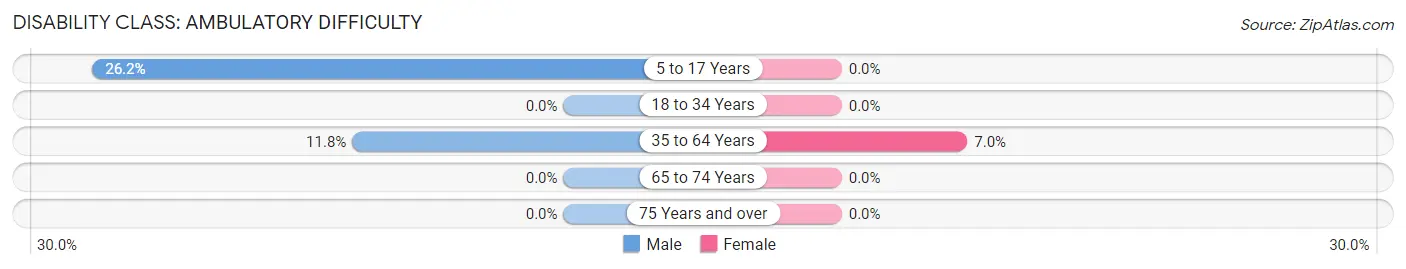
| Age Bracket | Male | Female |
| 5 to 17 Years | 16 (26.2%) | 0 (0.0%) |
| 18 to 34 Years | 0 (0.0%) | 0 (0.0%) |
| 35 to 64 Years | 20 (11.8%) | 10 (7.0%) |
| 65 to 74 Years | 0 (0.0%) | 0 (0.0%) |
| 75 Years and over | 0 (0.0%) | 0 (0.0%) |
Disability Class: Self-Care Difficulty
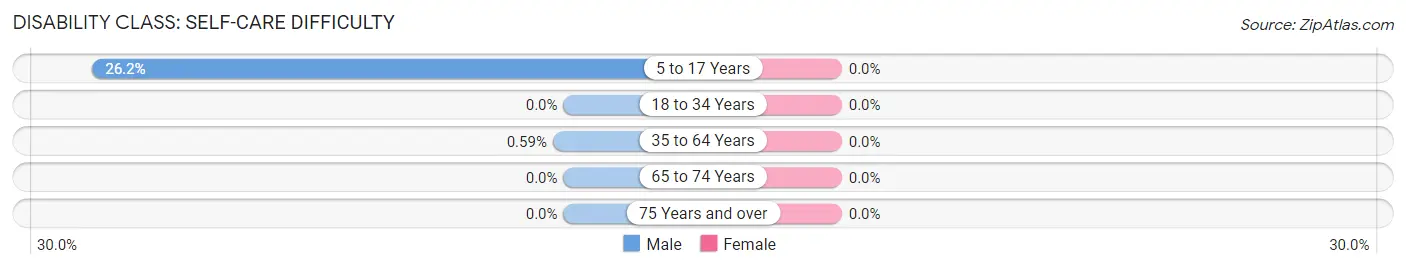
| Age Bracket | Male | Female |
| 5 to 17 Years | 16 (26.2%) | 0 (0.0%) |
| 18 to 34 Years | 0 (0.0%) | 0 (0.0%) |
| 35 to 64 Years | 1 (0.6%) | 0 (0.0%) |
| 65 to 74 Years | 0 (0.0%) | 0 (0.0%) |
| 75 Years and over | 0 (0.0%) | 0 (0.0%) |
Technology Access in Grand View Estates
Computing Device Access in Grand View Estates
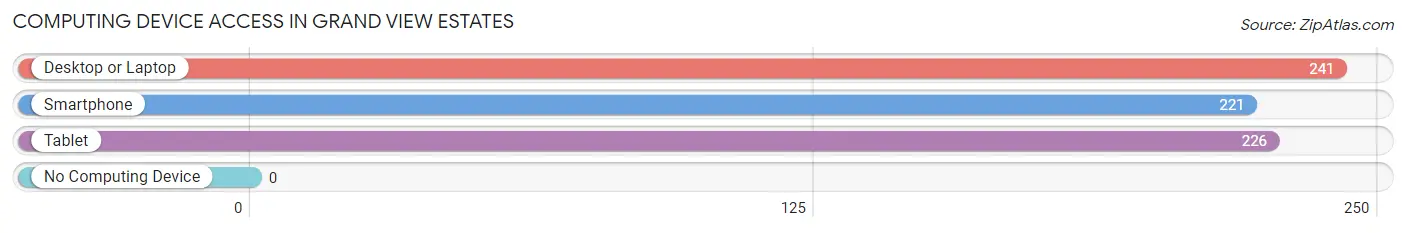
| Device Type | # Households | % Households |
| Desktop or Laptop | 241 | 100.0% |
| Smartphone | 221 | 91.7% |
| Tablet | 226 | 93.8% |
| No Computing Device | 0 | 0.0% |
| Total | 241 | 100.0% |
Internet Access in Grand View Estates
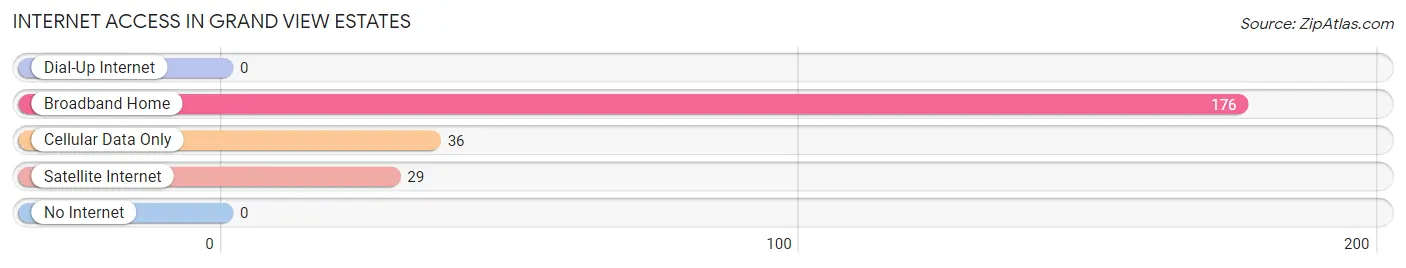
| Internet Type | # Households | % Households |
| Dial-Up Internet | 0 | 0.0% |
| Broadband Home | 176 | 73.0% |
| Cellular Data Only | 36 | 14.9% |
| Satellite Internet | 29 | 12.0% |
| No Internet | 0 | 0.0% |
| Total | 241 | 100.0% |
Grand View Estates Summary
Geography
Grand View Estates is a small, unincorporated community located in the foothills of the Rocky Mountains in Jefferson County, Colorado. The community is situated at an elevation of 8,000 feet, and is surrounded by the majestic peaks of the Front Range. The area is characterized by rolling hills, lush meadows, and dense forests of pine and aspen. The community is located approximately 25 miles west of Denver, and is accessible via Highway 285.
History
Grand View Estates was founded in the late 1800s by a group of settlers who were drawn to the area by its stunning natural beauty. The settlers built a small community, and the area quickly became known for its picturesque views of the Rocky Mountains. The community was officially incorporated in the early 1900s, and the population began to grow. In the 1950s, the area was developed into a residential community, and the population continued to grow. Today, Grand View Estates is a small, rural community with a population of approximately 500 people.
Economy
Grand View Estates is a small, rural community with a limited economy. The majority of the population is employed in the service sector, with many residents working in the tourism industry. The area is home to several small businesses, including restaurants, retail stores, and a local winery. The community also has a small agricultural sector, with many residents growing vegetables and raising livestock.
Demographics
As of the 2010 census, the population of Grand View Estates was 498. The racial makeup of the community was 97.2% White, 0.2% African American, 0.4% Native American, 0.6% Asian, 0.2% Pacific Islander, and 1.4% from other races. The median household income was $50,000, and the median age was 44. The majority of the population was married, with 57.2% of households having two or more people.
Conclusion
Grand View Estates is a small, rural community located in the foothills of the Rocky Mountains in Jefferson County, Colorado. The area is characterized by its stunning natural beauty, and is home to a population of approximately 500 people. The economy of the community is largely based on the service sector, with many residents employed in the tourism industry. The population is predominantly White, with a median household income of $50,000 and a median age of 44.
Common Questions
What is Per Capita Income in Grand View Estates?
Per Capita income in Grand View Estates is $52,437.
What is the Median Family Income in Grand View Estates?
Median Family Income in Grand View Estates is $169,167.
What is the Median Household income in Grand View Estates?
Median Household Income in Grand View Estates is $144,583.
What is Inequality or Gini Index in Grand View Estates?
Inequality or Gini Index in Grand View Estates is 0.32.
What is the Total Population of Grand View Estates?
Total Population of Grand View Estates is 788.
What is the Total Male Population of Grand View Estates?
Total Male Population of Grand View Estates is 396.
What is the Total Female Population of Grand View Estates?
Total Female Population of Grand View Estates is 392.
What is the Ratio of Males per 100 Females in Grand View Estates?
There are 101.02 Males per 100 Females in Grand View Estates.
What is the Ratio of Females per 100 Males in Grand View Estates?
There are 98.99 Females per 100 Males in Grand View Estates.
What is the Median Population Age in Grand View Estates?
Median Population Age in Grand View Estates is 47.3 Years.
What is the Average Family Size in Grand View Estates
Average Family Size in Grand View Estates is 3.1 People.
What is the Average Household Size in Grand View Estates
Average Household Size in Grand View Estates is 3.2 People.
How Large is the Labor Force in Grand View Estates?
There are 473 People in the Labor Forcein in Grand View Estates.
What is the Percentage of People in the Labor Force in Grand View Estates?
74.0% of People are in the Labor Force in Grand View Estates.
What is the Unemployment Rate in Grand View Estates?
Unemployment Rate in Grand View Estates is 4.4%.