Columbine, CO Map & Demographics
Columbine Map
Columbine Overview
$54,175
PER CAPITA INCOME
$133,622
AVG FAMILY INCOME
$122,048
AVG HOUSEHOLD INCOME
33.9%
WAGE / INCOME GAP [ % ]
66.1¢/ $1
WAGE / INCOME GAP [ $ ]
$10,582
FAMILY INCOME DEFICIT
0.38
INEQUALITY / GINI INDEX
25,940
TOTAL POPULATION
12,797
MALE POPULATION
13,143
FEMALE POPULATION
97.37
MALES / 100 FEMALES
102.70
FEMALES / 100 MALES
41.0
MEDIAN AGE
3.0
AVG FAMILY SIZE
2.7
AVG HOUSEHOLD SIZE
13,692
LABOR FORCE [ PEOPLE ]
66.8%
PERCENT IN LABOR FORCE
3.6%
UNEMPLOYMENT RATE
Income in Columbine
Income Overview in Columbine
Per Capita Income in Columbine is $54,175, while median incomes of families and households are $133,622 and $122,048 respectively.
| Characteristic | Number | Measure |
| Per Capita Income | 25,940 | $54,175 |
| Median Family Income | 7,536 | $133,622 |
| Mean Family Income | 7,536 | $154,482 |
| Median Household Income | 9,654 | $122,048 |
| Mean Household Income | 9,654 | $143,881 |
| Income Deficit | 7,536 | $10,582 |
| Wage / Income Gap (%) | 25,940 | 33.94% |
| Wage / Income Gap ($) | 25,940 | 66.06¢ per $1 |
| Gini / Inequality Index | 25,940 | 0.38 |
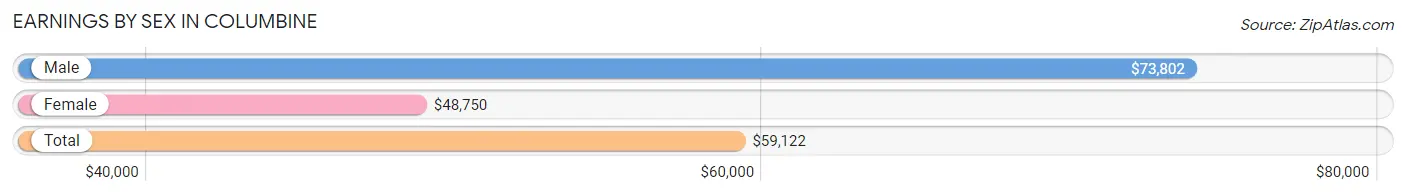
Earnings by Sex in Columbine
Average Earnings in Columbine are $59,122, $73,802 for men and $48,750 for women, a difference of 33.9%.
| Sex | Number | Average Earnings |
| Male | 7,556 (52.9%) | $73,802 |
| Female | 6,713 (47.0%) | $48,750 |
| Total | 14,269 (100.0%) | $59,122 |
Earnings by Sex by Income Bracket in Columbine
The most common earnings brackets in Columbine are $100,000+ for men (2,492 | 33.0%) and $100,000+ for women (1,203 | 17.9%).
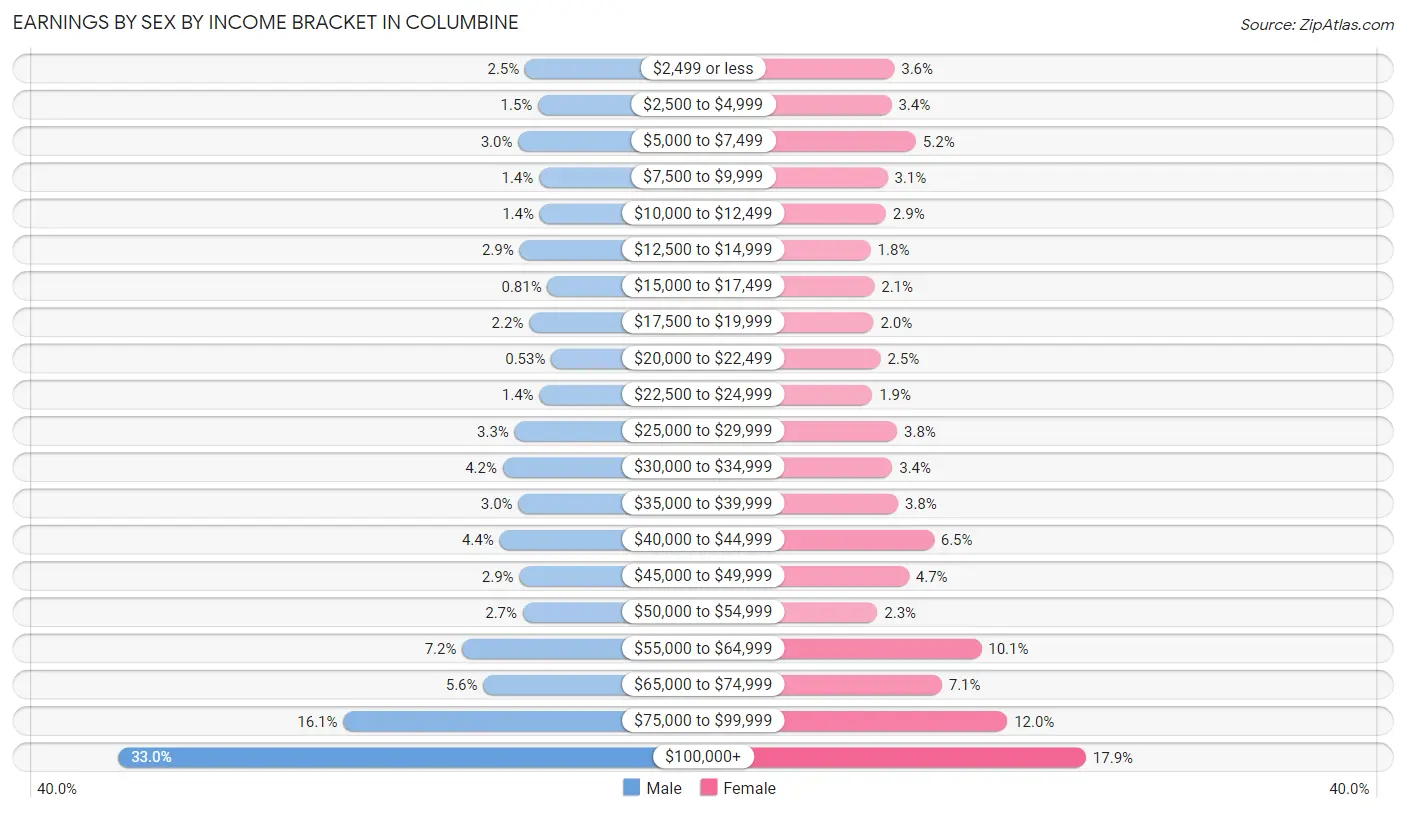
| Income | Male | Female |
| $2,499 or less | 188 (2.5%) | 239 (3.6%) |
| $2,500 to $4,999 | 114 (1.5%) | 225 (3.4%) |
| $5,000 to $7,499 | 227 (3.0%) | 348 (5.2%) |
| $7,500 to $9,999 | 109 (1.4%) | 205 (3.0%) |
| $10,000 to $12,499 | 105 (1.4%) | 197 (2.9%) |
| $12,500 to $14,999 | 220 (2.9%) | 120 (1.8%) |
| $15,000 to $17,499 | 61 (0.8%) | 138 (2.1%) |
| $17,500 to $19,999 | 165 (2.2%) | 134 (2.0%) |
| $20,000 to $22,499 | 40 (0.5%) | 170 (2.5%) |
| $22,500 to $24,999 | 107 (1.4%) | 128 (1.9%) |
| $25,000 to $29,999 | 247 (3.3%) | 253 (3.8%) |
| $30,000 to $34,999 | 314 (4.2%) | 229 (3.4%) |
| $35,000 to $39,999 | 226 (3.0%) | 258 (3.8%) |
| $40,000 to $44,999 | 333 (4.4%) | 438 (6.5%) |
| $45,000 to $49,999 | 221 (2.9%) | 312 (4.6%) |
| $50,000 to $54,999 | 201 (2.7%) | 154 (2.3%) |
| $55,000 to $64,999 | 544 (7.2%) | 677 (10.1%) |
| $65,000 to $74,999 | 425 (5.6%) | 478 (7.1%) |
| $75,000 to $99,999 | 1,217 (16.1%) | 807 (12.0%) |
| $100,000+ | 2,492 (33.0%) | 1,203 (17.9%) |
| Total | 7,556 (100.0%) | 6,713 (100.0%) |
Earnings by Sex by Educational Attainment in Columbine
Average earnings in Columbine are $83,596 for men and $56,538 for women, a difference of 32.4%. Men with an educational attainment of graduate degree enjoy the highest average annual earnings of $117,797, while those with less than high school education earn the least with $54,732. Women with an educational attainment of graduate degree earn the most with the average annual earnings of $80,850, while those with high school diploma education have the smallest earnings of $37,566.
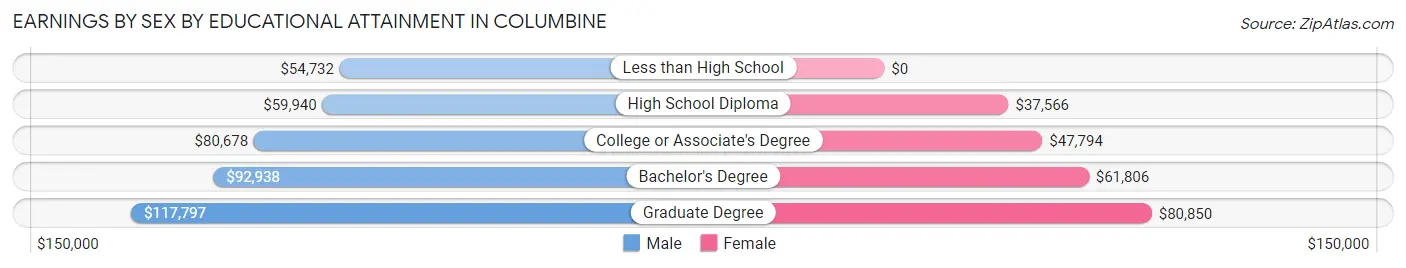
| Educational Attainment | Male Income | Female Income |
| Less than High School | $54,732 | $0 |
| High School Diploma | $59,940 | $37,566 |
| College or Associate's Degree | $80,678 | $47,794 |
| Bachelor's Degree | $92,938 | $61,806 |
| Graduate Degree | $117,797 | $80,850 |
| Total | $83,596 | $56,538 |
Family Income in Columbine
Family Income Brackets in Columbine
According to the Columbine family income data, there are 1,929 families falling into the $100,000 to $149,999 income range, which is the most common income bracket and makes up 25.6% of all families. Conversely, the $25,000 to $34,999 income bracket is the least frequent group with only 75 families (1.0%) belonging to this category.
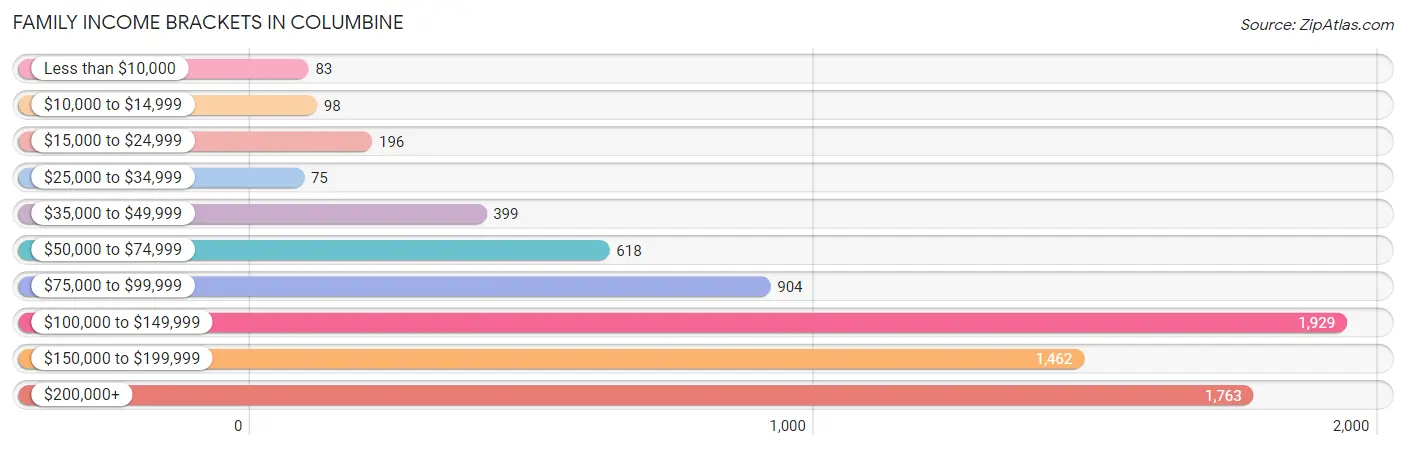
| Income Bracket | # Families | % Families |
| Less than $10,000 | 83 | 1.1% |
| $10,000 to $14,999 | 98 | 1.3% |
| $15,000 to $24,999 | 196 | 2.6% |
| $25,000 to $34,999 | 75 | 1.0% |
| $35,000 to $49,999 | 399 | 5.3% |
| $50,000 to $74,999 | 618 | 8.2% |
| $75,000 to $99,999 | 904 | 12.0% |
| $100,000 to $149,999 | 1,929 | 25.6% |
| $150,000 to $199,999 | 1,462 | 19.4% |
| $200,000+ | 1,763 | 23.4% |
Family Income by Famaliy Size in Columbine
4-person families (1,228 | 16.3%) account for the highest median family income in Columbine with $179,545 per family, while 2-person families (3,626 | 48.1%) have the highest median income of $57,429 per family member.
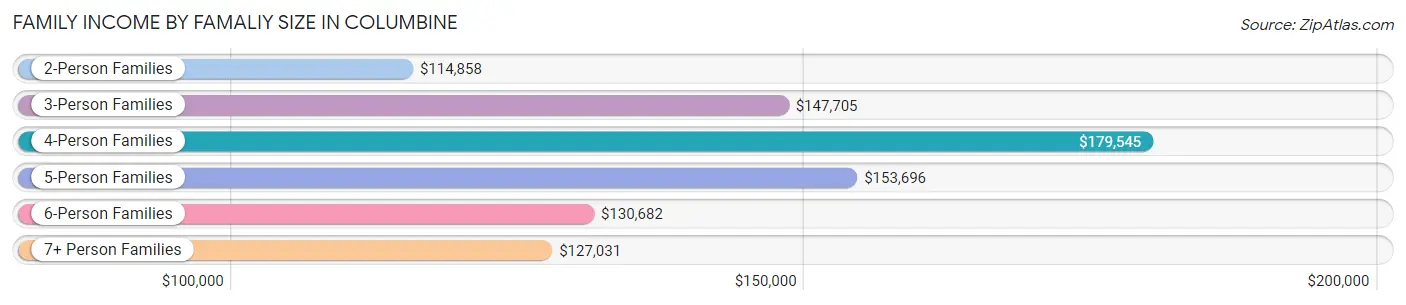
| Income Bracket | # Families | Median Income |
| 2-Person Families | 3,626 (48.1%) | $114,858 |
| 3-Person Families | 1,947 (25.8%) | $147,705 |
| 4-Person Families | 1,228 (16.3%) | $179,545 |
| 5-Person Families | 356 (4.7%) | $153,696 |
| 6-Person Families | 290 (3.8%) | $130,682 |
| 7+ Person Families | 89 (1.2%) | $127,031 |
| Total | 7,536 (100.0%) | $133,622 |
Family Income by Number of Earners in Columbine
The median family income in Columbine is $133,622, with families comprising 3+ earners (1,022) having the highest median family income of $192,421, while families with no earners (1,253) have the lowest median family income of $70,739, accounting for 13.6% and 16.6% of families, respectively.
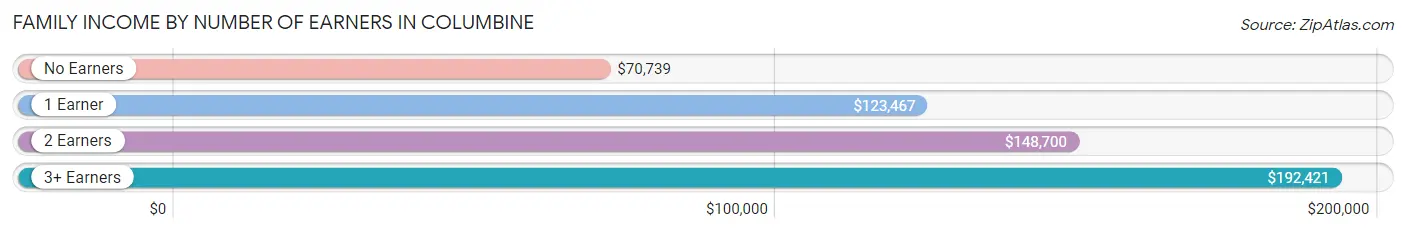
| Number of Earners | # Families | Median Income |
| No Earners | 1,253 (16.6%) | $70,739 |
| 1 Earner | 2,099 (27.9%) | $123,467 |
| 2 Earners | 3,162 (42.0%) | $148,700 |
| 3+ Earners | 1,022 (13.6%) | $192,421 |
| Total | 7,536 (100.0%) | $133,622 |
Household Income in Columbine
Household Income Brackets in Columbine
With 2,414 households falling in the category, the $100,000 to $149,999 income range is the most frequent in Columbine, accounting for 25.0% of all households. In contrast, only 135 households (1.4%) fall into the $10,000 to $14,999 income bracket, making it the least populous group.
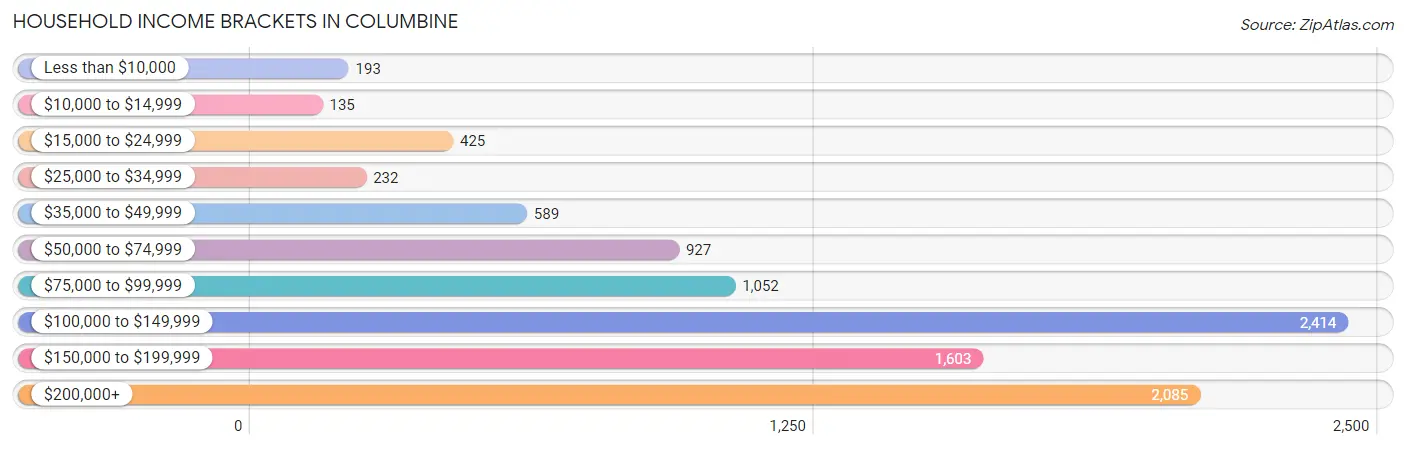
| Income Bracket | # Households | % Households |
| Less than $10,000 | 193 | 2.0% |
| $10,000 to $14,999 | 135 | 1.4% |
| $15,000 to $24,999 | 425 | 4.4% |
| $25,000 to $34,999 | 232 | 2.4% |
| $35,000 to $49,999 | 589 | 6.1% |
| $50,000 to $74,999 | 927 | 9.6% |
| $75,000 to $99,999 | 1,052 | 10.9% |
| $100,000 to $149,999 | 2,414 | 25.0% |
| $150,000 to $199,999 | 1,603 | 16.6% |
| $200,000+ | 2,085 | 21.6% |
Household Income by Householder Age in Columbine
The median household income in Columbine is $122,048, with the highest median household income of $153,105 found in the 45 to 64 years age bracket for the primary householder. A total of 3,487 households (36.1%) fall into this category. Meanwhile, the 15 to 24 years age bracket for the primary householder has the lowest median household income of $0, with 102 households (1.1%) in this group.
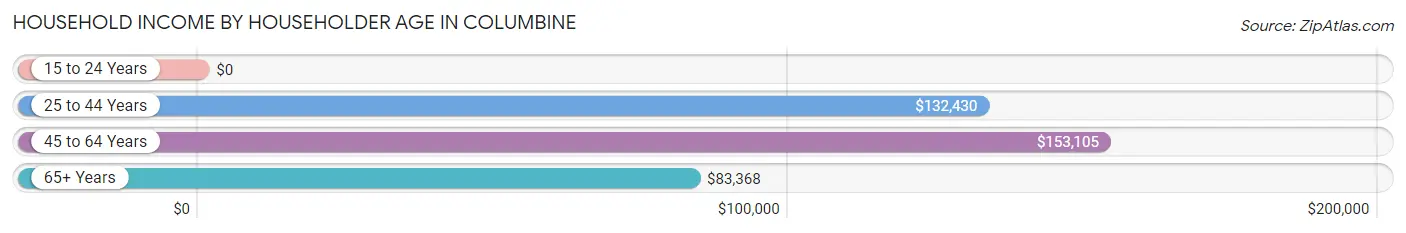
| Income Bracket | # Households | Median Income |
| 15 to 24 Years | 102 (1.1%) | $0 |
| 25 to 44 Years | 2,890 (29.9%) | $132,430 |
| 45 to 64 Years | 3,487 (36.1%) | $153,105 |
| 65+ Years | 3,175 (32.9%) | $83,368 |
| Total | 9,654 (100.0%) | $122,048 |
Poverty in Columbine
Income Below Poverty by Sex and Age in Columbine
With 4.6% poverty level for males and 7.9% for females among the residents of Columbine, under 5 year old males and 15 year old females are the most vulnerable to poverty, with 81 males (9.9%) and 69 females (32.7%) in their respective age groups living below the poverty level.
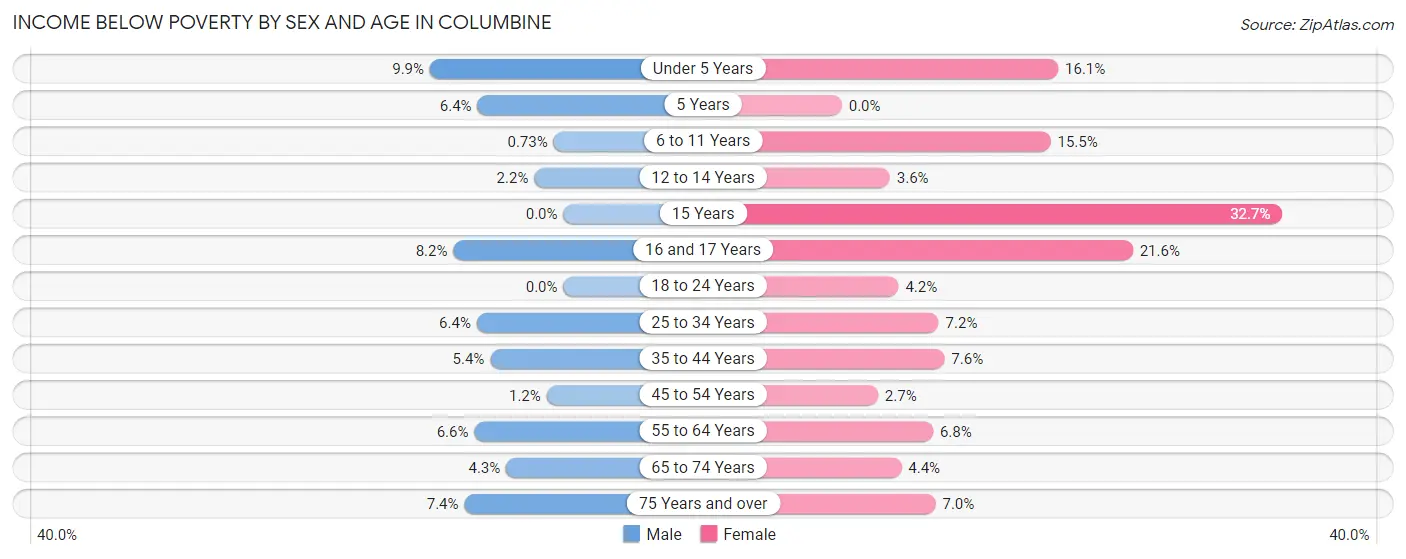
| Age Bracket | Male | Female |
| Under 5 Years | 81 (9.9%) | 128 (16.1%) |
| 5 Years | 9 (6.4%) | 0 (0.0%) |
| 6 to 11 Years | 9 (0.7%) | 142 (15.5%) |
| 12 to 14 Years | 8 (2.2%) | 20 (3.6%) |
| 15 Years | 0 (0.0%) | 69 (32.7%) |
| 16 and 17 Years | 25 (8.2%) | 89 (21.6%) |
| 18 to 24 Years | 0 (0.0%) | 32 (4.2%) |
| 25 to 34 Years | 93 (6.4%) | 111 (7.2%) |
| 35 to 44 Years | 100 (5.4%) | 139 (7.6%) |
| 45 to 54 Years | 20 (1.2%) | 44 (2.7%) |
| 55 to 64 Years | 113 (6.6%) | 109 (6.8%) |
| 65 to 74 Years | 57 (4.3%) | 71 (4.4%) |
| 75 Years and over | 68 (7.3%) | 79 (7.0%) |
| Total | 583 (4.6%) | 1,033 (7.9%) |
Income Above Poverty by Sex and Age in Columbine
According to the poverty statistics in Columbine, males aged 15 years and females aged 5 years are the age groups that are most secure financially, with 100.0% of males and 100.0% of females in these age groups living above the poverty line.
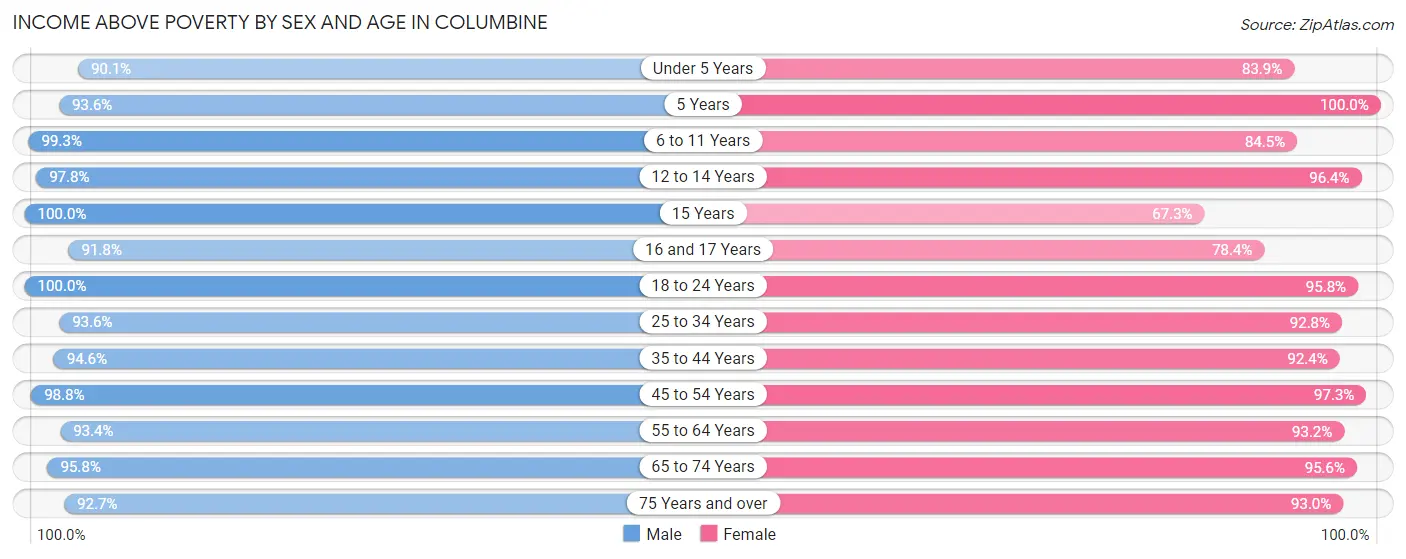
| Age Bracket | Male | Female |
| Under 5 Years | 736 (90.1%) | 669 (83.9%) |
| 5 Years | 132 (93.6%) | 101 (100.0%) |
| 6 to 11 Years | 1,226 (99.3%) | 774 (84.5%) |
| 12 to 14 Years | 362 (97.8%) | 541 (96.4%) |
| 15 Years | 276 (100.0%) | 142 (67.3%) |
| 16 and 17 Years | 281 (91.8%) | 323 (78.4%) |
| 18 to 24 Years | 751 (100.0%) | 728 (95.8%) |
| 25 to 34 Years | 1,353 (93.6%) | 1,433 (92.8%) |
| 35 to 44 Years | 1,743 (94.6%) | 1,685 (92.4%) |
| 45 to 54 Years | 1,595 (98.8%) | 1,595 (97.3%) |
| 55 to 64 Years | 1,597 (93.4%) | 1,502 (93.2%) |
| 65 to 74 Years | 1,284 (95.8%) | 1,535 (95.6%) |
| 75 Years and over | 857 (92.6%) | 1,056 (93.0%) |
| Total | 12,193 (95.4%) | 12,084 (92.1%) |
Income Below Poverty Among Married-Couple Families in Columbine
The poverty statistics for married-couple families in Columbine show that 1.7% or 102 of the total 6,100 families live below the poverty line. Families with 3 or 4 children have the highest poverty rate of 5.1%, comprising of 21 families. On the other hand, families with 1 or 2 children have the lowest poverty rate of 0.0%, which includes 0 families.
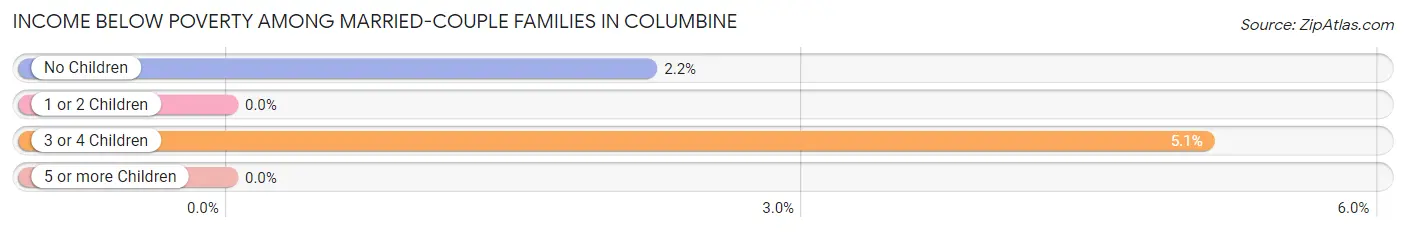
| Children | Above Poverty | Below Poverty |
| No Children | 3,625 (97.8%) | 81 (2.2%) |
| 1 or 2 Children | 1,920 (100.0%) | 0 (0.0%) |
| 3 or 4 Children | 391 (94.9%) | 21 (5.1%) |
| 5 or more Children | 62 (100.0%) | 0 (0.0%) |
| Total | 5,998 (98.3%) | 102 (1.7%) |
Income Below Poverty Among Single-Parent Households in Columbine
According to the poverty data in Columbine, 21.9% or 159 single-father households and 9.1% or 65 single-mother households are living below the poverty line. Among single-father households, those with 3 or 4 children have the highest poverty rate, with 57 households (67.9%) experiencing poverty. Likewise, among single-mother households, those with 1 or 2 children have the highest poverty rate, with 48 households (14.0%) falling below the poverty line.
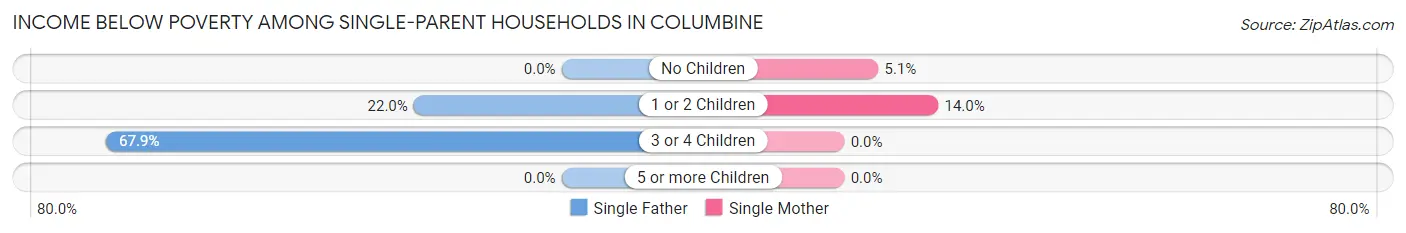
| Children | Single Father | Single Mother |
| No Children | 0 (0.0%) | 17 (5.1%) |
| 1 or 2 Children | 102 (22.0%) | 48 (14.0%) |
| 3 or 4 Children | 57 (67.9%) | 0 (0.0%) |
| 5 or more Children | 0 (0.0%) | 0 (0.0%) |
| Total | 159 (21.9%) | 65 (9.1%) |
Income Below Poverty Among Married-Couple vs Single-Parent Households in Columbine
The poverty data for Columbine shows that 102 of the married-couple family households (1.7%) and 224 of the single-parent households (15.6%) are living below the poverty level. Within the married-couple family households, those with 3 or 4 children have the highest poverty rate, with 21 households (5.1%) falling below the poverty line. Among the single-parent households, those with 3 or 4 children have the highest poverty rate, with 57 household (49.6%) living below poverty.
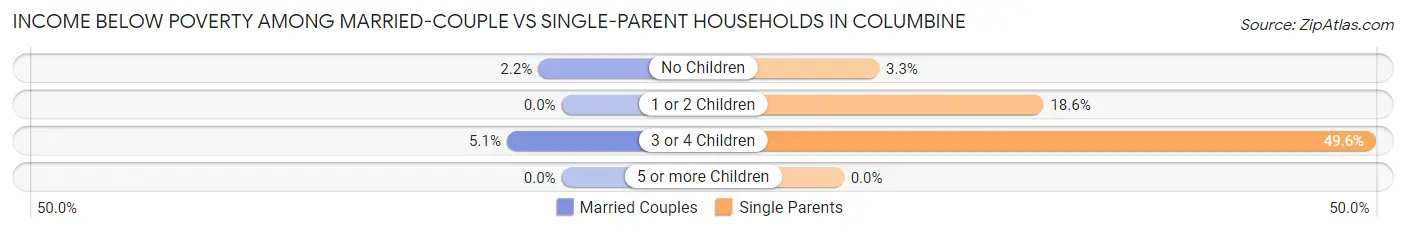
| Children | Married-Couple Families | Single-Parent Households |
| No Children | 81 (2.2%) | 17 (3.3%) |
| 1 or 2 Children | 0 (0.0%) | 150 (18.6%) |
| 3 or 4 Children | 21 (5.1%) | 57 (49.6%) |
| 5 or more Children | 0 (0.0%) | 0 (0.0%) |
| Total | 102 (1.7%) | 224 (15.6%) |
Race in Columbine
The most populous races in Columbine are White / Caucasian (23,007 | 88.7%), Hispanic or Latino (2,687 | 10.4%), and Two or more Races (1,550 | 6.0%).
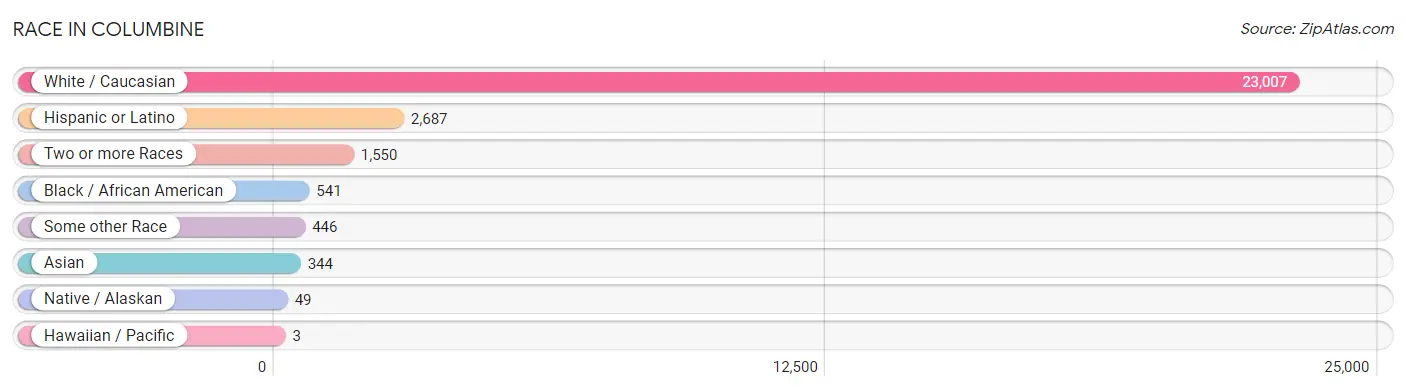
| Race | # Population | % Population |
| Asian | 344 | 1.3% |
| Black / African American | 541 | 2.1% |
| Hawaiian / Pacific | 3 | 0.0% |
| Hispanic or Latino | 2,687 | 10.4% |
| Native / Alaskan | 49 | 0.2% |
| White / Caucasian | 23,007 | 88.7% |
| Two or more Races | 1,550 | 6.0% |
| Some other Race | 446 | 1.7% |
| Total | 25,940 | 100.0% |
Ancestry in Columbine
The most populous ancestries reported in Columbine are German (7,075 | 27.3%), English (4,875 | 18.8%), Irish (3,983 | 15.3%), Mexican (1,843 | 7.1%), and Italian (1,357 | 5.2%), together accounting for 73.7% of all Columbine residents.
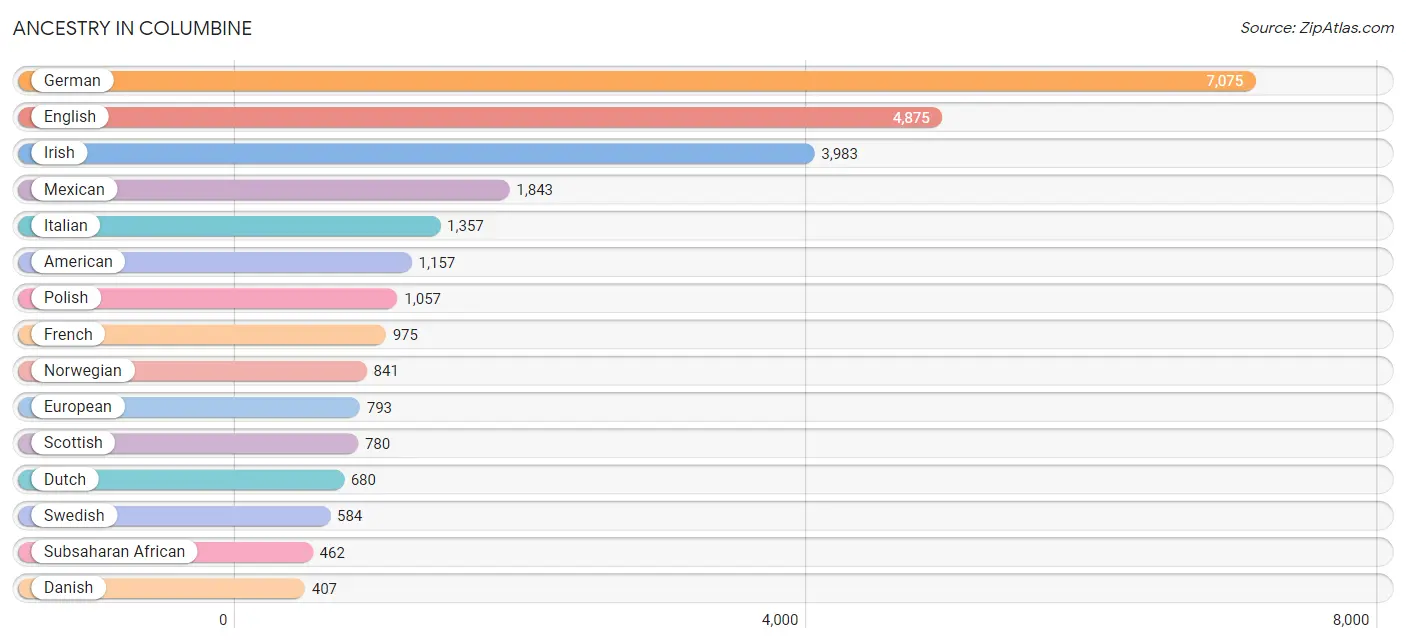
| Ancestry | # Population | % Population |
| African | 10 | 0.0% |
| American | 1,157 | 4.5% |
| Apache | 2 | 0.0% |
| Arab | 35 | 0.1% |
| Arapaho | 15 | 0.1% |
| Argentinean | 10 | 0.0% |
| Armenian | 23 | 0.1% |
| Assyrian / Chaldean / Syriac | 10 | 0.0% |
| Australian | 16 | 0.1% |
| Austrian | 104 | 0.4% |
| Belgian | 17 | 0.1% |
| Bhutanese | 94 | 0.4% |
| Bolivian | 19 | 0.1% |
| British | 285 | 1.1% |
| Burmese | 86 | 0.3% |
| Canadian | 36 | 0.1% |
| Central American | 104 | 0.4% |
| Cherokee | 23 | 0.1% |
| Choctaw | 3 | 0.0% |
| Comanche | 9 | 0.0% |
| Creek | 10 | 0.0% |
| Croatian | 18 | 0.1% |
| Czech | 217 | 0.8% |
| Czechoslovakian | 9 | 0.0% |
| Danish | 407 | 1.6% |
| Dutch | 680 | 2.6% |
| Eastern European | 22 | 0.1% |
| Ecuadorian | 28 | 0.1% |
| English | 4,875 | 18.8% |
| European | 793 | 3.1% |
| Filipino | 22 | 0.1% |
| Finnish | 27 | 0.1% |
| French | 975 | 3.8% |
| French Canadian | 252 | 1.0% |
| German | 7,075 | 27.3% |
| Ghanaian | 397 | 1.5% |
| Greek | 130 | 0.5% |
| Hungarian | 128 | 0.5% |
| Icelander | 17 | 0.1% |
| Indian (Asian) | 117 | 0.4% |
| Iranian | 9 | 0.0% |
| Irish | 3,983 | 15.3% |
| Italian | 1,357 | 5.2% |
| Japanese | 10 | 0.0% |
| Korean | 92 | 0.4% |
| Laotian | 33 | 0.1% |
| Latvian | 24 | 0.1% |
| Lebanese | 9 | 0.0% |
| Lithuanian | 25 | 0.1% |
| Maltese | 10 | 0.0% |
| Mexican | 1,843 | 7.1% |
| Native Hawaiian | 18 | 0.1% |
| Nicaraguan | 10 | 0.0% |
| Northern European | 60 | 0.2% |
| Norwegian | 841 | 3.2% |
| Pakistani | 45 | 0.2% |
| Panamanian | 36 | 0.1% |
| Peruvian | 27 | 0.1% |
| Polish | 1,057 | 4.1% |
| Portuguese | 45 | 0.2% |
| Puerto Rican | 7 | 0.0% |
| Romanian | 146 | 0.6% |
| Russian | 206 | 0.8% |
| Salvadoran | 58 | 0.2% |
| Scandinavian | 152 | 0.6% |
| Scotch-Irish | 339 | 1.3% |
| Scottish | 780 | 3.0% |
| Serbian | 13 | 0.1% |
| Sioux | 31 | 0.1% |
| Slavic | 7 | 0.0% |
| Slovak | 30 | 0.1% |
| Slovene | 61 | 0.2% |
| South American | 84 | 0.3% |
| Spaniard | 238 | 0.9% |
| Spanish | 350 | 1.3% |
| Sri Lankan | 72 | 0.3% |
| Subsaharan African | 462 | 1.8% |
| Swedish | 584 | 2.2% |
| Swiss | 47 | 0.2% |
| Ukrainian | 88 | 0.3% |
| Welsh | 235 | 0.9% |
| Yugoslavian | 24 | 0.1% |
| Yuman | 15 | 0.1% | View All 83 Rows |
Immigrants in Columbine
The most numerous immigrant groups reported in Columbine came from Europe (353 | 1.4%), Africa (235 | 0.9%), Ghana (235 | 0.9%), Western Africa (235 | 0.9%), and Asia (214 | 0.8%), together accounting for 4.9% of all Columbine residents.
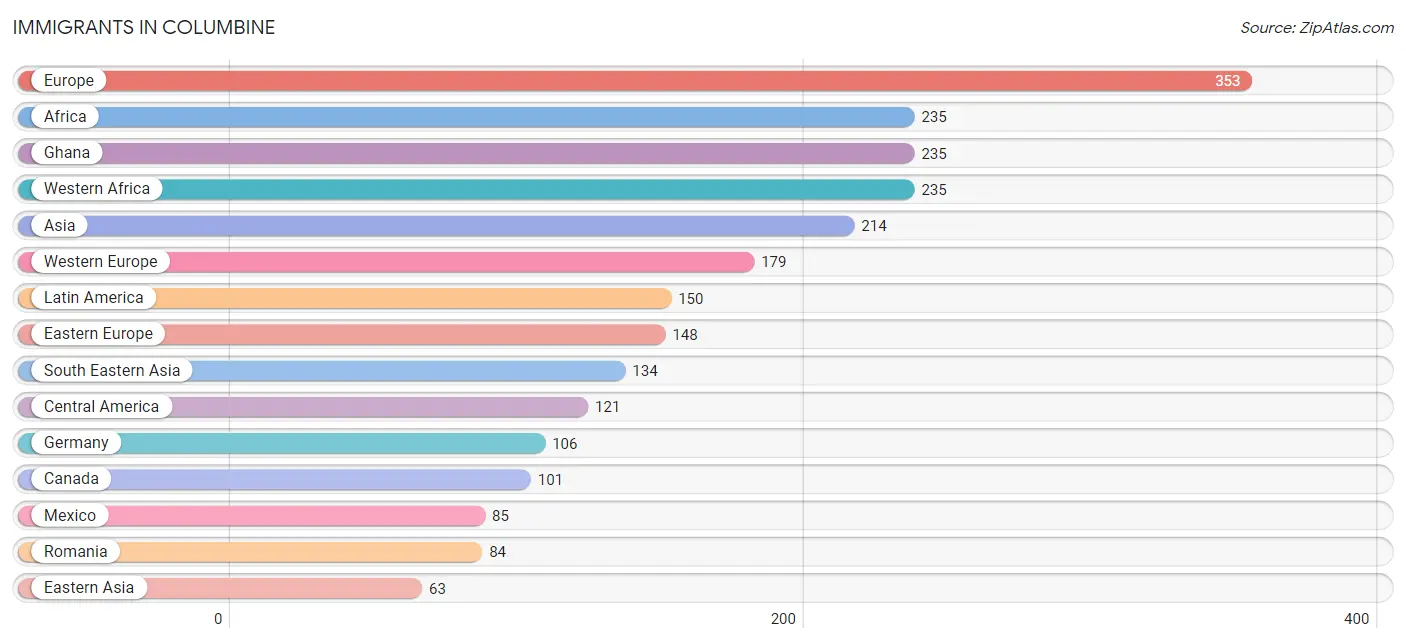
| Immigration Origin | # Population | % Population |
| Africa | 235 | 0.9% |
| Argentina | 10 | 0.0% |
| Asia | 214 | 0.8% |
| Australia | 19 | 0.1% |
| Austria | 16 | 0.1% |
| Bolivia | 19 | 0.1% |
| Cambodia | 2 | 0.0% |
| Canada | 101 | 0.4% |
| Central America | 121 | 0.5% |
| China | 43 | 0.2% |
| Czechoslovakia | 34 | 0.1% |
| Eastern Asia | 63 | 0.2% |
| Eastern Europe | 148 | 0.6% |
| El Salvador | 26 | 0.1% |
| England | 5 | 0.0% |
| Europe | 353 | 1.4% |
| France | 57 | 0.2% |
| Germany | 106 | 0.4% |
| Ghana | 235 | 0.9% |
| Hungary | 14 | 0.1% |
| Indonesia | 16 | 0.1% |
| Iran | 9 | 0.0% |
| Italy | 12 | 0.1% |
| Japan | 7 | 0.0% |
| Korea | 13 | 0.1% |
| Latin America | 150 | 0.6% |
| Mexico | 85 | 0.3% |
| Micronesia | 3 | 0.0% |
| Nicaragua | 10 | 0.0% |
| Northern Europe | 14 | 0.1% |
| Oceania | 22 | 0.1% |
| Philippines | 52 | 0.2% |
| Poland | 7 | 0.0% |
| Romania | 84 | 0.3% |
| Russia | 9 | 0.0% |
| South America | 29 | 0.1% |
| South Central Asia | 9 | 0.0% |
| South Eastern Asia | 134 | 0.5% |
| Southern Europe | 12 | 0.1% |
| Thailand | 20 | 0.1% |
| Vietnam | 44 | 0.2% |
| Western Africa | 235 | 0.9% |
| Western Asia | 8 | 0.0% |
| Western Europe | 179 | 0.7% | View All 44 Rows |
Sex and Age in Columbine
Sex and Age in Columbine
The most populous age groups in Columbine are 40 to 44 Years (1,043 | 8.2%) for men and 35 to 39 Years (1,064 | 8.1%) for women.
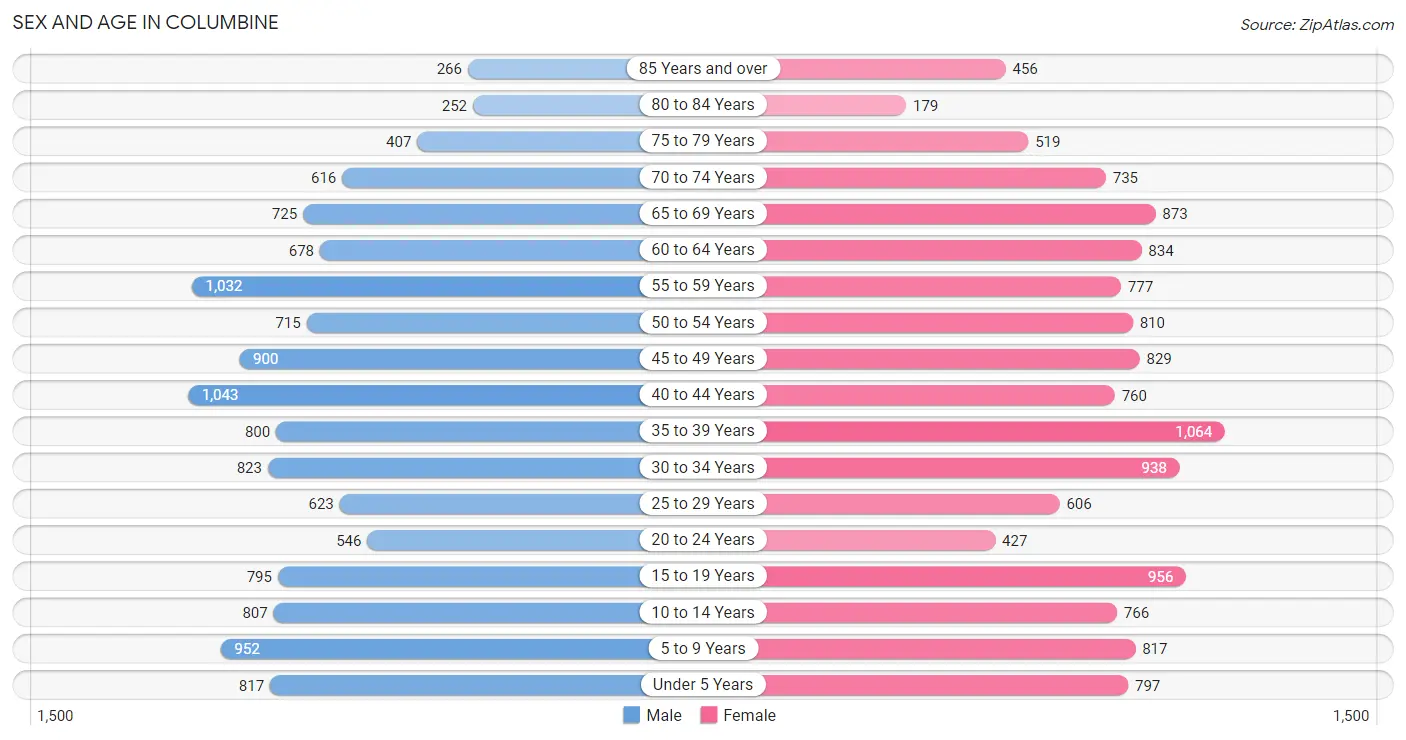
| Age Bracket | Male | Female |
| Under 5 Years | 817 (6.4%) | 797 (6.1%) |
| 5 to 9 Years | 952 (7.4%) | 817 (6.2%) |
| 10 to 14 Years | 807 (6.3%) | 766 (5.8%) |
| 15 to 19 Years | 795 (6.2%) | 956 (7.3%) |
| 20 to 24 Years | 546 (4.3%) | 427 (3.3%) |
| 25 to 29 Years | 623 (4.9%) | 606 (4.6%) |
| 30 to 34 Years | 823 (6.4%) | 938 (7.1%) |
| 35 to 39 Years | 800 (6.2%) | 1,064 (8.1%) |
| 40 to 44 Years | 1,043 (8.2%) | 760 (5.8%) |
| 45 to 49 Years | 900 (7.0%) | 829 (6.3%) |
| 50 to 54 Years | 715 (5.6%) | 810 (6.2%) |
| 55 to 59 Years | 1,032 (8.1%) | 777 (5.9%) |
| 60 to 64 Years | 678 (5.3%) | 834 (6.4%) |
| 65 to 69 Years | 725 (5.7%) | 873 (6.6%) |
| 70 to 74 Years | 616 (4.8%) | 735 (5.6%) |
| 75 to 79 Years | 407 (3.2%) | 519 (4.0%) |
| 80 to 84 Years | 252 (2.0%) | 179 (1.4%) |
| 85 Years and over | 266 (2.1%) | 456 (3.5%) |
| Total | 12,797 (100.0%) | 13,143 (100.0%) |
Families and Households in Columbine
Median Family Size in Columbine
The median family size in Columbine is 3.00 persons per family, with single female/mother families (710 | 9.4%) accounting for the largest median family size of 3.24 persons per family. On the other hand, single male/father families (726 | 9.6%) represent the smallest median family size with 2.80 persons per family.
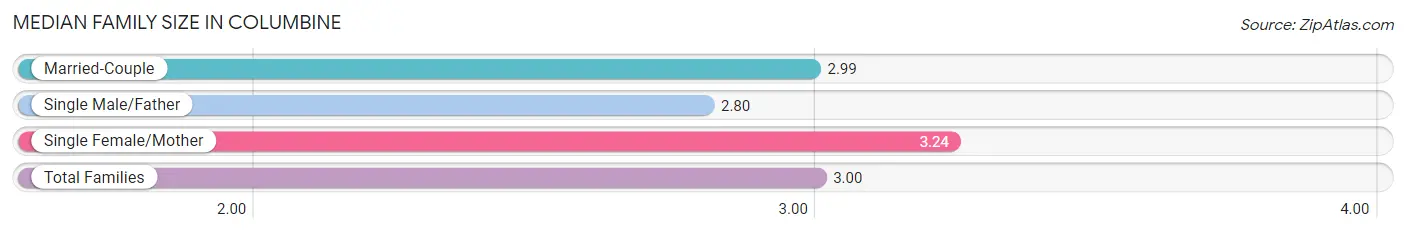
| Family Type | # Families | Family Size |
| Married-Couple | 6,100 (80.9%) | 2.99 |
| Single Male/Father | 726 (9.6%) | 2.80 |
| Single Female/Mother | 710 (9.4%) | 3.24 |
| Total Families | 7,536 (100.0%) | 3.00 |
Median Household Size in Columbine
The median household size in Columbine is 2.67 persons per household, with single female/mother households (710 | 7.3%) accounting for the largest median household size of 3.5 persons per household. non-family households (2,118 | 21.9%) represent the smallest median household size with 1.28 persons per household.
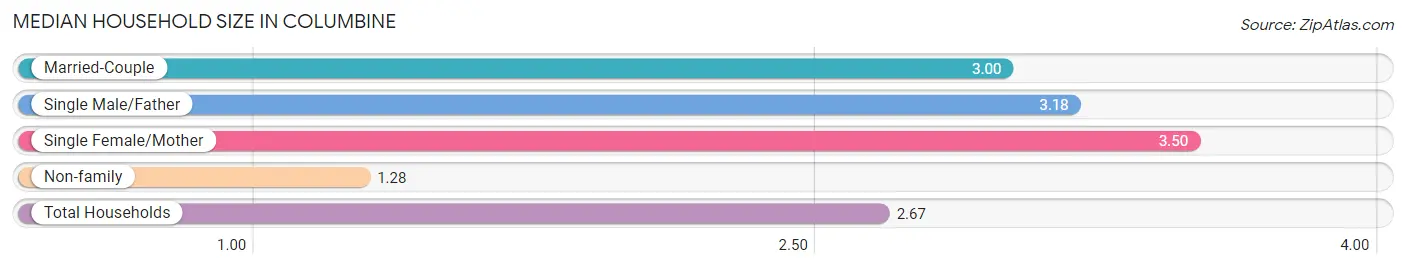
| Household Type | # Households | Household Size |
| Married-Couple | 6,100 (63.2%) | 3.00 |
| Single Male/Father | 726 (7.5%) | 3.18 |
| Single Female/Mother | 710 (7.3%) | 3.50 |
| Non-family | 2,118 (21.9%) | 1.28 |
| Total Households | 9,654 (100.0%) | 2.67 |
Household Size by Marriage Status in Columbine
Out of a total of 9,654 households in Columbine, 7,536 (78.1%) are family households, while 2,118 (21.9%) are nonfamily households. The most numerous type of family households are 2-person households, comprising 3,507, and the most common type of nonfamily households are 1-person households, comprising 1,705.
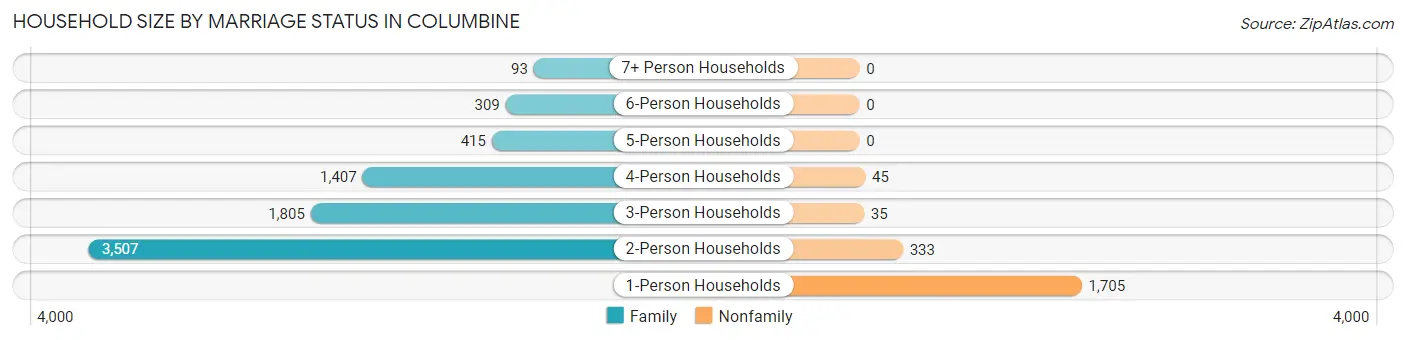
| Household Size | Family Households | Nonfamily Households |
| 1-Person Households | - | 1,705 (17.7%) |
| 2-Person Households | 3,507 (36.3%) | 333 (3.5%) |
| 3-Person Households | 1,805 (18.7%) | 35 (0.4%) |
| 4-Person Households | 1,407 (14.6%) | 45 (0.5%) |
| 5-Person Households | 415 (4.3%) | 0 (0.0%) |
| 6-Person Households | 309 (3.2%) | 0 (0.0%) |
| 7+ Person Households | 93 (1.0%) | 0 (0.0%) |
| Total | 7,536 (78.1%) | 2,118 (21.9%) |
Female Fertility in Columbine
Fertility by Age in Columbine
Average fertility rate in Columbine is 26.0 births per 1,000 women. Women in the age bracket of 20 to 34 years have the highest fertility rate with 33.0 births per 1,000 women. Women in the age bracket of 35 to 50 years acount for 56.9% of all women with births.
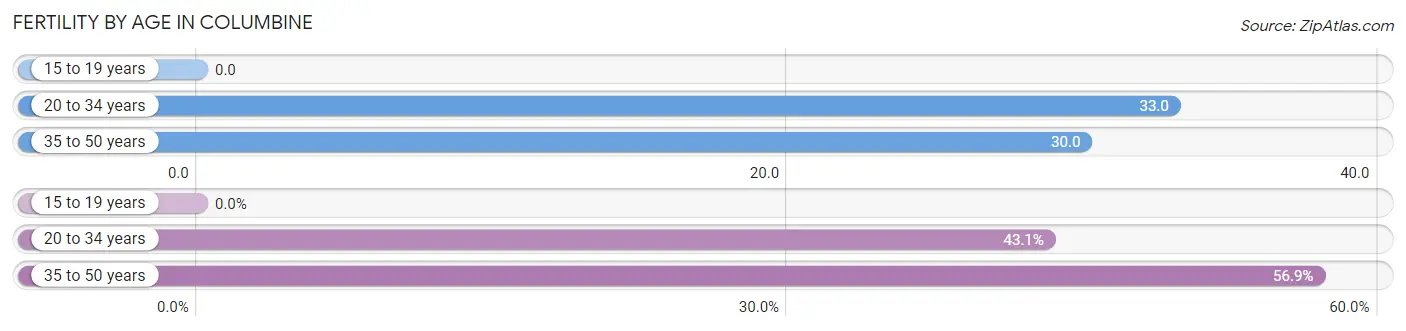
| Age Bracket | Women with Births | Births / 1,000 Women |
| 15 to 19 years | 0 (0.0%) | 0.0 |
| 20 to 34 years | 66 (43.1%) | 33.0 |
| 35 to 50 years | 87 (56.9%) | 30.0 |
| Total | 153 (100.0%) | 26.0 |
Fertility by Age by Marriage Status in Columbine
92.8% of women with births (153) in Columbine are married. The highest percentage of unmarried women with births falls into 35 to 50 years age bracket with 12.6% of them unmarried at the time of birth, while the lowest percentage of unmarried women with births belong to 20 to 34 years age bracket with 0.0% of them unmarried.
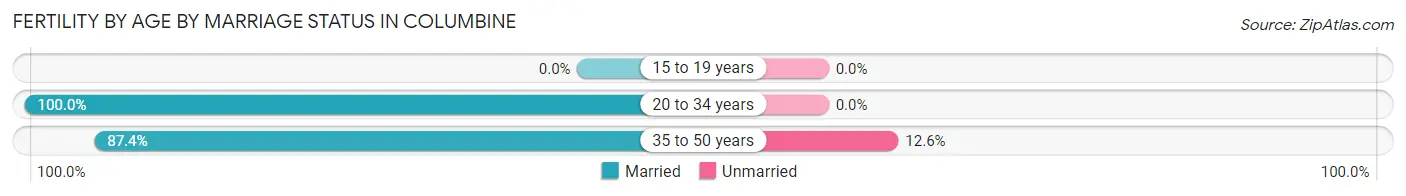
| Age Bracket | Married | Unmarried |
| 15 to 19 years | 0 (0.0%) | 0 (0.0%) |
| 20 to 34 years | 66 (100.0%) | 0 (0.0%) |
| 35 to 50 years | 76 (87.4%) | 11 (12.6%) |
| Total | 142 (92.8%) | 11 (7.2%) |
Fertility by Education in Columbine
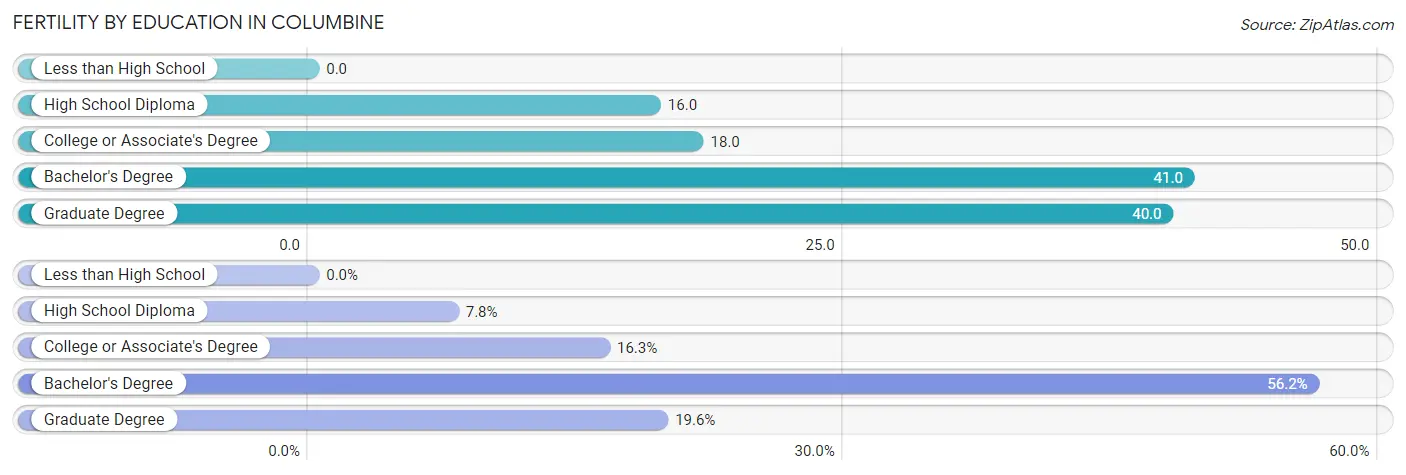
| Educational Attainment | Women with Births | Births / 1,000 Women |
| Less than High School | 0 (0.0%) | 0.0 |
| High School Diploma | 12 (7.8%) | 16.0 |
| College or Associate's Degree | 25 (16.3%) | 18.0 |
| Bachelor's Degree | 86 (56.2%) | 41.0 |
| Graduate Degree | 30 (19.6%) | 40.0 |
| Total | 153 (100.0%) | 26.0 |
Fertility by Education by Marriage Status in Columbine
7.2% of women with births in Columbine are unmarried. Women with the educational attainment of high school diploma are most likely to be married with 100.0% of them married at childbirth, while women with the educational attainment of graduate degree are least likely to be married with 36.7% of them unmarried at childbirth.
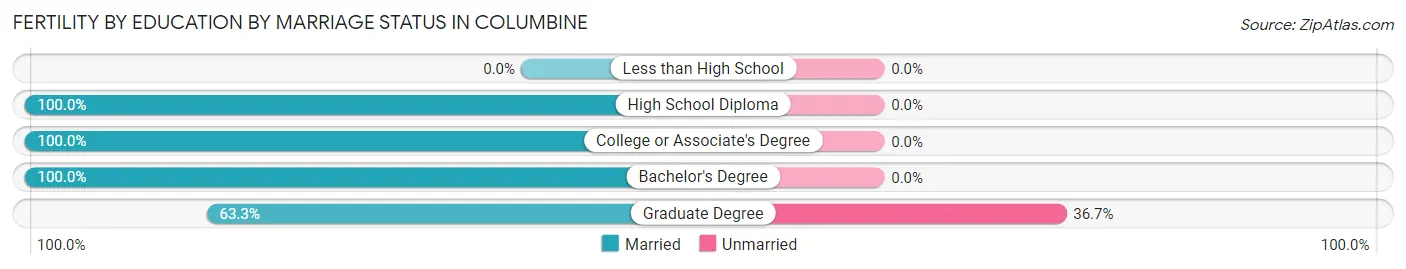
| Educational Attainment | Married | Unmarried |
| Less than High School | 0 (0.0%) | 0 (0.0%) |
| High School Diploma | 12 (100.0%) | 0 (0.0%) |
| College or Associate's Degree | 25 (100.0%) | 0 (0.0%) |
| Bachelor's Degree | 86 (100.0%) | 0 (0.0%) |
| Graduate Degree | 19 (63.3%) | 11 (36.7%) |
| Total | 142 (92.8%) | 11 (7.2%) |
Employment Characteristics in Columbine
Employment by Class of Employer in Columbine
Among the 13,023 employed individuals in Columbine, private company employees (9,283 | 71.3%), local government employees (1,066 | 8.2%), and not-for-profit organizations (869 | 6.7%) make up the most common classes of employment.
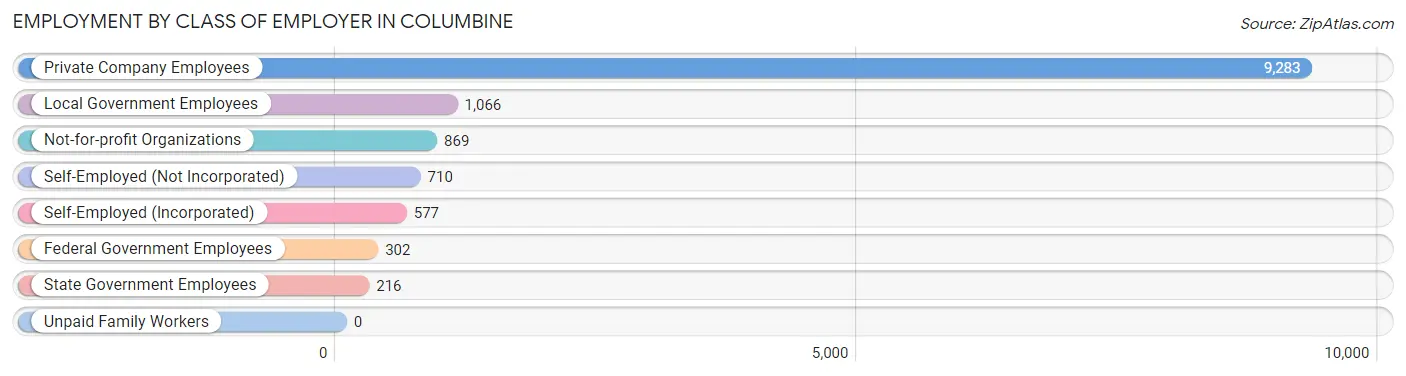
| Employer Class | # Employees | % Employees |
| Private Company Employees | 9,283 | 71.3% |
| Self-Employed (Incorporated) | 577 | 4.4% |
| Self-Employed (Not Incorporated) | 710 | 5.4% |
| Not-for-profit Organizations | 869 | 6.7% |
| Local Government Employees | 1,066 | 8.2% |
| State Government Employees | 216 | 1.7% |
| Federal Government Employees | 302 | 2.3% |
| Unpaid Family Workers | 0 | 0.0% |
| Total | 13,023 | 100.0% |
Employment Status by Age in Columbine
According to the labor force statistics for Columbine, out of the total population over 16 years of age (20,497), 66.8% or 13,692 individuals are in the labor force, with 3.6% or 493 of them unemployed. The age group with the highest labor force participation rate is 20 to 24 years, with 90.8% or 883 individuals in the labor force. Within the labor force, the 16 to 19 years age range has the highest percentage of unemployed individuals, with 16.4% or 125 of them being unemployed.
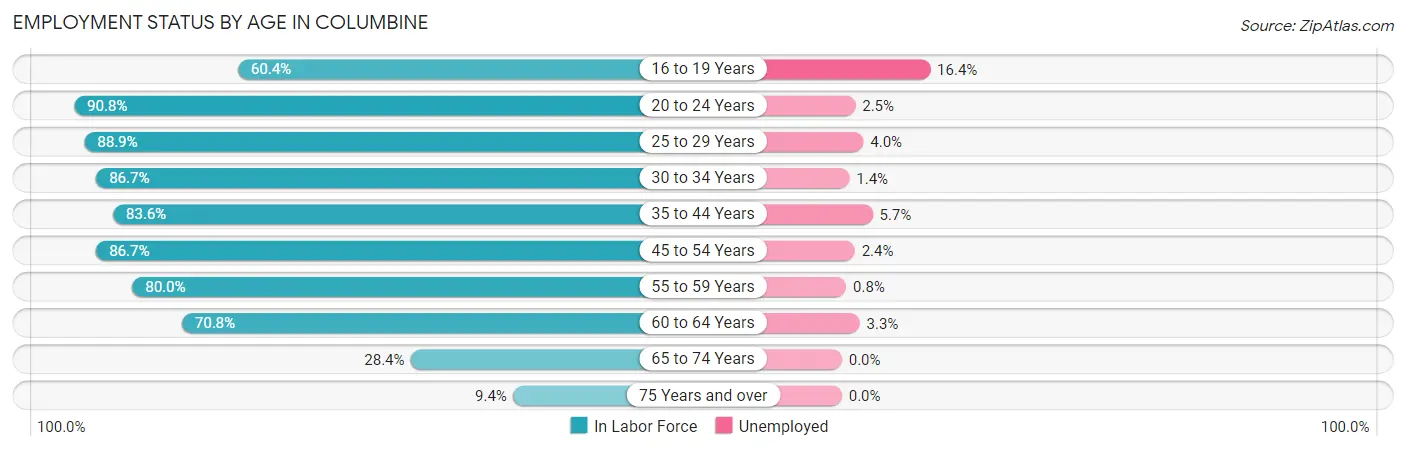
| Age Bracket | In Labor Force | Unemployed |
| 16 to 19 Years | 763 (60.4%) | 125 (16.4%) |
| 20 to 24 Years | 883 (90.8%) | 22 (2.5%) |
| 25 to 29 Years | 1,093 (88.9%) | 44 (4.0%) |
| 30 to 34 Years | 1,527 (86.7%) | 21 (1.4%) |
| 35 to 44 Years | 3,066 (83.6%) | 175 (5.7%) |
| 45 to 54 Years | 2,821 (86.7%) | 68 (2.4%) |
| 55 to 59 Years | 1,447 (80.0%) | 12 (0.8%) |
| 60 to 64 Years | 1,070 (70.8%) | 35 (3.3%) |
| 65 to 74 Years | 838 (28.4%) | 0 (0.0%) |
| 75 Years and over | 195 (9.4%) | 0 (0.0%) |
| Total | 13,692 (66.8%) | 493 (3.6%) |
Employment Status by Educational Attainment in Columbine
According to labor force statistics for Columbine, 83.3% of individuals (11,022) out of the total population between 25 and 64 years of age (13,232) are in the labor force, with 3.2% or 353 of them being unemployed. The group with the highest labor force participation rate are those with the educational attainment of college / associate degree, with 87.1% or 2,947 individuals in the labor force. Within the labor force, individuals with high school diploma education have the highest percentage of unemployment, with 4.4% or 83 of them being unemployed.
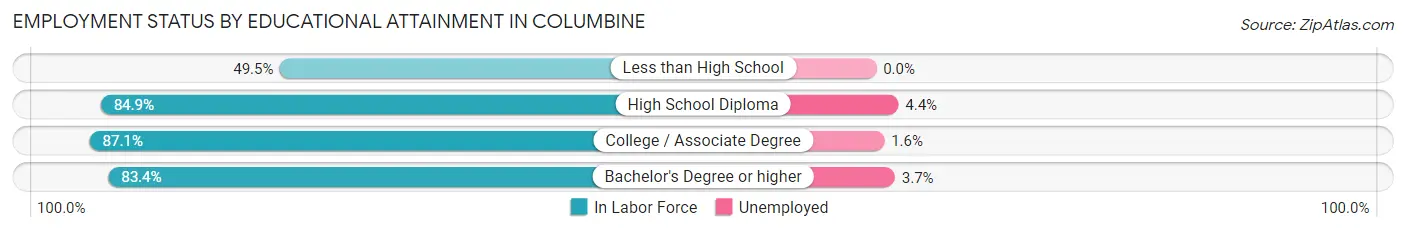
| Educational Attainment | In Labor Force | Unemployed |
| Less than High School | 256 (49.5%) | 0 (0.0%) |
| High School Diploma | 1,892 (84.9%) | 98 (4.4%) |
| College / Associate Degree | 2,947 (87.1%) | 54 (1.6%) |
| Bachelor's Degree or higher | 5,923 (83.4%) | 263 (3.7%) |
| Total | 11,022 (83.3%) | 423 (3.2%) |
Employment Occupations by Sex in Columbine
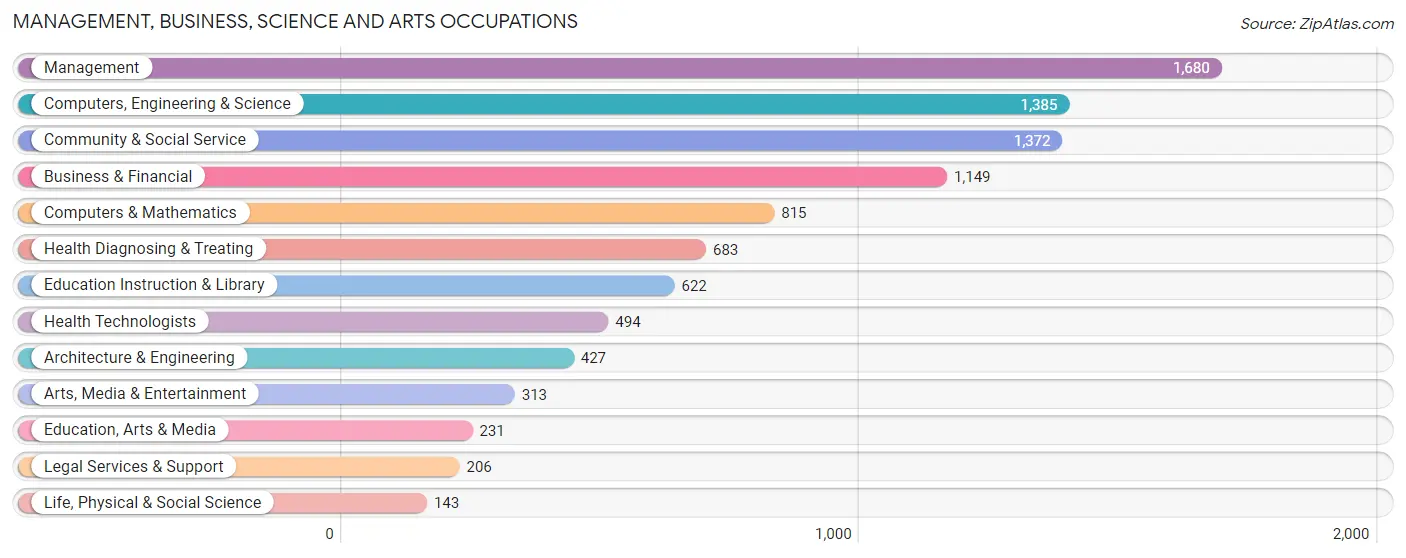
Management, Business, Science and Arts Occupations
The most common Management, Business, Science and Arts occupations in Columbine are Management (1,680 | 12.7%), Computers, Engineering & Science (1,385 | 10.5%), Community & Social Service (1,372 | 10.4%), Business & Financial (1,149 | 8.7%), and Computers & Mathematics (815 | 6.2%).
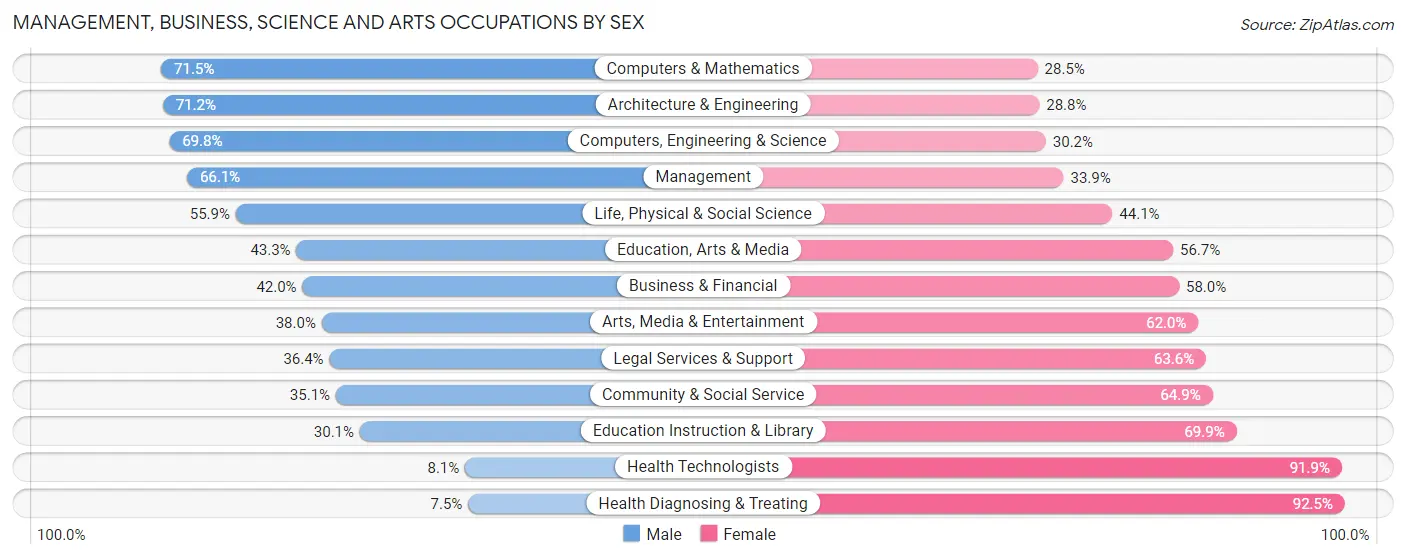
Management, Business, Science and Arts Occupations by Sex
Within the Management, Business, Science and Arts occupations in Columbine, the most male-oriented occupations are Computers & Mathematics (71.5%), Architecture & Engineering (71.2%), and Computers, Engineering & Science (69.8%), while the most female-oriented occupations are Health Diagnosing & Treating (92.5%), Health Technologists (91.9%), and Education Instruction & Library (69.9%).
| Occupation | Male | Female |
| Management | 1,111 (66.1%) | 569 (33.9%) |
| Business & Financial | 483 (42.0%) | 666 (58.0%) |
| Computers, Engineering & Science | 967 (69.8%) | 418 (30.2%) |
| Computers & Mathematics | 583 (71.5%) | 232 (28.5%) |
| Architecture & Engineering | 304 (71.2%) | 123 (28.8%) |
| Life, Physical & Social Science | 80 (55.9%) | 63 (44.1%) |
| Community & Social Service | 481 (35.1%) | 891 (64.9%) |
| Education, Arts & Media | 100 (43.3%) | 131 (56.7%) |
| Legal Services & Support | 75 (36.4%) | 131 (63.6%) |
| Education Instruction & Library | 187 (30.1%) | 435 (69.9%) |
| Arts, Media & Entertainment | 119 (38.0%) | 194 (62.0%) |
| Health Diagnosing & Treating | 51 (7.5%) | 632 (92.5%) |
| Health Technologists | 40 (8.1%) | 454 (91.9%) |
| Total (Category) | 3,093 (49.3%) | 3,176 (50.7%) |
| Total (Overall) | 6,876 (52.1%) | 6,308 (47.8%) |
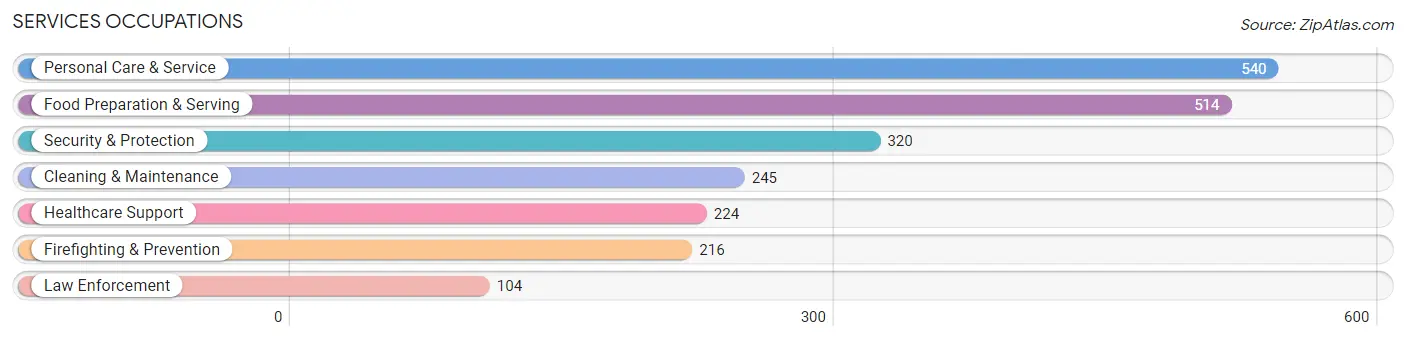
Services Occupations
The most common Services occupations in Columbine are Personal Care & Service (540 | 4.1%), Food Preparation & Serving (514 | 3.9%), Security & Protection (320 | 2.4%), Cleaning & Maintenance (245 | 1.9%), and Healthcare Support (224 | 1.7%).
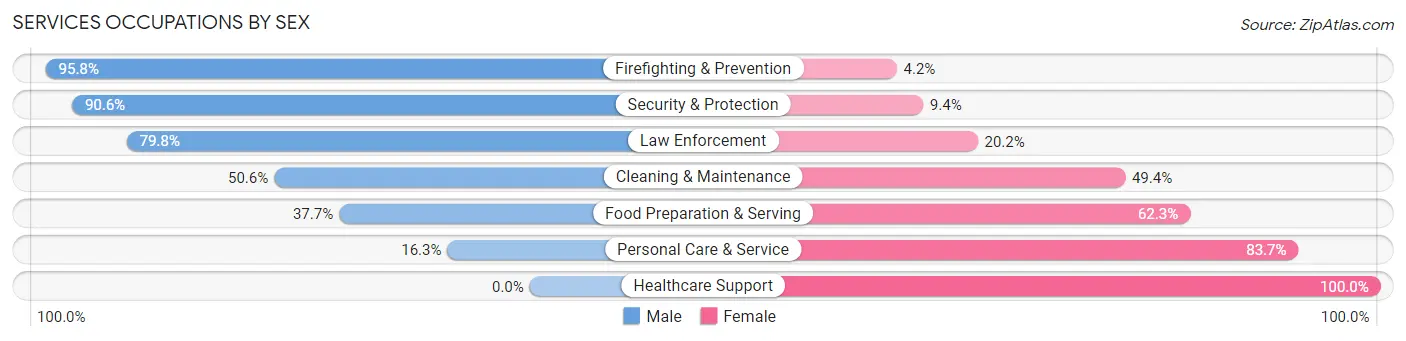
Services Occupations by Sex
Within the Services occupations in Columbine, the most male-oriented occupations are Firefighting & Prevention (95.8%), Security & Protection (90.6%), and Law Enforcement (79.8%), while the most female-oriented occupations are Healthcare Support (100.0%), Personal Care & Service (83.7%), and Food Preparation & Serving (62.3%).
| Occupation | Male | Female |
| Healthcare Support | 0 (0.0%) | 224 (100.0%) |
| Security & Protection | 290 (90.6%) | 30 (9.4%) |
| Firefighting & Prevention | 207 (95.8%) | 9 (4.2%) |
| Law Enforcement | 83 (79.8%) | 21 (20.2%) |
| Food Preparation & Serving | 194 (37.7%) | 320 (62.3%) |
| Cleaning & Maintenance | 124 (50.6%) | 121 (49.4%) |
| Personal Care & Service | 88 (16.3%) | 452 (83.7%) |
| Total (Category) | 696 (37.8%) | 1,147 (62.2%) |
| Total (Overall) | 6,876 (52.1%) | 6,308 (47.8%) |
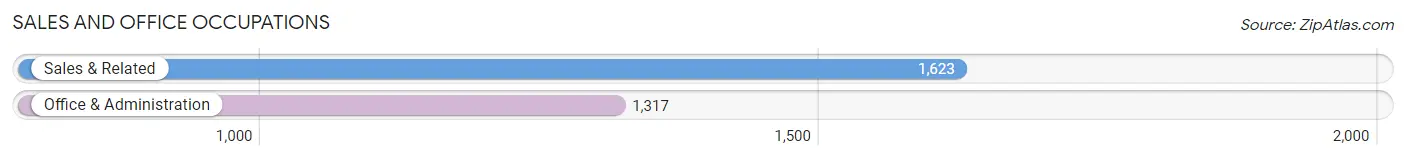
Sales and Office Occupations
The most common Sales and Office occupations in Columbine are Sales & Related (1,623 | 12.3%), and Office & Administration (1,317 | 10.0%).
Sales and Office Occupations by Sex
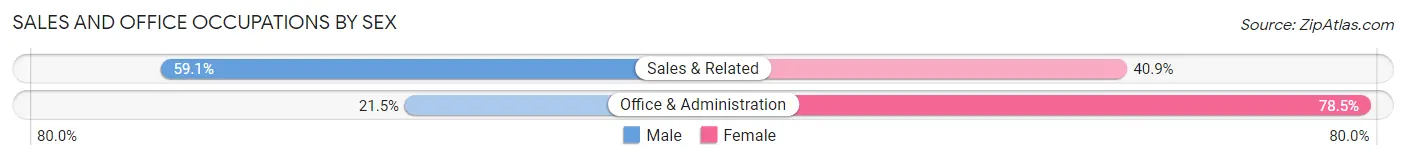
| Occupation | Male | Female |
| Sales & Related | 959 (59.1%) | 664 (40.9%) |
| Office & Administration | 283 (21.5%) | 1,034 (78.5%) |
| Total (Category) | 1,242 (42.2%) | 1,698 (57.8%) |
| Total (Overall) | 6,876 (52.1%) | 6,308 (47.8%) |
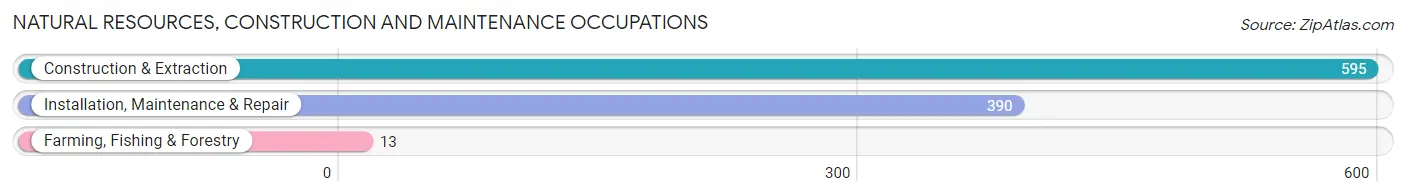
Natural Resources, Construction and Maintenance Occupations
The most common Natural Resources, Construction and Maintenance occupations in Columbine are Construction & Extraction (595 | 4.5%), Installation, Maintenance & Repair (390 | 3.0%), and Farming, Fishing & Forestry (13 | 0.1%).
Natural Resources, Construction and Maintenance Occupations by Sex
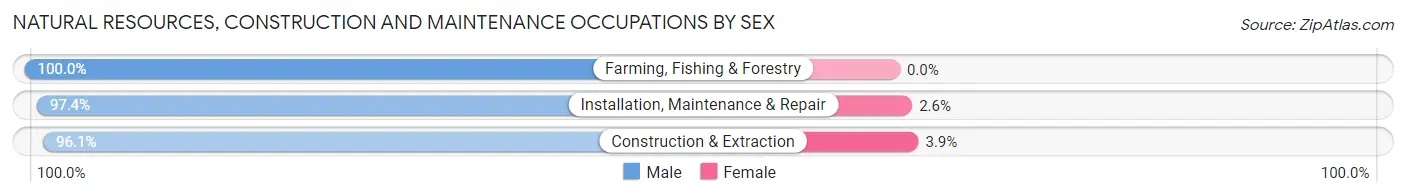
| Occupation | Male | Female |
| Farming, Fishing & Forestry | 13 (100.0%) | 0 (0.0%) |
| Construction & Extraction | 572 (96.1%) | 23 (3.9%) |
| Installation, Maintenance & Repair | 380 (97.4%) | 10 (2.6%) |
| Total (Category) | 965 (96.7%) | 33 (3.3%) |
| Total (Overall) | 6,876 (52.1%) | 6,308 (47.8%) |
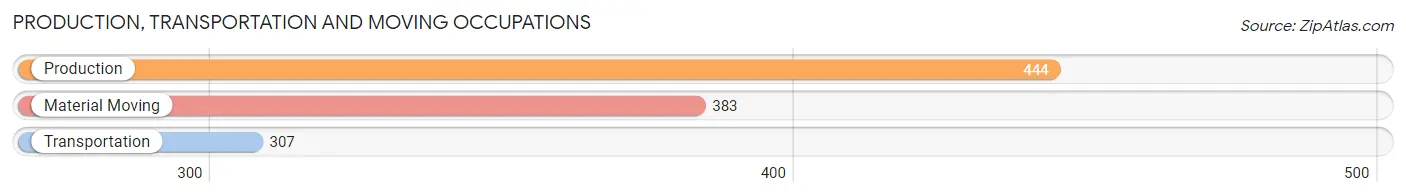
Production, Transportation and Moving Occupations
The most common Production, Transportation and Moving occupations in Columbine are Production (444 | 3.4%), Material Moving (383 | 2.9%), and Transportation (307 | 2.3%).
Production, Transportation and Moving Occupations by Sex
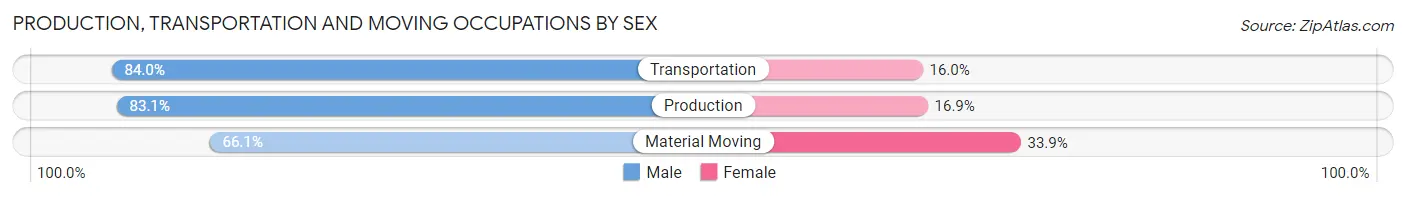
| Occupation | Male | Female |
| Production | 369 (83.1%) | 75 (16.9%) |
| Transportation | 258 (84.0%) | 49 (16.0%) |
| Material Moving | 253 (66.1%) | 130 (33.9%) |
| Total (Category) | 880 (77.6%) | 254 (22.4%) |
| Total (Overall) | 6,876 (52.1%) | 6,308 (47.8%) |
Employment Industries by Sex in Columbine
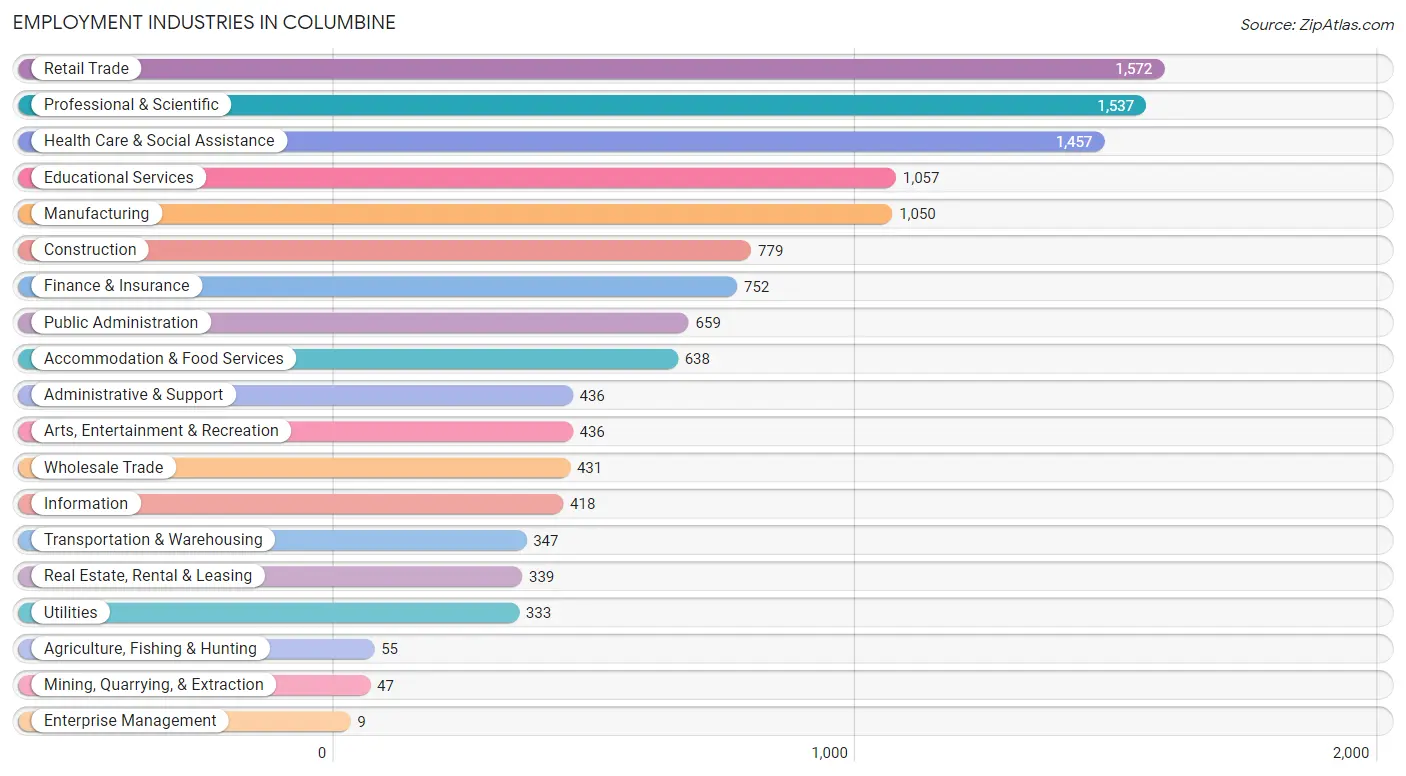
Employment Industries in Columbine
The major employment industries in Columbine include Retail Trade (1,572 | 11.9%), Professional & Scientific (1,537 | 11.7%), Health Care & Social Assistance (1,457 | 11.1%), Educational Services (1,057 | 8.0%), and Manufacturing (1,050 | 8.0%).
Employment Industries by Sex in Columbine
The Columbine industries that see more men than women are Agriculture, Fishing & Hunting (100.0%), Utilities (96.4%), and Construction (86.9%), whereas the industries that tend to have a higher number of women are Enterprise Management (100.0%), Health Care & Social Assistance (86.4%), and Educational Services (67.4%).

| Industry | Male | Female |
| Agriculture, Fishing & Hunting | 55 (100.0%) | 0 (0.0%) |
| Mining, Quarrying, & Extraction | 25 (53.2%) | 22 (46.8%) |
| Construction | 677 (86.9%) | 102 (13.1%) |
| Manufacturing | 672 (64.0%) | 378 (36.0%) |
| Wholesale Trade | 253 (58.7%) | 178 (41.3%) |
| Retail Trade | 845 (53.7%) | 727 (46.3%) |
| Transportation & Warehousing | 198 (57.1%) | 149 (42.9%) |
| Utilities | 321 (96.4%) | 12 (3.6%) |
| Information | 336 (80.4%) | 82 (19.6%) |
| Finance & Insurance | 310 (41.2%) | 442 (58.8%) |
| Real Estate, Rental & Leasing | 190 (56.0%) | 149 (44.0%) |
| Professional & Scientific | 792 (51.5%) | 745 (48.5%) |
| Enterprise Management | 0 (0.0%) | 9 (100.0%) |
| Administrative & Support | 246 (56.4%) | 190 (43.6%) |
| Educational Services | 345 (32.6%) | 712 (67.4%) |
| Health Care & Social Assistance | 198 (13.6%) | 1,259 (86.4%) |
| Arts, Entertainment & Recreation | 295 (67.7%) | 141 (32.3%) |
| Accommodation & Food Services | 346 (54.2%) | 292 (45.8%) |
| Public Administration | 430 (65.2%) | 229 (34.7%) |
| Total | 6,876 (52.1%) | 6,308 (47.8%) |
Education in Columbine
School Enrollment in Columbine
The most common levels of schooling among the 6,048 students in Columbine are high school (1,484 | 24.5%), elementary school (1,359 | 22.5%), and middle school (1,303 | 21.5%).
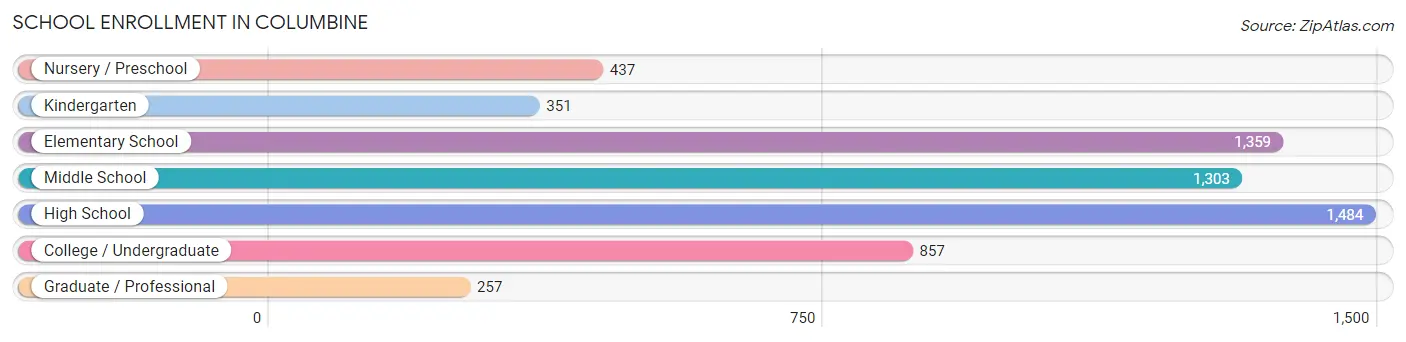
| School Level | # Students | % Students |
| Nursery / Preschool | 437 | 7.2% |
| Kindergarten | 351 | 5.8% |
| Elementary School | 1,359 | 22.5% |
| Middle School | 1,303 | 21.5% |
| High School | 1,484 | 24.5% |
| College / Undergraduate | 857 | 14.2% |
| Graduate / Professional | 257 | 4.3% |
| Total | 6,048 | 100.0% |
School Enrollment by Age by Funding Source in Columbine
Out of a total of 6,048 students who are enrolled in schools in Columbine, 1,010 (16.7%) attend a private institution, while the remaining 5,038 (83.3%) are enrolled in public schools. The age group of 3 to 4 year olds has the highest likelihood of being enrolled in private schools, with 108 (32.1% in the age bracket) enrolled. Conversely, the age group of 18 to 19 year olds has the lowest likelihood of being enrolled in a private school, with 266 (99.3% in the age bracket) attending a public institution.
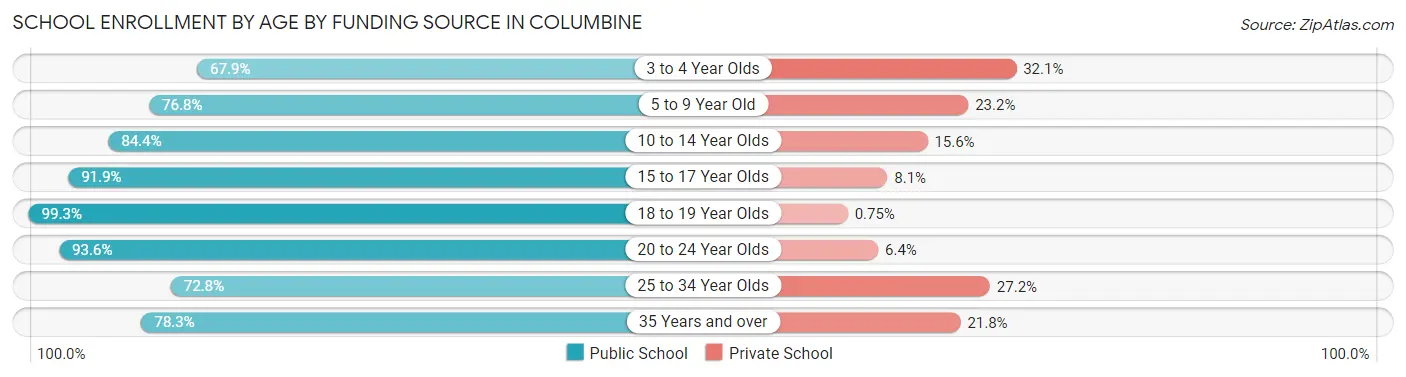
| Age Bracket | Public School | Private School |
| 3 to 4 Year Olds | 228 (67.9%) | 108 (32.1%) |
| 5 to 9 Year Old | 1,321 (76.8%) | 399 (23.2%) |
| 10 to 14 Year Olds | 1,309 (84.4%) | 242 (15.6%) |
| 15 to 17 Year Olds | 1,108 (91.9%) | 98 (8.1%) |
| 18 to 19 Year Olds | 266 (99.3%) | 2 (0.7%) |
| 20 to 24 Year Olds | 365 (93.6%) | 25 (6.4%) |
| 25 to 34 Year Olds | 179 (72.8%) | 67 (27.2%) |
| 35 Years and over | 259 (78.2%) | 72 (21.7%) |
| Total | 5,038 (83.3%) | 1,010 (16.7%) |
Educational Attainment by Field of Study in Columbine
Business (2,479 | 24.3%), engineering (1,099 | 10.8%), education (842 | 8.3%), science & technology (823 | 8.1%), and social sciences (657 | 6.4%) are the most common fields of study among 10,208 individuals in Columbine who have obtained a bachelor's degree or higher.
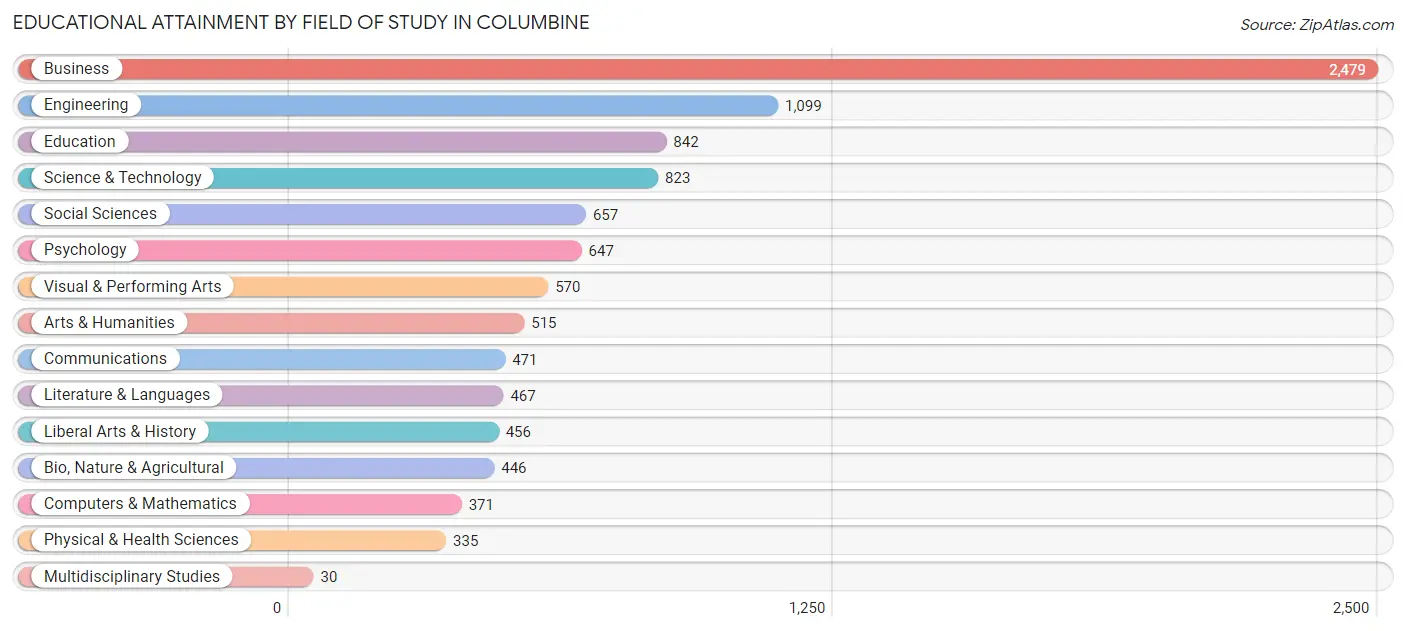
| Field of Study | # Graduates | % Graduates |
| Computers & Mathematics | 371 | 3.6% |
| Bio, Nature & Agricultural | 446 | 4.4% |
| Physical & Health Sciences | 335 | 3.3% |
| Psychology | 647 | 6.3% |
| Social Sciences | 657 | 6.4% |
| Engineering | 1,099 | 10.8% |
| Multidisciplinary Studies | 30 | 0.3% |
| Science & Technology | 823 | 8.1% |
| Business | 2,479 | 24.3% |
| Education | 842 | 8.3% |
| Literature & Languages | 467 | 4.6% |
| Liberal Arts & History | 456 | 4.5% |
| Visual & Performing Arts | 570 | 5.6% |
| Communications | 471 | 4.6% |
| Arts & Humanities | 515 | 5.1% |
| Total | 10,208 | 100.0% |
Transportation & Commute in Columbine
Vehicle Availability by Sex in Columbine
The most prevalent vehicle ownership categories in Columbine are males with 2 vehicles (3,189, accounting for 46.8%) and females with 2 vehicles (2,503, making up 51.5%).
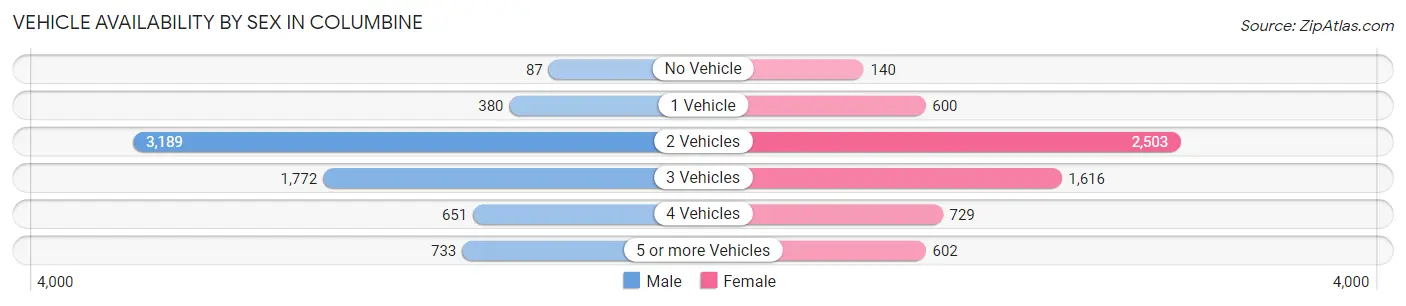
| Vehicles Available | Male | Female |
| No Vehicle | 87 (1.3%) | 140 (2.3%) |
| 1 Vehicle | 380 (5.6%) | 600 (9.7%) |
| 2 Vehicles | 3,189 (46.8%) | 2,503 (40.4%) |
| 3 Vehicles | 1,772 (26.0%) | 1,616 (26.1%) |
| 4 Vehicles | 651 (9.6%) | 729 (11.8%) |
| 5 or more Vehicles | 733 (10.8%) | 602 (9.7%) |
| Total | 6,812 (100.0%) | 6,190 (100.0%) |
Commute Time in Columbine
The most frequently occuring commute durations in Columbine are 30 to 34 minutes (2,034 commuters, 18.8%), 15 to 19 minutes (1,780 commuters, 16.4%), and 10 to 14 minutes (1,490 commuters, 13.8%).
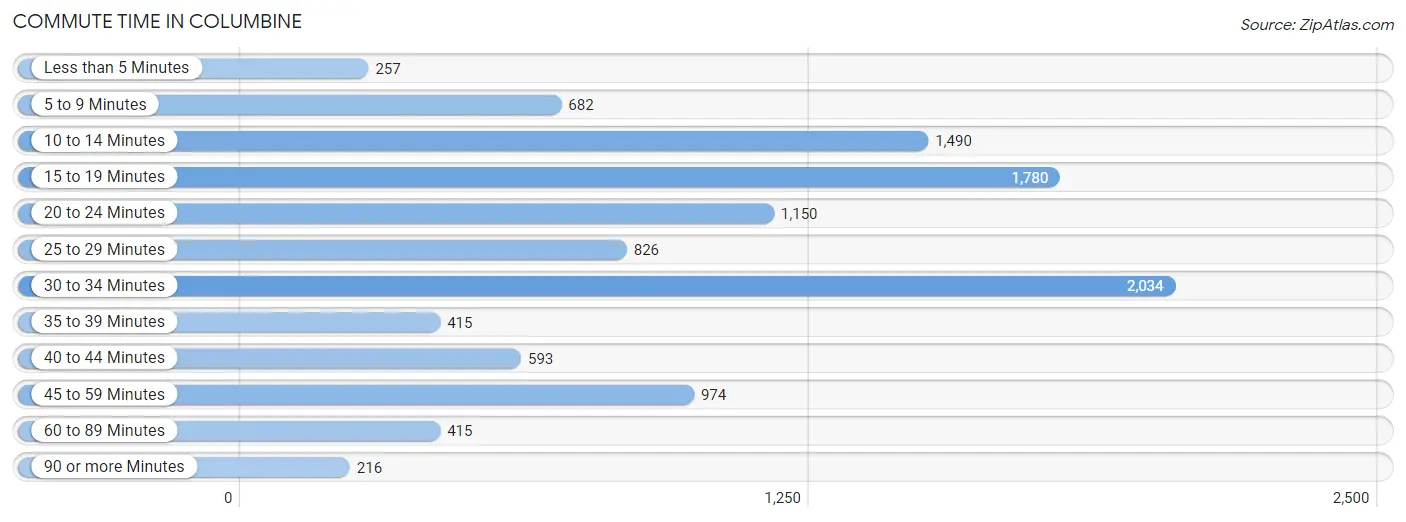
| Commute Time | # Commuters | % Commuters |
| Less than 5 Minutes | 257 | 2.4% |
| 5 to 9 Minutes | 682 | 6.3% |
| 10 to 14 Minutes | 1,490 | 13.8% |
| 15 to 19 Minutes | 1,780 | 16.4% |
| 20 to 24 Minutes | 1,150 | 10.6% |
| 25 to 29 Minutes | 826 | 7.6% |
| 30 to 34 Minutes | 2,034 | 18.8% |
| 35 to 39 Minutes | 415 | 3.8% |
| 40 to 44 Minutes | 593 | 5.5% |
| 45 to 59 Minutes | 974 | 9.0% |
| 60 to 89 Minutes | 415 | 3.8% |
| 90 or more Minutes | 216 | 2.0% |
Commute Time by Sex in Columbine
The most common commute times in Columbine are 30 to 34 minutes (1,071 commuters, 19.2%) for males and 30 to 34 minutes (963 commuters, 18.3%) for females.
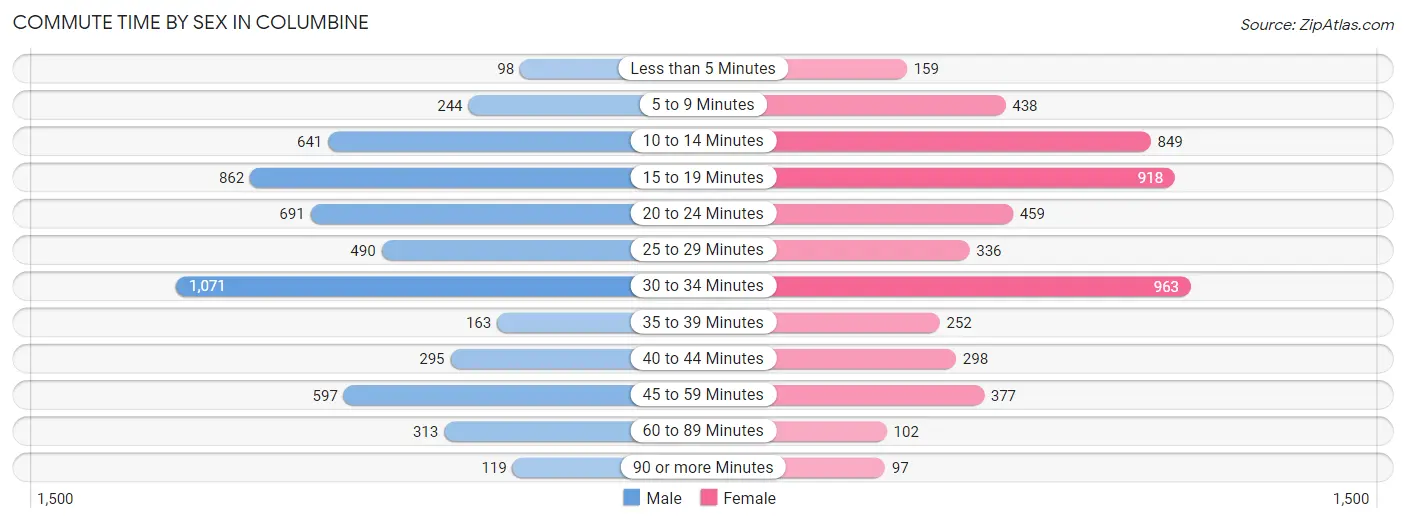
| Commute Time | Male | Female |
| Less than 5 Minutes | 98 (1.8%) | 159 (3.0%) |
| 5 to 9 Minutes | 244 (4.4%) | 438 (8.4%) |
| 10 to 14 Minutes | 641 (11.5%) | 849 (16.2%) |
| 15 to 19 Minutes | 862 (15.4%) | 918 (17.5%) |
| 20 to 24 Minutes | 691 (12.4%) | 459 (8.7%) |
| 25 to 29 Minutes | 490 (8.8%) | 336 (6.4%) |
| 30 to 34 Minutes | 1,071 (19.2%) | 963 (18.3%) |
| 35 to 39 Minutes | 163 (2.9%) | 252 (4.8%) |
| 40 to 44 Minutes | 295 (5.3%) | 298 (5.7%) |
| 45 to 59 Minutes | 597 (10.7%) | 377 (7.2%) |
| 60 to 89 Minutes | 313 (5.6%) | 102 (1.9%) |
| 90 or more Minutes | 119 (2.1%) | 97 (1.8%) |
Time of Departure to Work by Sex in Columbine
The most frequent times of departure to work in Columbine are 7:00 AM to 7:29 AM (867, 15.5%) for males and 7:00 AM to 7:29 AM (886, 16.9%) for females.
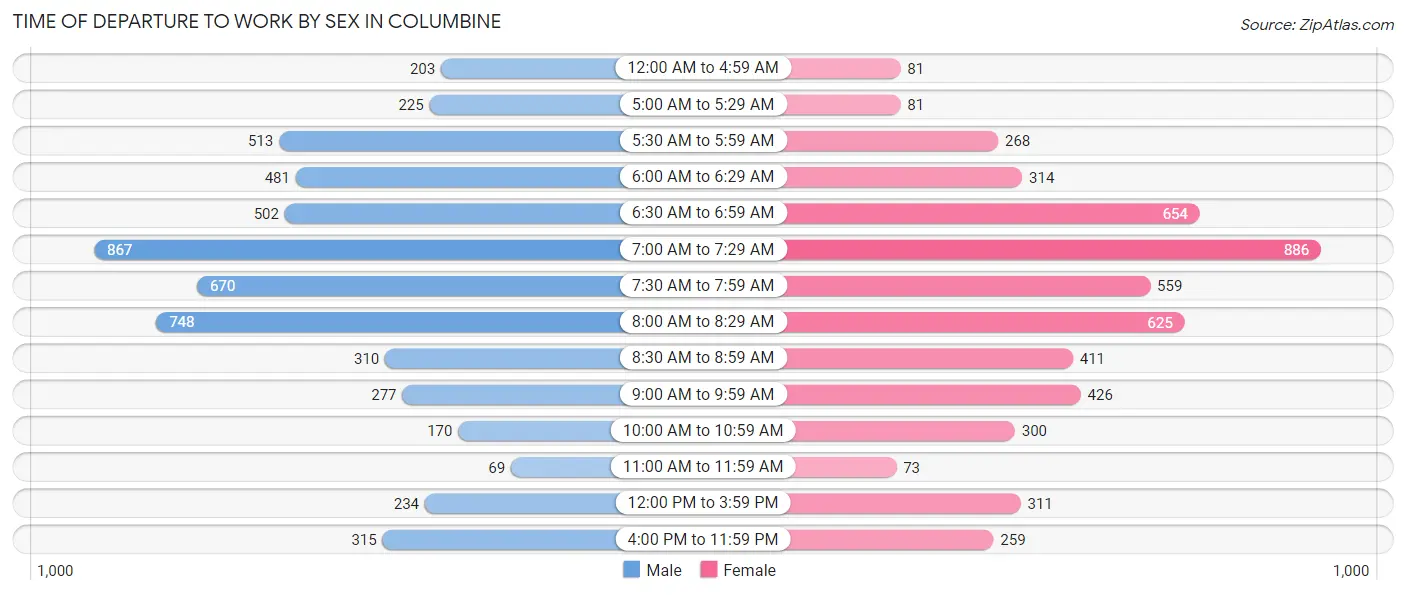
| Time of Departure | Male | Female |
| 12:00 AM to 4:59 AM | 203 (3.6%) | 81 (1.5%) |
| 5:00 AM to 5:29 AM | 225 (4.0%) | 81 (1.5%) |
| 5:30 AM to 5:59 AM | 513 (9.2%) | 268 (5.1%) |
| 6:00 AM to 6:29 AM | 481 (8.6%) | 314 (6.0%) |
| 6:30 AM to 6:59 AM | 502 (9.0%) | 654 (12.5%) |
| 7:00 AM to 7:29 AM | 867 (15.5%) | 886 (16.9%) |
| 7:30 AM to 7:59 AM | 670 (12.0%) | 559 (10.6%) |
| 8:00 AM to 8:29 AM | 748 (13.4%) | 625 (11.9%) |
| 8:30 AM to 8:59 AM | 310 (5.6%) | 411 (7.8%) |
| 9:00 AM to 9:59 AM | 277 (5.0%) | 426 (8.1%) |
| 10:00 AM to 10:59 AM | 170 (3.0%) | 300 (5.7%) |
| 11:00 AM to 11:59 AM | 69 (1.2%) | 73 (1.4%) |
| 12:00 PM to 3:59 PM | 234 (4.2%) | 311 (5.9%) |
| 4:00 PM to 11:59 PM | 315 (5.6%) | 259 (4.9%) |
| Total | 5,584 (100.0%) | 5,248 (100.0%) |
Housing Occupancy in Columbine
Occupancy by Ownership in Columbine
Of the total 9,654 dwellings in Columbine, owner-occupied units account for 8,544 (88.5%), while renter-occupied units make up 1,110 (11.5%).
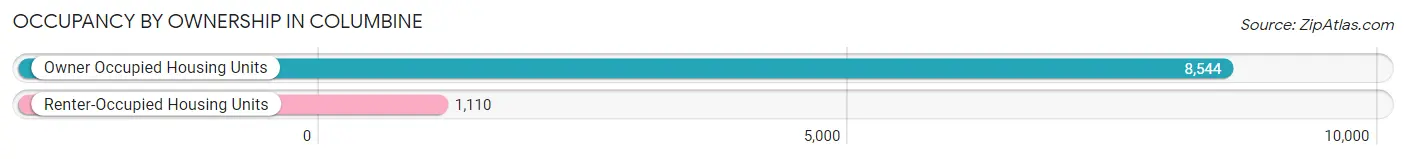
| Occupancy | # Housing Units | % Housing Units |
| Owner Occupied Housing Units | 8,544 | 88.5% |
| Renter-Occupied Housing Units | 1,110 | 11.5% |
| Total Occupied Housing Units | 9,654 | 100.0% |
Occupancy by Household Size in Columbine
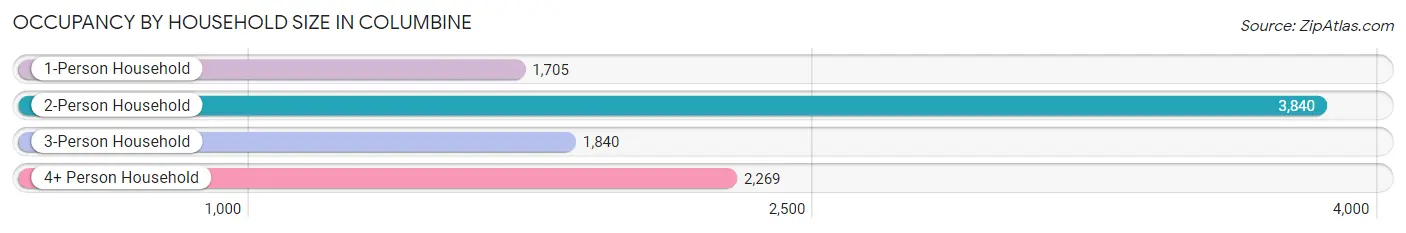
| Household Size | # Housing Units | % Housing Units |
| 1-Person Household | 1,705 | 17.7% |
| 2-Person Household | 3,840 | 39.8% |
| 3-Person Household | 1,840 | 19.1% |
| 4+ Person Household | 2,269 | 23.5% |
| Total Housing Units | 9,654 | 100.0% |
Occupancy by Ownership by Household Size in Columbine
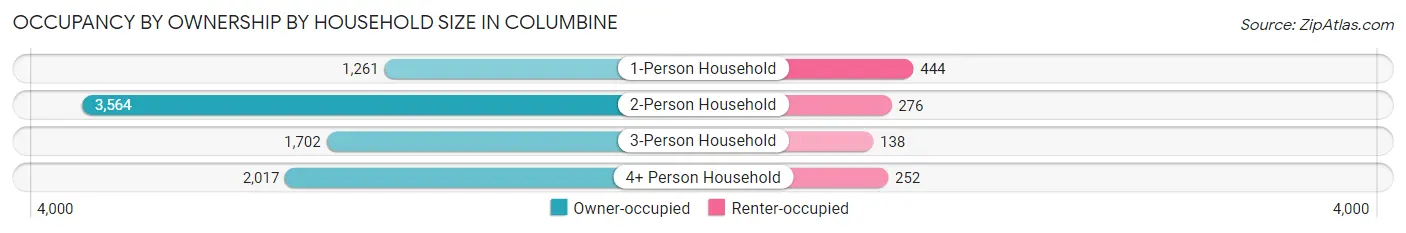
| Household Size | Owner-occupied | Renter-occupied |
| 1-Person Household | 1,261 (74.0%) | 444 (26.0%) |
| 2-Person Household | 3,564 (92.8%) | 276 (7.2%) |
| 3-Person Household | 1,702 (92.5%) | 138 (7.5%) |
| 4+ Person Household | 2,017 (88.9%) | 252 (11.1%) |
| Total Housing Units | 8,544 (88.5%) | 1,110 (11.5%) |
Occupancy by Educational Attainment in Columbine
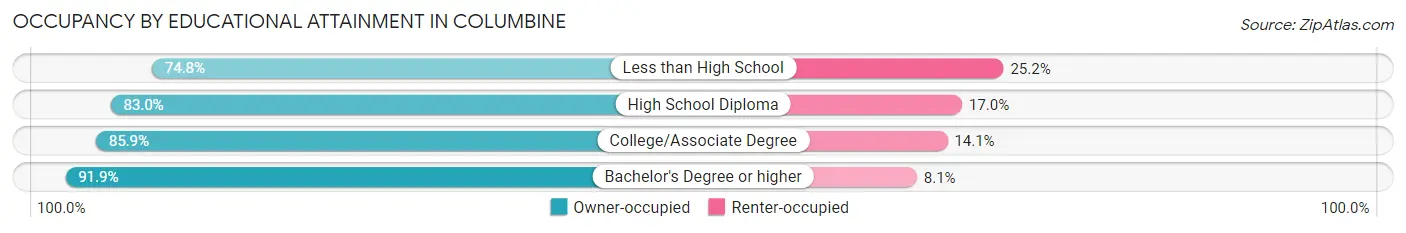
| Household Size | Owner-occupied | Renter-occupied |
| Less than High School | 157 (74.8%) | 53 (25.2%) |
| High School Diploma | 1,130 (83.0%) | 232 (17.0%) |
| College/Associate Degree | 2,455 (85.9%) | 404 (14.1%) |
| Bachelor's Degree or higher | 4,802 (91.9%) | 421 (8.1%) |
Occupancy by Age of Householder in Columbine
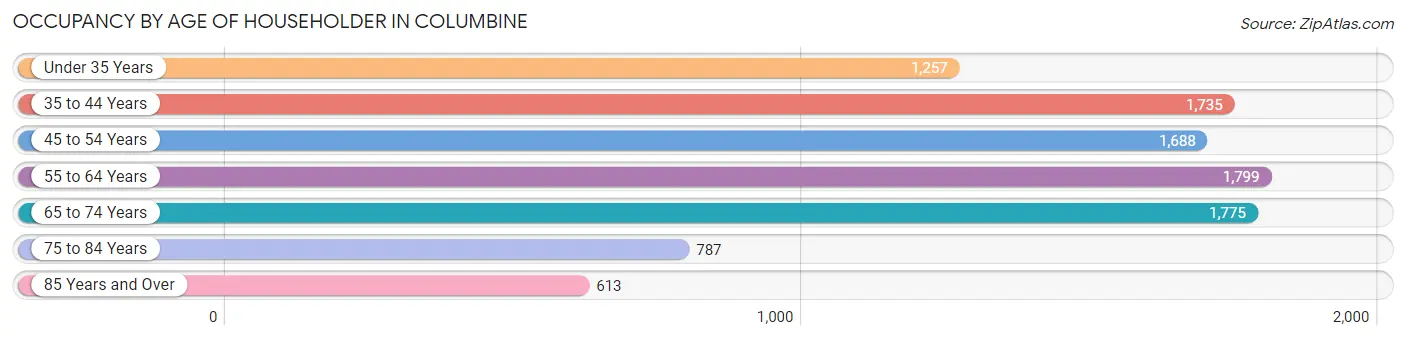
| Age Bracket | # Households | % Households |
| Under 35 Years | 1,257 | 13.0% |
| 35 to 44 Years | 1,735 | 18.0% |
| 45 to 54 Years | 1,688 | 17.5% |
| 55 to 64 Years | 1,799 | 18.6% |
| 65 to 74 Years | 1,775 | 18.4% |
| 75 to 84 Years | 787 | 8.2% |
| 85 Years and Over | 613 | 6.4% |
| Total | 9,654 | 100.0% |
Housing Finances in Columbine
Median Income by Occupancy in Columbine
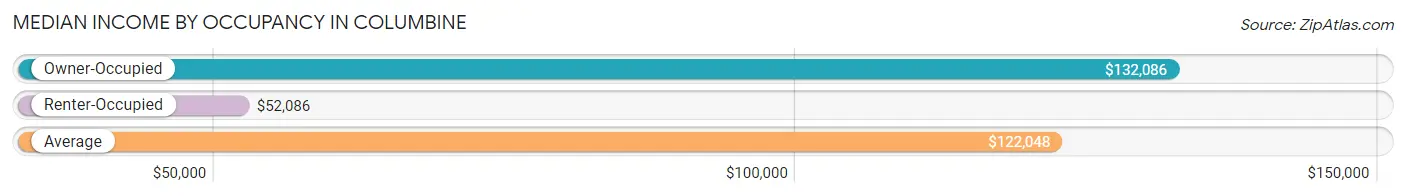
| Occupancy Type | # Households | Median Income |
| Owner-Occupied | 8,544 (88.5%) | $132,086 |
| Renter-Occupied | 1,110 (11.5%) | $52,086 |
| Average | 9,654 (100.0%) | $122,048 |
Occupancy by Householder Income Bracket in Columbine
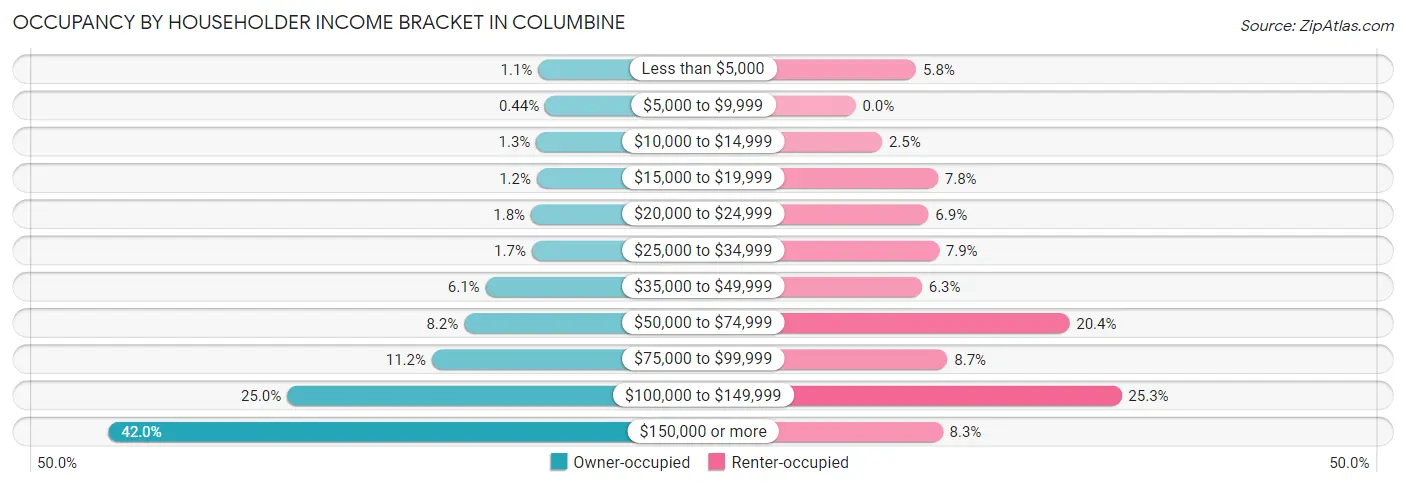
| Income Bracket | Owner-occupied | Renter-occupied |
| Less than $5,000 | 93 (1.1%) | 64 (5.8%) |
| $5,000 to $9,999 | 38 (0.4%) | 0 (0.0%) |
| $10,000 to $14,999 | 109 (1.3%) | 28 (2.5%) |
| $15,000 to $19,999 | 104 (1.2%) | 87 (7.8%) |
| $20,000 to $24,999 | 152 (1.8%) | 77 (6.9%) |
| $25,000 to $34,999 | 145 (1.7%) | 88 (7.9%) |
| $35,000 to $49,999 | 522 (6.1%) | 70 (6.3%) |
| $50,000 to $74,999 | 696 (8.2%) | 226 (20.4%) |
| $75,000 to $99,999 | 959 (11.2%) | 97 (8.7%) |
| $100,000 to $149,999 | 2,136 (25.0%) | 281 (25.3%) |
| $150,000 or more | 3,590 (42.0%) | 92 (8.3%) |
| Total | 8,544 (100.0%) | 1,110 (100.0%) |
Monthly Housing Cost Tiers in Columbine
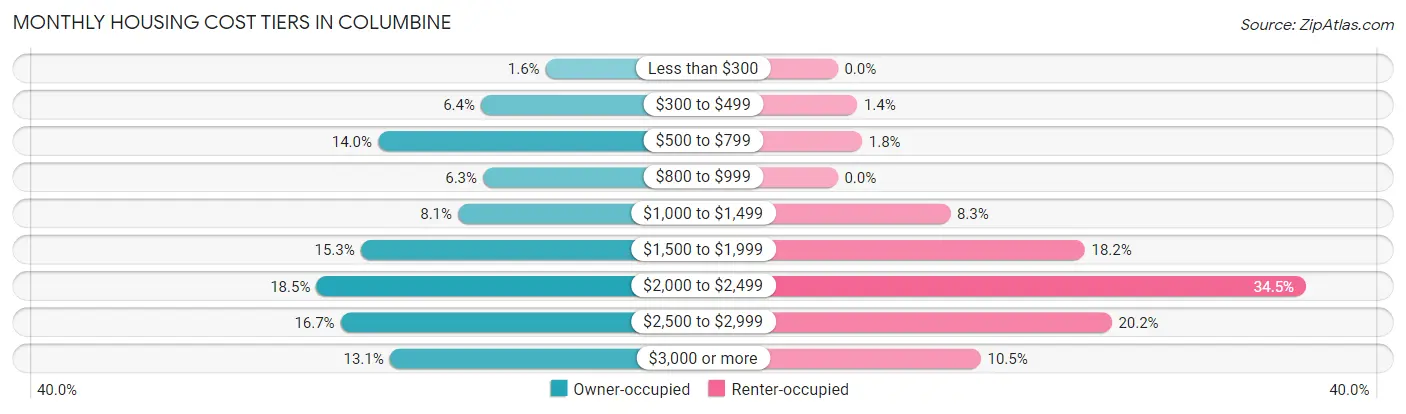
| Monthly Cost | Owner-occupied | Renter-occupied |
| Less than $300 | 140 (1.6%) | 0 (0.0%) |
| $300 to $499 | 547 (6.4%) | 16 (1.4%) |
| $500 to $799 | 1,195 (14.0%) | 20 (1.8%) |
| $800 to $999 | 534 (6.2%) | 0 (0.0%) |
| $1,000 to $1,499 | 691 (8.1%) | 92 (8.3%) |
| $1,500 to $1,999 | 1,304 (15.3%) | 202 (18.2%) |
| $2,000 to $2,499 | 1,582 (18.5%) | 383 (34.5%) |
| $2,500 to $2,999 | 1,430 (16.7%) | 224 (20.2%) |
| $3,000 or more | 1,121 (13.1%) | 117 (10.5%) |
| Total | 8,544 (100.0%) | 1,110 (100.0%) |
Physical Housing Characteristics in Columbine
Housing Structures in Columbine
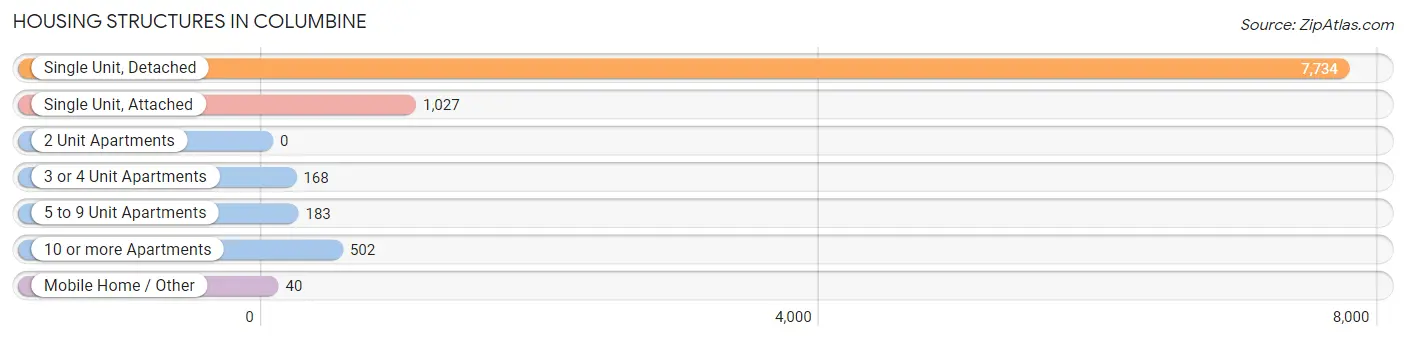
| Structure Type | # Housing Units | % Housing Units |
| Single Unit, Detached | 7,734 | 80.1% |
| Single Unit, Attached | 1,027 | 10.6% |
| 2 Unit Apartments | 0 | 0.0% |
| 3 or 4 Unit Apartments | 168 | 1.7% |
| 5 to 9 Unit Apartments | 183 | 1.9% |
| 10 or more Apartments | 502 | 5.2% |
| Mobile Home / Other | 40 | 0.4% |
| Total | 9,654 | 100.0% |
Housing Structures by Occupancy in Columbine
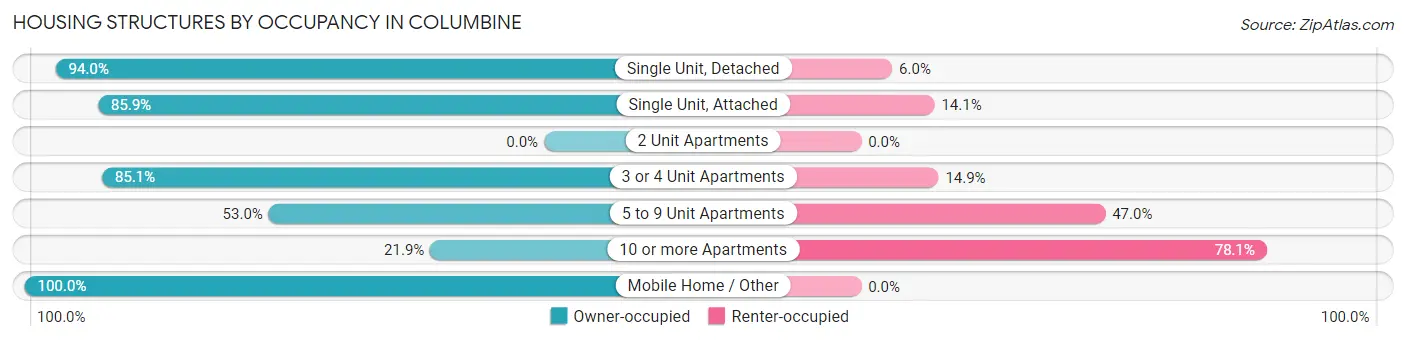
| Structure Type | Owner-occupied | Renter-occupied |
| Single Unit, Detached | 7,272 (94.0%) | 462 (6.0%) |
| Single Unit, Attached | 882 (85.9%) | 145 (14.1%) |
| 2 Unit Apartments | 0 (0.0%) | 0 (0.0%) |
| 3 or 4 Unit Apartments | 143 (85.1%) | 25 (14.9%) |
| 5 to 9 Unit Apartments | 97 (53.0%) | 86 (47.0%) |
| 10 or more Apartments | 110 (21.9%) | 392 (78.1%) |
| Mobile Home / Other | 40 (100.0%) | 0 (0.0%) |
| Total | 8,544 (88.5%) | 1,110 (11.5%) |
Housing Structures by Number of Rooms in Columbine
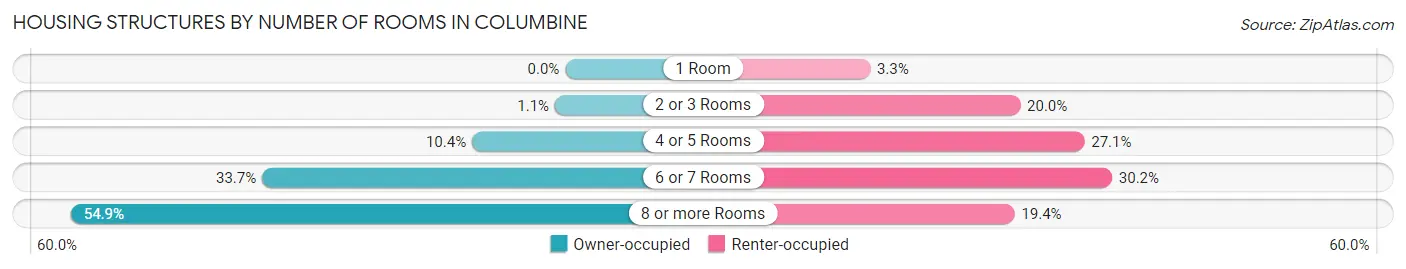
| Number of Rooms | Owner-occupied | Renter-occupied |
| 1 Room | 0 (0.0%) | 37 (3.3%) |
| 2 or 3 Rooms | 97 (1.1%) | 222 (20.0%) |
| 4 or 5 Rooms | 884 (10.3%) | 301 (27.1%) |
| 6 or 7 Rooms | 2,875 (33.7%) | 335 (30.2%) |
| 8 or more Rooms | 4,688 (54.9%) | 215 (19.4%) |
| Total | 8,544 (100.0%) | 1,110 (100.0%) |
Housing Structure by Heating Type in Columbine
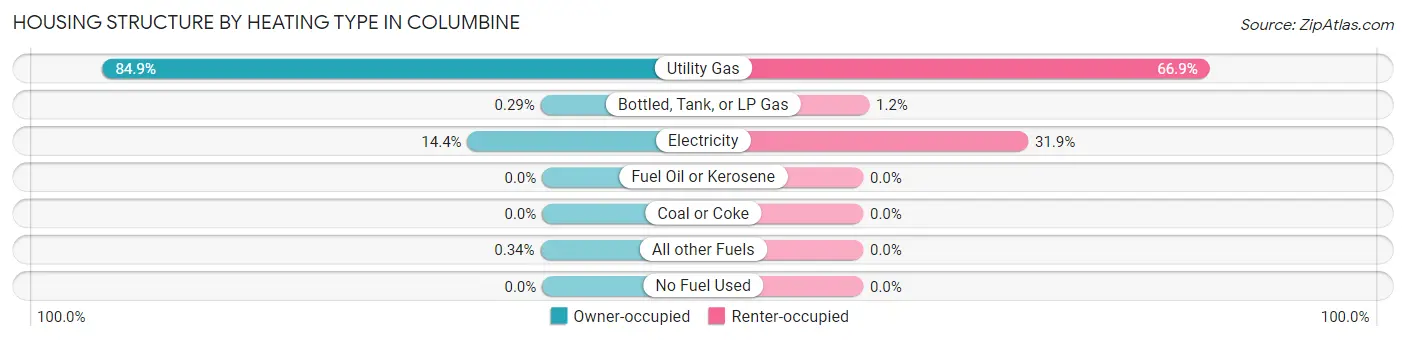
| Heating Type | Owner-occupied | Renter-occupied |
| Utility Gas | 7,257 (84.9%) | 743 (66.9%) |
| Bottled, Tank, or LP Gas | 25 (0.3%) | 13 (1.2%) |
| Electricity | 1,233 (14.4%) | 354 (31.9%) |
| Fuel Oil or Kerosene | 0 (0.0%) | 0 (0.0%) |
| Coal or Coke | 0 (0.0%) | 0 (0.0%) |
| All other Fuels | 29 (0.3%) | 0 (0.0%) |
| No Fuel Used | 0 (0.0%) | 0 (0.0%) |
| Total | 8,544 (100.0%) | 1,110 (100.0%) |
Household Vehicle Usage in Columbine
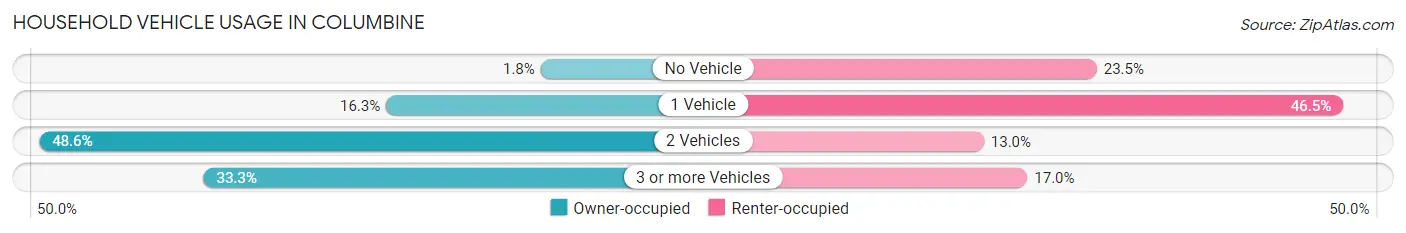
| Vehicles per Household | Owner-occupied | Renter-occupied |
| No Vehicle | 156 (1.8%) | 261 (23.5%) |
| 1 Vehicle | 1,389 (16.3%) | 516 (46.5%) |
| 2 Vehicles | 4,155 (48.6%) | 144 (13.0%) |
| 3 or more Vehicles | 2,844 (33.3%) | 189 (17.0%) |
| Total | 8,544 (100.0%) | 1,110 (100.0%) |
Real Estate & Mortgages in Columbine
Real Estate and Mortgage Overview in Columbine
| Characteristic | Without Mortgage | With Mortgage |
| Housing Units | 2,380 | 6,164 |
| Median Property Value | $530,600 | $557,100 |
| Median Household Income | $89,717 | $2,991 |
| Monthly Housing Costs | $634 | $1,121 |
| Real Estate Taxes | $2,746 | $131 |
Property Value by Mortgage Status in Columbine
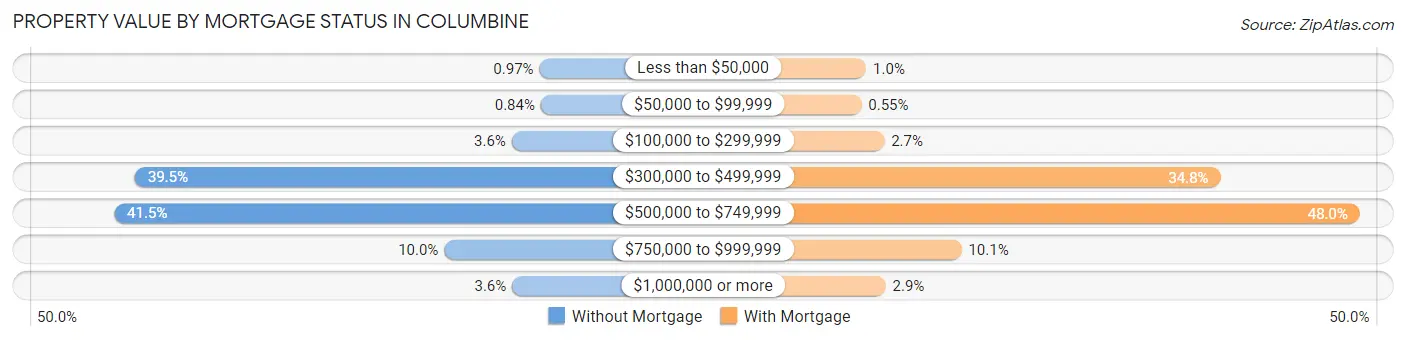
| Property Value | Without Mortgage | With Mortgage |
| Less than $50,000 | 23 (1.0%) | 62 (1.0%) |
| $50,000 to $99,999 | 20 (0.8%) | 34 (0.5%) |
| $100,000 to $299,999 | 86 (3.6%) | 168 (2.7%) |
| $300,000 to $499,999 | 940 (39.5%) | 2,142 (34.7%) |
| $500,000 to $749,999 | 987 (41.5%) | 2,960 (48.0%) |
| $750,000 to $999,999 | 239 (10.0%) | 622 (10.1%) |
| $1,000,000 or more | 85 (3.6%) | 176 (2.9%) |
| Total | 2,380 (100.0%) | 6,164 (100.0%) |
Household Income by Mortgage Status in Columbine
| Household Income | Without Mortgage | With Mortgage |
| Less than $10,000 | 122 (5.1%) | 111 (1.8%) |
| $10,000 to $24,999 | 163 (6.9%) | 9 (0.2%) |
| $25,000 to $34,999 | 108 (4.5%) | 202 (3.3%) |
| $35,000 to $49,999 | 269 (11.3%) | 37 (0.6%) |
| $50,000 to $74,999 | 318 (13.4%) | 253 (4.1%) |
| $75,000 to $99,999 | 340 (14.3%) | 378 (6.1%) |
| $100,000 to $149,999 | 461 (19.4%) | 619 (10.0%) |
| $150,000 or more | 599 (25.2%) | 1,675 (27.2%) |
| Total | 2,380 (100.0%) | 6,164 (100.0%) |
Property Value to Household Income Ratio in Columbine
| Value-to-Income Ratio | Without Mortgage | With Mortgage |
| Less than 2.0x | 196 (8.2%) | 148,120 (2,403.0%) |
| 2.0x to 2.9x | 260 (10.9%) | 515 (8.4%) |
| 3.0x to 3.9x | 291 (12.2%) | 1,652 (26.8%) |
| 4.0x or more | 1,576 (66.2%) | 1,402 (22.7%) |
| Total | 2,380 (100.0%) | 6,164 (100.0%) |
Real Estate Taxes by Mortgage Status in Columbine
| Property Taxes | Without Mortgage | With Mortgage |
| Less than $800 | 42 (1.8%) | 9 (0.2%) |
| $800 to $1,499 | 146 (6.1%) | 136 (2.2%) |
| $800 to $1,499 | 2,110 (88.7%) | 587 (9.5%) |
| Total | 2,380 (100.0%) | 6,164 (100.0%) |
Health & Disability in Columbine
Health Insurance Coverage by Age in Columbine
| Age Bracket | With Coverage | Without Coverage |
| Under 6 Years | 1,624 (87.5%) | 232 (12.5%) |
| 6 to 18 Years | 4,574 (96.4%) | 171 (3.6%) |
| 19 to 25 Years | 1,328 (98.2%) | 25 (1.8%) |
| 26 to 34 Years | 2,487 (92.3%) | 208 (7.7%) |
| 35 to 44 Years | 3,514 (96.1%) | 144 (3.9%) |
| 45 to 54 Years | 3,119 (95.9%) | 135 (4.2%) |
| 55 to 64 Years | 3,246 (97.7%) | 75 (2.3%) |
| 65 to 74 Years | 2,947 (100.0%) | 0 (0.0%) |
| 75 Years and older | 2,038 (98.9%) | 22 (1.1%) |
| Total | 24,877 (96.1%) | 1,012 (3.9%) |
Health Insurance Coverage by Citizenship Status in Columbine
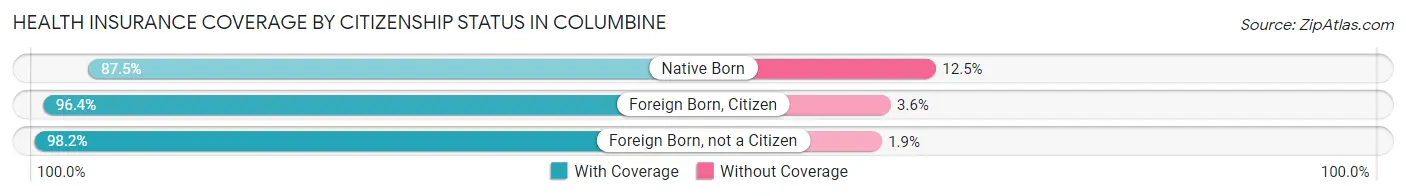
| Citizenship Status | With Coverage | Without Coverage |
| Native Born | 1,624 (87.5%) | 232 (12.5%) |
| Foreign Born, Citizen | 4,574 (96.4%) | 171 (3.6%) |
| Foreign Born, not a Citizen | 1,328 (98.2%) | 25 (1.8%) |
Health Insurance Coverage by Household Income in Columbine
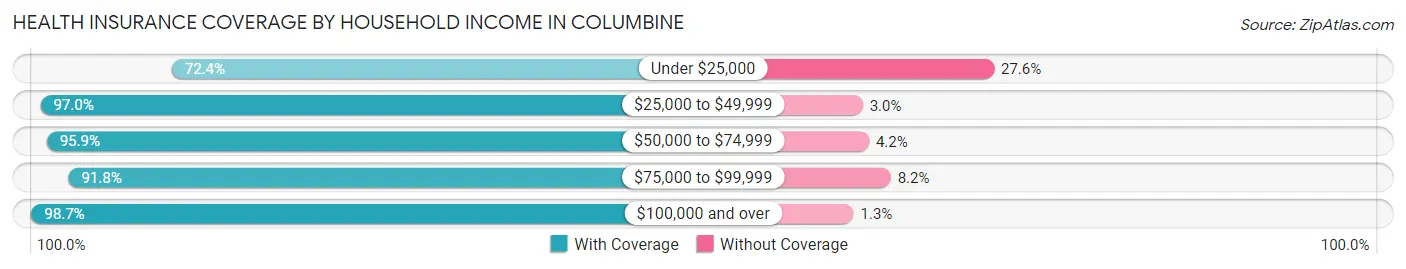
| Household Income | With Coverage | Without Coverage |
| Under $25,000 | 1,118 (72.4%) | 426 (27.6%) |
| $25,000 to $49,999 | 1,433 (97.0%) | 44 (3.0%) |
| $50,000 to $74,999 | 1,918 (95.9%) | 83 (4.2%) |
| $75,000 to $99,999 | 2,544 (91.8%) | 228 (8.2%) |
| $100,000 and over | 17,756 (98.7%) | 231 (1.3%) |
Public vs Private Health Insurance Coverage by Age in Columbine
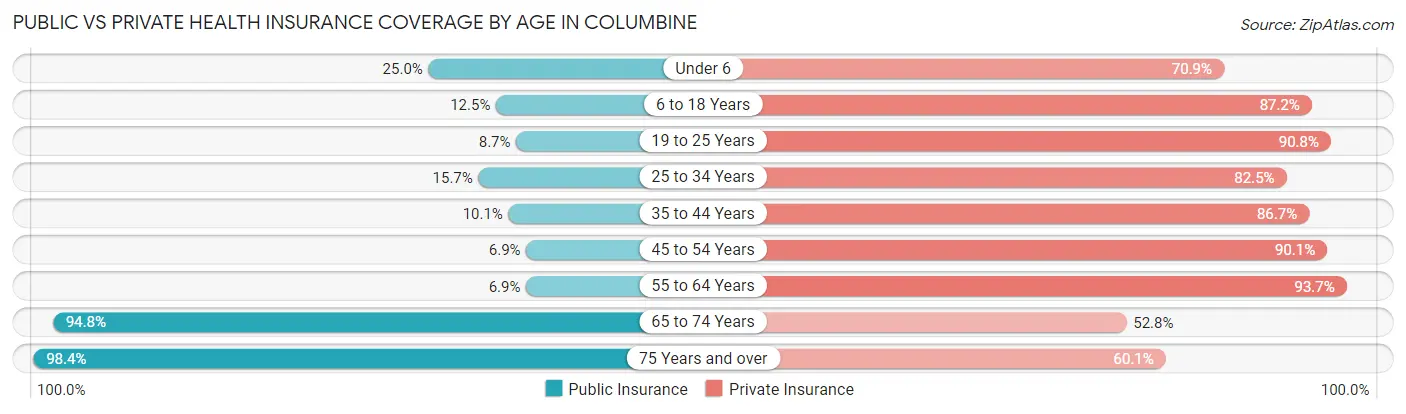
| Age Bracket | Public Insurance | Private Insurance |
| Under 6 | 464 (25.0%) | 1,316 (70.9%) |
| 6 to 18 Years | 591 (12.5%) | 4,138 (87.2%) |
| 19 to 25 Years | 118 (8.7%) | 1,228 (90.8%) |
| 25 to 34 Years | 424 (15.7%) | 2,224 (82.5%) |
| 35 to 44 Years | 371 (10.1%) | 3,172 (86.7%) |
| 45 to 54 Years | 223 (6.9%) | 2,931 (90.1%) |
| 55 to 64 Years | 228 (6.9%) | 3,111 (93.7%) |
| 65 to 74 Years | 2,793 (94.8%) | 1,556 (52.8%) |
| 75 Years and over | 2,027 (98.4%) | 1,238 (60.1%) |
| Total | 7,239 (28.0%) | 20,914 (80.8%) |
Disability Status by Sex by Age in Columbine
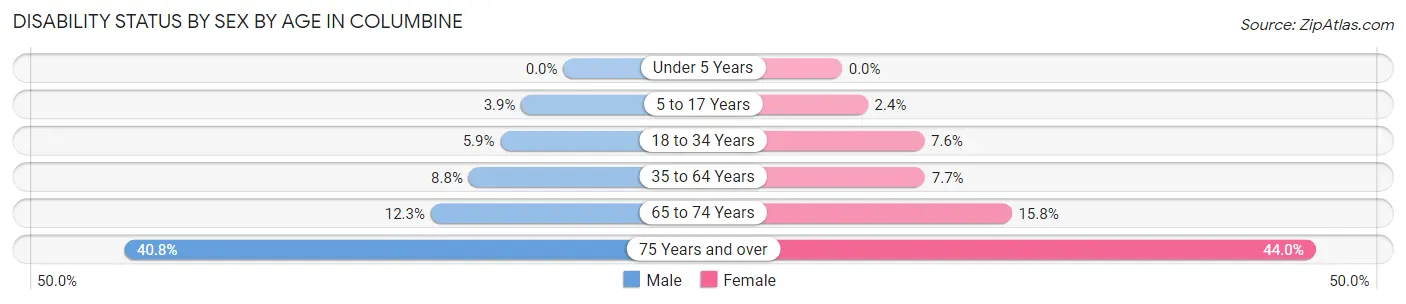
| Age Bracket | Male | Female |
| Under 5 Years | 0 (0.0%) | 0 (0.0%) |
| 5 to 17 Years | 91 (3.9%) | 53 (2.4%) |
| 18 to 34 Years | 128 (5.9%) | 176 (7.6%) |
| 35 to 64 Years | 453 (8.8%) | 391 (7.7%) |
| 65 to 74 Years | 165 (12.3%) | 253 (15.8%) |
| 75 Years and over | 377 (40.8%) | 499 (44.0%) |
Disability Class by Sex by Age in Columbine
Disability Class: Hearing Difficulty
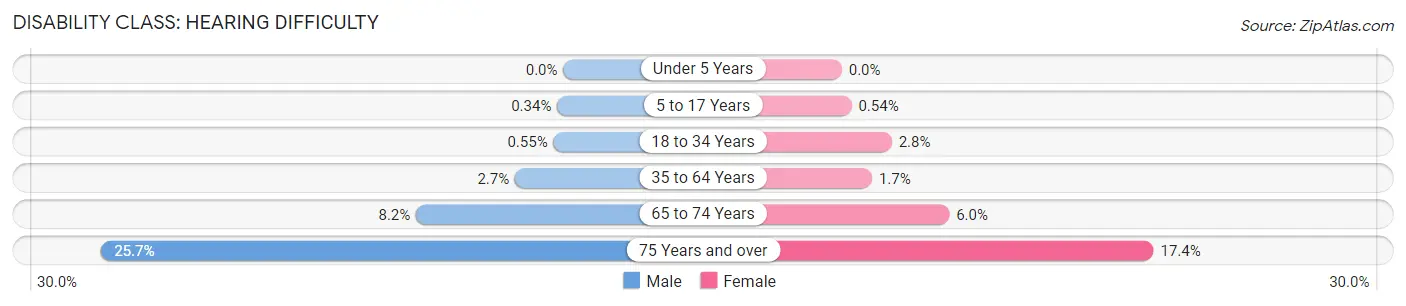
| Age Bracket | Male | Female |
| Under 5 Years | 0 (0.0%) | 0 (0.0%) |
| 5 to 17 Years | 8 (0.3%) | 12 (0.5%) |
| 18 to 34 Years | 12 (0.5%) | 64 (2.8%) |
| 35 to 64 Years | 139 (2.7%) | 85 (1.7%) |
| 65 to 74 Years | 110 (8.2%) | 96 (6.0%) |
| 75 Years and over | 238 (25.7%) | 197 (17.4%) |
Disability Class: Vision Difficulty
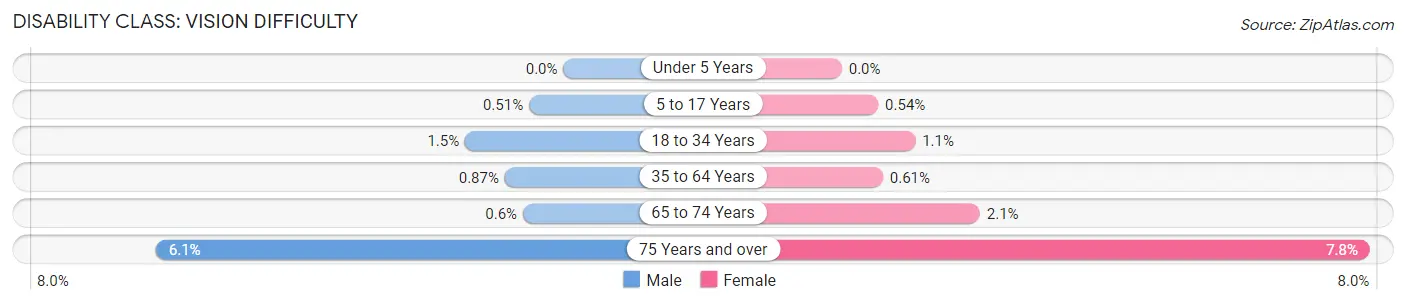
| Age Bracket | Male | Female |
| Under 5 Years | 0 (0.0%) | 0 (0.0%) |
| 5 to 17 Years | 12 (0.5%) | 12 (0.5%) |
| 18 to 34 Years | 32 (1.5%) | 25 (1.1%) |
| 35 to 64 Years | 45 (0.9%) | 31 (0.6%) |
| 65 to 74 Years | 8 (0.6%) | 33 (2.1%) |
| 75 Years and over | 56 (6.0%) | 89 (7.8%) |
Disability Class: Cognitive Difficulty
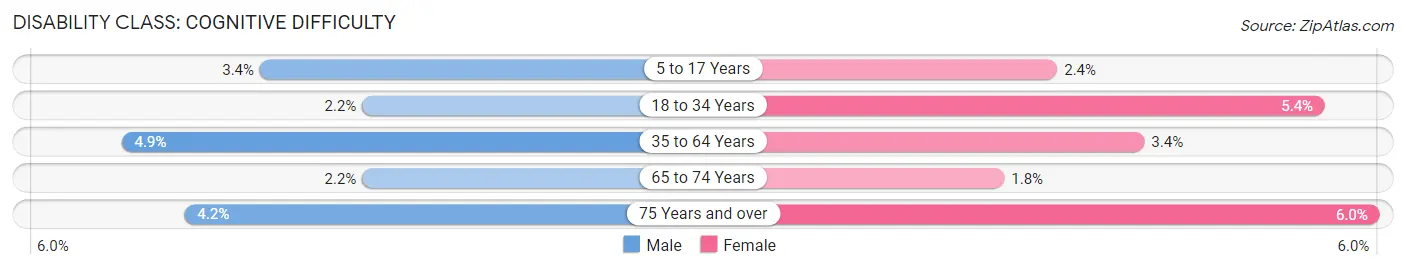
| Age Bracket | Male | Female |
| 5 to 17 Years | 79 (3.4%) | 53 (2.4%) |
| 18 to 34 Years | 49 (2.2%) | 124 (5.4%) |
| 35 to 64 Years | 254 (4.9%) | 171 (3.4%) |
| 65 to 74 Years | 30 (2.2%) | 29 (1.8%) |
| 75 Years and over | 39 (4.2%) | 68 (6.0%) |
Disability Class: Ambulatory Difficulty
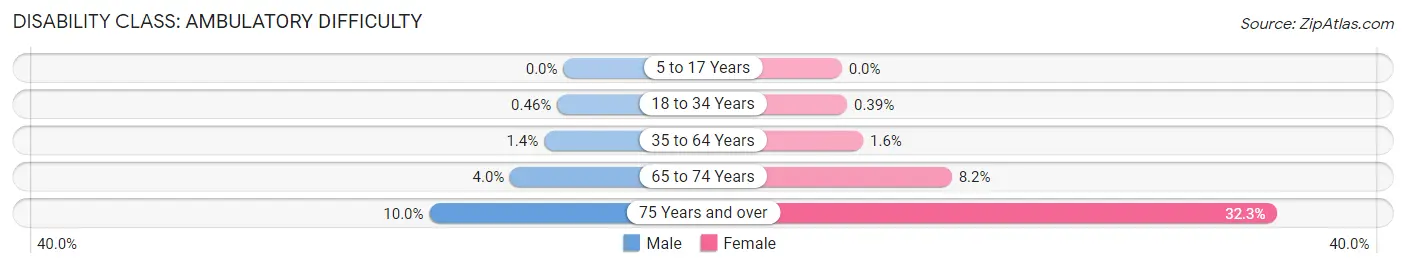
| Age Bracket | Male | Female |
| 5 to 17 Years | 0 (0.0%) | 0 (0.0%) |
| 18 to 34 Years | 10 (0.5%) | 9 (0.4%) |
| 35 to 64 Years | 74 (1.4%) | 80 (1.6%) |
| 65 to 74 Years | 53 (4.0%) | 131 (8.2%) |
| 75 Years and over | 92 (10.0%) | 367 (32.3%) |
Disability Class: Self-Care Difficulty
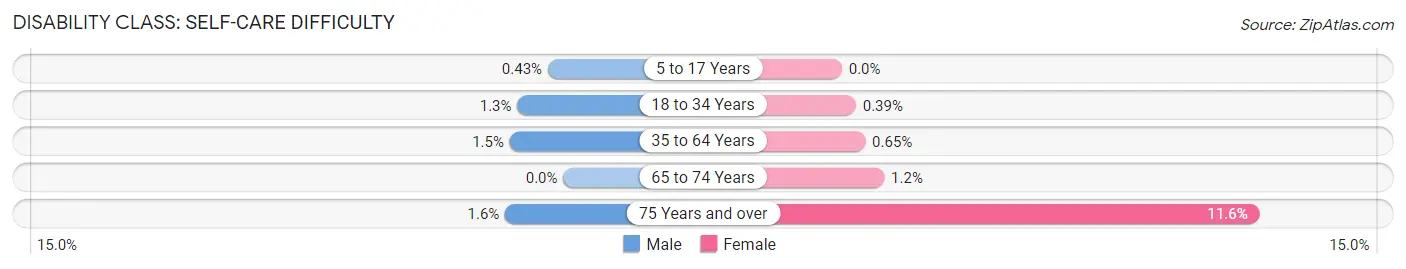
| Age Bracket | Male | Female |
| 5 to 17 Years | 10 (0.4%) | 0 (0.0%) |
| 18 to 34 Years | 28 (1.3%) | 9 (0.4%) |
| 35 to 64 Years | 77 (1.5%) | 33 (0.6%) |
| 65 to 74 Years | 0 (0.0%) | 19 (1.2%) |
| 75 Years and over | 15 (1.6%) | 132 (11.6%) |
Technology Access in Columbine
Computing Device Access in Columbine
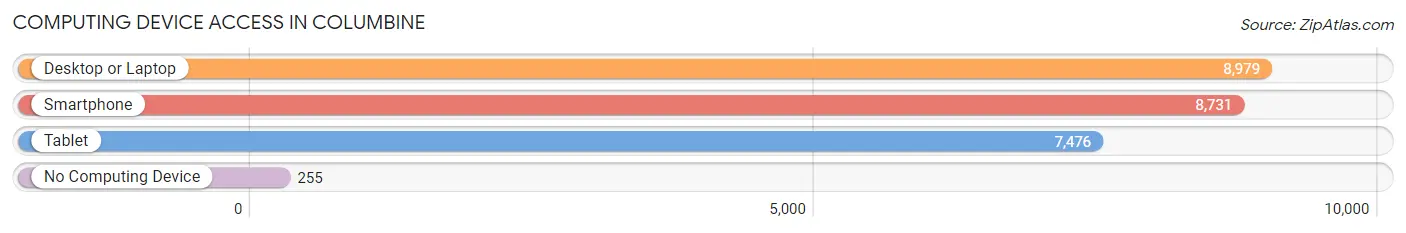
| Device Type | # Households | % Households |
| Desktop or Laptop | 8,979 | 93.0% |
| Smartphone | 8,731 | 90.4% |
| Tablet | 7,476 | 77.4% |
| No Computing Device | 255 | 2.6% |
| Total | 9,654 | 100.0% |
Internet Access in Columbine
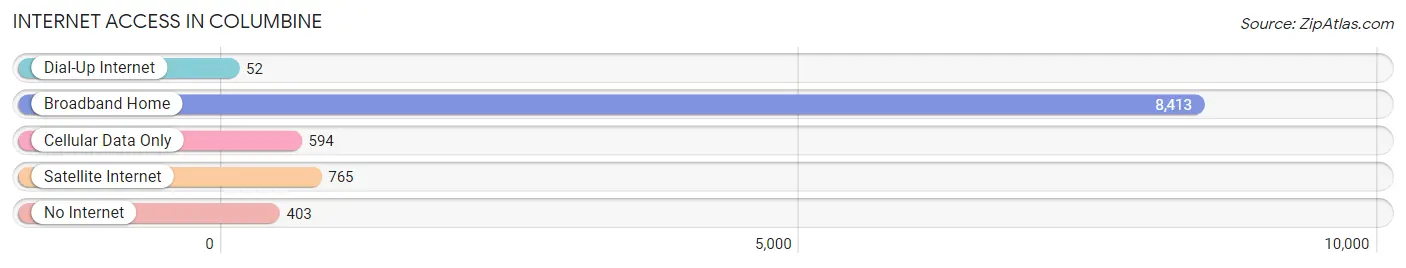
| Internet Type | # Households | % Households |
| Dial-Up Internet | 52 | 0.5% |
| Broadband Home | 8,413 | 87.2% |
| Cellular Data Only | 594 | 6.1% |
| Satellite Internet | 765 | 7.9% |
| No Internet | 403 | 4.2% |
| Total | 9,654 | 100.0% |
Columbine Summary
Colarado's Columbine is a small unincorporated community located in Jefferson County, Colorado. It is situated in the foothills of the Rocky Mountains, approximately 15 miles southwest of Denver. The community is named after the state flower, the columbine.
History
The area that is now Columbine was first settled in the late 1800s by homesteaders. The first post office was established in 1891 and the town was officially incorporated in 1902. The town was named after the state flower, the columbine.
The town grew slowly but steadily over the years, and by the 1950s it had become a popular destination for tourists and outdoor enthusiasts. The town was also home to a number of small businesses, including a general store, a gas station, and a few restaurants.
In 1999, Columbine was thrust into the national spotlight when two students at Columbine High School committed a mass shooting, killing 12 students and one teacher. The tragedy shocked the nation and brought attention to the town of Columbine.
Geography
Columbine is located in the foothills of the Rocky Mountains, approximately 15 miles southwest of Denver. The town is situated at an elevation of 5,890 feet above sea level. The town is surrounded by rolling hills and open fields, with the Rocky Mountains visible in the distance.
The town is located in a semi-arid climate, with hot summers and cold winters. The average annual temperature is around 50 degrees Fahrenheit. The average annual precipitation is around 16 inches.
Economy
The economy of Columbine is largely based on tourism and outdoor recreation. The town is home to a number of small businesses, including restaurants, gas stations, and a general store. The town is also home to a number of outdoor recreation businesses, such as fishing and hunting guides, horseback riding, and camping.
The town is also home to a number of small manufacturing businesses, including a furniture factory and a metal fabrication shop.
Demographics
As of the 2010 census, the population of Columbine was 8,908. The racial makeup of the town was 94.3% White, 1.2% African American, 0.7% Native American, 0.7% Asian, 0.1% Pacific Islander, 1.2% from other races, and 2.0% from two or more races. Hispanic or Latino of any race were 4.3% of the population.
The median household income in Columbine was $60,945, and the median family income was $68,958. The per capita income for the town was $27,845. About 4.3% of families and 5.7% of the population were below the poverty line, including 6.3% of those under age 18 and 4.2% of those age 65 or over.
Common Questions
What is Per Capita Income in Columbine?
Per Capita income in Columbine is $54,175.
What is the Median Family Income in Columbine?
Median Family Income in Columbine is $133,622.
What is the Median Household income in Columbine?
Median Household Income in Columbine is $122,048.
What is Income or Wage Gap in Columbine?
Income or Wage Gap in Columbine is 33.9%.
Women in Columbine earn 66.1 cents for every dollar earned by a man.
What is Family Income Deficit in Columbine?
Family Income Deficit in Columbine is $10,582.
Families that are below poverty line in Columbine earn $10,582 less on average than the poverty threshold level.
What is Inequality or Gini Index in Columbine?
Inequality or Gini Index in Columbine is 0.38.
What is the Total Population of Columbine?
Total Population of Columbine is 25,940.
What is the Total Male Population of Columbine?
Total Male Population of Columbine is 12,797.
What is the Total Female Population of Columbine?
Total Female Population of Columbine is 13,143.
What is the Ratio of Males per 100 Females in Columbine?
There are 97.37 Males per 100 Females in Columbine.
What is the Ratio of Females per 100 Males in Columbine?
There are 102.70 Females per 100 Males in Columbine.
What is the Median Population Age in Columbine?
Median Population Age in Columbine is 41.0 Years.
What is the Average Family Size in Columbine
Average Family Size in Columbine is 3.0 People.
What is the Average Household Size in Columbine
Average Household Size in Columbine is 2.7 People.
How Large is the Labor Force in Columbine?
There are 13,692 People in the Labor Forcein in Columbine.
What is the Percentage of People in the Labor Force in Columbine?
66.8% of People are in the Labor Force in Columbine.
What is the Unemployment Rate in Columbine?
Unemployment Rate in Columbine is 3.6%.