Gunbarrel, CO Map & Demographics
Gunbarrel Map
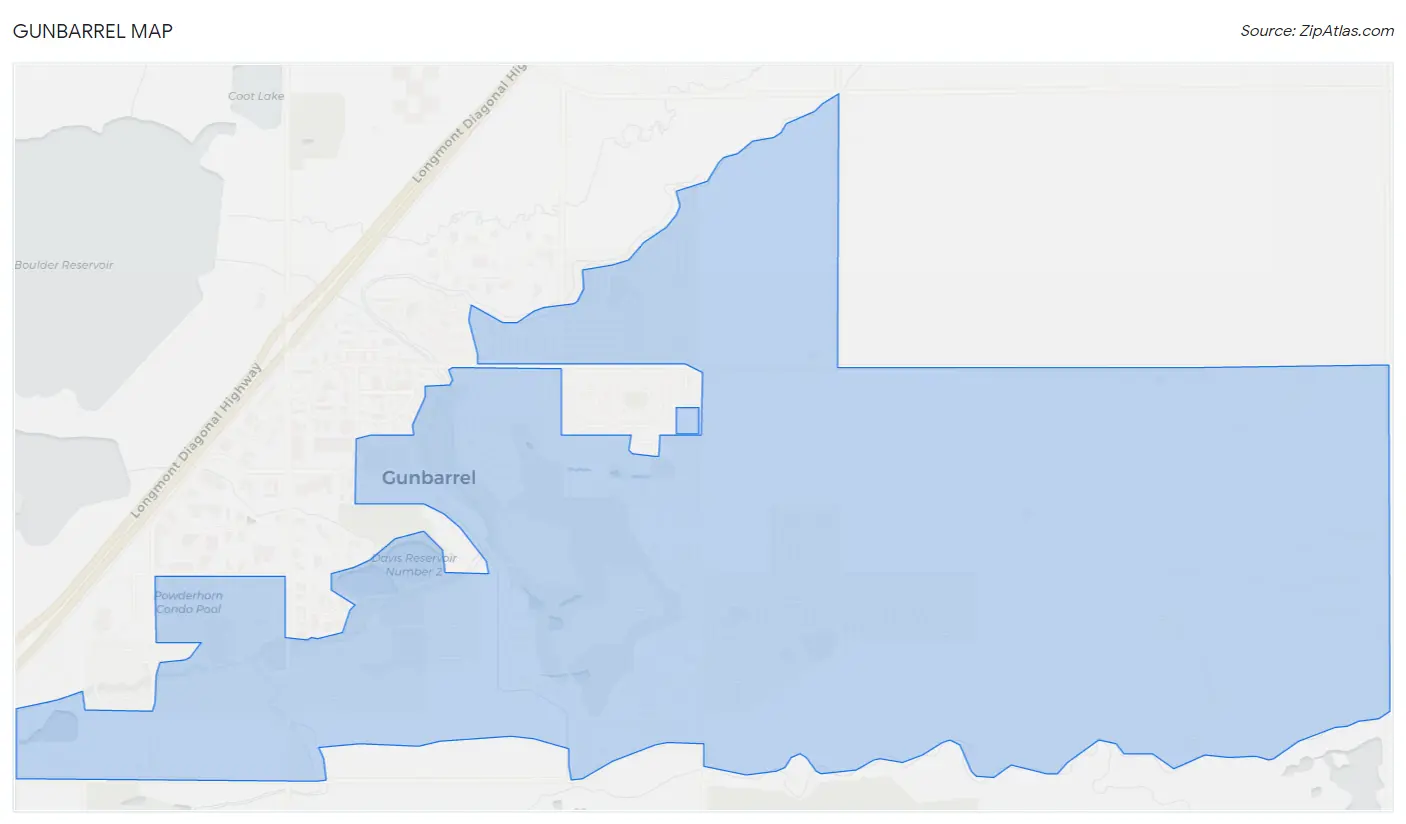
Gunbarrel Overview
$65,695
PER CAPITA INCOME
$149,688
AVG FAMILY INCOME
$105,335
AVG HOUSEHOLD INCOME
42.4%
WAGE / INCOME GAP [ % ]
57.6¢/ $1
WAGE / INCOME GAP [ $ ]
$8,397
FAMILY INCOME DEFICIT
0.46
INEQUALITY / GINI INDEX
10,108
TOTAL POPULATION
5,177
MALE POPULATION
4,931
FEMALE POPULATION
104.99
MALES / 100 FEMALES
95.25
FEMALES / 100 MALES
42.5
MEDIAN AGE
2.7
AVG FAMILY SIZE
2.1
AVG HOUSEHOLD SIZE
6,163
LABOR FORCE [ PEOPLE ]
69.5%
PERCENT IN LABOR FORCE
5.6%
UNEMPLOYMENT RATE
Income in Gunbarrel
Income Overview in Gunbarrel
Per Capita Income in Gunbarrel is $65,695, while median incomes of families and households are $149,688 and $105,335 respectively.
| Characteristic | Number | Measure |
| Per Capita Income | 10,108 | $65,695 |
| Median Family Income | 2,370 | $149,688 |
| Mean Family Income | 2,370 | $194,589 |
| Median Household Income | 4,699 | $105,335 |
| Mean Household Income | 4,699 | $140,386 |
| Income Deficit | 2,370 | $8,397 |
| Wage / Income Gap (%) | 10,108 | 42.42% |
| Wage / Income Gap ($) | 10,108 | 57.58¢ per $1 |
| Gini / Inequality Index | 10,108 | 0.46 |
Earnings by Sex in Gunbarrel
Average Earnings in Gunbarrel are $60,234, $69,328 for men and $39,922 for women, a difference of 42.4%.
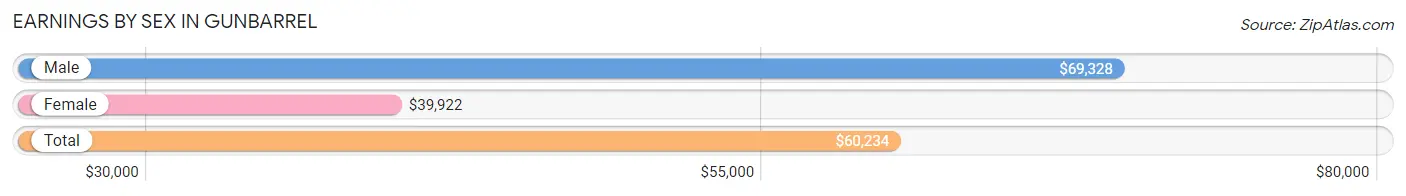
| Sex | Number | Average Earnings |
| Male | 3,723 (56.8%) | $69,328 |
| Female | 2,836 (43.2%) | $39,922 |
| Total | 6,559 (100.0%) | $60,234 |
Earnings by Sex by Income Bracket in Gunbarrel
The most common earnings brackets in Gunbarrel are $100,000+ for men (1,237 | 33.2%) and $100,000+ for women (561 | 19.8%).
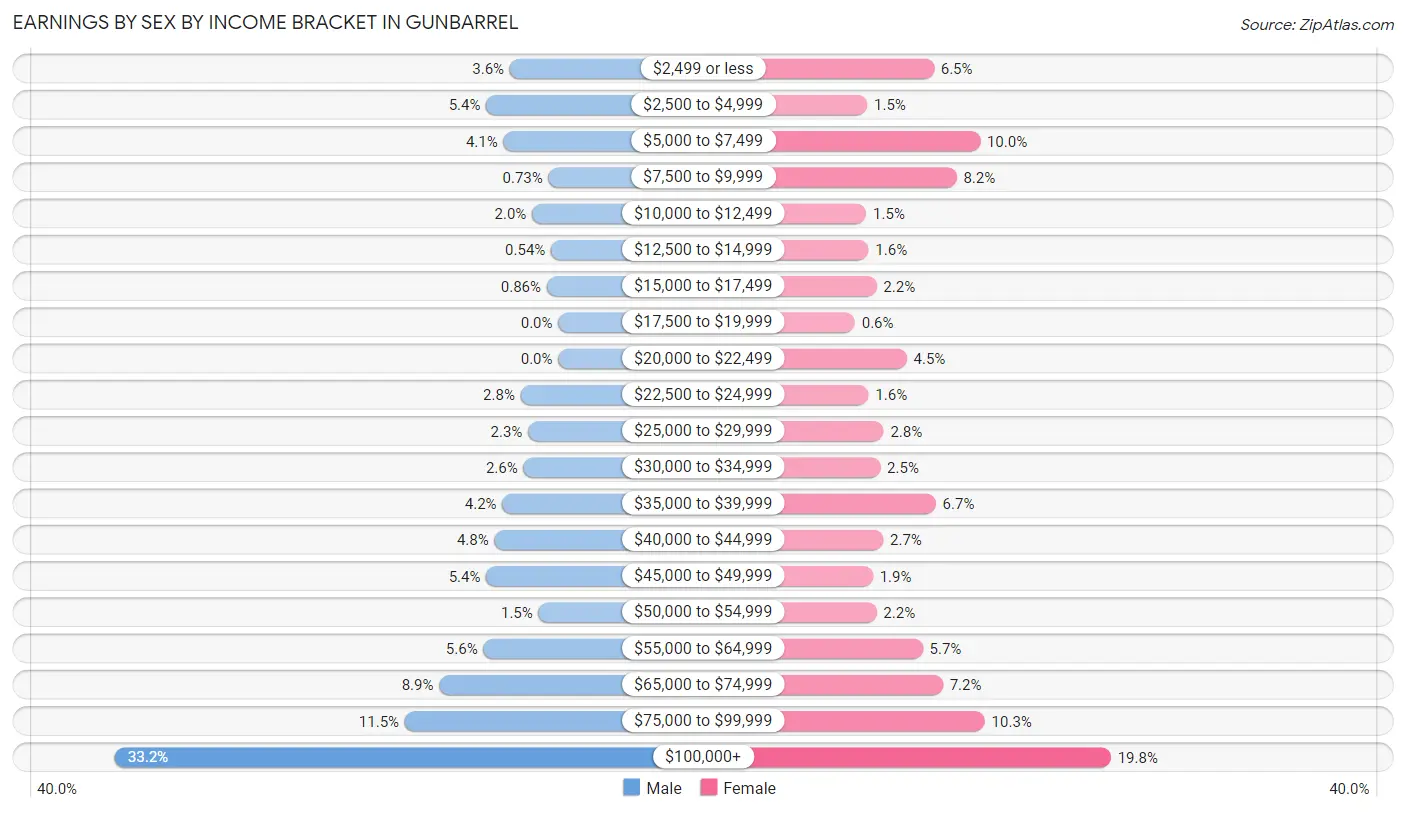
| Income | Male | Female |
| $2,499 or less | 135 (3.6%) | 185 (6.5%) |
| $2,500 to $4,999 | 201 (5.4%) | 43 (1.5%) |
| $5,000 to $7,499 | 153 (4.1%) | 283 (10.0%) |
| $7,500 to $9,999 | 27 (0.7%) | 233 (8.2%) |
| $10,000 to $12,499 | 73 (2.0%) | 41 (1.5%) |
| $12,500 to $14,999 | 20 (0.5%) | 46 (1.6%) |
| $15,000 to $17,499 | 32 (0.9%) | 63 (2.2%) |
| $17,500 to $19,999 | 0 (0.0%) | 17 (0.6%) |
| $20,000 to $22,499 | 0 (0.0%) | 127 (4.5%) |
| $22,500 to $24,999 | 105 (2.8%) | 46 (1.6%) |
| $25,000 to $29,999 | 84 (2.3%) | 78 (2.8%) |
| $30,000 to $34,999 | 97 (2.6%) | 71 (2.5%) |
| $35,000 to $39,999 | 156 (4.2%) | 189 (6.7%) |
| $40,000 to $44,999 | 178 (4.8%) | 77 (2.7%) |
| $45,000 to $49,999 | 201 (5.4%) | 55 (1.9%) |
| $50,000 to $54,999 | 55 (1.5%) | 63 (2.2%) |
| $55,000 to $64,999 | 209 (5.6%) | 161 (5.7%) |
| $65,000 to $74,999 | 332 (8.9%) | 204 (7.2%) |
| $75,000 to $99,999 | 428 (11.5%) | 293 (10.3%) |
| $100,000+ | 1,237 (33.2%) | 561 (19.8%) |
| Total | 3,723 (100.0%) | 2,836 (100.0%) |
Earnings by Sex by Educational Attainment in Gunbarrel
Average earnings in Gunbarrel are $76,625 for men and $54,763 for women, a difference of 28.5%. Men with an educational attainment of graduate degree enjoy the highest average annual earnings of $106,563, while those with college or associate's degree education earn the least with $43,992. Women with an educational attainment of less than high school earn the most with the average annual earnings of $250,001, while those with college or associate's degree education have the smallest earnings of $28,167.
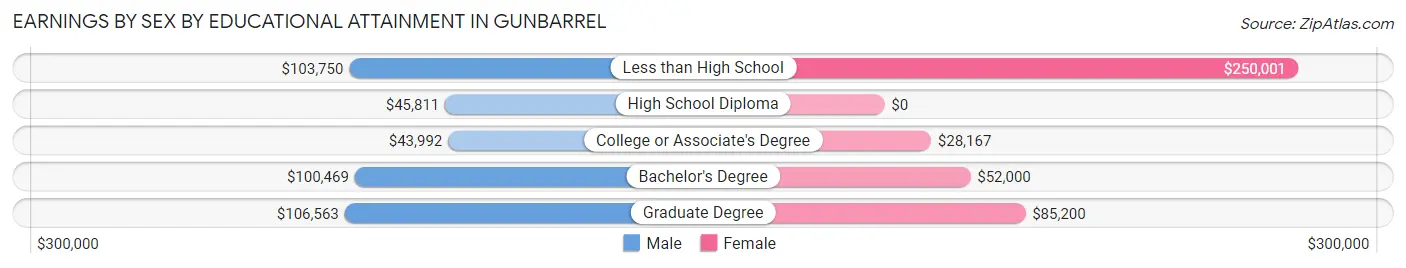
| Educational Attainment | Male Income | Female Income |
| Less than High School | $103,750 | $250,001 |
| High School Diploma | $45,811 | $0 |
| College or Associate's Degree | $43,992 | $28,167 |
| Bachelor's Degree | $100,469 | $52,000 |
| Graduate Degree | $106,563 | $85,200 |
| Total | $76,625 | $54,763 |
Family Income in Gunbarrel
Family Income Brackets in Gunbarrel
According to the Gunbarrel family income data, there are 851 families falling into the $200,000+ income range, which is the most common income bracket and makes up 35.9% of all families. Conversely, the $10,000 to $14,999 income bracket is the least frequent group with only 5 families (0.2%) belonging to this category.
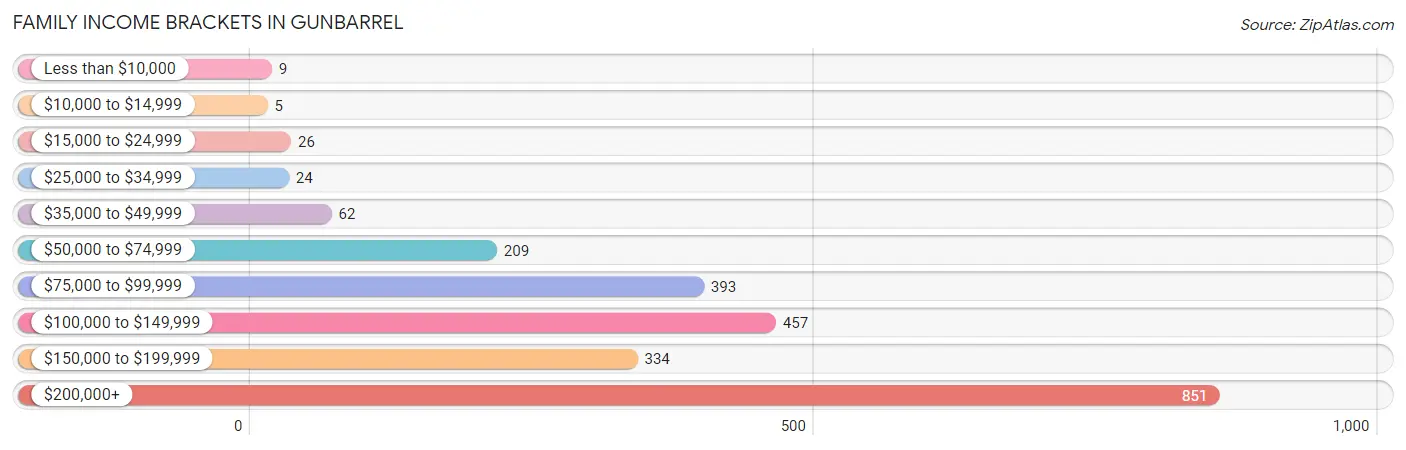
| Income Bracket | # Families | % Families |
| Less than $10,000 | 9 | 0.4% |
| $10,000 to $14,999 | 5 | 0.2% |
| $15,000 to $24,999 | 26 | 1.1% |
| $25,000 to $34,999 | 24 | 1.0% |
| $35,000 to $49,999 | 62 | 2.6% |
| $50,000 to $74,999 | 209 | 8.8% |
| $75,000 to $99,999 | 393 | 16.6% |
| $100,000 to $149,999 | 457 | 19.3% |
| $150,000 to $199,999 | 334 | 14.1% |
| $200,000+ | 851 | 35.9% |
Family Income by Famaliy Size in Gunbarrel
5-person families (97 | 4.1%) account for the highest median family income in Gunbarrel with $250,001 per family, while 2-person families (1,341 | 56.6%) have the highest median income of $69,219 per family member.
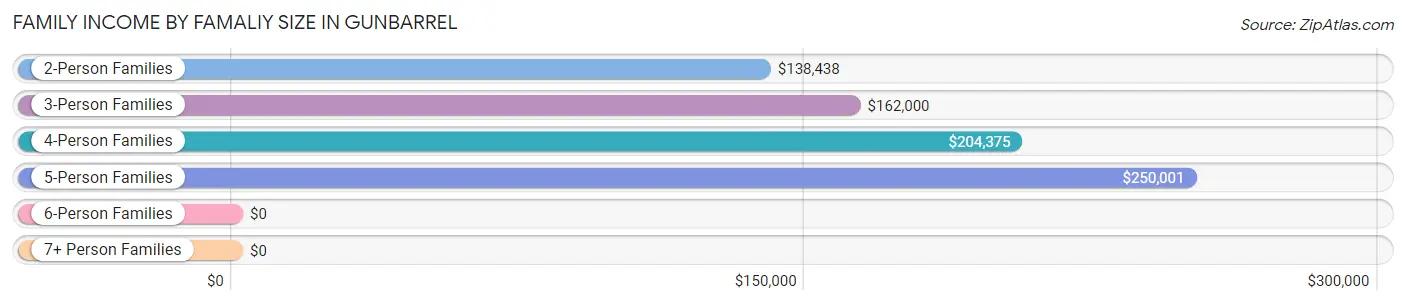
| Income Bracket | # Families | Median Income |
| 2-Person Families | 1,341 (56.6%) | $138,438 |
| 3-Person Families | 516 (21.8%) | $162,000 |
| 4-Person Families | 412 (17.4%) | $204,375 |
| 5-Person Families | 97 (4.1%) | $250,001 |
| 6-Person Families | 4 (0.2%) | $0 |
| 7+ Person Families | 0 (0.0%) | $0 |
| Total | 2,370 (100.0%) | $149,688 |
Family Income by Number of Earners in Gunbarrel
The median family income in Gunbarrel is $149,688, with families comprising 3+ earners (189) having the highest median family income of $216,821, while families with no earners (314) have the lowest median family income of $102,000, accounting for 8.0% and 13.3% of families, respectively.
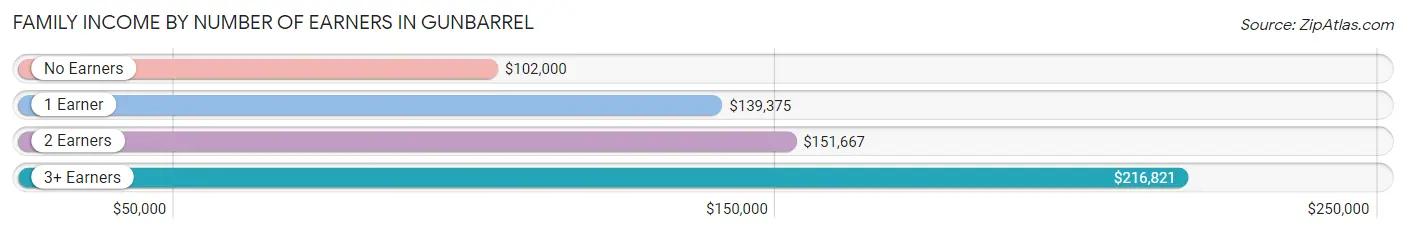
| Number of Earners | # Families | Median Income |
| No Earners | 314 (13.3%) | $102,000 |
| 1 Earner | 619 (26.1%) | $139,375 |
| 2 Earners | 1,248 (52.7%) | $151,667 |
| 3+ Earners | 189 (8.0%) | $216,821 |
| Total | 2,370 (100.0%) | $149,688 |
Household Income in Gunbarrel
Household Income Brackets in Gunbarrel
With 1,048 households falling in the category, the $200,000+ income range is the most frequent in Gunbarrel, accounting for 22.3% of all households. In contrast, only 146 households (3.1%) fall into the $10,000 to $14,999 income bracket, making it the least populous group.
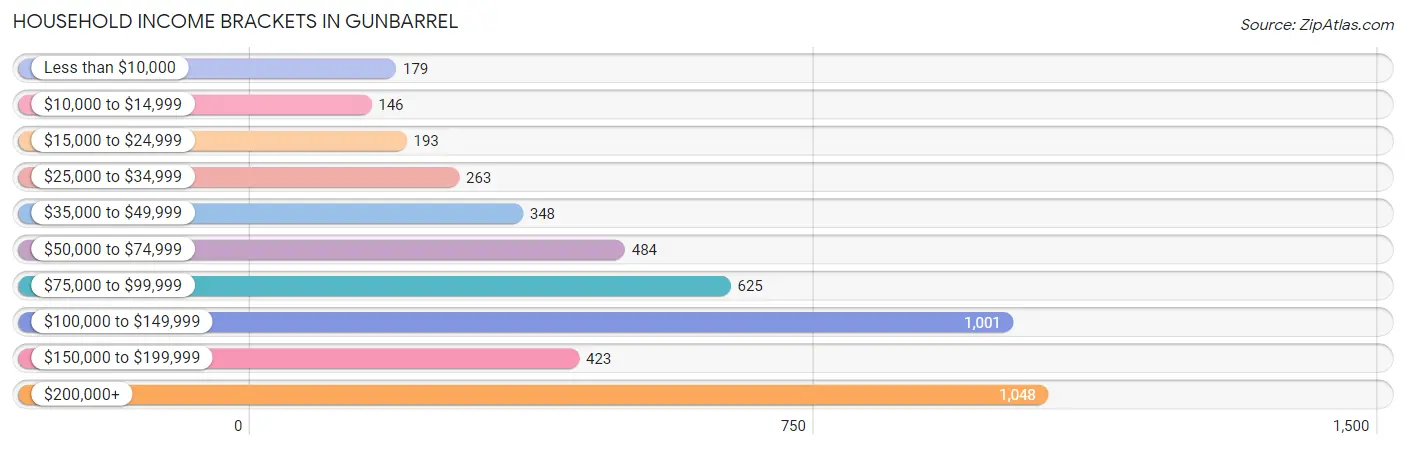
| Income Bracket | # Households | % Households |
| Less than $10,000 | 179 | 3.8% |
| $10,000 to $14,999 | 146 | 3.1% |
| $15,000 to $24,999 | 193 | 4.1% |
| $25,000 to $34,999 | 263 | 5.6% |
| $35,000 to $49,999 | 348 | 7.4% |
| $50,000 to $74,999 | 484 | 10.3% |
| $75,000 to $99,999 | 625 | 13.3% |
| $100,000 to $149,999 | 1,001 | 21.3% |
| $150,000 to $199,999 | 423 | 9.0% |
| $200,000+ | 1,048 | 22.3% |
Household Income by Householder Age in Gunbarrel
The median household income in Gunbarrel is $105,335, with the highest median household income of $112,256 found in the 45 to 64 years age bracket for the primary householder. A total of 1,560 households (33.2%) fall into this category. Meanwhile, the 15 to 24 years age bracket for the primary householder has the lowest median household income of $73,375, with 301 households (6.4%) in this group.
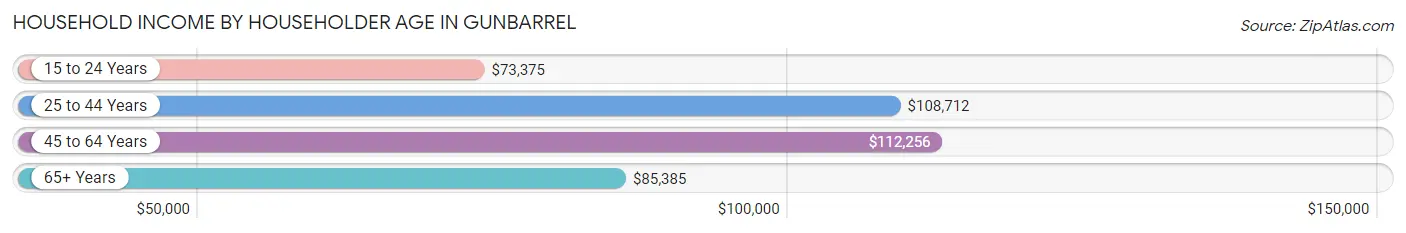
| Income Bracket | # Households | Median Income |
| 15 to 24 Years | 301 (6.4%) | $73,375 |
| 25 to 44 Years | 1,564 (33.3%) | $108,712 |
| 45 to 64 Years | 1,560 (33.2%) | $112,256 |
| 65+ Years | 1,274 (27.1%) | $85,385 |
| Total | 4,699 (100.0%) | $105,335 |
Poverty in Gunbarrel
Income Below Poverty by Sex and Age in Gunbarrel
With 9.7% poverty level for males and 10.5% for females among the residents of Gunbarrel, 18 to 24 year old males and 18 to 24 year old females are the most vulnerable to poverty, with 142 males (30.7%) and 134 females (33.0%) in their respective age groups living below the poverty level.
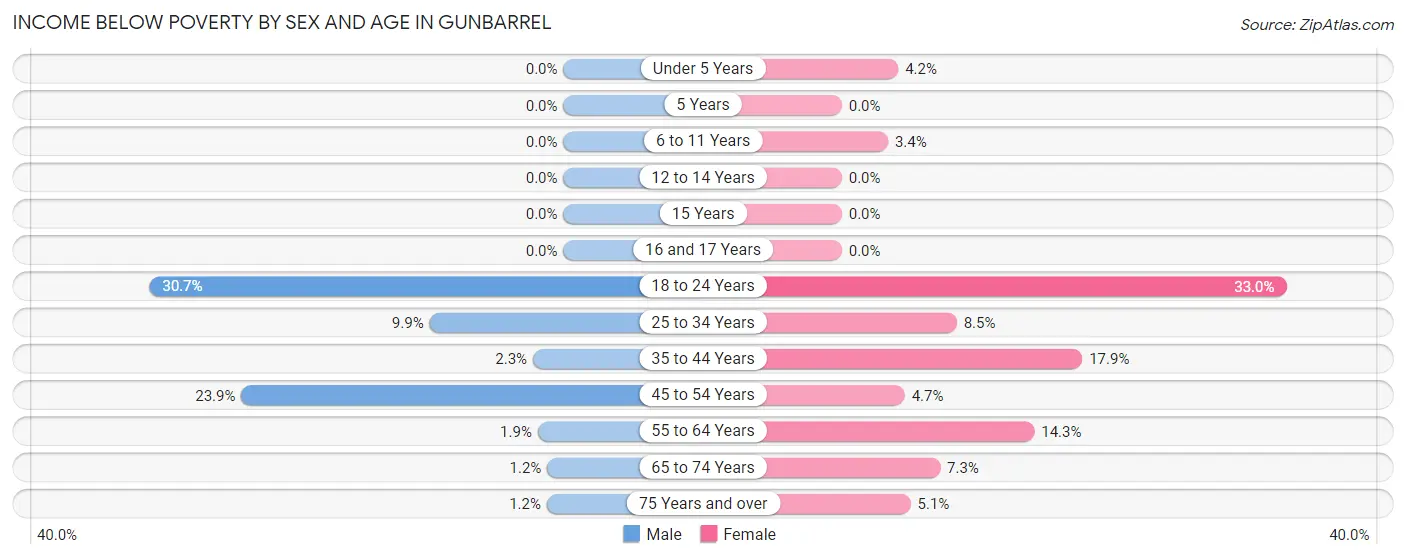
| Age Bracket | Male | Female |
| Under 5 Years | 0 (0.0%) | 16 (4.2%) |
| 5 Years | 0 (0.0%) | 0 (0.0%) |
| 6 to 11 Years | 0 (0.0%) | 8 (3.4%) |
| 12 to 14 Years | 0 (0.0%) | 0 (0.0%) |
| 15 Years | 0 (0.0%) | 0 (0.0%) |
| 16 and 17 Years | 0 (0.0%) | 0 (0.0%) |
| 18 to 24 Years | 142 (30.7%) | 134 (33.0%) |
| 25 to 34 Years | 109 (9.9%) | 65 (8.5%) |
| 35 to 44 Years | 16 (2.3%) | 88 (17.8%) |
| 45 to 54 Years | 213 (23.9%) | 33 (4.7%) |
| 55 to 64 Years | 12 (1.9%) | 116 (14.3%) |
| 65 to 74 Years | 6 (1.2%) | 34 (7.3%) |
| 75 Years and over | 4 (1.2%) | 21 (5.1%) |
| Total | 502 (9.7%) | 515 (10.5%) |
Income Above Poverty by Sex and Age in Gunbarrel
According to the poverty statistics in Gunbarrel, males aged under 5 years and females aged 5 years are the age groups that are most secure financially, with 100.0% of males and 100.0% of females in these age groups living above the poverty line.
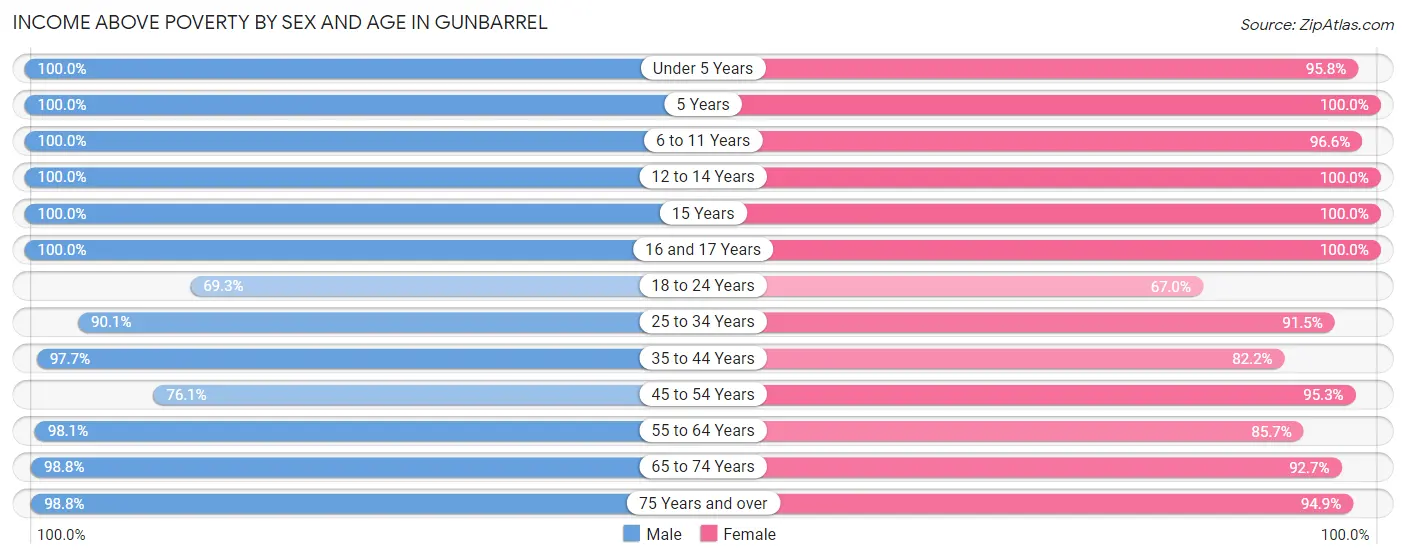
| Age Bracket | Male | Female |
| Under 5 Years | 104 (100.0%) | 366 (95.8%) |
| 5 Years | 50 (100.0%) | 33 (100.0%) |
| 6 to 11 Years | 136 (100.0%) | 225 (96.6%) |
| 12 to 14 Years | 125 (100.0%) | 117 (100.0%) |
| 15 Years | 31 (100.0%) | 18 (100.0%) |
| 16 and 17 Years | 114 (100.0%) | 80 (100.0%) |
| 18 to 24 Years | 320 (69.3%) | 272 (67.0%) |
| 25 to 34 Years | 988 (90.1%) | 697 (91.5%) |
| 35 to 44 Years | 692 (97.7%) | 405 (82.2%) |
| 45 to 54 Years | 678 (76.1%) | 674 (95.3%) |
| 55 to 64 Years | 621 (98.1%) | 696 (85.7%) |
| 65 to 74 Years | 496 (98.8%) | 432 (92.7%) |
| 75 Years and over | 320 (98.8%) | 390 (94.9%) |
| Total | 4,675 (90.3%) | 4,405 (89.5%) |
Income Below Poverty Among Married-Couple Families in Gunbarrel
The poverty statistics for married-couple families in Gunbarrel show that 1.5% or 29 of the total 1,920 families live below the poverty line. Families with 1 or 2 children have the highest poverty rate of 3.7%, comprising of 25 families. On the other hand, families with 3 or 4 children have the lowest poverty rate of 0.0%, which includes 0 families.
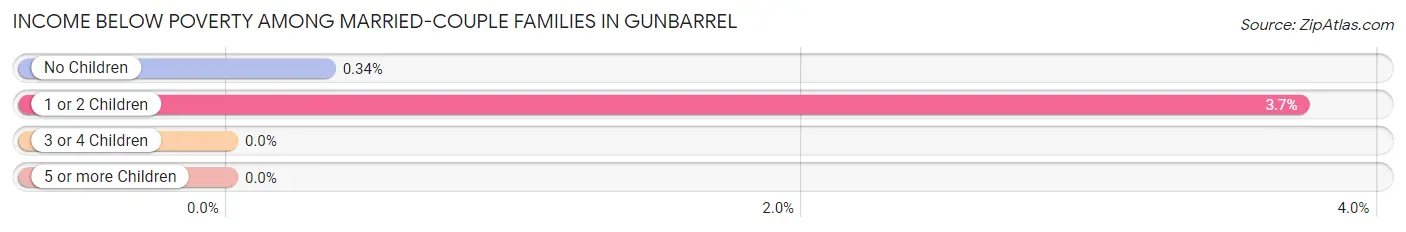
| Children | Above Poverty | Below Poverty |
| No Children | 1,185 (99.7%) | 4 (0.3%) |
| 1 or 2 Children | 645 (96.3%) | 25 (3.7%) |
| 3 or 4 Children | 61 (100.0%) | 0 (0.0%) |
| 5 or more Children | 0 (0.0%) | 0 (0.0%) |
| Total | 1,891 (98.5%) | 29 (1.5%) |
Income Below Poverty Among Single-Parent Households in Gunbarrel
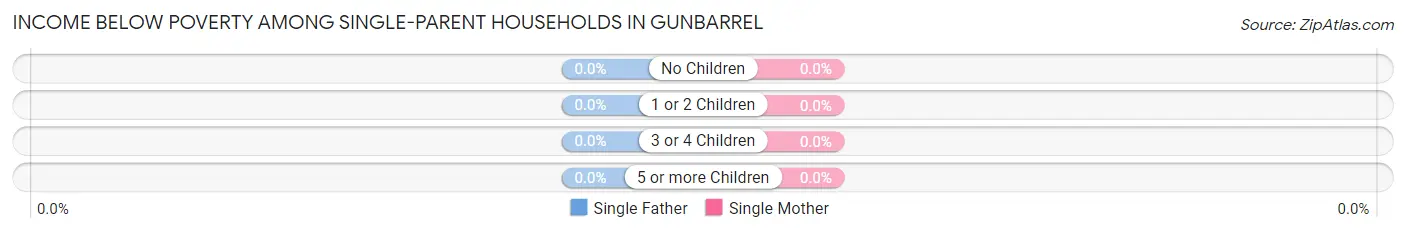
| Children | Single Father | Single Mother |
| No Children | 0 (0.0%) | 0 (0.0%) |
| 1 or 2 Children | 0 (0.0%) | 0 (0.0%) |
| 3 or 4 Children | 0 (0.0%) | 0 (0.0%) |
| 5 or more Children | 0 (0.0%) | 0 (0.0%) |
| Total | 0 (0.0%) | 0 (0.0%) |
Income Below Poverty Among Married-Couple vs Single-Parent Households in Gunbarrel
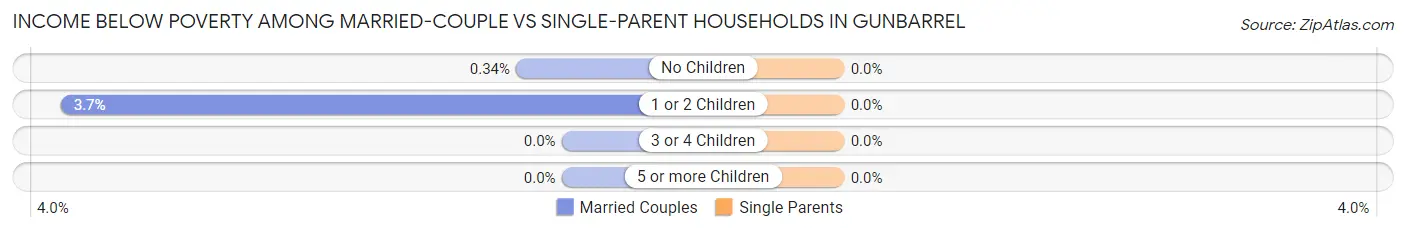
| Children | Married-Couple Families | Single-Parent Households |
| No Children | 4 (0.3%) | 0 (0.0%) |
| 1 or 2 Children | 25 (3.7%) | 0 (0.0%) |
| 3 or 4 Children | 0 (0.0%) | 0 (0.0%) |
| 5 or more Children | 0 (0.0%) | 0 (0.0%) |
| Total | 29 (1.5%) | 0 (0.0%) |
Race in Gunbarrel
The most populous races in Gunbarrel are White / Caucasian (8,749 | 86.6%), Two or more Races (820 | 8.1%), and Hispanic or Latino (370 | 3.7%).
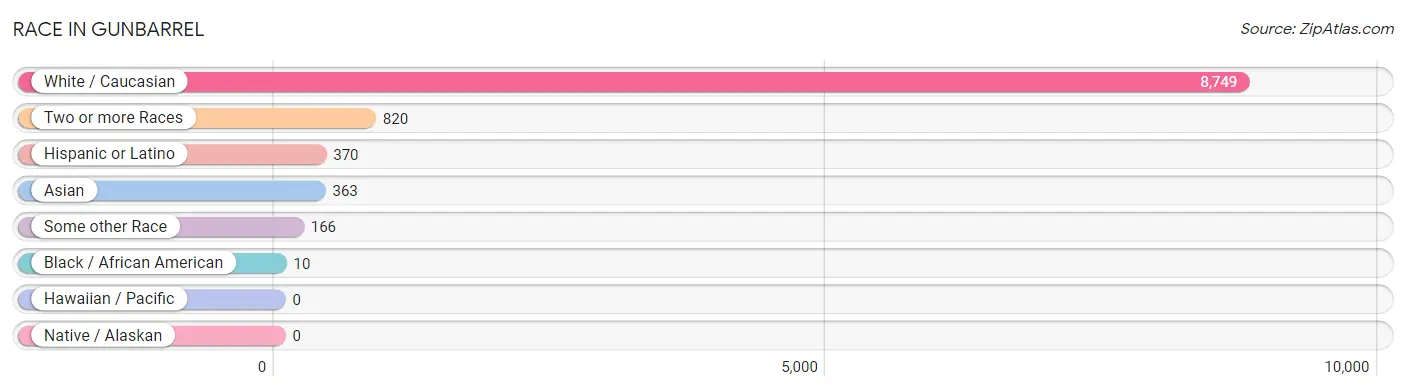
| Race | # Population | % Population |
| Asian | 363 | 3.6% |
| Black / African American | 10 | 0.1% |
| Hawaiian / Pacific | 0 | 0.0% |
| Hispanic or Latino | 370 | 3.7% |
| Native / Alaskan | 0 | 0.0% |
| White / Caucasian | 8,749 | 86.6% |
| Two or more Races | 820 | 8.1% |
| Some other Race | 166 | 1.6% |
| Total | 10,108 | 100.0% |
Ancestry in Gunbarrel
The most populous ancestries reported in Gunbarrel are German (2,263 | 22.4%), English (1,341 | 13.3%), Irish (1,210 | 12.0%), European (637 | 6.3%), and Italian (604 | 6.0%), together accounting for 59.9% of all Gunbarrel residents.
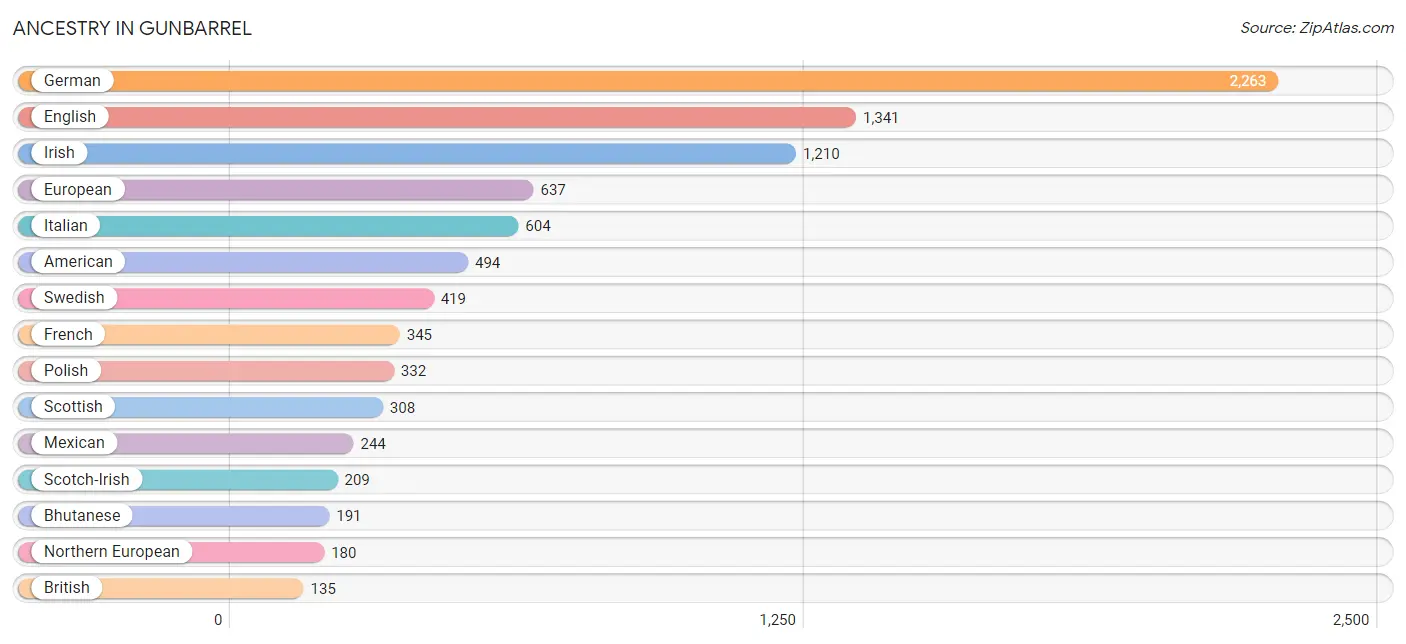
| Ancestry | # Population | % Population |
| Afghan | 16 | 0.2% |
| African | 7 | 0.1% |
| Albanian | 19 | 0.2% |
| American | 494 | 4.9% |
| Arab | 41 | 0.4% |
| Armenian | 16 | 0.2% |
| Austrian | 49 | 0.5% |
| Basque | 22 | 0.2% |
| Belgian | 45 | 0.4% |
| Bhutanese | 191 | 1.9% |
| Brazilian | 108 | 1.1% |
| British | 135 | 1.3% |
| Burmese | 32 | 0.3% |
| Cajun | 15 | 0.2% |
| Canadian | 27 | 0.3% |
| Cherokee | 34 | 0.3% |
| Chickasaw | 3 | 0.0% |
| Chilean | 19 | 0.2% |
| Colombian | 16 | 0.2% |
| Croatian | 15 | 0.2% |
| Czech | 89 | 0.9% |
| Czechoslovakian | 12 | 0.1% |
| Danish | 133 | 1.3% |
| Dutch | 75 | 0.7% |
| Eastern European | 35 | 0.4% |
| English | 1,341 | 13.3% |
| European | 637 | 6.3% |
| Finnish | 39 | 0.4% |
| French | 345 | 3.4% |
| French Canadian | 32 | 0.3% |
| German | 2,263 | 22.4% |
| Greek | 100 | 1.0% |
| Hungarian | 39 | 0.4% |
| Indian (Asian) | 111 | 1.1% |
| Iranian | 14 | 0.1% |
| Irish | 1,210 | 12.0% |
| Iroquois | 2 | 0.0% |
| Italian | 604 | 6.0% |
| Kenyan | 16 | 0.2% |
| Korean | 112 | 1.1% |
| Lebanese | 16 | 0.2% |
| Lithuanian | 39 | 0.4% |
| Luxembourger | 20 | 0.2% |
| Mexican | 244 | 2.4% |
| Mexican American Indian | 9 | 0.1% |
| Moroccan | 1 | 0.0% |
| Northern European | 180 | 1.8% |
| Norwegian | 130 | 1.3% |
| Pakistani | 18 | 0.2% |
| Paraguayan | 4 | 0.0% |
| Polish | 332 | 3.3% |
| Portuguese | 5 | 0.1% |
| Puerto Rican | 29 | 0.3% |
| Russian | 125 | 1.2% |
| Scandinavian | 105 | 1.0% |
| Scotch-Irish | 209 | 2.1% |
| Scottish | 308 | 3.0% |
| Slavic | 59 | 0.6% |
| Slovak | 27 | 0.3% |
| South African | 15 | 0.2% |
| South American | 39 | 0.4% |
| Spanish | 58 | 0.6% |
| Subsaharan African | 38 | 0.4% |
| Swedish | 419 | 4.2% |
| Swiss | 63 | 0.6% |
| Syrian | 18 | 0.2% |
| Thai | 121 | 1.2% |
| Ukrainian | 33 | 0.3% |
| Welsh | 121 | 1.2% |
| Yugoslavian | 5 | 0.1% | View All 70 Rows |
Immigrants in Gunbarrel
The most numerous immigrant groups reported in Gunbarrel came from Europe (340 | 3.4%), Asia (216 | 2.1%), Western Europe (150 | 1.5%), Eastern Europe (133 | 1.3%), and South Central Asia (114 | 1.1%), together accounting for 9.4% of all Gunbarrel residents.
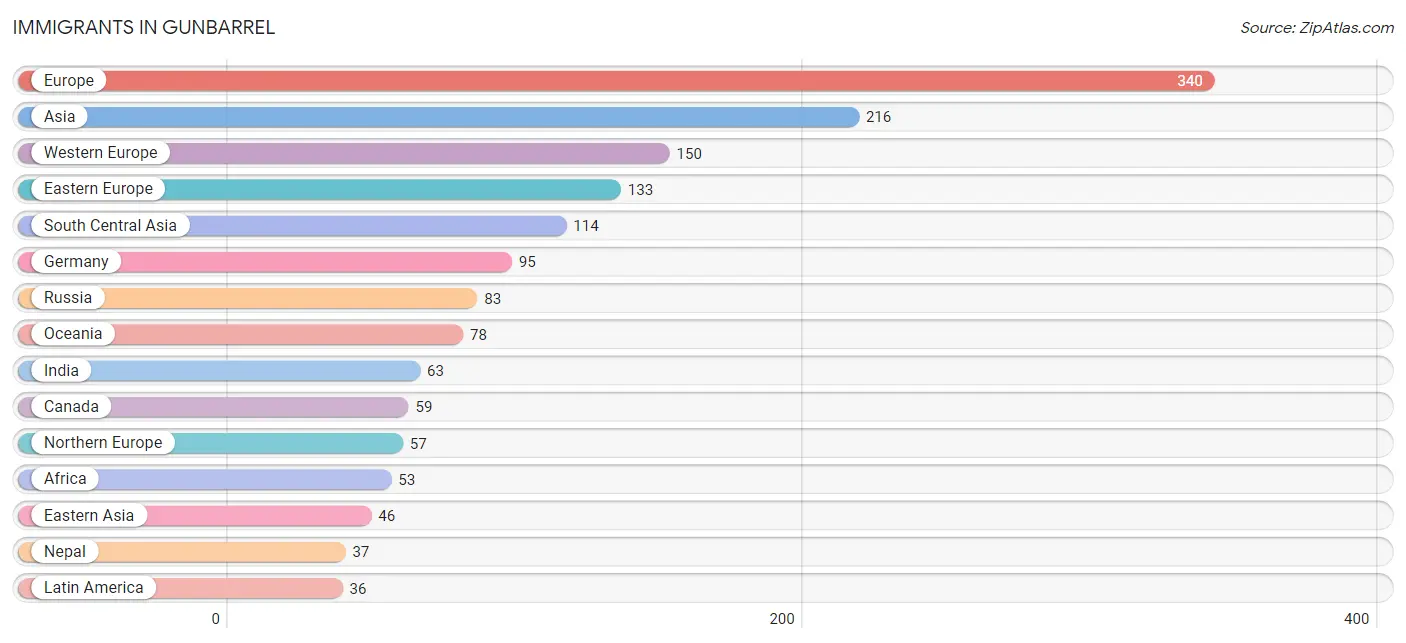
| Immigration Origin | # Population | % Population |
| Africa | 53 | 0.5% |
| Asia | 216 | 2.1% |
| Belgium | 10 | 0.1% |
| Brazil | 11 | 0.1% |
| Canada | 59 | 0.6% |
| Central America | 18 | 0.2% |
| China | 32 | 0.3% |
| Colombia | 7 | 0.1% |
| Eastern Asia | 46 | 0.5% |
| Eastern Europe | 133 | 1.3% |
| England | 5 | 0.1% |
| Europe | 340 | 3.4% |
| France | 29 | 0.3% |
| Germany | 95 | 0.9% |
| Hungary | 8 | 0.1% |
| India | 63 | 0.6% |
| Iran | 14 | 0.1% |
| Japan | 14 | 0.1% |
| Latin America | 36 | 0.4% |
| Lebanon | 16 | 0.2% |
| Mexico | 18 | 0.2% |
| Nepal | 37 | 0.4% |
| Netherlands | 16 | 0.2% |
| Northern Europe | 57 | 0.6% |
| Norway | 11 | 0.1% |
| Oceania | 78 | 0.8% |
| Poland | 7 | 0.1% |
| Russia | 83 | 0.8% |
| Scotland | 14 | 0.1% |
| South Africa | 35 | 0.4% |
| South America | 18 | 0.2% |
| South Central Asia | 114 | 1.1% |
| Ukraine | 35 | 0.4% |
| Western Asia | 16 | 0.2% |
| Western Europe | 150 | 1.5% | View All 35 Rows |
Sex and Age in Gunbarrel
Sex and Age in Gunbarrel
The most populous age groups in Gunbarrel are 25 to 29 Years (598 | 11.6%) for men and 25 to 29 Years (428 | 8.7%) for women.
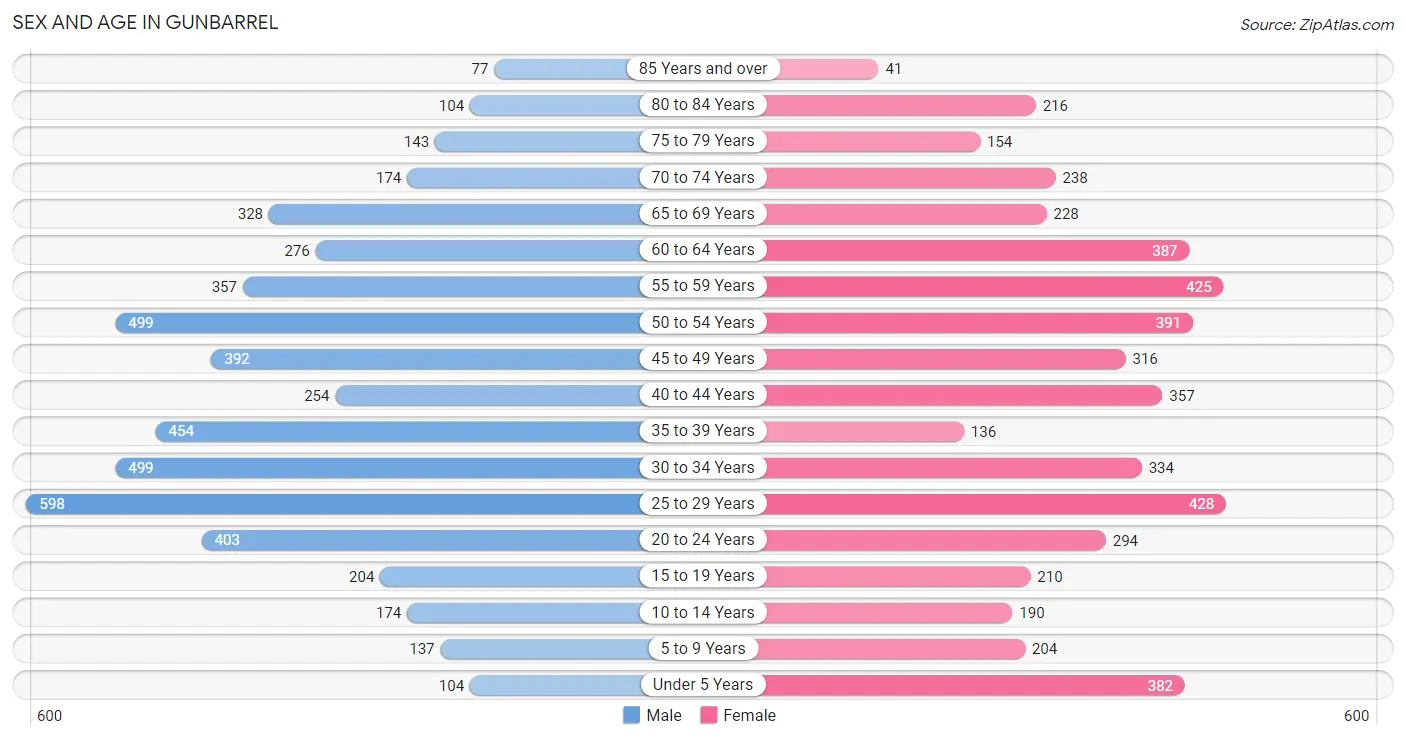
| Age Bracket | Male | Female |
| Under 5 Years | 104 (2.0%) | 382 (7.7%) |
| 5 to 9 Years | 137 (2.6%) | 204 (4.1%) |
| 10 to 14 Years | 174 (3.4%) | 190 (3.8%) |
| 15 to 19 Years | 204 (3.9%) | 210 (4.3%) |
| 20 to 24 Years | 403 (7.8%) | 294 (6.0%) |
| 25 to 29 Years | 598 (11.6%) | 428 (8.7%) |
| 30 to 34 Years | 499 (9.6%) | 334 (6.8%) |
| 35 to 39 Years | 454 (8.8%) | 136 (2.8%) |
| 40 to 44 Years | 254 (4.9%) | 357 (7.2%) |
| 45 to 49 Years | 392 (7.6%) | 316 (6.4%) |
| 50 to 54 Years | 499 (9.6%) | 391 (7.9%) |
| 55 to 59 Years | 357 (6.9%) | 425 (8.6%) |
| 60 to 64 Years | 276 (5.3%) | 387 (7.9%) |
| 65 to 69 Years | 328 (6.3%) | 228 (4.6%) |
| 70 to 74 Years | 174 (3.4%) | 238 (4.8%) |
| 75 to 79 Years | 143 (2.8%) | 154 (3.1%) |
| 80 to 84 Years | 104 (2.0%) | 216 (4.4%) |
| 85 Years and over | 77 (1.5%) | 41 (0.8%) |
| Total | 5,177 (100.0%) | 4,931 (100.0%) |
Families and Households in Gunbarrel
Median Family Size in Gunbarrel
The median family size in Gunbarrel is 2.72 persons per family, with married-couple families (1,920 | 81.0%) accounting for the largest median family size of 2.8 persons per family. On the other hand, single male/father families (229 | 9.7%) represent the smallest median family size with 2.16 persons per family.
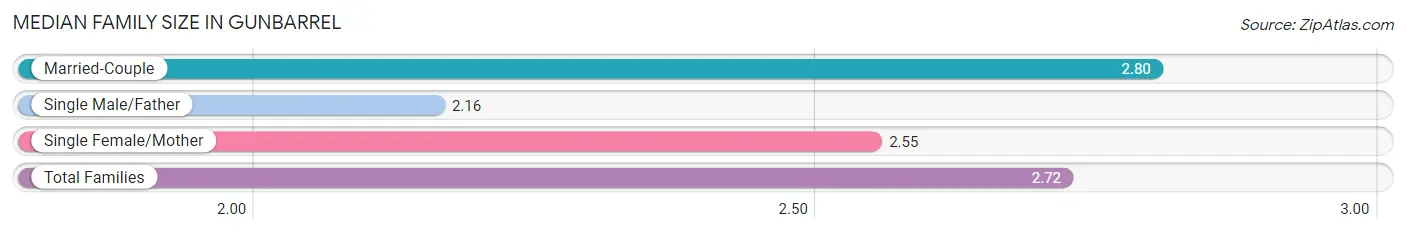
| Family Type | # Families | Family Size |
| Married-Couple | 1,920 (81.0%) | 2.80 |
| Single Male/Father | 229 (9.7%) | 2.16 |
| Single Female/Mother | 221 (9.3%) | 2.55 |
| Total Families | 2,370 (100.0%) | 2.72 |
Median Household Size in Gunbarrel
The median household size in Gunbarrel is 2.15 persons per household, with single male/father households (229 | 4.9%) accounting for the largest median household size of 3.01 persons per household. non-family households (2,329 | 49.6%) represent the smallest median household size with 1.44 persons per household.
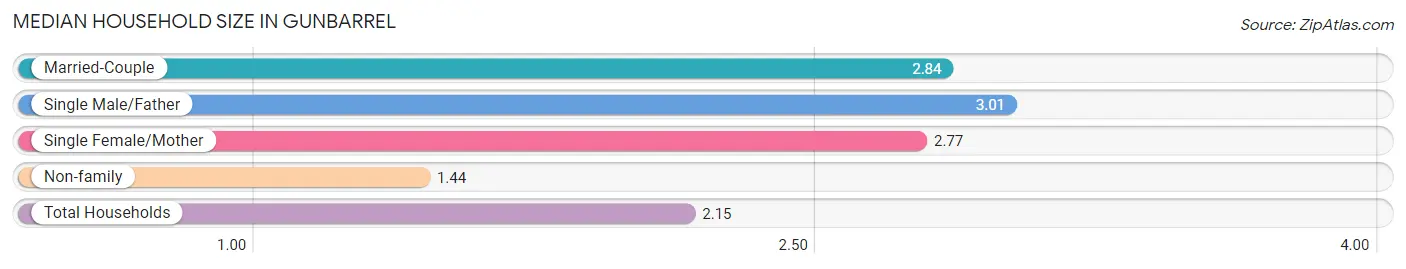
| Household Type | # Households | Household Size |
| Married-Couple | 1,920 (40.9%) | 2.84 |
| Single Male/Father | 229 (4.9%) | 3.01 |
| Single Female/Mother | 221 (4.7%) | 2.77 |
| Non-family | 2,329 (49.6%) | 1.44 |
| Total Households | 4,699 (100.0%) | 2.15 |
Household Size by Marriage Status in Gunbarrel
Out of a total of 4,699 households in Gunbarrel, 2,370 (50.4%) are family households, while 2,329 (49.6%) are nonfamily households. The most numerous type of family households are 2-person households, comprising 1,228, and the most common type of nonfamily households are 1-person households, comprising 1,603.
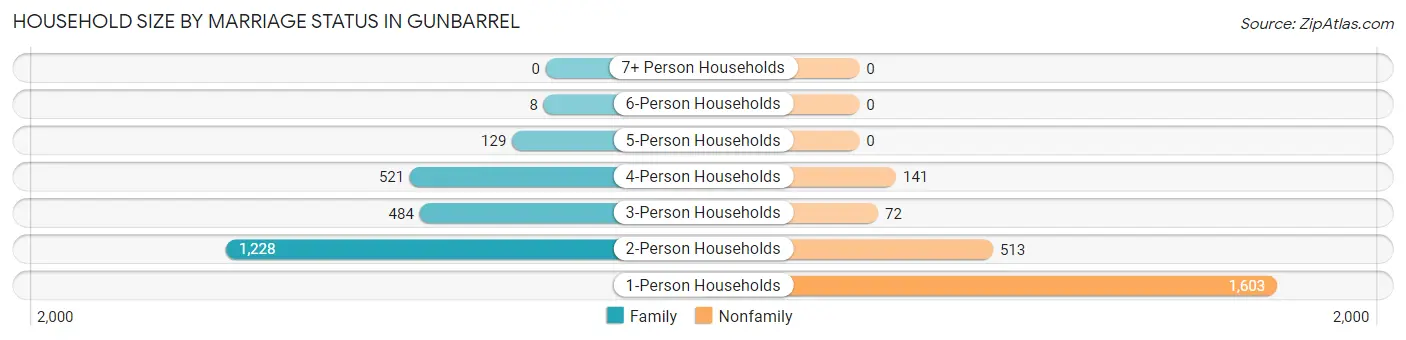
| Household Size | Family Households | Nonfamily Households |
| 1-Person Households | - | 1,603 (34.1%) |
| 2-Person Households | 1,228 (26.1%) | 513 (10.9%) |
| 3-Person Households | 484 (10.3%) | 72 (1.5%) |
| 4-Person Households | 521 (11.1%) | 141 (3.0%) |
| 5-Person Households | 129 (2.8%) | 0 (0.0%) |
| 6-Person Households | 8 (0.2%) | 0 (0.0%) |
| 7+ Person Households | 0 (0.0%) | 0 (0.0%) |
| Total | 2,370 (50.4%) | 2,329 (49.6%) |
Female Fertility in Gunbarrel
Fertility by Age in Gunbarrel
Average fertility rate in Gunbarrel is 51.0 births per 1,000 women. Women in the age bracket of 35 to 50 years have the highest fertility rate with 69.0 births per 1,000 women. Women in the age bracket of 35 to 50 years acount for 54.1% of all women with births.
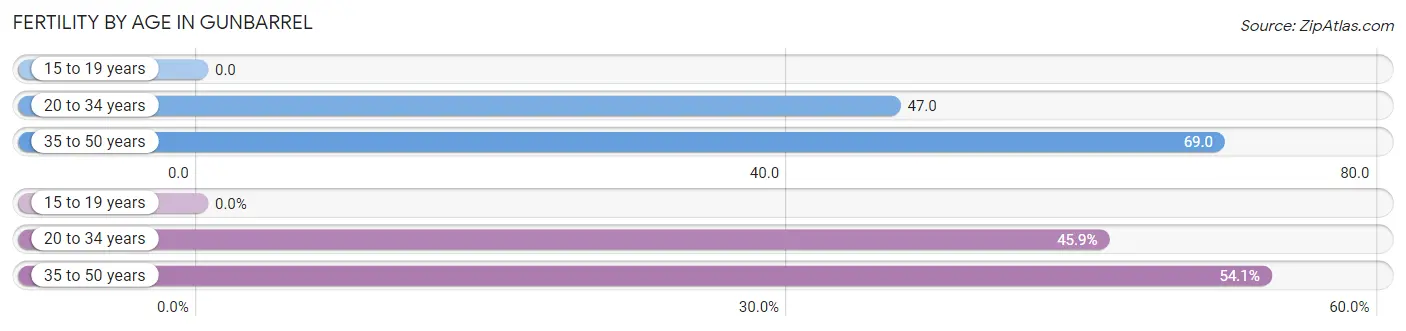
| Age Bracket | Women with Births | Births / 1,000 Women |
| 15 to 19 years | 0 (0.0%) | 0.0 |
| 20 to 34 years | 50 (45.9%) | 47.0 |
| 35 to 50 years | 59 (54.1%) | 69.0 |
| Total | 109 (100.0%) | 51.0 |
Fertility by Age by Marriage Status in Gunbarrel
75.2% of women with births (109) in Gunbarrel are married. The highest percentage of unmarried women with births falls into 35 to 50 years age bracket with 35.6% of them unmarried at the time of birth, while the lowest percentage of unmarried women with births belong to 20 to 34 years age bracket with 12.0% of them unmarried.
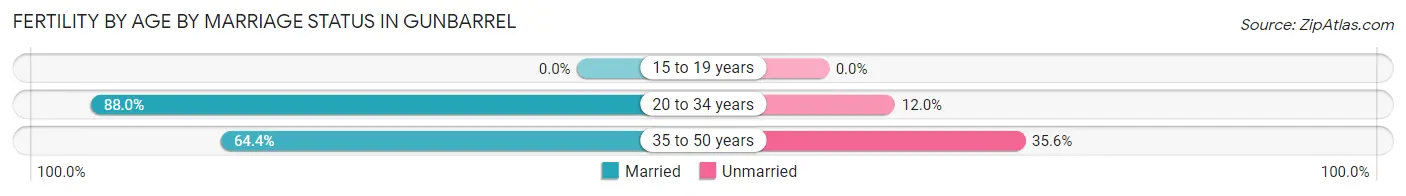
| Age Bracket | Married | Unmarried |
| 15 to 19 years | 0 (0.0%) | 0 (0.0%) |
| 20 to 34 years | 44 (88.0%) | 6 (12.0%) |
| 35 to 50 years | 38 (64.4%) | 21 (35.6%) |
| Total | 82 (75.2%) | 27 (24.8%) |
Fertility by Education in Gunbarrel
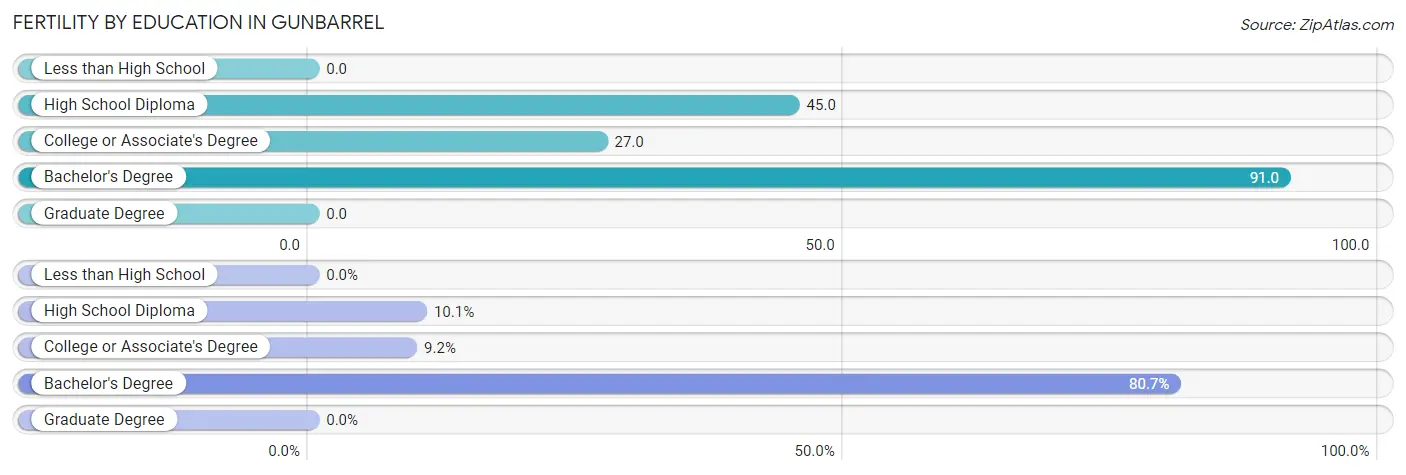
| Educational Attainment | Women with Births | Births / 1,000 Women |
| Less than High School | 0 (0.0%) | 0.0 |
| High School Diploma | 11 (10.1%) | 45.0 |
| College or Associate's Degree | 10 (9.2%) | 27.0 |
| Bachelor's Degree | 88 (80.7%) | 91.0 |
| Graduate Degree | 0 (0.0%) | 0.0 |
| Total | 109 (100.0%) | 51.0 |
Fertility by Education by Marriage Status in Gunbarrel
24.8% of women with births in Gunbarrel are unmarried. Women with the educational attainment of college or associate's degree are most likely to be married with 100.0% of them married at childbirth, while women with the educational attainment of high school diploma are least likely to be married with 54.5% of them unmarried at childbirth.
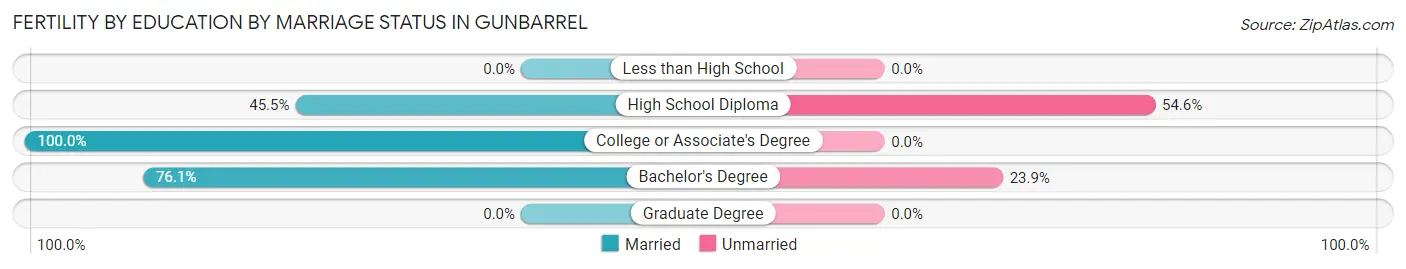
| Educational Attainment | Married | Unmarried |
| Less than High School | 0 (0.0%) | 0 (0.0%) |
| High School Diploma | 5 (45.5%) | 6 (54.5%) |
| College or Associate's Degree | 10 (100.0%) | 0 (0.0%) |
| Bachelor's Degree | 67 (76.1%) | 21 (23.9%) |
| Graduate Degree | 0 (0.0%) | 0 (0.0%) |
| Total | 82 (75.2%) | 27 (24.8%) |
Employment Characteristics in Gunbarrel
Employment by Class of Employer in Gunbarrel
Among the 5,684 employed individuals in Gunbarrel, private company employees (3,727 | 65.6%), self-employed (not incorporated) (573 | 10.1%), and state government employees (432 | 7.6%) make up the most common classes of employment.
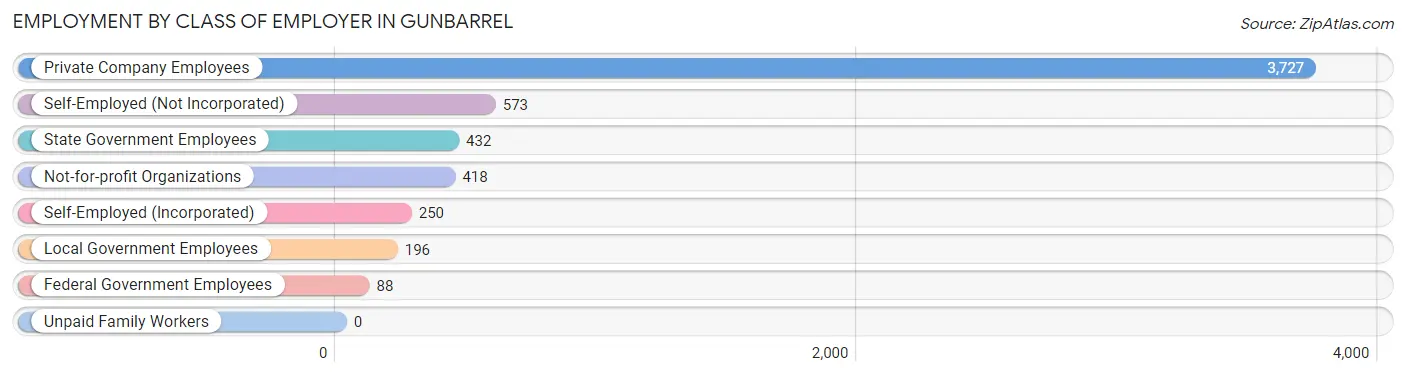
| Employer Class | # Employees | % Employees |
| Private Company Employees | 3,727 | 65.6% |
| Self-Employed (Incorporated) | 250 | 4.4% |
| Self-Employed (Not Incorporated) | 573 | 10.1% |
| Not-for-profit Organizations | 418 | 7.3% |
| Local Government Employees | 196 | 3.5% |
| State Government Employees | 432 | 7.6% |
| Federal Government Employees | 88 | 1.5% |
| Unpaid Family Workers | 0 | 0.0% |
| Total | 5,684 | 100.0% |
Employment Status by Age in Gunbarrel
According to the labor force statistics for Gunbarrel, out of the total population over 16 years of age (8,868), 69.5% or 6,163 individuals are in the labor force, with 5.6% or 345 of them unemployed. The age group with the highest labor force participation rate is 30 to 34 years, with 97.2% or 810 individuals in the labor force. Within the labor force, the 55 to 59 years age range has the highest percentage of unemployed individuals, with 18.1% or 110 of them being unemployed.
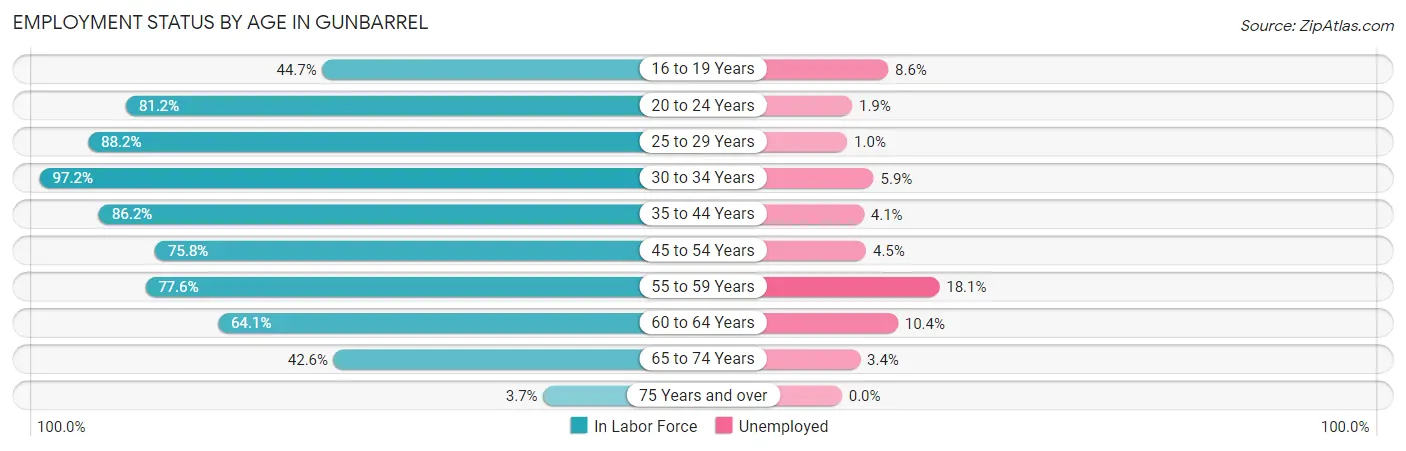
| Age Bracket | In Labor Force | Unemployed |
| 16 to 19 Years | 163 (44.7%) | 14 (8.6%) |
| 20 to 24 Years | 566 (81.2%) | 11 (1.9%) |
| 25 to 29 Years | 905 (88.2%) | 9 (1.0%) |
| 30 to 34 Years | 810 (97.2%) | 48 (5.9%) |
| 35 to 44 Years | 1,035 (86.2%) | 42 (4.1%) |
| 45 to 54 Years | 1,211 (75.8%) | 54 (4.5%) |
| 55 to 59 Years | 607 (77.6%) | 110 (18.1%) |
| 60 to 64 Years | 425 (64.1%) | 44 (10.4%) |
| 65 to 74 Years | 412 (42.6%) | 14 (3.4%) |
| 75 Years and over | 27 (3.7%) | 0 (0.0%) |
| Total | 6,163 (69.5%) | 345 (5.6%) |
Employment Status by Educational Attainment in Gunbarrel
According to labor force statistics for Gunbarrel, 81.8% of individuals (4,992) out of the total population between 25 and 64 years of age (6,103) are in the labor force, with 6.2% or 310 of them being unemployed. The group with the highest labor force participation rate are those with the educational attainment of less than high school, with 97.6% or 120 individuals in the labor force. Within the labor force, individuals with bachelor's degree or higher education have the highest percentage of unemployment, with 8.5% or 299 of them being unemployed.
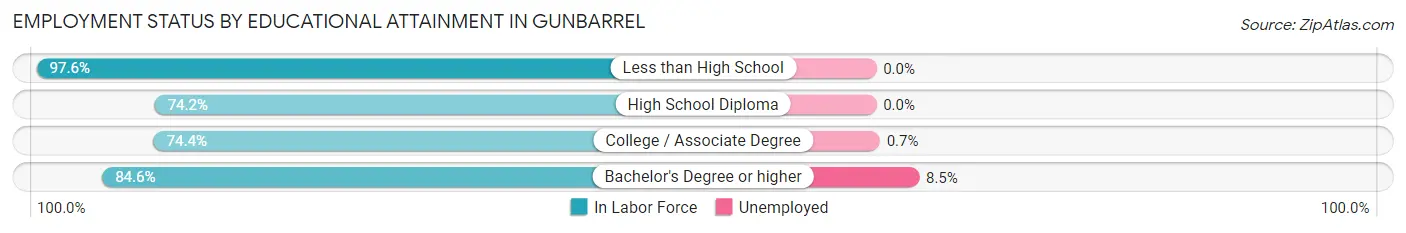
| Educational Attainment | In Labor Force | Unemployed |
| Less than High School | 120 (97.6%) | 0 (0.0%) |
| High School Diploma | 244 (74.2%) | 0 (0.0%) |
| College / Associate Degree | 1,106 (74.4%) | 10 (0.7%) |
| Bachelor's Degree or higher | 3,523 (84.6%) | 354 (8.5%) |
| Total | 4,992 (81.8%) | 378 (6.2%) |
Employment Occupations by Sex in Gunbarrel
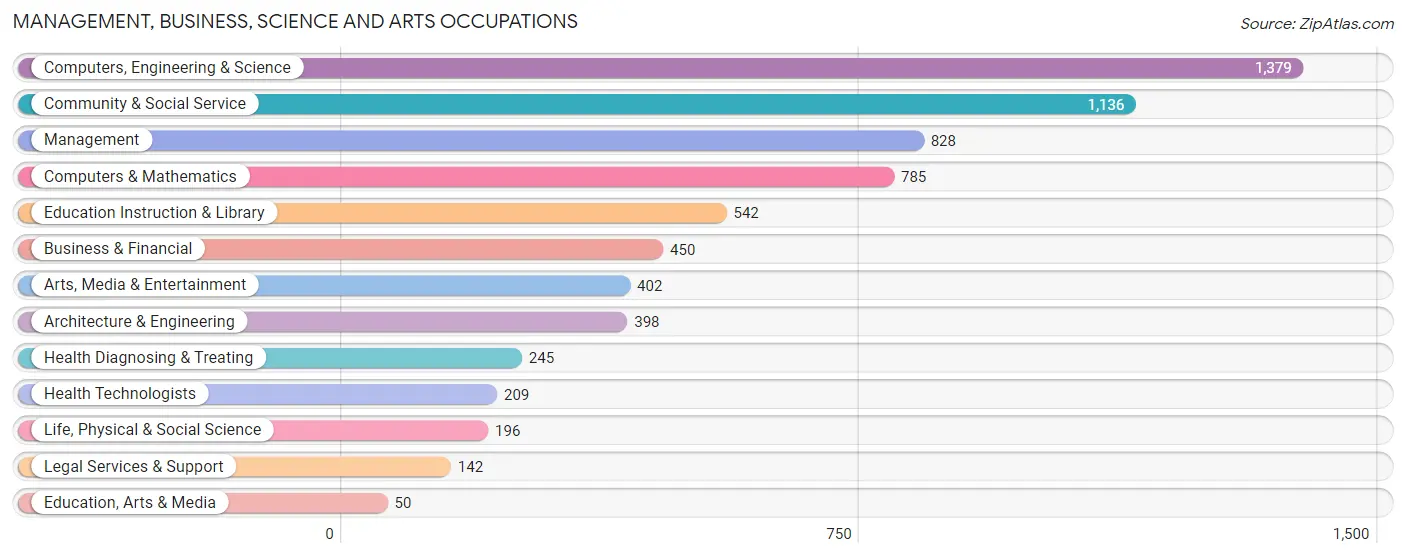
Management, Business, Science and Arts Occupations
The most common Management, Business, Science and Arts occupations in Gunbarrel are Computers, Engineering & Science (1,379 | 23.8%), Community & Social Service (1,136 | 19.6%), Management (828 | 14.3%), Computers & Mathematics (785 | 13.5%), and Education Instruction & Library (542 | 9.3%).
Management, Business, Science and Arts Occupations by Sex
Within the Management, Business, Science and Arts occupations in Gunbarrel, the most male-oriented occupations are Architecture & Engineering (87.9%), Computers & Mathematics (83.6%), and Computers, Engineering & Science (80.1%), while the most female-oriented occupations are Health Technologists (80.4%), Health Diagnosing & Treating (78.4%), and Legal Services & Support (74.7%).
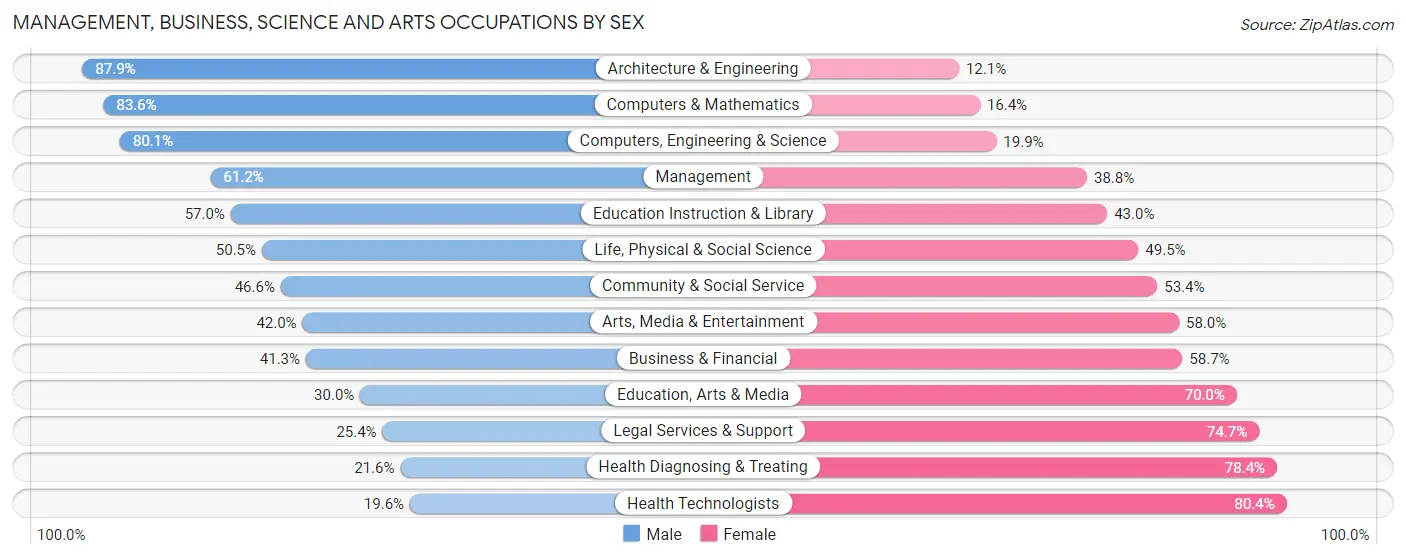
| Occupation | Male | Female |
| Management | 507 (61.2%) | 321 (38.8%) |
| Business & Financial | 186 (41.3%) | 264 (58.7%) |
| Computers, Engineering & Science | 1,105 (80.1%) | 274 (19.9%) |
| Computers & Mathematics | 656 (83.6%) | 129 (16.4%) |
| Architecture & Engineering | 350 (87.9%) | 48 (12.1%) |
| Life, Physical & Social Science | 99 (50.5%) | 97 (49.5%) |
| Community & Social Service | 529 (46.6%) | 607 (53.4%) |
| Education, Arts & Media | 15 (30.0%) | 35 (70.0%) |
| Legal Services & Support | 36 (25.4%) | 106 (74.7%) |
| Education Instruction & Library | 309 (57.0%) | 233 (43.0%) |
| Arts, Media & Entertainment | 169 (42.0%) | 233 (58.0%) |
| Health Diagnosing & Treating | 53 (21.6%) | 192 (78.4%) |
| Health Technologists | 41 (19.6%) | 168 (80.4%) |
| Total (Category) | 2,380 (58.9%) | 1,658 (41.1%) |
| Total (Overall) | 3,354 (57.9%) | 2,443 (42.1%) |
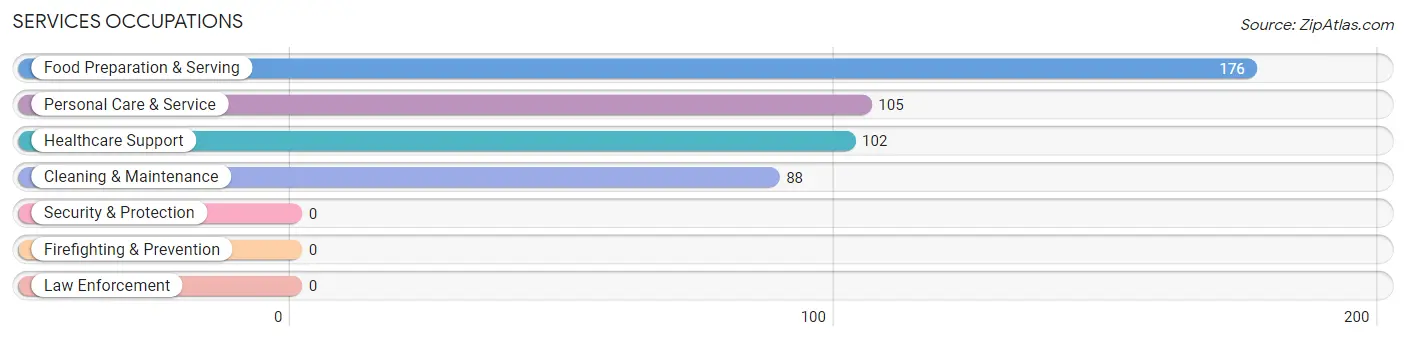
Services Occupations
The most common Services occupations in Gunbarrel are Food Preparation & Serving (176 | 3.0%), Personal Care & Service (105 | 1.8%), Healthcare Support (102 | 1.8%), and Cleaning & Maintenance (88 | 1.5%).
Services Occupations by Sex
Within the Services occupations in Gunbarrel, the most male-oriented occupations are Cleaning & Maintenance (78.4%), Healthcare Support (72.6%), and Food Preparation & Serving (56.8%), while the most female-oriented occupations are Personal Care & Service (95.2%), Food Preparation & Serving (43.2%), and Healthcare Support (27.5%).
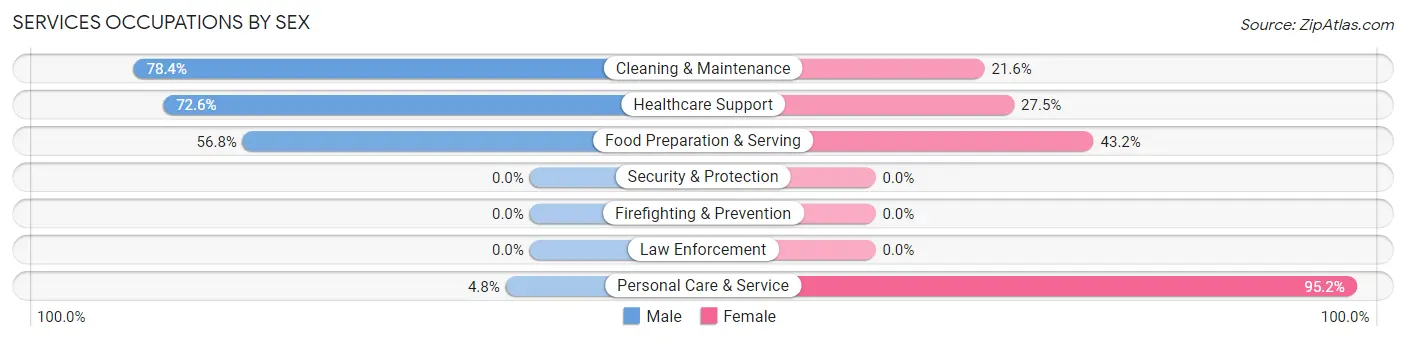
| Occupation | Male | Female |
| Healthcare Support | 74 (72.6%) | 28 (27.5%) |
| Security & Protection | 0 (0.0%) | 0 (0.0%) |
| Firefighting & Prevention | 0 (0.0%) | 0 (0.0%) |
| Law Enforcement | 0 (0.0%) | 0 (0.0%) |
| Food Preparation & Serving | 100 (56.8%) | 76 (43.2%) |
| Cleaning & Maintenance | 69 (78.4%) | 19 (21.6%) |
| Personal Care & Service | 5 (4.8%) | 100 (95.2%) |
| Total (Category) | 248 (52.6%) | 223 (47.3%) |
| Total (Overall) | 3,354 (57.9%) | 2,443 (42.1%) |
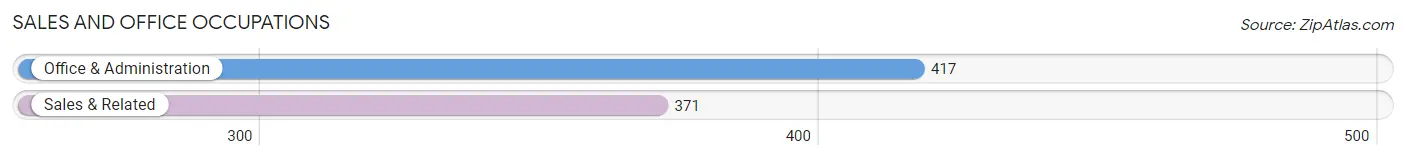
Sales and Office Occupations
The most common Sales and Office occupations in Gunbarrel are Office & Administration (417 | 7.2%), and Sales & Related (371 | 6.4%).
Sales and Office Occupations by Sex
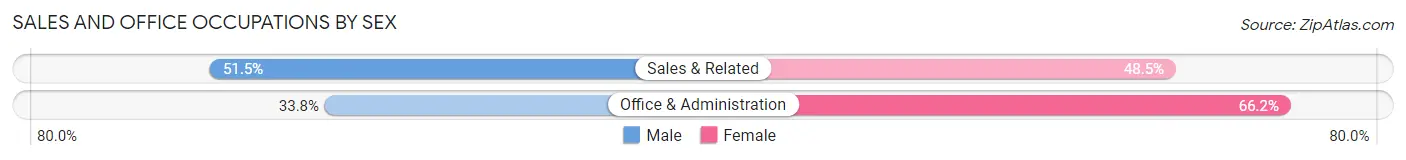
| Occupation | Male | Female |
| Sales & Related | 191 (51.5%) | 180 (48.5%) |
| Office & Administration | 141 (33.8%) | 276 (66.2%) |
| Total (Category) | 332 (42.1%) | 456 (57.9%) |
| Total (Overall) | 3,354 (57.9%) | 2,443 (42.1%) |
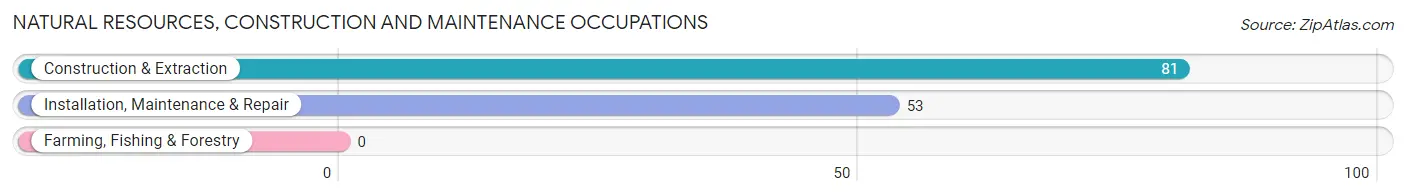
Natural Resources, Construction and Maintenance Occupations
The most common Natural Resources, Construction and Maintenance occupations in Gunbarrel are Construction & Extraction (81 | 1.4%), and Installation, Maintenance & Repair (53 | 0.9%).
Natural Resources, Construction and Maintenance Occupations by Sex
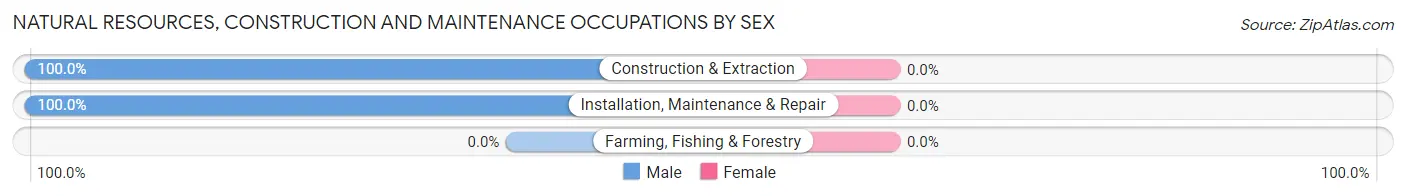
| Occupation | Male | Female |
| Farming, Fishing & Forestry | 0 (0.0%) | 0 (0.0%) |
| Construction & Extraction | 81 (100.0%) | 0 (0.0%) |
| Installation, Maintenance & Repair | 53 (100.0%) | 0 (0.0%) |
| Total (Category) | 134 (100.0%) | 0 (0.0%) |
| Total (Overall) | 3,354 (57.9%) | 2,443 (42.1%) |
Production, Transportation and Moving Occupations
The most common Production, Transportation and Moving occupations in Gunbarrel are Production (207 | 3.6%), Transportation (94 | 1.6%), and Material Moving (65 | 1.1%).
Production, Transportation and Moving Occupations by Sex
| Occupation | Male | Female |
| Production | 152 (73.4%) | 55 (26.6%) |
| Transportation | 79 (84.0%) | 15 (16.0%) |
| Material Moving | 29 (44.6%) | 36 (55.4%) |
| Total (Category) | 260 (71.0%) | 106 (29.0%) |
| Total (Overall) | 3,354 (57.9%) | 2,443 (42.1%) |
Employment Industries by Sex in Gunbarrel
Employment Industries in Gunbarrel
The major employment industries in Gunbarrel include Professional & Scientific (1,370 | 23.6%), Educational Services (736 | 12.7%), Manufacturing (732 | 12.6%), Health Care & Social Assistance (553 | 9.5%), and Retail Trade (460 | 7.9%).
Employment Industries by Sex in Gunbarrel
The Gunbarrel industries that see more men than women are Agriculture, Fishing & Hunting (100.0%), Mining, Quarrying, & Extraction (100.0%), and Construction (95.6%), whereas the industries that tend to have a higher number of women are Real Estate, Rental & Leasing (80.4%), Wholesale Trade (68.8%), and Health Care & Social Assistance (68.3%).
| Industry | Male | Female |
| Agriculture, Fishing & Hunting | 10 (100.0%) | 0 (0.0%) |
| Mining, Quarrying, & Extraction | 78 (100.0%) | 0 (0.0%) |
| Construction | 195 (95.6%) | 9 (4.4%) |
| Manufacturing | 467 (63.8%) | 265 (36.2%) |
| Wholesale Trade | 25 (31.2%) | 55 (68.8%) |
| Retail Trade | 252 (54.8%) | 208 (45.2%) |
| Transportation & Warehousing | 82 (82.8%) | 17 (17.2%) |
| Utilities | 0 (0.0%) | 0 (0.0%) |
| Information | 301 (89.3%) | 36 (10.7%) |
| Finance & Insurance | 78 (60.9%) | 50 (39.1%) |
| Real Estate, Rental & Leasing | 21 (19.6%) | 86 (80.4%) |
| Professional & Scientific | 765 (55.8%) | 605 (44.2%) |
| Enterprise Management | 0 (0.0%) | 0 (0.0%) |
| Administrative & Support | 78 (44.1%) | 99 (55.9%) |
| Educational Services | 378 (51.4%) | 358 (48.6%) |
| Health Care & Social Assistance | 175 (31.7%) | 378 (68.3%) |
| Arts, Entertainment & Recreation | 94 (70.7%) | 39 (29.3%) |
| Accommodation & Food Services | 267 (72.4%) | 102 (27.6%) |
| Public Administration | 58 (75.3%) | 19 (24.7%) |
| Total | 3,354 (57.9%) | 2,443 (42.1%) |
Education in Gunbarrel
School Enrollment in Gunbarrel
The most common levels of schooling among the 2,242 students in Gunbarrel are college / undergraduate (500 | 22.3%), high school (478 | 21.3%), and graduate / professional (460 | 20.5%).
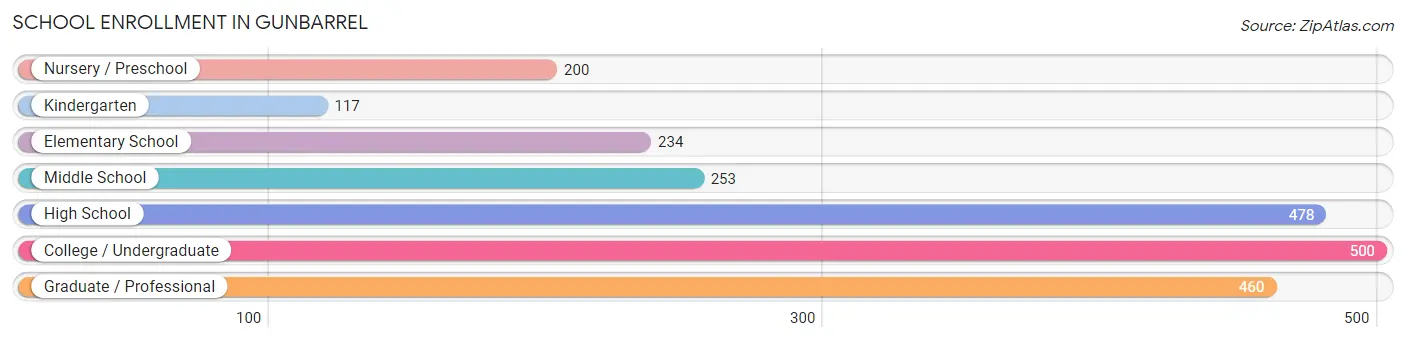
| School Level | # Students | % Students |
| Nursery / Preschool | 200 | 8.9% |
| Kindergarten | 117 | 5.2% |
| Elementary School | 234 | 10.4% |
| Middle School | 253 | 11.3% |
| High School | 478 | 21.3% |
| College / Undergraduate | 500 | 22.3% |
| Graduate / Professional | 460 | 20.5% |
| Total | 2,242 | 100.0% |
School Enrollment by Age by Funding Source in Gunbarrel
Out of a total of 2,242 students who are enrolled in schools in Gunbarrel, 265 (11.8%) attend a private institution, while the remaining 1,977 (88.2%) are enrolled in public schools. The age group of 35 years and over has the highest likelihood of being enrolled in private schools, with 74 (39.0% in the age bracket) enrolled. Conversely, the age group of 18 to 19 year olds has the lowest likelihood of being enrolled in a private school, with 111 (100.0% in the age bracket) attending a public institution.
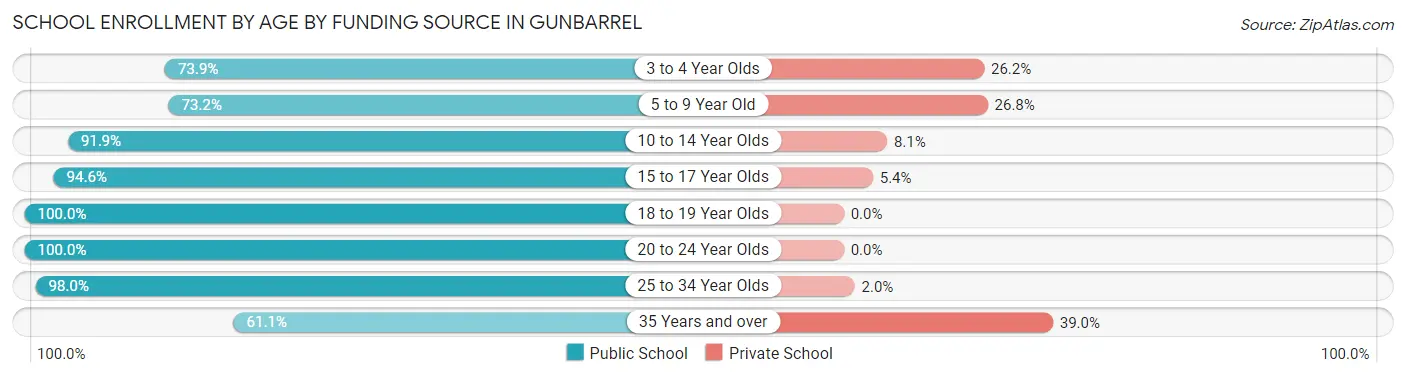
| Age Bracket | Public School | Private School |
| 3 to 4 Year Olds | 144 (73.9%) | 51 (26.2%) |
| 5 to 9 Year Old | 243 (73.2%) | 89 (26.8%) |
| 10 to 14 Year Olds | 331 (91.9%) | 29 (8.1%) |
| 15 to 17 Year Olds | 227 (94.6%) | 13 (5.4%) |
| 18 to 19 Year Olds | 111 (100.0%) | 0 (0.0%) |
| 20 to 24 Year Olds | 419 (100.0%) | 0 (0.0%) |
| 25 to 34 Year Olds | 387 (98.0%) | 8 (2.0%) |
| 35 Years and over | 116 (61.1%) | 74 (39.0%) |
| Total | 1,977 (88.2%) | 265 (11.8%) |
Educational Attainment by Field of Study in Gunbarrel
Engineering (867 | 14.7%), business (609 | 10.3%), social sciences (529 | 8.9%), computers & mathematics (526 | 8.9%), and bio, nature & agricultural (469 | 7.9%) are the most common fields of study among 5,911 individuals in Gunbarrel who have obtained a bachelor's degree or higher.
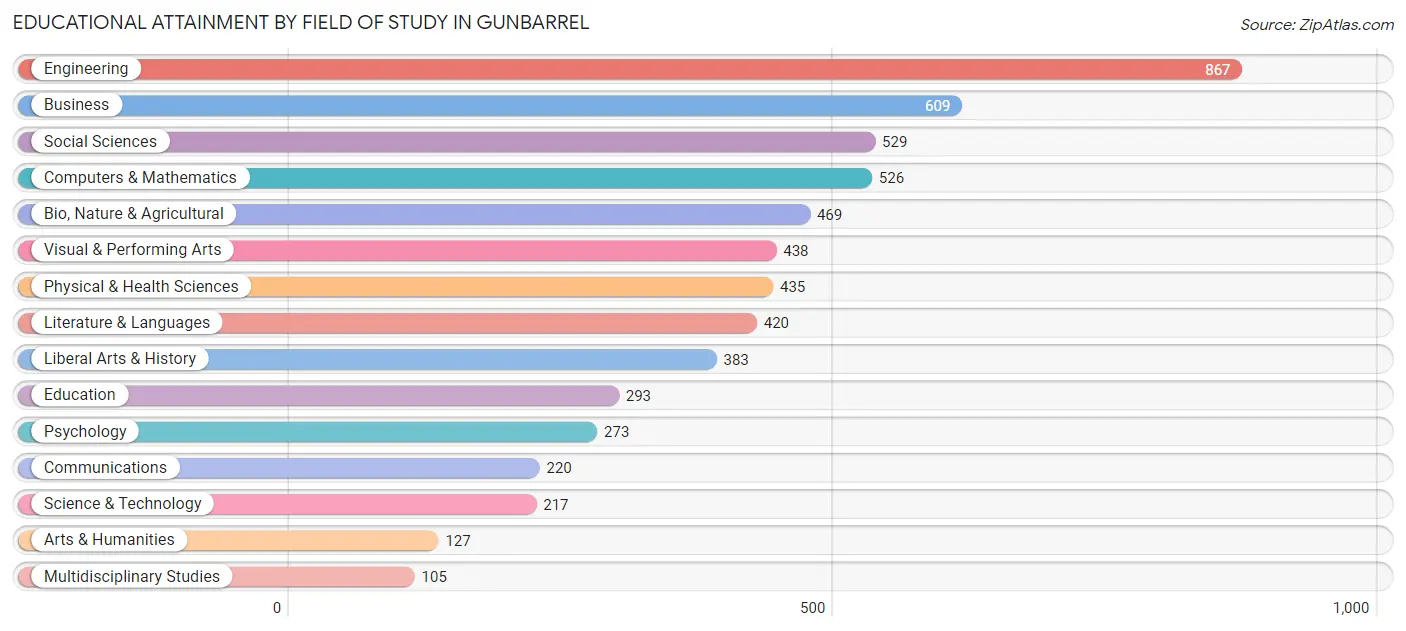
| Field of Study | # Graduates | % Graduates |
| Computers & Mathematics | 526 | 8.9% |
| Bio, Nature & Agricultural | 469 | 7.9% |
| Physical & Health Sciences | 435 | 7.4% |
| Psychology | 273 | 4.6% |
| Social Sciences | 529 | 8.9% |
| Engineering | 867 | 14.7% |
| Multidisciplinary Studies | 105 | 1.8% |
| Science & Technology | 217 | 3.7% |
| Business | 609 | 10.3% |
| Education | 293 | 5.0% |
| Literature & Languages | 420 | 7.1% |
| Liberal Arts & History | 383 | 6.5% |
| Visual & Performing Arts | 438 | 7.4% |
| Communications | 220 | 3.7% |
| Arts & Humanities | 127 | 2.1% |
| Total | 5,911 | 100.0% |
Transportation & Commute in Gunbarrel
Vehicle Availability by Sex in Gunbarrel
The most prevalent vehicle ownership categories in Gunbarrel are males with 2 vehicles (1,561, accounting for 46.9%) and females with 2 vehicles (798, making up 66.3%).
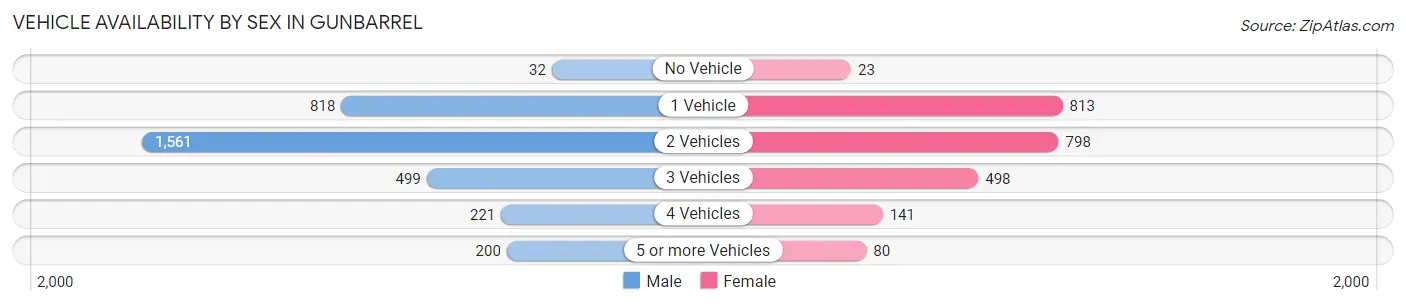
| Vehicles Available | Male | Female |
| No Vehicle | 32 (1.0%) | 23 (1.0%) |
| 1 Vehicle | 818 (24.6%) | 813 (34.5%) |
| 2 Vehicles | 1,561 (46.9%) | 798 (33.9%) |
| 3 Vehicles | 499 (15.0%) | 498 (21.2%) |
| 4 Vehicles | 221 (6.6%) | 141 (6.0%) |
| 5 or more Vehicles | 200 (6.0%) | 80 (3.4%) |
| Total | 3,331 (100.0%) | 2,353 (100.0%) |
Commute Time in Gunbarrel
The most frequently occuring commute durations in Gunbarrel are 15 to 19 minutes (993 commuters, 24.3%), 20 to 24 minutes (633 commuters, 15.5%), and 10 to 14 minutes (627 commuters, 15.3%).
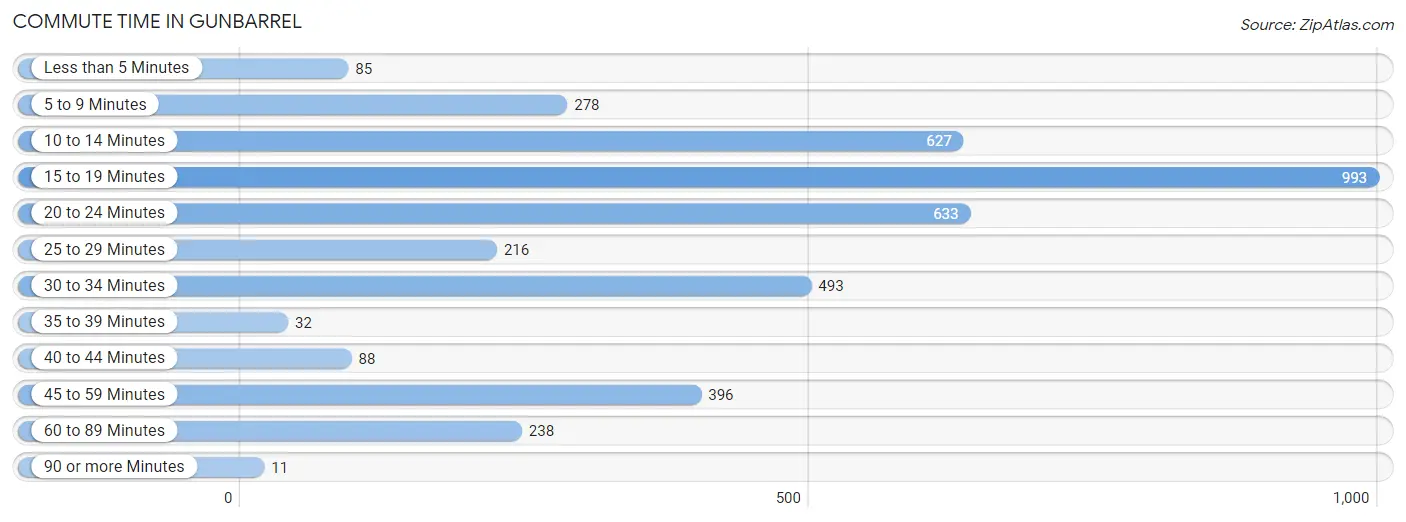
| Commute Time | # Commuters | % Commuters |
| Less than 5 Minutes | 85 | 2.1% |
| 5 to 9 Minutes | 278 | 6.8% |
| 10 to 14 Minutes | 627 | 15.3% |
| 15 to 19 Minutes | 993 | 24.3% |
| 20 to 24 Minutes | 633 | 15.5% |
| 25 to 29 Minutes | 216 | 5.3% |
| 30 to 34 Minutes | 493 | 12.0% |
| 35 to 39 Minutes | 32 | 0.8% |
| 40 to 44 Minutes | 88 | 2.1% |
| 45 to 59 Minutes | 396 | 9.7% |
| 60 to 89 Minutes | 238 | 5.8% |
| 90 or more Minutes | 11 | 0.3% |
Commute Time by Sex in Gunbarrel
The most common commute times in Gunbarrel are 15 to 19 minutes (761 commuters, 32.2%) for males and 20 to 24 minutes (342 commuters, 19.8%) for females.
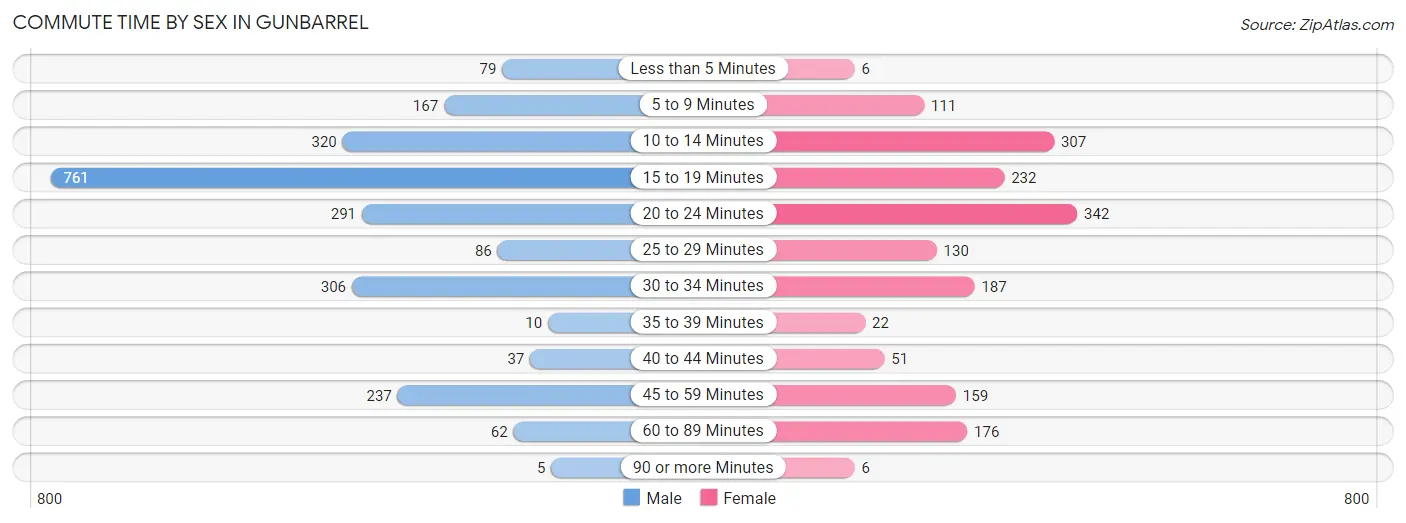
| Commute Time | Male | Female |
| Less than 5 Minutes | 79 (3.4%) | 6 (0.4%) |
| 5 to 9 Minutes | 167 (7.1%) | 111 (6.4%) |
| 10 to 14 Minutes | 320 (13.6%) | 307 (17.8%) |
| 15 to 19 Minutes | 761 (32.2%) | 232 (13.4%) |
| 20 to 24 Minutes | 291 (12.3%) | 342 (19.8%) |
| 25 to 29 Minutes | 86 (3.6%) | 130 (7.5%) |
| 30 to 34 Minutes | 306 (13.0%) | 187 (10.8%) |
| 35 to 39 Minutes | 10 (0.4%) | 22 (1.3%) |
| 40 to 44 Minutes | 37 (1.6%) | 51 (2.9%) |
| 45 to 59 Minutes | 237 (10.0%) | 159 (9.2%) |
| 60 to 89 Minutes | 62 (2.6%) | 176 (10.2%) |
| 90 or more Minutes | 5 (0.2%) | 6 (0.4%) |
Time of Departure to Work by Sex in Gunbarrel
The most frequent times of departure to work in Gunbarrel are 7:30 AM to 7:59 AM (400, 16.9%) for males and 7:30 AM to 7:59 AM (351, 20.3%) for females.
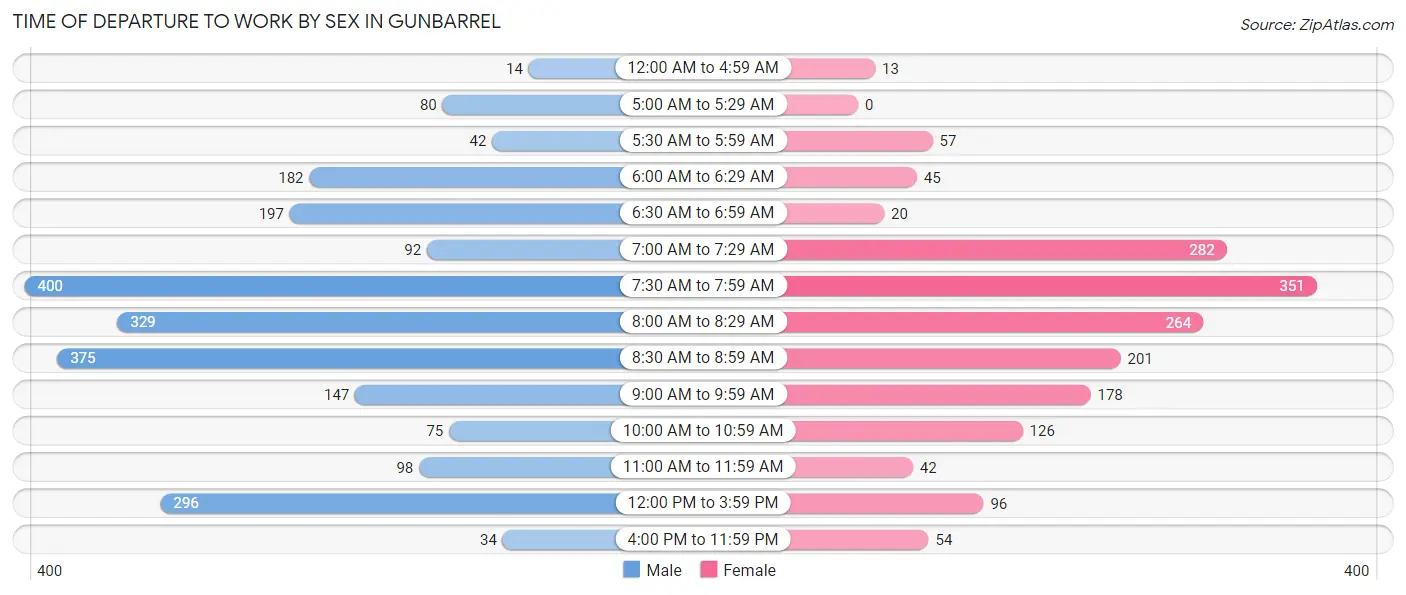
| Time of Departure | Male | Female |
| 12:00 AM to 4:59 AM | 14 (0.6%) | 13 (0.7%) |
| 5:00 AM to 5:29 AM | 80 (3.4%) | 0 (0.0%) |
| 5:30 AM to 5:59 AM | 42 (1.8%) | 57 (3.3%) |
| 6:00 AM to 6:29 AM | 182 (7.7%) | 45 (2.6%) |
| 6:30 AM to 6:59 AM | 197 (8.3%) | 20 (1.2%) |
| 7:00 AM to 7:29 AM | 92 (3.9%) | 282 (16.3%) |
| 7:30 AM to 7:59 AM | 400 (16.9%) | 351 (20.3%) |
| 8:00 AM to 8:29 AM | 329 (13.9%) | 264 (15.3%) |
| 8:30 AM to 8:59 AM | 375 (15.9%) | 201 (11.6%) |
| 9:00 AM to 9:59 AM | 147 (6.2%) | 178 (10.3%) |
| 10:00 AM to 10:59 AM | 75 (3.2%) | 126 (7.3%) |
| 11:00 AM to 11:59 AM | 98 (4.2%) | 42 (2.4%) |
| 12:00 PM to 3:59 PM | 296 (12.5%) | 96 (5.6%) |
| 4:00 PM to 11:59 PM | 34 (1.4%) | 54 (3.1%) |
| Total | 2,361 (100.0%) | 1,729 (100.0%) |
Housing Occupancy in Gunbarrel
Occupancy by Ownership in Gunbarrel
Of the total 4,699 dwellings in Gunbarrel, owner-occupied units account for 2,850 (60.7%), while renter-occupied units make up 1,849 (39.4%).
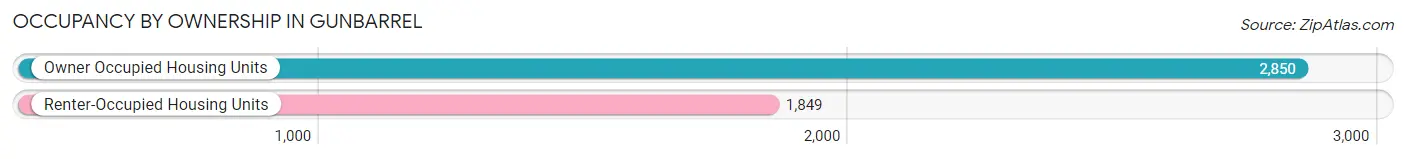
| Occupancy | # Housing Units | % Housing Units |
| Owner Occupied Housing Units | 2,850 | 60.7% |
| Renter-Occupied Housing Units | 1,849 | 39.4% |
| Total Occupied Housing Units | 4,699 | 100.0% |
Occupancy by Household Size in Gunbarrel
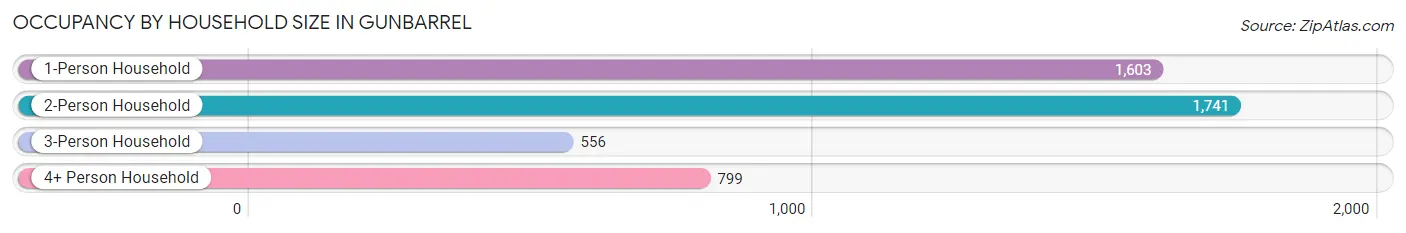
| Household Size | # Housing Units | % Housing Units |
| 1-Person Household | 1,603 | 34.1% |
| 2-Person Household | 1,741 | 37.0% |
| 3-Person Household | 556 | 11.8% |
| 4+ Person Household | 799 | 17.0% |
| Total Housing Units | 4,699 | 100.0% |
Occupancy by Ownership by Household Size in Gunbarrel
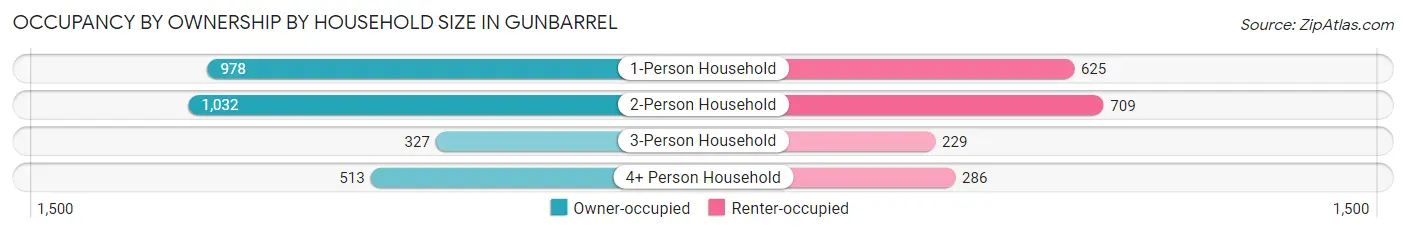
| Household Size | Owner-occupied | Renter-occupied |
| 1-Person Household | 978 (61.0%) | 625 (39.0%) |
| 2-Person Household | 1,032 (59.3%) | 709 (40.7%) |
| 3-Person Household | 327 (58.8%) | 229 (41.2%) |
| 4+ Person Household | 513 (64.2%) | 286 (35.8%) |
| Total Housing Units | 2,850 (60.7%) | 1,849 (39.4%) |
Occupancy by Educational Attainment in Gunbarrel
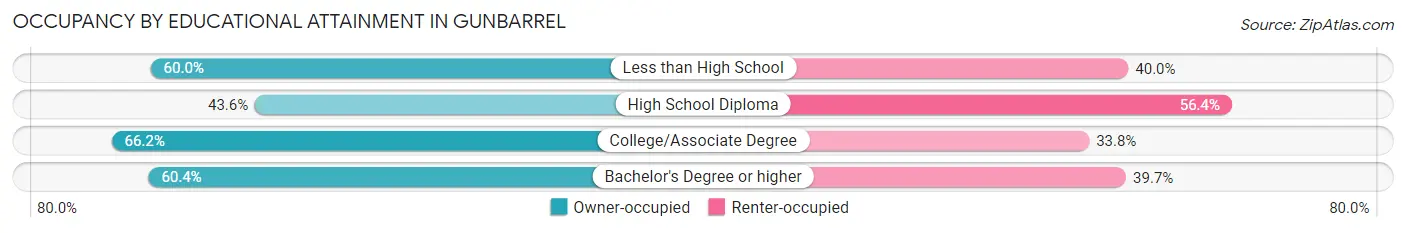
| Household Size | Owner-occupied | Renter-occupied |
| Less than High School | 9 (60.0%) | 6 (40.0%) |
| High School Diploma | 109 (43.6%) | 141 (56.4%) |
| College/Associate Degree | 633 (66.2%) | 323 (33.8%) |
| Bachelor's Degree or higher | 2,099 (60.4%) | 1,379 (39.7%) |
Occupancy by Age of Householder in Gunbarrel
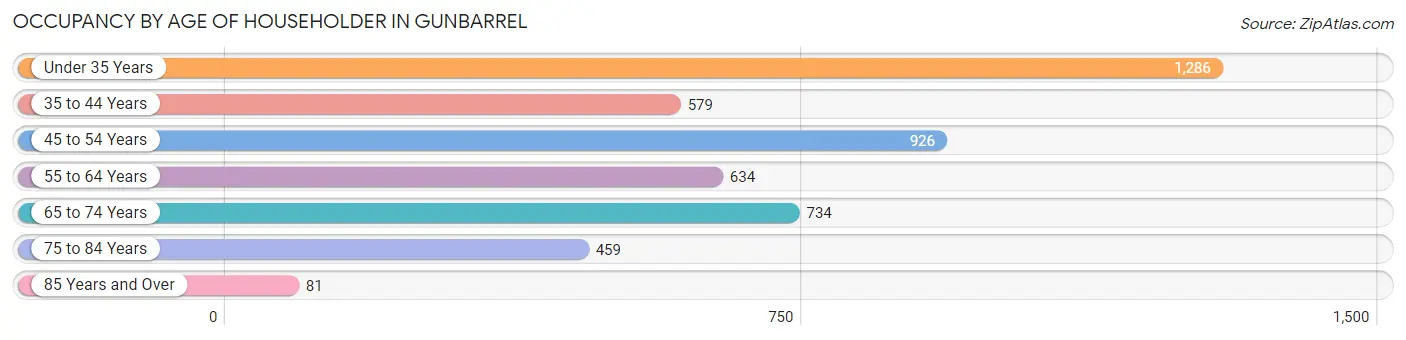
| Age Bracket | # Households | % Households |
| Under 35 Years | 1,286 | 27.4% |
| 35 to 44 Years | 579 | 12.3% |
| 45 to 54 Years | 926 | 19.7% |
| 55 to 64 Years | 634 | 13.5% |
| 65 to 74 Years | 734 | 15.6% |
| 75 to 84 Years | 459 | 9.8% |
| 85 Years and Over | 81 | 1.7% |
| Total | 4,699 | 100.0% |
Housing Finances in Gunbarrel
Median Income by Occupancy in Gunbarrel
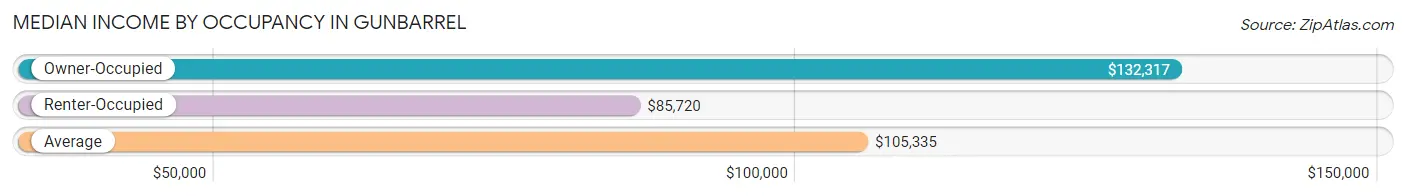
| Occupancy Type | # Households | Median Income |
| Owner-Occupied | 2,850 (60.7%) | $132,317 |
| Renter-Occupied | 1,849 (39.4%) | $85,720 |
| Average | 4,699 (100.0%) | $105,335 |
Occupancy by Householder Income Bracket in Gunbarrel
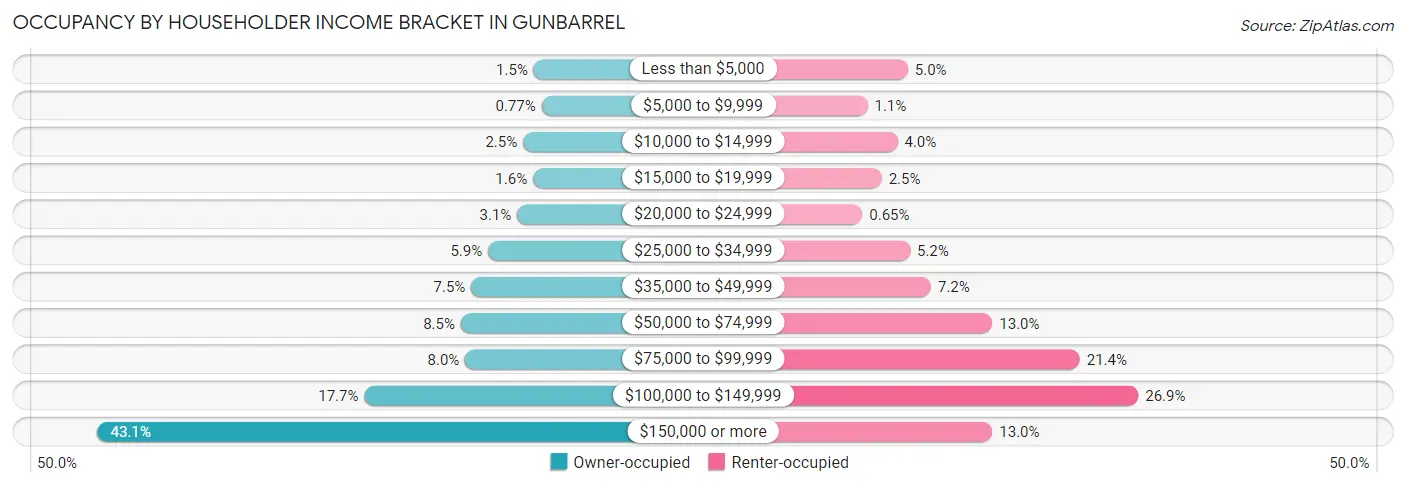
| Income Bracket | Owner-occupied | Renter-occupied |
| Less than $5,000 | 43 (1.5%) | 92 (5.0%) |
| $5,000 to $9,999 | 22 (0.8%) | 21 (1.1%) |
| $10,000 to $14,999 | 72 (2.5%) | 74 (4.0%) |
| $15,000 to $19,999 | 45 (1.6%) | 46 (2.5%) |
| $20,000 to $24,999 | 88 (3.1%) | 12 (0.6%) |
| $25,000 to $34,999 | 167 (5.9%) | 96 (5.2%) |
| $35,000 to $49,999 | 213 (7.5%) | 133 (7.2%) |
| $50,000 to $74,999 | 241 (8.5%) | 241 (13.0%) |
| $75,000 to $99,999 | 229 (8.0%) | 395 (21.4%) |
| $100,000 to $149,999 | 503 (17.6%) | 498 (26.9%) |
| $150,000 or more | 1,227 (43.0%) | 241 (13.0%) |
| Total | 2,850 (100.0%) | 1,849 (100.0%) |
Monthly Housing Cost Tiers in Gunbarrel
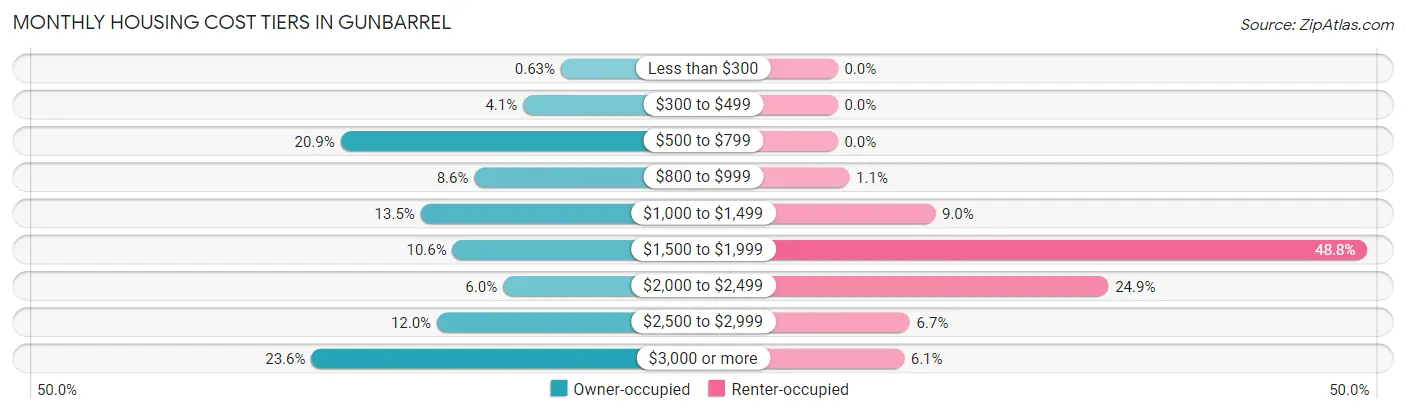
| Monthly Cost | Owner-occupied | Renter-occupied |
| Less than $300 | 18 (0.6%) | 0 (0.0%) |
| $300 to $499 | 117 (4.1%) | 0 (0.0%) |
| $500 to $799 | 596 (20.9%) | 0 (0.0%) |
| $800 to $999 | 245 (8.6%) | 20 (1.1%) |
| $1,000 to $1,499 | 386 (13.5%) | 166 (9.0%) |
| $1,500 to $1,999 | 302 (10.6%) | 902 (48.8%) |
| $2,000 to $2,499 | 170 (6.0%) | 461 (24.9%) |
| $2,500 to $2,999 | 343 (12.0%) | 123 (6.7%) |
| $3,000 or more | 673 (23.6%) | 113 (6.1%) |
| Total | 2,850 (100.0%) | 1,849 (100.0%) |
Physical Housing Characteristics in Gunbarrel
Housing Structures in Gunbarrel
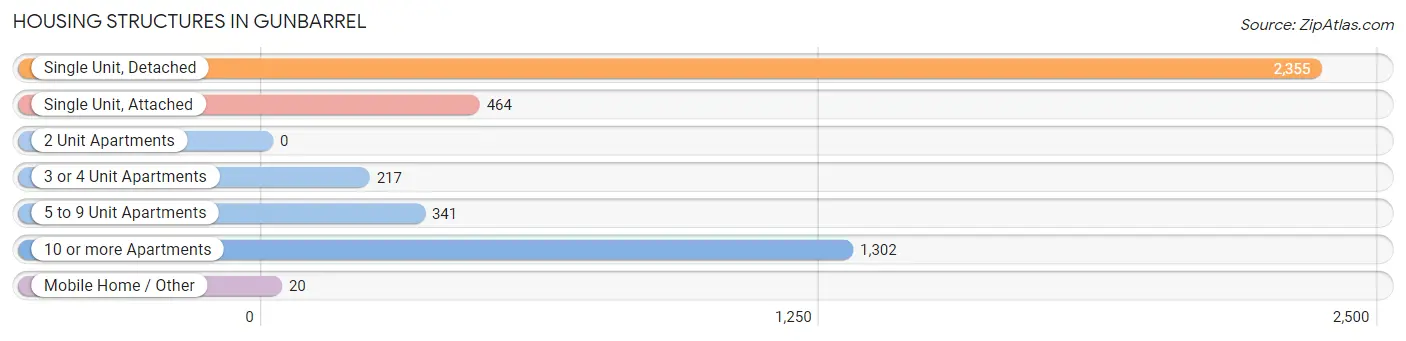
| Structure Type | # Housing Units | % Housing Units |
| Single Unit, Detached | 2,355 | 50.1% |
| Single Unit, Attached | 464 | 9.9% |
| 2 Unit Apartments | 0 | 0.0% |
| 3 or 4 Unit Apartments | 217 | 4.6% |
| 5 to 9 Unit Apartments | 341 | 7.3% |
| 10 or more Apartments | 1,302 | 27.7% |
| Mobile Home / Other | 20 | 0.4% |
| Total | 4,699 | 100.0% |
Housing Structures by Occupancy in Gunbarrel
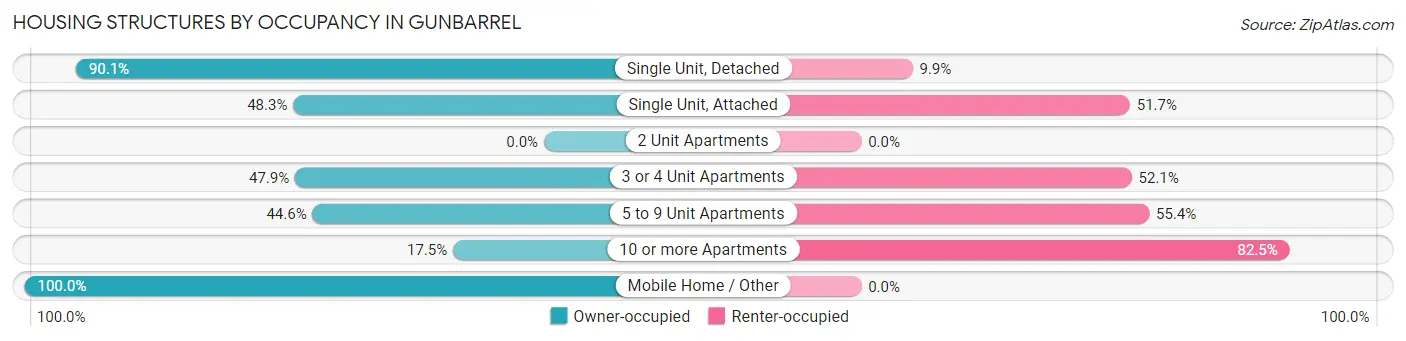
| Structure Type | Owner-occupied | Renter-occupied |
| Single Unit, Detached | 2,122 (90.1%) | 233 (9.9%) |
| Single Unit, Attached | 224 (48.3%) | 240 (51.7%) |
| 2 Unit Apartments | 0 (0.0%) | 0 (0.0%) |
| 3 or 4 Unit Apartments | 104 (47.9%) | 113 (52.1%) |
| 5 to 9 Unit Apartments | 152 (44.6%) | 189 (55.4%) |
| 10 or more Apartments | 228 (17.5%) | 1,074 (82.5%) |
| Mobile Home / Other | 20 (100.0%) | 0 (0.0%) |
| Total | 2,850 (60.7%) | 1,849 (39.4%) |
Housing Structures by Number of Rooms in Gunbarrel
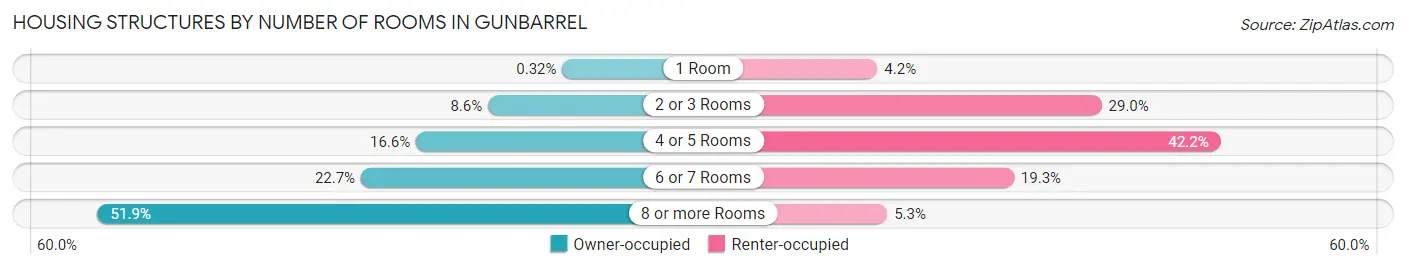
| Number of Rooms | Owner-occupied | Renter-occupied |
| 1 Room | 9 (0.3%) | 77 (4.2%) |
| 2 or 3 Rooms | 244 (8.6%) | 537 (29.0%) |
| 4 or 5 Rooms | 472 (16.6%) | 781 (42.2%) |
| 6 or 7 Rooms | 646 (22.7%) | 357 (19.3%) |
| 8 or more Rooms | 1,479 (51.9%) | 97 (5.2%) |
| Total | 2,850 (100.0%) | 1,849 (100.0%) |
Housing Structure by Heating Type in Gunbarrel
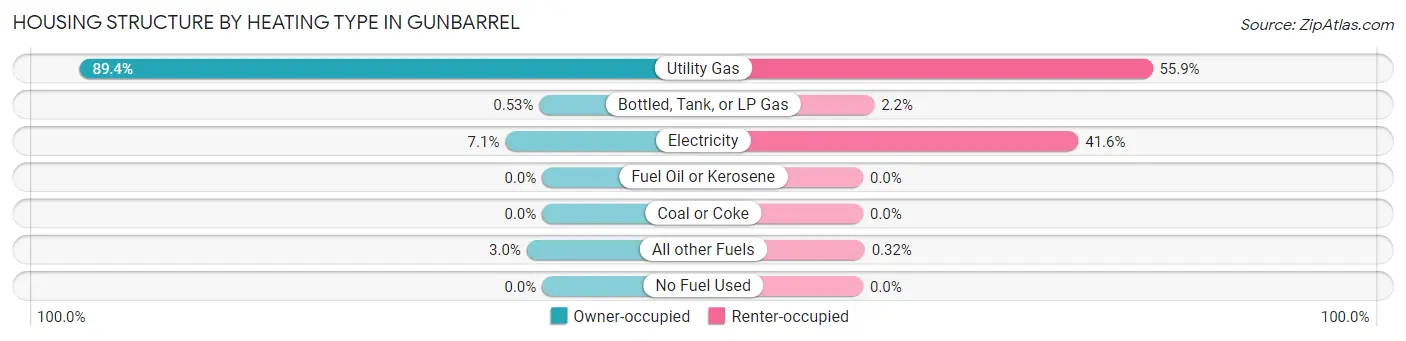
| Heating Type | Owner-occupied | Renter-occupied |
| Utility Gas | 2,547 (89.4%) | 1,034 (55.9%) |
| Bottled, Tank, or LP Gas | 15 (0.5%) | 40 (2.2%) |
| Electricity | 203 (7.1%) | 769 (41.6%) |
| Fuel Oil or Kerosene | 0 (0.0%) | 0 (0.0%) |
| Coal or Coke | 0 (0.0%) | 0 (0.0%) |
| All other Fuels | 85 (3.0%) | 6 (0.3%) |
| No Fuel Used | 0 (0.0%) | 0 (0.0%) |
| Total | 2,850 (100.0%) | 1,849 (100.0%) |
Household Vehicle Usage in Gunbarrel
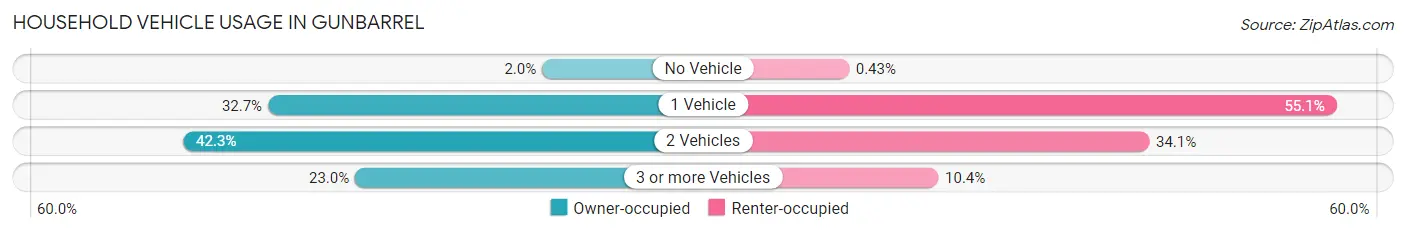
| Vehicles per Household | Owner-occupied | Renter-occupied |
| No Vehicle | 58 (2.0%) | 8 (0.4%) |
| 1 Vehicle | 933 (32.7%) | 1,018 (55.1%) |
| 2 Vehicles | 1,204 (42.2%) | 630 (34.1%) |
| 3 or more Vehicles | 655 (23.0%) | 193 (10.4%) |
| Total | 2,850 (100.0%) | 1,849 (100.0%) |
Real Estate & Mortgages in Gunbarrel
Real Estate and Mortgage Overview in Gunbarrel
| Characteristic | Without Mortgage | With Mortgage |
| Housing Units | 1,114 | 1,736 |
| Median Property Value | $739,500 | $696,600 |
| Median Household Income | $88,214 | $928 |
| Monthly Housing Costs | $728 | $673 |
| Real Estate Taxes | $3,917 | $16 |
Property Value by Mortgage Status in Gunbarrel
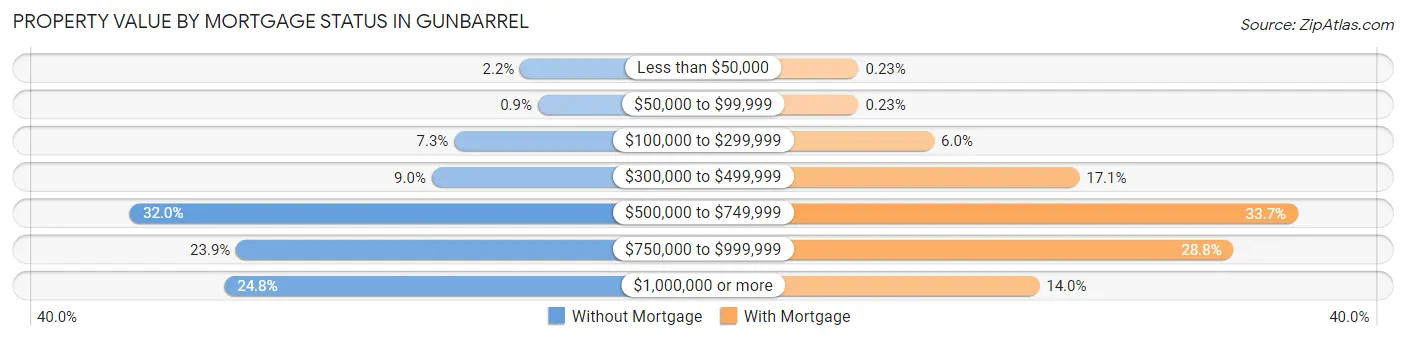
| Property Value | Without Mortgage | With Mortgage |
| Less than $50,000 | 25 (2.2%) | 4 (0.2%) |
| $50,000 to $99,999 | 10 (0.9%) | 4 (0.2%) |
| $100,000 to $299,999 | 81 (7.3%) | 104 (6.0%) |
| $300,000 to $499,999 | 100 (9.0%) | 296 (17.1%) |
| $500,000 to $749,999 | 356 (32.0%) | 585 (33.7%) |
| $750,000 to $999,999 | 266 (23.9%) | 500 (28.8%) |
| $1,000,000 or more | 276 (24.8%) | 243 (14.0%) |
| Total | 1,114 (100.0%) | 1,736 (100.0%) |
Household Income by Mortgage Status in Gunbarrel
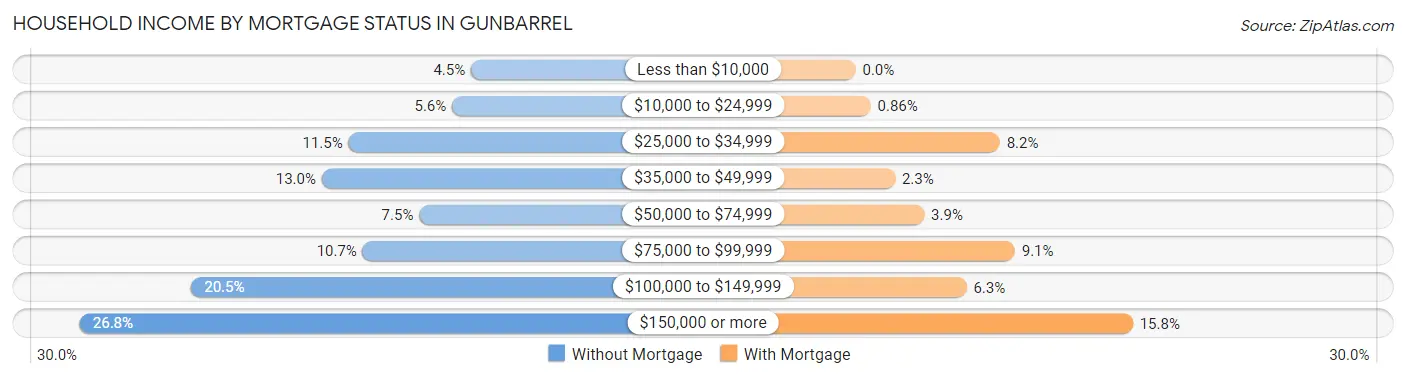
| Household Income | Without Mortgage | With Mortgage |
| Less than $10,000 | 50 (4.5%) | 0 (0.0%) |
| $10,000 to $24,999 | 62 (5.6%) | 15 (0.9%) |
| $25,000 to $34,999 | 128 (11.5%) | 143 (8.2%) |
| $35,000 to $49,999 | 145 (13.0%) | 39 (2.2%) |
| $50,000 to $74,999 | 83 (7.4%) | 68 (3.9%) |
| $75,000 to $99,999 | 119 (10.7%) | 158 (9.1%) |
| $100,000 to $149,999 | 228 (20.5%) | 110 (6.3%) |
| $150,000 or more | 299 (26.8%) | 275 (15.8%) |
| Total | 1,114 (100.0%) | 1,736 (100.0%) |
Property Value to Household Income Ratio in Gunbarrel
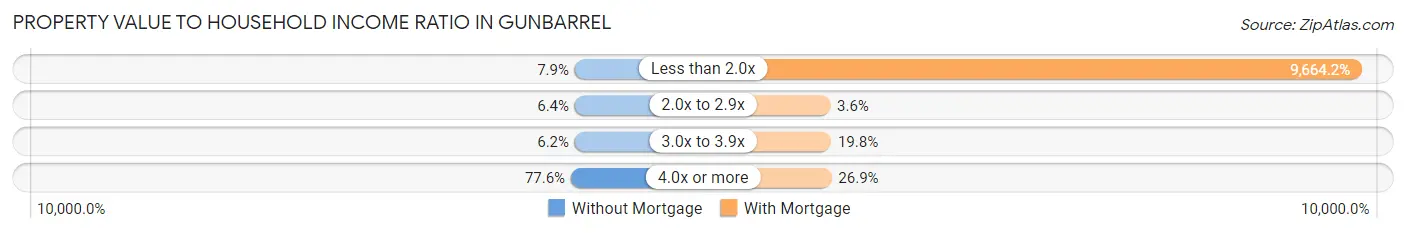
| Value-to-Income Ratio | Without Mortgage | With Mortgage |
| Less than 2.0x | 88 (7.9%) | 167,770 (9,664.2%) |
| 2.0x to 2.9x | 71 (6.4%) | 63 (3.6%) |
| 3.0x to 3.9x | 69 (6.2%) | 344 (19.8%) |
| 4.0x or more | 864 (77.6%) | 467 (26.9%) |
| Total | 1,114 (100.0%) | 1,736 (100.0%) |
Real Estate Taxes by Mortgage Status in Gunbarrel
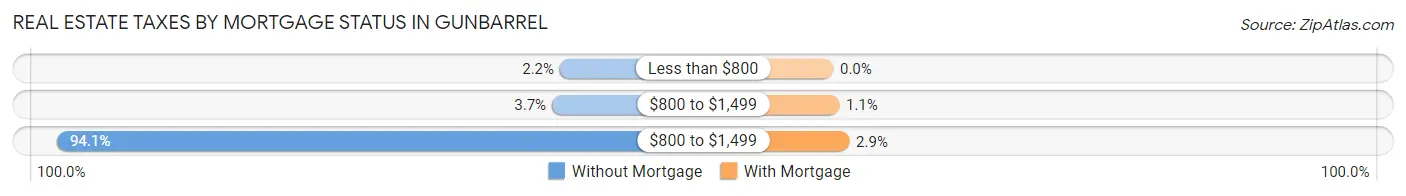
| Property Taxes | Without Mortgage | With Mortgage |
| Less than $800 | 25 (2.2%) | 0 (0.0%) |
| $800 to $1,499 | 41 (3.7%) | 19 (1.1%) |
| $800 to $1,499 | 1,048 (94.1%) | 51 (2.9%) |
| Total | 1,114 (100.0%) | 1,736 (100.0%) |
Health & Disability in Gunbarrel
Health Insurance Coverage by Age in Gunbarrel
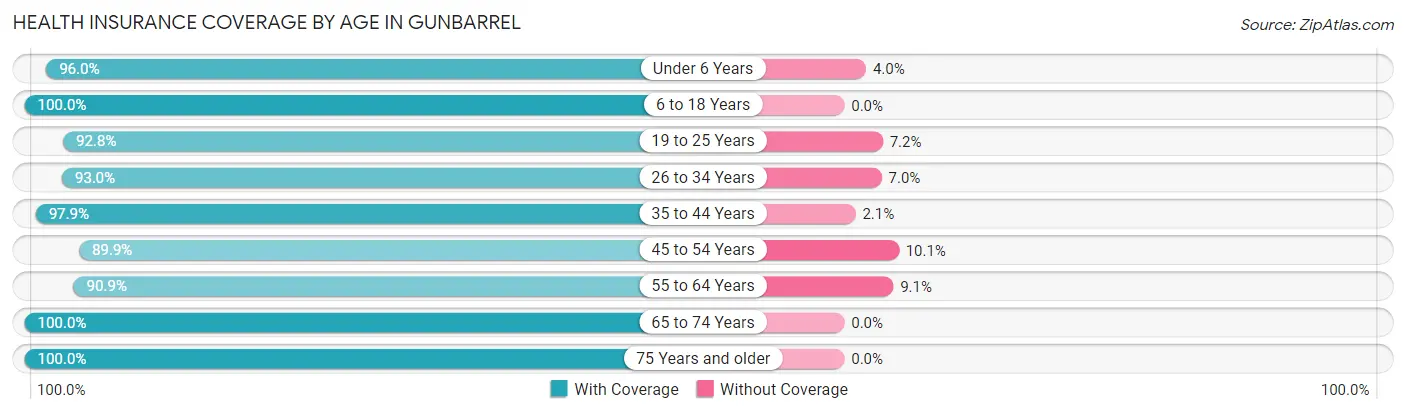
| Age Bracket | With Coverage | Without Coverage |
| Under 6 Years | 546 (96.0%) | 23 (4.0%) |
| 6 to 18 Years | 987 (100.0%) | 0 (0.0%) |
| 19 to 25 Years | 842 (92.8%) | 65 (7.2%) |
| 26 to 34 Years | 1,564 (93.0%) | 117 (7.0%) |
| 35 to 44 Years | 1,176 (97.9%) | 25 (2.1%) |
| 45 to 54 Years | 1,436 (89.9%) | 162 (10.1%) |
| 55 to 64 Years | 1,313 (90.9%) | 132 (9.1%) |
| 65 to 74 Years | 968 (100.0%) | 0 (0.0%) |
| 75 Years and older | 735 (100.0%) | 0 (0.0%) |
| Total | 9,567 (94.8%) | 524 (5.2%) |
Health Insurance Coverage by Citizenship Status in Gunbarrel
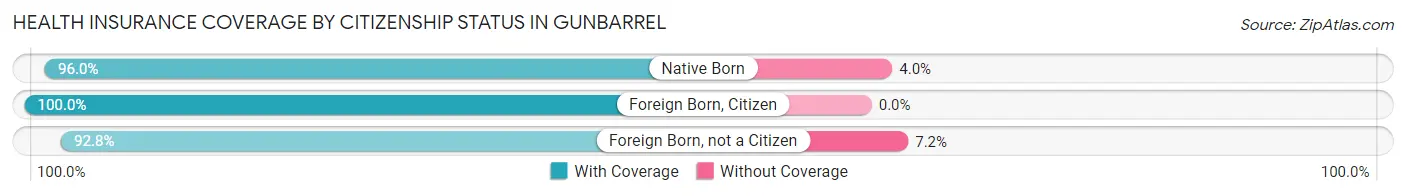
| Citizenship Status | With Coverage | Without Coverage |
| Native Born | 546 (96.0%) | 23 (4.0%) |
| Foreign Born, Citizen | 987 (100.0%) | 0 (0.0%) |
| Foreign Born, not a Citizen | 842 (92.8%) | 65 (7.2%) |
Health Insurance Coverage by Household Income in Gunbarrel
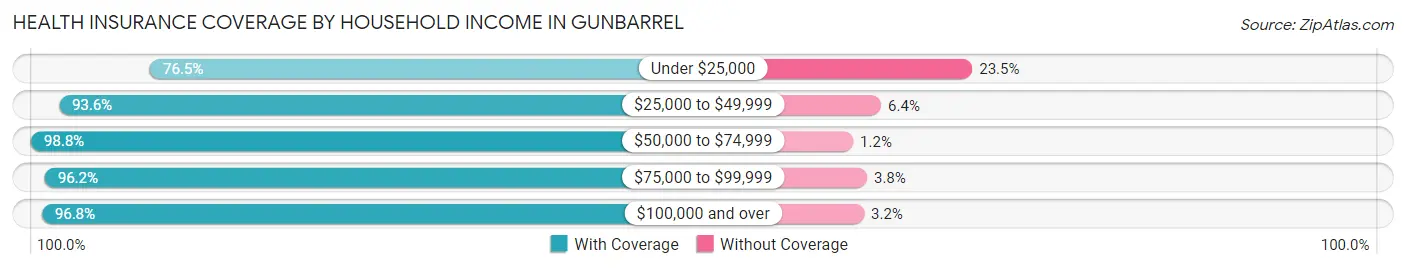
| Household Income | With Coverage | Without Coverage |
| Under $25,000 | 670 (76.5%) | 206 (23.5%) |
| $25,000 to $49,999 | 785 (93.6%) | 54 (6.4%) |
| $50,000 to $74,999 | 747 (98.8%) | 9 (1.2%) |
| $75,000 to $99,999 | 1,446 (96.2%) | 57 (3.8%) |
| $100,000 and over | 5,919 (96.8%) | 198 (3.2%) |
Public vs Private Health Insurance Coverage by Age in Gunbarrel
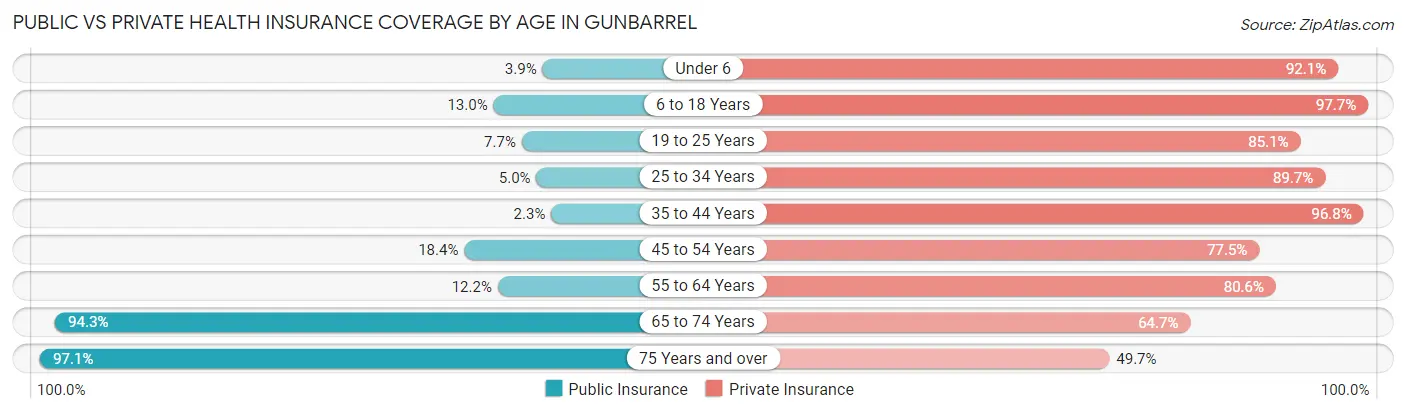
| Age Bracket | Public Insurance | Private Insurance |
| Under 6 | 22 (3.9%) | 524 (92.1%) |
| 6 to 18 Years | 128 (13.0%) | 964 (97.7%) |
| 19 to 25 Years | 70 (7.7%) | 772 (85.1%) |
| 25 to 34 Years | 84 (5.0%) | 1,508 (89.7%) |
| 35 to 44 Years | 27 (2.2%) | 1,163 (96.8%) |
| 45 to 54 Years | 294 (18.4%) | 1,238 (77.5%) |
| 55 to 64 Years | 176 (12.2%) | 1,164 (80.5%) |
| 65 to 74 Years | 913 (94.3%) | 626 (64.7%) |
| 75 Years and over | 714 (97.1%) | 365 (49.7%) |
| Total | 2,428 (24.1%) | 8,324 (82.5%) |
Disability Status by Sex by Age in Gunbarrel
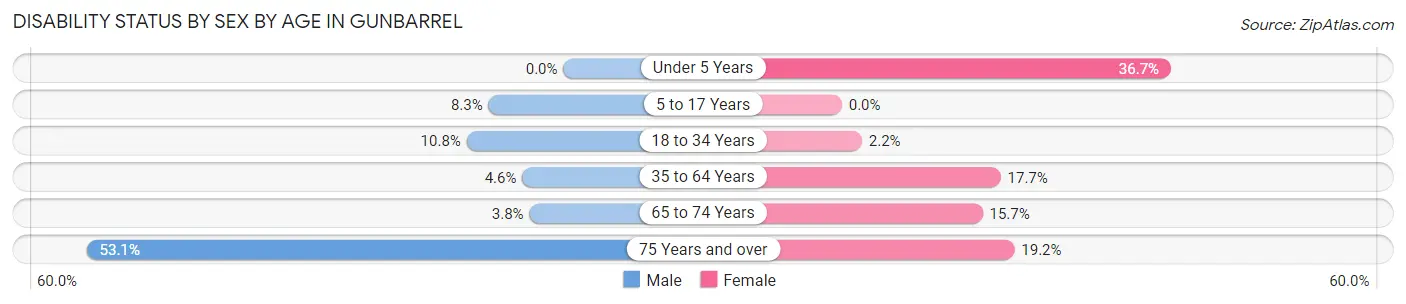
| Age Bracket | Male | Female |
| Under 5 Years | 0 (0.0%) | 140 (36.6%) |
| 5 to 17 Years | 38 (8.3%) | 0 (0.0%) |
| 18 to 34 Years | 166 (10.8%) | 26 (2.2%) |
| 35 to 64 Years | 102 (4.6%) | 356 (17.7%) |
| 65 to 74 Years | 19 (3.8%) | 73 (15.7%) |
| 75 Years and over | 172 (53.1%) | 79 (19.2%) |
Disability Class by Sex by Age in Gunbarrel
Disability Class: Hearing Difficulty
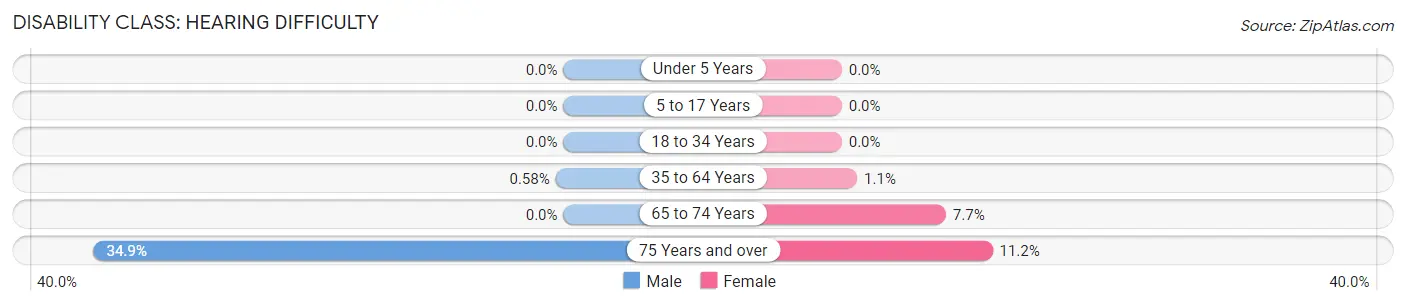
| Age Bracket | Male | Female |
| Under 5 Years | 0 (0.0%) | 0 (0.0%) |
| 5 to 17 Years | 0 (0.0%) | 0 (0.0%) |
| 18 to 34 Years | 0 (0.0%) | 0 (0.0%) |
| 35 to 64 Years | 13 (0.6%) | 23 (1.1%) |
| 65 to 74 Years | 0 (0.0%) | 36 (7.7%) |
| 75 Years and over | 113 (34.9%) | 46 (11.2%) |
Disability Class: Vision Difficulty
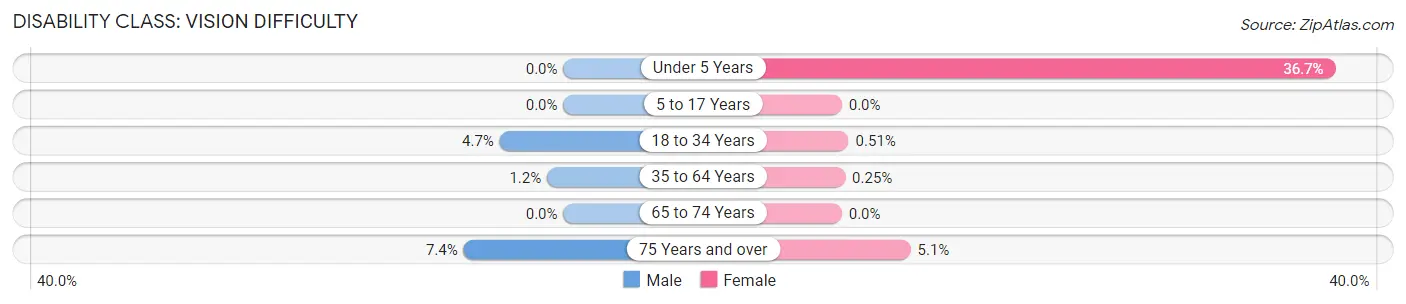
| Age Bracket | Male | Female |
| Under 5 Years | 0 (0.0%) | 140 (36.6%) |
| 5 to 17 Years | 0 (0.0%) | 0 (0.0%) |
| 18 to 34 Years | 73 (4.7%) | 6 (0.5%) |
| 35 to 64 Years | 27 (1.2%) | 5 (0.3%) |
| 65 to 74 Years | 0 (0.0%) | 0 (0.0%) |
| 75 Years and over | 24 (7.4%) | 21 (5.1%) |
Disability Class: Cognitive Difficulty
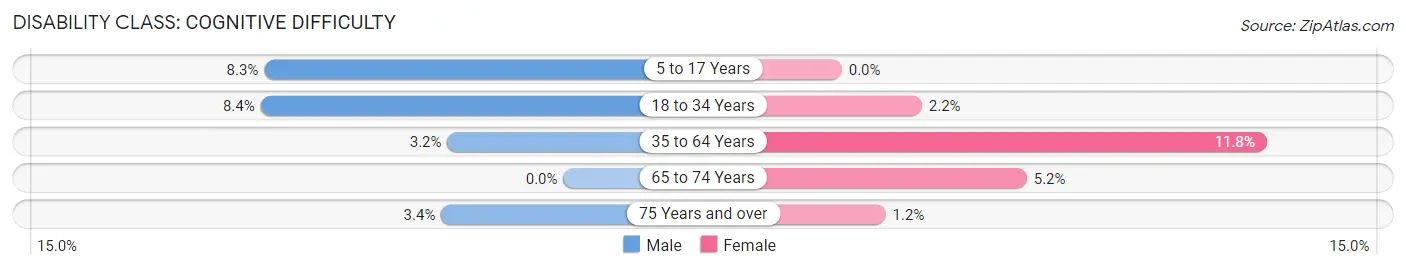
| Age Bracket | Male | Female |
| 5 to 17 Years | 38 (8.3%) | 0 (0.0%) |
| 18 to 34 Years | 130 (8.4%) | 26 (2.2%) |
| 35 to 64 Years | 72 (3.2%) | 238 (11.8%) |
| 65 to 74 Years | 0 (0.0%) | 24 (5.1%) |
| 75 Years and over | 11 (3.4%) | 5 (1.2%) |
Disability Class: Ambulatory Difficulty
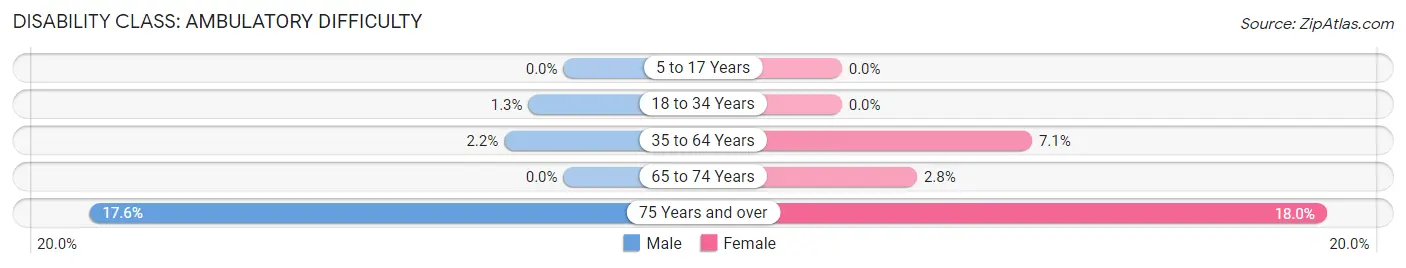
| Age Bracket | Male | Female |
| 5 to 17 Years | 0 (0.0%) | 0 (0.0%) |
| 18 to 34 Years | 20 (1.3%) | 0 (0.0%) |
| 35 to 64 Years | 49 (2.2%) | 142 (7.1%) |
| 65 to 74 Years | 0 (0.0%) | 13 (2.8%) |
| 75 Years and over | 57 (17.6%) | 74 (18.0%) |
Disability Class: Self-Care Difficulty
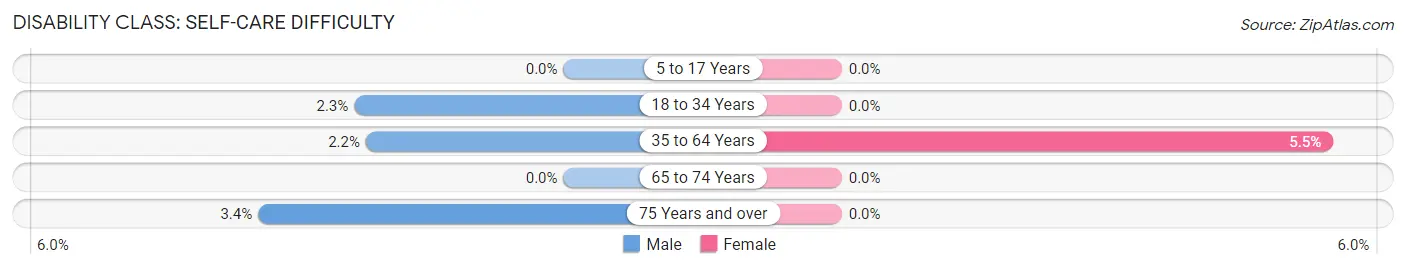
| Age Bracket | Male | Female |
| 5 to 17 Years | 0 (0.0%) | 0 (0.0%) |
| 18 to 34 Years | 36 (2.3%) | 0 (0.0%) |
| 35 to 64 Years | 49 (2.2%) | 110 (5.5%) |
| 65 to 74 Years | 0 (0.0%) | 0 (0.0%) |
| 75 Years and over | 11 (3.4%) | 0 (0.0%) |
Technology Access in Gunbarrel
Computing Device Access in Gunbarrel
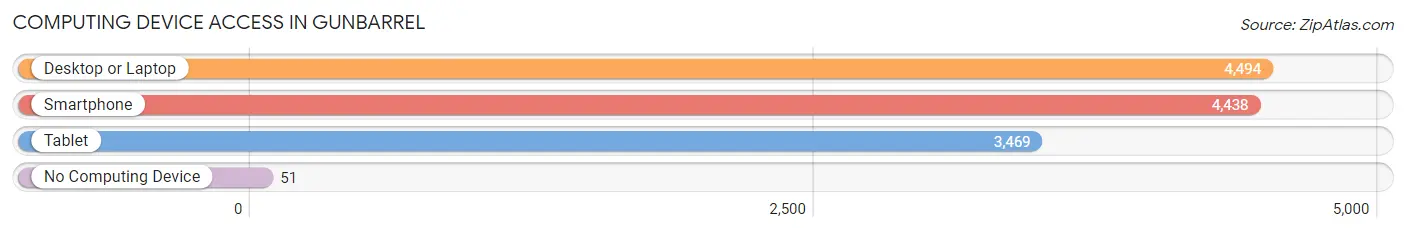
| Device Type | # Households | % Households |
| Desktop or Laptop | 4,494 | 95.6% |
| Smartphone | 4,438 | 94.5% |
| Tablet | 3,469 | 73.8% |
| No Computing Device | 51 | 1.1% |
| Total | 4,699 | 100.0% |
Internet Access in Gunbarrel
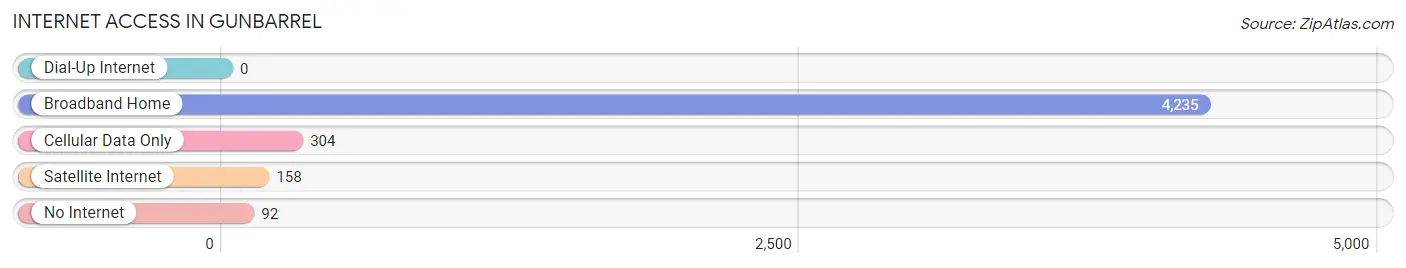
| Internet Type | # Households | % Households |
| Dial-Up Internet | 0 | 0.0% |
| Broadband Home | 4,235 | 90.1% |
| Cellular Data Only | 304 | 6.5% |
| Satellite Internet | 158 | 3.4% |
| No Internet | 92 | 2.0% |
| Total | 4,699 | 100.0% |
Gunbarrel Summary
History
The history of Gunbarrel, Colorado dates back to the late 1800s when the area was first settled by homesteaders. The town was officially founded in 1891 and was named after a nearby creek. The creek was named after a gun barrel that was found in the area by a local rancher. The town was originally a farming and ranching community, but it soon became a popular destination for tourists and outdoor enthusiasts.
In the early 1900s, the town began to grow and develop. The first school was built in 1910 and the first post office opened in 1911. The town also had a general store, a blacksmith shop, and a hotel. In the 1920s, the town was connected to the rest of the state by a railroad line.
In the 1950s, the town began to experience a population boom as people moved to the area for its scenic beauty and outdoor recreation opportunities. The town was incorporated in 1959 and the population continued to grow throughout the 1960s and 1970s.
Geography
Gunbarrel is located in Boulder County, Colorado, approximately 10 miles northeast of Boulder. The town is situated at an elevation of 5,400 feet and is surrounded by rolling hills and open space. The town is located in the foothills of the Rocky Mountains and is close to several popular outdoor recreation areas, including the Indian Peaks Wilderness Area and the Arapaho National Forest.
The town covers an area of approximately 4.5 square miles and has a population of approximately 8,000 people. The town is served by the Boulder Valley School District and is home to several parks and recreational facilities.
Economy
The economy of Gunbarrel is largely based on the service industry. The town is home to several restaurants, retail stores, and other businesses. The town is also home to several technology companies, including IBM, Oracle, and Google.
The town is also home to several educational institutions, including the University of Colorado Boulder and Naropa University. The town is also home to several medical facilities, including the Boulder Community Health Center and the Boulder Valley Medical Center.
Demographics
As of the 2010 census, the population of Gunbarrel was 8,000 people. The racial makeup of the town was 87.3% White, 4.2% African American, 0.7% Native American, 3.2% Asian, 0.2% Pacific Islander, and 4.4% from other races. The median household income was $76,000 and the median family income was $86,000.
The town is home to several religious denominations, including Catholic, Protestant, and Jewish. The town is also home to several cultural organizations, including the Boulder County Arts Council and the Boulder County Historical Society.
Conclusion
Gunbarrel, Colorado is a small town located in Boulder County. The town has a rich history and is home to several businesses, educational institutions, and medical facilities. The town is also home to several parks and recreational facilities and is close to several popular outdoor recreation areas. The town has a population of 8,000 people and is served by the Boulder Valley School District. The town has a diverse population and is home to several religious denominations and cultural organizations.
Common Questions
What is Per Capita Income in Gunbarrel?
Per Capita income in Gunbarrel is $65,695.
What is the Median Family Income in Gunbarrel?
Median Family Income in Gunbarrel is $149,688.
What is the Median Household income in Gunbarrel?
Median Household Income in Gunbarrel is $105,335.
What is Income or Wage Gap in Gunbarrel?
Income or Wage Gap in Gunbarrel is 42.4%.
Women in Gunbarrel earn 57.6 cents for every dollar earned by a man.
What is Family Income Deficit in Gunbarrel?
Family Income Deficit in Gunbarrel is $8,397.
Families that are below poverty line in Gunbarrel earn $8,397 less on average than the poverty threshold level.
What is Inequality or Gini Index in Gunbarrel?
Inequality or Gini Index in Gunbarrel is 0.46.
What is the Total Population of Gunbarrel?
Total Population of Gunbarrel is 10,108.
What is the Total Male Population of Gunbarrel?
Total Male Population of Gunbarrel is 5,177.
What is the Total Female Population of Gunbarrel?
Total Female Population of Gunbarrel is 4,931.
What is the Ratio of Males per 100 Females in Gunbarrel?
There are 104.99 Males per 100 Females in Gunbarrel.
What is the Ratio of Females per 100 Males in Gunbarrel?
There are 95.25 Females per 100 Males in Gunbarrel.
What is the Median Population Age in Gunbarrel?
Median Population Age in Gunbarrel is 42.5 Years.
What is the Average Family Size in Gunbarrel
Average Family Size in Gunbarrel is 2.7 People.
What is the Average Household Size in Gunbarrel
Average Household Size in Gunbarrel is 2.1 People.
How Large is the Labor Force in Gunbarrel?
There are 6,163 People in the Labor Forcein in Gunbarrel.
What is the Percentage of People in the Labor Force in Gunbarrel?
69.5% of People are in the Labor Force in Gunbarrel.
What is the Unemployment Rate in Gunbarrel?
Unemployment Rate in Gunbarrel is 5.6%.