Cherry Creek, CO Map & Demographics
Cherry Creek Map
Cherry Creek Overview
$83,229
PER CAPITA INCOME
$196,798
AVG FAMILY INCOME
$146,583
AVG HOUSEHOLD INCOME
54.4%
WAGE / INCOME GAP [ % ]
45.6¢/ $1
WAGE / INCOME GAP [ $ ]
0.51
INEQUALITY / GINI INDEX
11,157
TOTAL POPULATION
5,517
MALE POPULATION
5,640
FEMALE POPULATION
97.82
MALES / 100 FEMALES
102.23
FEMALES / 100 MALES
42.6
MEDIAN AGE
3.2
AVG FAMILY SIZE
2.7
AVG HOUSEHOLD SIZE
6,081
LABOR FORCE [ PEOPLE ]
70.1%
PERCENT IN LABOR FORCE
4.4%
UNEMPLOYMENT RATE
Income in Cherry Creek
Income Overview in Cherry Creek
Per Capita Income in Cherry Creek is $83,229, while median incomes of families and households are $196,798 and $146,583 respectively.
| Characteristic | Number | Measure |
| Per Capita Income | 11,157 | $83,229 |
| Median Family Income | 2,978 | $196,798 |
| Mean Family Income | 2,978 | $269,083 |
| Median Household Income | 4,105 | $146,583 |
| Mean Household Income | 4,105 | $221,299 |
| Income Deficit | 2,978 | $0 |
| Wage / Income Gap (%) | 11,157 | 54.36% |
| Wage / Income Gap ($) | 11,157 | 45.64¢ per $1 |
| Gini / Inequality Index | 11,157 | 0.51 |
Earnings by Sex in Cherry Creek
Average Earnings in Cherry Creek are $67,695, $106,452 for men and $48,583 for women, a difference of 54.4%.
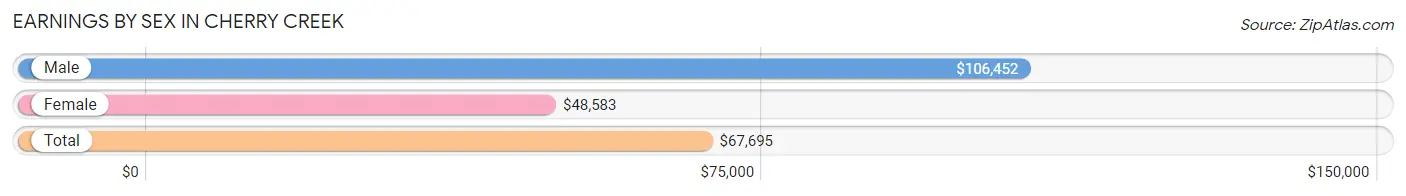
| Sex | Number | Average Earnings |
| Male | 3,157 (49.8%) | $106,452 |
| Female | 3,176 (50.1%) | $48,583 |
| Total | 6,333 (100.0%) | $67,695 |
Earnings by Sex by Income Bracket in Cherry Creek
The most common earnings brackets in Cherry Creek are $100,000+ for men (1,780 | 56.4%) and $100,000+ for women (764 | 24.1%).
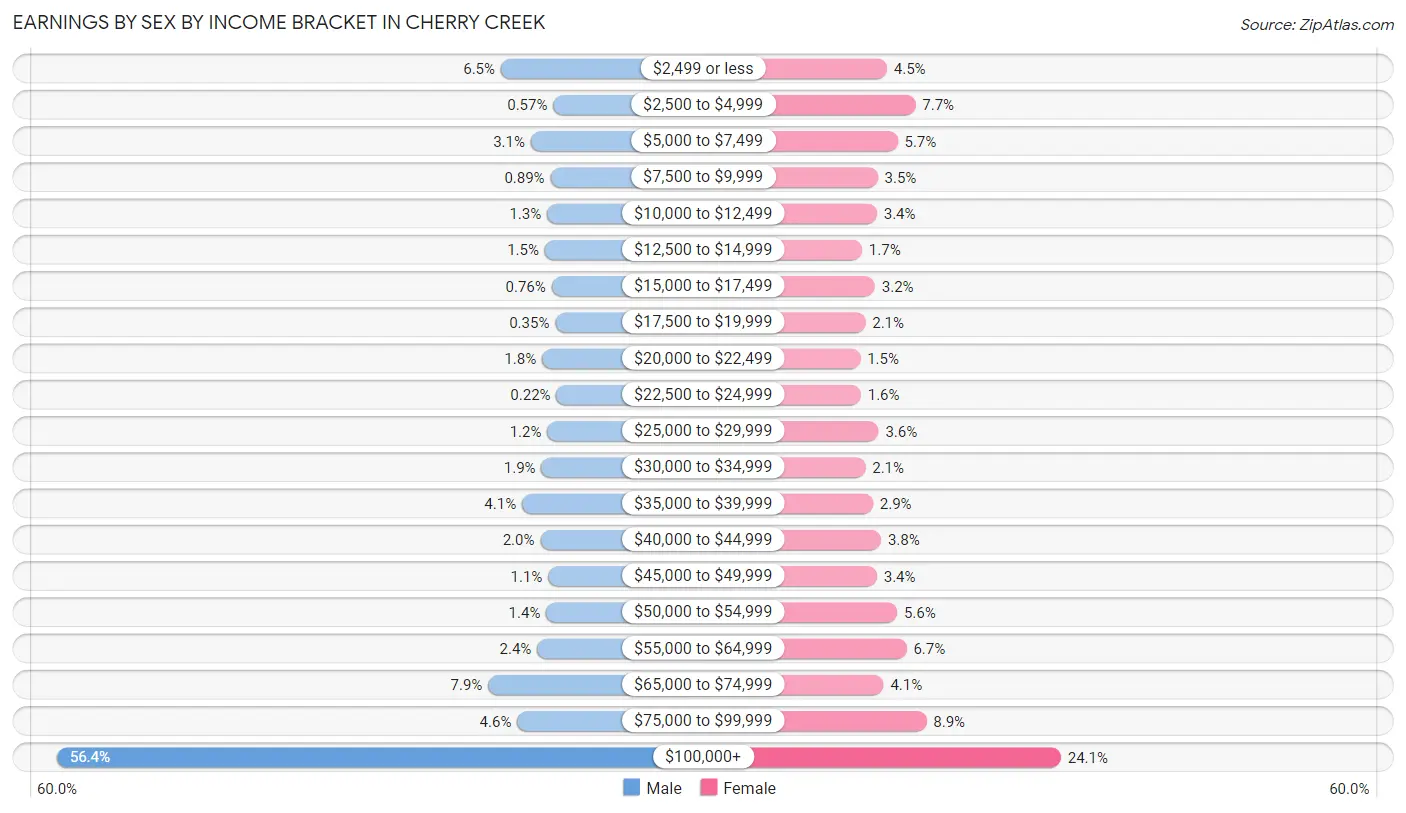
| Income | Male | Female |
| $2,499 or less | 204 (6.5%) | 143 (4.5%) |
| $2,500 to $4,999 | 18 (0.6%) | 245 (7.7%) |
| $5,000 to $7,499 | 98 (3.1%) | 181 (5.7%) |
| $7,500 to $9,999 | 28 (0.9%) | 110 (3.5%) |
| $10,000 to $12,499 | 40 (1.3%) | 107 (3.4%) |
| $12,500 to $14,999 | 48 (1.5%) | 54 (1.7%) |
| $15,000 to $17,499 | 24 (0.8%) | 100 (3.2%) |
| $17,500 to $19,999 | 11 (0.4%) | 66 (2.1%) |
| $20,000 to $22,499 | 58 (1.8%) | 48 (1.5%) |
| $22,500 to $24,999 | 7 (0.2%) | 50 (1.6%) |
| $25,000 to $29,999 | 39 (1.2%) | 113 (3.6%) |
| $30,000 to $34,999 | 60 (1.9%) | 66 (2.1%) |
| $35,000 to $39,999 | 129 (4.1%) | 93 (2.9%) |
| $40,000 to $44,999 | 64 (2.0%) | 122 (3.8%) |
| $45,000 to $49,999 | 36 (1.1%) | 107 (3.4%) |
| $50,000 to $54,999 | 43 (1.4%) | 179 (5.6%) |
| $55,000 to $64,999 | 75 (2.4%) | 213 (6.7%) |
| $65,000 to $74,999 | 249 (7.9%) | 131 (4.1%) |
| $75,000 to $99,999 | 146 (4.6%) | 284 (8.9%) |
| $100,000+ | 1,780 (56.4%) | 764 (24.1%) |
| Total | 3,157 (100.0%) | 3,176 (100.0%) |
Earnings by Sex by Educational Attainment in Cherry Creek
Average earnings in Cherry Creek are $116,740 for men and $58,237 for women, a difference of 50.1%. Men with an educational attainment of graduate degree enjoy the highest average annual earnings of $147,708, while those with high school diploma education earn the least with $54,567. Women with an educational attainment of graduate degree earn the most with the average annual earnings of $68,917, while those with college or associate's degree education have the smallest earnings of $51,615.
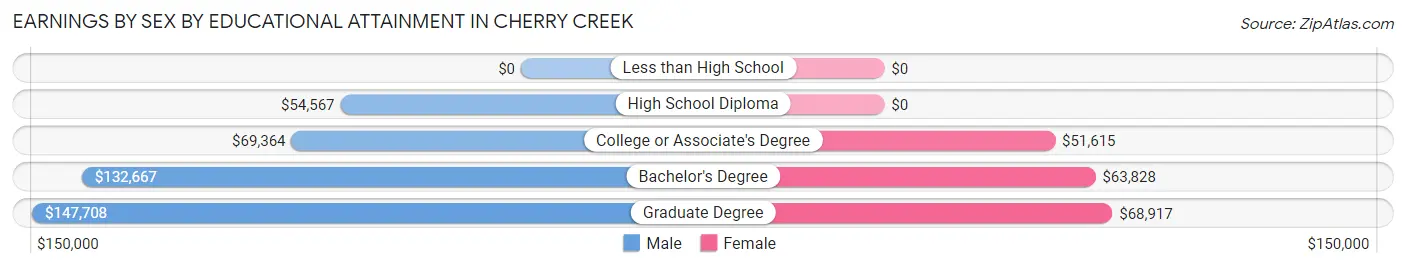
| Educational Attainment | Male Income | Female Income |
| Less than High School | - | - |
| High School Diploma | $54,567 | $0 |
| College or Associate's Degree | $69,364 | $51,615 |
| Bachelor's Degree | $132,667 | $63,828 |
| Graduate Degree | $147,708 | $68,917 |
| Total | $116,740 | $58,237 |
Family Income in Cherry Creek
Family Income Brackets in Cherry Creek
According to the Cherry Creek family income data, there are 1,465 families falling into the $200,000+ income range, which is the most common income bracket and makes up 49.2% of all families. Conversely, the $10,000 to $14,999 income bracket is the least frequent group with only 9 families (0.3%) belonging to this category.
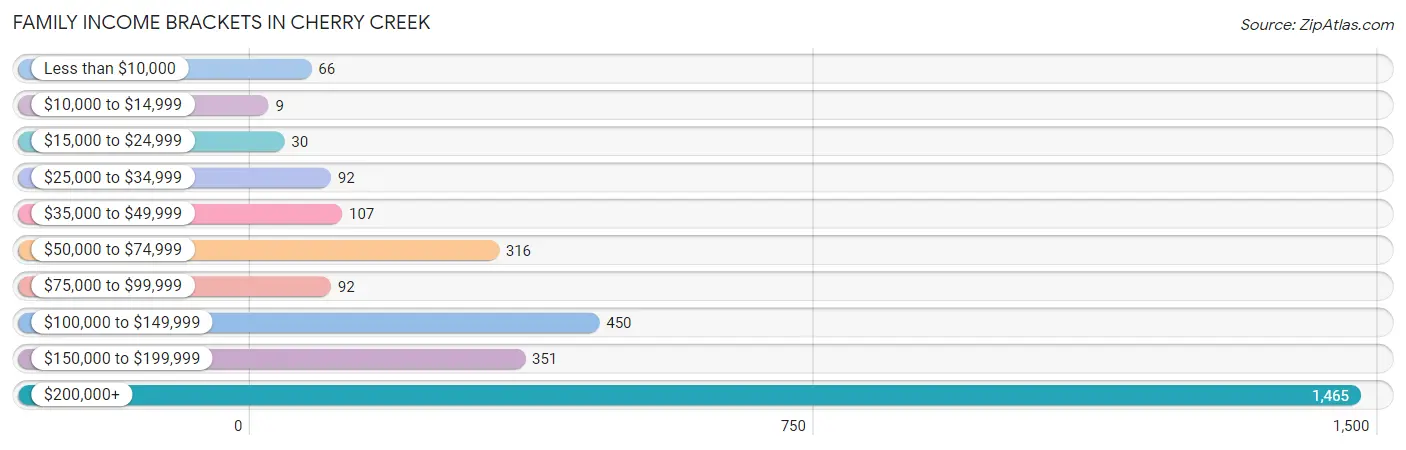
| Income Bracket | # Families | % Families |
| Less than $10,000 | 66 | 2.2% |
| $10,000 to $14,999 | 9 | 0.3% |
| $15,000 to $24,999 | 30 | 1.0% |
| $25,000 to $34,999 | 92 | 3.1% |
| $35,000 to $49,999 | 107 | 3.6% |
| $50,000 to $74,999 | 316 | 10.6% |
| $75,000 to $99,999 | 92 | 3.1% |
| $100,000 to $149,999 | 450 | 15.1% |
| $150,000 to $199,999 | 351 | 11.8% |
| $200,000+ | 1,465 | 49.2% |
Family Income by Famaliy Size in Cherry Creek
5-person families (293 | 9.8%) account for the highest median family income in Cherry Creek with $245,114 per family, while 2-person families (1,145 | 38.5%) have the highest median income of $82,366 per family member.
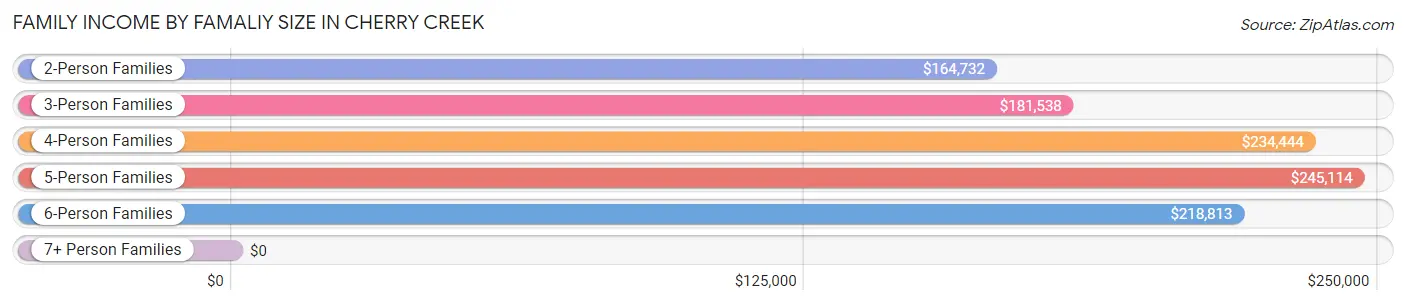
| Income Bracket | # Families | Median Income |
| 2-Person Families | 1,145 (38.5%) | $164,732 |
| 3-Person Families | 644 (21.6%) | $181,538 |
| 4-Person Families | 846 (28.4%) | $234,444 |
| 5-Person Families | 293 (9.8%) | $245,114 |
| 6-Person Families | 39 (1.3%) | $218,813 |
| 7+ Person Families | 11 (0.4%) | $0 |
| Total | 2,978 (100.0%) | $196,798 |
Family Income by Number of Earners in Cherry Creek
The median family income in Cherry Creek is $196,798, with families comprising 3+ earners (477) having the highest median family income of $246,932, while families with no earners (389) have the lowest median family income of $69,792, accounting for 16.0% and 13.1% of families, respectively.
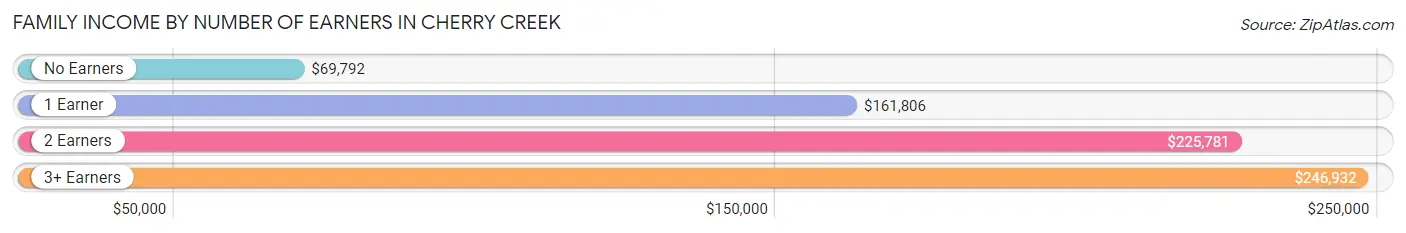
| Number of Earners | # Families | Median Income |
| No Earners | 389 (13.1%) | $69,792 |
| 1 Earner | 875 (29.4%) | $161,806 |
| 2 Earners | 1,237 (41.5%) | $225,781 |
| 3+ Earners | 477 (16.0%) | $246,932 |
| Total | 2,978 (100.0%) | $196,798 |
Household Income in Cherry Creek
Household Income Brackets in Cherry Creek
With 1,576 households falling in the category, the $200,000+ income range is the most frequent in Cherry Creek, accounting for 38.4% of all households. In contrast, only 70 households (1.7%) fall into the $15,000 to $24,999 income bracket, making it the least populous group.
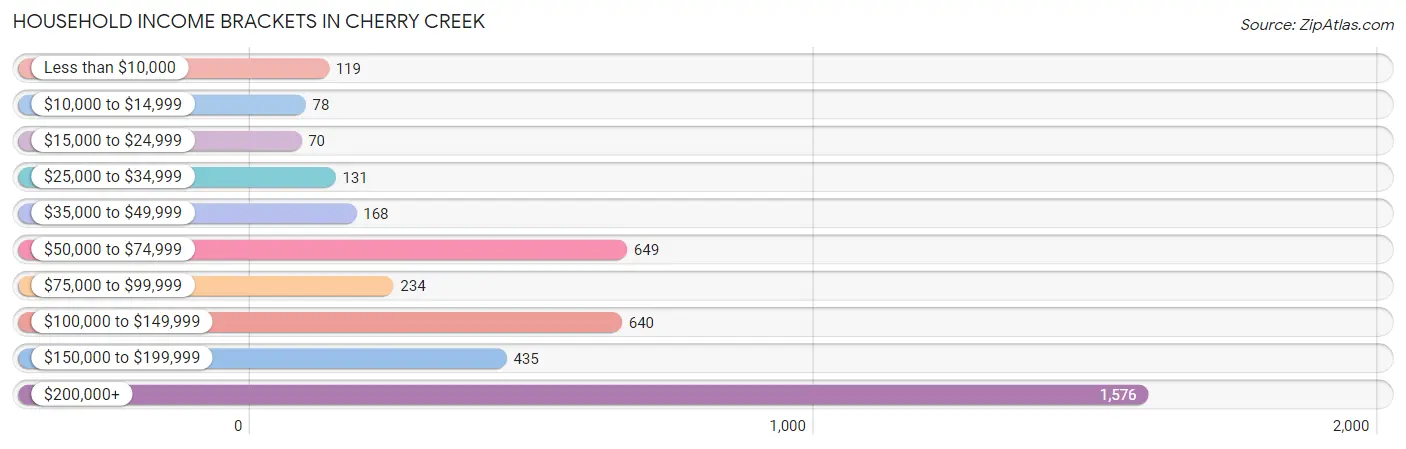
| Income Bracket | # Households | % Households |
| Less than $10,000 | 119 | 2.9% |
| $10,000 to $14,999 | 78 | 1.9% |
| $15,000 to $24,999 | 70 | 1.7% |
| $25,000 to $34,999 | 131 | 3.2% |
| $35,000 to $49,999 | 168 | 4.1% |
| $50,000 to $74,999 | 649 | 15.8% |
| $75,000 to $99,999 | 234 | 5.7% |
| $100,000 to $149,999 | 640 | 15.6% |
| $150,000 to $199,999 | 435 | 10.6% |
| $200,000+ | 1,576 | 38.4% |
Household Income by Householder Age in Cherry Creek
The median household income in Cherry Creek is $146,583, with the highest median household income of $187,279 found in the 45 to 64 years age bracket for the primary householder. A total of 1,979 households (48.2%) fall into this category. Meanwhile, the 15 to 24 years age bracket for the primary householder has the lowest median household income of $0, with 69 households (1.7%) in this group.
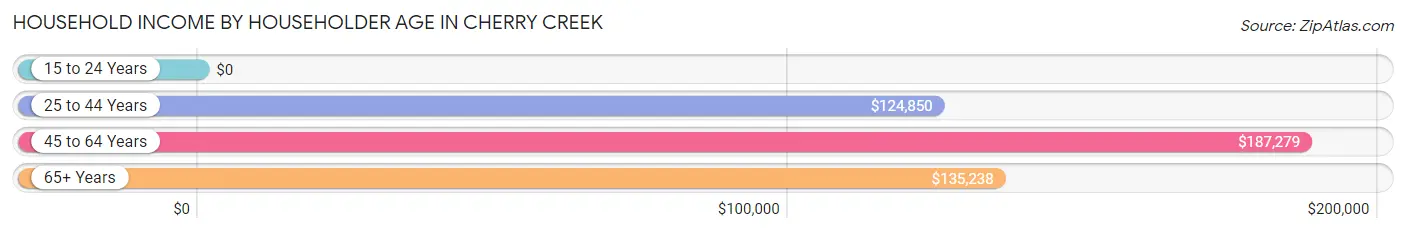
| Income Bracket | # Households | Median Income |
| 15 to 24 Years | 69 (1.7%) | $0 |
| 25 to 44 Years | 1,143 (27.8%) | $124,850 |
| 45 to 64 Years | 1,979 (48.2%) | $187,279 |
| 65+ Years | 914 (22.3%) | $135,238 |
| Total | 4,105 (100.0%) | $146,583 |
Poverty in Cherry Creek
Income Below Poverty by Sex and Age in Cherry Creek
With 3.7% poverty level for males and 6.2% for females among the residents of Cherry Creek, 5 year old males and 75 year old and over females are the most vulnerable to poverty, with 10 males (23.8%) and 33 females (13.3%) in their respective age groups living below the poverty level.
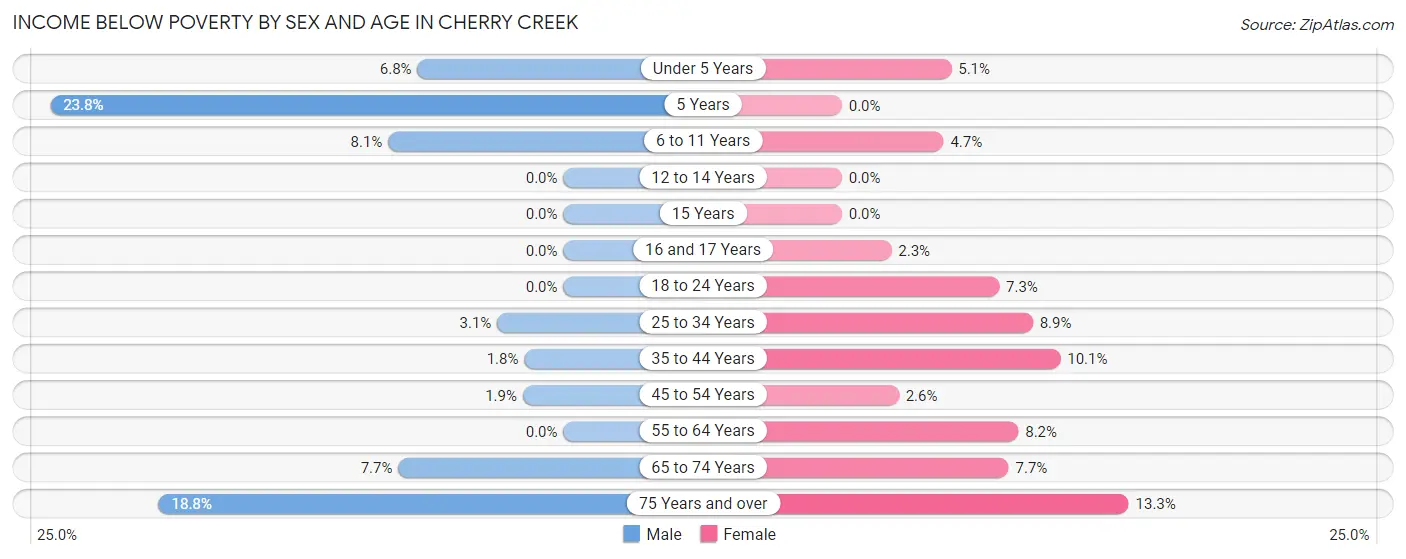
| Age Bracket | Male | Female |
| Under 5 Years | 18 (6.8%) | 10 (5.1%) |
| 5 Years | 10 (23.8%) | 0 (0.0%) |
| 6 to 11 Years | 51 (8.1%) | 21 (4.7%) |
| 12 to 14 Years | 0 (0.0%) | 0 (0.0%) |
| 15 Years | 0 (0.0%) | 0 (0.0%) |
| 16 and 17 Years | 0 (0.0%) | 6 (2.3%) |
| 18 to 24 Years | 0 (0.0%) | 30 (7.3%) |
| 25 to 34 Years | 16 (3.1%) | 42 (8.9%) |
| 35 to 44 Years | 12 (1.8%) | 77 (10.1%) |
| 45 to 54 Years | 22 (1.9%) | 28 (2.6%) |
| 55 to 64 Years | 0 (0.0%) | 54 (8.2%) |
| 65 to 74 Years | 38 (7.7%) | 48 (7.7%) |
| 75 Years and over | 37 (18.8%) | 33 (13.3%) |
| Total | 204 (3.7%) | 349 (6.2%) |
Income Above Poverty by Sex and Age in Cherry Creek
According to the poverty statistics in Cherry Creek, males aged 12 to 14 years and females aged 5 years are the age groups that are most secure financially, with 100.0% of males and 100.0% of females in these age groups living above the poverty line.
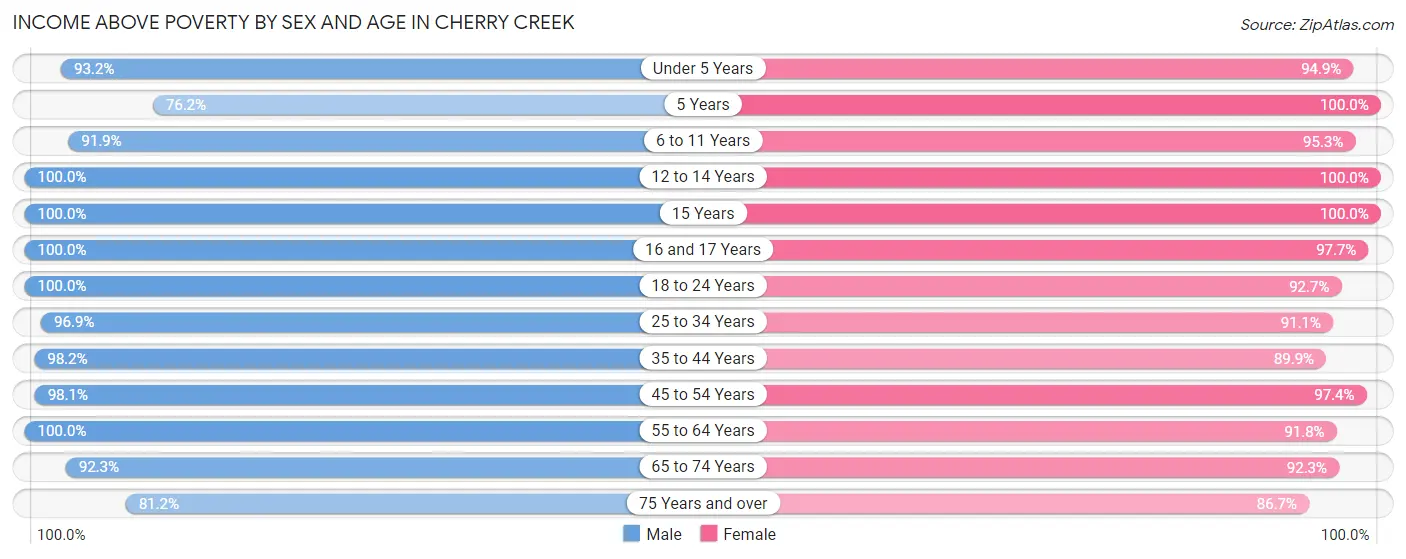
| Age Bracket | Male | Female |
| Under 5 Years | 248 (93.2%) | 187 (94.9%) |
| 5 Years | 32 (76.2%) | 97 (100.0%) |
| 6 to 11 Years | 576 (91.9%) | 424 (95.3%) |
| 12 to 14 Years | 296 (100.0%) | 260 (100.0%) |
| 15 Years | 120 (100.0%) | 132 (100.0%) |
| 16 and 17 Years | 284 (100.0%) | 255 (97.7%) |
| 18 to 24 Years | 249 (100.0%) | 381 (92.7%) |
| 25 to 34 Years | 505 (96.9%) | 432 (91.1%) |
| 35 to 44 Years | 652 (98.2%) | 682 (89.9%) |
| 45 to 54 Years | 1,147 (98.1%) | 1,032 (97.4%) |
| 55 to 64 Years | 570 (100.0%) | 605 (91.8%) |
| 65 to 74 Years | 458 (92.3%) | 572 (92.3%) |
| 75 Years and over | 160 (81.2%) | 215 (86.7%) |
| Total | 5,297 (96.3%) | 5,274 (93.8%) |
Income Below Poverty Among Married-Couple Families in Cherry Creek
The poverty statistics for married-couple families in Cherry Creek show that 3.4% or 86 of the total 2,520 families live below the poverty line. Families with 5 or more children have the highest poverty rate of 100.0%, comprising of 11 families. On the other hand, families with 1 or 2 children have the lowest poverty rate of 0.8%, which includes 9 families.
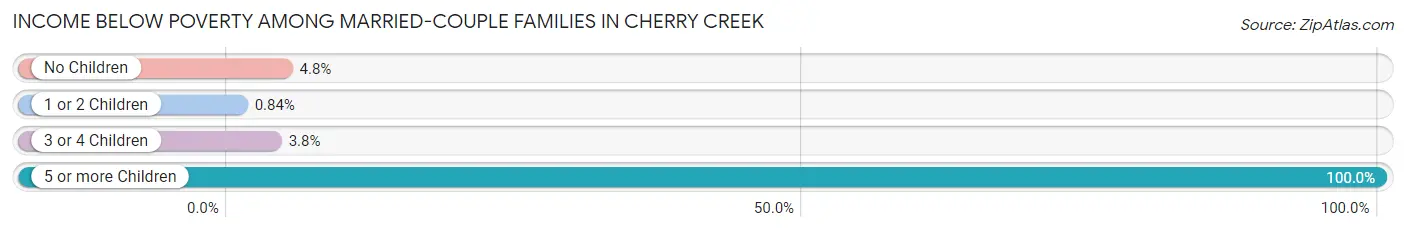
| Children | Above Poverty | Below Poverty |
| No Children | 1,123 (95.3%) | 56 (4.8%) |
| 1 or 2 Children | 1,058 (99.2%) | 9 (0.8%) |
| 3 or 4 Children | 253 (96.2%) | 10 (3.8%) |
| 5 or more Children | 0 (0.0%) | 11 (100.0%) |
| Total | 2,434 (96.6%) | 86 (3.4%) |
Income Below Poverty Among Single-Parent Households in Cherry Creek
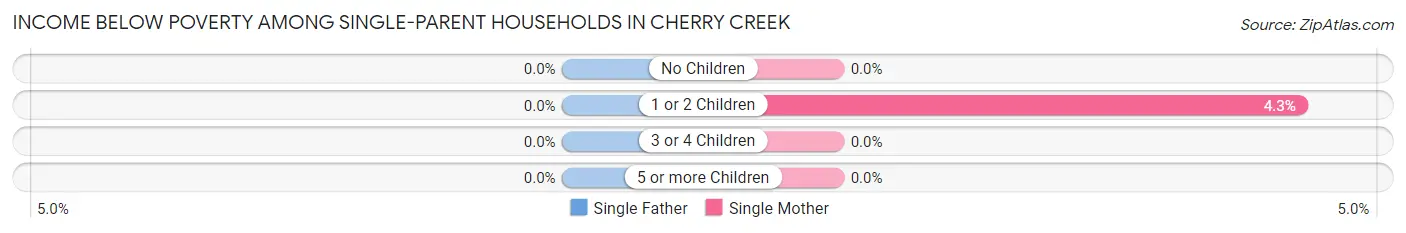
| Children | Single Father | Single Mother |
| No Children | 0 (0.0%) | 0 (0.0%) |
| 1 or 2 Children | 0 (0.0%) | 7 (4.3%) |
| 3 or 4 Children | 0 (0.0%) | 0 (0.0%) |
| 5 or more Children | 0 (0.0%) | 0 (0.0%) |
| Total | 0 (0.0%) | 7 (3.3%) |
Income Below Poverty Among Married-Couple vs Single-Parent Households in Cherry Creek
The poverty data for Cherry Creek shows that 86 of the married-couple family households (3.4%) and 7 of the single-parent households (1.5%) are living below the poverty level. Within the married-couple family households, those with 5 or more children have the highest poverty rate, with 11 households (100.0%) falling below the poverty line. Among the single-parent households, those with 1 or 2 children have the highest poverty rate, with 7 household (2.1%) living below poverty.
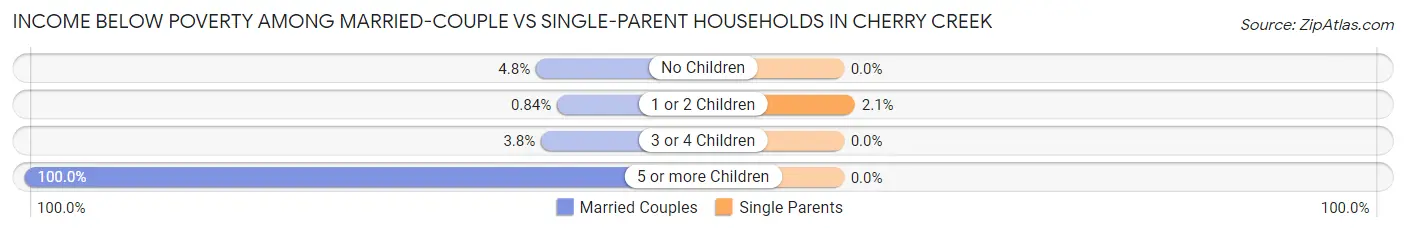
| Children | Married-Couple Families | Single-Parent Households |
| No Children | 56 (4.8%) | 0 (0.0%) |
| 1 or 2 Children | 9 (0.8%) | 7 (2.1%) |
| 3 or 4 Children | 10 (3.8%) | 0 (0.0%) |
| 5 or more Children | 11 (100.0%) | 0 (0.0%) |
| Total | 86 (3.4%) | 7 (1.5%) |
Race in Cherry Creek
The most populous races in Cherry Creek are White / Caucasian (8,405 | 75.3%), Two or more Races (1,269 | 11.4%), and Asian (1,254 | 11.2%).
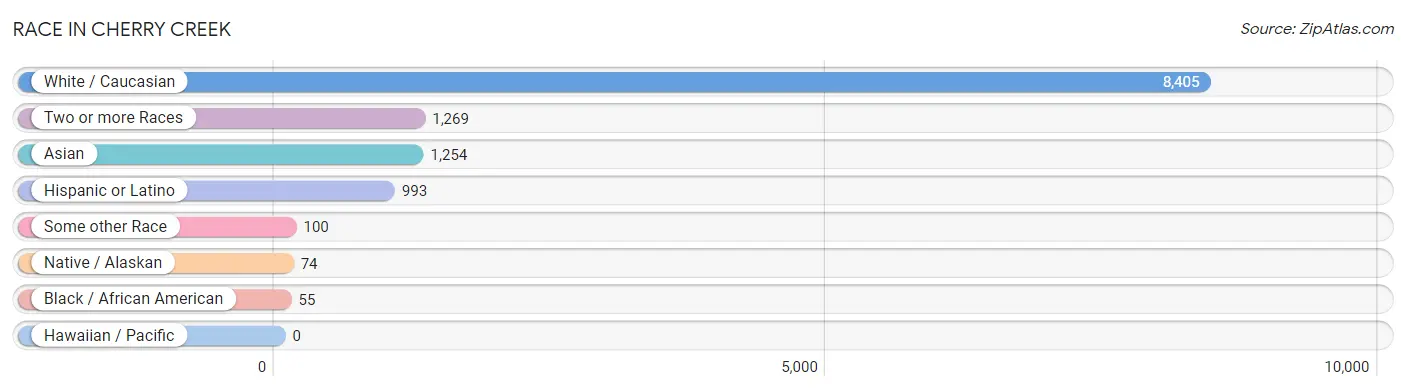
| Race | # Population | % Population |
| Asian | 1,254 | 11.2% |
| Black / African American | 55 | 0.5% |
| Hawaiian / Pacific | 0 | 0.0% |
| Hispanic or Latino | 993 | 8.9% |
| Native / Alaskan | 74 | 0.7% |
| White / Caucasian | 8,405 | 75.3% |
| Two or more Races | 1,269 | 11.4% |
| Some other Race | 100 | 0.9% |
| Total | 11,157 | 100.0% |
Ancestry in Cherry Creek
The most populous ancestries reported in Cherry Creek are German (1,845 | 16.5%), Irish (1,220 | 10.9%), English (1,071 | 9.6%), Indian (Asian) (611 | 5.5%), and European (487 | 4.4%), together accounting for 46.9% of all Cherry Creek residents.
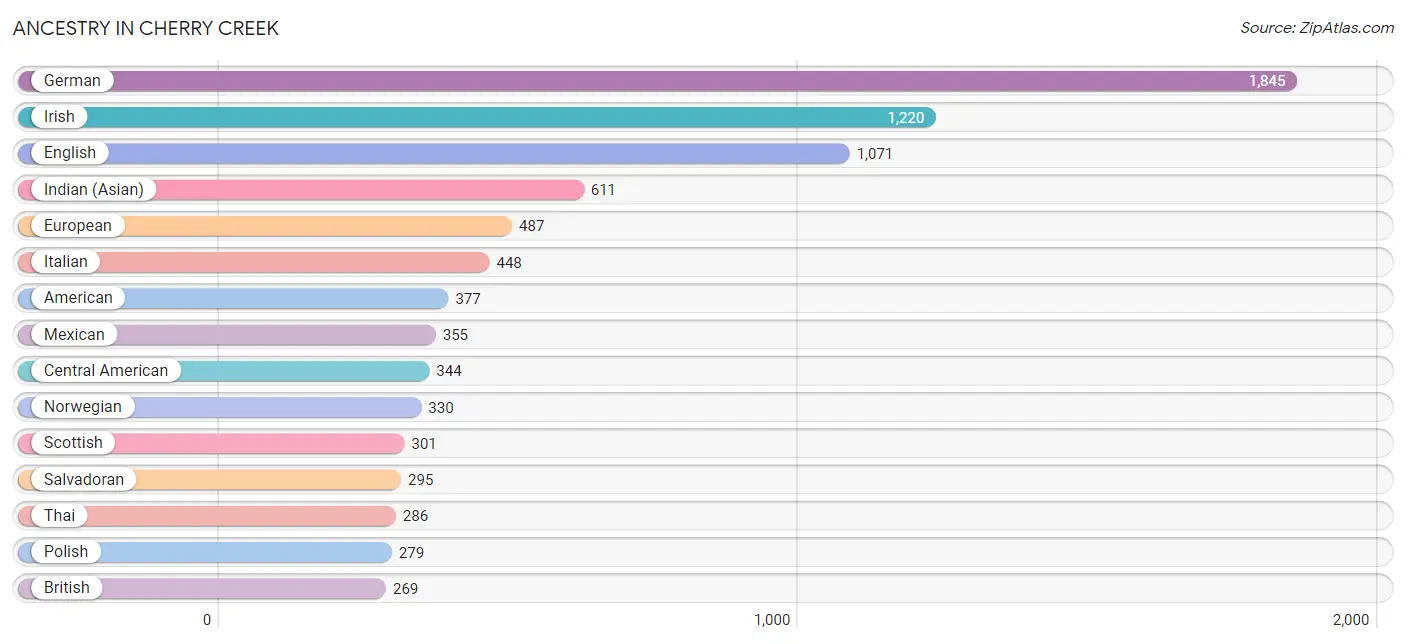
| Ancestry | # Population | % Population |
| American | 377 | 3.4% |
| Arab | 112 | 1.0% |
| Argentinean | 38 | 0.3% |
| Armenian | 21 | 0.2% |
| Austrian | 46 | 0.4% |
| Bangladeshi | 20 | 0.2% |
| Belgian | 9 | 0.1% |
| Bhutanese | 87 | 0.8% |
| Brazilian | 16 | 0.1% |
| British | 269 | 2.4% |
| Bulgarian | 23 | 0.2% |
| Burmese | 204 | 1.8% |
| Canadian | 113 | 1.0% |
| Central American | 344 | 3.1% |
| Cherokee | 11 | 0.1% |
| Chippewa | 17 | 0.2% |
| Colombian | 33 | 0.3% |
| Croatian | 45 | 0.4% |
| Cuban | 56 | 0.5% |
| Czech | 94 | 0.8% |
| Czechoslovakian | 19 | 0.2% |
| Danish | 57 | 0.5% |
| Dutch | 124 | 1.1% |
| Eastern European | 210 | 1.9% |
| Ecuadorian | 43 | 0.4% |
| English | 1,071 | 9.6% |
| European | 487 | 4.4% |
| Filipino | 26 | 0.2% |
| Finnish | 19 | 0.2% |
| French | 141 | 1.3% |
| French Canadian | 9 | 0.1% |
| German | 1,845 | 16.5% |
| Greek | 61 | 0.5% |
| Guatemalan | 31 | 0.3% |
| Hungarian | 147 | 1.3% |
| Indian (Asian) | 611 | 5.5% |
| Iranian | 27 | 0.2% |
| Irish | 1,220 | 10.9% |
| Israeli | 32 | 0.3% |
| Italian | 448 | 4.0% |
| Korean | 95 | 0.9% |
| Laotian | 5 | 0.0% |
| Lebanese | 62 | 0.6% |
| Lithuanian | 58 | 0.5% |
| Mexican | 355 | 3.2% |
| Mexican American Indian | 23 | 0.2% |
| Navajo | 74 | 0.7% |
| Nicaraguan | 18 | 0.2% |
| Northern European | 147 | 1.3% |
| Norwegian | 330 | 3.0% |
| Peruvian | 22 | 0.2% |
| Polish | 279 | 2.5% |
| Puerto Rican | 69 | 0.6% |
| Romanian | 11 | 0.1% |
| Russian | 234 | 2.1% |
| Salvadoran | 295 | 2.6% |
| Scandinavian | 96 | 0.9% |
| Scotch-Irish | 147 | 1.3% |
| Scottish | 301 | 2.7% |
| Serbian | 2 | 0.0% |
| Slovak | 27 | 0.2% |
| Slovene | 10 | 0.1% |
| South American | 136 | 1.2% |
| Spaniard | 24 | 0.2% |
| Spanish | 9 | 0.1% |
| Sri Lankan | 256 | 2.3% |
| Swedish | 87 | 0.8% |
| Swiss | 46 | 0.4% |
| Thai | 286 | 2.6% |
| Turkish | 42 | 0.4% |
| Ukrainian | 36 | 0.3% |
| Welsh | 55 | 0.5% |
| Yugoslavian | 6 | 0.1% | View All 73 Rows |
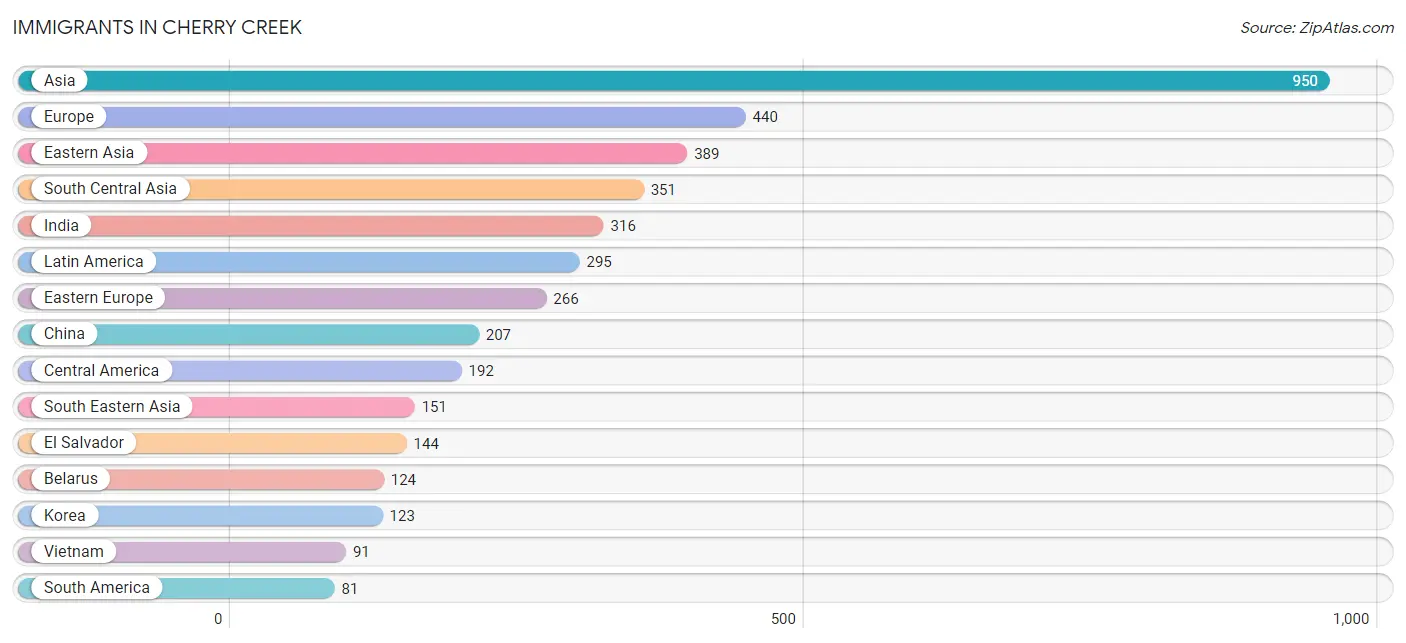
Immigrants in Cherry Creek
The most numerous immigrant groups reported in Cherry Creek came from Asia (950 | 8.5%), Europe (440 | 3.9%), Eastern Asia (389 | 3.5%), South Central Asia (351 | 3.2%), and India (316 | 2.8%), together accounting for 21.9% of all Cherry Creek residents.
| Immigration Origin | # Population | % Population |
| Africa | 21 | 0.2% |
| Argentina | 11 | 0.1% |
| Asia | 950 | 8.5% |
| Australia | 7 | 0.1% |
| Austria | 11 | 0.1% |
| Belarus | 124 | 1.1% |
| Belgium | 9 | 0.1% |
| Brazil | 29 | 0.3% |
| Bulgaria | 12 | 0.1% |
| Canada | 68 | 0.6% |
| Caribbean | 22 | 0.2% |
| Central America | 192 | 1.7% |
| China | 207 | 1.9% |
| Colombia | 17 | 0.2% |
| Cuba | 22 | 0.2% |
| Czechoslovakia | 22 | 0.2% |
| Eastern Asia | 389 | 3.5% |
| Eastern Europe | 266 | 2.4% |
| Ecuador | 14 | 0.1% |
| El Salvador | 144 | 1.3% |
| England | 9 | 0.1% |
| Europe | 440 | 3.9% |
| France | 8 | 0.1% |
| Germany | 44 | 0.4% |
| Greece | 15 | 0.1% |
| Guatemala | 16 | 0.1% |
| Hong Kong | 17 | 0.2% |
| Hungary | 27 | 0.2% |
| India | 316 | 2.8% |
| Indonesia | 2 | 0.0% |
| Iran | 35 | 0.3% |
| Iraq | 26 | 0.2% |
| Israel | 24 | 0.2% |
| Italy | 14 | 0.1% |
| Japan | 59 | 0.5% |
| Korea | 123 | 1.1% |
| Latin America | 295 | 2.6% |
| Lithuania | 36 | 0.3% |
| Mexico | 14 | 0.1% |
| Nicaragua | 18 | 0.2% |
| Northern Europe | 73 | 0.6% |
| Oceania | 7 | 0.1% |
| Peru | 10 | 0.1% |
| Philippines | 58 | 0.5% |
| Russia | 26 | 0.2% |
| Scotland | 9 | 0.1% |
| South Africa | 21 | 0.2% |
| South America | 81 | 0.7% |
| South Central Asia | 351 | 3.2% |
| South Eastern Asia | 151 | 1.3% |
| Southern Europe | 29 | 0.3% |
| Turkey | 9 | 0.1% |
| Vietnam | 91 | 0.8% |
| Western Asia | 59 | 0.5% |
| Western Europe | 72 | 0.6% | View All 55 Rows |
Sex and Age in Cherry Creek
Sex and Age in Cherry Creek
The most populous age groups in Cherry Creek are 50 to 54 Years (696 | 12.6%) for men and 50 to 54 Years (619 | 11.0%) for women.
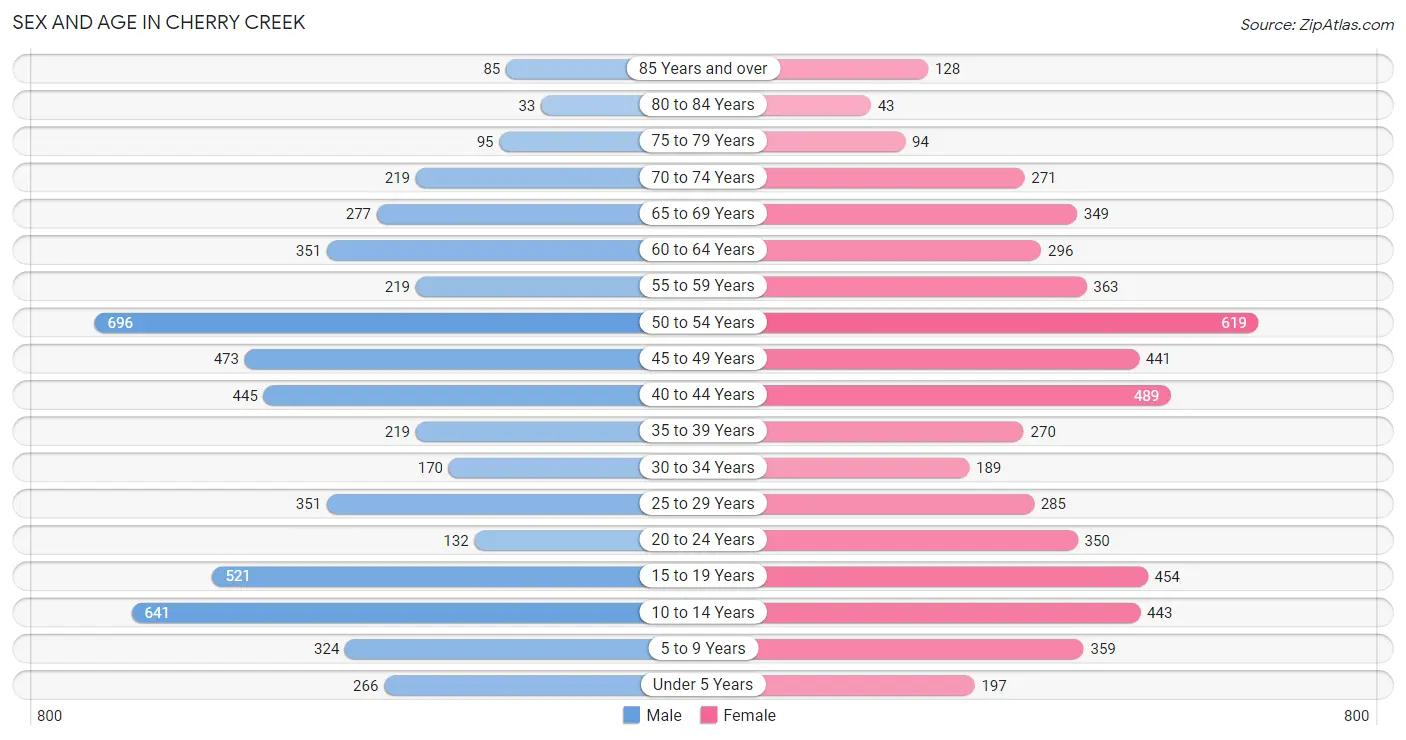
| Age Bracket | Male | Female |
| Under 5 Years | 266 (4.8%) | 197 (3.5%) |
| 5 to 9 Years | 324 (5.9%) | 359 (6.4%) |
| 10 to 14 Years | 641 (11.6%) | 443 (7.9%) |
| 15 to 19 Years | 521 (9.4%) | 454 (8.1%) |
| 20 to 24 Years | 132 (2.4%) | 350 (6.2%) |
| 25 to 29 Years | 351 (6.4%) | 285 (5.1%) |
| 30 to 34 Years | 170 (3.1%) | 189 (3.4%) |
| 35 to 39 Years | 219 (4.0%) | 270 (4.8%) |
| 40 to 44 Years | 445 (8.1%) | 489 (8.7%) |
| 45 to 49 Years | 473 (8.6%) | 441 (7.8%) |
| 50 to 54 Years | 696 (12.6%) | 619 (11.0%) |
| 55 to 59 Years | 219 (4.0%) | 363 (6.4%) |
| 60 to 64 Years | 351 (6.4%) | 296 (5.2%) |
| 65 to 69 Years | 277 (5.0%) | 349 (6.2%) |
| 70 to 74 Years | 219 (4.0%) | 271 (4.8%) |
| 75 to 79 Years | 95 (1.7%) | 94 (1.7%) |
| 80 to 84 Years | 33 (0.6%) | 43 (0.8%) |
| 85 Years and over | 85 (1.5%) | 128 (2.3%) |
| Total | 5,517 (100.0%) | 5,640 (100.0%) |
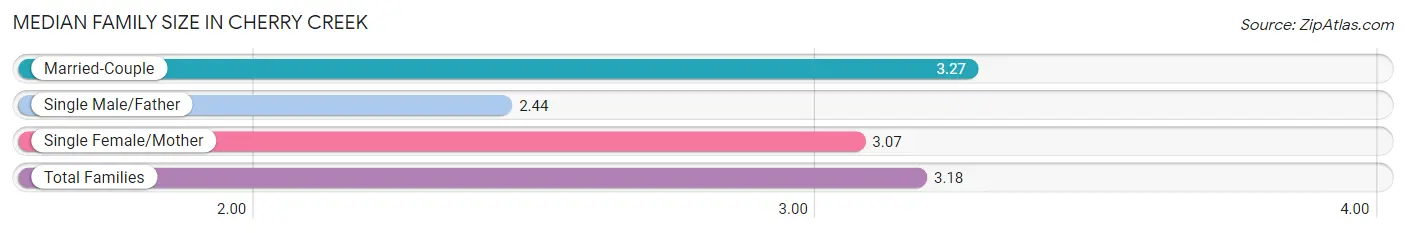
Families and Households in Cherry Creek
Median Family Size in Cherry Creek
The median family size in Cherry Creek is 3.18 persons per family, with married-couple families (2,520 | 84.6%) accounting for the largest median family size of 3.27 persons per family. On the other hand, single male/father families (248 | 8.3%) represent the smallest median family size with 2.44 persons per family.
| Family Type | # Families | Family Size |
| Married-Couple | 2,520 (84.6%) | 3.27 |
| Single Male/Father | 248 (8.3%) | 2.44 |
| Single Female/Mother | 210 (7.0%) | 3.07 |
| Total Families | 2,978 (100.0%) | 3.18 |
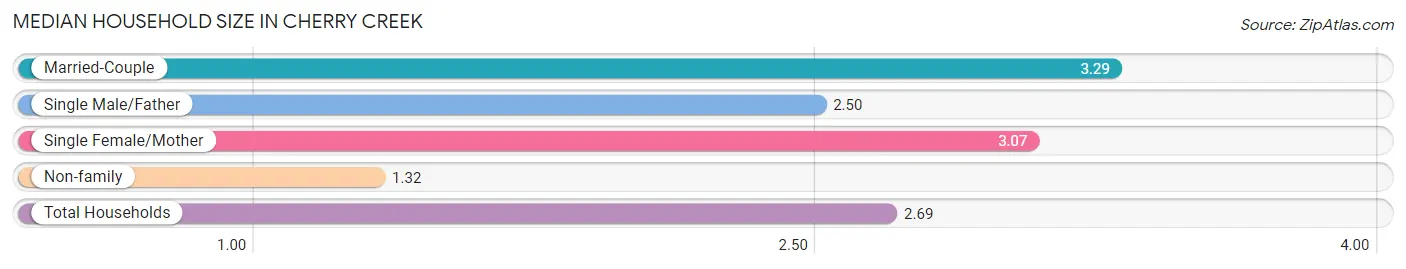
Median Household Size in Cherry Creek
The median household size in Cherry Creek is 2.69 persons per household, with married-couple households (2,520 | 61.4%) accounting for the largest median household size of 3.29 persons per household. non-family households (1,127 | 27.5%) represent the smallest median household size with 1.32 persons per household.
| Household Type | # Households | Household Size |
| Married-Couple | 2,520 (61.4%) | 3.29 |
| Single Male/Father | 248 (6.0%) | 2.50 |
| Single Female/Mother | 210 (5.1%) | 3.07 |
| Non-family | 1,127 (27.5%) | 1.32 |
| Total Households | 4,105 (100.0%) | 2.69 |
Household Size by Marriage Status in Cherry Creek
Out of a total of 4,105 households in Cherry Creek, 2,978 (72.6%) are family households, while 1,127 (27.5%) are nonfamily households. The most numerous type of family households are 2-person households, comprising 1,142, and the most common type of nonfamily households are 1-person households, comprising 863.
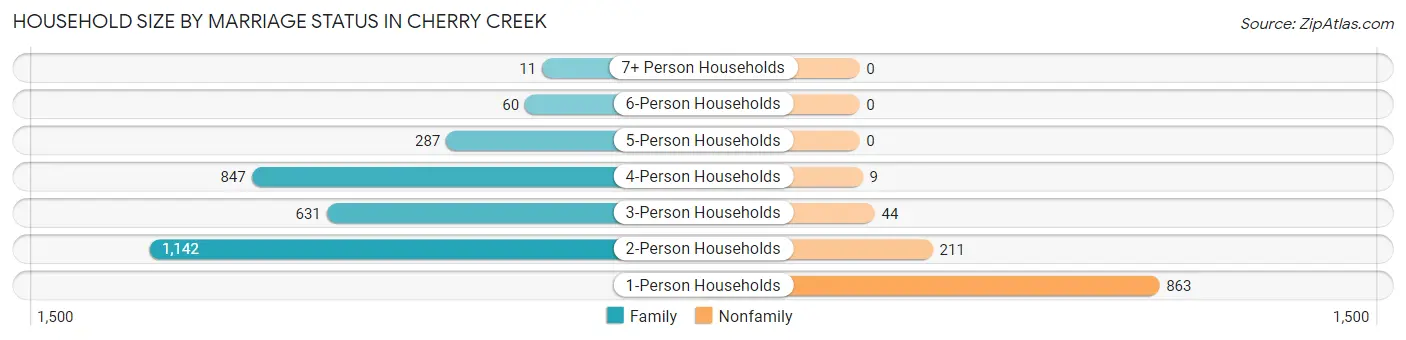
| Household Size | Family Households | Nonfamily Households |
| 1-Person Households | - | 863 (21.0%) |
| 2-Person Households | 1,142 (27.8%) | 211 (5.1%) |
| 3-Person Households | 631 (15.4%) | 44 (1.1%) |
| 4-Person Households | 847 (20.6%) | 9 (0.2%) |
| 5-Person Households | 287 (7.0%) | 0 (0.0%) |
| 6-Person Households | 60 (1.5%) | 0 (0.0%) |
| 7+ Person Households | 11 (0.3%) | 0 (0.0%) |
| Total | 2,978 (72.6%) | 1,127 (27.5%) |
Female Fertility in Cherry Creek
Fertility by Age in Cherry Creek
Average fertility rate in Cherry Creek is 29.0 births per 1,000 women. Women in the age bracket of 35 to 50 years have the highest fertility rate with 39.0 births per 1,000 women. Women in the age bracket of 35 to 50 years acount for 72.8% of all women with births.
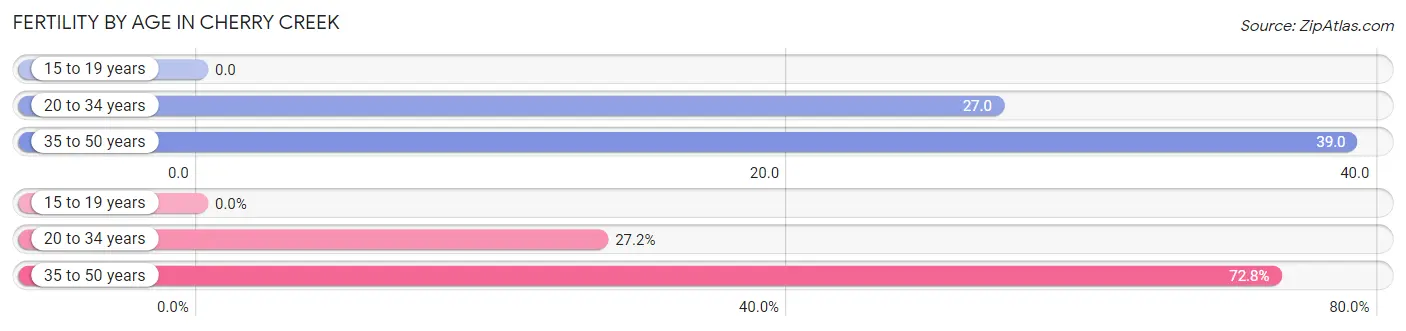
| Age Bracket | Women with Births | Births / 1,000 Women |
| 15 to 19 years | 0 (0.0%) | 0.0 |
| 20 to 34 years | 22 (27.2%) | 27.0 |
| 35 to 50 years | 59 (72.8%) | 39.0 |
| Total | 81 (100.0%) | 29.0 |
Fertility by Age by Marriage Status in Cherry Creek
69.1% of women with births (81) in Cherry Creek are married. The highest percentage of unmarried women with births falls into 35 to 50 years age bracket with 42.4% of them unmarried at the time of birth, while the lowest percentage of unmarried women with births belong to 20 to 34 years age bracket with 0.0% of them unmarried.
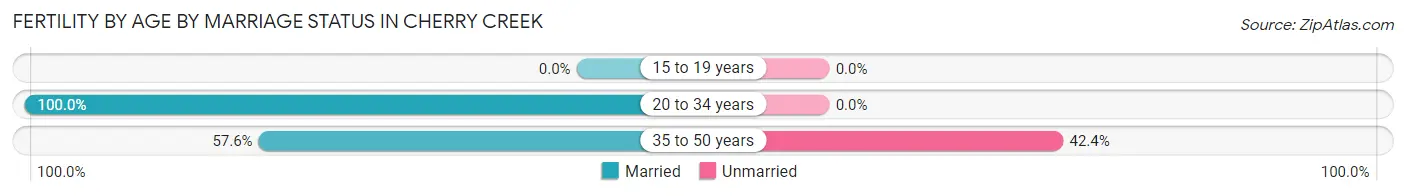
| Age Bracket | Married | Unmarried |
| 15 to 19 years | 0 (0.0%) | 0 (0.0%) |
| 20 to 34 years | 22 (100.0%) | 0 (0.0%) |
| 35 to 50 years | 34 (57.6%) | 25 (42.4%) |
| Total | 56 (69.1%) | 25 (30.9%) |
Fertility by Education in Cherry Creek
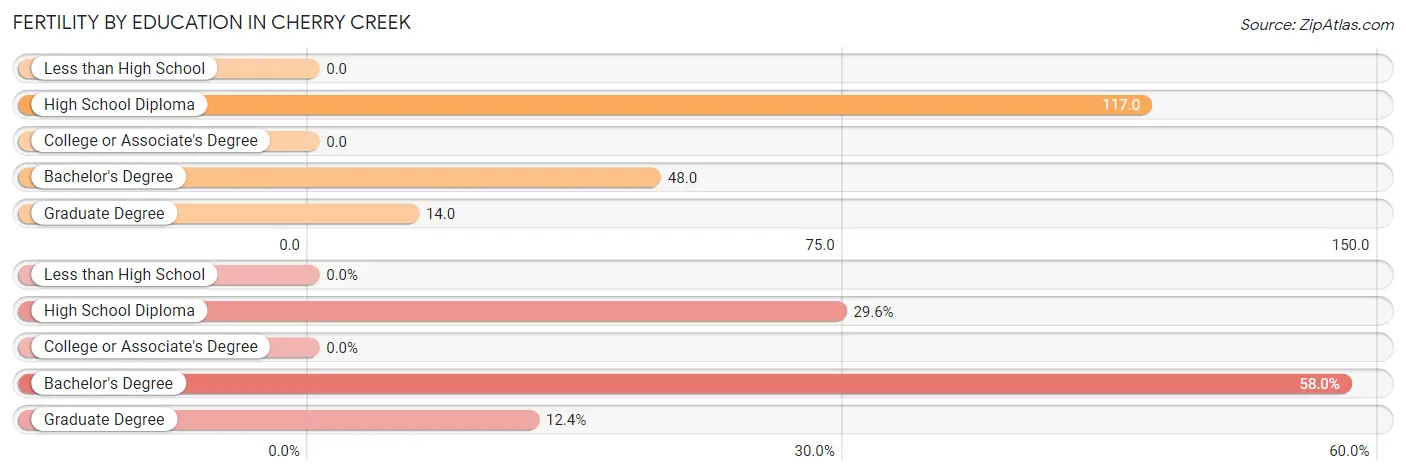
| Educational Attainment | Women with Births | Births / 1,000 Women |
| Less than High School | 0 (0.0%) | 0.0 |
| High School Diploma | 24 (29.6%) | 117.0 |
| College or Associate's Degree | 0 (0.0%) | 0.0 |
| Bachelor's Degree | 47 (58.0%) | 48.0 |
| Graduate Degree | 10 (12.3%) | 14.0 |
| Total | 81 (100.0%) | 29.0 |
Fertility by Education by Marriage Status in Cherry Creek
30.9% of women with births in Cherry Creek are unmarried. Women with the educational attainment of high school diploma are most likely to be married with 100.0% of them married at childbirth, while women with the educational attainment of bachelor's degree are least likely to be married with 53.2% of them unmarried at childbirth.
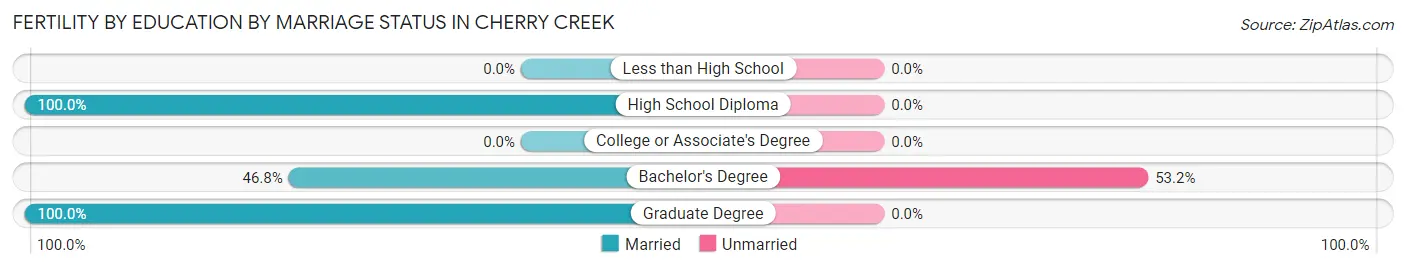
| Educational Attainment | Married | Unmarried |
| Less than High School | 0 (0.0%) | 0 (0.0%) |
| High School Diploma | 24 (100.0%) | 0 (0.0%) |
| College or Associate's Degree | 0 (0.0%) | 0 (0.0%) |
| Bachelor's Degree | 22 (46.8%) | 25 (53.2%) |
| Graduate Degree | 10 (100.0%) | 0 (0.0%) |
| Total | 56 (69.1%) | 25 (30.9%) |
Employment Characteristics in Cherry Creek
Employment by Class of Employer in Cherry Creek
Among the 5,644 employed individuals in Cherry Creek, private company employees (3,793 | 67.2%), not-for-profit organizations (650 | 11.5%), and self-employed (incorporated) (364 | 6.5%) make up the most common classes of employment.
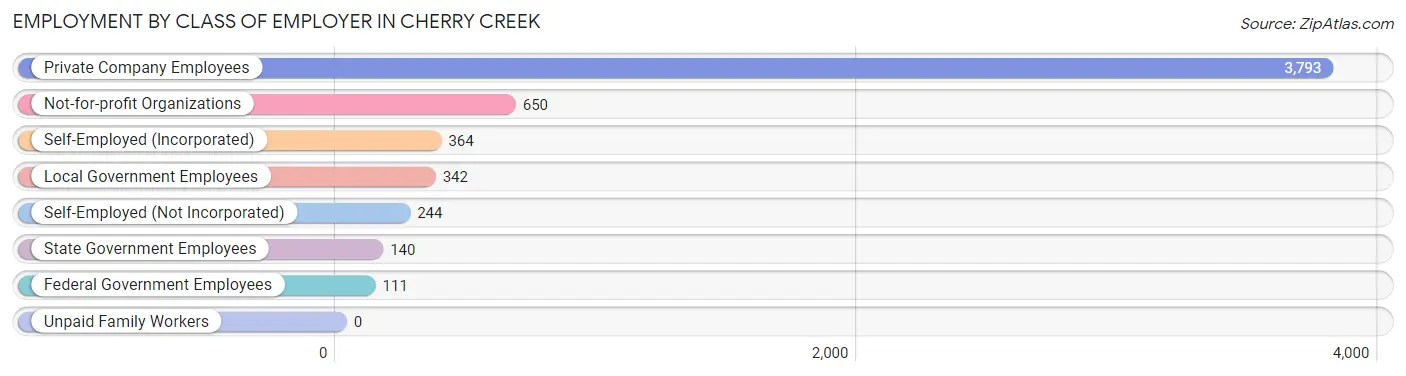
| Employer Class | # Employees | % Employees |
| Private Company Employees | 3,793 | 67.2% |
| Self-Employed (Incorporated) | 364 | 6.5% |
| Self-Employed (Not Incorporated) | 244 | 4.3% |
| Not-for-profit Organizations | 650 | 11.5% |
| Local Government Employees | 342 | 6.1% |
| State Government Employees | 140 | 2.5% |
| Federal Government Employees | 111 | 2.0% |
| Unpaid Family Workers | 0 | 0.0% |
| Total | 5,644 | 100.0% |
Employment Status by Age in Cherry Creek
According to the labor force statistics for Cherry Creek, out of the total population over 16 years of age (8,675), 70.1% or 6,081 individuals are in the labor force, with 4.4% or 268 of them unemployed. The age group with the highest labor force participation rate is 25 to 29 years, with 94.7% or 602 individuals in the labor force. Within the labor force, the 75 years and over age range has the highest percentage of unemployed individuals, with 30.0% or 9 of them being unemployed.
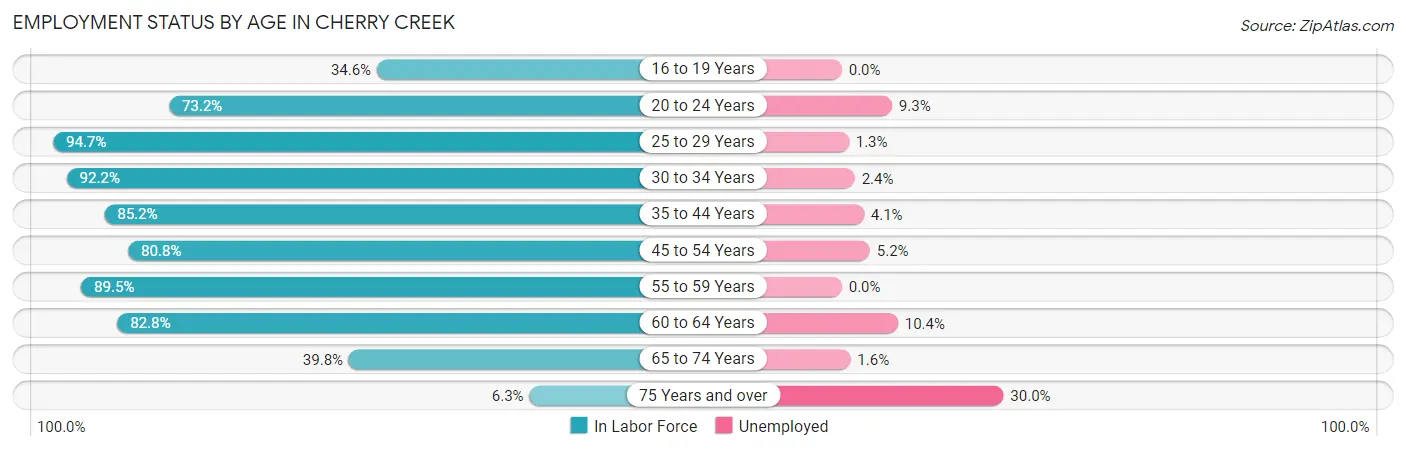
| Age Bracket | In Labor Force | Unemployed |
| 16 to 19 Years | 250 (34.6%) | 0 (0.0%) |
| 20 to 24 Years | 353 (73.2%) | 33 (9.3%) |
| 25 to 29 Years | 602 (94.7%) | 8 (1.3%) |
| 30 to 34 Years | 331 (92.2%) | 8 (2.4%) |
| 35 to 44 Years | 1,212 (85.2%) | 50 (4.1%) |
| 45 to 54 Years | 1,801 (80.8%) | 94 (5.2%) |
| 55 to 59 Years | 521 (89.5%) | 0 (0.0%) |
| 60 to 64 Years | 536 (82.8%) | 56 (10.4%) |
| 65 to 74 Years | 444 (39.8%) | 7 (1.6%) |
| 75 Years and over | 30 (6.3%) | 9 (30.0%) |
| Total | 6,081 (70.1%) | 268 (4.4%) |
Employment Status by Educational Attainment in Cherry Creek
According to labor force statistics for Cherry Creek, 85.2% of individuals (5,006) out of the total population between 25 and 64 years of age (5,876) are in the labor force, with 4.3% or 215 of them being unemployed. The group with the highest labor force participation rate are those with the educational attainment of high school diploma, with 93.2% or 272 individuals in the labor force. Within the labor force, individuals with bachelor's degree or higher education have the highest percentage of unemployment, with 5.5% or 211 of them being unemployed.
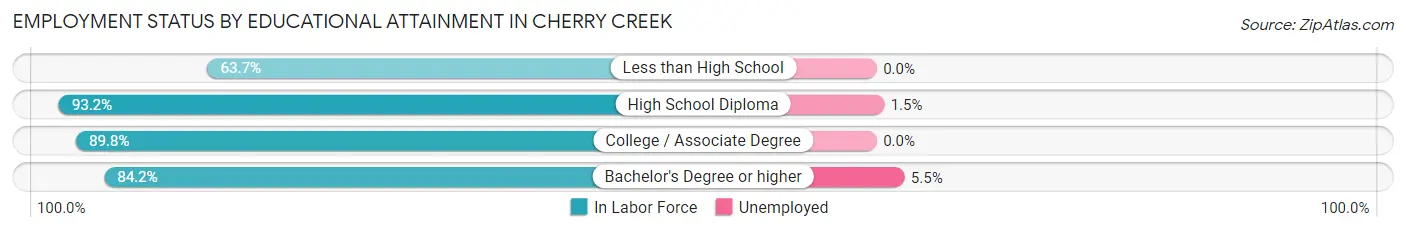
| Educational Attainment | In Labor Force | Unemployed |
| Less than High School | 65 (63.7%) | 0 (0.0%) |
| High School Diploma | 272 (93.2%) | 4 (1.5%) |
| College / Associate Degree | 823 (89.8%) | 0 (0.0%) |
| Bachelor's Degree or higher | 3,845 (84.2%) | 251 (5.5%) |
| Total | 5,006 (85.2%) | 253 (4.3%) |
Employment Occupations by Sex in Cherry Creek
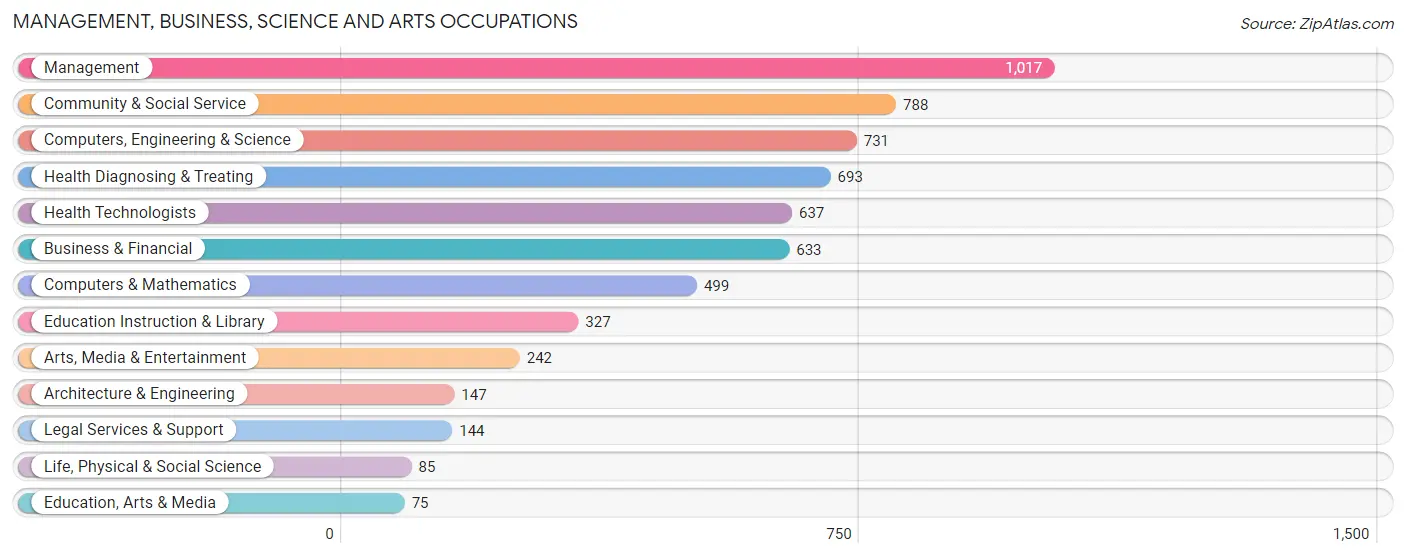
Management, Business, Science and Arts Occupations
The most common Management, Business, Science and Arts occupations in Cherry Creek are Management (1,017 | 17.5%), Community & Social Service (788 | 13.6%), Computers, Engineering & Science (731 | 12.6%), Health Diagnosing & Treating (693 | 11.9%), and Health Technologists (637 | 11.0%).
Management, Business, Science and Arts Occupations by Sex
Within the Management, Business, Science and Arts occupations in Cherry Creek, the most male-oriented occupations are Arts, Media & Entertainment (85.1%), Computers & Mathematics (83.2%), and Architecture & Engineering (80.9%), while the most female-oriented occupations are Life, Physical & Social Science (80.0%), Business & Financial (69.8%), and Education Instruction & Library (63.3%).
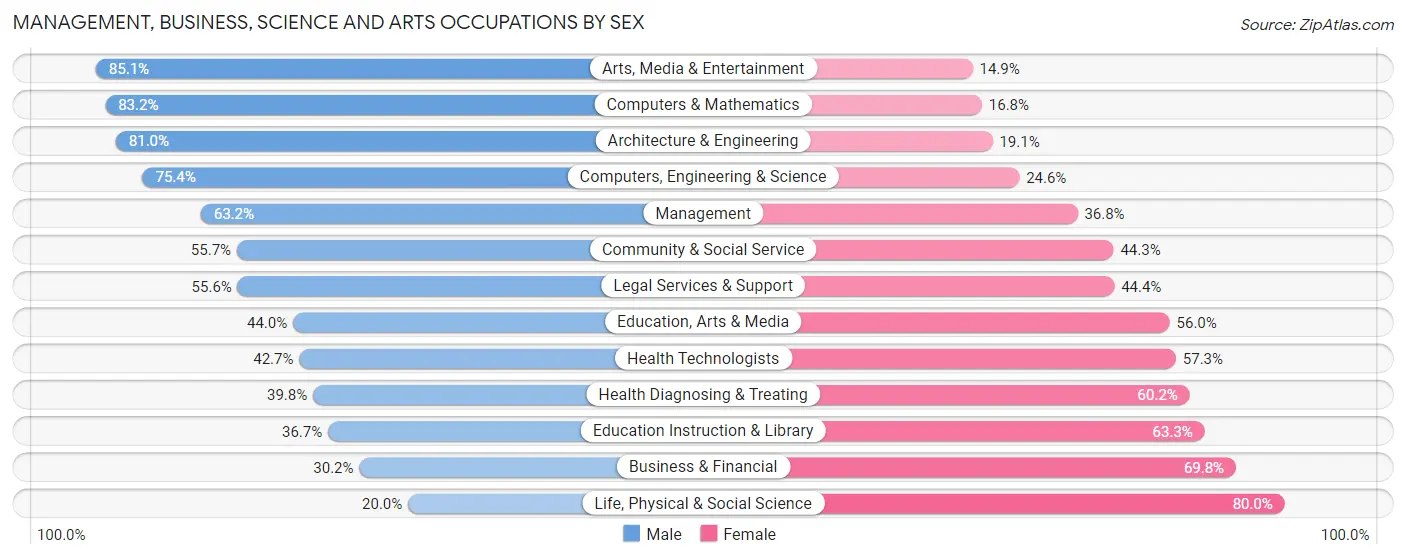
| Occupation | Male | Female |
| Management | 643 (63.2%) | 374 (36.8%) |
| Business & Financial | 191 (30.2%) | 442 (69.8%) |
| Computers, Engineering & Science | 551 (75.4%) | 180 (24.6%) |
| Computers & Mathematics | 415 (83.2%) | 84 (16.8%) |
| Architecture & Engineering | 119 (80.9%) | 28 (19.1%) |
| Life, Physical & Social Science | 17 (20.0%) | 68 (80.0%) |
| Community & Social Service | 439 (55.7%) | 349 (44.3%) |
| Education, Arts & Media | 33 (44.0%) | 42 (56.0%) |
| Legal Services & Support | 80 (55.6%) | 64 (44.4%) |
| Education Instruction & Library | 120 (36.7%) | 207 (63.3%) |
| Arts, Media & Entertainment | 206 (85.1%) | 36 (14.9%) |
| Health Diagnosing & Treating | 276 (39.8%) | 417 (60.2%) |
| Health Technologists | 272 (42.7%) | 365 (57.3%) |
| Total (Category) | 2,100 (54.4%) | 1,762 (45.6%) |
| Total (Overall) | 2,991 (51.4%) | 2,825 (48.6%) |
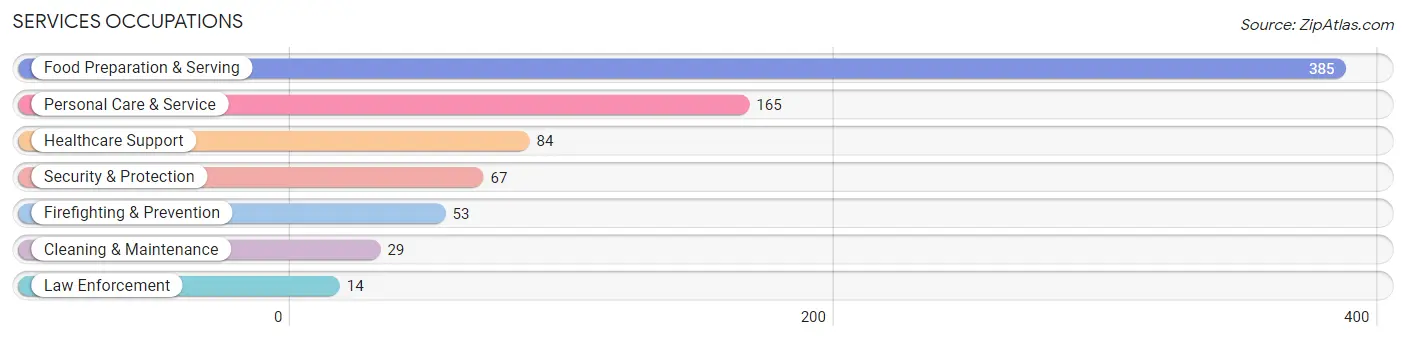
Services Occupations
The most common Services occupations in Cherry Creek are Food Preparation & Serving (385 | 6.6%), Personal Care & Service (165 | 2.8%), Healthcare Support (84 | 1.4%), Security & Protection (67 | 1.1%), and Firefighting & Prevention (53 | 0.9%).
Services Occupations by Sex
Within the Services occupations in Cherry Creek, the most male-oriented occupations are Law Enforcement (100.0%), Security & Protection (68.7%), and Cleaning & Maintenance (62.1%), while the most female-oriented occupations are Personal Care & Service (87.3%), Healthcare Support (79.8%), and Food Preparation & Serving (55.3%).
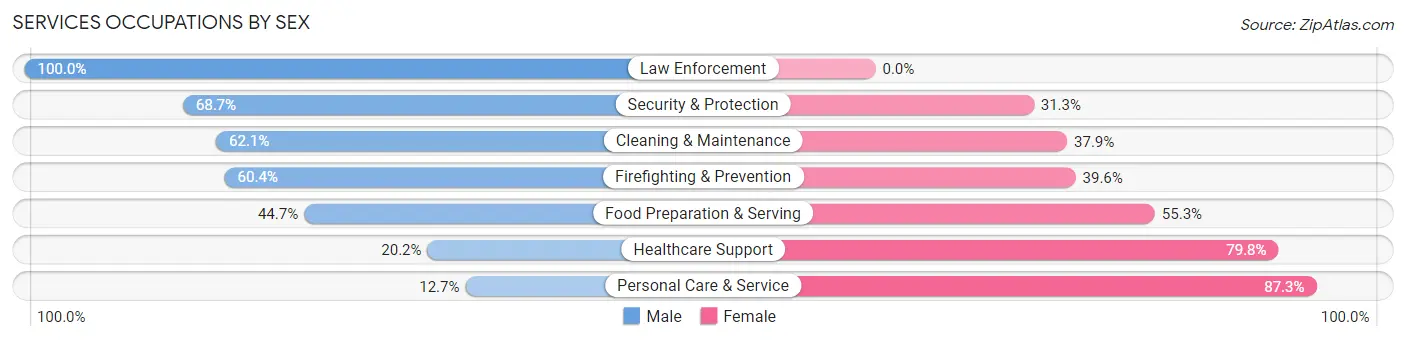
| Occupation | Male | Female |
| Healthcare Support | 17 (20.2%) | 67 (79.8%) |
| Security & Protection | 46 (68.7%) | 21 (31.3%) |
| Firefighting & Prevention | 32 (60.4%) | 21 (39.6%) |
| Law Enforcement | 14 (100.0%) | 0 (0.0%) |
| Food Preparation & Serving | 172 (44.7%) | 213 (55.3%) |
| Cleaning & Maintenance | 18 (62.1%) | 11 (37.9%) |
| Personal Care & Service | 21 (12.7%) | 144 (87.3%) |
| Total (Category) | 274 (37.5%) | 456 (62.5%) |
| Total (Overall) | 2,991 (51.4%) | 2,825 (48.6%) |
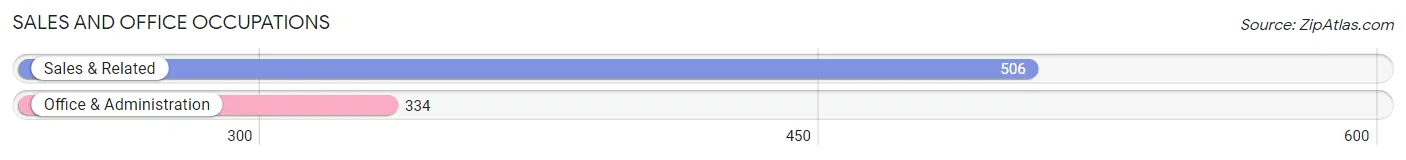
Sales and Office Occupations
The most common Sales and Office occupations in Cherry Creek are Sales & Related (506 | 8.7%), and Office & Administration (334 | 5.7%).
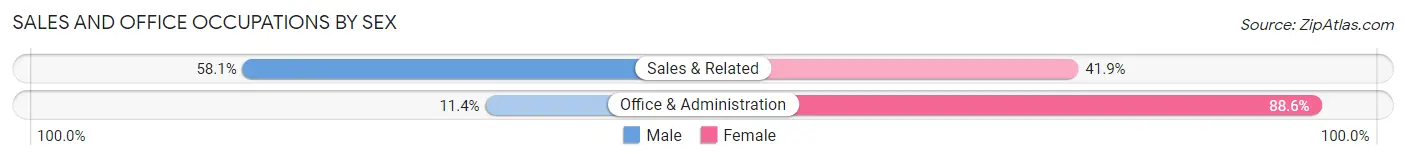
Sales and Office Occupations by Sex
| Occupation | Male | Female |
| Sales & Related | 294 (58.1%) | 212 (41.9%) |
| Office & Administration | 38 (11.4%) | 296 (88.6%) |
| Total (Category) | 332 (39.5%) | 508 (60.5%) |
| Total (Overall) | 2,991 (51.4%) | 2,825 (48.6%) |
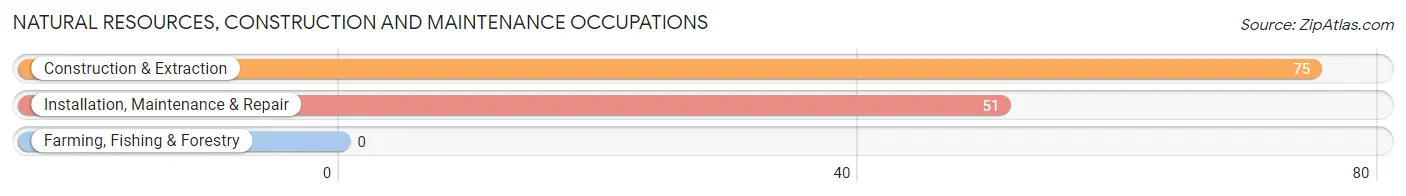
Natural Resources, Construction and Maintenance Occupations
The most common Natural Resources, Construction and Maintenance occupations in Cherry Creek are Construction & Extraction (75 | 1.3%), and Installation, Maintenance & Repair (51 | 0.9%).
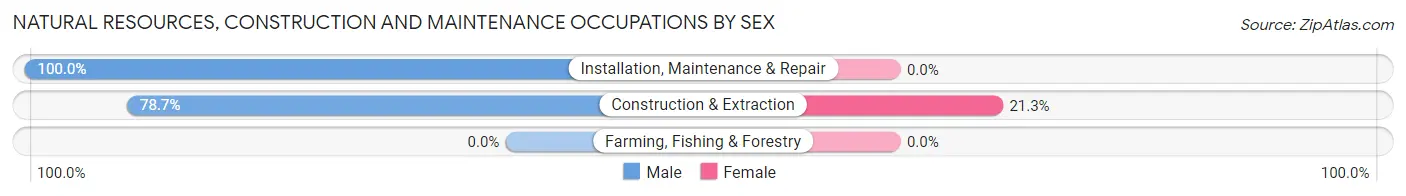
Natural Resources, Construction and Maintenance Occupations by Sex
| Occupation | Male | Female |
| Farming, Fishing & Forestry | 0 (0.0%) | 0 (0.0%) |
| Construction & Extraction | 59 (78.7%) | 16 (21.3%) |
| Installation, Maintenance & Repair | 51 (100.0%) | 0 (0.0%) |
| Total (Category) | 110 (87.3%) | 16 (12.7%) |
| Total (Overall) | 2,991 (51.4%) | 2,825 (48.6%) |
Production, Transportation and Moving Occupations
The most common Production, Transportation and Moving occupations in Cherry Creek are Transportation (108 | 1.9%), Material Moving (95 | 1.6%), and Production (55 | 0.9%).
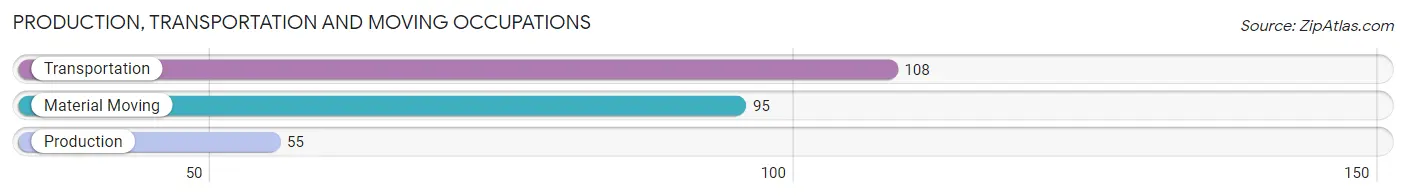
Production, Transportation and Moving Occupations by Sex
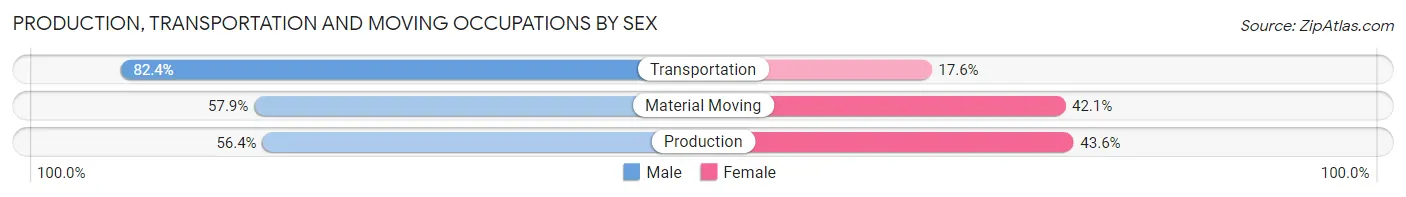
| Occupation | Male | Female |
| Production | 31 (56.4%) | 24 (43.6%) |
| Transportation | 89 (82.4%) | 19 (17.6%) |
| Material Moving | 55 (57.9%) | 40 (42.1%) |
| Total (Category) | 175 (67.8%) | 83 (32.2%) |
| Total (Overall) | 2,991 (51.4%) | 2,825 (48.6%) |
Employment Industries by Sex in Cherry Creek
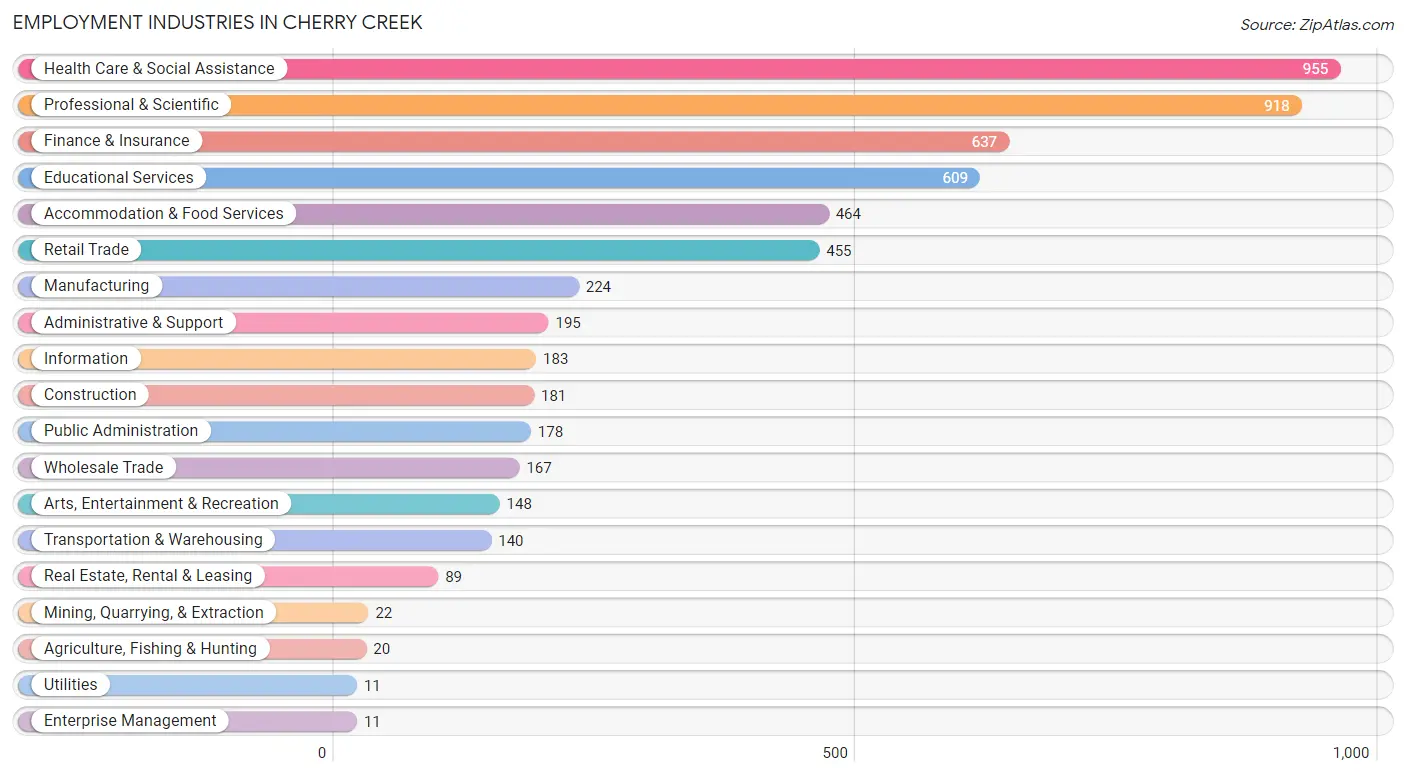
Employment Industries in Cherry Creek
The major employment industries in Cherry Creek include Health Care & Social Assistance (955 | 16.4%), Professional & Scientific (918 | 15.8%), Finance & Insurance (637 | 11.0%), Educational Services (609 | 10.5%), and Accommodation & Food Services (464 | 8.0%).
Employment Industries by Sex in Cherry Creek
The Cherry Creek industries that see more men than women are Utilities (100.0%), Enterprise Management (100.0%), and Construction (80.1%), whereas the industries that tend to have a higher number of women are Mining, Quarrying, & Extraction (68.2%), Administrative & Support (67.7%), and Health Care & Social Assistance (66.6%).
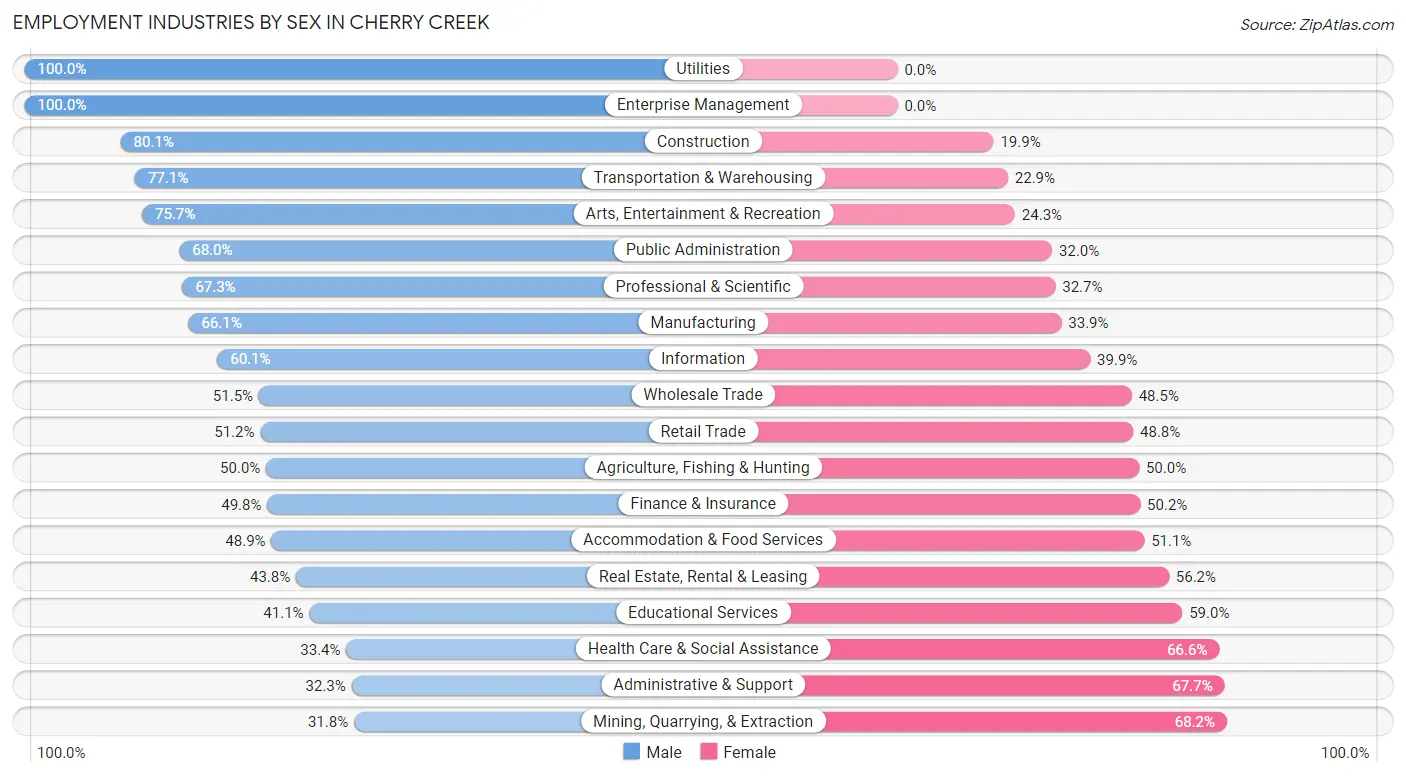
| Industry | Male | Female |
| Agriculture, Fishing & Hunting | 10 (50.0%) | 10 (50.0%) |
| Mining, Quarrying, & Extraction | 7 (31.8%) | 15 (68.2%) |
| Construction | 145 (80.1%) | 36 (19.9%) |
| Manufacturing | 148 (66.1%) | 76 (33.9%) |
| Wholesale Trade | 86 (51.5%) | 81 (48.5%) |
| Retail Trade | 233 (51.2%) | 222 (48.8%) |
| Transportation & Warehousing | 108 (77.1%) | 32 (22.9%) |
| Utilities | 11 (100.0%) | 0 (0.0%) |
| Information | 110 (60.1%) | 73 (39.9%) |
| Finance & Insurance | 317 (49.8%) | 320 (50.2%) |
| Real Estate, Rental & Leasing | 39 (43.8%) | 50 (56.2%) |
| Professional & Scientific | 618 (67.3%) | 300 (32.7%) |
| Enterprise Management | 11 (100.0%) | 0 (0.0%) |
| Administrative & Support | 63 (32.3%) | 132 (67.7%) |
| Educational Services | 250 (41.0%) | 359 (59.0%) |
| Health Care & Social Assistance | 319 (33.4%) | 636 (66.6%) |
| Arts, Entertainment & Recreation | 112 (75.7%) | 36 (24.3%) |
| Accommodation & Food Services | 227 (48.9%) | 237 (51.1%) |
| Public Administration | 121 (68.0%) | 57 (32.0%) |
| Total | 2,991 (51.4%) | 2,825 (48.6%) |
Education in Cherry Creek
School Enrollment in Cherry Creek
The most common levels of schooling among the 3,435 students in Cherry Creek are high school (1,001 | 29.1%), middle school (879 | 25.6%), and elementary school (604 | 17.6%).
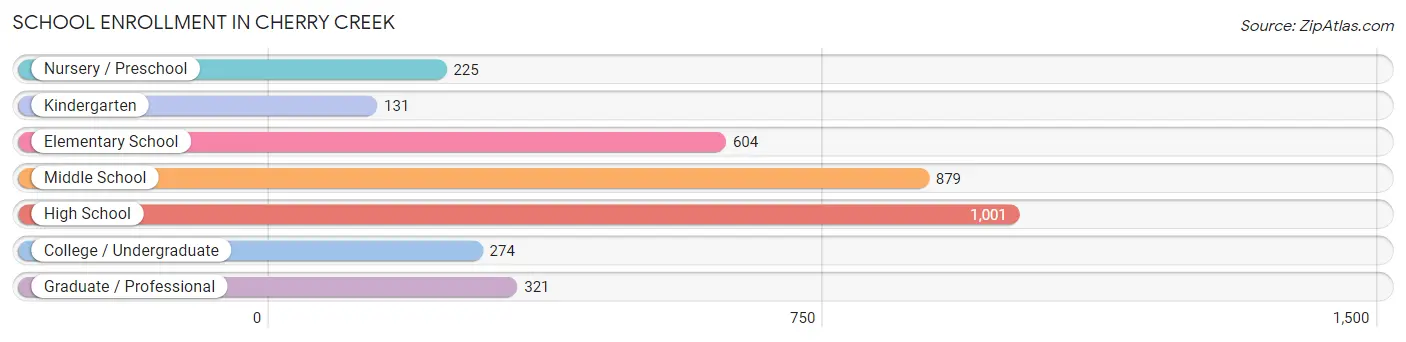
| School Level | # Students | % Students |
| Nursery / Preschool | 225 | 6.6% |
| Kindergarten | 131 | 3.8% |
| Elementary School | 604 | 17.6% |
| Middle School | 879 | 25.6% |
| High School | 1,001 | 29.1% |
| College / Undergraduate | 274 | 8.0% |
| Graduate / Professional | 321 | 9.3% |
| Total | 3,435 | 100.0% |
School Enrollment by Age by Funding Source in Cherry Creek
Out of a total of 3,435 students who are enrolled in schools in Cherry Creek, 550 (16.0%) attend a private institution, while the remaining 2,885 (84.0%) are enrolled in public schools. The age group of 3 to 4 year olds has the highest likelihood of being enrolled in private schools, with 116 (58.6% in the age bracket) enrolled. Conversely, the age group of 18 to 19 year olds has the lowest likelihood of being enrolled in a private school, with 175 (100.0% in the age bracket) attending a public institution.
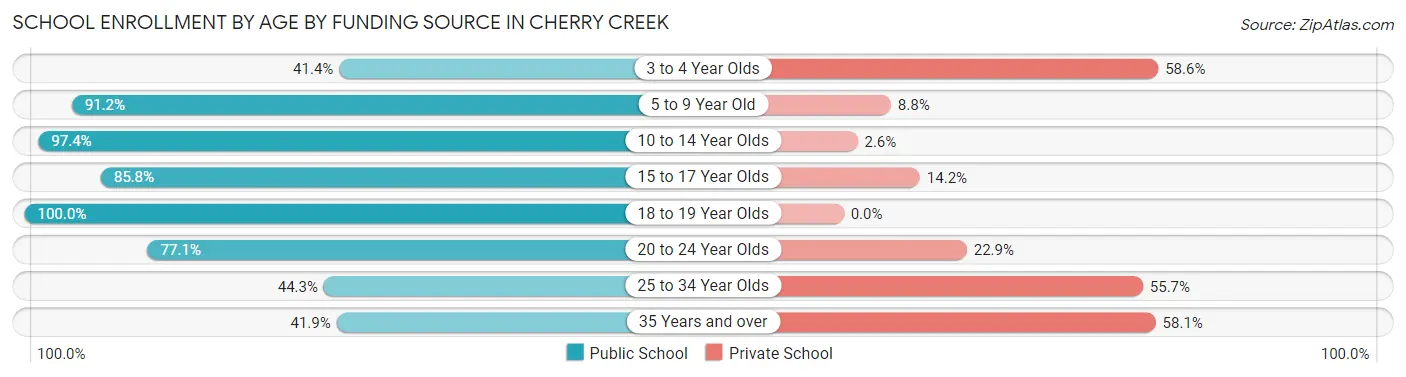
| Age Bracket | Public School | Private School |
| 3 to 4 Year Olds | 82 (41.4%) | 116 (58.6%) |
| 5 to 9 Year Old | 591 (91.2%) | 57 (8.8%) |
| 10 to 14 Year Olds | 1,056 (97.4%) | 28 (2.6%) |
| 15 to 17 Year Olds | 677 (85.8%) | 112 (14.2%) |
| 18 to 19 Year Olds | 175 (100.0%) | 0 (0.0%) |
| 20 to 24 Year Olds | 158 (77.1%) | 47 (22.9%) |
| 25 to 34 Year Olds | 116 (44.3%) | 146 (55.7%) |
| 35 Years and over | 31 (41.9%) | 43 (58.1%) |
| Total | 2,885 (84.0%) | 550 (16.0%) |
Educational Attainment by Field of Study in Cherry Creek
Business (1,334 | 21.6%), psychology (538 | 8.7%), engineering (494 | 8.0%), social sciences (486 | 7.9%), and science & technology (481 | 7.8%) are the most common fields of study among 6,178 individuals in Cherry Creek who have obtained a bachelor's degree or higher.
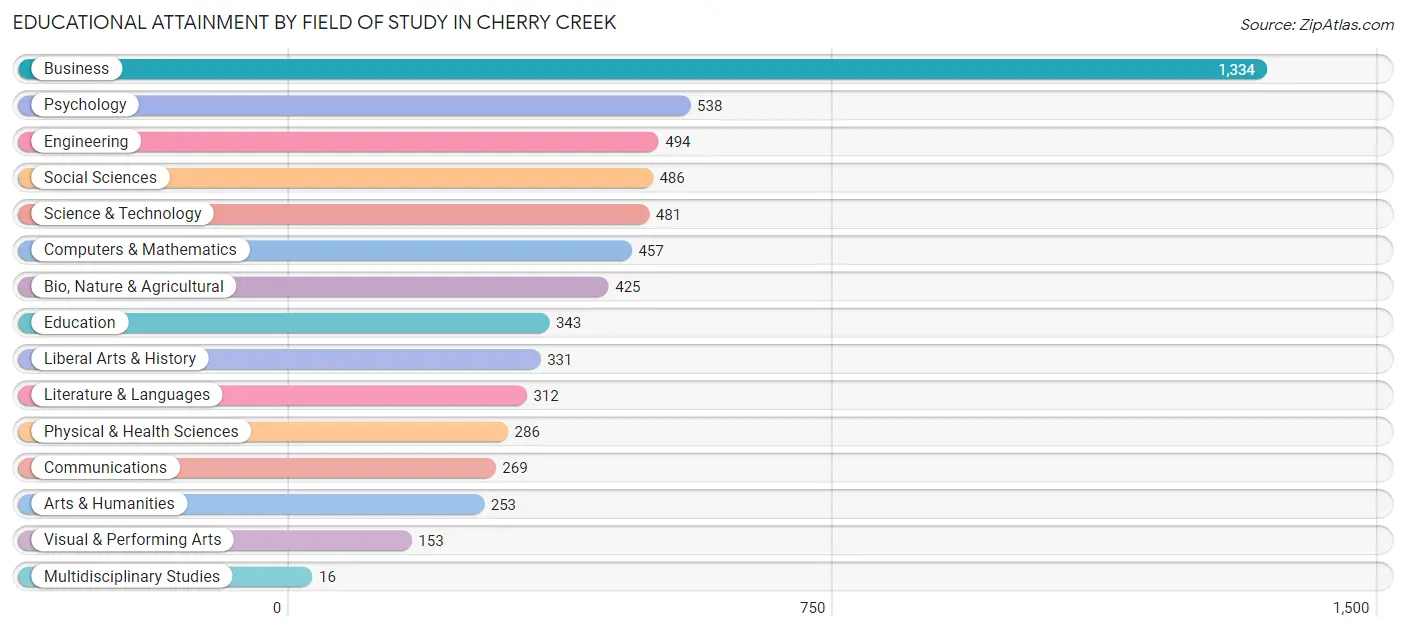
| Field of Study | # Graduates | % Graduates |
| Computers & Mathematics | 457 | 7.4% |
| Bio, Nature & Agricultural | 425 | 6.9% |
| Physical & Health Sciences | 286 | 4.6% |
| Psychology | 538 | 8.7% |
| Social Sciences | 486 | 7.9% |
| Engineering | 494 | 8.0% |
| Multidisciplinary Studies | 16 | 0.3% |
| Science & Technology | 481 | 7.8% |
| Business | 1,334 | 21.6% |
| Education | 343 | 5.6% |
| Literature & Languages | 312 | 5.1% |
| Liberal Arts & History | 331 | 5.4% |
| Visual & Performing Arts | 153 | 2.5% |
| Communications | 269 | 4.3% |
| Arts & Humanities | 253 | 4.1% |
| Total | 6,178 | 100.0% |
Transportation & Commute in Cherry Creek
Vehicle Availability by Sex in Cherry Creek
The most prevalent vehicle ownership categories in Cherry Creek are males with 2 vehicles (1,284, accounting for 44.5%) and females with 2 vehicles (1,172, making up 47.2%).
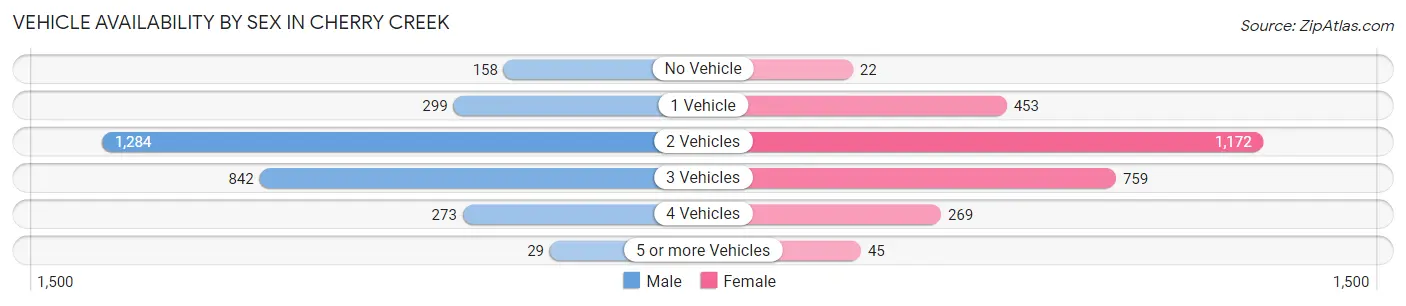
| Vehicles Available | Male | Female |
| No Vehicle | 158 (5.5%) | 22 (0.8%) |
| 1 Vehicle | 299 (10.4%) | 453 (16.7%) |
| 2 Vehicles | 1,284 (44.5%) | 1,172 (43.1%) |
| 3 Vehicles | 842 (29.2%) | 759 (27.9%) |
| 4 Vehicles | 273 (9.5%) | 269 (9.9%) |
| 5 or more Vehicles | 29 (1.0%) | 45 (1.7%) |
| Total | 2,885 (100.0%) | 2,720 (100.0%) |
Commute Time in Cherry Creek
The most frequently occuring commute durations in Cherry Creek are 10 to 14 minutes (971 commuters, 23.2%), 15 to 19 minutes (717 commuters, 17.1%), and 20 to 24 minutes (518 commuters, 12.3%).
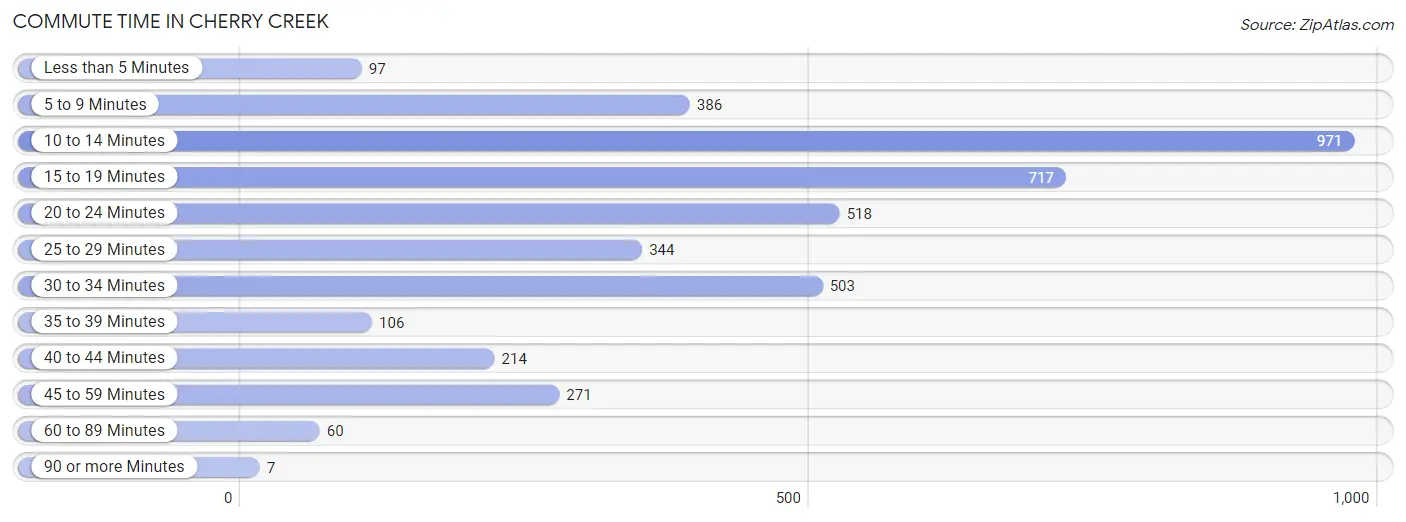
| Commute Time | # Commuters | % Commuters |
| Less than 5 Minutes | 97 | 2.3% |
| 5 to 9 Minutes | 386 | 9.2% |
| 10 to 14 Minutes | 971 | 23.2% |
| 15 to 19 Minutes | 717 | 17.1% |
| 20 to 24 Minutes | 518 | 12.3% |
| 25 to 29 Minutes | 344 | 8.2% |
| 30 to 34 Minutes | 503 | 12.0% |
| 35 to 39 Minutes | 106 | 2.5% |
| 40 to 44 Minutes | 214 | 5.1% |
| 45 to 59 Minutes | 271 | 6.5% |
| 60 to 89 Minutes | 60 | 1.4% |
| 90 or more Minutes | 7 | 0.2% |
Commute Time by Sex in Cherry Creek
The most common commute times in Cherry Creek are 10 to 14 minutes (444 commuters, 21.2%) for males and 10 to 14 minutes (527 commuters, 25.1%) for females.
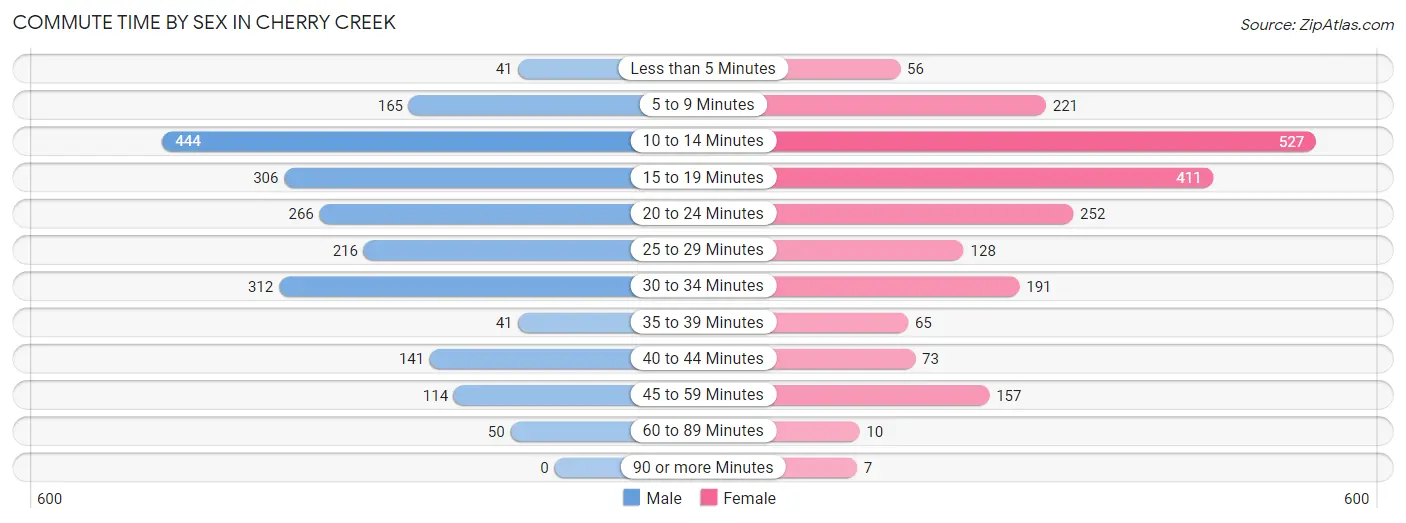
| Commute Time | Male | Female |
| Less than 5 Minutes | 41 (2.0%) | 56 (2.7%) |
| 5 to 9 Minutes | 165 (7.9%) | 221 (10.5%) |
| 10 to 14 Minutes | 444 (21.2%) | 527 (25.1%) |
| 15 to 19 Minutes | 306 (14.6%) | 411 (19.6%) |
| 20 to 24 Minutes | 266 (12.7%) | 252 (12.0%) |
| 25 to 29 Minutes | 216 (10.3%) | 128 (6.1%) |
| 30 to 34 Minutes | 312 (14.9%) | 191 (9.1%) |
| 35 to 39 Minutes | 41 (2.0%) | 65 (3.1%) |
| 40 to 44 Minutes | 141 (6.7%) | 73 (3.5%) |
| 45 to 59 Minutes | 114 (5.4%) | 157 (7.5%) |
| 60 to 89 Minutes | 50 (2.4%) | 10 (0.5%) |
| 90 or more Minutes | 0 (0.0%) | 7 (0.3%) |
Time of Departure to Work by Sex in Cherry Creek
The most frequent times of departure to work in Cherry Creek are 7:30 AM to 7:59 AM (401, 19.1%) for males and 8:00 AM to 8:29 AM (444, 21.2%) for females.
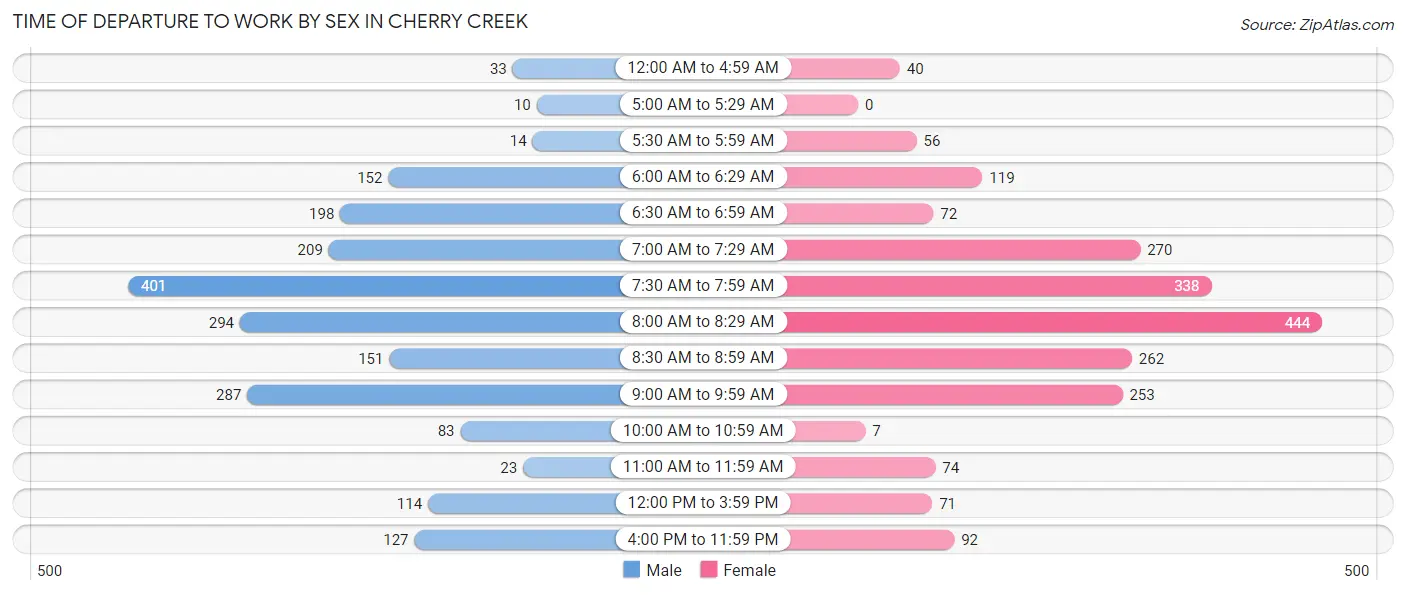
| Time of Departure | Male | Female |
| 12:00 AM to 4:59 AM | 33 (1.6%) | 40 (1.9%) |
| 5:00 AM to 5:29 AM | 10 (0.5%) | 0 (0.0%) |
| 5:30 AM to 5:59 AM | 14 (0.7%) | 56 (2.7%) |
| 6:00 AM to 6:29 AM | 152 (7.2%) | 119 (5.7%) |
| 6:30 AM to 6:59 AM | 198 (9.5%) | 72 (3.4%) |
| 7:00 AM to 7:29 AM | 209 (10.0%) | 270 (12.9%) |
| 7:30 AM to 7:59 AM | 401 (19.1%) | 338 (16.1%) |
| 8:00 AM to 8:29 AM | 294 (14.0%) | 444 (21.2%) |
| 8:30 AM to 8:59 AM | 151 (7.2%) | 262 (12.5%) |
| 9:00 AM to 9:59 AM | 287 (13.7%) | 253 (12.1%) |
| 10:00 AM to 10:59 AM | 83 (4.0%) | 7 (0.3%) |
| 11:00 AM to 11:59 AM | 23 (1.1%) | 74 (3.5%) |
| 12:00 PM to 3:59 PM | 114 (5.4%) | 71 (3.4%) |
| 4:00 PM to 11:59 PM | 127 (6.1%) | 92 (4.4%) |
| Total | 2,096 (100.0%) | 2,098 (100.0%) |
Housing Occupancy in Cherry Creek
Occupancy by Ownership in Cherry Creek
Of the total 4,105 dwellings in Cherry Creek, owner-occupied units account for 3,140 (76.5%), while renter-occupied units make up 965 (23.5%).
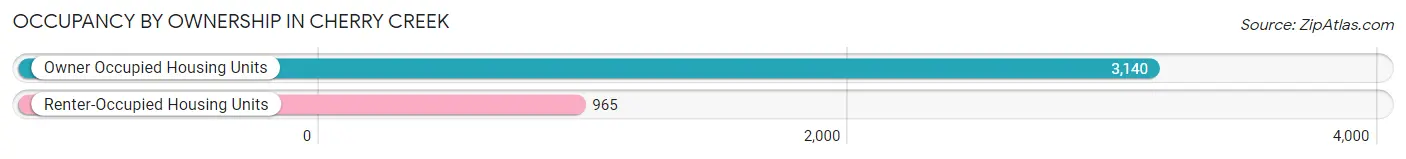
| Occupancy | # Housing Units | % Housing Units |
| Owner Occupied Housing Units | 3,140 | 76.5% |
| Renter-Occupied Housing Units | 965 | 23.5% |
| Total Occupied Housing Units | 4,105 | 100.0% |
Occupancy by Household Size in Cherry Creek
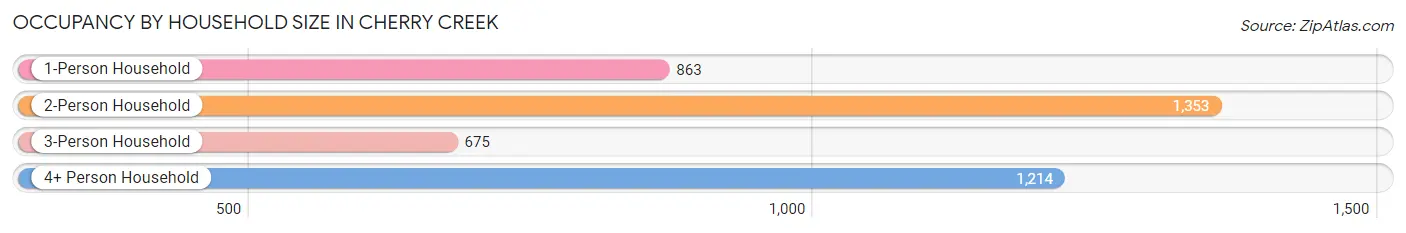
| Household Size | # Housing Units | % Housing Units |
| 1-Person Household | 863 | 21.0% |
| 2-Person Household | 1,353 | 33.0% |
| 3-Person Household | 675 | 16.4% |
| 4+ Person Household | 1,214 | 29.6% |
| Total Housing Units | 4,105 | 100.0% |
Occupancy by Ownership by Household Size in Cherry Creek
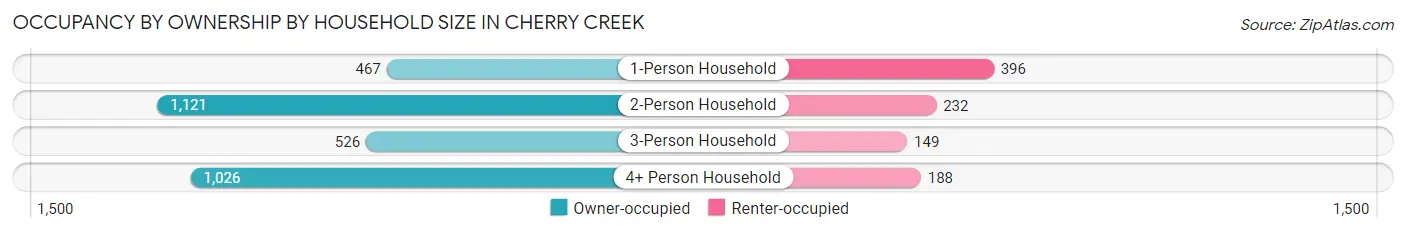
| Household Size | Owner-occupied | Renter-occupied |
| 1-Person Household | 467 (54.1%) | 396 (45.9%) |
| 2-Person Household | 1,121 (82.9%) | 232 (17.2%) |
| 3-Person Household | 526 (77.9%) | 149 (22.1%) |
| 4+ Person Household | 1,026 (84.5%) | 188 (15.5%) |
| Total Housing Units | 3,140 (76.5%) | 965 (23.5%) |
Occupancy by Educational Attainment in Cherry Creek
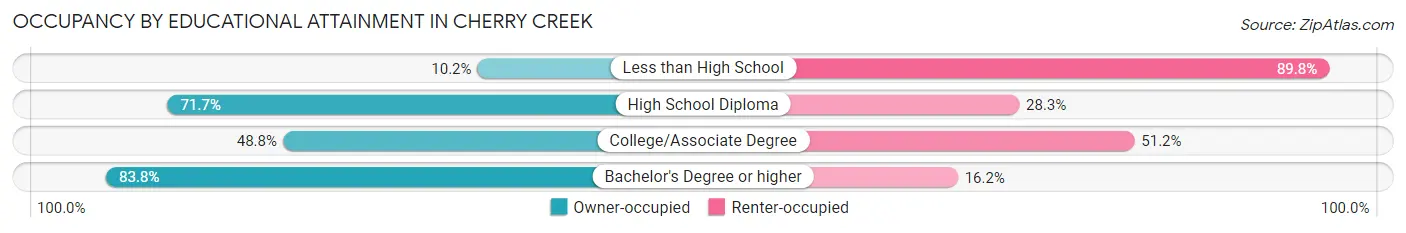
| Household Size | Owner-occupied | Renter-occupied |
| Less than High School | 9 (10.2%) | 79 (89.8%) |
| High School Diploma | 177 (71.7%) | 70 (28.3%) |
| College/Associate Degree | 288 (48.8%) | 302 (51.2%) |
| Bachelor's Degree or higher | 2,666 (83.8%) | 514 (16.2%) |
Occupancy by Age of Householder in Cherry Creek
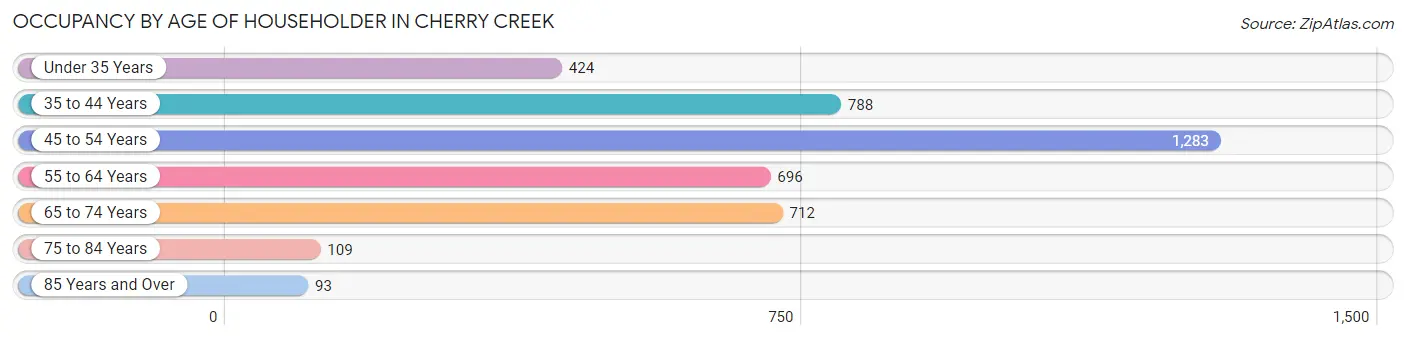
| Age Bracket | # Households | % Households |
| Under 35 Years | 424 | 10.3% |
| 35 to 44 Years | 788 | 19.2% |
| 45 to 54 Years | 1,283 | 31.2% |
| 55 to 64 Years | 696 | 17.0% |
| 65 to 74 Years | 712 | 17.3% |
| 75 to 84 Years | 109 | 2.7% |
| 85 Years and Over | 93 | 2.3% |
| Total | 4,105 | 100.0% |
Housing Finances in Cherry Creek
Median Income by Occupancy in Cherry Creek
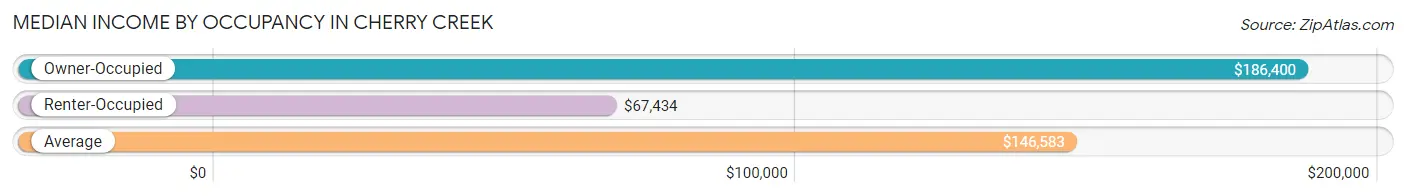
| Occupancy Type | # Households | Median Income |
| Owner-Occupied | 3,140 (76.5%) | $186,400 |
| Renter-Occupied | 965 (23.5%) | $67,434 |
| Average | 4,105 (100.0%) | $146,583 |
Occupancy by Householder Income Bracket in Cherry Creek
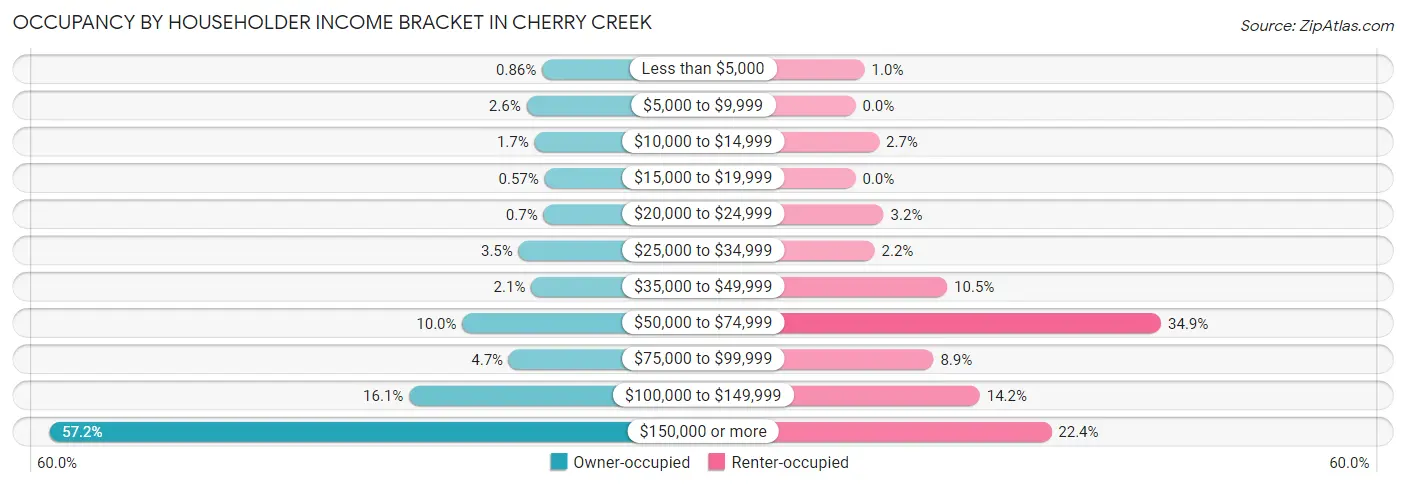
| Income Bracket | Owner-occupied | Renter-occupied |
| Less than $5,000 | 27 (0.9%) | 10 (1.0%) |
| $5,000 to $9,999 | 83 (2.6%) | 0 (0.0%) |
| $10,000 to $14,999 | 54 (1.7%) | 26 (2.7%) |
| $15,000 to $19,999 | 18 (0.6%) | 0 (0.0%) |
| $20,000 to $24,999 | 22 (0.7%) | 31 (3.2%) |
| $25,000 to $34,999 | 111 (3.5%) | 21 (2.2%) |
| $35,000 to $49,999 | 66 (2.1%) | 101 (10.5%) |
| $50,000 to $74,999 | 313 (10.0%) | 337 (34.9%) |
| $75,000 to $99,999 | 146 (4.6%) | 86 (8.9%) |
| $100,000 to $149,999 | 504 (16.1%) | 137 (14.2%) |
| $150,000 or more | 1,796 (57.2%) | 216 (22.4%) |
| Total | 3,140 (100.0%) | 965 (100.0%) |
Monthly Housing Cost Tiers in Cherry Creek
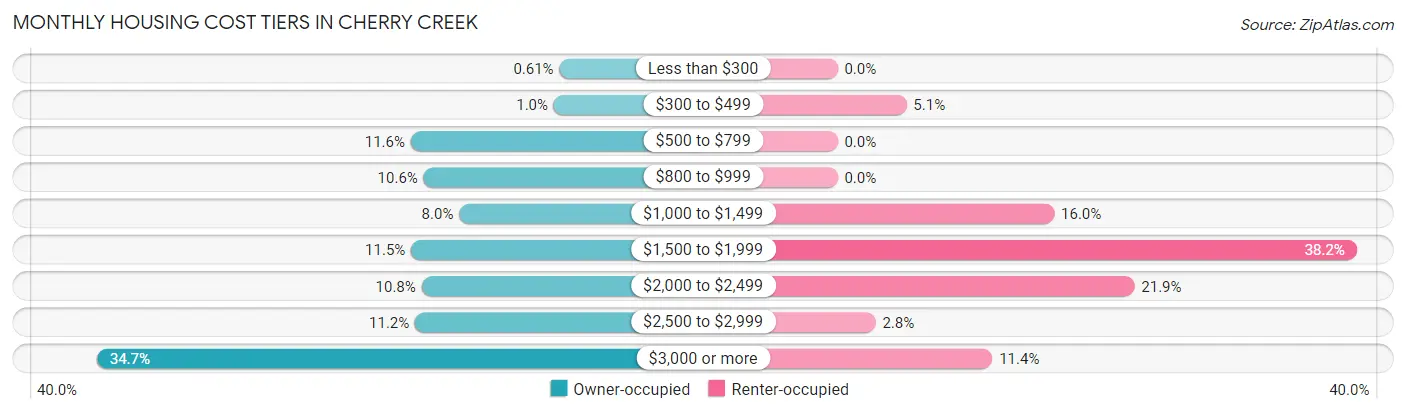
| Monthly Cost | Owner-occupied | Renter-occupied |
| Less than $300 | 19 (0.6%) | 0 (0.0%) |
| $300 to $499 | 32 (1.0%) | 49 (5.1%) |
| $500 to $799 | 363 (11.6%) | 0 (0.0%) |
| $800 to $999 | 333 (10.6%) | 0 (0.0%) |
| $1,000 to $1,499 | 251 (8.0%) | 154 (16.0%) |
| $1,500 to $1,999 | 362 (11.5%) | 369 (38.2%) |
| $2,000 to $2,499 | 338 (10.8%) | 211 (21.9%) |
| $2,500 to $2,999 | 353 (11.2%) | 27 (2.8%) |
| $3,000 or more | 1,089 (34.7%) | 110 (11.4%) |
| Total | 3,140 (100.0%) | 965 (100.0%) |
Physical Housing Characteristics in Cherry Creek
Housing Structures in Cherry Creek
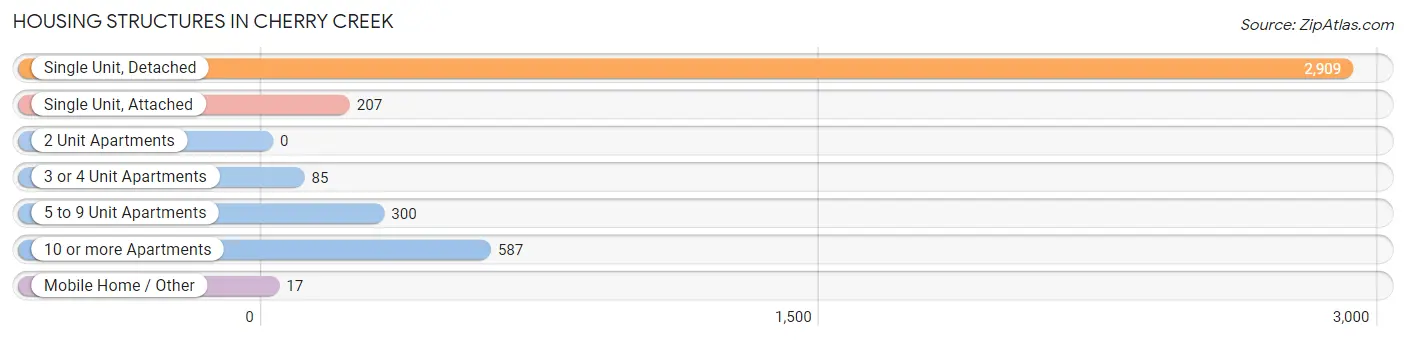
| Structure Type | # Housing Units | % Housing Units |
| Single Unit, Detached | 2,909 | 70.9% |
| Single Unit, Attached | 207 | 5.0% |
| 2 Unit Apartments | 0 | 0.0% |
| 3 or 4 Unit Apartments | 85 | 2.1% |
| 5 to 9 Unit Apartments | 300 | 7.3% |
| 10 or more Apartments | 587 | 14.3% |
| Mobile Home / Other | 17 | 0.4% |
| Total | 4,105 | 100.0% |
Housing Structures by Occupancy in Cherry Creek
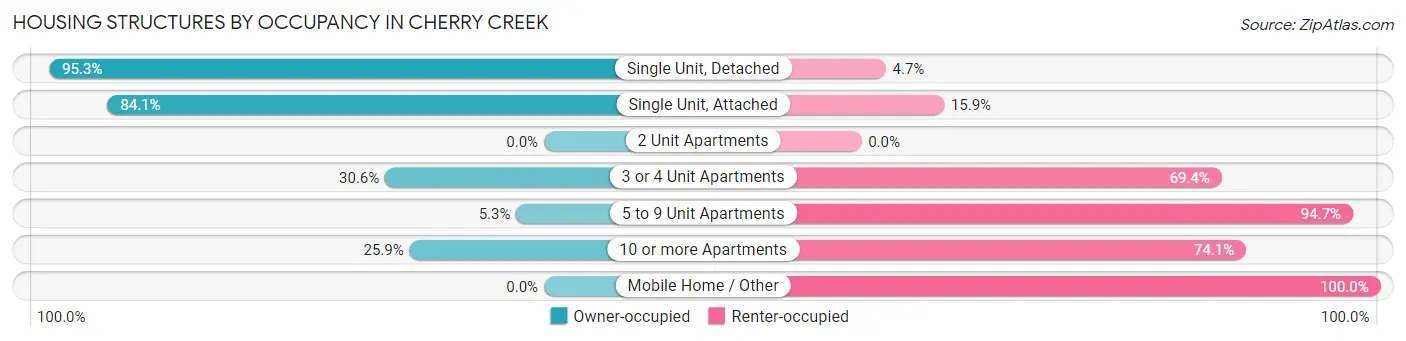
| Structure Type | Owner-occupied | Renter-occupied |
| Single Unit, Detached | 2,772 (95.3%) | 137 (4.7%) |
| Single Unit, Attached | 174 (84.1%) | 33 (15.9%) |
| 2 Unit Apartments | 0 (0.0%) | 0 (0.0%) |
| 3 or 4 Unit Apartments | 26 (30.6%) | 59 (69.4%) |
| 5 to 9 Unit Apartments | 16 (5.3%) | 284 (94.7%) |
| 10 or more Apartments | 152 (25.9%) | 435 (74.1%) |
| Mobile Home / Other | 0 (0.0%) | 17 (100.0%) |
| Total | 3,140 (76.5%) | 965 (23.5%) |
Housing Structures by Number of Rooms in Cherry Creek
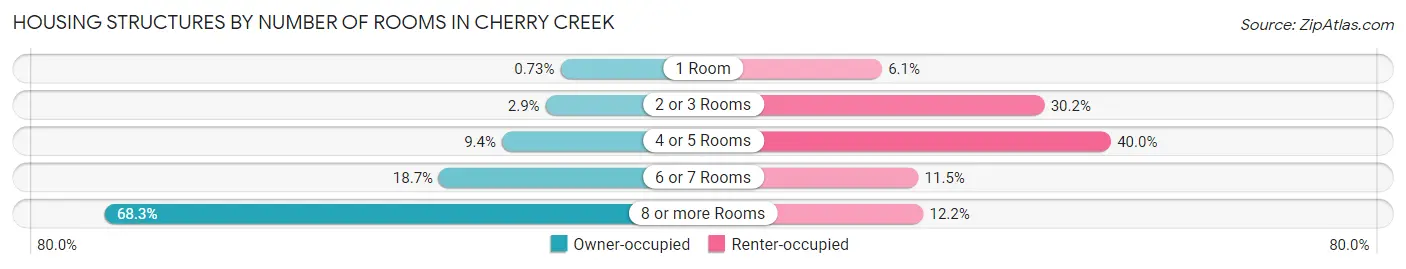
| Number of Rooms | Owner-occupied | Renter-occupied |
| 1 Room | 23 (0.7%) | 59 (6.1%) |
| 2 or 3 Rooms | 92 (2.9%) | 291 (30.2%) |
| 4 or 5 Rooms | 295 (9.4%) | 386 (40.0%) |
| 6 or 7 Rooms | 587 (18.7%) | 111 (11.5%) |
| 8 or more Rooms | 2,143 (68.2%) | 118 (12.2%) |
| Total | 3,140 (100.0%) | 965 (100.0%) |
Housing Structure by Heating Type in Cherry Creek
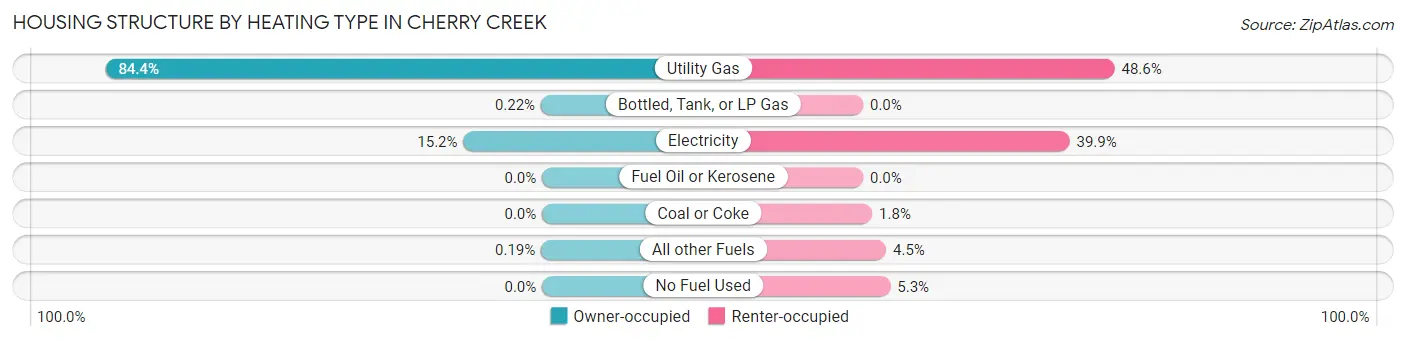
| Heating Type | Owner-occupied | Renter-occupied |
| Utility Gas | 2,649 (84.4%) | 469 (48.6%) |
| Bottled, Tank, or LP Gas | 7 (0.2%) | 0 (0.0%) |
| Electricity | 478 (15.2%) | 385 (39.9%) |
| Fuel Oil or Kerosene | 0 (0.0%) | 0 (0.0%) |
| Coal or Coke | 0 (0.0%) | 17 (1.8%) |
| All other Fuels | 6 (0.2%) | 43 (4.5%) |
| No Fuel Used | 0 (0.0%) | 51 (5.3%) |
| Total | 3,140 (100.0%) | 965 (100.0%) |
Household Vehicle Usage in Cherry Creek
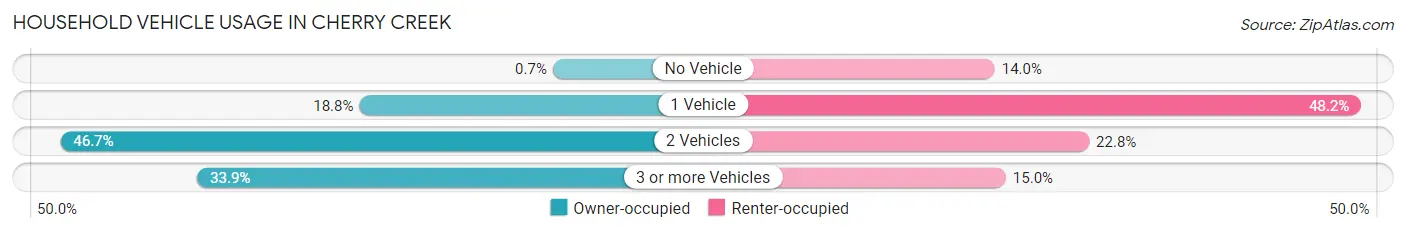
| Vehicles per Household | Owner-occupied | Renter-occupied |
| No Vehicle | 22 (0.7%) | 135 (14.0%) |
| 1 Vehicle | 589 (18.8%) | 465 (48.2%) |
| 2 Vehicles | 1,465 (46.7%) | 220 (22.8%) |
| 3 or more Vehicles | 1,064 (33.9%) | 145 (15.0%) |
| Total | 3,140 (100.0%) | 965 (100.0%) |
Real Estate & Mortgages in Cherry Creek
Real Estate and Mortgage Overview in Cherry Creek
| Characteristic | Without Mortgage | With Mortgage |
| Housing Units | 922 | 2,218 |
| Median Property Value | $747,300 | $824,000 |
| Median Household Income | $135,577 | $1,396 |
| Monthly Housing Costs | $828 | $1,089 |
| Real Estate Taxes | $4,341 | $37 |
Property Value by Mortgage Status in Cherry Creek
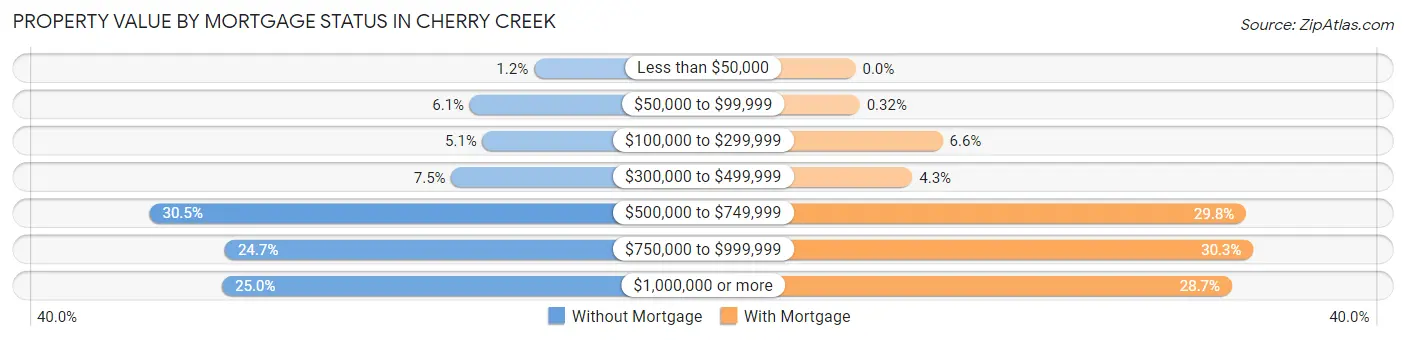
| Property Value | Without Mortgage | With Mortgage |
| Less than $50,000 | 11 (1.2%) | 0 (0.0%) |
| $50,000 to $99,999 | 56 (6.1%) | 7 (0.3%) |
| $100,000 to $299,999 | 47 (5.1%) | 147 (6.6%) |
| $300,000 to $499,999 | 69 (7.5%) | 96 (4.3%) |
| $500,000 to $749,999 | 281 (30.5%) | 660 (29.8%) |
| $750,000 to $999,999 | 228 (24.7%) | 672 (30.3%) |
| $1,000,000 or more | 230 (24.9%) | 636 (28.7%) |
| Total | 922 (100.0%) | 2,218 (100.0%) |
Household Income by Mortgage Status in Cherry Creek
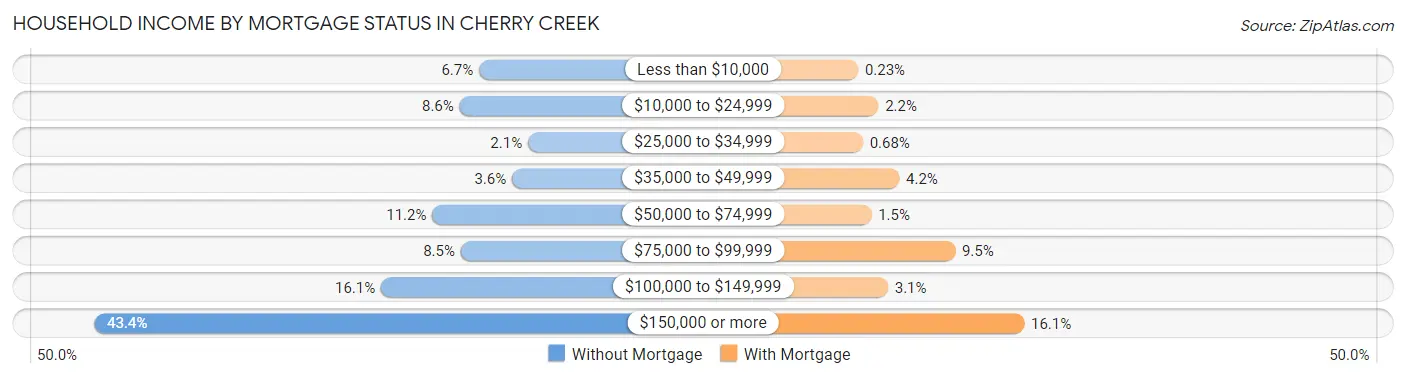
| Household Income | Without Mortgage | With Mortgage |
| Less than $10,000 | 62 (6.7%) | 5 (0.2%) |
| $10,000 to $24,999 | 79 (8.6%) | 48 (2.2%) |
| $25,000 to $34,999 | 19 (2.1%) | 15 (0.7%) |
| $35,000 to $49,999 | 33 (3.6%) | 92 (4.2%) |
| $50,000 to $74,999 | 103 (11.2%) | 33 (1.5%) |
| $75,000 to $99,999 | 78 (8.5%) | 210 (9.5%) |
| $100,000 to $149,999 | 148 (16.1%) | 68 (3.1%) |
| $150,000 or more | 400 (43.4%) | 356 (16.1%) |
| Total | 922 (100.0%) | 2,218 (100.0%) |
Property Value to Household Income Ratio in Cherry Creek
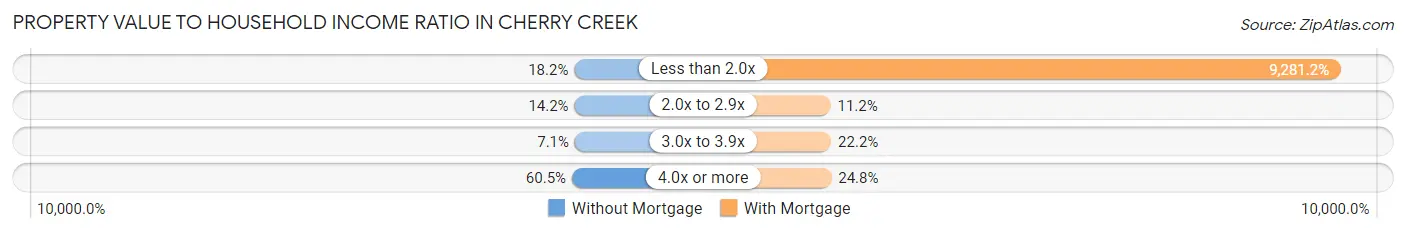
| Value-to-Income Ratio | Without Mortgage | With Mortgage |
| Less than 2.0x | 168 (18.2%) | 205,857 (9,281.2%) |
| 2.0x to 2.9x | 131 (14.2%) | 249 (11.2%) |
| 3.0x to 3.9x | 65 (7.0%) | 493 (22.2%) |
| 4.0x or more | 558 (60.5%) | 551 (24.8%) |
| Total | 922 (100.0%) | 2,218 (100.0%) |
Real Estate Taxes by Mortgage Status in Cherry Creek
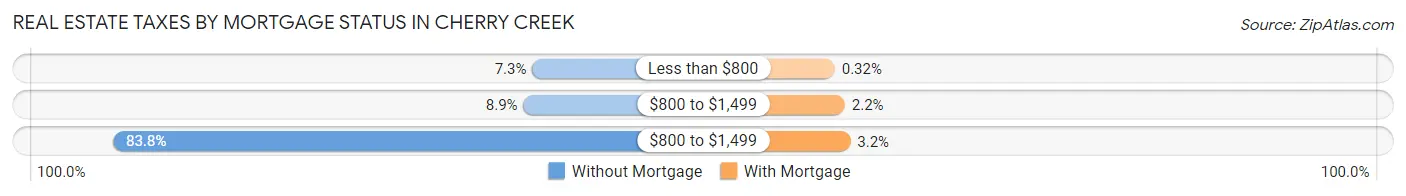
| Property Taxes | Without Mortgage | With Mortgage |
| Less than $800 | 67 (7.3%) | 7 (0.3%) |
| $800 to $1,499 | 82 (8.9%) | 48 (2.2%) |
| $800 to $1,499 | 773 (83.8%) | 70 (3.2%) |
| Total | 922 (100.0%) | 2,218 (100.0%) |
Health & Disability in Cherry Creek
Health Insurance Coverage by Age in Cherry Creek
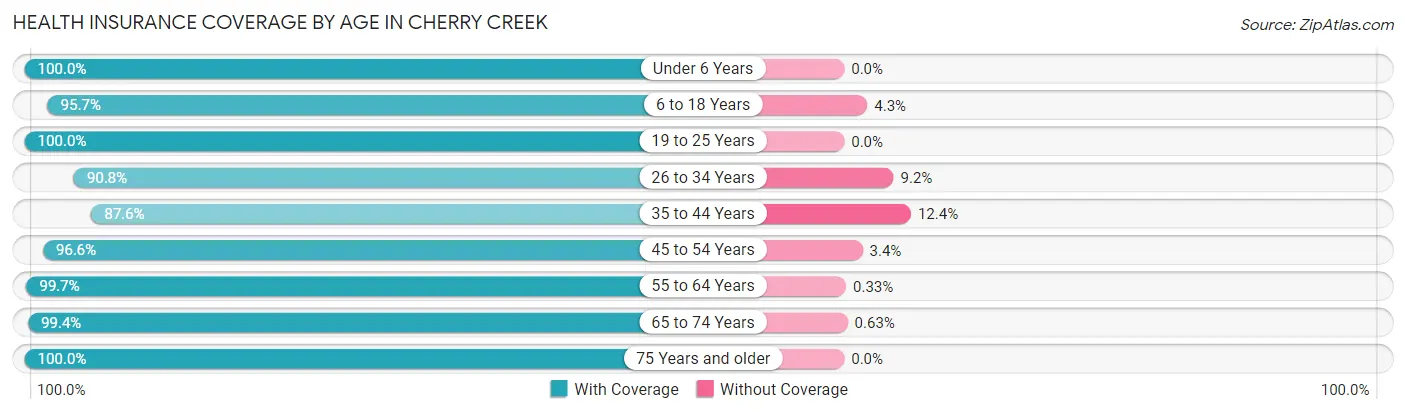
| Age Bracket | With Coverage | Without Coverage |
| Under 6 Years | 602 (100.0%) | 0 (0.0%) |
| 6 to 18 Years | 2,468 (95.7%) | 111 (4.3%) |
| 19 to 25 Years | 674 (100.0%) | 0 (0.0%) |
| 26 to 34 Years | 751 (90.8%) | 76 (9.2%) |
| 35 to 44 Years | 1,246 (87.6%) | 177 (12.4%) |
| 45 to 54 Years | 2,153 (96.6%) | 76 (3.4%) |
| 55 to 64 Years | 1,225 (99.7%) | 4 (0.3%) |
| 65 to 74 Years | 1,109 (99.4%) | 7 (0.6%) |
| 75 Years and older | 445 (100.0%) | 0 (0.0%) |
| Total | 10,673 (96.0%) | 451 (4.1%) |
Health Insurance Coverage by Citizenship Status in Cherry Creek
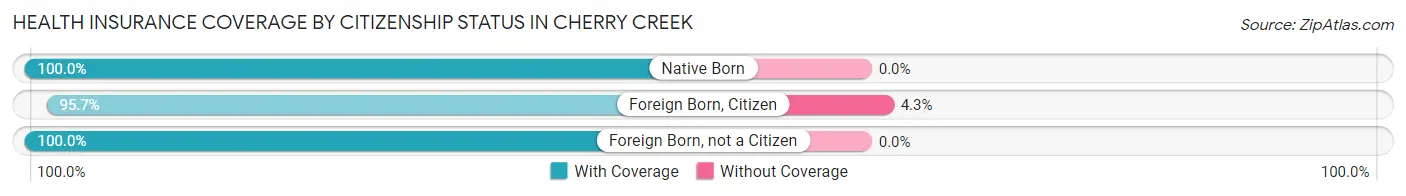
| Citizenship Status | With Coverage | Without Coverage |
| Native Born | 602 (100.0%) | 0 (0.0%) |
| Foreign Born, Citizen | 2,468 (95.7%) | 111 (4.3%) |
| Foreign Born, not a Citizen | 674 (100.0%) | 0 (0.0%) |
Health Insurance Coverage by Household Income in Cherry Creek
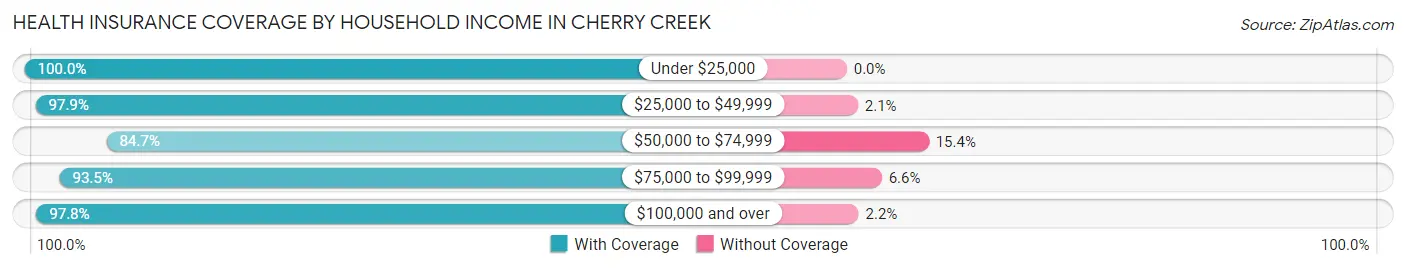
| Household Income | With Coverage | Without Coverage |
| Under $25,000 | 439 (100.0%) | 0 (0.0%) |
| $25,000 to $49,999 | 661 (97.9%) | 14 (2.1%) |
| $50,000 to $74,999 | 1,279 (84.7%) | 232 (15.3%) |
| $75,000 to $99,999 | 414 (93.4%) | 29 (6.6%) |
| $100,000 and over | 7,800 (97.8%) | 176 (2.2%) |
Public vs Private Health Insurance Coverage by Age in Cherry Creek
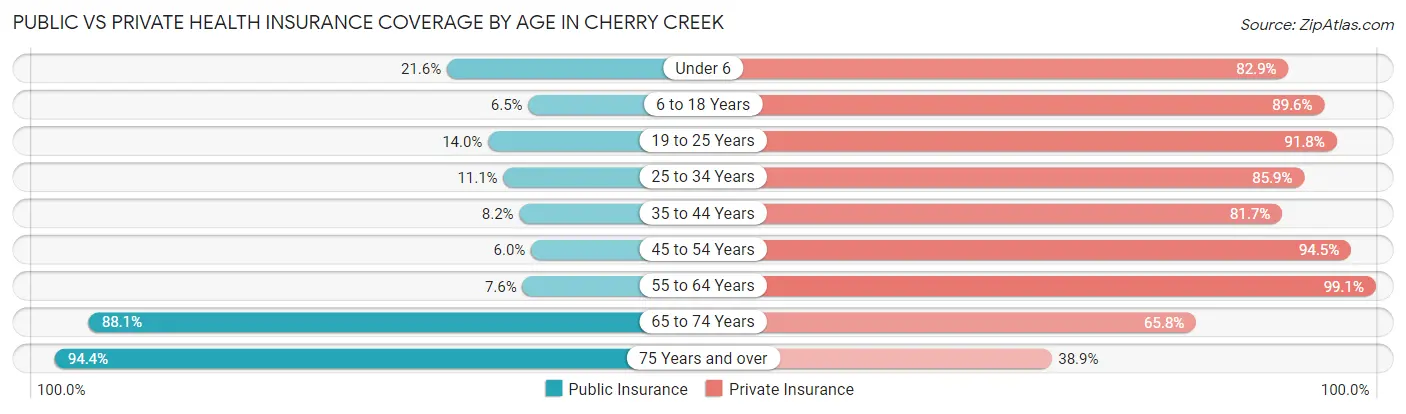
| Age Bracket | Public Insurance | Private Insurance |
| Under 6 | 130 (21.6%) | 499 (82.9%) |
| 6 to 18 Years | 167 (6.5%) | 2,310 (89.6%) |
| 19 to 25 Years | 94 (14.0%) | 619 (91.8%) |
| 25 to 34 Years | 92 (11.1%) | 710 (85.9%) |
| 35 to 44 Years | 116 (8.2%) | 1,163 (81.7%) |
| 45 to 54 Years | 133 (6.0%) | 2,107 (94.5%) |
| 55 to 64 Years | 93 (7.6%) | 1,218 (99.1%) |
| 65 to 74 Years | 983 (88.1%) | 734 (65.8%) |
| 75 Years and over | 420 (94.4%) | 173 (38.9%) |
| Total | 2,228 (20.0%) | 9,533 (85.7%) |
Disability Status by Sex by Age in Cherry Creek
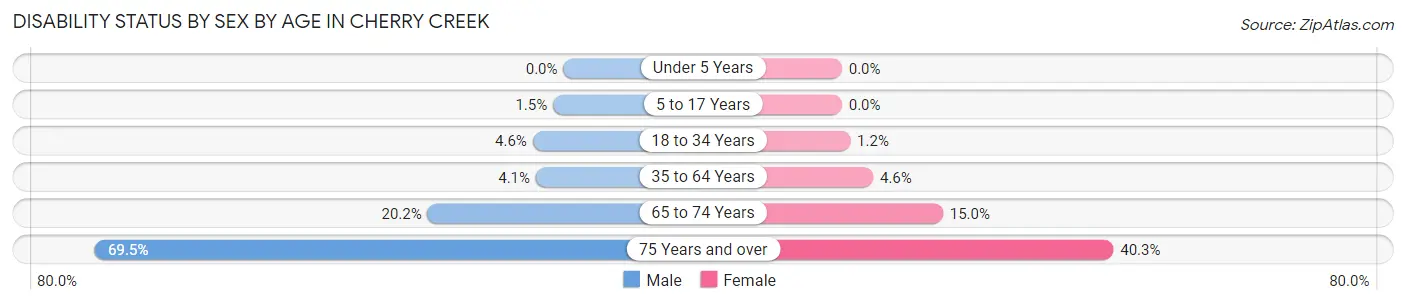
| Age Bracket | Male | Female |
| Under 5 Years | 0 (0.0%) | 0 (0.0%) |
| 5 to 17 Years | 21 (1.5%) | 0 (0.0%) |
| 18 to 34 Years | 35 (4.5%) | 11 (1.2%) |
| 35 to 64 Years | 98 (4.1%) | 115 (4.6%) |
| 65 to 74 Years | 100 (20.2%) | 93 (15.0%) |
| 75 Years and over | 137 (69.5%) | 100 (40.3%) |
Disability Class by Sex by Age in Cherry Creek
Disability Class: Hearing Difficulty
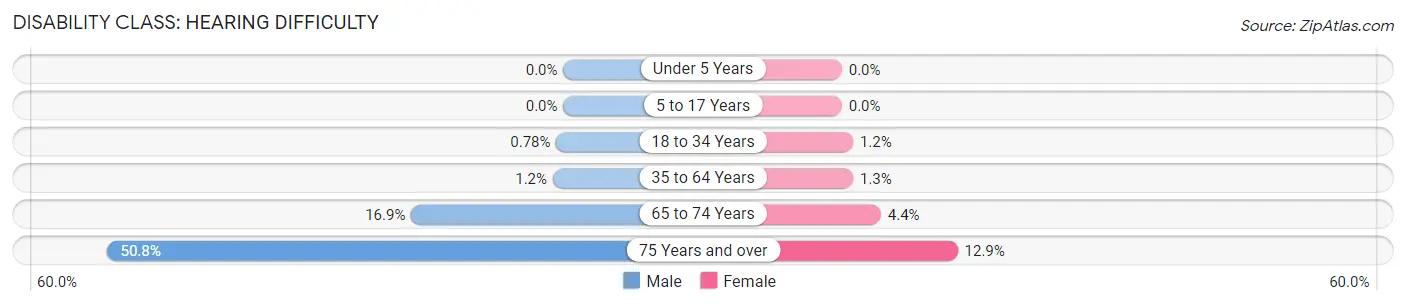
| Age Bracket | Male | Female |
| Under 5 Years | 0 (0.0%) | 0 (0.0%) |
| 5 to 17 Years | 0 (0.0%) | 0 (0.0%) |
| 18 to 34 Years | 6 (0.8%) | 11 (1.2%) |
| 35 to 64 Years | 28 (1.2%) | 31 (1.3%) |
| 65 to 74 Years | 84 (16.9%) | 27 (4.3%) |
| 75 Years and over | 100 (50.8%) | 32 (12.9%) |
Disability Class: Vision Difficulty
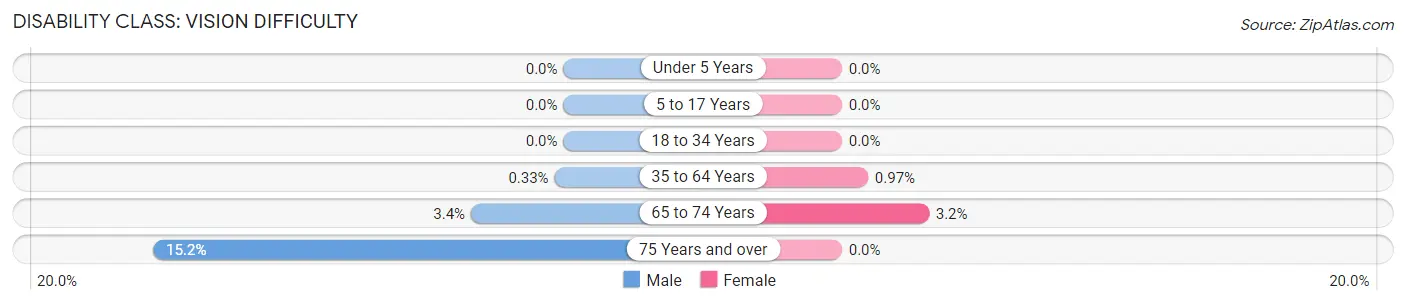
| Age Bracket | Male | Female |
| Under 5 Years | 0 (0.0%) | 0 (0.0%) |
| 5 to 17 Years | 0 (0.0%) | 0 (0.0%) |
| 18 to 34 Years | 0 (0.0%) | 0 (0.0%) |
| 35 to 64 Years | 8 (0.3%) | 24 (1.0%) |
| 65 to 74 Years | 17 (3.4%) | 20 (3.2%) |
| 75 Years and over | 30 (15.2%) | 0 (0.0%) |
Disability Class: Cognitive Difficulty
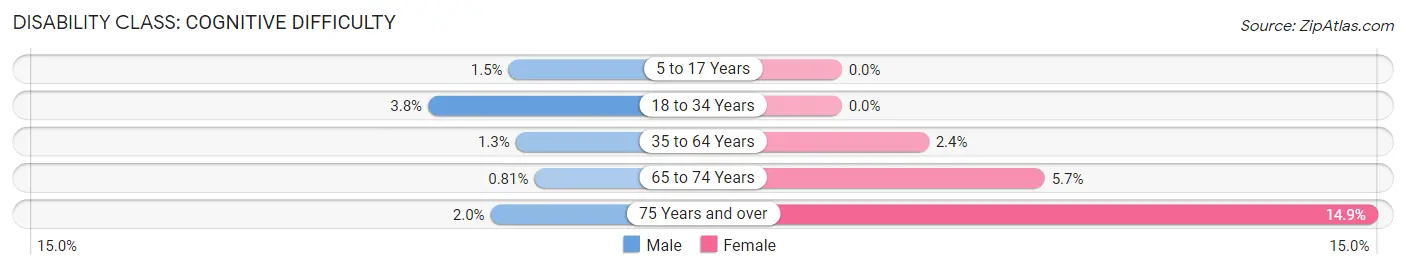
| Age Bracket | Male | Female |
| 5 to 17 Years | 21 (1.5%) | 0 (0.0%) |
| 18 to 34 Years | 29 (3.8%) | 0 (0.0%) |
| 35 to 64 Years | 32 (1.3%) | 60 (2.4%) |
| 65 to 74 Years | 4 (0.8%) | 35 (5.7%) |
| 75 Years and over | 4 (2.0%) | 37 (14.9%) |
Disability Class: Ambulatory Difficulty
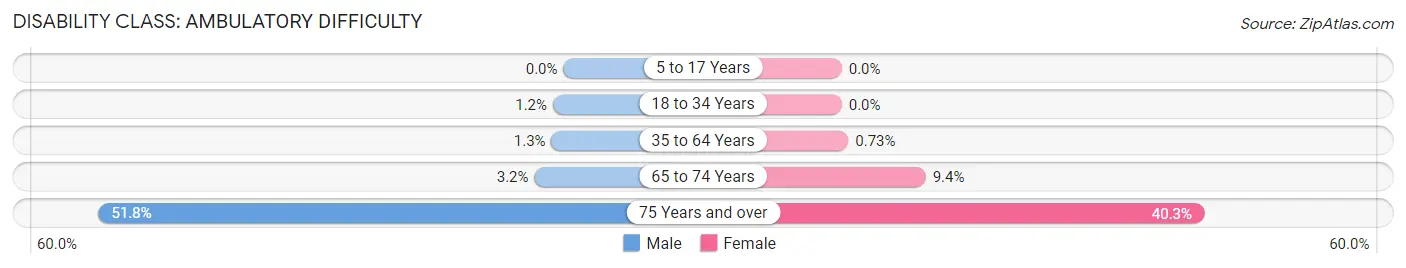
| Age Bracket | Male | Female |
| 5 to 17 Years | 0 (0.0%) | 0 (0.0%) |
| 18 to 34 Years | 9 (1.2%) | 0 (0.0%) |
| 35 to 64 Years | 32 (1.3%) | 18 (0.7%) |
| 65 to 74 Years | 16 (3.2%) | 58 (9.3%) |
| 75 Years and over | 102 (51.8%) | 100 (40.3%) |
Disability Class: Self-Care Difficulty
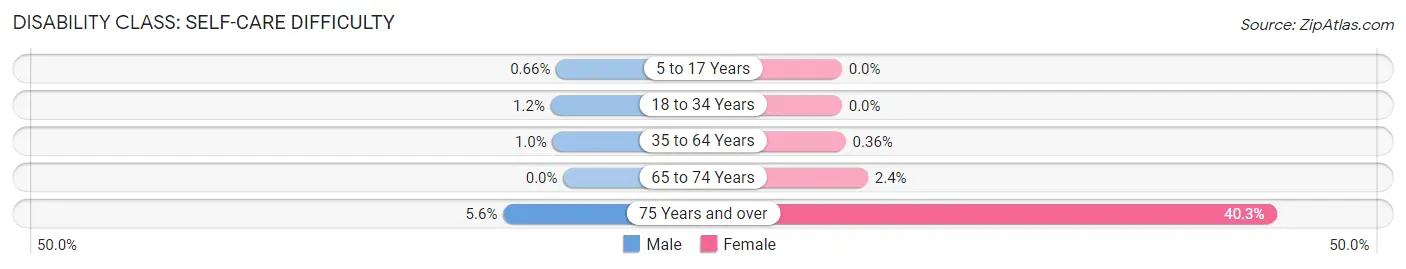
| Age Bracket | Male | Female |
| 5 to 17 Years | 9 (0.7%) | 0 (0.0%) |
| 18 to 34 Years | 9 (1.2%) | 0 (0.0%) |
| 35 to 64 Years | 24 (1.0%) | 9 (0.4%) |
| 65 to 74 Years | 0 (0.0%) | 15 (2.4%) |
| 75 Years and over | 11 (5.6%) | 100 (40.3%) |
Technology Access in Cherry Creek
Computing Device Access in Cherry Creek
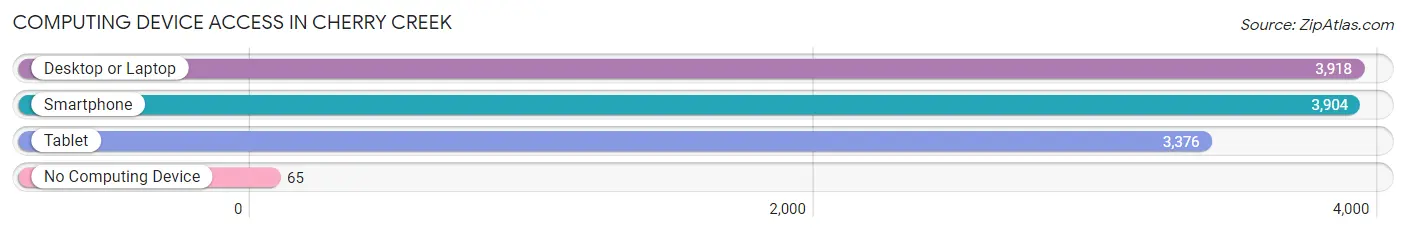
| Device Type | # Households | % Households |
| Desktop or Laptop | 3,918 | 95.4% |
| Smartphone | 3,904 | 95.1% |
| Tablet | 3,376 | 82.2% |
| No Computing Device | 65 | 1.6% |
| Total | 4,105 | 100.0% |
Internet Access in Cherry Creek
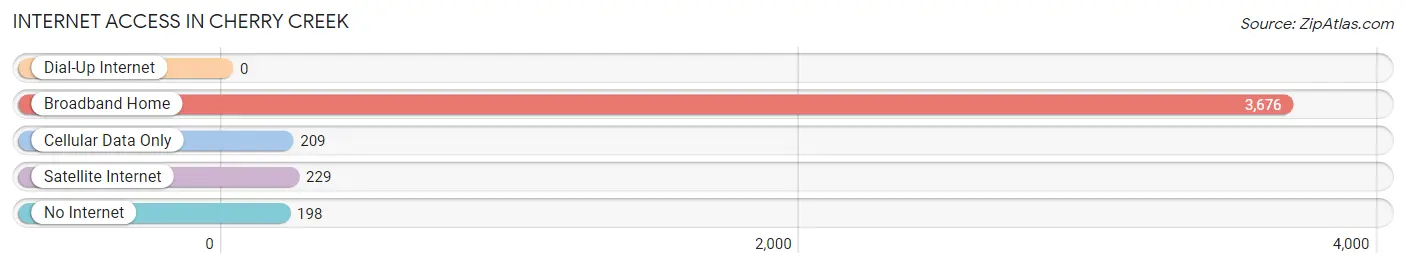
| Internet Type | # Households | % Households |
| Dial-Up Internet | 0 | 0.0% |
| Broadband Home | 3,676 | 89.5% |
| Cellular Data Only | 209 | 5.1% |
| Satellite Internet | 229 | 5.6% |
| No Internet | 198 | 4.8% |
| Total | 4,105 | 100.0% |
Cherry Creek Summary
Cherry Creek is a neighborhood in Denver, Colorado, located in the southeastern part of the city. It is bordered by the neighborhoods of Glendale, Hilltop, and Washington Park to the north, University Hills to the east, and the city of Greenwood Village to the south. The area is known for its upscale shopping, dining, and entertainment, as well as its high-end residential neighborhoods.
History
The area now known as Cherry Creek was originally inhabited by the Arapaho and Cheyenne Native American tribes. The first European settlers arrived in the area in the late 1800s, and the area was officially incorporated as the town of Cherry Creek in 1887. The town was named after the nearby Cherry Creek, which was named for the wild cherry trees that grew along its banks.
In the early 1900s, the area began to develop as a residential neighborhood, with many of the homes being built in the popular Victorian style. The area also became a popular destination for Denver's wealthy, who built large estates in the area.
In the 1950s, the area began to transition from a residential neighborhood to a commercial and retail center. The Cherry Creek Shopping Center opened in 1956, and the area quickly became a popular destination for shopping and dining.
Geography
Cherry Creek is located in the southeastern part of Denver, Colorado. It is bordered by the neighborhoods of Glendale, Hilltop, and Washington Park to the north, University Hills to the east, and the city of Greenwood Village to the south. The area is located in the South Platte River Valley, and is situated at an elevation of 5,280 feet above sea level.
Economy
Cherry Creek is home to a variety of businesses, including retail stores, restaurants, and professional services. The area is also home to several corporate headquarters, including the headquarters of the Coors Brewing Company, the Denver Broncos, and the Denver Nuggets.
The area is also home to the Cherry Creek Shopping Center, which is one of the largest shopping centers in the Denver area. The shopping center is home to over 160 stores, including high-end retailers such as Neiman Marcus, Saks Fifth Avenue, and Nordstrom.
Demographics
As of the 2010 census, the population of Cherry Creek was 8,945. The racial makeup of the area was 79.3% White, 8.2% African American, 0.3% Native American, 5.2% Asian, 0.1% Pacific Islander, 4.2% from other races, and 2.9% from two or more races. Hispanic or Latino of any race were 11.3% of the population.
The median household income in Cherry Creek was $90,845, and the median family income was $103,945. The per capita income for the area was $50,945. The unemployment rate in Cherry Creek was 3.2%, compared to the national average of 5.2%.
Common Questions
What is Per Capita Income in Cherry Creek?
Per Capita income in Cherry Creek is $83,229.
What is the Median Family Income in Cherry Creek?
Median Family Income in Cherry Creek is $196,798.
What is the Median Household income in Cherry Creek?
Median Household Income in Cherry Creek is $146,583.
What is Income or Wage Gap in Cherry Creek?
Income or Wage Gap in Cherry Creek is 54.4%.
Women in Cherry Creek earn 45.6 cents for every dollar earned by a man.
What is Inequality or Gini Index in Cherry Creek?
Inequality or Gini Index in Cherry Creek is 0.51.
What is the Total Population of Cherry Creek?
Total Population of Cherry Creek is 11,157.
What is the Total Male Population of Cherry Creek?
Total Male Population of Cherry Creek is 5,517.
What is the Total Female Population of Cherry Creek?
Total Female Population of Cherry Creek is 5,640.
What is the Ratio of Males per 100 Females in Cherry Creek?
There are 97.82 Males per 100 Females in Cherry Creek.
What is the Ratio of Females per 100 Males in Cherry Creek?
There are 102.23 Females per 100 Males in Cherry Creek.
What is the Median Population Age in Cherry Creek?
Median Population Age in Cherry Creek is 42.6 Years.
What is the Average Family Size in Cherry Creek
Average Family Size in Cherry Creek is 3.2 People.
What is the Average Household Size in Cherry Creek
Average Household Size in Cherry Creek is 2.7 People.
How Large is the Labor Force in Cherry Creek?
There are 6,081 People in the Labor Forcein in Cherry Creek.
What is the Percentage of People in the Labor Force in Cherry Creek?
70.1% of People are in the Labor Force in Cherry Creek.
What is the Unemployment Rate in Cherry Creek?
Unemployment Rate in Cherry Creek is 4.4%.