Lazy Acres, CO Map & Demographics
Lazy Acres Map
Lazy Acres Overview
$93,383
PER CAPITA INCOME
$139,583
AVG FAMILY INCOME
$150,927
AVG HOUSEHOLD INCOME
40.4%
WAGE / INCOME GAP [ % ]
59.6¢/ $1
WAGE / INCOME GAP [ $ ]
0.53
INEQUALITY / GINI INDEX
1,014
TOTAL POPULATION
511
MALE POPULATION
503
FEMALE POPULATION
101.59
MALES / 100 FEMALES
98.43
FEMALES / 100 MALES
56.7
MEDIAN AGE
2.2
AVG FAMILY SIZE
2.1
AVG HOUSEHOLD SIZE
494
LABOR FORCE [ PEOPLE ]
54.9%
PERCENT IN LABOR FORCE
3.8%
UNEMPLOYMENT RATE
Income in Lazy Acres
Income Overview in Lazy Acres
Per Capita Income in Lazy Acres is $93,383, while median incomes of families and households are $139,583 and $150,927 respectively.
| Characteristic | Number | Measure |
| Per Capita Income | 1,014 | $93,383 |
| Median Family Income | 386 | $139,583 |
| Mean Family Income | 386 | $223,824 |
| Median Household Income | 479 | $150,927 |
| Mean Household Income | 479 | $208,371 |
| Income Deficit | 386 | $0 |
| Wage / Income Gap (%) | 1,014 | 40.43% |
| Wage / Income Gap ($) | 1,014 | 59.57¢ per $1 |
| Gini / Inequality Index | 1,014 | 0.53 |
Earnings by Sex in Lazy Acres
Average Earnings in Lazy Acres are $49,412, $58,750 for men and $35,000 for women, a difference of 40.4%.
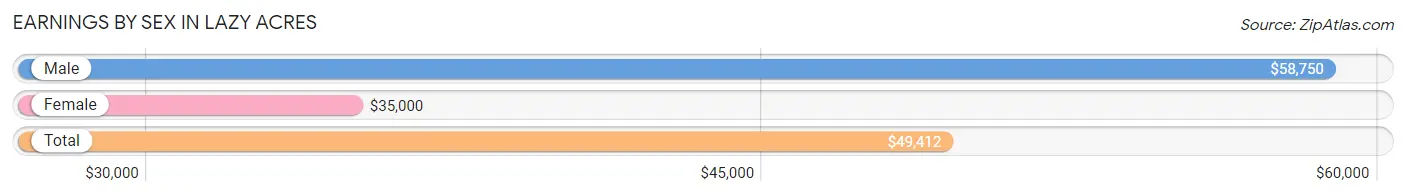
| Sex | Number | Average Earnings |
| Male | 272 (49.3%) | $58,750 |
| Female | 280 (50.7%) | $35,000 |
| Total | 552 (100.0%) | $49,412 |
Earnings by Sex by Income Bracket in Lazy Acres
The most common earnings brackets in Lazy Acres are $100,000+ for men (98 | 36.0%) and $100,000+ for women (64 | 22.9%).
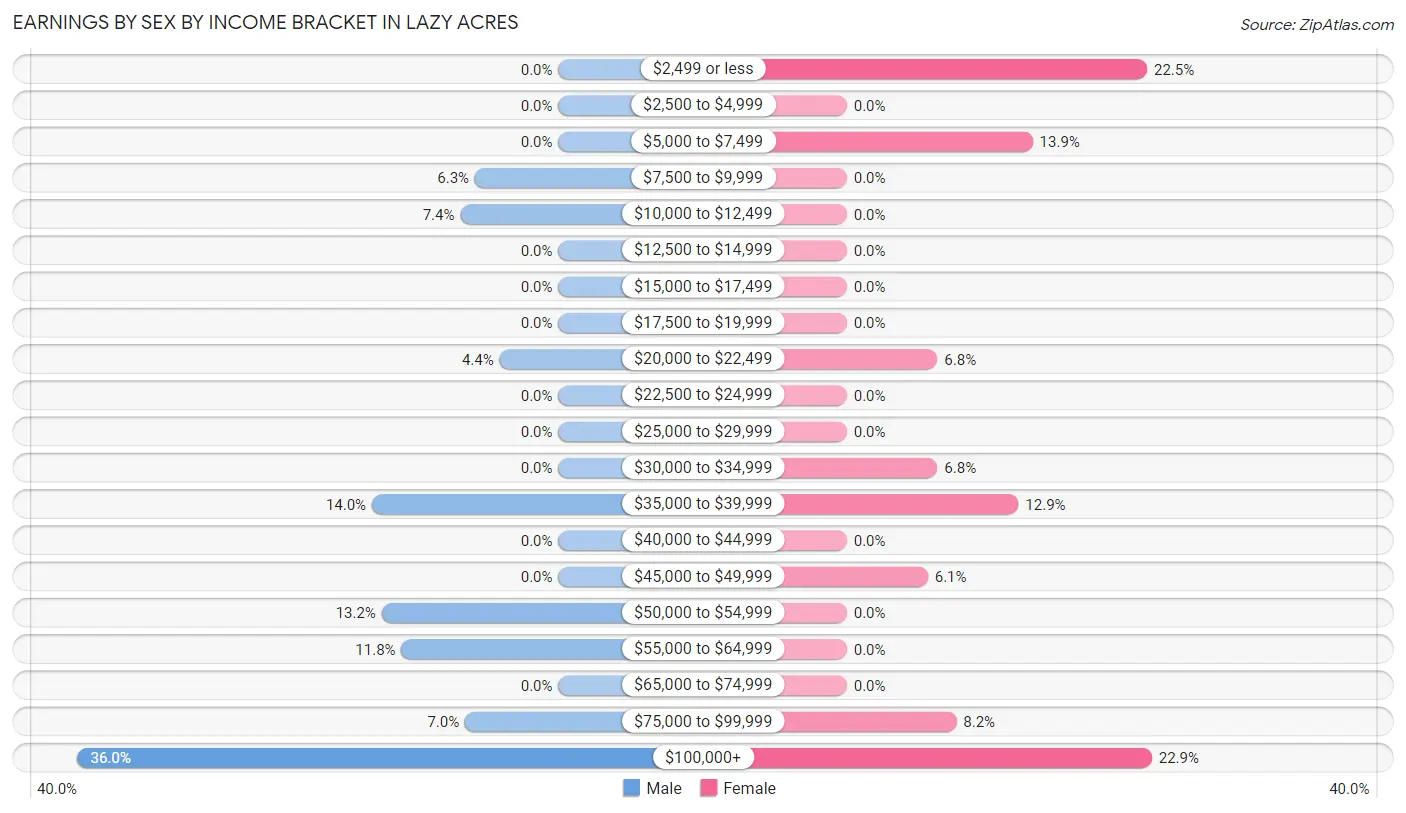
| Income | Male | Female |
| $2,499 or less | 0 (0.0%) | 63 (22.5%) |
| $2,500 to $4,999 | 0 (0.0%) | 0 (0.0%) |
| $5,000 to $7,499 | 0 (0.0%) | 39 (13.9%) |
| $7,500 to $9,999 | 17 (6.2%) | 0 (0.0%) |
| $10,000 to $12,499 | 20 (7.3%) | 0 (0.0%) |
| $12,500 to $14,999 | 0 (0.0%) | 0 (0.0%) |
| $15,000 to $17,499 | 0 (0.0%) | 0 (0.0%) |
| $17,500 to $19,999 | 0 (0.0%) | 0 (0.0%) |
| $20,000 to $22,499 | 12 (4.4%) | 19 (6.8%) |
| $22,500 to $24,999 | 0 (0.0%) | 0 (0.0%) |
| $25,000 to $29,999 | 0 (0.0%) | 0 (0.0%) |
| $30,000 to $34,999 | 0 (0.0%) | 19 (6.8%) |
| $35,000 to $39,999 | 38 (14.0%) | 36 (12.9%) |
| $40,000 to $44,999 | 0 (0.0%) | 0 (0.0%) |
| $45,000 to $49,999 | 0 (0.0%) | 17 (6.1%) |
| $50,000 to $54,999 | 36 (13.2%) | 0 (0.0%) |
| $55,000 to $64,999 | 32 (11.8%) | 0 (0.0%) |
| $65,000 to $74,999 | 0 (0.0%) | 0 (0.0%) |
| $75,000 to $99,999 | 19 (7.0%) | 23 (8.2%) |
| $100,000+ | 98 (36.0%) | 64 (22.9%) |
| Total | 272 (100.0%) | 280 (100.0%) |
Earnings by Sex by Educational Attainment in Lazy Acres
| Educational Attainment | Male Income | Female Income |
| Less than High School | - | - |
| High School Diploma | - | - |
| College or Associate's Degree | - | - |
| Bachelor's Degree | - | - |
| Graduate Degree | - | - |
| Total | - | - |
Family Income in Lazy Acres
Family Income Brackets in Lazy Acres
According to the Lazy Acres family income data, there are 116 families falling into the $200,000+ income range, which is the most common income bracket and makes up 30.0% of all families.
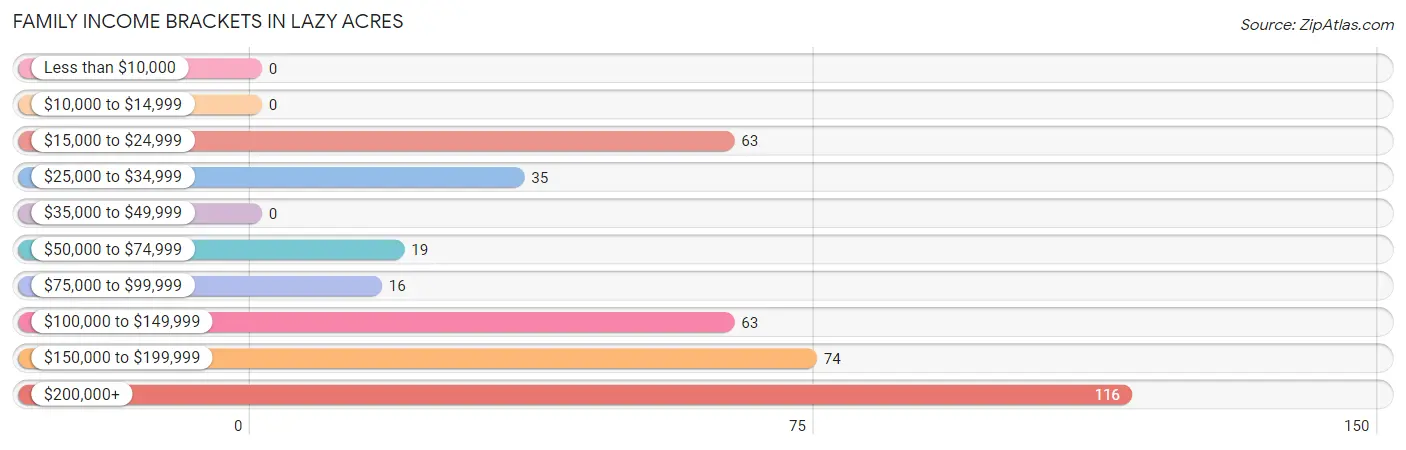
| Income Bracket | # Families | % Families |
| Less than $10,000 | 0 | 0.0% |
| $10,000 to $14,999 | 0 | 0.0% |
| $15,000 to $24,999 | 63 | 16.3% |
| $25,000 to $34,999 | 35 | 9.1% |
| $35,000 to $49,999 | 0 | 0.0% |
| $50,000 to $74,999 | 19 | 4.9% |
| $75,000 to $99,999 | 16 | 4.1% |
| $100,000 to $149,999 | 63 | 16.3% |
| $150,000 to $199,999 | 74 | 19.2% |
| $200,000+ | 116 | 30.1% |
Family Income by Famaliy Size in Lazy Acres
2-person families (335 | 86.8%) account for the highest median family income in Lazy Acres with $101,917 per family, while 2-person families (335 | 86.8%) have the highest median income of $50,958 per family member.
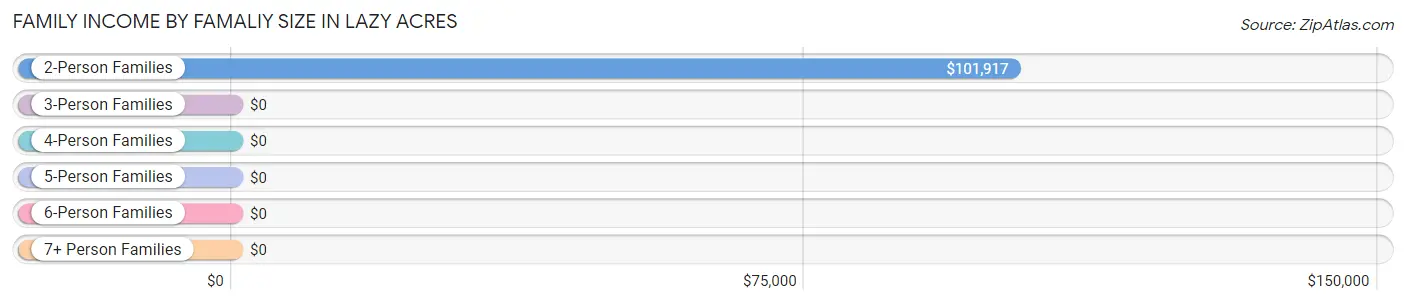
| Income Bracket | # Families | Median Income |
| 2-Person Families | 335 (86.8%) | $101,917 |
| 3-Person Families | 17 (4.4%) | $0 |
| 4-Person Families | 34 (8.8%) | $0 |
| 5-Person Families | 0 (0.0%) | $0 |
| 6-Person Families | 0 (0.0%) | $0 |
| 7+ Person Families | 0 (0.0%) | $0 |
| Total | 386 (100.0%) | $139,583 |
Family Income by Number of Earners in Lazy Acres
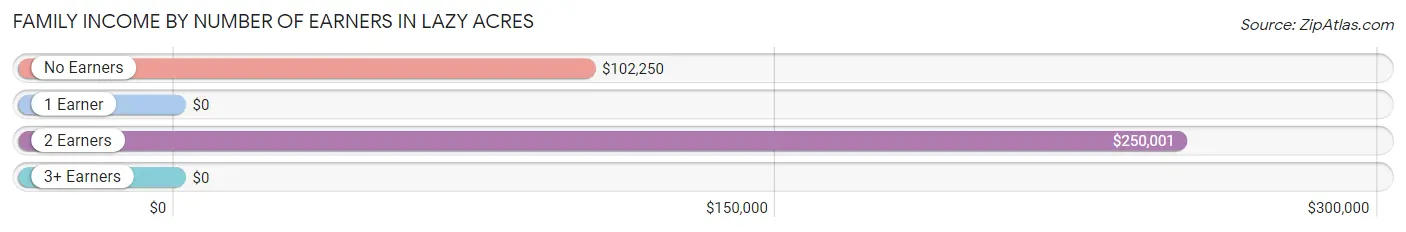
| Number of Earners | # Families | Median Income |
| No Earners | 111 (28.8%) | $102,250 |
| 1 Earner | 93 (24.1%) | $0 |
| 2 Earners | 169 (43.8%) | $250,001 |
| 3+ Earners | 13 (3.4%) | $0 |
| Total | 386 (100.0%) | $139,583 |
Household Income in Lazy Acres
Household Income Brackets in Lazy Acres
With 131 households falling in the category, the $200,000+ income range is the most frequent in Lazy Acres, accounting for 27.4% of all households.
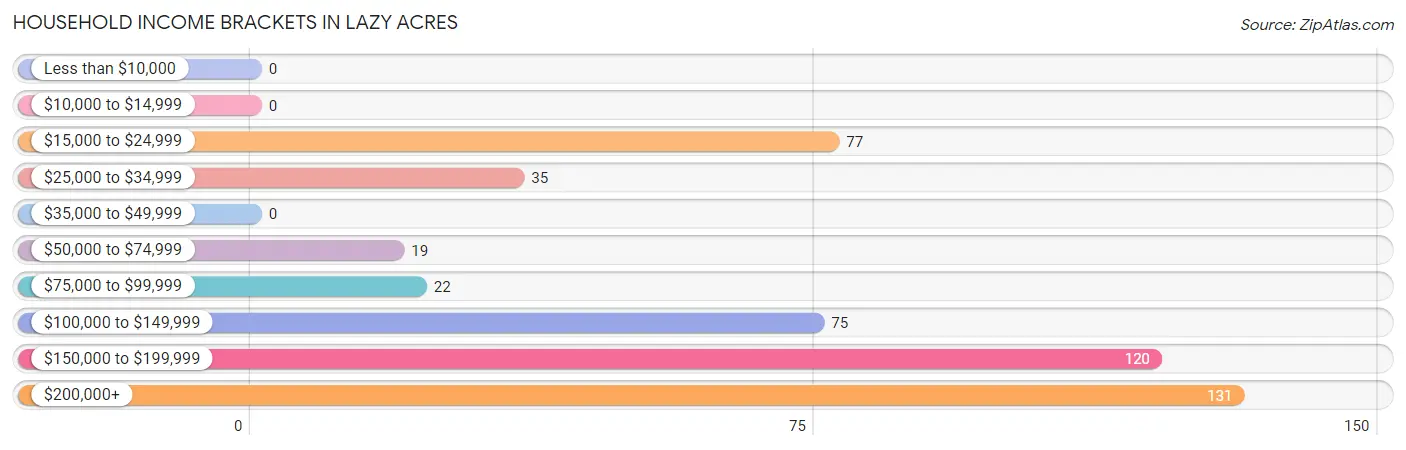
| Income Bracket | # Households | % Households |
| Less than $10,000 | 0 | 0.0% |
| $10,000 to $14,999 | 0 | 0.0% |
| $15,000 to $24,999 | 77 | 16.1% |
| $25,000 to $34,999 | 35 | 7.3% |
| $35,000 to $49,999 | 0 | 0.0% |
| $50,000 to $74,999 | 19 | 4.0% |
| $75,000 to $99,999 | 22 | 4.6% |
| $100,000 to $149,999 | 75 | 15.7% |
| $150,000 to $199,999 | 120 | 25.1% |
| $200,000+ | 131 | 27.3% |
Household Income by Householder Age in Lazy Acres
The median household income in Lazy Acres is $150,927, with the highest median household income of $250,001 found in the 25 to 44 years age bracket for the primary householder. A total of 76 households (15.9%) fall into this category.
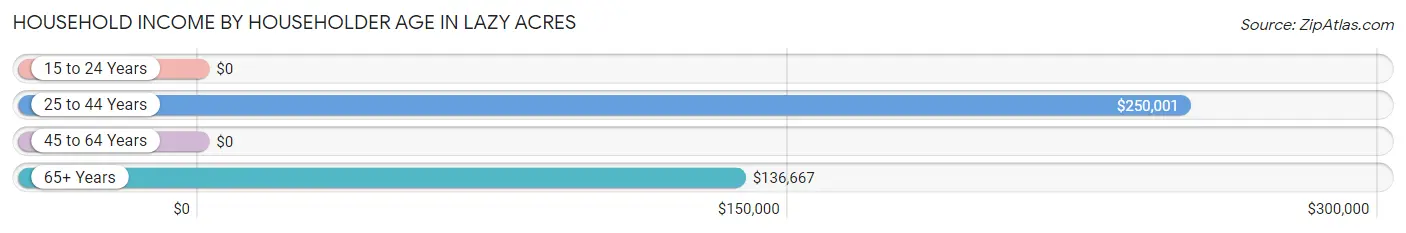
| Income Bracket | # Households | Median Income |
| 15 to 24 Years | 0 (0.0%) | $0 |
| 25 to 44 Years | 76 (15.9%) | $250,001 |
| 45 to 64 Years | 225 (47.0%) | $0 |
| 65+ Years | 178 (37.2%) | $136,667 |
| Total | 479 (100.0%) | $150,927 |
Poverty in Lazy Acres
Income Below Poverty by Sex and Age in Lazy Acres
With 14.3% poverty level for males and 12.5% for females among the residents of Lazy Acres, 6 to 11 year old males and 45 to 54 year old females are the most vulnerable to poverty, with 49 males (56.3%) and 63 females (70.0%) in their respective age groups living below the poverty level.
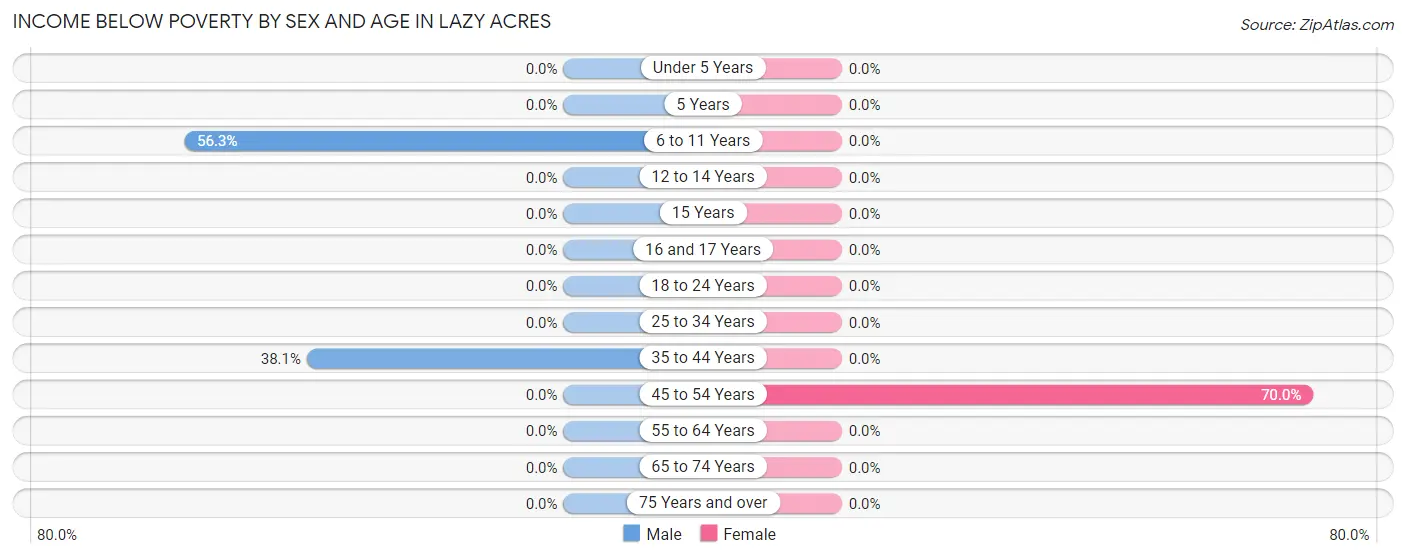
| Age Bracket | Male | Female |
| Under 5 Years | 0 (0.0%) | 0 (0.0%) |
| 5 Years | 0 (0.0%) | 0 (0.0%) |
| 6 to 11 Years | 49 (56.3%) | 0 (0.0%) |
| 12 to 14 Years | 0 (0.0%) | 0 (0.0%) |
| 15 Years | 0 (0.0%) | 0 (0.0%) |
| 16 and 17 Years | 0 (0.0%) | 0 (0.0%) |
| 18 to 24 Years | 0 (0.0%) | 0 (0.0%) |
| 25 to 34 Years | 0 (0.0%) | 0 (0.0%) |
| 35 to 44 Years | 24 (38.1%) | 0 (0.0%) |
| 45 to 54 Years | 0 (0.0%) | 63 (70.0%) |
| 55 to 64 Years | 0 (0.0%) | 0 (0.0%) |
| 65 to 74 Years | 0 (0.0%) | 0 (0.0%) |
| 75 Years and over | 0 (0.0%) | 0 (0.0%) |
| Total | 73 (14.3%) | 63 (12.5%) |
Income Above Poverty by Sex and Age in Lazy Acres
According to the poverty statistics in Lazy Acres, males aged under 5 years and females aged 6 to 11 years are the age groups that are most secure financially, with 100.0% of males and 100.0% of females in these age groups living above the poverty line.
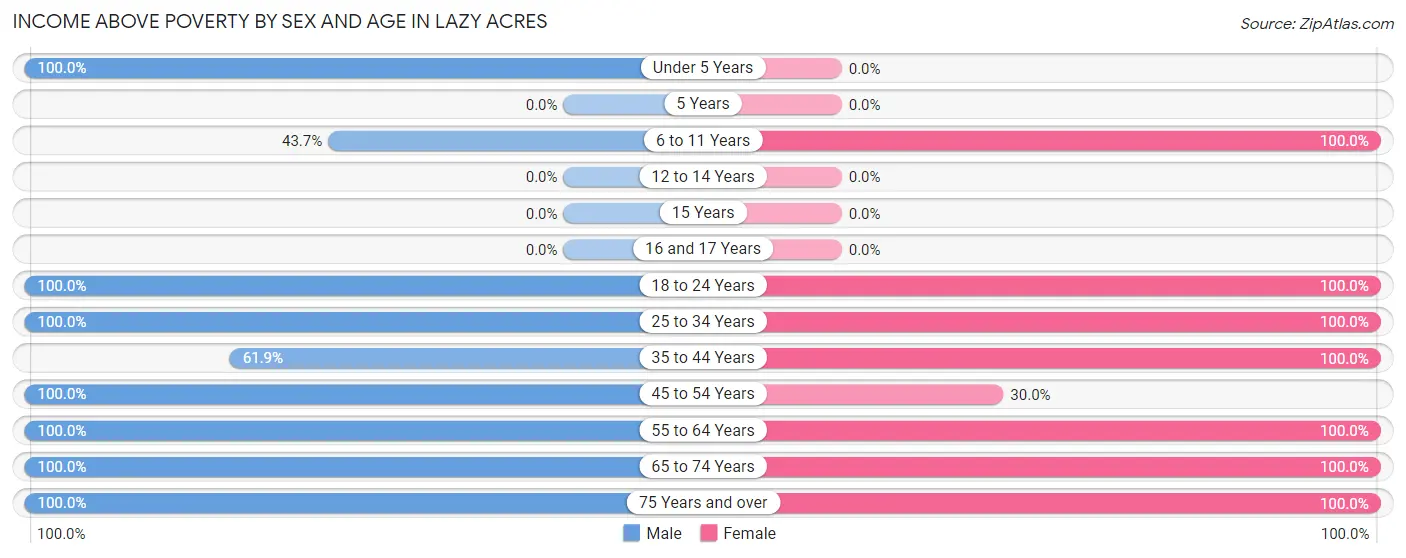
| Age Bracket | Male | Female |
| Under 5 Years | 19 (100.0%) | 0 (0.0%) |
| 5 Years | 0 (0.0%) | 0 (0.0%) |
| 6 to 11 Years | 38 (43.7%) | 9 (100.0%) |
| 12 to 14 Years | 0 (0.0%) | 0 (0.0%) |
| 15 Years | 0 (0.0%) | 0 (0.0%) |
| 16 and 17 Years | 0 (0.0%) | 0 (0.0%) |
| 18 to 24 Years | 37 (100.0%) | 26 (100.0%) |
| 25 to 34 Years | 27 (100.0%) | 40 (100.0%) |
| 35 to 44 Years | 39 (61.9%) | 37 (100.0%) |
| 45 to 54 Years | 19 (100.0%) | 27 (30.0%) |
| 55 to 64 Years | 134 (100.0%) | 117 (100.0%) |
| 65 to 74 Years | 98 (100.0%) | 108 (100.0%) |
| 75 Years and over | 27 (100.0%) | 76 (100.0%) |
| Total | 438 (85.7%) | 440 (87.5%) |
Income Below Poverty Among Married-Couple Families in Lazy Acres
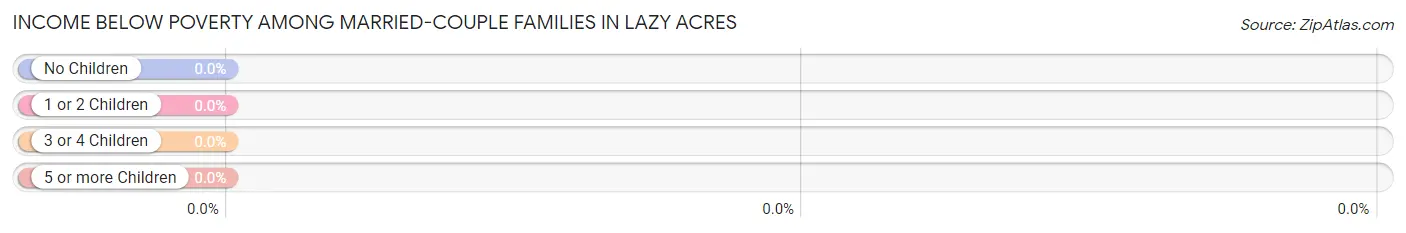
| Children | Above Poverty | Below Poverty |
| No Children | 275 (100.0%) | 0 (0.0%) |
| 1 or 2 Children | 38 (100.0%) | 0 (0.0%) |
| 3 or 4 Children | 0 (0.0%) | 0 (0.0%) |
| 5 or more Children | 0 (0.0%) | 0 (0.0%) |
| Total | 313 (100.0%) | 0 (0.0%) |
Income Below Poverty Among Single-Parent Households in Lazy Acres
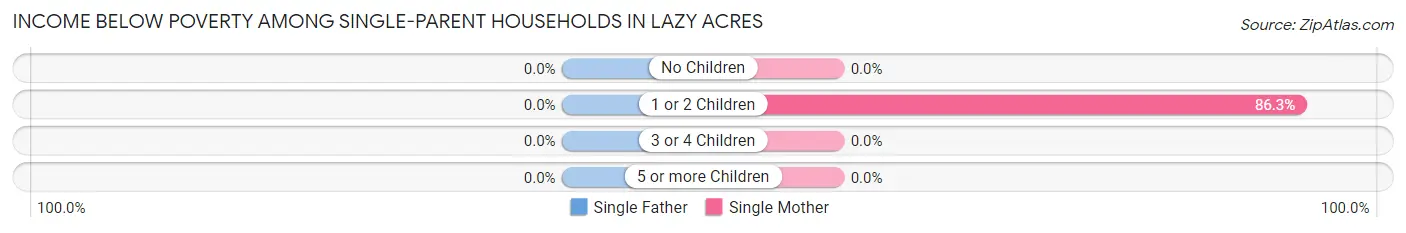
| Children | Single Father | Single Mother |
| No Children | 0 (0.0%) | 0 (0.0%) |
| 1 or 2 Children | 0 (0.0%) | 63 (86.3%) |
| 3 or 4 Children | 0 (0.0%) | 0 (0.0%) |
| 5 or more Children | 0 (0.0%) | 0 (0.0%) |
| Total | 0 (0.0%) | 63 (86.3%) |
Income Below Poverty Among Married-Couple vs Single-Parent Households in Lazy Acres
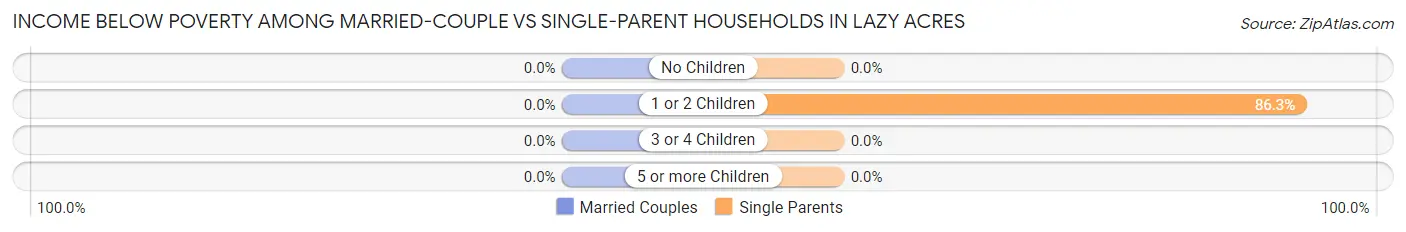
| Children | Married-Couple Families | Single-Parent Households |
| No Children | 0 (0.0%) | 0 (0.0%) |
| 1 or 2 Children | 0 (0.0%) | 63 (86.3%) |
| 3 or 4 Children | 0 (0.0%) | 0 (0.0%) |
| 5 or more Children | 0 (0.0%) | 0 (0.0%) |
| Total | 0 (0.0%) | 63 (86.3%) |
Race in Lazy Acres
The most populous races in Lazy Acres are White / Caucasian (1,014 | 100.0%), and Hispanic or Latino (11 | 1.1%).
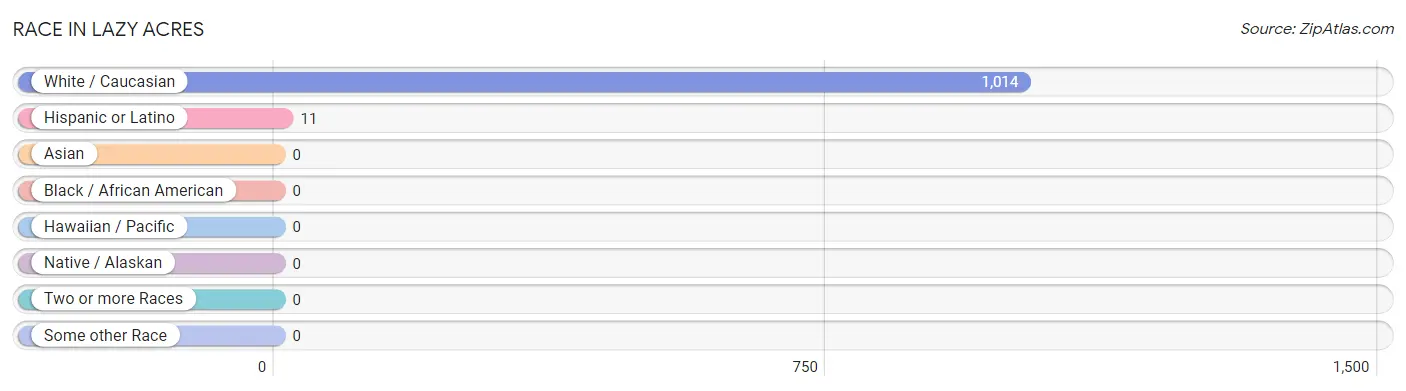
| Race | # Population | % Population |
| Asian | 0 | 0.0% |
| Black / African American | 0 | 0.0% |
| Hawaiian / Pacific | 0 | 0.0% |
| Hispanic or Latino | 11 | 1.1% |
| Native / Alaskan | 0 | 0.0% |
| White / Caucasian | 1,014 | 100.0% |
| Two or more Races | 0 | 0.0% |
| Some other Race | 0 | 0.0% |
| Total | 1,014 | 100.0% |
Ancestry in Lazy Acres
The most populous ancestries reported in Lazy Acres are English (233 | 23.0%), German (227 | 22.4%), Polish (131 | 12.9%), Irish (101 | 10.0%), and Russian (100 | 9.9%), together accounting for 78.1% of all Lazy Acres residents.
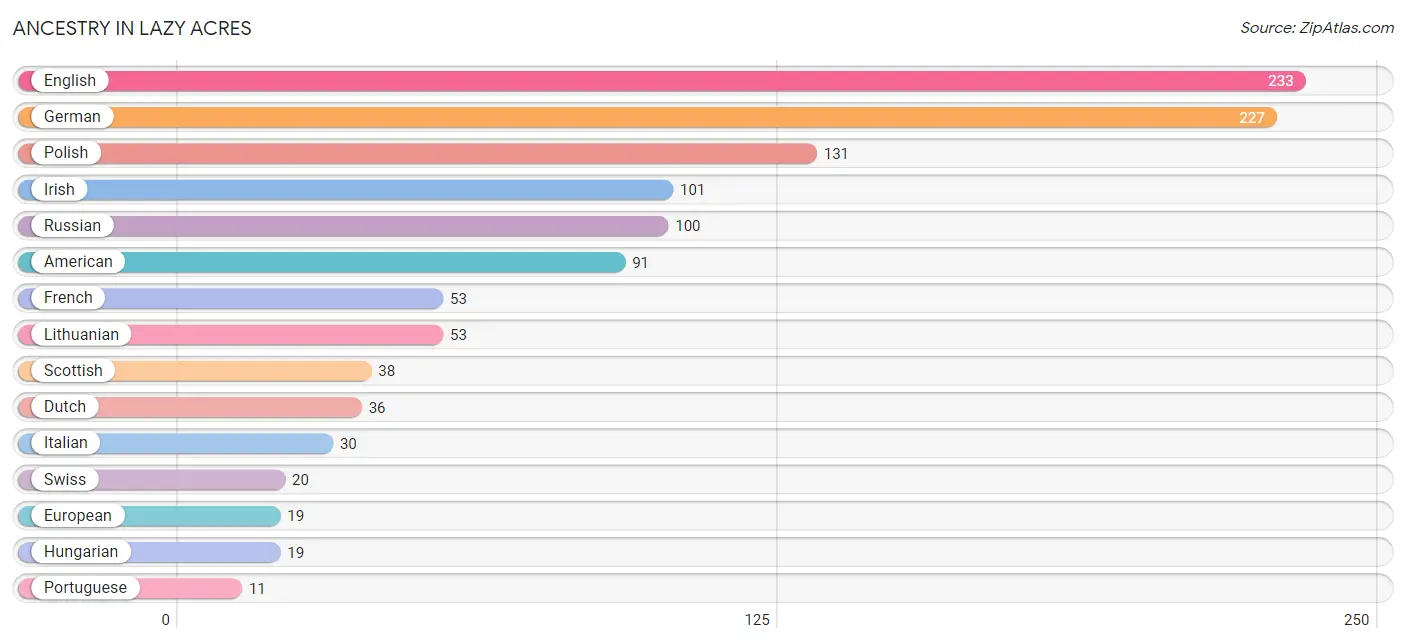
| Ancestry | # Population | % Population |
| American | 91 | 9.0% |
| Dutch | 36 | 3.5% |
| English | 233 | 23.0% |
| European | 19 | 1.9% |
| French | 53 | 5.2% |
| German | 227 | 22.4% |
| Hungarian | 19 | 1.9% |
| Irish | 101 | 10.0% |
| Italian | 30 | 3.0% |
| Lithuanian | 53 | 5.2% |
| Polish | 131 | 12.9% |
| Portuguese | 11 | 1.1% |
| Russian | 100 | 9.9% |
| Scottish | 38 | 3.7% |
| South American | 11 | 1.1% |
| Swiss | 20 | 2.0% |
| Uruguayan | 11 | 1.1% | View All 17 Rows |
Immigrants in Lazy Acres
The most numerous immigrant groups reported in Lazy Acres came from Eastern Europe (24 | 2.4%), Europe (24 | 2.4%), Russia (24 | 2.4%), Latin America (21 | 2.1%), and Canada (18 | 1.8%), together accounting for 11.0% of all Lazy Acres residents.
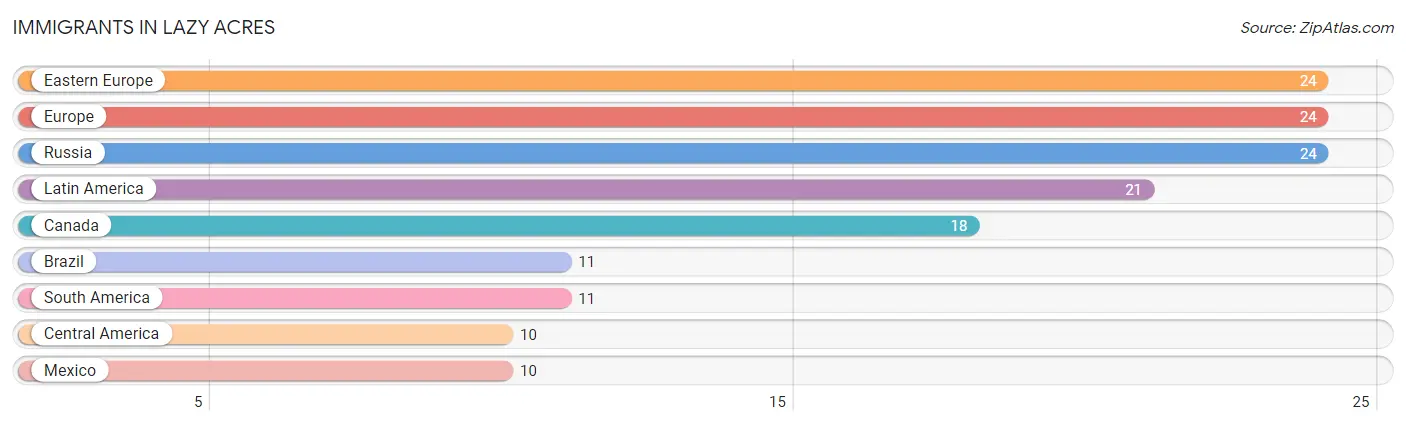
| Immigration Origin | # Population | % Population |
| Brazil | 11 | 1.1% |
| Canada | 18 | 1.8% |
| Central America | 10 | 1.0% |
| Eastern Europe | 24 | 2.4% |
| Europe | 24 | 2.4% |
| Latin America | 21 | 2.1% |
| Mexico | 10 | 1.0% |
| Russia | 24 | 2.4% |
| South America | 11 | 1.1% | View All 9 Rows |
Sex and Age in Lazy Acres
Sex and Age in Lazy Acres
The most populous age groups in Lazy Acres are 65 to 69 Years (98 | 19.2%) for men and 55 to 59 Years (89 | 17.7%) for women.
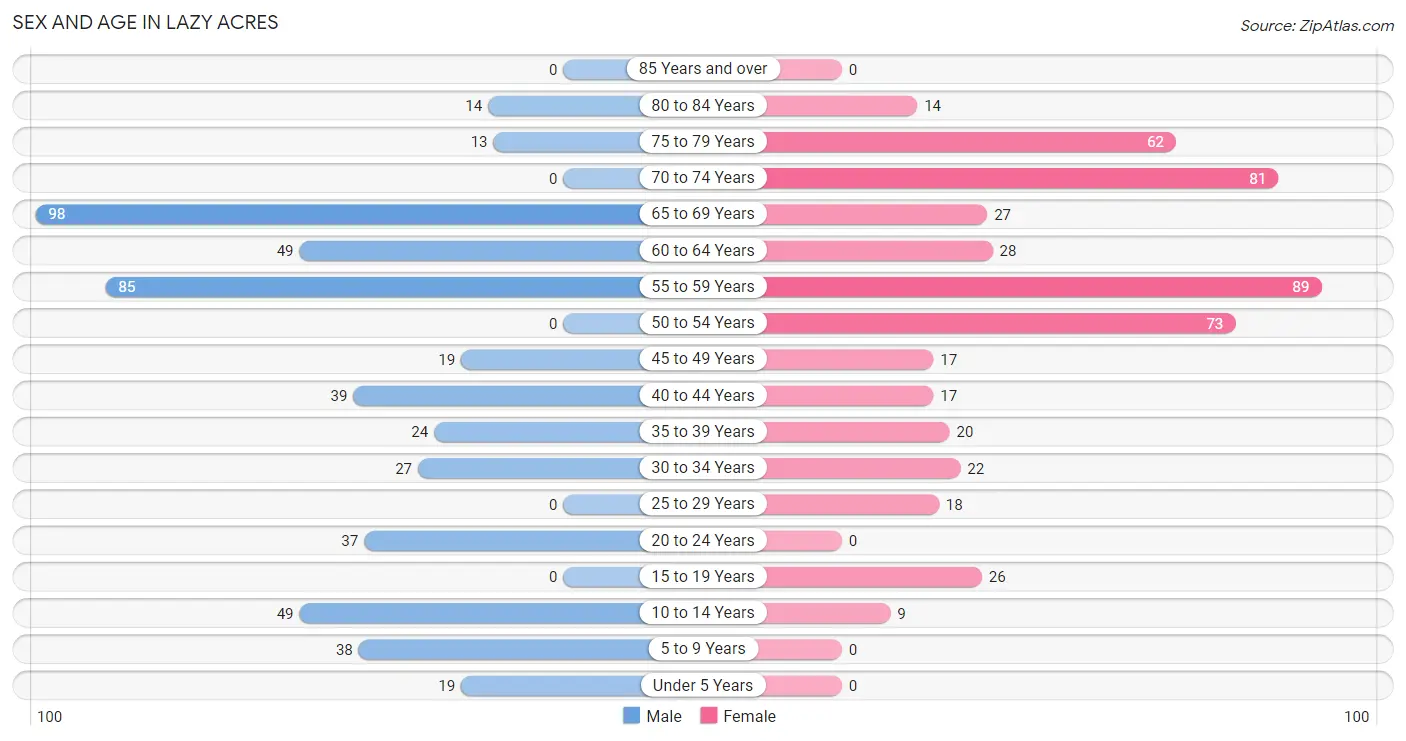
| Age Bracket | Male | Female |
| Under 5 Years | 19 (3.7%) | 0 (0.0%) |
| 5 to 9 Years | 38 (7.4%) | 0 (0.0%) |
| 10 to 14 Years | 49 (9.6%) | 9 (1.8%) |
| 15 to 19 Years | 0 (0.0%) | 26 (5.2%) |
| 20 to 24 Years | 37 (7.2%) | 0 (0.0%) |
| 25 to 29 Years | 0 (0.0%) | 18 (3.6%) |
| 30 to 34 Years | 27 (5.3%) | 22 (4.4%) |
| 35 to 39 Years | 24 (4.7%) | 20 (4.0%) |
| 40 to 44 Years | 39 (7.6%) | 17 (3.4%) |
| 45 to 49 Years | 19 (3.7%) | 17 (3.4%) |
| 50 to 54 Years | 0 (0.0%) | 73 (14.5%) |
| 55 to 59 Years | 85 (16.6%) | 89 (17.7%) |
| 60 to 64 Years | 49 (9.6%) | 28 (5.6%) |
| 65 to 69 Years | 98 (19.2%) | 27 (5.4%) |
| 70 to 74 Years | 0 (0.0%) | 81 (16.1%) |
| 75 to 79 Years | 13 (2.5%) | 62 (12.3%) |
| 80 to 84 Years | 14 (2.7%) | 14 (2.8%) |
| 85 Years and over | 0 (0.0%) | 0 (0.0%) |
| Total | 511 (100.0%) | 503 (100.0%) |
Families and Households in Lazy Acres
Median Family Size in Lazy Acres
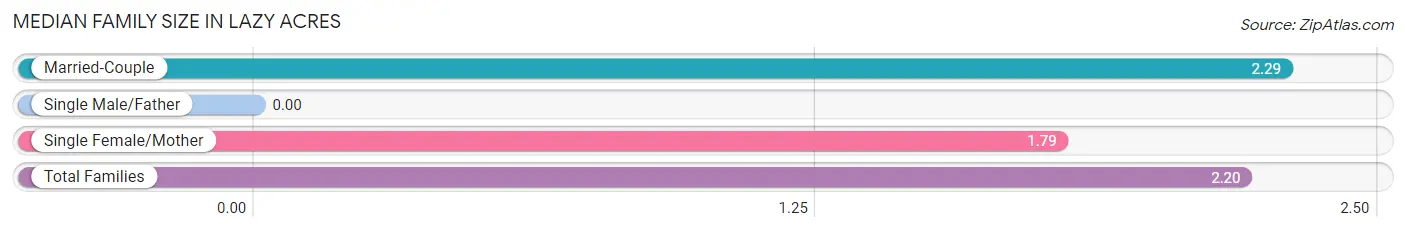
| Family Type | # Families | Family Size |
| Married-Couple | 313 (81.1%) | 2.29 |
| Single Male/Father | 0 (0.0%) | - |
| Single Female/Mother | 73 (18.9%) | 1.79 |
| Total Families | 386 (100.0%) | 2.20 |
Median Household Size in Lazy Acres
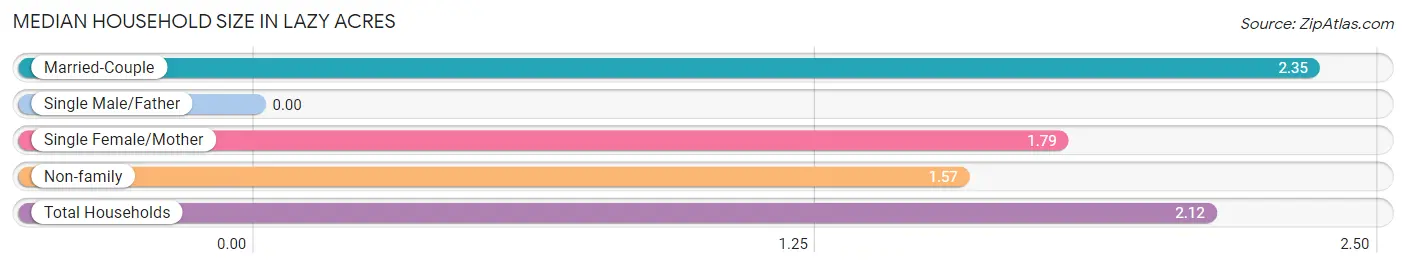
| Household Type | # Households | Household Size |
| Married-Couple | 313 (65.3%) | 2.35 |
| Single Male/Father | 0 (0.0%) | - |
| Single Female/Mother | 73 (15.2%) | 1.79 |
| Non-family | 93 (19.4%) | 1.57 |
| Total Households | 479 (100.0%) | 2.12 |
Household Size by Marriage Status in Lazy Acres
Out of a total of 479 households in Lazy Acres, 386 (80.6%) are family households, while 93 (19.4%) are nonfamily households. The most numerous type of family households are 2-person households, comprising 319, and the most common type of nonfamily households are 2-person households, comprising 53.
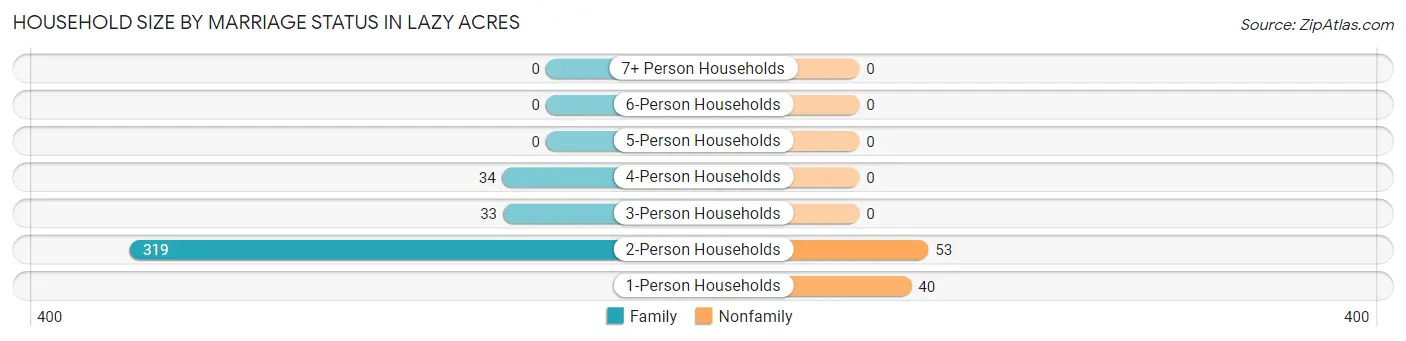
| Household Size | Family Households | Nonfamily Households |
| 1-Person Households | - | 40 (8.4%) |
| 2-Person Households | 319 (66.6%) | 53 (11.1%) |
| 3-Person Households | 33 (6.9%) | 0 (0.0%) |
| 4-Person Households | 34 (7.1%) | 0 (0.0%) |
| 5-Person Households | 0 (0.0%) | 0 (0.0%) |
| 6-Person Households | 0 (0.0%) | 0 (0.0%) |
| 7+ Person Households | 0 (0.0%) | 0 (0.0%) |
| Total | 386 (80.6%) | 93 (19.4%) |
Female Fertility in Lazy Acres
Fertility by Age in Lazy Acres
| Age Bracket | Women with Births | Births / 1,000 Women |
| 15 to 19 years | 0 (0.0%) | 0.0 |
| 20 to 34 years | 0 (0.0%) | 0.0 |
| 35 to 50 years | 0 (0.0%) | 0.0 |
| Total | 0 (0.0%) | 0.0 |
Fertility by Age by Marriage Status in Lazy Acres
| Age Bracket | Married | Unmarried |
| 15 to 19 years | 0 (0.0%) | 0 (0.0%) |
| 20 to 34 years | 0 (0.0%) | 0 (0.0%) |
| 35 to 50 years | 0 (0.0%) | 0 (0.0%) |
| Total | 0 (0.0%) | 0 (0.0%) |
Fertility by Education in Lazy Acres
| Educational Attainment | Women with Births | Births / 1,000 Women |
| Less than High School | 0 (0.0%) | 0.0 |
| High School Diploma | 0 (0.0%) | 0.0 |
| College or Associate's Degree | 0 (0.0%) | 0.0 |
| Bachelor's Degree | 0 (0.0%) | 0.0 |
| Graduate Degree | 0 (0.0%) | 0.0 |
| Total | 0 (0.0%) | 0.0 |
Fertility by Education by Marriage Status in Lazy Acres
| Educational Attainment | Married | Unmarried |
| Less than High School | 0 (0.0%) | 0 (0.0%) |
| High School Diploma | 0 (0.0%) | 0 (0.0%) |
| College or Associate's Degree | 0 (0.0%) | 0 (0.0%) |
| Bachelor's Degree | 0 (0.0%) | 0 (0.0%) |
| Graduate Degree | 0 (0.0%) | 0 (0.0%) |
| Total | 0 (0.0%) | 0 (0.0%) |
Employment Characteristics in Lazy Acres
Employment by Class of Employer in Lazy Acres
Among the 412 employed individuals in Lazy Acres, private company employees (205 | 49.8%), self-employed (incorporated) (90 | 21.8%), and self-employed (not incorporated) (58 | 14.1%) make up the most common classes of employment.
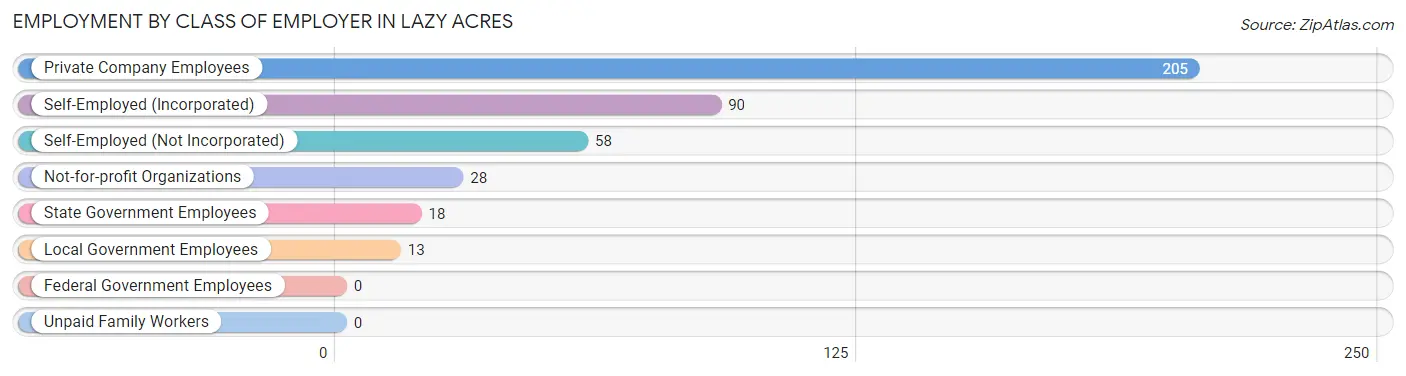
| Employer Class | # Employees | % Employees |
| Private Company Employees | 205 | 49.8% |
| Self-Employed (Incorporated) | 90 | 21.8% |
| Self-Employed (Not Incorporated) | 58 | 14.1% |
| Not-for-profit Organizations | 28 | 6.8% |
| Local Government Employees | 13 | 3.2% |
| State Government Employees | 18 | 4.4% |
| Federal Government Employees | 0 | 0.0% |
| Unpaid Family Workers | 0 | 0.0% |
| Total | 412 | 100.0% |
Employment Status by Age in Lazy Acres
According to the labor force statistics for Lazy Acres, out of the total population over 16 years of age (899), 54.9% or 494 individuals are in the labor force, with 3.8% or 19 of them unemployed. The age group with the highest labor force participation rate is 20 to 24 years, with 100.0% or 37 individuals in the labor force. Within the labor force, the 55 to 59 years age range has the highest percentage of unemployed individuals, with 15.7% or 19 of them being unemployed.
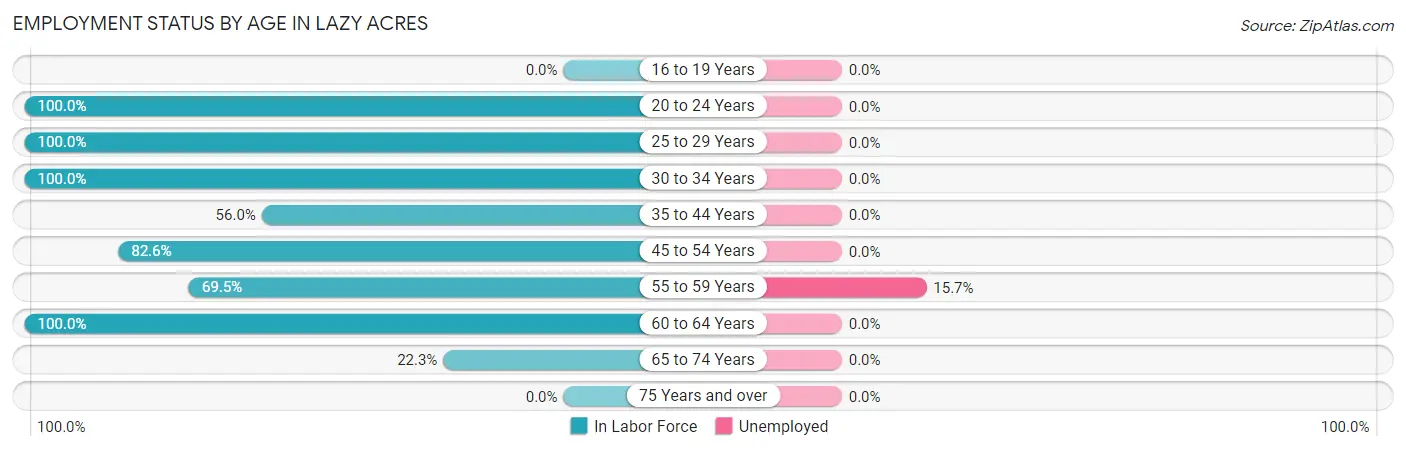
| Age Bracket | In Labor Force | Unemployed |
| 16 to 19 Years | 0 (0.0%) | 0 (0.0%) |
| 20 to 24 Years | 37 (100.0%) | 0 (0.0%) |
| 25 to 29 Years | 18 (100.0%) | 0 (0.0%) |
| 30 to 34 Years | 49 (100.0%) | 0 (0.0%) |
| 35 to 44 Years | 56 (56.0%) | 0 (0.0%) |
| 45 to 54 Years | 90 (82.6%) | 0 (0.0%) |
| 55 to 59 Years | 121 (69.5%) | 19 (15.7%) |
| 60 to 64 Years | 77 (100.0%) | 0 (0.0%) |
| 65 to 74 Years | 46 (22.3%) | 0 (0.0%) |
| 75 Years and over | 0 (0.0%) | 0 (0.0%) |
| Total | 494 (54.9%) | 19 (3.8%) |
Employment Status by Educational Attainment in Lazy Acres
According to labor force statistics for Lazy Acres, 78.0% of individuals (411) out of the total population between 25 and 64 years of age (527) are in the labor force, with 4.6% or 19 of them being unemployed. The group with the highest labor force participation rate are those with the educational attainment of bachelor's degree or higher, with 86.7% or 411 individuals in the labor force. Within the labor force, individuals with bachelor's degree or higher education have the highest percentage of unemployment, with 4.6% or 19 of them being unemployed.
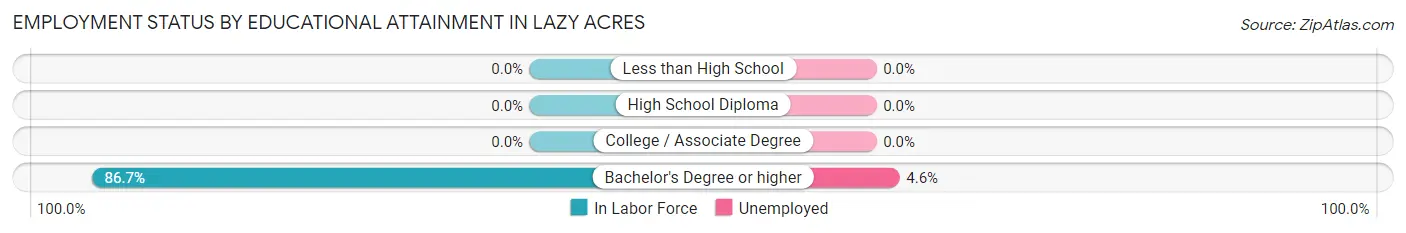
| Educational Attainment | In Labor Force | Unemployed |
| Less than High School | 0 (0.0%) | 0 (0.0%) |
| High School Diploma | 0 (0.0%) | 0 (0.0%) |
| College / Associate Degree | 0 (0.0%) | 0 (0.0%) |
| Bachelor's Degree or higher | 411 (86.7%) | 22 (4.6%) |
| Total | 411 (78.0%) | 24 (4.6%) |
Employment Occupations by Sex in Lazy Acres
Management, Business, Science and Arts Occupations
The most common Management, Business, Science and Arts occupations in Lazy Acres are Computers, Engineering & Science (131 | 27.6%), Management (82 | 17.3%), Computers & Mathematics (82 | 17.3%), Community & Social Service (67 | 14.1%), and Health Diagnosing & Treating (42 | 8.8%).
Management, Business, Science and Arts Occupations by Sex
Within the Management, Business, Science and Arts occupations in Lazy Acres, the most male-oriented occupations are Life, Physical & Social Science (100.0%), Arts, Media & Entertainment (100.0%), and Management (81.7%), while the most female-oriented occupations are Business & Financial (100.0%), Education, Arts & Media (100.0%), and Legal Services & Support (100.0%).
| Occupation | Male | Female |
| Management | 67 (81.7%) | 15 (18.3%) |
| Business & Financial | 0 (0.0%) | 37 (100.0%) |
| Computers, Engineering & Science | 80 (61.1%) | 51 (38.9%) |
| Computers & Mathematics | 48 (58.5%) | 34 (41.5%) |
| Architecture & Engineering | 13 (43.3%) | 17 (56.7%) |
| Life, Physical & Social Science | 19 (100.0%) | 0 (0.0%) |
| Community & Social Service | 20 (29.8%) | 47 (70.2%) |
| Education, Arts & Media | 0 (0.0%) | 19 (100.0%) |
| Legal Services & Support | 0 (0.0%) | 10 (100.0%) |
| Education Instruction & Library | 0 (0.0%) | 18 (100.0%) |
| Arts, Media & Entertainment | 20 (100.0%) | 0 (0.0%) |
| Health Diagnosing & Treating | 31 (73.8%) | 11 (26.2%) |
| Health Technologists | 31 (73.8%) | 11 (26.2%) |
| Total (Category) | 198 (55.1%) | 161 (44.9%) |
| Total (Overall) | 234 (49.3%) | 241 (50.7%) |
Services Occupations
The most common Services occupations in Lazy Acres are Personal Care & Service (63 | 13.3%), and Healthcare Support (17 | 3.6%).
Services Occupations by Sex
| Occupation | Male | Female |
| Healthcare Support | 0 (0.0%) | 17 (100.0%) |
| Security & Protection | 0 (0.0%) | 0 (0.0%) |
| Firefighting & Prevention | 0 (0.0%) | 0 (0.0%) |
| Law Enforcement | 0 (0.0%) | 0 (0.0%) |
| Food Preparation & Serving | 0 (0.0%) | 0 (0.0%) |
| Cleaning & Maintenance | 0 (0.0%) | 0 (0.0%) |
| Personal Care & Service | 0 (0.0%) | 63 (100.0%) |
| Total (Category) | 0 (0.0%) | 80 (100.0%) |
| Total (Overall) | 234 (49.3%) | 241 (50.7%) |
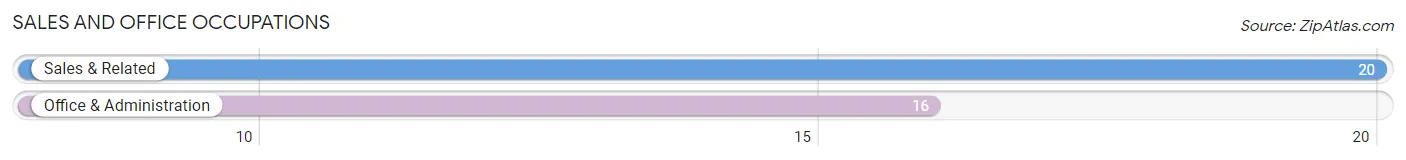
Sales and Office Occupations
The most common Sales and Office occupations in Lazy Acres are Sales & Related (20 | 4.2%), and Office & Administration (16 | 3.4%).
Sales and Office Occupations by Sex
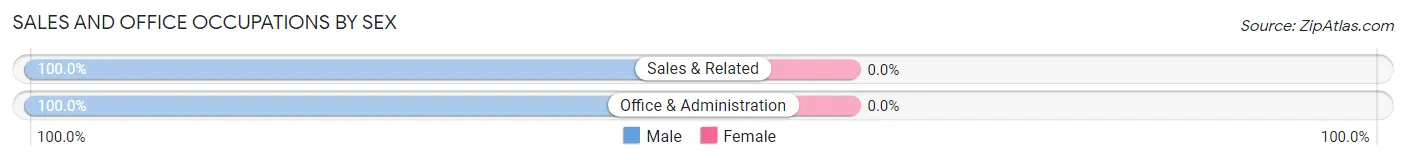
| Occupation | Male | Female |
| Sales & Related | 20 (100.0%) | 0 (0.0%) |
| Office & Administration | 16 (100.0%) | 0 (0.0%) |
| Total (Category) | 36 (100.0%) | 0 (0.0%) |
| Total (Overall) | 234 (49.3%) | 241 (50.7%) |
Natural Resources, Construction and Maintenance Occupations
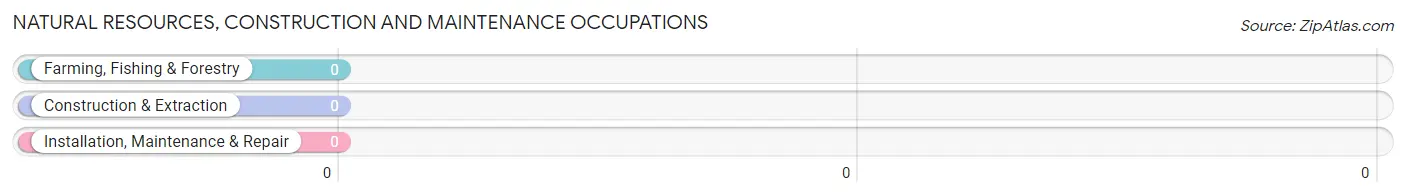
Natural Resources, Construction and Maintenance Occupations by Sex
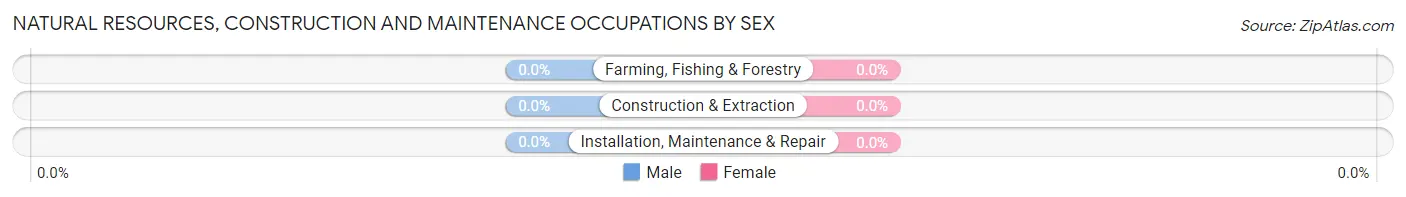
| Occupation | Male | Female |
| Farming, Fishing & Forestry | 0 (0.0%) | 0 (0.0%) |
| Construction & Extraction | 0 (0.0%) | 0 (0.0%) |
| Installation, Maintenance & Repair | 0 (0.0%) | 0 (0.0%) |
| Total (Category) | 0 (0.0%) | 0 (0.0%) |
| Total (Overall) | 234 (49.3%) | 241 (50.7%) |
Production, Transportation and Moving Occupations
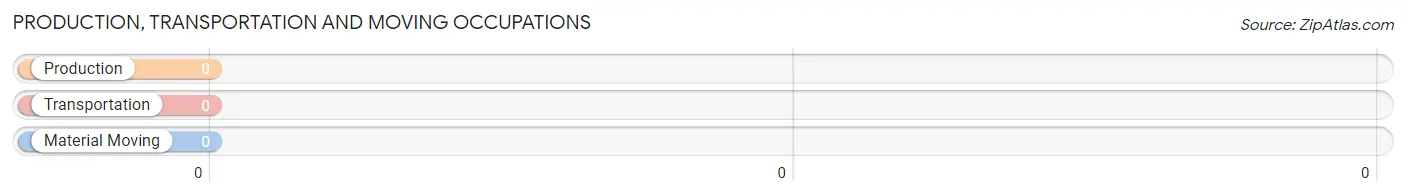
Production, Transportation and Moving Occupations by Sex
| Occupation | Male | Female |
| Production | 0 (0.0%) | 0 (0.0%) |
| Transportation | 0 (0.0%) | 0 (0.0%) |
| Material Moving | 0 (0.0%) | 0 (0.0%) |
| Total (Category) | 0 (0.0%) | 0 (0.0%) |
| Total (Overall) | 234 (49.3%) | 241 (50.7%) |
Employment Industries by Sex in Lazy Acres
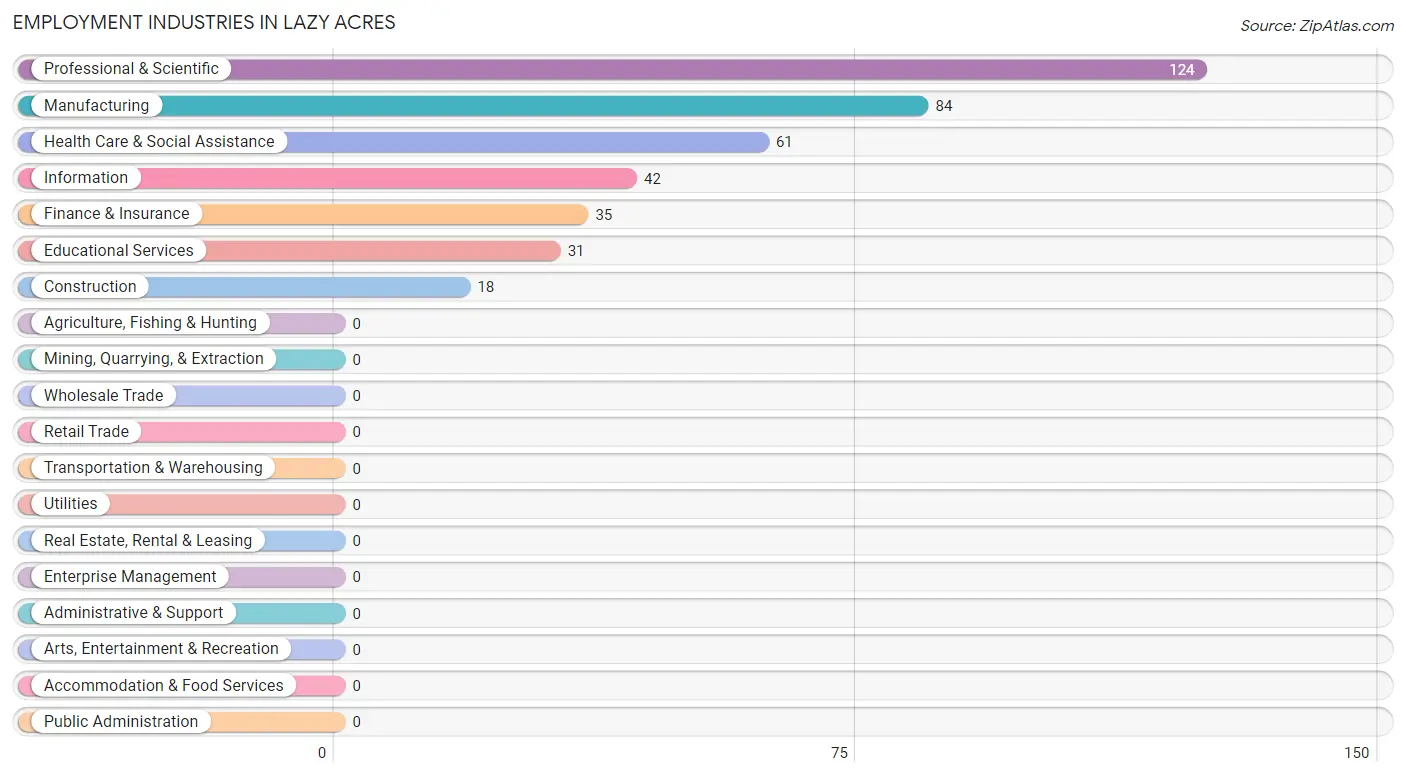
Employment Industries in Lazy Acres
The major employment industries in Lazy Acres include Professional & Scientific (124 | 26.1%), Manufacturing (84 | 17.7%), Health Care & Social Assistance (61 | 12.8%), Information (42 | 8.8%), and Finance & Insurance (35 | 7.4%).
Employment Industries by Sex in Lazy Acres
The Lazy Acres industries that see more men than women are Construction (100.0%), Manufacturing (88.1%), and Information (73.8%), whereas the industries that tend to have a higher number of women are Educational Services (100.0%), Professional & Scientific (51.6%), and Health Care & Social Assistance (49.2%).
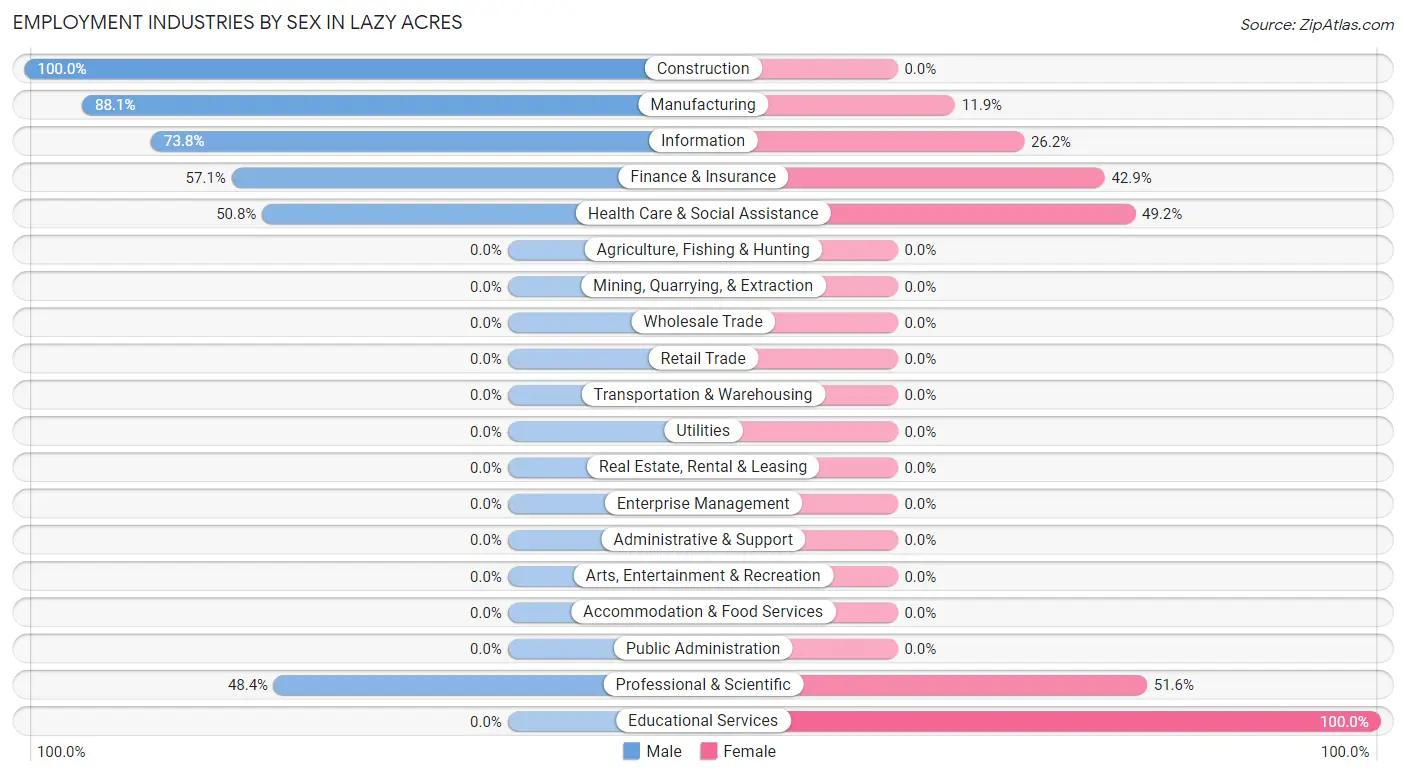
| Industry | Male | Female |
| Agriculture, Fishing & Hunting | 0 (0.0%) | 0 (0.0%) |
| Mining, Quarrying, & Extraction | 0 (0.0%) | 0 (0.0%) |
| Construction | 18 (100.0%) | 0 (0.0%) |
| Manufacturing | 74 (88.1%) | 10 (11.9%) |
| Wholesale Trade | 0 (0.0%) | 0 (0.0%) |
| Retail Trade | 0 (0.0%) | 0 (0.0%) |
| Transportation & Warehousing | 0 (0.0%) | 0 (0.0%) |
| Utilities | 0 (0.0%) | 0 (0.0%) |
| Information | 31 (73.8%) | 11 (26.2%) |
| Finance & Insurance | 20 (57.1%) | 15 (42.9%) |
| Real Estate, Rental & Leasing | 0 (0.0%) | 0 (0.0%) |
| Professional & Scientific | 60 (48.4%) | 64 (51.6%) |
| Enterprise Management | 0 (0.0%) | 0 (0.0%) |
| Administrative & Support | 0 (0.0%) | 0 (0.0%) |
| Educational Services | 0 (0.0%) | 31 (100.0%) |
| Health Care & Social Assistance | 31 (50.8%) | 30 (49.2%) |
| Arts, Entertainment & Recreation | 0 (0.0%) | 0 (0.0%) |
| Accommodation & Food Services | 0 (0.0%) | 0 (0.0%) |
| Public Administration | 0 (0.0%) | 0 (0.0%) |
| Total | 234 (49.3%) | 241 (50.7%) |
Education in Lazy Acres
School Enrollment in Lazy Acres
The most common levels of schooling among the 176 students in Lazy Acres are middle school (58 | 33.0%), college / undergraduate (43 | 24.4%), and graduate / professional (37 | 21.0%).
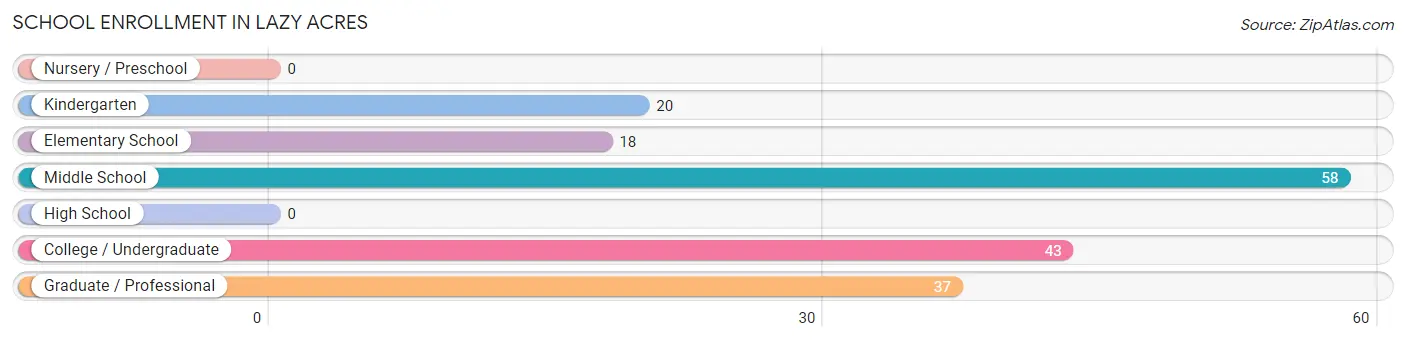
| School Level | # Students | % Students |
| Nursery / Preschool | 0 | 0.0% |
| Kindergarten | 20 | 11.4% |
| Elementary School | 18 | 10.2% |
| Middle School | 58 | 33.0% |
| High School | 0 | 0.0% |
| College / Undergraduate | 43 | 24.4% |
| Graduate / Professional | 37 | 21.0% |
| Total | 176 | 100.0% |
School Enrollment by Age by Funding Source in Lazy Acres
Out of a total of 176 students who are enrolled in schools in Lazy Acres, 81 (46.0%) attend a private institution, while the remaining 95 (54.0%) are enrolled in public schools. The age group of 5 to 9 year old has the highest likelihood of being enrolled in private schools, with 38 (100.0% in the age bracket) enrolled. Conversely, the age group of 10 to 14 year olds has the lowest likelihood of being enrolled in a private school, with 58 (100.0% in the age bracket) attending a public institution.
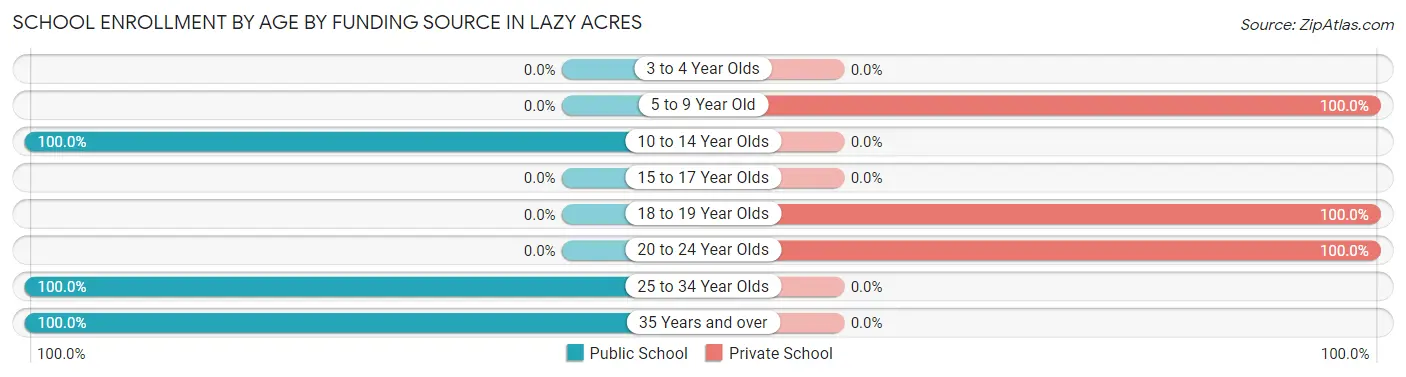
| Age Bracket | Public School | Private School |
| 3 to 4 Year Olds | 0 (0.0%) | 0 (0.0%) |
| 5 to 9 Year Old | 0 (0.0%) | 38 (100.0%) |
| 10 to 14 Year Olds | 58 (100.0%) | 0 (0.0%) |
| 15 to 17 Year Olds | 0 (0.0%) | 0 (0.0%) |
| 18 to 19 Year Olds | 0 (0.0%) | 26 (100.0%) |
| 20 to 24 Year Olds | 0 (0.0%) | 17 (100.0%) |
| 25 to 34 Year Olds | 18 (100.0%) | 0 (0.0%) |
| 35 Years and over | 19 (100.0%) | 0 (0.0%) |
| Total | 95 (54.0%) | 81 (46.0%) |
Educational Attainment by Field of Study in Lazy Acres
Business (130 | 17.1%), bio, nature & agricultural (121 | 15.9%), literature & languages (84 | 11.0%), physical & health sciences (78 | 10.2%), and science & technology (77 | 10.1%) are the most common fields of study among 761 individuals in Lazy Acres who have obtained a bachelor's degree or higher.
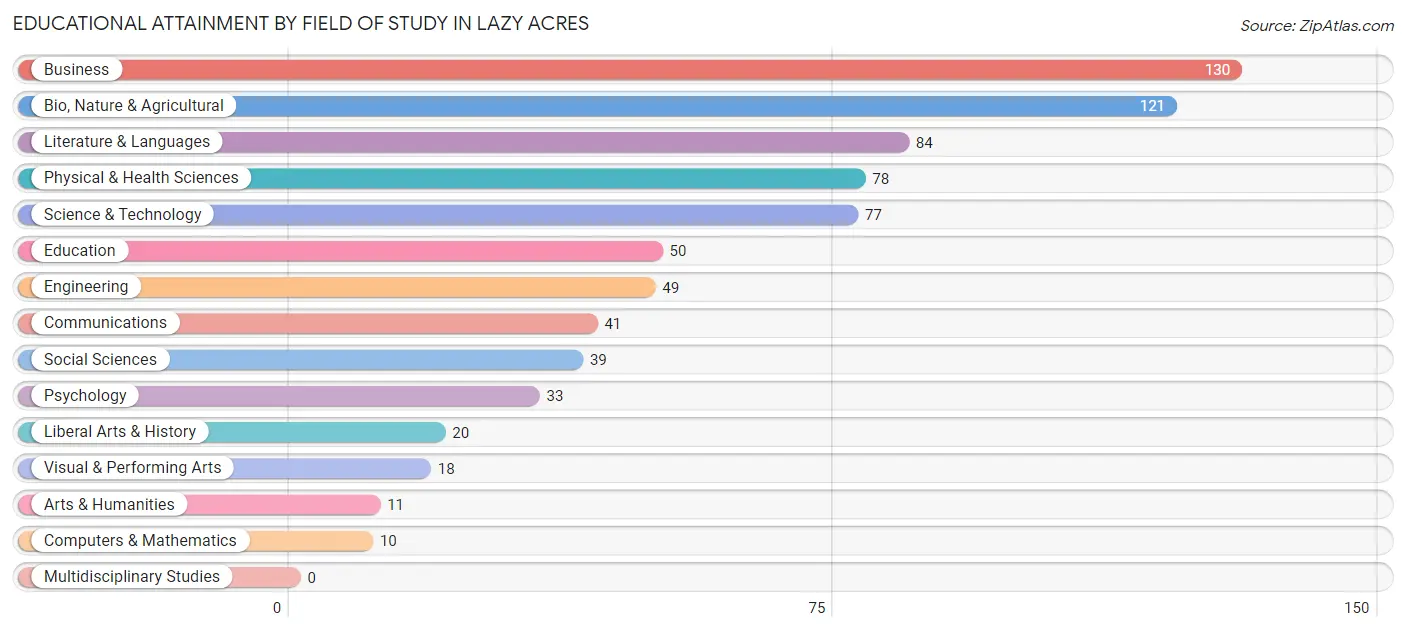
| Field of Study | # Graduates | % Graduates |
| Computers & Mathematics | 10 | 1.3% |
| Bio, Nature & Agricultural | 121 | 15.9% |
| Physical & Health Sciences | 78 | 10.2% |
| Psychology | 33 | 4.3% |
| Social Sciences | 39 | 5.1% |
| Engineering | 49 | 6.4% |
| Multidisciplinary Studies | 0 | 0.0% |
| Science & Technology | 77 | 10.1% |
| Business | 130 | 17.1% |
| Education | 50 | 6.6% |
| Literature & Languages | 84 | 11.0% |
| Liberal Arts & History | 20 | 2.6% |
| Visual & Performing Arts | 18 | 2.4% |
| Communications | 41 | 5.4% |
| Arts & Humanities | 11 | 1.5% |
| Total | 761 | 100.0% |
Transportation & Commute in Lazy Acres
Vehicle Availability by Sex in Lazy Acres
The most prevalent vehicle ownership categories in Lazy Acres are males with 2 vehicles (108, accounting for 46.2%) and females with 2 vehicles (80, making up 60.7%).
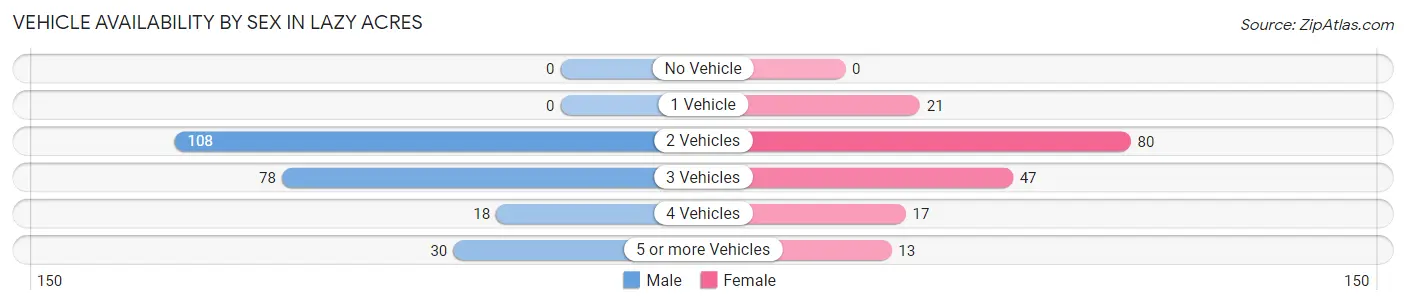
| Vehicles Available | Male | Female |
| No Vehicle | 0 (0.0%) | 0 (0.0%) |
| 1 Vehicle | 0 (0.0%) | 21 (11.8%) |
| 2 Vehicles | 108 (46.2%) | 80 (44.9%) |
| 3 Vehicles | 78 (33.3%) | 47 (26.4%) |
| 4 Vehicles | 18 (7.7%) | 17 (9.6%) |
| 5 or more Vehicles | 30 (12.8%) | 13 (7.3%) |
| Total | 234 (100.0%) | 178 (100.0%) |
Commute Time in Lazy Acres
The most frequently occuring commute durations in Lazy Acres are 20 to 24 minutes (179 commuters, 65.1%), 30 to 34 minutes (41 commuters, 14.9%), and 35 to 39 minutes (22 commuters, 8.0%).
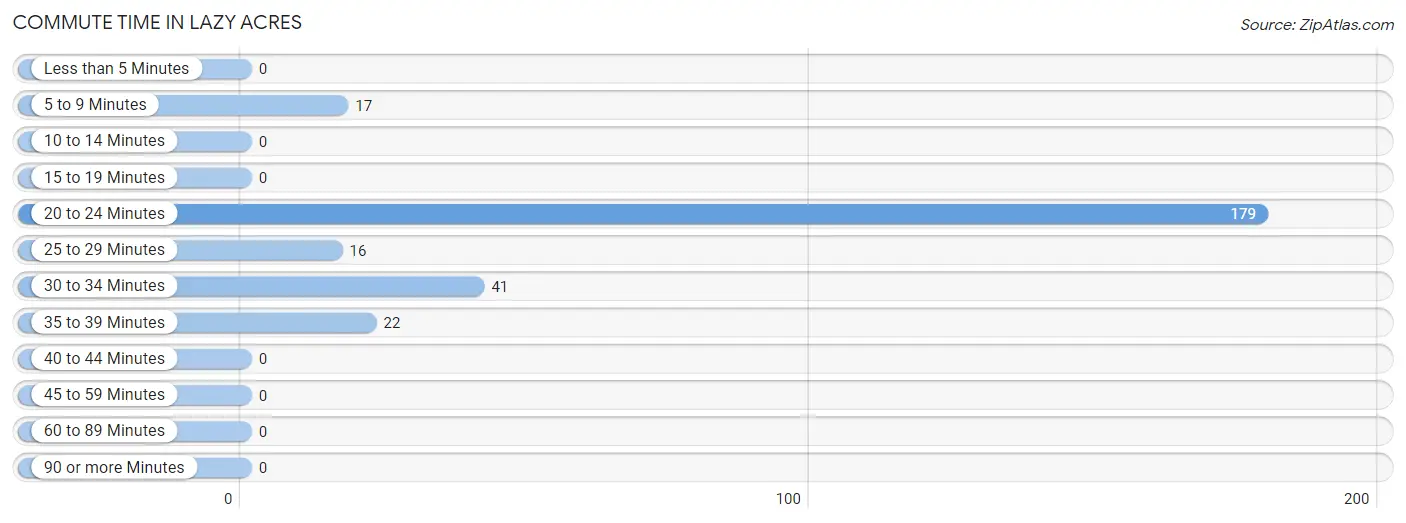
| Commute Time | # Commuters | % Commuters |
| Less than 5 Minutes | 0 | 0.0% |
| 5 to 9 Minutes | 17 | 6.2% |
| 10 to 14 Minutes | 0 | 0.0% |
| 15 to 19 Minutes | 0 | 0.0% |
| 20 to 24 Minutes | 179 | 65.1% |
| 25 to 29 Minutes | 16 | 5.8% |
| 30 to 34 Minutes | 41 | 14.9% |
| 35 to 39 Minutes | 22 | 8.0% |
| 40 to 44 Minutes | 0 | 0.0% |
| 45 to 59 Minutes | 0 | 0.0% |
| 60 to 89 Minutes | 0 | 0.0% |
| 90 or more Minutes | 0 | 0.0% |
Commute Time by Sex in Lazy Acres
The most common commute times in Lazy Acres are 20 to 24 minutes (107 commuters, 73.8%) for males and 20 to 24 minutes (72 commuters, 55.4%) for females.
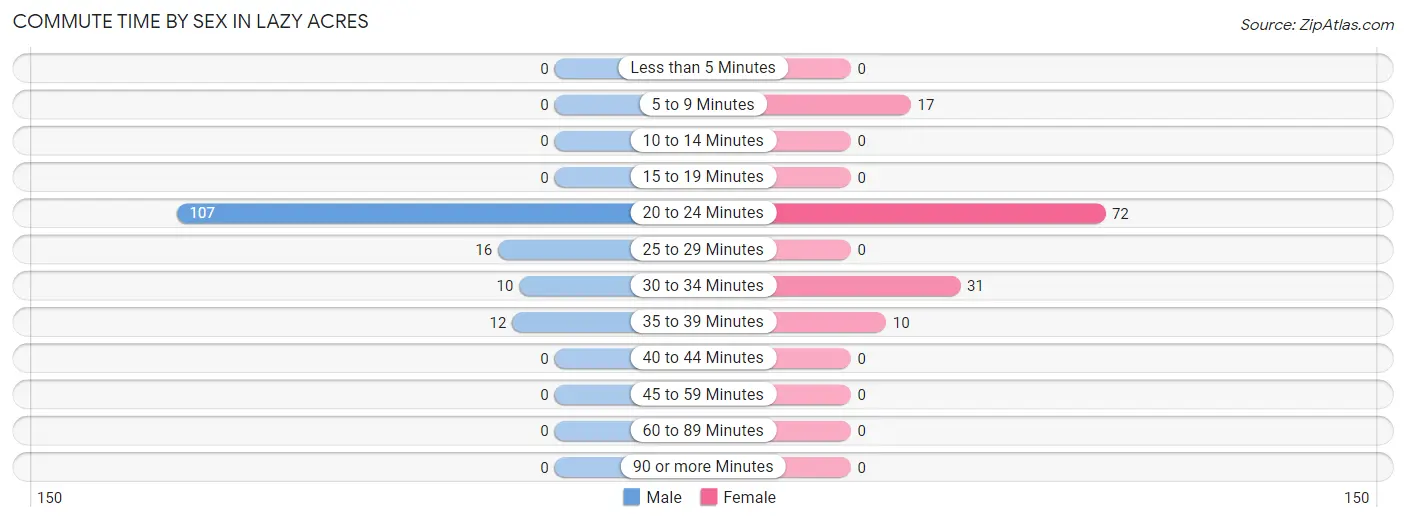
| Commute Time | Male | Female |
| Less than 5 Minutes | 0 (0.0%) | 0 (0.0%) |
| 5 to 9 Minutes | 0 (0.0%) | 17 (13.1%) |
| 10 to 14 Minutes | 0 (0.0%) | 0 (0.0%) |
| 15 to 19 Minutes | 0 (0.0%) | 0 (0.0%) |
| 20 to 24 Minutes | 107 (73.8%) | 72 (55.4%) |
| 25 to 29 Minutes | 16 (11.0%) | 0 (0.0%) |
| 30 to 34 Minutes | 10 (6.9%) | 31 (23.8%) |
| 35 to 39 Minutes | 12 (8.3%) | 10 (7.7%) |
| 40 to 44 Minutes | 0 (0.0%) | 0 (0.0%) |
| 45 to 59 Minutes | 0 (0.0%) | 0 (0.0%) |
| 60 to 89 Minutes | 0 (0.0%) | 0 (0.0%) |
| 90 or more Minutes | 0 (0.0%) | 0 (0.0%) |
Time of Departure to Work by Sex in Lazy Acres
The most frequent times of departure to work in Lazy Acres are 6:00 AM to 6:29 AM (38, 26.2%) for males and 7:30 AM to 7:59 AM (40, 30.8%) for females.
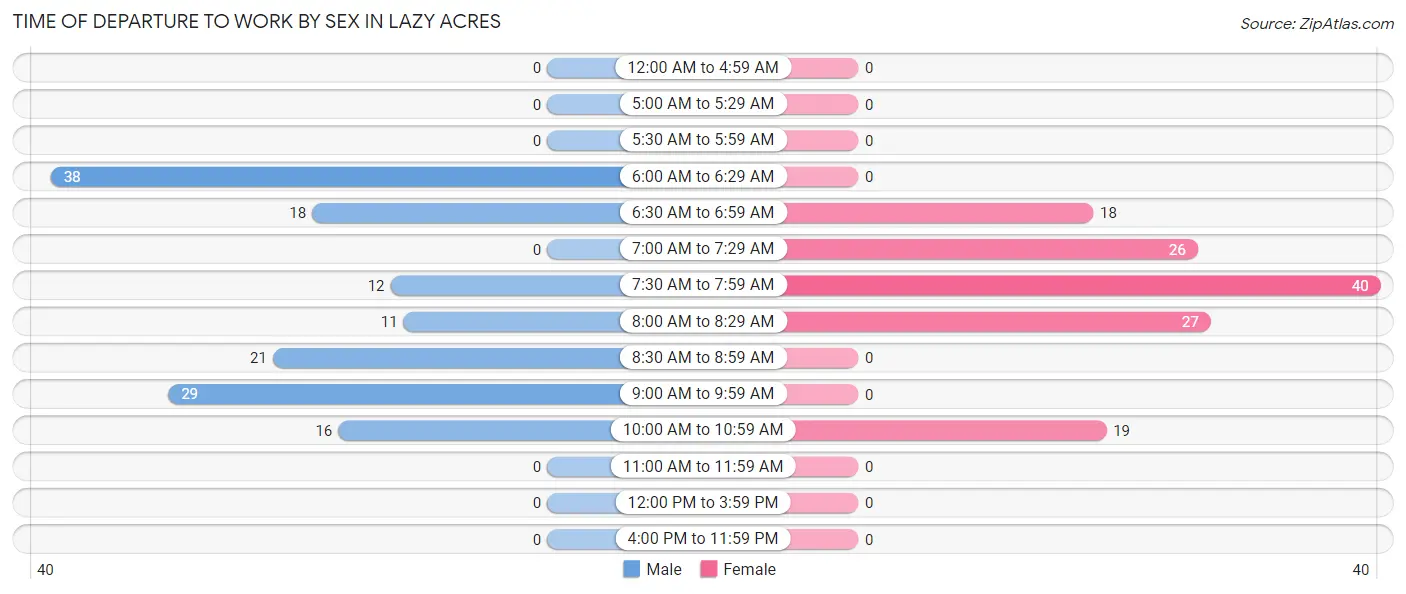
| Time of Departure | Male | Female |
| 12:00 AM to 4:59 AM | 0 (0.0%) | 0 (0.0%) |
| 5:00 AM to 5:29 AM | 0 (0.0%) | 0 (0.0%) |
| 5:30 AM to 5:59 AM | 0 (0.0%) | 0 (0.0%) |
| 6:00 AM to 6:29 AM | 38 (26.2%) | 0 (0.0%) |
| 6:30 AM to 6:59 AM | 18 (12.4%) | 18 (13.9%) |
| 7:00 AM to 7:29 AM | 0 (0.0%) | 26 (20.0%) |
| 7:30 AM to 7:59 AM | 12 (8.3%) | 40 (30.8%) |
| 8:00 AM to 8:29 AM | 11 (7.6%) | 27 (20.8%) |
| 8:30 AM to 8:59 AM | 21 (14.5%) | 0 (0.0%) |
| 9:00 AM to 9:59 AM | 29 (20.0%) | 0 (0.0%) |
| 10:00 AM to 10:59 AM | 16 (11.0%) | 19 (14.6%) |
| 11:00 AM to 11:59 AM | 0 (0.0%) | 0 (0.0%) |
| 12:00 PM to 3:59 PM | 0 (0.0%) | 0 (0.0%) |
| 4:00 PM to 11:59 PM | 0 (0.0%) | 0 (0.0%) |
| Total | 145 (100.0%) | 130 (100.0%) |
Housing Occupancy in Lazy Acres
Occupancy by Ownership in Lazy Acres
Of the total 479 dwellings in Lazy Acres, owner-occupied units account for 479 (100.0%), while renter-occupied units make up 0 (0.0%).
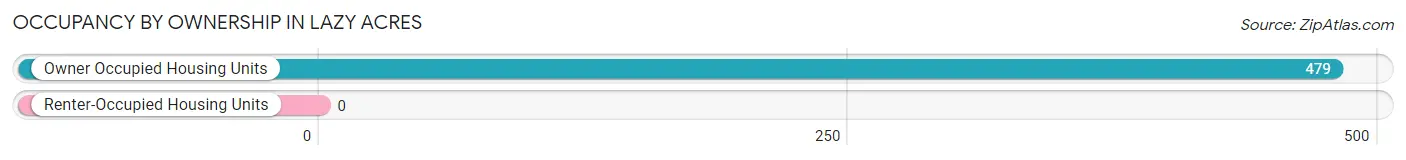
| Occupancy | # Housing Units | % Housing Units |
| Owner Occupied Housing Units | 479 | 100.0% |
| Renter-Occupied Housing Units | 0 | 0.0% |
| Total Occupied Housing Units | 479 | 100.0% |
Occupancy by Household Size in Lazy Acres
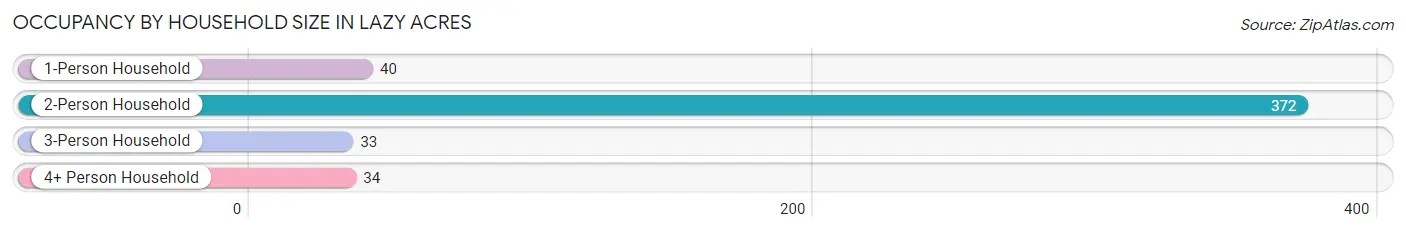
| Household Size | # Housing Units | % Housing Units |
| 1-Person Household | 40 | 8.4% |
| 2-Person Household | 372 | 77.7% |
| 3-Person Household | 33 | 6.9% |
| 4+ Person Household | 34 | 7.1% |
| Total Housing Units | 479 | 100.0% |
Occupancy by Ownership by Household Size in Lazy Acres
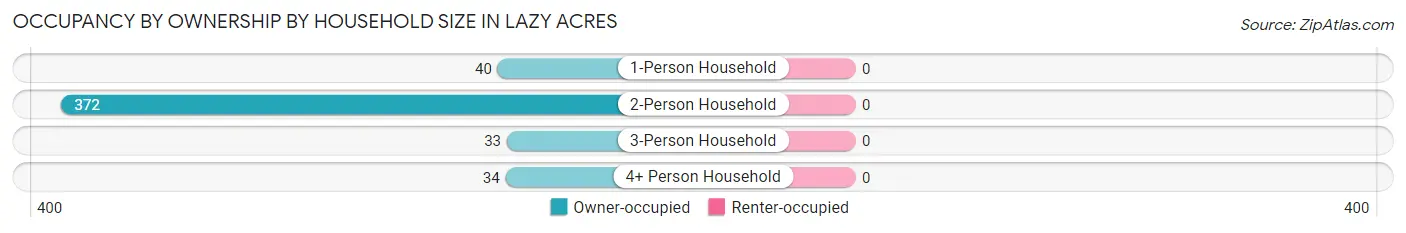
| Household Size | Owner-occupied | Renter-occupied |
| 1-Person Household | 40 (100.0%) | 0 (0.0%) |
| 2-Person Household | 372 (100.0%) | 0 (0.0%) |
| 3-Person Household | 33 (100.0%) | 0 (0.0%) |
| 4+ Person Household | 34 (100.0%) | 0 (0.0%) |
| Total Housing Units | 479 (100.0%) | 0 (0.0%) |
Occupancy by Educational Attainment in Lazy Acres
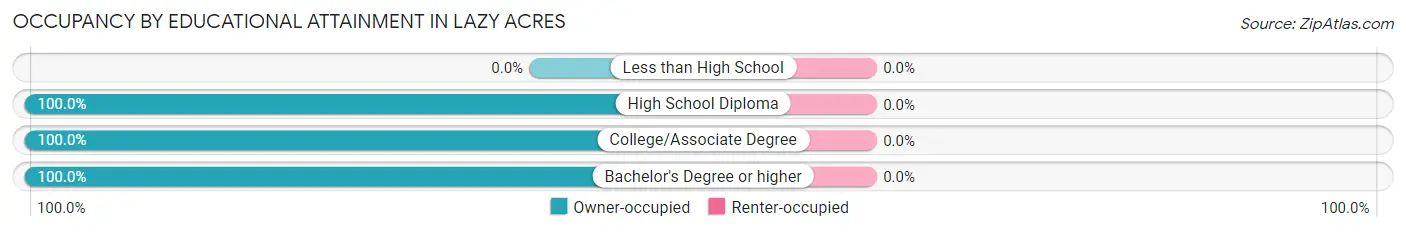
| Household Size | Owner-occupied | Renter-occupied |
| Less than High School | 0 (0.0%) | 0 (0.0%) |
| High School Diploma | 15 (100.0%) | 0 (0.0%) |
| College/Associate Degree | 83 (100.0%) | 0 (0.0%) |
| Bachelor's Degree or higher | 381 (100.0%) | 0 (0.0%) |
Occupancy by Age of Householder in Lazy Acres
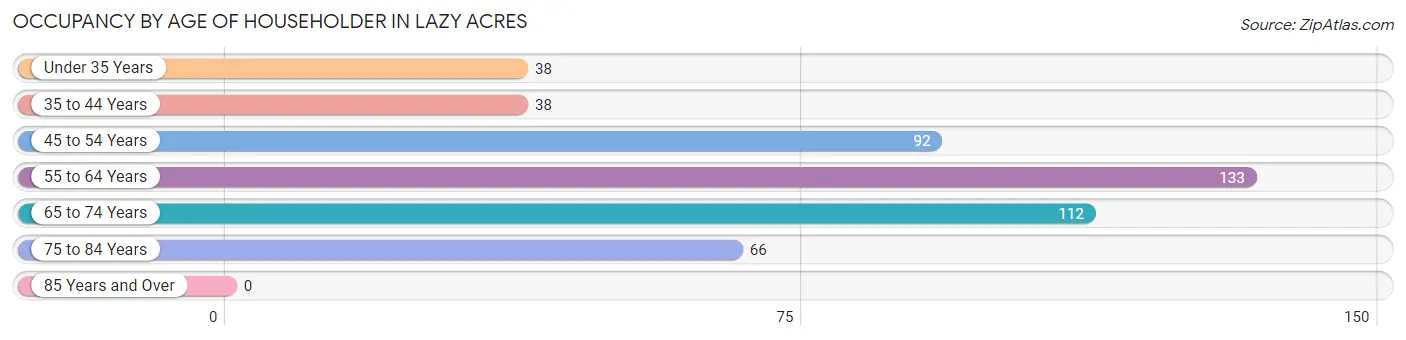
| Age Bracket | # Households | % Households |
| Under 35 Years | 38 | 7.9% |
| 35 to 44 Years | 38 | 7.9% |
| 45 to 54 Years | 92 | 19.2% |
| 55 to 64 Years | 133 | 27.8% |
| 65 to 74 Years | 112 | 23.4% |
| 75 to 84 Years | 66 | 13.8% |
| 85 Years and Over | 0 | 0.0% |
| Total | 479 | 100.0% |
Housing Finances in Lazy Acres
Median Income by Occupancy in Lazy Acres
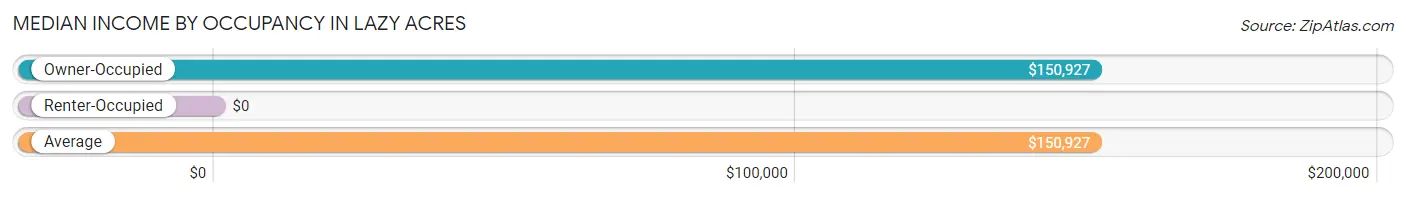
| Occupancy Type | # Households | Median Income |
| Owner-Occupied | 479 (100.0%) | $150,927 |
| Renter-Occupied | 0 (0.0%) | $0 |
| Average | 479 (100.0%) | $150,927 |
Occupancy by Householder Income Bracket in Lazy Acres
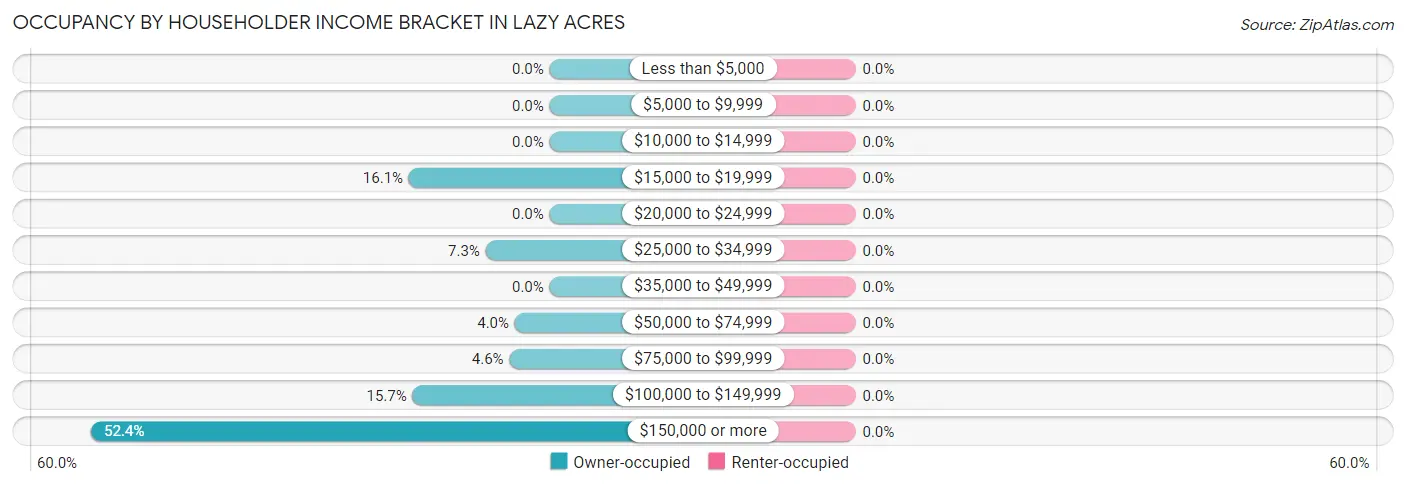
| Income Bracket | Owner-occupied | Renter-occupied |
| Less than $5,000 | 0 (0.0%) | 0 (0.0%) |
| $5,000 to $9,999 | 0 (0.0%) | 0 (0.0%) |
| $10,000 to $14,999 | 0 (0.0%) | 0 (0.0%) |
| $15,000 to $19,999 | 77 (16.1%) | 0 (0.0%) |
| $20,000 to $24,999 | 0 (0.0%) | 0 (0.0%) |
| $25,000 to $34,999 | 35 (7.3%) | 0 (0.0%) |
| $35,000 to $49,999 | 0 (0.0%) | 0 (0.0%) |
| $50,000 to $74,999 | 19 (4.0%) | 0 (0.0%) |
| $75,000 to $99,999 | 22 (4.6%) | 0 (0.0%) |
| $100,000 to $149,999 | 75 (15.7%) | 0 (0.0%) |
| $150,000 or more | 251 (52.4%) | 0 (0.0%) |
| Total | 479 (100.0%) | 0 (0.0%) |
Monthly Housing Cost Tiers in Lazy Acres
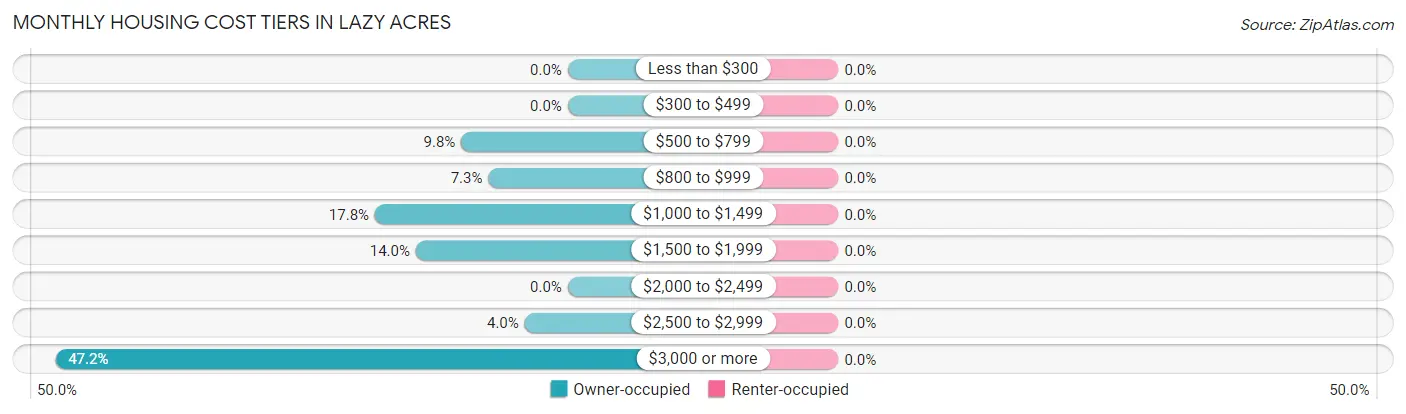
| Monthly Cost | Owner-occupied | Renter-occupied |
| Less than $300 | 0 (0.0%) | 0 (0.0%) |
| $300 to $499 | 0 (0.0%) | 0 (0.0%) |
| $500 to $799 | 47 (9.8%) | 0 (0.0%) |
| $800 to $999 | 35 (7.3%) | 0 (0.0%) |
| $1,000 to $1,499 | 85 (17.7%) | 0 (0.0%) |
| $1,500 to $1,999 | 67 (14.0%) | 0 (0.0%) |
| $2,000 to $2,499 | 0 (0.0%) | 0 (0.0%) |
| $2,500 to $2,999 | 19 (4.0%) | 0 (0.0%) |
| $3,000 or more | 226 (47.2%) | 0 (0.0%) |
| Total | 479 (100.0%) | 0 (0.0%) |
Physical Housing Characteristics in Lazy Acres
Housing Structures in Lazy Acres
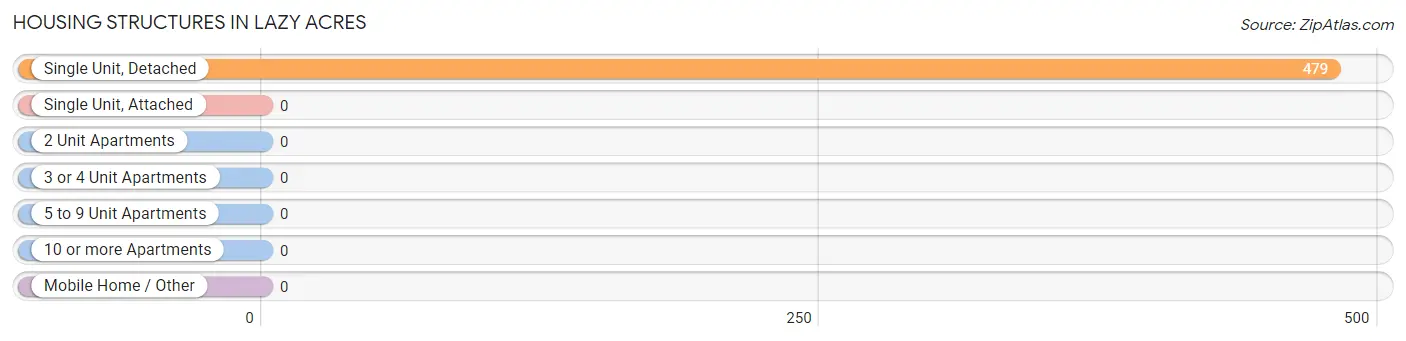
| Structure Type | # Housing Units | % Housing Units |
| Single Unit, Detached | 479 | 100.0% |
| Single Unit, Attached | 0 | 0.0% |
| 2 Unit Apartments | 0 | 0.0% |
| 3 or 4 Unit Apartments | 0 | 0.0% |
| 5 to 9 Unit Apartments | 0 | 0.0% |
| 10 or more Apartments | 0 | 0.0% |
| Mobile Home / Other | 0 | 0.0% |
| Total | 479 | 100.0% |
Housing Structures by Occupancy in Lazy Acres
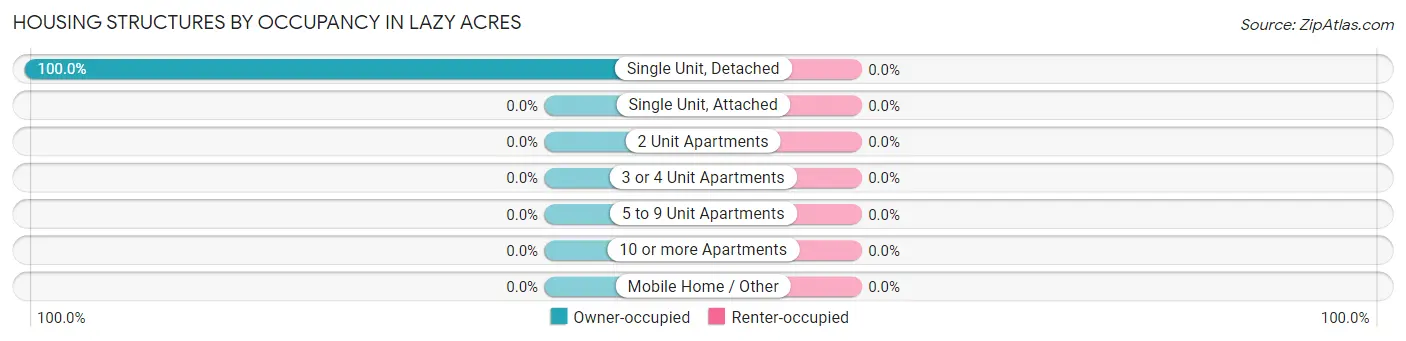
| Structure Type | Owner-occupied | Renter-occupied |
| Single Unit, Detached | 479 (100.0%) | 0 (0.0%) |
| Single Unit, Attached | 0 (0.0%) | 0 (0.0%) |
| 2 Unit Apartments | 0 (0.0%) | 0 (0.0%) |
| 3 or 4 Unit Apartments | 0 (0.0%) | 0 (0.0%) |
| 5 to 9 Unit Apartments | 0 (0.0%) | 0 (0.0%) |
| 10 or more Apartments | 0 (0.0%) | 0 (0.0%) |
| Mobile Home / Other | 0 (0.0%) | 0 (0.0%) |
| Total | 479 (100.0%) | 0 (0.0%) |
Housing Structures by Number of Rooms in Lazy Acres
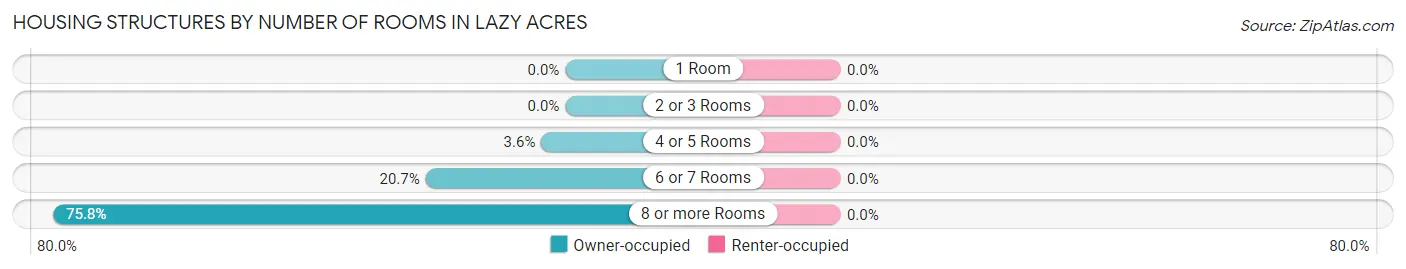
| Number of Rooms | Owner-occupied | Renter-occupied |
| 1 Room | 0 (0.0%) | 0 (0.0%) |
| 2 or 3 Rooms | 0 (0.0%) | 0 (0.0%) |
| 4 or 5 Rooms | 17 (3.5%) | 0 (0.0%) |
| 6 or 7 Rooms | 99 (20.7%) | 0 (0.0%) |
| 8 or more Rooms | 363 (75.8%) | 0 (0.0%) |
| Total | 479 (100.0%) | 0 (0.0%) |
Housing Structure by Heating Type in Lazy Acres
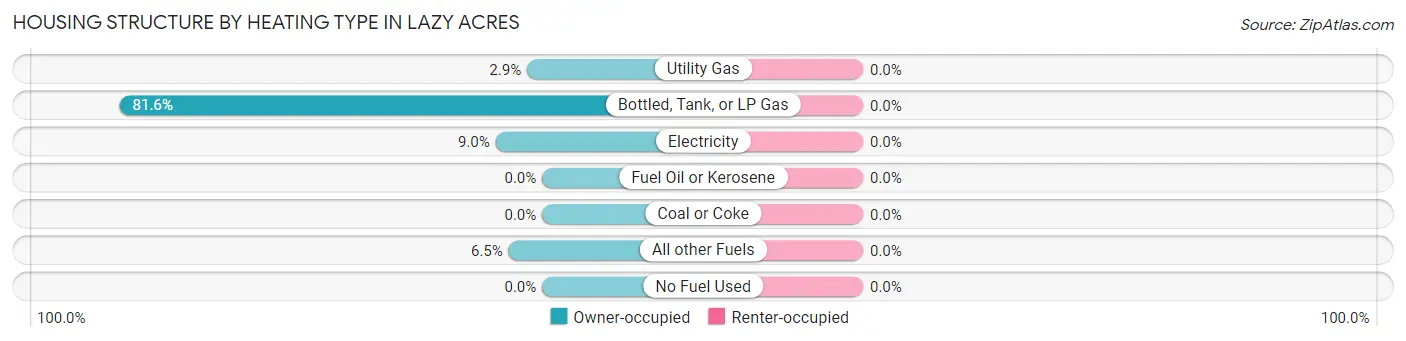
| Heating Type | Owner-occupied | Renter-occupied |
| Utility Gas | 14 (2.9%) | 0 (0.0%) |
| Bottled, Tank, or LP Gas | 391 (81.6%) | 0 (0.0%) |
| Electricity | 43 (9.0%) | 0 (0.0%) |
| Fuel Oil or Kerosene | 0 (0.0%) | 0 (0.0%) |
| Coal or Coke | 0 (0.0%) | 0 (0.0%) |
| All other Fuels | 31 (6.5%) | 0 (0.0%) |
| No Fuel Used | 0 (0.0%) | 0 (0.0%) |
| Total | 479 (100.0%) | 0 (0.0%) |
Household Vehicle Usage in Lazy Acres
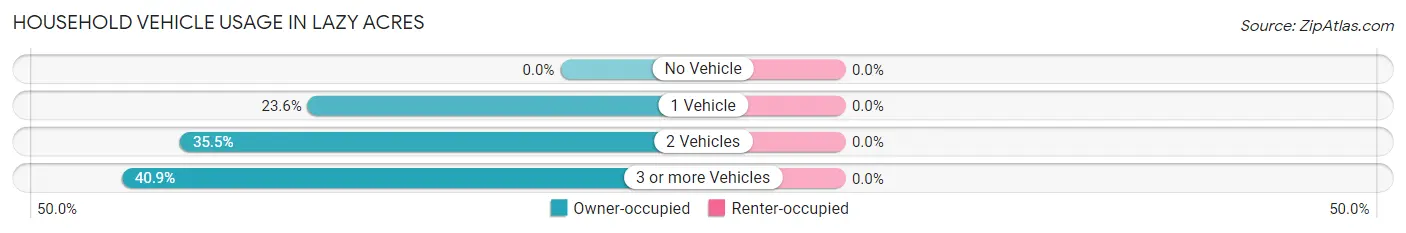
| Vehicles per Household | Owner-occupied | Renter-occupied |
| No Vehicle | 0 (0.0%) | 0 (0.0%) |
| 1 Vehicle | 113 (23.6%) | 0 (0.0%) |
| 2 Vehicles | 170 (35.5%) | 0 (0.0%) |
| 3 or more Vehicles | 196 (40.9%) | 0 (0.0%) |
| Total | 479 (100.0%) | 0 (0.0%) |
Real Estate & Mortgages in Lazy Acres
Real Estate and Mortgage Overview in Lazy Acres
| Characteristic | Without Mortgage | With Mortgage |
| Housing Units | 131 | 348 |
| Median Property Value | $761,700 | $897,500 |
| Median Household Income | $177,697 | $169 |
| Monthly Housing Costs | $853 | $226 |
| Real Estate Taxes | $3,732 | $18 |
Property Value by Mortgage Status in Lazy Acres
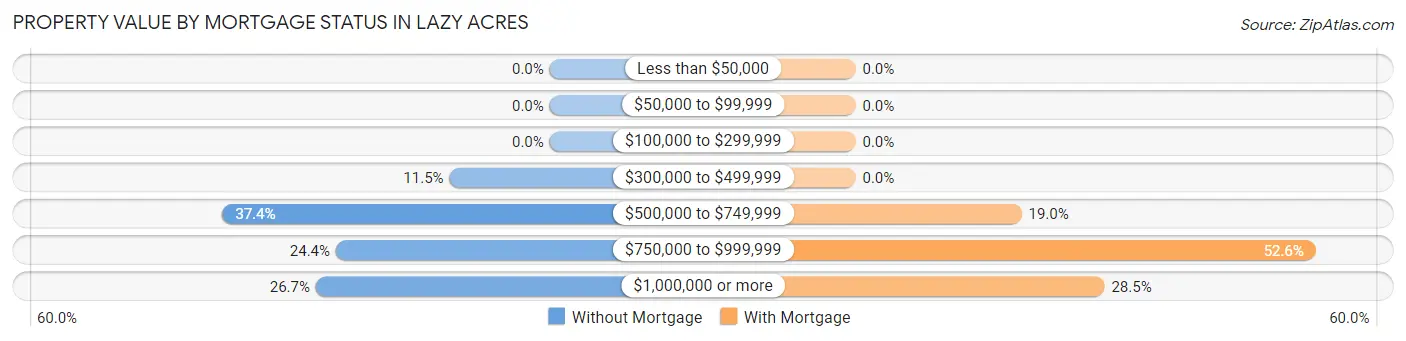
| Property Value | Without Mortgage | With Mortgage |
| Less than $50,000 | 0 (0.0%) | 0 (0.0%) |
| $50,000 to $99,999 | 0 (0.0%) | 0 (0.0%) |
| $100,000 to $299,999 | 0 (0.0%) | 0 (0.0%) |
| $300,000 to $499,999 | 15 (11.5%) | 0 (0.0%) |
| $500,000 to $749,999 | 49 (37.4%) | 66 (19.0%) |
| $750,000 to $999,999 | 32 (24.4%) | 183 (52.6%) |
| $1,000,000 or more | 35 (26.7%) | 99 (28.4%) |
| Total | 131 (100.0%) | 348 (100.0%) |
Household Income by Mortgage Status in Lazy Acres
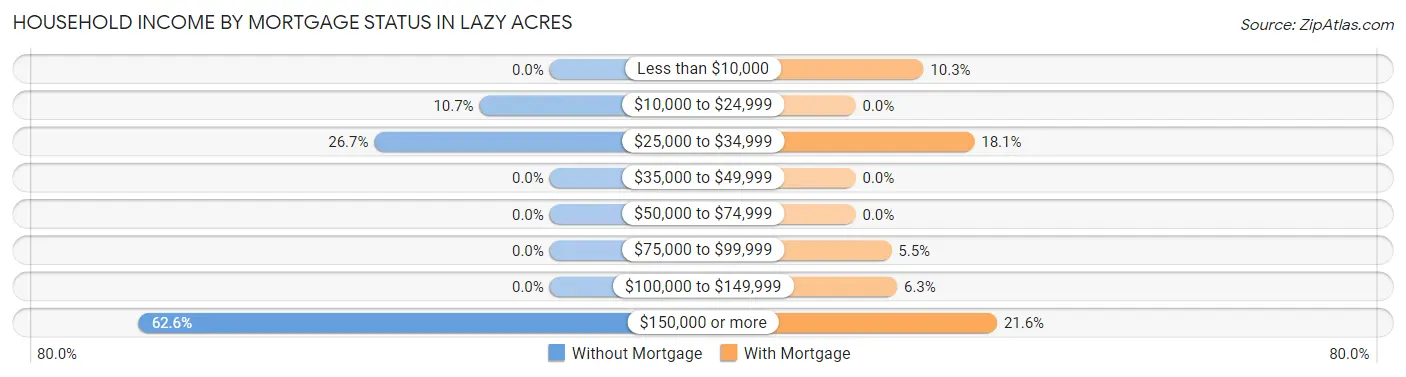
| Household Income | Without Mortgage | With Mortgage |
| Less than $10,000 | 0 (0.0%) | 36 (10.3%) |
| $10,000 to $24,999 | 14 (10.7%) | 0 (0.0%) |
| $25,000 to $34,999 | 35 (26.7%) | 63 (18.1%) |
| $35,000 to $49,999 | 0 (0.0%) | 0 (0.0%) |
| $50,000 to $74,999 | 0 (0.0%) | 0 (0.0%) |
| $75,000 to $99,999 | 0 (0.0%) | 19 (5.5%) |
| $100,000 to $149,999 | 0 (0.0%) | 22 (6.3%) |
| $150,000 or more | 82 (62.6%) | 75 (21.5%) |
| Total | 131 (100.0%) | 348 (100.0%) |
Property Value to Household Income Ratio in Lazy Acres
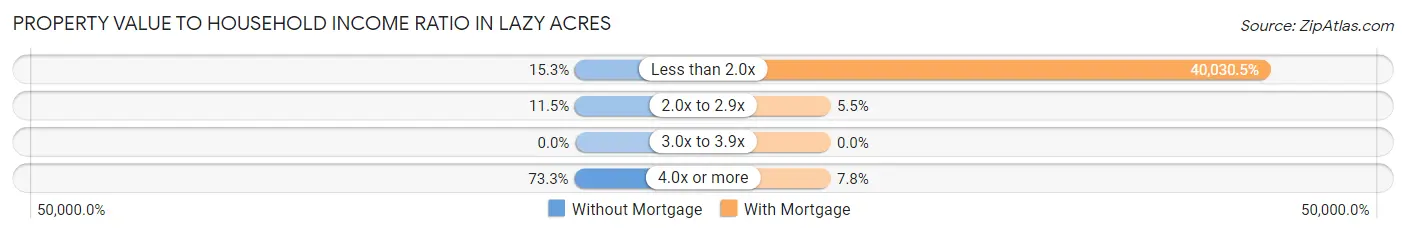
| Value-to-Income Ratio | Without Mortgage | With Mortgage |
| Less than 2.0x | 20 (15.3%) | 139,306 (40,030.5%) |
| 2.0x to 2.9x | 15 (11.5%) | 19 (5.5%) |
| 3.0x to 3.9x | 0 (0.0%) | 0 (0.0%) |
| 4.0x or more | 96 (73.3%) | 27 (7.8%) |
| Total | 131 (100.0%) | 348 (100.0%) |
Real Estate Taxes by Mortgage Status in Lazy Acres
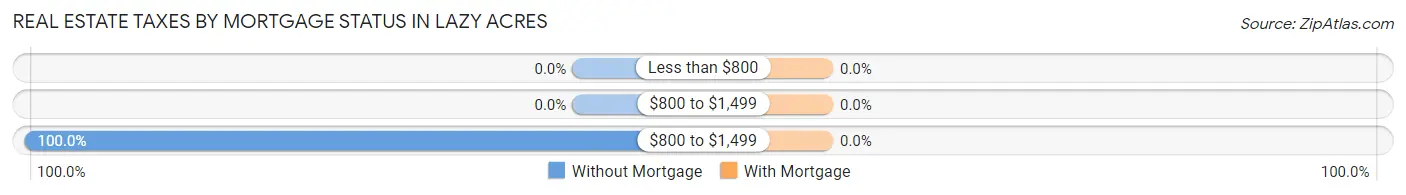
| Property Taxes | Without Mortgage | With Mortgage |
| Less than $800 | 0 (0.0%) | 0 (0.0%) |
| $800 to $1,499 | 0 (0.0%) | 0 (0.0%) |
| $800 to $1,499 | 131 (100.0%) | 0 (0.0%) |
| Total | 131 (100.0%) | 348 (100.0%) |
Health & Disability in Lazy Acres
Health Insurance Coverage by Age in Lazy Acres
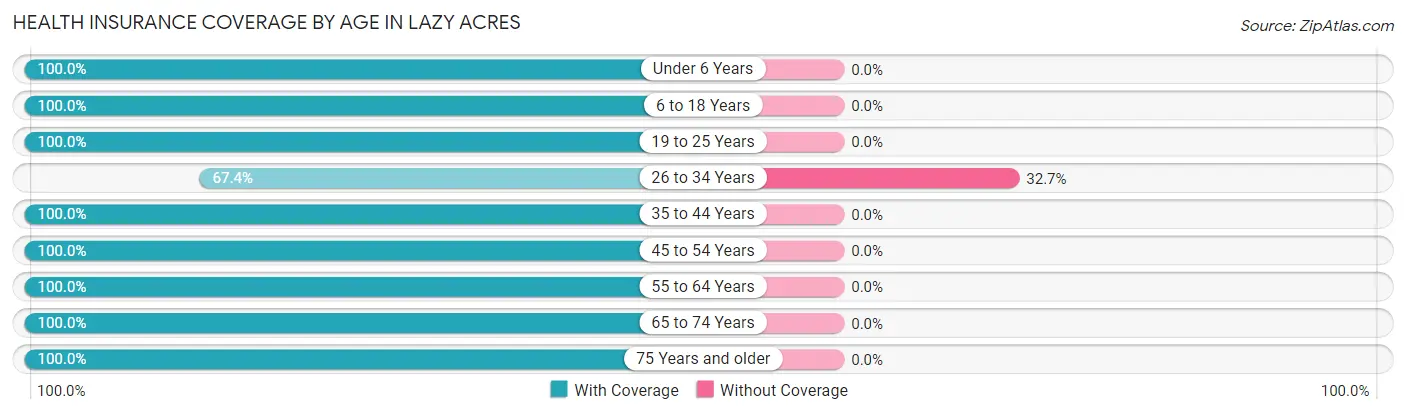
| Age Bracket | With Coverage | Without Coverage |
| Under 6 Years | 19 (100.0%) | 0 (0.0%) |
| 6 to 18 Years | 96 (100.0%) | 0 (0.0%) |
| 19 to 25 Years | 81 (100.0%) | 0 (0.0%) |
| 26 to 34 Years | 33 (67.3%) | 16 (32.7%) |
| 35 to 44 Years | 100 (100.0%) | 0 (0.0%) |
| 45 to 54 Years | 109 (100.0%) | 0 (0.0%) |
| 55 to 64 Years | 251 (100.0%) | 0 (0.0%) |
| 65 to 74 Years | 206 (100.0%) | 0 (0.0%) |
| 75 Years and older | 103 (100.0%) | 0 (0.0%) |
| Total | 998 (98.4%) | 16 (1.6%) |
Health Insurance Coverage by Citizenship Status in Lazy Acres
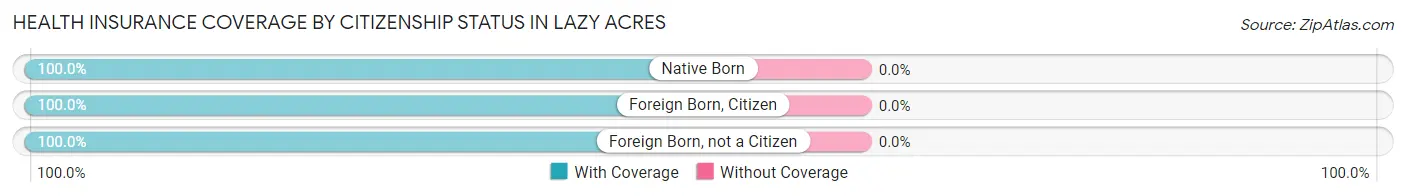
| Citizenship Status | With Coverage | Without Coverage |
| Native Born | 19 (100.0%) | 0 (0.0%) |
| Foreign Born, Citizen | 96 (100.0%) | 0 (0.0%) |
| Foreign Born, not a Citizen | 81 (100.0%) | 0 (0.0%) |
Health Insurance Coverage by Household Income in Lazy Acres
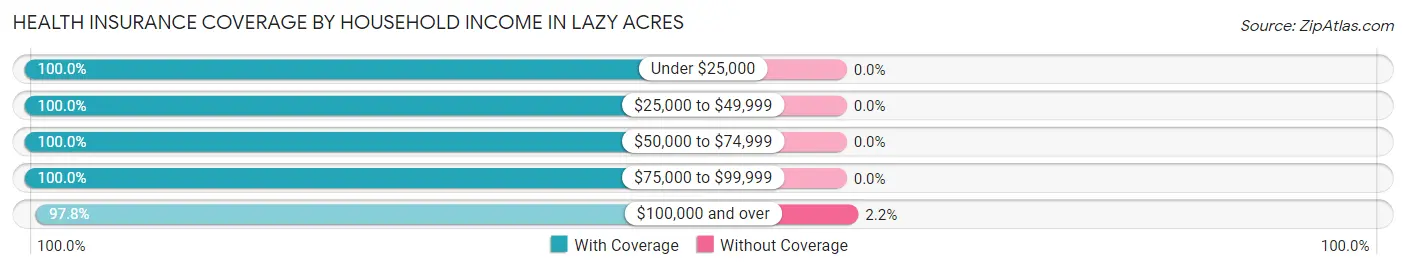
| Household Income | With Coverage | Without Coverage |
| Under $25,000 | 126 (100.0%) | 0 (0.0%) |
| $25,000 to $49,999 | 66 (100.0%) | 0 (0.0%) |
| $50,000 to $74,999 | 38 (100.0%) | 0 (0.0%) |
| $75,000 to $99,999 | 46 (100.0%) | 0 (0.0%) |
| $100,000 and over | 722 (97.8%) | 16 (2.2%) |
Public vs Private Health Insurance Coverage by Age in Lazy Acres
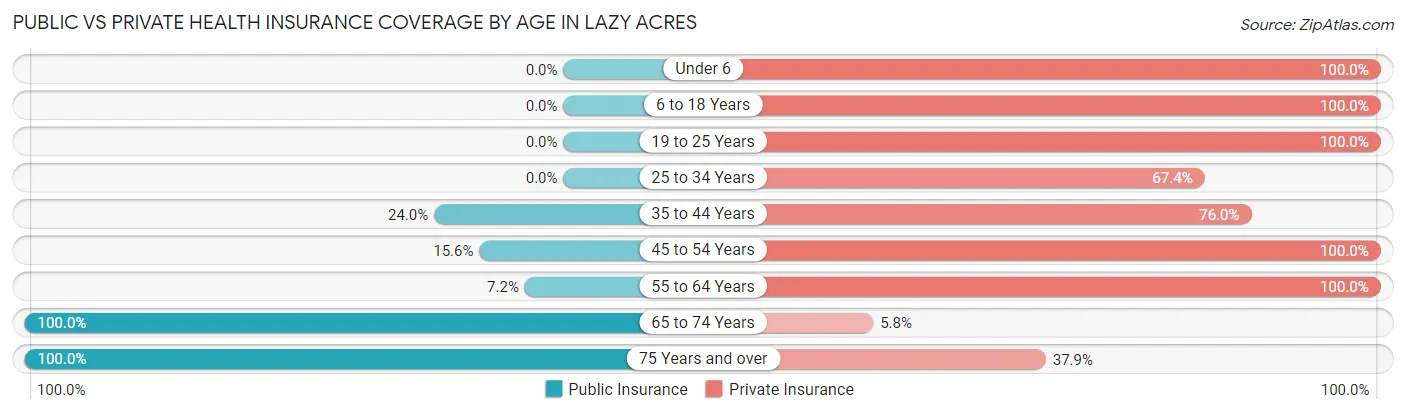
| Age Bracket | Public Insurance | Private Insurance |
| Under 6 | 0 (0.0%) | 19 (100.0%) |
| 6 to 18 Years | 0 (0.0%) | 96 (100.0%) |
| 19 to 25 Years | 0 (0.0%) | 81 (100.0%) |
| 25 to 34 Years | 0 (0.0%) | 33 (67.3%) |
| 35 to 44 Years | 24 (24.0%) | 76 (76.0%) |
| 45 to 54 Years | 17 (15.6%) | 109 (100.0%) |
| 55 to 64 Years | 18 (7.2%) | 251 (100.0%) |
| 65 to 74 Years | 206 (100.0%) | 12 (5.8%) |
| 75 Years and over | 103 (100.0%) | 39 (37.9%) |
| Total | 368 (36.3%) | 716 (70.6%) |
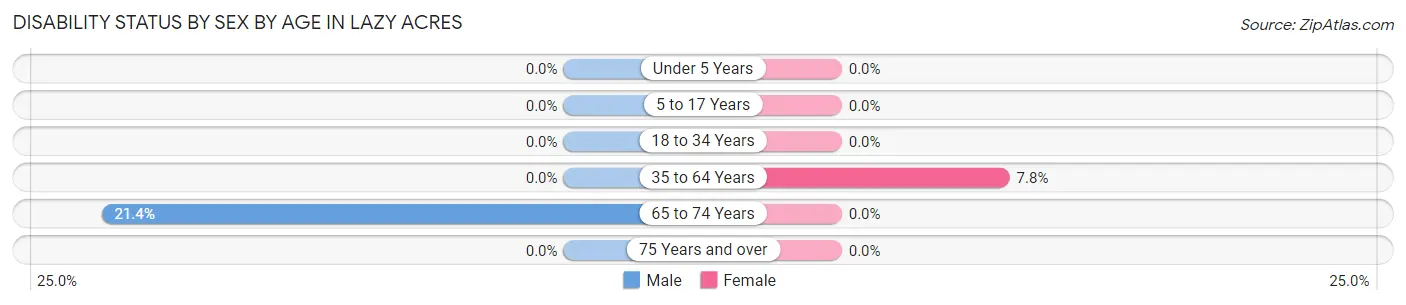
Disability Status by Sex by Age in Lazy Acres
| Age Bracket | Male | Female |
| Under 5 Years | 0 (0.0%) | 0 (0.0%) |
| 5 to 17 Years | 0 (0.0%) | 0 (0.0%) |
| 18 to 34 Years | 0 (0.0%) | 0 (0.0%) |
| 35 to 64 Years | 0 (0.0%) | 19 (7.8%) |
| 65 to 74 Years | 21 (21.4%) | 0 (0.0%) |
| 75 Years and over | 0 (0.0%) | 0 (0.0%) |
Disability Class by Sex by Age in Lazy Acres
Disability Class: Hearing Difficulty
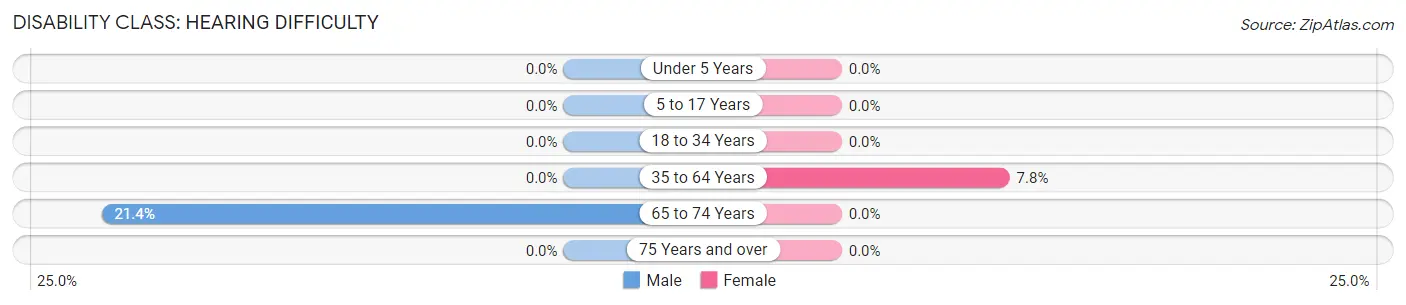
| Age Bracket | Male | Female |
| Under 5 Years | 0 (0.0%) | 0 (0.0%) |
| 5 to 17 Years | 0 (0.0%) | 0 (0.0%) |
| 18 to 34 Years | 0 (0.0%) | 0 (0.0%) |
| 35 to 64 Years | 0 (0.0%) | 19 (7.8%) |
| 65 to 74 Years | 21 (21.4%) | 0 (0.0%) |
| 75 Years and over | 0 (0.0%) | 0 (0.0%) |
Disability Class: Vision Difficulty
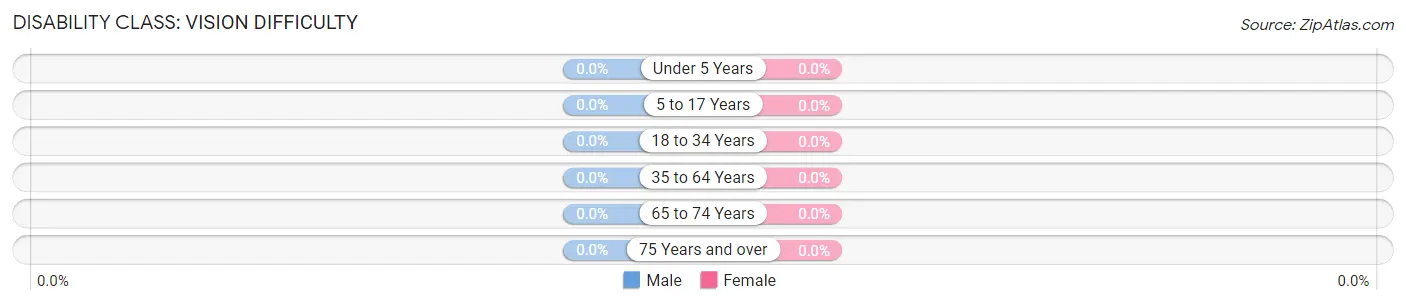
| Age Bracket | Male | Female |
| Under 5 Years | 0 (0.0%) | 0 (0.0%) |
| 5 to 17 Years | 0 (0.0%) | 0 (0.0%) |
| 18 to 34 Years | 0 (0.0%) | 0 (0.0%) |
| 35 to 64 Years | 0 (0.0%) | 0 (0.0%) |
| 65 to 74 Years | 0 (0.0%) | 0 (0.0%) |
| 75 Years and over | 0 (0.0%) | 0 (0.0%) |
Disability Class: Cognitive Difficulty
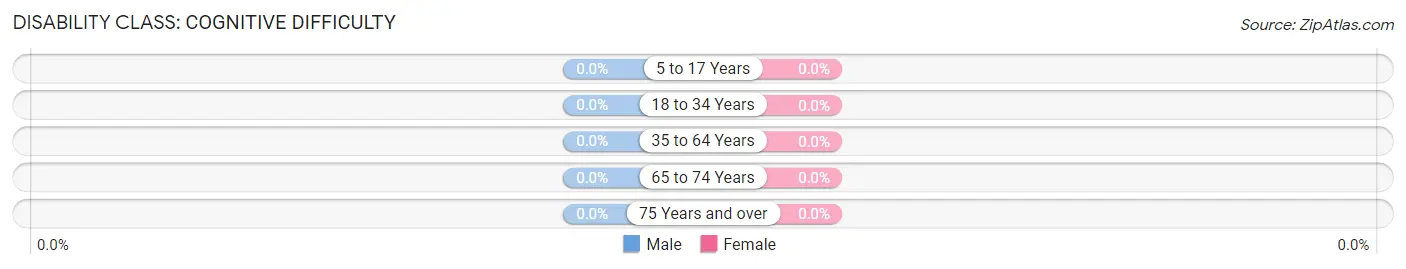
| Age Bracket | Male | Female |
| 5 to 17 Years | 0 (0.0%) | 0 (0.0%) |
| 18 to 34 Years | 0 (0.0%) | 0 (0.0%) |
| 35 to 64 Years | 0 (0.0%) | 0 (0.0%) |
| 65 to 74 Years | 0 (0.0%) | 0 (0.0%) |
| 75 Years and over | 0 (0.0%) | 0 (0.0%) |
Disability Class: Ambulatory Difficulty
| Age Bracket | Male | Female |
| 5 to 17 Years | 0 (0.0%) | 0 (0.0%) |
| 18 to 34 Years | 0 (0.0%) | 0 (0.0%) |
| 35 to 64 Years | 0 (0.0%) | 0 (0.0%) |
| 65 to 74 Years | 0 (0.0%) | 0 (0.0%) |
| 75 Years and over | 0 (0.0%) | 0 (0.0%) |
Disability Class: Self-Care Difficulty
| Age Bracket | Male | Female |
| 5 to 17 Years | 0 (0.0%) | 0 (0.0%) |
| 18 to 34 Years | 0 (0.0%) | 0 (0.0%) |
| 35 to 64 Years | 0 (0.0%) | 0 (0.0%) |
| 65 to 74 Years | 0 (0.0%) | 0 (0.0%) |
| 75 Years and over | 0 (0.0%) | 0 (0.0%) |
Technology Access in Lazy Acres
Computing Device Access in Lazy Acres
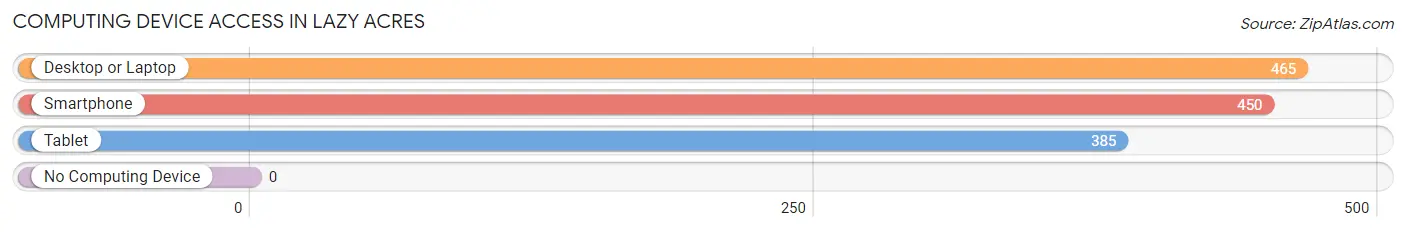
| Device Type | # Households | % Households |
| Desktop or Laptop | 465 | 97.1% |
| Smartphone | 450 | 94.0% |
| Tablet | 385 | 80.4% |
| No Computing Device | 0 | 0.0% |
| Total | 479 | 100.0% |
Internet Access in Lazy Acres
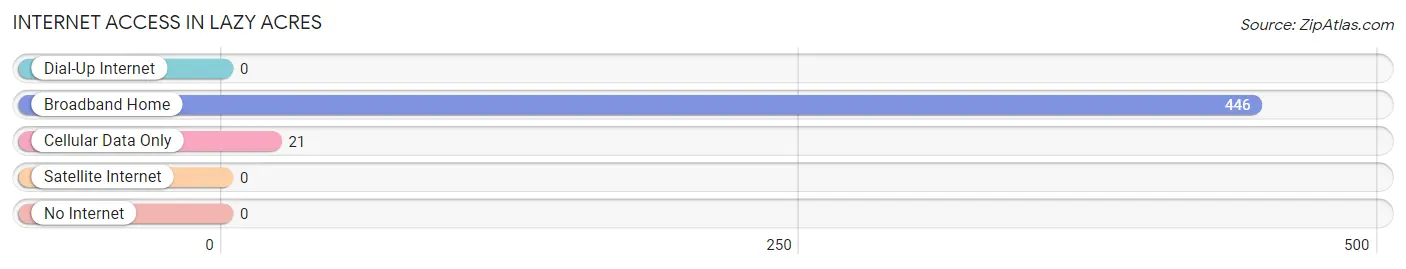
| Internet Type | # Households | % Households |
| Dial-Up Internet | 0 | 0.0% |
| Broadband Home | 446 | 93.1% |
| Cellular Data Only | 21 | 4.4% |
| Satellite Internet | 0 | 0.0% |
| No Internet | 0 | 0.0% |
| Total | 479 | 100.0% |
Lazy Acres Summary
Lazy Acres is a small town located in the state of Colorado, in the United States. It is situated in the foothills of the Rocky Mountains, and is surrounded by beautiful scenery. The town has a population of just over 1,000 people, and is known for its laid-back atmosphere and friendly locals.
Geography
Lazy Acres is located in the foothills of the Rocky Mountains, in the Front Range of Colorado. The town is situated at an elevation of 6,000 feet, and is surrounded by mountains and forests. The town is located in a valley, and is bordered by the Big Thompson River to the north and the Cache la Poudre River to the south. The town is located about 30 miles northwest of Denver, and is accessible by car or bus.
Climate
Lazy Acres has a semi-arid climate, with hot summers and cold winters. The average temperature in the summer is around 80 degrees Fahrenheit, and the average temperature in the winter is around 20 degrees Fahrenheit. The town receives an average of 16 inches of precipitation per year, with most of it falling in the form of snow.
Economy
Lazy Acres is a small town, and its economy is largely based on tourism. The town is home to several small businesses, including restaurants, shops, and lodging. The town also has a few small farms, which produce vegetables, fruits, and livestock. The town is also home to a few small manufacturing companies, which produce items such as furniture and clothing.
Demographics
As of the 2010 census, the population of Lazy Acres was 1,072. The town is predominantly white, with a small Hispanic population. The median household income in the town is $45,000, and the median age is 44. The town has a low unemployment rate, and most of the residents are employed in the tourism industry.
Conclusion
Lazy Acres is a small town located in the foothills of the Rocky Mountains in Colorado. The town has a population of just over 1,000 people, and is known for its laid-back atmosphere and friendly locals. The town has a semi-arid climate, with hot summers and cold winters. The economy of the town is largely based on tourism, and the town is home to several small businesses. The town is predominantly white, with a small Hispanic population. The median household income in the town is $45,000, and the median age is 44.
Common Questions
What is Per Capita Income in Lazy Acres?
Per Capita income in Lazy Acres is $93,383.
What is the Median Family Income in Lazy Acres?
Median Family Income in Lazy Acres is $139,583.
What is the Median Household income in Lazy Acres?
Median Household Income in Lazy Acres is $150,927.
What is Income or Wage Gap in Lazy Acres?
Income or Wage Gap in Lazy Acres is 40.4%.
Women in Lazy Acres earn 59.6 cents for every dollar earned by a man.
What is Inequality or Gini Index in Lazy Acres?
Inequality or Gini Index in Lazy Acres is 0.53.
What is the Total Population of Lazy Acres?
Total Population of Lazy Acres is 1,014.
What is the Total Male Population of Lazy Acres?
Total Male Population of Lazy Acres is 511.
What is the Total Female Population of Lazy Acres?
Total Female Population of Lazy Acres is 503.
What is the Ratio of Males per 100 Females in Lazy Acres?
There are 101.59 Males per 100 Females in Lazy Acres.
What is the Ratio of Females per 100 Males in Lazy Acres?
There are 98.43 Females per 100 Males in Lazy Acres.
What is the Median Population Age in Lazy Acres?
Median Population Age in Lazy Acres is 56.7 Years.
What is the Average Family Size in Lazy Acres
Average Family Size in Lazy Acres is 2.2 People.
What is the Average Household Size in Lazy Acres
Average Household Size in Lazy Acres is 2.1 People.
How Large is the Labor Force in Lazy Acres?
There are 494 People in the Labor Forcein in Lazy Acres.
What is the Percentage of People in the Labor Force in Lazy Acres?
54.9% of People are in the Labor Force in Lazy Acres.
What is the Unemployment Rate in Lazy Acres?
Unemployment Rate in Lazy Acres is 3.8%.