Zip Codes with the Highest Percentage of Population Employed in Computer, Engineering & Science in Grand Junction, CO
RELATED REPORTS & OPTIONS
Computer, Engineering & Science
Grand Junction
Compare Zip Codes
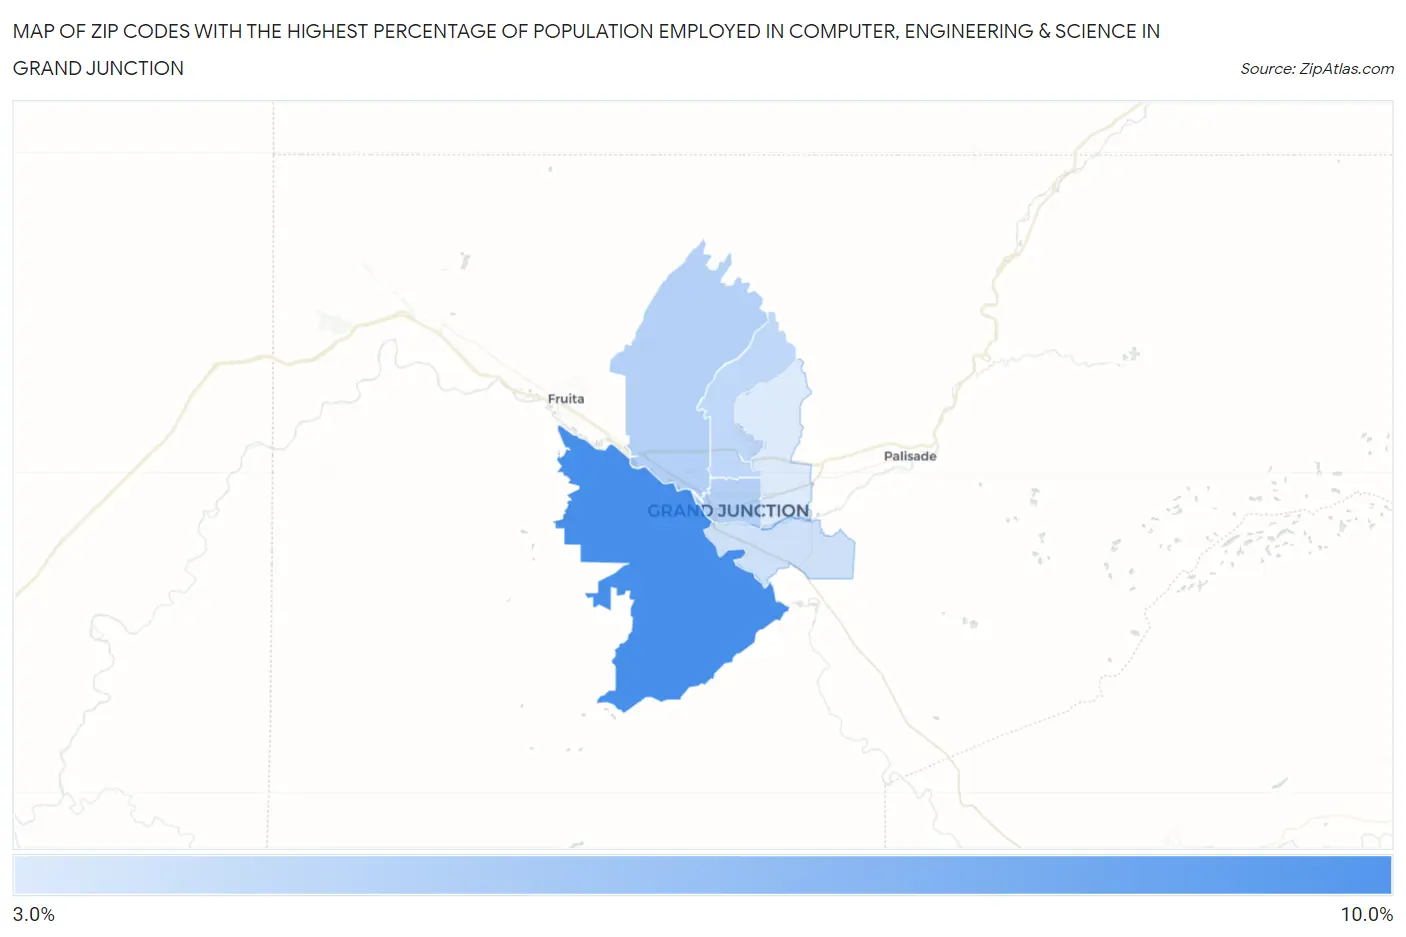
Map of Zip Codes with the Highest Percentage of Population Employed in Computer, Engineering & Science in Grand Junction
3.5%
8.3%
Zip Codes with the Highest Percentage of Population Employed in Computer, Engineering & Science in Grand Junction, CO
| Zip Code | % Employed | vs State | vs National | |
| 1. | 81507 | 8.3% | 9.0%(-0.648)#154 | 6.8%(+1.58)#4,779 |
| 2. | 81501 | 4.8% | 9.0%(-4.20)#257 | 6.8%(-1.97)#11,952 |
| 3. | 81505 | 4.8% | 9.0%(-4.21)#258 | 6.8%(-1.98)#11,987 |
| 4. | 81506 | 4.4% | 9.0%(-4.56)#271 | 6.8%(-2.33)#13,047 |
| 5. | 81503 | 3.9% | 9.0%(-5.08)#290 | 6.8%(-2.85)#14,752 |
| 6. | 81504 | 3.5% | 9.0%(-5.53)#308 | 6.8%(-3.30)#16,392 |
1
Common Questions
What are the Top 5 Zip Codes with the Highest Percentage of Population Employed in Computer, Engineering & Science in Grand Junction, CO?
Top 5 Zip Codes with the Highest Percentage of Population Employed in Computer, Engineering & Science in Grand Junction, CO are:
What zip code has the Highest Percentage of Population Employed in Computer, Engineering & Science in Grand Junction, CO?
81507 has the Highest Percentage of Population Employed in Computer, Engineering & Science in Grand Junction, CO with 8.3%.
What is the Percentage of Population Employed in Computer, Engineering & Science in Grand Junction, CO?
Percentage of Population Employed in Computer, Engineering & Science in Grand Junction is 5.0%.
What is the Percentage of Population Employed in Computer, Engineering & Science in Colorado?
Percentage of Population Employed in Computer, Engineering & Science in Colorado is 9.0%.
What is the Percentage of Population Employed in Computer, Engineering & Science in the United States?
Percentage of Population Employed in Computer, Engineering & Science in the United States is 6.8%.