Ponderosa Park, CO Map & Demographics
Ponderosa Park Map
Ponderosa Park Overview
$53,175
PER CAPITA INCOME
$126,591
AVG FAMILY INCOME
$127,901
AVG HOUSEHOLD INCOME
36.0%
WAGE / INCOME GAP [ % ]
64.0¢/ $1
WAGE / INCOME GAP [ $ ]
0.32
INEQUALITY / GINI INDEX
3,577
TOTAL POPULATION
1,869
MALE POPULATION
1,708
FEMALE POPULATION
109.43
MALES / 100 FEMALES
91.39
FEMALES / 100 MALES
44.8
MEDIAN AGE
3.0
AVG FAMILY SIZE
2.8
AVG HOUSEHOLD SIZE
1,962
LABOR FORCE [ PEOPLE ]
65.7%
PERCENT IN LABOR FORCE
0.7%
UNEMPLOYMENT RATE
Income in Ponderosa Park
Income Overview in Ponderosa Park
Per Capita Income in Ponderosa Park is $53,175, while median incomes of families and households are $126,591 and $127,901 respectively.
| Characteristic | Number | Measure |
| Per Capita Income | 3,577 | $53,175 |
| Median Family Income | 1,058 | $126,591 |
| Mean Family Income | 1,058 | $149,229 |
| Median Household Income | 1,261 | $127,901 |
| Mean Household Income | 1,261 | $146,764 |
| Income Deficit | 1,058 | $0 |
| Wage / Income Gap (%) | 3,577 | 36.00% |
| Wage / Income Gap ($) | 3,577 | 64.00¢ per $1 |
| Gini / Inequality Index | 3,577 | 0.32 |
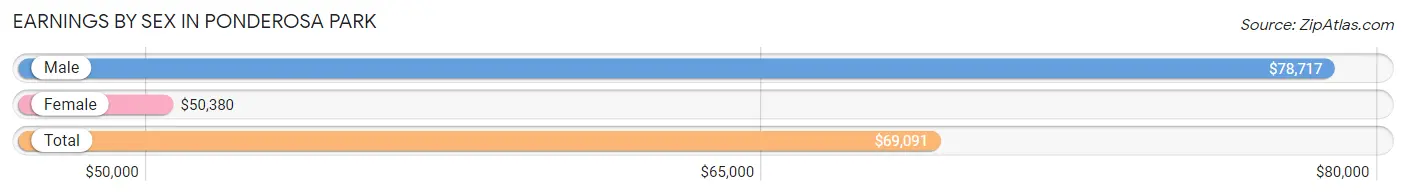
Earnings by Sex in Ponderosa Park
Average Earnings in Ponderosa Park are $69,091, $78,717 for men and $50,380 for women, a difference of 36.0%.
| Sex | Number | Average Earnings |
| Male | 1,225 (57.9%) | $78,717 |
| Female | 891 (42.1%) | $50,380 |
| Total | 2,116 (100.0%) | $69,091 |
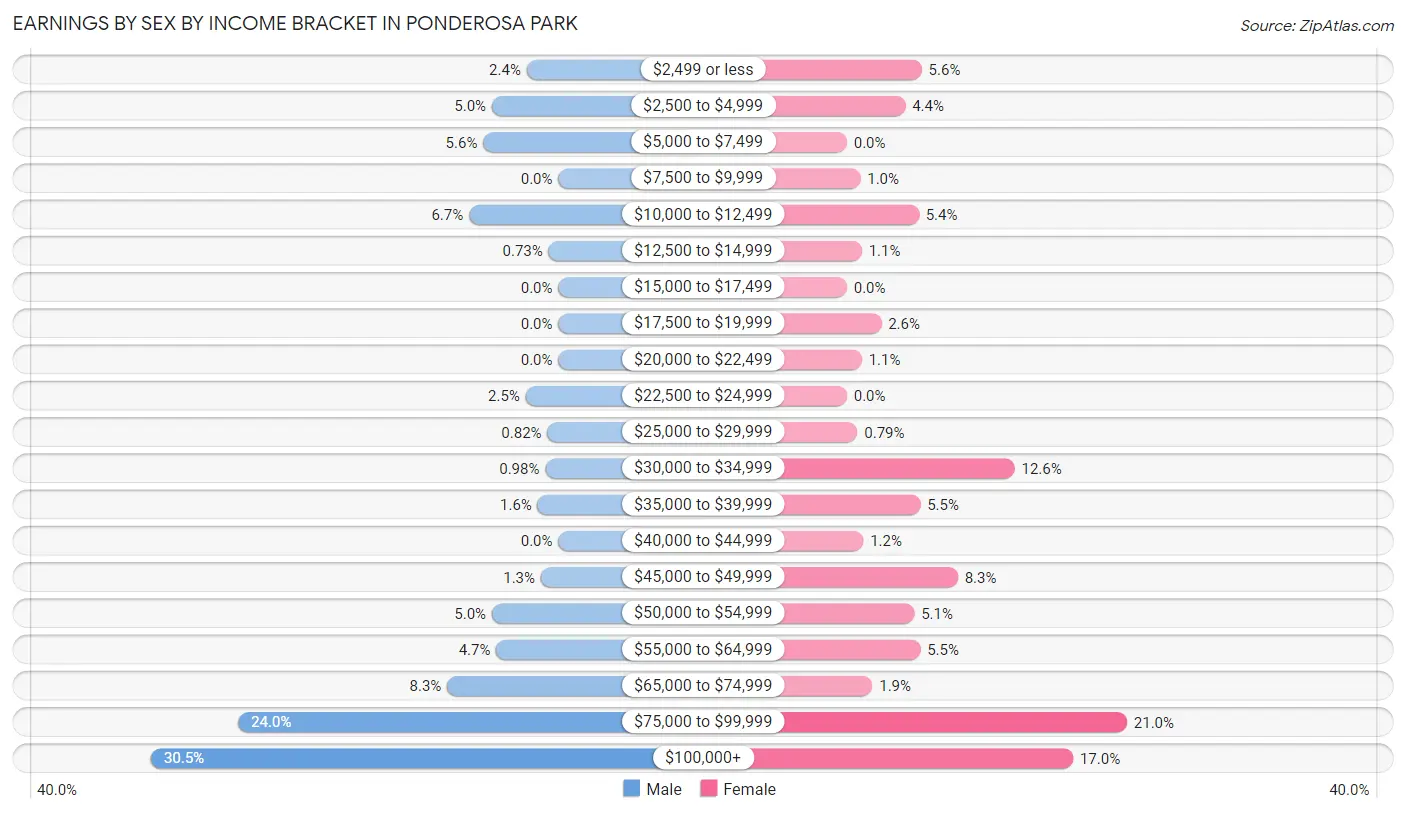
Earnings by Sex by Income Bracket in Ponderosa Park
The most common earnings brackets in Ponderosa Park are $100,000+ for men (374 | 30.5%) and $75,000 to $99,999 for women (187 | 21.0%).
| Income | Male | Female |
| $2,499 or less | 29 (2.4%) | 50 (5.6%) |
| $2,500 to $4,999 | 61 (5.0%) | 39 (4.4%) |
| $5,000 to $7,499 | 69 (5.6%) | 0 (0.0%) |
| $7,500 to $9,999 | 0 (0.0%) | 9 (1.0%) |
| $10,000 to $12,499 | 82 (6.7%) | 48 (5.4%) |
| $12,500 to $14,999 | 9 (0.7%) | 10 (1.1%) |
| $15,000 to $17,499 | 0 (0.0%) | 0 (0.0%) |
| $17,500 to $19,999 | 0 (0.0%) | 23 (2.6%) |
| $20,000 to $22,499 | 0 (0.0%) | 10 (1.1%) |
| $22,500 to $24,999 | 30 (2.5%) | 0 (0.0%) |
| $25,000 to $29,999 | 10 (0.8%) | 7 (0.8%) |
| $30,000 to $34,999 | 12 (1.0%) | 112 (12.6%) |
| $35,000 to $39,999 | 19 (1.5%) | 49 (5.5%) |
| $40,000 to $44,999 | 0 (0.0%) | 11 (1.2%) |
| $45,000 to $49,999 | 16 (1.3%) | 74 (8.3%) |
| $50,000 to $54,999 | 61 (5.0%) | 45 (5.1%) |
| $55,000 to $64,999 | 57 (4.6%) | 49 (5.5%) |
| $65,000 to $74,999 | 102 (8.3%) | 17 (1.9%) |
| $75,000 to $99,999 | 294 (24.0%) | 187 (21.0%) |
| $100,000+ | 374 (30.5%) | 151 (17.0%) |
| Total | 1,225 (100.0%) | 891 (100.0%) |
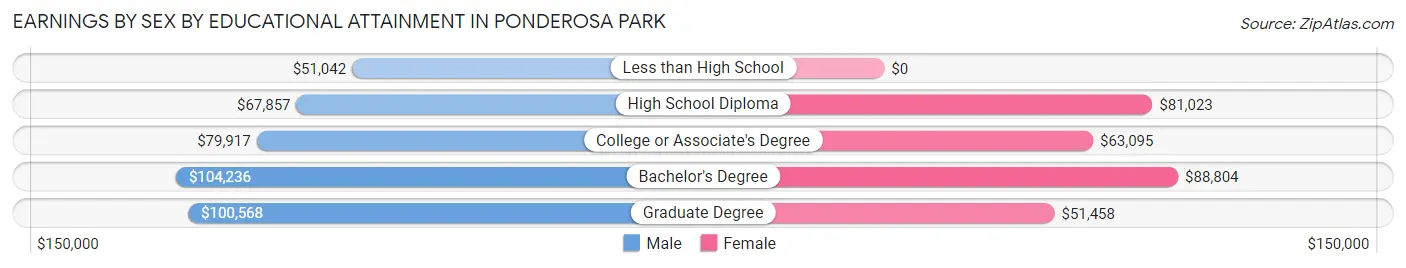
Earnings by Sex by Educational Attainment in Ponderosa Park
Average earnings in Ponderosa Park are $83,750 for men and $64,469 for women, a difference of 23.0%. Men with an educational attainment of bachelor's degree enjoy the highest average annual earnings of $104,236, while those with less than high school education earn the least with $51,042. Women with an educational attainment of bachelor's degree earn the most with the average annual earnings of $88,804, while those with graduate degree education have the smallest earnings of $51,458.
| Educational Attainment | Male Income | Female Income |
| Less than High School | $51,042 | $0 |
| High School Diploma | $67,857 | $81,023 |
| College or Associate's Degree | $79,917 | $63,095 |
| Bachelor's Degree | $104,236 | $88,804 |
| Graduate Degree | $100,568 | $51,458 |
| Total | $83,750 | $64,469 |
Family Income in Ponderosa Park
Family Income Brackets in Ponderosa Park
According to the Ponderosa Park family income data, there are 269 families falling into the $100,000 to $149,999 income range, which is the most common income bracket and makes up 25.4% of all families.
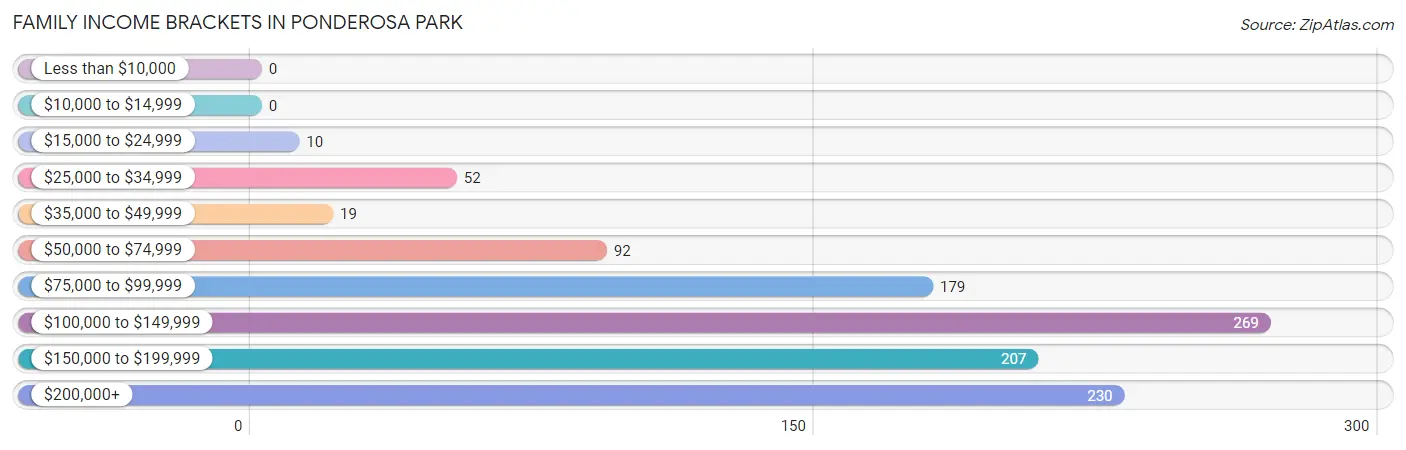
| Income Bracket | # Families | % Families |
| Less than $10,000 | 0 | 0.0% |
| $10,000 to $14,999 | 0 | 0.0% |
| $15,000 to $24,999 | 10 | 0.9% |
| $25,000 to $34,999 | 52 | 4.9% |
| $35,000 to $49,999 | 19 | 1.8% |
| $50,000 to $74,999 | 92 | 8.7% |
| $75,000 to $99,999 | 179 | 16.9% |
| $100,000 to $149,999 | 269 | 25.4% |
| $150,000 to $199,999 | 207 | 19.6% |
| $200,000+ | 230 | 21.7% |
Family Income by Famaliy Size in Ponderosa Park
6-person families (28 | 2.6%) account for the highest median family income in Ponderosa Park with $250,001 per family, while 2-person families (594 | 56.1%) have the highest median income of $60,357 per family member.
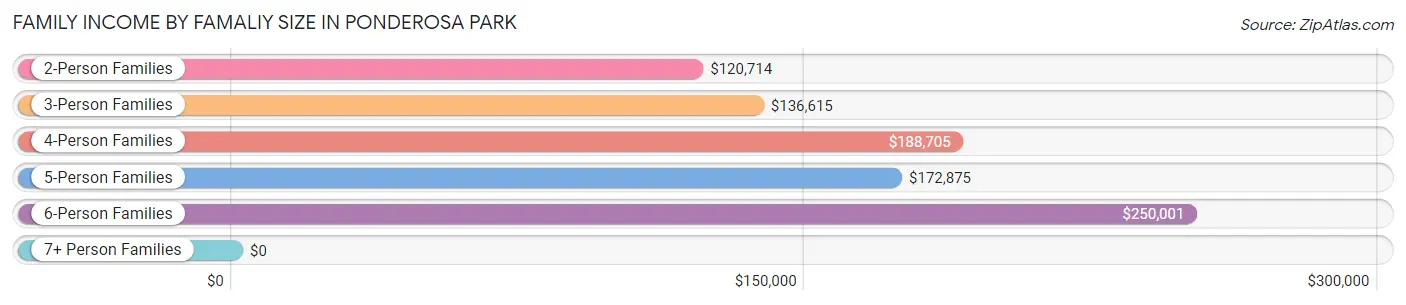
| Income Bracket | # Families | Median Income |
| 2-Person Families | 594 (56.1%) | $120,714 |
| 3-Person Families | 223 (21.1%) | $136,615 |
| 4-Person Families | 123 (11.6%) | $188,705 |
| 5-Person Families | 65 (6.1%) | $172,875 |
| 6-Person Families | 28 (2.6%) | $250,001 |
| 7+ Person Families | 25 (2.4%) | $0 |
| Total | 1,058 (100.0%) | $126,591 |
Family Income by Number of Earners in Ponderosa Park
The median family income in Ponderosa Park is $126,591, with families comprising 3+ earners (147) having the highest median family income of $205,125, while families with no earners (169) have the lowest median family income of $55,139, accounting for 13.9% and 16.0% of families, respectively.
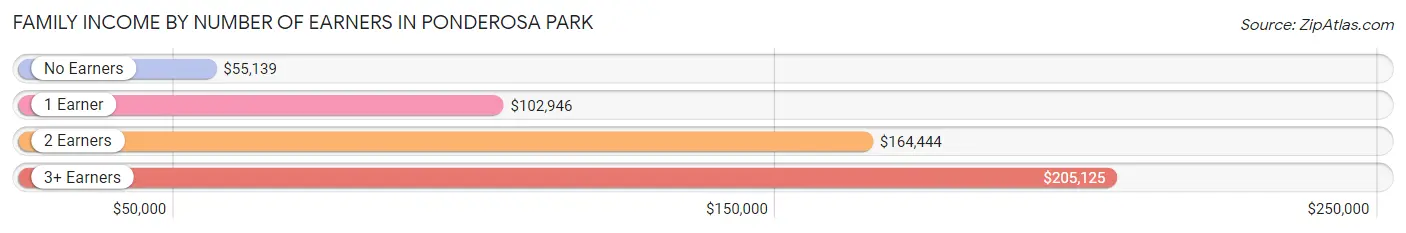
| Number of Earners | # Families | Median Income |
| No Earners | 169 (16.0%) | $55,139 |
| 1 Earner | 348 (32.9%) | $102,946 |
| 2 Earners | 394 (37.2%) | $164,444 |
| 3+ Earners | 147 (13.9%) | $205,125 |
| Total | 1,058 (100.0%) | $126,591 |
Household Income in Ponderosa Park
Household Income Brackets in Ponderosa Park
With 388 households falling in the category, the $100,000 to $149,999 income range is the most frequent in Ponderosa Park, accounting for 30.8% of all households. In contrast, only 9 households (0.7%) fall into the $10,000 to $14,999 income bracket, making it the least populous group.
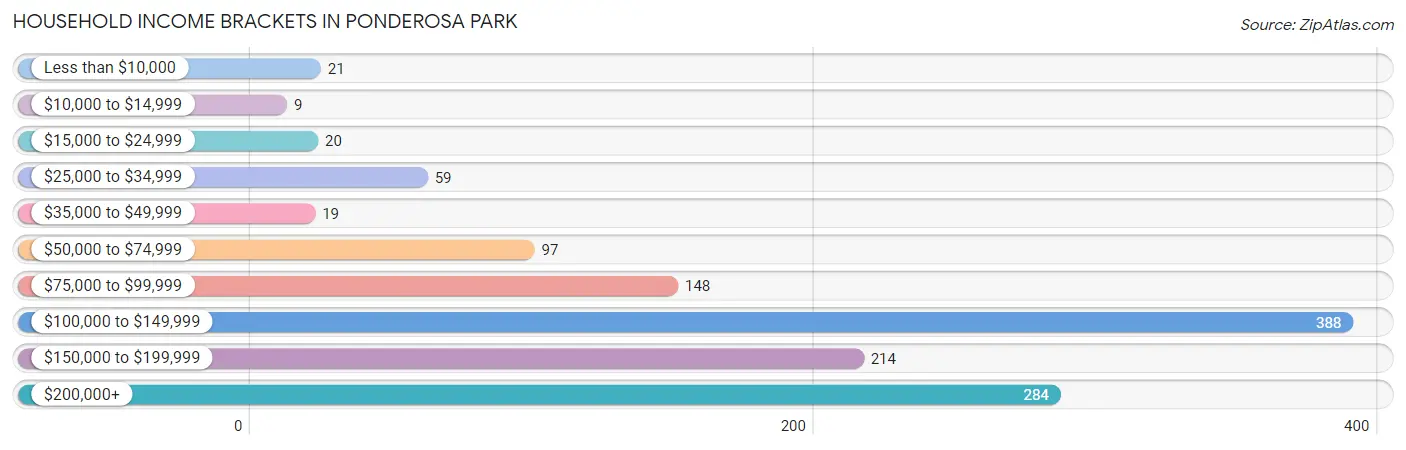
| Income Bracket | # Households | % Households |
| Less than $10,000 | 21 | 1.7% |
| $10,000 to $14,999 | 9 | 0.7% |
| $15,000 to $24,999 | 20 | 1.6% |
| $25,000 to $34,999 | 59 | 4.7% |
| $35,000 to $49,999 | 19 | 1.5% |
| $50,000 to $74,999 | 97 | 7.7% |
| $75,000 to $99,999 | 148 | 11.7% |
| $100,000 to $149,999 | 388 | 30.8% |
| $150,000 to $199,999 | 214 | 17.0% |
| $200,000+ | 284 | 22.5% |
Household Income by Householder Age in Ponderosa Park
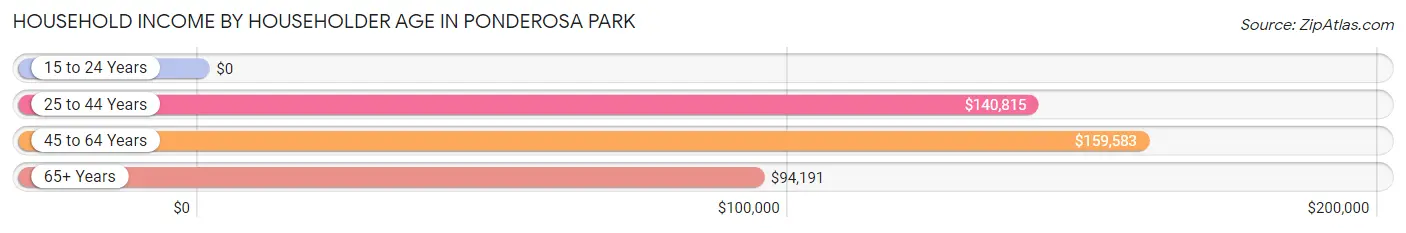
The median household income in Ponderosa Park is $127,901, with the highest median household income of $159,583 found in the 45 to 64 years age bracket for the primary householder. A total of 567 households (45.0%) fall into this category. Meanwhile, the 15 to 24 years age bracket for the primary householder has the lowest median household income of $0, with 24 households (1.9%) in this group.
| Income Bracket | # Households | Median Income |
| 15 to 24 Years | 24 (1.9%) | $0 |
| 25 to 44 Years | 315 (25.0%) | $140,815 |
| 45 to 64 Years | 567 (45.0%) | $159,583 |
| 65+ Years | 355 (28.1%) | $94,191 |
| Total | 1,261 (100.0%) | $127,901 |
Poverty in Ponderosa Park
Income Below Poverty by Sex and Age in Ponderosa Park
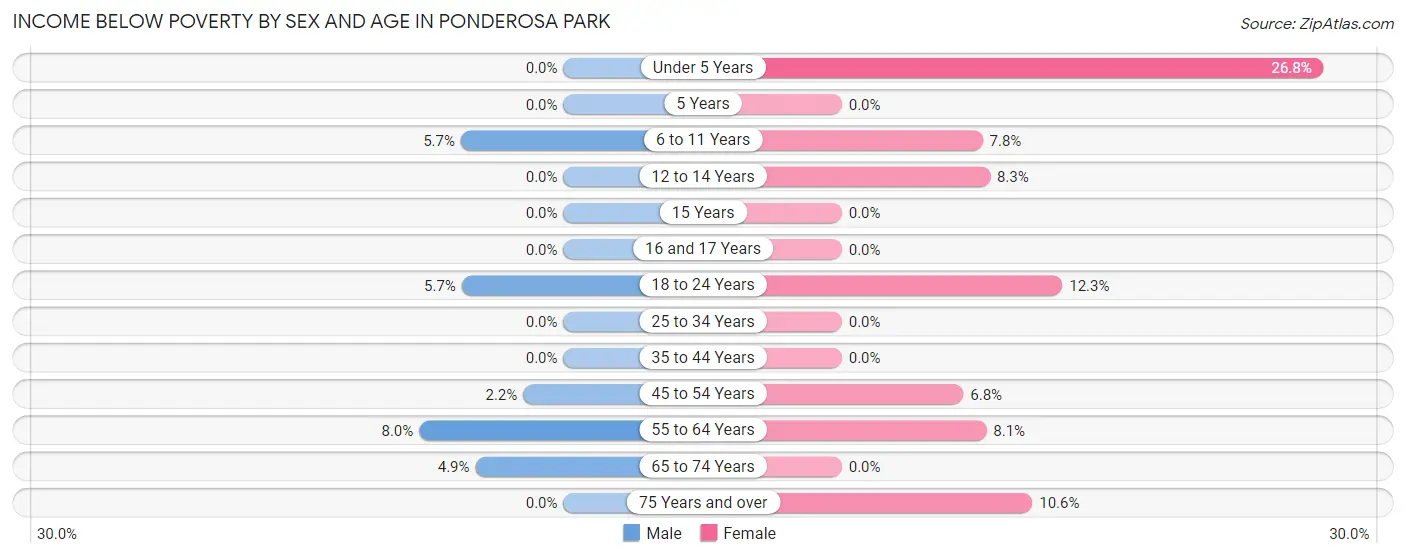
With 3.2% poverty level for males and 5.3% for females among the residents of Ponderosa Park, 55 to 64 year old males and under 5 year old females are the most vulnerable to poverty, with 20 males (8.0%) and 11 females (26.8%) in their respective age groups living below the poverty level.
| Age Bracket | Male | Female |
| Under 5 Years | 0 (0.0%) | 11 (26.8%) |
| 5 Years | 0 (0.0%) | 0 (0.0%) |
| 6 to 11 Years | 8 (5.7%) | 8 (7.8%) |
| 12 to 14 Years | 0 (0.0%) | 8 (8.3%) |
| 15 Years | 0 (0.0%) | 0 (0.0%) |
| 16 and 17 Years | 0 (0.0%) | 0 (0.0%) |
| 18 to 24 Years | 12 (5.7%) | 14 (12.3%) |
| 25 to 34 Years | 0 (0.0%) | 0 (0.0%) |
| 35 to 44 Years | 0 (0.0%) | 0 (0.0%) |
| 45 to 54 Years | 6 (2.2%) | 17 (6.8%) |
| 55 to 64 Years | 20 (8.0%) | 26 (8.1%) |
| 65 to 74 Years | 14 (4.9%) | 0 (0.0%) |
| 75 Years and over | 0 (0.0%) | 7 (10.6%) |
| Total | 60 (3.2%) | 91 (5.3%) |
Income Above Poverty by Sex and Age in Ponderosa Park
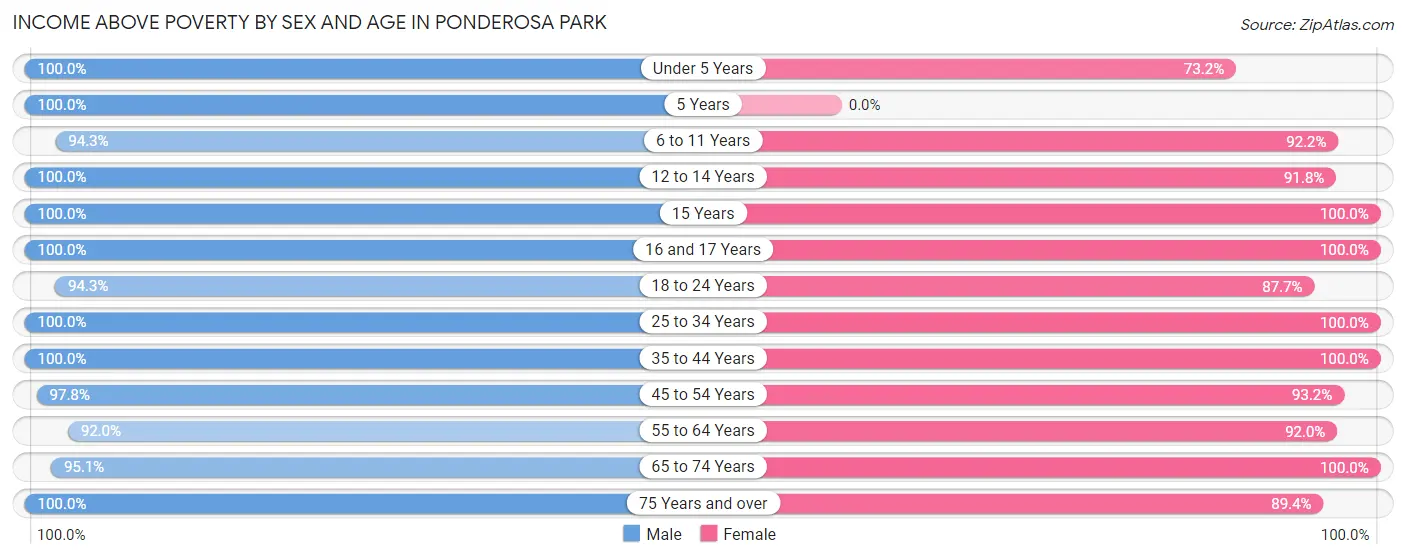
According to the poverty statistics in Ponderosa Park, males aged under 5 years and females aged 15 years are the age groups that are most secure financially, with 100.0% of males and 100.0% of females in these age groups living above the poverty line.
| Age Bracket | Male | Female |
| Under 5 Years | 63 (100.0%) | 30 (73.2%) |
| 5 Years | 12 (100.0%) | 0 (0.0%) |
| 6 to 11 Years | 132 (94.3%) | 94 (92.2%) |
| 12 to 14 Years | 61 (100.0%) | 89 (91.7%) |
| 15 Years | 46 (100.0%) | 28 (100.0%) |
| 16 and 17 Years | 36 (100.0%) | 89 (100.0%) |
| 18 to 24 Years | 200 (94.3%) | 100 (87.7%) |
| 25 to 34 Years | 157 (100.0%) | 84 (100.0%) |
| 35 to 44 Years | 246 (100.0%) | 277 (100.0%) |
| 45 to 54 Years | 262 (97.8%) | 234 (93.2%) |
| 55 to 64 Years | 229 (92.0%) | 297 (91.9%) |
| 65 to 74 Years | 272 (95.1%) | 236 (100.0%) |
| 75 Years and over | 93 (100.0%) | 59 (89.4%) |
| Total | 1,809 (96.8%) | 1,617 (94.7%) |
Income Below Poverty Among Married-Couple Families in Ponderosa Park
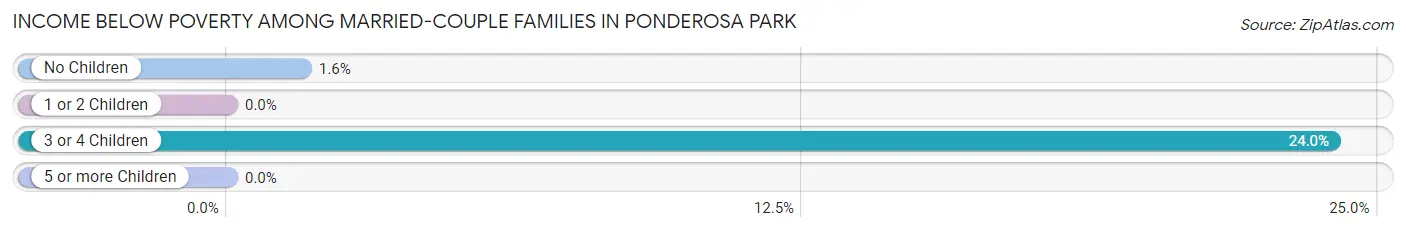
The poverty statistics for married-couple families in Ponderosa Park show that 1.9% or 16 of the total 862 families live below the poverty line. Families with 3 or 4 children have the highest poverty rate of 24.0%, comprising of 6 families. On the other hand, families with 1 or 2 children have the lowest poverty rate of 0.0%, which includes 0 families.
| Children | Above Poverty | Below Poverty |
| No Children | 612 (98.4%) | 10 (1.6%) |
| 1 or 2 Children | 198 (100.0%) | 0 (0.0%) |
| 3 or 4 Children | 19 (76.0%) | 6 (24.0%) |
| 5 or more Children | 17 (100.0%) | 0 (0.0%) |
| Total | 846 (98.1%) | 16 (1.9%) |
Income Below Poverty Among Single-Parent Households in Ponderosa Park
| Children | Single Father | Single Mother |
| No Children | 0 (0.0%) | 0 (0.0%) |
| 1 or 2 Children | 0 (0.0%) | 0 (0.0%) |
| 3 or 4 Children | 0 (0.0%) | 0 (0.0%) |
| 5 or more Children | 0 (0.0%) | 0 (0.0%) |
| Total | 0 (0.0%) | 0 (0.0%) |
Income Below Poverty Among Married-Couple vs Single-Parent Households in Ponderosa Park
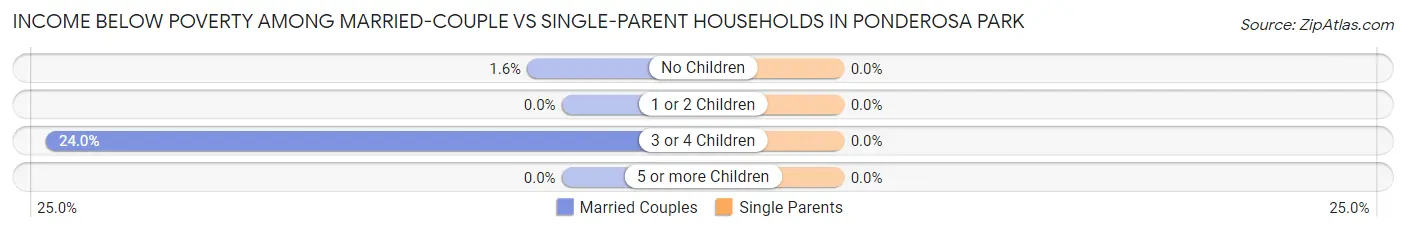
| Children | Married-Couple Families | Single-Parent Households |
| No Children | 10 (1.6%) | 0 (0.0%) |
| 1 or 2 Children | 0 (0.0%) | 0 (0.0%) |
| 3 or 4 Children | 6 (24.0%) | 0 (0.0%) |
| 5 or more Children | 0 (0.0%) | 0 (0.0%) |
| Total | 16 (1.9%) | 0 (0.0%) |
Race in Ponderosa Park
The most populous races in Ponderosa Park are White / Caucasian (3,389 | 94.7%), Hispanic or Latino (176 | 4.9%), and Two or more Races (80 | 2.2%).
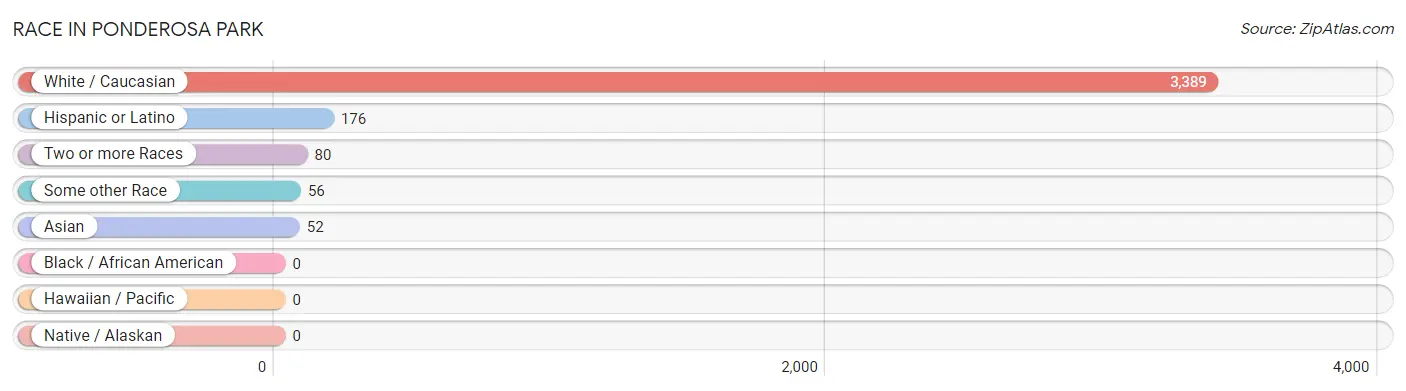
| Race | # Population | % Population |
| Asian | 52 | 1.5% |
| Black / African American | 0 | 0.0% |
| Hawaiian / Pacific | 0 | 0.0% |
| Hispanic or Latino | 176 | 4.9% |
| Native / Alaskan | 0 | 0.0% |
| White / Caucasian | 3,389 | 94.7% |
| Two or more Races | 80 | 2.2% |
| Some other Race | 56 | 1.6% |
| Total | 3,577 | 100.0% |
Ancestry in Ponderosa Park
The most populous ancestries reported in Ponderosa Park are English (932 | 26.1%), German (804 | 22.5%), Irish (413 | 11.6%), Scottish (248 | 6.9%), and Italian (167 | 4.7%), together accounting for 71.7% of all Ponderosa Park residents.
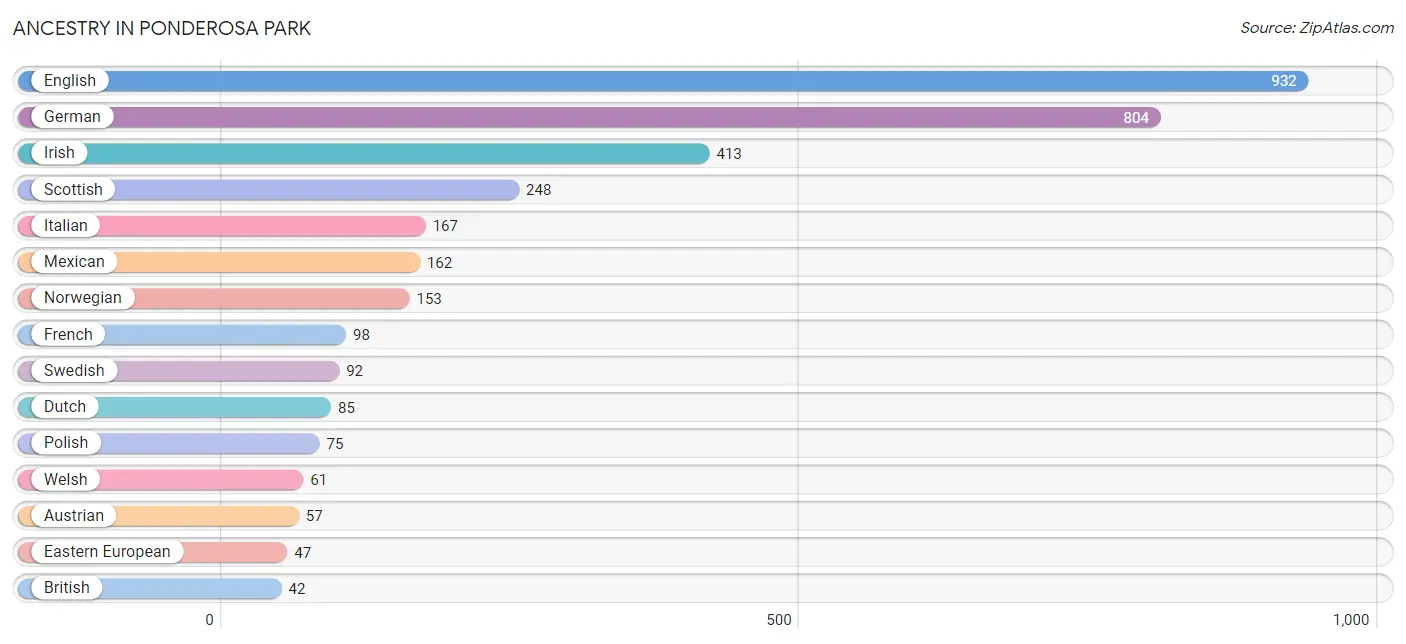
| Ancestry | # Population | % Population |
| African | 7 | 0.2% |
| American | 8 | 0.2% |
| Austrian | 57 | 1.6% |
| Bhutanese | 27 | 0.7% |
| British | 42 | 1.2% |
| Czech | 38 | 1.1% |
| Dutch | 85 | 2.4% |
| Eastern European | 47 | 1.3% |
| English | 932 | 26.1% |
| European | 34 | 0.9% |
| French | 98 | 2.7% |
| French Canadian | 29 | 0.8% |
| German | 804 | 22.5% |
| Greek | 9 | 0.3% |
| Hungarian | 20 | 0.6% |
| Indian (Asian) | 25 | 0.7% |
| Irish | 413 | 11.6% |
| Italian | 167 | 4.7% |
| Mexican | 162 | 4.5% |
| Norwegian | 153 | 4.3% |
| Polish | 75 | 2.1% |
| Scotch-Irish | 17 | 0.5% |
| Scottish | 248 | 6.9% |
| Spanish | 14 | 0.4% |
| Sri Lankan | 25 | 0.7% |
| Subsaharan African | 7 | 0.2% |
| Swedish | 92 | 2.6% |
| Swiss | 23 | 0.6% |
| Tlingit-Haida | 18 | 0.5% |
| Welsh | 61 | 1.7% |
| Yugoslavian | 10 | 0.3% | View All 31 Rows |
Immigrants in Ponderosa Park
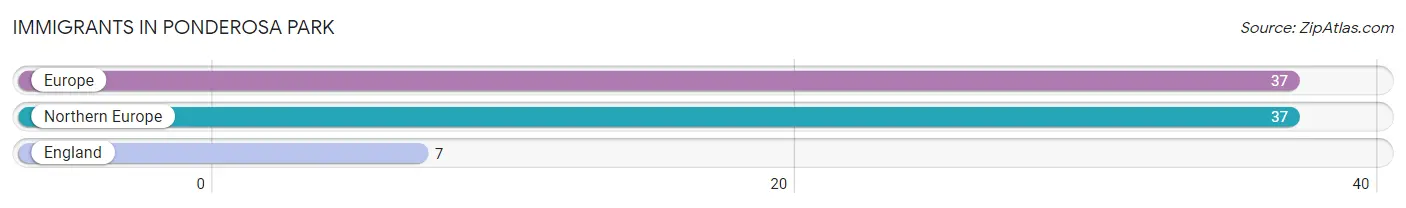
The most numerous immigrant groups reported in Ponderosa Park came from Europe (37 | 1.0%), Northern Europe (37 | 1.0%), and England (7 | 0.2%), together accounting for 2.3% of all Ponderosa Park residents.
| Immigration Origin | # Population | % Population |
| England | 7 | 0.2% |
| Europe | 37 | 1.0% |
| Northern Europe | 37 | 1.0% | View All 3 Rows |
Sex and Age in Ponderosa Park
Sex and Age in Ponderosa Park
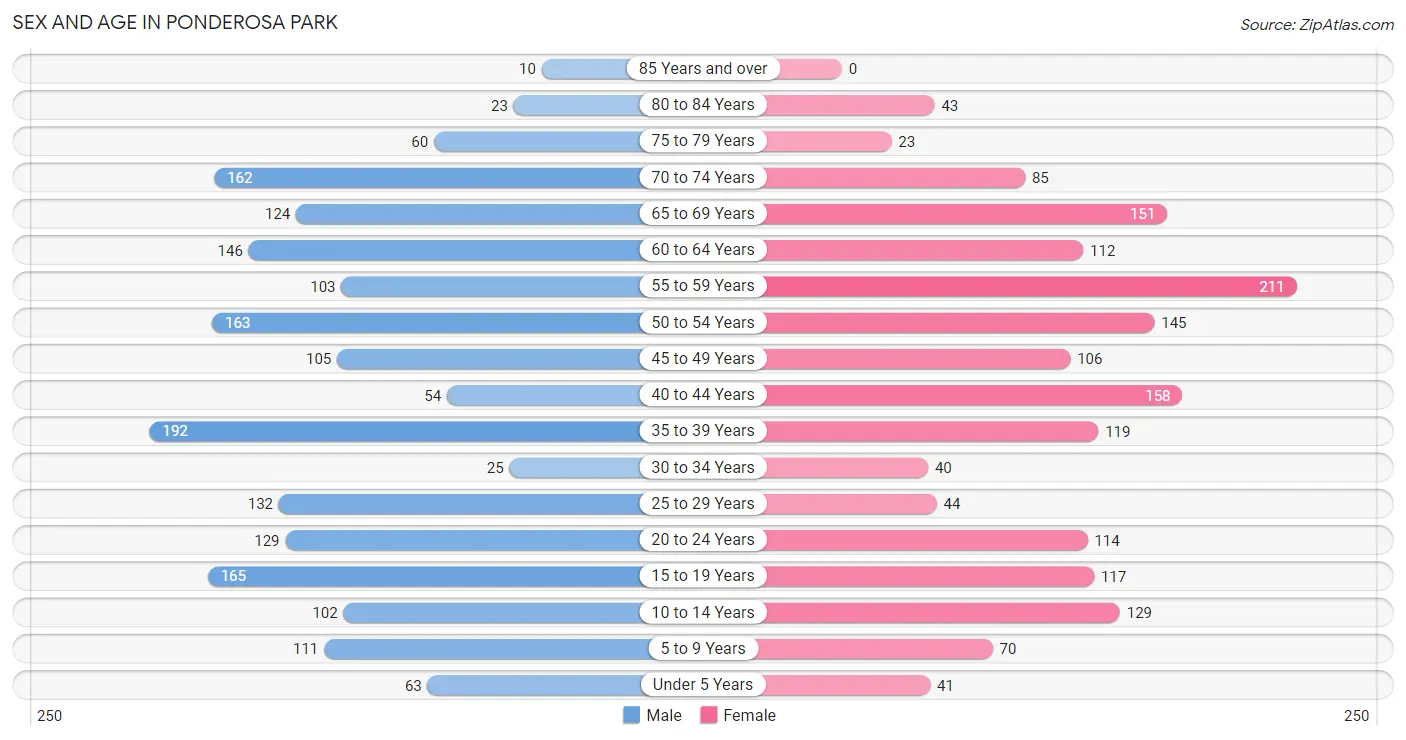
The most populous age groups in Ponderosa Park are 35 to 39 Years (192 | 10.3%) for men and 55 to 59 Years (211 | 12.3%) for women.
| Age Bracket | Male | Female |
| Under 5 Years | 63 (3.4%) | 41 (2.4%) |
| 5 to 9 Years | 111 (5.9%) | 70 (4.1%) |
| 10 to 14 Years | 102 (5.5%) | 129 (7.5%) |
| 15 to 19 Years | 165 (8.8%) | 117 (6.9%) |
| 20 to 24 Years | 129 (6.9%) | 114 (6.7%) |
| 25 to 29 Years | 132 (7.1%) | 44 (2.6%) |
| 30 to 34 Years | 25 (1.3%) | 40 (2.3%) |
| 35 to 39 Years | 192 (10.3%) | 119 (7.0%) |
| 40 to 44 Years | 54 (2.9%) | 158 (9.2%) |
| 45 to 49 Years | 105 (5.6%) | 106 (6.2%) |
| 50 to 54 Years | 163 (8.7%) | 145 (8.5%) |
| 55 to 59 Years | 103 (5.5%) | 211 (12.3%) |
| 60 to 64 Years | 146 (7.8%) | 112 (6.6%) |
| 65 to 69 Years | 124 (6.6%) | 151 (8.8%) |
| 70 to 74 Years | 162 (8.7%) | 85 (5.0%) |
| 75 to 79 Years | 60 (3.2%) | 23 (1.3%) |
| 80 to 84 Years | 23 (1.2%) | 43 (2.5%) |
| 85 Years and over | 10 (0.5%) | 0 (0.0%) |
| Total | 1,869 (100.0%) | 1,708 (100.0%) |
Families and Households in Ponderosa Park
Median Family Size in Ponderosa Park
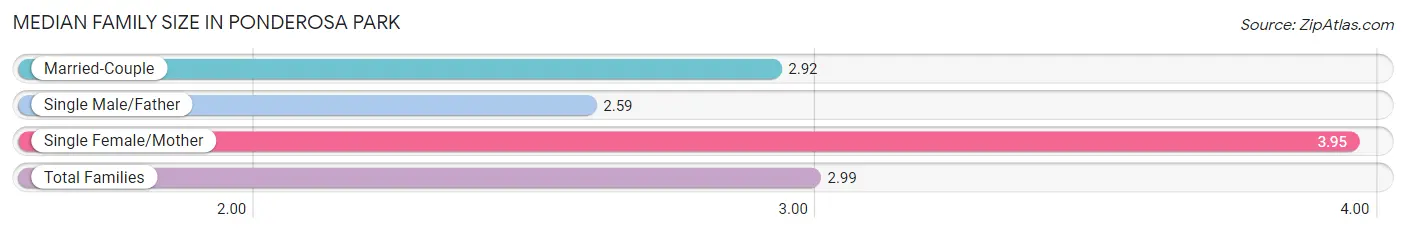
The median family size in Ponderosa Park is 2.99 persons per family, with single female/mother families (100 | 9.5%) accounting for the largest median family size of 3.95 persons per family. On the other hand, single male/father families (96 | 9.1%) represent the smallest median family size with 2.59 persons per family.
| Family Type | # Families | Family Size |
| Married-Couple | 862 (81.5%) | 2.92 |
| Single Male/Father | 96 (9.1%) | 2.59 |
| Single Female/Mother | 100 (9.5%) | 3.95 |
| Total Families | 1,058 (100.0%) | 2.99 |
Median Household Size in Ponderosa Park
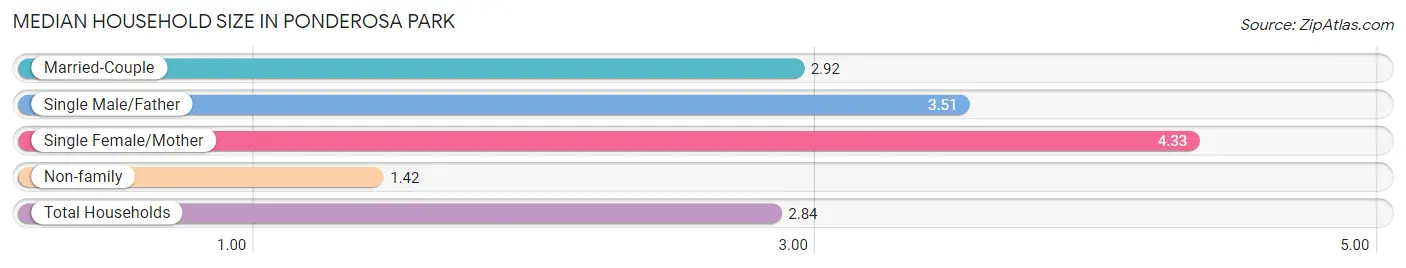
The median household size in Ponderosa Park is 2.84 persons per household, with single female/mother households (100 | 7.9%) accounting for the largest median household size of 4.33 persons per household. non-family households (203 | 16.1%) represent the smallest median household size with 1.42 persons per household.
| Household Type | # Households | Household Size |
| Married-Couple | 862 (68.4%) | 2.92 |
| Single Male/Father | 96 (7.6%) | 3.51 |
| Single Female/Mother | 100 (7.9%) | 4.33 |
| Non-family | 203 (16.1%) | 1.42 |
| Total Households | 1,261 (100.0%) | 2.84 |
Household Size by Marriage Status in Ponderosa Park
Out of a total of 1,261 households in Ponderosa Park, 1,058 (83.9%) are family households, while 203 (16.1%) are nonfamily households. The most numerous type of family households are 2-person households, comprising 536, and the most common type of nonfamily households are 1-person households, comprising 124.
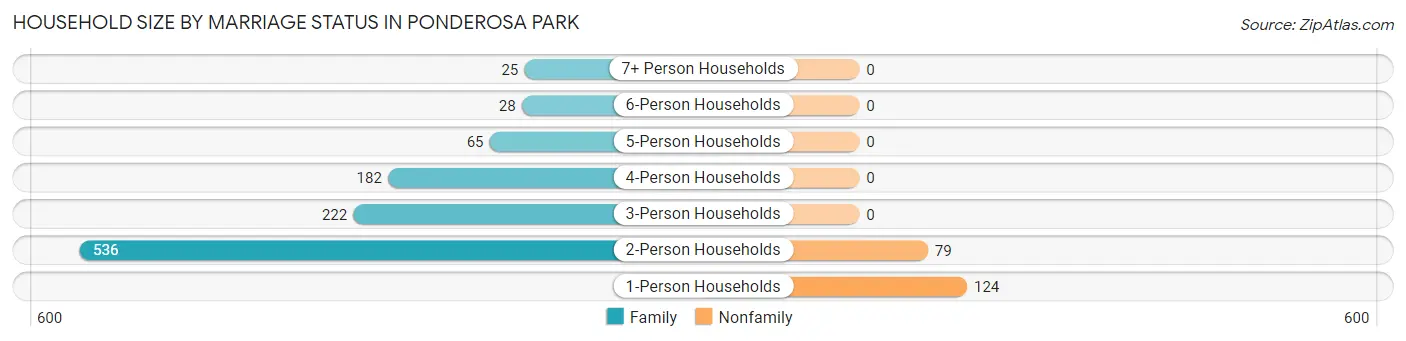
| Household Size | Family Households | Nonfamily Households |
| 1-Person Households | - | 124 (9.8%) |
| 2-Person Households | 536 (42.5%) | 79 (6.3%) |
| 3-Person Households | 222 (17.6%) | 0 (0.0%) |
| 4-Person Households | 182 (14.4%) | 0 (0.0%) |
| 5-Person Households | 65 (5.1%) | 0 (0.0%) |
| 6-Person Households | 28 (2.2%) | 0 (0.0%) |
| 7+ Person Households | 25 (2.0%) | 0 (0.0%) |
| Total | 1,058 (83.9%) | 203 (16.1%) |
Female Fertility in Ponderosa Park
Fertility by Age in Ponderosa Park
| Age Bracket | Women with Births | Births / 1,000 Women |
| 15 to 19 years | 0 (0.0%) | 0.0 |
| 20 to 34 years | 0 (0.0%) | 0.0 |
| 35 to 50 years | 0 (0.0%) | 0.0 |
| Total | 0 (0.0%) | 0.0 |
Fertility by Age by Marriage Status in Ponderosa Park
| Age Bracket | Married | Unmarried |
| 15 to 19 years | 0 (0.0%) | 0 (0.0%) |
| 20 to 34 years | 0 (0.0%) | 0 (0.0%) |
| 35 to 50 years | 0 (0.0%) | 0 (0.0%) |
| Total | 0 (0.0%) | 0 (0.0%) |
Fertility by Education in Ponderosa Park
| Educational Attainment | Women with Births | Births / 1,000 Women |
| Less than High School | 0 (0.0%) | 0.0 |
| High School Diploma | 0 (0.0%) | 0.0 |
| College or Associate's Degree | 0 (0.0%) | 0.0 |
| Bachelor's Degree | 0 (0.0%) | 0.0 |
| Graduate Degree | 0 (0.0%) | 0.0 |
| Total | 0 (0.0%) | 0.0 |
Fertility by Education by Marriage Status in Ponderosa Park
| Educational Attainment | Married | Unmarried |
| Less than High School | 0 (0.0%) | 0 (0.0%) |
| High School Diploma | 0 (0.0%) | 0 (0.0%) |
| College or Associate's Degree | 0 (0.0%) | 0 (0.0%) |
| Bachelor's Degree | 0 (0.0%) | 0 (0.0%) |
| Graduate Degree | 0 (0.0%) | 0 (0.0%) |
| Total | 0 (0.0%) | 0 (0.0%) |
Employment Characteristics in Ponderosa Park
Employment by Class of Employer in Ponderosa Park
Among the 1,948 employed individuals in Ponderosa Park, private company employees (1,318 | 67.7%), self-employed (incorporated) (151 | 7.7%), and local government employees (144 | 7.4%) make up the most common classes of employment.
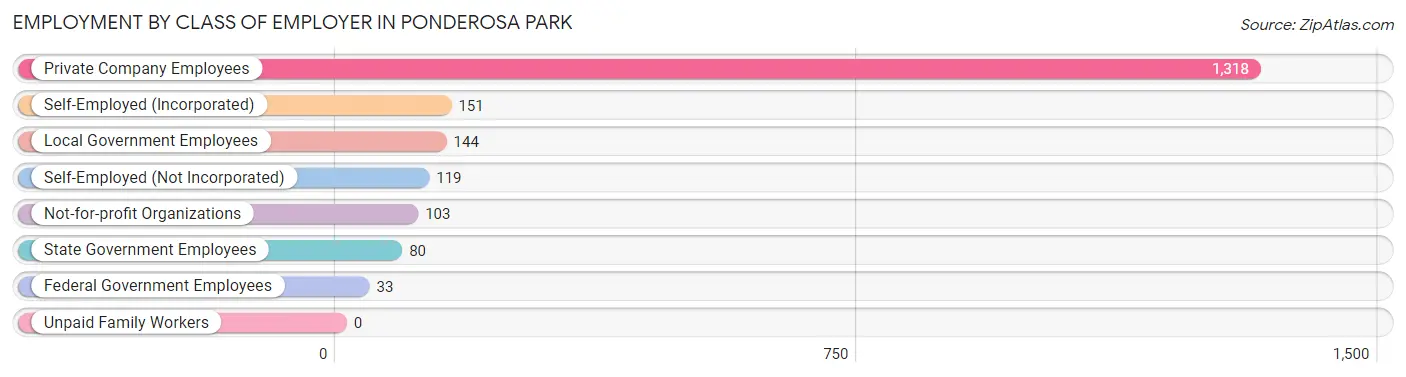
| Employer Class | # Employees | % Employees |
| Private Company Employees | 1,318 | 67.7% |
| Self-Employed (Incorporated) | 151 | 7.7% |
| Self-Employed (Not Incorporated) | 119 | 6.1% |
| Not-for-profit Organizations | 103 | 5.3% |
| Local Government Employees | 144 | 7.4% |
| State Government Employees | 80 | 4.1% |
| Federal Government Employees | 33 | 1.7% |
| Unpaid Family Workers | 0 | 0.0% |
| Total | 1,948 | 100.0% |
Employment Status by Age in Ponderosa Park
According to the labor force statistics for Ponderosa Park, out of the total population over 16 years of age (2,987), 65.7% or 1,962 individuals are in the labor force, with 0.7% or 14 of them unemployed. The age group with the highest labor force participation rate is 25 to 29 years, with 100.0% or 176 individuals in the labor force. Within the labor force, the 25 to 29 years age range has the highest percentage of unemployed individuals, with 8.0% or 14 of them being unemployed.
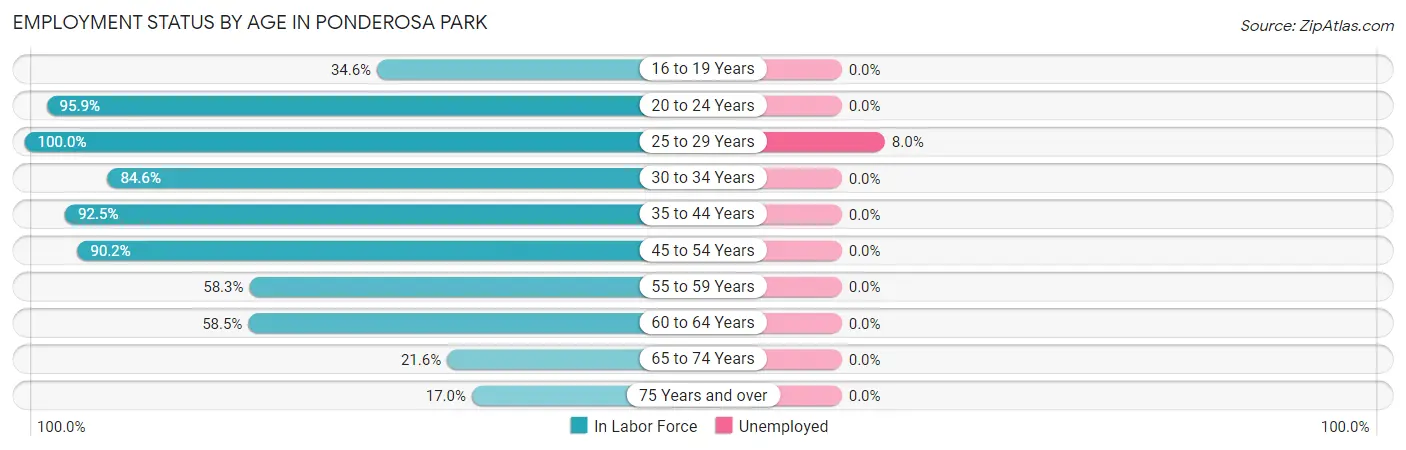
| Age Bracket | In Labor Force | Unemployed |
| 16 to 19 Years | 72 (34.6%) | 0 (0.0%) |
| 20 to 24 Years | 233 (95.9%) | 0 (0.0%) |
| 25 to 29 Years | 176 (100.0%) | 14 (8.0%) |
| 30 to 34 Years | 55 (84.6%) | 0 (0.0%) |
| 35 to 44 Years | 484 (92.5%) | 0 (0.0%) |
| 45 to 54 Years | 468 (90.2%) | 0 (0.0%) |
| 55 to 59 Years | 183 (58.3%) | 0 (0.0%) |
| 60 to 64 Years | 151 (58.5%) | 0 (0.0%) |
| 65 to 74 Years | 113 (21.6%) | 0 (0.0%) |
| 75 Years and over | 27 (17.0%) | 0 (0.0%) |
| Total | 1,962 (65.7%) | 14 (0.7%) |
Employment Status by Educational Attainment in Ponderosa Park
According to labor force statistics for Ponderosa Park, 81.8% of individuals (1,517) out of the total population between 25 and 64 years of age (1,855) are in the labor force, with 0.9% or 14 of them being unemployed. The group with the highest labor force participation rate are those with the educational attainment of college / associate degree, with 89.4% or 551 individuals in the labor force. Within the labor force, individuals with college / associate degree education have the highest percentage of unemployment, with 2.5% or 14 of them being unemployed.
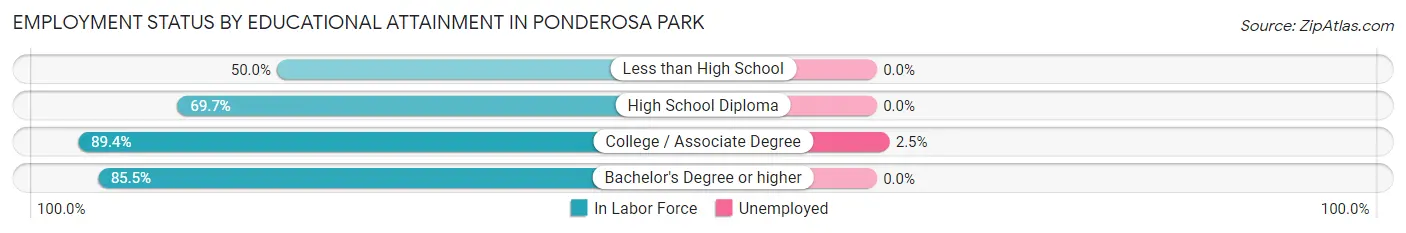
| Educational Attainment | In Labor Force | Unemployed |
| Less than High School | 35 (50.0%) | 0 (0.0%) |
| High School Diploma | 301 (69.7%) | 0 (0.0%) |
| College / Associate Degree | 551 (89.4%) | 15 (2.5%) |
| Bachelor's Degree or higher | 630 (85.5%) | 0 (0.0%) |
| Total | 1,517 (81.8%) | 17 (0.9%) |
Employment Occupations by Sex in Ponderosa Park
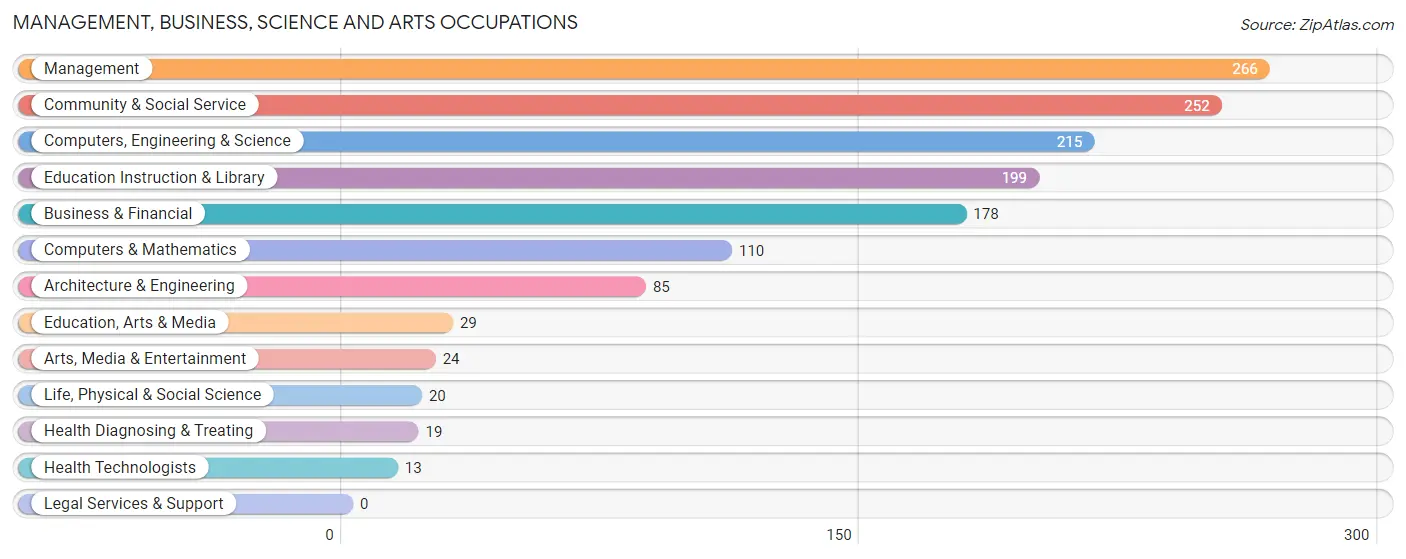
Management, Business, Science and Arts Occupations
The most common Management, Business, Science and Arts occupations in Ponderosa Park are Management (266 | 13.8%), Community & Social Service (252 | 13.0%), Computers, Engineering & Science (215 | 11.1%), Education Instruction & Library (199 | 10.3%), and Business & Financial (178 | 9.2%).
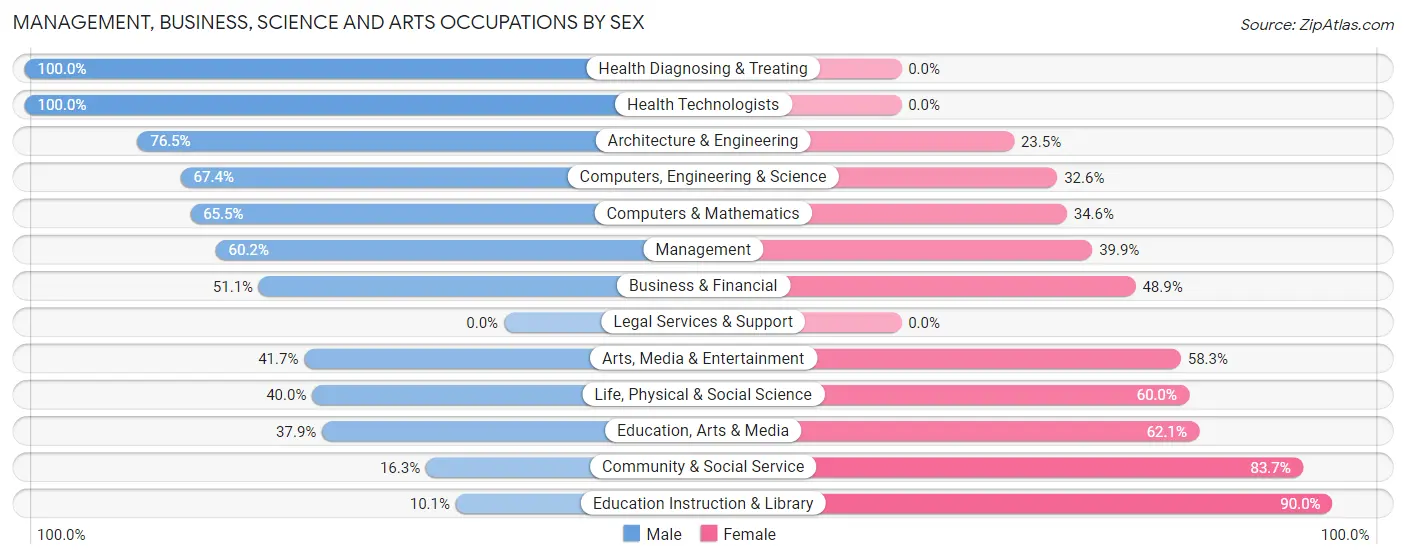
Management, Business, Science and Arts Occupations by Sex
Within the Management, Business, Science and Arts occupations in Ponderosa Park, the most male-oriented occupations are Health Diagnosing & Treating (100.0%), Health Technologists (100.0%), and Architecture & Engineering (76.5%), while the most female-oriented occupations are Education Instruction & Library (89.9%), Community & Social Service (83.7%), and Education, Arts & Media (62.1%).
| Occupation | Male | Female |
| Management | 160 (60.2%) | 106 (39.9%) |
| Business & Financial | 91 (51.1%) | 87 (48.9%) |
| Computers, Engineering & Science | 145 (67.4%) | 70 (32.6%) |
| Computers & Mathematics | 72 (65.4%) | 38 (34.5%) |
| Architecture & Engineering | 65 (76.5%) | 20 (23.5%) |
| Life, Physical & Social Science | 8 (40.0%) | 12 (60.0%) |
| Community & Social Service | 41 (16.3%) | 211 (83.7%) |
| Education, Arts & Media | 11 (37.9%) | 18 (62.1%) |
| Legal Services & Support | 0 (0.0%) | 0 (0.0%) |
| Education Instruction & Library | 20 (10.1%) | 179 (89.9%) |
| Arts, Media & Entertainment | 10 (41.7%) | 14 (58.3%) |
| Health Diagnosing & Treating | 19 (100.0%) | 0 (0.0%) |
| Health Technologists | 13 (100.0%) | 0 (0.0%) |
| Total (Category) | 456 (49.0%) | 474 (51.0%) |
| Total (Overall) | 1,140 (59.0%) | 794 (41.0%) |
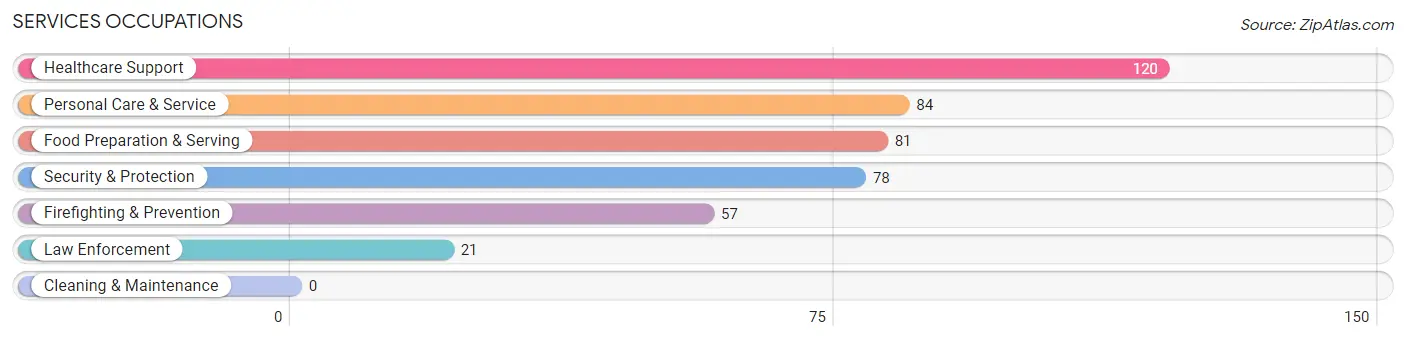
Services Occupations
The most common Services occupations in Ponderosa Park are Healthcare Support (120 | 6.2%), Personal Care & Service (84 | 4.3%), Food Preparation & Serving (81 | 4.2%), Security & Protection (78 | 4.0%), and Firefighting & Prevention (57 | 2.9%).
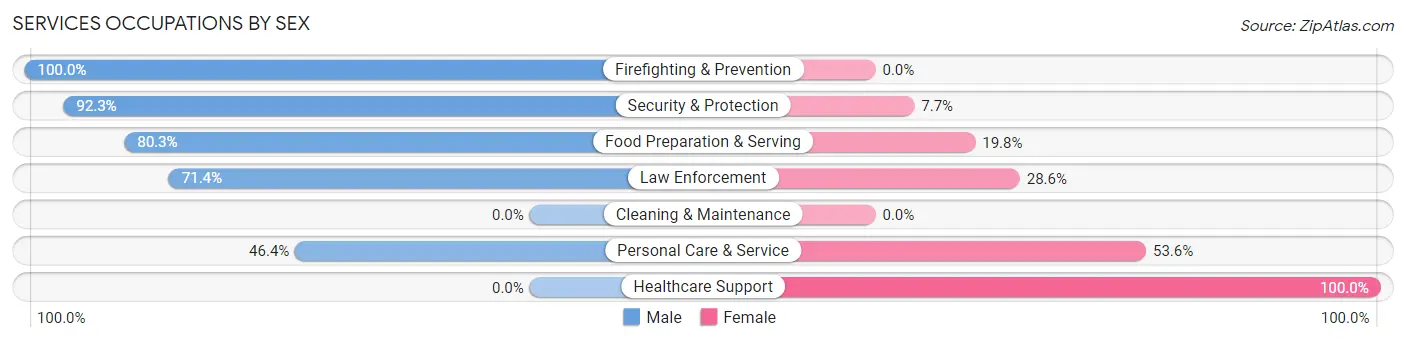
Services Occupations by Sex
Within the Services occupations in Ponderosa Park, the most male-oriented occupations are Firefighting & Prevention (100.0%), Security & Protection (92.3%), and Food Preparation & Serving (80.2%), while the most female-oriented occupations are Healthcare Support (100.0%), Personal Care & Service (53.6%), and Law Enforcement (28.6%).
| Occupation | Male | Female |
| Healthcare Support | 0 (0.0%) | 120 (100.0%) |
| Security & Protection | 72 (92.3%) | 6 (7.7%) |
| Firefighting & Prevention | 57 (100.0%) | 0 (0.0%) |
| Law Enforcement | 15 (71.4%) | 6 (28.6%) |
| Food Preparation & Serving | 65 (80.2%) | 16 (19.8%) |
| Cleaning & Maintenance | 0 (0.0%) | 0 (0.0%) |
| Personal Care & Service | 39 (46.4%) | 45 (53.6%) |
| Total (Category) | 176 (48.5%) | 187 (51.5%) |
| Total (Overall) | 1,140 (59.0%) | 794 (41.0%) |
Sales and Office Occupations
The most common Sales and Office occupations in Ponderosa Park are Sales & Related (108 | 5.6%), and Office & Administration (108 | 5.6%).
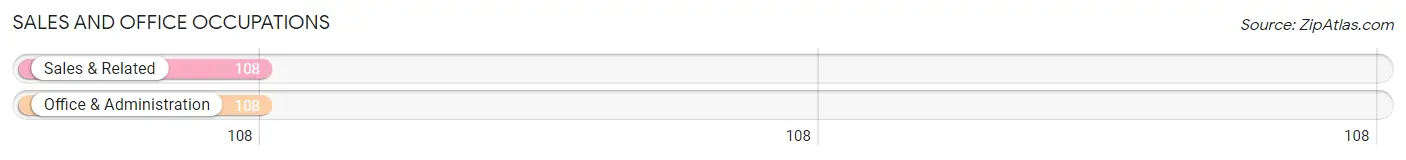
Sales and Office Occupations by Sex

| Occupation | Male | Female |
| Sales & Related | 54 (50.0%) | 54 (50.0%) |
| Office & Administration | 36 (33.3%) | 72 (66.7%) |
| Total (Category) | 90 (41.7%) | 126 (58.3%) |
| Total (Overall) | 1,140 (59.0%) | 794 (41.0%) |
Natural Resources, Construction and Maintenance Occupations
The most common Natural Resources, Construction and Maintenance occupations in Ponderosa Park are Installation, Maintenance & Repair (145 | 7.5%), Construction & Extraction (109 | 5.6%), and Farming, Fishing & Forestry (11 | 0.6%).
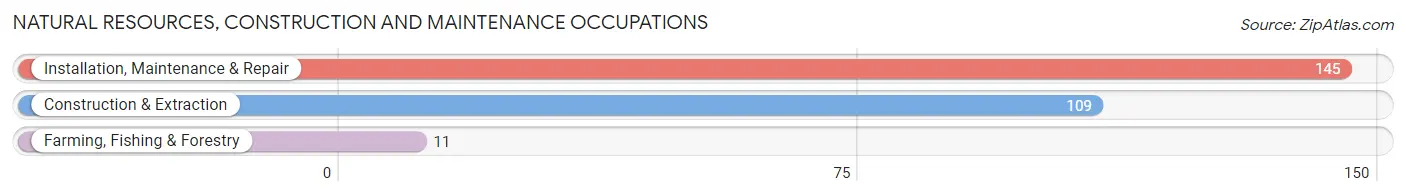
Natural Resources, Construction and Maintenance Occupations by Sex
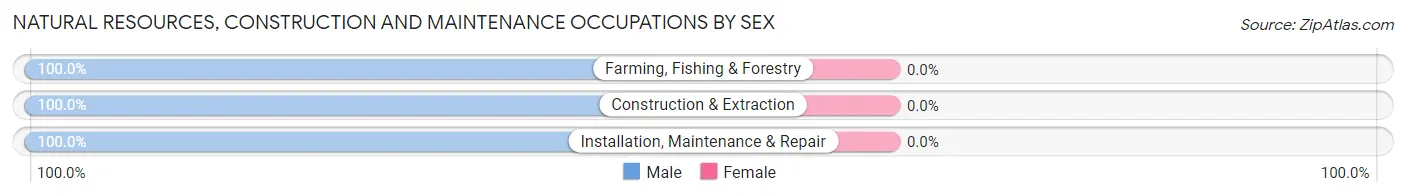
| Occupation | Male | Female |
| Farming, Fishing & Forestry | 11 (100.0%) | 0 (0.0%) |
| Construction & Extraction | 109 (100.0%) | 0 (0.0%) |
| Installation, Maintenance & Repair | 145 (100.0%) | 0 (0.0%) |
| Total (Category) | 265 (100.0%) | 0 (0.0%) |
| Total (Overall) | 1,140 (59.0%) | 794 (41.0%) |
Production, Transportation and Moving Occupations
The most common Production, Transportation and Moving occupations in Ponderosa Park are Transportation (87 | 4.5%), Production (65 | 3.4%), and Material Moving (8 | 0.4%).
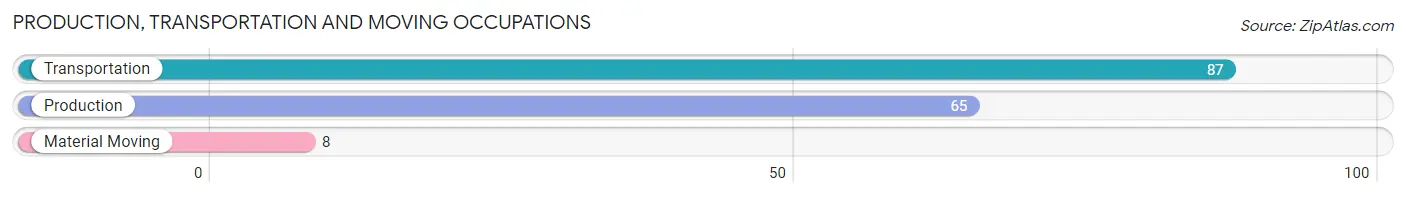
Production, Transportation and Moving Occupations by Sex
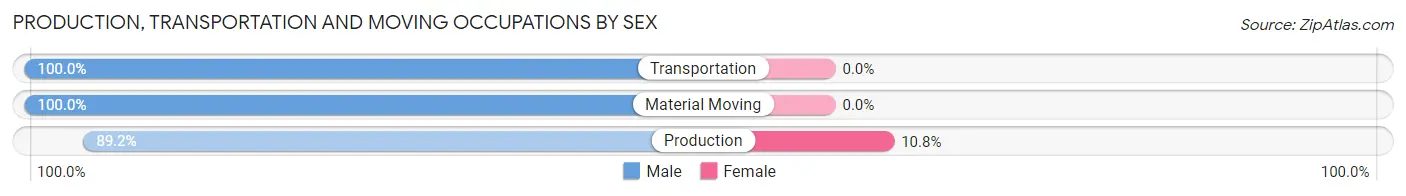
| Occupation | Male | Female |
| Production | 58 (89.2%) | 7 (10.8%) |
| Transportation | 87 (100.0%) | 0 (0.0%) |
| Material Moving | 8 (100.0%) | 0 (0.0%) |
| Total (Category) | 153 (95.6%) | 7 (4.4%) |
| Total (Overall) | 1,140 (59.0%) | 794 (41.0%) |
Employment Industries by Sex in Ponderosa Park
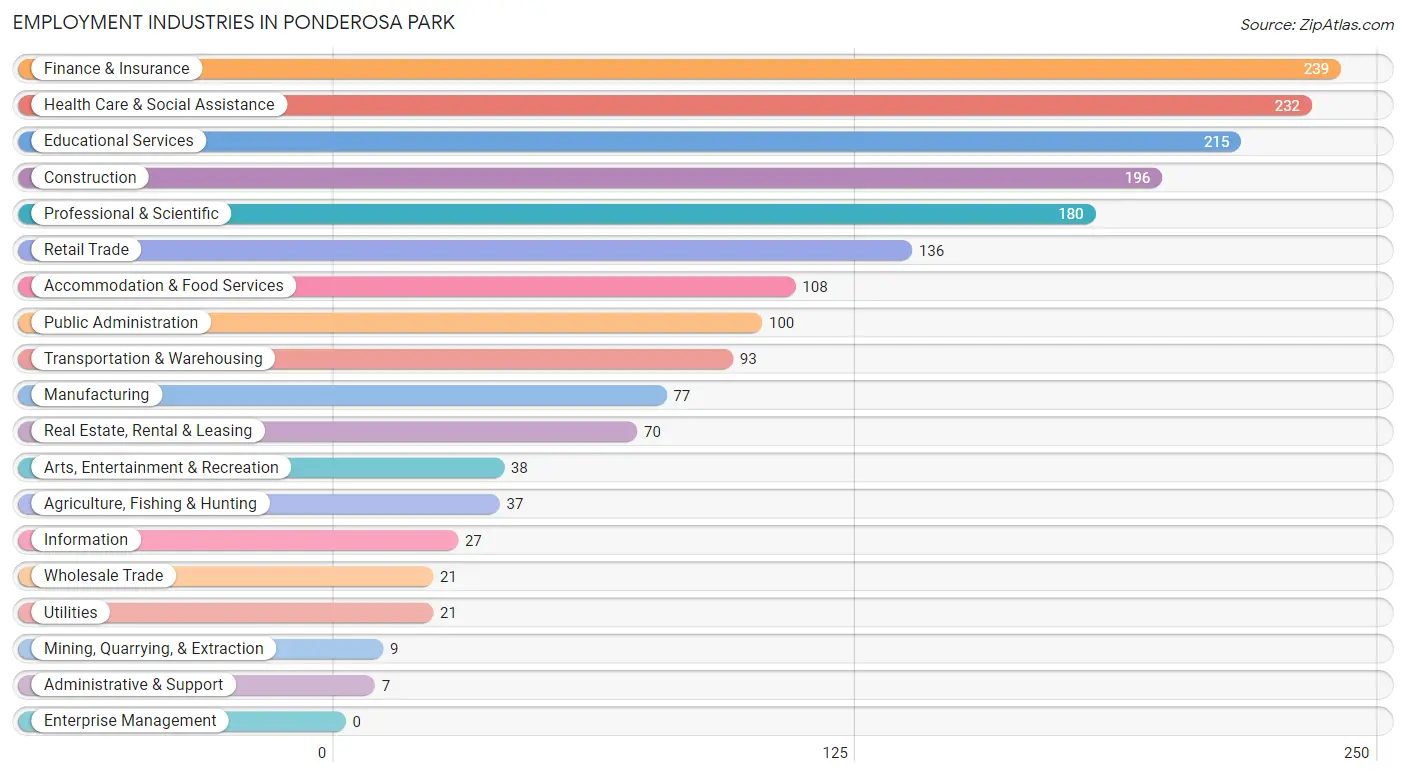
Employment Industries in Ponderosa Park
The major employment industries in Ponderosa Park include Finance & Insurance (239 | 12.4%), Health Care & Social Assistance (232 | 12.0%), Educational Services (215 | 11.1%), Construction (196 | 10.1%), and Professional & Scientific (180 | 9.3%).
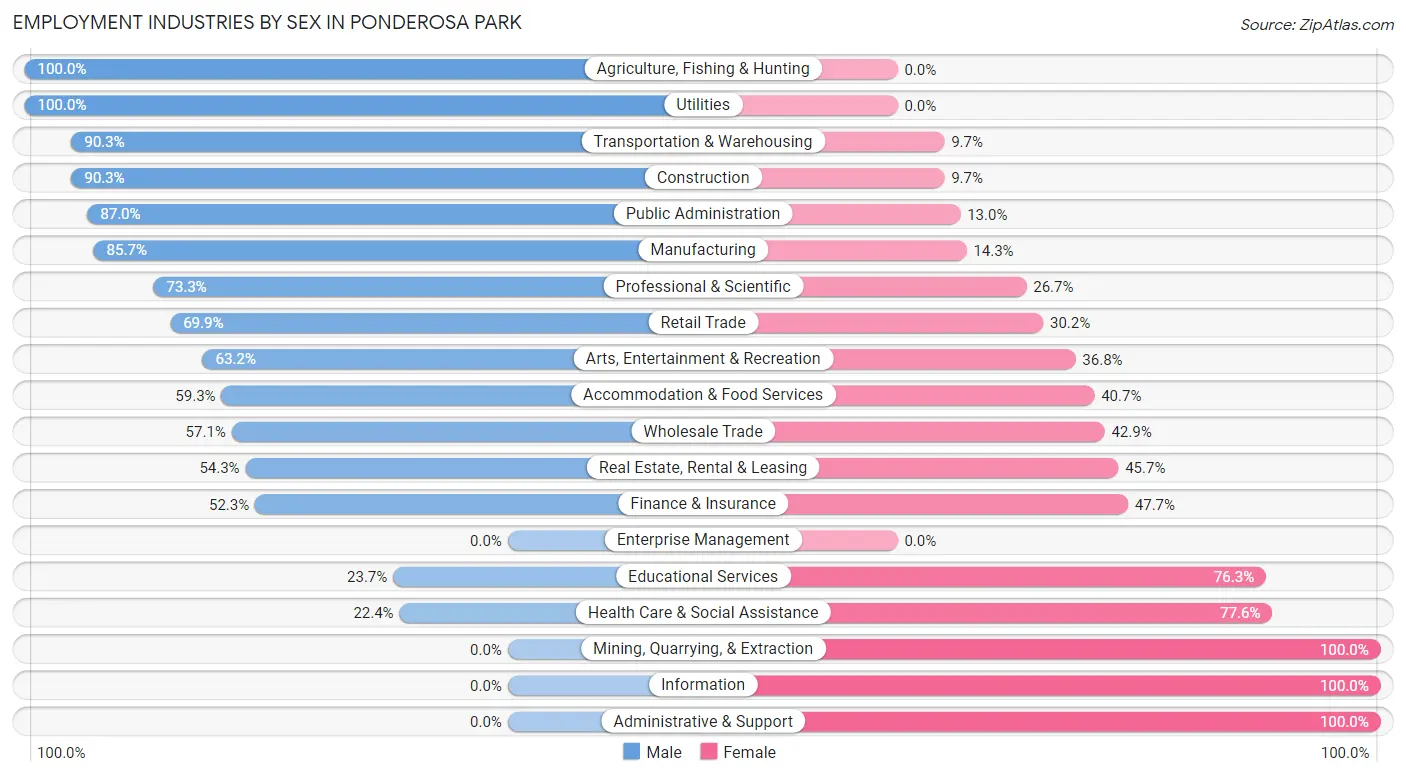
Employment Industries by Sex in Ponderosa Park
The Ponderosa Park industries that see more men than women are Agriculture, Fishing & Hunting (100.0%), Utilities (100.0%), and Transportation & Warehousing (90.3%), whereas the industries that tend to have a higher number of women are Mining, Quarrying, & Extraction (100.0%), Information (100.0%), and Administrative & Support (100.0%).
| Industry | Male | Female |
| Agriculture, Fishing & Hunting | 37 (100.0%) | 0 (0.0%) |
| Mining, Quarrying, & Extraction | 0 (0.0%) | 9 (100.0%) |
| Construction | 177 (90.3%) | 19 (9.7%) |
| Manufacturing | 66 (85.7%) | 11 (14.3%) |
| Wholesale Trade | 12 (57.1%) | 9 (42.9%) |
| Retail Trade | 95 (69.9%) | 41 (30.1%) |
| Transportation & Warehousing | 84 (90.3%) | 9 (9.7%) |
| Utilities | 21 (100.0%) | 0 (0.0%) |
| Information | 0 (0.0%) | 27 (100.0%) |
| Finance & Insurance | 125 (52.3%) | 114 (47.7%) |
| Real Estate, Rental & Leasing | 38 (54.3%) | 32 (45.7%) |
| Professional & Scientific | 132 (73.3%) | 48 (26.7%) |
| Enterprise Management | 0 (0.0%) | 0 (0.0%) |
| Administrative & Support | 0 (0.0%) | 7 (100.0%) |
| Educational Services | 51 (23.7%) | 164 (76.3%) |
| Health Care & Social Assistance | 52 (22.4%) | 180 (77.6%) |
| Arts, Entertainment & Recreation | 24 (63.2%) | 14 (36.8%) |
| Accommodation & Food Services | 64 (59.3%) | 44 (40.7%) |
| Public Administration | 87 (87.0%) | 13 (13.0%) |
| Total | 1,140 (59.0%) | 794 (41.0%) |
Education in Ponderosa Park
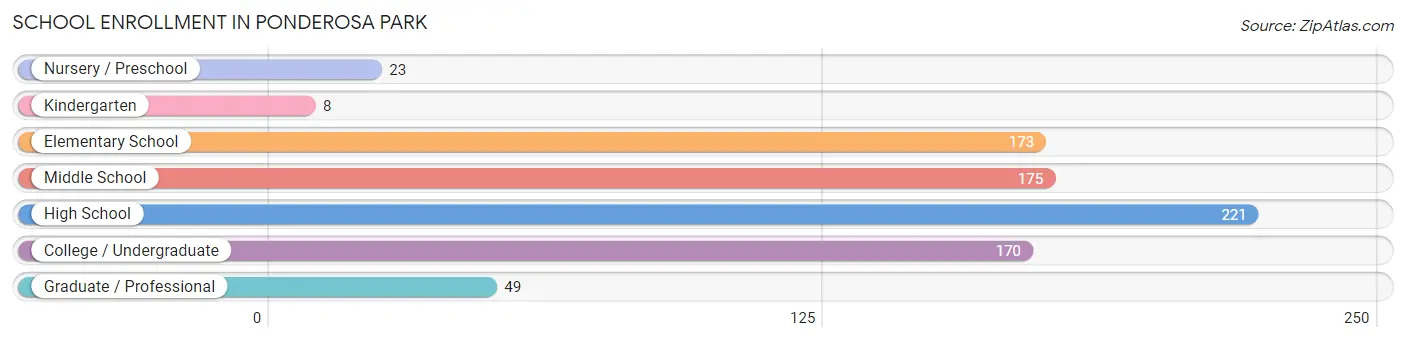
School Enrollment in Ponderosa Park
The most common levels of schooling among the 819 students in Ponderosa Park are high school (221 | 27.0%), middle school (175 | 21.4%), and elementary school (173 | 21.1%).
| School Level | # Students | % Students |
| Nursery / Preschool | 23 | 2.8% |
| Kindergarten | 8 | 1.0% |
| Elementary School | 173 | 21.1% |
| Middle School | 175 | 21.4% |
| High School | 221 | 27.0% |
| College / Undergraduate | 170 | 20.8% |
| Graduate / Professional | 49 | 6.0% |
| Total | 819 | 100.0% |
School Enrollment by Age by Funding Source in Ponderosa Park
Out of a total of 819 students who are enrolled in schools in Ponderosa Park, 217 (26.5%) attend a private institution, while the remaining 602 (73.5%) are enrolled in public schools. The age group of 18 to 19 year olds has the highest likelihood of being enrolled in private schools, with 32 (100.0% in the age bracket) enrolled. Conversely, the age group of 3 to 4 year olds has the lowest likelihood of being enrolled in a private school, with 11 (100.0% in the age bracket) attending a public institution.
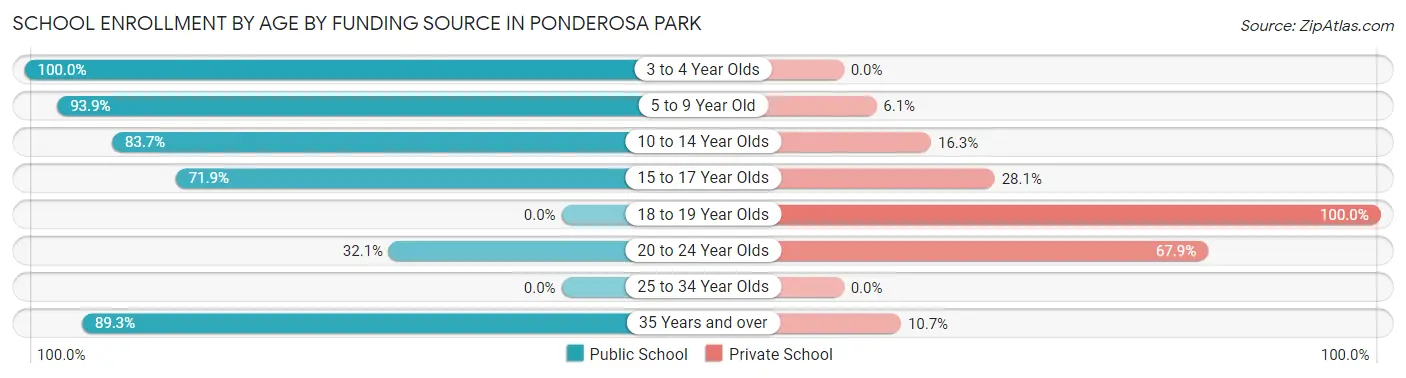
| Age Bracket | Public School | Private School |
| 3 to 4 Year Olds | 11 (100.0%) | 0 (0.0%) |
| 5 to 9 Year Old | 170 (93.9%) | 11 (6.1%) |
| 10 to 14 Year Olds | 175 (83.7%) | 34 (16.3%) |
| 15 to 17 Year Olds | 143 (71.9%) | 56 (28.1%) |
| 18 to 19 Year Olds | 0 (0.0%) | 32 (100.0%) |
| 20 to 24 Year Olds | 36 (32.1%) | 76 (67.9%) |
| 25 to 34 Year Olds | 0 (0.0%) | 0 (0.0%) |
| 35 Years and over | 67 (89.3%) | 8 (10.7%) |
| Total | 602 (73.5%) | 217 (26.5%) |
Educational Attainment by Field of Study in Ponderosa Park
Business (317 | 24.3%), liberal arts & history (160 | 12.3%), education (116 | 8.9%), computers & mathematics (87 | 6.7%), and science & technology (85 | 6.5%) are the most common fields of study among 1,304 individuals in Ponderosa Park who have obtained a bachelor's degree or higher.
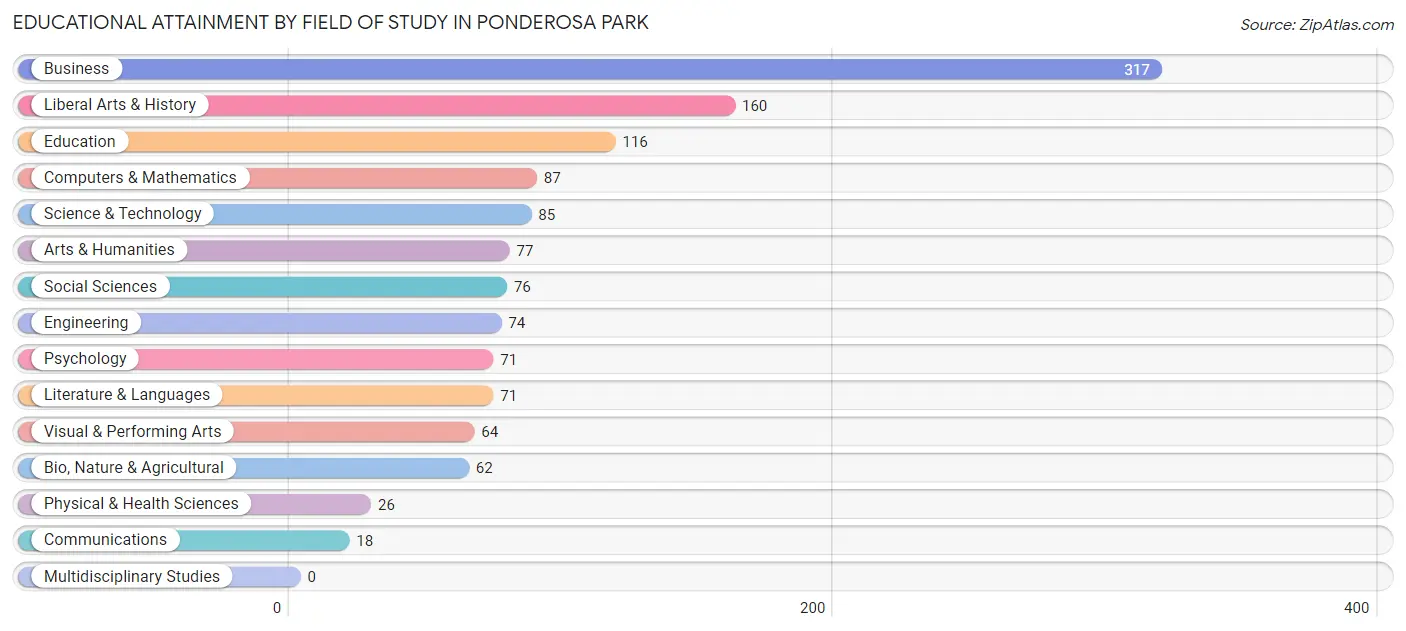
| Field of Study | # Graduates | % Graduates |
| Computers & Mathematics | 87 | 6.7% |
| Bio, Nature & Agricultural | 62 | 4.8% |
| Physical & Health Sciences | 26 | 2.0% |
| Psychology | 71 | 5.4% |
| Social Sciences | 76 | 5.8% |
| Engineering | 74 | 5.7% |
| Multidisciplinary Studies | 0 | 0.0% |
| Science & Technology | 85 | 6.5% |
| Business | 317 | 24.3% |
| Education | 116 | 8.9% |
| Literature & Languages | 71 | 5.4% |
| Liberal Arts & History | 160 | 12.3% |
| Visual & Performing Arts | 64 | 4.9% |
| Communications | 18 | 1.4% |
| Arts & Humanities | 77 | 5.9% |
| Total | 1,304 | 100.0% |
Transportation & Commute in Ponderosa Park
Vehicle Availability by Sex in Ponderosa Park
The most prevalent vehicle ownership categories in Ponderosa Park are males with 4 vehicles (336, accounting for 29.1%) and females with 4 vehicles (211, making up 42.3%).
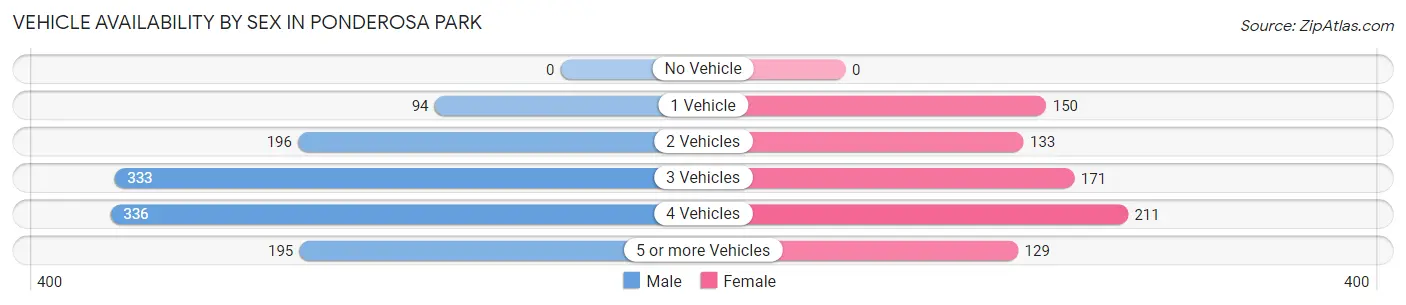
| Vehicles Available | Male | Female |
| No Vehicle | 0 (0.0%) | 0 (0.0%) |
| 1 Vehicle | 94 (8.2%) | 150 (18.9%) |
| 2 Vehicles | 196 (17.0%) | 133 (16.8%) |
| 3 Vehicles | 333 (28.9%) | 171 (21.5%) |
| 4 Vehicles | 336 (29.1%) | 211 (26.6%) |
| 5 or more Vehicles | 195 (16.9%) | 129 (16.3%) |
| Total | 1,154 (100.0%) | 794 (100.0%) |
Commute Time in Ponderosa Park
The most frequently occuring commute durations in Ponderosa Park are 60 to 89 minutes (407 commuters, 25.4%), 45 to 59 minutes (287 commuters, 17.9%), and 30 to 34 minutes (238 commuters, 14.9%).
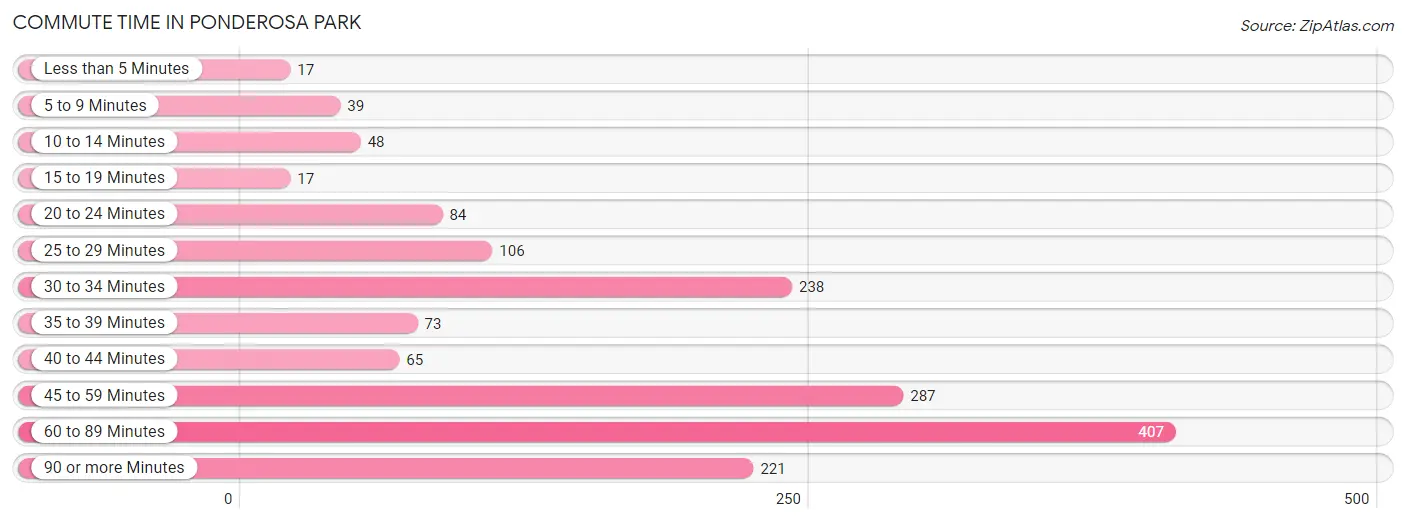
| Commute Time | # Commuters | % Commuters |
| Less than 5 Minutes | 17 | 1.1% |
| 5 to 9 Minutes | 39 | 2.4% |
| 10 to 14 Minutes | 48 | 3.0% |
| 15 to 19 Minutes | 17 | 1.1% |
| 20 to 24 Minutes | 84 | 5.2% |
| 25 to 29 Minutes | 106 | 6.6% |
| 30 to 34 Minutes | 238 | 14.9% |
| 35 to 39 Minutes | 73 | 4.6% |
| 40 to 44 Minutes | 65 | 4.1% |
| 45 to 59 Minutes | 287 | 17.9% |
| 60 to 89 Minutes | 407 | 25.4% |
| 90 or more Minutes | 221 | 13.8% |
Commute Time by Sex in Ponderosa Park
The most common commute times in Ponderosa Park are 60 to 89 minutes (343 commuters, 35.7%) for males and 45 to 59 minutes (119 commuters, 18.6%) for females.
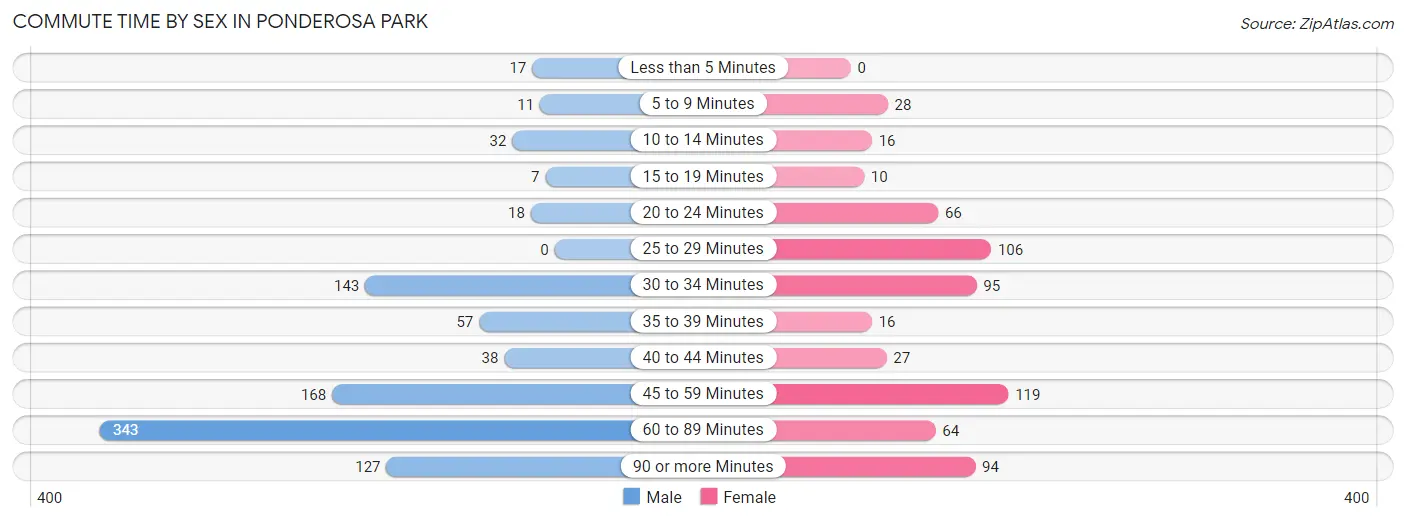
| Commute Time | Male | Female |
| Less than 5 Minutes | 17 (1.8%) | 0 (0.0%) |
| 5 to 9 Minutes | 11 (1.1%) | 28 (4.4%) |
| 10 to 14 Minutes | 32 (3.3%) | 16 (2.5%) |
| 15 to 19 Minutes | 7 (0.7%) | 10 (1.6%) |
| 20 to 24 Minutes | 18 (1.9%) | 66 (10.3%) |
| 25 to 29 Minutes | 0 (0.0%) | 106 (16.5%) |
| 30 to 34 Minutes | 143 (14.9%) | 95 (14.8%) |
| 35 to 39 Minutes | 57 (5.9%) | 16 (2.5%) |
| 40 to 44 Minutes | 38 (4.0%) | 27 (4.2%) |
| 45 to 59 Minutes | 168 (17.5%) | 119 (18.6%) |
| 60 to 89 Minutes | 343 (35.7%) | 64 (10.0%) |
| 90 or more Minutes | 127 (13.2%) | 94 (14.7%) |
Time of Departure to Work by Sex in Ponderosa Park
The most frequent times of departure to work in Ponderosa Park are 6:00 AM to 6:29 AM (230, 23.9%) for males and 7:00 AM to 7:29 AM (259, 40.4%) for females.
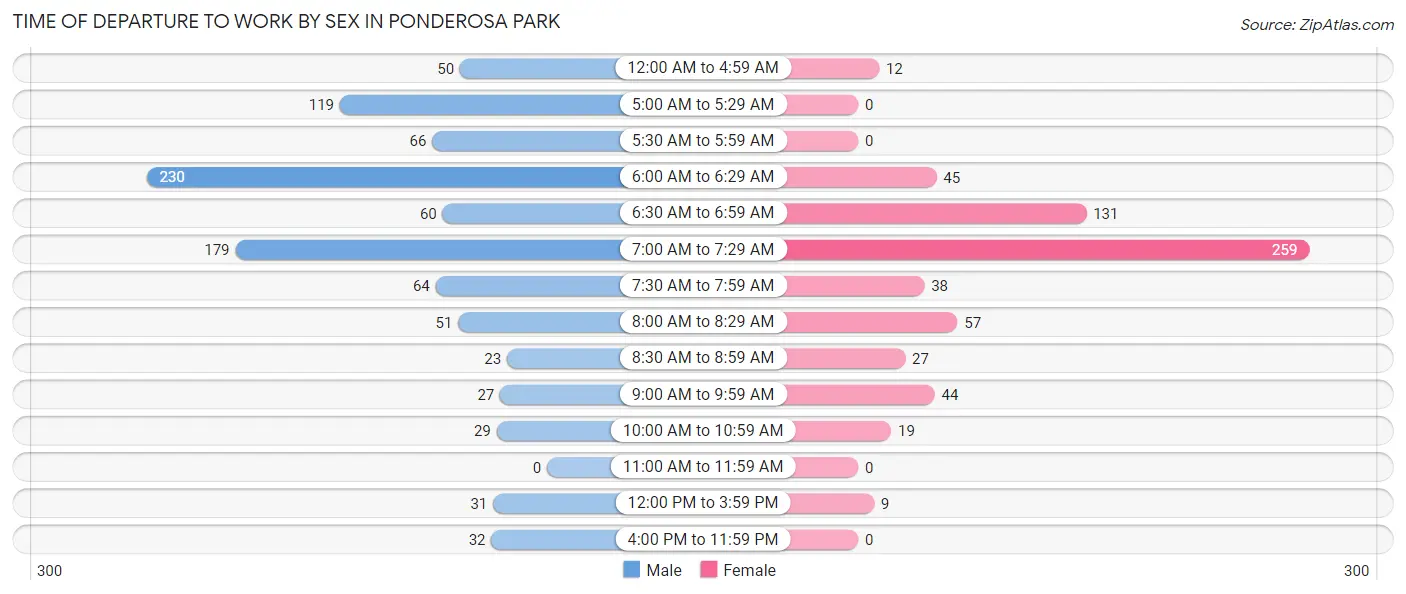
| Time of Departure | Male | Female |
| 12:00 AM to 4:59 AM | 50 (5.2%) | 12 (1.9%) |
| 5:00 AM to 5:29 AM | 119 (12.4%) | 0 (0.0%) |
| 5:30 AM to 5:59 AM | 66 (6.9%) | 0 (0.0%) |
| 6:00 AM to 6:29 AM | 230 (23.9%) | 45 (7.0%) |
| 6:30 AM to 6:59 AM | 60 (6.2%) | 131 (20.4%) |
| 7:00 AM to 7:29 AM | 179 (18.6%) | 259 (40.4%) |
| 7:30 AM to 7:59 AM | 64 (6.7%) | 38 (5.9%) |
| 8:00 AM to 8:29 AM | 51 (5.3%) | 57 (8.9%) |
| 8:30 AM to 8:59 AM | 23 (2.4%) | 27 (4.2%) |
| 9:00 AM to 9:59 AM | 27 (2.8%) | 44 (6.9%) |
| 10:00 AM to 10:59 AM | 29 (3.0%) | 19 (3.0%) |
| 11:00 AM to 11:59 AM | 0 (0.0%) | 0 (0.0%) |
| 12:00 PM to 3:59 PM | 31 (3.2%) | 9 (1.4%) |
| 4:00 PM to 11:59 PM | 32 (3.3%) | 0 (0.0%) |
| Total | 961 (100.0%) | 641 (100.0%) |
Housing Occupancy in Ponderosa Park
Occupancy by Ownership in Ponderosa Park
Of the total 1,261 dwellings in Ponderosa Park, owner-occupied units account for 1,195 (94.8%), while renter-occupied units make up 66 (5.2%).
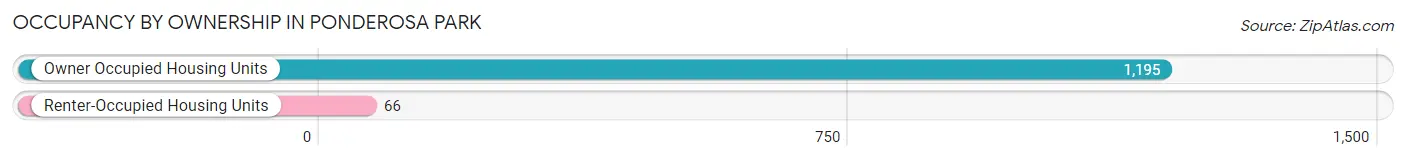
| Occupancy | # Housing Units | % Housing Units |
| Owner Occupied Housing Units | 1,195 | 94.8% |
| Renter-Occupied Housing Units | 66 | 5.2% |
| Total Occupied Housing Units | 1,261 | 100.0% |
Occupancy by Household Size in Ponderosa Park
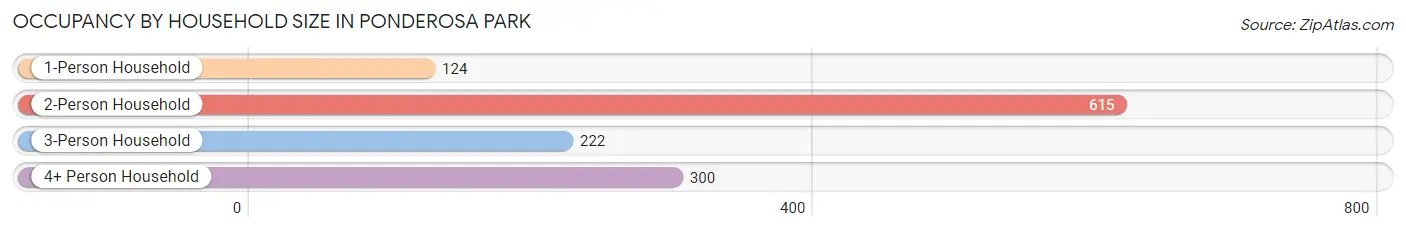
| Household Size | # Housing Units | % Housing Units |
| 1-Person Household | 124 | 9.8% |
| 2-Person Household | 615 | 48.8% |
| 3-Person Household | 222 | 17.6% |
| 4+ Person Household | 300 | 23.8% |
| Total Housing Units | 1,261 | 100.0% |
Occupancy by Ownership by Household Size in Ponderosa Park
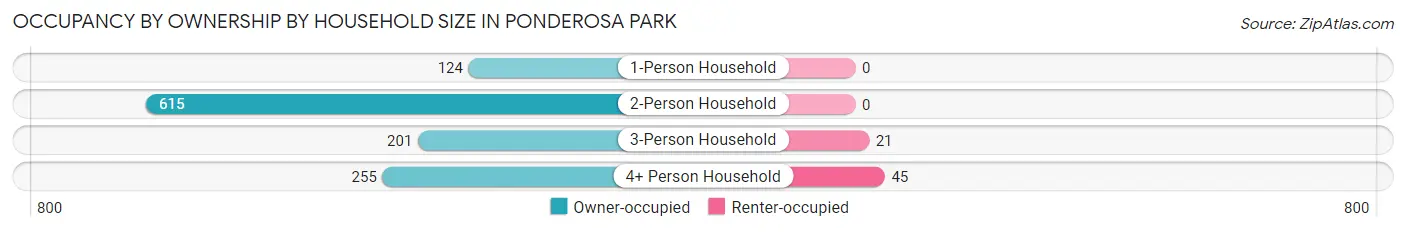
| Household Size | Owner-occupied | Renter-occupied |
| 1-Person Household | 124 (100.0%) | 0 (0.0%) |
| 2-Person Household | 615 (100.0%) | 0 (0.0%) |
| 3-Person Household | 201 (90.5%) | 21 (9.5%) |
| 4+ Person Household | 255 (85.0%) | 45 (15.0%) |
| Total Housing Units | 1,195 (94.8%) | 66 (5.2%) |
Occupancy by Educational Attainment in Ponderosa Park
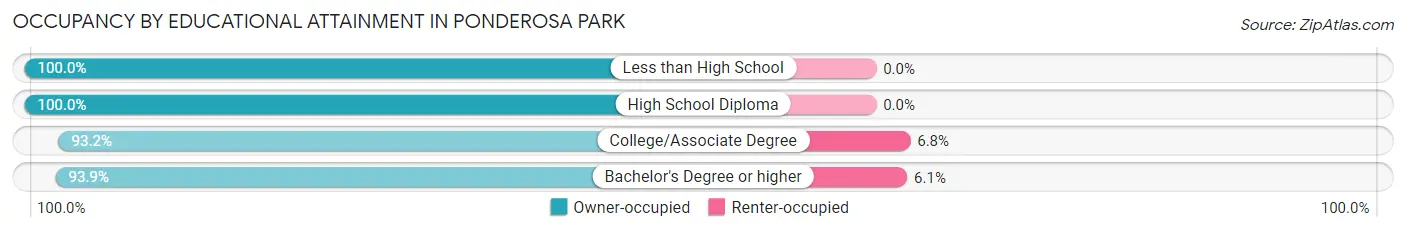
| Household Size | Owner-occupied | Renter-occupied |
| Less than High School | 17 (100.0%) | 0 (0.0%) |
| High School Diploma | 211 (100.0%) | 0 (0.0%) |
| College/Associate Degree | 386 (93.2%) | 28 (6.8%) |
| Bachelor's Degree or higher | 581 (93.9%) | 38 (6.1%) |
Occupancy by Age of Householder in Ponderosa Park
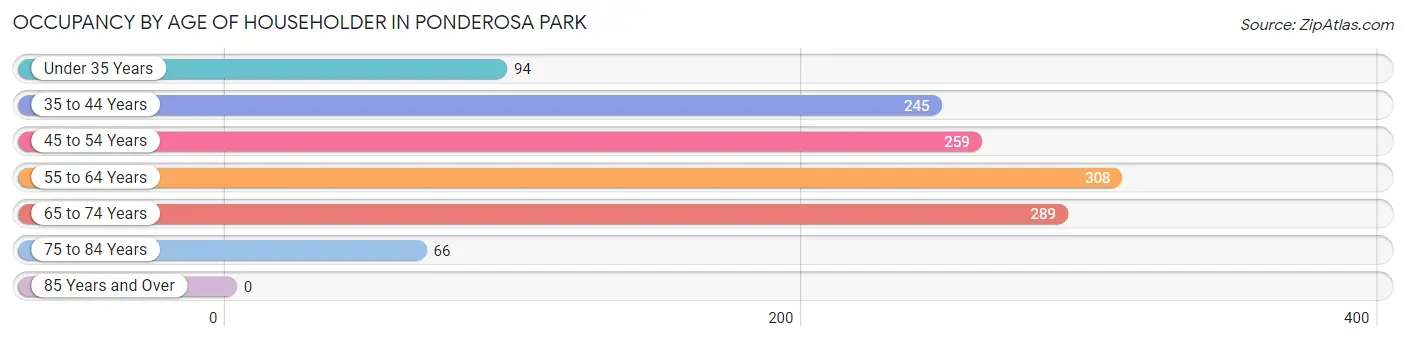
| Age Bracket | # Households | % Households |
| Under 35 Years | 94 | 7.4% |
| 35 to 44 Years | 245 | 19.4% |
| 45 to 54 Years | 259 | 20.5% |
| 55 to 64 Years | 308 | 24.4% |
| 65 to 74 Years | 289 | 22.9% |
| 75 to 84 Years | 66 | 5.2% |
| 85 Years and Over | 0 | 0.0% |
| Total | 1,261 | 100.0% |
Housing Finances in Ponderosa Park
Median Income by Occupancy in Ponderosa Park
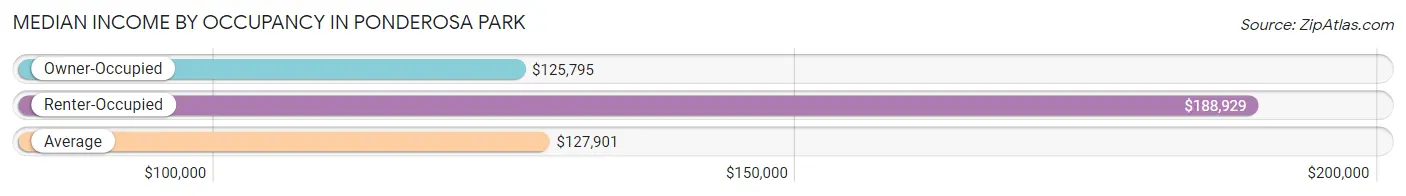
| Occupancy Type | # Households | Median Income |
| Owner-Occupied | 1,195 (94.8%) | $125,795 |
| Renter-Occupied | 66 (5.2%) | $188,929 |
| Average | 1,261 (100.0%) | $127,901 |
Occupancy by Householder Income Bracket in Ponderosa Park
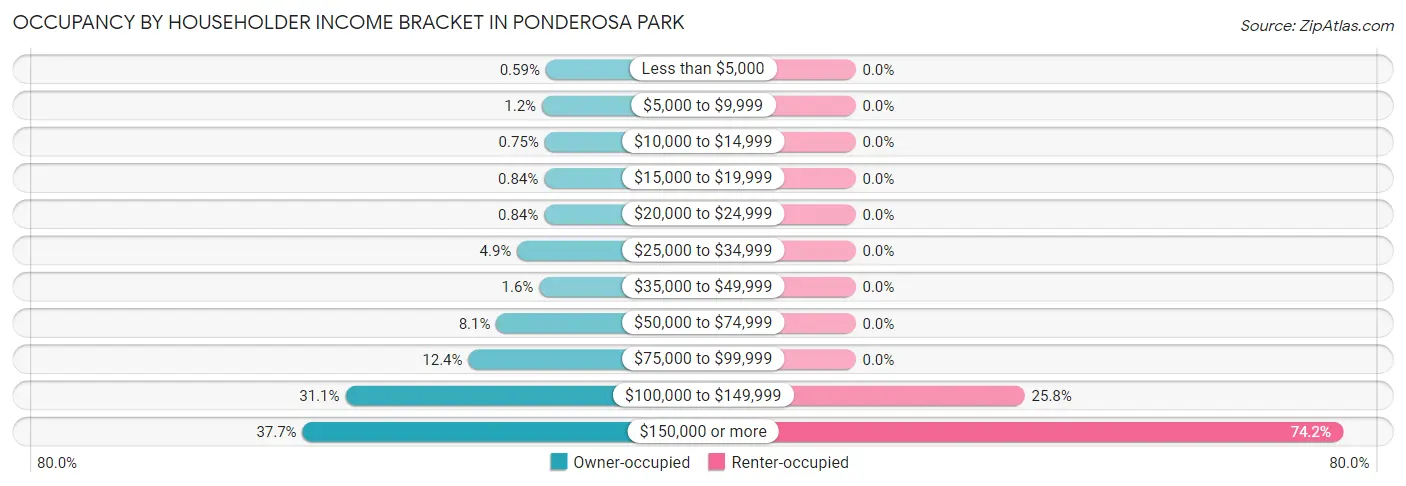
| Income Bracket | Owner-occupied | Renter-occupied |
| Less than $5,000 | 7 (0.6%) | 0 (0.0%) |
| $5,000 to $9,999 | 14 (1.2%) | 0 (0.0%) |
| $10,000 to $14,999 | 9 (0.7%) | 0 (0.0%) |
| $15,000 to $19,999 | 10 (0.8%) | 0 (0.0%) |
| $20,000 to $24,999 | 10 (0.8%) | 0 (0.0%) |
| $25,000 to $34,999 | 59 (4.9%) | 0 (0.0%) |
| $35,000 to $49,999 | 19 (1.6%) | 0 (0.0%) |
| $50,000 to $74,999 | 97 (8.1%) | 0 (0.0%) |
| $75,000 to $99,999 | 148 (12.4%) | 0 (0.0%) |
| $100,000 to $149,999 | 372 (31.1%) | 17 (25.8%) |
| $150,000 or more | 450 (37.7%) | 49 (74.2%) |
| Total | 1,195 (100.0%) | 66 (100.0%) |
Monthly Housing Cost Tiers in Ponderosa Park
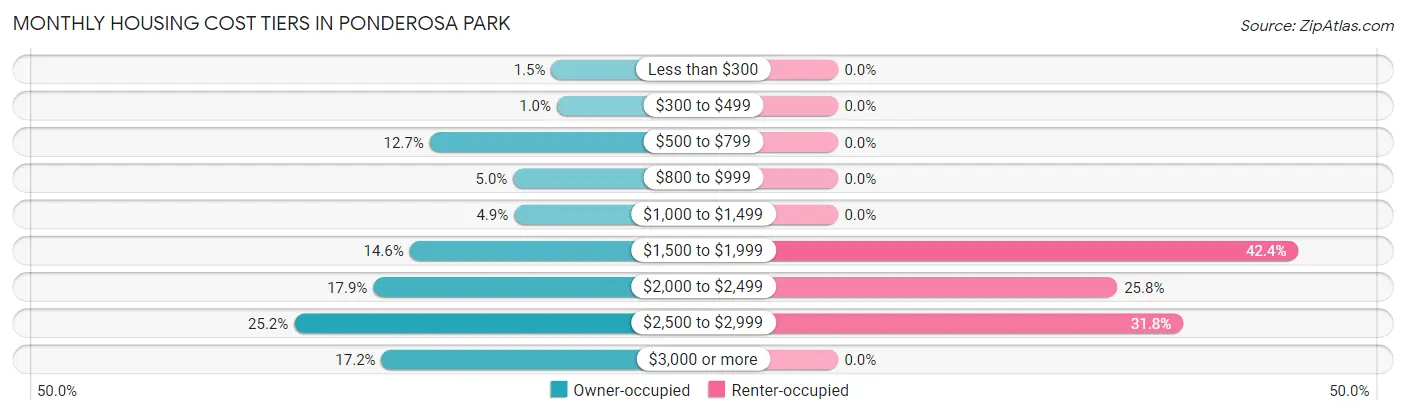
| Monthly Cost | Owner-occupied | Renter-occupied |
| Less than $300 | 18 (1.5%) | 0 (0.0%) |
| $300 to $499 | 12 (1.0%) | 0 (0.0%) |
| $500 to $799 | 152 (12.7%) | 0 (0.0%) |
| $800 to $999 | 60 (5.0%) | 0 (0.0%) |
| $1,000 to $1,499 | 59 (4.9%) | 0 (0.0%) |
| $1,500 to $1,999 | 174 (14.6%) | 28 (42.4%) |
| $2,000 to $2,499 | 214 (17.9%) | 17 (25.8%) |
| $2,500 to $2,999 | 301 (25.2%) | 21 (31.8%) |
| $3,000 or more | 205 (17.2%) | 0 (0.0%) |
| Total | 1,195 (100.0%) | 66 (100.0%) |
Physical Housing Characteristics in Ponderosa Park
Housing Structures in Ponderosa Park
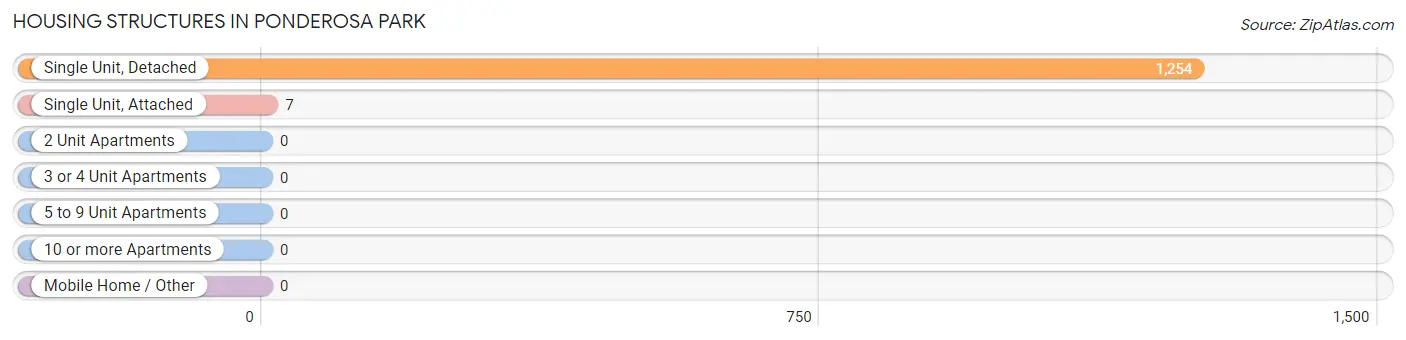
| Structure Type | # Housing Units | % Housing Units |
| Single Unit, Detached | 1,254 | 99.4% |
| Single Unit, Attached | 7 | 0.6% |
| 2 Unit Apartments | 0 | 0.0% |
| 3 or 4 Unit Apartments | 0 | 0.0% |
| 5 to 9 Unit Apartments | 0 | 0.0% |
| 10 or more Apartments | 0 | 0.0% |
| Mobile Home / Other | 0 | 0.0% |
| Total | 1,261 | 100.0% |
Housing Structures by Occupancy in Ponderosa Park
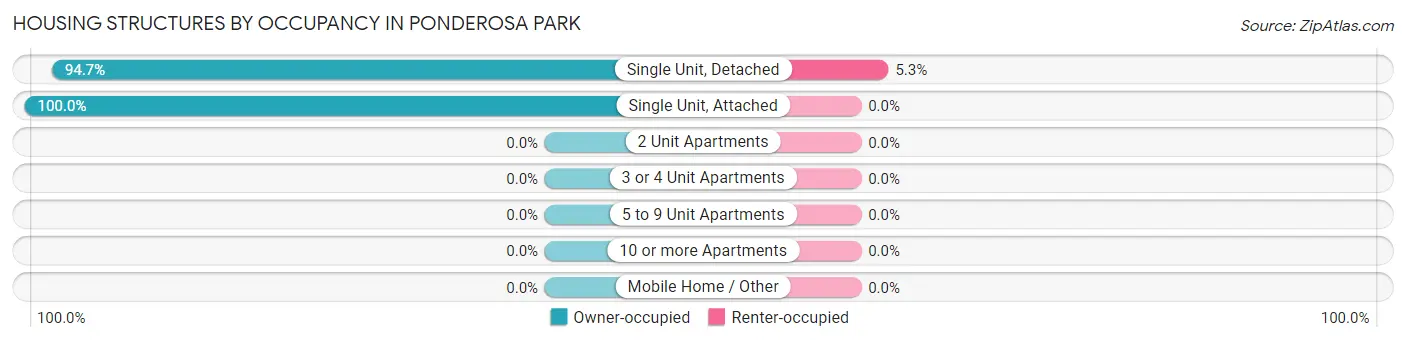
| Structure Type | Owner-occupied | Renter-occupied |
| Single Unit, Detached | 1,188 (94.7%) | 66 (5.3%) |
| Single Unit, Attached | 7 (100.0%) | 0 (0.0%) |
| 2 Unit Apartments | 0 (0.0%) | 0 (0.0%) |
| 3 or 4 Unit Apartments | 0 (0.0%) | 0 (0.0%) |
| 5 to 9 Unit Apartments | 0 (0.0%) | 0 (0.0%) |
| 10 or more Apartments | 0 (0.0%) | 0 (0.0%) |
| Mobile Home / Other | 0 (0.0%) | 0 (0.0%) |
| Total | 1,195 (94.8%) | 66 (5.2%) |
Housing Structures by Number of Rooms in Ponderosa Park
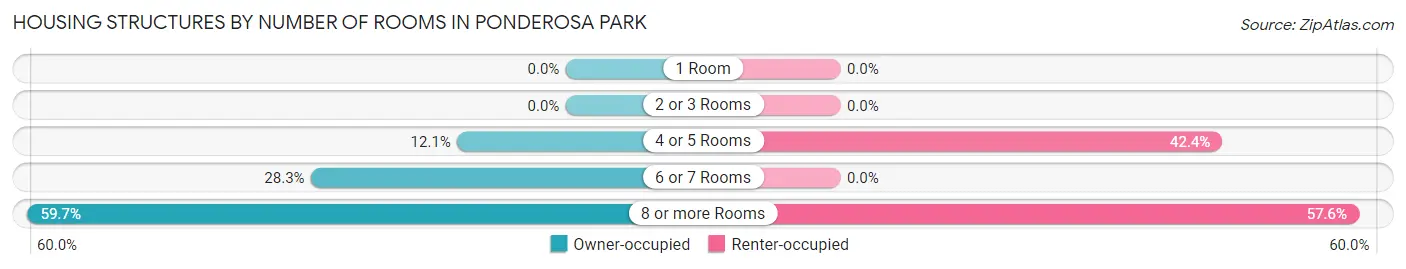
| Number of Rooms | Owner-occupied | Renter-occupied |
| 1 Room | 0 (0.0%) | 0 (0.0%) |
| 2 or 3 Rooms | 0 (0.0%) | 0 (0.0%) |
| 4 or 5 Rooms | 144 (12.0%) | 28 (42.4%) |
| 6 or 7 Rooms | 338 (28.3%) | 0 (0.0%) |
| 8 or more Rooms | 713 (59.7%) | 38 (57.6%) |
| Total | 1,195 (100.0%) | 66 (100.0%) |
Housing Structure by Heating Type in Ponderosa Park
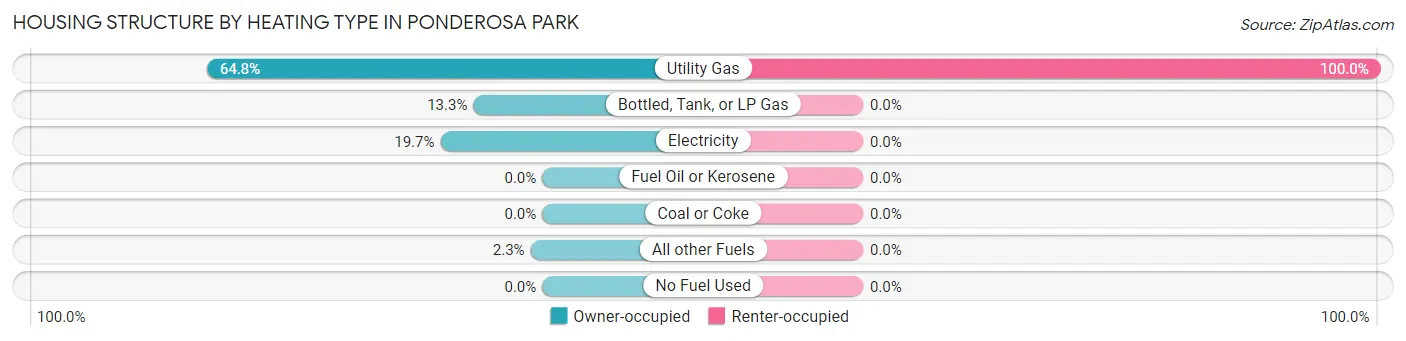
| Heating Type | Owner-occupied | Renter-occupied |
| Utility Gas | 774 (64.8%) | 66 (100.0%) |
| Bottled, Tank, or LP Gas | 159 (13.3%) | 0 (0.0%) |
| Electricity | 235 (19.7%) | 0 (0.0%) |
| Fuel Oil or Kerosene | 0 (0.0%) | 0 (0.0%) |
| Coal or Coke | 0 (0.0%) | 0 (0.0%) |
| All other Fuels | 27 (2.3%) | 0 (0.0%) |
| No Fuel Used | 0 (0.0%) | 0 (0.0%) |
| Total | 1,195 (100.0%) | 66 (100.0%) |
Household Vehicle Usage in Ponderosa Park
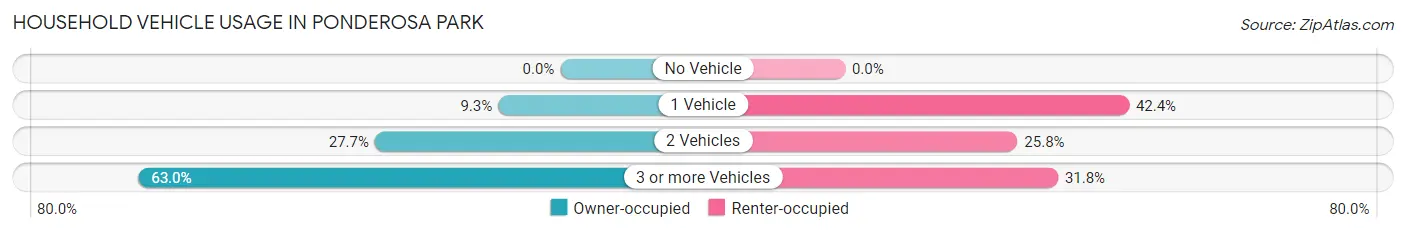
| Vehicles per Household | Owner-occupied | Renter-occupied |
| No Vehicle | 0 (0.0%) | 0 (0.0%) |
| 1 Vehicle | 111 (9.3%) | 28 (42.4%) |
| 2 Vehicles | 331 (27.7%) | 17 (25.8%) |
| 3 or more Vehicles | 753 (63.0%) | 21 (31.8%) |
| Total | 1,195 (100.0%) | 66 (100.0%) |
Real Estate & Mortgages in Ponderosa Park
Real Estate and Mortgage Overview in Ponderosa Park
| Characteristic | Without Mortgage | With Mortgage |
| Housing Units | 216 | 979 |
| Median Property Value | $622,500 | $627,600 |
| Median Household Income | $70,227 | $379 |
| Monthly Housing Costs | $635 | $205 |
| Real Estate Taxes | $2,778 | $0 |
Property Value by Mortgage Status in Ponderosa Park
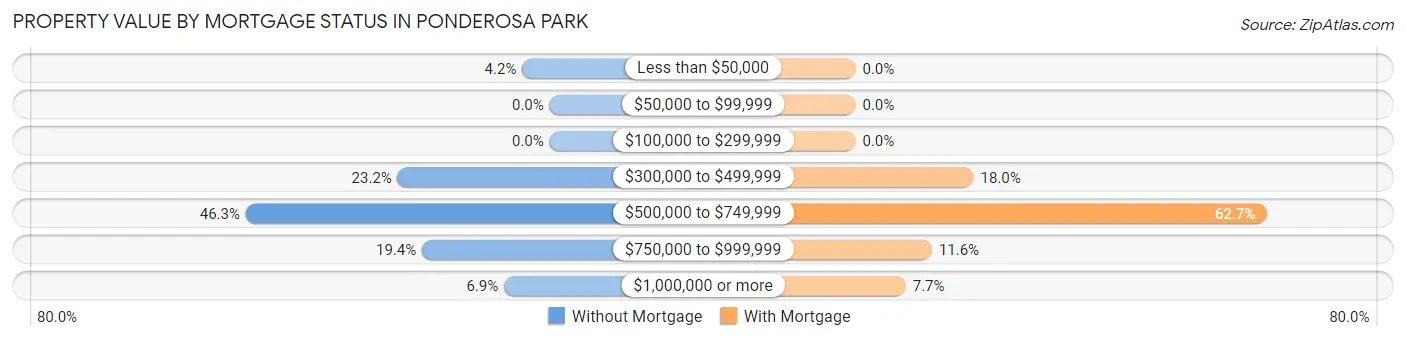
| Property Value | Without Mortgage | With Mortgage |
| Less than $50,000 | 9 (4.2%) | 0 (0.0%) |
| $50,000 to $99,999 | 0 (0.0%) | 0 (0.0%) |
| $100,000 to $299,999 | 0 (0.0%) | 0 (0.0%) |
| $300,000 to $499,999 | 50 (23.2%) | 176 (18.0%) |
| $500,000 to $749,999 | 100 (46.3%) | 614 (62.7%) |
| $750,000 to $999,999 | 42 (19.4%) | 114 (11.6%) |
| $1,000,000 or more | 15 (6.9%) | 75 (7.7%) |
| Total | 216 (100.0%) | 979 (100.0%) |
Household Income by Mortgage Status in Ponderosa Park
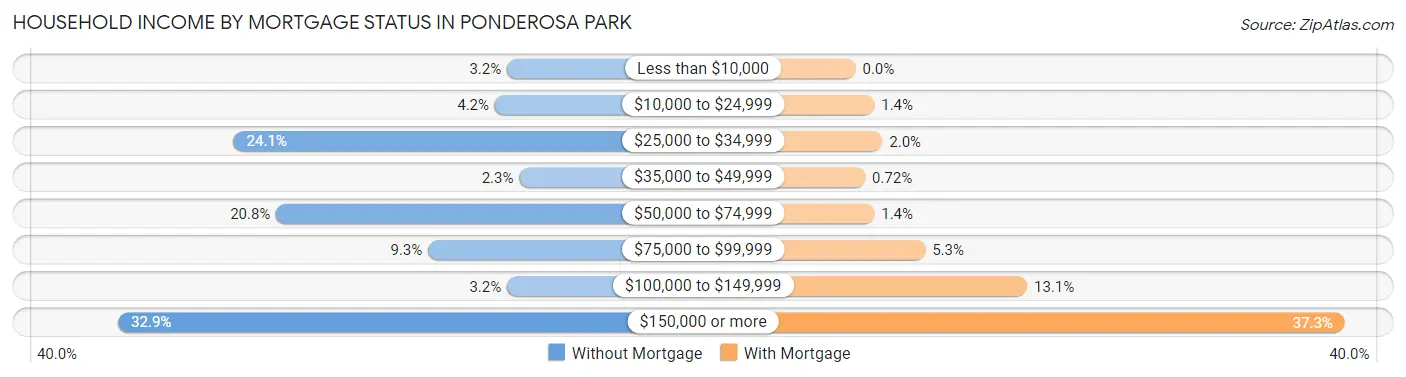
| Household Income | Without Mortgage | With Mortgage |
| Less than $10,000 | 7 (3.2%) | 0 (0.0%) |
| $10,000 to $24,999 | 9 (4.2%) | 14 (1.4%) |
| $25,000 to $34,999 | 52 (24.1%) | 20 (2.0%) |
| $35,000 to $49,999 | 5 (2.3%) | 7 (0.7%) |
| $50,000 to $74,999 | 45 (20.8%) | 14 (1.4%) |
| $75,000 to $99,999 | 20 (9.3%) | 52 (5.3%) |
| $100,000 to $149,999 | 7 (3.2%) | 128 (13.1%) |
| $150,000 or more | 71 (32.9%) | 365 (37.3%) |
| Total | 216 (100.0%) | 979 (100.0%) |
Property Value to Household Income Ratio in Ponderosa Park
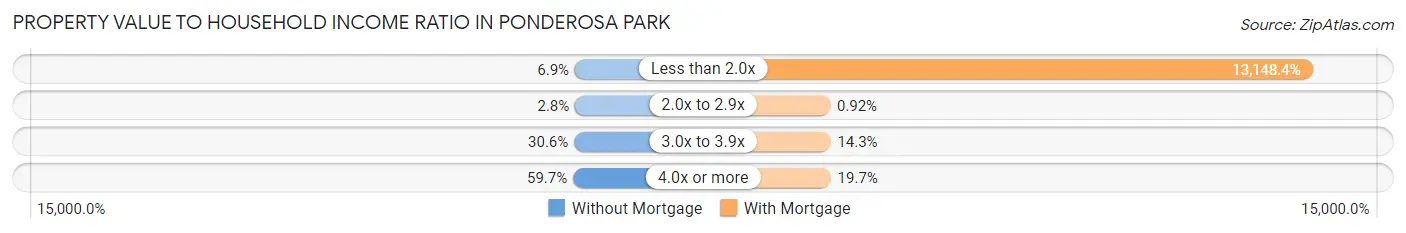
| Value-to-Income Ratio | Without Mortgage | With Mortgage |
| Less than 2.0x | 15 (6.9%) | 128,723 (13,148.4%) |
| 2.0x to 2.9x | 6 (2.8%) | 9 (0.9%) |
| 3.0x to 3.9x | 66 (30.6%) | 140 (14.3%) |
| 4.0x or more | 129 (59.7%) | 193 (19.7%) |
| Total | 216 (100.0%) | 979 (100.0%) |
Real Estate Taxes by Mortgage Status in Ponderosa Park
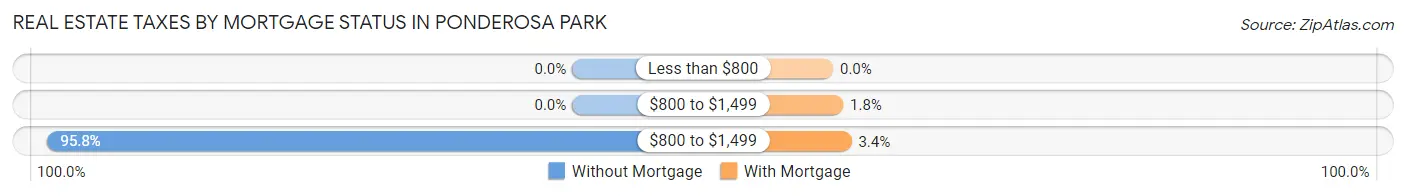
| Property Taxes | Without Mortgage | With Mortgage |
| Less than $800 | 0 (0.0%) | 0 (0.0%) |
| $800 to $1,499 | 0 (0.0%) | 18 (1.8%) |
| $800 to $1,499 | 207 (95.8%) | 33 (3.4%) |
| Total | 216 (100.0%) | 979 (100.0%) |
Health & Disability in Ponderosa Park
Health Insurance Coverage by Age in Ponderosa Park
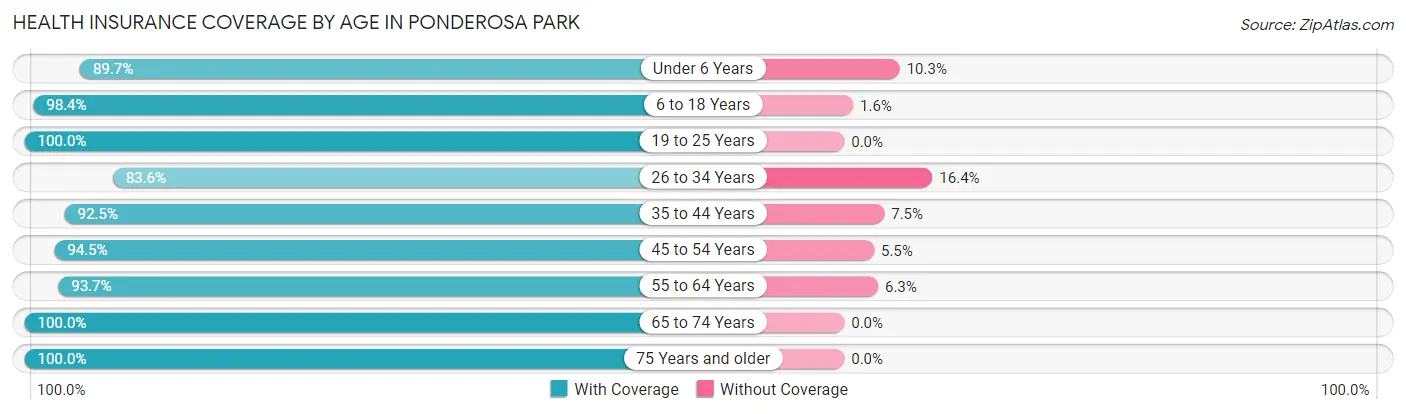
| Age Bracket | With Coverage | Without Coverage |
| Under 6 Years | 104 (89.7%) | 12 (10.3%) |
| 6 to 18 Years | 660 (98.4%) | 11 (1.6%) |
| 19 to 25 Years | 282 (100.0%) | 0 (0.0%) |
| 26 to 34 Years | 178 (83.6%) | 35 (16.4%) |
| 35 to 44 Years | 484 (92.5%) | 39 (7.5%) |
| 45 to 54 Years | 477 (94.5%) | 28 (5.5%) |
| 55 to 64 Years | 536 (93.7%) | 36 (6.3%) |
| 65 to 74 Years | 522 (100.0%) | 0 (0.0%) |
| 75 Years and older | 159 (100.0%) | 0 (0.0%) |
| Total | 3,402 (95.5%) | 161 (4.5%) |
Health Insurance Coverage by Citizenship Status in Ponderosa Park
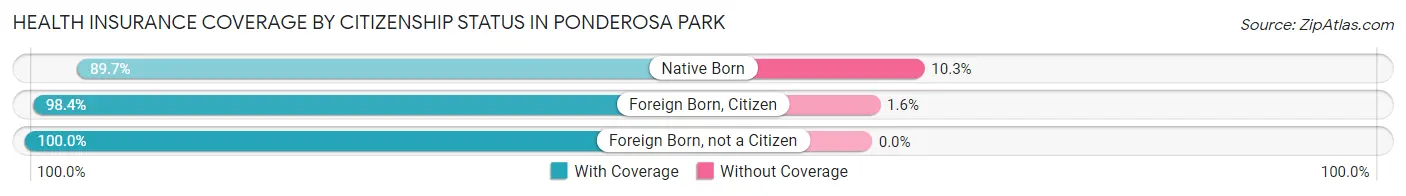
| Citizenship Status | With Coverage | Without Coverage |
| Native Born | 104 (89.7%) | 12 (10.3%) |
| Foreign Born, Citizen | 660 (98.4%) | 11 (1.6%) |
| Foreign Born, not a Citizen | 282 (100.0%) | 0 (0.0%) |
Health Insurance Coverage by Household Income in Ponderosa Park
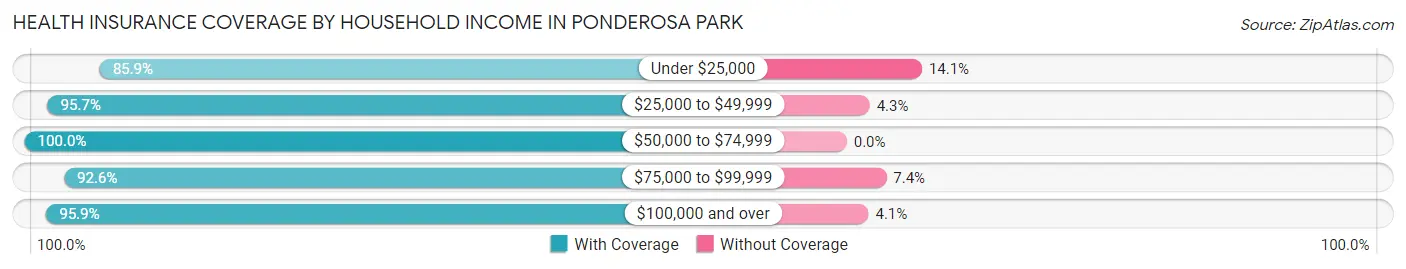
| Household Income | With Coverage | Without Coverage |
| Under $25,000 | 61 (85.9%) | 10 (14.1%) |
| $25,000 to $49,999 | 178 (95.7%) | 8 (4.3%) |
| $50,000 to $74,999 | 194 (100.0%) | 0 (0.0%) |
| $75,000 to $99,999 | 450 (92.6%) | 36 (7.4%) |
| $100,000 and over | 2,519 (95.9%) | 107 (4.1%) |
Public vs Private Health Insurance Coverage by Age in Ponderosa Park

| Age Bracket | Public Insurance | Private Insurance |
| Under 6 | 11 (9.5%) | 93 (80.2%) |
| 6 to 18 Years | 86 (12.8%) | 608 (90.6%) |
| 19 to 25 Years | 0 (0.0%) | 282 (100.0%) |
| 25 to 34 Years | 0 (0.0%) | 178 (83.6%) |
| 35 to 44 Years | 25 (4.8%) | 484 (92.5%) |
| 45 to 54 Years | 6 (1.2%) | 477 (94.5%) |
| 55 to 64 Years | 46 (8.0%) | 499 (87.2%) |
| 65 to 74 Years | 465 (89.1%) | 360 (69.0%) |
| 75 Years and over | 152 (95.6%) | 122 (76.7%) |
| Total | 791 (22.2%) | 3,103 (87.1%) |
Disability Status by Sex by Age in Ponderosa Park
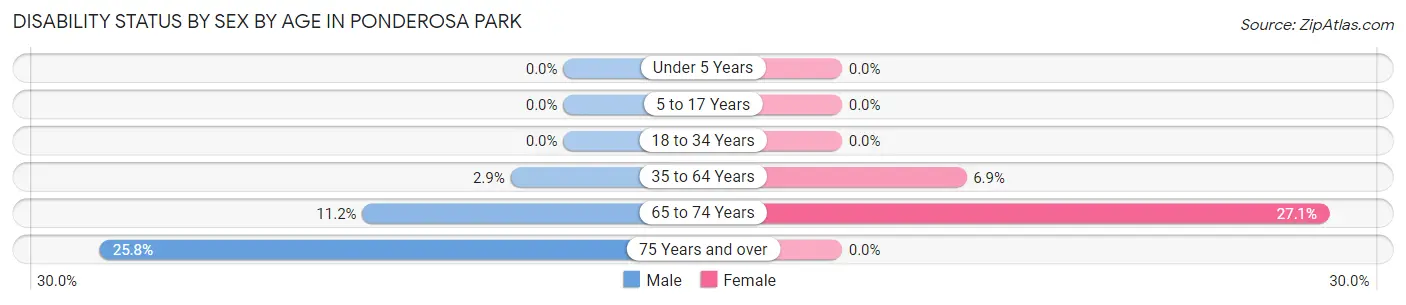
| Age Bracket | Male | Female |
| Under 5 Years | 0 (0.0%) | 0 (0.0%) |
| 5 to 17 Years | 0 (0.0%) | 0 (0.0%) |
| 18 to 34 Years | 0 (0.0%) | 0 (0.0%) |
| 35 to 64 Years | 22 (2.9%) | 59 (6.9%) |
| 65 to 74 Years | 32 (11.2%) | 64 (27.1%) |
| 75 Years and over | 24 (25.8%) | 0 (0.0%) |
Disability Class by Sex by Age in Ponderosa Park
Disability Class: Hearing Difficulty
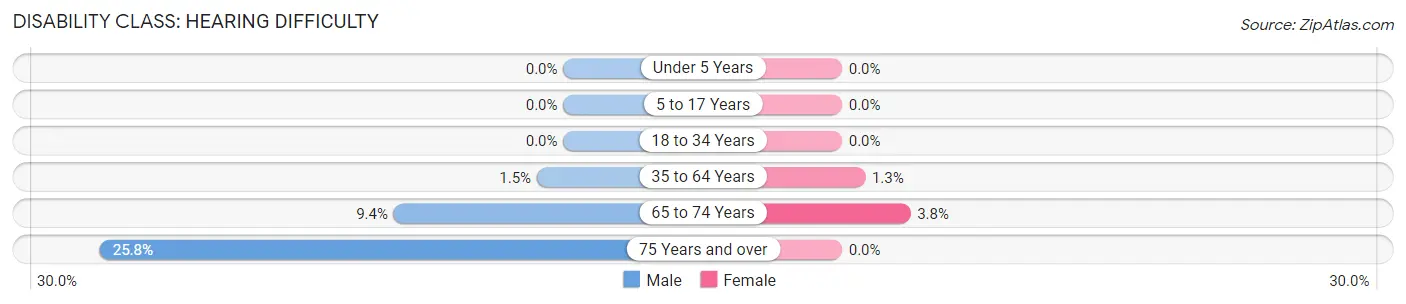
| Age Bracket | Male | Female |
| Under 5 Years | 0 (0.0%) | 0 (0.0%) |
| 5 to 17 Years | 0 (0.0%) | 0 (0.0%) |
| 18 to 34 Years | 0 (0.0%) | 0 (0.0%) |
| 35 to 64 Years | 11 (1.5%) | 11 (1.3%) |
| 65 to 74 Years | 27 (9.4%) | 9 (3.8%) |
| 75 Years and over | 24 (25.8%) | 0 (0.0%) |
Disability Class: Vision Difficulty
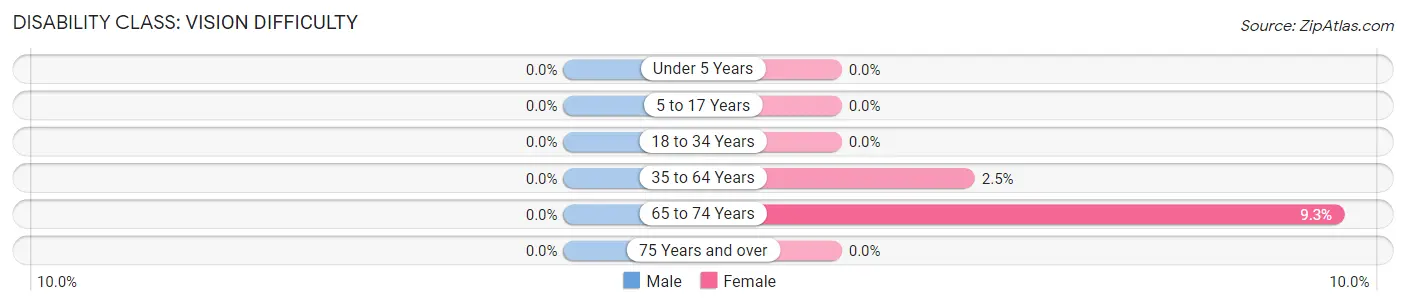
| Age Bracket | Male | Female |
| Under 5 Years | 0 (0.0%) | 0 (0.0%) |
| 5 to 17 Years | 0 (0.0%) | 0 (0.0%) |
| 18 to 34 Years | 0 (0.0%) | 0 (0.0%) |
| 35 to 64 Years | 0 (0.0%) | 21 (2.5%) |
| 65 to 74 Years | 0 (0.0%) | 22 (9.3%) |
| 75 Years and over | 0 (0.0%) | 0 (0.0%) |
Disability Class: Cognitive Difficulty
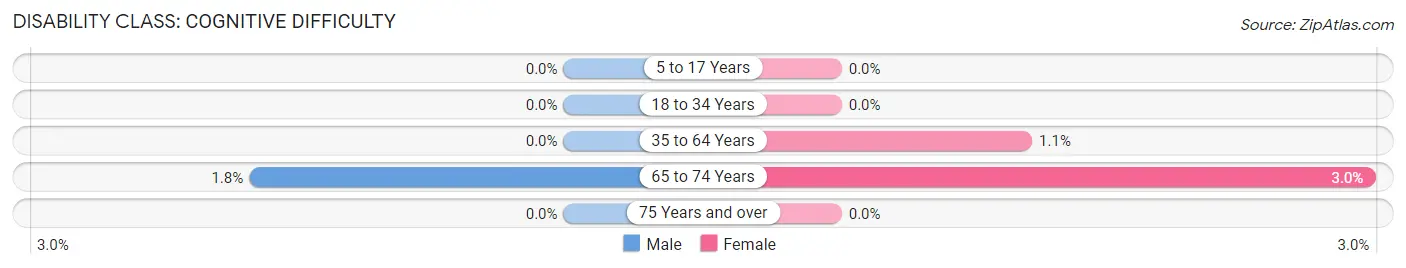
| Age Bracket | Male | Female |
| 5 to 17 Years | 0 (0.0%) | 0 (0.0%) |
| 18 to 34 Years | 0 (0.0%) | 0 (0.0%) |
| 35 to 64 Years | 0 (0.0%) | 9 (1.1%) |
| 65 to 74 Years | 5 (1.8%) | 7 (3.0%) |
| 75 Years and over | 0 (0.0%) | 0 (0.0%) |
Disability Class: Ambulatory Difficulty
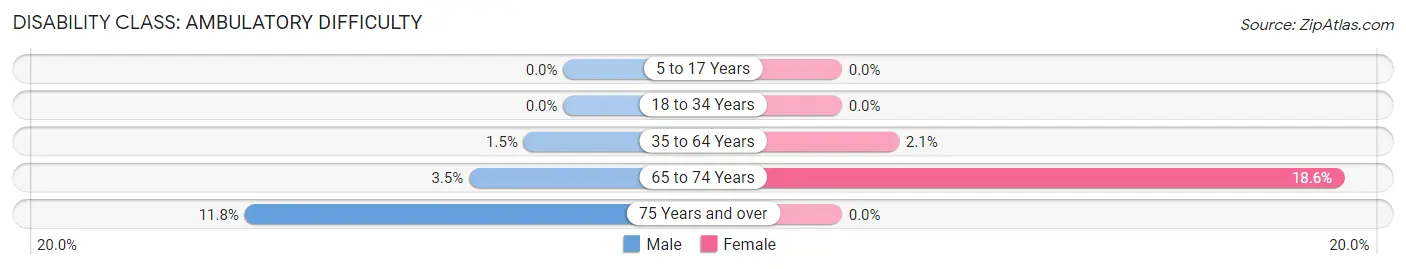
| Age Bracket | Male | Female |
| 5 to 17 Years | 0 (0.0%) | 0 (0.0%) |
| 18 to 34 Years | 0 (0.0%) | 0 (0.0%) |
| 35 to 64 Years | 11 (1.5%) | 18 (2.1%) |
| 65 to 74 Years | 10 (3.5%) | 44 (18.6%) |
| 75 Years and over | 11 (11.8%) | 0 (0.0%) |
Disability Class: Self-Care Difficulty
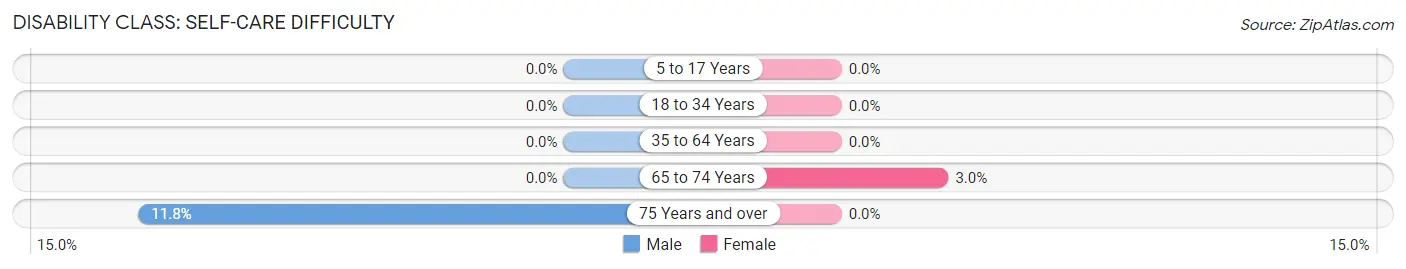
| Age Bracket | Male | Female |
| 5 to 17 Years | 0 (0.0%) | 0 (0.0%) |
| 18 to 34 Years | 0 (0.0%) | 0 (0.0%) |
| 35 to 64 Years | 0 (0.0%) | 0 (0.0%) |
| 65 to 74 Years | 0 (0.0%) | 7 (3.0%) |
| 75 Years and over | 11 (11.8%) | 0 (0.0%) |
Technology Access in Ponderosa Park
Computing Device Access in Ponderosa Park
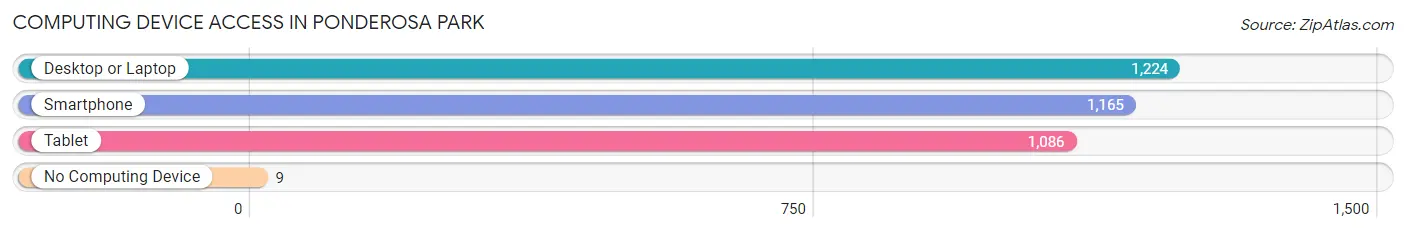
| Device Type | # Households | % Households |
| Desktop or Laptop | 1,224 | 97.1% |
| Smartphone | 1,165 | 92.4% |
| Tablet | 1,086 | 86.1% |
| No Computing Device | 9 | 0.7% |
| Total | 1,261 | 100.0% |
Internet Access in Ponderosa Park
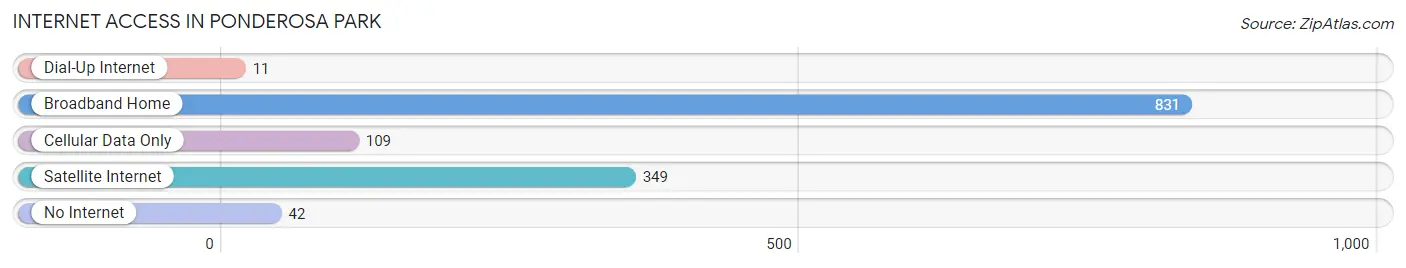
| Internet Type | # Households | % Households |
| Dial-Up Internet | 11 | 0.9% |
| Broadband Home | 831 | 65.9% |
| Cellular Data Only | 109 | 8.6% |
| Satellite Internet | 349 | 27.7% |
| No Internet | 42 | 3.3% |
| Total | 1,261 | 100.0% |
Ponderosa Park Summary
Ponderosa Park is a small unincorporated community located in Douglas County, Colorado, United States. It is situated in the foothills of the Rocky Mountains, approximately 25 miles south of Denver. The community is surrounded by the Pike National Forest and is home to a variety of wildlife, including deer, elk, and black bears.
History
Ponderosa Park was founded in the late 1800s by homesteaders who were drawn to the area by its natural beauty and abundant resources. The community was originally known as “Ponderosa” and was later changed to “Ponderosa Park” in the early 1900s. The name was chosen to reflect the abundance of ponderosa pine trees in the area.
The first settlers in the area were primarily ranchers and farmers, who raised cattle and grew hay, oats, and wheat. The community also had a small sawmill and a general store. In the early 1900s, the Denver & Rio Grande Western Railroad built a line through the area, connecting Ponderosa Park to Denver and other nearby towns.
Geography
Ponderosa Park is located in the foothills of the Rocky Mountains, approximately 25 miles south of Denver. The community is situated at an elevation of 6,800 feet and is surrounded by the Pike National Forest. The area is characterized by rolling hills, dense forests, and numerous creeks and streams.
The climate in Ponderosa Park is generally mild, with warm summers and cold winters. The average annual temperature is around 50 degrees Fahrenheit, and the average annual precipitation is around 20 inches.
Economy
The economy of Ponderosa Park is largely based on tourism and recreation. The area is popular with hikers, campers, and other outdoor enthusiasts, and there are several nearby ski resorts. The community also has a small sawmill and a general store.
Demographics
As of the 2010 census, the population of Ponderosa Park was 1,093. The racial makeup of the community was 97.3% White, 0.7% Native American, 0.3% Asian, 0.2% African American, and 1.5% from other races. The median household income was $50,000, and the median age was 44.
Conclusion
Ponderosa Park is a small unincorporated community located in Douglas County, Colorado. It is situated in the foothills of the Rocky Mountains and is surrounded by the Pike National Forest. The economy of the community is largely based on tourism and recreation, and the area is popular with hikers, campers, and other outdoor enthusiasts. The population of Ponderosa Park was 1,093 as of the 2010 census, and the median household income was $50,000.
Common Questions
What is Per Capita Income in Ponderosa Park?
Per Capita income in Ponderosa Park is $53,175.
What is the Median Family Income in Ponderosa Park?
Median Family Income in Ponderosa Park is $126,591.
What is the Median Household income in Ponderosa Park?
Median Household Income in Ponderosa Park is $127,901.
What is Income or Wage Gap in Ponderosa Park?
Income or Wage Gap in Ponderosa Park is 36.0%.
Women in Ponderosa Park earn 64.0 cents for every dollar earned by a man.
What is Inequality or Gini Index in Ponderosa Park?
Inequality or Gini Index in Ponderosa Park is 0.32.
What is the Total Population of Ponderosa Park?
Total Population of Ponderosa Park is 3,577.
What is the Total Male Population of Ponderosa Park?
Total Male Population of Ponderosa Park is 1,869.
What is the Total Female Population of Ponderosa Park?
Total Female Population of Ponderosa Park is 1,708.
What is the Ratio of Males per 100 Females in Ponderosa Park?
There are 109.43 Males per 100 Females in Ponderosa Park.
What is the Ratio of Females per 100 Males in Ponderosa Park?
There are 91.39 Females per 100 Males in Ponderosa Park.
What is the Median Population Age in Ponderosa Park?
Median Population Age in Ponderosa Park is 44.8 Years.
What is the Average Family Size in Ponderosa Park
Average Family Size in Ponderosa Park is 3.0 People.
What is the Average Household Size in Ponderosa Park
Average Household Size in Ponderosa Park is 2.8 People.
How Large is the Labor Force in Ponderosa Park?
There are 1,962 People in the Labor Forcein in Ponderosa Park.
What is the Percentage of People in the Labor Force in Ponderosa Park?
65.7% of People are in the Labor Force in Ponderosa Park.
What is the Unemployment Rate in Ponderosa Park?
Unemployment Rate in Ponderosa Park is 0.7%.