Berthoud, CO Map & Demographics
Berthoud Map
Berthoud Overview
$45,757
PER CAPITA INCOME
$112,453
AVG FAMILY INCOME
$101,817
AVG HOUSEHOLD INCOME
46.4%
WAGE / INCOME GAP [ % ]
53.6¢/ $1
WAGE / INCOME GAP [ $ ]
0.34
INEQUALITY / GINI INDEX
10,892
TOTAL POPULATION
5,505
MALE POPULATION
5,387
FEMALE POPULATION
102.19
MALES / 100 FEMALES
97.86
FEMALES / 100 MALES
38.5
MEDIAN AGE
2.9
AVG FAMILY SIZE
2.6
AVG HOUSEHOLD SIZE
6,271
LABOR FORCE [ PEOPLE ]
71.4%
PERCENT IN LABOR FORCE
2.8%
UNEMPLOYMENT RATE
Berthoud Zip Codes
Berthoud Area Codes
Income in Berthoud
Income Overview in Berthoud
Per Capita Income in Berthoud is $45,757, while median incomes of families and households are $112,453 and $101,817 respectively.
| Characteristic | Number | Measure |
| Per Capita Income | 10,892 | $45,757 |
| Median Family Income | 3,339 | $112,453 |
| Mean Family Income | 3,339 | $129,311 |
| Median Household Income | 4,143 | $101,817 |
| Mean Household Income | 4,143 | $118,820 |
| Income Deficit | 3,339 | $0 |
| Wage / Income Gap (%) | 10,892 | 46.41% |
| Wage / Income Gap ($) | 10,892 | 53.59¢ per $1 |
| Gini / Inequality Index | 10,892 | 0.34 |
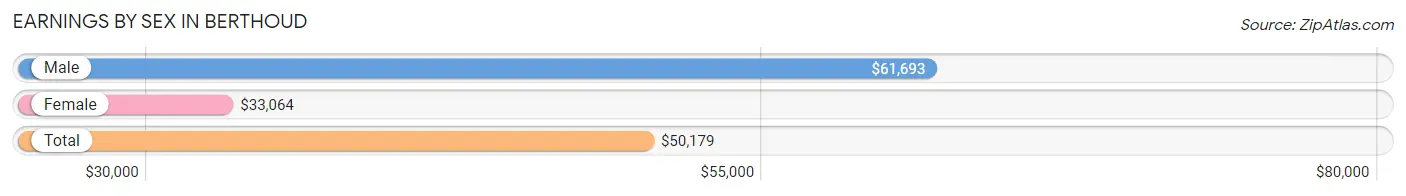
Earnings by Sex in Berthoud
Average Earnings in Berthoud are $50,179, $61,693 for men and $33,064 for women, a difference of 46.4%.
| Sex | Number | Average Earnings |
| Male | 3,607 (53.9%) | $61,693 |
| Female | 3,083 (46.1%) | $33,064 |
| Total | 6,690 (100.0%) | $50,179 |
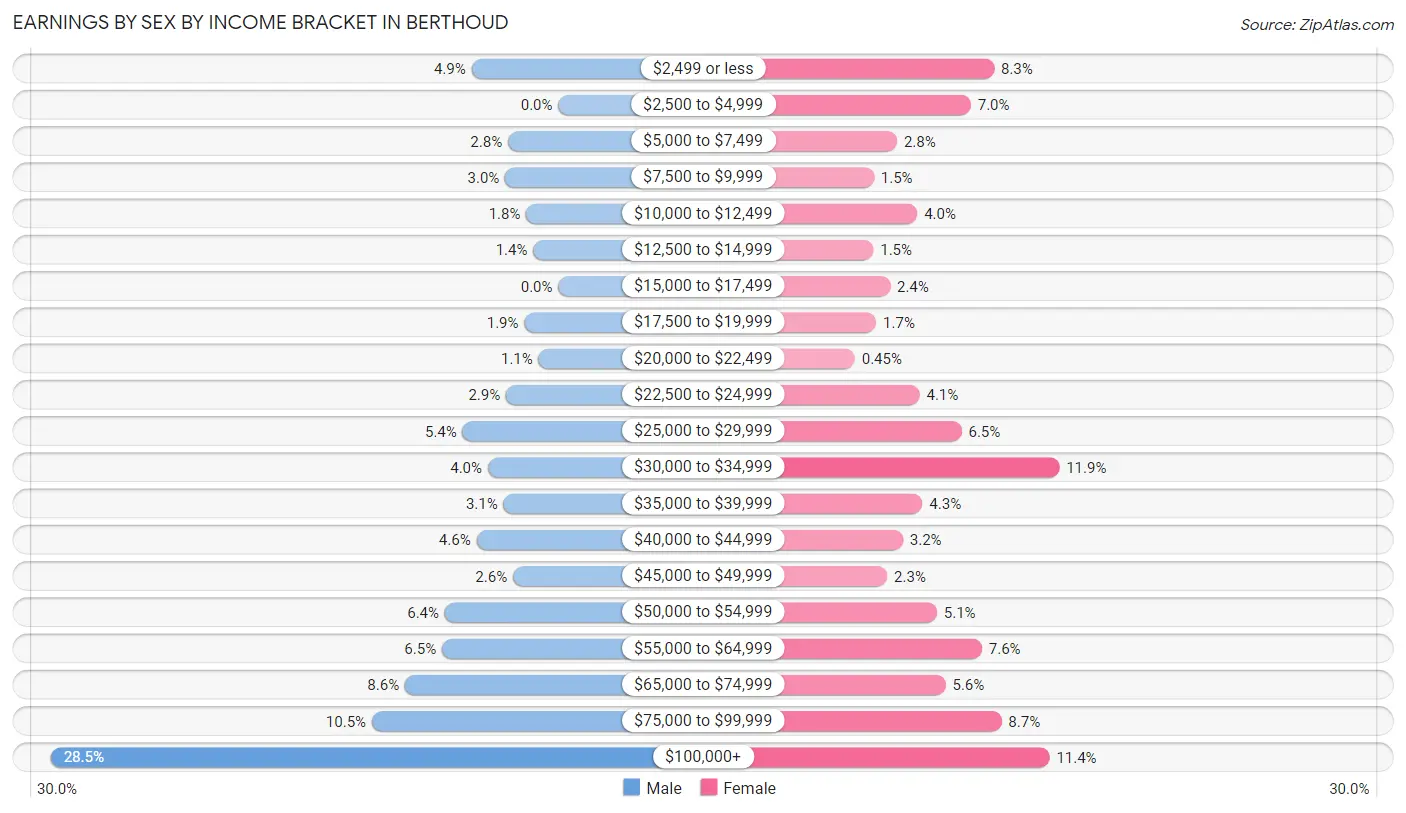
Earnings by Sex by Income Bracket in Berthoud
The most common earnings brackets in Berthoud are $100,000+ for men (1,029 | 28.5%) and $30,000 to $34,999 for women (368 | 11.9%).
| Income | Male | Female |
| $2,499 or less | 176 (4.9%) | 255 (8.3%) |
| $2,500 to $4,999 | 0 (0.0%) | 215 (7.0%) |
| $5,000 to $7,499 | 102 (2.8%) | 87 (2.8%) |
| $7,500 to $9,999 | 108 (3.0%) | 47 (1.5%) |
| $10,000 to $12,499 | 65 (1.8%) | 122 (4.0%) |
| $12,500 to $14,999 | 51 (1.4%) | 46 (1.5%) |
| $15,000 to $17,499 | 0 (0.0%) | 75 (2.4%) |
| $17,500 to $19,999 | 69 (1.9%) | 51 (1.7%) |
| $20,000 to $22,499 | 40 (1.1%) | 14 (0.4%) |
| $22,500 to $24,999 | 106 (2.9%) | 126 (4.1%) |
| $25,000 to $29,999 | 194 (5.4%) | 199 (6.5%) |
| $30,000 to $34,999 | 143 (4.0%) | 368 (11.9%) |
| $35,000 to $39,999 | 111 (3.1%) | 131 (4.3%) |
| $40,000 to $44,999 | 166 (4.6%) | 97 (3.2%) |
| $45,000 to $49,999 | 92 (2.5%) | 70 (2.3%) |
| $50,000 to $54,999 | 230 (6.4%) | 156 (5.1%) |
| $55,000 to $64,999 | 236 (6.5%) | 234 (7.6%) |
| $65,000 to $74,999 | 311 (8.6%) | 171 (5.6%) |
| $75,000 to $99,999 | 378 (10.5%) | 268 (8.7%) |
| $100,000+ | 1,029 (28.5%) | 351 (11.4%) |
| Total | 3,607 (100.0%) | 3,083 (100.0%) |
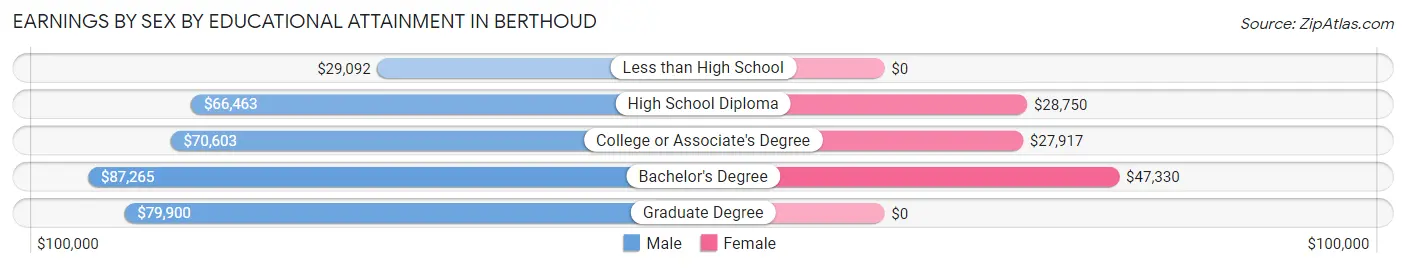
Earnings by Sex by Educational Attainment in Berthoud
Average earnings in Berthoud are $72,806 for men and $39,253 for women, a difference of 46.1%. Men with an educational attainment of bachelor's degree enjoy the highest average annual earnings of $87,265, while those with less than high school education earn the least with $29,092. Women with an educational attainment of bachelor's degree earn the most with the average annual earnings of $47,330, while those with college or associate's degree education have the smallest earnings of $27,917.
| Educational Attainment | Male Income | Female Income |
| Less than High School | $29,092 | $0 |
| High School Diploma | $66,463 | $28,750 |
| College or Associate's Degree | $70,603 | $27,917 |
| Bachelor's Degree | $87,265 | $47,330 |
| Graduate Degree | $79,900 | $0 |
| Total | $72,806 | $39,253 |
Family Income in Berthoud
Family Income Brackets in Berthoud
According to the Berthoud family income data, there are 915 families falling into the $100,000 to $149,999 income range, which is the most common income bracket and makes up 27.4% of all families. Conversely, the $15,000 to $24,999 income bracket is the least frequent group with only 17 families (0.5%) belonging to this category.
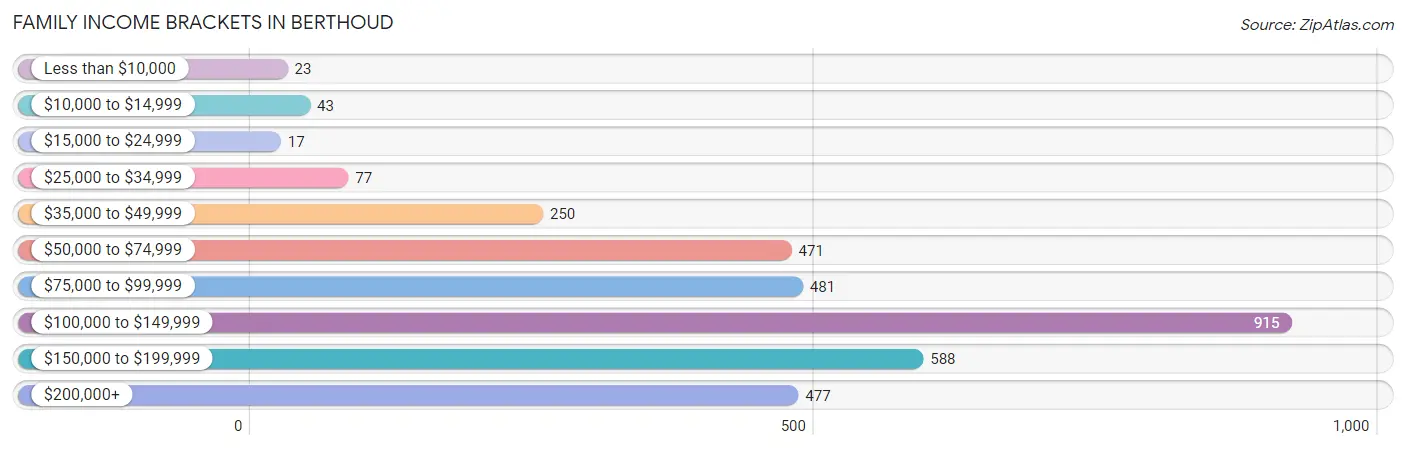
| Income Bracket | # Families | % Families |
| Less than $10,000 | 23 | 0.7% |
| $10,000 to $14,999 | 43 | 1.3% |
| $15,000 to $24,999 | 17 | 0.5% |
| $25,000 to $34,999 | 77 | 2.3% |
| $35,000 to $49,999 | 250 | 7.5% |
| $50,000 to $74,999 | 471 | 14.1% |
| $75,000 to $99,999 | 481 | 14.4% |
| $100,000 to $149,999 | 915 | 27.4% |
| $150,000 to $199,999 | 588 | 17.6% |
| $200,000+ | 477 | 14.3% |
Family Income by Famaliy Size in Berthoud
6-person families (152 | 4.5%) account for the highest median family income in Berthoud with $143,676 per family, while 2-person families (1,760 | 52.7%) have the highest median income of $48,008 per family member.
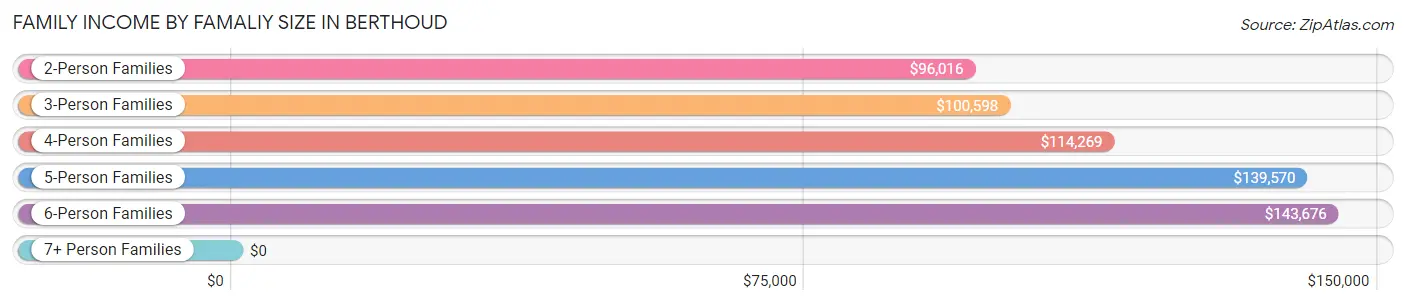
| Income Bracket | # Families | Median Income |
| 2-Person Families | 1,760 (52.7%) | $96,016 |
| 3-Person Families | 585 (17.5%) | $100,598 |
| 4-Person Families | 644 (19.3%) | $114,269 |
| 5-Person Families | 171 (5.1%) | $139,570 |
| 6-Person Families | 152 (4.5%) | $143,676 |
| 7+ Person Families | 27 (0.8%) | $0 |
| Total | 3,339 (100.0%) | $112,453 |
Family Income by Number of Earners in Berthoud
The median family income in Berthoud is $112,453, with families comprising 3+ earners (474) having the highest median family income of $139,591, while families with no earners (285) have the lowest median family income of $62,721, accounting for 14.2% and 8.5% of families, respectively.
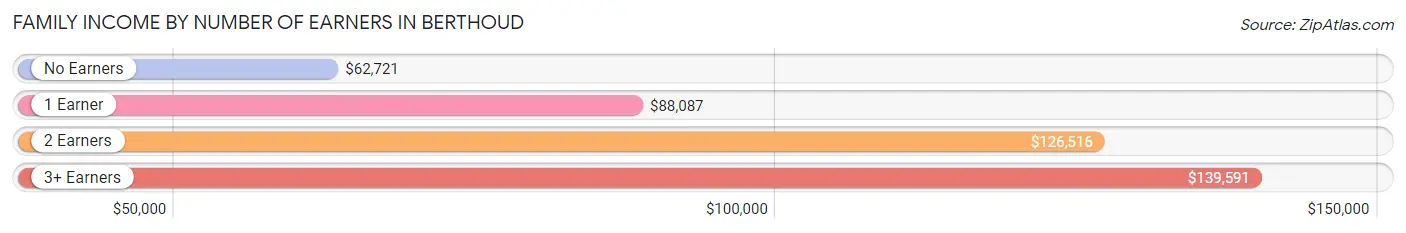
| Number of Earners | # Families | Median Income |
| No Earners | 285 (8.5%) | $62,721 |
| 1 Earner | 873 (26.2%) | $88,087 |
| 2 Earners | 1,707 (51.1%) | $126,516 |
| 3+ Earners | 474 (14.2%) | $139,591 |
| Total | 3,339 (100.0%) | $112,453 |
Household Income in Berthoud
Household Income Brackets in Berthoud
With 998 households falling in the category, the $100,000 to $149,999 income range is the most frequent in Berthoud, accounting for 24.1% of all households. In contrast, only 8 households (0.2%) fall into the less than $10,000 income bracket, making it the least populous group.
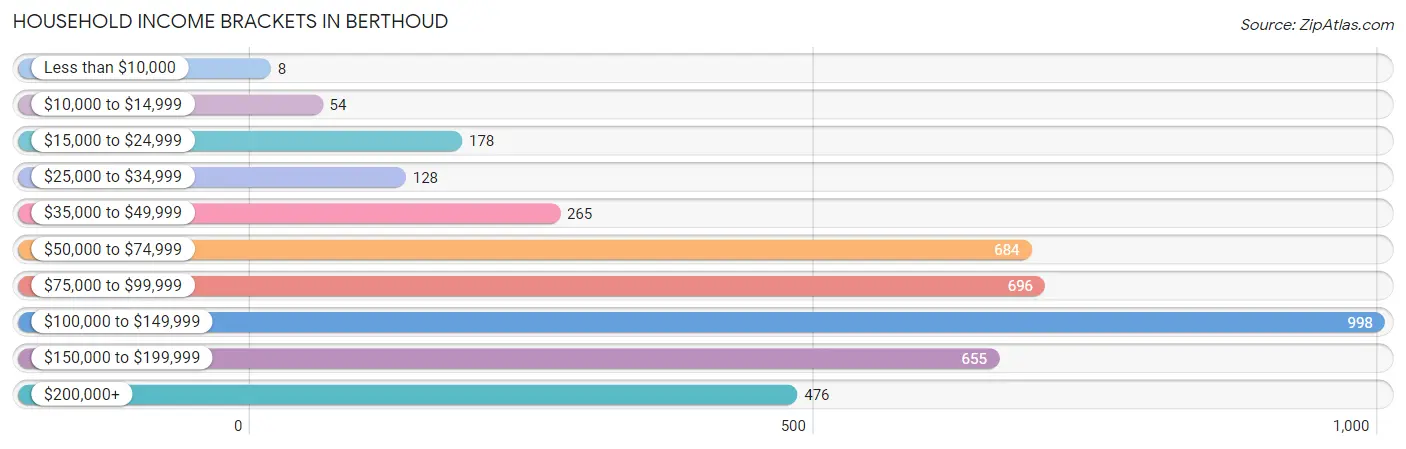
| Income Bracket | # Households | % Households |
| Less than $10,000 | 8 | 0.2% |
| $10,000 to $14,999 | 54 | 1.3% |
| $15,000 to $24,999 | 178 | 4.3% |
| $25,000 to $34,999 | 128 | 3.1% |
| $35,000 to $49,999 | 265 | 6.4% |
| $50,000 to $74,999 | 684 | 16.5% |
| $75,000 to $99,999 | 696 | 16.8% |
| $100,000 to $149,999 | 998 | 24.1% |
| $150,000 to $199,999 | 655 | 15.8% |
| $200,000+ | 476 | 11.5% |
Household Income by Householder Age in Berthoud
The median household income in Berthoud is $101,817, with the highest median household income of $126,516 found in the 45 to 64 years age bracket for the primary householder. A total of 1,519 households (36.7%) fall into this category. Meanwhile, the 65+ years age bracket for the primary householder has the lowest median household income of $83,224, with 979 households (23.6%) in this group.
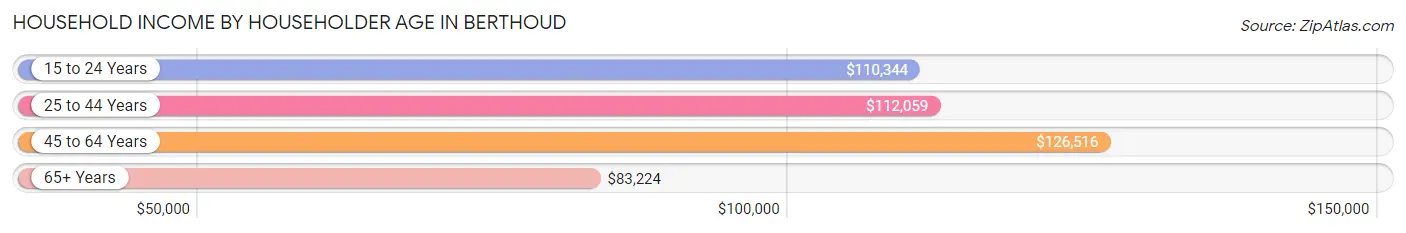
| Income Bracket | # Households | Median Income |
| 15 to 24 Years | 69 (1.7%) | $110,344 |
| 25 to 44 Years | 1,576 (38.0%) | $112,059 |
| 45 to 64 Years | 1,519 (36.7%) | $126,516 |
| 65+ Years | 979 (23.6%) | $83,224 |
| Total | 4,143 (100.0%) | $101,817 |
Poverty in Berthoud
Income Below Poverty by Sex and Age in Berthoud
With 2.4% poverty level for males and 3.0% for females among the residents of Berthoud, 75 year old and over males and 5 year old females are the most vulnerable to poverty, with 30 males (13.9%) and 21 females (100.0%) in their respective age groups living below the poverty level.
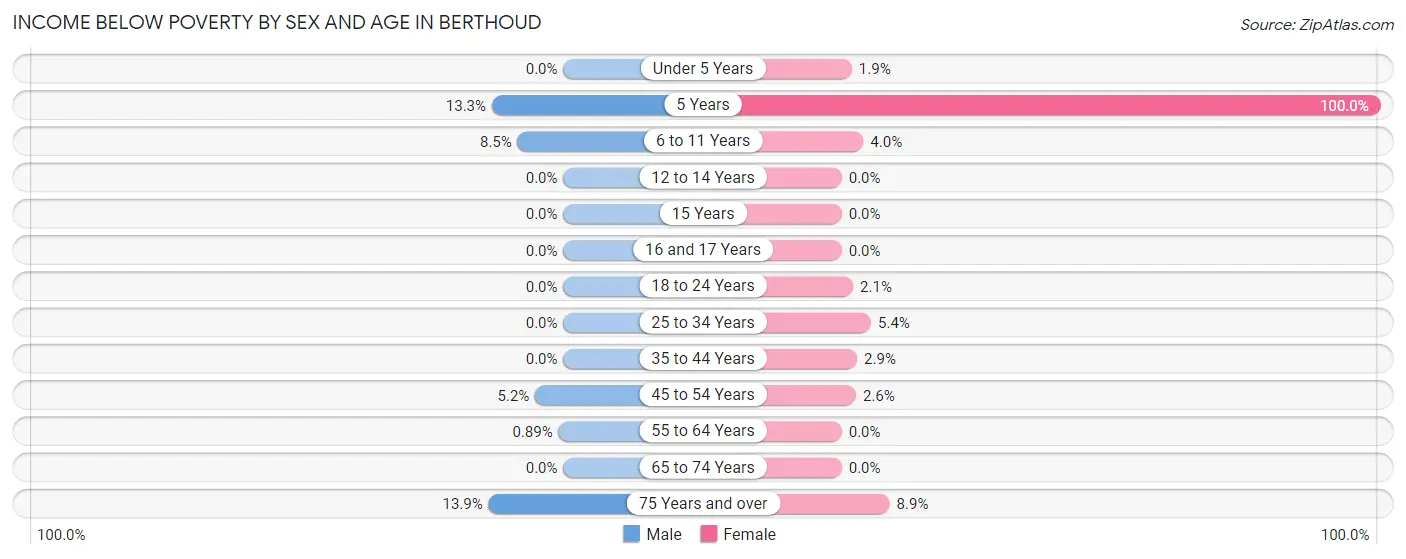
| Age Bracket | Male | Female |
| Under 5 Years | 0 (0.0%) | 9 (1.9%) |
| 5 Years | 15 (13.3%) | 21 (100.0%) |
| 6 to 11 Years | 37 (8.5%) | 15 (4.0%) |
| 12 to 14 Years | 0 (0.0%) | 0 (0.0%) |
| 15 Years | 0 (0.0%) | 0 (0.0%) |
| 16 and 17 Years | 0 (0.0%) | 0 (0.0%) |
| 18 to 24 Years | 0 (0.0%) | 7 (2.1%) |
| 25 to 34 Years | 0 (0.0%) | 47 (5.4%) |
| 35 to 44 Years | 0 (0.0%) | 21 (2.9%) |
| 45 to 54 Years | 42 (5.2%) | 19 (2.6%) |
| 55 to 64 Years | 5 (0.9%) | 0 (0.0%) |
| 65 to 74 Years | 0 (0.0%) | 0 (0.0%) |
| 75 Years and over | 30 (13.9%) | 19 (8.9%) |
| Total | 129 (2.4%) | 158 (3.0%) |
Income Above Poverty by Sex and Age in Berthoud
According to the poverty statistics in Berthoud, males aged under 5 years and females aged 12 to 14 years are the age groups that are most secure financially, with 100.0% of males and 100.0% of females in these age groups living above the poverty line.
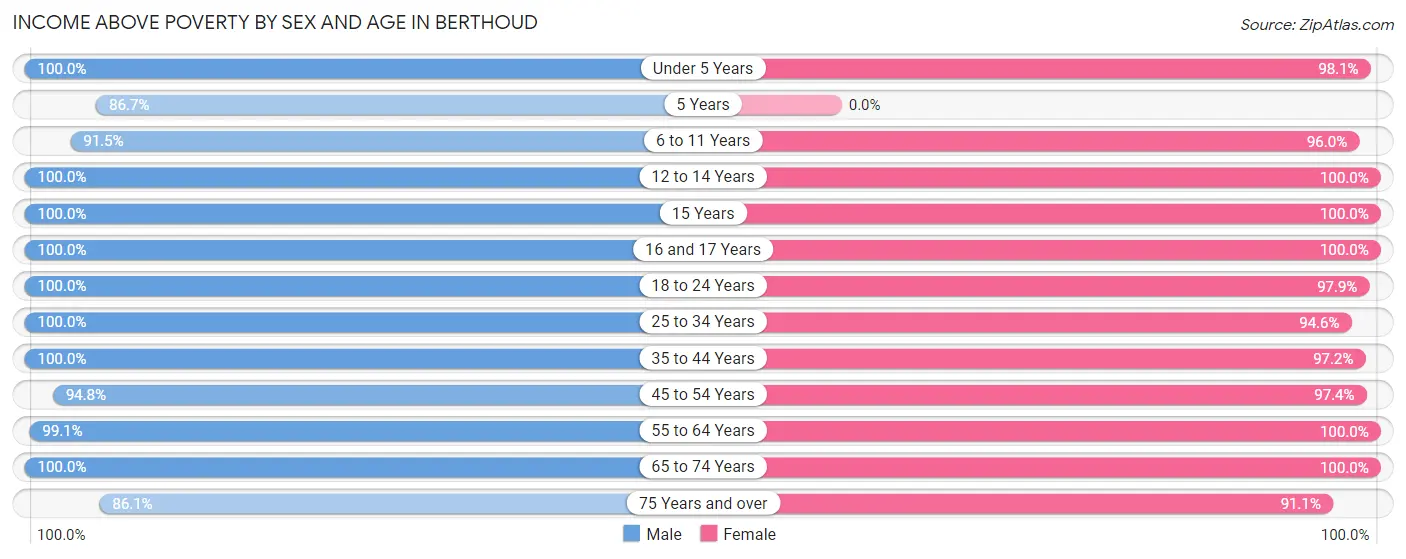
| Age Bracket | Male | Female |
| Under 5 Years | 288 (100.0%) | 470 (98.1%) |
| 5 Years | 98 (86.7%) | 0 (0.0%) |
| 6 to 11 Years | 399 (91.5%) | 359 (96.0%) |
| 12 to 14 Years | 265 (100.0%) | 63 (100.0%) |
| 15 Years | 26 (100.0%) | 21 (100.0%) |
| 16 and 17 Years | 207 (100.0%) | 163 (100.0%) |
| 18 to 24 Years | 560 (100.0%) | 325 (97.9%) |
| 25 to 34 Years | 684 (100.0%) | 817 (94.6%) |
| 35 to 44 Years | 822 (100.0%) | 716 (97.2%) |
| 45 to 54 Years | 761 (94.8%) | 701 (97.4%) |
| 55 to 64 Years | 554 (99.1%) | 805 (100.0%) |
| 65 to 74 Years | 492 (100.0%) | 528 (100.0%) |
| 75 Years and over | 186 (86.1%) | 195 (91.1%) |
| Total | 5,342 (97.6%) | 5,163 (97.0%) |
Income Below Poverty Among Married-Couple Families in Berthoud
The poverty statistics for married-couple families in Berthoud show that 1.5% or 42 of the total 2,857 families live below the poverty line. Families with 1 or 2 children have the highest poverty rate of 2.6%, comprising of 23 families. On the other hand, families with 3 or 4 children have the lowest poverty rate of 0.0%, which includes 0 families.
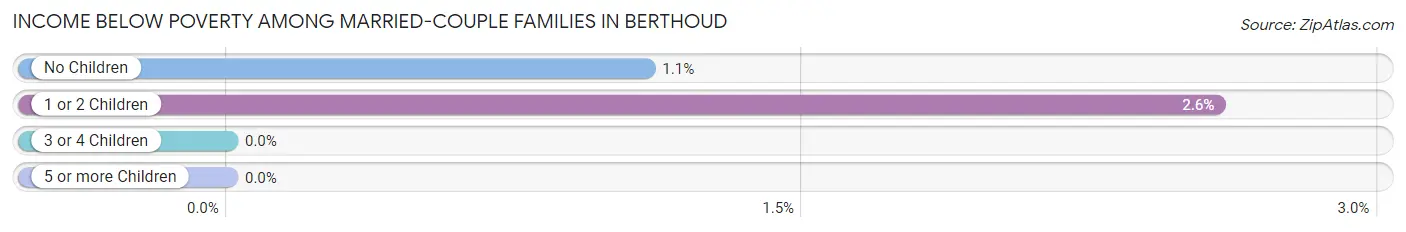
| Children | Above Poverty | Below Poverty |
| No Children | 1,724 (98.9%) | 19 (1.1%) |
| 1 or 2 Children | 868 (97.4%) | 23 (2.6%) |
| 3 or 4 Children | 196 (100.0%) | 0 (0.0%) |
| 5 or more Children | 27 (100.0%) | 0 (0.0%) |
| Total | 2,815 (98.5%) | 42 (1.5%) |
Income Below Poverty Among Single-Parent Households in Berthoud
According to the poverty data in Berthoud, 12.5% or 15 single-father households and 1.9% or 7 single-mother households are living below the poverty line. Among single-father households, those with 3 or 4 children have the highest poverty rate, with 15 households (26.3%) experiencing poverty. Likewise, among single-mother households, those with 1 or 2 children have the highest poverty rate, with 7 households (5.1%) falling below the poverty line.
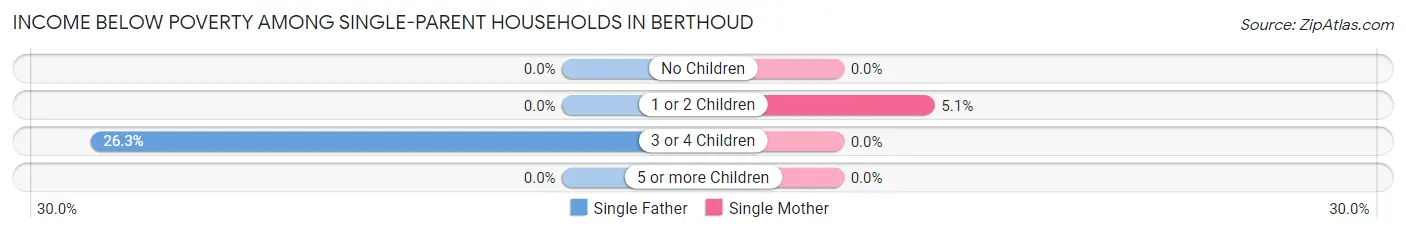
| Children | Single Father | Single Mother |
| No Children | 0 (0.0%) | 0 (0.0%) |
| 1 or 2 Children | 0 (0.0%) | 7 (5.1%) |
| 3 or 4 Children | 15 (26.3%) | 0 (0.0%) |
| 5 or more Children | 0 (0.0%) | 0 (0.0%) |
| Total | 15 (12.5%) | 7 (1.9%) |
Income Below Poverty Among Married-Couple vs Single-Parent Households in Berthoud
The poverty data for Berthoud shows that 42 of the married-couple family households (1.5%) and 22 of the single-parent households (4.6%) are living below the poverty level. Within the married-couple family households, those with 1 or 2 children have the highest poverty rate, with 23 households (2.6%) falling below the poverty line. Among the single-parent households, those with 3 or 4 children have the highest poverty rate, with 15 household (20.3%) living below poverty.
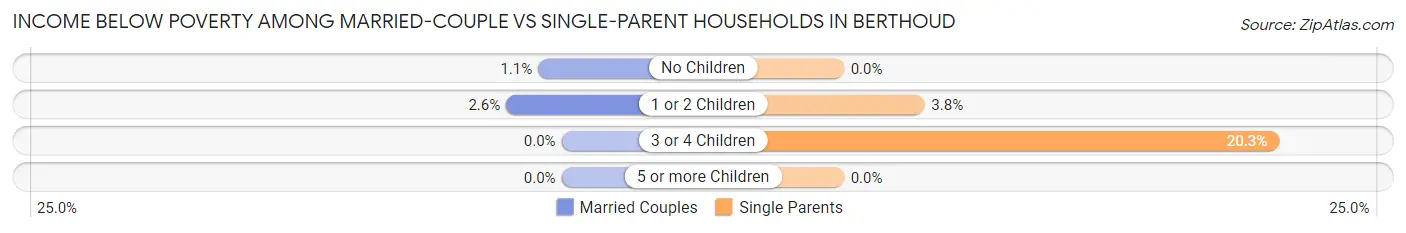
| Children | Married-Couple Families | Single-Parent Households |
| No Children | 19 (1.1%) | 0 (0.0%) |
| 1 or 2 Children | 23 (2.6%) | 7 (3.8%) |
| 3 or 4 Children | 0 (0.0%) | 15 (20.3%) |
| 5 or more Children | 0 (0.0%) | 0 (0.0%) |
| Total | 42 (1.5%) | 22 (4.6%) |
Race in Berthoud
The most populous races in Berthoud are White / Caucasian (9,750 | 89.5%), Hispanic or Latino (1,649 | 15.1%), and Two or more Races (631 | 5.8%).
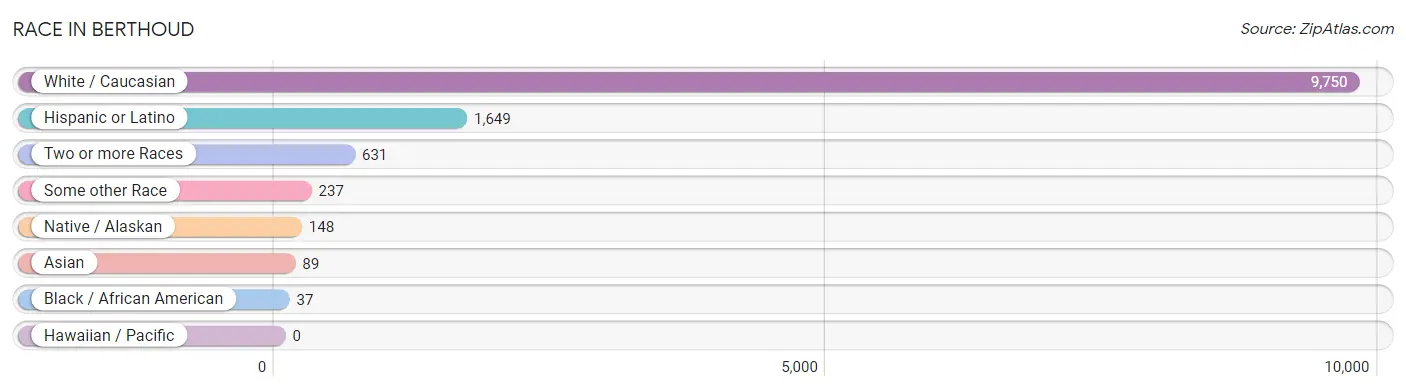
| Race | # Population | % Population |
| Asian | 89 | 0.8% |
| Black / African American | 37 | 0.3% |
| Hawaiian / Pacific | 0 | 0.0% |
| Hispanic or Latino | 1,649 | 15.1% |
| Native / Alaskan | 148 | 1.4% |
| White / Caucasian | 9,750 | 89.5% |
| Two or more Races | 631 | 5.8% |
| Some other Race | 237 | 2.2% |
| Total | 10,892 | 100.0% |
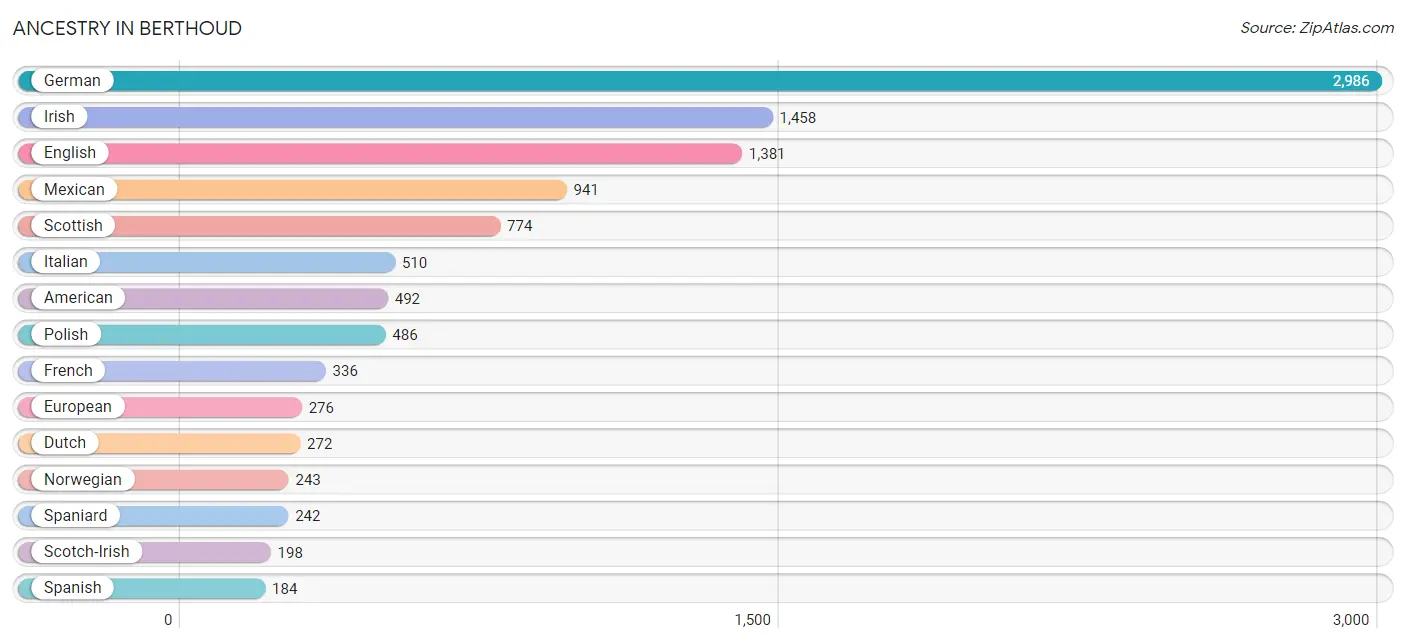
Ancestry in Berthoud
The most populous ancestries reported in Berthoud are German (2,986 | 27.4%), Irish (1,458 | 13.4%), English (1,381 | 12.7%), Mexican (941 | 8.6%), and Scottish (774 | 7.1%), together accounting for 69.2% of all Berthoud residents.
| Ancestry | # Population | % Population |
| American | 492 | 4.5% |
| Arab | 73 | 0.7% |
| Austrian | 46 | 0.4% |
| Belgian | 79 | 0.7% |
| Brazilian | 36 | 0.3% |
| British | 69 | 0.6% |
| Cajun | 17 | 0.2% |
| Canadian | 6 | 0.1% |
| Celtic | 33 | 0.3% |
| Central American Indian | 55 | 0.5% |
| Cherokee | 57 | 0.5% |
| Choctaw | 43 | 0.4% |
| Colombian | 44 | 0.4% |
| Croatian | 38 | 0.4% |
| Cuban | 7 | 0.1% |
| Czech | 33 | 0.3% |
| Czechoslovakian | 67 | 0.6% |
| Danish | 66 | 0.6% |
| Dutch | 272 | 2.5% |
| Eastern European | 17 | 0.2% |
| English | 1,381 | 12.7% |
| European | 276 | 2.5% |
| French | 336 | 3.1% |
| French Canadian | 67 | 0.6% |
| German | 2,986 | 27.4% |
| Haitian | 3 | 0.0% |
| Hungarian | 34 | 0.3% |
| Indian (Asian) | 24 | 0.2% |
| Iranian | 29 | 0.3% |
| Irish | 1,458 | 13.4% |
| Italian | 510 | 4.7% |
| Lithuanian | 92 | 0.8% |
| Mexican | 941 | 8.6% |
| Mexican American Indian | 80 | 0.7% |
| Navajo | 11 | 0.1% |
| Northern European | 12 | 0.1% |
| Norwegian | 243 | 2.2% |
| Peruvian | 32 | 0.3% |
| Polish | 486 | 4.5% |
| Portuguese | 18 | 0.2% |
| Puerto Rican | 181 | 1.7% |
| Russian | 54 | 0.5% |
| Scandinavian | 29 | 0.3% |
| Scotch-Irish | 198 | 1.8% |
| Scottish | 774 | 7.1% |
| Sioux | 27 | 0.3% |
| Slovak | 31 | 0.3% |
| Slovene | 56 | 0.5% |
| South American | 76 | 0.7% |
| Spaniard | 242 | 2.2% |
| Spanish | 184 | 1.7% |
| Sri Lankan | 44 | 0.4% |
| Swedish | 149 | 1.4% |
| Swiss | 118 | 1.1% |
| Syrian | 73 | 0.7% |
| Ukrainian | 179 | 1.6% |
| Welsh | 143 | 1.3% | View All 57 Rows |
Immigrants in Berthoud
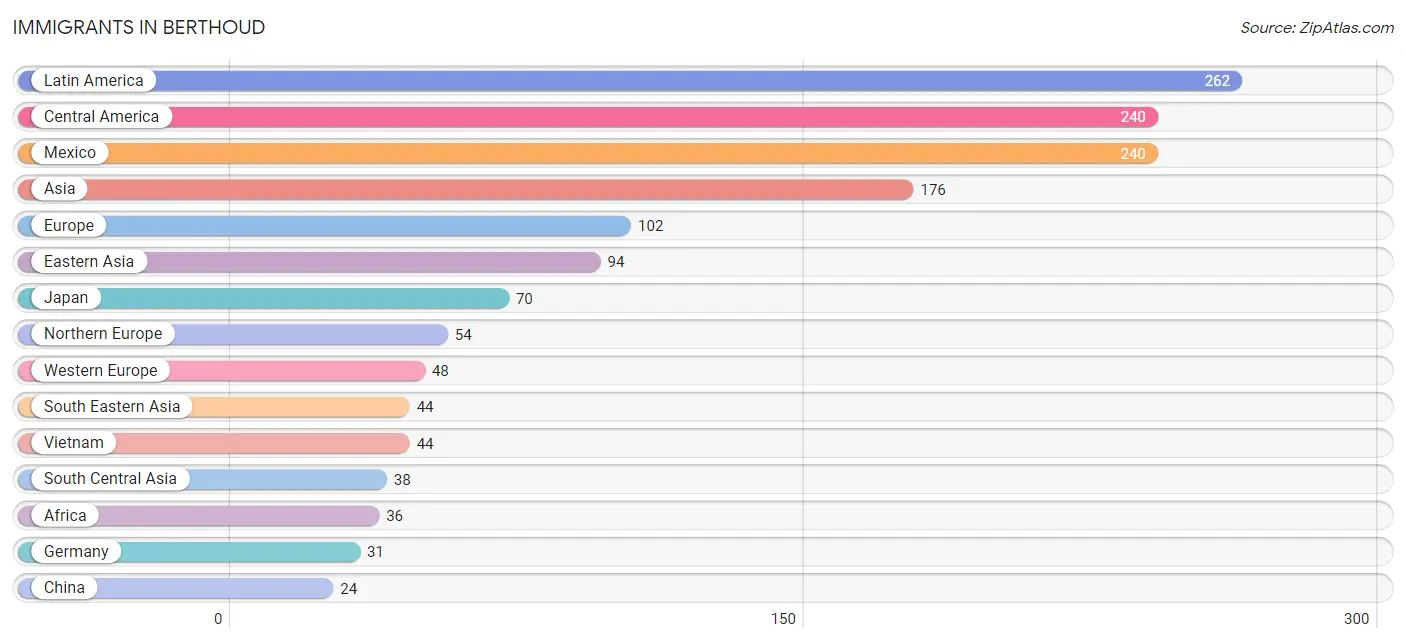
The most numerous immigrant groups reported in Berthoud came from Latin America (262 | 2.4%), Central America (240 | 2.2%), Mexico (240 | 2.2%), Asia (176 | 1.6%), and Europe (102 | 0.9%), together accounting for 9.4% of all Berthoud residents.
| Immigration Origin | # Population | % Population |
| Africa | 36 | 0.3% |
| Asia | 176 | 1.6% |
| Brazil | 19 | 0.2% |
| Canada | 6 | 0.1% |
| Caribbean | 3 | 0.0% |
| Central America | 240 | 2.2% |
| China | 24 | 0.2% |
| Eastern Africa | 18 | 0.2% |
| Eastern Asia | 94 | 0.9% |
| England | 15 | 0.1% |
| Eritrea | 18 | 0.2% |
| Europe | 102 | 0.9% |
| Germany | 31 | 0.3% |
| Haiti | 3 | 0.0% |
| Iran | 17 | 0.2% |
| Ireland | 8 | 0.1% |
| Japan | 70 | 0.6% |
| Latin America | 262 | 2.4% |
| Mexico | 240 | 2.2% |
| Middle Africa | 18 | 0.2% |
| Northern Europe | 54 | 0.5% |
| Pakistan | 21 | 0.2% |
| South America | 19 | 0.2% |
| South Central Asia | 38 | 0.4% |
| South Eastern Asia | 44 | 0.4% |
| Switzerland | 17 | 0.2% |
| Vietnam | 44 | 0.4% |
| Western Europe | 48 | 0.4% | View All 28 Rows |
Sex and Age in Berthoud
Sex and Age in Berthoud
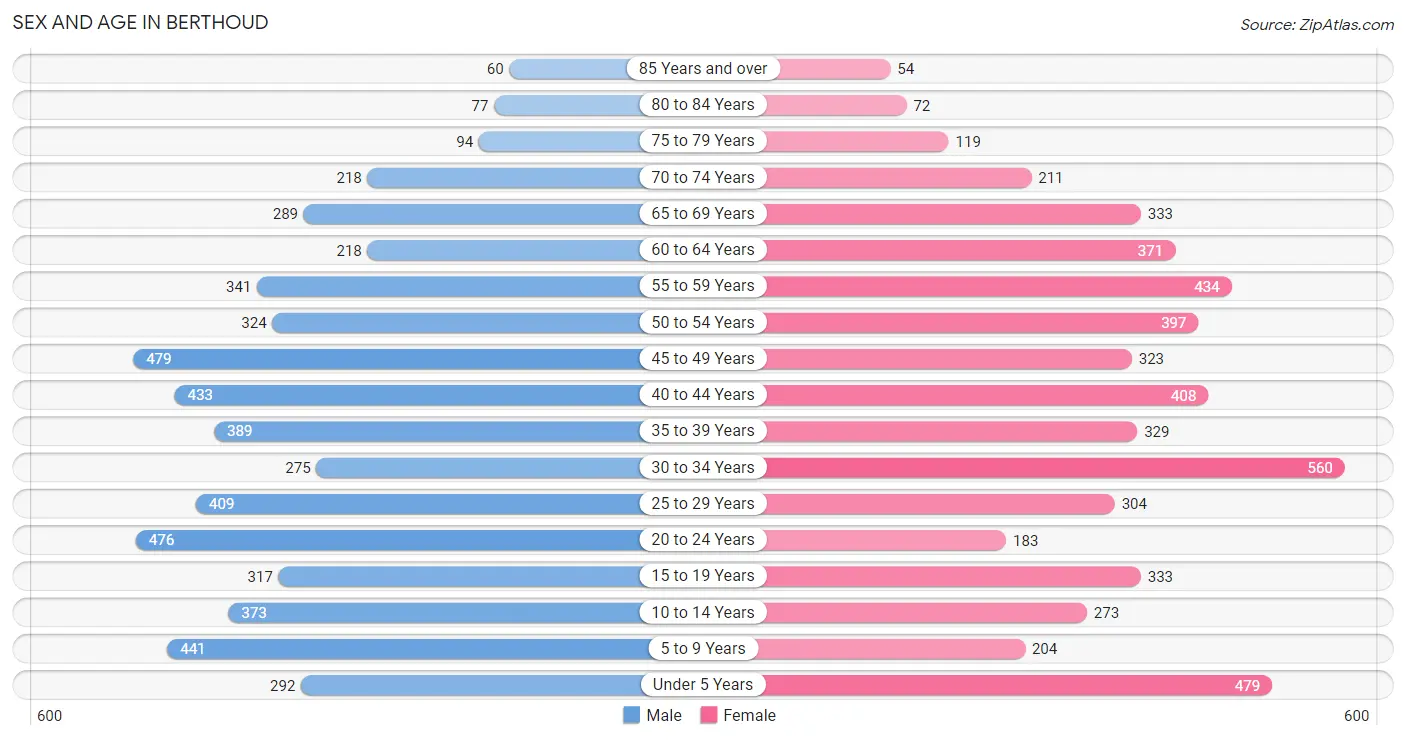
The most populous age groups in Berthoud are 45 to 49 Years (479 | 8.7%) for men and 30 to 34 Years (560 | 10.4%) for women.
| Age Bracket | Male | Female |
| Under 5 Years | 292 (5.3%) | 479 (8.9%) |
| 5 to 9 Years | 441 (8.0%) | 204 (3.8%) |
| 10 to 14 Years | 373 (6.8%) | 273 (5.1%) |
| 15 to 19 Years | 317 (5.8%) | 333 (6.2%) |
| 20 to 24 Years | 476 (8.6%) | 183 (3.4%) |
| 25 to 29 Years | 409 (7.4%) | 304 (5.6%) |
| 30 to 34 Years | 275 (5.0%) | 560 (10.4%) |
| 35 to 39 Years | 389 (7.1%) | 329 (6.1%) |
| 40 to 44 Years | 433 (7.9%) | 408 (7.6%) |
| 45 to 49 Years | 479 (8.7%) | 323 (6.0%) |
| 50 to 54 Years | 324 (5.9%) | 397 (7.4%) |
| 55 to 59 Years | 341 (6.2%) | 434 (8.1%) |
| 60 to 64 Years | 218 (4.0%) | 371 (6.9%) |
| 65 to 69 Years | 289 (5.2%) | 333 (6.2%) |
| 70 to 74 Years | 218 (4.0%) | 211 (3.9%) |
| 75 to 79 Years | 94 (1.7%) | 119 (2.2%) |
| 80 to 84 Years | 77 (1.4%) | 72 (1.3%) |
| 85 Years and over | 60 (1.1%) | 54 (1.0%) |
| Total | 5,505 (100.0%) | 5,387 (100.0%) |
Families and Households in Berthoud
Median Family Size in Berthoud
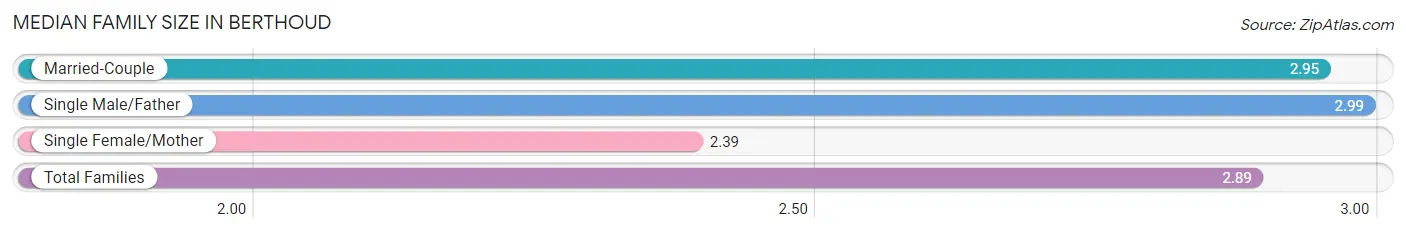
The median family size in Berthoud is 2.89 persons per family, with single male/father families (120 | 3.6%) accounting for the largest median family size of 2.99 persons per family. On the other hand, single female/mother families (362 | 10.8%) represent the smallest median family size with 2.39 persons per family.
| Family Type | # Families | Family Size |
| Married-Couple | 2,857 (85.6%) | 2.95 |
| Single Male/Father | 120 (3.6%) | 2.99 |
| Single Female/Mother | 362 (10.8%) | 2.39 |
| Total Families | 3,339 (100.0%) | 2.89 |
Median Household Size in Berthoud
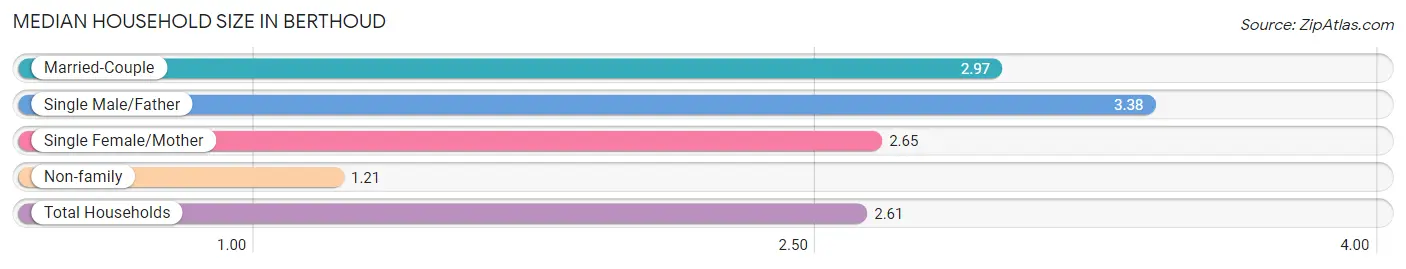
The median household size in Berthoud is 2.61 persons per household, with single male/father households (120 | 2.9%) accounting for the largest median household size of 3.38 persons per household. non-family households (804 | 19.4%) represent the smallest median household size with 1.21 persons per household.
| Household Type | # Households | Household Size |
| Married-Couple | 2,857 (69.0%) | 2.97 |
| Single Male/Father | 120 (2.9%) | 3.38 |
| Single Female/Mother | 362 (8.7%) | 2.65 |
| Non-family | 804 (19.4%) | 1.21 |
| Total Households | 4,143 (100.0%) | 2.61 |
Household Size by Marriage Status in Berthoud
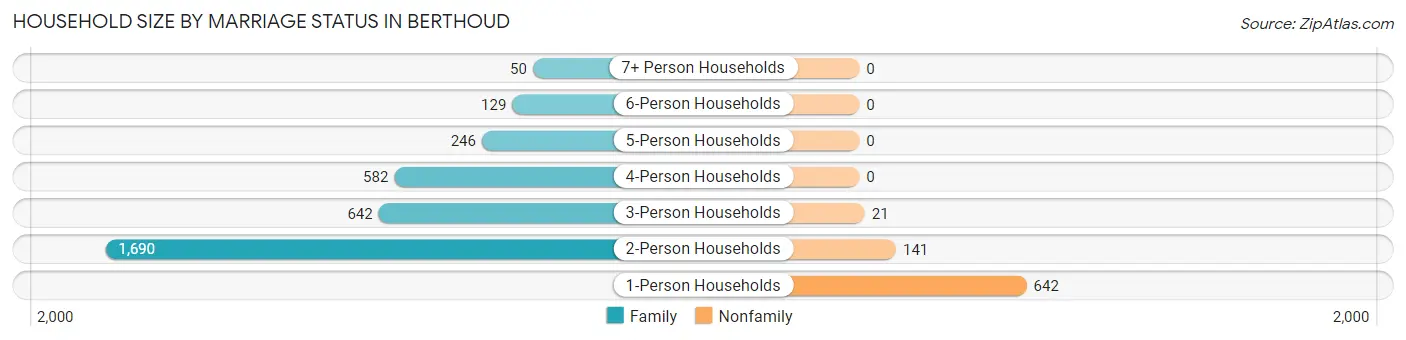
Out of a total of 4,143 households in Berthoud, 3,339 (80.6%) are family households, while 804 (19.4%) are nonfamily households. The most numerous type of family households are 2-person households, comprising 1,690, and the most common type of nonfamily households are 1-person households, comprising 642.
| Household Size | Family Households | Nonfamily Households |
| 1-Person Households | - | 642 (15.5%) |
| 2-Person Households | 1,690 (40.8%) | 141 (3.4%) |
| 3-Person Households | 642 (15.5%) | 21 (0.5%) |
| 4-Person Households | 582 (14.1%) | 0 (0.0%) |
| 5-Person Households | 246 (5.9%) | 0 (0.0%) |
| 6-Person Households | 129 (3.1%) | 0 (0.0%) |
| 7+ Person Households | 50 (1.2%) | 0 (0.0%) |
| Total | 3,339 (80.6%) | 804 (19.4%) |
Female Fertility in Berthoud
Fertility by Age in Berthoud
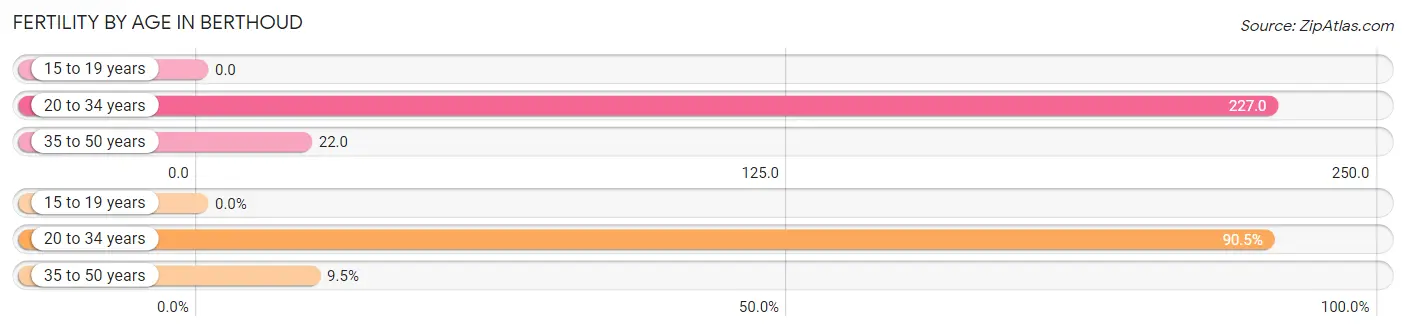
Average fertility rate in Berthoud is 105.0 births per 1,000 women. Women in the age bracket of 20 to 34 years have the highest fertility rate with 227.0 births per 1,000 women. Women in the age bracket of 20 to 34 years acount for 90.5% of all women with births.
| Age Bracket | Women with Births | Births / 1,000 Women |
| 15 to 19 years | 0 (0.0%) | 0.0 |
| 20 to 34 years | 238 (90.5%) | 227.0 |
| 35 to 50 years | 25 (9.5%) | 22.0 |
| Total | 263 (100.0%) | 105.0 |
Fertility by Age by Marriage Status in Berthoud
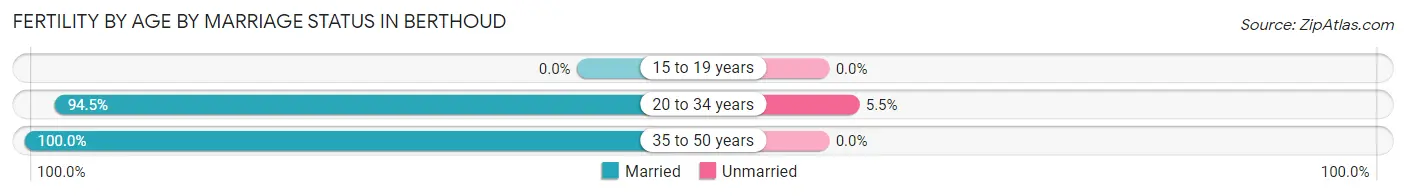
95.1% of women with births (263) in Berthoud are married. The highest percentage of unmarried women with births falls into 20 to 34 years age bracket with 5.5% of them unmarried at the time of birth, while the lowest percentage of unmarried women with births belong to 35 to 50 years age bracket with 0.0% of them unmarried.
| Age Bracket | Married | Unmarried |
| 15 to 19 years | 0 (0.0%) | 0 (0.0%) |
| 20 to 34 years | 225 (94.5%) | 13 (5.5%) |
| 35 to 50 years | 25 (100.0%) | 0 (0.0%) |
| Total | 250 (95.1%) | 13 (4.9%) |
Fertility by Education in Berthoud
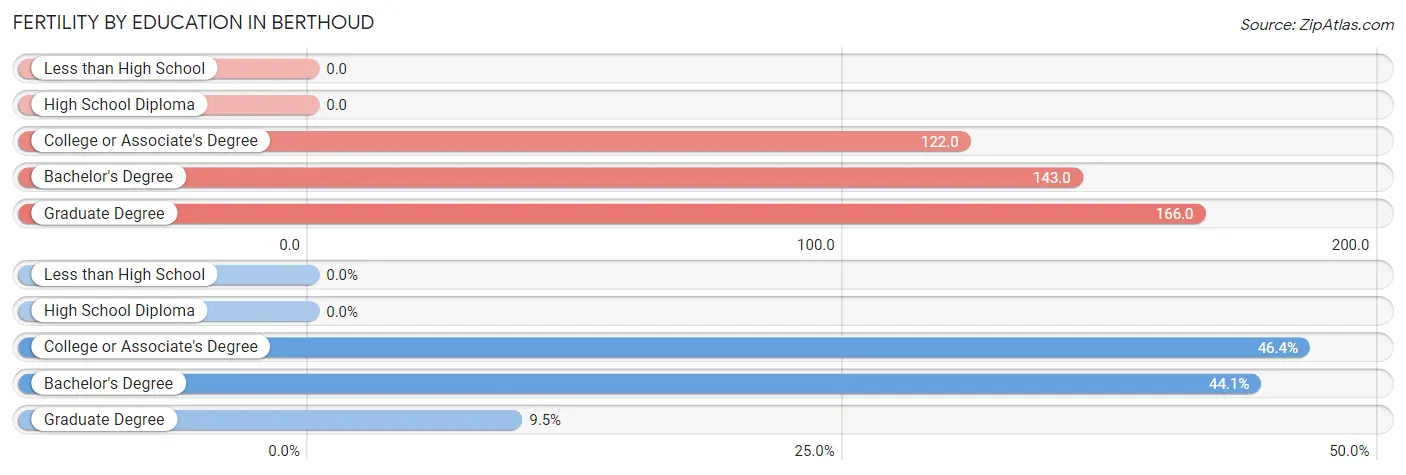
| Educational Attainment | Women with Births | Births / 1,000 Women |
| Less than High School | 0 (0.0%) | 0.0 |
| High School Diploma | 0 (0.0%) | 0.0 |
| College or Associate's Degree | 122 (46.4%) | 122.0 |
| Bachelor's Degree | 116 (44.1%) | 143.0 |
| Graduate Degree | 25 (9.5%) | 166.0 |
| Total | 263 (100.0%) | 105.0 |
Fertility by Education by Marriage Status in Berthoud
4.9% of women with births in Berthoud are unmarried. Women with the educational attainment of bachelor's degree are most likely to be married with 100.0% of them married at childbirth, while women with the educational attainment of college or associate's degree are least likely to be married with 10.7% of them unmarried at childbirth.
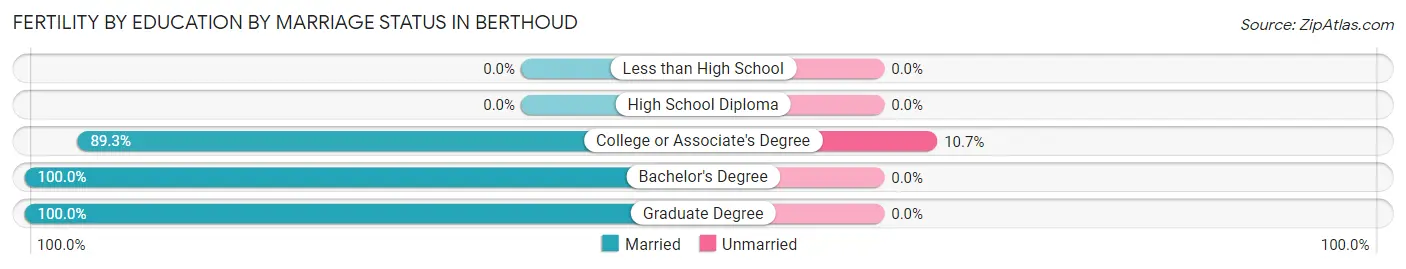
| Educational Attainment | Married | Unmarried |
| Less than High School | 0 (0.0%) | 0 (0.0%) |
| High School Diploma | 0 (0.0%) | 0 (0.0%) |
| College or Associate's Degree | 109 (89.3%) | 13 (10.7%) |
| Bachelor's Degree | 116 (100.0%) | 0 (0.0%) |
| Graduate Degree | 25 (100.0%) | 0 (0.0%) |
| Total | 250 (95.1%) | 13 (4.9%) |
Employment Characteristics in Berthoud
Employment by Class of Employer in Berthoud
Among the 6,015 employed individuals in Berthoud, private company employees (3,732 | 62.0%), not-for-profit organizations (672 | 11.2%), and self-employed (not incorporated) (592 | 9.8%) make up the most common classes of employment.
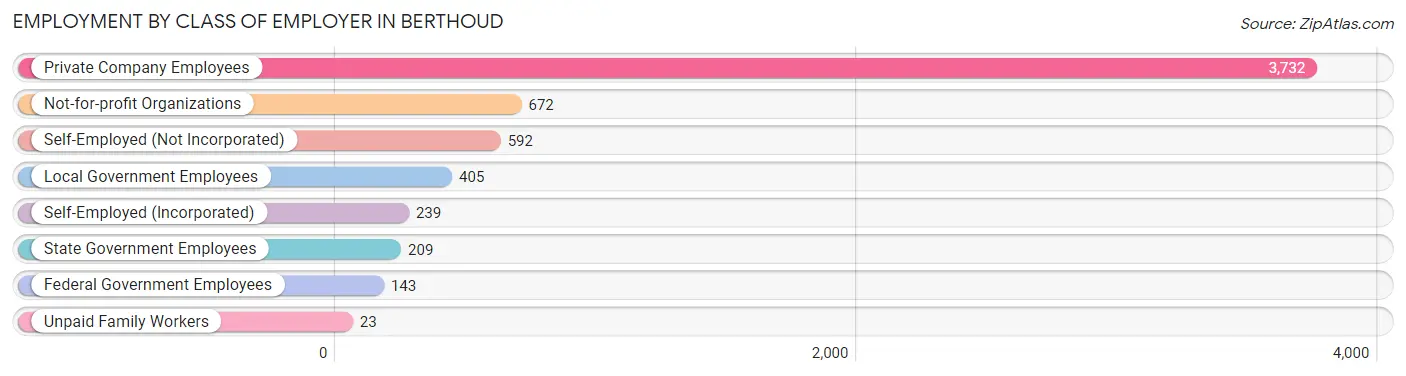
| Employer Class | # Employees | % Employees |
| Private Company Employees | 3,732 | 62.0% |
| Self-Employed (Incorporated) | 239 | 4.0% |
| Self-Employed (Not Incorporated) | 592 | 9.8% |
| Not-for-profit Organizations | 672 | 11.2% |
| Local Government Employees | 405 | 6.7% |
| State Government Employees | 209 | 3.5% |
| Federal Government Employees | 143 | 2.4% |
| Unpaid Family Workers | 23 | 0.4% |
| Total | 6,015 | 100.0% |
Employment Status by Age in Berthoud
According to the labor force statistics for Berthoud, out of the total population over 16 years of age (8,783), 71.4% or 6,271 individuals are in the labor force, with 2.8% or 176 of them unemployed. The age group with the highest labor force participation rate is 45 to 54 years, with 92.3% or 1,406 individuals in the labor force. Within the labor force, the 16 to 19 years age range has the highest percentage of unemployed individuals, with 12.5% or 37 of them being unemployed.
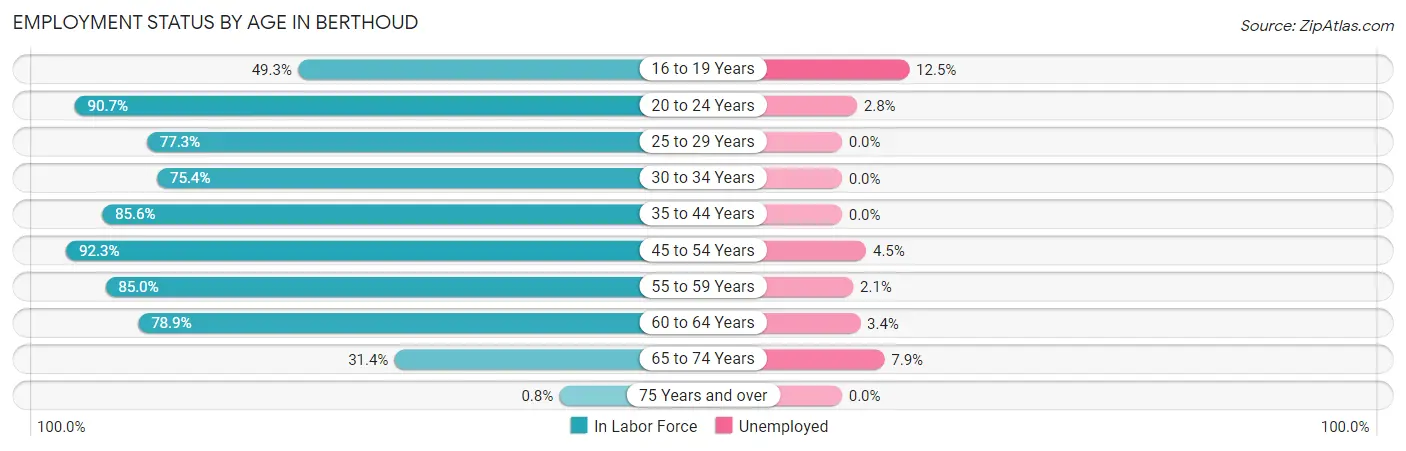
| Age Bracket | In Labor Force | Unemployed |
| 16 to 19 Years | 297 (49.3%) | 37 (12.5%) |
| 20 to 24 Years | 598 (90.7%) | 17 (2.8%) |
| 25 to 29 Years | 551 (77.3%) | 0 (0.0%) |
| 30 to 34 Years | 630 (75.4%) | 0 (0.0%) |
| 35 to 44 Years | 1,335 (85.6%) | 0 (0.0%) |
| 45 to 54 Years | 1,406 (92.3%) | 63 (4.5%) |
| 55 to 59 Years | 659 (85.0%) | 14 (2.1%) |
| 60 to 64 Years | 465 (78.9%) | 16 (3.4%) |
| 65 to 74 Years | 330 (31.4%) | 26 (7.9%) |
| 75 Years and over | 4 (0.8%) | 0 (0.0%) |
| Total | 6,271 (71.4%) | 176 (2.8%) |
Employment Status by Educational Attainment in Berthoud
According to labor force statistics for Berthoud, 84.2% of individuals (5,047) out of the total population between 25 and 64 years of age (5,994) are in the labor force, with 1.8% or 91 of them being unemployed. The group with the highest labor force participation rate are those with the educational attainment of bachelor's degree or higher, with 88.6% or 2,269 individuals in the labor force. Within the labor force, individuals with bachelor's degree or higher education have the highest percentage of unemployment, with 3.0% or 68 of them being unemployed.
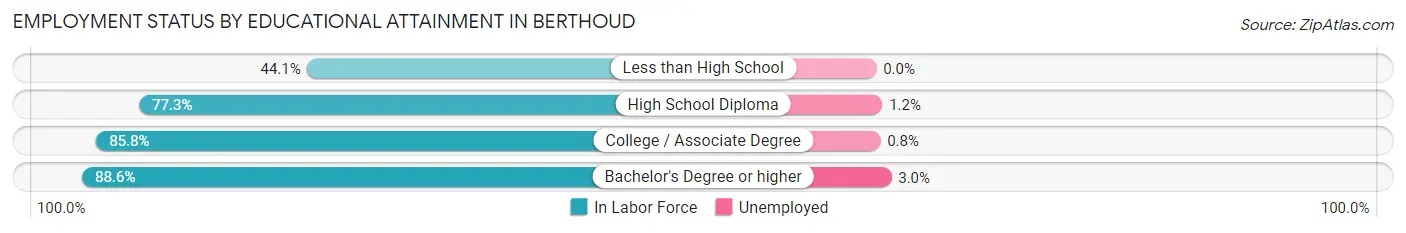
| Educational Attainment | In Labor Force | Unemployed |
| Less than High School | 90 (44.1%) | 0 (0.0%) |
| High School Diploma | 777 (77.3%) | 12 (1.2%) |
| College / Associate Degree | 1,908 (85.8%) | 18 (0.8%) |
| Bachelor's Degree or higher | 2,269 (88.6%) | 77 (3.0%) |
| Total | 5,047 (84.2%) | 108 (1.8%) |
Employment Occupations by Sex in Berthoud
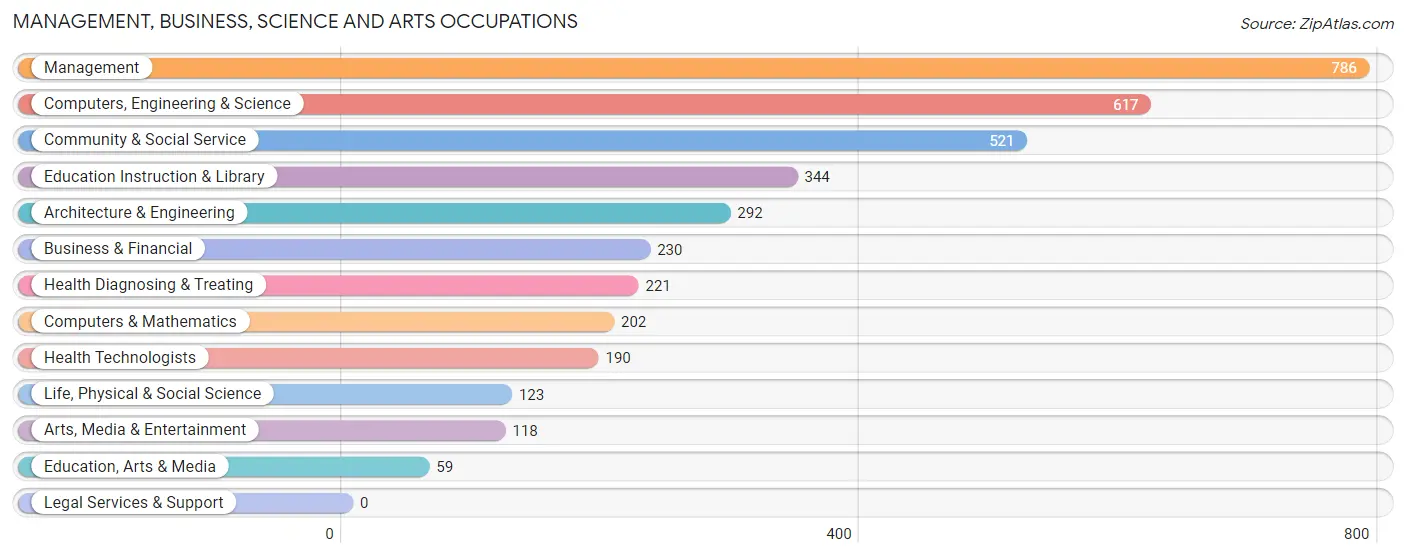
Management, Business, Science and Arts Occupations
The most common Management, Business, Science and Arts occupations in Berthoud are Management (786 | 12.9%), Computers, Engineering & Science (617 | 10.1%), Community & Social Service (521 | 8.5%), Education Instruction & Library (344 | 5.6%), and Architecture & Engineering (292 | 4.8%).
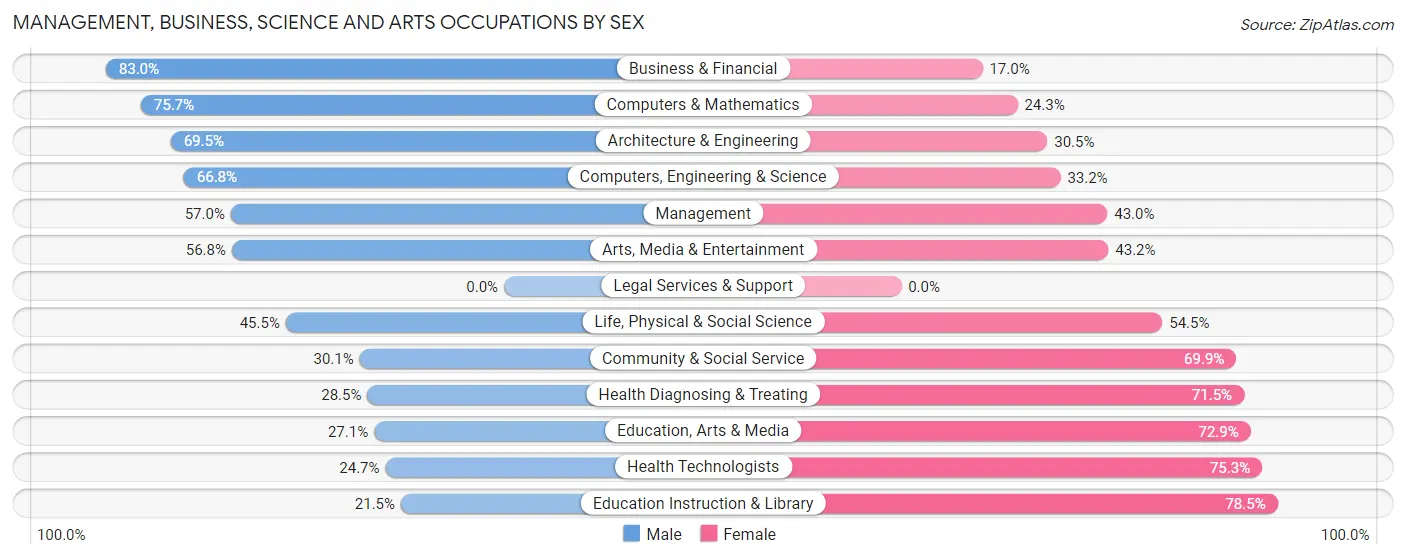
Management, Business, Science and Arts Occupations by Sex
Within the Management, Business, Science and Arts occupations in Berthoud, the most male-oriented occupations are Business & Financial (83.0%), Computers & Mathematics (75.7%), and Architecture & Engineering (69.5%), while the most female-oriented occupations are Education Instruction & Library (78.5%), Health Technologists (75.3%), and Education, Arts & Media (72.9%).
| Occupation | Male | Female |
| Management | 448 (57.0%) | 338 (43.0%) |
| Business & Financial | 191 (83.0%) | 39 (17.0%) |
| Computers, Engineering & Science | 412 (66.8%) | 205 (33.2%) |
| Computers & Mathematics | 153 (75.7%) | 49 (24.3%) |
| Architecture & Engineering | 203 (69.5%) | 89 (30.5%) |
| Life, Physical & Social Science | 56 (45.5%) | 67 (54.5%) |
| Community & Social Service | 157 (30.1%) | 364 (69.9%) |
| Education, Arts & Media | 16 (27.1%) | 43 (72.9%) |
| Legal Services & Support | 0 (0.0%) | 0 (0.0%) |
| Education Instruction & Library | 74 (21.5%) | 270 (78.5%) |
| Arts, Media & Entertainment | 67 (56.8%) | 51 (43.2%) |
| Health Diagnosing & Treating | 63 (28.5%) | 158 (71.5%) |
| Health Technologists | 47 (24.7%) | 143 (75.3%) |
| Total (Category) | 1,271 (53.5%) | 1,104 (46.5%) |
| Total (Overall) | 3,312 (54.3%) | 2,789 (45.7%) |
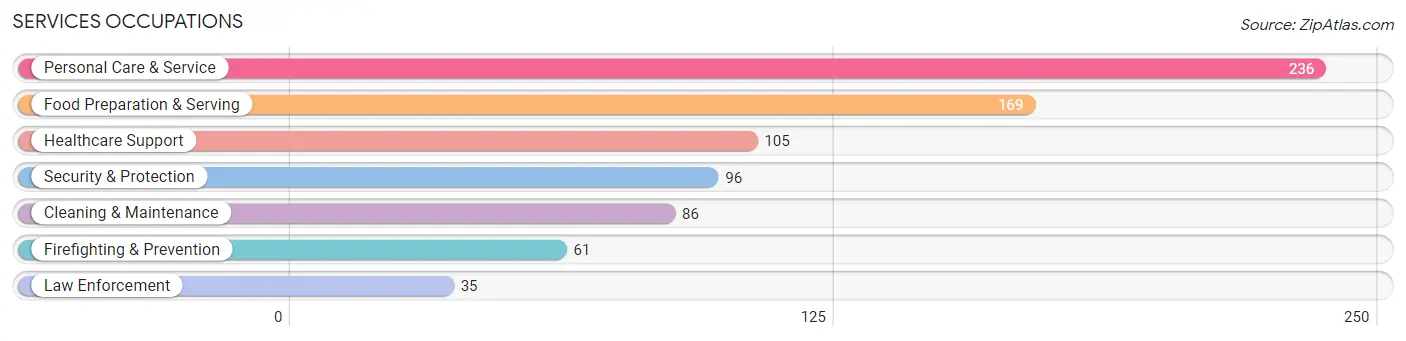
Services Occupations
The most common Services occupations in Berthoud are Personal Care & Service (236 | 3.9%), Food Preparation & Serving (169 | 2.8%), Healthcare Support (105 | 1.7%), Security & Protection (96 | 1.6%), and Cleaning & Maintenance (86 | 1.4%).
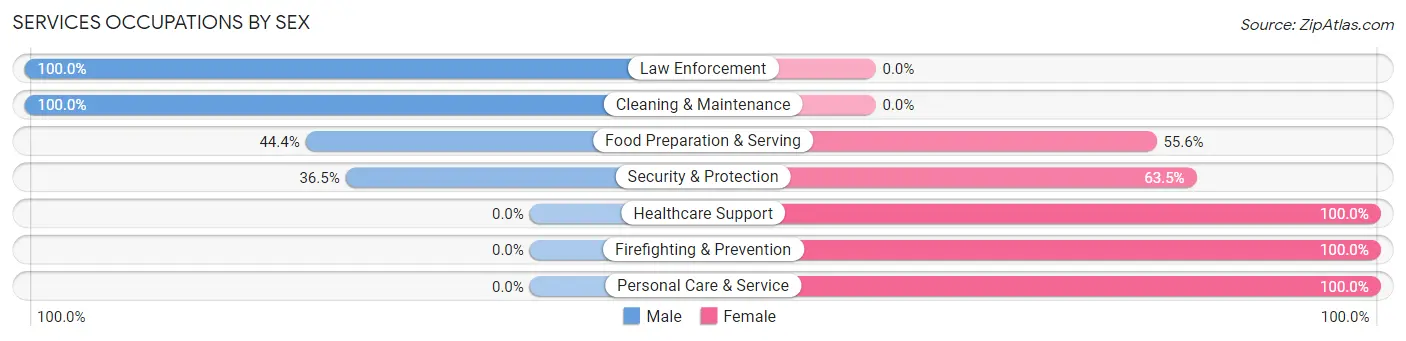
Services Occupations by Sex
Within the Services occupations in Berthoud, the most male-oriented occupations are Law Enforcement (100.0%), Cleaning & Maintenance (100.0%), and Food Preparation & Serving (44.4%), while the most female-oriented occupations are Healthcare Support (100.0%), Firefighting & Prevention (100.0%), and Personal Care & Service (100.0%).
| Occupation | Male | Female |
| Healthcare Support | 0 (0.0%) | 105 (100.0%) |
| Security & Protection | 35 (36.5%) | 61 (63.5%) |
| Firefighting & Prevention | 0 (0.0%) | 61 (100.0%) |
| Law Enforcement | 35 (100.0%) | 0 (0.0%) |
| Food Preparation & Serving | 75 (44.4%) | 94 (55.6%) |
| Cleaning & Maintenance | 86 (100.0%) | 0 (0.0%) |
| Personal Care & Service | 0 (0.0%) | 236 (100.0%) |
| Total (Category) | 196 (28.3%) | 496 (71.7%) |
| Total (Overall) | 3,312 (54.3%) | 2,789 (45.7%) |
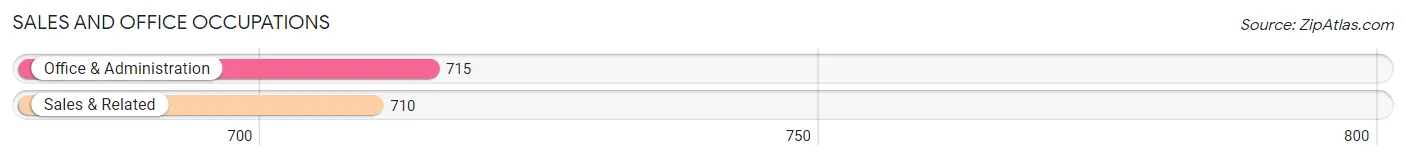
Sales and Office Occupations
The most common Sales and Office occupations in Berthoud are Office & Administration (715 | 11.7%), and Sales & Related (710 | 11.6%).
Sales and Office Occupations by Sex
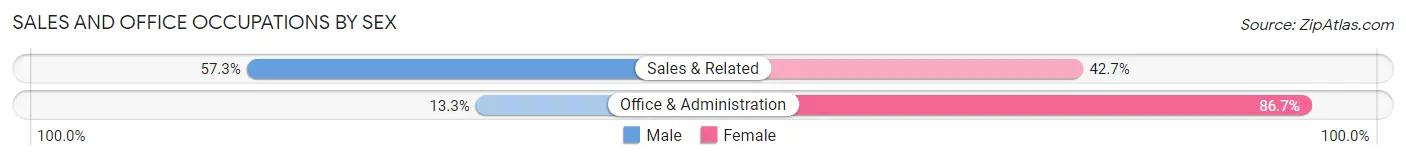
| Occupation | Male | Female |
| Sales & Related | 407 (57.3%) | 303 (42.7%) |
| Office & Administration | 95 (13.3%) | 620 (86.7%) |
| Total (Category) | 502 (35.2%) | 923 (64.8%) |
| Total (Overall) | 3,312 (54.3%) | 2,789 (45.7%) |
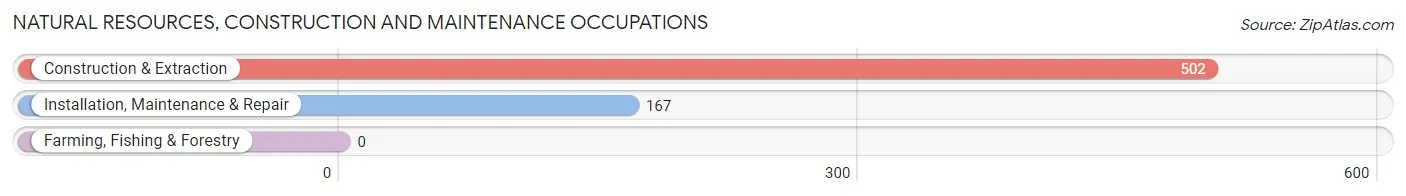
Natural Resources, Construction and Maintenance Occupations
The most common Natural Resources, Construction and Maintenance occupations in Berthoud are Construction & Extraction (502 | 8.2%), and Installation, Maintenance & Repair (167 | 2.7%).
Natural Resources, Construction and Maintenance Occupations by Sex
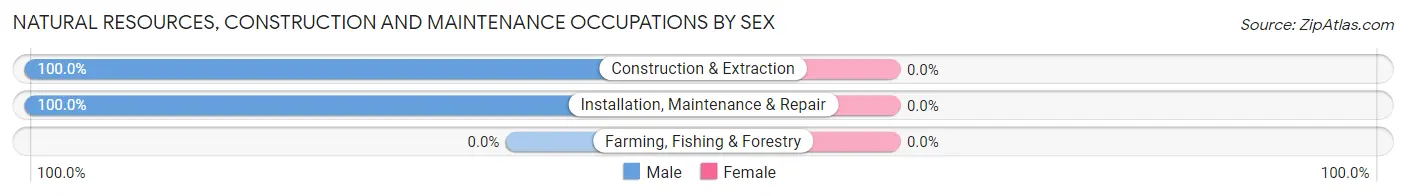
| Occupation | Male | Female |
| Farming, Fishing & Forestry | 0 (0.0%) | 0 (0.0%) |
| Construction & Extraction | 502 (100.0%) | 0 (0.0%) |
| Installation, Maintenance & Repair | 167 (100.0%) | 0 (0.0%) |
| Total (Category) | 669 (100.0%) | 0 (0.0%) |
| Total (Overall) | 3,312 (54.3%) | 2,789 (45.7%) |
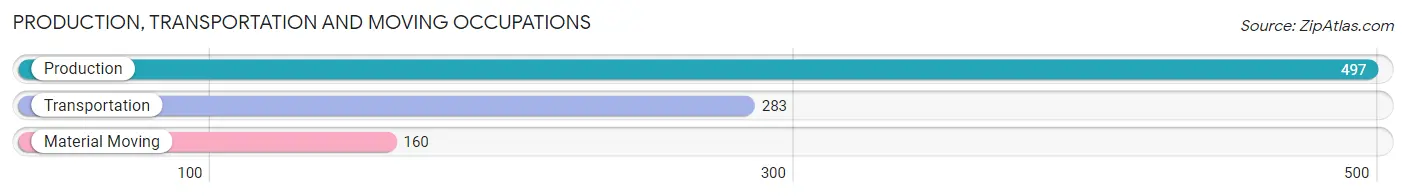
Production, Transportation and Moving Occupations
The most common Production, Transportation and Moving occupations in Berthoud are Production (497 | 8.2%), Transportation (283 | 4.6%), and Material Moving (160 | 2.6%).
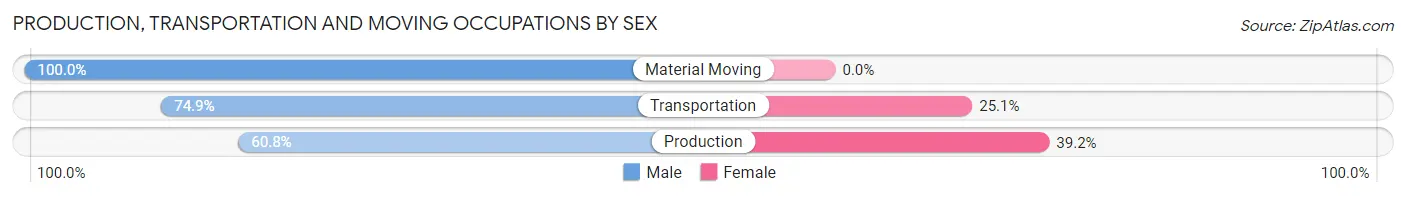
Production, Transportation and Moving Occupations by Sex
| Occupation | Male | Female |
| Production | 302 (60.8%) | 195 (39.2%) |
| Transportation | 212 (74.9%) | 71 (25.1%) |
| Material Moving | 160 (100.0%) | 0 (0.0%) |
| Total (Category) | 674 (71.7%) | 266 (28.3%) |
| Total (Overall) | 3,312 (54.3%) | 2,789 (45.7%) |
Employment Industries by Sex in Berthoud
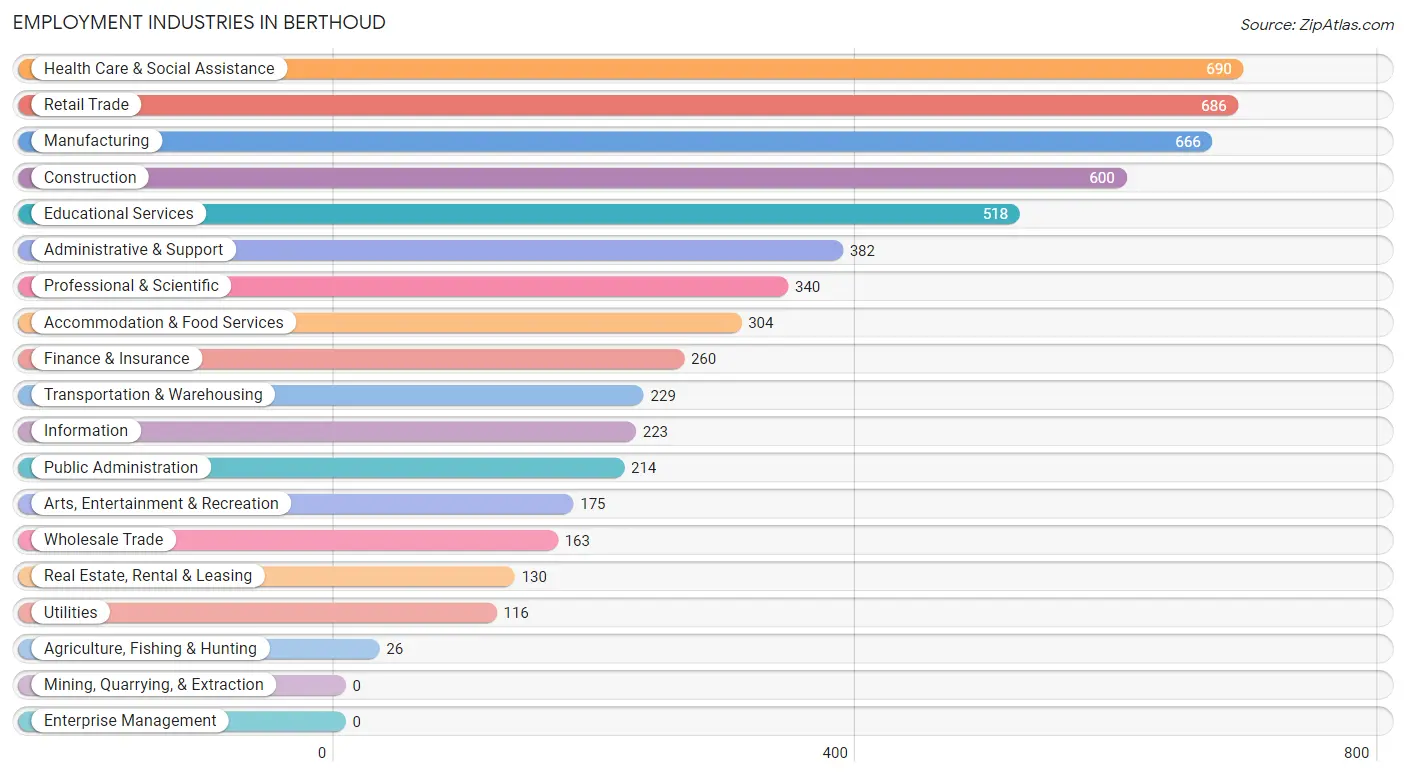
Employment Industries in Berthoud
The major employment industries in Berthoud include Health Care & Social Assistance (690 | 11.3%), Retail Trade (686 | 11.2%), Manufacturing (666 | 10.9%), Construction (600 | 9.8%), and Educational Services (518 | 8.5%).
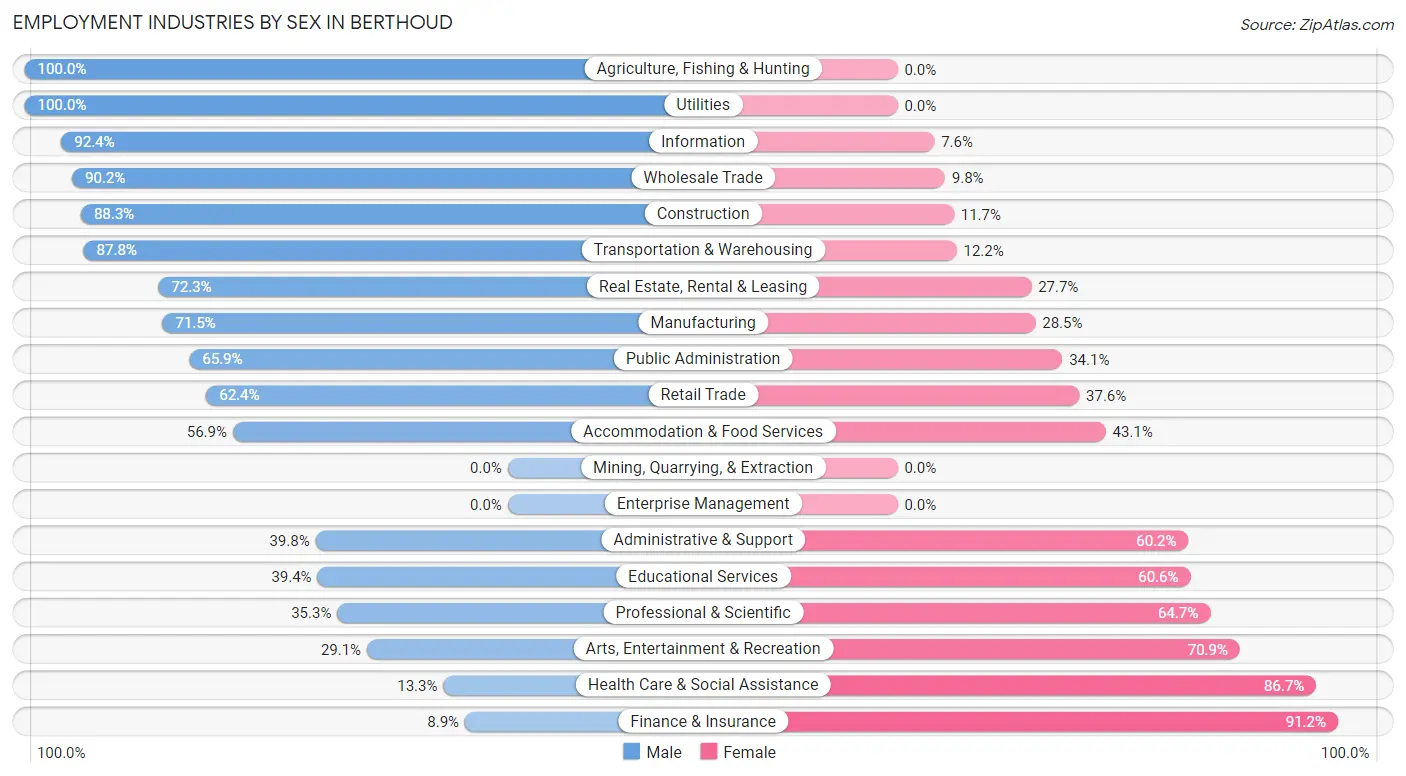
Employment Industries by Sex in Berthoud
The Berthoud industries that see more men than women are Agriculture, Fishing & Hunting (100.0%), Utilities (100.0%), and Information (92.4%), whereas the industries that tend to have a higher number of women are Finance & Insurance (91.1%), Health Care & Social Assistance (86.7%), and Arts, Entertainment & Recreation (70.9%).
| Industry | Male | Female |
| Agriculture, Fishing & Hunting | 26 (100.0%) | 0 (0.0%) |
| Mining, Quarrying, & Extraction | 0 (0.0%) | 0 (0.0%) |
| Construction | 530 (88.3%) | 70 (11.7%) |
| Manufacturing | 476 (71.5%) | 190 (28.5%) |
| Wholesale Trade | 147 (90.2%) | 16 (9.8%) |
| Retail Trade | 428 (62.4%) | 258 (37.6%) |
| Transportation & Warehousing | 201 (87.8%) | 28 (12.2%) |
| Utilities | 116 (100.0%) | 0 (0.0%) |
| Information | 206 (92.4%) | 17 (7.6%) |
| Finance & Insurance | 23 (8.8%) | 237 (91.1%) |
| Real Estate, Rental & Leasing | 94 (72.3%) | 36 (27.7%) |
| Professional & Scientific | 120 (35.3%) | 220 (64.7%) |
| Enterprise Management | 0 (0.0%) | 0 (0.0%) |
| Administrative & Support | 152 (39.8%) | 230 (60.2%) |
| Educational Services | 204 (39.4%) | 314 (60.6%) |
| Health Care & Social Assistance | 92 (13.3%) | 598 (86.7%) |
| Arts, Entertainment & Recreation | 51 (29.1%) | 124 (70.9%) |
| Accommodation & Food Services | 173 (56.9%) | 131 (43.1%) |
| Public Administration | 141 (65.9%) | 73 (34.1%) |
| Total | 3,312 (54.3%) | 2,789 (45.7%) |
Education in Berthoud
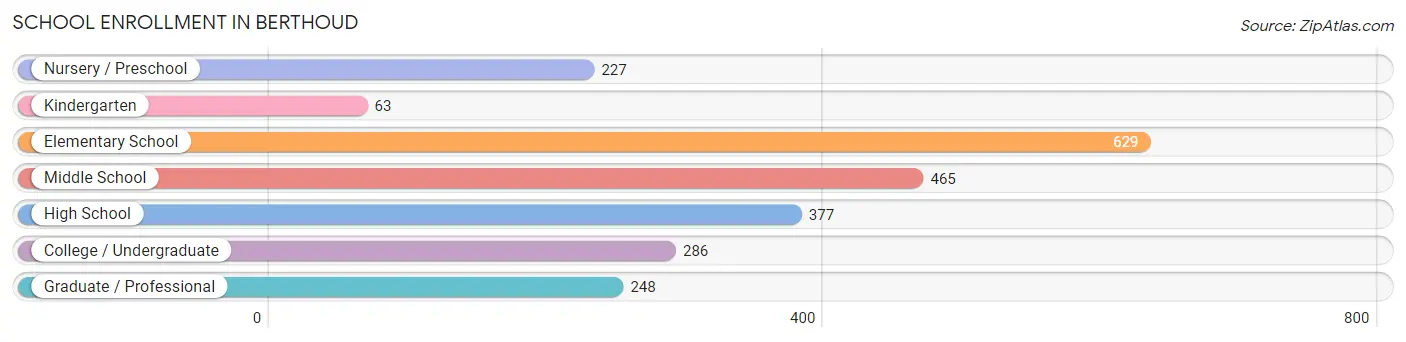
School Enrollment in Berthoud
The most common levels of schooling among the 2,295 students in Berthoud are elementary school (629 | 27.4%), middle school (465 | 20.3%), and high school (377 | 16.4%).
| School Level | # Students | % Students |
| Nursery / Preschool | 227 | 9.9% |
| Kindergarten | 63 | 2.8% |
| Elementary School | 629 | 27.4% |
| Middle School | 465 | 20.3% |
| High School | 377 | 16.4% |
| College / Undergraduate | 286 | 12.5% |
| Graduate / Professional | 248 | 10.8% |
| Total | 2,295 | 100.0% |
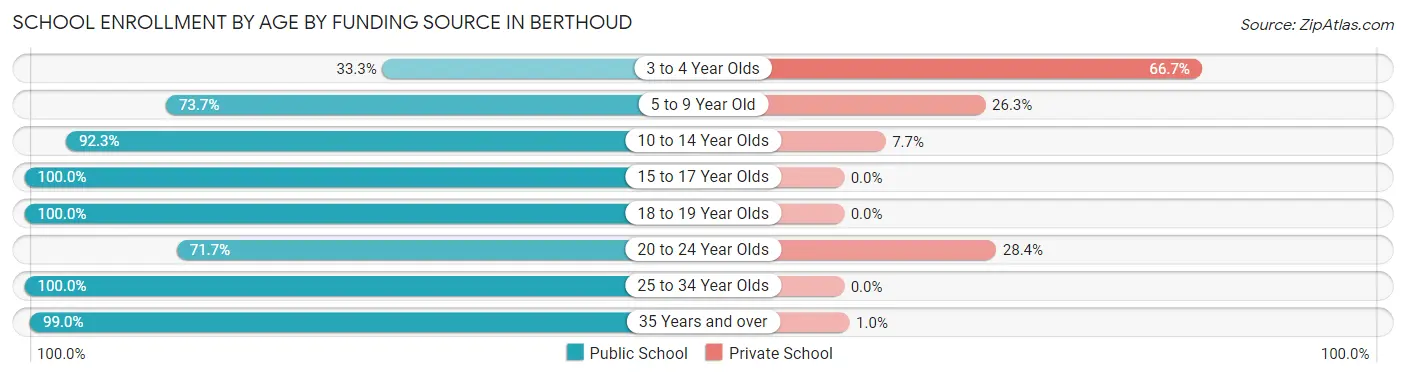
School Enrollment by Age by Funding Source in Berthoud
Out of a total of 2,295 students who are enrolled in schools in Berthoud, 347 (15.1%) attend a private institution, while the remaining 1,948 (84.9%) are enrolled in public schools. The age group of 3 to 4 year olds has the highest likelihood of being enrolled in private schools, with 92 (66.7% in the age bracket) enrolled. Conversely, the age group of 15 to 17 year olds has the lowest likelihood of being enrolled in a private school, with 323 (100.0% in the age bracket) attending a public institution.
| Age Bracket | Public School | Private School |
| 3 to 4 Year Olds | 46 (33.3%) | 92 (66.7%) |
| 5 to 9 Year Old | 467 (73.7%) | 167 (26.3%) |
| 10 to 14 Year Olds | 596 (92.3%) | 50 (7.7%) |
| 15 to 17 Year Olds | 323 (100.0%) | 0 (0.0%) |
| 18 to 19 Year Olds | 75 (100.0%) | 0 (0.0%) |
| 20 to 24 Year Olds | 91 (71.7%) | 36 (28.3%) |
| 25 to 34 Year Olds | 156 (100.0%) | 0 (0.0%) |
| 35 Years and over | 194 (99.0%) | 2 (1.0%) |
| Total | 1,948 (84.9%) | 347 (15.1%) |
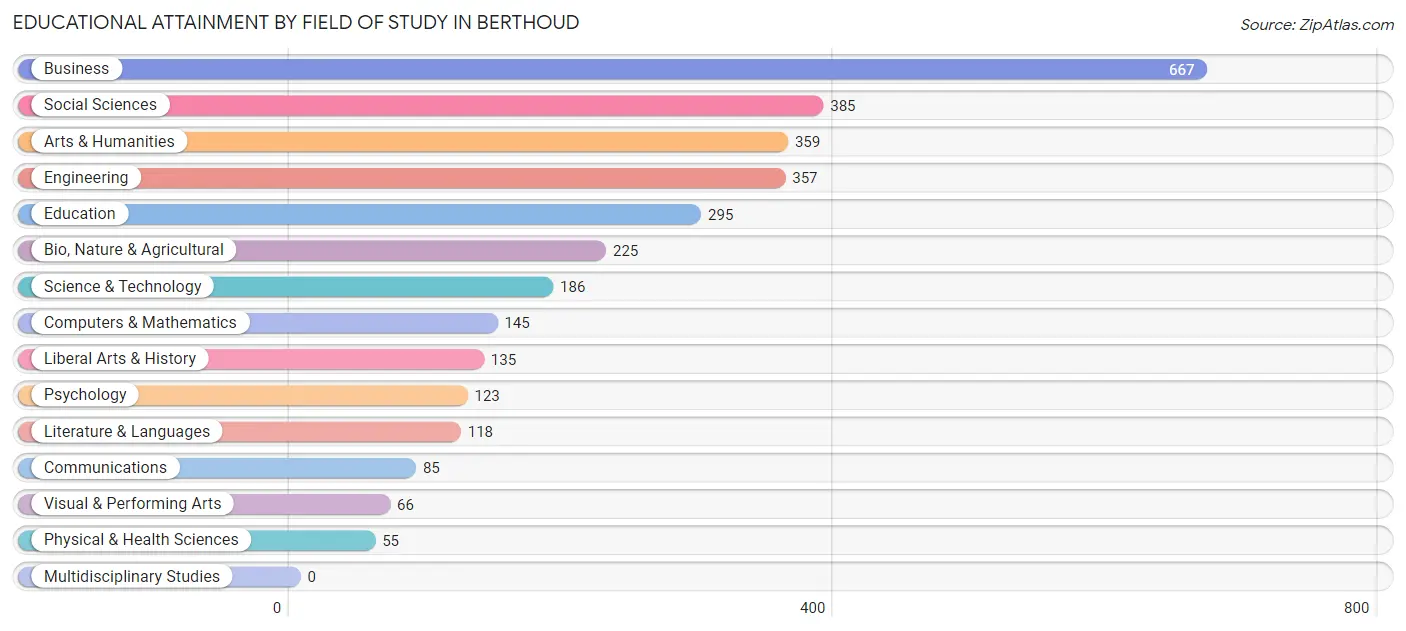
Educational Attainment by Field of Study in Berthoud
Business (667 | 20.8%), social sciences (385 | 12.0%), arts & humanities (359 | 11.2%), engineering (357 | 11.2%), and education (295 | 9.2%) are the most common fields of study among 3,201 individuals in Berthoud who have obtained a bachelor's degree or higher.
| Field of Study | # Graduates | % Graduates |
| Computers & Mathematics | 145 | 4.5% |
| Bio, Nature & Agricultural | 225 | 7.0% |
| Physical & Health Sciences | 55 | 1.7% |
| Psychology | 123 | 3.8% |
| Social Sciences | 385 | 12.0% |
| Engineering | 357 | 11.2% |
| Multidisciplinary Studies | 0 | 0.0% |
| Science & Technology | 186 | 5.8% |
| Business | 667 | 20.8% |
| Education | 295 | 9.2% |
| Literature & Languages | 118 | 3.7% |
| Liberal Arts & History | 135 | 4.2% |
| Visual & Performing Arts | 66 | 2.1% |
| Communications | 85 | 2.7% |
| Arts & Humanities | 359 | 11.2% |
| Total | 3,201 | 100.0% |
Transportation & Commute in Berthoud
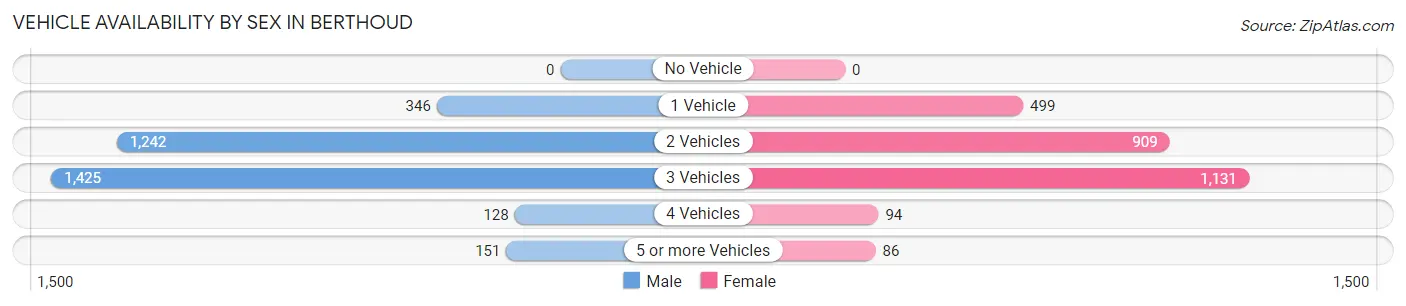
Vehicle Availability by Sex in Berthoud
The most prevalent vehicle ownership categories in Berthoud are males with 3 vehicles (1,425, accounting for 43.3%) and females with 3 vehicles (1,131, making up 52.4%).
| Vehicles Available | Male | Female |
| No Vehicle | 0 (0.0%) | 0 (0.0%) |
| 1 Vehicle | 346 (10.5%) | 499 (18.3%) |
| 2 Vehicles | 1,242 (37.7%) | 909 (33.4%) |
| 3 Vehicles | 1,425 (43.3%) | 1,131 (41.6%) |
| 4 Vehicles | 128 (3.9%) | 94 (3.5%) |
| 5 or more Vehicles | 151 (4.6%) | 86 (3.2%) |
| Total | 3,292 (100.0%) | 2,719 (100.0%) |
Commute Time in Berthoud
The most frequently occuring commute durations in Berthoud are 30 to 34 minutes (843 commuters, 16.1%), 20 to 24 minutes (810 commuters, 15.4%), and 60 to 89 minutes (655 commuters, 12.5%).
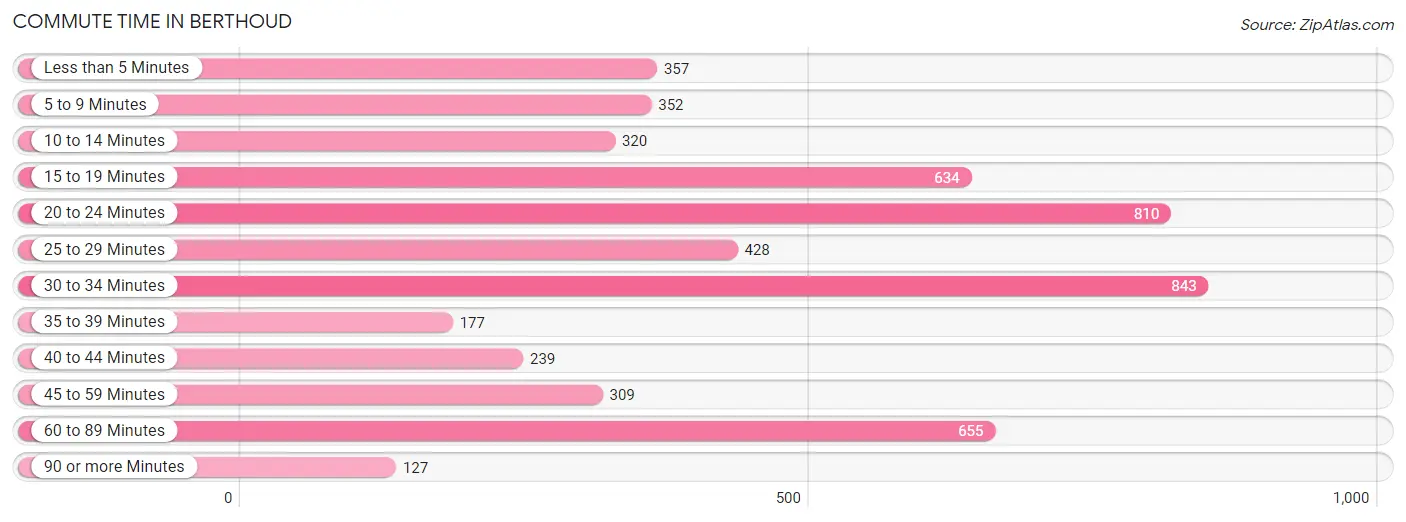
| Commute Time | # Commuters | % Commuters |
| Less than 5 Minutes | 357 | 6.8% |
| 5 to 9 Minutes | 352 | 6.7% |
| 10 to 14 Minutes | 320 | 6.1% |
| 15 to 19 Minutes | 634 | 12.1% |
| 20 to 24 Minutes | 810 | 15.4% |
| 25 to 29 Minutes | 428 | 8.2% |
| 30 to 34 Minutes | 843 | 16.1% |
| 35 to 39 Minutes | 177 | 3.4% |
| 40 to 44 Minutes | 239 | 4.5% |
| 45 to 59 Minutes | 309 | 5.9% |
| 60 to 89 Minutes | 655 | 12.5% |
| 90 or more Minutes | 127 | 2.4% |
Commute Time by Sex in Berthoud
The most common commute times in Berthoud are 20 to 24 minutes (573 commuters, 19.7%) for males and 15 to 19 minutes (437 commuters, 18.7%) for females.
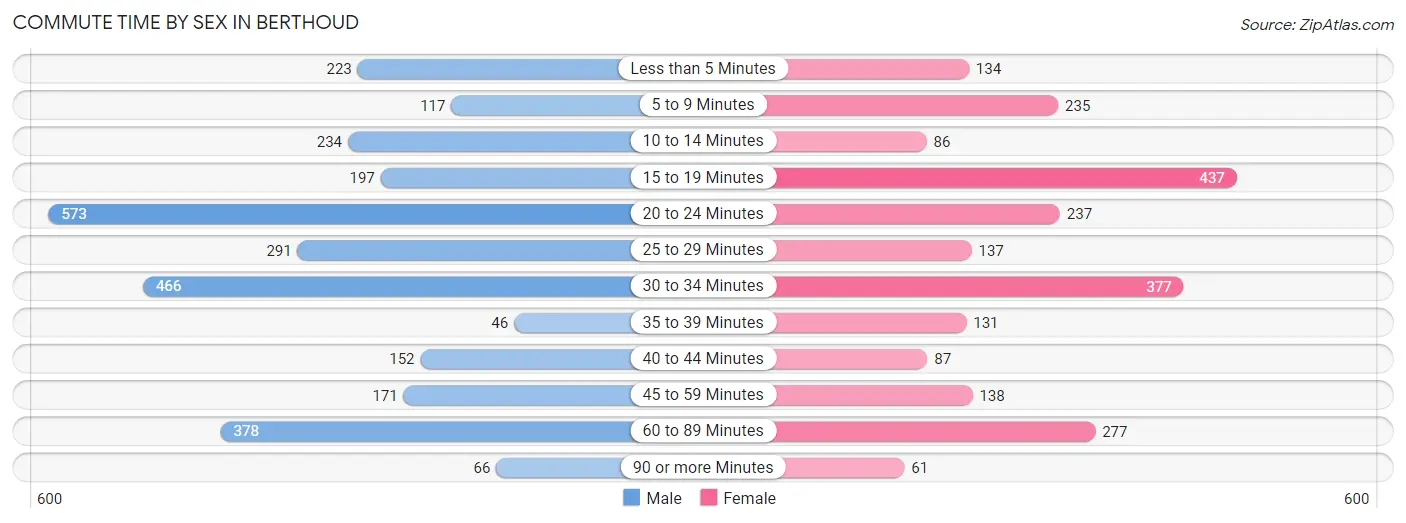
| Commute Time | Male | Female |
| Less than 5 Minutes | 223 (7.6%) | 134 (5.7%) |
| 5 to 9 Minutes | 117 (4.0%) | 235 (10.1%) |
| 10 to 14 Minutes | 234 (8.0%) | 86 (3.7%) |
| 15 to 19 Minutes | 197 (6.8%) | 437 (18.7%) |
| 20 to 24 Minutes | 573 (19.7%) | 237 (10.1%) |
| 25 to 29 Minutes | 291 (10.0%) | 137 (5.9%) |
| 30 to 34 Minutes | 466 (16.0%) | 377 (16.1%) |
| 35 to 39 Minutes | 46 (1.6%) | 131 (5.6%) |
| 40 to 44 Minutes | 152 (5.2%) | 87 (3.7%) |
| 45 to 59 Minutes | 171 (5.9%) | 138 (5.9%) |
| 60 to 89 Minutes | 378 (13.0%) | 277 (11.8%) |
| 90 or more Minutes | 66 (2.3%) | 61 (2.6%) |
Time of Departure to Work by Sex in Berthoud
The most frequent times of departure to work in Berthoud are 12:00 AM to 4:59 AM (407, 14.0%) for males and 7:00 AM to 7:29 AM (577, 24.7%) for females.
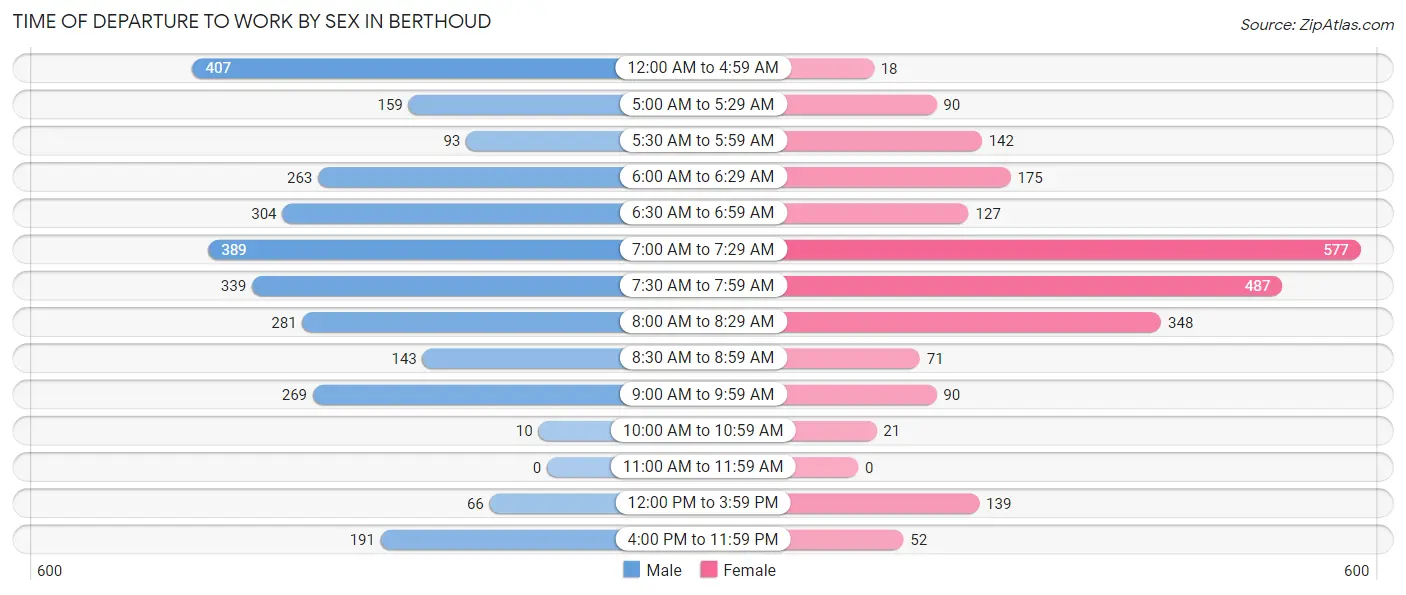
| Time of Departure | Male | Female |
| 12:00 AM to 4:59 AM | 407 (14.0%) | 18 (0.8%) |
| 5:00 AM to 5:29 AM | 159 (5.5%) | 90 (3.8%) |
| 5:30 AM to 5:59 AM | 93 (3.2%) | 142 (6.1%) |
| 6:00 AM to 6:29 AM | 263 (9.0%) | 175 (7.5%) |
| 6:30 AM to 6:59 AM | 304 (10.4%) | 127 (5.4%) |
| 7:00 AM to 7:29 AM | 389 (13.4%) | 577 (24.7%) |
| 7:30 AM to 7:59 AM | 339 (11.6%) | 487 (20.8%) |
| 8:00 AM to 8:29 AM | 281 (9.6%) | 348 (14.9%) |
| 8:30 AM to 8:59 AM | 143 (4.9%) | 71 (3.0%) |
| 9:00 AM to 9:59 AM | 269 (9.2%) | 90 (3.8%) |
| 10:00 AM to 10:59 AM | 10 (0.3%) | 21 (0.9%) |
| 11:00 AM to 11:59 AM | 0 (0.0%) | 0 (0.0%) |
| 12:00 PM to 3:59 PM | 66 (2.3%) | 139 (5.9%) |
| 4:00 PM to 11:59 PM | 191 (6.6%) | 52 (2.2%) |
| Total | 2,914 (100.0%) | 2,337 (100.0%) |
Housing Occupancy in Berthoud
Occupancy by Ownership in Berthoud
Of the total 4,143 dwellings in Berthoud, owner-occupied units account for 3,642 (87.9%), while renter-occupied units make up 501 (12.1%).
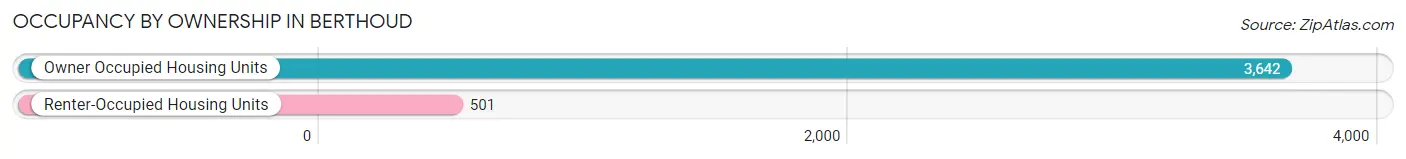
| Occupancy | # Housing Units | % Housing Units |
| Owner Occupied Housing Units | 3,642 | 87.9% |
| Renter-Occupied Housing Units | 501 | 12.1% |
| Total Occupied Housing Units | 4,143 | 100.0% |
Occupancy by Household Size in Berthoud
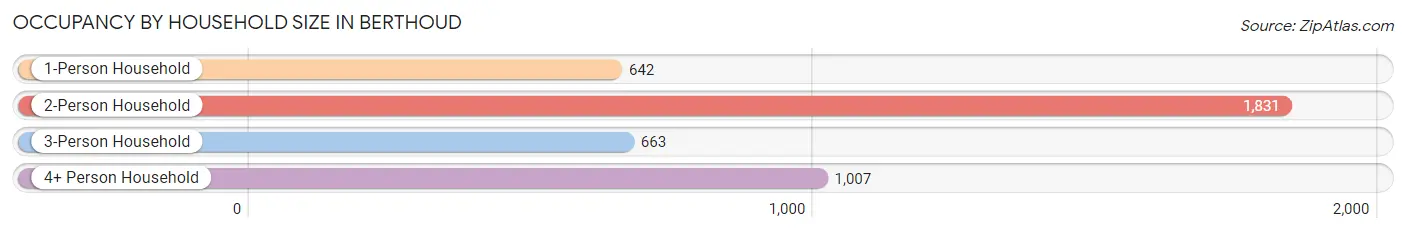
| Household Size | # Housing Units | % Housing Units |
| 1-Person Household | 642 | 15.5% |
| 2-Person Household | 1,831 | 44.2% |
| 3-Person Household | 663 | 16.0% |
| 4+ Person Household | 1,007 | 24.3% |
| Total Housing Units | 4,143 | 100.0% |
Occupancy by Ownership by Household Size in Berthoud
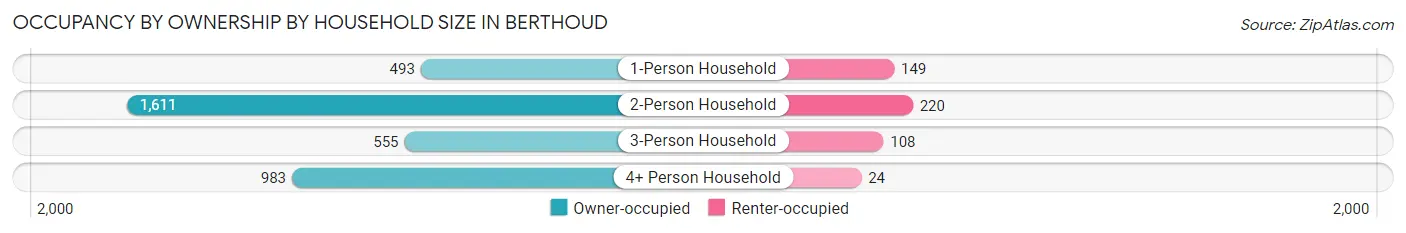
| Household Size | Owner-occupied | Renter-occupied |
| 1-Person Household | 493 (76.8%) | 149 (23.2%) |
| 2-Person Household | 1,611 (88.0%) | 220 (12.0%) |
| 3-Person Household | 555 (83.7%) | 108 (16.3%) |
| 4+ Person Household | 983 (97.6%) | 24 (2.4%) |
| Total Housing Units | 3,642 (87.9%) | 501 (12.1%) |
Occupancy by Educational Attainment in Berthoud
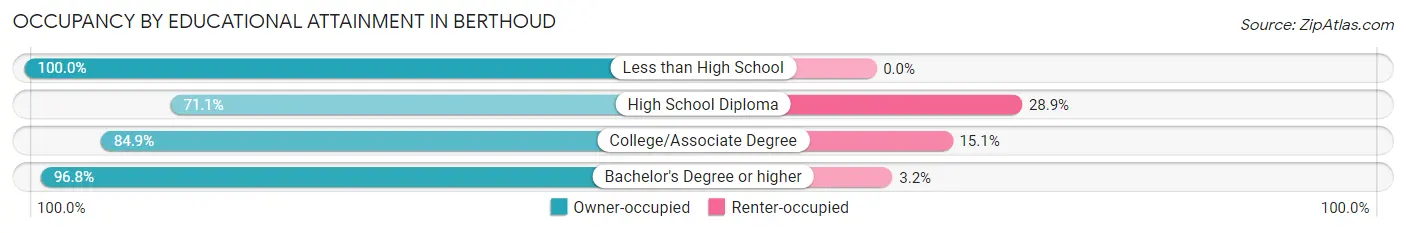
| Household Size | Owner-occupied | Renter-occupied |
| Less than High School | 32 (100.0%) | 0 (0.0%) |
| High School Diploma | 470 (71.1%) | 191 (28.9%) |
| College/Associate Degree | 1,419 (84.9%) | 253 (15.1%) |
| Bachelor's Degree or higher | 1,721 (96.8%) | 57 (3.2%) |
Occupancy by Age of Householder in Berthoud
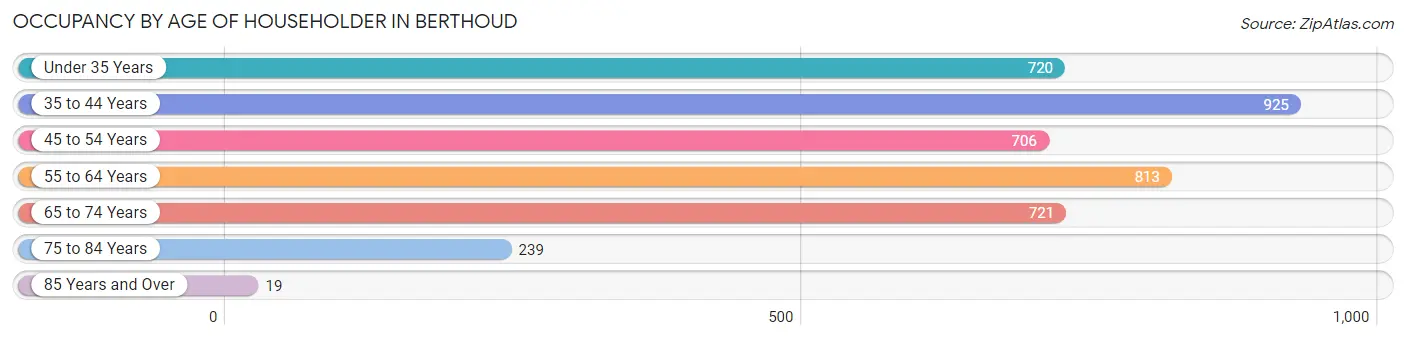
| Age Bracket | # Households | % Households |
| Under 35 Years | 720 | 17.4% |
| 35 to 44 Years | 925 | 22.3% |
| 45 to 54 Years | 706 | 17.0% |
| 55 to 64 Years | 813 | 19.6% |
| 65 to 74 Years | 721 | 17.4% |
| 75 to 84 Years | 239 | 5.8% |
| 85 Years and Over | 19 | 0.5% |
| Total | 4,143 | 100.0% |
Housing Finances in Berthoud
Median Income by Occupancy in Berthoud
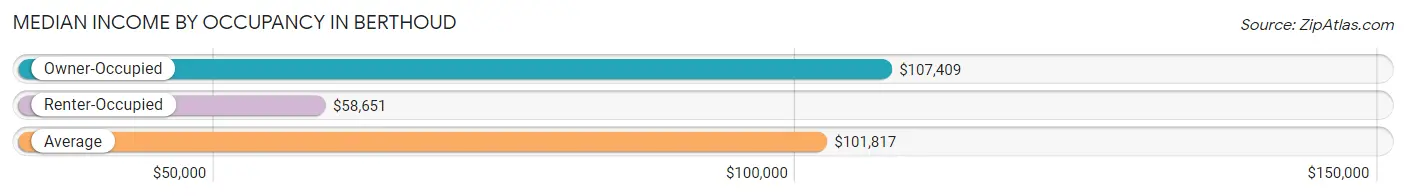
| Occupancy Type | # Households | Median Income |
| Owner-Occupied | 3,642 (87.9%) | $107,409 |
| Renter-Occupied | 501 (12.1%) | $58,651 |
| Average | 4,143 (100.0%) | $101,817 |
Occupancy by Householder Income Bracket in Berthoud
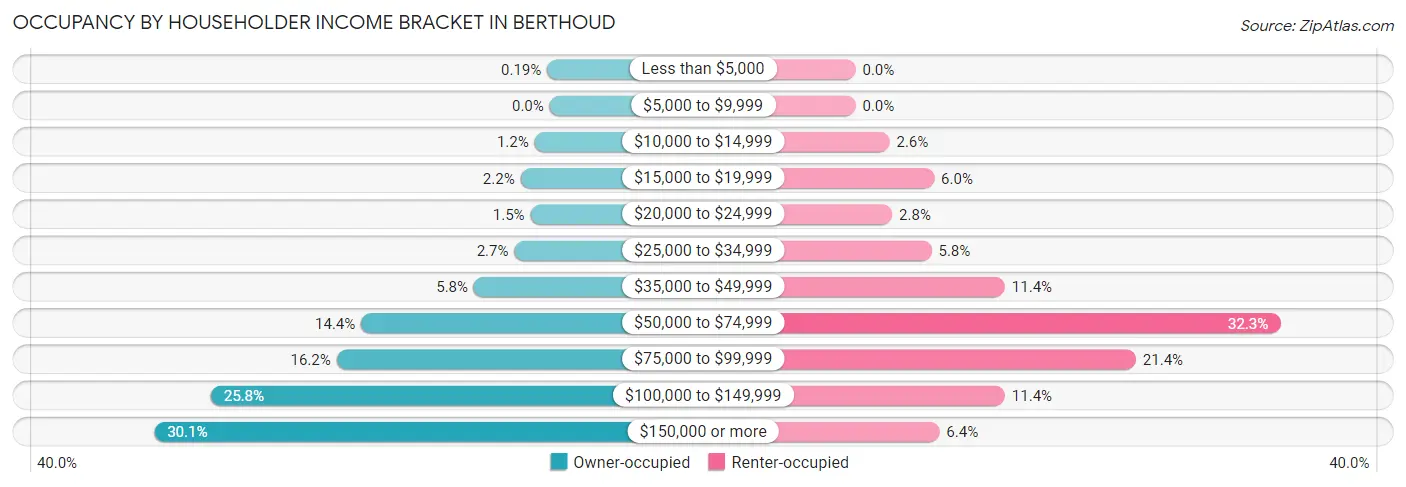
| Income Bracket | Owner-occupied | Renter-occupied |
| Less than $5,000 | 7 (0.2%) | 0 (0.0%) |
| $5,000 to $9,999 | 0 (0.0%) | 0 (0.0%) |
| $10,000 to $14,999 | 42 (1.1%) | 13 (2.6%) |
| $15,000 to $19,999 | 81 (2.2%) | 30 (6.0%) |
| $20,000 to $24,999 | 53 (1.5%) | 14 (2.8%) |
| $25,000 to $34,999 | 98 (2.7%) | 29 (5.8%) |
| $35,000 to $49,999 | 210 (5.8%) | 57 (11.4%) |
| $50,000 to $74,999 | 523 (14.4%) | 162 (32.3%) |
| $75,000 to $99,999 | 591 (16.2%) | 107 (21.4%) |
| $100,000 to $149,999 | 940 (25.8%) | 57 (11.4%) |
| $150,000 or more | 1,097 (30.1%) | 32 (6.4%) |
| Total | 3,642 (100.0%) | 501 (100.0%) |
Monthly Housing Cost Tiers in Berthoud
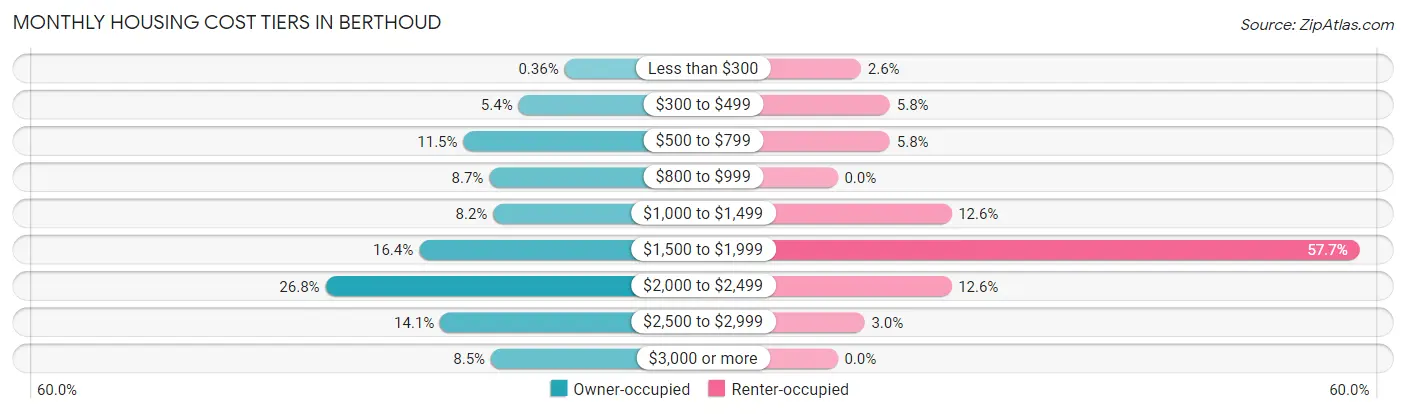
| Monthly Cost | Owner-occupied | Renter-occupied |
| Less than $300 | 13 (0.4%) | 13 (2.6%) |
| $300 to $499 | 198 (5.4%) | 29 (5.8%) |
| $500 to $799 | 420 (11.5%) | 29 (5.8%) |
| $800 to $999 | 316 (8.7%) | 0 (0.0%) |
| $1,000 to $1,499 | 300 (8.2%) | 63 (12.6%) |
| $1,500 to $1,999 | 598 (16.4%) | 289 (57.7%) |
| $2,000 to $2,499 | 975 (26.8%) | 63 (12.6%) |
| $2,500 to $2,999 | 513 (14.1%) | 15 (3.0%) |
| $3,000 or more | 309 (8.5%) | 0 (0.0%) |
| Total | 3,642 (100.0%) | 501 (100.0%) |
Physical Housing Characteristics in Berthoud
Housing Structures in Berthoud
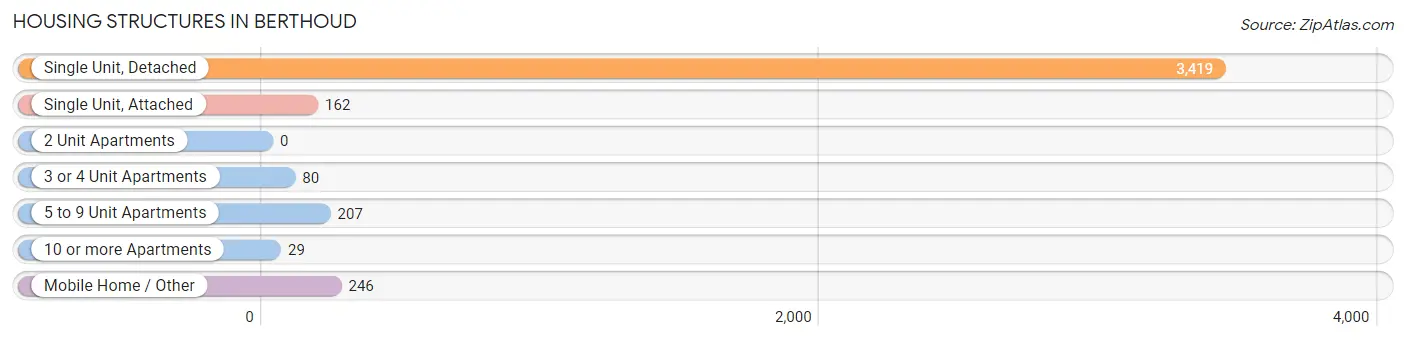
| Structure Type | # Housing Units | % Housing Units |
| Single Unit, Detached | 3,419 | 82.5% |
| Single Unit, Attached | 162 | 3.9% |
| 2 Unit Apartments | 0 | 0.0% |
| 3 or 4 Unit Apartments | 80 | 1.9% |
| 5 to 9 Unit Apartments | 207 | 5.0% |
| 10 or more Apartments | 29 | 0.7% |
| Mobile Home / Other | 246 | 5.9% |
| Total | 4,143 | 100.0% |
Housing Structures by Occupancy in Berthoud
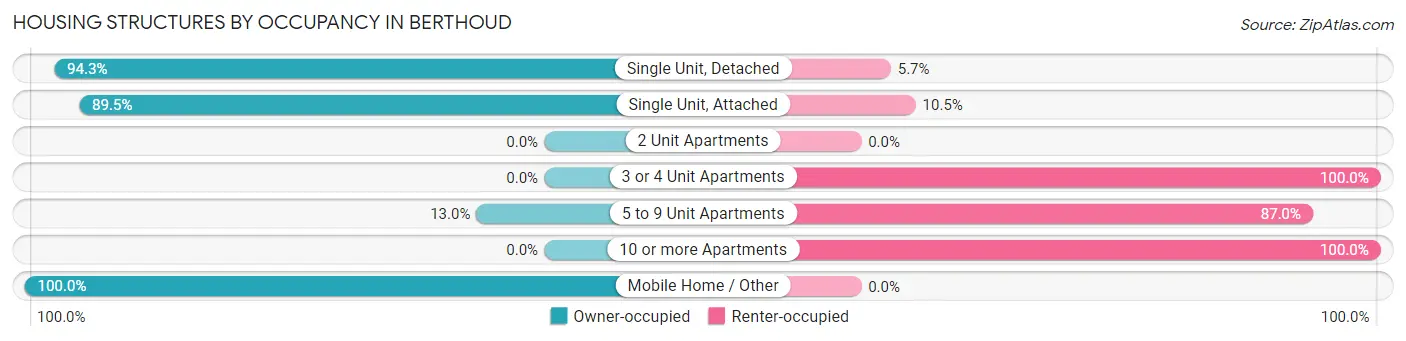
| Structure Type | Owner-occupied | Renter-occupied |
| Single Unit, Detached | 3,224 (94.3%) | 195 (5.7%) |
| Single Unit, Attached | 145 (89.5%) | 17 (10.5%) |
| 2 Unit Apartments | 0 (0.0%) | 0 (0.0%) |
| 3 or 4 Unit Apartments | 0 (0.0%) | 80 (100.0%) |
| 5 to 9 Unit Apartments | 27 (13.0%) | 180 (87.0%) |
| 10 or more Apartments | 0 (0.0%) | 29 (100.0%) |
| Mobile Home / Other | 246 (100.0%) | 0 (0.0%) |
| Total | 3,642 (87.9%) | 501 (12.1%) |
Housing Structures by Number of Rooms in Berthoud
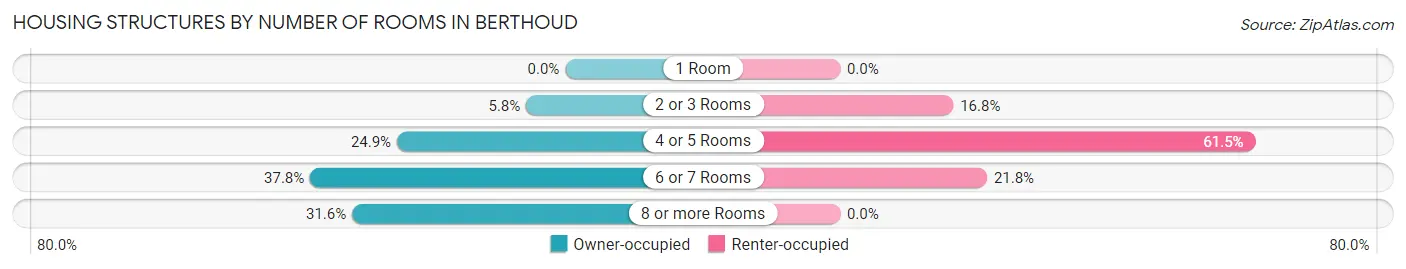
| Number of Rooms | Owner-occupied | Renter-occupied |
| 1 Room | 0 (0.0%) | 0 (0.0%) |
| 2 or 3 Rooms | 211 (5.8%) | 84 (16.8%) |
| 4 or 5 Rooms | 907 (24.9%) | 308 (61.5%) |
| 6 or 7 Rooms | 1,375 (37.8%) | 109 (21.8%) |
| 8 or more Rooms | 1,149 (31.6%) | 0 (0.0%) |
| Total | 3,642 (100.0%) | 501 (100.0%) |
Housing Structure by Heating Type in Berthoud
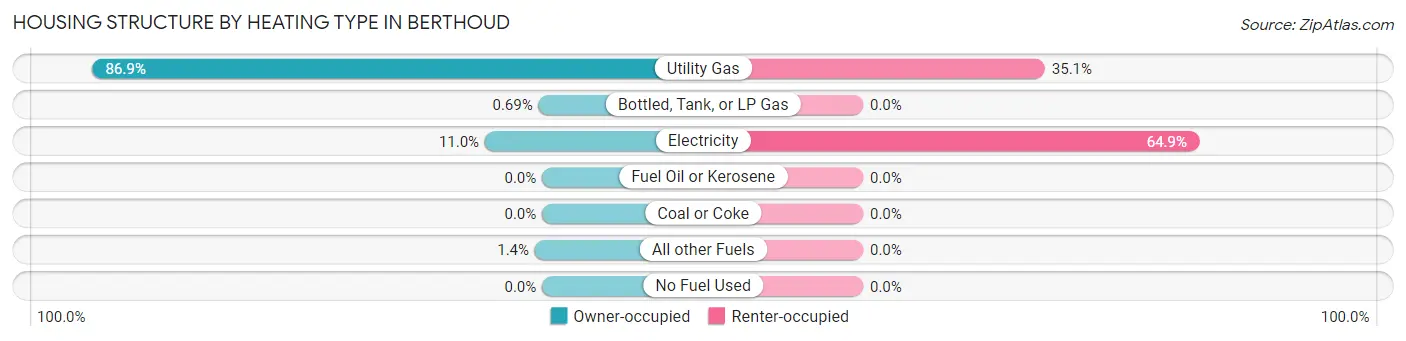
| Heating Type | Owner-occupied | Renter-occupied |
| Utility Gas | 3,164 (86.9%) | 176 (35.1%) |
| Bottled, Tank, or LP Gas | 25 (0.7%) | 0 (0.0%) |
| Electricity | 402 (11.0%) | 325 (64.9%) |
| Fuel Oil or Kerosene | 0 (0.0%) | 0 (0.0%) |
| Coal or Coke | 0 (0.0%) | 0 (0.0%) |
| All other Fuels | 51 (1.4%) | 0 (0.0%) |
| No Fuel Used | 0 (0.0%) | 0 (0.0%) |
| Total | 3,642 (100.0%) | 501 (100.0%) |
Household Vehicle Usage in Berthoud
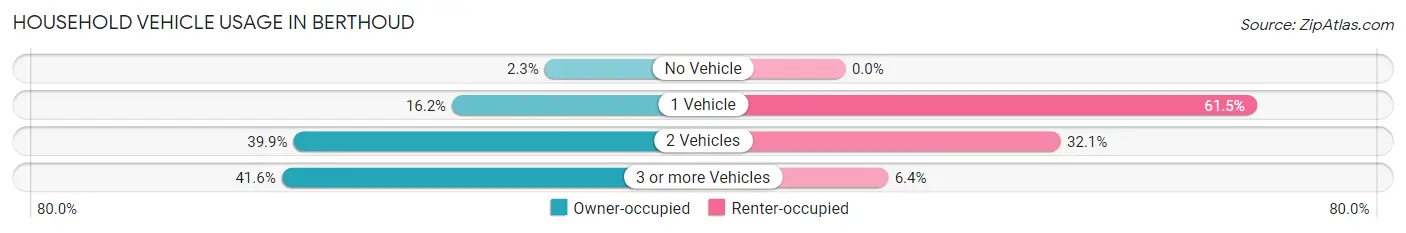
| Vehicles per Household | Owner-occupied | Renter-occupied |
| No Vehicle | 85 (2.3%) | 0 (0.0%) |
| 1 Vehicle | 589 (16.2%) | 308 (61.5%) |
| 2 Vehicles | 1,452 (39.9%) | 161 (32.1%) |
| 3 or more Vehicles | 1,516 (41.6%) | 32 (6.4%) |
| Total | 3,642 (100.0%) | 501 (100.0%) |
Real Estate & Mortgages in Berthoud
Real Estate and Mortgage Overview in Berthoud
| Characteristic | Without Mortgage | With Mortgage |
| Housing Units | 802 | 2,840 |
| Median Property Value | $401,700 | $466,500 |
| Median Household Income | $81,929 | $920 |
| Monthly Housing Costs | $636 | $309 |
| Real Estate Taxes | $1,706 | $45 |
Property Value by Mortgage Status in Berthoud
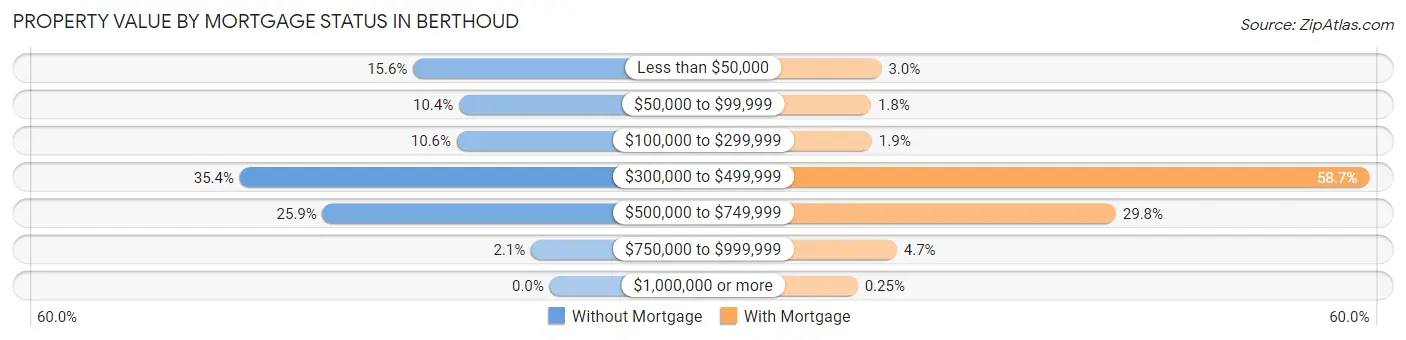
| Property Value | Without Mortgage | With Mortgage |
| Less than $50,000 | 125 (15.6%) | 84 (3.0%) |
| $50,000 to $99,999 | 83 (10.3%) | 50 (1.8%) |
| $100,000 to $299,999 | 85 (10.6%) | 53 (1.9%) |
| $300,000 to $499,999 | 284 (35.4%) | 1,667 (58.7%) |
| $500,000 to $749,999 | 208 (25.9%) | 845 (29.7%) |
| $750,000 to $999,999 | 17 (2.1%) | 134 (4.7%) |
| $1,000,000 or more | 0 (0.0%) | 7 (0.3%) |
| Total | 802 (100.0%) | 2,840 (100.0%) |
Household Income by Mortgage Status in Berthoud
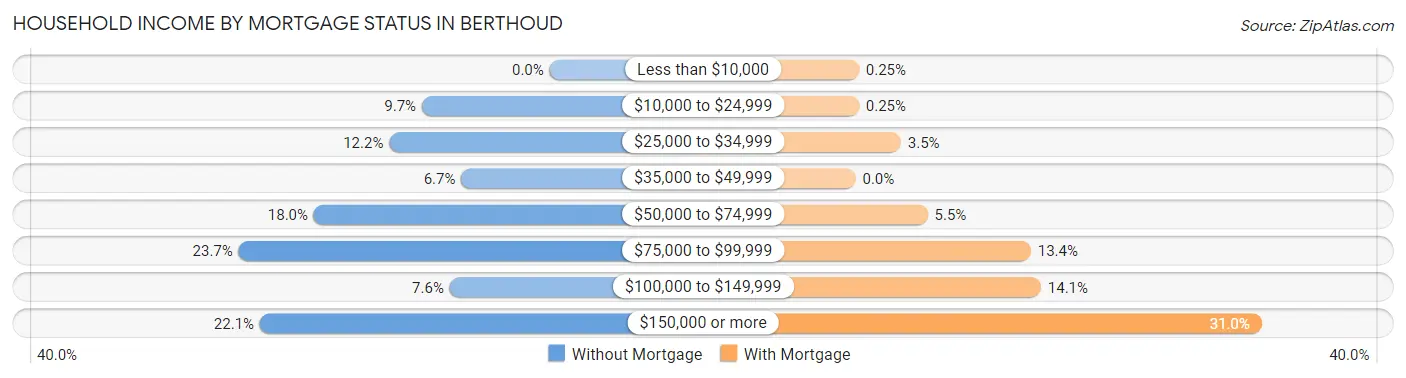
| Household Income | Without Mortgage | With Mortgage |
| Less than $10,000 | 0 (0.0%) | 7 (0.3%) |
| $10,000 to $24,999 | 78 (9.7%) | 7 (0.3%) |
| $25,000 to $34,999 | 98 (12.2%) | 98 (3.5%) |
| $35,000 to $49,999 | 54 (6.7%) | 0 (0.0%) |
| $50,000 to $74,999 | 144 (18.0%) | 156 (5.5%) |
| $75,000 to $99,999 | 190 (23.7%) | 379 (13.4%) |
| $100,000 to $149,999 | 61 (7.6%) | 401 (14.1%) |
| $150,000 or more | 177 (22.1%) | 879 (30.9%) |
| Total | 802 (100.0%) | 2,840 (100.0%) |
Property Value to Household Income Ratio in Berthoud
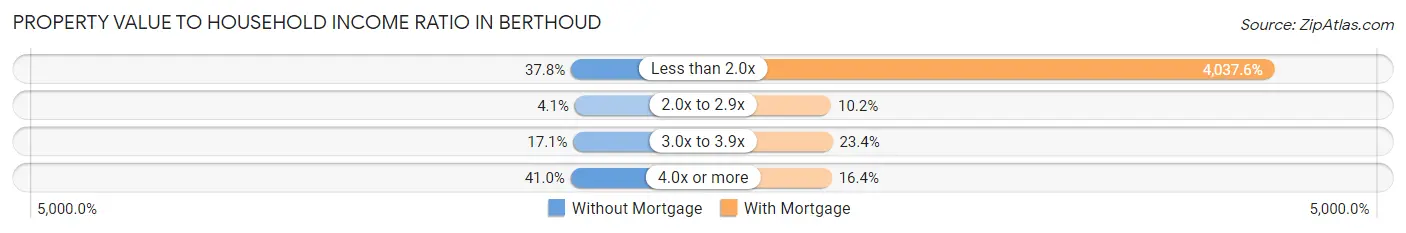
| Value-to-Income Ratio | Without Mortgage | With Mortgage |
| Less than 2.0x | 303 (37.8%) | 114,667 (4,037.6%) |
| 2.0x to 2.9x | 33 (4.1%) | 289 (10.2%) |
| 3.0x to 3.9x | 137 (17.1%) | 664 (23.4%) |
| 4.0x or more | 329 (41.0%) | 465 (16.4%) |
| Total | 802 (100.0%) | 2,840 (100.0%) |
Real Estate Taxes by Mortgage Status in Berthoud
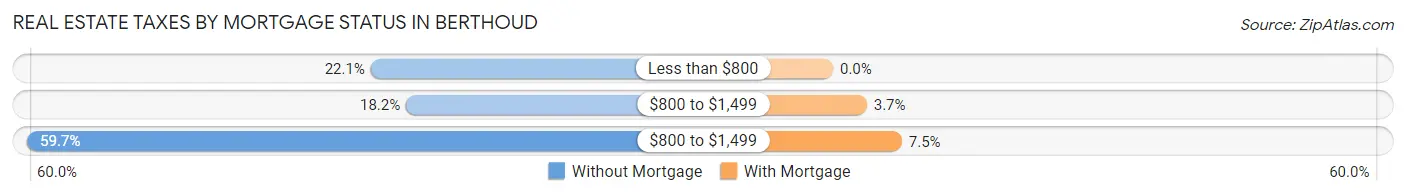
| Property Taxes | Without Mortgage | With Mortgage |
| Less than $800 | 177 (22.1%) | 0 (0.0%) |
| $800 to $1,499 | 146 (18.2%) | 105 (3.7%) |
| $800 to $1,499 | 479 (59.7%) | 214 (7.5%) |
| Total | 802 (100.0%) | 2,840 (100.0%) |
Health & Disability in Berthoud
Health Insurance Coverage by Age in Berthoud
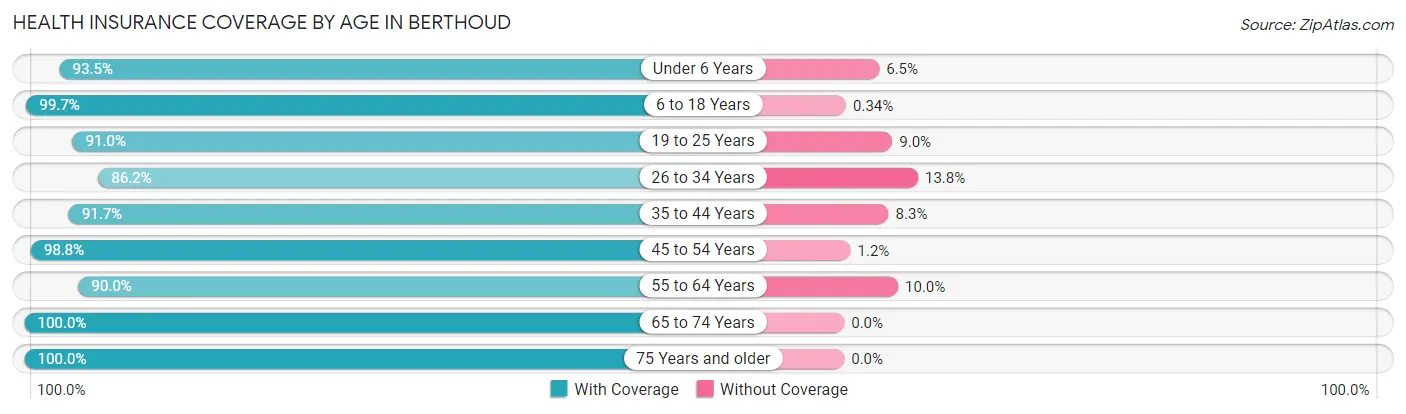
| Age Bracket | With Coverage | Without Coverage |
| Under 6 Years | 846 (93.5%) | 59 (6.5%) |
| 6 to 18 Years | 1,743 (99.7%) | 6 (0.3%) |
| 19 to 25 Years | 732 (91.0%) | 72 (9.0%) |
| 26 to 34 Years | 1,260 (86.2%) | 201 (13.8%) |
| 35 to 44 Years | 1,430 (91.7%) | 129 (8.3%) |
| 45 to 54 Years | 1,505 (98.8%) | 18 (1.2%) |
| 55 to 64 Years | 1,227 (90.0%) | 137 (10.0%) |
| 65 to 74 Years | 1,020 (100.0%) | 0 (0.0%) |
| 75 Years and older | 430 (100.0%) | 0 (0.0%) |
| Total | 10,193 (94.3%) | 622 (5.8%) |
Health Insurance Coverage by Citizenship Status in Berthoud
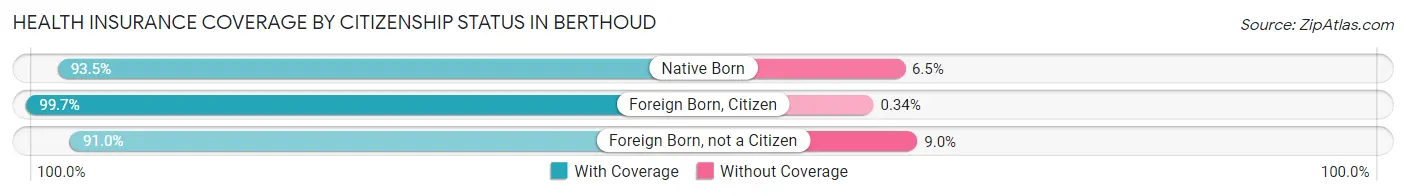
| Citizenship Status | With Coverage | Without Coverage |
| Native Born | 846 (93.5%) | 59 (6.5%) |
| Foreign Born, Citizen | 1,743 (99.7%) | 6 (0.3%) |
| Foreign Born, not a Citizen | 732 (91.0%) | 72 (9.0%) |
Health Insurance Coverage by Household Income in Berthoud
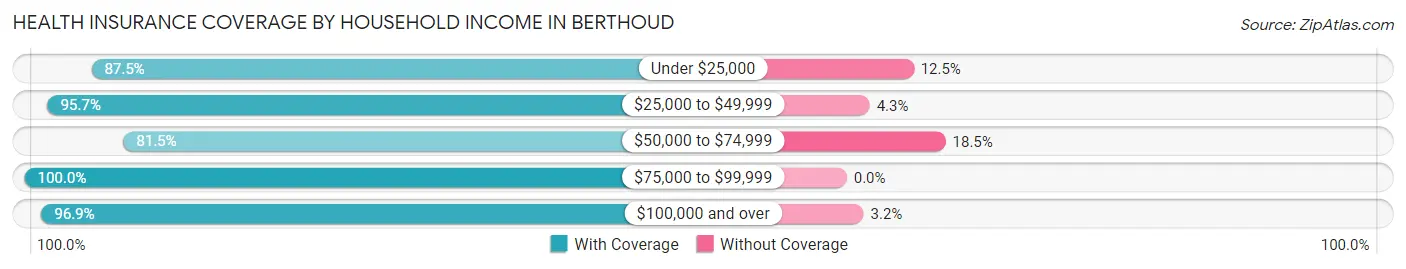
| Household Income | With Coverage | Without Coverage |
| Under $25,000 | 363 (87.5%) | 52 (12.5%) |
| $25,000 to $49,999 | 737 (95.7%) | 33 (4.3%) |
| $50,000 to $74,999 | 1,448 (81.5%) | 329 (18.5%) |
| $75,000 to $99,999 | 1,248 (100.0%) | 0 (0.0%) |
| $100,000 and over | 6,393 (96.9%) | 208 (3.2%) |
Public vs Private Health Insurance Coverage by Age in Berthoud
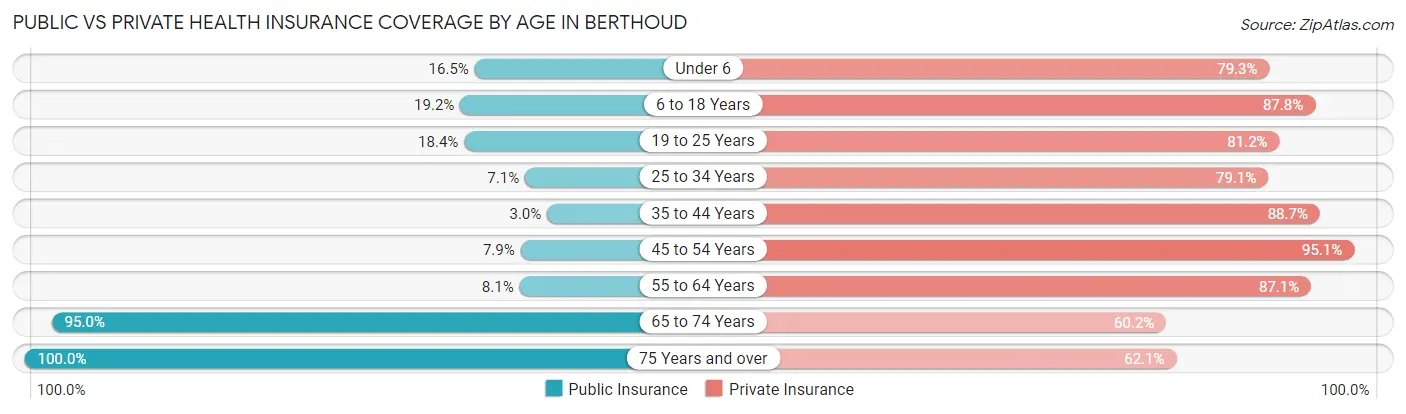
| Age Bracket | Public Insurance | Private Insurance |
| Under 6 | 149 (16.5%) | 718 (79.3%) |
| 6 to 18 Years | 335 (19.2%) | 1,536 (87.8%) |
| 19 to 25 Years | 148 (18.4%) | 653 (81.2%) |
| 25 to 34 Years | 104 (7.1%) | 1,156 (79.1%) |
| 35 to 44 Years | 47 (3.0%) | 1,383 (88.7%) |
| 45 to 54 Years | 121 (7.9%) | 1,448 (95.1%) |
| 55 to 64 Years | 111 (8.1%) | 1,188 (87.1%) |
| 65 to 74 Years | 969 (95.0%) | 614 (60.2%) |
| 75 Years and over | 430 (100.0%) | 267 (62.1%) |
| Total | 2,414 (22.3%) | 8,963 (82.9%) |
Disability Status by Sex by Age in Berthoud
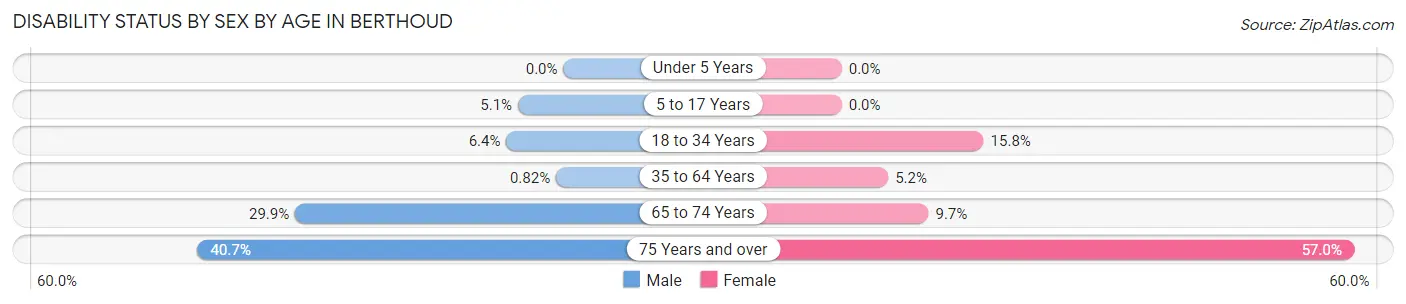
| Age Bracket | Male | Female |
| Under 5 Years | 0 (0.0%) | 0 (0.0%) |
| 5 to 17 Years | 53 (5.1%) | 0 (0.0%) |
| 18 to 34 Years | 79 (6.4%) | 189 (15.8%) |
| 35 to 64 Years | 18 (0.8%) | 117 (5.2%) |
| 65 to 74 Years | 147 (29.9%) | 51 (9.7%) |
| 75 Years and over | 88 (40.7%) | 122 (57.0%) |
Disability Class by Sex by Age in Berthoud
Disability Class: Hearing Difficulty
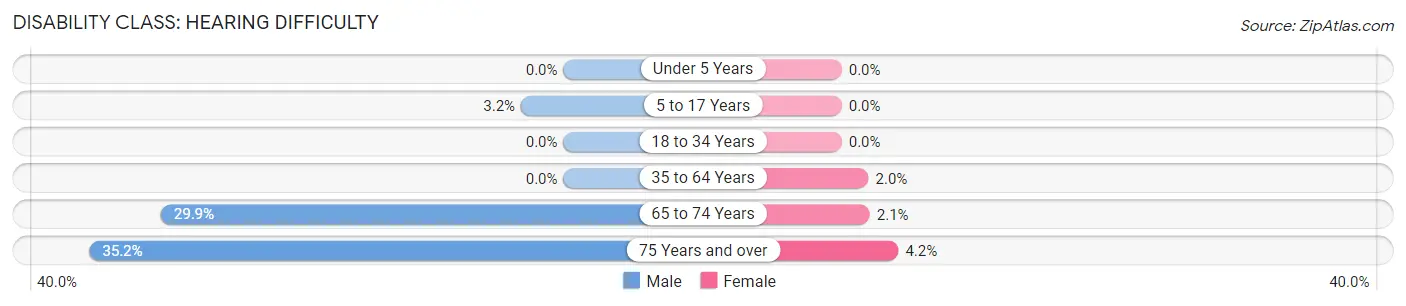
| Age Bracket | Male | Female |
| Under 5 Years | 0 (0.0%) | 0 (0.0%) |
| 5 to 17 Years | 33 (3.2%) | 0 (0.0%) |
| 18 to 34 Years | 0 (0.0%) | 0 (0.0%) |
| 35 to 64 Years | 0 (0.0%) | 45 (2.0%) |
| 65 to 74 Years | 147 (29.9%) | 11 (2.1%) |
| 75 Years and over | 76 (35.2%) | 9 (4.2%) |
Disability Class: Vision Difficulty
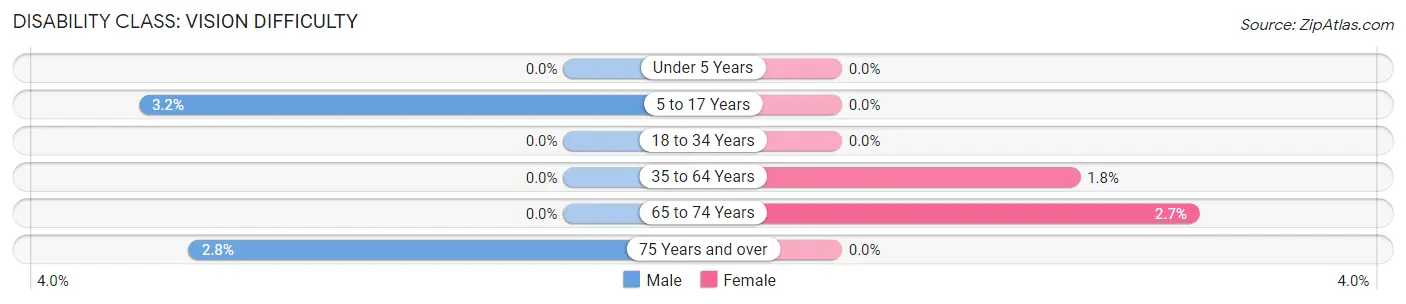
| Age Bracket | Male | Female |
| Under 5 Years | 0 (0.0%) | 0 (0.0%) |
| 5 to 17 Years | 33 (3.2%) | 0 (0.0%) |
| 18 to 34 Years | 0 (0.0%) | 0 (0.0%) |
| 35 to 64 Years | 0 (0.0%) | 40 (1.8%) |
| 65 to 74 Years | 0 (0.0%) | 14 (2.6%) |
| 75 Years and over | 6 (2.8%) | 0 (0.0%) |
Disability Class: Cognitive Difficulty
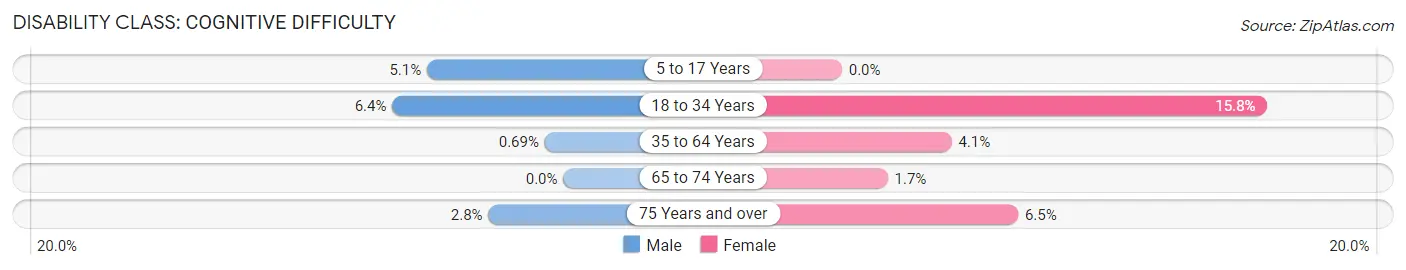
| Age Bracket | Male | Female |
| 5 to 17 Years | 53 (5.1%) | 0 (0.0%) |
| 18 to 34 Years | 79 (6.4%) | 189 (15.8%) |
| 35 to 64 Years | 15 (0.7%) | 92 (4.1%) |
| 65 to 74 Years | 0 (0.0%) | 9 (1.7%) |
| 75 Years and over | 6 (2.8%) | 14 (6.5%) |
Disability Class: Ambulatory Difficulty
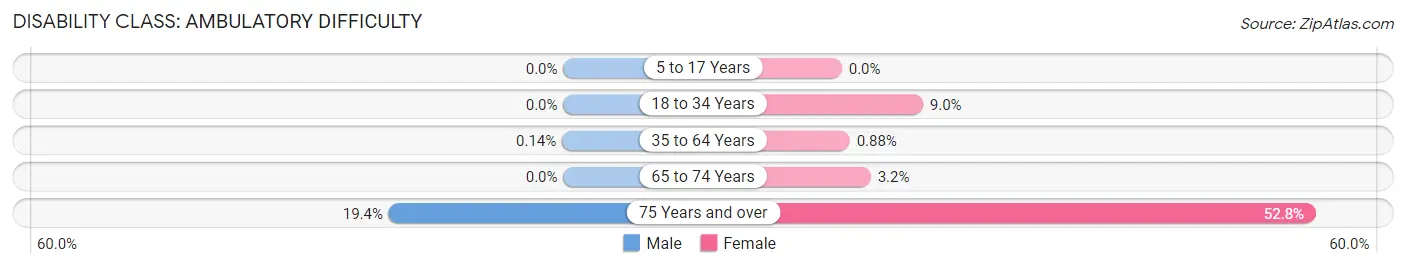
| Age Bracket | Male | Female |
| 5 to 17 Years | 0 (0.0%) | 0 (0.0%) |
| 18 to 34 Years | 0 (0.0%) | 108 (9.0%) |
| 35 to 64 Years | 3 (0.1%) | 20 (0.9%) |
| 65 to 74 Years | 0 (0.0%) | 17 (3.2%) |
| 75 Years and over | 42 (19.4%) | 113 (52.8%) |
Disability Class: Self-Care Difficulty
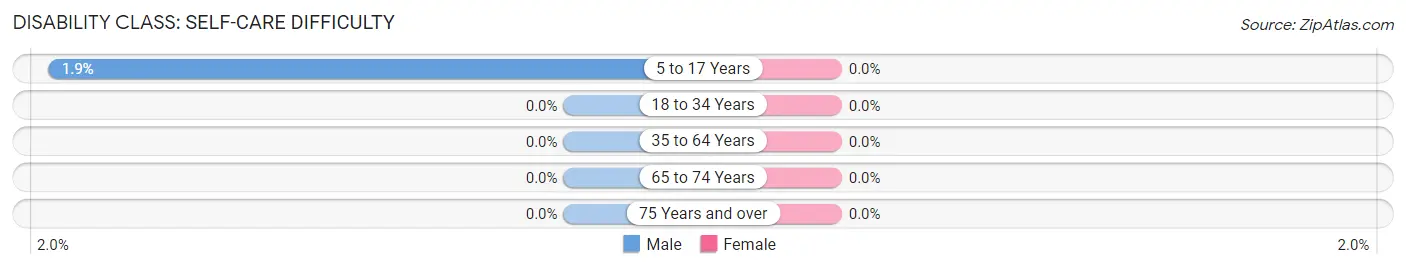
| Age Bracket | Male | Female |
| 5 to 17 Years | 20 (1.9%) | 0 (0.0%) |
| 18 to 34 Years | 0 (0.0%) | 0 (0.0%) |
| 35 to 64 Years | 0 (0.0%) | 0 (0.0%) |
| 65 to 74 Years | 0 (0.0%) | 0 (0.0%) |
| 75 Years and over | 0 (0.0%) | 0 (0.0%) |
Technology Access in Berthoud
Computing Device Access in Berthoud
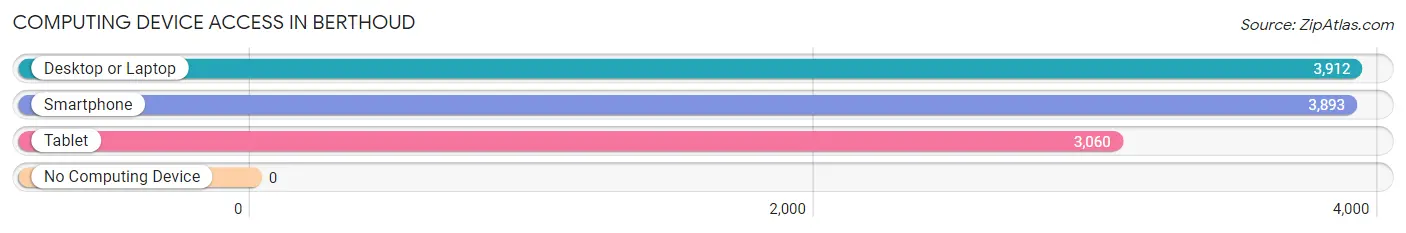
| Device Type | # Households | % Households |
| Desktop or Laptop | 3,912 | 94.4% |
| Smartphone | 3,893 | 94.0% |
| Tablet | 3,060 | 73.9% |
| No Computing Device | 0 | 0.0% |
| Total | 4,143 | 100.0% |
Internet Access in Berthoud
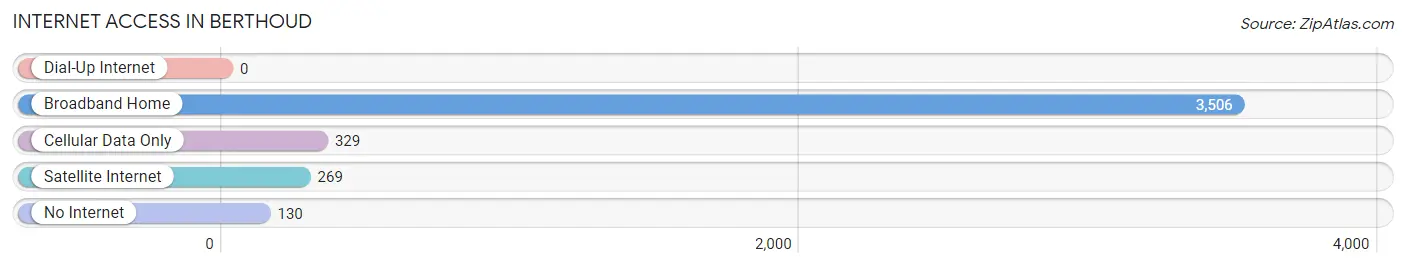
| Internet Type | # Households | % Households |
| Dial-Up Internet | 0 | 0.0% |
| Broadband Home | 3,506 | 84.6% |
| Cellular Data Only | 329 | 7.9% |
| Satellite Internet | 269 | 6.5% |
| No Internet | 130 | 3.1% |
| Total | 4,143 | 100.0% |
Berthoud Summary
Berthoud, Colorado is a small town located in Larimer County, approximately 35 miles north of Denver. It is situated in the foothills of the Rocky Mountains and is surrounded by agricultural land. The town has a population of approximately 6,000 people and is known for its small-town charm and rural atmosphere.
History
Berthoud was founded in 1882 by Peter and Mary Berthoud, who were among the first settlers in the area. The town was named after Peter Berthoud, who was a surveyor and civil engineer. The town was originally a farming community, and the Berthouds built a flour mill and a general store. The town grew slowly over the years, and by the early 1900s, it had become a popular destination for tourists.
In the 1920s, the town began to experience a period of growth and development. The Great Western Sugar Company opened a sugar beet processing plant in Berthoud, and the town became a center for the sugar beet industry. The town also became a popular destination for tourists, and the Berthouds built a hotel and a dance hall.
In the 1950s, the town experienced a period of decline as the sugar beet industry declined and the town's population began to decline. However, in the late 1970s, the town began to experience a period of growth and development. The town was incorporated in 1981, and the population began to grow again.
Geography
Berthoud is located in the foothills of the Rocky Mountains, and the town is surrounded by agricultural land. The town is situated at an elevation of 5,000 feet, and the climate is semi-arid. The town is located near the Cache la Poudre River, and the town is home to several parks and recreational areas.
Economy
Berthoud's economy is largely based on agriculture and tourism. The town is home to several farms and ranches, and the town is also home to several wineries and breweries. The town is also home to several small businesses, including restaurants, shops, and galleries.
The town is also home to several manufacturing companies, including a concrete plant and a metal fabrication plant. The town is also home to several technology companies, including a software development company and a web design company.
Demographics
As of the 2010 census, the population of Berthoud was 6,031. The median age of the population was 36.7 years, and the median household income was $60,945. The town is predominantly white, with 87.3% of the population identifying as white. The town is also home to a small Hispanic population, with 8.3% of the population identifying as Hispanic or Latino.
Berthoud is a small town with a rural atmosphere and a strong sense of community. The town is home to several parks and recreational areas, and the town is also home to several wineries and breweries. The town is also home to several small businesses, and the town is home to several technology companies. The town is also home to several farms and ranches, and the town is home to several manufacturing companies.
Common Questions
What is Per Capita Income in Berthoud?
Per Capita income in Berthoud is $45,757.
What is the Median Family Income in Berthoud?
Median Family Income in Berthoud is $112,453.
What is the Median Household income in Berthoud?
Median Household Income in Berthoud is $101,817.
What is Income or Wage Gap in Berthoud?
Income or Wage Gap in Berthoud is 46.4%.
Women in Berthoud earn 53.6 cents for every dollar earned by a man.
What is Inequality or Gini Index in Berthoud?
Inequality or Gini Index in Berthoud is 0.34.
What is the Total Population of Berthoud?
Total Population of Berthoud is 10,892.
What is the Total Male Population of Berthoud?
Total Male Population of Berthoud is 5,505.
What is the Total Female Population of Berthoud?
Total Female Population of Berthoud is 5,387.
What is the Ratio of Males per 100 Females in Berthoud?
There are 102.19 Males per 100 Females in Berthoud.
What is the Ratio of Females per 100 Males in Berthoud?
There are 97.86 Females per 100 Males in Berthoud.
What is the Median Population Age in Berthoud?
Median Population Age in Berthoud is 38.5 Years.
What is the Average Family Size in Berthoud
Average Family Size in Berthoud is 2.9 People.
What is the Average Household Size in Berthoud
Average Household Size in Berthoud is 2.6 People.
How Large is the Labor Force in Berthoud?
There are 6,271 People in the Labor Forcein in Berthoud.
What is the Percentage of People in the Labor Force in Berthoud?
71.4% of People are in the Labor Force in Berthoud.
What is the Unemployment Rate in Berthoud?
Unemployment Rate in Berthoud is 2.8%.