Southern Ute, CO Map & Demographics
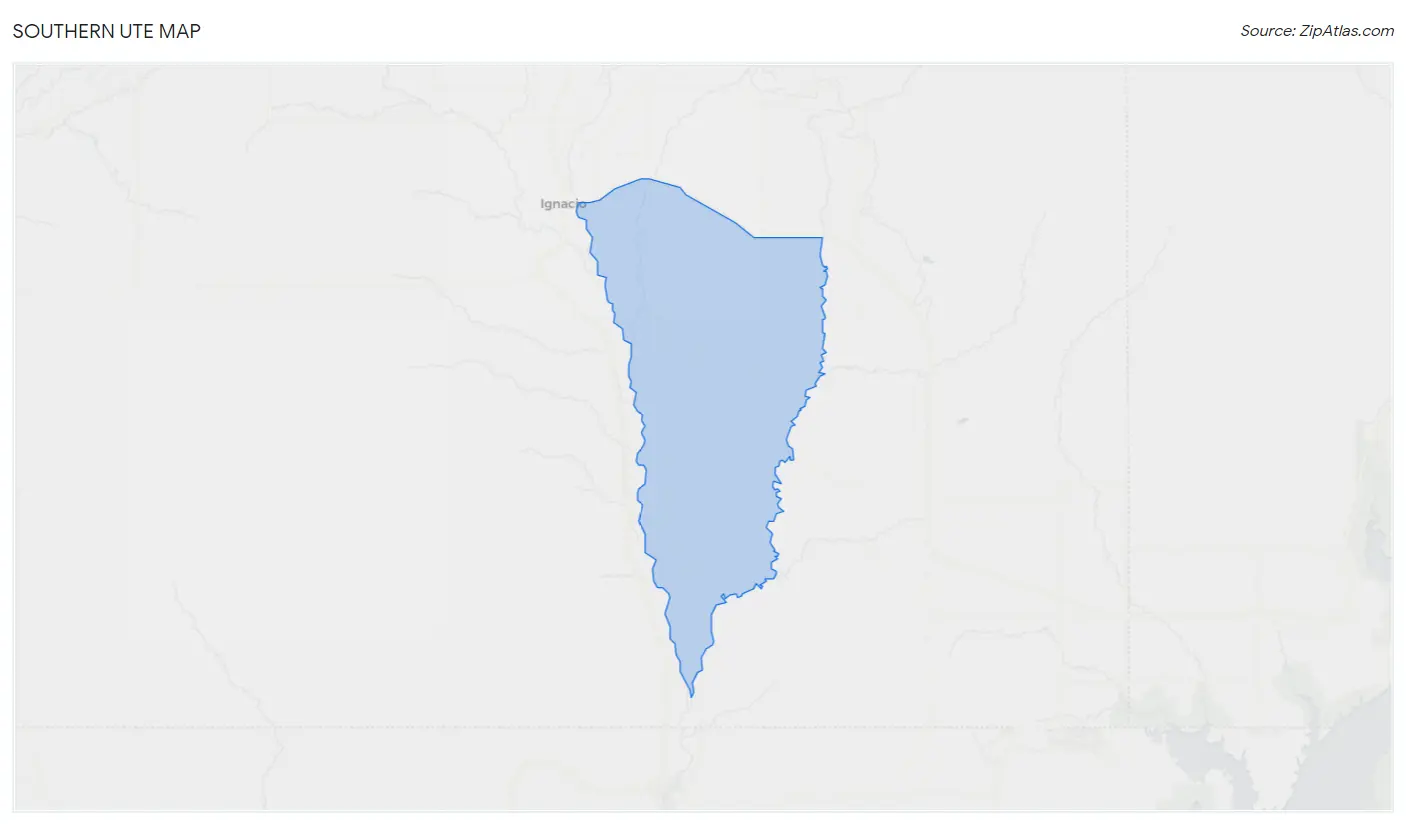
Southern Ute Map
Southern Ute Overview
$30,782
PER CAPITA INCOME
$103,036
AVG FAMILY INCOME
11.0%
WAGE / INCOME GAP [ % ]
89.0¢/ $1
WAGE / INCOME GAP [ $ ]
0.38
INEQUALITY / GINI INDEX
136
TOTAL POPULATION
55
MALE POPULATION
81
FEMALE POPULATION
67.90
MALES / 100 FEMALES
147.27
FEMALES / 100 MALES
40.3
MEDIAN AGE
2.9
AVG FAMILY SIZE
2.2
AVG HOUSEHOLD SIZE
46
LABOR FORCE [ PEOPLE ]
38.0%
PERCENT IN LABOR FORCE
Income in Southern Ute
Income Overview in Southern Ute
| Characteristic | Number | Measure |
| Per Capita Income | 136 | $30,782 |
| Median Family Income | 31 | $103,036 |
| Mean Family Income | 31 | $101,213 |
| Median Household Income | 63 | $0 |
| Mean Household Income | 63 | $69,163 |
| Income Deficit | 31 | $0 |
| Wage / Income Gap (%) | 136 | 10.98% |
| Wage / Income Gap ($) | 136 | 89.02¢ per $1 |
| Gini / Inequality Index | 136 | 0.38 |
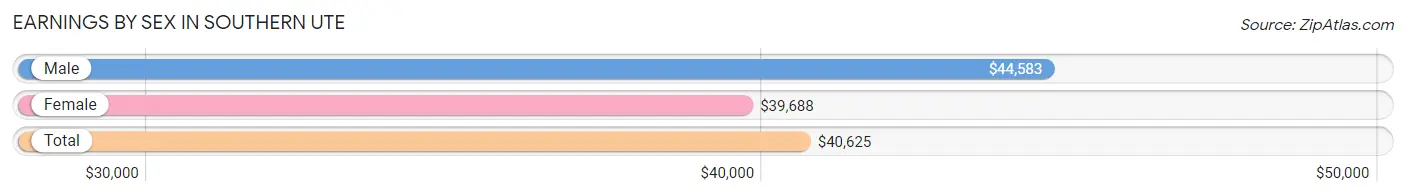
Earnings by Sex in Southern Ute
Average Earnings in Southern Ute are $40,625, $44,583 for men and $39,688 for women, a difference of 11.0%.
| Sex | Number | Average Earnings |
| Male | 29 (52.7%) | $44,583 |
| Female | 26 (47.3%) | $39,688 |
| Total | 55 (100.0%) | $40,625 |
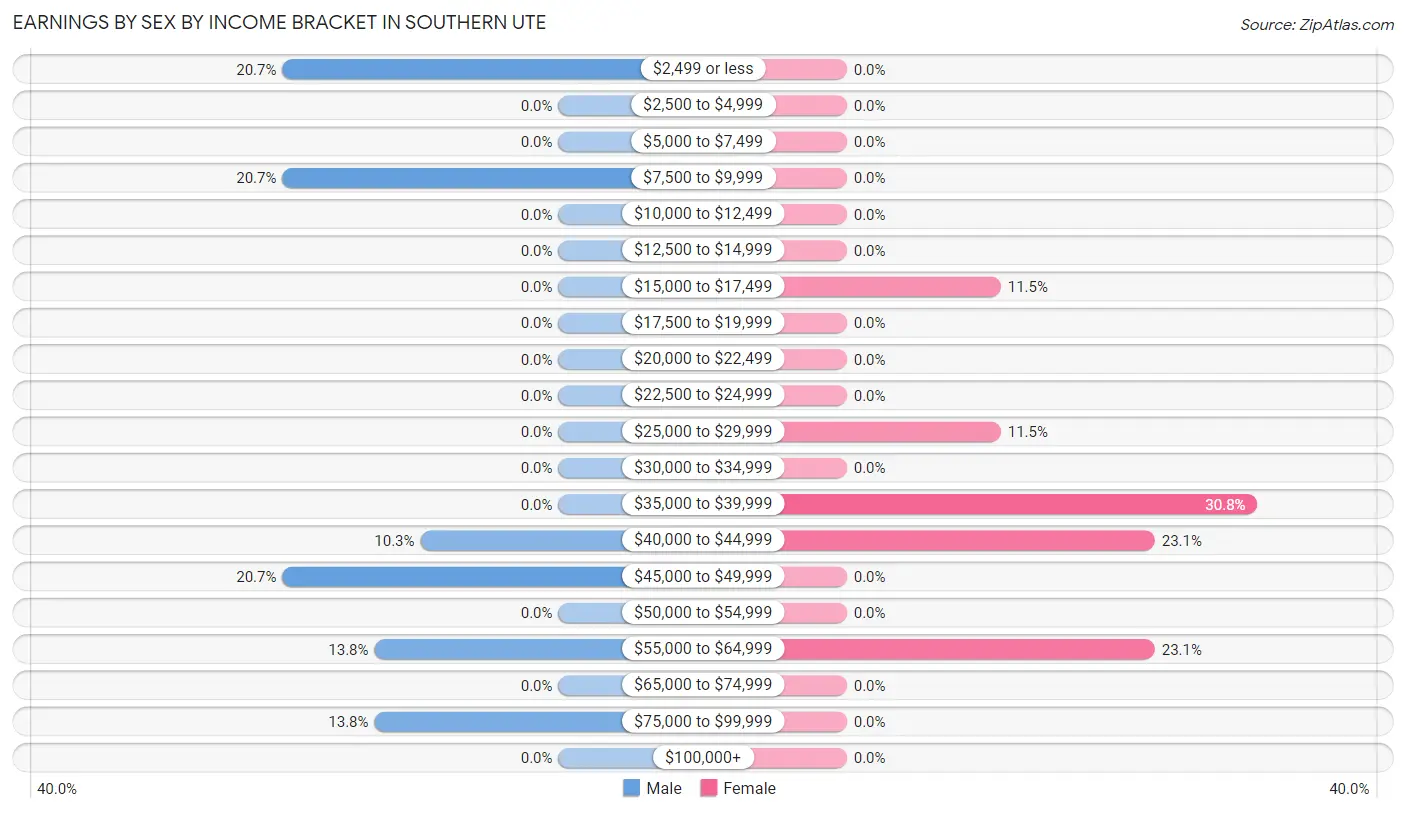
Earnings by Sex by Income Bracket in Southern Ute
The most common earnings brackets in Southern Ute are $2,499 or less for men (6 | 20.7%) and $35,000 to $39,999 for women (8 | 30.8%).
| Income | Male | Female |
| $2,499 or less | 6 (20.7%) | 0 (0.0%) |
| $2,500 to $4,999 | 0 (0.0%) | 0 (0.0%) |
| $5,000 to $7,499 | 0 (0.0%) | 0 (0.0%) |
| $7,500 to $9,999 | 6 (20.7%) | 0 (0.0%) |
| $10,000 to $12,499 | 0 (0.0%) | 0 (0.0%) |
| $12,500 to $14,999 | 0 (0.0%) | 0 (0.0%) |
| $15,000 to $17,499 | 0 (0.0%) | 3 (11.5%) |
| $17,500 to $19,999 | 0 (0.0%) | 0 (0.0%) |
| $20,000 to $22,499 | 0 (0.0%) | 0 (0.0%) |
| $22,500 to $24,999 | 0 (0.0%) | 0 (0.0%) |
| $25,000 to $29,999 | 0 (0.0%) | 3 (11.5%) |
| $30,000 to $34,999 | 0 (0.0%) | 0 (0.0%) |
| $35,000 to $39,999 | 0 (0.0%) | 8 (30.8%) |
| $40,000 to $44,999 | 3 (10.3%) | 6 (23.1%) |
| $45,000 to $49,999 | 6 (20.7%) | 0 (0.0%) |
| $50,000 to $54,999 | 0 (0.0%) | 0 (0.0%) |
| $55,000 to $64,999 | 4 (13.8%) | 6 (23.1%) |
| $65,000 to $74,999 | 0 (0.0%) | 0 (0.0%) |
| $75,000 to $99,999 | 4 (13.8%) | 0 (0.0%) |
| $100,000+ | 0 (0.0%) | 0 (0.0%) |
| Total | 29 (100.0%) | 26 (100.0%) |
Earnings by Sex by Educational Attainment in Southern Ute
| Educational Attainment | Male Income | Female Income |
| Less than High School | - | - |
| High School Diploma | - | - |
| College or Associate's Degree | - | - |
| Bachelor's Degree | - | - |
| Graduate Degree | - | - |
| Total | $49,792 | $0 |
Family Income in Southern Ute
Family Income Brackets in Southern Ute
According to the Southern Ute family income data, there are 13 families falling into the $100,000 to $149,999 income range, which is the most common income bracket and makes up 41.9% of all families.
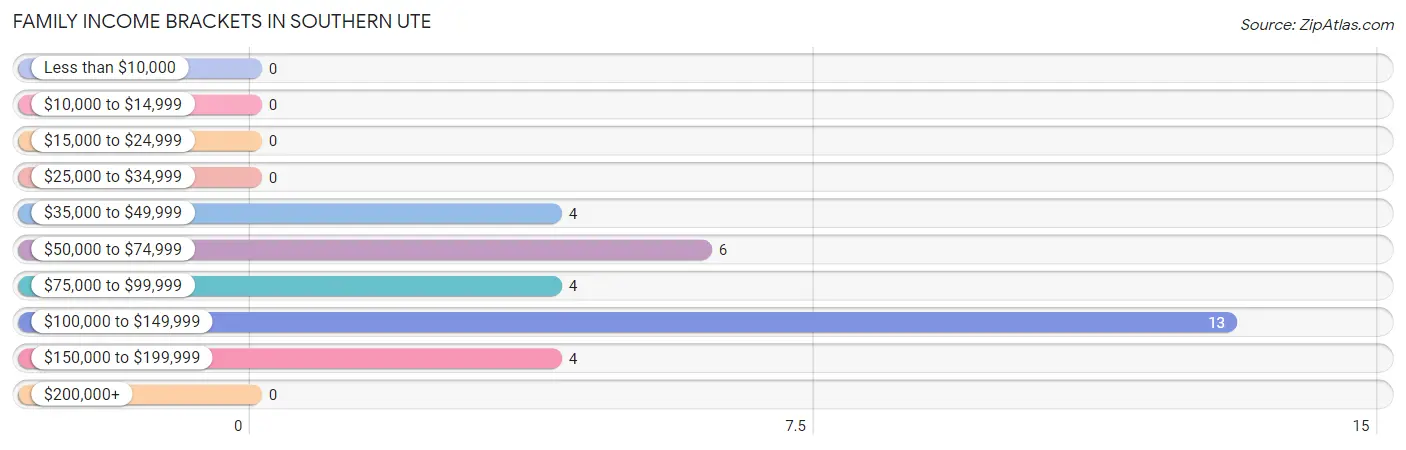
| Income Bracket | # Families | % Families |
| Less than $10,000 | 0 | 0.0% |
| $10,000 to $14,999 | 0 | 0.0% |
| $15,000 to $24,999 | 0 | 0.0% |
| $25,000 to $34,999 | 0 | 0.0% |
| $35,000 to $49,999 | 4 | 12.9% |
| $50,000 to $74,999 | 6 | 19.4% |
| $75,000 to $99,999 | 4 | 12.9% |
| $100,000 to $149,999 | 13 | 41.9% |
| $150,000 to $199,999 | 4 | 12.9% |
| $200,000+ | 0 | 0.0% |
Family Income by Famaliy Size in Southern Ute
2-person families (17 | 54.8%) account for the highest median family income in Southern Ute with $128,125 per family, while 2-person families (17 | 54.8%) have the highest median income of $64,062 per family member.
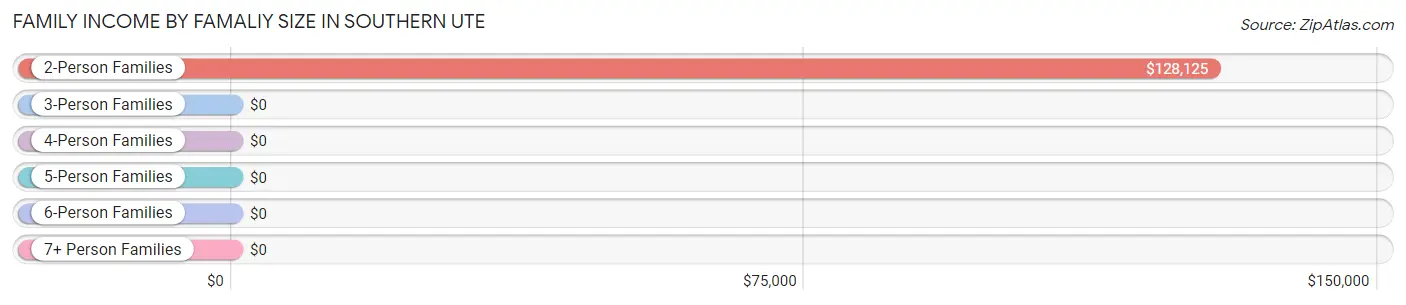
| Income Bracket | # Families | Median Income |
| 2-Person Families | 17 (54.8%) | $128,125 |
| 3-Person Families | 3 (9.7%) | $0 |
| 4-Person Families | 0 (0.0%) | $0 |
| 5-Person Families | 11 (35.5%) | $0 |
| 6-Person Families | 0 (0.0%) | $0 |
| 7+ Person Families | 0 (0.0%) | $0 |
| Total | 31 (100.0%) | $103,036 |
Family Income by Number of Earners in Southern Ute
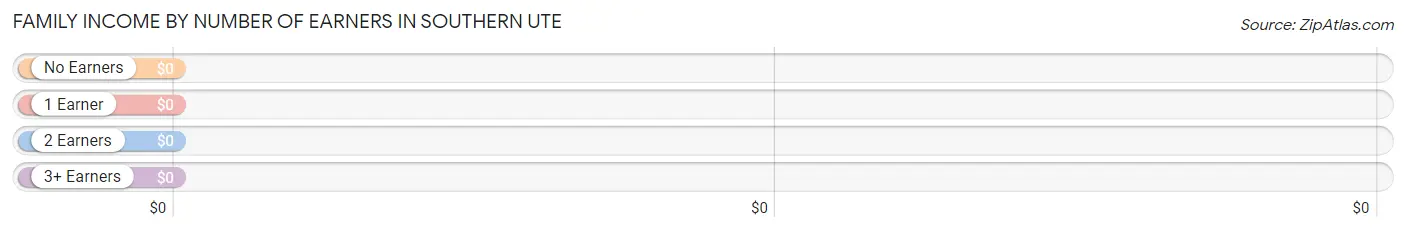
| Number of Earners | # Families | Median Income |
| No Earners | 10 (32.3%) | $0 |
| 1 Earner | 11 (35.5%) | $0 |
| 2 Earners | 10 (32.3%) | $0 |
| 3+ Earners | 0 (0.0%) | $0 |
| Total | 31 (100.0%) | $103,036 |
Household Income in Southern Ute
Household Income Brackets in Southern Ute
With 13 households falling in the category, the $100,000 to $149,999 income range is the most frequent in Southern Ute, accounting for 20.6% of all households.
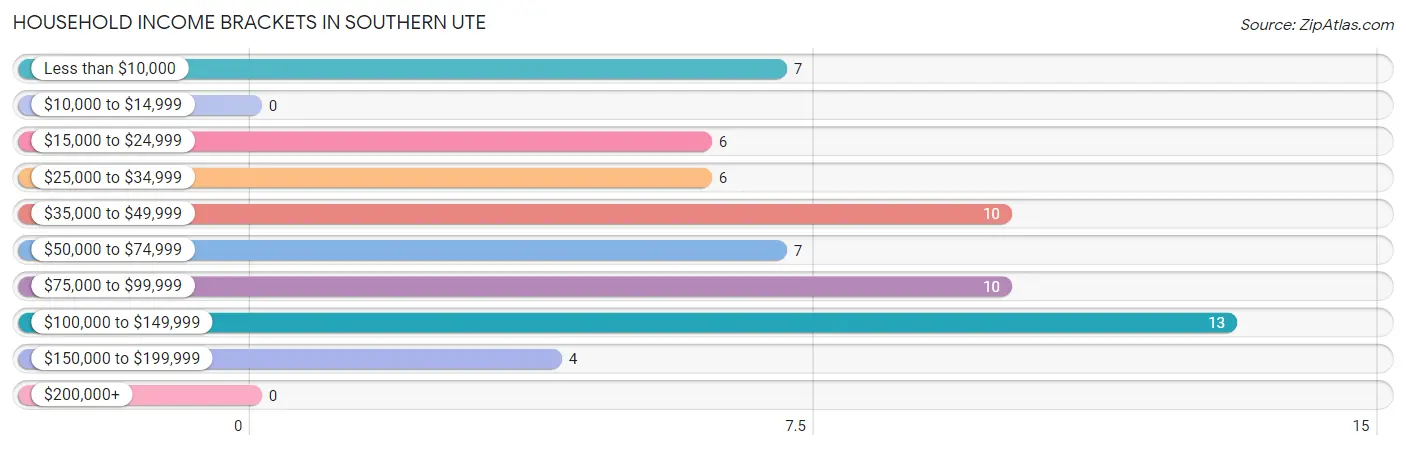
| Income Bracket | # Households | % Households |
| Less than $10,000 | 7 | 11.1% |
| $10,000 to $14,999 | 0 | 0.0% |
| $15,000 to $24,999 | 6 | 9.5% |
| $25,000 to $34,999 | 6 | 9.5% |
| $35,000 to $49,999 | 10 | 15.9% |
| $50,000 to $74,999 | 7 | 11.1% |
| $75,000 to $99,999 | 10 | 15.9% |
| $100,000 to $149,999 | 13 | 20.6% |
| $150,000 to $199,999 | 4 | 6.3% |
| $200,000+ | 0 | 0.0% |
Household Income by Householder Age in Southern Ute
The median household income in Southern Ute is $0, with the highest median household income of $43,438 found in the 65+ years age bracket for the primary householder. A total of 27 households (42.9%) fall into this category. Meanwhile, the 15 to 24 years age bracket for the primary householder has the lowest median household income of $0, with 6 households (9.5%) in this group.
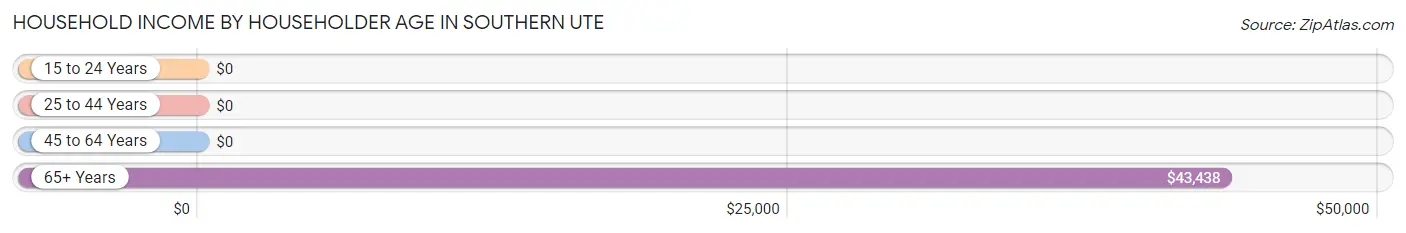
| Income Bracket | # Households | Median Income |
| 15 to 24 Years | 6 (9.5%) | $0 |
| 25 to 44 Years | 10 (15.9%) | $0 |
| 45 to 64 Years | 20 (31.8%) | $0 |
| 65+ Years | 27 (42.9%) | $43,438 |
| Total | 63 (100.0%) | $0 |
Poverty in Southern Ute
Income Below Poverty by Sex and Age in Southern Ute
With 10.9% poverty level for males and 8.6% for females among the residents of Southern Ute, 18 to 24 year old males and 55 to 64 year old females are the most vulnerable to poverty, with 6 males (100.0%) and 7 females (35.0%) in their respective age groups living below the poverty level.
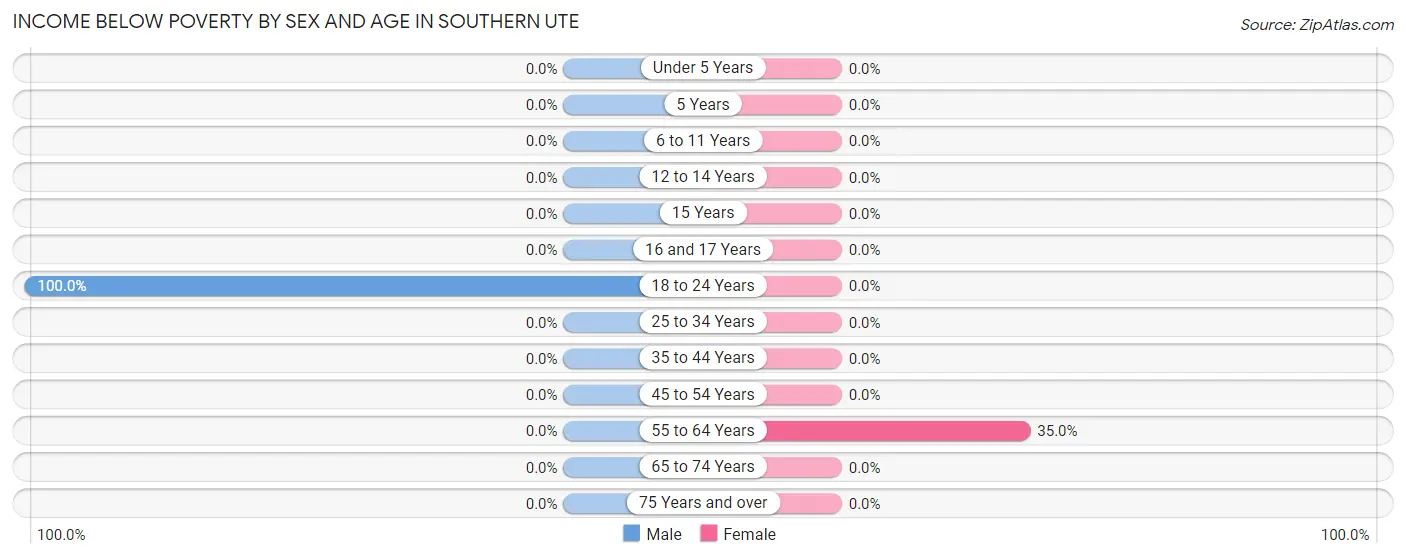
| Age Bracket | Male | Female |
| Under 5 Years | 0 (0.0%) | 0 (0.0%) |
| 5 Years | 0 (0.0%) | 0 (0.0%) |
| 6 to 11 Years | 0 (0.0%) | 0 (0.0%) |
| 12 to 14 Years | 0 (0.0%) | 0 (0.0%) |
| 15 Years | 0 (0.0%) | 0 (0.0%) |
| 16 and 17 Years | 0 (0.0%) | 0 (0.0%) |
| 18 to 24 Years | 6 (100.0%) | 0 (0.0%) |
| 25 to 34 Years | 0 (0.0%) | 0 (0.0%) |
| 35 to 44 Years | 0 (0.0%) | 0 (0.0%) |
| 45 to 54 Years | 0 (0.0%) | 0 (0.0%) |
| 55 to 64 Years | 0 (0.0%) | 7 (35.0%) |
| 65 to 74 Years | 0 (0.0%) | 0 (0.0%) |
| 75 Years and over | 0 (0.0%) | 0 (0.0%) |
| Total | 6 (10.9%) | 7 (8.6%) |
Income Above Poverty by Sex and Age in Southern Ute
According to the poverty statistics in Southern Ute, males aged 6 to 11 years and females aged under 5 years are the age groups that are most secure financially, with 100.0% of males and 100.0% of females in these age groups living above the poverty line.
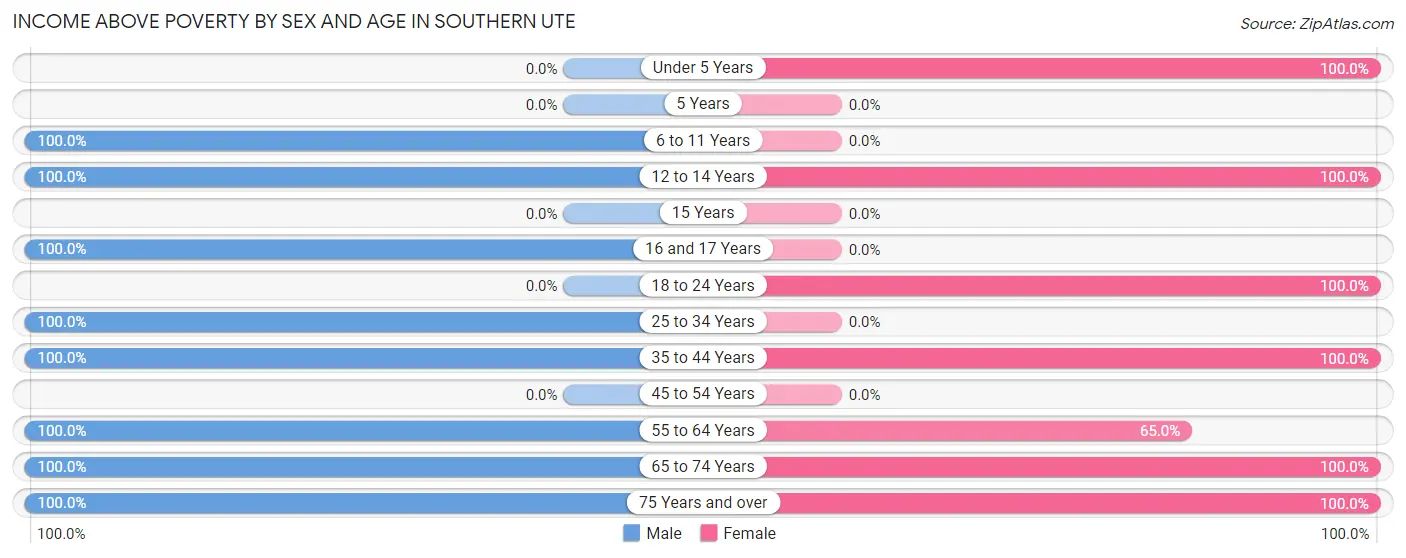
| Age Bracket | Male | Female |
| Under 5 Years | 0 (0.0%) | 3 (100.0%) |
| 5 Years | 0 (0.0%) | 0 (0.0%) |
| 6 to 11 Years | 5 (100.0%) | 0 (0.0%) |
| 12 to 14 Years | 4 (100.0%) | 3 (100.0%) |
| 15 Years | 0 (0.0%) | 0 (0.0%) |
| 16 and 17 Years | 6 (100.0%) | 0 (0.0%) |
| 18 to 24 Years | 0 (0.0%) | 22 (100.0%) |
| 25 to 34 Years | 6 (100.0%) | 0 (0.0%) |
| 35 to 44 Years | 12 (100.0%) | 4 (100.0%) |
| 45 to 54 Years | 0 (0.0%) | 0 (0.0%) |
| 55 to 64 Years | 3 (100.0%) | 13 (65.0%) |
| 65 to 74 Years | 4 (100.0%) | 25 (100.0%) |
| 75 Years and over | 9 (100.0%) | 4 (100.0%) |
| Total | 49 (89.1%) | 74 (91.4%) |
Income Below Poverty Among Married-Couple Families in Southern Ute
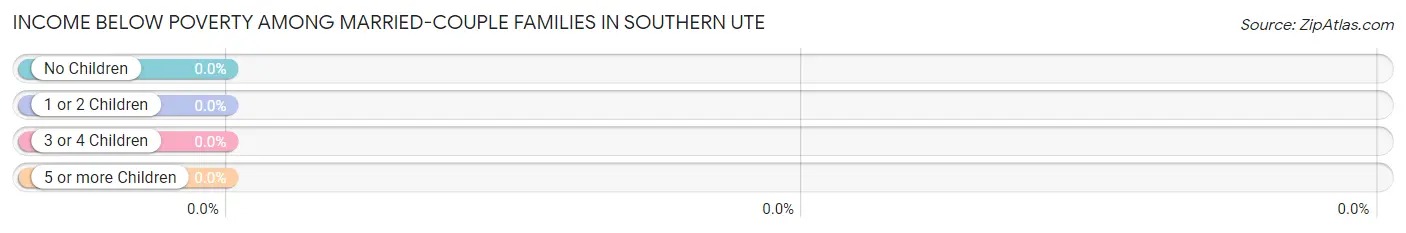
| Children | Above Poverty | Below Poverty |
| No Children | 20 (100.0%) | 0 (0.0%) |
| 1 or 2 Children | 0 (0.0%) | 0 (0.0%) |
| 3 or 4 Children | 4 (100.0%) | 0 (0.0%) |
| 5 or more Children | 0 (0.0%) | 0 (0.0%) |
| Total | 24 (100.0%) | 0 (0.0%) |
Income Below Poverty Among Single-Parent Households in Southern Ute
| Children | Single Father | Single Mother |
| No Children | 0 (0.0%) | 0 (0.0%) |
| 1 or 2 Children | 0 (0.0%) | 0 (0.0%) |
| 3 or 4 Children | 0 (0.0%) | 0 (0.0%) |
| 5 or more Children | 0 (0.0%) | 0 (0.0%) |
| Total | 0 (0.0%) | 0 (0.0%) |
Income Below Poverty Among Married-Couple vs Single-Parent Households in Southern Ute
| Children | Married-Couple Families | Single-Parent Households |
| No Children | 0 (0.0%) | 0 (0.0%) |
| 1 or 2 Children | 0 (0.0%) | 0 (0.0%) |
| 3 or 4 Children | 0 (0.0%) | 0 (0.0%) |
| 5 or more Children | 0 (0.0%) | 0 (0.0%) |
| Total | 0 (0.0%) | 0 (0.0%) |
Race in Southern Ute
The most populous races in Southern Ute are White / Caucasian (73 | 53.7%), Native / Alaskan (60 | 44.1%), and Hispanic or Latino (22 | 16.2%).
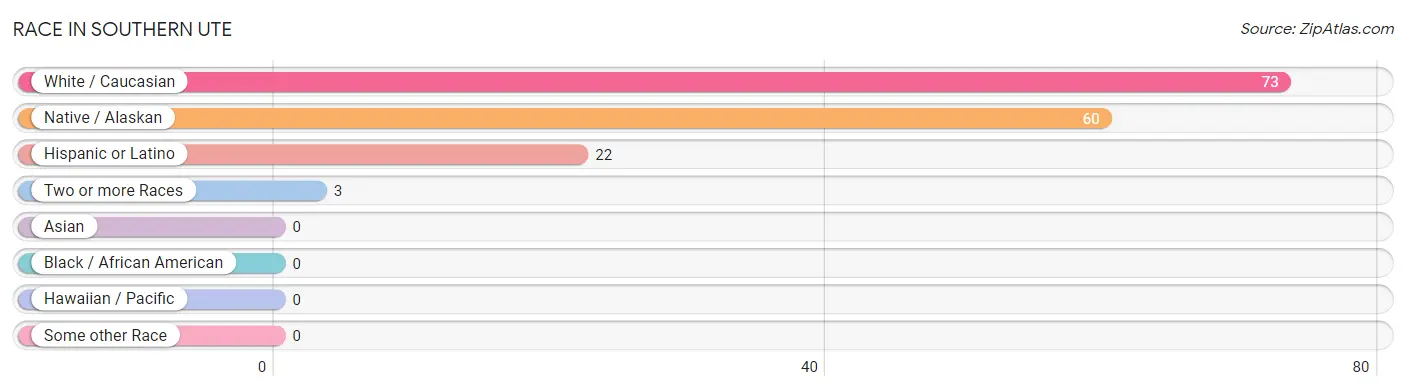
| Race | # Population | % Population |
| Asian | 0 | 0.0% |
| Black / African American | 0 | 0.0% |
| Hawaiian / Pacific | 0 | 0.0% |
| Hispanic or Latino | 22 | 16.2% |
| Native / Alaskan | 60 | 44.1% |
| White / Caucasian | 73 | 53.7% |
| Two or more Races | 3 | 2.2% |
| Some other Race | 0 | 0.0% |
| Total | 136 | 100.0% |
Ancestry in Southern Ute
The most populous ancestries reported in Southern Ute are Ute (60 | 44.1%), Spanish (16 | 11.8%), Norwegian (9 | 6.6%), Irish (6 | 4.4%), and German (3 | 2.2%), together accounting for 69.1% of all Southern Ute residents.
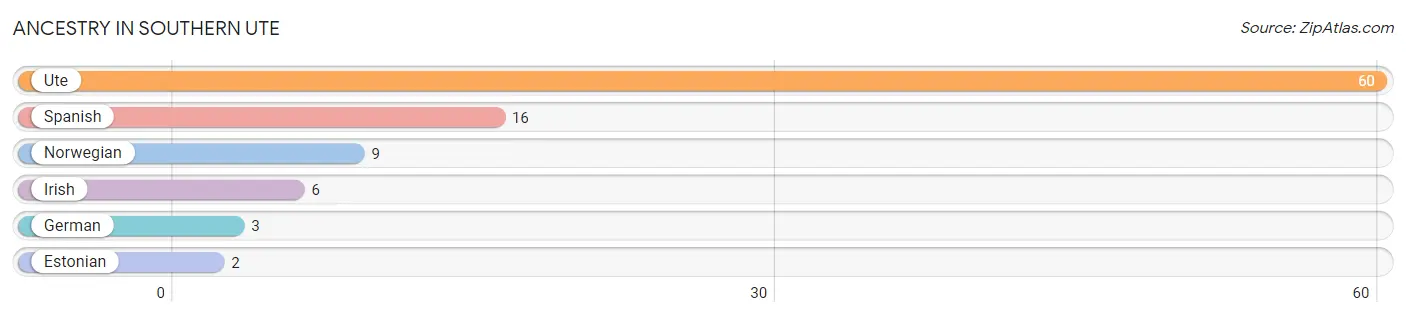
| Ancestry | # Population | % Population |
| Estonian | 2 | 1.5% |
| German | 3 | 2.2% |
| Irish | 6 | 4.4% |
| Norwegian | 9 | 6.6% |
| Spanish | 16 | 11.8% |
| Ute | 60 | 44.1% | View All 6 Rows |
Immigrants in Southern Ute
The most numerous immigrant groups reported in Southern Ute came from Eastern Europe (2 | 1.5%), and Europe (2 | 1.5%), together accounting for 2.9% of all Southern Ute residents.
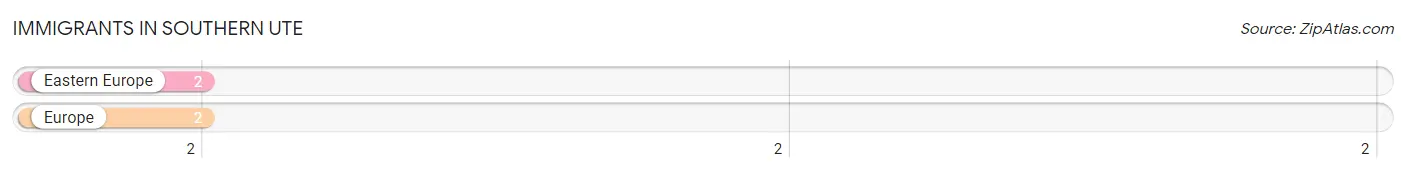
| Immigration Origin | # Population | % Population |
| Eastern Europe | 2 | 1.5% |
| Europe | 2 | 1.5% | View All 2 Rows |
Sex and Age in Southern Ute
Sex and Age in Southern Ute
The most populous age groups in Southern Ute are 10 to 14 Years (9 | 16.4%) for men and 20 to 24 Years (22 | 27.2%) for women.
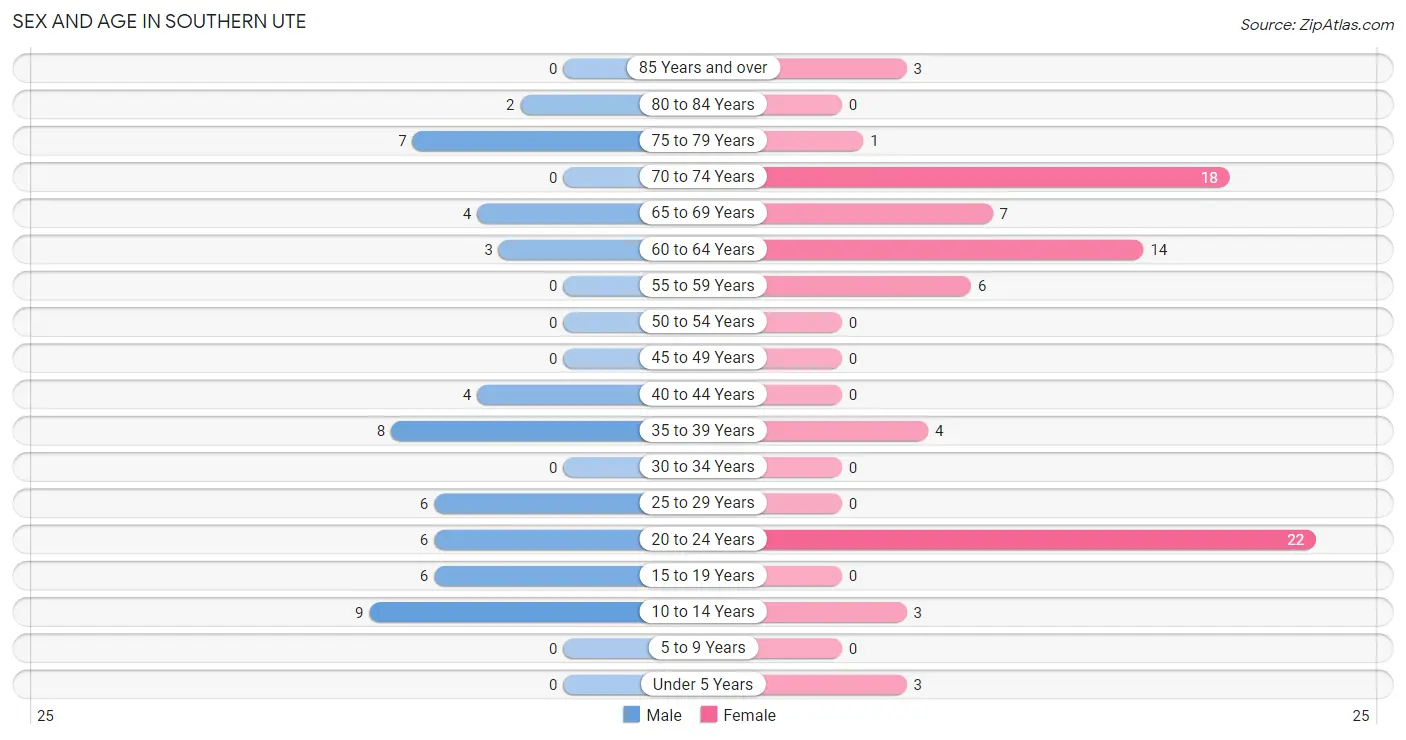
| Age Bracket | Male | Female |
| Under 5 Years | 0 (0.0%) | 3 (3.7%) |
| 5 to 9 Years | 0 (0.0%) | 0 (0.0%) |
| 10 to 14 Years | 9 (16.4%) | 3 (3.7%) |
| 15 to 19 Years | 6 (10.9%) | 0 (0.0%) |
| 20 to 24 Years | 6 (10.9%) | 22 (27.2%) |
| 25 to 29 Years | 6 (10.9%) | 0 (0.0%) |
| 30 to 34 Years | 0 (0.0%) | 0 (0.0%) |
| 35 to 39 Years | 8 (14.5%) | 4 (4.9%) |
| 40 to 44 Years | 4 (7.3%) | 0 (0.0%) |
| 45 to 49 Years | 0 (0.0%) | 0 (0.0%) |
| 50 to 54 Years | 0 (0.0%) | 0 (0.0%) |
| 55 to 59 Years | 0 (0.0%) | 6 (7.4%) |
| 60 to 64 Years | 3 (5.4%) | 14 (17.3%) |
| 65 to 69 Years | 4 (7.3%) | 7 (8.6%) |
| 70 to 74 Years | 0 (0.0%) | 18 (22.2%) |
| 75 to 79 Years | 7 (12.7%) | 1 (1.2%) |
| 80 to 84 Years | 2 (3.6%) | 0 (0.0%) |
| 85 Years and over | 0 (0.0%) | 3 (3.7%) |
| Total | 55 (100.0%) | 81 (100.0%) |
Families and Households in Southern Ute
Median Family Size in Southern Ute
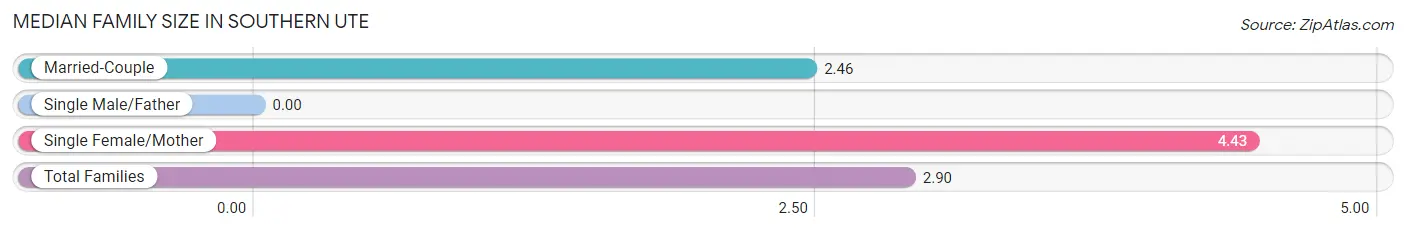
| Family Type | # Families | Family Size |
| Married-Couple | 24 (77.4%) | 2.46 |
| Single Male/Father | 0 (0.0%) | - |
| Single Female/Mother | 7 (22.6%) | 4.43 |
| Total Families | 31 (100.0%) | 2.90 |
Median Household Size in Southern Ute
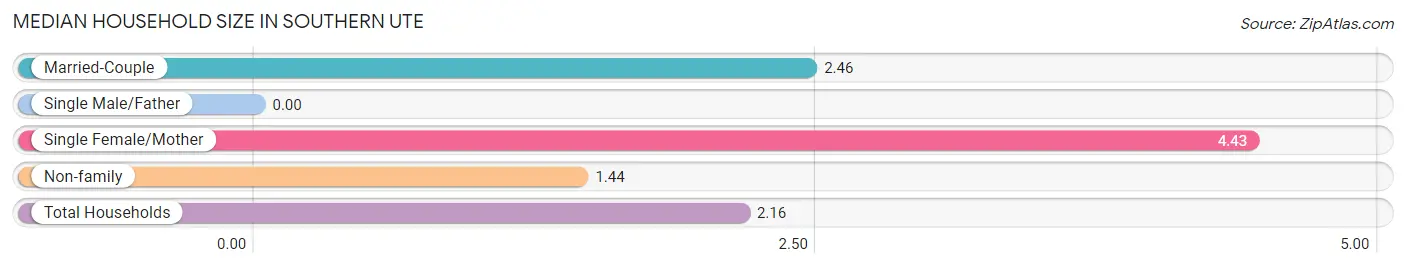
| Household Type | # Households | Household Size |
| Married-Couple | 24 (38.1%) | 2.46 |
| Single Male/Father | 0 (0.0%) | - |
| Single Female/Mother | 7 (11.1%) | 4.43 |
| Non-family | 32 (50.8%) | 1.44 |
| Total Households | 63 (100.0%) | 2.16 |
Household Size by Marriage Status in Southern Ute
Out of a total of 63 households in Southern Ute, 31 (49.2%) are family households, while 32 (50.8%) are nonfamily households. The most numerous type of family households are 2-person households, comprising 17, and the most common type of nonfamily households are 1-person households, comprising 26.
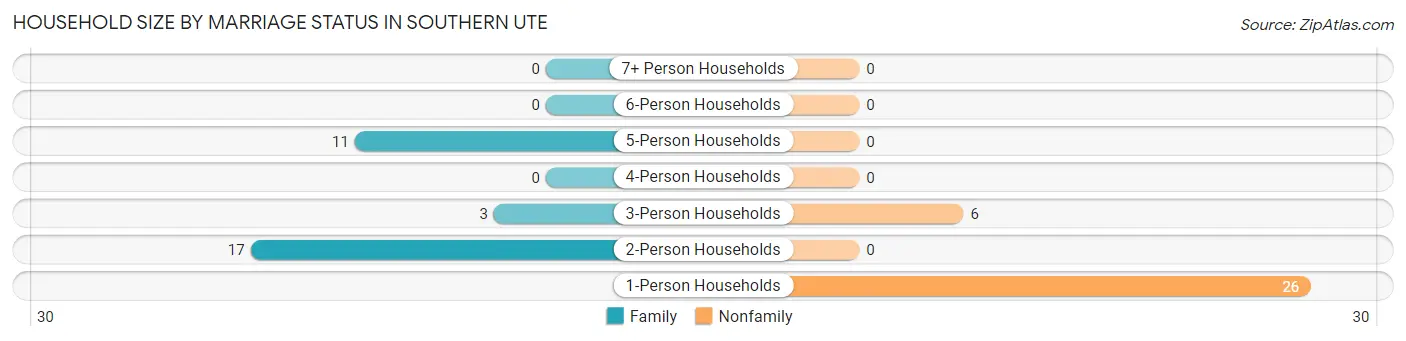
| Household Size | Family Households | Nonfamily Households |
| 1-Person Households | - | 26 (41.3%) |
| 2-Person Households | 17 (27.0%) | 0 (0.0%) |
| 3-Person Households | 3 (4.8%) | 6 (9.5%) |
| 4-Person Households | 0 (0.0%) | 0 (0.0%) |
| 5-Person Households | 11 (17.5%) | 0 (0.0%) |
| 6-Person Households | 0 (0.0%) | 0 (0.0%) |
| 7+ Person Households | 0 (0.0%) | 0 (0.0%) |
| Total | 31 (49.2%) | 32 (50.8%) |
Female Fertility in Southern Ute
Fertility by Age in Southern Ute
| Age Bracket | Women with Births | Births / 1,000 Women |
| 15 to 19 years | 0 (0.0%) | 0.0 |
| 20 to 34 years | 0 (0.0%) | 0.0 |
| 35 to 50 years | 0 (0.0%) | 0.0 |
| Total | 0 (0.0%) | 0.0 |
Fertility by Age by Marriage Status in Southern Ute
| Age Bracket | Married | Unmarried |
| 15 to 19 years | 0 (0.0%) | 0 (0.0%) |
| 20 to 34 years | 0 (0.0%) | 0 (0.0%) |
| 35 to 50 years | 0 (0.0%) | 0 (0.0%) |
| Total | 0 (0.0%) | 0 (0.0%) |
Fertility by Education in Southern Ute
| Educational Attainment | Women with Births | Births / 1,000 Women |
| Less than High School | 0 (0.0%) | 0.0 |
| High School Diploma | 0 (0.0%) | 0.0 |
| College or Associate's Degree | 0 (0.0%) | 0.0 |
| Bachelor's Degree | 0 (0.0%) | 0.0 |
| Graduate Degree | 0 (0.0%) | 0.0 |
| Total | 0 (0.0%) | 0.0 |
Fertility by Education by Marriage Status in Southern Ute
| Educational Attainment | Married | Unmarried |
| Less than High School | 0 (0.0%) | 0 (0.0%) |
| High School Diploma | 0 (0.0%) | 0 (0.0%) |
| College or Associate's Degree | 0 (0.0%) | 0 (0.0%) |
| Bachelor's Degree | 0 (0.0%) | 0 (0.0%) |
| Graduate Degree | 0 (0.0%) | 0 (0.0%) |
| Total | 0 (0.0%) | 0 (0.0%) |
Employment Characteristics in Southern Ute
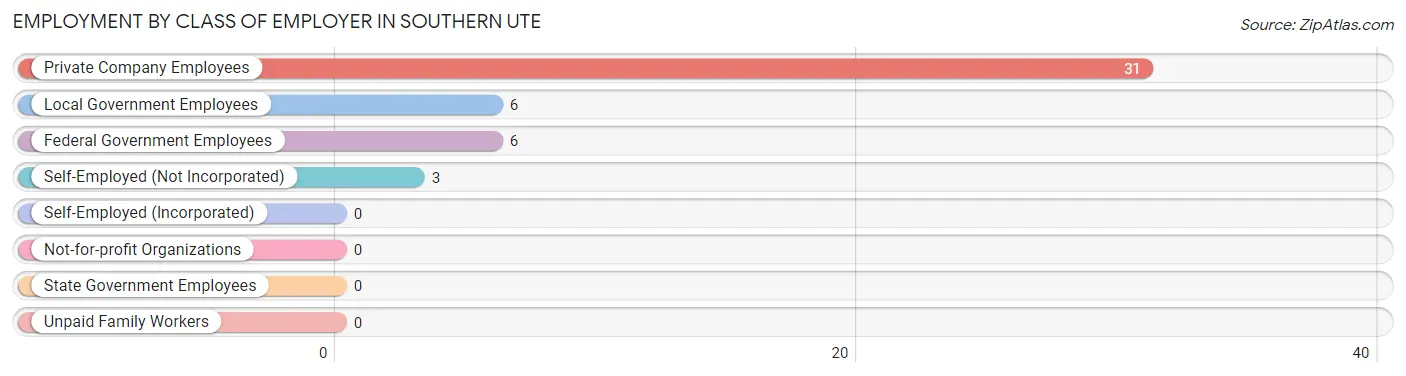
Employment by Class of Employer in Southern Ute
Among the 46 employed individuals in Southern Ute, private company employees (31 | 67.4%), local government employees (6 | 13.0%), and federal government employees (6 | 13.0%) make up the most common classes of employment.
| Employer Class | # Employees | % Employees |
| Private Company Employees | 31 | 67.4% |
| Self-Employed (Incorporated) | 0 | 0.0% |
| Self-Employed (Not Incorporated) | 3 | 6.5% |
| Not-for-profit Organizations | 0 | 0.0% |
| Local Government Employees | 6 | 13.0% |
| State Government Employees | 0 | 0.0% |
| Federal Government Employees | 6 | 13.0% |
| Unpaid Family Workers | 0 | 0.0% |
| Total | 46 | 100.0% |
Employment Status by Age in Southern Ute
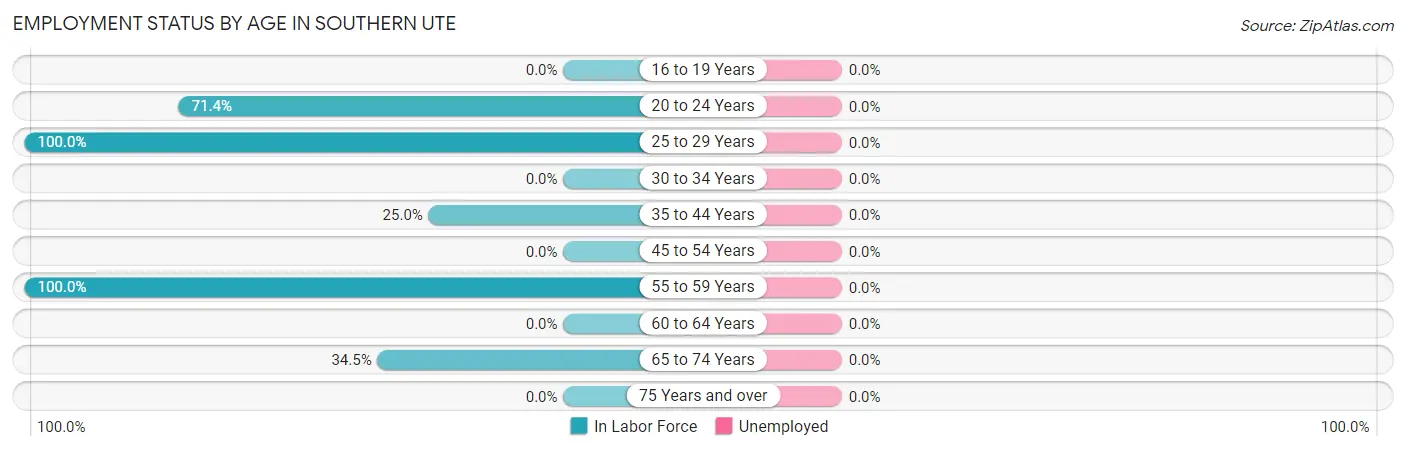
| Age Bracket | In Labor Force | Unemployed |
| 16 to 19 Years | 0 (0.0%) | 0 (0.0%) |
| 20 to 24 Years | 20 (71.4%) | 0 (0.0%) |
| 25 to 29 Years | 6 (100.0%) | 0 (0.0%) |
| 30 to 34 Years | 0 (0.0%) | 0 (0.0%) |
| 35 to 44 Years | 4 (25.0%) | 0 (0.0%) |
| 45 to 54 Years | 0 (0.0%) | 0 (0.0%) |
| 55 to 59 Years | 6 (100.0%) | 0 (0.0%) |
| 60 to 64 Years | 0 (0.0%) | 0 (0.0%) |
| 65 to 74 Years | 10 (34.5%) | 0 (0.0%) |
| 75 Years and over | 0 (0.0%) | 0 (0.0%) |
| Total | 46 (38.0%) | 0 (0.0%) |
Employment Status by Educational Attainment in Southern Ute
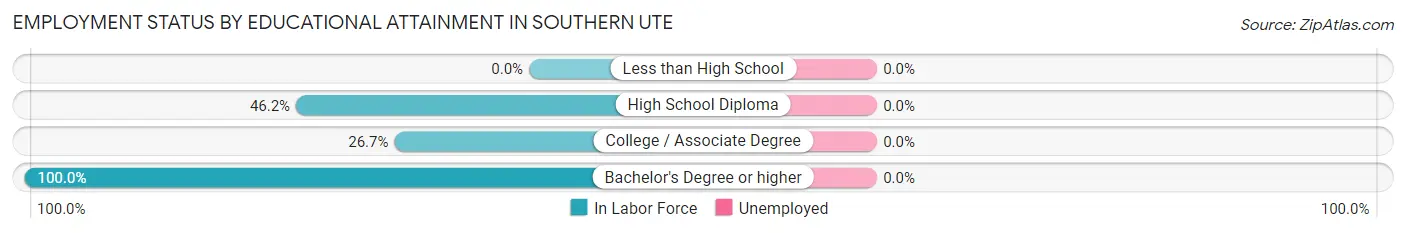
| Educational Attainment | In Labor Force | Unemployed |
| Less than High School | 0 (0.0%) | 0 (0.0%) |
| High School Diploma | 6 (46.2%) | 0 (0.0%) |
| College / Associate Degree | 4 (26.7%) | 0 (0.0%) |
| Bachelor's Degree or higher | 6 (100.0%) | 0 (0.0%) |
| Total | 16 (35.6%) | 0 (0.0%) |
Employment Occupations by Sex in Southern Ute
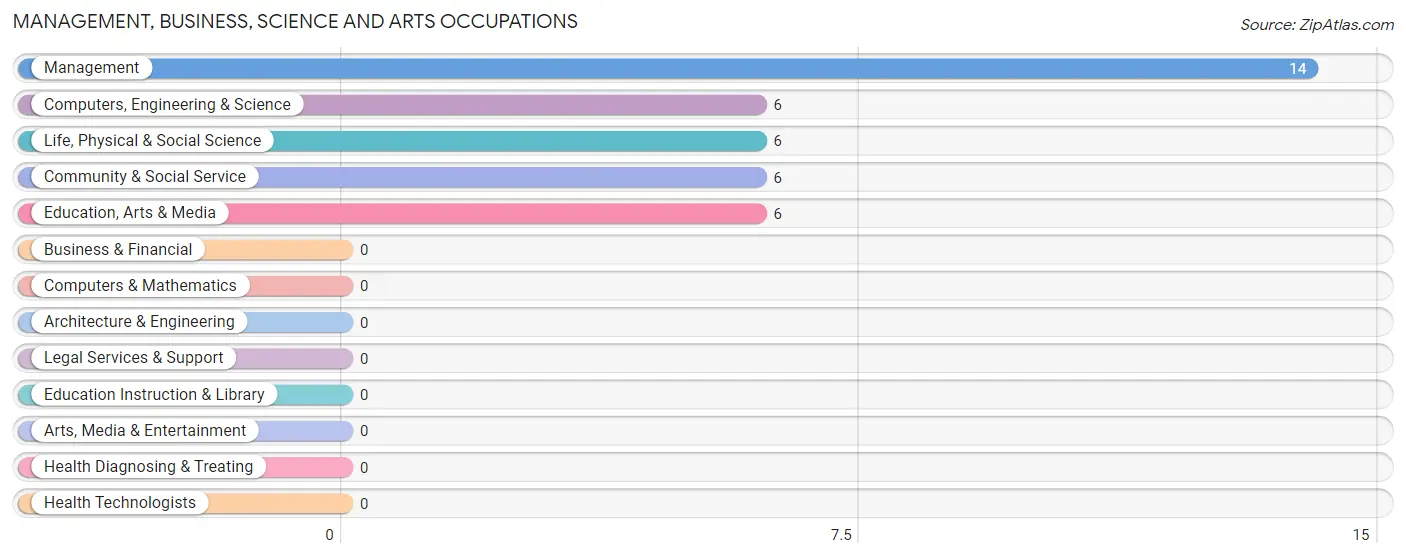
Management, Business, Science and Arts Occupations
The most common Management, Business, Science and Arts occupations in Southern Ute are Management (14 | 30.4%), Computers, Engineering & Science (6 | 13.0%), Life, Physical & Social Science (6 | 13.0%), Community & Social Service (6 | 13.0%), and Education, Arts & Media (6 | 13.0%).
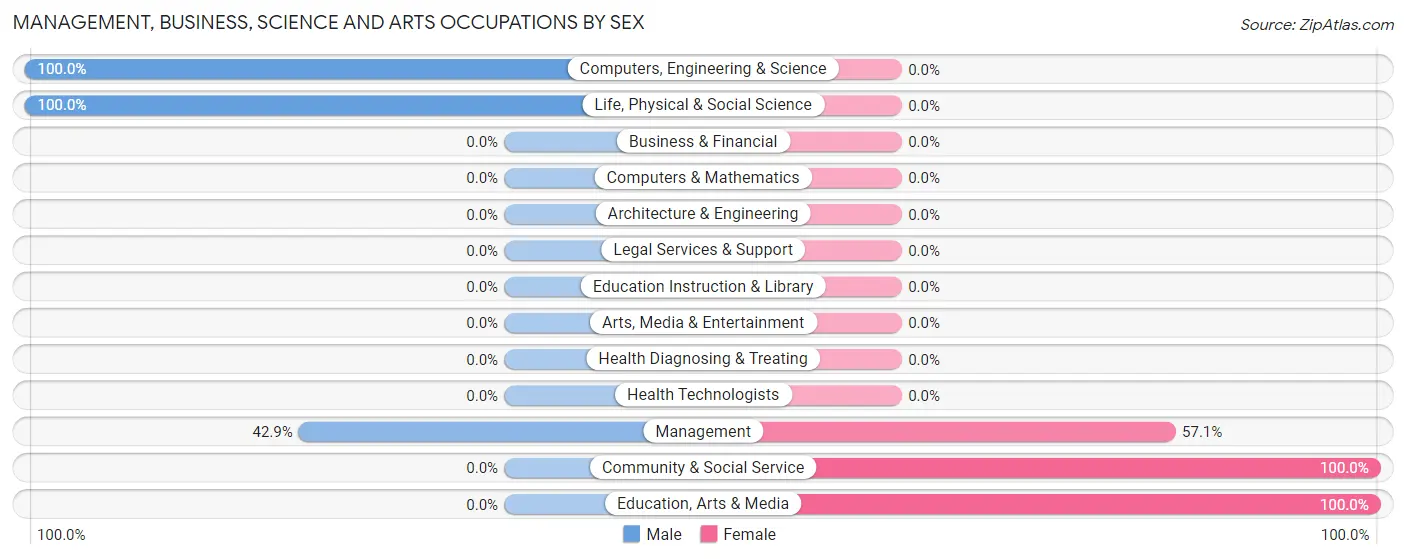
Management, Business, Science and Arts Occupations by Sex
Within the Management, Business, Science and Arts occupations in Southern Ute, the most male-oriented occupations are Computers, Engineering & Science (100.0%), Life, Physical & Social Science (100.0%), and Management (42.9%), while the most female-oriented occupations are Community & Social Service (100.0%), Education, Arts & Media (100.0%), and Management (57.1%).
| Occupation | Male | Female |
| Management | 6 (42.9%) | 8 (57.1%) |
| Business & Financial | 0 (0.0%) | 0 (0.0%) |
| Computers, Engineering & Science | 6 (100.0%) | 0 (0.0%) |
| Computers & Mathematics | 0 (0.0%) | 0 (0.0%) |
| Architecture & Engineering | 0 (0.0%) | 0 (0.0%) |
| Life, Physical & Social Science | 6 (100.0%) | 0 (0.0%) |
| Community & Social Service | 0 (0.0%) | 6 (100.0%) |
| Education, Arts & Media | 0 (0.0%) | 6 (100.0%) |
| Legal Services & Support | 0 (0.0%) | 0 (0.0%) |
| Education Instruction & Library | 0 (0.0%) | 0 (0.0%) |
| Arts, Media & Entertainment | 0 (0.0%) | 0 (0.0%) |
| Health Diagnosing & Treating | 0 (0.0%) | 0 (0.0%) |
| Health Technologists | 0 (0.0%) | 0 (0.0%) |
| Total (Category) | 12 (46.2%) | 14 (53.8%) |
| Total (Overall) | 20 (43.5%) | 26 (56.5%) |
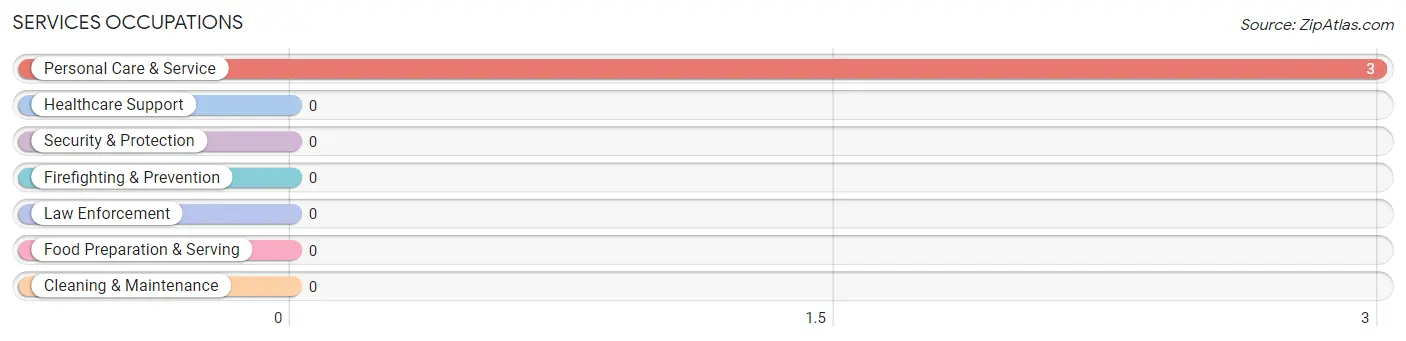
Services Occupations
The most common Services occupations in Southern Ute are , and Personal Care & Service (3 | 6.5%).
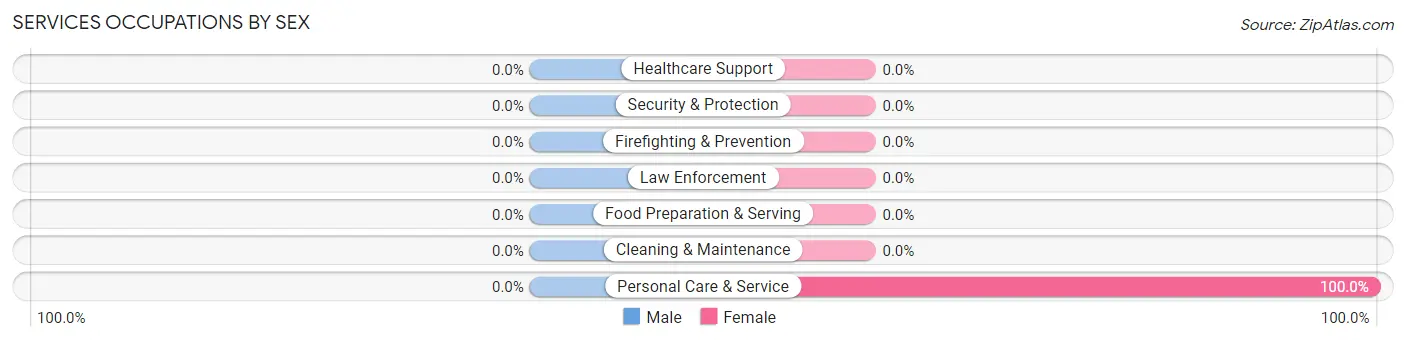
Services Occupations by Sex
| Occupation | Male | Female |
| Healthcare Support | 0 (0.0%) | 0 (0.0%) |
| Security & Protection | 0 (0.0%) | 0 (0.0%) |
| Firefighting & Prevention | 0 (0.0%) | 0 (0.0%) |
| Law Enforcement | 0 (0.0%) | 0 (0.0%) |
| Food Preparation & Serving | 0 (0.0%) | 0 (0.0%) |
| Cleaning & Maintenance | 0 (0.0%) | 0 (0.0%) |
| Personal Care & Service | 0 (0.0%) | 3 (100.0%) |
| Total (Category) | 0 (0.0%) | 3 (100.0%) |
| Total (Overall) | 20 (43.5%) | 26 (56.5%) |
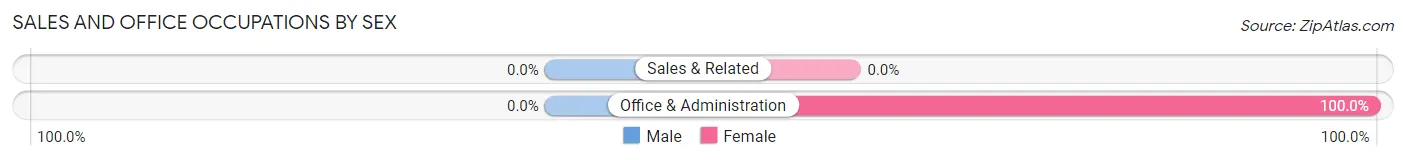
Sales and Office Occupations
The most common Sales and Office occupations in Southern Ute are , and Office & Administration (3 | 6.5%).
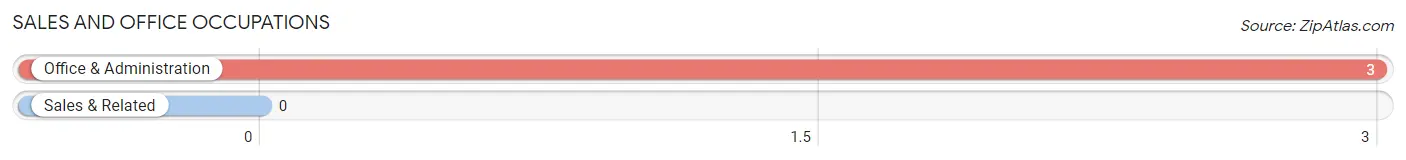
Sales and Office Occupations by Sex
| Occupation | Male | Female |
| Sales & Related | 0 (0.0%) | 0 (0.0%) |
| Office & Administration | 0 (0.0%) | 3 (100.0%) |
| Total (Category) | 0 (0.0%) | 3 (100.0%) |
| Total (Overall) | 20 (43.5%) | 26 (56.5%) |
Natural Resources, Construction and Maintenance Occupations
The most common Natural Resources, Construction and Maintenance occupations in Southern Ute are Farming, Fishing & Forestry (10 | 21.7%), and Construction & Extraction (4 | 8.7%).
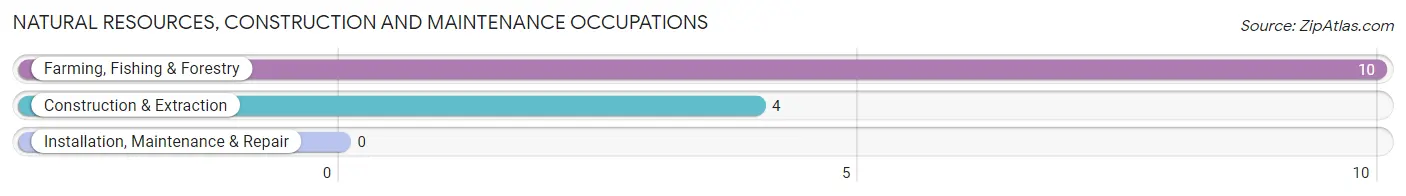
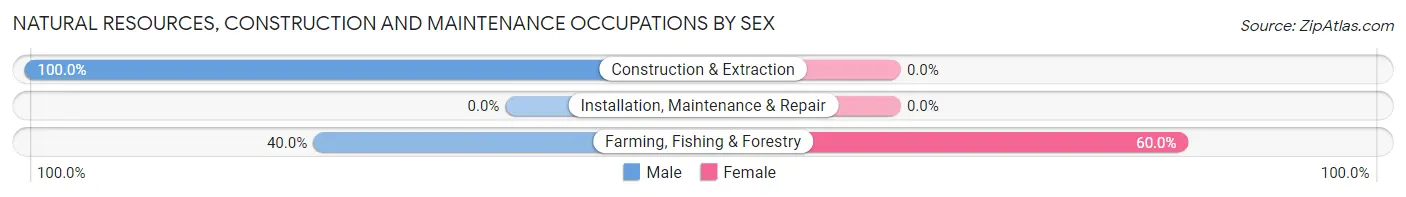
Natural Resources, Construction and Maintenance Occupations by Sex
| Occupation | Male | Female |
| Farming, Fishing & Forestry | 4 (40.0%) | 6 (60.0%) |
| Construction & Extraction | 4 (100.0%) | 0 (0.0%) |
| Installation, Maintenance & Repair | 0 (0.0%) | 0 (0.0%) |
| Total (Category) | 8 (57.1%) | 6 (42.9%) |
| Total (Overall) | 20 (43.5%) | 26 (56.5%) |
Production, Transportation and Moving Occupations
Production, Transportation and Moving Occupations by Sex
| Occupation | Male | Female |
| Production | 0 (0.0%) | 0 (0.0%) |
| Transportation | 0 (0.0%) | 0 (0.0%) |
| Material Moving | 0 (0.0%) | 0 (0.0%) |
| Total (Category) | 0 (0.0%) | 0 (0.0%) |
| Total (Overall) | 20 (43.5%) | 26 (56.5%) |
Employment Industries by Sex in Southern Ute
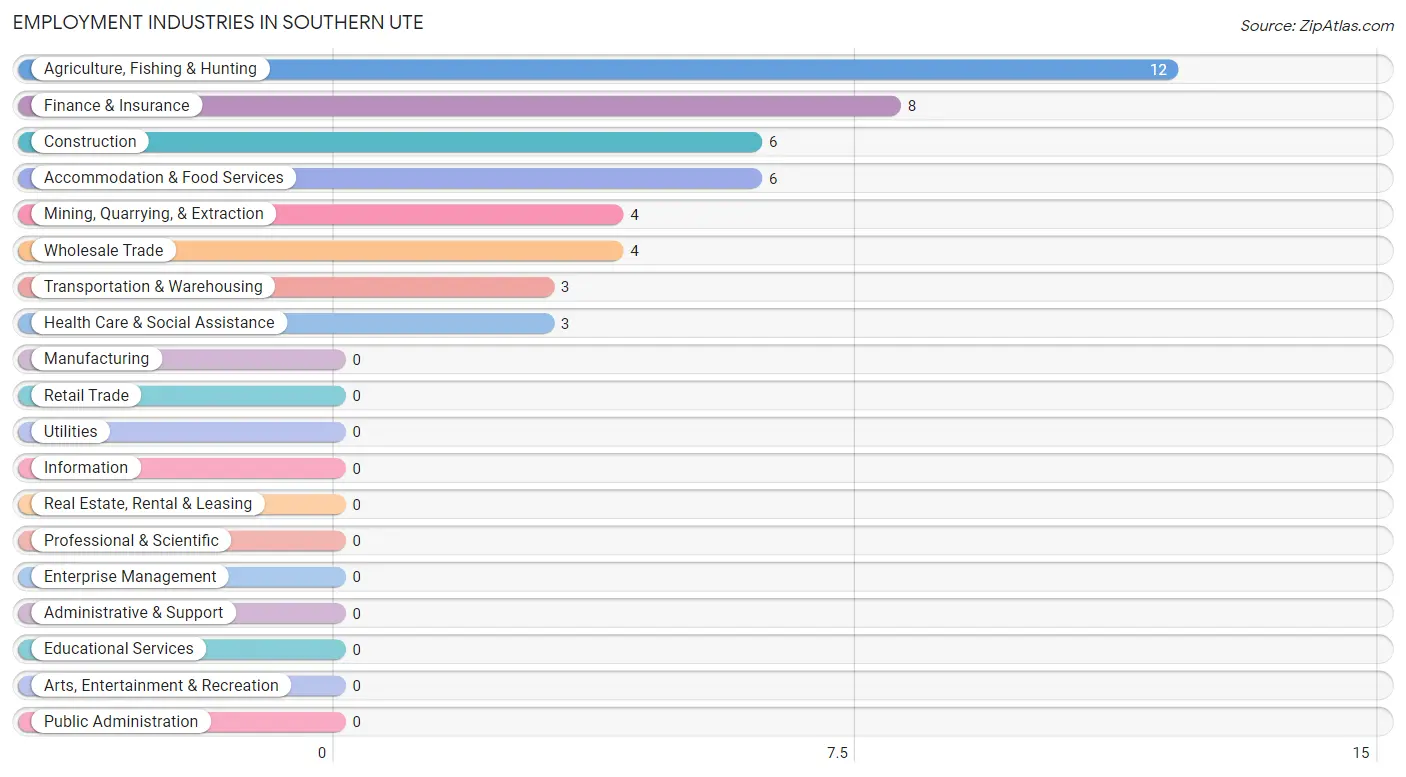
Employment Industries in Southern Ute
The major employment industries in Southern Ute include Agriculture, Fishing & Hunting (12 | 26.1%), Finance & Insurance (8 | 17.4%), Construction (6 | 13.0%), Accommodation & Food Services (6 | 13.0%), and Mining, Quarrying, & Extraction (4 | 8.7%).
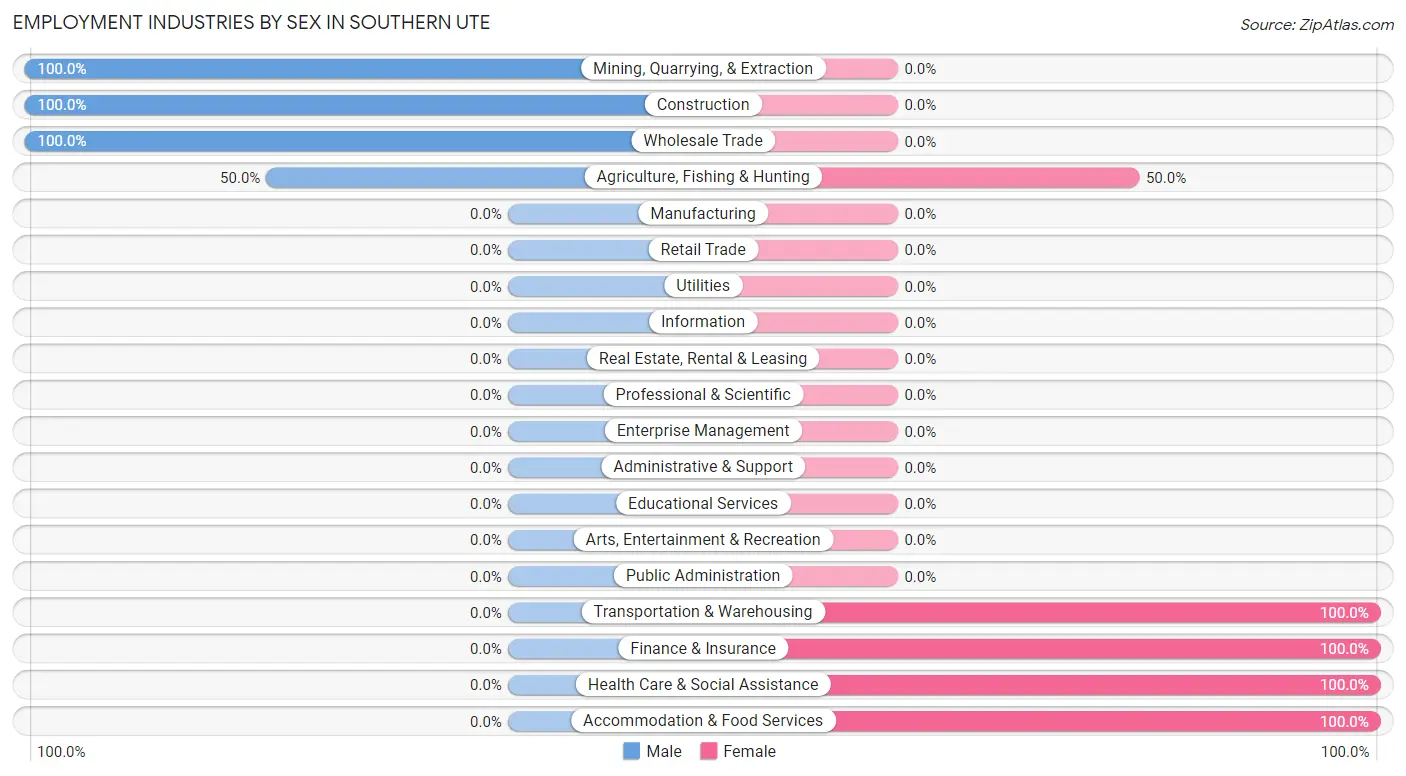
Employment Industries by Sex in Southern Ute
The Southern Ute industries that see more men than women are Mining, Quarrying, & Extraction (100.0%), Construction (100.0%), and Wholesale Trade (100.0%), whereas the industries that tend to have a higher number of women are Transportation & Warehousing (100.0%), Finance & Insurance (100.0%), and Health Care & Social Assistance (100.0%).
| Industry | Male | Female |
| Agriculture, Fishing & Hunting | 6 (50.0%) | 6 (50.0%) |
| Mining, Quarrying, & Extraction | 4 (100.0%) | 0 (0.0%) |
| Construction | 6 (100.0%) | 0 (0.0%) |
| Manufacturing | 0 (0.0%) | 0 (0.0%) |
| Wholesale Trade | 4 (100.0%) | 0 (0.0%) |
| Retail Trade | 0 (0.0%) | 0 (0.0%) |
| Transportation & Warehousing | 0 (0.0%) | 3 (100.0%) |
| Utilities | 0 (0.0%) | 0 (0.0%) |
| Information | 0 (0.0%) | 0 (0.0%) |
| Finance & Insurance | 0 (0.0%) | 8 (100.0%) |
| Real Estate, Rental & Leasing | 0 (0.0%) | 0 (0.0%) |
| Professional & Scientific | 0 (0.0%) | 0 (0.0%) |
| Enterprise Management | 0 (0.0%) | 0 (0.0%) |
| Administrative & Support | 0 (0.0%) | 0 (0.0%) |
| Educational Services | 0 (0.0%) | 0 (0.0%) |
| Health Care & Social Assistance | 0 (0.0%) | 3 (100.0%) |
| Arts, Entertainment & Recreation | 0 (0.0%) | 0 (0.0%) |
| Accommodation & Food Services | 0 (0.0%) | 6 (100.0%) |
| Public Administration | 0 (0.0%) | 0 (0.0%) |
| Total | 20 (43.5%) | 26 (56.5%) |
Education in Southern Ute
School Enrollment in Southern Ute
The most common levels of schooling among the 18 students in Southern Ute are middle school (12 | 66.7%), and high school (6 | 33.3%).
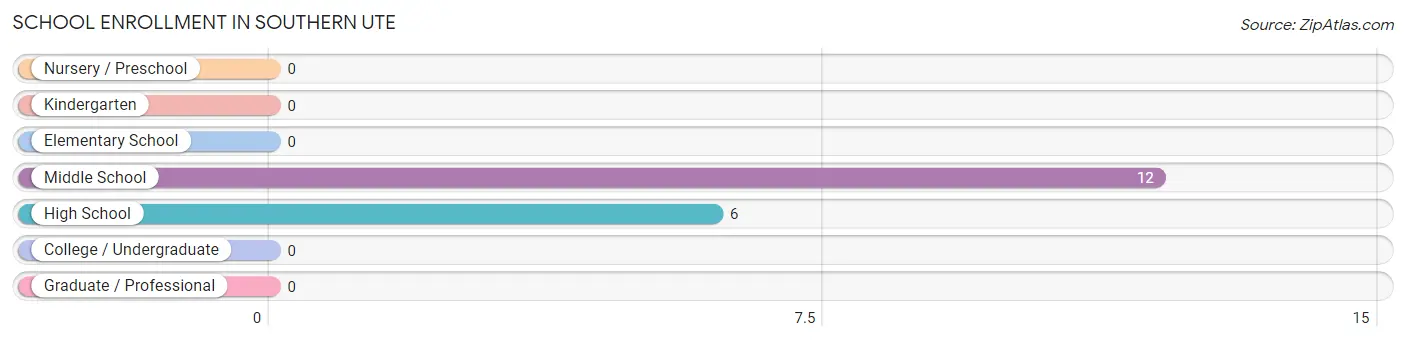
| School Level | # Students | % Students |
| Nursery / Preschool | 0 | 0.0% |
| Kindergarten | 0 | 0.0% |
| Elementary School | 0 | 0.0% |
| Middle School | 12 | 66.7% |
| High School | 6 | 33.3% |
| College / Undergraduate | 0 | 0.0% |
| Graduate / Professional | 0 | 0.0% |
| Total | 18 | 100.0% |
School Enrollment by Age by Funding Source in Southern Ute
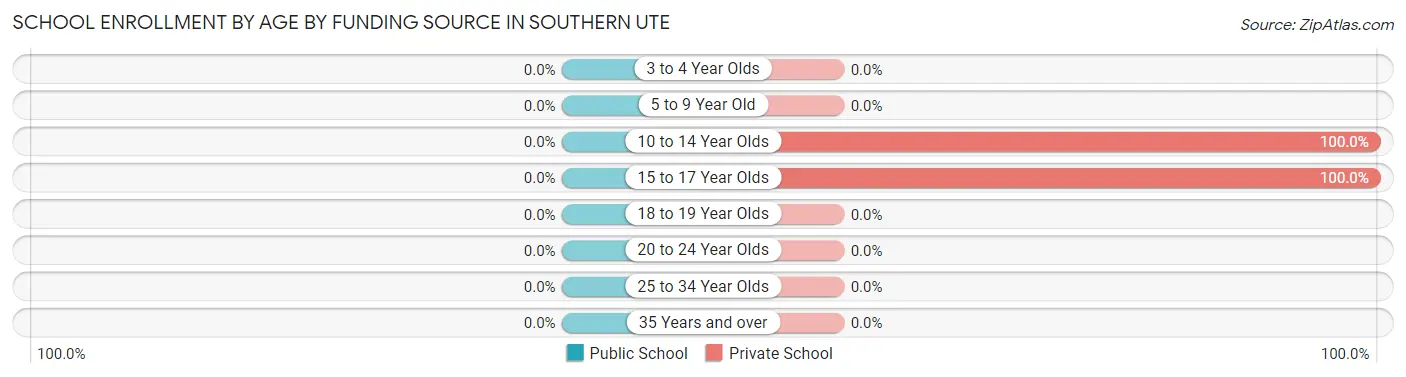
| Age Bracket | Public School | Private School |
| 3 to 4 Year Olds | 0 (0.0%) | 0 (0.0%) |
| 5 to 9 Year Old | 0 (0.0%) | 0 (0.0%) |
| 10 to 14 Year Olds | 0 (0.0%) | 12 (100.0%) |
| 15 to 17 Year Olds | 0 (0.0%) | 6 (100.0%) |
| 18 to 19 Year Olds | 0 (0.0%) | 0 (0.0%) |
| 20 to 24 Year Olds | 0 (0.0%) | 0 (0.0%) |
| 25 to 34 Year Olds | 0 (0.0%) | 0 (0.0%) |
| 35 Years and over | 0 (0.0%) | 0 (0.0%) |
| Total | 0 (0.0%) | 18 (100.0%) |
Educational Attainment by Field of Study in Southern Ute
Education (10 | 62.5%), and engineering (6 | 37.5%) are the most common fields of study among 16 individuals in Southern Ute who have obtained a bachelor's degree or higher.
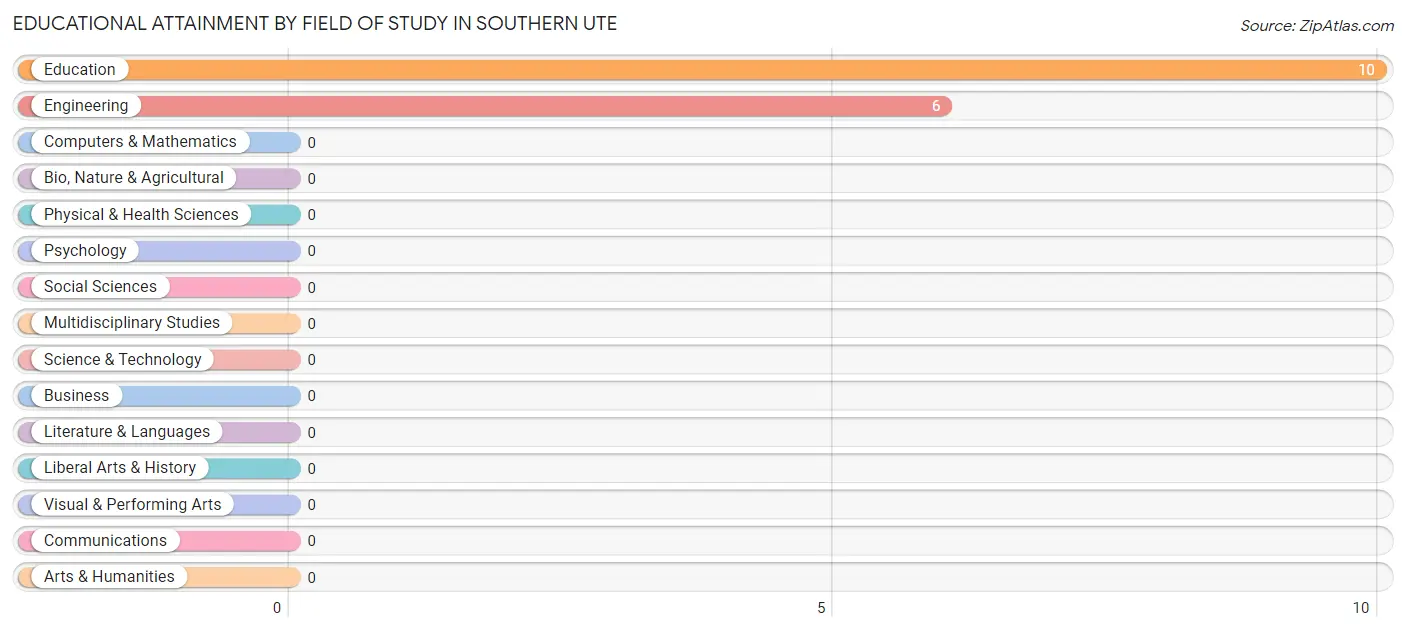
| Field of Study | # Graduates | % Graduates |
| Computers & Mathematics | 0 | 0.0% |
| Bio, Nature & Agricultural | 0 | 0.0% |
| Physical & Health Sciences | 0 | 0.0% |
| Psychology | 0 | 0.0% |
| Social Sciences | 0 | 0.0% |
| Engineering | 6 | 37.5% |
| Multidisciplinary Studies | 0 | 0.0% |
| Science & Technology | 0 | 0.0% |
| Business | 0 | 0.0% |
| Education | 10 | 62.5% |
| Literature & Languages | 0 | 0.0% |
| Liberal Arts & History | 0 | 0.0% |
| Visual & Performing Arts | 0 | 0.0% |
| Communications | 0 | 0.0% |
| Arts & Humanities | 0 | 0.0% |
| Total | 16 | 100.0% |
Transportation & Commute in Southern Ute
Vehicle Availability by Sex in Southern Ute
The most prevalent vehicle ownership categories in Southern Ute are males with 2 vehicles (10, accounting for 50.0%) and females with 2 vehicles (17, making up 38.5%).
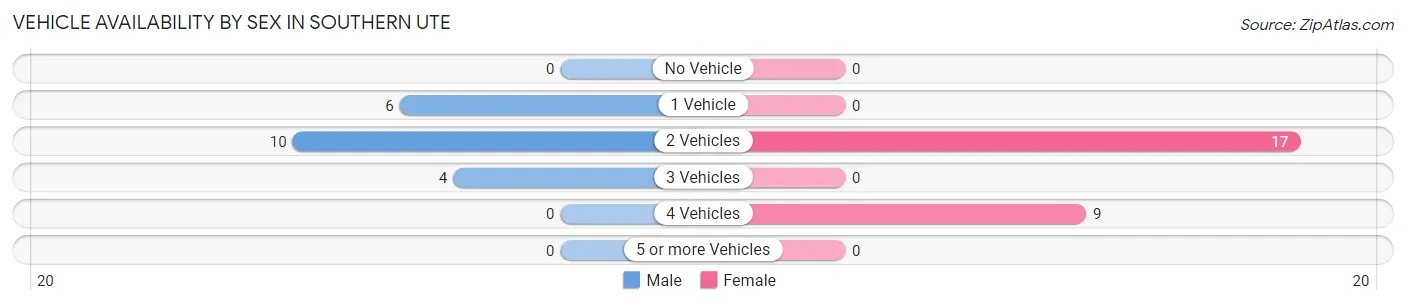
| Vehicles Available | Male | Female |
| No Vehicle | 0 (0.0%) | 0 (0.0%) |
| 1 Vehicle | 6 (30.0%) | 0 (0.0%) |
| 2 Vehicles | 10 (50.0%) | 17 (65.4%) |
| 3 Vehicles | 4 (20.0%) | 0 (0.0%) |
| 4 Vehicles | 0 (0.0%) | 9 (34.6%) |
| 5 or more Vehicles | 0 (0.0%) | 0 (0.0%) |
| Total | 20 (100.0%) | 26 (100.0%) |
Commute Time in Southern Ute
The most frequently occuring commute durations in Southern Ute are 20 to 24 minutes (14 commuters, 42.4%), 25 to 29 minutes (6 commuters, 18.2%), and 30 to 34 minutes (6 commuters, 18.2%).
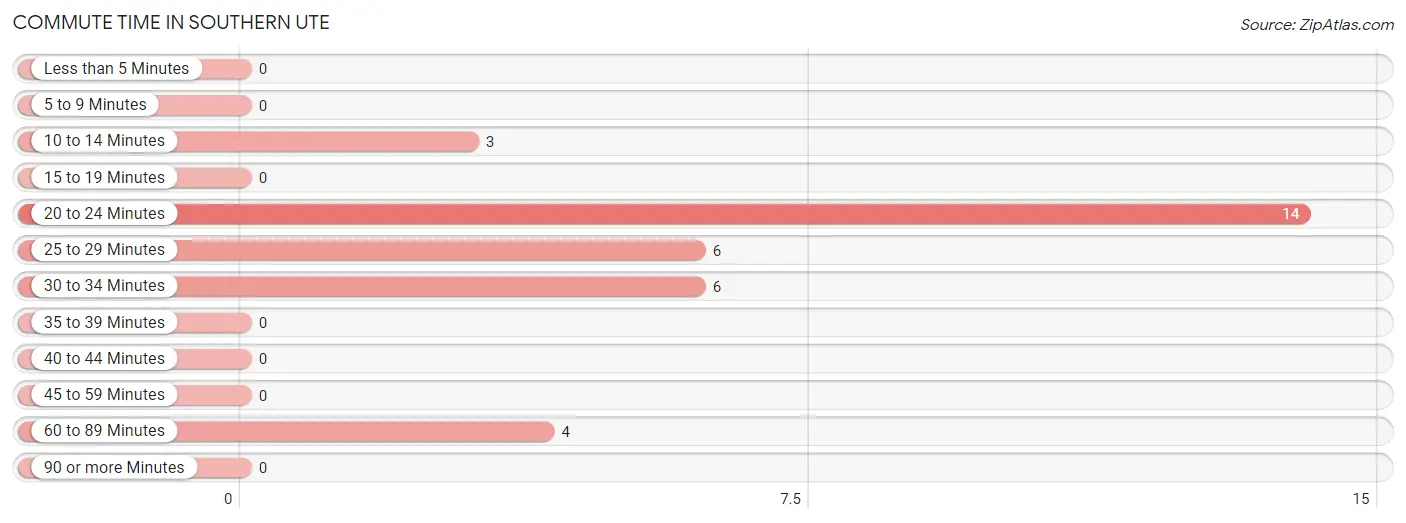
| Commute Time | # Commuters | % Commuters |
| Less than 5 Minutes | 0 | 0.0% |
| 5 to 9 Minutes | 0 | 0.0% |
| 10 to 14 Minutes | 3 | 9.1% |
| 15 to 19 Minutes | 0 | 0.0% |
| 20 to 24 Minutes | 14 | 42.4% |
| 25 to 29 Minutes | 6 | 18.2% |
| 30 to 34 Minutes | 6 | 18.2% |
| 35 to 39 Minutes | 0 | 0.0% |
| 40 to 44 Minutes | 0 | 0.0% |
| 45 to 59 Minutes | 0 | 0.0% |
| 60 to 89 Minutes | 4 | 12.1% |
| 90 or more Minutes | 0 | 0.0% |
Commute Time by Sex in Southern Ute
The most common commute times in Southern Ute are 25 to 29 minutes (6 commuters, 60.0%) for males and 20 to 24 minutes (14 commuters, 60.9%) for females.
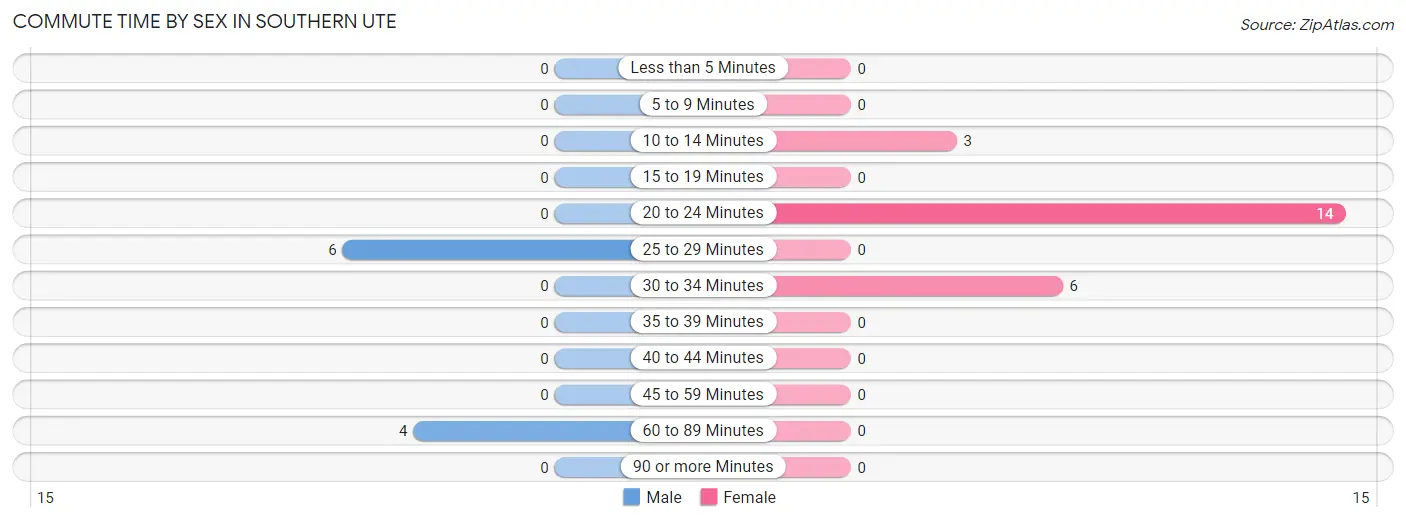
| Commute Time | Male | Female |
| Less than 5 Minutes | 0 (0.0%) | 0 (0.0%) |
| 5 to 9 Minutes | 0 (0.0%) | 0 (0.0%) |
| 10 to 14 Minutes | 0 (0.0%) | 3 (13.0%) |
| 15 to 19 Minutes | 0 (0.0%) | 0 (0.0%) |
| 20 to 24 Minutes | 0 (0.0%) | 14 (60.9%) |
| 25 to 29 Minutes | 6 (60.0%) | 0 (0.0%) |
| 30 to 34 Minutes | 0 (0.0%) | 6 (26.1%) |
| 35 to 39 Minutes | 0 (0.0%) | 0 (0.0%) |
| 40 to 44 Minutes | 0 (0.0%) | 0 (0.0%) |
| 45 to 59 Minutes | 0 (0.0%) | 0 (0.0%) |
| 60 to 89 Minutes | 4 (40.0%) | 0 (0.0%) |
| 90 or more Minutes | 0 (0.0%) | 0 (0.0%) |
Time of Departure to Work by Sex in Southern Ute
The most frequent times of departure to work in Southern Ute are 6:00 AM to 6:29 AM (10, 100.0%) for males and 7:30 AM to 7:59 AM (14, 60.9%) for females.
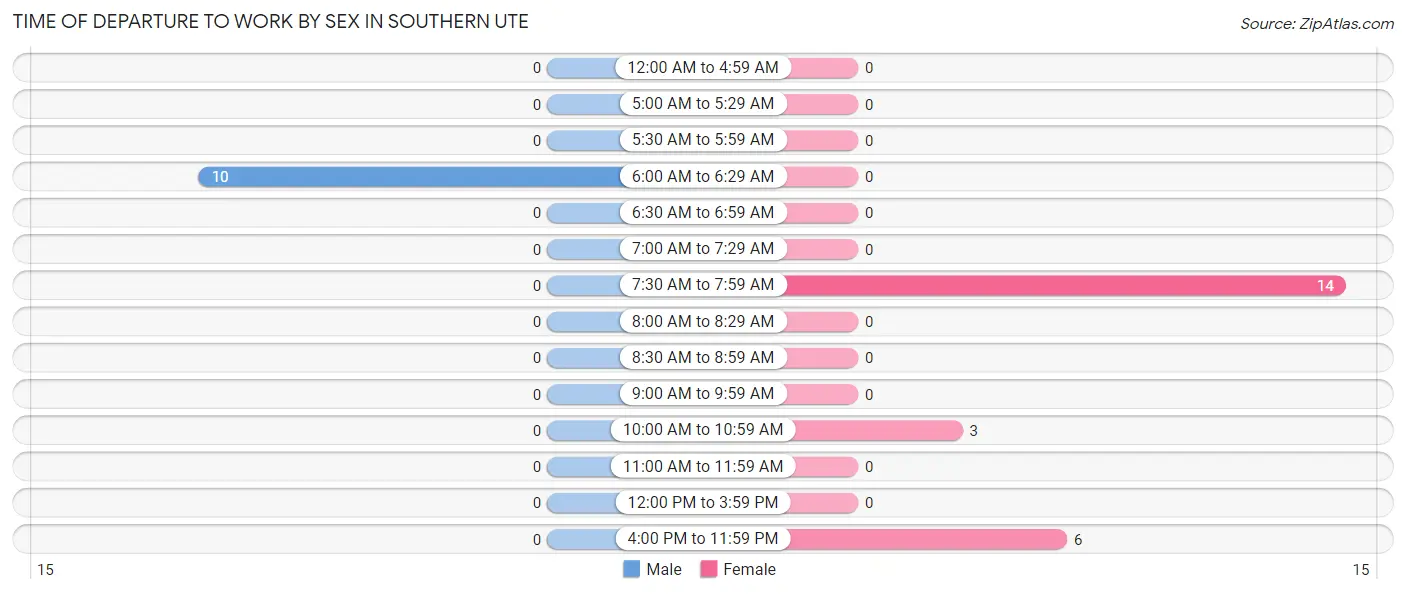
| Time of Departure | Male | Female |
| 12:00 AM to 4:59 AM | 0 (0.0%) | 0 (0.0%) |
| 5:00 AM to 5:29 AM | 0 (0.0%) | 0 (0.0%) |
| 5:30 AM to 5:59 AM | 0 (0.0%) | 0 (0.0%) |
| 6:00 AM to 6:29 AM | 10 (100.0%) | 0 (0.0%) |
| 6:30 AM to 6:59 AM | 0 (0.0%) | 0 (0.0%) |
| 7:00 AM to 7:29 AM | 0 (0.0%) | 0 (0.0%) |
| 7:30 AM to 7:59 AM | 0 (0.0%) | 14 (60.9%) |
| 8:00 AM to 8:29 AM | 0 (0.0%) | 0 (0.0%) |
| 8:30 AM to 8:59 AM | 0 (0.0%) | 0 (0.0%) |
| 9:00 AM to 9:59 AM | 0 (0.0%) | 0 (0.0%) |
| 10:00 AM to 10:59 AM | 0 (0.0%) | 3 (13.0%) |
| 11:00 AM to 11:59 AM | 0 (0.0%) | 0 (0.0%) |
| 12:00 PM to 3:59 PM | 0 (0.0%) | 0 (0.0%) |
| 4:00 PM to 11:59 PM | 0 (0.0%) | 6 (26.1%) |
| Total | 10 (100.0%) | 23 (100.0%) |
Housing Occupancy in Southern Ute
Occupancy by Ownership in Southern Ute
Of the total 63 dwellings in Southern Ute, owner-occupied units account for 50 (79.4%), while renter-occupied units make up 13 (20.6%).
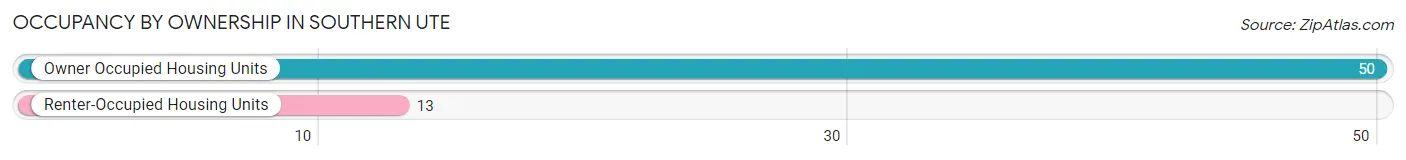
| Occupancy | # Housing Units | % Housing Units |
| Owner Occupied Housing Units | 50 | 79.4% |
| Renter-Occupied Housing Units | 13 | 20.6% |
| Total Occupied Housing Units | 63 | 100.0% |
Occupancy by Household Size in Southern Ute
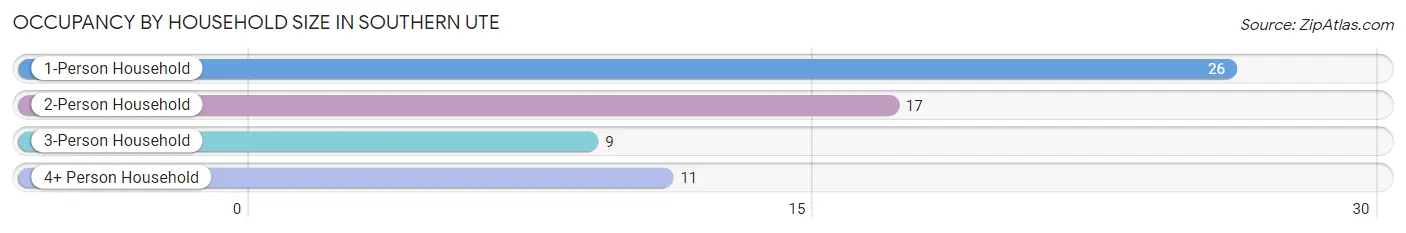
| Household Size | # Housing Units | % Housing Units |
| 1-Person Household | 26 | 41.3% |
| 2-Person Household | 17 | 27.0% |
| 3-Person Household | 9 | 14.3% |
| 4+ Person Household | 11 | 17.5% |
| Total Housing Units | 63 | 100.0% |
Occupancy by Ownership by Household Size in Southern Ute
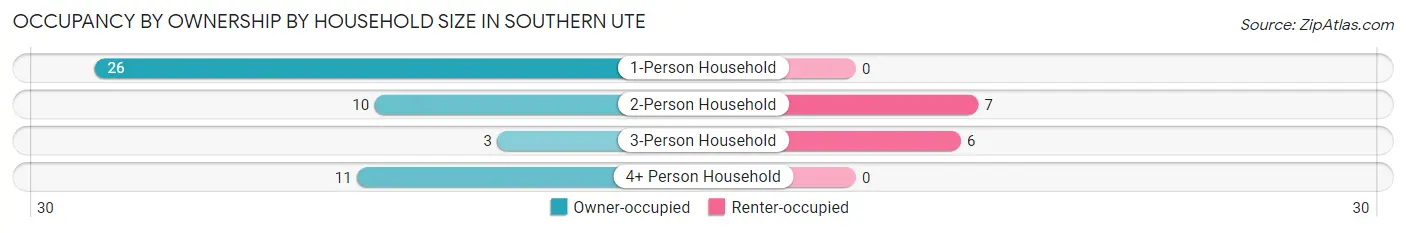
| Household Size | Owner-occupied | Renter-occupied |
| 1-Person Household | 26 (100.0%) | 0 (0.0%) |
| 2-Person Household | 10 (58.8%) | 7 (41.2%) |
| 3-Person Household | 3 (33.3%) | 6 (66.7%) |
| 4+ Person Household | 11 (100.0%) | 0 (0.0%) |
| Total Housing Units | 50 (79.4%) | 13 (20.6%) |
Occupancy by Educational Attainment in Southern Ute
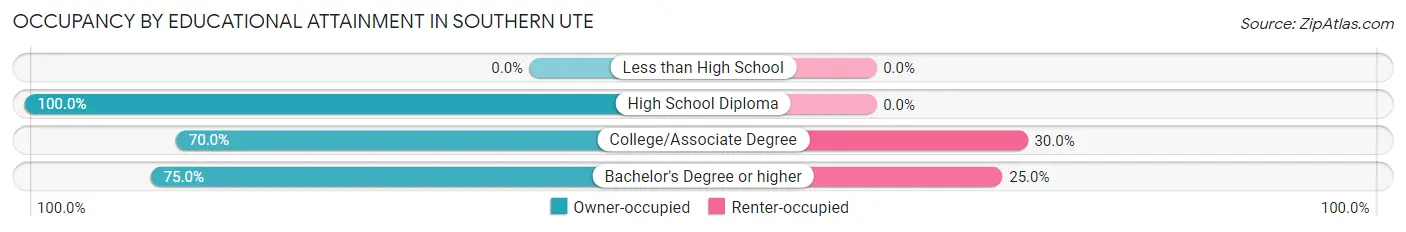
| Household Size | Owner-occupied | Renter-occupied |
| Less than High School | 0 (0.0%) | 0 (0.0%) |
| High School Diploma | 17 (100.0%) | 0 (0.0%) |
| College/Associate Degree | 21 (70.0%) | 9 (30.0%) |
| Bachelor's Degree or higher | 12 (75.0%) | 4 (25.0%) |
Occupancy by Age of Householder in Southern Ute
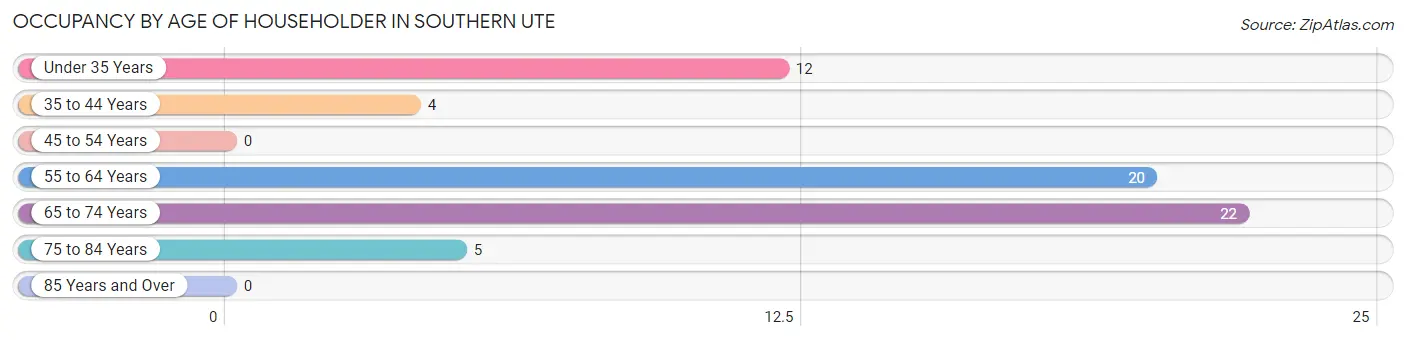
| Age Bracket | # Households | % Households |
| Under 35 Years | 12 | 19.1% |
| 35 to 44 Years | 4 | 6.4% |
| 45 to 54 Years | 0 | 0.0% |
| 55 to 64 Years | 20 | 31.8% |
| 65 to 74 Years | 22 | 34.9% |
| 75 to 84 Years | 5 | 7.9% |
| 85 Years and Over | 0 | 0.0% |
| Total | 63 | 100.0% |
Housing Finances in Southern Ute
Median Income by Occupancy in Southern Ute
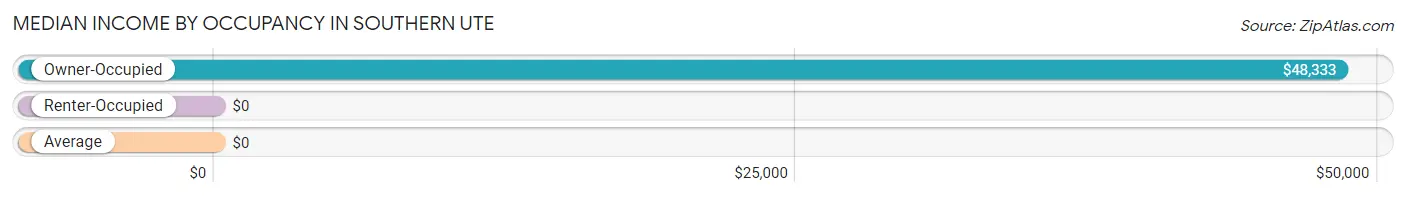
| Occupancy Type | # Households | Median Income |
| Owner-Occupied | 50 (79.4%) | $48,333 |
| Renter-Occupied | 13 (20.6%) | $0 |
| Average | 63 (100.0%) | $0 |
Occupancy by Householder Income Bracket in Southern Ute
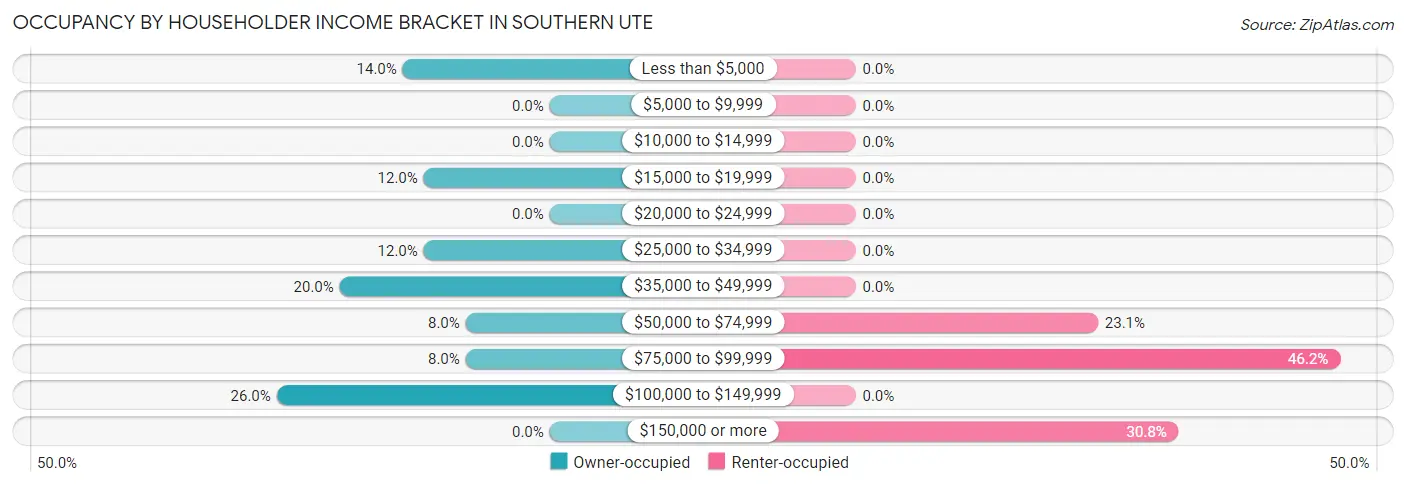
| Income Bracket | Owner-occupied | Renter-occupied |
| Less than $5,000 | 7 (14.0%) | 0 (0.0%) |
| $5,000 to $9,999 | 0 (0.0%) | 0 (0.0%) |
| $10,000 to $14,999 | 0 (0.0%) | 0 (0.0%) |
| $15,000 to $19,999 | 6 (12.0%) | 0 (0.0%) |
| $20,000 to $24,999 | 0 (0.0%) | 0 (0.0%) |
| $25,000 to $34,999 | 6 (12.0%) | 0 (0.0%) |
| $35,000 to $49,999 | 10 (20.0%) | 0 (0.0%) |
| $50,000 to $74,999 | 4 (8.0%) | 3 (23.1%) |
| $75,000 to $99,999 | 4 (8.0%) | 6 (46.2%) |
| $100,000 to $149,999 | 13 (26.0%) | 0 (0.0%) |
| $150,000 or more | 0 (0.0%) | 4 (30.8%) |
| Total | 50 (100.0%) | 13 (100.0%) |
Monthly Housing Cost Tiers in Southern Ute
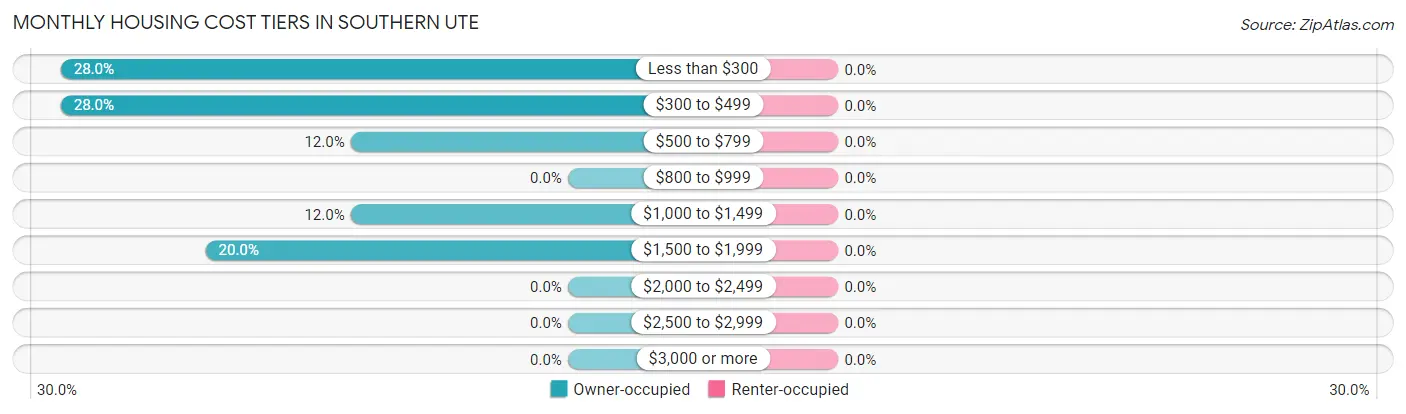
| Monthly Cost | Owner-occupied | Renter-occupied |
| Less than $300 | 14 (28.0%) | 0 (0.0%) |
| $300 to $499 | 14 (28.0%) | 0 (0.0%) |
| $500 to $799 | 6 (12.0%) | 0 (0.0%) |
| $800 to $999 | 0 (0.0%) | 0 (0.0%) |
| $1,000 to $1,499 | 6 (12.0%) | 0 (0.0%) |
| $1,500 to $1,999 | 10 (20.0%) | 0 (0.0%) |
| $2,000 to $2,499 | 0 (0.0%) | 0 (0.0%) |
| $2,500 to $2,999 | 0 (0.0%) | 0 (0.0%) |
| $3,000 or more | 0 (0.0%) | 0 (0.0%) |
| Total | 50 (100.0%) | 13 (100.0%) |
Physical Housing Characteristics in Southern Ute
Housing Structures in Southern Ute
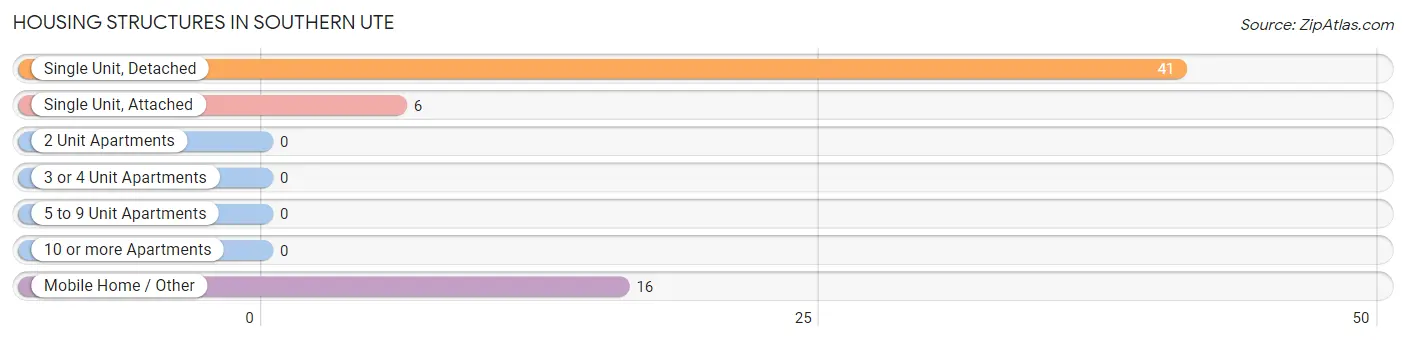
| Structure Type | # Housing Units | % Housing Units |
| Single Unit, Detached | 41 | 65.1% |
| Single Unit, Attached | 6 | 9.5% |
| 2 Unit Apartments | 0 | 0.0% |
| 3 or 4 Unit Apartments | 0 | 0.0% |
| 5 to 9 Unit Apartments | 0 | 0.0% |
| 10 or more Apartments | 0 | 0.0% |
| Mobile Home / Other | 16 | 25.4% |
| Total | 63 | 100.0% |
Housing Structures by Occupancy in Southern Ute
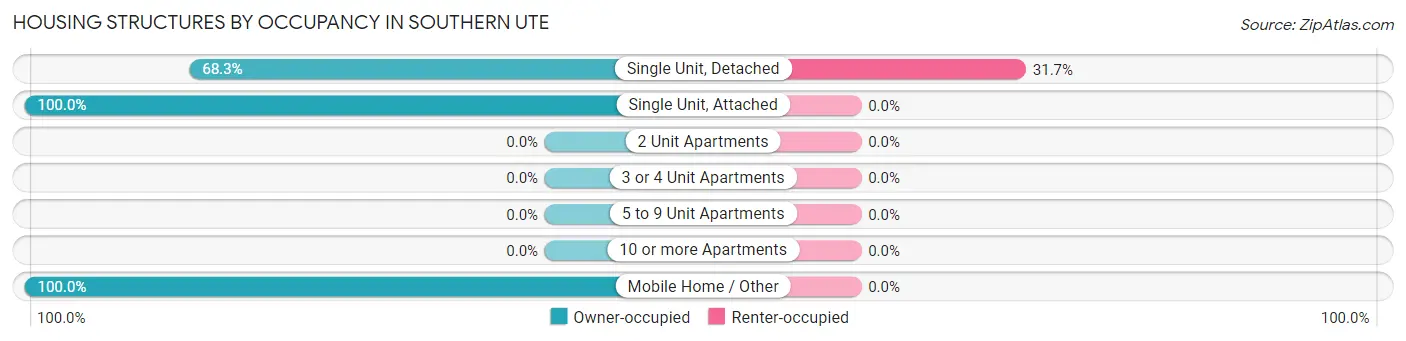
| Structure Type | Owner-occupied | Renter-occupied |
| Single Unit, Detached | 28 (68.3%) | 13 (31.7%) |
| Single Unit, Attached | 6 (100.0%) | 0 (0.0%) |
| 2 Unit Apartments | 0 (0.0%) | 0 (0.0%) |
| 3 or 4 Unit Apartments | 0 (0.0%) | 0 (0.0%) |
| 5 to 9 Unit Apartments | 0 (0.0%) | 0 (0.0%) |
| 10 or more Apartments | 0 (0.0%) | 0 (0.0%) |
| Mobile Home / Other | 16 (100.0%) | 0 (0.0%) |
| Total | 50 (79.4%) | 13 (20.6%) |
Housing Structures by Number of Rooms in Southern Ute
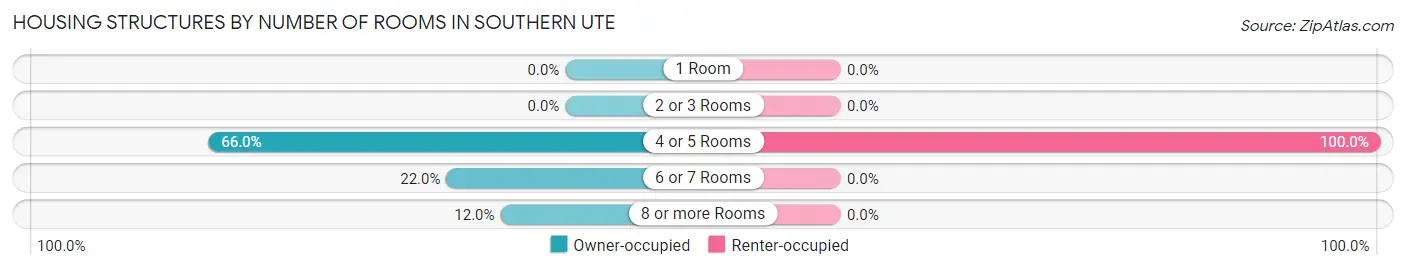
| Number of Rooms | Owner-occupied | Renter-occupied |
| 1 Room | 0 (0.0%) | 0 (0.0%) |
| 2 or 3 Rooms | 0 (0.0%) | 0 (0.0%) |
| 4 or 5 Rooms | 33 (66.0%) | 13 (100.0%) |
| 6 or 7 Rooms | 11 (22.0%) | 0 (0.0%) |
| 8 or more Rooms | 6 (12.0%) | 0 (0.0%) |
| Total | 50 (100.0%) | 13 (100.0%) |
Housing Structure by Heating Type in Southern Ute
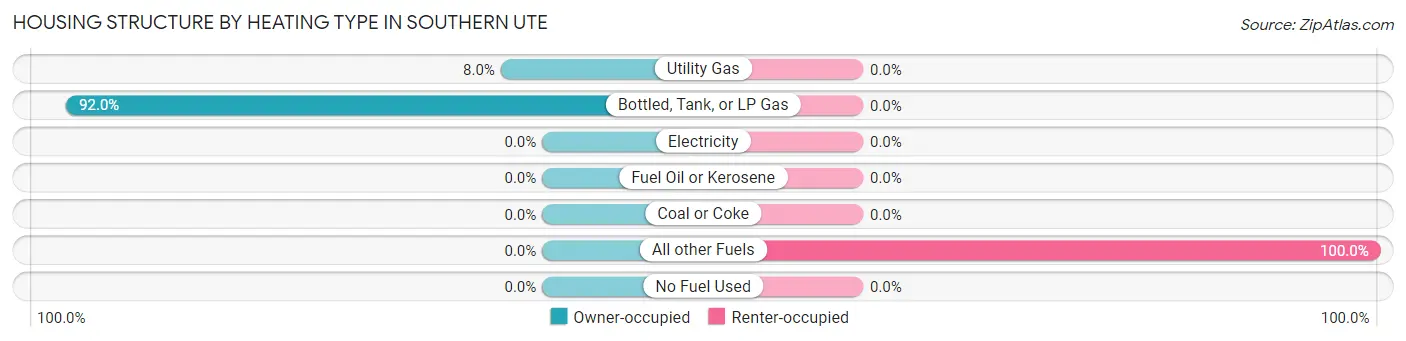
| Heating Type | Owner-occupied | Renter-occupied |
| Utility Gas | 4 (8.0%) | 0 (0.0%) |
| Bottled, Tank, or LP Gas | 46 (92.0%) | 0 (0.0%) |
| Electricity | 0 (0.0%) | 0 (0.0%) |
| Fuel Oil or Kerosene | 0 (0.0%) | 0 (0.0%) |
| Coal or Coke | 0 (0.0%) | 0 (0.0%) |
| All other Fuels | 0 (0.0%) | 13 (100.0%) |
| No Fuel Used | 0 (0.0%) | 0 (0.0%) |
| Total | 50 (100.0%) | 13 (100.0%) |
Household Vehicle Usage in Southern Ute
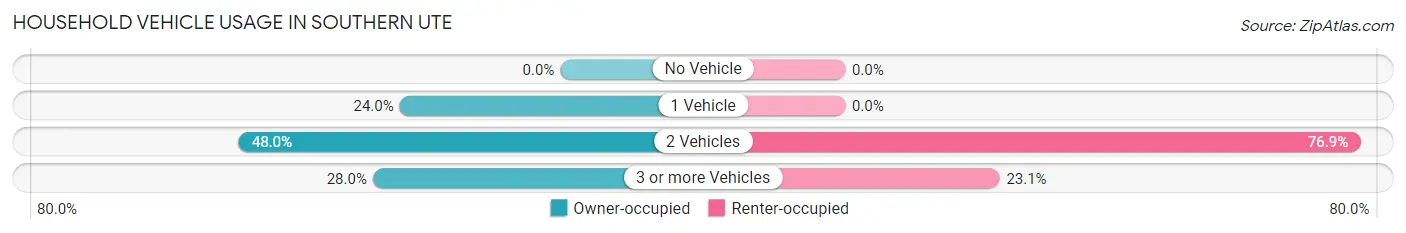
| Vehicles per Household | Owner-occupied | Renter-occupied |
| No Vehicle | 0 (0.0%) | 0 (0.0%) |
| 1 Vehicle | 12 (24.0%) | 0 (0.0%) |
| 2 Vehicles | 24 (48.0%) | 10 (76.9%) |
| 3 or more Vehicles | 14 (28.0%) | 3 (23.1%) |
| Total | 50 (100.0%) | 13 (100.0%) |
Real Estate & Mortgages in Southern Ute
Real Estate and Mortgage Overview in Southern Ute
| Characteristic | Without Mortgage | With Mortgage |
| Housing Units | 40 | 10 |
| Median Property Value | $283,300 | $0 |
| Median Household Income | - | - |
| Monthly Housing Costs | $420 | $0 |
| Real Estate Taxes | - | - |
Property Value by Mortgage Status in Southern Ute
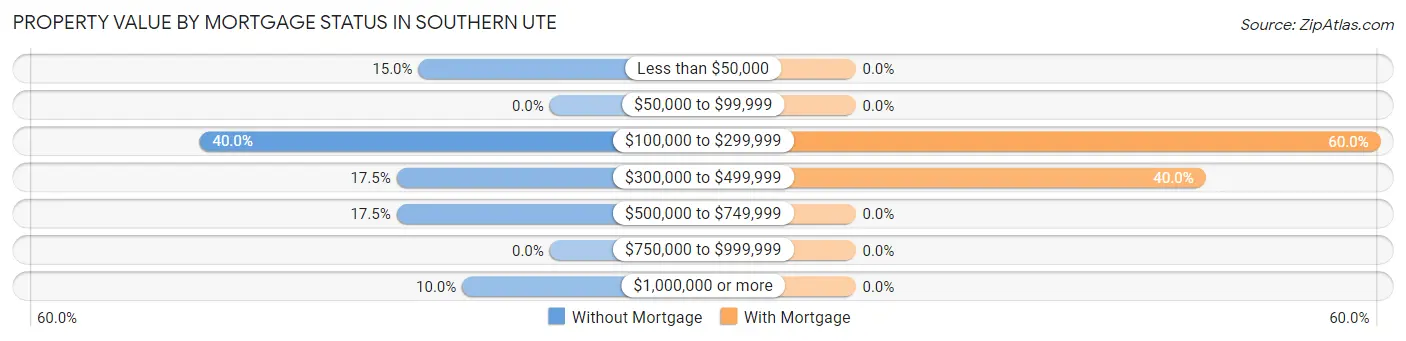
| Property Value | Without Mortgage | With Mortgage |
| Less than $50,000 | 6 (15.0%) | 0 (0.0%) |
| $50,000 to $99,999 | 0 (0.0%) | 0 (0.0%) |
| $100,000 to $299,999 | 16 (40.0%) | 6 (60.0%) |
| $300,000 to $499,999 | 7 (17.5%) | 4 (40.0%) |
| $500,000 to $749,999 | 7 (17.5%) | 0 (0.0%) |
| $750,000 to $999,999 | 0 (0.0%) | 0 (0.0%) |
| $1,000,000 or more | 4 (10.0%) | 0 (0.0%) |
| Total | 40 (100.0%) | 10 (100.0%) |
Household Income by Mortgage Status in Southern Ute
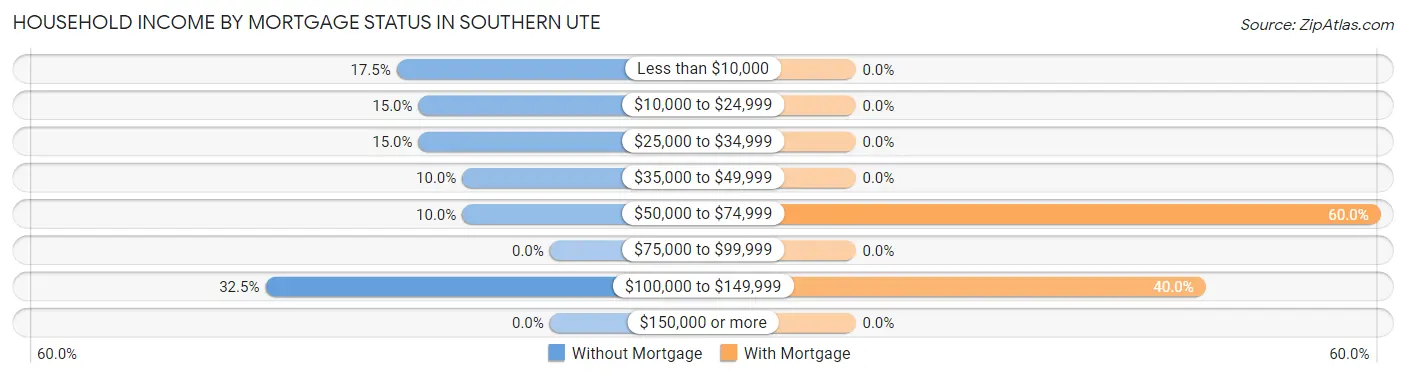
| Household Income | Without Mortgage | With Mortgage |
| Less than $10,000 | 7 (17.5%) | 0 (0.0%) |
| $10,000 to $24,999 | 6 (15.0%) | 0 (0.0%) |
| $25,000 to $34,999 | 6 (15.0%) | 0 (0.0%) |
| $35,000 to $49,999 | 4 (10.0%) | 0 (0.0%) |
| $50,000 to $74,999 | 4 (10.0%) | 6 (60.0%) |
| $75,000 to $99,999 | 0 (0.0%) | 0 (0.0%) |
| $100,000 to $149,999 | 13 (32.5%) | 4 (40.0%) |
| $150,000 or more | 0 (0.0%) | 0 (0.0%) |
| Total | 40 (100.0%) | 10 (100.0%) |
Property Value to Household Income Ratio in Southern Ute
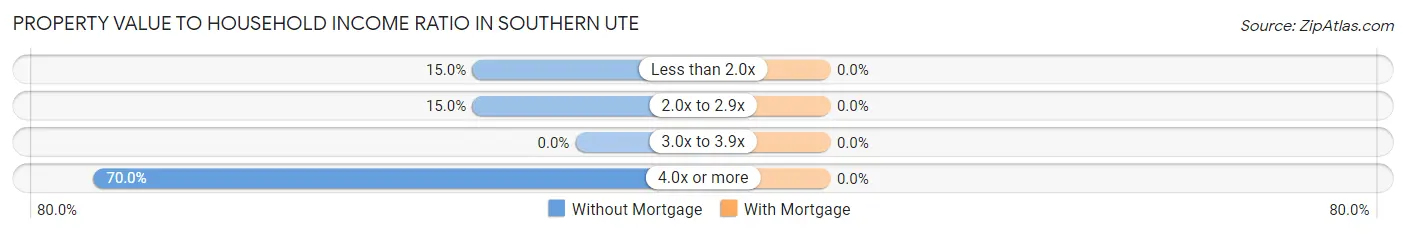
| Value-to-Income Ratio | Without Mortgage | With Mortgage |
| Less than 2.0x | 6 (15.0%) | 0 (0.0%) |
| 2.0x to 2.9x | 6 (15.0%) | 0 (0.0%) |
| 3.0x to 3.9x | 0 (0.0%) | 0 (0.0%) |
| 4.0x or more | 28 (70.0%) | 0 (0.0%) |
| Total | 40 (100.0%) | 10 (100.0%) |
Real Estate Taxes by Mortgage Status in Southern Ute
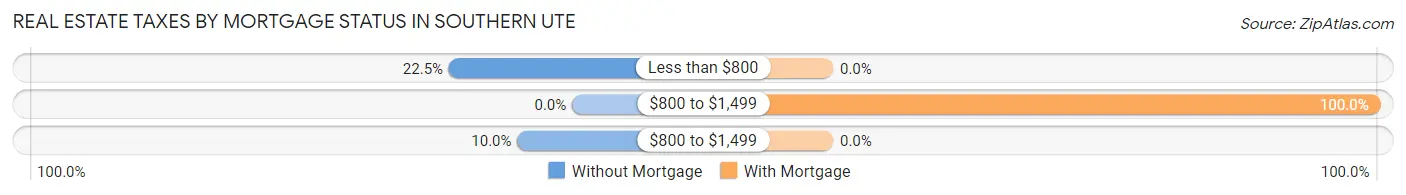
| Property Taxes | Without Mortgage | With Mortgage |
| Less than $800 | 9 (22.5%) | 0 (0.0%) |
| $800 to $1,499 | 0 (0.0%) | 10 (100.0%) |
| $800 to $1,499 | 4 (10.0%) | 0 (0.0%) |
| Total | 40 (100.0%) | 10 (100.0%) |
Health & Disability in Southern Ute
Health Insurance Coverage by Age in Southern Ute
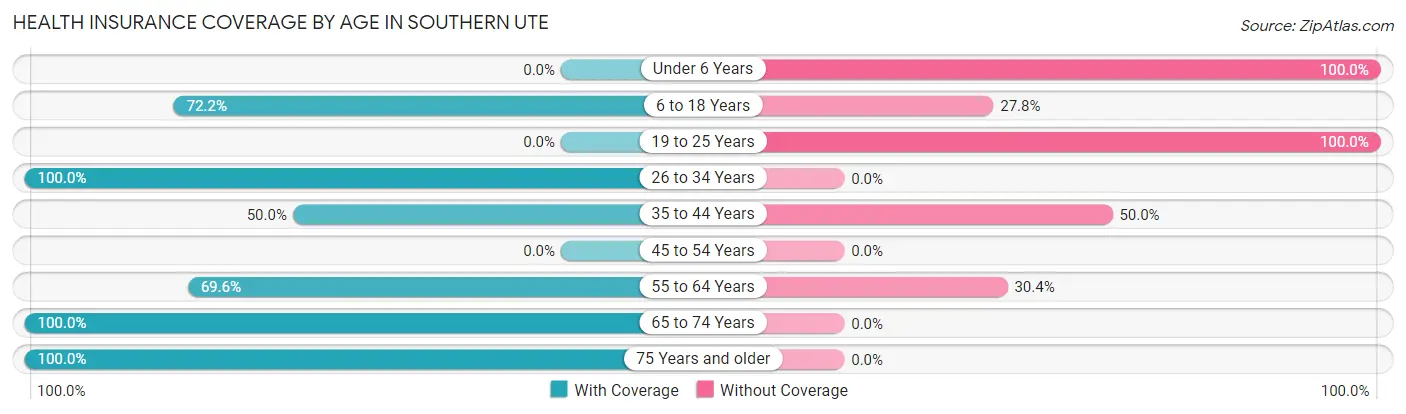
| Age Bracket | With Coverage | Without Coverage |
| Under 6 Years | 0 (0.0%) | 3 (100.0%) |
| 6 to 18 Years | 13 (72.2%) | 5 (27.8%) |
| 19 to 25 Years | 0 (0.0%) | 28 (100.0%) |
| 26 to 34 Years | 6 (100.0%) | 0 (0.0%) |
| 35 to 44 Years | 8 (50.0%) | 8 (50.0%) |
| 45 to 54 Years | 0 (0.0%) | 0 (0.0%) |
| 55 to 64 Years | 16 (69.6%) | 7 (30.4%) |
| 65 to 74 Years | 29 (100.0%) | 0 (0.0%) |
| 75 Years and older | 13 (100.0%) | 0 (0.0%) |
| Total | 85 (62.5%) | 51 (37.5%) |
Health Insurance Coverage by Citizenship Status in Southern Ute
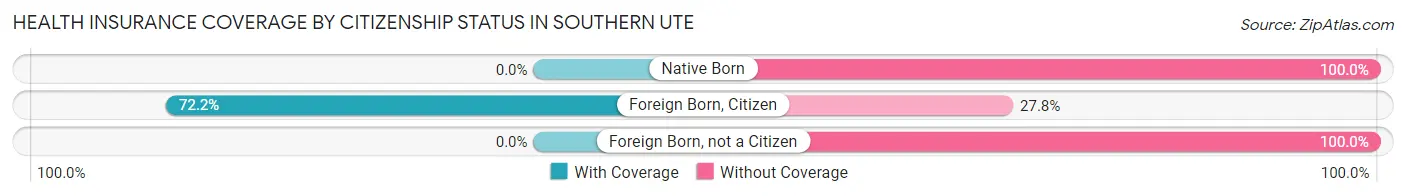
| Citizenship Status | With Coverage | Without Coverage |
| Native Born | 0 (0.0%) | 3 (100.0%) |
| Foreign Born, Citizen | 13 (72.2%) | 5 (27.8%) |
| Foreign Born, not a Citizen | 0 (0.0%) | 28 (100.0%) |
Health Insurance Coverage by Household Income in Southern Ute
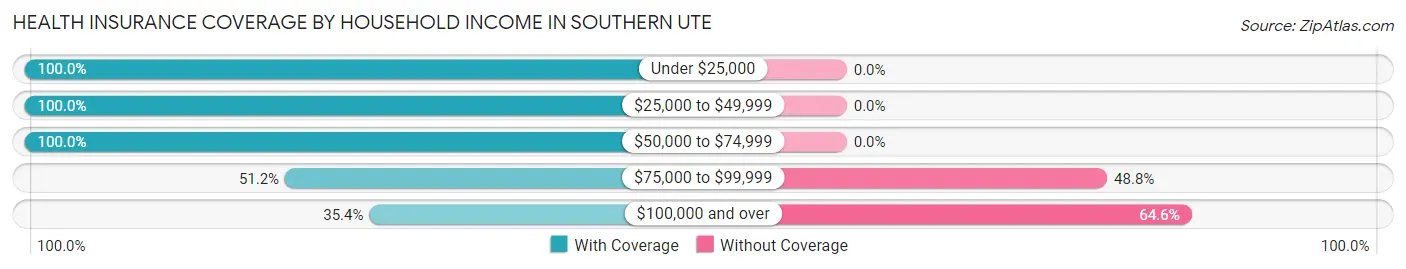
| Household Income | With Coverage | Without Coverage |
| Under $25,000 | 13 (100.0%) | 0 (0.0%) |
| $25,000 to $49,999 | 19 (100.0%) | 0 (0.0%) |
| $50,000 to $74,999 | 15 (100.0%) | 0 (0.0%) |
| $75,000 to $99,999 | 21 (51.2%) | 20 (48.8%) |
| $100,000 and over | 17 (35.4%) | 31 (64.6%) |
Public vs Private Health Insurance Coverage by Age in Southern Ute
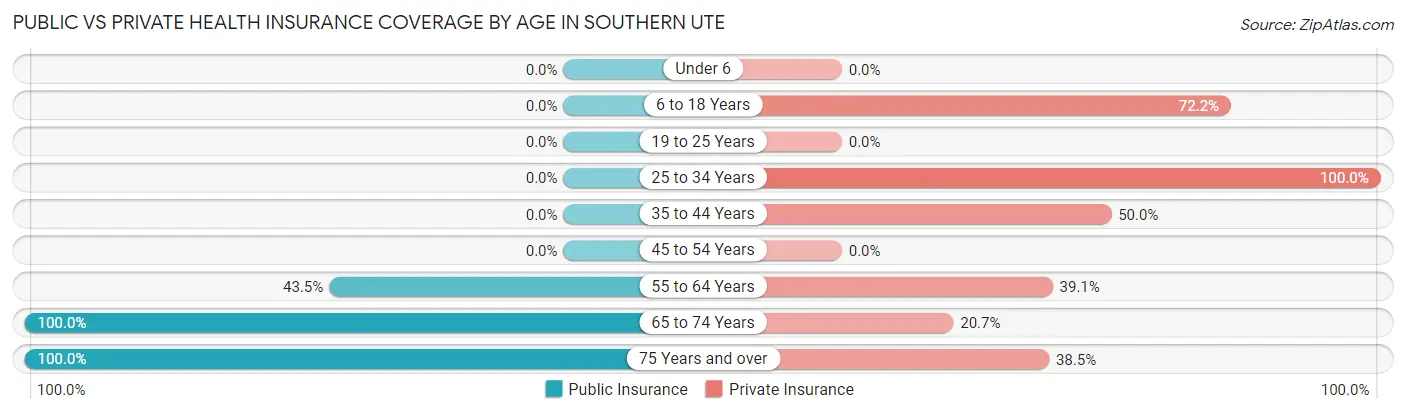
| Age Bracket | Public Insurance | Private Insurance |
| Under 6 | 0 (0.0%) | 0 (0.0%) |
| 6 to 18 Years | 0 (0.0%) | 13 (72.2%) |
| 19 to 25 Years | 0 (0.0%) | 0 (0.0%) |
| 25 to 34 Years | 0 (0.0%) | 6 (100.0%) |
| 35 to 44 Years | 0 (0.0%) | 8 (50.0%) |
| 45 to 54 Years | 0 (0.0%) | 0 (0.0%) |
| 55 to 64 Years | 10 (43.5%) | 9 (39.1%) |
| 65 to 74 Years | 29 (100.0%) | 6 (20.7%) |
| 75 Years and over | 13 (100.0%) | 5 (38.5%) |
| Total | 52 (38.2%) | 47 (34.6%) |
Disability Status by Sex by Age in Southern Ute
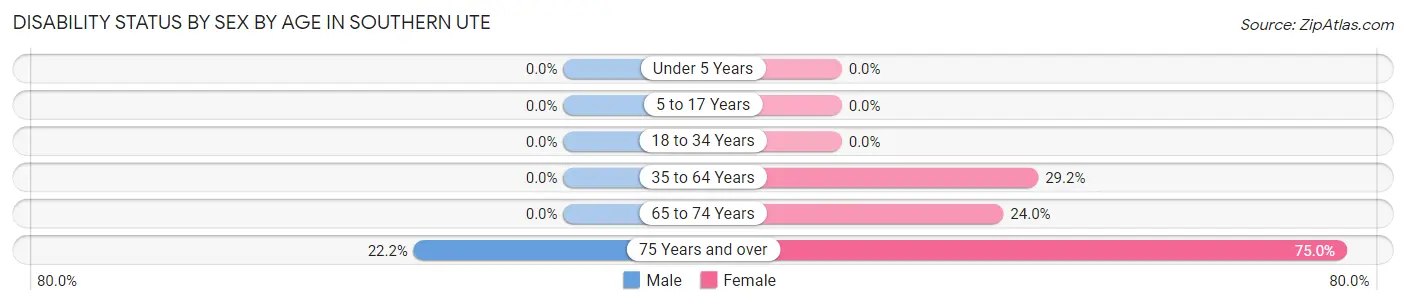
| Age Bracket | Male | Female |
| Under 5 Years | 0 (0.0%) | 0 (0.0%) |
| 5 to 17 Years | 0 (0.0%) | 0 (0.0%) |
| 18 to 34 Years | 0 (0.0%) | 0 (0.0%) |
| 35 to 64 Years | 0 (0.0%) | 7 (29.2%) |
| 65 to 74 Years | 0 (0.0%) | 6 (24.0%) |
| 75 Years and over | 2 (22.2%) | 3 (75.0%) |
Disability Class by Sex by Age in Southern Ute
Disability Class: Hearing Difficulty
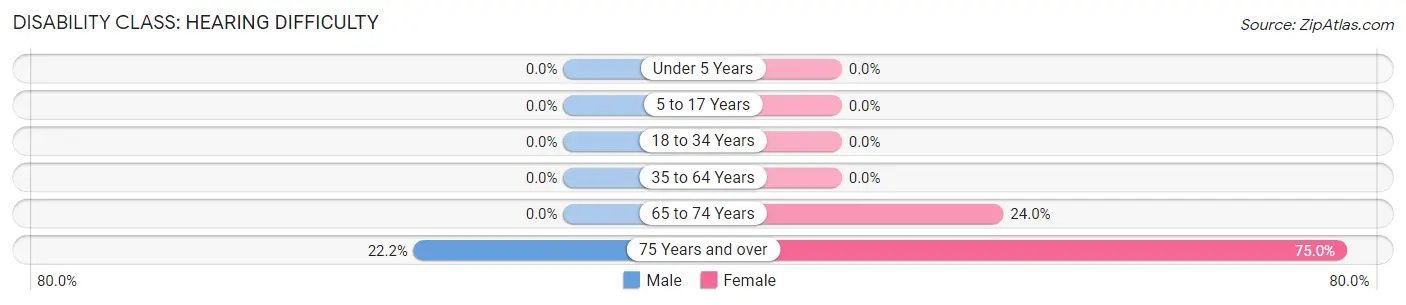
| Age Bracket | Male | Female |
| Under 5 Years | 0 (0.0%) | 0 (0.0%) |
| 5 to 17 Years | 0 (0.0%) | 0 (0.0%) |
| 18 to 34 Years | 0 (0.0%) | 0 (0.0%) |
| 35 to 64 Years | 0 (0.0%) | 0 (0.0%) |
| 65 to 74 Years | 0 (0.0%) | 6 (24.0%) |
| 75 Years and over | 2 (22.2%) | 3 (75.0%) |
Disability Class: Vision Difficulty
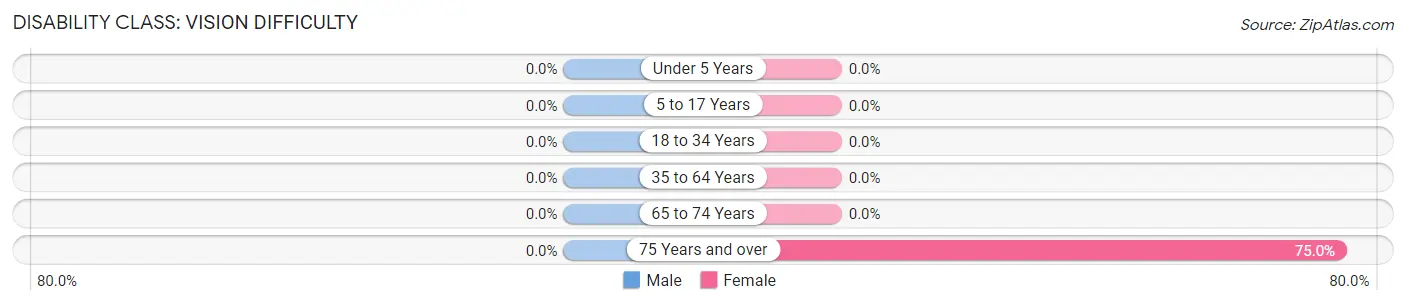
| Age Bracket | Male | Female |
| Under 5 Years | 0 (0.0%) | 0 (0.0%) |
| 5 to 17 Years | 0 (0.0%) | 0 (0.0%) |
| 18 to 34 Years | 0 (0.0%) | 0 (0.0%) |
| 35 to 64 Years | 0 (0.0%) | 0 (0.0%) |
| 65 to 74 Years | 0 (0.0%) | 0 (0.0%) |
| 75 Years and over | 0 (0.0%) | 3 (75.0%) |
Disability Class: Cognitive Difficulty
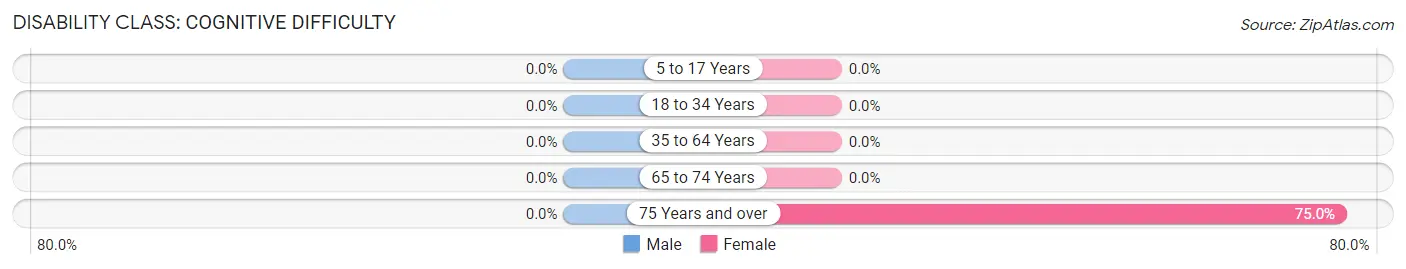
| Age Bracket | Male | Female |
| 5 to 17 Years | 0 (0.0%) | 0 (0.0%) |
| 18 to 34 Years | 0 (0.0%) | 0 (0.0%) |
| 35 to 64 Years | 0 (0.0%) | 0 (0.0%) |
| 65 to 74 Years | 0 (0.0%) | 0 (0.0%) |
| 75 Years and over | 0 (0.0%) | 3 (75.0%) |
Disability Class: Ambulatory Difficulty
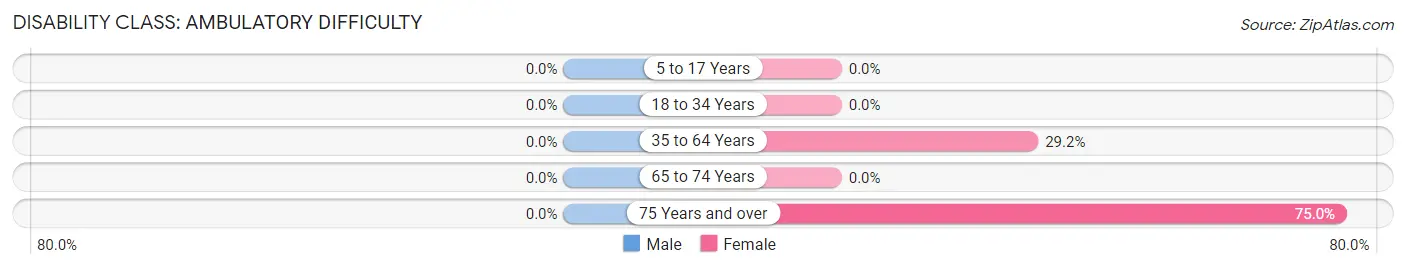
| Age Bracket | Male | Female |
| 5 to 17 Years | 0 (0.0%) | 0 (0.0%) |
| 18 to 34 Years | 0 (0.0%) | 0 (0.0%) |
| 35 to 64 Years | 0 (0.0%) | 7 (29.2%) |
| 65 to 74 Years | 0 (0.0%) | 0 (0.0%) |
| 75 Years and over | 0 (0.0%) | 3 (75.0%) |
Disability Class: Self-Care Difficulty
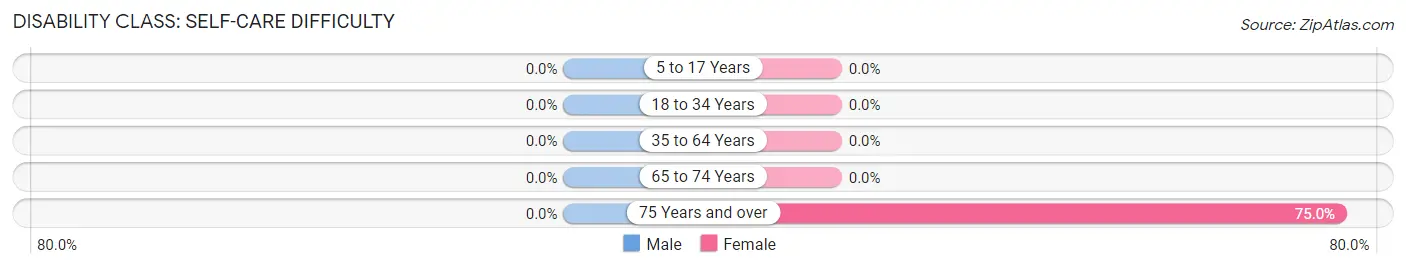
| Age Bracket | Male | Female |
| 5 to 17 Years | 0 (0.0%) | 0 (0.0%) |
| 18 to 34 Years | 0 (0.0%) | 0 (0.0%) |
| 35 to 64 Years | 0 (0.0%) | 0 (0.0%) |
| 65 to 74 Years | 0 (0.0%) | 0 (0.0%) |
| 75 Years and over | 0 (0.0%) | 3 (75.0%) |
Technology Access in Southern Ute
Computing Device Access in Southern Ute
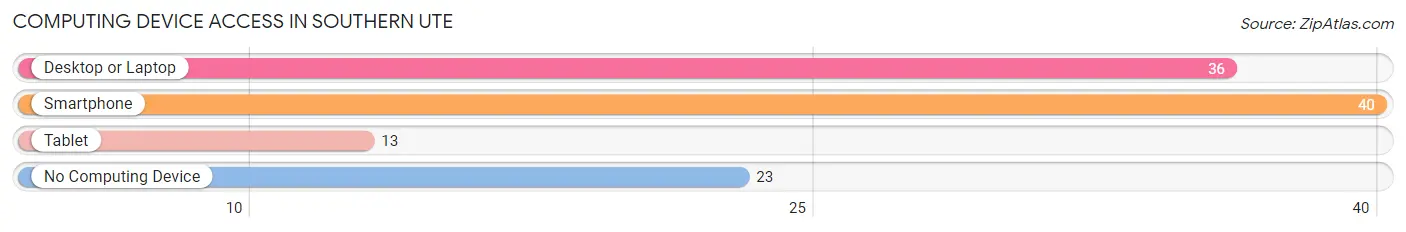
| Device Type | # Households | % Households |
| Desktop or Laptop | 36 | 57.1% |
| Smartphone | 40 | 63.5% |
| Tablet | 13 | 20.6% |
| No Computing Device | 23 | 36.5% |
| Total | 63 | 100.0% |
Internet Access in Southern Ute
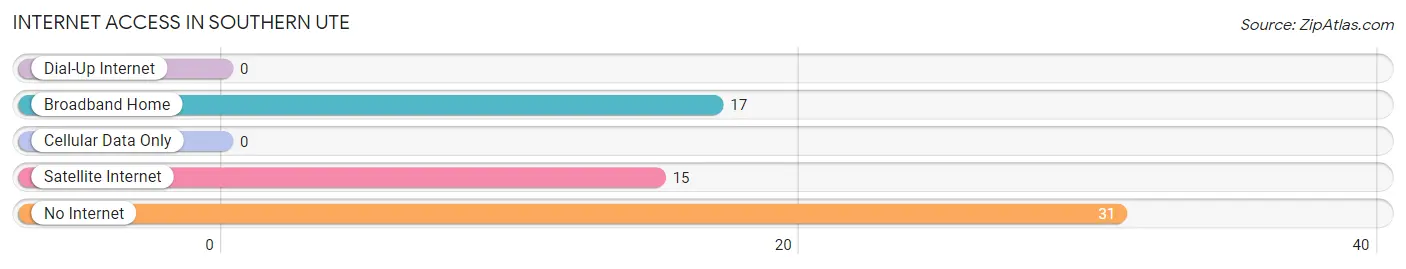
| Internet Type | # Households | % Households |
| Dial-Up Internet | 0 | 0.0% |
| Broadband Home | 17 | 27.0% |
| Cellular Data Only | 0 | 0.0% |
| Satellite Internet | 15 | 23.8% |
| No Internet | 31 | 49.2% |
| Total | 63 | 100.0% |
Southern Ute Summary
Southern Ute is a Native American tribe located in southwestern Colorado. The tribe is composed of two distinct bands, the Mountain Ute and the Southern Ute. The Southern Ute Indian Reservation is located in southwestern Colorado, and is the homeland of the Southern Ute Tribe. The reservation is located in La Plata, Montezuma, and Archuleta counties, and covers an area of 1,056 square miles.
History
The Southern Ute Tribe is descended from the Ute people, who have lived in the area for thousands of years. The Ute people were nomadic hunter-gatherers who lived in the mountains of Colorado and Utah. The Ute people were divided into seven bands, including the Mouache, Capote, Weeminuche, Yampa, Uintah, and Uncompahgre. The Southern Ute Tribe is descended from the Mouache and Capote bands.
The Southern Ute Tribe was first contacted by Europeans in the late 1700s. In 1868, the tribe signed the Treaty of Conejos, which established the Southern Ute Reservation. The reservation was originally much larger than it is today, but was reduced in size over the years.
In the late 1800s, the Southern Ute Tribe began to experience significant changes. The tribe was forced to move from their traditional lands to the reservation, and the government began to implement a policy of assimilation. The tribe was forced to adopt a sedentary lifestyle, and the government began to encourage the tribe to adopt Christianity and the English language.
Geography
The Southern Ute Indian Reservation is located in southwestern Colorado, and covers an area of 1,056 square miles. The reservation is located in La Plata, Montezuma, and Archuleta counties. The reservation is bordered by the Ute Mountain Ute Reservation to the north, the Navajo Nation to the east, and the Jicarilla Apache Reservation to the south.
The reservation is located in the San Juan Mountains, and is home to several mountain peaks, including Mount Hesperus, the highest peak in the San Juan Mountains. The reservation is also home to several rivers, including the San Juan River, the Animas River, and the La Plata River.
Economy
The Southern Ute Tribe is a sovereign nation, and is self-governing. The tribe operates several businesses, including a casino, a hotel, a gas station, and a convenience store. The tribe also operates a number of agricultural businesses, including a cattle ranch and a hay farm.
The tribe also operates a number of government programs, including a housing authority, a health clinic, and a tribal court. The tribe also operates a number of educational programs, including a tribal college and a tribal school.
Demographics
As of the 2010 census, the Southern Ute Tribe had a population of 3,541. The majority of the population (90.3%) identified as Native American, and the remainder identified as white (7.2%), Hispanic (1.7%), and other (0.8%). The median age of the population was 33.7 years, and the median household income was $31,944.
Conclusion
The Southern Ute Tribe is a sovereign nation located in southwestern Colorado. The tribe is composed of two distinct bands, the Mountain Ute and the Southern Ute. The Southern Ute Indian Reservation is located in La Plata, Montezuma, and Archuleta counties, and covers an area of 1,056 square miles. The tribe is self-governing, and operates several businesses, including a casino, a hotel, a gas station, and a convenience store. As of the 2010 census, the Southern Ute Tribe had a population of 3,541.
Common Questions
What is Per Capita Income in Southern Ute?
Per Capita income in Southern Ute is $30,782.
What is the Median Family Income in Southern Ute?
Median Family Income in Southern Ute is $103,036.
What is Income or Wage Gap in Southern Ute?
Income or Wage Gap in Southern Ute is 11.0%.
Women in Southern Ute earn 89.0 cents for every dollar earned by a man.
What is Inequality or Gini Index in Southern Ute?
Inequality or Gini Index in Southern Ute is 0.38.
What is the Total Population of Southern Ute?
Total Population of Southern Ute is 136.
What is the Total Male Population of Southern Ute?
Total Male Population of Southern Ute is 55.
What is the Total Female Population of Southern Ute?
Total Female Population of Southern Ute is 81.
What is the Ratio of Males per 100 Females in Southern Ute?
There are 67.90 Males per 100 Females in Southern Ute.
What is the Ratio of Females per 100 Males in Southern Ute?
There are 147.27 Females per 100 Males in Southern Ute.
What is the Median Population Age in Southern Ute?
Median Population Age in Southern Ute is 40.3 Years.
What is the Average Family Size in Southern Ute
Average Family Size in Southern Ute is 2.9 People.
What is the Average Household Size in Southern Ute
Average Household Size in Southern Ute is 2.2 People.
How Large is the Labor Force in Southern Ute?
There are 46 People in the Labor Forcein in Southern Ute.
What is the Percentage of People in the Labor Force in Southern Ute?
38.0% of People are in the Labor Force in Southern Ute.