Crisman, CO Map & Demographics
Crisman Map
Crisman Overview
$128,858
PER CAPITA INCOME
$189,479
AVG FAMILY INCOME
$162,500
AVG HOUSEHOLD INCOME
8.7%
WAGE / INCOME GAP [ % ]
91.3¢/ $1
WAGE / INCOME GAP [ $ ]
0.52
INEQUALITY / GINI INDEX
264
TOTAL POPULATION
126
MALE POPULATION
138
FEMALE POPULATION
91.30
MALES / 100 FEMALES
109.52
FEMALES / 100 MALES
40.5
MEDIAN AGE
3.2
AVG FAMILY SIZE
2.5
AVG HOUSEHOLD SIZE
164
LABOR FORCE [ PEOPLE ]
76.3%
PERCENT IN LABOR FORCE
9.1%
UNEMPLOYMENT RATE
Income in Crisman
Income Overview in Crisman
Per Capita Income in Crisman is $128,858, while median incomes of families and households are $189,479 and $162,500 respectively.
| Characteristic | Number | Measure |
| Per Capita Income | 264 | $128,858 |
| Median Family Income | 63 | $189,479 |
| Mean Family Income | 63 | $447,625 |
| Median Household Income | 104 | $162,500 |
| Mean Household Income | 104 | $327,862 |
| Income Deficit | 63 | $0 |
| Wage / Income Gap (%) | 264 | 8.69% |
| Wage / Income Gap ($) | 264 | 91.31¢ per $1 |
| Gini / Inequality Index | 264 | 0.52 |
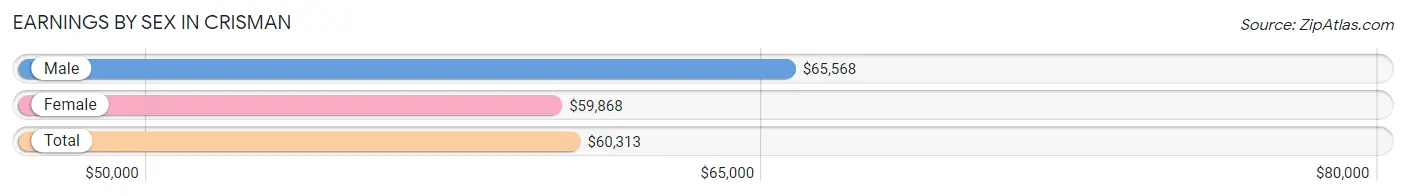
Earnings by Sex in Crisman
Average Earnings in Crisman are $60,313, $65,568 for men and $59,868 for women, a difference of 8.7%.
| Sex | Number | Average Earnings |
| Male | 97 (48.3%) | $65,568 |
| Female | 104 (51.7%) | $59,868 |
| Total | 201 (100.0%) | $60,313 |
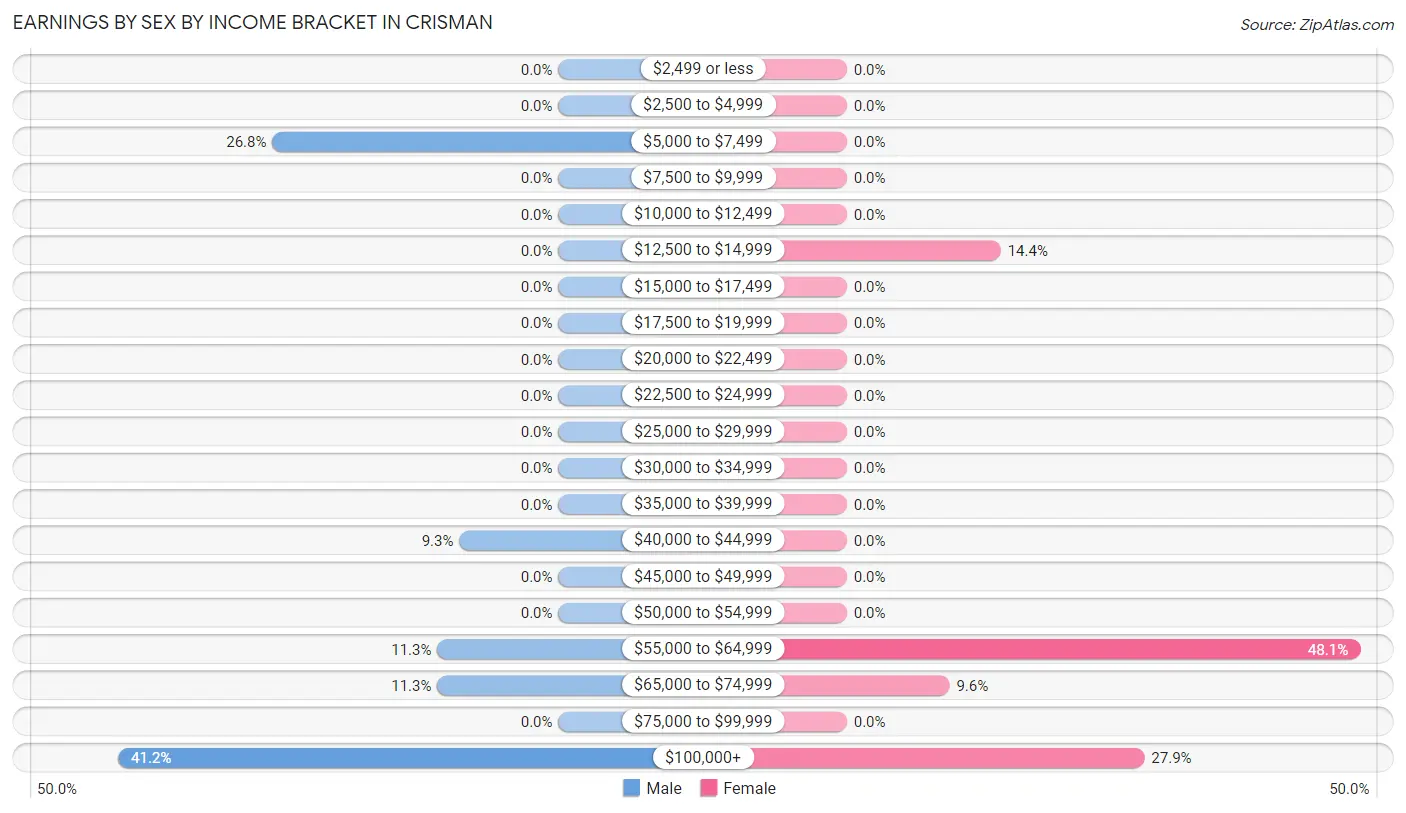
Earnings by Sex by Income Bracket in Crisman
The most common earnings brackets in Crisman are $100,000+ for men (40 | 41.2%) and $55,000 to $64,999 for women (50 | 48.1%).
| Income | Male | Female |
| $2,499 or less | 0 (0.0%) | 0 (0.0%) |
| $2,500 to $4,999 | 0 (0.0%) | 0 (0.0%) |
| $5,000 to $7,499 | 26 (26.8%) | 0 (0.0%) |
| $7,500 to $9,999 | 0 (0.0%) | 0 (0.0%) |
| $10,000 to $12,499 | 0 (0.0%) | 0 (0.0%) |
| $12,500 to $14,999 | 0 (0.0%) | 15 (14.4%) |
| $15,000 to $17,499 | 0 (0.0%) | 0 (0.0%) |
| $17,500 to $19,999 | 0 (0.0%) | 0 (0.0%) |
| $20,000 to $22,499 | 0 (0.0%) | 0 (0.0%) |
| $22,500 to $24,999 | 0 (0.0%) | 0 (0.0%) |
| $25,000 to $29,999 | 0 (0.0%) | 0 (0.0%) |
| $30,000 to $34,999 | 0 (0.0%) | 0 (0.0%) |
| $35,000 to $39,999 | 0 (0.0%) | 0 (0.0%) |
| $40,000 to $44,999 | 9 (9.3%) | 0 (0.0%) |
| $45,000 to $49,999 | 0 (0.0%) | 0 (0.0%) |
| $50,000 to $54,999 | 0 (0.0%) | 0 (0.0%) |
| $55,000 to $64,999 | 11 (11.3%) | 50 (48.1%) |
| $65,000 to $74,999 | 11 (11.3%) | 10 (9.6%) |
| $75,000 to $99,999 | 0 (0.0%) | 0 (0.0%) |
| $100,000+ | 40 (41.2%) | 29 (27.9%) |
| Total | 97 (100.0%) | 104 (100.0%) |
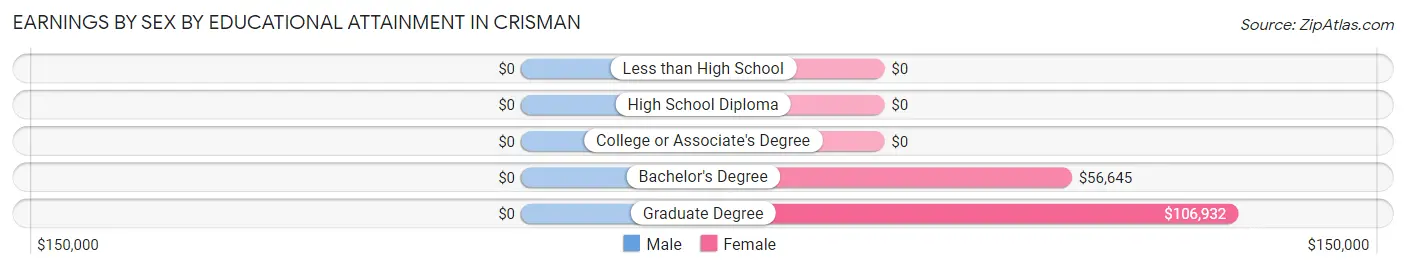
Earnings by Sex by Educational Attainment in Crisman
| Educational Attainment | Male Income | Female Income |
| Less than High School | - | - |
| High School Diploma | - | - |
| College or Associate's Degree | - | - |
| Bachelor's Degree | - | - |
| Graduate Degree | - | - |
| Total | $103,125 | $59,868 |
Family Income in Crisman
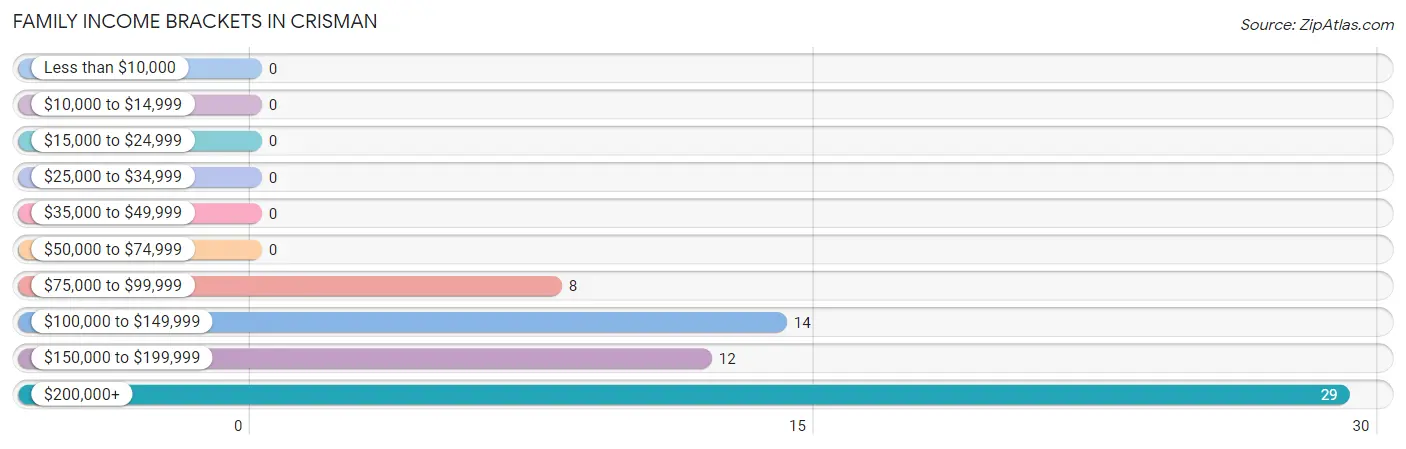
Family Income Brackets in Crisman
According to the Crisman family income data, there are 29 families falling into the $200,000+ income range, which is the most common income bracket and makes up 46.0% of all families.
| Income Bracket | # Families | % Families |
| Less than $10,000 | 0 | 0.0% |
| $10,000 to $14,999 | 0 | 0.0% |
| $15,000 to $24,999 | 0 | 0.0% |
| $25,000 to $34,999 | 0 | 0.0% |
| $35,000 to $49,999 | 0 | 0.0% |
| $50,000 to $74,999 | 0 | 0.0% |
| $75,000 to $99,999 | 8 | 12.7% |
| $100,000 to $149,999 | 14 | 22.2% |
| $150,000 to $199,999 | 12 | 19.0% |
| $200,000+ | 29 | 46.0% |
Family Income by Famaliy Size in Crisman
| Income Bracket | # Families | Median Income |
| 2-Person Families | 22 (34.9%) | $0 |
| 3-Person Families | 12 (19.1%) | $0 |
| 4-Person Families | 29 (46.0%) | $0 |
| 5-Person Families | 0 (0.0%) | $0 |
| 6-Person Families | 0 (0.0%) | $0 |
| 7+ Person Families | 0 (0.0%) | $0 |
| Total | 63 (100.0%) | $189,479 |
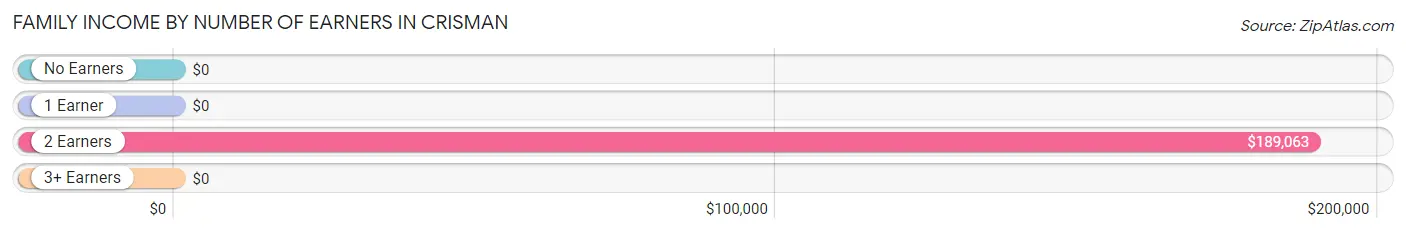
Family Income by Number of Earners in Crisman
| Number of Earners | # Families | Median Income |
| No Earners | 0 (0.0%) | $0 |
| 1 Earner | 14 (22.2%) | $0 |
| 2 Earners | 31 (49.2%) | $189,063 |
| 3+ Earners | 18 (28.6%) | $0 |
| Total | 63 (100.0%) | $189,479 |
Household Income in Crisman
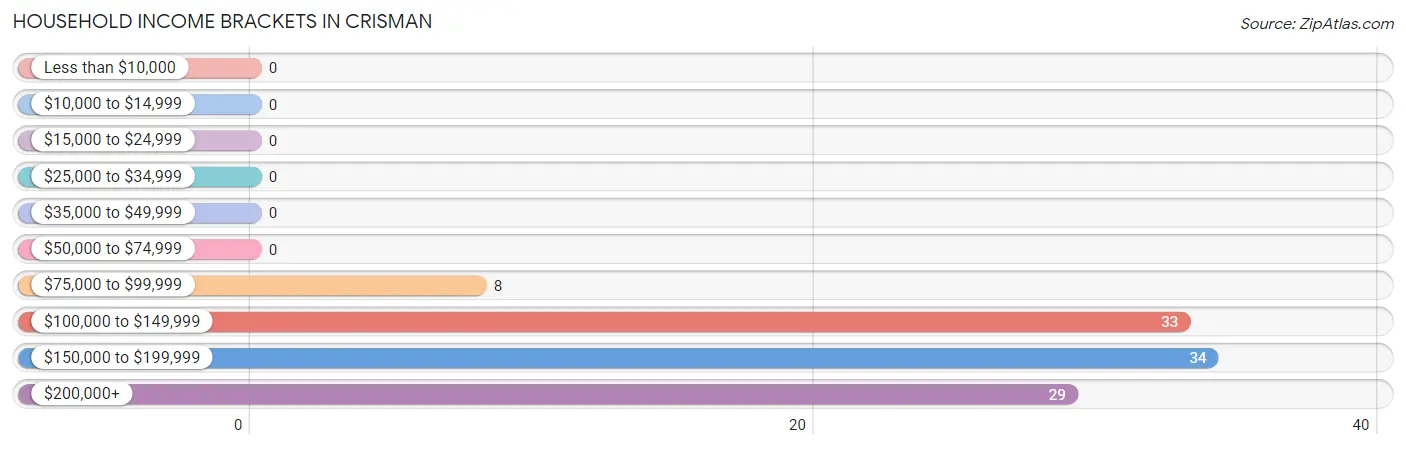
Household Income Brackets in Crisman
With 34 households falling in the category, the $150,000 to $199,999 income range is the most frequent in Crisman, accounting for 32.7% of all households.
| Income Bracket | # Households | % Households |
| Less than $10,000 | 0 | 0.0% |
| $10,000 to $14,999 | 0 | 0.0% |
| $15,000 to $24,999 | 0 | 0.0% |
| $25,000 to $34,999 | 0 | 0.0% |
| $35,000 to $49,999 | 0 | 0.0% |
| $50,000 to $74,999 | 0 | 0.0% |
| $75,000 to $99,999 | 8 | 7.7% |
| $100,000 to $149,999 | 33 | 31.7% |
| $150,000 to $199,999 | 34 | 32.7% |
| $200,000+ | 29 | 27.9% |
Household Income by Householder Age in Crisman
The median household income in Crisman is $162,500, with the highest median household income of $188,750 found in the 25 to 44 years age bracket for the primary householder. A total of 34 households (32.7%) fall into this category.
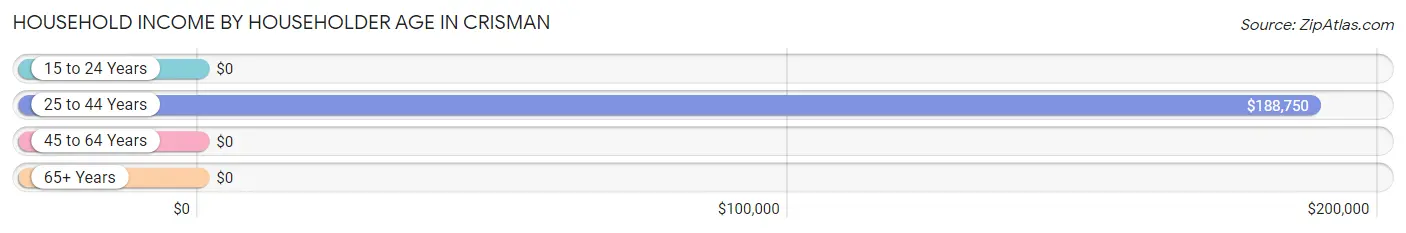
| Income Bracket | # Households | Median Income |
| 15 to 24 Years | 0 (0.0%) | $0 |
| 25 to 44 Years | 34 (32.7%) | $188,750 |
| 45 to 64 Years | 45 (43.3%) | $0 |
| 65+ Years | 25 (24.0%) | $0 |
| Total | 104 (100.0%) | $162,500 |
Poverty in Crisman
Income Below Poverty by Sex and Age in Crisman
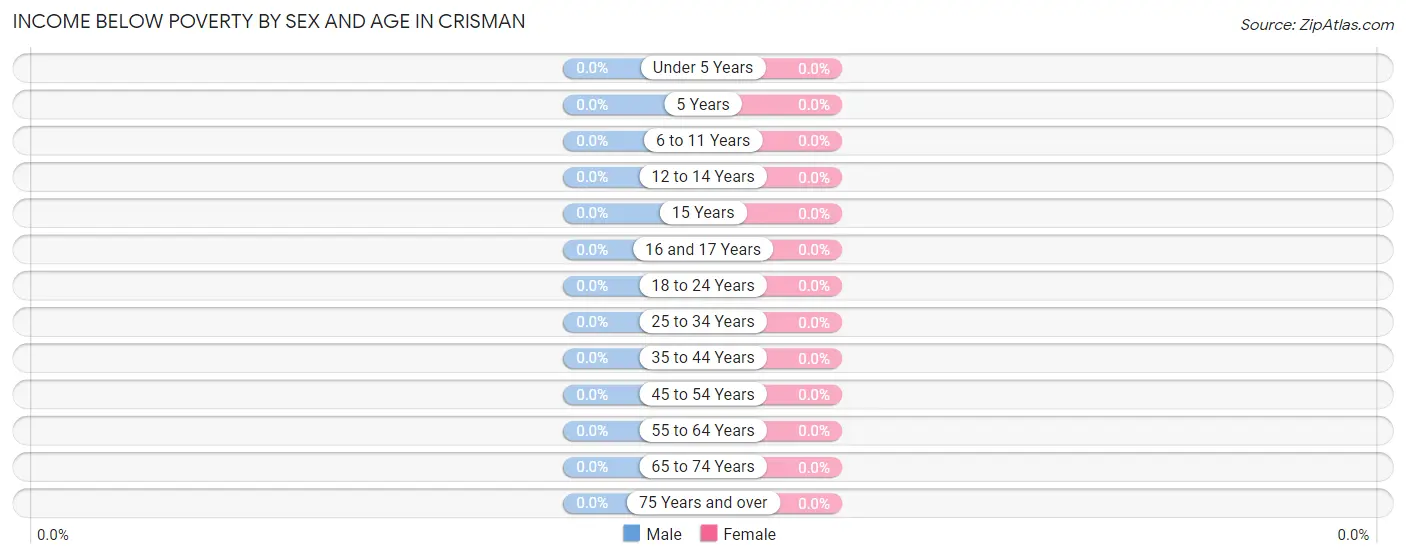
| Age Bracket | Male | Female |
| Under 5 Years | 0 (0.0%) | 0 (0.0%) |
| 5 Years | 0 (0.0%) | 0 (0.0%) |
| 6 to 11 Years | 0 (0.0%) | 0 (0.0%) |
| 12 to 14 Years | 0 (0.0%) | 0 (0.0%) |
| 15 Years | 0 (0.0%) | 0 (0.0%) |
| 16 and 17 Years | 0 (0.0%) | 0 (0.0%) |
| 18 to 24 Years | 0 (0.0%) | 0 (0.0%) |
| 25 to 34 Years | 0 (0.0%) | 0 (0.0%) |
| 35 to 44 Years | 0 (0.0%) | 0 (0.0%) |
| 45 to 54 Years | 0 (0.0%) | 0 (0.0%) |
| 55 to 64 Years | 0 (0.0%) | 0 (0.0%) |
| 65 to 74 Years | 0 (0.0%) | 0 (0.0%) |
| 75 Years and over | 0 (0.0%) | 0 (0.0%) |
| Total | 0 (0.0%) | 0 (0.0%) |
Income Above Poverty by Sex and Age in Crisman
According to the poverty statistics in Crisman, males aged 5 years and females aged under 5 years are the age groups that are most secure financially, with 100.0% of males and 100.0% of females in these age groups living above the poverty line.
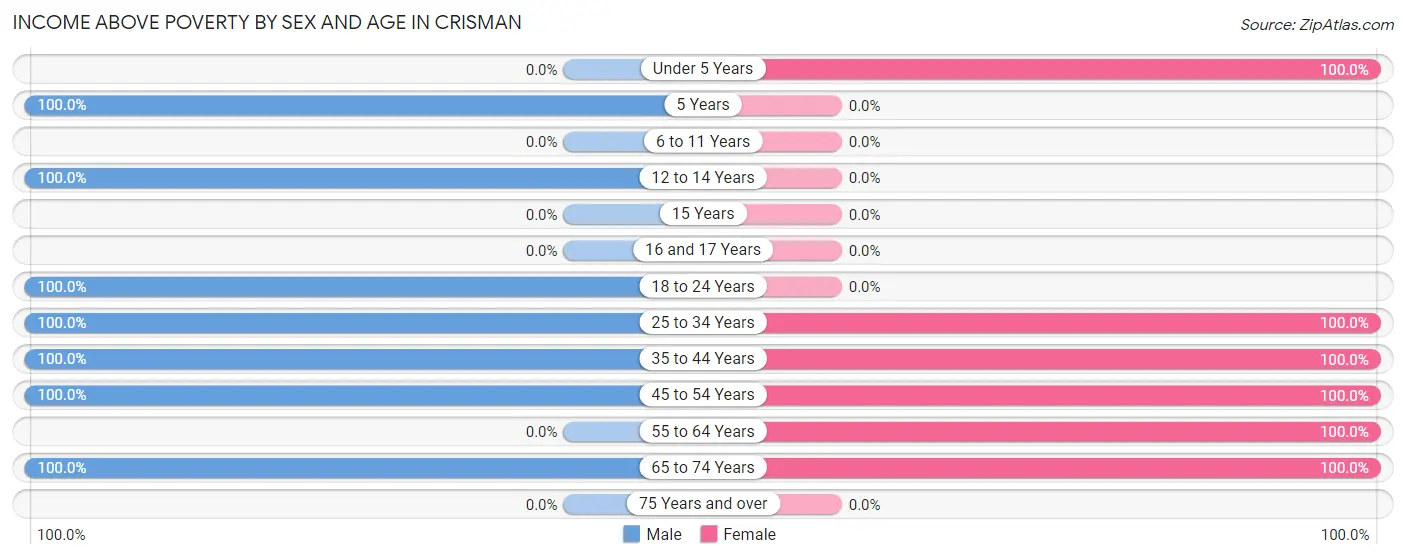
| Age Bracket | Male | Female |
| Under 5 Years | 0 (0.0%) | 20 (100.0%) |
| 5 Years | 11 (100.0%) | 0 (0.0%) |
| 6 to 11 Years | 0 (0.0%) | 0 (0.0%) |
| 12 to 14 Years | 18 (100.0%) | 0 (0.0%) |
| 15 Years | 0 (0.0%) | 0 (0.0%) |
| 16 and 17 Years | 0 (0.0%) | 0 (0.0%) |
| 18 to 24 Years | 26 (100.0%) | 0 (0.0%) |
| 25 to 34 Years | 11 (100.0%) | 12 (100.0%) |
| 35 to 44 Years | 22 (100.0%) | 37 (100.0%) |
| 45 to 54 Years | 27 (100.0%) | 26 (100.0%) |
| 55 to 64 Years | 0 (0.0%) | 29 (100.0%) |
| 65 to 74 Years | 11 (100.0%) | 14 (100.0%) |
| 75 Years and over | 0 (0.0%) | 0 (0.0%) |
| Total | 126 (100.0%) | 138 (100.0%) |
Income Below Poverty Among Married-Couple Families in Crisman
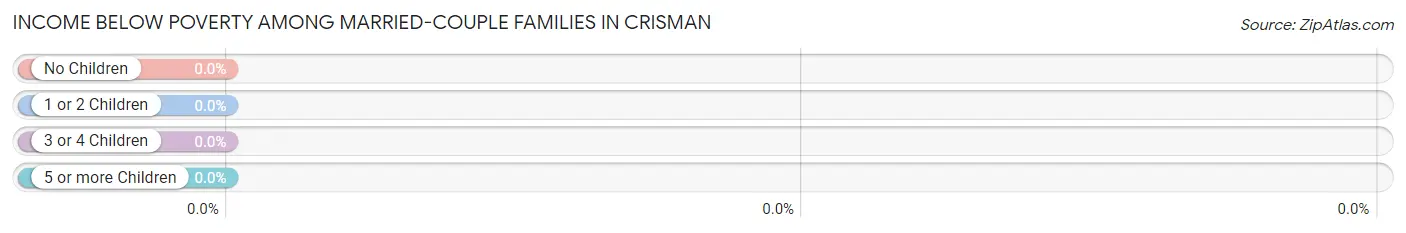
| Children | Above Poverty | Below Poverty |
| No Children | 8 (100.0%) | 0 (0.0%) |
| 1 or 2 Children | 41 (100.0%) | 0 (0.0%) |
| 3 or 4 Children | 0 (0.0%) | 0 (0.0%) |
| 5 or more Children | 0 (0.0%) | 0 (0.0%) |
| Total | 49 (100.0%) | 0 (0.0%) |
Income Below Poverty Among Single-Parent Households in Crisman
| Children | Single Father | Single Mother |
| No Children | 0 (0.0%) | 0 (0.0%) |
| 1 or 2 Children | 0 (0.0%) | 0 (0.0%) |
| 3 or 4 Children | 0 (0.0%) | 0 (0.0%) |
| 5 or more Children | 0 (0.0%) | 0 (0.0%) |
| Total | 0 (0.0%) | 0 (0.0%) |
Income Below Poverty Among Married-Couple vs Single-Parent Households in Crisman
| Children | Married-Couple Families | Single-Parent Households |
| No Children | 0 (0.0%) | 0 (0.0%) |
| 1 or 2 Children | 0 (0.0%) | 0 (0.0%) |
| 3 or 4 Children | 0 (0.0%) | 0 (0.0%) |
| 5 or more Children | 0 (0.0%) | 0 (0.0%) |
| Total | 0 (0.0%) | 0 (0.0%) |
Race in Crisman
The most populous races in Crisman are , and White / Caucasian (264 | 100.0%).
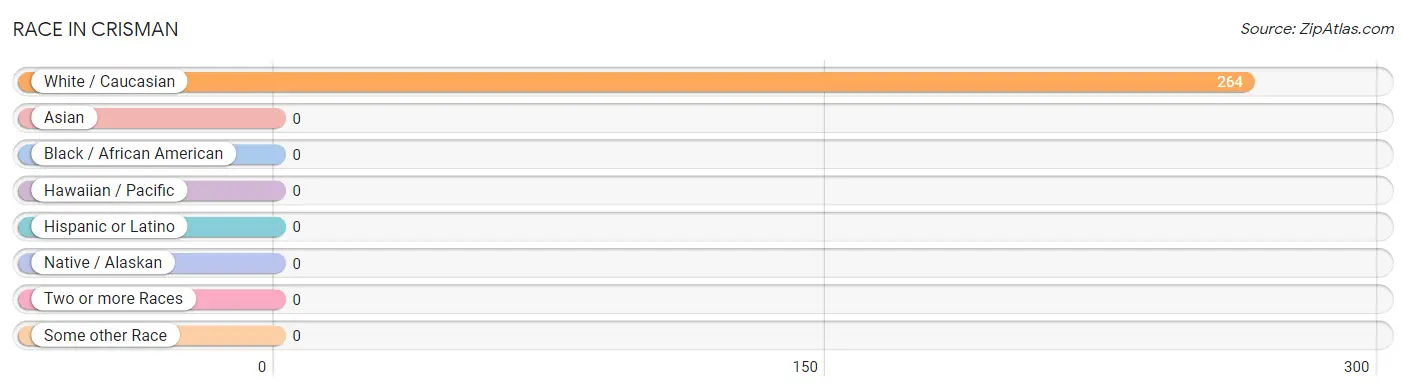
| Race | # Population | % Population |
| Asian | 0 | 0.0% |
| Black / African American | 0 | 0.0% |
| Hawaiian / Pacific | 0 | 0.0% |
| Hispanic or Latino | 0 | 0.0% |
| Native / Alaskan | 0 | 0.0% |
| White / Caucasian | 264 | 100.0% |
| Two or more Races | 0 | 0.0% |
| Some other Race | 0 | 0.0% |
| Total | 264 | 100.0% |
Ancestry in Crisman
The most populous ancestries reported in Crisman are German (103 | 39.0%), Scottish (62 | 23.5%), English (57 | 21.6%), American (38 | 14.4%), and European (33 | 12.5%), together accounting for 111.0% of all Crisman residents.
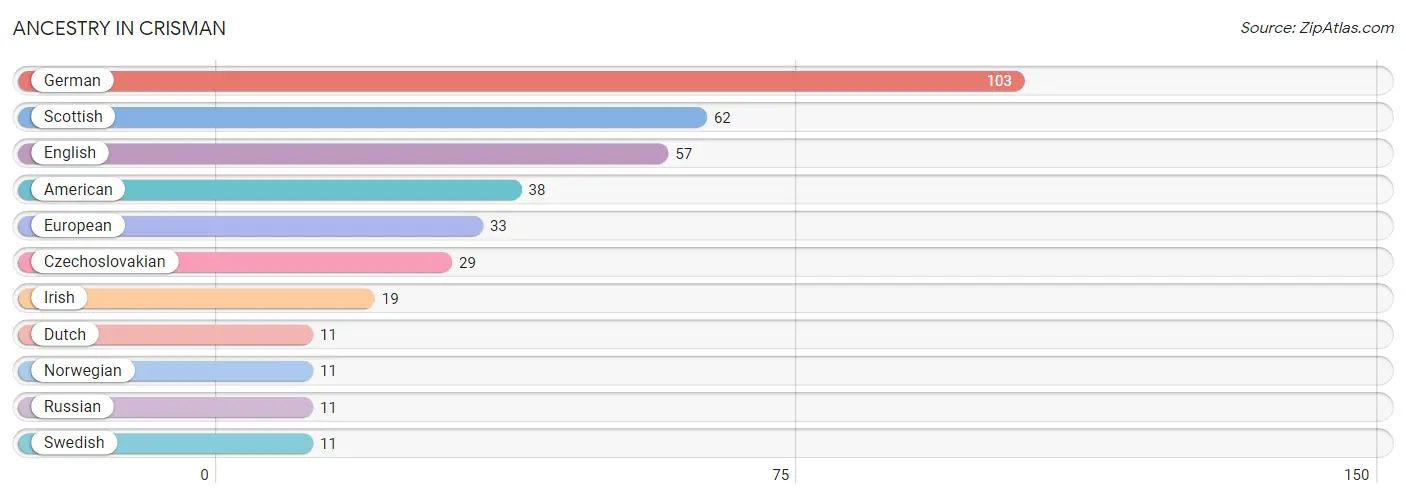
| Ancestry | # Population | % Population |
| American | 38 | 14.4% |
| Czechoslovakian | 29 | 11.0% |
| Dutch | 11 | 4.2% |
| English | 57 | 21.6% |
| European | 33 | 12.5% |
| German | 103 | 39.0% |
| Irish | 19 | 7.2% |
| Norwegian | 11 | 4.2% |
| Russian | 11 | 4.2% |
| Scottish | 62 | 23.5% |
| Swedish | 11 | 4.2% | View All 11 Rows |
Immigrants in Crisman

| Immigration Origin | # Population | % Population | View All 0 Rows |
Sex and Age in Crisman
Sex and Age in Crisman
The most populous age groups in Crisman are 45 to 49 Years (27 | 21.4%) for men and 60 to 64 Years (29 | 21.0%) for women.
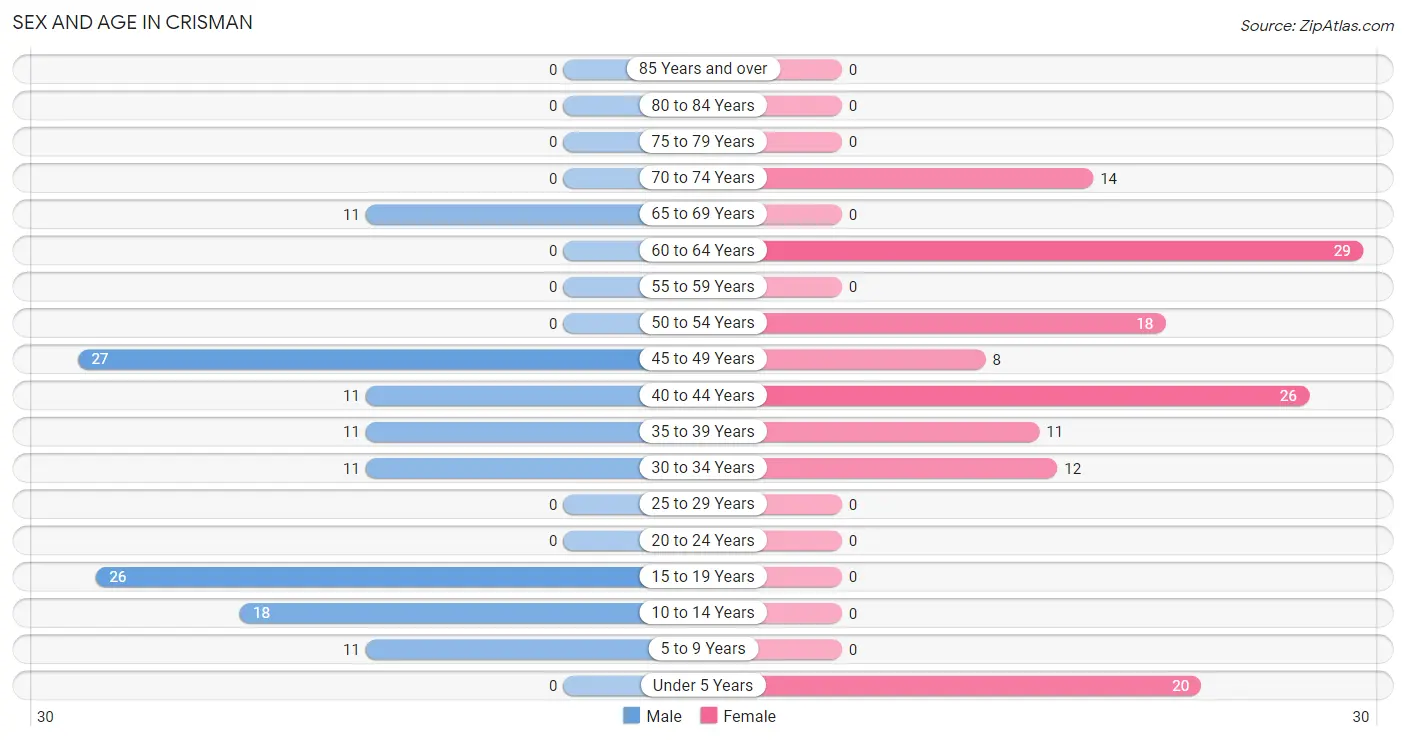
| Age Bracket | Male | Female |
| Under 5 Years | 0 (0.0%) | 20 (14.5%) |
| 5 to 9 Years | 11 (8.7%) | 0 (0.0%) |
| 10 to 14 Years | 18 (14.3%) | 0 (0.0%) |
| 15 to 19 Years | 26 (20.6%) | 0 (0.0%) |
| 20 to 24 Years | 0 (0.0%) | 0 (0.0%) |
| 25 to 29 Years | 0 (0.0%) | 0 (0.0%) |
| 30 to 34 Years | 11 (8.7%) | 12 (8.7%) |
| 35 to 39 Years | 11 (8.7%) | 11 (8.0%) |
| 40 to 44 Years | 11 (8.7%) | 26 (18.8%) |
| 45 to 49 Years | 27 (21.4%) | 8 (5.8%) |
| 50 to 54 Years | 0 (0.0%) | 18 (13.0%) |
| 55 to 59 Years | 0 (0.0%) | 0 (0.0%) |
| 60 to 64 Years | 0 (0.0%) | 29 (21.0%) |
| 65 to 69 Years | 11 (8.7%) | 0 (0.0%) |
| 70 to 74 Years | 0 (0.0%) | 14 (10.1%) |
| 75 to 79 Years | 0 (0.0%) | 0 (0.0%) |
| 80 to 84 Years | 0 (0.0%) | 0 (0.0%) |
| 85 Years and over | 0 (0.0%) | 0 (0.0%) |
| Total | 126 (100.0%) | 138 (100.0%) |
Families and Households in Crisman
Median Family Size in Crisman
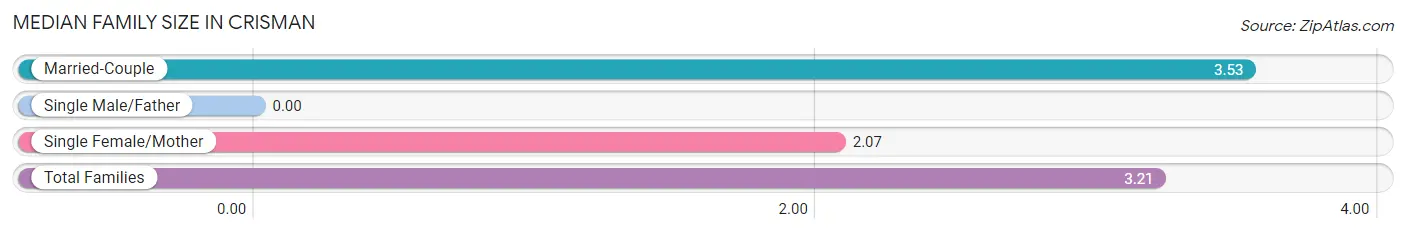
| Family Type | # Families | Family Size |
| Married-Couple | 49 (77.8%) | 3.53 |
| Single Male/Father | 0 (0.0%) | - |
| Single Female/Mother | 14 (22.2%) | 2.07 |
| Total Families | 63 (100.0%) | 3.21 |
Median Household Size in Crisman
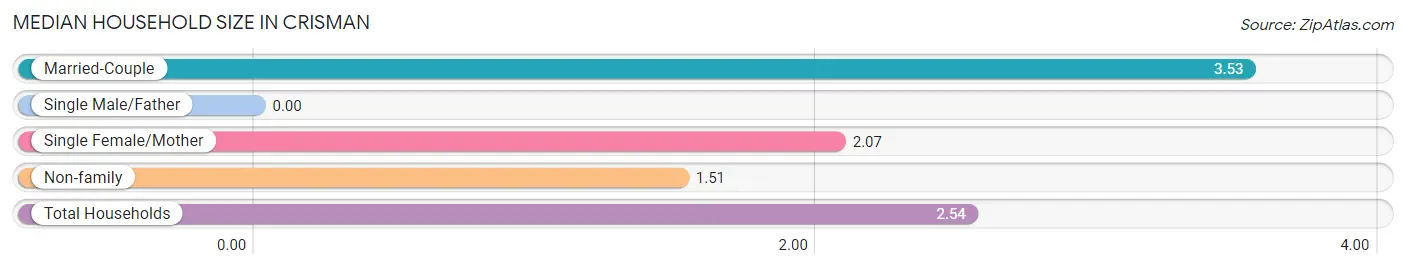
| Household Type | # Households | Household Size |
| Married-Couple | 49 (47.1%) | 3.53 |
| Single Male/Father | 0 (0.0%) | - |
| Single Female/Mother | 14 (13.5%) | 2.07 |
| Non-family | 41 (39.4%) | 1.51 |
| Total Households | 104 (100.0%) | 2.54 |
Household Size by Marriage Status in Crisman
Out of a total of 104 households in Crisman, 63 (60.6%) are family households, while 41 (39.4%) are nonfamily households. The most numerous type of family households are 4-person households, comprising 29, and the most common type of nonfamily households are 2-person households, comprising 22.
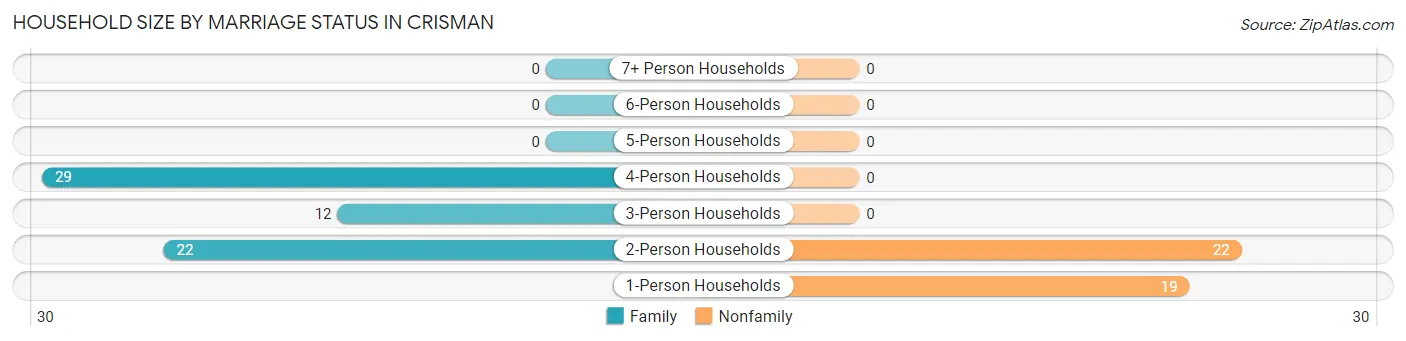
| Household Size | Family Households | Nonfamily Households |
| 1-Person Households | - | 19 (18.3%) |
| 2-Person Households | 22 (21.1%) | 22 (21.1%) |
| 3-Person Households | 12 (11.5%) | 0 (0.0%) |
| 4-Person Households | 29 (27.9%) | 0 (0.0%) |
| 5-Person Households | 0 (0.0%) | 0 (0.0%) |
| 6-Person Households | 0 (0.0%) | 0 (0.0%) |
| 7+ Person Households | 0 (0.0%) | 0 (0.0%) |
| Total | 63 (60.6%) | 41 (39.4%) |
Female Fertility in Crisman
Fertility by Age in Crisman
| Age Bracket | Women with Births | Births / 1,000 Women |
| 15 to 19 years | 0 (0.0%) | 0.0 |
| 20 to 34 years | 0 (0.0%) | 0.0 |
| 35 to 50 years | 0 (0.0%) | 0.0 |
| Total | 0 (0.0%) | 0.0 |
Fertility by Age by Marriage Status in Crisman
| Age Bracket | Married | Unmarried |
| 15 to 19 years | 0 (0.0%) | 0 (0.0%) |
| 20 to 34 years | 0 (0.0%) | 0 (0.0%) |
| 35 to 50 years | 0 (0.0%) | 0 (0.0%) |
| Total | 0 (0.0%) | 0 (0.0%) |
Fertility by Education in Crisman
| Educational Attainment | Women with Births | Births / 1,000 Women |
| Less than High School | 0 (0.0%) | 0.0 |
| High School Diploma | 0 (0.0%) | 0.0 |
| College or Associate's Degree | 0 (0.0%) | 0.0 |
| Bachelor's Degree | 0 (0.0%) | 0.0 |
| Graduate Degree | 0 (0.0%) | 0.0 |
| Total | 0 (0.0%) | 0.0 |
Fertility by Education by Marriage Status in Crisman
| Educational Attainment | Married | Unmarried |
| Less than High School | 0 (0.0%) | 0 (0.0%) |
| High School Diploma | 0 (0.0%) | 0 (0.0%) |
| College or Associate's Degree | 0 (0.0%) | 0 (0.0%) |
| Bachelor's Degree | 0 (0.0%) | 0 (0.0%) |
| Graduate Degree | 0 (0.0%) | 0 (0.0%) |
| Total | 0 (0.0%) | 0 (0.0%) |
Employment Characteristics in Crisman
Employment by Class of Employer in Crisman
Among the 130 employed individuals in Crisman, private company employees (52 | 40.0%), self-employed (not incorporated) (28 | 21.5%), and federal government employees (18 | 13.9%) make up the most common classes of employment.
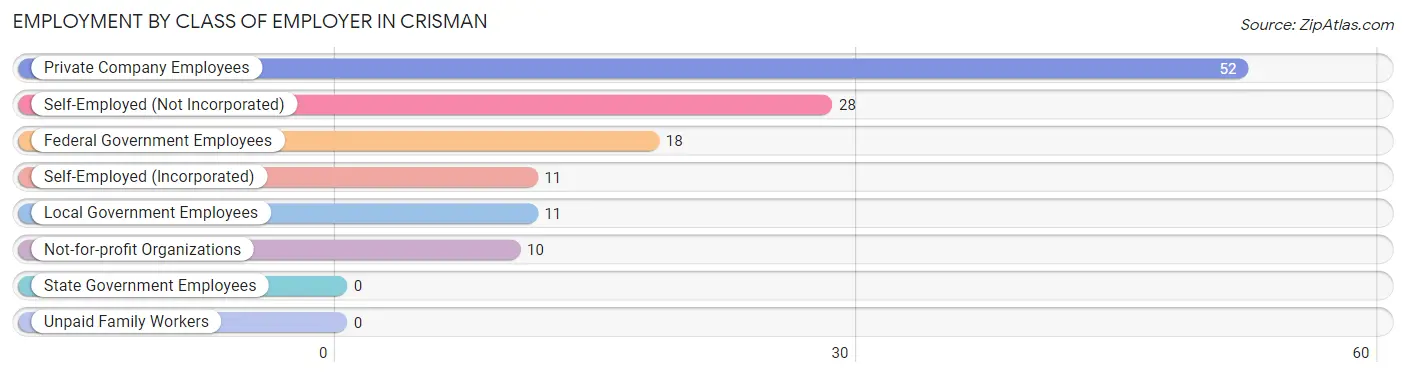
| Employer Class | # Employees | % Employees |
| Private Company Employees | 52 | 40.0% |
| Self-Employed (Incorporated) | 11 | 8.5% |
| Self-Employed (Not Incorporated) | 28 | 21.5% |
| Not-for-profit Organizations | 10 | 7.7% |
| Local Government Employees | 11 | 8.5% |
| State Government Employees | 0 | 0.0% |
| Federal Government Employees | 18 | 13.9% |
| Unpaid Family Workers | 0 | 0.0% |
| Total | 130 | 100.0% |
Employment Status by Age in Crisman
According to the labor force statistics for Crisman, out of the total population over 16 years of age (215), 76.3% or 164 individuals are in the labor force, with 9.1% or 15 of them unemployed. The age group with the highest labor force participation rate is 30 to 34 years, with 100.0% or 23 individuals in the labor force. Within the labor force, the 35 to 44 years age range has the highest percentage of unemployed individuals, with 25.4% or 15 of them being unemployed.
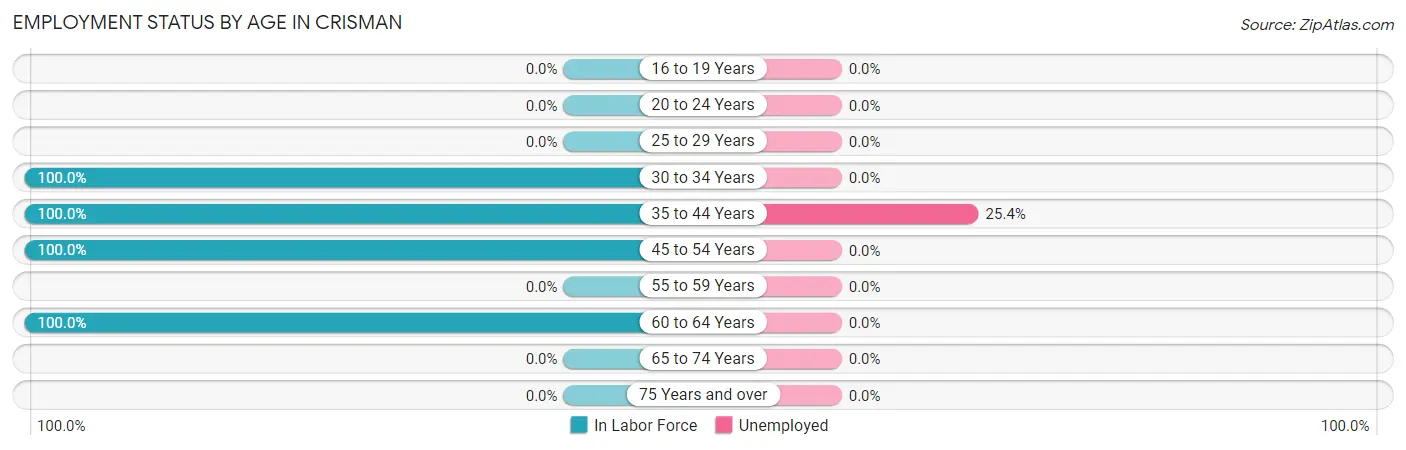
| Age Bracket | In Labor Force | Unemployed |
| 16 to 19 Years | 0 (0.0%) | 0 (0.0%) |
| 20 to 24 Years | 0 (0.0%) | 0 (0.0%) |
| 25 to 29 Years | 0 (0.0%) | 0 (0.0%) |
| 30 to 34 Years | 23 (100.0%) | 0 (0.0%) |
| 35 to 44 Years | 59 (100.0%) | 15 (25.4%) |
| 45 to 54 Years | 53 (100.0%) | 0 (0.0%) |
| 55 to 59 Years | 0 (0.0%) | 0 (0.0%) |
| 60 to 64 Years | 29 (100.0%) | 0 (0.0%) |
| 65 to 74 Years | 0 (0.0%) | 0 (0.0%) |
| 75 Years and over | 0 (0.0%) | 0 (0.0%) |
| Total | 164 (76.3%) | 15 (9.1%) |
Employment Status by Educational Attainment in Crisman
According to labor force statistics for Crisman, 100.0% of individuals (164) out of the total population between 25 and 64 years of age (164) are in the labor force, with 9.1% or 15 of them being unemployed. The group with the highest labor force participation rate are those with the educational attainment of college / associate degree, with 100.0% or 17 individuals in the labor force. Within the labor force, individuals with bachelor's degree or higher education have the highest percentage of unemployment, with 10.2% or 15 of them being unemployed.
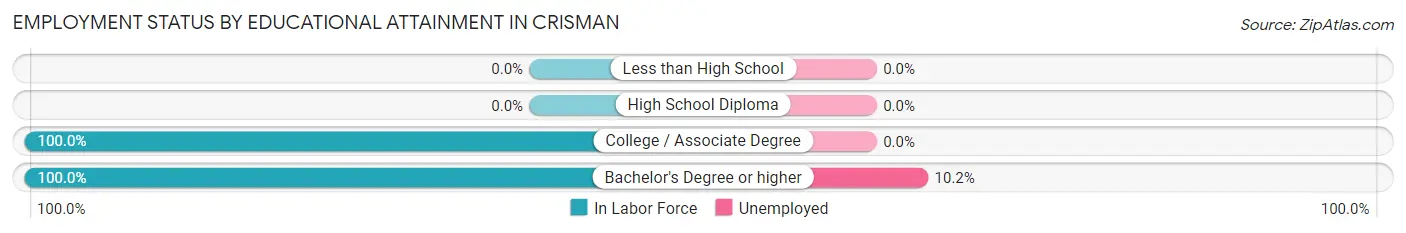
| Educational Attainment | In Labor Force | Unemployed |
| Less than High School | 0 (0.0%) | 0 (0.0%) |
| High School Diploma | 0 (0.0%) | 0 (0.0%) |
| College / Associate Degree | 17 (100.0%) | 0 (0.0%) |
| Bachelor's Degree or higher | 147 (100.0%) | 15 (10.2%) |
| Total | 164 (100.0%) | 15 (9.1%) |
Employment Occupations by Sex in Crisman
Management, Business, Science and Arts Occupations
The most common Management, Business, Science and Arts occupations in Crisman are Business & Financial (33 | 22.2%), Management (29 | 19.5%), Computers, Engineering & Science (29 | 19.5%), Architecture & Engineering (29 | 19.5%), and Community & Social Service (11 | 7.4%).
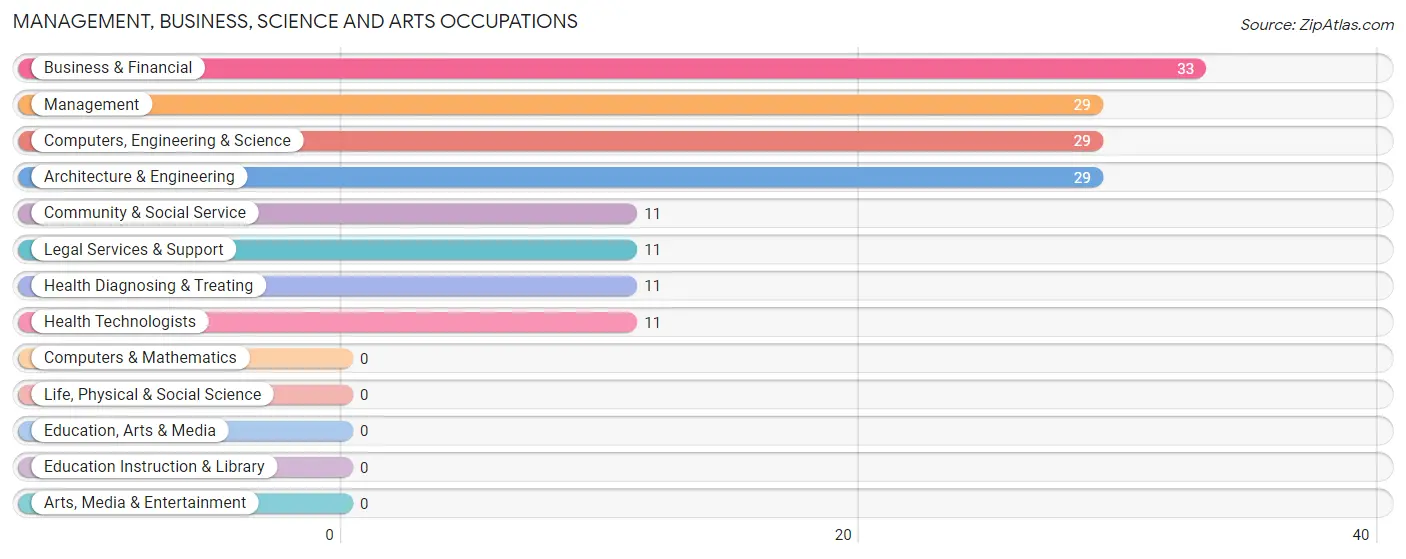
Management, Business, Science and Arts Occupations by Sex
Within the Management, Business, Science and Arts occupations in Crisman, the most male-oriented occupations are Computers, Engineering & Science (100.0%), Architecture & Engineering (100.0%), and Community & Social Service (100.0%), while the most female-oriented occupations are Management (100.0%), and Business & Financial (100.0%).
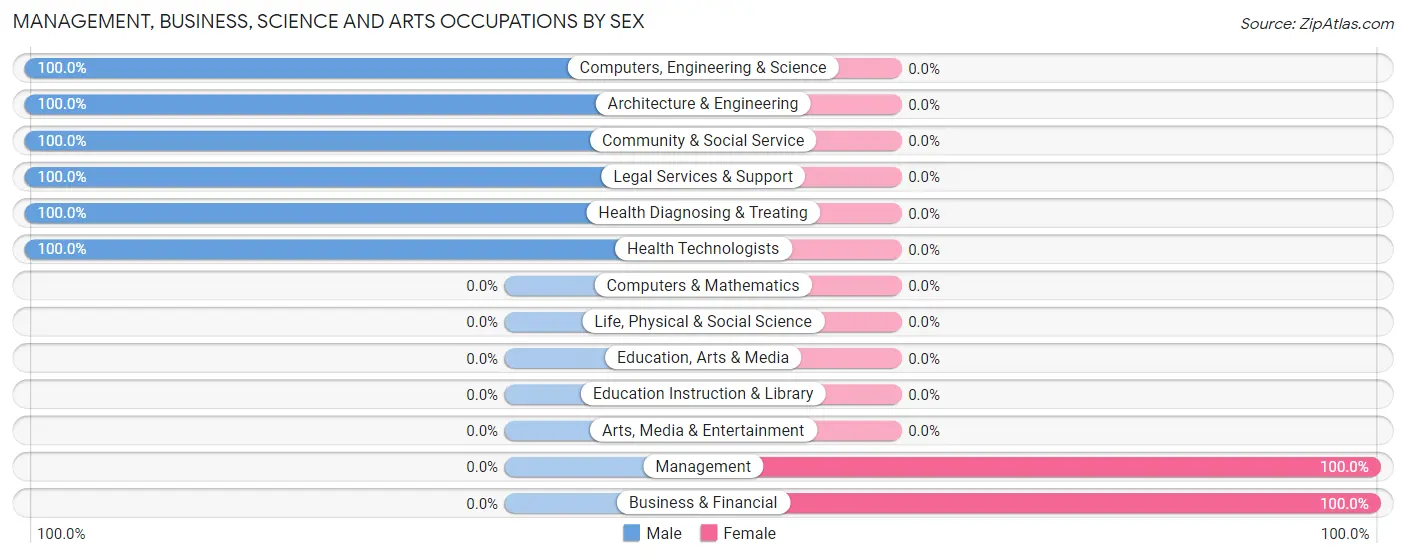
| Occupation | Male | Female |
| Management | 0 (0.0%) | 29 (100.0%) |
| Business & Financial | 0 (0.0%) | 33 (100.0%) |
| Computers, Engineering & Science | 29 (100.0%) | 0 (0.0%) |
| Computers & Mathematics | 0 (0.0%) | 0 (0.0%) |
| Architecture & Engineering | 29 (100.0%) | 0 (0.0%) |
| Life, Physical & Social Science | 0 (0.0%) | 0 (0.0%) |
| Community & Social Service | 11 (100.0%) | 0 (0.0%) |
| Education, Arts & Media | 0 (0.0%) | 0 (0.0%) |
| Legal Services & Support | 11 (100.0%) | 0 (0.0%) |
| Education Instruction & Library | 0 (0.0%) | 0 (0.0%) |
| Arts, Media & Entertainment | 0 (0.0%) | 0 (0.0%) |
| Health Diagnosing & Treating | 11 (100.0%) | 0 (0.0%) |
| Health Technologists | 11 (100.0%) | 0 (0.0%) |
| Total (Category) | 51 (45.1%) | 62 (54.9%) |
| Total (Overall) | 60 (40.3%) | 89 (59.7%) |
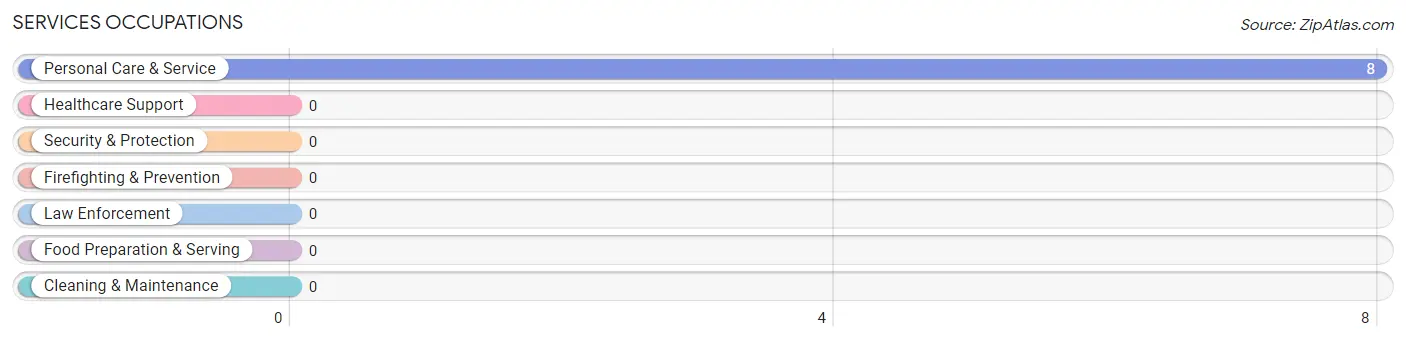
Services Occupations
The most common Services occupations in Crisman are , and Personal Care & Service (8 | 5.4%).
Services Occupations by Sex
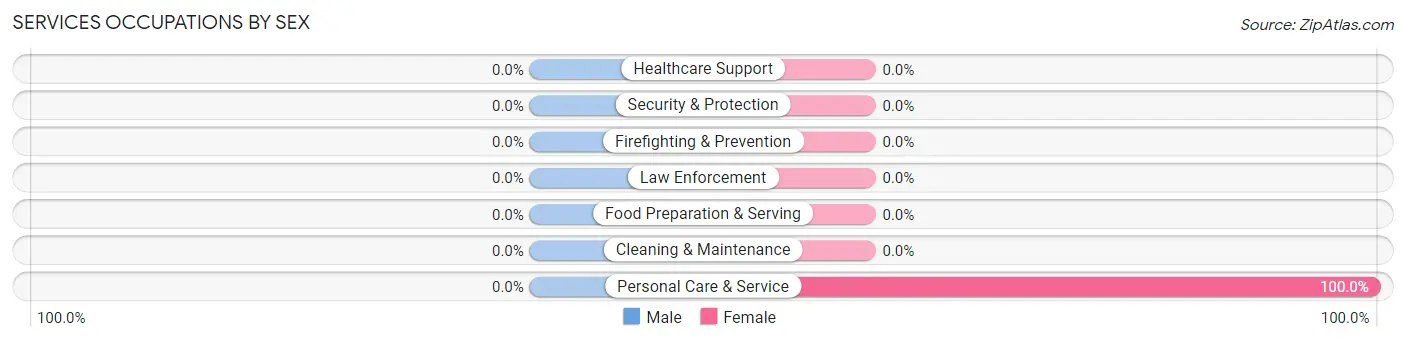
| Occupation | Male | Female |
| Healthcare Support | 0 (0.0%) | 0 (0.0%) |
| Security & Protection | 0 (0.0%) | 0 (0.0%) |
| Firefighting & Prevention | 0 (0.0%) | 0 (0.0%) |
| Law Enforcement | 0 (0.0%) | 0 (0.0%) |
| Food Preparation & Serving | 0 (0.0%) | 0 (0.0%) |
| Cleaning & Maintenance | 0 (0.0%) | 0 (0.0%) |
| Personal Care & Service | 0 (0.0%) | 8 (100.0%) |
| Total (Category) | 0 (0.0%) | 8 (100.0%) |
| Total (Overall) | 60 (40.3%) | 89 (59.7%) |
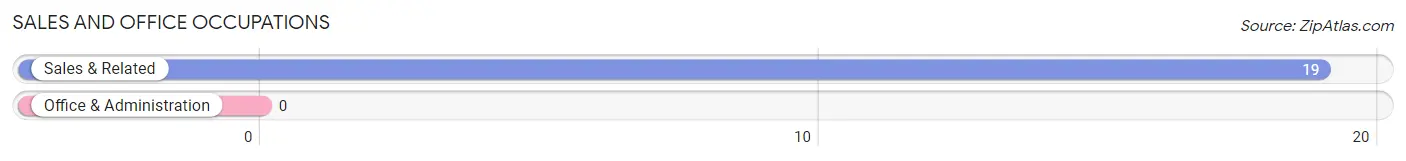
Sales and Office Occupations
The most common Sales and Office occupations in Crisman are , and Sales & Related (19 | 12.8%).
Sales and Office Occupations by Sex
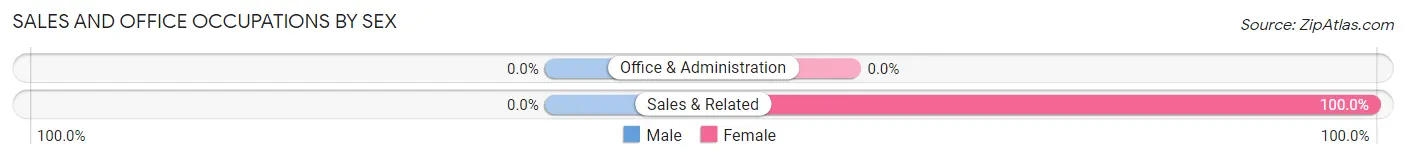
| Occupation | Male | Female |
| Sales & Related | 0 (0.0%) | 19 (100.0%) |
| Office & Administration | 0 (0.0%) | 0 (0.0%) |
| Total (Category) | 0 (0.0%) | 19 (100.0%) |
| Total (Overall) | 60 (40.3%) | 89 (59.7%) |
Natural Resources, Construction and Maintenance Occupations
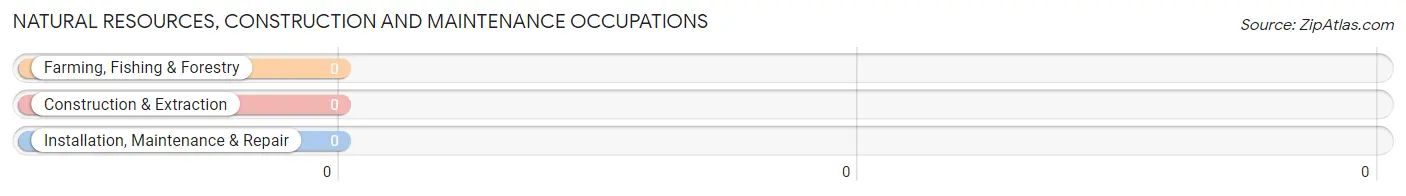
Natural Resources, Construction and Maintenance Occupations by Sex
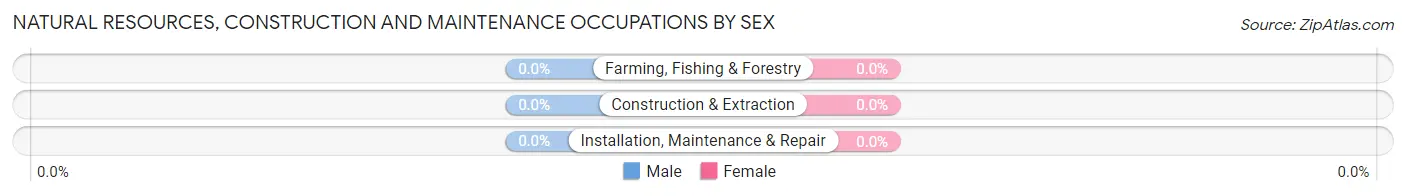
| Occupation | Male | Female |
| Farming, Fishing & Forestry | 0 (0.0%) | 0 (0.0%) |
| Construction & Extraction | 0 (0.0%) | 0 (0.0%) |
| Installation, Maintenance & Repair | 0 (0.0%) | 0 (0.0%) |
| Total (Category) | 0 (0.0%) | 0 (0.0%) |
| Total (Overall) | 60 (40.3%) | 89 (59.7%) |
Production, Transportation and Moving Occupations
The most common Production, Transportation and Moving occupations in Crisman are , and Material Moving (9 | 6.0%).
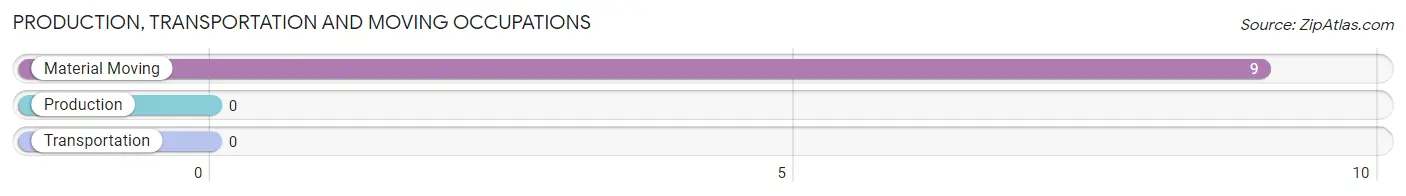
Production, Transportation and Moving Occupations by Sex
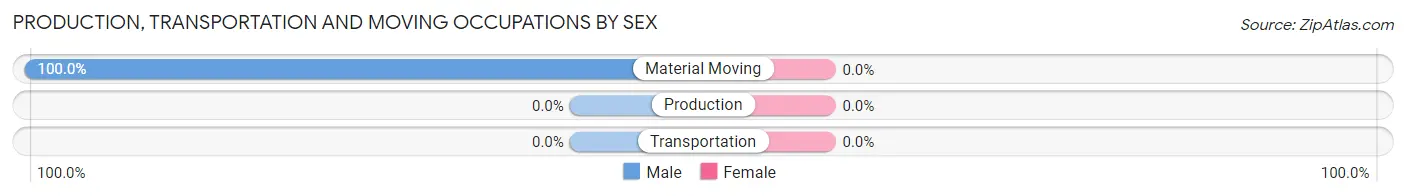
| Occupation | Male | Female |
| Production | 0 (0.0%) | 0 (0.0%) |
| Transportation | 0 (0.0%) | 0 (0.0%) |
| Material Moving | 9 (100.0%) | 0 (0.0%) |
| Total (Category) | 9 (100.0%) | 0 (0.0%) |
| Total (Overall) | 60 (40.3%) | 89 (59.7%) |
Employment Industries by Sex in Crisman
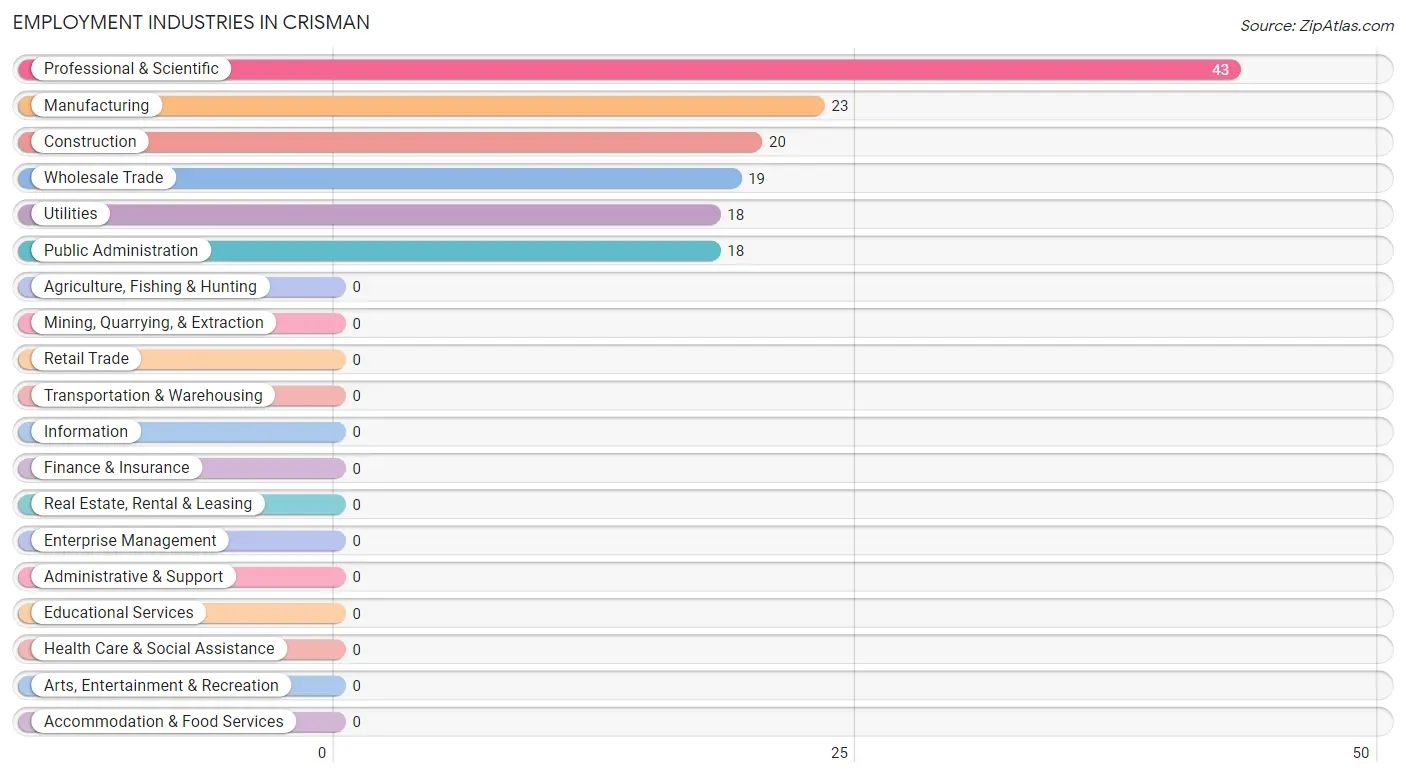
Employment Industries in Crisman
The major employment industries in Crisman include Professional & Scientific (43 | 28.9%), Manufacturing (23 | 15.4%), Construction (20 | 13.4%), Wholesale Trade (19 | 12.8%), and Utilities (18 | 12.1%).
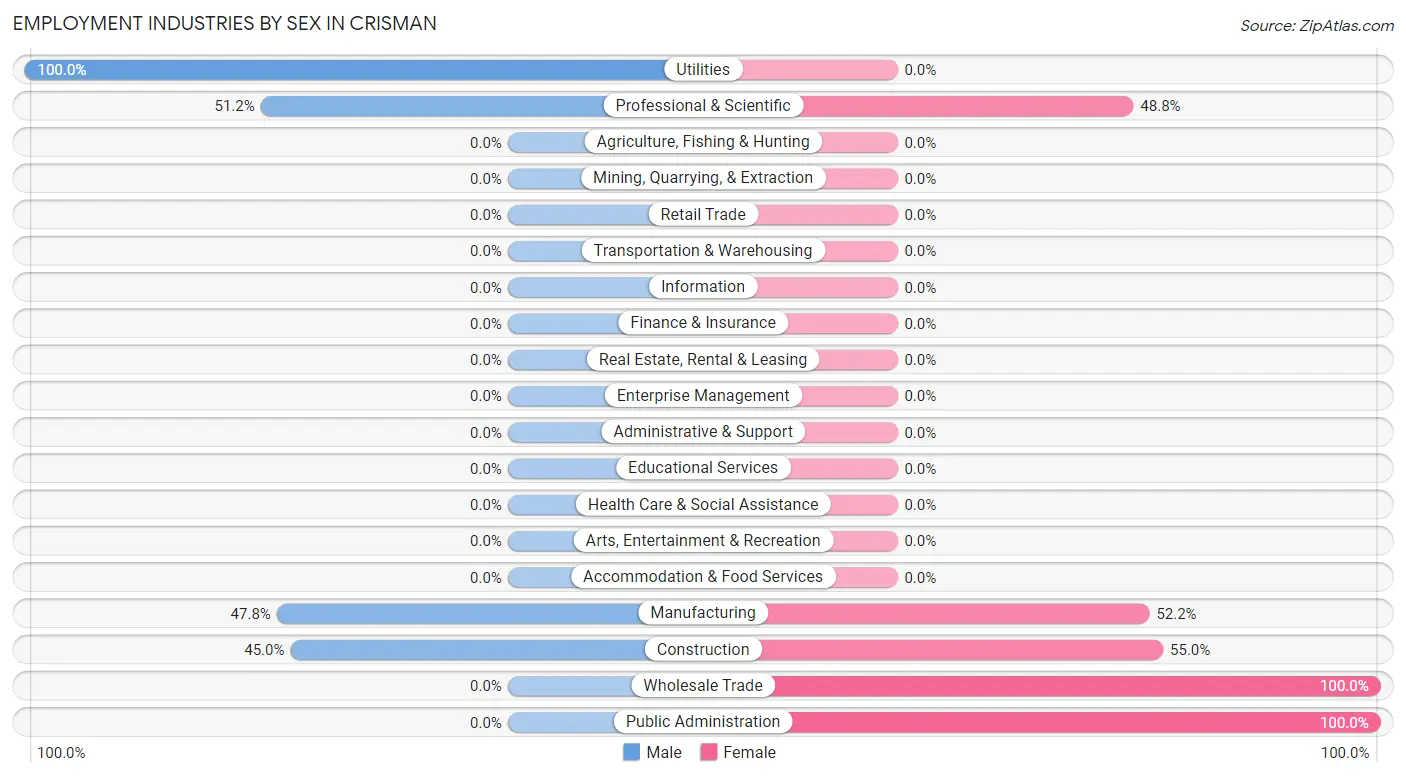
Employment Industries by Sex in Crisman
The Crisman industries that see more men than women are Utilities (100.0%), Professional & Scientific (51.2%), and Manufacturing (47.8%), whereas the industries that tend to have a higher number of women are Wholesale Trade (100.0%), Public Administration (100.0%), and Construction (55.0%).
| Industry | Male | Female |
| Agriculture, Fishing & Hunting | 0 (0.0%) | 0 (0.0%) |
| Mining, Quarrying, & Extraction | 0 (0.0%) | 0 (0.0%) |
| Construction | 9 (45.0%) | 11 (55.0%) |
| Manufacturing | 11 (47.8%) | 12 (52.2%) |
| Wholesale Trade | 0 (0.0%) | 19 (100.0%) |
| Retail Trade | 0 (0.0%) | 0 (0.0%) |
| Transportation & Warehousing | 0 (0.0%) | 0 (0.0%) |
| Utilities | 18 (100.0%) | 0 (0.0%) |
| Information | 0 (0.0%) | 0 (0.0%) |
| Finance & Insurance | 0 (0.0%) | 0 (0.0%) |
| Real Estate, Rental & Leasing | 0 (0.0%) | 0 (0.0%) |
| Professional & Scientific | 22 (51.2%) | 21 (48.8%) |
| Enterprise Management | 0 (0.0%) | 0 (0.0%) |
| Administrative & Support | 0 (0.0%) | 0 (0.0%) |
| Educational Services | 0 (0.0%) | 0 (0.0%) |
| Health Care & Social Assistance | 0 (0.0%) | 0 (0.0%) |
| Arts, Entertainment & Recreation | 0 (0.0%) | 0 (0.0%) |
| Accommodation & Food Services | 0 (0.0%) | 0 (0.0%) |
| Public Administration | 0 (0.0%) | 18 (100.0%) |
| Total | 60 (40.3%) | 89 (59.7%) |
Education in Crisman
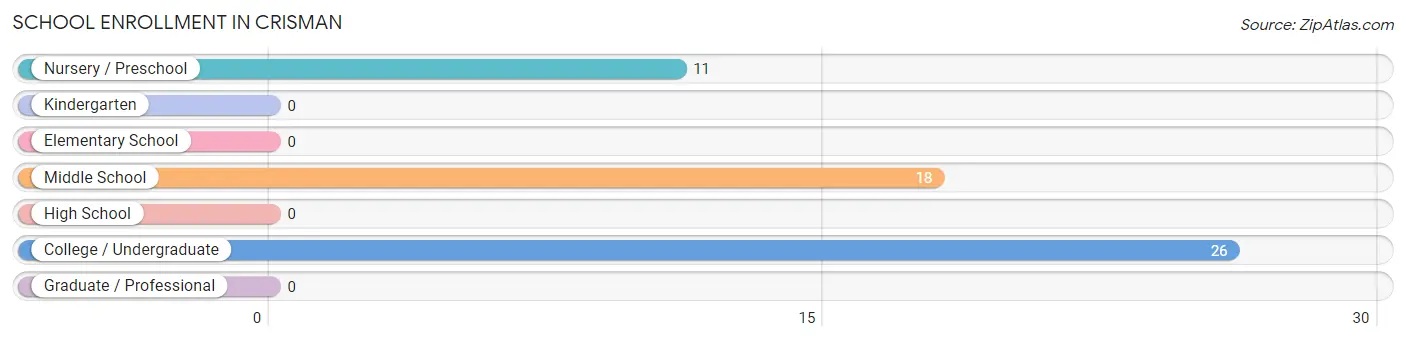
School Enrollment in Crisman
The most common levels of schooling among the 55 students in Crisman are college / undergraduate (26 | 47.3%), middle school (18 | 32.7%), and nursery / preschool (11 | 20.0%).
| School Level | # Students | % Students |
| Nursery / Preschool | 11 | 20.0% |
| Kindergarten | 0 | 0.0% |
| Elementary School | 0 | 0.0% |
| Middle School | 18 | 32.7% |
| High School | 0 | 0.0% |
| College / Undergraduate | 26 | 47.3% |
| Graduate / Professional | 0 | 0.0% |
| Total | 55 | 100.0% |
School Enrollment by Age by Funding Source in Crisman
Out of a total of 55 students who are enrolled in schools in Crisman, 11 (20.0%) attend a private institution, while the remaining 44 (80.0%) are enrolled in public schools. The age group of 5 to 9 year old has the highest likelihood of being enrolled in private schools, with 11 (100.0% in the age bracket) enrolled. Conversely, the age group of 10 to 14 year olds has the lowest likelihood of being enrolled in a private school, with 18 (100.0% in the age bracket) attending a public institution.
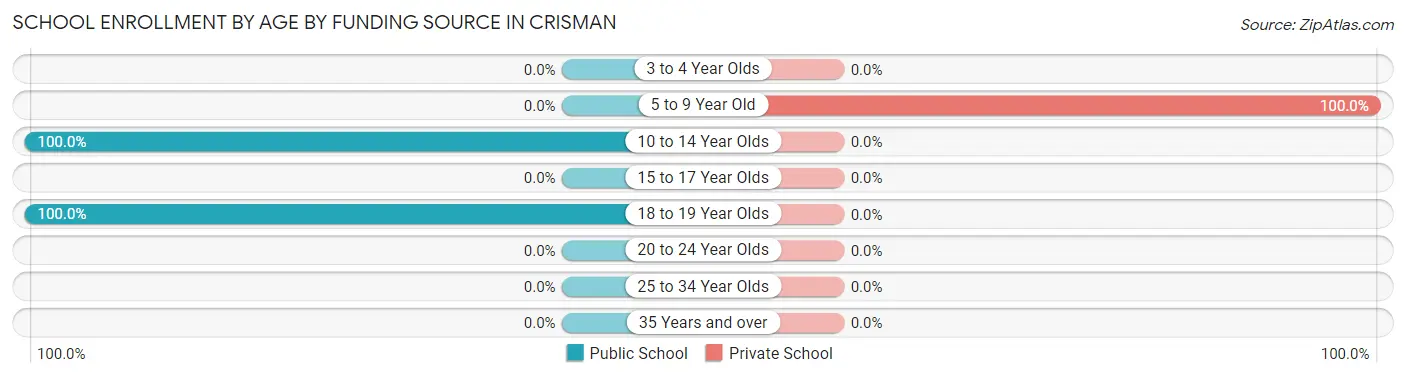
| Age Bracket | Public School | Private School |
| 3 to 4 Year Olds | 0 (0.0%) | 0 (0.0%) |
| 5 to 9 Year Old | 0 (0.0%) | 11 (100.0%) |
| 10 to 14 Year Olds | 18 (100.0%) | 0 (0.0%) |
| 15 to 17 Year Olds | 0 (0.0%) | 0 (0.0%) |
| 18 to 19 Year Olds | 26 (100.0%) | 0 (0.0%) |
| 20 to 24 Year Olds | 0 (0.0%) | 0 (0.0%) |
| 25 to 34 Year Olds | 0 (0.0%) | 0 (0.0%) |
| 35 Years and over | 0 (0.0%) | 0 (0.0%) |
| Total | 44 (80.0%) | 11 (20.0%) |
Educational Attainment by Field of Study in Crisman
Literature & languages (36 | 18.6%), bio, nature & agricultural (30 | 15.5%), engineering (29 | 14.9%), visual & performing arts (26 | 13.4%), and business (21 | 10.8%) are the most common fields of study among 194 individuals in Crisman who have obtained a bachelor's degree or higher.
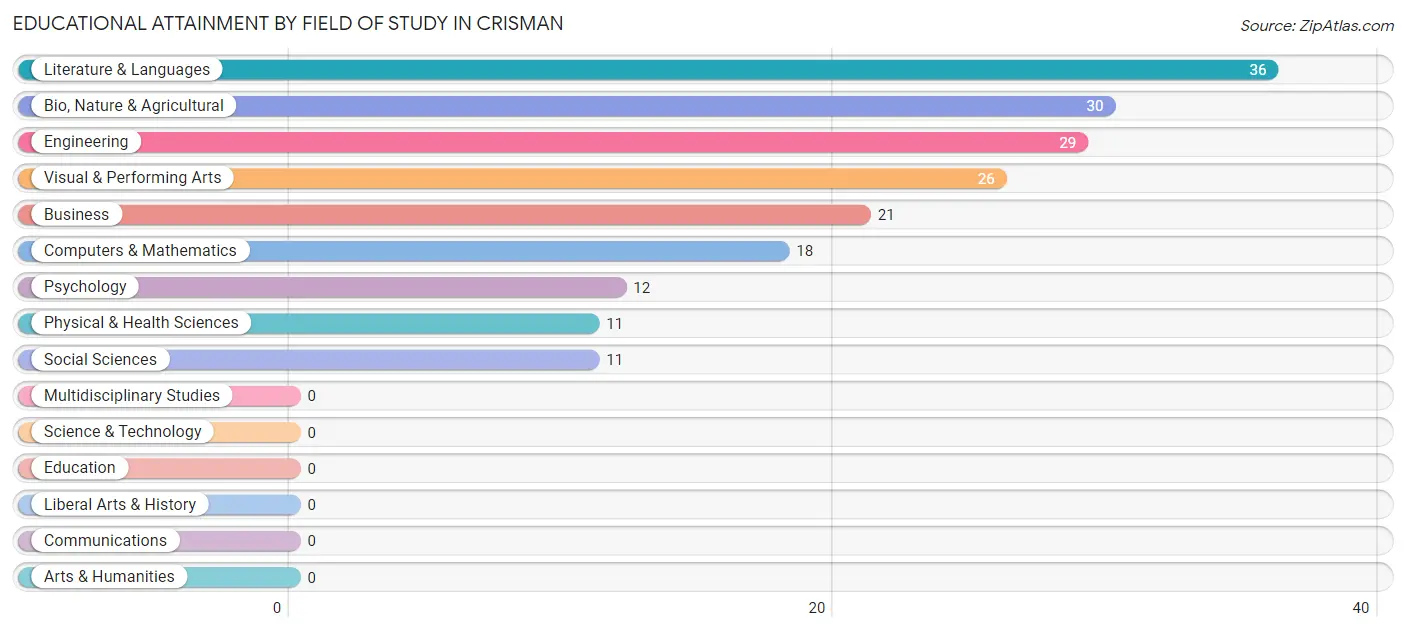
| Field of Study | # Graduates | % Graduates |
| Computers & Mathematics | 18 | 9.3% |
| Bio, Nature & Agricultural | 30 | 15.5% |
| Physical & Health Sciences | 11 | 5.7% |
| Psychology | 12 | 6.2% |
| Social Sciences | 11 | 5.7% |
| Engineering | 29 | 14.9% |
| Multidisciplinary Studies | 0 | 0.0% |
| Science & Technology | 0 | 0.0% |
| Business | 21 | 10.8% |
| Education | 0 | 0.0% |
| Literature & Languages | 36 | 18.6% |
| Liberal Arts & History | 0 | 0.0% |
| Visual & Performing Arts | 26 | 13.4% |
| Communications | 0 | 0.0% |
| Arts & Humanities | 0 | 0.0% |
| Total | 194 | 100.0% |
Transportation & Commute in Crisman
Vehicle Availability by Sex in Crisman
The most prevalent vehicle ownership categories in Crisman are males with 3 vehicles (27, accounting for 45.0%) and females with 3 vehicles (36, making up 38.6%).
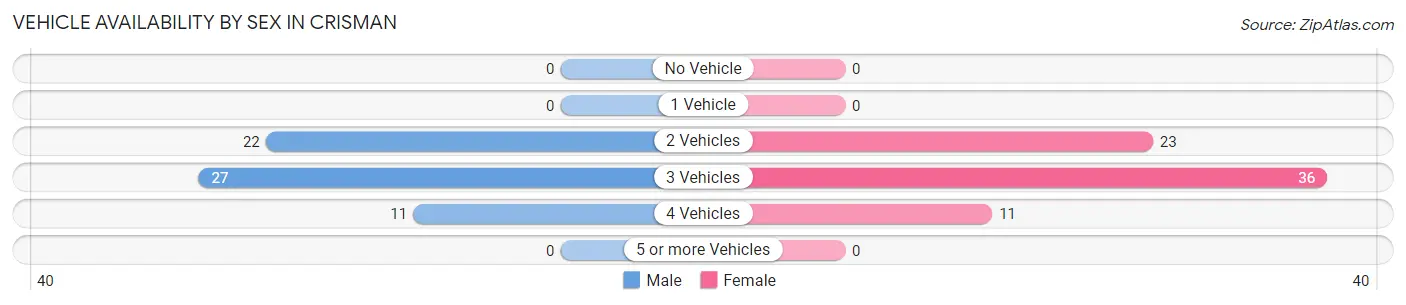
| Vehicles Available | Male | Female |
| No Vehicle | 0 (0.0%) | 0 (0.0%) |
| 1 Vehicle | 0 (0.0%) | 0 (0.0%) |
| 2 Vehicles | 22 (36.7%) | 23 (32.9%) |
| 3 Vehicles | 27 (45.0%) | 36 (51.4%) |
| 4 Vehicles | 11 (18.3%) | 11 (15.7%) |
| 5 or more Vehicles | 0 (0.0%) | 0 (0.0%) |
| Total | 60 (100.0%) | 70 (100.0%) |
Commute Time in Crisman
The most frequently occuring commute durations in Crisman are 30 to 34 minutes (34 commuters, 55.7%), 20 to 24 minutes (10 commuters, 16.4%), and 60 to 89 minutes (9 commuters, 14.7%).
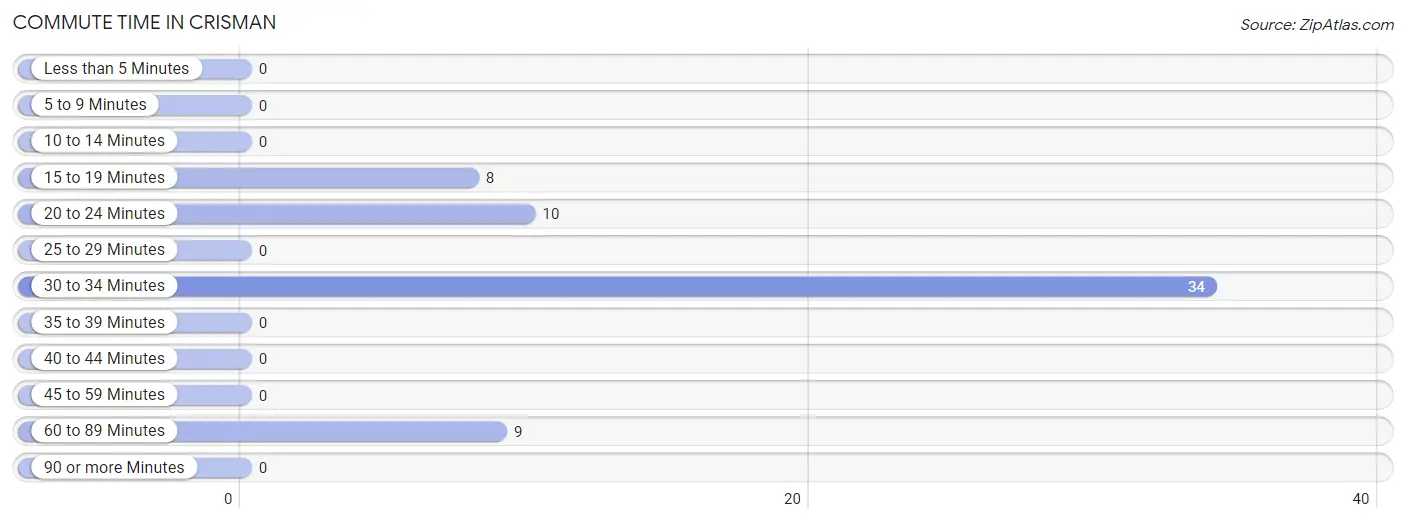
| Commute Time | # Commuters | % Commuters |
| Less than 5 Minutes | 0 | 0.0% |
| 5 to 9 Minutes | 0 | 0.0% |
| 10 to 14 Minutes | 0 | 0.0% |
| 15 to 19 Minutes | 8 | 13.1% |
| 20 to 24 Minutes | 10 | 16.4% |
| 25 to 29 Minutes | 0 | 0.0% |
| 30 to 34 Minutes | 34 | 55.7% |
| 35 to 39 Minutes | 0 | 0.0% |
| 40 to 44 Minutes | 0 | 0.0% |
| 45 to 59 Minutes | 0 | 0.0% |
| 60 to 89 Minutes | 9 | 14.7% |
| 90 or more Minutes | 0 | 0.0% |
Commute Time by Sex in Crisman
The most common commute times in Crisman are 30 to 34 minutes (22 commuters, 71.0%) for males and 30 to 34 minutes (12 commuters, 40.0%) for females.
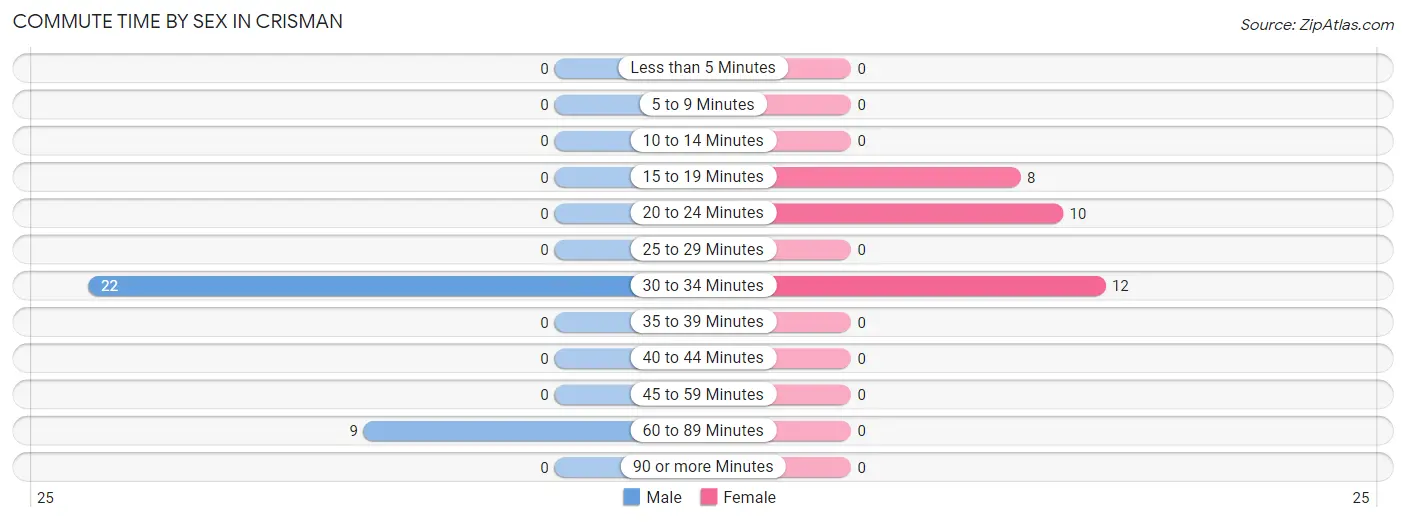
| Commute Time | Male | Female |
| Less than 5 Minutes | 0 (0.0%) | 0 (0.0%) |
| 5 to 9 Minutes | 0 (0.0%) | 0 (0.0%) |
| 10 to 14 Minutes | 0 (0.0%) | 0 (0.0%) |
| 15 to 19 Minutes | 0 (0.0%) | 8 (26.7%) |
| 20 to 24 Minutes | 0 (0.0%) | 10 (33.3%) |
| 25 to 29 Minutes | 0 (0.0%) | 0 (0.0%) |
| 30 to 34 Minutes | 22 (71.0%) | 12 (40.0%) |
| 35 to 39 Minutes | 0 (0.0%) | 0 (0.0%) |
| 40 to 44 Minutes | 0 (0.0%) | 0 (0.0%) |
| 45 to 59 Minutes | 0 (0.0%) | 0 (0.0%) |
| 60 to 89 Minutes | 9 (29.0%) | 0 (0.0%) |
| 90 or more Minutes | 0 (0.0%) | 0 (0.0%) |
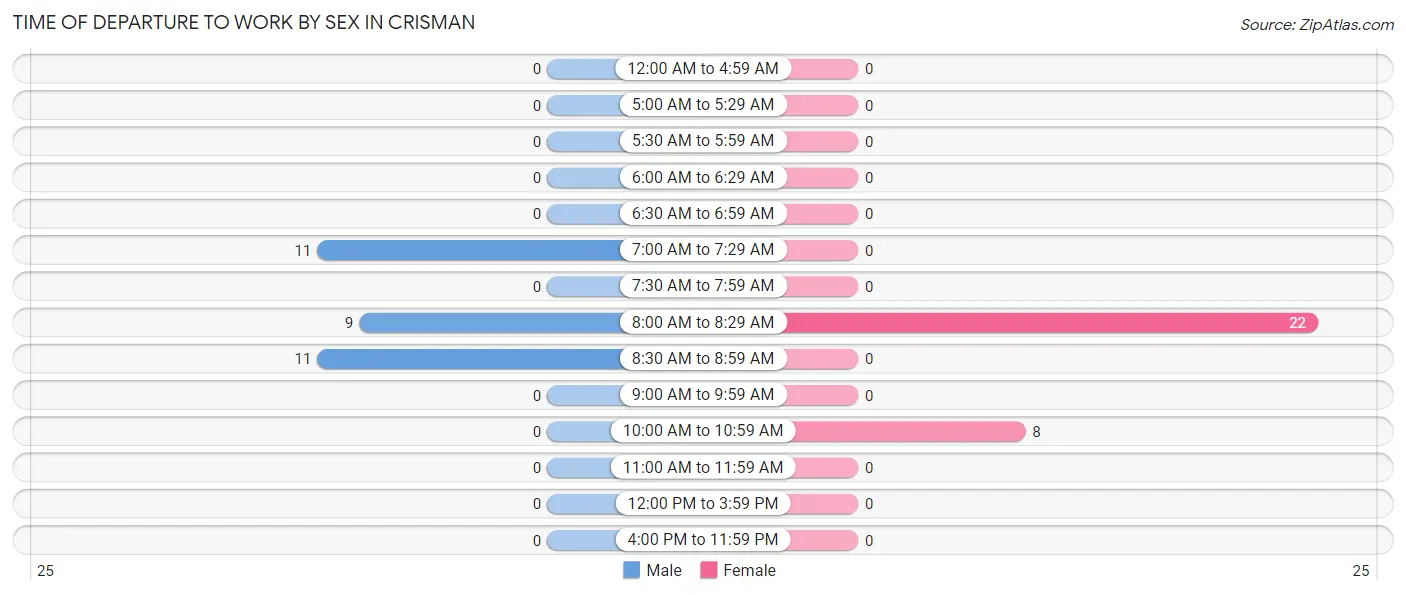
Time of Departure to Work by Sex in Crisman
The most frequent times of departure to work in Crisman are 7:00 AM to 7:29 AM (11, 35.5%) for males and 8:00 AM to 8:29 AM (22, 73.3%) for females.
| Time of Departure | Male | Female |
| 12:00 AM to 4:59 AM | 0 (0.0%) | 0 (0.0%) |
| 5:00 AM to 5:29 AM | 0 (0.0%) | 0 (0.0%) |
| 5:30 AM to 5:59 AM | 0 (0.0%) | 0 (0.0%) |
| 6:00 AM to 6:29 AM | 0 (0.0%) | 0 (0.0%) |
| 6:30 AM to 6:59 AM | 0 (0.0%) | 0 (0.0%) |
| 7:00 AM to 7:29 AM | 11 (35.5%) | 0 (0.0%) |
| 7:30 AM to 7:59 AM | 0 (0.0%) | 0 (0.0%) |
| 8:00 AM to 8:29 AM | 9 (29.0%) | 22 (73.3%) |
| 8:30 AM to 8:59 AM | 11 (35.5%) | 0 (0.0%) |
| 9:00 AM to 9:59 AM | 0 (0.0%) | 0 (0.0%) |
| 10:00 AM to 10:59 AM | 0 (0.0%) | 8 (26.7%) |
| 11:00 AM to 11:59 AM | 0 (0.0%) | 0 (0.0%) |
| 12:00 PM to 3:59 PM | 0 (0.0%) | 0 (0.0%) |
| 4:00 PM to 11:59 PM | 0 (0.0%) | 0 (0.0%) |
| Total | 31 (100.0%) | 30 (100.0%) |
Housing Occupancy in Crisman
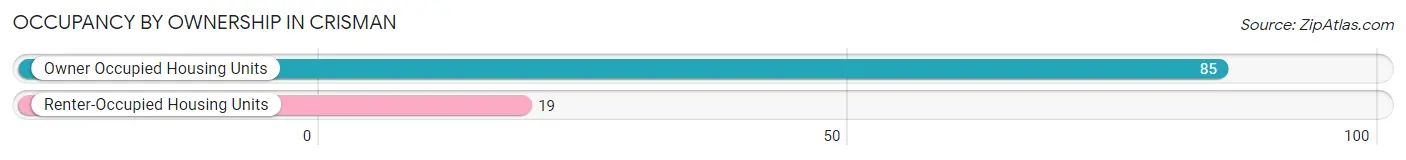
Occupancy by Ownership in Crisman
Of the total 104 dwellings in Crisman, owner-occupied units account for 85 (81.7%), while renter-occupied units make up 19 (18.3%).
| Occupancy | # Housing Units | % Housing Units |
| Owner Occupied Housing Units | 85 | 81.7% |
| Renter-Occupied Housing Units | 19 | 18.3% |
| Total Occupied Housing Units | 104 | 100.0% |
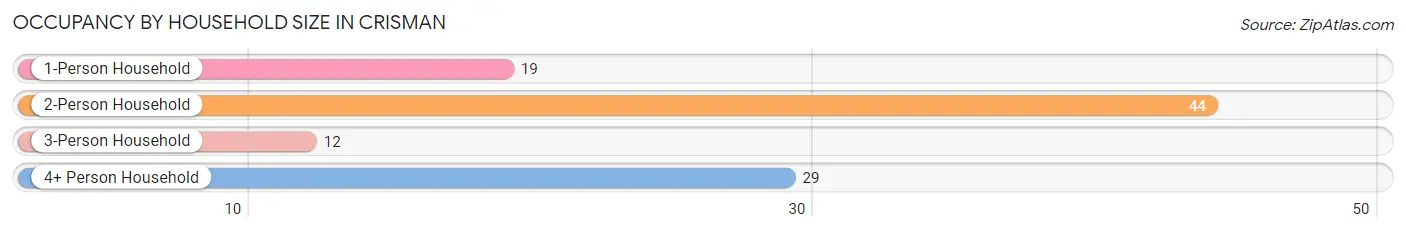
Occupancy by Household Size in Crisman
| Household Size | # Housing Units | % Housing Units |
| 1-Person Household | 19 | 18.3% |
| 2-Person Household | 44 | 42.3% |
| 3-Person Household | 12 | 11.5% |
| 4+ Person Household | 29 | 27.9% |
| Total Housing Units | 104 | 100.0% |
Occupancy by Ownership by Household Size in Crisman
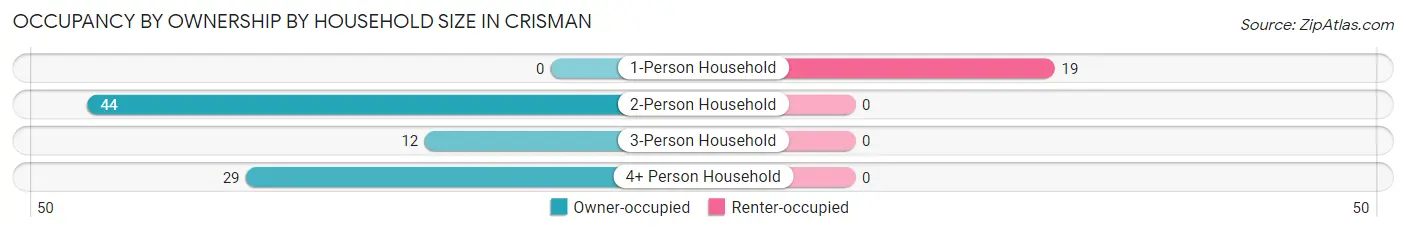
| Household Size | Owner-occupied | Renter-occupied |
| 1-Person Household | 0 (0.0%) | 19 (100.0%) |
| 2-Person Household | 44 (100.0%) | 0 (0.0%) |
| 3-Person Household | 12 (100.0%) | 0 (0.0%) |
| 4+ Person Household | 29 (100.0%) | 0 (0.0%) |
| Total Housing Units | 85 (81.7%) | 19 (18.3%) |
Occupancy by Educational Attainment in Crisman
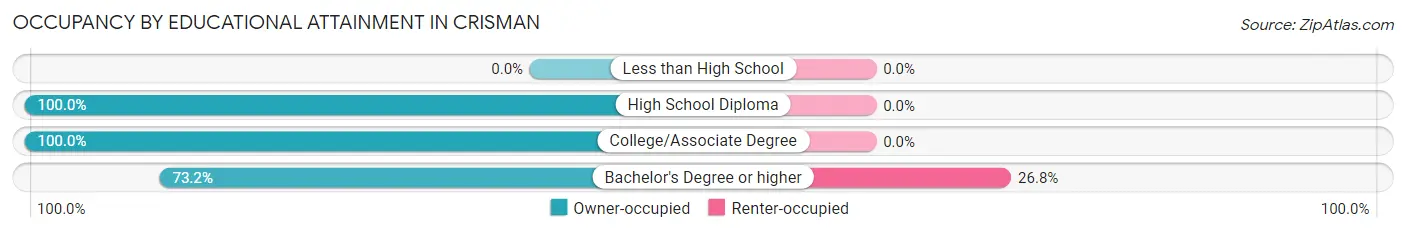
| Household Size | Owner-occupied | Renter-occupied |
| Less than High School | 0 (0.0%) | 0 (0.0%) |
| High School Diploma | 11 (100.0%) | 0 (0.0%) |
| College/Associate Degree | 22 (100.0%) | 0 (0.0%) |
| Bachelor's Degree or higher | 52 (73.2%) | 19 (26.8%) |
Occupancy by Age of Householder in Crisman
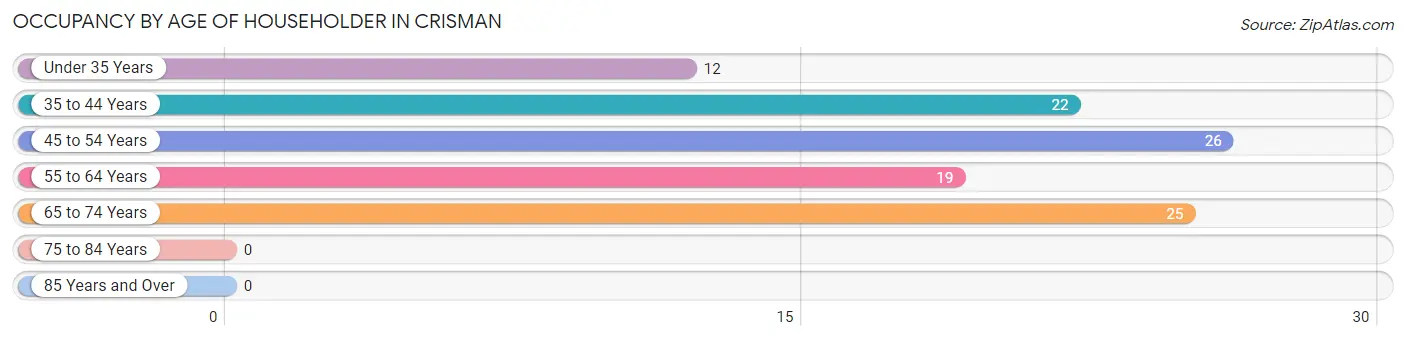
| Age Bracket | # Households | % Households |
| Under 35 Years | 12 | 11.5% |
| 35 to 44 Years | 22 | 21.1% |
| 45 to 54 Years | 26 | 25.0% |
| 55 to 64 Years | 19 | 18.3% |
| 65 to 74 Years | 25 | 24.0% |
| 75 to 84 Years | 0 | 0.0% |
| 85 Years and Over | 0 | 0.0% |
| Total | 104 | 100.0% |
Housing Finances in Crisman
Median Income by Occupancy in Crisman
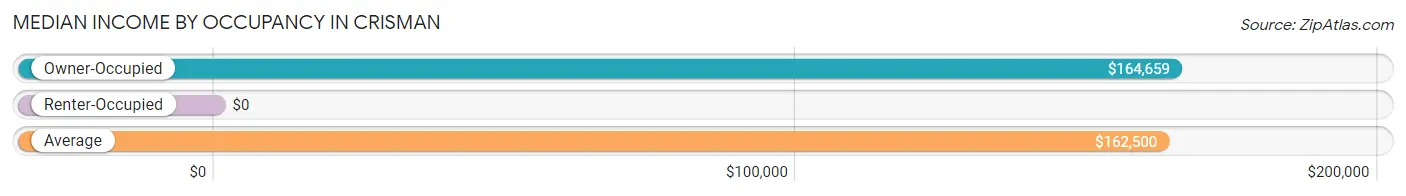
| Occupancy Type | # Households | Median Income |
| Owner-Occupied | 85 (81.7%) | $164,659 |
| Renter-Occupied | 19 (18.3%) | $0 |
| Average | 104 (100.0%) | $162,500 |
Occupancy by Householder Income Bracket in Crisman
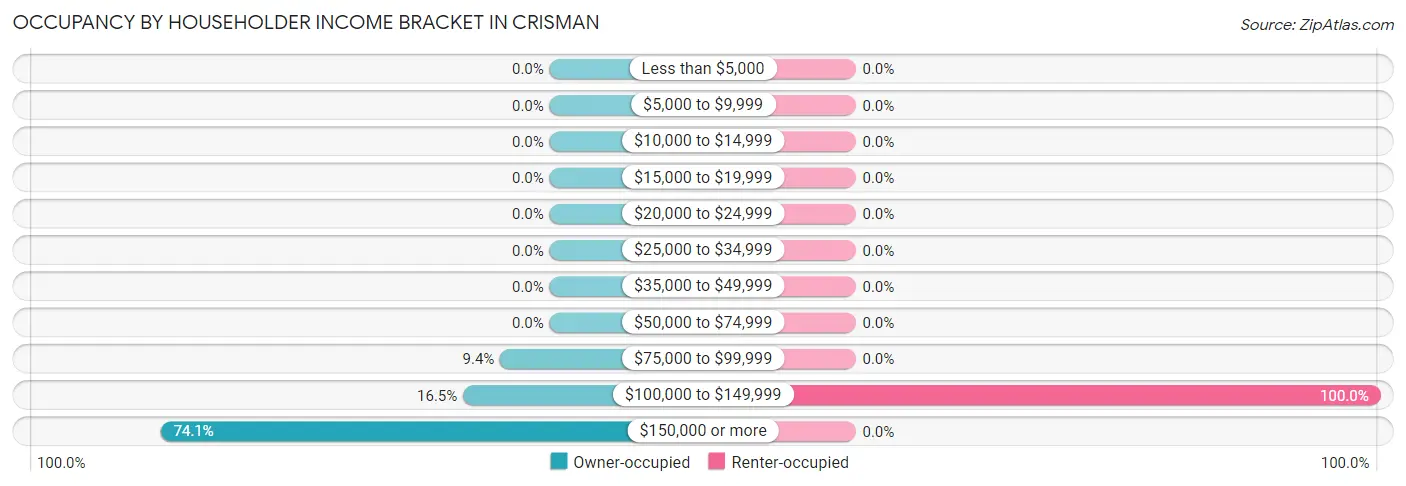
| Income Bracket | Owner-occupied | Renter-occupied |
| Less than $5,000 | 0 (0.0%) | 0 (0.0%) |
| $5,000 to $9,999 | 0 (0.0%) | 0 (0.0%) |
| $10,000 to $14,999 | 0 (0.0%) | 0 (0.0%) |
| $15,000 to $19,999 | 0 (0.0%) | 0 (0.0%) |
| $20,000 to $24,999 | 0 (0.0%) | 0 (0.0%) |
| $25,000 to $34,999 | 0 (0.0%) | 0 (0.0%) |
| $35,000 to $49,999 | 0 (0.0%) | 0 (0.0%) |
| $50,000 to $74,999 | 0 (0.0%) | 0 (0.0%) |
| $75,000 to $99,999 | 8 (9.4%) | 0 (0.0%) |
| $100,000 to $149,999 | 14 (16.5%) | 19 (100.0%) |
| $150,000 or more | 63 (74.1%) | 0 (0.0%) |
| Total | 85 (100.0%) | 19 (100.0%) |
Monthly Housing Cost Tiers in Crisman
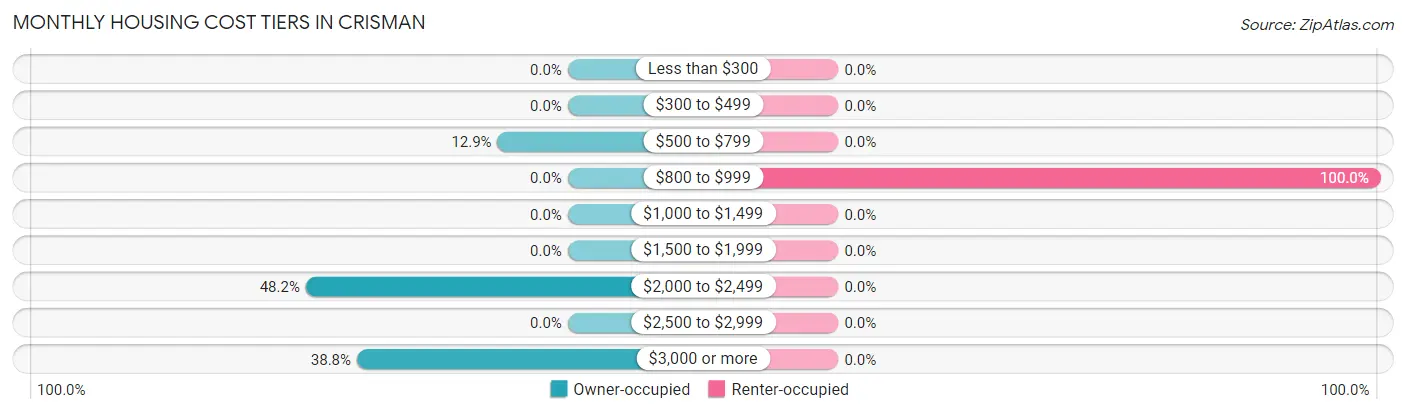
| Monthly Cost | Owner-occupied | Renter-occupied |
| Less than $300 | 0 (0.0%) | 0 (0.0%) |
| $300 to $499 | 0 (0.0%) | 0 (0.0%) |
| $500 to $799 | 11 (12.9%) | 0 (0.0%) |
| $800 to $999 | 0 (0.0%) | 19 (100.0%) |
| $1,000 to $1,499 | 0 (0.0%) | 0 (0.0%) |
| $1,500 to $1,999 | 0 (0.0%) | 0 (0.0%) |
| $2,000 to $2,499 | 41 (48.2%) | 0 (0.0%) |
| $2,500 to $2,999 | 0 (0.0%) | 0 (0.0%) |
| $3,000 or more | 33 (38.8%) | 0 (0.0%) |
| Total | 85 (100.0%) | 19 (100.0%) |
Physical Housing Characteristics in Crisman
Housing Structures in Crisman
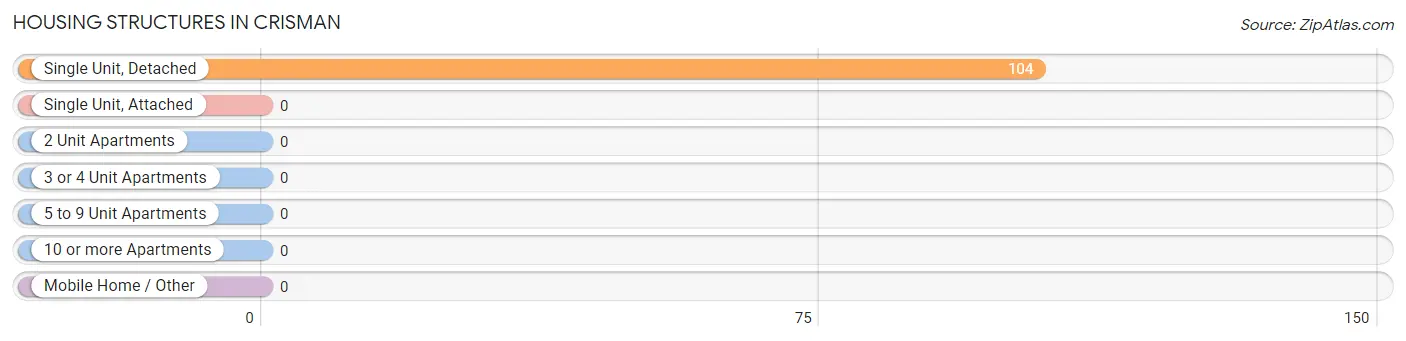
| Structure Type | # Housing Units | % Housing Units |
| Single Unit, Detached | 104 | 100.0% |
| Single Unit, Attached | 0 | 0.0% |
| 2 Unit Apartments | 0 | 0.0% |
| 3 or 4 Unit Apartments | 0 | 0.0% |
| 5 to 9 Unit Apartments | 0 | 0.0% |
| 10 or more Apartments | 0 | 0.0% |
| Mobile Home / Other | 0 | 0.0% |
| Total | 104 | 100.0% |
Housing Structures by Occupancy in Crisman
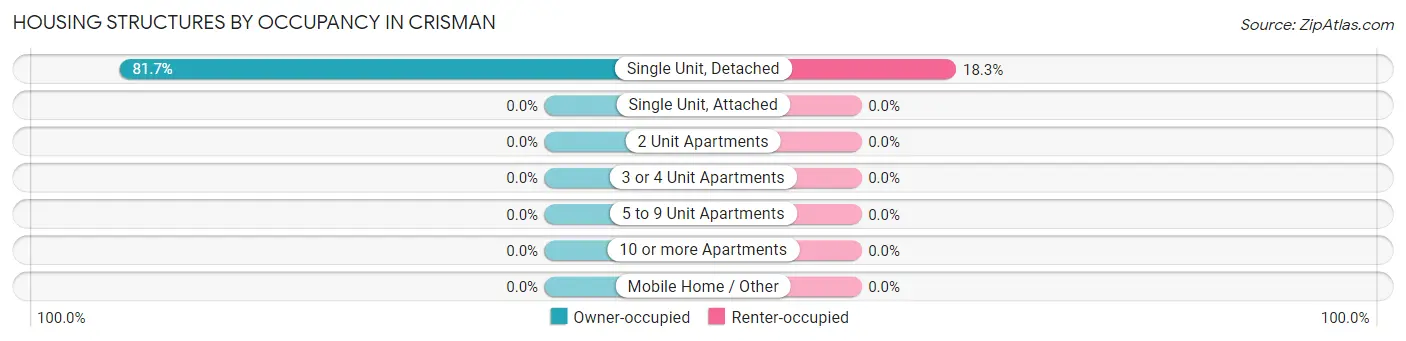
| Structure Type | Owner-occupied | Renter-occupied |
| Single Unit, Detached | 85 (81.7%) | 19 (18.3%) |
| Single Unit, Attached | 0 (0.0%) | 0 (0.0%) |
| 2 Unit Apartments | 0 (0.0%) | 0 (0.0%) |
| 3 or 4 Unit Apartments | 0 (0.0%) | 0 (0.0%) |
| 5 to 9 Unit Apartments | 0 (0.0%) | 0 (0.0%) |
| 10 or more Apartments | 0 (0.0%) | 0 (0.0%) |
| Mobile Home / Other | 0 (0.0%) | 0 (0.0%) |
| Total | 85 (81.7%) | 19 (18.3%) |
Housing Structures by Number of Rooms in Crisman
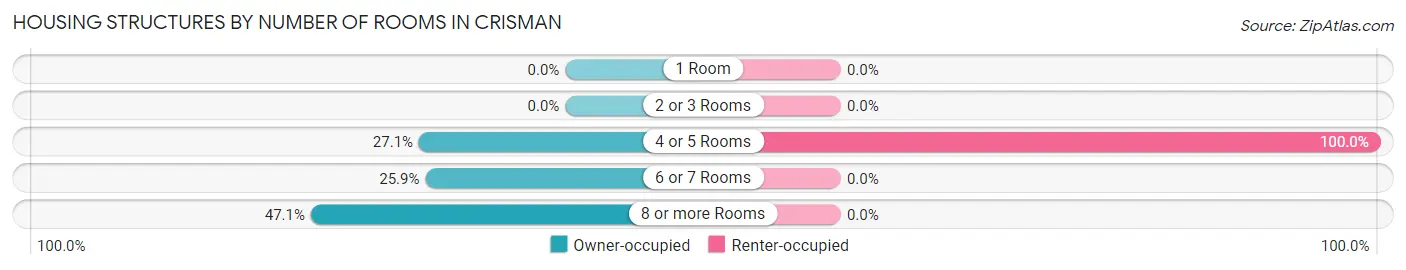
| Number of Rooms | Owner-occupied | Renter-occupied |
| 1 Room | 0 (0.0%) | 0 (0.0%) |
| 2 or 3 Rooms | 0 (0.0%) | 0 (0.0%) |
| 4 or 5 Rooms | 23 (27.1%) | 19 (100.0%) |
| 6 or 7 Rooms | 22 (25.9%) | 0 (0.0%) |
| 8 or more Rooms | 40 (47.1%) | 0 (0.0%) |
| Total | 85 (100.0%) | 19 (100.0%) |
Housing Structure by Heating Type in Crisman
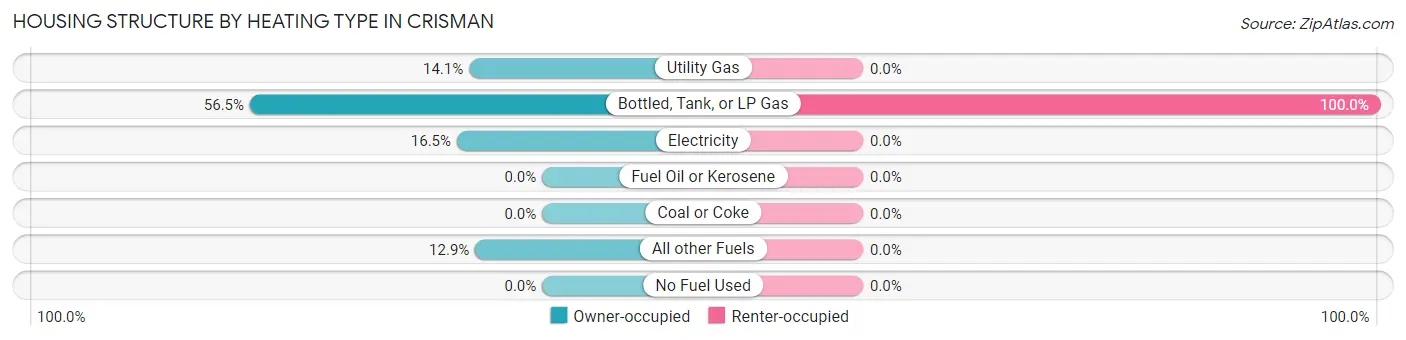
| Heating Type | Owner-occupied | Renter-occupied |
| Utility Gas | 12 (14.1%) | 0 (0.0%) |
| Bottled, Tank, or LP Gas | 48 (56.5%) | 19 (100.0%) |
| Electricity | 14 (16.5%) | 0 (0.0%) |
| Fuel Oil or Kerosene | 0 (0.0%) | 0 (0.0%) |
| Coal or Coke | 0 (0.0%) | 0 (0.0%) |
| All other Fuels | 11 (12.9%) | 0 (0.0%) |
| No Fuel Used | 0 (0.0%) | 0 (0.0%) |
| Total | 85 (100.0%) | 19 (100.0%) |
Household Vehicle Usage in Crisman
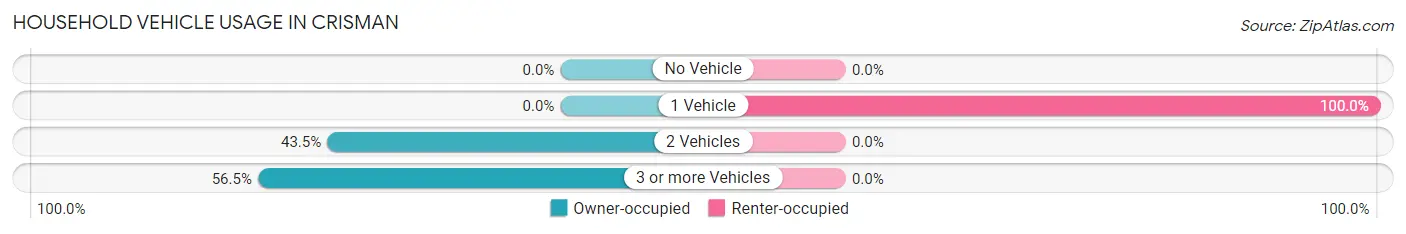
| Vehicles per Household | Owner-occupied | Renter-occupied |
| No Vehicle | 0 (0.0%) | 0 (0.0%) |
| 1 Vehicle | 0 (0.0%) | 19 (100.0%) |
| 2 Vehicles | 37 (43.5%) | 0 (0.0%) |
| 3 or more Vehicles | 48 (56.5%) | 0 (0.0%) |
| Total | 85 (100.0%) | 19 (100.0%) |
Real Estate & Mortgages in Crisman
Real Estate and Mortgage Overview in Crisman
| Characteristic | Without Mortgage | With Mortgage |
| Housing Units | 11 | 74 |
| Median Property Value | - | - |
| Median Household Income | - | - |
| Monthly Housing Costs | - | - |
| Real Estate Taxes | - | - |
Property Value by Mortgage Status in Crisman
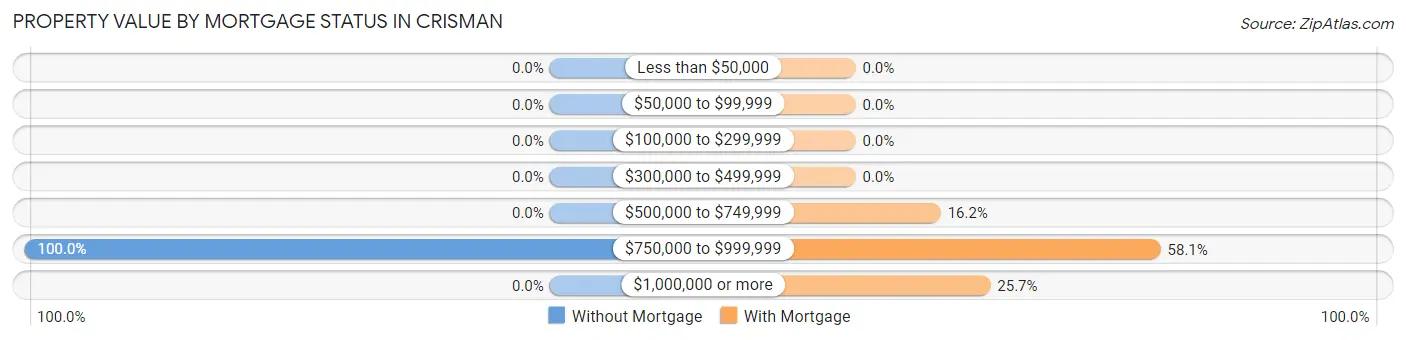
| Property Value | Without Mortgage | With Mortgage |
| Less than $50,000 | 0 (0.0%) | 0 (0.0%) |
| $50,000 to $99,999 | 0 (0.0%) | 0 (0.0%) |
| $100,000 to $299,999 | 0 (0.0%) | 0 (0.0%) |
| $300,000 to $499,999 | 0 (0.0%) | 0 (0.0%) |
| $500,000 to $749,999 | 0 (0.0%) | 12 (16.2%) |
| $750,000 to $999,999 | 11 (100.0%) | 43 (58.1%) |
| $1,000,000 or more | 0 (0.0%) | 19 (25.7%) |
| Total | 11 (100.0%) | 74 (100.0%) |
Household Income by Mortgage Status in Crisman
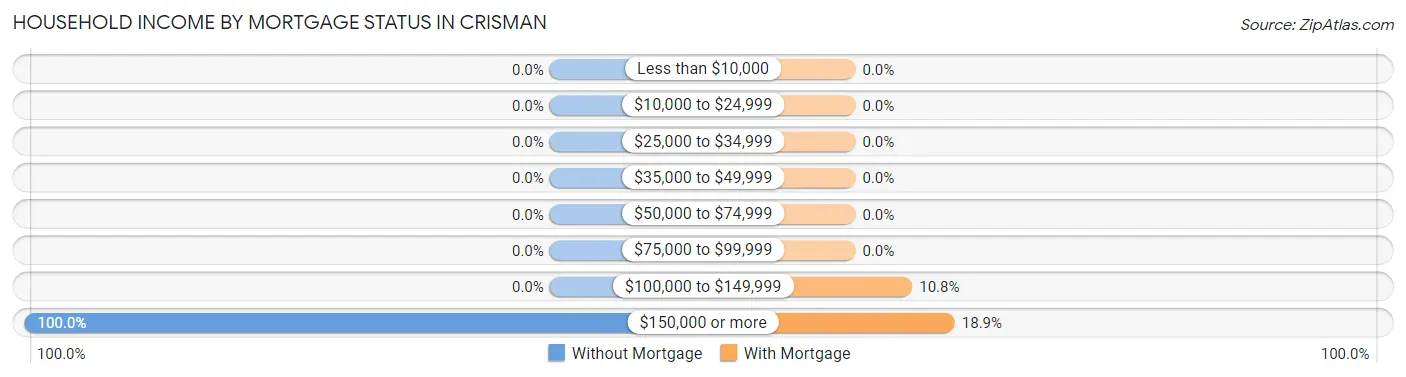
| Household Income | Without Mortgage | With Mortgage |
| Less than $10,000 | 0 (0.0%) | 0 (0.0%) |
| $10,000 to $24,999 | 0 (0.0%) | 0 (0.0%) |
| $25,000 to $34,999 | 0 (0.0%) | 0 (0.0%) |
| $35,000 to $49,999 | 0 (0.0%) | 0 (0.0%) |
| $50,000 to $74,999 | 0 (0.0%) | 0 (0.0%) |
| $75,000 to $99,999 | 0 (0.0%) | 0 (0.0%) |
| $100,000 to $149,999 | 0 (0.0%) | 8 (10.8%) |
| $150,000 or more | 11 (100.0%) | 14 (18.9%) |
| Total | 11 (100.0%) | 74 (100.0%) |
Property Value to Household Income Ratio in Crisman
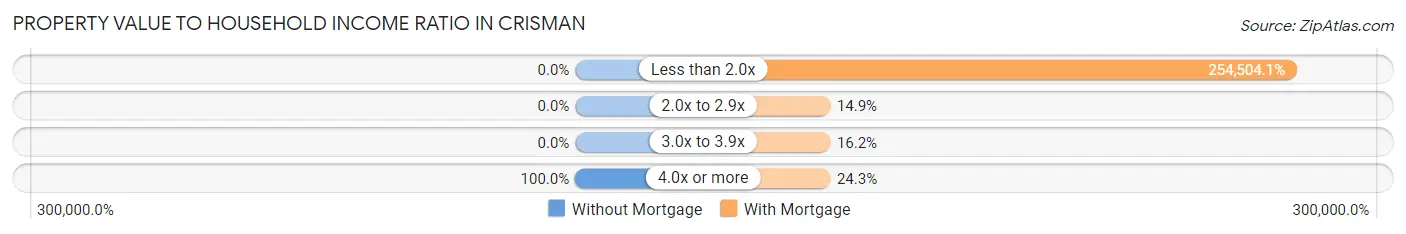
| Value-to-Income Ratio | Without Mortgage | With Mortgage |
| Less than 2.0x | 0 (0.0%) | 188,333 (254,504.1%) |
| 2.0x to 2.9x | 0 (0.0%) | 11 (14.9%) |
| 3.0x to 3.9x | 0 (0.0%) | 12 (16.2%) |
| 4.0x or more | 11 (100.0%) | 18 (24.3%) |
| Total | 11 (100.0%) | 74 (100.0%) |
Real Estate Taxes by Mortgage Status in Crisman
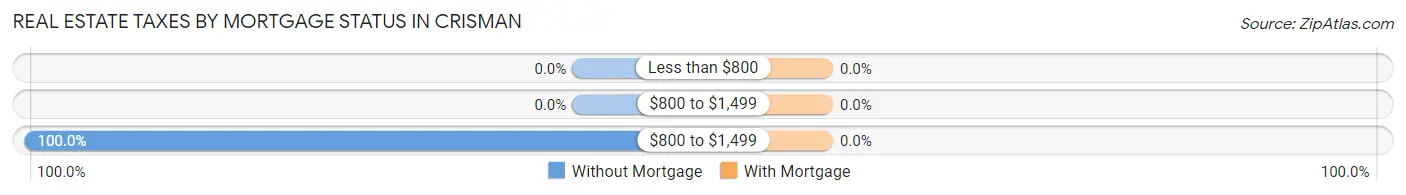
| Property Taxes | Without Mortgage | With Mortgage |
| Less than $800 | 0 (0.0%) | 0 (0.0%) |
| $800 to $1,499 | 0 (0.0%) | 0 (0.0%) |
| $800 to $1,499 | 11 (100.0%) | 0 (0.0%) |
| Total | 11 (100.0%) | 74 (100.0%) |
Health & Disability in Crisman
Health Insurance Coverage by Age in Crisman
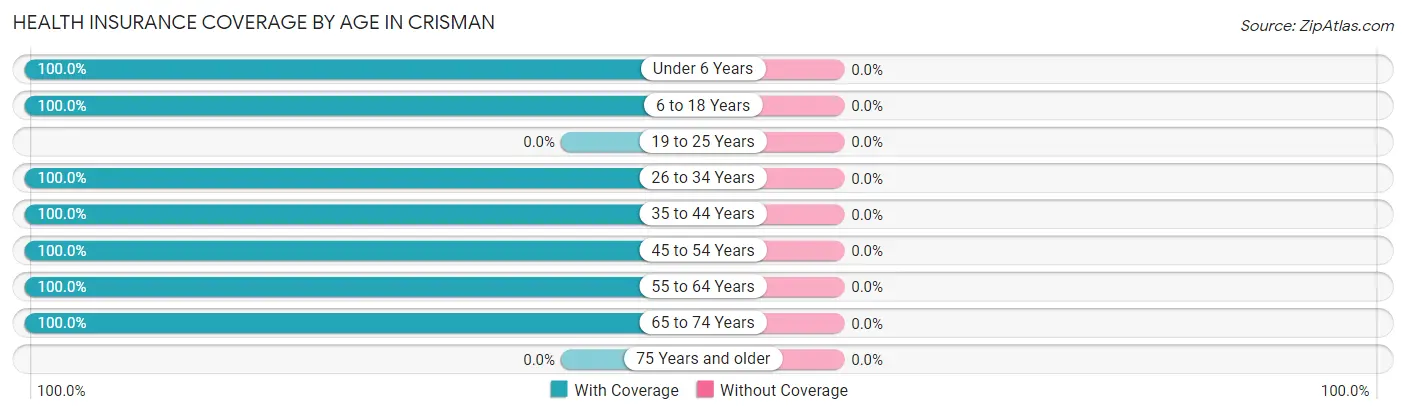
| Age Bracket | With Coverage | Without Coverage |
| Under 6 Years | 31 (100.0%) | 0 (0.0%) |
| 6 to 18 Years | 44 (100.0%) | 0 (0.0%) |
| 19 to 25 Years | 0 (0.0%) | 0 (0.0%) |
| 26 to 34 Years | 23 (100.0%) | 0 (0.0%) |
| 35 to 44 Years | 59 (100.0%) | 0 (0.0%) |
| 45 to 54 Years | 53 (100.0%) | 0 (0.0%) |
| 55 to 64 Years | 29 (100.0%) | 0 (0.0%) |
| 65 to 74 Years | 25 (100.0%) | 0 (0.0%) |
| 75 Years and older | 0 (0.0%) | 0 (0.0%) |
| Total | 264 (100.0%) | 0 (0.0%) |
Health Insurance Coverage by Citizenship Status in Crisman
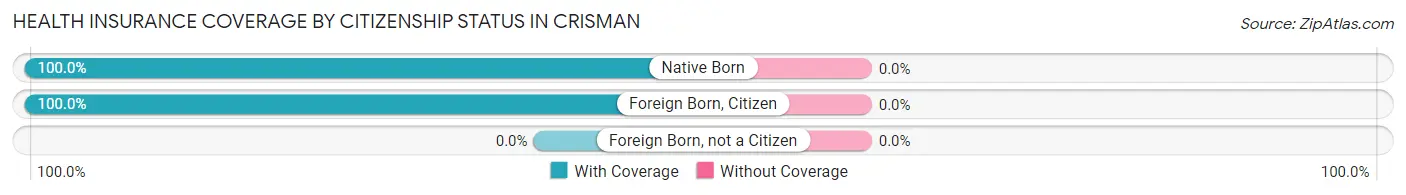
| Citizenship Status | With Coverage | Without Coverage |
| Native Born | 31 (100.0%) | 0 (0.0%) |
| Foreign Born, Citizen | 44 (100.0%) | 0 (0.0%) |
| Foreign Born, not a Citizen | 0 (0.0%) | 0 (0.0%) |
Health Insurance Coverage by Household Income in Crisman
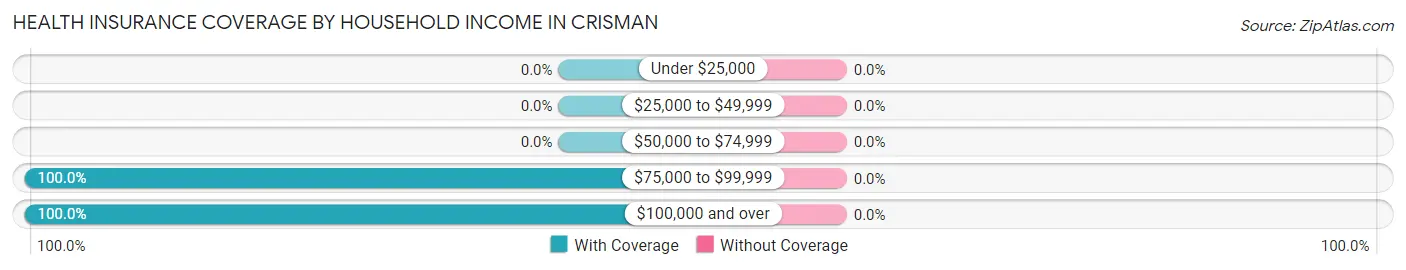
| Household Income | With Coverage | Without Coverage |
| Under $25,000 | 0 (0.0%) | 0 (0.0%) |
| $25,000 to $49,999 | 0 (0.0%) | 0 (0.0%) |
| $50,000 to $74,999 | 0 (0.0%) | 0 (0.0%) |
| $75,000 to $99,999 | 17 (100.0%) | 0 (0.0%) |
| $100,000 and over | 247 (100.0%) | 0 (0.0%) |
Public vs Private Health Insurance Coverage by Age in Crisman
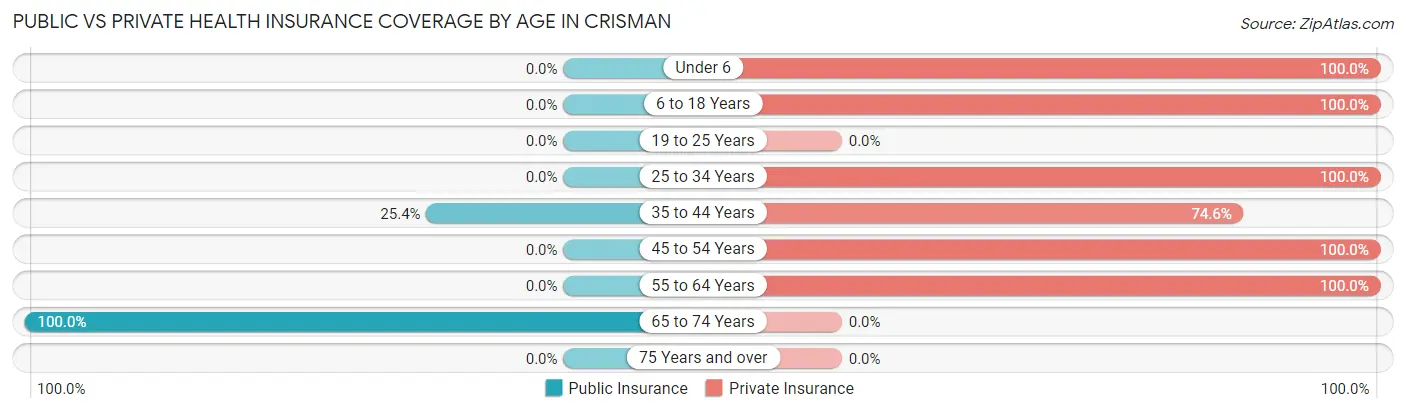
| Age Bracket | Public Insurance | Private Insurance |
| Under 6 | 0 (0.0%) | 31 (100.0%) |
| 6 to 18 Years | 0 (0.0%) | 44 (100.0%) |
| 19 to 25 Years | 0 (0.0%) | 0 (0.0%) |
| 25 to 34 Years | 0 (0.0%) | 23 (100.0%) |
| 35 to 44 Years | 15 (25.4%) | 44 (74.6%) |
| 45 to 54 Years | 0 (0.0%) | 53 (100.0%) |
| 55 to 64 Years | 0 (0.0%) | 29 (100.0%) |
| 65 to 74 Years | 25 (100.0%) | 0 (0.0%) |
| 75 Years and over | 0 (0.0%) | 0 (0.0%) |
| Total | 40 (15.1%) | 224 (84.9%) |
Disability Status by Sex by Age in Crisman
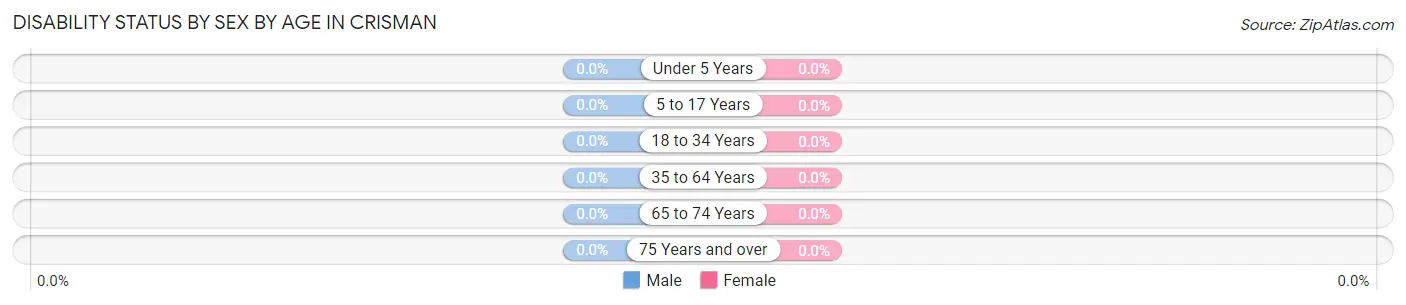
| Age Bracket | Male | Female |
| Under 5 Years | 0 (0.0%) | 0 (0.0%) |
| 5 to 17 Years | 0 (0.0%) | 0 (0.0%) |
| 18 to 34 Years | 0 (0.0%) | 0 (0.0%) |
| 35 to 64 Years | 0 (0.0%) | 0 (0.0%) |
| 65 to 74 Years | 0 (0.0%) | 0 (0.0%) |
| 75 Years and over | 0 (0.0%) | 0 (0.0%) |
Disability Class by Sex by Age in Crisman
Disability Class: Hearing Difficulty
| Age Bracket | Male | Female |
| Under 5 Years | 0 (0.0%) | 0 (0.0%) |
| 5 to 17 Years | 0 (0.0%) | 0 (0.0%) |
| 18 to 34 Years | 0 (0.0%) | 0 (0.0%) |
| 35 to 64 Years | 0 (0.0%) | 0 (0.0%) |
| 65 to 74 Years | 0 (0.0%) | 0 (0.0%) |
| 75 Years and over | 0 (0.0%) | 0 (0.0%) |
Disability Class: Vision Difficulty
| Age Bracket | Male | Female |
| Under 5 Years | 0 (0.0%) | 0 (0.0%) |
| 5 to 17 Years | 0 (0.0%) | 0 (0.0%) |
| 18 to 34 Years | 0 (0.0%) | 0 (0.0%) |
| 35 to 64 Years | 0 (0.0%) | 0 (0.0%) |
| 65 to 74 Years | 0 (0.0%) | 0 (0.0%) |
| 75 Years and over | 0 (0.0%) | 0 (0.0%) |
Disability Class: Cognitive Difficulty
| Age Bracket | Male | Female |
| 5 to 17 Years | 0 (0.0%) | 0 (0.0%) |
| 18 to 34 Years | 0 (0.0%) | 0 (0.0%) |
| 35 to 64 Years | 0 (0.0%) | 0 (0.0%) |
| 65 to 74 Years | 0 (0.0%) | 0 (0.0%) |
| 75 Years and over | 0 (0.0%) | 0 (0.0%) |
Disability Class: Ambulatory Difficulty
| Age Bracket | Male | Female |
| 5 to 17 Years | 0 (0.0%) | 0 (0.0%) |
| 18 to 34 Years | 0 (0.0%) | 0 (0.0%) |
| 35 to 64 Years | 0 (0.0%) | 0 (0.0%) |
| 65 to 74 Years | 0 (0.0%) | 0 (0.0%) |
| 75 Years and over | 0 (0.0%) | 0 (0.0%) |
Disability Class: Self-Care Difficulty
| Age Bracket | Male | Female |
| 5 to 17 Years | 0 (0.0%) | 0 (0.0%) |
| 18 to 34 Years | 0 (0.0%) | 0 (0.0%) |
| 35 to 64 Years | 0 (0.0%) | 0 (0.0%) |
| 65 to 74 Years | 0 (0.0%) | 0 (0.0%) |
| 75 Years and over | 0 (0.0%) | 0 (0.0%) |
Technology Access in Crisman
Computing Device Access in Crisman
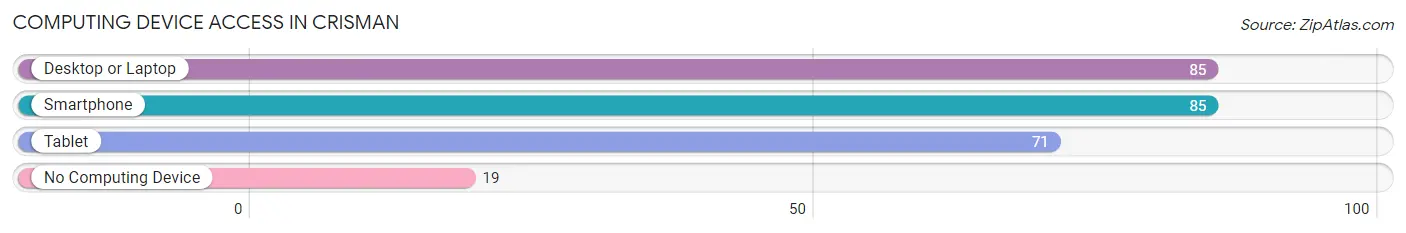
| Device Type | # Households | % Households |
| Desktop or Laptop | 85 | 81.7% |
| Smartphone | 85 | 81.7% |
| Tablet | 71 | 68.3% |
| No Computing Device | 19 | 18.3% |
| Total | 104 | 100.0% |
Internet Access in Crisman
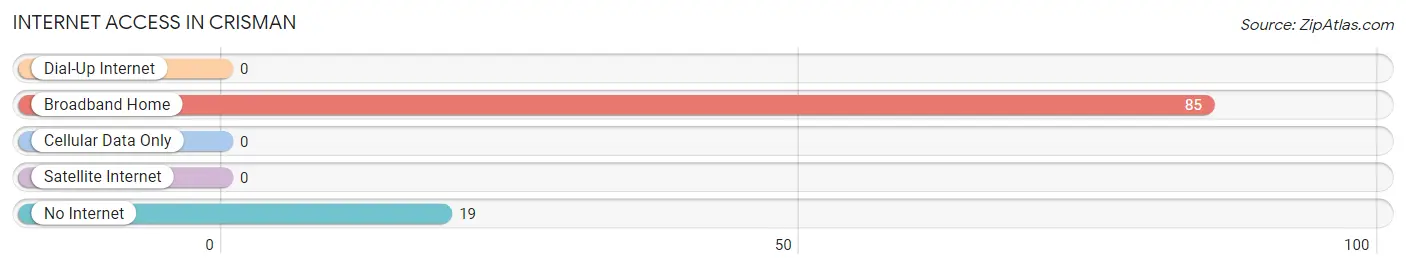
| Internet Type | # Households | % Households |
| Dial-Up Internet | 0 | 0.0% |
| Broadband Home | 85 | 81.7% |
| Cellular Data Only | 0 | 0.0% |
| Satellite Internet | 0 | 0.0% |
| No Internet | 19 | 18.3% |
| Total | 104 | 100.0% |
Crisman Summary
Crisman is an unincorporated community located in Gunnison County, Colorado, United States. It is situated in the Gunnison Valley, at an elevation of 8,890 feet (2,710 m). The community is located along the Taylor River, approximately 8 miles (13 km) south of the city of Gunnison.
History
The area around Crisman was first settled in the late 1800s by miners and ranchers. The town was originally known as “Crisman’s Crossing”, named after the first settler, John Crisman. The town was officially established in 1883, when the post office was established.
In the early 1900s, the town was a popular stop for travelers on the Denver and Rio Grande Western Railroad. The railroad provided a convenient way for people to travel between Gunnison and Crested Butte.
In the 1920s, the town began to decline as the railroad stopped running and the population began to dwindle. The town was eventually abandoned in the 1940s.
Geography
Crisman is located in the Gunnison Valley, at an elevation of 8,890 feet (2,710 m). The town is situated along the Taylor River, approximately 8 miles (13 km) south of the city of Gunnison.
The town is surrounded by the Gunnison National Forest, which provides a variety of outdoor activities, including camping, fishing, hiking, and mountain biking. The nearby Taylor River is a popular spot for fly fishing.
Economy
The economy of Crisman is largely based on tourism and recreation. The town is a popular destination for outdoor enthusiasts, who come to enjoy the nearby Gunnison National Forest and Taylor River.
The town is also home to several small businesses, including a general store, a restaurant, and a gas station.
Demographics
As of the 2010 census, the population of Crisman was 39. The racial makeup of the town was 97.4% White, 0.0% African American, 0.0% Native American, 0.0% Asian, 0.0% Pacific Islander, 0.0% from other races, and 2.6% from two or more races. Hispanic or Latino of any race were 0.0% of the population.
The median income for a household in the town was $37,500, and the median income for a family was $41,250. The per capita income for the town was $17,917. About 11.1% of families and 14.3% of the population were below the poverty line, including none of those under the age of eighteen and none of those sixty-five or over.
Conclusion
Crisman is a small, unincorporated community located in Gunnison County, Colorado. The town was originally established in the late 1800s by miners and ranchers, and was a popular stop for travelers on the Denver and Rio Grande Western Railroad. The town began to decline in the 1920s, and was eventually abandoned in the 1940s. Today, the town is a popular destination for outdoor enthusiasts, who come to enjoy the nearby Gunnison National Forest and Taylor River. The economy of Crisman is largely based on tourism and recreation, and the town is home to several small businesses. The population of Crisman was 39 as of the 2010 census.
Common Questions
What is Per Capita Income in Crisman?
Per Capita income in Crisman is $128,858.
What is the Median Family Income in Crisman?
Median Family Income in Crisman is $189,479.
What is the Median Household income in Crisman?
Median Household Income in Crisman is $162,500.
What is Income or Wage Gap in Crisman?
Income or Wage Gap in Crisman is 8.7%.
Women in Crisman earn 91.3 cents for every dollar earned by a man.
What is Inequality or Gini Index in Crisman?
Inequality or Gini Index in Crisman is 0.52.
What is the Total Population of Crisman?
Total Population of Crisman is 264.
What is the Total Male Population of Crisman?
Total Male Population of Crisman is 126.
What is the Total Female Population of Crisman?
Total Female Population of Crisman is 138.
What is the Ratio of Males per 100 Females in Crisman?
There are 91.30 Males per 100 Females in Crisman.
What is the Ratio of Females per 100 Males in Crisman?
There are 109.52 Females per 100 Males in Crisman.
What is the Median Population Age in Crisman?
Median Population Age in Crisman is 40.5 Years.
What is the Average Family Size in Crisman
Average Family Size in Crisman is 3.2 People.
What is the Average Household Size in Crisman
Average Household Size in Crisman is 2.5 People.
How Large is the Labor Force in Crisman?
There are 164 People in the Labor Forcein in Crisman.
What is the Percentage of People in the Labor Force in Crisman?
76.3% of People are in the Labor Force in Crisman.
What is the Unemployment Rate in Crisman?
Unemployment Rate in Crisman is 9.1%.