Green Mountain Falls, CO Map & Demographics
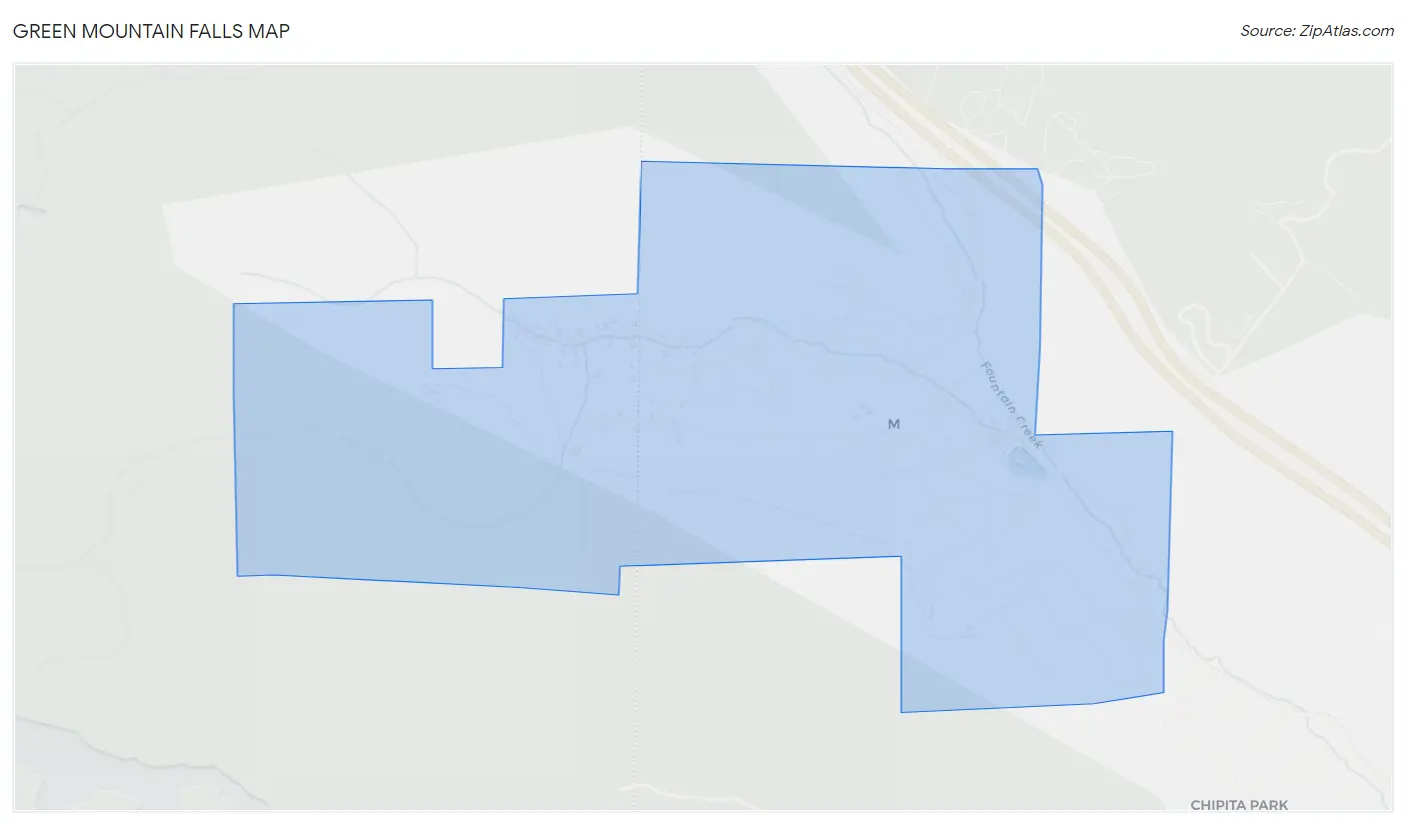
Green Mountain Falls Map
Green Mountain Falls Overview
$45,762
PER CAPITA INCOME
$72,292
AVG FAMILY INCOME
$66,953
AVG HOUSEHOLD INCOME
68.8%
WAGE / INCOME GAP [ % ]
31.2¢/ $1
WAGE / INCOME GAP [ $ ]
0.40
INEQUALITY / GINI INDEX
518
TOTAL POPULATION
223
MALE POPULATION
295
FEMALE POPULATION
75.59
MALES / 100 FEMALES
132.29
FEMALES / 100 MALES
46.7
MEDIAN AGE
2.5
AVG FAMILY SIZE
2.0
AVG HOUSEHOLD SIZE
336
LABOR FORCE [ PEOPLE ]
66.5%
PERCENT IN LABOR FORCE
Green Mountain Falls Zip Codes
Green Mountain Falls Area Codes
Income in Green Mountain Falls
Income Overview in Green Mountain Falls
Per Capita Income in Green Mountain Falls is $45,762, while median incomes of families and households are $72,292 and $66,953 respectively.
| Characteristic | Number | Measure |
| Per Capita Income | 518 | $45,762 |
| Median Family Income | 149 | $72,292 |
| Mean Family Income | 149 | $102,721 |
| Median Household Income | 256 | $66,953 |
| Mean Household Income | 256 | $90,211 |
| Income Deficit | 149 | $0 |
| Wage / Income Gap (%) | 518 | 68.83% |
| Wage / Income Gap ($) | 518 | 31.17¢ per $1 |
| Gini / Inequality Index | 518 | 0.40 |
Earnings by Sex in Green Mountain Falls
Average Earnings in Green Mountain Falls are $43,176, $70,469 for men and $21,964 for women, a difference of 68.8%.
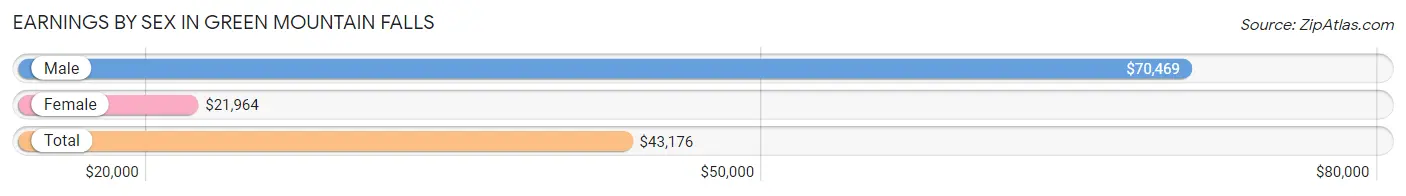
| Sex | Number | Average Earnings |
| Male | 167 (46.4%) | $70,469 |
| Female | 193 (53.6%) | $21,964 |
| Total | 360 (100.0%) | $43,176 |
Earnings by Sex by Income Bracket in Green Mountain Falls
The most common earnings brackets in Green Mountain Falls are $100,000+ for men (59 | 35.3%) and $5,000 to $7,499 for women (44 | 22.8%).
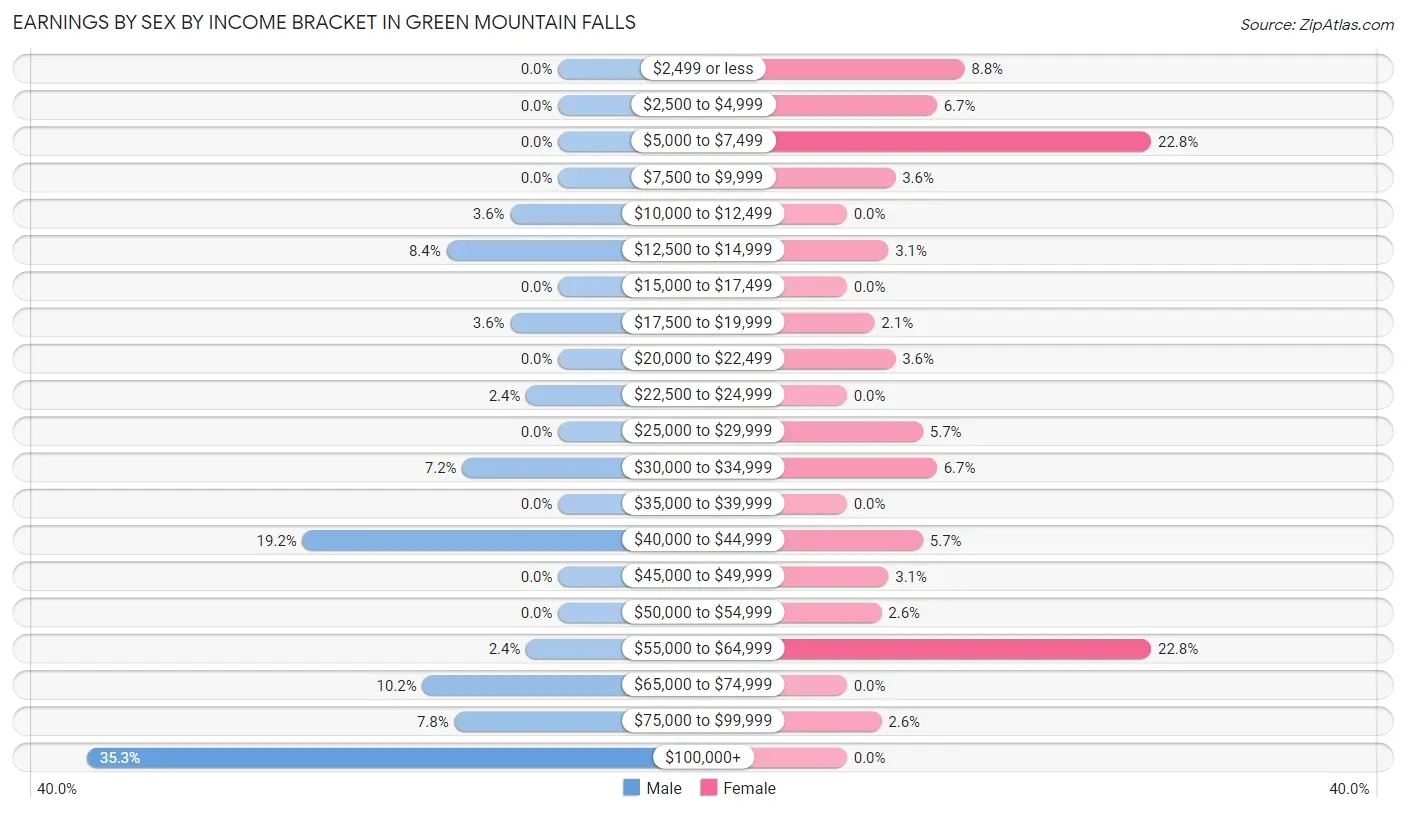
| Income | Male | Female |
| $2,499 or less | 0 (0.0%) | 17 (8.8%) |
| $2,500 to $4,999 | 0 (0.0%) | 13 (6.7%) |
| $5,000 to $7,499 | 0 (0.0%) | 44 (22.8%) |
| $7,500 to $9,999 | 0 (0.0%) | 7 (3.6%) |
| $10,000 to $12,499 | 6 (3.6%) | 0 (0.0%) |
| $12,500 to $14,999 | 14 (8.4%) | 6 (3.1%) |
| $15,000 to $17,499 | 0 (0.0%) | 0 (0.0%) |
| $17,500 to $19,999 | 6 (3.6%) | 4 (2.1%) |
| $20,000 to $22,499 | 0 (0.0%) | 7 (3.6%) |
| $22,500 to $24,999 | 4 (2.4%) | 0 (0.0%) |
| $25,000 to $29,999 | 0 (0.0%) | 11 (5.7%) |
| $30,000 to $34,999 | 12 (7.2%) | 13 (6.7%) |
| $35,000 to $39,999 | 0 (0.0%) | 0 (0.0%) |
| $40,000 to $44,999 | 32 (19.2%) | 11 (5.7%) |
| $45,000 to $49,999 | 0 (0.0%) | 6 (3.1%) |
| $50,000 to $54,999 | 0 (0.0%) | 5 (2.6%) |
| $55,000 to $64,999 | 4 (2.4%) | 44 (22.8%) |
| $65,000 to $74,999 | 17 (10.2%) | 0 (0.0%) |
| $75,000 to $99,999 | 13 (7.8%) | 5 (2.6%) |
| $100,000+ | 59 (35.3%) | 0 (0.0%) |
| Total | 167 (100.0%) | 193 (100.0%) |
Earnings by Sex by Educational Attainment in Green Mountain Falls
Average earnings in Green Mountain Falls are $72,750 for men and $42,083 for women, a difference of 42.1%. Men with an educational attainment of bachelor's degree enjoy the highest average annual earnings of $111,250, while those with college or associate's degree education earn the least with $43,984. Women with an educational attainment of graduate degree earn the most with the average annual earnings of $58,958, while those with high school diploma education have the smallest earnings of $31,000.
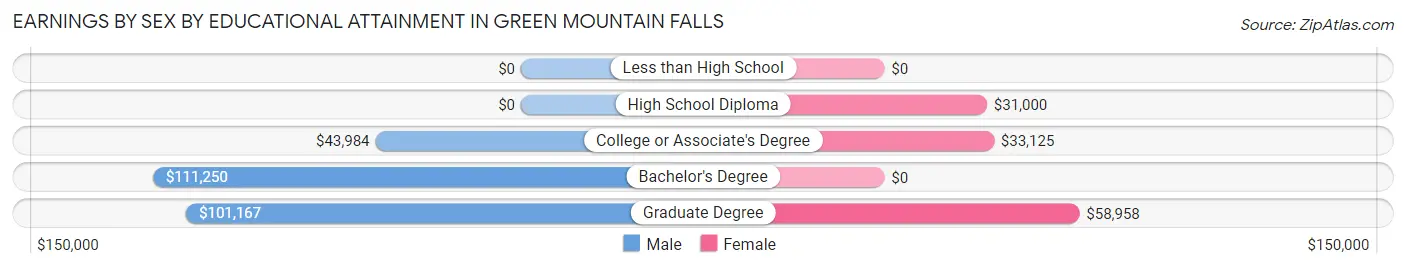
| Educational Attainment | Male Income | Female Income |
| Less than High School | - | - |
| High School Diploma | - | - |
| College or Associate's Degree | $43,984 | $33,125 |
| Bachelor's Degree | $111,250 | $0 |
| Graduate Degree | $101,167 | $58,958 |
| Total | $72,750 | $42,083 |
Family Income in Green Mountain Falls
Family Income Brackets in Green Mountain Falls
According to the Green Mountain Falls family income data, there are 51 families falling into the $50,000 to $74,999 income range, which is the most common income bracket and makes up 34.2% of all families.
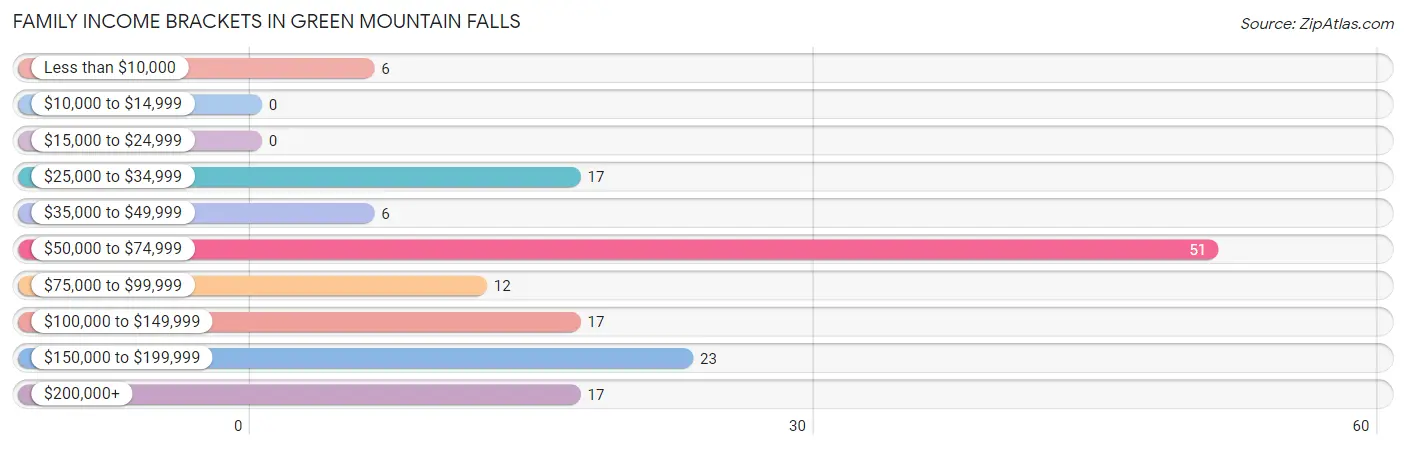
| Income Bracket | # Families | % Families |
| Less than $10,000 | 6 | 4.0% |
| $10,000 to $14,999 | 0 | 0.0% |
| $15,000 to $24,999 | 0 | 0.0% |
| $25,000 to $34,999 | 17 | 11.4% |
| $35,000 to $49,999 | 6 | 4.0% |
| $50,000 to $74,999 | 51 | 34.2% |
| $75,000 to $99,999 | 12 | 8.1% |
| $100,000 to $149,999 | 17 | 11.4% |
| $150,000 to $199,999 | 23 | 15.4% |
| $200,000+ | 17 | 11.4% |
Family Income by Famaliy Size in Green Mountain Falls
2-person families (115 | 77.2%) account for the highest median family income in Green Mountain Falls with $67,156 per family, while 2-person families (115 | 77.2%) have the highest median income of $33,578 per family member.
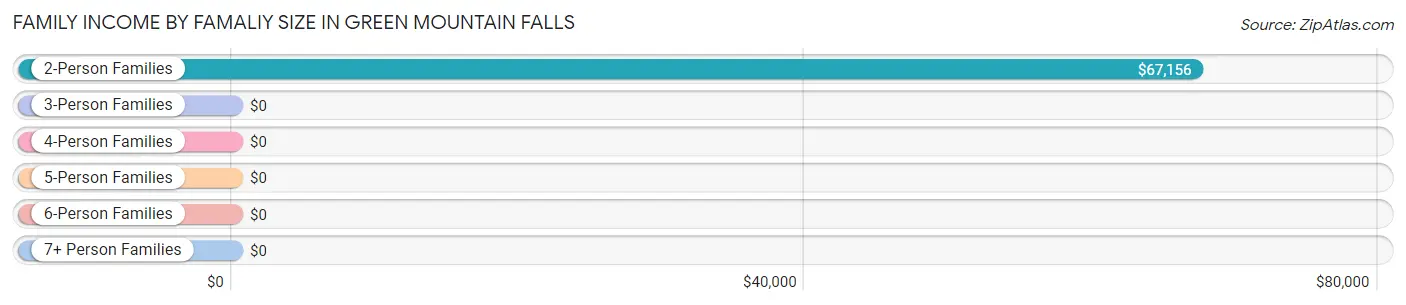
| Income Bracket | # Families | Median Income |
| 2-Person Families | 115 (77.2%) | $67,156 |
| 3-Person Families | 10 (6.7%) | $0 |
| 4-Person Families | 24 (16.1%) | $0 |
| 5-Person Families | 0 (0.0%) | $0 |
| 6-Person Families | 0 (0.0%) | $0 |
| 7+ Person Families | 0 (0.0%) | $0 |
| Total | 149 (100.0%) | $72,292 |
Family Income by Number of Earners in Green Mountain Falls
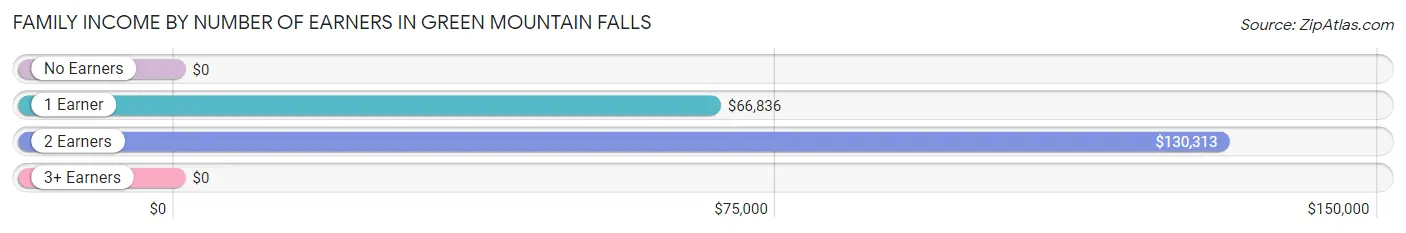
| Number of Earners | # Families | Median Income |
| No Earners | 18 (12.1%) | $0 |
| 1 Earner | 57 (38.3%) | $66,836 |
| 2 Earners | 50 (33.6%) | $130,313 |
| 3+ Earners | 24 (16.1%) | $0 |
| Total | 149 (100.0%) | $72,292 |
Household Income in Green Mountain Falls
Household Income Brackets in Green Mountain Falls
With 74 households falling in the category, the $50,000 to $74,999 income range is the most frequent in Green Mountain Falls, accounting for 28.9% of all households.
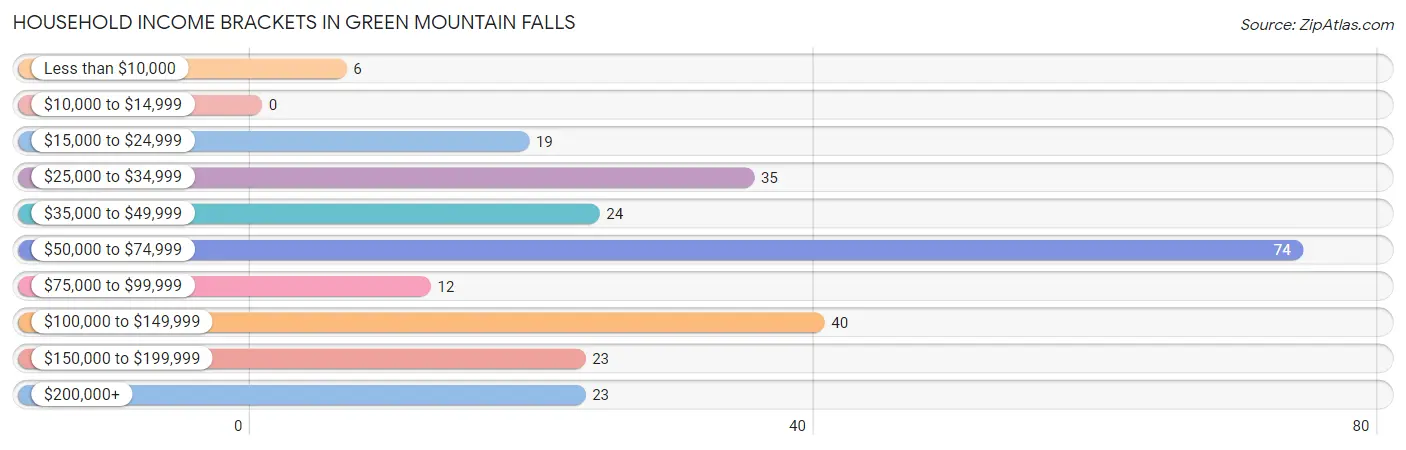
| Income Bracket | # Households | % Households |
| Less than $10,000 | 6 | 2.3% |
| $10,000 to $14,999 | 0 | 0.0% |
| $15,000 to $24,999 | 19 | 7.4% |
| $25,000 to $34,999 | 35 | 13.7% |
| $35,000 to $49,999 | 24 | 9.4% |
| $50,000 to $74,999 | 74 | 28.9% |
| $75,000 to $99,999 | 12 | 4.7% |
| $100,000 to $149,999 | 40 | 15.6% |
| $150,000 to $199,999 | 23 | 9.0% |
| $200,000+ | 23 | 9.0% |
Household Income by Householder Age in Green Mountain Falls
The median household income in Green Mountain Falls is $66,953, with the highest median household income of $72,292 found in the 45 to 64 years age bracket for the primary householder. A total of 107 households (41.8%) fall into this category.
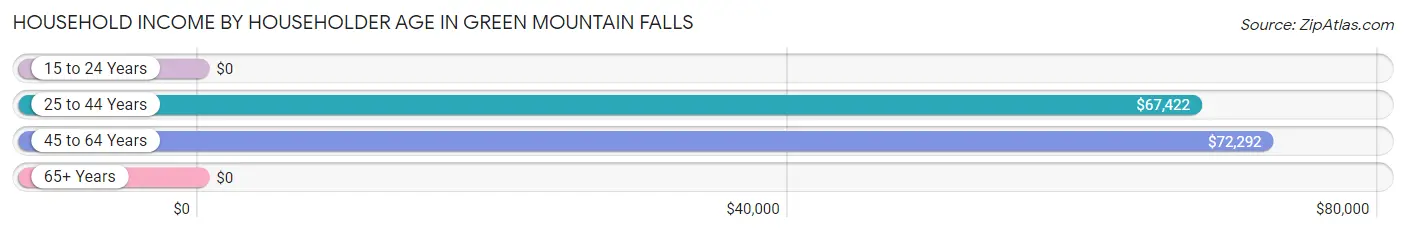
| Income Bracket | # Households | Median Income |
| 15 to 24 Years | 0 (0.0%) | $0 |
| 25 to 44 Years | 78 (30.5%) | $67,422 |
| 45 to 64 Years | 107 (41.8%) | $72,292 |
| 65+ Years | 71 (27.7%) | $0 |
| Total | 256 (100.0%) | $66,953 |
Poverty in Green Mountain Falls
Income Below Poverty by Sex and Age in Green Mountain Falls
With 7.7% poverty level for males and 3.7% for females among the residents of Green Mountain Falls, 75 year old and over males and 35 to 44 year old females are the most vulnerable to poverty, with 5 males (45.5%) and 5 females (45.5%) in their respective age groups living below the poverty level.
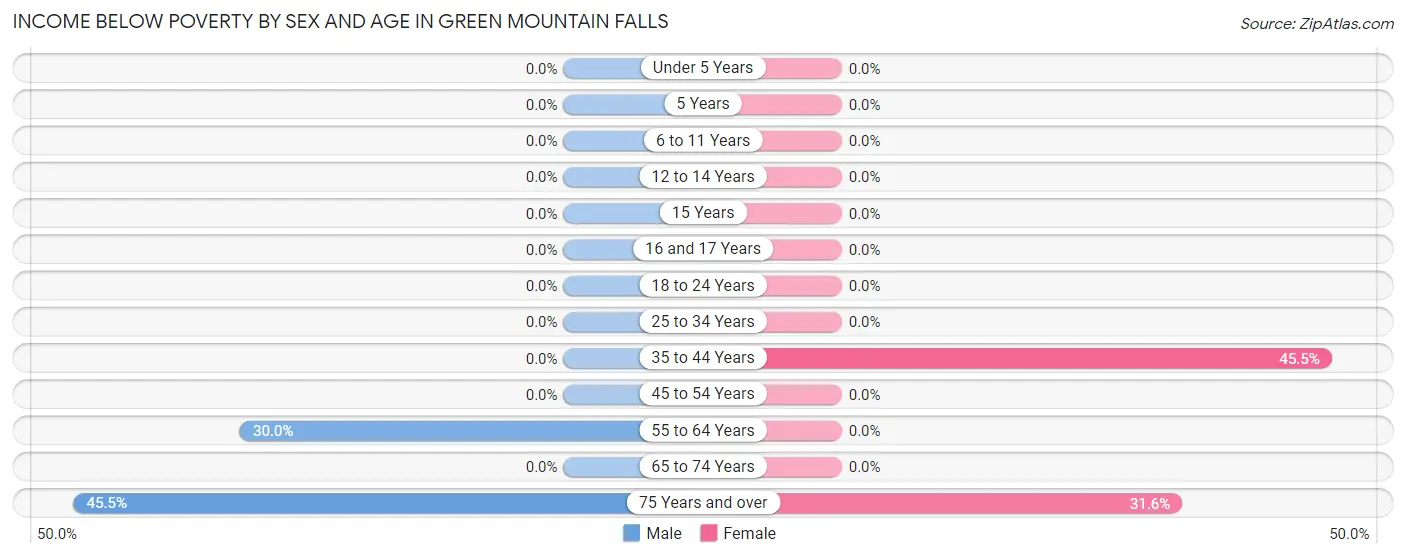
| Age Bracket | Male | Female |
| Under 5 Years | 0 (0.0%) | 0 (0.0%) |
| 5 Years | 0 (0.0%) | 0 (0.0%) |
| 6 to 11 Years | 0 (0.0%) | 0 (0.0%) |
| 12 to 14 Years | 0 (0.0%) | 0 (0.0%) |
| 15 Years | 0 (0.0%) | 0 (0.0%) |
| 16 and 17 Years | 0 (0.0%) | 0 (0.0%) |
| 18 to 24 Years | 0 (0.0%) | 0 (0.0%) |
| 25 to 34 Years | 0 (0.0%) | 0 (0.0%) |
| 35 to 44 Years | 0 (0.0%) | 5 (45.5%) |
| 45 to 54 Years | 0 (0.0%) | 0 (0.0%) |
| 55 to 64 Years | 12 (30.0%) | 0 (0.0%) |
| 65 to 74 Years | 0 (0.0%) | 0 (0.0%) |
| 75 Years and over | 5 (45.5%) | 6 (31.6%) |
| Total | 17 (7.7%) | 11 (3.7%) |
Income Above Poverty by Sex and Age in Green Mountain Falls
According to the poverty statistics in Green Mountain Falls, males aged 18 to 24 years and females aged under 5 years are the age groups that are most secure financially, with 100.0% of males and 100.0% of females in these age groups living above the poverty line.
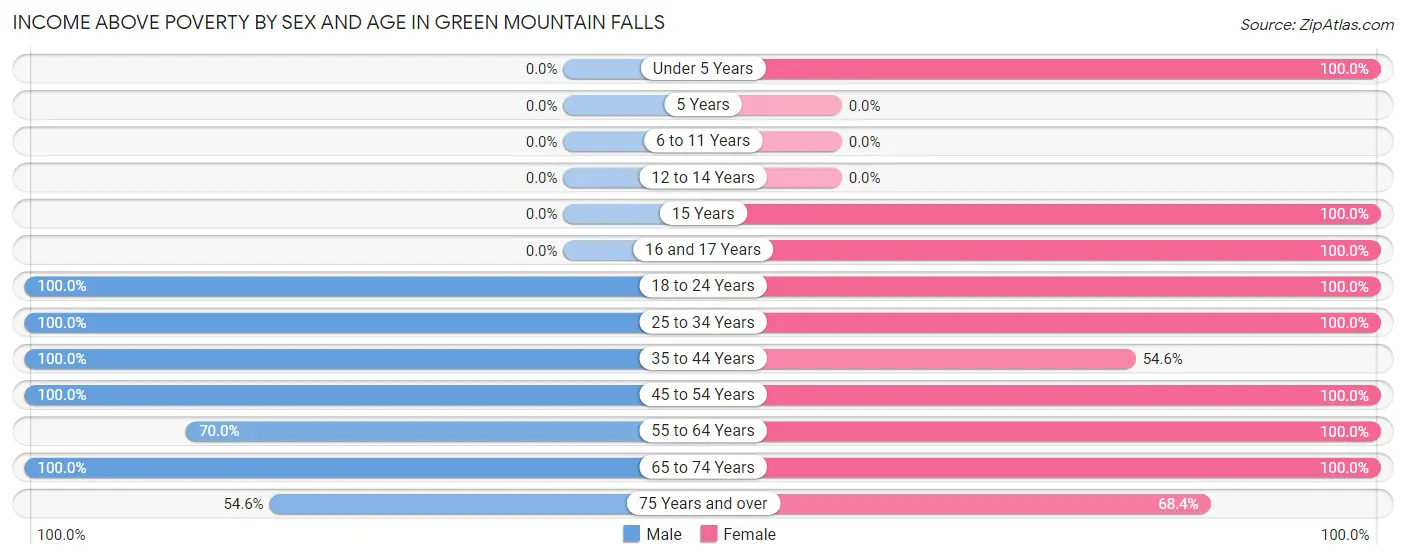
| Age Bracket | Male | Female |
| Under 5 Years | 0 (0.0%) | 4 (100.0%) |
| 5 Years | 0 (0.0%) | 0 (0.0%) |
| 6 to 11 Years | 0 (0.0%) | 0 (0.0%) |
| 12 to 14 Years | 0 (0.0%) | 0 (0.0%) |
| 15 Years | 0 (0.0%) | 7 (100.0%) |
| 16 and 17 Years | 0 (0.0%) | 35 (100.0%) |
| 18 to 24 Years | 20 (100.0%) | 25 (100.0%) |
| 25 to 34 Years | 63 (100.0%) | 68 (100.0%) |
| 35 to 44 Years | 4 (100.0%) | 6 (54.5%) |
| 45 to 54 Years | 47 (100.0%) | 33 (100.0%) |
| 55 to 64 Years | 28 (70.0%) | 56 (100.0%) |
| 65 to 74 Years | 35 (100.0%) | 36 (100.0%) |
| 75 Years and over | 6 (54.5%) | 13 (68.4%) |
| Total | 203 (92.3%) | 283 (96.3%) |
Income Below Poverty Among Married-Couple Families in Green Mountain Falls
The poverty statistics for married-couple families in Green Mountain Falls show that 5.2% or 6 of the total 116 families live below the poverty line. Families with no children have the highest poverty rate of 6.8%, comprising of 6 families. On the other hand, families with 1 or 2 children have the lowest poverty rate of 0.0%, which includes 0 families.
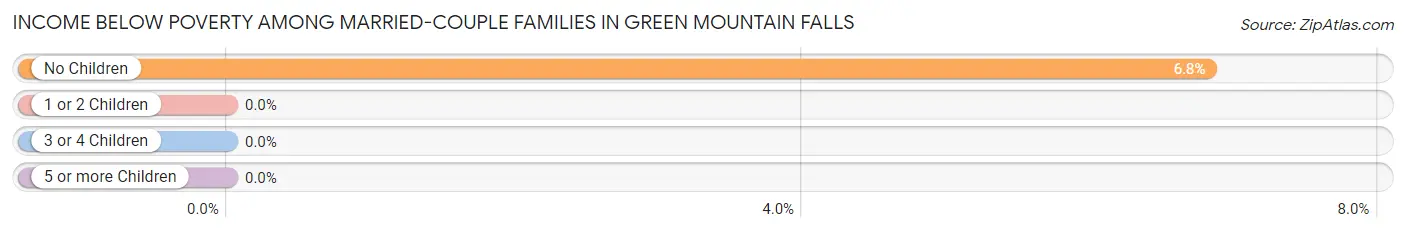
| Children | Above Poverty | Below Poverty |
| No Children | 82 (93.2%) | 6 (6.8%) |
| 1 or 2 Children | 28 (100.0%) | 0 (0.0%) |
| 3 or 4 Children | 0 (0.0%) | 0 (0.0%) |
| 5 or more Children | 0 (0.0%) | 0 (0.0%) |
| Total | 110 (94.8%) | 6 (5.2%) |
Income Below Poverty Among Single-Parent Households in Green Mountain Falls
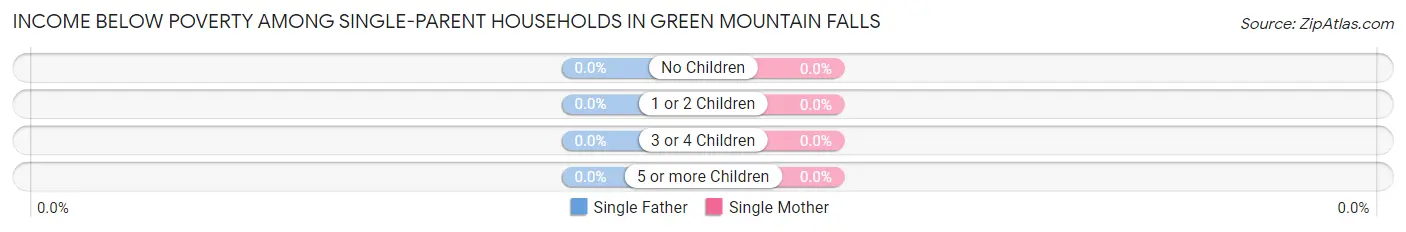
| Children | Single Father | Single Mother |
| No Children | 0 (0.0%) | 0 (0.0%) |
| 1 or 2 Children | 0 (0.0%) | 0 (0.0%) |
| 3 or 4 Children | 0 (0.0%) | 0 (0.0%) |
| 5 or more Children | 0 (0.0%) | 0 (0.0%) |
| Total | 0 (0.0%) | 0 (0.0%) |
Income Below Poverty Among Married-Couple vs Single-Parent Households in Green Mountain Falls
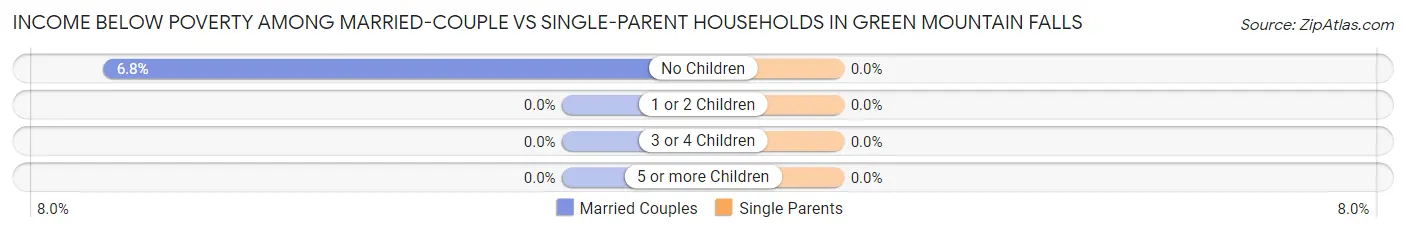
| Children | Married-Couple Families | Single-Parent Households |
| No Children | 6 (6.8%) | 0 (0.0%) |
| 1 or 2 Children | 0 (0.0%) | 0 (0.0%) |
| 3 or 4 Children | 0 (0.0%) | 0 (0.0%) |
| 5 or more Children | 0 (0.0%) | 0 (0.0%) |
| Total | 6 (5.2%) | 0 (0.0%) |
Race in Green Mountain Falls
The most populous races in Green Mountain Falls are White / Caucasian (486 | 93.8%), Two or more Races (17 | 3.3%), and Asian (8 | 1.5%).
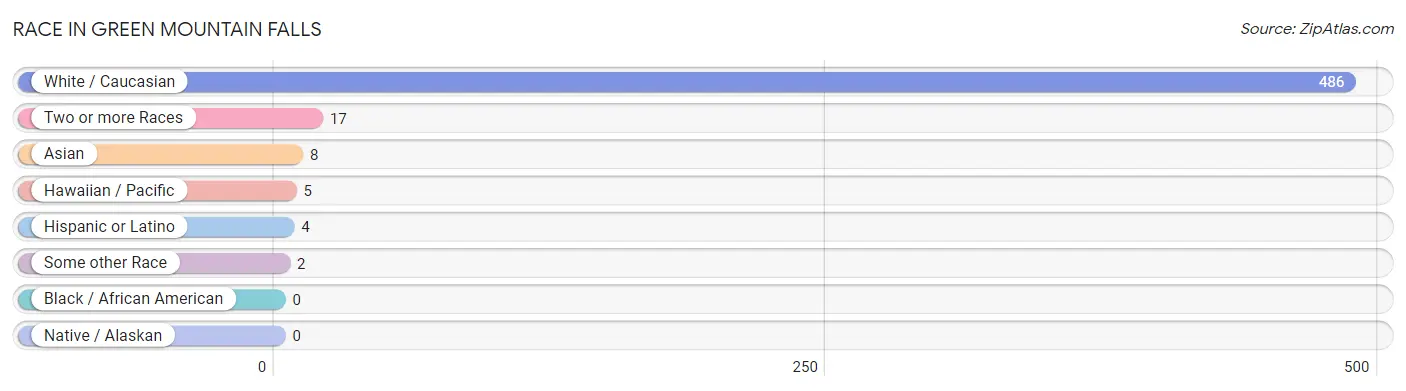
| Race | # Population | % Population |
| Asian | 8 | 1.5% |
| Black / African American | 0 | 0.0% |
| Hawaiian / Pacific | 5 | 1.0% |
| Hispanic or Latino | 4 | 0.8% |
| Native / Alaskan | 0 | 0.0% |
| White / Caucasian | 486 | 93.8% |
| Two or more Races | 17 | 3.3% |
| Some other Race | 2 | 0.4% |
| Total | 518 | 100.0% |
Ancestry in Green Mountain Falls
The most populous ancestries reported in Green Mountain Falls are English (81 | 15.6%), German (79 | 15.2%), European (74 | 14.3%), Italian (59 | 11.4%), and Irish (28 | 5.4%), together accounting for 62.0% of all Green Mountain Falls residents.
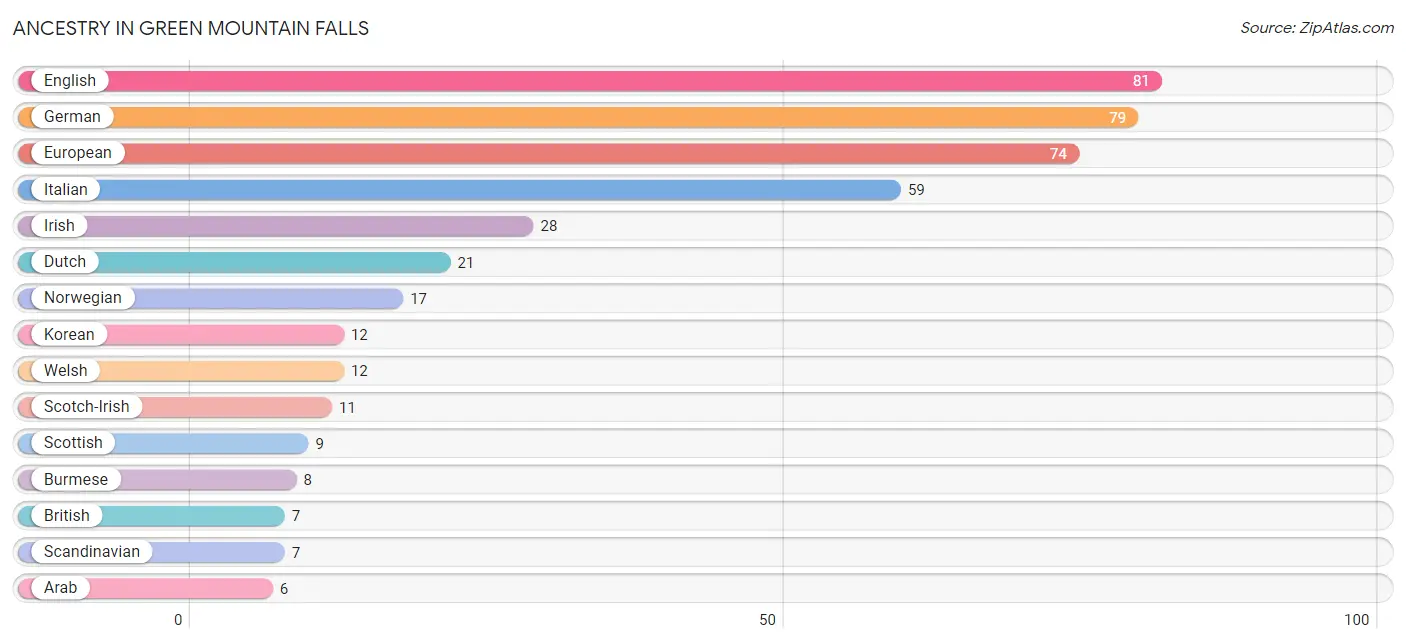
| Ancestry | # Population | % Population |
| Arab | 6 | 1.2% |
| British | 7 | 1.3% |
| Burmese | 8 | 1.5% |
| Czech | 6 | 1.2% |
| Dutch | 21 | 4.1% |
| Eastern European | 5 | 1.0% |
| English | 81 | 15.6% |
| European | 74 | 14.3% |
| Fijian | 5 | 1.0% |
| Finnish | 5 | 1.0% |
| German | 79 | 15.2% |
| Irish | 28 | 5.4% |
| Italian | 59 | 11.4% |
| Korean | 12 | 2.3% |
| Lebanese | 6 | 1.2% |
| Lithuanian | 3 | 0.6% |
| Mexican | 3 | 0.6% |
| Norwegian | 17 | 3.3% |
| Polish | 6 | 1.2% |
| Scandinavian | 7 | 1.3% |
| Scotch-Irish | 11 | 2.1% |
| Scottish | 9 | 1.7% |
| Welsh | 12 | 2.3% | View All 23 Rows |
Immigrants in Green Mountain Falls
The most numerous immigrant groups reported in Green Mountain Falls came from Asia (8 | 1.5%), Eastern Asia (8 | 1.5%), Korea (8 | 1.5%), and Oceania (5 | 1.0%), together accounting for 5.6% of all Green Mountain Falls residents.
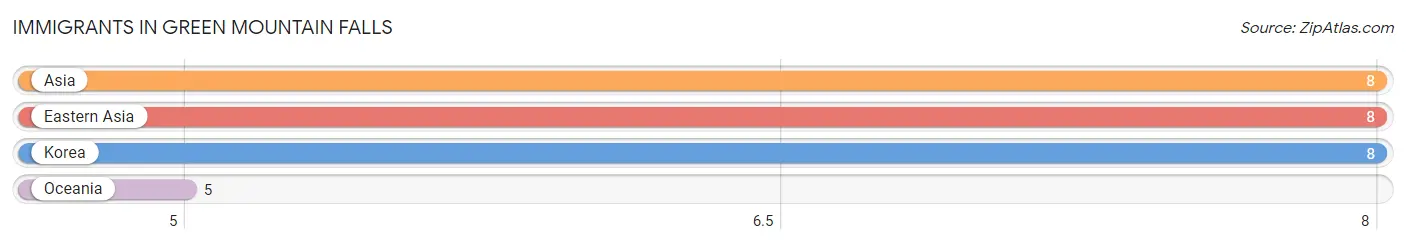
| Immigration Origin | # Population | % Population |
| Asia | 8 | 1.5% |
| Eastern Asia | 8 | 1.5% |
| Korea | 8 | 1.5% |
| Oceania | 5 | 1.0% | View All 4 Rows |
Sex and Age in Green Mountain Falls
Sex and Age in Green Mountain Falls
The most populous age groups in Green Mountain Falls are 45 to 49 Years (36 | 16.1%) for men and 30 to 34 Years (56 | 19.0%) for women.
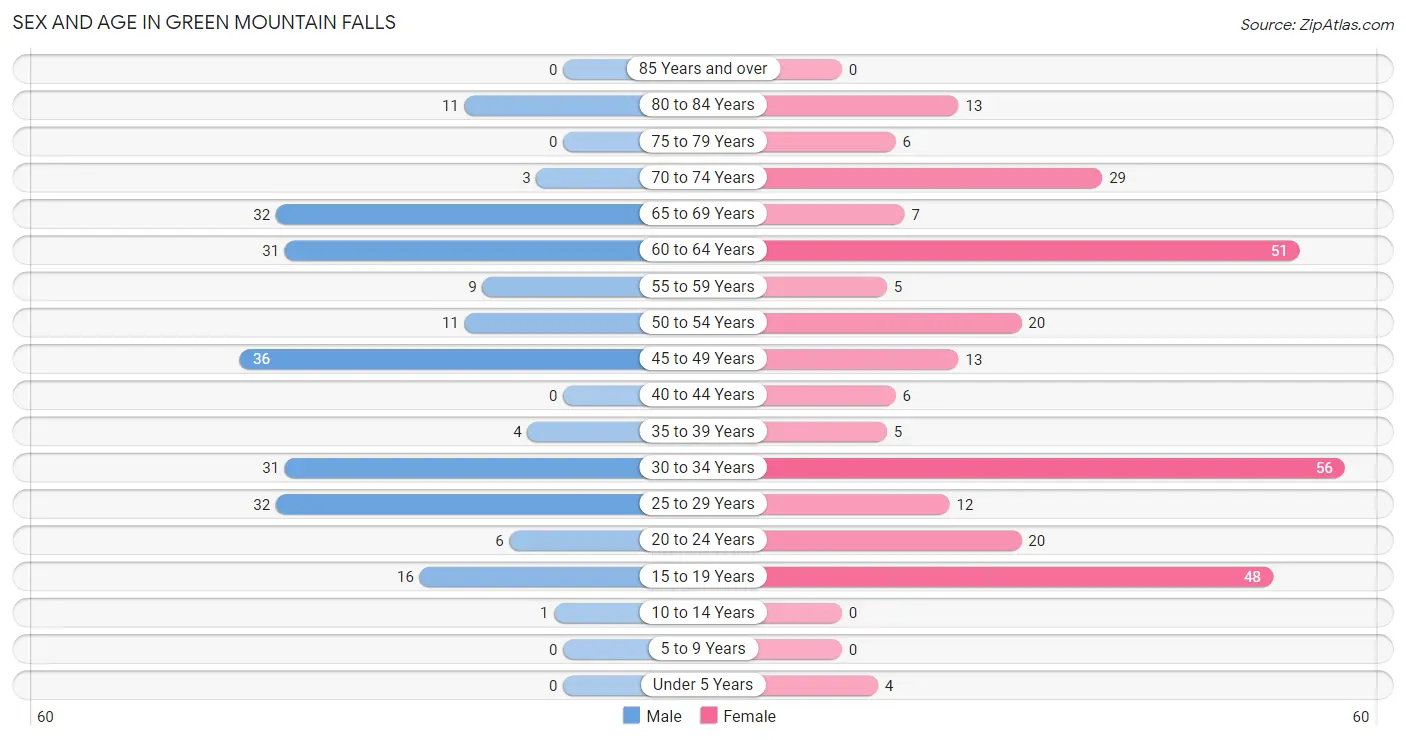
| Age Bracket | Male | Female |
| Under 5 Years | 0 (0.0%) | 4 (1.4%) |
| 5 to 9 Years | 0 (0.0%) | 0 (0.0%) |
| 10 to 14 Years | 1 (0.4%) | 0 (0.0%) |
| 15 to 19 Years | 16 (7.2%) | 48 (16.3%) |
| 20 to 24 Years | 6 (2.7%) | 20 (6.8%) |
| 25 to 29 Years | 32 (14.3%) | 12 (4.1%) |
| 30 to 34 Years | 31 (13.9%) | 56 (19.0%) |
| 35 to 39 Years | 4 (1.8%) | 5 (1.7%) |
| 40 to 44 Years | 0 (0.0%) | 6 (2.0%) |
| 45 to 49 Years | 36 (16.1%) | 13 (4.4%) |
| 50 to 54 Years | 11 (4.9%) | 20 (6.8%) |
| 55 to 59 Years | 9 (4.0%) | 5 (1.7%) |
| 60 to 64 Years | 31 (13.9%) | 51 (17.3%) |
| 65 to 69 Years | 32 (14.3%) | 7 (2.4%) |
| 70 to 74 Years | 3 (1.3%) | 29 (9.8%) |
| 75 to 79 Years | 0 (0.0%) | 6 (2.0%) |
| 80 to 84 Years | 11 (4.9%) | 13 (4.4%) |
| 85 Years and over | 0 (0.0%) | 0 (0.0%) |
| Total | 223 (100.0%) | 295 (100.0%) |
Families and Households in Green Mountain Falls
Median Family Size in Green Mountain Falls
The median family size in Green Mountain Falls is 2.50 persons per family, with married-couple families (116 | 77.8%) accounting for the largest median family size of 2.54 persons per family. On the other hand, single male/father families (14 | 9.4%) represent the smallest median family size with 2.29 persons per family.
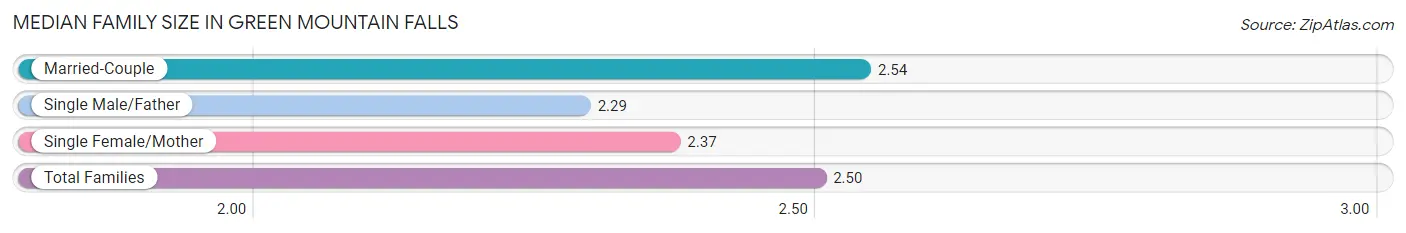
| Family Type | # Families | Family Size |
| Married-Couple | 116 (77.8%) | 2.54 |
| Single Male/Father | 14 (9.4%) | 2.29 |
| Single Female/Mother | 19 (12.8%) | 2.37 |
| Total Families | 149 (100.0%) | 2.50 |
Median Household Size in Green Mountain Falls
The median household size in Green Mountain Falls is 2.01 persons per household, with single female/mother households (19 | 7.4%) accounting for the largest median household size of 3.37 persons per household. non-family households (107 | 41.8%) represent the smallest median household size with 1.15 persons per household.
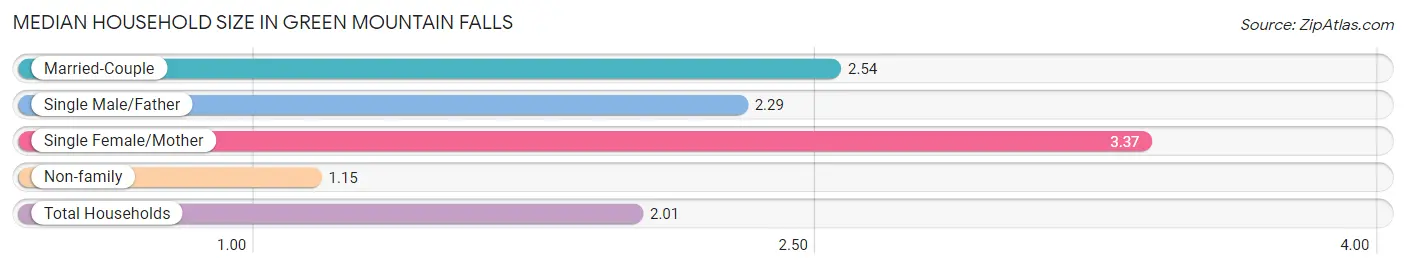
| Household Type | # Households | Household Size |
| Married-Couple | 116 (45.3%) | 2.54 |
| Single Male/Father | 14 (5.5%) | 2.29 |
| Single Female/Mother | 19 (7.4%) | 3.37 |
| Non-family | 107 (41.8%) | 1.15 |
| Total Households | 256 (100.0%) | 2.01 |
Household Size by Marriage Status in Green Mountain Falls
Out of a total of 256 households in Green Mountain Falls, 149 (58.2%) are family households, while 107 (41.8%) are nonfamily households. The most numerous type of family households are 2-person households, comprising 102, and the most common type of nonfamily households are 1-person households, comprising 90.
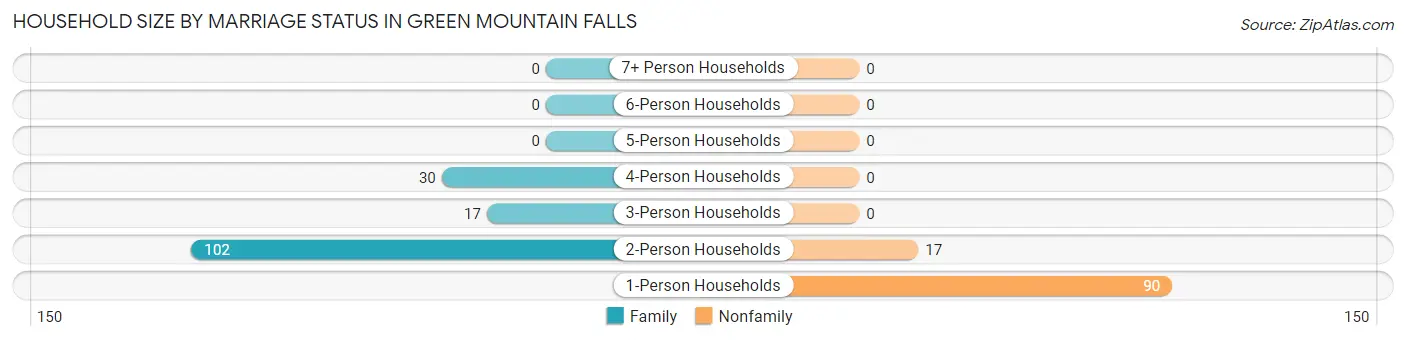
| Household Size | Family Households | Nonfamily Households |
| 1-Person Households | - | 90 (35.2%) |
| 2-Person Households | 102 (39.8%) | 17 (6.6%) |
| 3-Person Households | 17 (6.6%) | 0 (0.0%) |
| 4-Person Households | 30 (11.7%) | 0 (0.0%) |
| 5-Person Households | 0 (0.0%) | 0 (0.0%) |
| 6-Person Households | 0 (0.0%) | 0 (0.0%) |
| 7+ Person Households | 0 (0.0%) | 0 (0.0%) |
| Total | 149 (58.2%) | 107 (41.8%) |
Female Fertility in Green Mountain Falls
Fertility by Age in Green Mountain Falls
| Age Bracket | Women with Births | Births / 1,000 Women |
| 15 to 19 years | 0 (0.0%) | 0.0 |
| 20 to 34 years | 0 (0.0%) | 0.0 |
| 35 to 50 years | 0 (0.0%) | 0.0 |
| Total | 0 (0.0%) | 0.0 |
Fertility by Age by Marriage Status in Green Mountain Falls
| Age Bracket | Married | Unmarried |
| 15 to 19 years | 0 (0.0%) | 0 (0.0%) |
| 20 to 34 years | 0 (0.0%) | 0 (0.0%) |
| 35 to 50 years | 0 (0.0%) | 0 (0.0%) |
| Total | 0 (0.0%) | 0 (0.0%) |
Fertility by Education in Green Mountain Falls
| Educational Attainment | Women with Births | Births / 1,000 Women |
| Less than High School | 0 (0.0%) | 0.0 |
| High School Diploma | 0 (0.0%) | 0.0 |
| College or Associate's Degree | 0 (0.0%) | 0.0 |
| Bachelor's Degree | 0 (0.0%) | 0.0 |
| Graduate Degree | 0 (0.0%) | 0.0 |
| Total | 0 (0.0%) | 0.0 |
Fertility by Education by Marriage Status in Green Mountain Falls
| Educational Attainment | Married | Unmarried |
| Less than High School | 0 (0.0%) | 0 (0.0%) |
| High School Diploma | 0 (0.0%) | 0 (0.0%) |
| College or Associate's Degree | 0 (0.0%) | 0 (0.0%) |
| Bachelor's Degree | 0 (0.0%) | 0 (0.0%) |
| Graduate Degree | 0 (0.0%) | 0 (0.0%) |
| Total | 0 (0.0%) | 0 (0.0%) |
Employment Characteristics in Green Mountain Falls
Employment by Class of Employer in Green Mountain Falls
Among the 330 employed individuals in Green Mountain Falls, private company employees (208 | 63.0%), self-employed (incorporated) (51 | 15.4%), and local government employees (29 | 8.8%) make up the most common classes of employment.
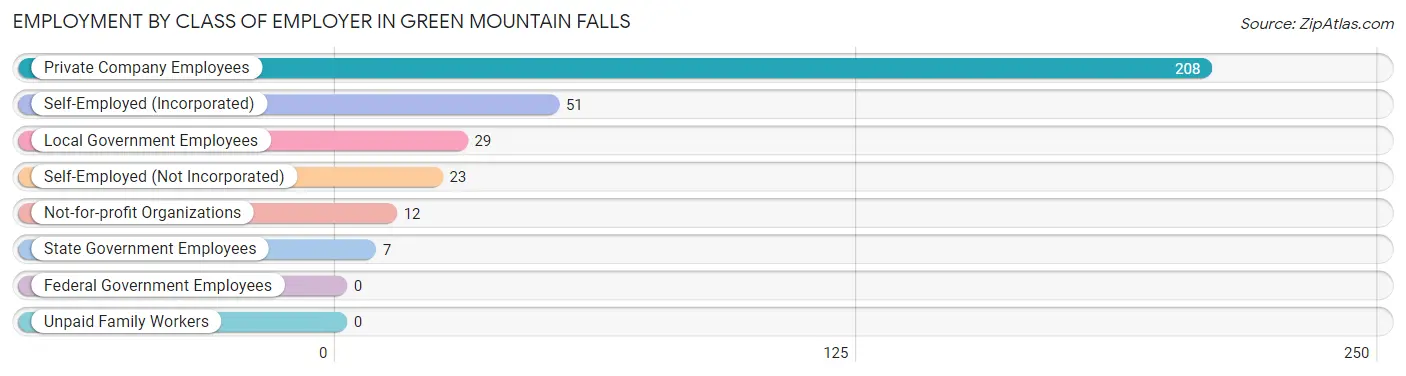
| Employer Class | # Employees | % Employees |
| Private Company Employees | 208 | 63.0% |
| Self-Employed (Incorporated) | 51 | 15.4% |
| Self-Employed (Not Incorporated) | 23 | 7.0% |
| Not-for-profit Organizations | 12 | 3.6% |
| Local Government Employees | 29 | 8.8% |
| State Government Employees | 7 | 2.1% |
| Federal Government Employees | 0 | 0.0% |
| Unpaid Family Workers | 0 | 0.0% |
| Total | 330 | 100.0% |
Employment Status by Age in Green Mountain Falls
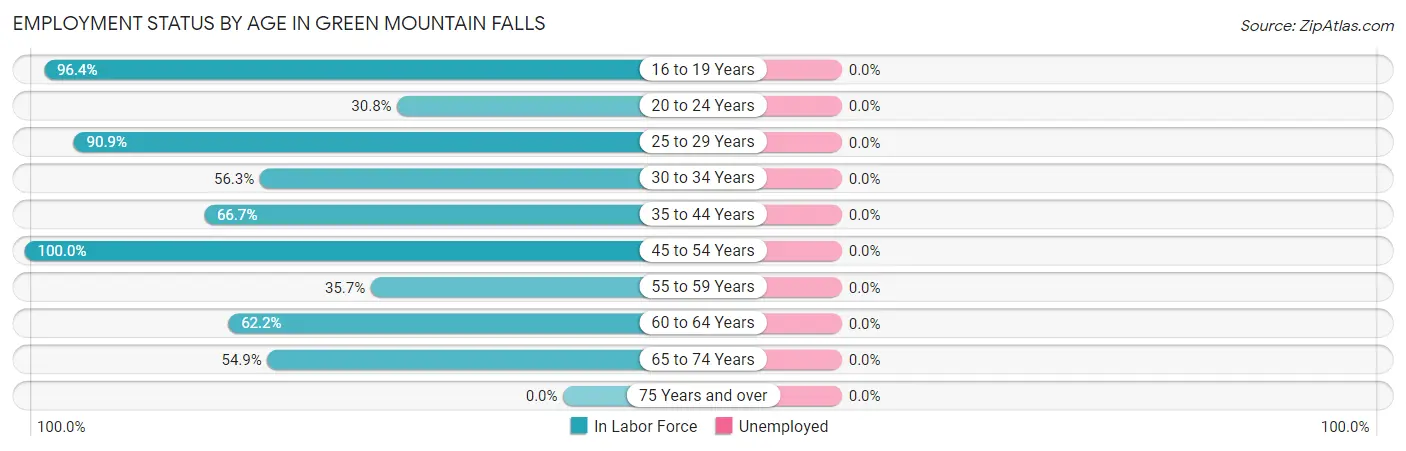
| Age Bracket | In Labor Force | Unemployed |
| 16 to 19 Years | 54 (96.4%) | 0 (0.0%) |
| 20 to 24 Years | 8 (30.8%) | 0 (0.0%) |
| 25 to 29 Years | 40 (90.9%) | 0 (0.0%) |
| 30 to 34 Years | 49 (56.3%) | 0 (0.0%) |
| 35 to 44 Years | 10 (66.7%) | 0 (0.0%) |
| 45 to 54 Years | 80 (100.0%) | 0 (0.0%) |
| 55 to 59 Years | 5 (35.7%) | 0 (0.0%) |
| 60 to 64 Years | 51 (62.2%) | 0 (0.0%) |
| 65 to 74 Years | 39 (54.9%) | 0 (0.0%) |
| 75 Years and over | 0 (0.0%) | 0 (0.0%) |
| Total | 336 (66.5%) | 0 (0.0%) |
Employment Status by Educational Attainment in Green Mountain Falls
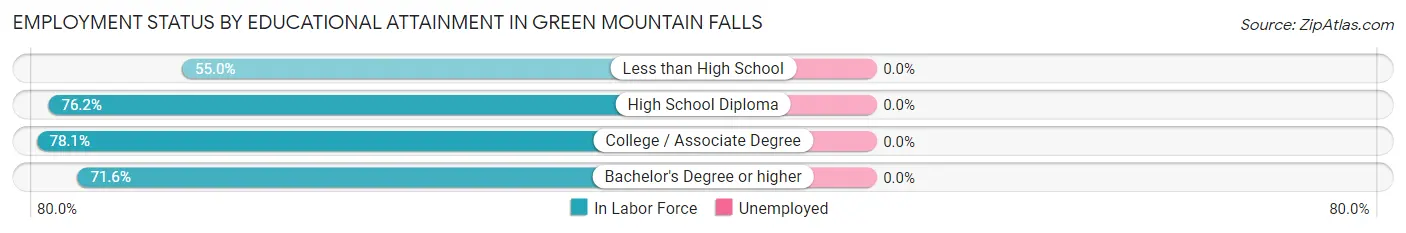
| Educational Attainment | In Labor Force | Unemployed |
| Less than High School | 11 (55.0%) | 0 (0.0%) |
| High School Diploma | 16 (76.2%) | 0 (0.0%) |
| College / Associate Degree | 82 (78.1%) | 0 (0.0%) |
| Bachelor's Degree or higher | 126 (71.6%) | 0 (0.0%) |
| Total | 235 (73.0%) | 0 (0.0%) |
Employment Occupations by Sex in Green Mountain Falls
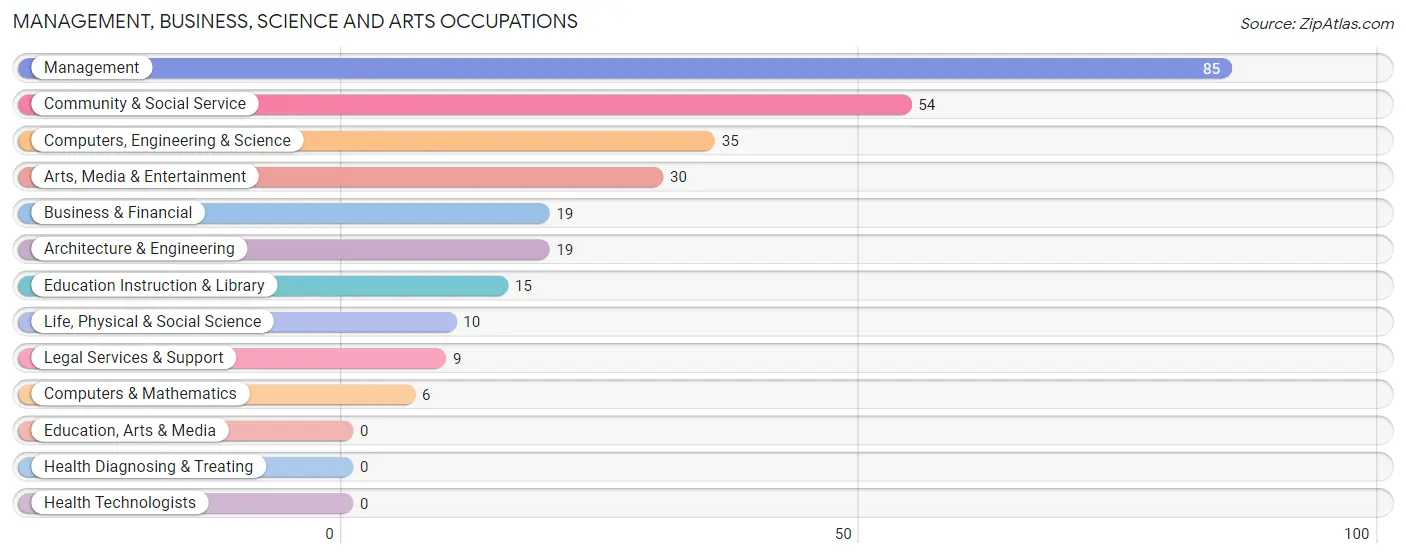
Management, Business, Science and Arts Occupations
The most common Management, Business, Science and Arts occupations in Green Mountain Falls are Management (85 | 25.3%), Community & Social Service (54 | 16.1%), Computers, Engineering & Science (35 | 10.4%), Arts, Media & Entertainment (30 | 8.9%), and Business & Financial (19 | 5.7%).
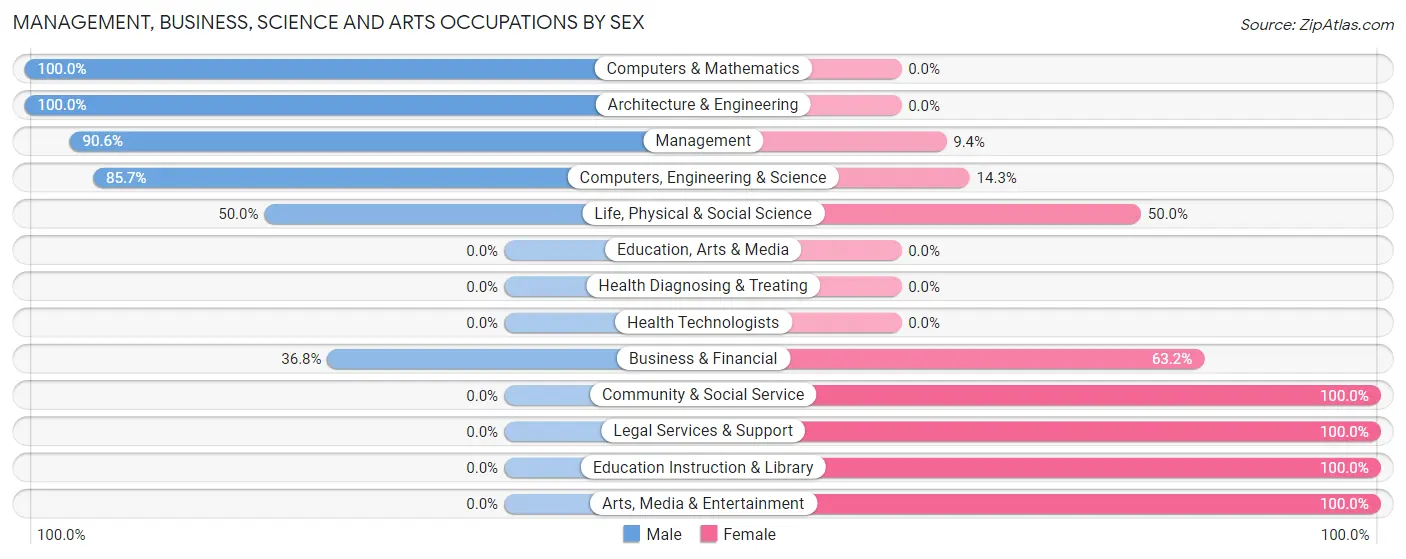
Management, Business, Science and Arts Occupations by Sex
Within the Management, Business, Science and Arts occupations in Green Mountain Falls, the most male-oriented occupations are Computers & Mathematics (100.0%), Architecture & Engineering (100.0%), and Management (90.6%), while the most female-oriented occupations are Community & Social Service (100.0%), Legal Services & Support (100.0%), and Education Instruction & Library (100.0%).
| Occupation | Male | Female |
| Management | 77 (90.6%) | 8 (9.4%) |
| Business & Financial | 7 (36.8%) | 12 (63.2%) |
| Computers, Engineering & Science | 30 (85.7%) | 5 (14.3%) |
| Computers & Mathematics | 6 (100.0%) | 0 (0.0%) |
| Architecture & Engineering | 19 (100.0%) | 0 (0.0%) |
| Life, Physical & Social Science | 5 (50.0%) | 5 (50.0%) |
| Community & Social Service | 0 (0.0%) | 54 (100.0%) |
| Education, Arts & Media | 0 (0.0%) | 0 (0.0%) |
| Legal Services & Support | 0 (0.0%) | 9 (100.0%) |
| Education Instruction & Library | 0 (0.0%) | 15 (100.0%) |
| Arts, Media & Entertainment | 0 (0.0%) | 30 (100.0%) |
| Health Diagnosing & Treating | 0 (0.0%) | 0 (0.0%) |
| Health Technologists | 0 (0.0%) | 0 (0.0%) |
| Total (Category) | 114 (59.1%) | 79 (40.9%) |
| Total (Overall) | 163 (48.5%) | 173 (51.5%) |
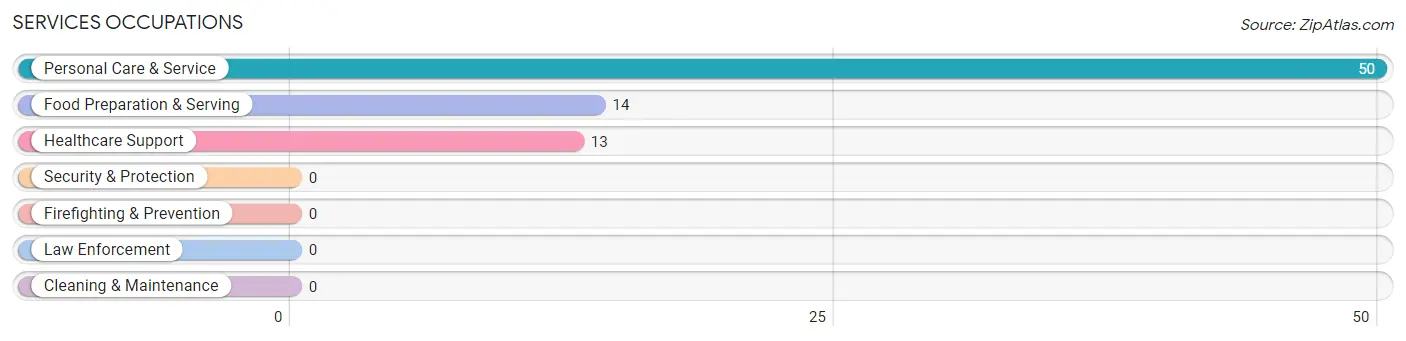
Services Occupations
The most common Services occupations in Green Mountain Falls are Personal Care & Service (50 | 14.9%), Food Preparation & Serving (14 | 4.2%), and Healthcare Support (13 | 3.9%).
Services Occupations by Sex
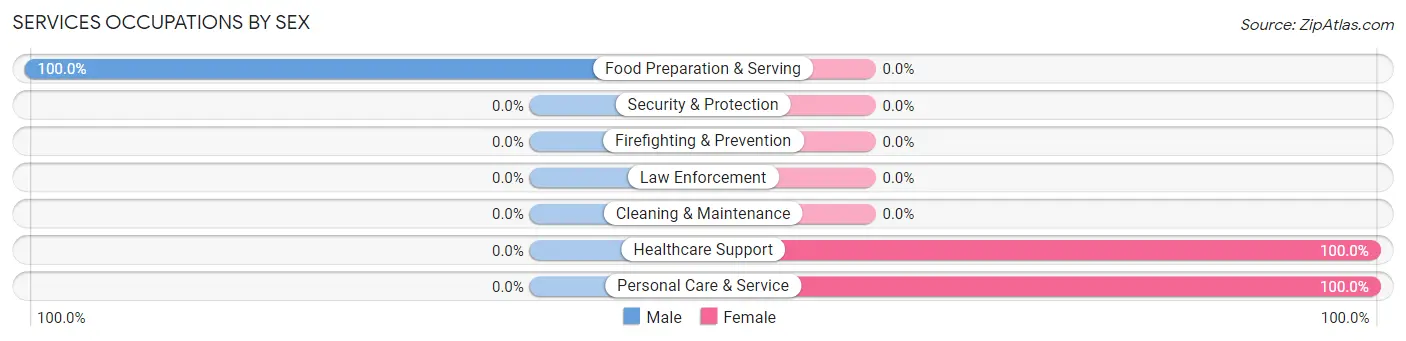
| Occupation | Male | Female |
| Healthcare Support | 0 (0.0%) | 13 (100.0%) |
| Security & Protection | 0 (0.0%) | 0 (0.0%) |
| Firefighting & Prevention | 0 (0.0%) | 0 (0.0%) |
| Law Enforcement | 0 (0.0%) | 0 (0.0%) |
| Food Preparation & Serving | 14 (100.0%) | 0 (0.0%) |
| Cleaning & Maintenance | 0 (0.0%) | 0 (0.0%) |
| Personal Care & Service | 0 (0.0%) | 50 (100.0%) |
| Total (Category) | 14 (18.2%) | 63 (81.8%) |
| Total (Overall) | 163 (48.5%) | 173 (51.5%) |
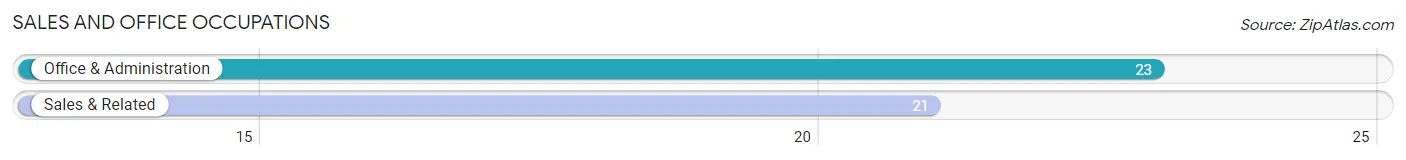
Sales and Office Occupations
The most common Sales and Office occupations in Green Mountain Falls are Office & Administration (23 | 6.9%), and Sales & Related (21 | 6.2%).
Sales and Office Occupations by Sex
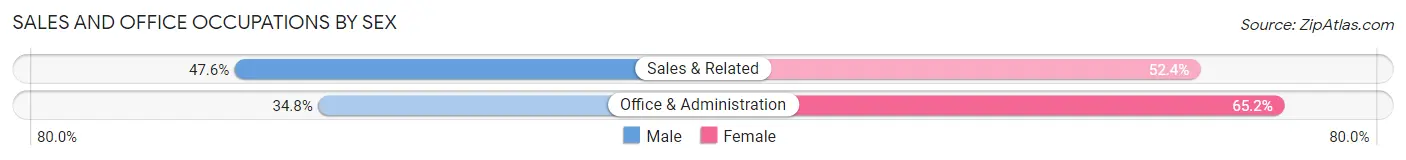
| Occupation | Male | Female |
| Sales & Related | 10 (47.6%) | 11 (52.4%) |
| Office & Administration | 8 (34.8%) | 15 (65.2%) |
| Total (Category) | 18 (40.9%) | 26 (59.1%) |
| Total (Overall) | 163 (48.5%) | 173 (51.5%) |
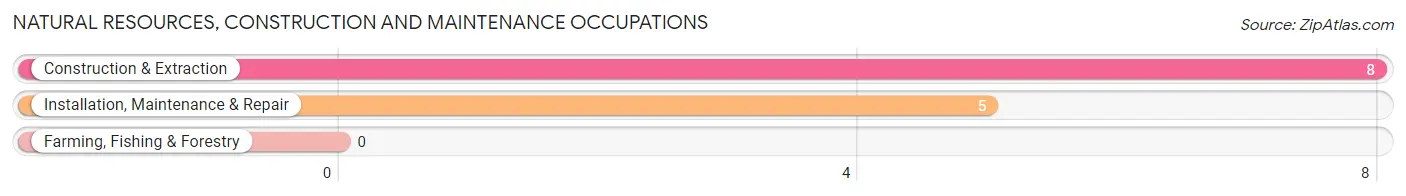
Natural Resources, Construction and Maintenance Occupations
The most common Natural Resources, Construction and Maintenance occupations in Green Mountain Falls are Construction & Extraction (8 | 2.4%), and Installation, Maintenance & Repair (5 | 1.5%).
Natural Resources, Construction and Maintenance Occupations by Sex
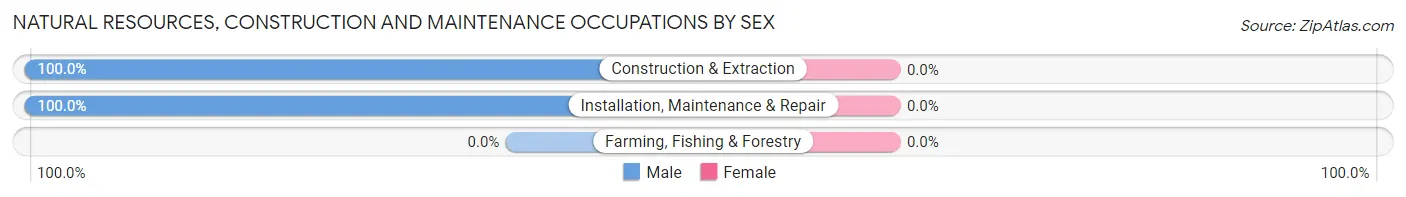
| Occupation | Male | Female |
| Farming, Fishing & Forestry | 0 (0.0%) | 0 (0.0%) |
| Construction & Extraction | 8 (100.0%) | 0 (0.0%) |
| Installation, Maintenance & Repair | 5 (100.0%) | 0 (0.0%) |
| Total (Category) | 13 (100.0%) | 0 (0.0%) |
| Total (Overall) | 163 (48.5%) | 173 (51.5%) |
Production, Transportation and Moving Occupations
The most common Production, Transportation and Moving occupations in Green Mountain Falls are Production (5 | 1.5%), and Transportation (4 | 1.2%).
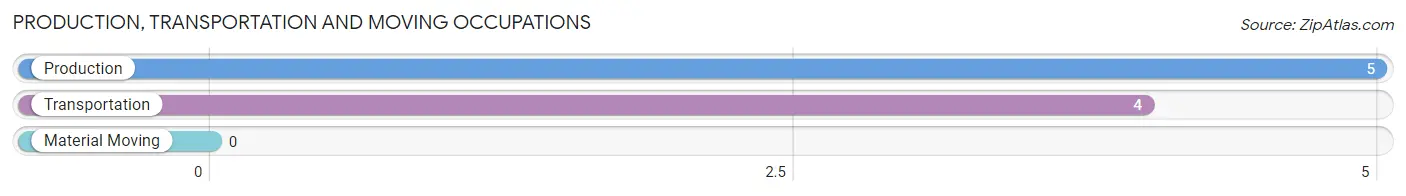
Production, Transportation and Moving Occupations by Sex
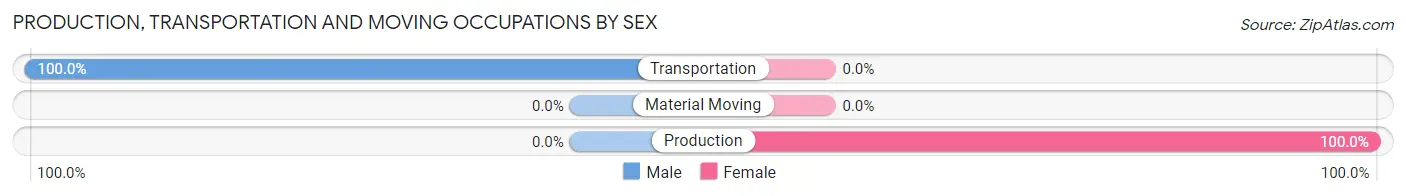
| Occupation | Male | Female |
| Production | 0 (0.0%) | 5 (100.0%) |
| Transportation | 4 (100.0%) | 0 (0.0%) |
| Material Moving | 0 (0.0%) | 0 (0.0%) |
| Total (Category) | 4 (44.4%) | 5 (55.6%) |
| Total (Overall) | 163 (48.5%) | 173 (51.5%) |
Employment Industries by Sex in Green Mountain Falls
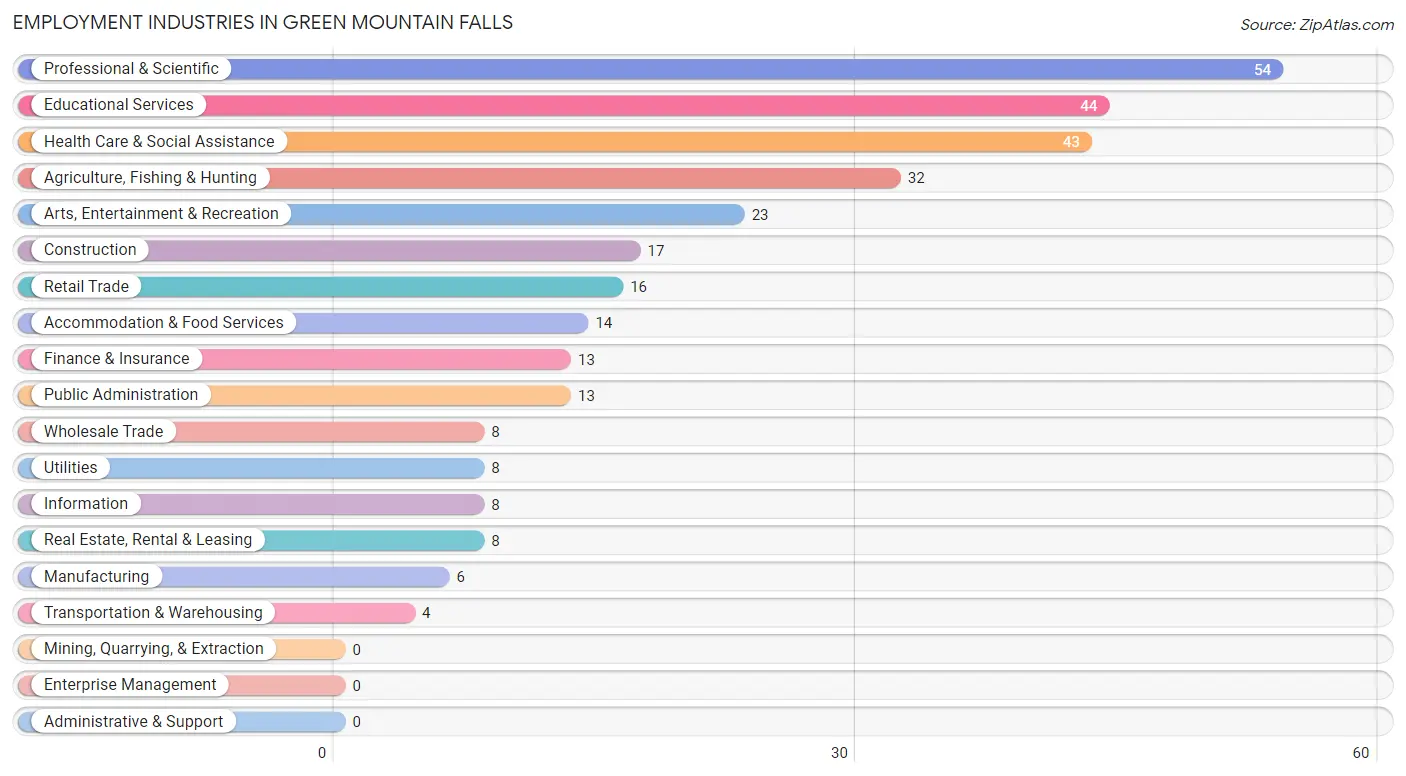
Employment Industries in Green Mountain Falls
The major employment industries in Green Mountain Falls include Professional & Scientific (54 | 16.1%), Educational Services (44 | 13.1%), Health Care & Social Assistance (43 | 12.8%), Agriculture, Fishing & Hunting (32 | 9.5%), and Arts, Entertainment & Recreation (23 | 6.9%).
Employment Industries by Sex in Green Mountain Falls
The Green Mountain Falls industries that see more men than women are Agriculture, Fishing & Hunting (100.0%), Construction (100.0%), and Manufacturing (100.0%), whereas the industries that tend to have a higher number of women are Retail Trade (100.0%), Real Estate, Rental & Leasing (100.0%), and Educational Services (100.0%).
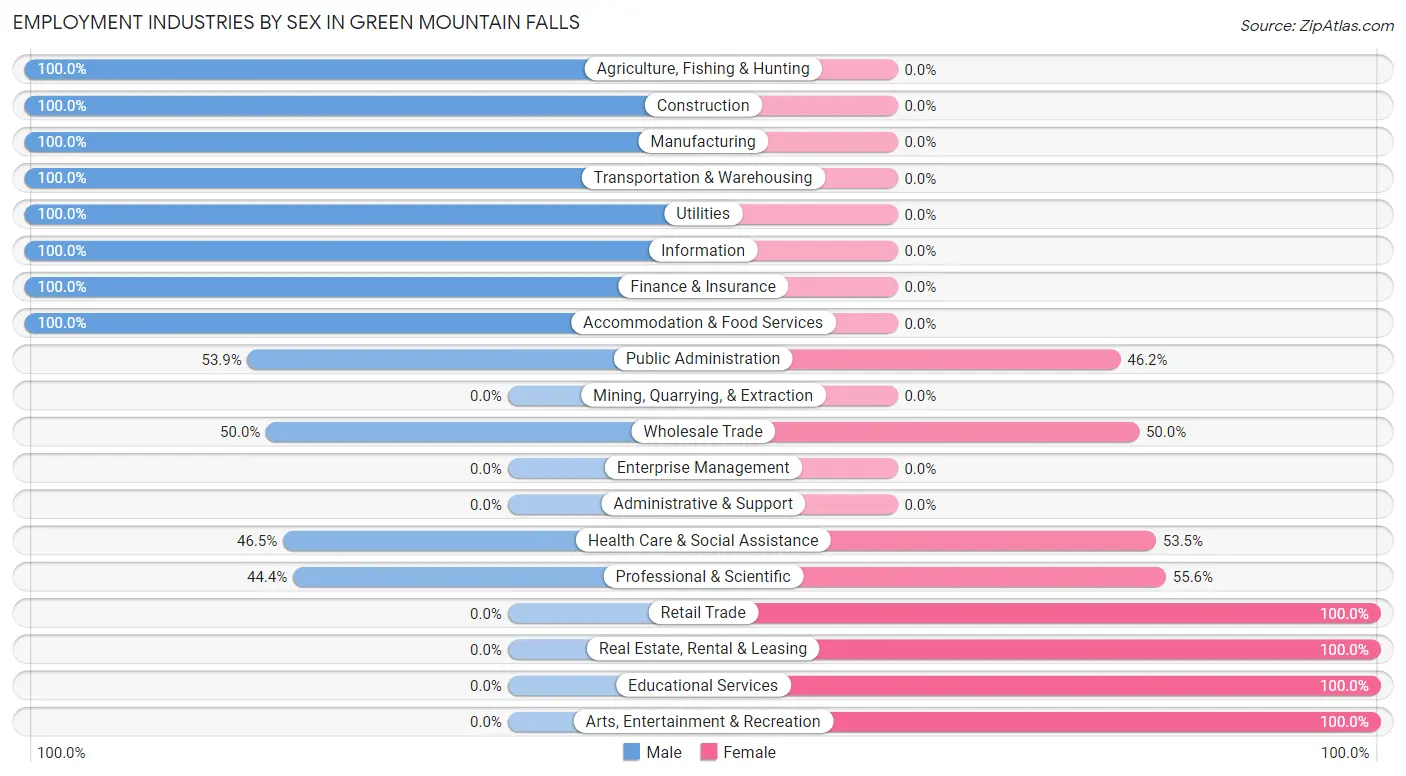
| Industry | Male | Female |
| Agriculture, Fishing & Hunting | 32 (100.0%) | 0 (0.0%) |
| Mining, Quarrying, & Extraction | 0 (0.0%) | 0 (0.0%) |
| Construction | 17 (100.0%) | 0 (0.0%) |
| Manufacturing | 6 (100.0%) | 0 (0.0%) |
| Wholesale Trade | 4 (50.0%) | 4 (50.0%) |
| Retail Trade | 0 (0.0%) | 16 (100.0%) |
| Transportation & Warehousing | 4 (100.0%) | 0 (0.0%) |
| Utilities | 8 (100.0%) | 0 (0.0%) |
| Information | 8 (100.0%) | 0 (0.0%) |
| Finance & Insurance | 13 (100.0%) | 0 (0.0%) |
| Real Estate, Rental & Leasing | 0 (0.0%) | 8 (100.0%) |
| Professional & Scientific | 24 (44.4%) | 30 (55.6%) |
| Enterprise Management | 0 (0.0%) | 0 (0.0%) |
| Administrative & Support | 0 (0.0%) | 0 (0.0%) |
| Educational Services | 0 (0.0%) | 44 (100.0%) |
| Health Care & Social Assistance | 20 (46.5%) | 23 (53.5%) |
| Arts, Entertainment & Recreation | 0 (0.0%) | 23 (100.0%) |
| Accommodation & Food Services | 14 (100.0%) | 0 (0.0%) |
| Public Administration | 7 (53.8%) | 6 (46.2%) |
| Total | 163 (48.5%) | 173 (51.5%) |
Education in Green Mountain Falls
School Enrollment in Green Mountain Falls
The most common levels of schooling among the 104 students in Green Mountain Falls are high school (64 | 61.5%), college / undergraduate (28 | 26.9%), and graduate / professional (12 | 11.5%).
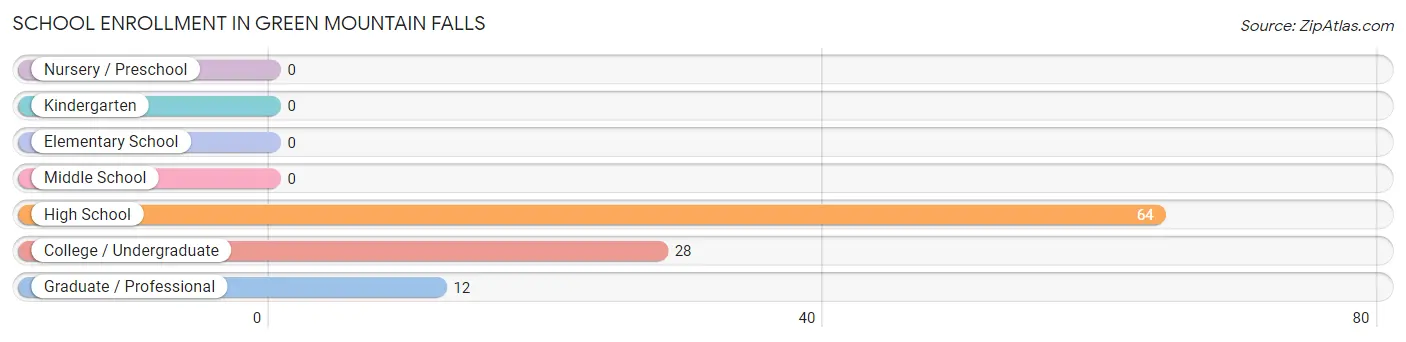
| School Level | # Students | % Students |
| Nursery / Preschool | 0 | 0.0% |
| Kindergarten | 0 | 0.0% |
| Elementary School | 0 | 0.0% |
| Middle School | 0 | 0.0% |
| High School | 64 | 61.5% |
| College / Undergraduate | 28 | 26.9% |
| Graduate / Professional | 12 | 11.5% |
| Total | 104 | 100.0% |
School Enrollment by Age by Funding Source in Green Mountain Falls
Out of a total of 104 students who are enrolled in schools in Green Mountain Falls, 1 (1.0%) attend a private institution, while the remaining 103 (99.0%) are enrolled in public schools. The age group of 15 to 17 year olds has the highest likelihood of being enrolled in private schools, with 1 (2.3% in the age bracket) enrolled. Conversely, the age group of 10 to 14 year olds has the lowest likelihood of being enrolled in a private school, with 1 (100.0% in the age bracket) attending a public institution.
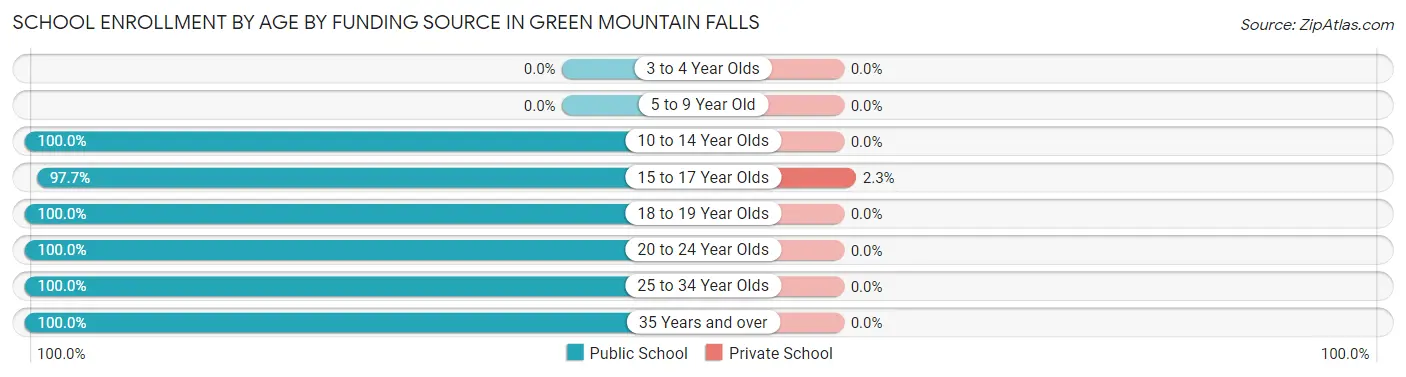
| Age Bracket | Public School | Private School |
| 3 to 4 Year Olds | 0 (0.0%) | 0 (0.0%) |
| 5 to 9 Year Old | 0 (0.0%) | 0 (0.0%) |
| 10 to 14 Year Olds | 1 (100.0%) | 0 (0.0%) |
| 15 to 17 Year Olds | 43 (97.7%) | 1 (2.3%) |
| 18 to 19 Year Olds | 19 (100.0%) | 0 (0.0%) |
| 20 to 24 Year Olds | 20 (100.0%) | 0 (0.0%) |
| 25 to 34 Year Olds | 8 (100.0%) | 0 (0.0%) |
| 35 Years and over | 12 (100.0%) | 0 (0.0%) |
| Total | 103 (99.0%) | 1 (1.0%) |
Educational Attainment by Field of Study in Green Mountain Falls
Science & technology (51 | 18.5%), education (35 | 12.7%), business (31 | 11.3%), psychology (25 | 9.1%), and engineering (20 | 7.3%) are the most common fields of study among 275 individuals in Green Mountain Falls who have obtained a bachelor's degree or higher.
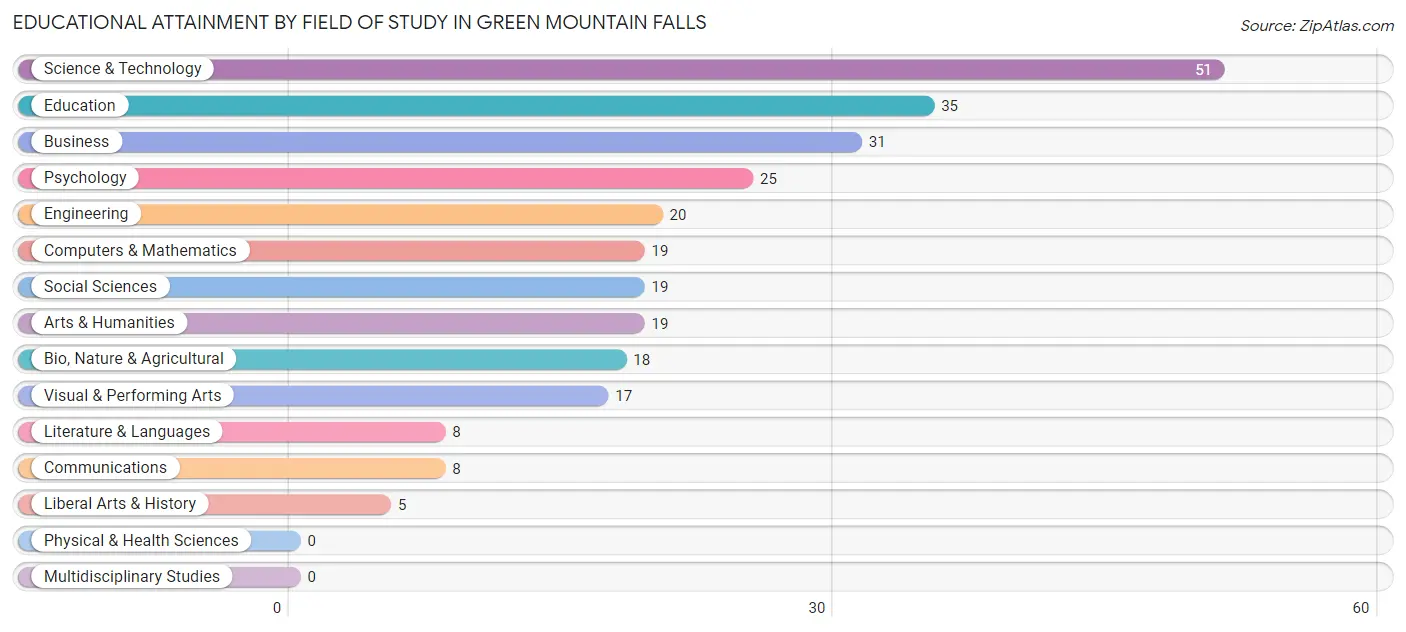
| Field of Study | # Graduates | % Graduates |
| Computers & Mathematics | 19 | 6.9% |
| Bio, Nature & Agricultural | 18 | 6.6% |
| Physical & Health Sciences | 0 | 0.0% |
| Psychology | 25 | 9.1% |
| Social Sciences | 19 | 6.9% |
| Engineering | 20 | 7.3% |
| Multidisciplinary Studies | 0 | 0.0% |
| Science & Technology | 51 | 18.5% |
| Business | 31 | 11.3% |
| Education | 35 | 12.7% |
| Literature & Languages | 8 | 2.9% |
| Liberal Arts & History | 5 | 1.8% |
| Visual & Performing Arts | 17 | 6.2% |
| Communications | 8 | 2.9% |
| Arts & Humanities | 19 | 6.9% |
| Total | 275 | 100.0% |
Transportation & Commute in Green Mountain Falls
Vehicle Availability by Sex in Green Mountain Falls
The most prevalent vehicle ownership categories in Green Mountain Falls are males with 2 vehicles (59, accounting for 37.6%) and females with 2 vehicles (52, making up 34.1%).
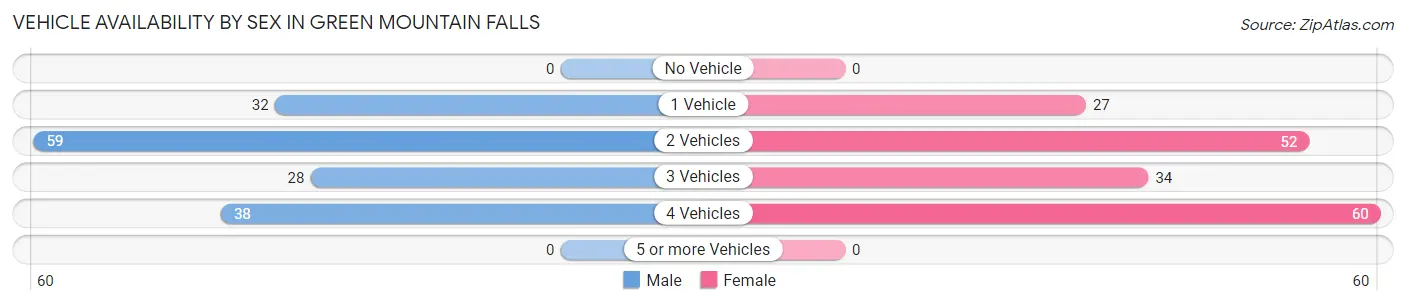
| Vehicles Available | Male | Female |
| No Vehicle | 0 (0.0%) | 0 (0.0%) |
| 1 Vehicle | 32 (20.4%) | 27 (15.6%) |
| 2 Vehicles | 59 (37.6%) | 52 (30.1%) |
| 3 Vehicles | 28 (17.8%) | 34 (19.7%) |
| 4 Vehicles | 38 (24.2%) | 60 (34.7%) |
| 5 or more Vehicles | 0 (0.0%) | 0 (0.0%) |
| Total | 157 (100.0%) | 173 (100.0%) |
Commute Time in Green Mountain Falls
The most frequently occuring commute durations in Green Mountain Falls are 20 to 24 minutes (78 commuters, 27.0%), 25 to 29 minutes (47 commuters, 16.3%), and 30 to 34 minutes (42 commuters, 14.5%).
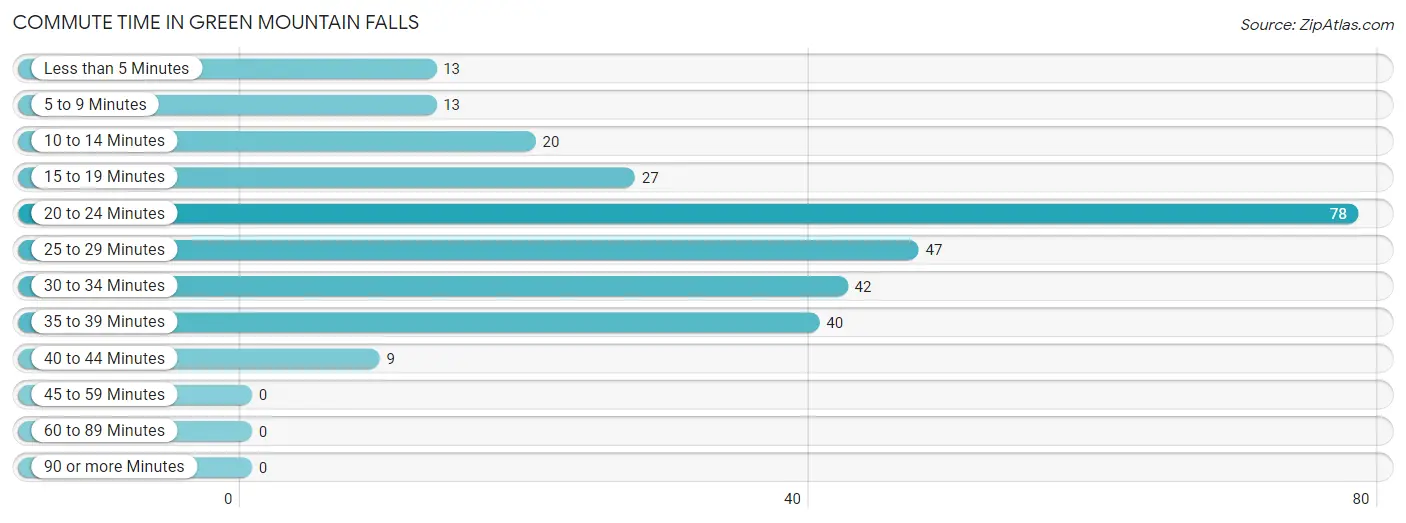
| Commute Time | # Commuters | % Commuters |
| Less than 5 Minutes | 13 | 4.5% |
| 5 to 9 Minutes | 13 | 4.5% |
| 10 to 14 Minutes | 20 | 6.9% |
| 15 to 19 Minutes | 27 | 9.3% |
| 20 to 24 Minutes | 78 | 27.0% |
| 25 to 29 Minutes | 47 | 16.3% |
| 30 to 34 Minutes | 42 | 14.5% |
| 35 to 39 Minutes | 40 | 13.8% |
| 40 to 44 Minutes | 9 | 3.1% |
| 45 to 59 Minutes | 0 | 0.0% |
| 60 to 89 Minutes | 0 | 0.0% |
| 90 or more Minutes | 0 | 0.0% |
Commute Time by Sex in Green Mountain Falls
The most common commute times in Green Mountain Falls are 25 to 29 minutes (47 commuters, 32.2%) for males and 20 to 24 minutes (61 commuters, 42.7%) for females.
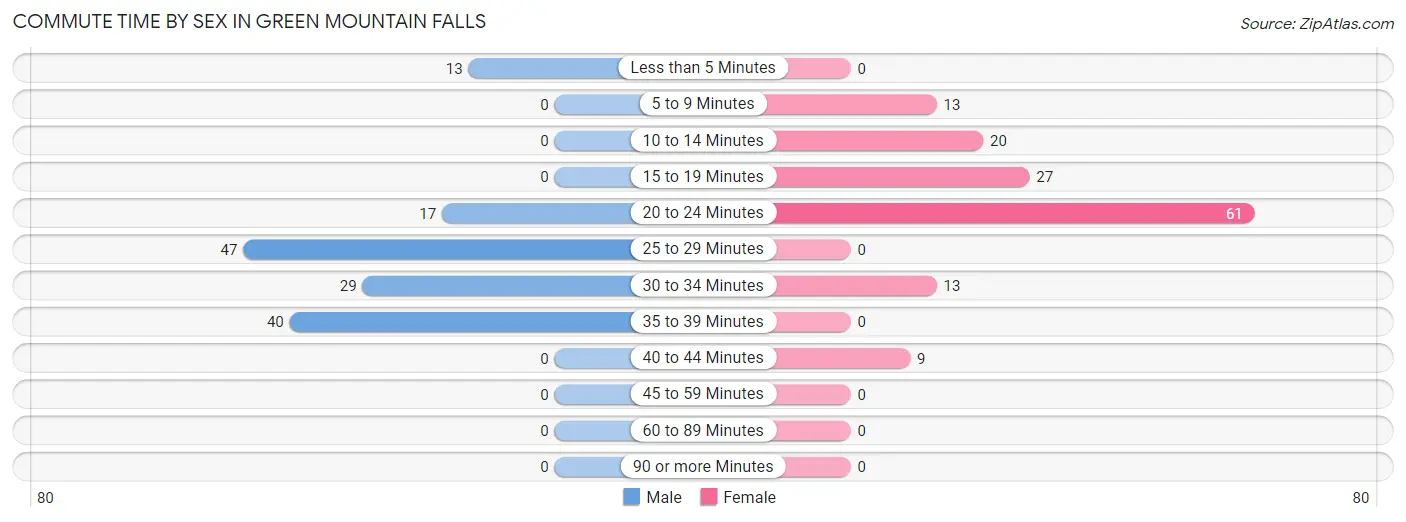
| Commute Time | Male | Female |
| Less than 5 Minutes | 13 (8.9%) | 0 (0.0%) |
| 5 to 9 Minutes | 0 (0.0%) | 13 (9.1%) |
| 10 to 14 Minutes | 0 (0.0%) | 20 (14.0%) |
| 15 to 19 Minutes | 0 (0.0%) | 27 (18.9%) |
| 20 to 24 Minutes | 17 (11.6%) | 61 (42.7%) |
| 25 to 29 Minutes | 47 (32.2%) | 0 (0.0%) |
| 30 to 34 Minutes | 29 (19.9%) | 13 (9.1%) |
| 35 to 39 Minutes | 40 (27.4%) | 0 (0.0%) |
| 40 to 44 Minutes | 0 (0.0%) | 9 (6.3%) |
| 45 to 59 Minutes | 0 (0.0%) | 0 (0.0%) |
| 60 to 89 Minutes | 0 (0.0%) | 0 (0.0%) |
| 90 or more Minutes | 0 (0.0%) | 0 (0.0%) |
Time of Departure to Work by Sex in Green Mountain Falls
The most frequent times of departure to work in Green Mountain Falls are 7:00 AM to 7:29 AM (36, 24.7%) for males and 7:00 AM to 7:29 AM (38, 26.6%) for females.
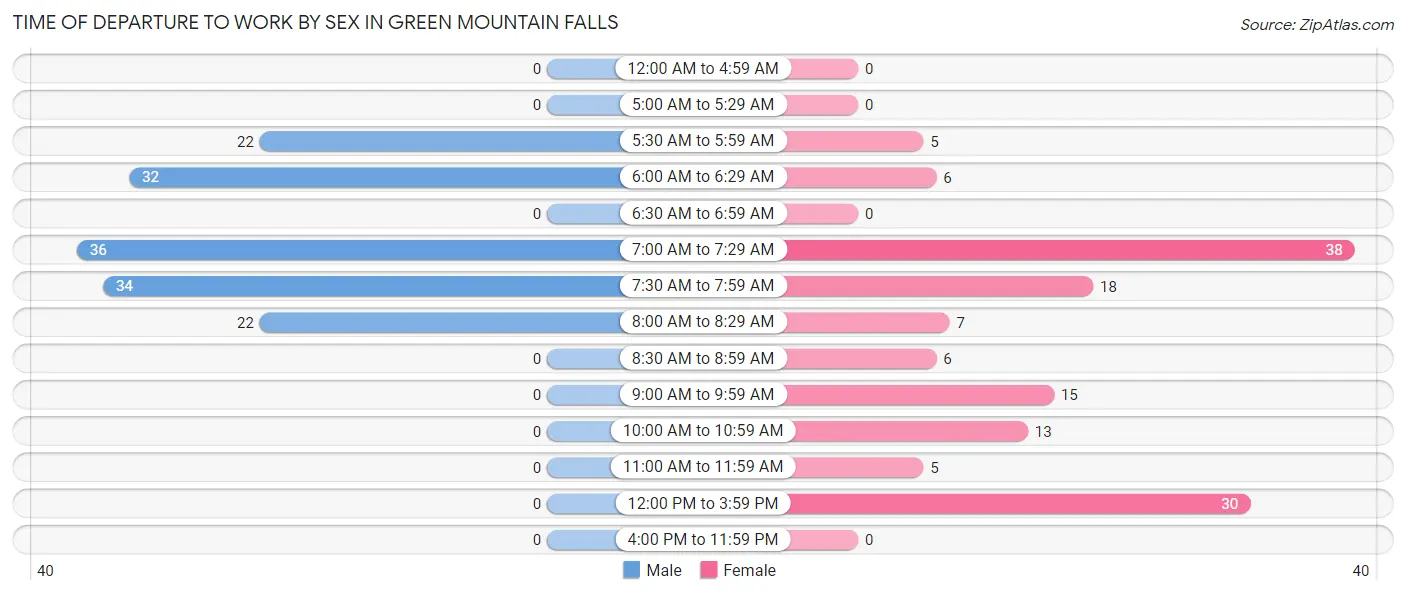
| Time of Departure | Male | Female |
| 12:00 AM to 4:59 AM | 0 (0.0%) | 0 (0.0%) |
| 5:00 AM to 5:29 AM | 0 (0.0%) | 0 (0.0%) |
| 5:30 AM to 5:59 AM | 22 (15.1%) | 5 (3.5%) |
| 6:00 AM to 6:29 AM | 32 (21.9%) | 6 (4.2%) |
| 6:30 AM to 6:59 AM | 0 (0.0%) | 0 (0.0%) |
| 7:00 AM to 7:29 AM | 36 (24.7%) | 38 (26.6%) |
| 7:30 AM to 7:59 AM | 34 (23.3%) | 18 (12.6%) |
| 8:00 AM to 8:29 AM | 22 (15.1%) | 7 (4.9%) |
| 8:30 AM to 8:59 AM | 0 (0.0%) | 6 (4.2%) |
| 9:00 AM to 9:59 AM | 0 (0.0%) | 15 (10.5%) |
| 10:00 AM to 10:59 AM | 0 (0.0%) | 13 (9.1%) |
| 11:00 AM to 11:59 AM | 0 (0.0%) | 5 (3.5%) |
| 12:00 PM to 3:59 PM | 0 (0.0%) | 30 (21.0%) |
| 4:00 PM to 11:59 PM | 0 (0.0%) | 0 (0.0%) |
| Total | 146 (100.0%) | 143 (100.0%) |
Housing Occupancy in Green Mountain Falls
Occupancy by Ownership in Green Mountain Falls
Of the total 256 dwellings in Green Mountain Falls, owner-occupied units account for 186 (72.7%), while renter-occupied units make up 70 (27.3%).
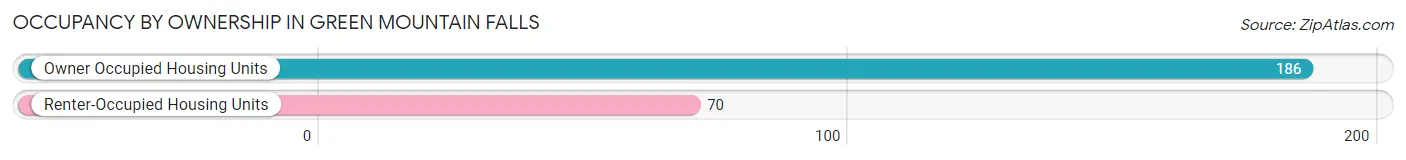
| Occupancy | # Housing Units | % Housing Units |
| Owner Occupied Housing Units | 186 | 72.7% |
| Renter-Occupied Housing Units | 70 | 27.3% |
| Total Occupied Housing Units | 256 | 100.0% |
Occupancy by Household Size in Green Mountain Falls
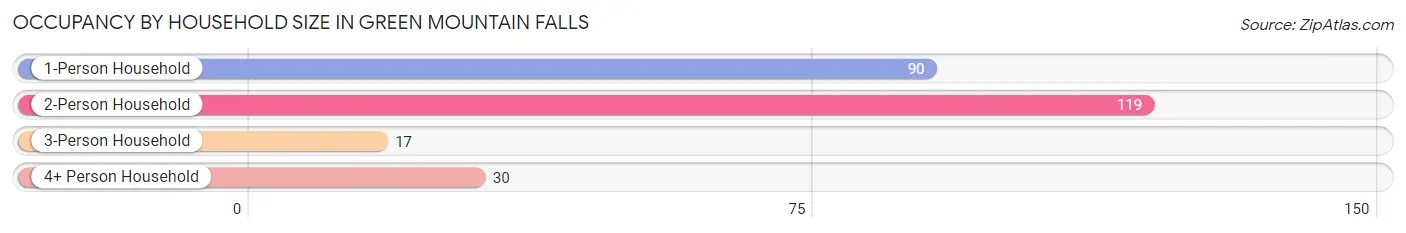
| Household Size | # Housing Units | % Housing Units |
| 1-Person Household | 90 | 35.2% |
| 2-Person Household | 119 | 46.5% |
| 3-Person Household | 17 | 6.6% |
| 4+ Person Household | 30 | 11.7% |
| Total Housing Units | 256 | 100.0% |
Occupancy by Ownership by Household Size in Green Mountain Falls
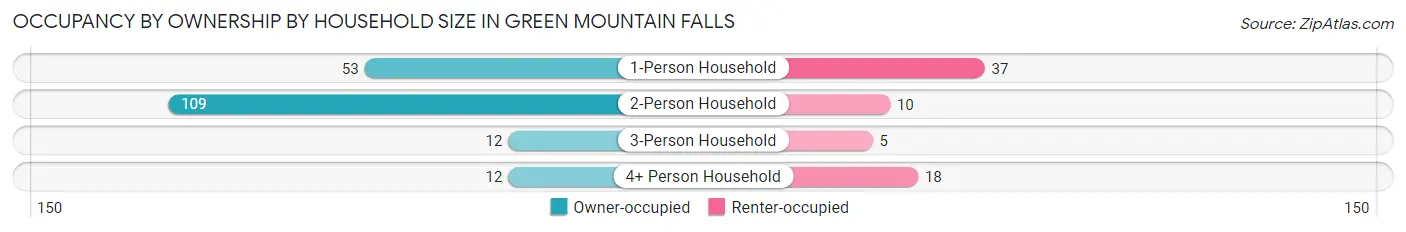
| Household Size | Owner-occupied | Renter-occupied |
| 1-Person Household | 53 (58.9%) | 37 (41.1%) |
| 2-Person Household | 109 (91.6%) | 10 (8.4%) |
| 3-Person Household | 12 (70.6%) | 5 (29.4%) |
| 4+ Person Household | 12 (40.0%) | 18 (60.0%) |
| Total Housing Units | 186 (72.7%) | 70 (27.3%) |
Occupancy by Educational Attainment in Green Mountain Falls
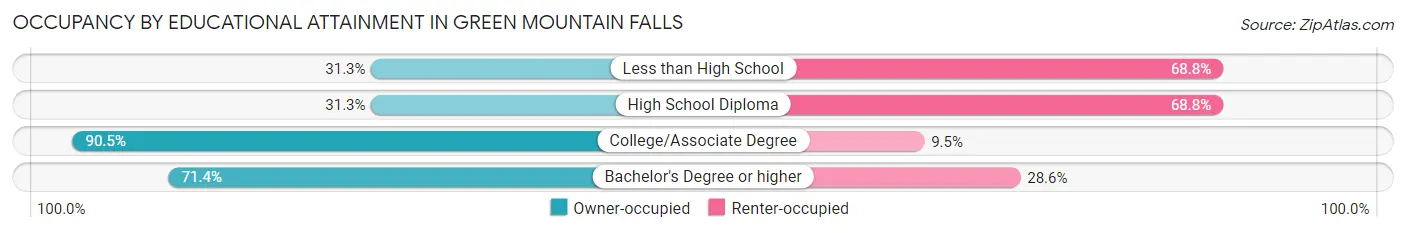
| Household Size | Owner-occupied | Renter-occupied |
| Less than High School | 5 (31.2%) | 11 (68.8%) |
| High School Diploma | 5 (31.2%) | 11 (68.8%) |
| College/Associate Degree | 76 (90.5%) | 8 (9.5%) |
| Bachelor's Degree or higher | 100 (71.4%) | 40 (28.6%) |
Occupancy by Age of Householder in Green Mountain Falls
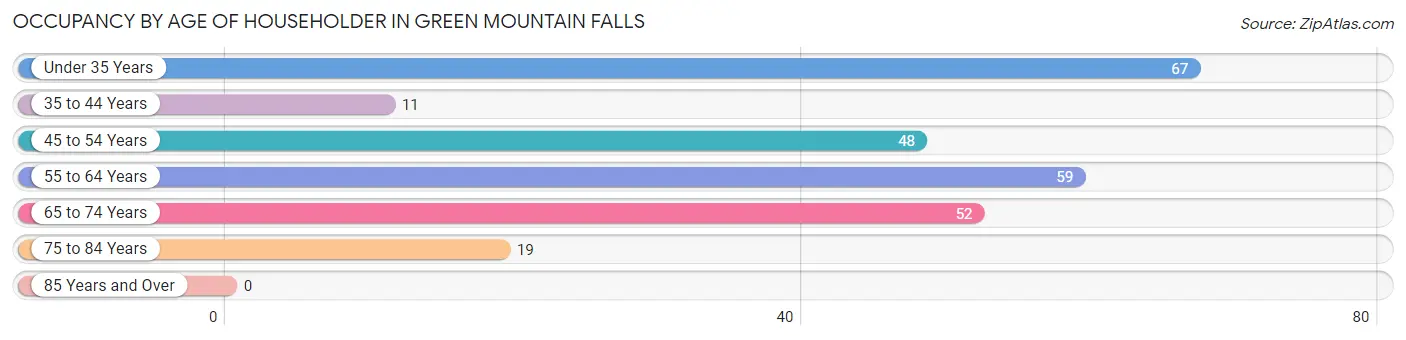
| Age Bracket | # Households | % Households |
| Under 35 Years | 67 | 26.2% |
| 35 to 44 Years | 11 | 4.3% |
| 45 to 54 Years | 48 | 18.8% |
| 55 to 64 Years | 59 | 23.1% |
| 65 to 74 Years | 52 | 20.3% |
| 75 to 84 Years | 19 | 7.4% |
| 85 Years and Over | 0 | 0.0% |
| Total | 256 | 100.0% |
Housing Finances in Green Mountain Falls
Median Income by Occupancy in Green Mountain Falls
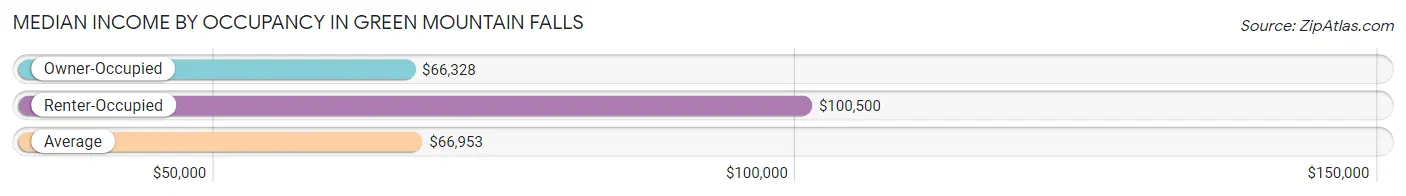
| Occupancy Type | # Households | Median Income |
| Owner-Occupied | 186 (72.7%) | $66,328 |
| Renter-Occupied | 70 (27.3%) | $100,500 |
| Average | 256 (100.0%) | $66,953 |
Occupancy by Householder Income Bracket in Green Mountain Falls
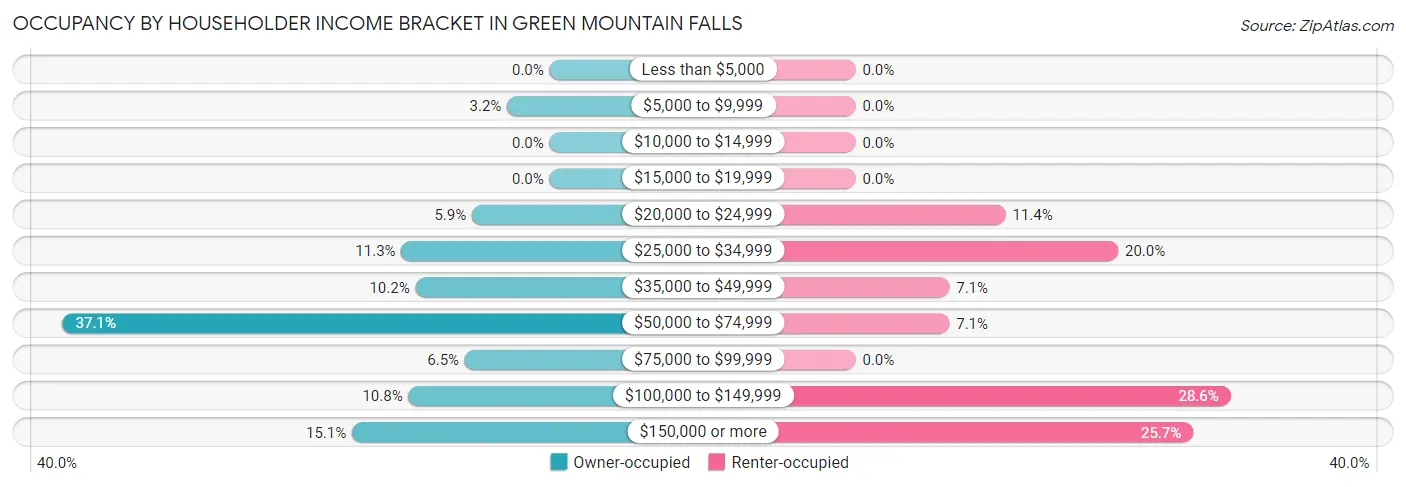
| Income Bracket | Owner-occupied | Renter-occupied |
| Less than $5,000 | 0 (0.0%) | 0 (0.0%) |
| $5,000 to $9,999 | 6 (3.2%) | 0 (0.0%) |
| $10,000 to $14,999 | 0 (0.0%) | 0 (0.0%) |
| $15,000 to $19,999 | 0 (0.0%) | 0 (0.0%) |
| $20,000 to $24,999 | 11 (5.9%) | 8 (11.4%) |
| $25,000 to $34,999 | 21 (11.3%) | 14 (20.0%) |
| $35,000 to $49,999 | 19 (10.2%) | 5 (7.1%) |
| $50,000 to $74,999 | 69 (37.1%) | 5 (7.1%) |
| $75,000 to $99,999 | 12 (6.5%) | 0 (0.0%) |
| $100,000 to $149,999 | 20 (10.7%) | 20 (28.6%) |
| $150,000 or more | 28 (15.0%) | 18 (25.7%) |
| Total | 186 (100.0%) | 70 (100.0%) |
Monthly Housing Cost Tiers in Green Mountain Falls
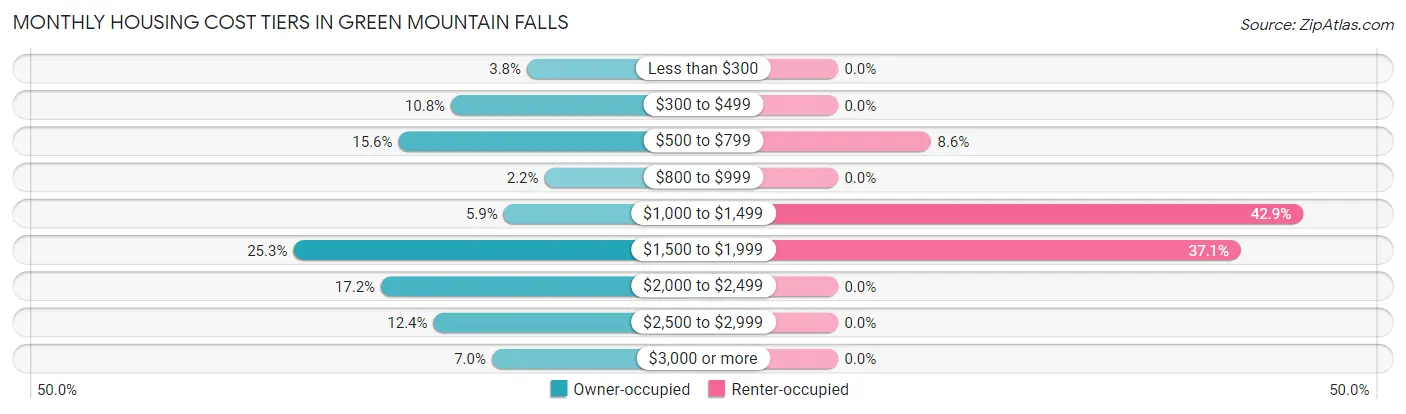
| Monthly Cost | Owner-occupied | Renter-occupied |
| Less than $300 | 7 (3.8%) | 0 (0.0%) |
| $300 to $499 | 20 (10.7%) | 0 (0.0%) |
| $500 to $799 | 29 (15.6%) | 6 (8.6%) |
| $800 to $999 | 4 (2.1%) | 0 (0.0%) |
| $1,000 to $1,499 | 11 (5.9%) | 30 (42.9%) |
| $1,500 to $1,999 | 47 (25.3%) | 26 (37.1%) |
| $2,000 to $2,499 | 32 (17.2%) | 0 (0.0%) |
| $2,500 to $2,999 | 23 (12.4%) | 0 (0.0%) |
| $3,000 or more | 13 (7.0%) | 0 (0.0%) |
| Total | 186 (100.0%) | 70 (100.0%) |
Physical Housing Characteristics in Green Mountain Falls
Housing Structures in Green Mountain Falls
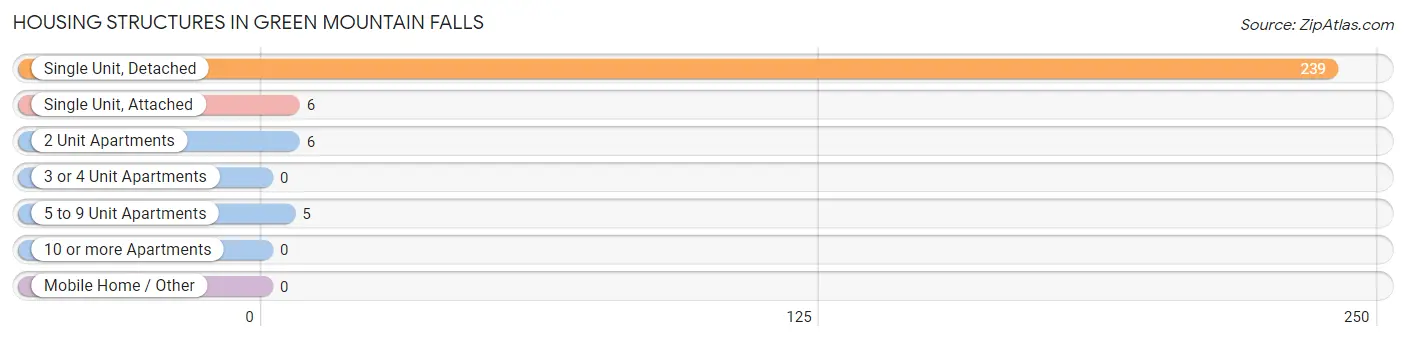
| Structure Type | # Housing Units | % Housing Units |
| Single Unit, Detached | 239 | 93.4% |
| Single Unit, Attached | 6 | 2.3% |
| 2 Unit Apartments | 6 | 2.3% |
| 3 or 4 Unit Apartments | 0 | 0.0% |
| 5 to 9 Unit Apartments | 5 | 1.9% |
| 10 or more Apartments | 0 | 0.0% |
| Mobile Home / Other | 0 | 0.0% |
| Total | 256 | 100.0% |
Housing Structures by Occupancy in Green Mountain Falls
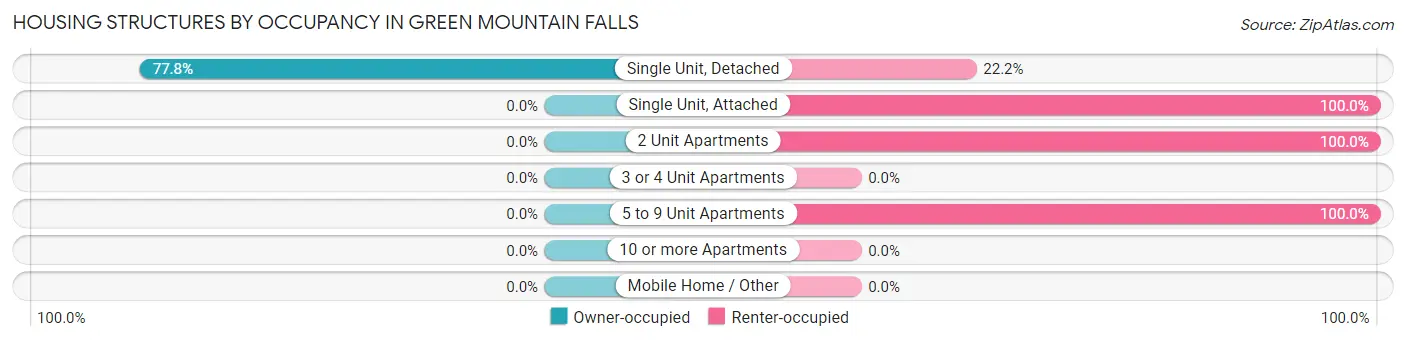
| Structure Type | Owner-occupied | Renter-occupied |
| Single Unit, Detached | 186 (77.8%) | 53 (22.2%) |
| Single Unit, Attached | 0 (0.0%) | 6 (100.0%) |
| 2 Unit Apartments | 0 (0.0%) | 6 (100.0%) |
| 3 or 4 Unit Apartments | 0 (0.0%) | 0 (0.0%) |
| 5 to 9 Unit Apartments | 0 (0.0%) | 5 (100.0%) |
| 10 or more Apartments | 0 (0.0%) | 0 (0.0%) |
| Mobile Home / Other | 0 (0.0%) | 0 (0.0%) |
| Total | 186 (72.7%) | 70 (27.3%) |
Housing Structures by Number of Rooms in Green Mountain Falls
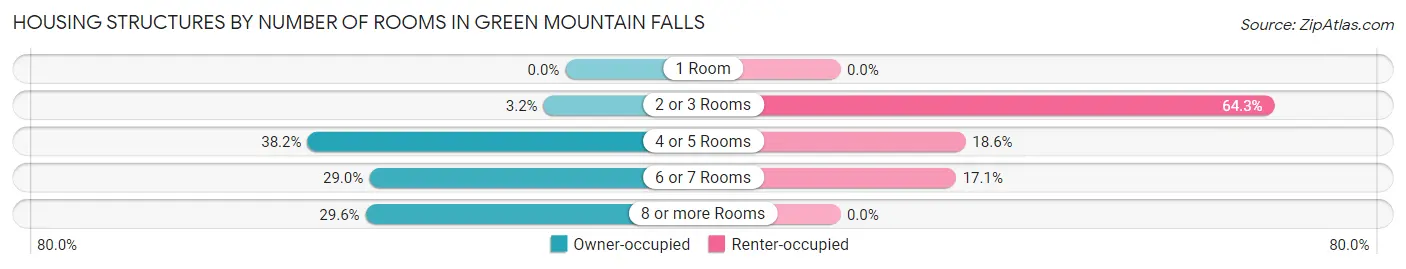
| Number of Rooms | Owner-occupied | Renter-occupied |
| 1 Room | 0 (0.0%) | 0 (0.0%) |
| 2 or 3 Rooms | 6 (3.2%) | 45 (64.3%) |
| 4 or 5 Rooms | 71 (38.2%) | 13 (18.6%) |
| 6 or 7 Rooms | 54 (29.0%) | 12 (17.1%) |
| 8 or more Rooms | 55 (29.6%) | 0 (0.0%) |
| Total | 186 (100.0%) | 70 (100.0%) |
Housing Structure by Heating Type in Green Mountain Falls
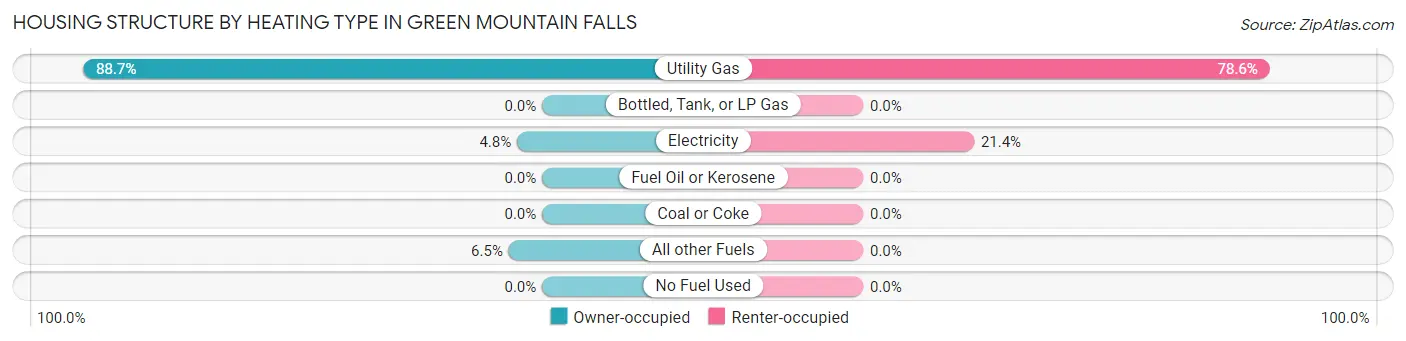
| Heating Type | Owner-occupied | Renter-occupied |
| Utility Gas | 165 (88.7%) | 55 (78.6%) |
| Bottled, Tank, or LP Gas | 0 (0.0%) | 0 (0.0%) |
| Electricity | 9 (4.8%) | 15 (21.4%) |
| Fuel Oil or Kerosene | 0 (0.0%) | 0 (0.0%) |
| Coal or Coke | 0 (0.0%) | 0 (0.0%) |
| All other Fuels | 12 (6.5%) | 0 (0.0%) |
| No Fuel Used | 0 (0.0%) | 0 (0.0%) |
| Total | 186 (100.0%) | 70 (100.0%) |
Household Vehicle Usage in Green Mountain Falls
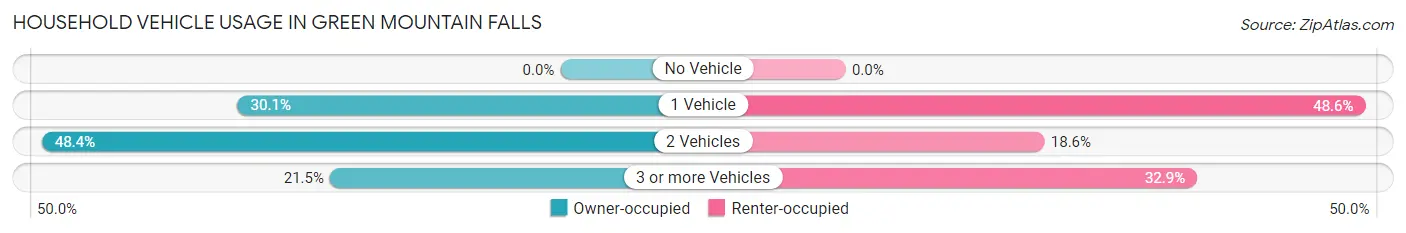
| Vehicles per Household | Owner-occupied | Renter-occupied |
| No Vehicle | 0 (0.0%) | 0 (0.0%) |
| 1 Vehicle | 56 (30.1%) | 34 (48.6%) |
| 2 Vehicles | 90 (48.4%) | 13 (18.6%) |
| 3 or more Vehicles | 40 (21.5%) | 23 (32.9%) |
| Total | 186 (100.0%) | 70 (100.0%) |
Real Estate & Mortgages in Green Mountain Falls
Real Estate and Mortgage Overview in Green Mountain Falls
| Characteristic | Without Mortgage | With Mortgage |
| Housing Units | 56 | 130 |
| Median Property Value | $318,800 | $442,600 |
| Median Household Income | $41,250 | $18 |
| Monthly Housing Costs | $506 | $13 |
| Real Estate Taxes | $1,714 | $0 |
Property Value by Mortgage Status in Green Mountain Falls
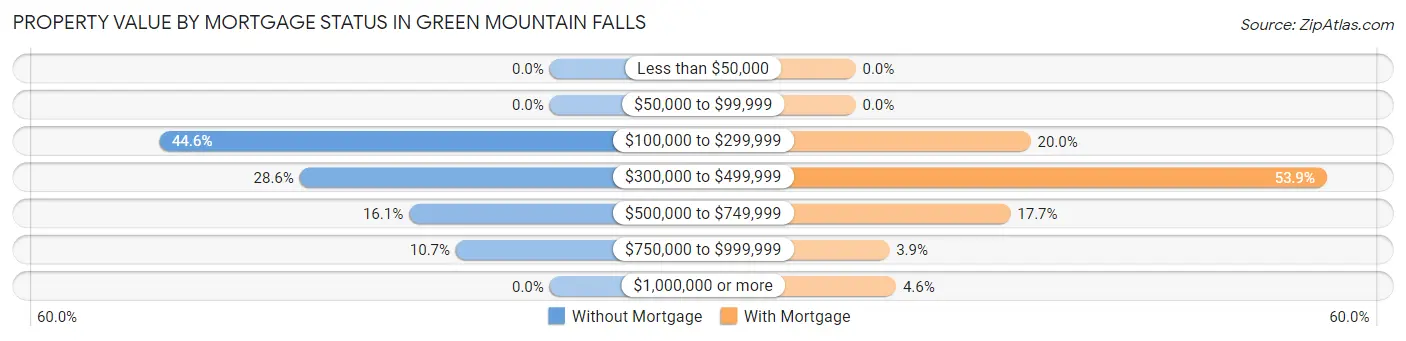
| Property Value | Without Mortgage | With Mortgage |
| Less than $50,000 | 0 (0.0%) | 0 (0.0%) |
| $50,000 to $99,999 | 0 (0.0%) | 0 (0.0%) |
| $100,000 to $299,999 | 25 (44.6%) | 26 (20.0%) |
| $300,000 to $499,999 | 16 (28.6%) | 70 (53.8%) |
| $500,000 to $749,999 | 9 (16.1%) | 23 (17.7%) |
| $750,000 to $999,999 | 6 (10.7%) | 5 (3.8%) |
| $1,000,000 or more | 0 (0.0%) | 6 (4.6%) |
| Total | 56 (100.0%) | 130 (100.0%) |
Household Income by Mortgage Status in Green Mountain Falls
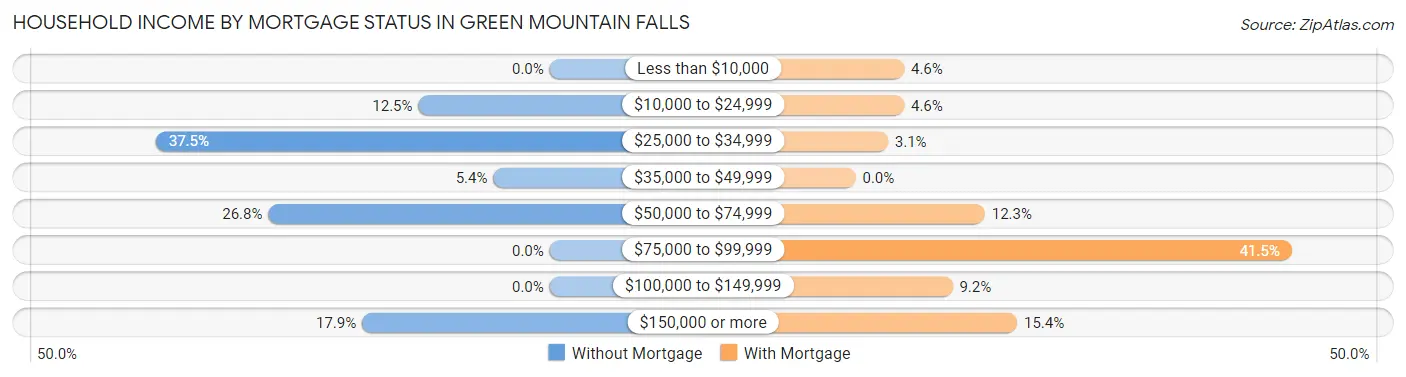
| Household Income | Without Mortgage | With Mortgage |
| Less than $10,000 | 0 (0.0%) | 6 (4.6%) |
| $10,000 to $24,999 | 7 (12.5%) | 6 (4.6%) |
| $25,000 to $34,999 | 21 (37.5%) | 4 (3.1%) |
| $35,000 to $49,999 | 3 (5.4%) | 0 (0.0%) |
| $50,000 to $74,999 | 15 (26.8%) | 16 (12.3%) |
| $75,000 to $99,999 | 0 (0.0%) | 54 (41.5%) |
| $100,000 to $149,999 | 0 (0.0%) | 12 (9.2%) |
| $150,000 or more | 10 (17.9%) | 20 (15.4%) |
| Total | 56 (100.0%) | 130 (100.0%) |
Property Value to Household Income Ratio in Green Mountain Falls
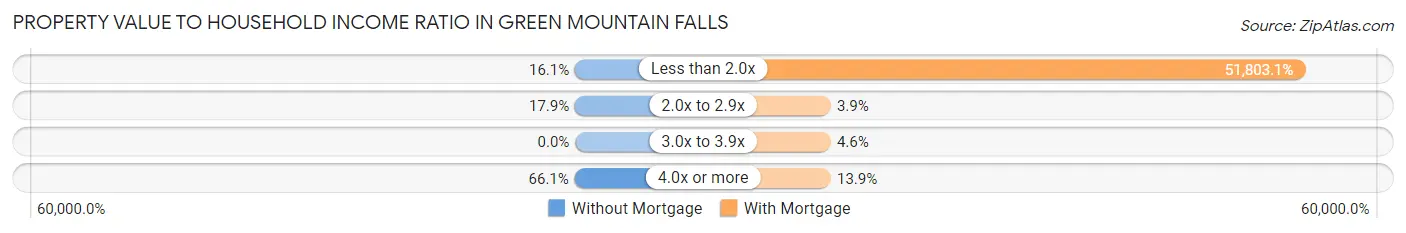
| Value-to-Income Ratio | Without Mortgage | With Mortgage |
| Less than 2.0x | 9 (16.1%) | 67,344 (51,803.1%) |
| 2.0x to 2.9x | 10 (17.9%) | 5 (3.8%) |
| 3.0x to 3.9x | 0 (0.0%) | 6 (4.6%) |
| 4.0x or more | 37 (66.1%) | 18 (13.9%) |
| Total | 56 (100.0%) | 130 (100.0%) |
Real Estate Taxes by Mortgage Status in Green Mountain Falls
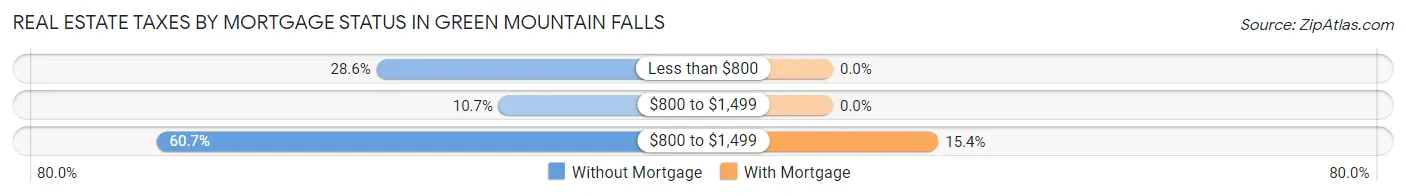
| Property Taxes | Without Mortgage | With Mortgage |
| Less than $800 | 16 (28.6%) | 0 (0.0%) |
| $800 to $1,499 | 6 (10.7%) | 0 (0.0%) |
| $800 to $1,499 | 34 (60.7%) | 20 (15.4%) |
| Total | 56 (100.0%) | 130 (100.0%) |
Health & Disability in Green Mountain Falls
Health Insurance Coverage by Age in Green Mountain Falls
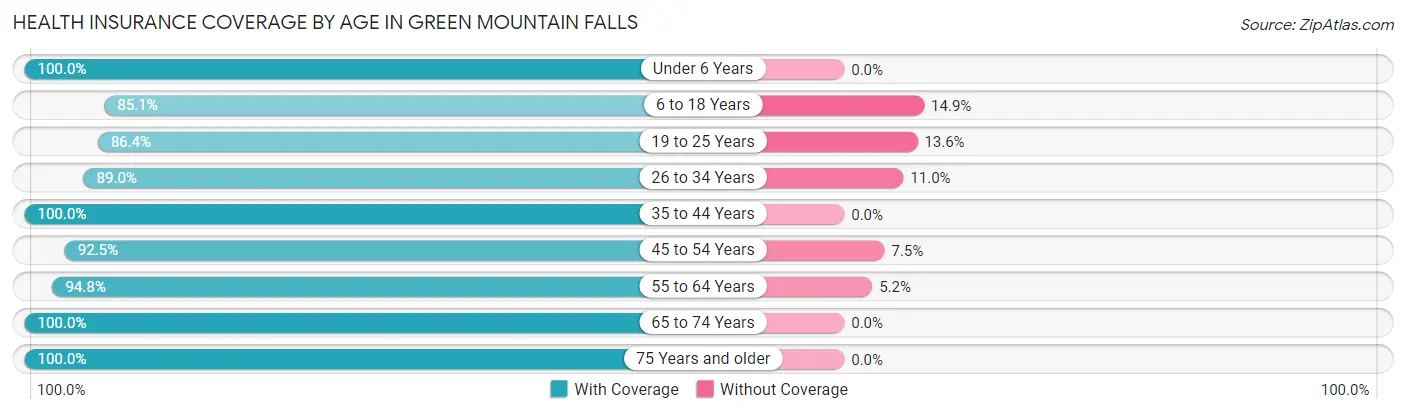
| Age Bracket | With Coverage | Without Coverage |
| Under 6 Years | 4 (100.0%) | 0 (0.0%) |
| 6 to 18 Years | 40 (85.1%) | 7 (14.9%) |
| 19 to 25 Years | 38 (86.4%) | 6 (13.6%) |
| 26 to 34 Years | 113 (89.0%) | 14 (11.0%) |
| 35 to 44 Years | 15 (100.0%) | 0 (0.0%) |
| 45 to 54 Years | 74 (92.5%) | 6 (7.5%) |
| 55 to 64 Years | 91 (94.8%) | 5 (5.2%) |
| 65 to 74 Years | 71 (100.0%) | 0 (0.0%) |
| 75 Years and older | 30 (100.0%) | 0 (0.0%) |
| Total | 476 (92.6%) | 38 (7.4%) |
Health Insurance Coverage by Citizenship Status in Green Mountain Falls
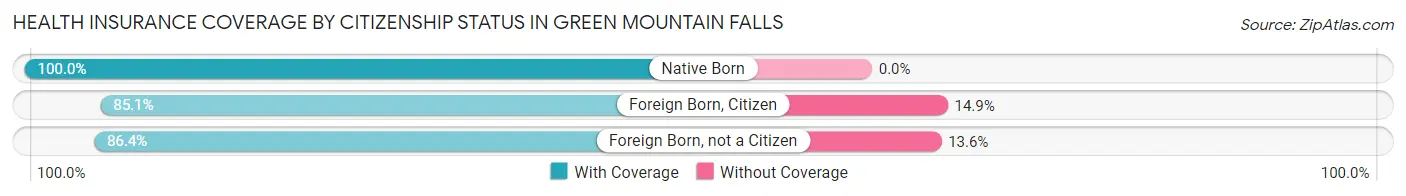
| Citizenship Status | With Coverage | Without Coverage |
| Native Born | 4 (100.0%) | 0 (0.0%) |
| Foreign Born, Citizen | 40 (85.1%) | 7 (14.9%) |
| Foreign Born, not a Citizen | 38 (86.4%) | 6 (13.6%) |
Health Insurance Coverage by Household Income in Green Mountain Falls

| Household Income | With Coverage | Without Coverage |
| Under $25,000 | 30 (100.0%) | 0 (0.0%) |
| $25,000 to $49,999 | 56 (64.4%) | 31 (35.6%) |
| $50,000 to $74,999 | 129 (100.0%) | 0 (0.0%) |
| $75,000 to $99,999 | 53 (100.0%) | 0 (0.0%) |
| $100,000 and over | 208 (96.7%) | 7 (3.3%) |
Public vs Private Health Insurance Coverage by Age in Green Mountain Falls
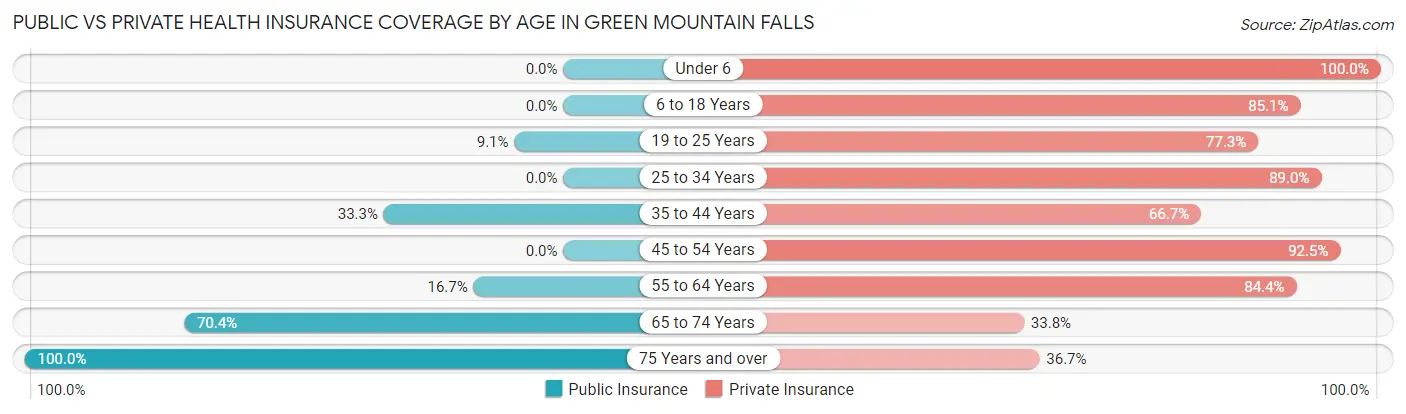
| Age Bracket | Public Insurance | Private Insurance |
| Under 6 | 0 (0.0%) | 4 (100.0%) |
| 6 to 18 Years | 0 (0.0%) | 40 (85.1%) |
| 19 to 25 Years | 4 (9.1%) | 34 (77.3%) |
| 25 to 34 Years | 0 (0.0%) | 113 (89.0%) |
| 35 to 44 Years | 5 (33.3%) | 10 (66.7%) |
| 45 to 54 Years | 0 (0.0%) | 74 (92.5%) |
| 55 to 64 Years | 16 (16.7%) | 81 (84.4%) |
| 65 to 74 Years | 50 (70.4%) | 24 (33.8%) |
| 75 Years and over | 30 (100.0%) | 11 (36.7%) |
| Total | 105 (20.4%) | 391 (76.1%) |
Disability Status by Sex by Age in Green Mountain Falls
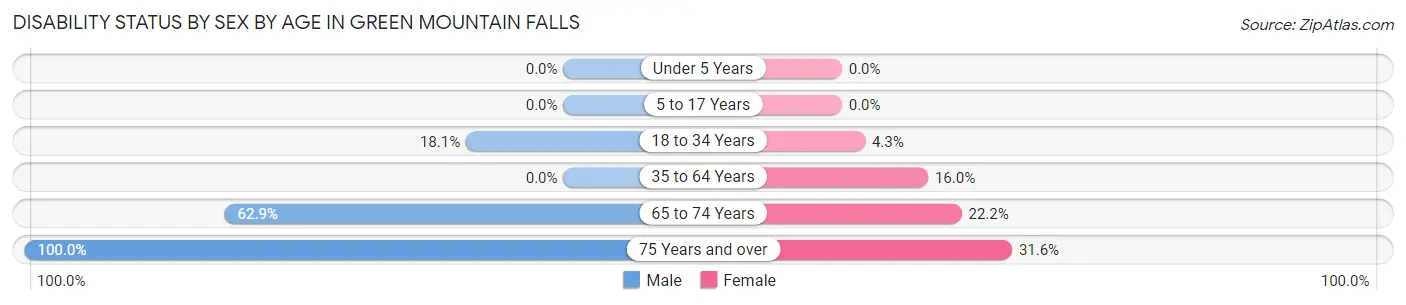
| Age Bracket | Male | Female |
| Under 5 Years | 0 (0.0%) | 0 (0.0%) |
| 5 to 17 Years | 0 (0.0%) | 0 (0.0%) |
| 18 to 34 Years | 15 (18.1%) | 4 (4.3%) |
| 35 to 64 Years | 0 (0.0%) | 16 (16.0%) |
| 65 to 74 Years | 22 (62.9%) | 8 (22.2%) |
| 75 Years and over | 11 (100.0%) | 6 (31.6%) |
Disability Class by Sex by Age in Green Mountain Falls
Disability Class: Hearing Difficulty
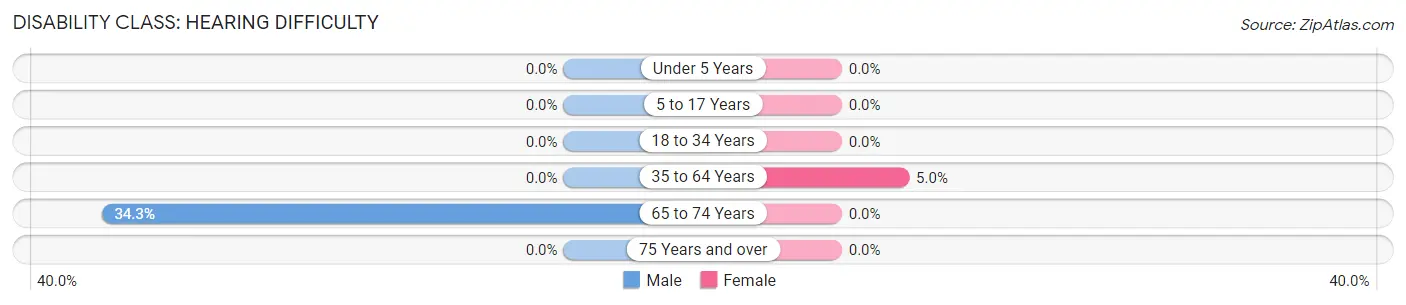
| Age Bracket | Male | Female |
| Under 5 Years | 0 (0.0%) | 0 (0.0%) |
| 5 to 17 Years | 0 (0.0%) | 0 (0.0%) |
| 18 to 34 Years | 0 (0.0%) | 0 (0.0%) |
| 35 to 64 Years | 0 (0.0%) | 5 (5.0%) |
| 65 to 74 Years | 12 (34.3%) | 0 (0.0%) |
| 75 Years and over | 0 (0.0%) | 0 (0.0%) |
Disability Class: Vision Difficulty
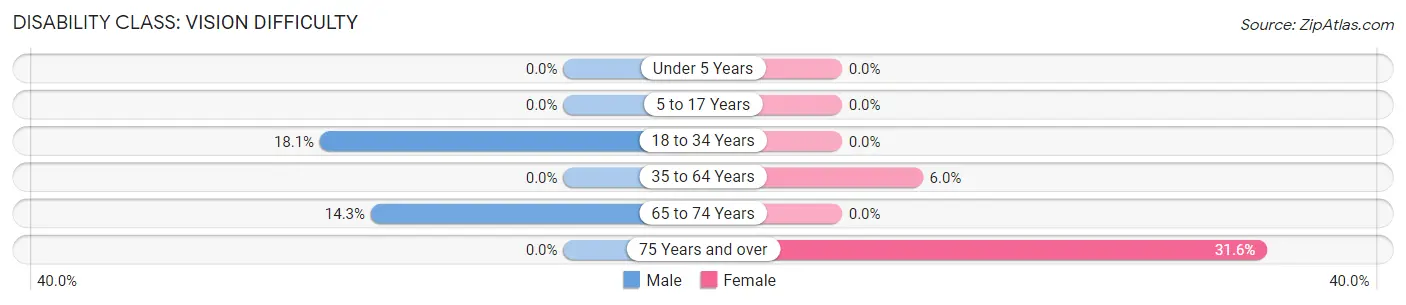
| Age Bracket | Male | Female |
| Under 5 Years | 0 (0.0%) | 0 (0.0%) |
| 5 to 17 Years | 0 (0.0%) | 0 (0.0%) |
| 18 to 34 Years | 15 (18.1%) | 0 (0.0%) |
| 35 to 64 Years | 0 (0.0%) | 6 (6.0%) |
| 65 to 74 Years | 5 (14.3%) | 0 (0.0%) |
| 75 Years and over | 0 (0.0%) | 6 (31.6%) |
Disability Class: Cognitive Difficulty
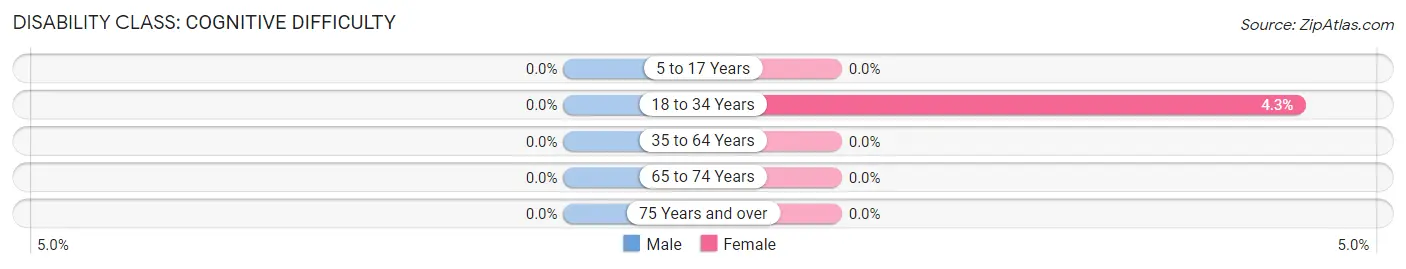
| Age Bracket | Male | Female |
| 5 to 17 Years | 0 (0.0%) | 0 (0.0%) |
| 18 to 34 Years | 0 (0.0%) | 4 (4.3%) |
| 35 to 64 Years | 0 (0.0%) | 0 (0.0%) |
| 65 to 74 Years | 0 (0.0%) | 0 (0.0%) |
| 75 Years and over | 0 (0.0%) | 0 (0.0%) |
Disability Class: Ambulatory Difficulty
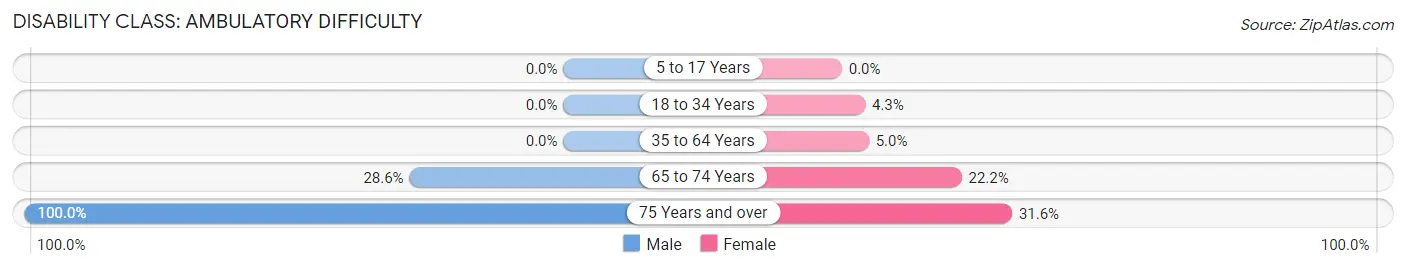
| Age Bracket | Male | Female |
| 5 to 17 Years | 0 (0.0%) | 0 (0.0%) |
| 18 to 34 Years | 0 (0.0%) | 4 (4.3%) |
| 35 to 64 Years | 0 (0.0%) | 5 (5.0%) |
| 65 to 74 Years | 10 (28.6%) | 8 (22.2%) |
| 75 Years and over | 11 (100.0%) | 6 (31.6%) |
Disability Class: Self-Care Difficulty
| Age Bracket | Male | Female |
| 5 to 17 Years | 0 (0.0%) | 0 (0.0%) |
| 18 to 34 Years | 0 (0.0%) | 4 (4.3%) |
| 35 to 64 Years | 0 (0.0%) | 0 (0.0%) |
| 65 to 74 Years | 0 (0.0%) | 0 (0.0%) |
| 75 Years and over | 0 (0.0%) | 0 (0.0%) |
Technology Access in Green Mountain Falls
Computing Device Access in Green Mountain Falls
| Device Type | # Households | % Households |
| Desktop or Laptop | 227 | 88.7% |
| Smartphone | 237 | 92.6% |
| Tablet | 121 | 47.3% |
| No Computing Device | 5 | 1.9% |
| Total | 256 | 100.0% |
Internet Access in Green Mountain Falls
| Internet Type | # Households | % Households |
| Dial-Up Internet | 0 | 0.0% |
| Broadband Home | 211 | 82.4% |
| Cellular Data Only | 25 | 9.8% |
| Satellite Internet | 6 | 2.3% |
| No Internet | 14 | 5.5% |
| Total | 256 | 100.0% |
Green Mountain Falls Summary
Geography
Green Mountain Falls is a small town located in El Paso County, Colorado, United States. It is situated at the base of Pikes Peak, the highest summit of the southern Front Range of the Rocky Mountains. The town is located at an elevation of 7,800 feet (2,400 m) and is surrounded by the Pike National Forest. The town is located approximately 10 miles (16 km) west of Colorado Springs and is part of the Colorado Springs Metropolitan Statistical Area.
The town is situated in a valley surrounded by mountains on all sides. The town is located at the intersection of U.S. Highway 24 and State Highway 67. The town is located in a narrow valley between two mountain ranges, the Rampart Range to the west and the Front Range to the east. The town is located at the headwaters of Monument Creek, which flows south through the town and eventually empties into the Arkansas River.
History
Green Mountain Falls was founded in 1871 by a group of settlers from the Midwest. The town was originally named "Green Mountain City" after the nearby mountain range. The town was later renamed "Green Mountain Falls" in 1876.
The town was originally a logging and mining town, but it soon became a popular tourist destination due to its scenic beauty and proximity to Colorado Springs. The town was incorporated in 1891 and was home to a number of resorts and hotels.
The town was also home to a number of summer camps, including Camp Green Mountain, which was founded in 1891 and is still in operation today. The town was also home to a number of summer homes and cabins, which were popular with tourists and vacationers.
Economy
Green Mountain Falls is a small town with a population of approximately 700 people. The town is primarily a tourist destination, with many visitors coming to enjoy the scenic beauty of the area. The town is also home to a number of small businesses, including restaurants, shops, and galleries.
The town is also home to a number of summer camps, including Camp Green Mountain, which is still in operation today. The town is also home to a number of summer homes and cabins, which are popular with tourists and vacationers.
Demographics
As of the 2010 census, the population of Green Mountain Falls was 690 people. The racial makeup of the town was 97.7% White, 0.3% African American, 0.3% Native American, 0.3% Asian, 0.3% from other races, and 1.0% from two or more races. Hispanic or Latino of any race were 1.3% of the population.
The median income for a household in the town was $45,833, and the median income for a family was $50,000. The per capita income for the town was $21,945. About 8.3% of families and 10.3% of the population were below the poverty line, including 14.3% of those under age 18 and none of those age 65 or over.
Common Questions
What is Per Capita Income in Green Mountain Falls?
Per Capita income in Green Mountain Falls is $45,762.
What is the Median Family Income in Green Mountain Falls?
Median Family Income in Green Mountain Falls is $72,292.
What is the Median Household income in Green Mountain Falls?
Median Household Income in Green Mountain Falls is $66,953.
What is Income or Wage Gap in Green Mountain Falls?
Income or Wage Gap in Green Mountain Falls is 68.8%.
Women in Green Mountain Falls earn 31.2 cents for every dollar earned by a man.
What is Inequality or Gini Index in Green Mountain Falls?
Inequality or Gini Index in Green Mountain Falls is 0.40.
What is the Total Population of Green Mountain Falls?
Total Population of Green Mountain Falls is 518.
What is the Total Male Population of Green Mountain Falls?
Total Male Population of Green Mountain Falls is 223.
What is the Total Female Population of Green Mountain Falls?
Total Female Population of Green Mountain Falls is 295.
What is the Ratio of Males per 100 Females in Green Mountain Falls?
There are 75.59 Males per 100 Females in Green Mountain Falls.
What is the Ratio of Females per 100 Males in Green Mountain Falls?
There are 132.29 Females per 100 Males in Green Mountain Falls.
What is the Median Population Age in Green Mountain Falls?
Median Population Age in Green Mountain Falls is 46.7 Years.
What is the Average Family Size in Green Mountain Falls
Average Family Size in Green Mountain Falls is 2.5 People.
What is the Average Household Size in Green Mountain Falls
Average Household Size in Green Mountain Falls is 2.0 People.
How Large is the Labor Force in Green Mountain Falls?
There are 336 People in the Labor Forcein in Green Mountain Falls.
What is the Percentage of People in the Labor Force in Green Mountain Falls?
66.5% of People are in the Labor Force in Green Mountain Falls.