Wellington, CO Map & Demographics
Wellington Map
Wellington Overview
$39,532
PER CAPITA INCOME
$112,478
AVG FAMILY INCOME
$101,259
AVG HOUSEHOLD INCOME
30.7%
WAGE / INCOME GAP [ % ]
69.3¢/ $1
WAGE / INCOME GAP [ $ ]
0.40
INEQUALITY / GINI INDEX
11,163
TOTAL POPULATION
5,589
MALE POPULATION
5,574
FEMALE POPULATION
100.27
MALES / 100 FEMALES
99.73
FEMALES / 100 MALES
32.4
MEDIAN AGE
3.4
AVG FAMILY SIZE
2.8
AVG HOUSEHOLD SIZE
5,721
LABOR FORCE [ PEOPLE ]
71.8%
PERCENT IN LABOR FORCE
7.7%
UNEMPLOYMENT RATE
Wellington Zip Codes
Wellington Area Codes
Income in Wellington
Income Overview in Wellington
Per Capita Income in Wellington is $39,532, while median incomes of families and households are $112,478 and $101,259 respectively.
| Characteristic | Number | Measure |
| Per Capita Income | 11,163 | $39,532 |
| Median Family Income | 2,879 | $112,478 |
| Mean Family Income | 2,879 | $131,933 |
| Median Household Income | 4,000 | $101,259 |
| Mean Household Income | 4,000 | $111,966 |
| Income Deficit | 2,879 | $0 |
| Wage / Income Gap (%) | 11,163 | 30.67% |
| Wage / Income Gap ($) | 11,163 | 69.33¢ per $1 |
| Gini / Inequality Index | 11,163 | 0.40 |
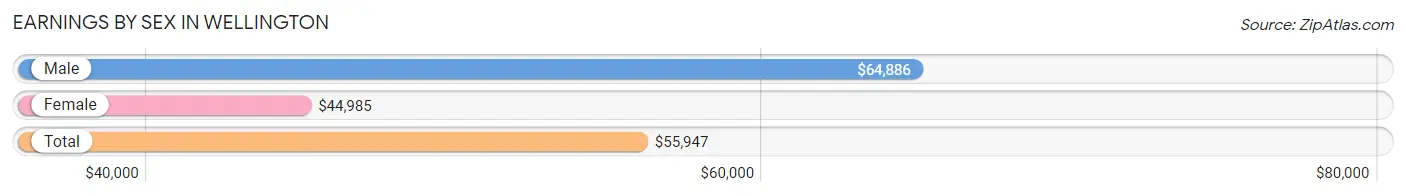
Earnings by Sex in Wellington
Average Earnings in Wellington are $55,947, $64,886 for men and $44,985 for women, a difference of 30.7%.
| Sex | Number | Average Earnings |
| Male | 3,539 (61.6%) | $64,886 |
| Female | 2,204 (38.4%) | $44,985 |
| Total | 5,743 (100.0%) | $55,947 |
Earnings by Sex by Income Bracket in Wellington
The most common earnings brackets in Wellington are $100,000+ for men (968 | 27.4%) and $55,000 to $64,999 for women (428 | 19.4%).
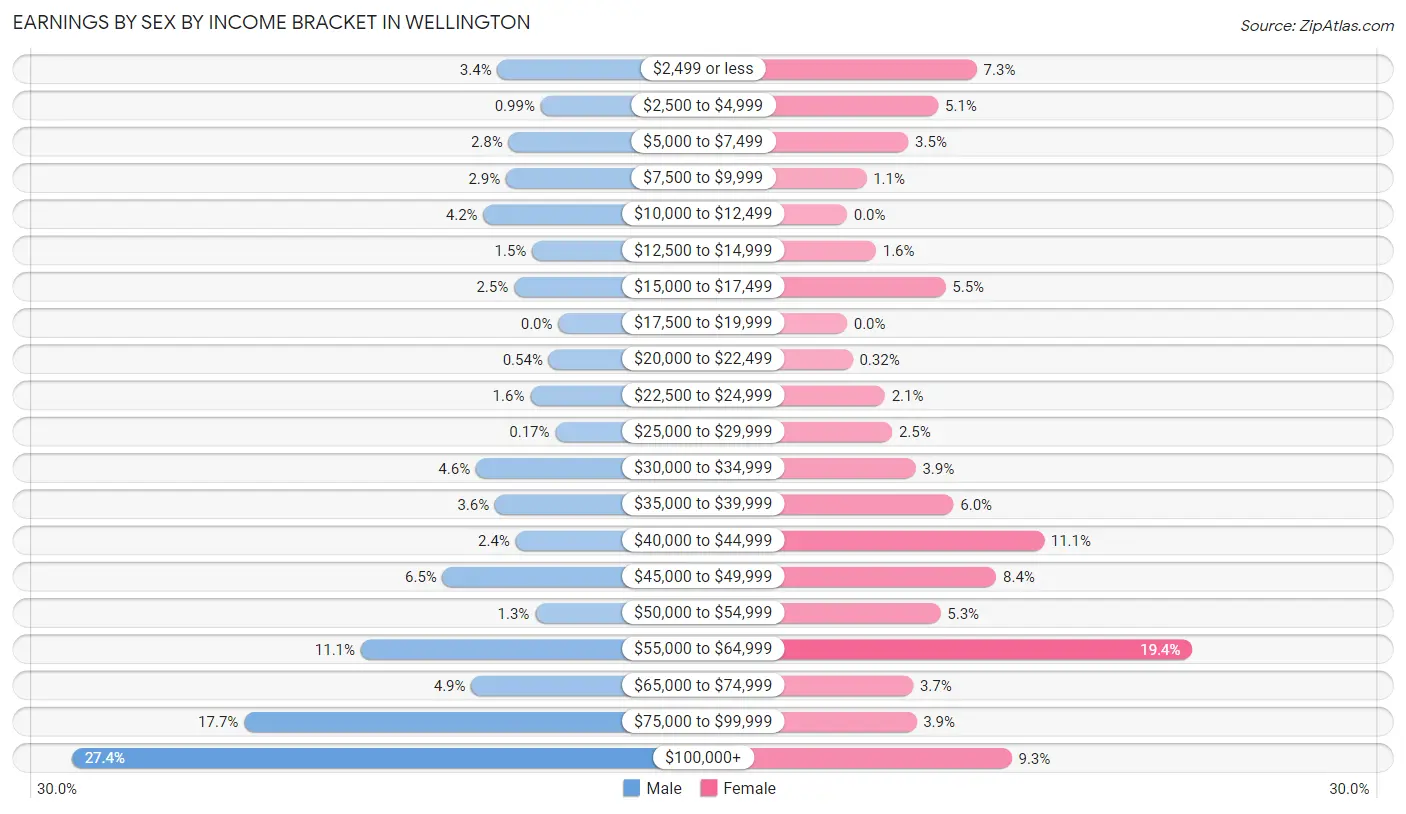
| Income | Male | Female |
| $2,499 or less | 121 (3.4%) | 161 (7.3%) |
| $2,500 to $4,999 | 35 (1.0%) | 113 (5.1%) |
| $5,000 to $7,499 | 99 (2.8%) | 76 (3.5%) |
| $7,500 to $9,999 | 104 (2.9%) | 24 (1.1%) |
| $10,000 to $12,499 | 149 (4.2%) | 0 (0.0%) |
| $12,500 to $14,999 | 52 (1.5%) | 36 (1.6%) |
| $15,000 to $17,499 | 88 (2.5%) | 122 (5.5%) |
| $17,500 to $19,999 | 0 (0.0%) | 0 (0.0%) |
| $20,000 to $22,499 | 19 (0.5%) | 7 (0.3%) |
| $22,500 to $24,999 | 56 (1.6%) | 47 (2.1%) |
| $25,000 to $29,999 | 6 (0.2%) | 56 (2.5%) |
| $30,000 to $34,999 | 164 (4.6%) | 85 (3.9%) |
| $35,000 to $39,999 | 126 (3.6%) | 132 (6.0%) |
| $40,000 to $44,999 | 85 (2.4%) | 244 (11.1%) |
| $45,000 to $49,999 | 230 (6.5%) | 185 (8.4%) |
| $50,000 to $54,999 | 46 (1.3%) | 116 (5.3%) |
| $55,000 to $64,999 | 393 (11.1%) | 428 (19.4%) |
| $65,000 to $74,999 | 173 (4.9%) | 82 (3.7%) |
| $75,000 to $99,999 | 625 (17.7%) | 86 (3.9%) |
| $100,000+ | 968 (27.4%) | 204 (9.3%) |
| Total | 3,539 (100.0%) | 2,204 (100.0%) |
Earnings by Sex by Educational Attainment in Wellington
Average earnings in Wellington are $75,353 for men and $49,914 for women, a difference of 33.8%. Men with an educational attainment of graduate degree enjoy the highest average annual earnings of $104,250, while those with bachelor's degree education earn the least with $59,438. Women with an educational attainment of graduate degree earn the most with the average annual earnings of $67,955, while those with college or associate's degree education have the smallest earnings of $38,906.
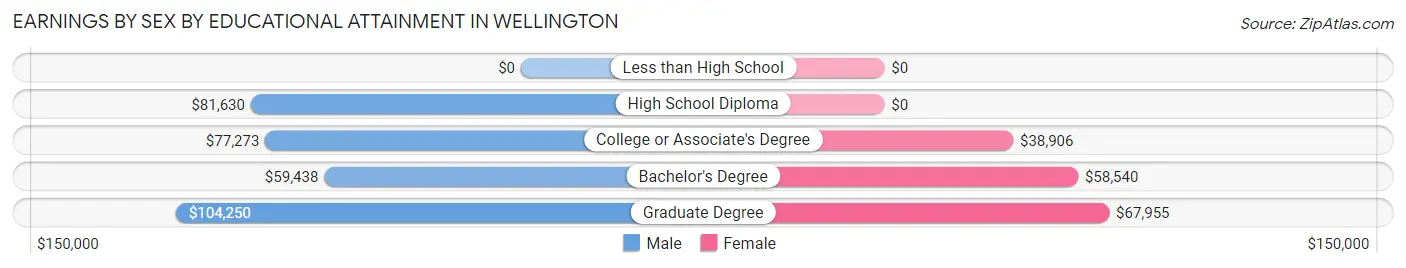
| Educational Attainment | Male Income | Female Income |
| Less than High School | - | - |
| High School Diploma | $81,630 | $0 |
| College or Associate's Degree | $77,273 | $38,906 |
| Bachelor's Degree | $59,438 | $58,540 |
| Graduate Degree | $104,250 | $67,955 |
| Total | $75,353 | $49,914 |
Family Income in Wellington
Family Income Brackets in Wellington
According to the Wellington family income data, there are 979 families falling into the $100,000 to $149,999 income range, which is the most common income bracket and makes up 34.0% of all families.
| Income Bracket | # Families | % Families |
| Less than $10,000 | 72 | 2.5% |
| $10,000 to $14,999 | 0 | 0.0% |
| $15,000 to $24,999 | 92 | 3.2% |
| $25,000 to $34,999 | 66 | 2.3% |
| $35,000 to $49,999 | 98 | 3.4% |
| $50,000 to $74,999 | 279 | 9.7% |
| $75,000 to $99,999 | 469 | 16.3% |
| $100,000 to $149,999 | 979 | 34.0% |
| $150,000 to $199,999 | 446 | 15.5% |
| $200,000+ | 374 | 13.0% |
Family Income by Famaliy Size in Wellington
6-person families (218 | 7.6%) account for the highest median family income in Wellington with $176,071 per family, while 2-person families (984 | 34.2%) have the highest median income of $57,730 per family member.
| Income Bracket | # Families | Median Income |
| 2-Person Families | 984 (34.2%) | $115,459 |
| 3-Person Families | 589 (20.5%) | $98,625 |
| 4-Person Families | 562 (19.5%) | $126,333 |
| 5-Person Families | 526 (18.3%) | $101,771 |
| 6-Person Families | 218 (7.6%) | $176,071 |
| 7+ Person Families | 0 (0.0%) | $0 |
| Total | 2,879 (100.0%) | $112,478 |
Family Income by Number of Earners in Wellington
| Number of Earners | # Families | Median Income |
| No Earners | 340 (11.8%) | $0 |
| 1 Earner | 734 (25.5%) | $100,245 |
| 2 Earners | 1,346 (46.8%) | $114,032 |
| 3+ Earners | 459 (15.9%) | $156,835 |
| Total | 2,879 (100.0%) | $112,478 |
Household Income in Wellington
Household Income Brackets in Wellington
With 1,204 households falling in the category, the $100,000 to $149,999 income range is the most frequent in Wellington, accounting for 30.1% of all households. In contrast, only 24 households (0.6%) fall into the $10,000 to $14,999 income bracket, making it the least populous group.
| Income Bracket | # Households | % Households |
| Less than $10,000 | 284 | 7.1% |
| $10,000 to $14,999 | 24 | 0.6% |
| $15,000 to $24,999 | 212 | 5.3% |
| $25,000 to $34,999 | 68 | 1.7% |
| $35,000 to $49,999 | 348 | 8.7% |
| $50,000 to $74,999 | 508 | 12.7% |
| $75,000 to $99,999 | 496 | 12.4% |
| $100,000 to $149,999 | 1,204 | 30.1% |
| $150,000 to $199,999 | 460 | 11.5% |
| $200,000+ | 404 | 10.1% |
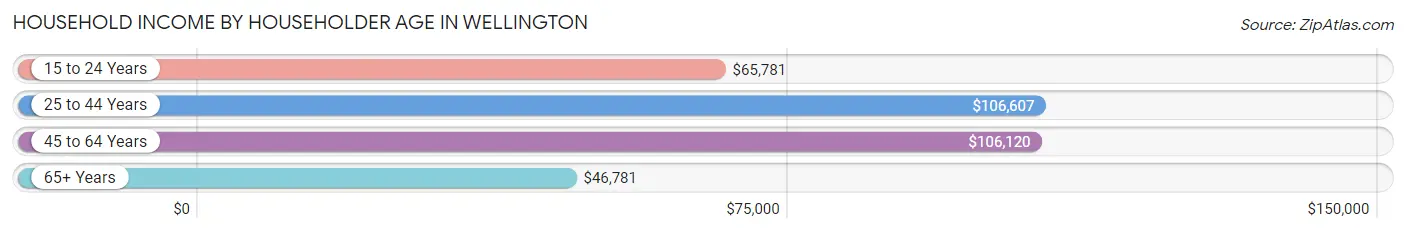
Household Income by Householder Age in Wellington
The median household income in Wellington is $101,259, with the highest median household income of $106,607 found in the 25 to 44 years age bracket for the primary householder. A total of 1,851 households (46.3%) fall into this category. Meanwhile, the 65+ years age bracket for the primary householder has the lowest median household income of $46,781, with 752 households (18.8%) in this group.
| Income Bracket | # Households | Median Income |
| 15 to 24 Years | 124 (3.1%) | $65,781 |
| 25 to 44 Years | 1,851 (46.3%) | $106,607 |
| 45 to 64 Years | 1,273 (31.8%) | $106,120 |
| 65+ Years | 752 (18.8%) | $46,781 |
| Total | 4,000 (100.0%) | $101,259 |
Poverty in Wellington
Income Below Poverty by Sex and Age in Wellington
With 9.6% poverty level for males and 13.1% for females among the residents of Wellington, 15 year old males and 75 year old and over females are the most vulnerable to poverty, with 80 males (60.6%) and 72 females (32.7%) in their respective age groups living below the poverty level.
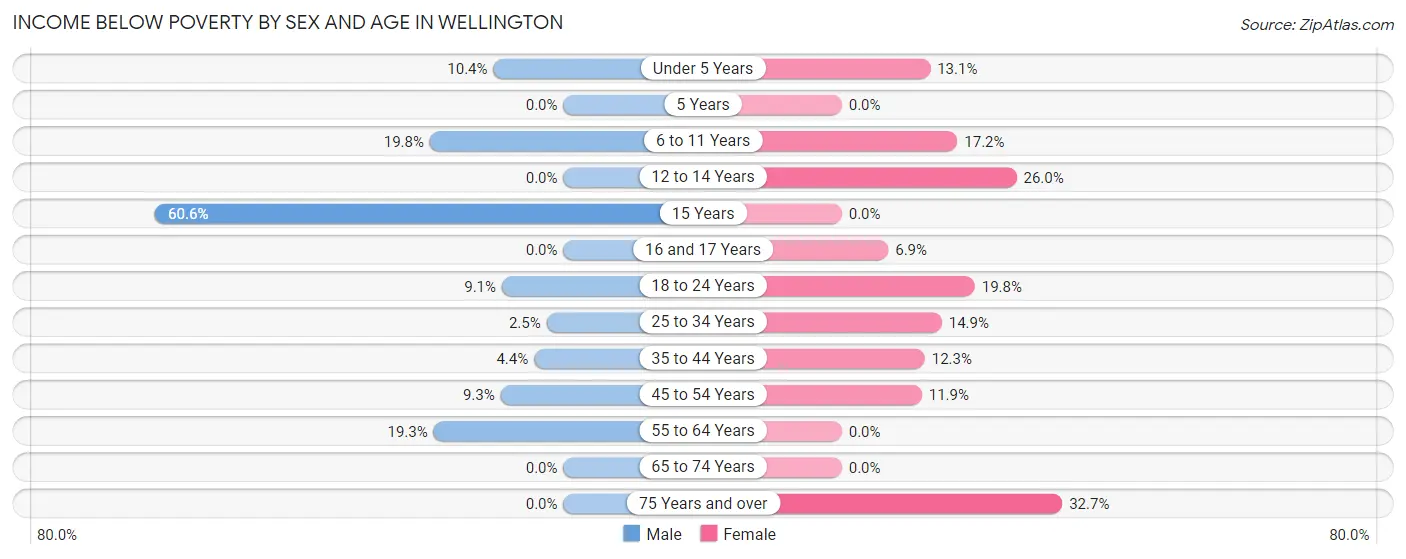
| Age Bracket | Male | Female |
| Under 5 Years | 58 (10.4%) | 78 (13.1%) |
| 5 Years | 0 (0.0%) | 0 (0.0%) |
| 6 to 11 Years | 142 (19.8%) | 70 (17.2%) |
| 12 to 14 Years | 0 (0.0%) | 102 (26.0%) |
| 15 Years | 80 (60.6%) | 0 (0.0%) |
| 16 and 17 Years | 0 (0.0%) | 8 (6.9%) |
| 18 to 24 Years | 45 (9.1%) | 64 (19.8%) |
| 25 to 34 Years | 19 (2.5%) | 132 (14.8%) |
| 35 to 44 Years | 49 (4.3%) | 129 (12.3%) |
| 45 to 54 Years | 64 (9.3%) | 72 (11.9%) |
| 55 to 64 Years | 79 (19.3%) | 0 (0.0%) |
| 65 to 74 Years | 0 (0.0%) | 0 (0.0%) |
| 75 Years and over | 0 (0.0%) | 72 (32.7%) |
| Total | 536 (9.6%) | 727 (13.1%) |
Income Above Poverty by Sex and Age in Wellington
According to the poverty statistics in Wellington, males aged 5 years and females aged 5 years are the age groups that are most secure financially, with 100.0% of males and 100.0% of females in these age groups living above the poverty line.
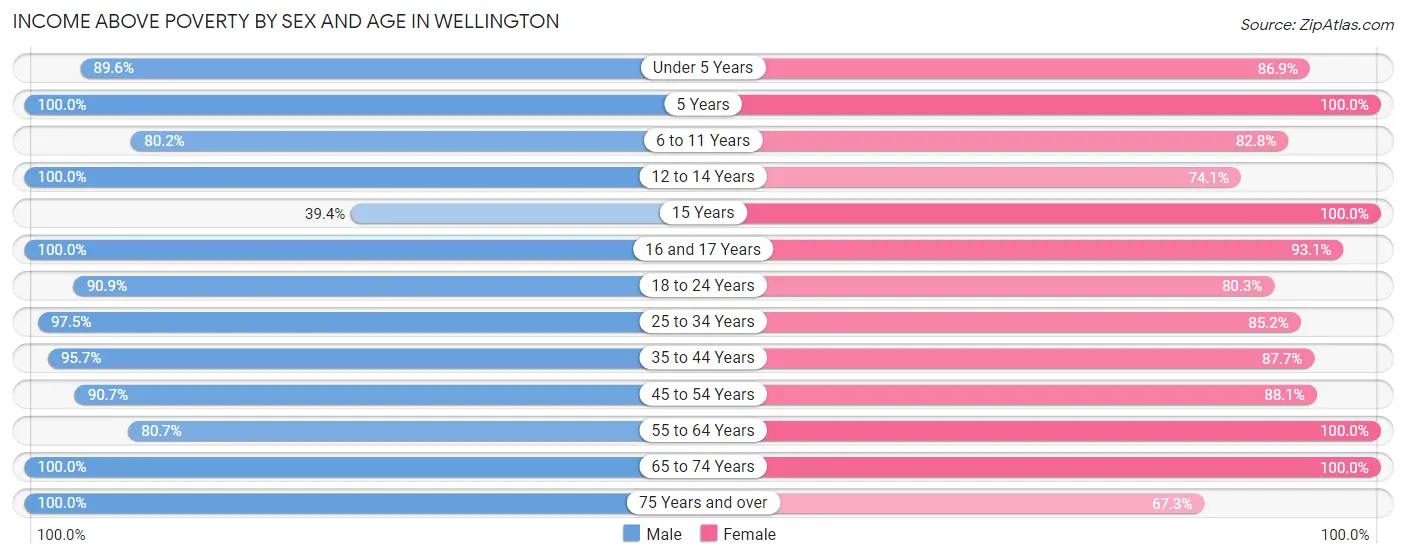
| Age Bracket | Male | Female |
| Under 5 Years | 500 (89.6%) | 516 (86.9%) |
| 5 Years | 64 (100.0%) | 69 (100.0%) |
| 6 to 11 Years | 574 (80.2%) | 338 (82.8%) |
| 12 to 14 Years | 140 (100.0%) | 291 (74.1%) |
| 15 Years | 52 (39.4%) | 94 (100.0%) |
| 16 and 17 Years | 75 (100.0%) | 108 (93.1%) |
| 18 to 24 Years | 448 (90.9%) | 260 (80.2%) |
| 25 to 34 Years | 745 (97.5%) | 757 (85.2%) |
| 35 to 44 Years | 1,078 (95.7%) | 917 (87.7%) |
| 45 to 54 Years | 622 (90.7%) | 534 (88.1%) |
| 55 to 64 Years | 331 (80.7%) | 371 (100.0%) |
| 65 to 74 Years | 343 (100.0%) | 417 (100.0%) |
| 75 Years and over | 81 (100.0%) | 148 (67.3%) |
| Total | 5,053 (90.4%) | 4,820 (86.9%) |
Income Below Poverty Among Married-Couple Families in Wellington
The poverty statistics for married-couple families in Wellington show that 2.8% or 68 of the total 2,454 families live below the poverty line. Families with 3 or 4 children have the highest poverty rate of 14.0%, comprising of 49 families. On the other hand, families with no children have the lowest poverty rate of 0.0%, which includes 0 families.
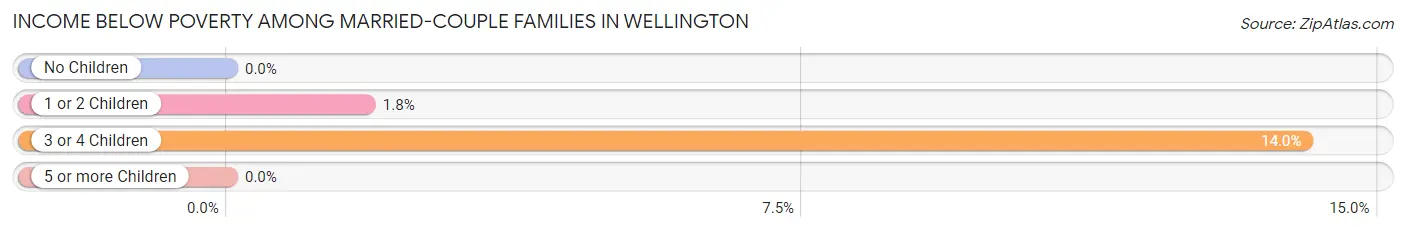
| Children | Above Poverty | Below Poverty |
| No Children | 1,050 (100.0%) | 0 (0.0%) |
| 1 or 2 Children | 1,036 (98.2%) | 19 (1.8%) |
| 3 or 4 Children | 300 (86.0%) | 49 (14.0%) |
| 5 or more Children | 0 (0.0%) | 0 (0.0%) |
| Total | 2,386 (97.2%) | 68 (2.8%) |
Income Below Poverty Among Single-Parent Households in Wellington
According to the poverty data in Wellington, 23.5% or 35 single-father households and 39.9% or 110 single-mother households are living below the poverty line. Among single-father households, those with 1 or 2 children have the highest poverty rate, with 35 households (40.2%) experiencing poverty. Likewise, among single-mother households, those with 3 or 4 children have the highest poverty rate, with 38 households (57.6%) falling below the poverty line.
| Children | Single Father | Single Mother |
| No Children | 0 (0.0%) | 0 (0.0%) |
| 1 or 2 Children | 35 (40.2%) | 72 (49.7%) |
| 3 or 4 Children | 0 (0.0%) | 38 (57.6%) |
| 5 or more Children | 0 (0.0%) | 0 (0.0%) |
| Total | 35 (23.5%) | 110 (39.9%) |
Income Below Poverty Among Married-Couple vs Single-Parent Households in Wellington
The poverty data for Wellington shows that 68 of the married-couple family households (2.8%) and 145 of the single-parent households (34.1%) are living below the poverty level. Within the married-couple family households, those with 3 or 4 children have the highest poverty rate, with 49 households (14.0%) falling below the poverty line. Among the single-parent households, those with 3 or 4 children have the highest poverty rate, with 38 household (57.6%) living below poverty.
| Children | Married-Couple Families | Single-Parent Households |
| No Children | 0 (0.0%) | 0 (0.0%) |
| 1 or 2 Children | 19 (1.8%) | 107 (46.1%) |
| 3 or 4 Children | 49 (14.0%) | 38 (57.6%) |
| 5 or more Children | 0 (0.0%) | 0 (0.0%) |
| Total | 68 (2.8%) | 145 (34.1%) |
Race in Wellington
The most populous races in Wellington are White / Caucasian (9,440 | 84.6%), Hispanic or Latino (1,908 | 17.1%), and Two or more Races (984 | 8.8%).
| Race | # Population | % Population |
| Asian | 71 | 0.6% |
| Black / African American | 66 | 0.6% |
| Hawaiian / Pacific | 0 | 0.0% |
| Hispanic or Latino | 1,908 | 17.1% |
| Native / Alaskan | 100 | 0.9% |
| White / Caucasian | 9,440 | 84.6% |
| Two or more Races | 984 | 8.8% |
| Some other Race | 502 | 4.5% |
| Total | 11,163 | 100.0% |
Ancestry in Wellington
The most populous ancestries reported in Wellington are German (2,757 | 24.7%), Mexican (1,606 | 14.4%), English (1,440 | 12.9%), Irish (1,143 | 10.2%), and French (921 | 8.3%), together accounting for 70.5% of all Wellington residents.
| Ancestry | # Population | % Population |
| American | 406 | 3.6% |
| British | 65 | 0.6% |
| Burmese | 33 | 0.3% |
| Canadian | 31 | 0.3% |
| Celtic | 30 | 0.3% |
| Cherokee | 93 | 0.8% |
| Colombian | 19 | 0.2% |
| Croatian | 22 | 0.2% |
| Cuban | 79 | 0.7% |
| Czech | 267 | 2.4% |
| Czechoslovakian | 67 | 0.6% |
| Danish | 23 | 0.2% |
| Dutch | 122 | 1.1% |
| Eastern European | 28 | 0.3% |
| English | 1,440 | 12.9% |
| European | 125 | 1.1% |
| Finnish | 21 | 0.2% |
| French | 921 | 8.3% |
| French Canadian | 140 | 1.3% |
| German | 2,757 | 24.7% |
| Greek | 93 | 0.8% |
| Hungarian | 31 | 0.3% |
| Irish | 1,143 | 10.2% |
| Italian | 799 | 7.2% |
| Korean | 20 | 0.2% |
| Lithuanian | 22 | 0.2% |
| Mexican | 1,606 | 14.4% |
| Mexican American Indian | 80 | 0.7% |
| Native Hawaiian | 55 | 0.5% |
| Navajo | 211 | 1.9% |
| Norwegian | 444 | 4.0% |
| Pakistani | 57 | 0.5% |
| Polish | 47 | 0.4% |
| Portuguese | 113 | 1.0% |
| Puerto Rican | 110 | 1.0% |
| Russian | 223 | 2.0% |
| Scotch-Irish | 170 | 1.5% |
| Scottish | 542 | 4.9% |
| Slavic | 14 | 0.1% |
| South American | 19 | 0.2% |
| Spaniard | 49 | 0.4% |
| Spanish | 45 | 0.4% |
| Subsaharan African | 30 | 0.3% |
| Swedish | 209 | 1.9% |
| Swiss | 19 | 0.2% |
| Welsh | 68 | 0.6% |
| Yaqui | 9 | 0.1% | View All 47 Rows |
Immigrants in Wellington
The most numerous immigrant groups reported in Wellington came from Europe (105 | 0.9%), Western Europe (105 | 0.9%), Germany (72 | 0.6%), Asia (71 | 0.6%), and Central America (38 | 0.3%), together accounting for 3.5% of all Wellington residents.
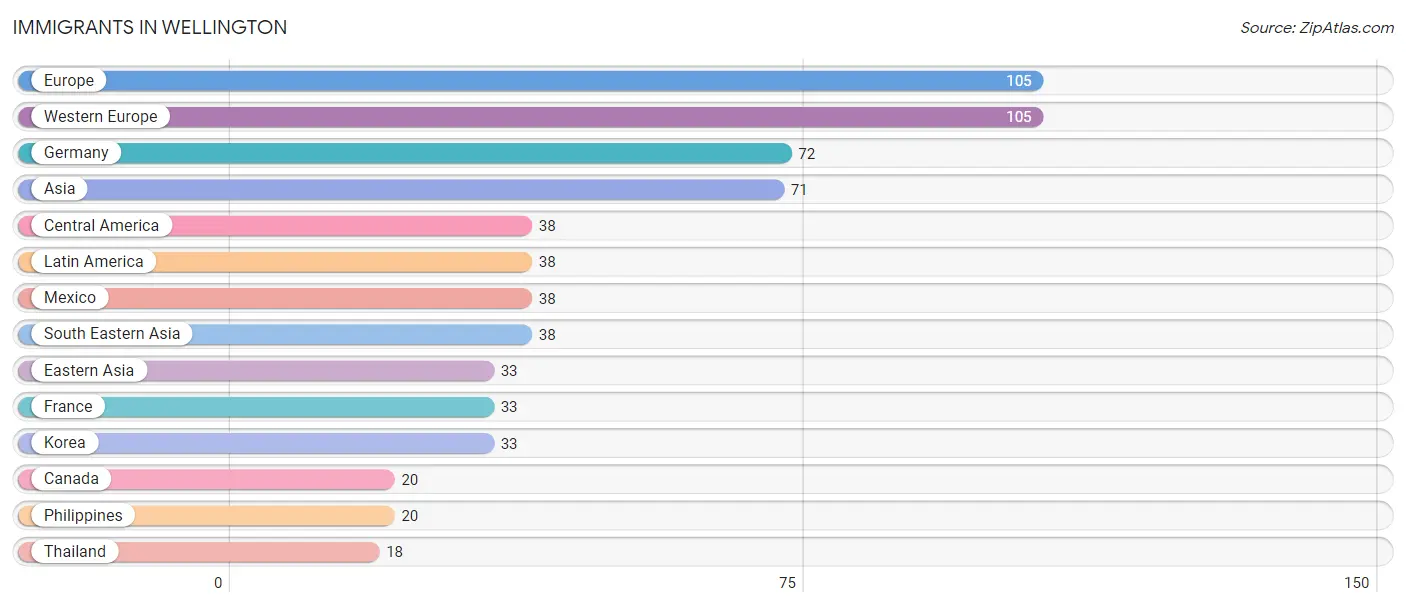
| Immigration Origin | # Population | % Population |
| Asia | 71 | 0.6% |
| Canada | 20 | 0.2% |
| Central America | 38 | 0.3% |
| Eastern Asia | 33 | 0.3% |
| Europe | 105 | 0.9% |
| France | 33 | 0.3% |
| Germany | 72 | 0.6% |
| Korea | 33 | 0.3% |
| Latin America | 38 | 0.3% |
| Mexico | 38 | 0.3% |
| Philippines | 20 | 0.2% |
| South Eastern Asia | 38 | 0.3% |
| Thailand | 18 | 0.2% |
| Western Europe | 105 | 0.9% | View All 14 Rows |
Sex and Age in Wellington
Sex and Age in Wellington
The most populous age groups in Wellington are 35 to 39 Years (642 | 11.5%) for men and 35 to 39 Years (642 | 11.5%) for women.
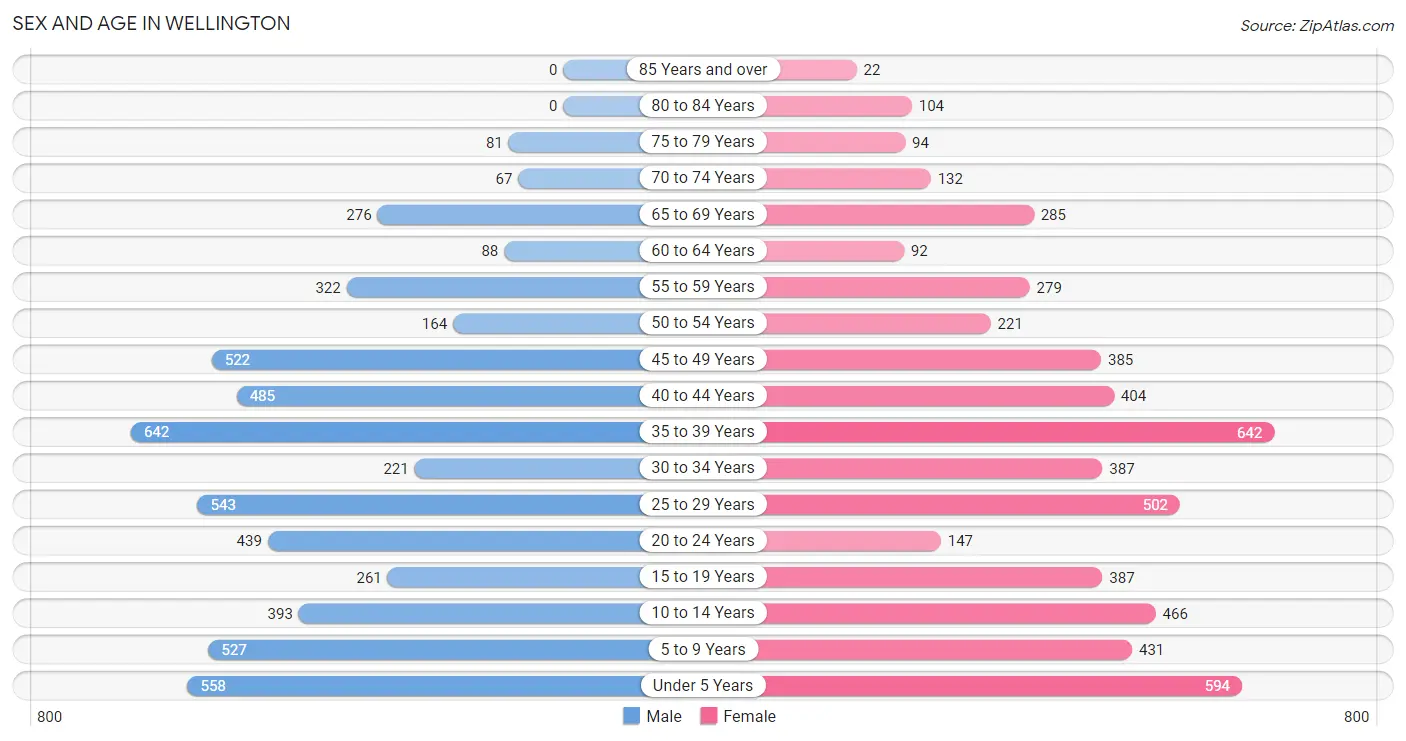
| Age Bracket | Male | Female |
| Under 5 Years | 558 (10.0%) | 594 (10.7%) |
| 5 to 9 Years | 527 (9.4%) | 431 (7.7%) |
| 10 to 14 Years | 393 (7.0%) | 466 (8.4%) |
| 15 to 19 Years | 261 (4.7%) | 387 (6.9%) |
| 20 to 24 Years | 439 (7.9%) | 147 (2.6%) |
| 25 to 29 Years | 543 (9.7%) | 502 (9.0%) |
| 30 to 34 Years | 221 (4.0%) | 387 (6.9%) |
| 35 to 39 Years | 642 (11.5%) | 642 (11.5%) |
| 40 to 44 Years | 485 (8.7%) | 404 (7.2%) |
| 45 to 49 Years | 522 (9.3%) | 385 (6.9%) |
| 50 to 54 Years | 164 (2.9%) | 221 (4.0%) |
| 55 to 59 Years | 322 (5.8%) | 279 (5.0%) |
| 60 to 64 Years | 88 (1.6%) | 92 (1.7%) |
| 65 to 69 Years | 276 (4.9%) | 285 (5.1%) |
| 70 to 74 Years | 67 (1.2%) | 132 (2.4%) |
| 75 to 79 Years | 81 (1.5%) | 94 (1.7%) |
| 80 to 84 Years | 0 (0.0%) | 104 (1.9%) |
| 85 Years and over | 0 (0.0%) | 22 (0.4%) |
| Total | 5,589 (100.0%) | 5,574 (100.0%) |
Families and Households in Wellington
Median Family Size in Wellington
The median family size in Wellington is 3.37 persons per family, with single female/mother families (276 | 9.6%) accounting for the largest median family size of 3.75 persons per family. On the other hand, single male/father families (149 | 5.2%) represent the smallest median family size with 3.02 persons per family.
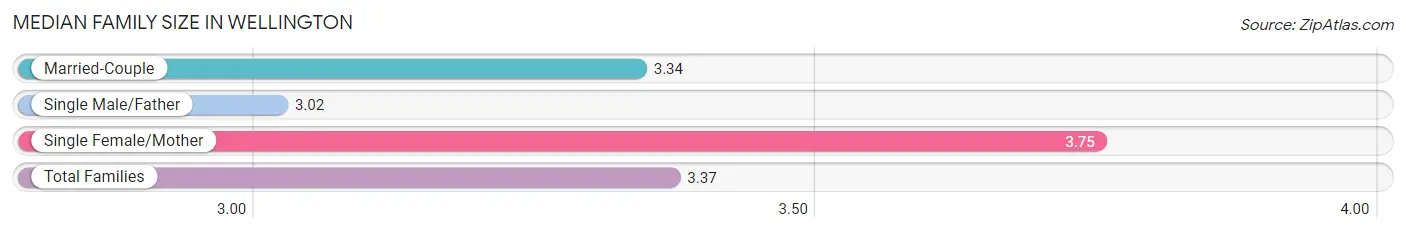
| Family Type | # Families | Family Size |
| Married-Couple | 2,454 (85.2%) | 3.34 |
| Single Male/Father | 149 (5.2%) | 3.02 |
| Single Female/Mother | 276 (9.6%) | 3.75 |
| Total Families | 2,879 (100.0%) | 3.37 |
Median Household Size in Wellington
The median household size in Wellington is 2.79 persons per household, with single female/mother households (276 | 6.9%) accounting for the largest median household size of 3.86 persons per household. non-family households (1,121 | 28.0%) represent the smallest median household size with 1.23 persons per household.
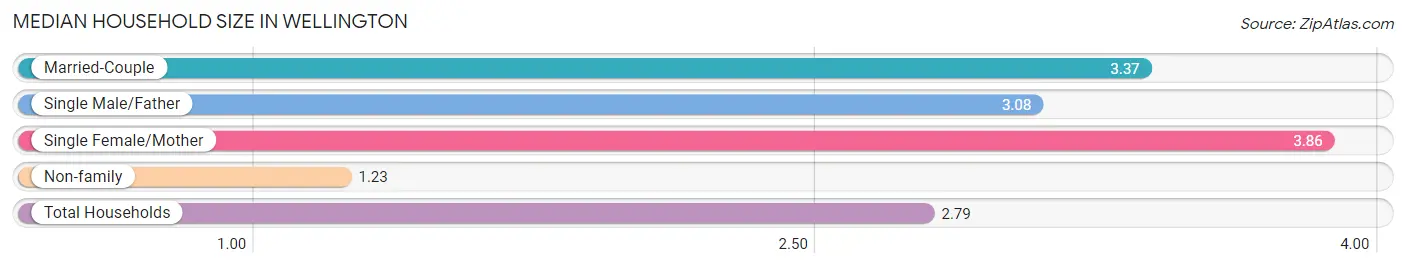
| Household Type | # Households | Household Size |
| Married-Couple | 2,454 (61.4%) | 3.37 |
| Single Male/Father | 149 (3.7%) | 3.08 |
| Single Female/Mother | 276 (6.9%) | 3.86 |
| Non-family | 1,121 (28.0%) | 1.23 |
| Total Households | 4,000 (100.0%) | 2.79 |
Household Size by Marriage Status in Wellington
Out of a total of 4,000 households in Wellington, 2,879 (72.0%) are family households, while 1,121 (28.0%) are nonfamily households. The most numerous type of family households are 2-person households, comprising 966, and the most common type of nonfamily households are 1-person households, comprising 909.
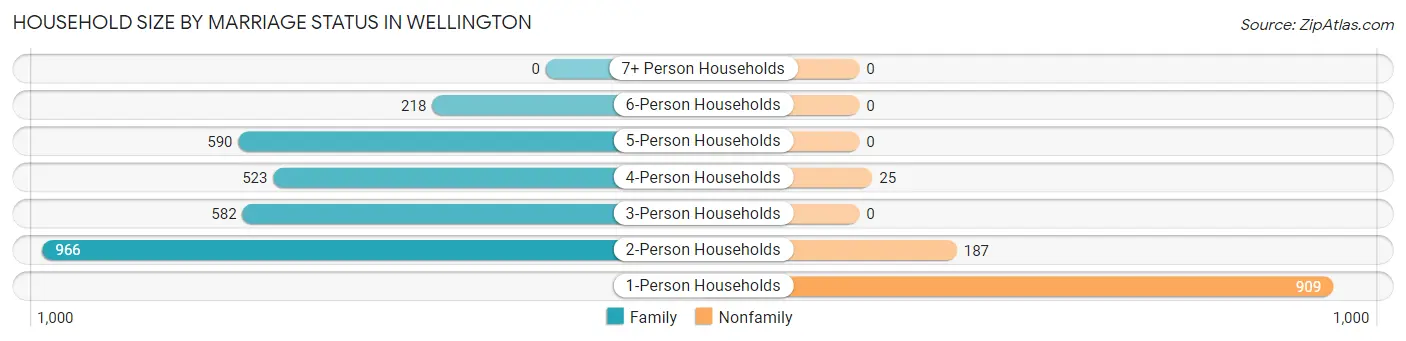
| Household Size | Family Households | Nonfamily Households |
| 1-Person Households | - | 909 (22.7%) |
| 2-Person Households | 966 (24.1%) | 187 (4.7%) |
| 3-Person Households | 582 (14.5%) | 0 (0.0%) |
| 4-Person Households | 523 (13.1%) | 25 (0.6%) |
| 5-Person Households | 590 (14.7%) | 0 (0.0%) |
| 6-Person Households | 218 (5.4%) | 0 (0.0%) |
| 7+ Person Households | 0 (0.0%) | 0 (0.0%) |
| Total | 2,879 (72.0%) | 1,121 (28.0%) |
Female Fertility in Wellington
Fertility by Age in Wellington
Average fertility rate in Wellington is 90.0 births per 1,000 women. Women in the age bracket of 20 to 34 years have the highest fertility rate with 164.0 births per 1,000 women. Women in the age bracket of 20 to 34 years acount for 63.9% of all women with births.
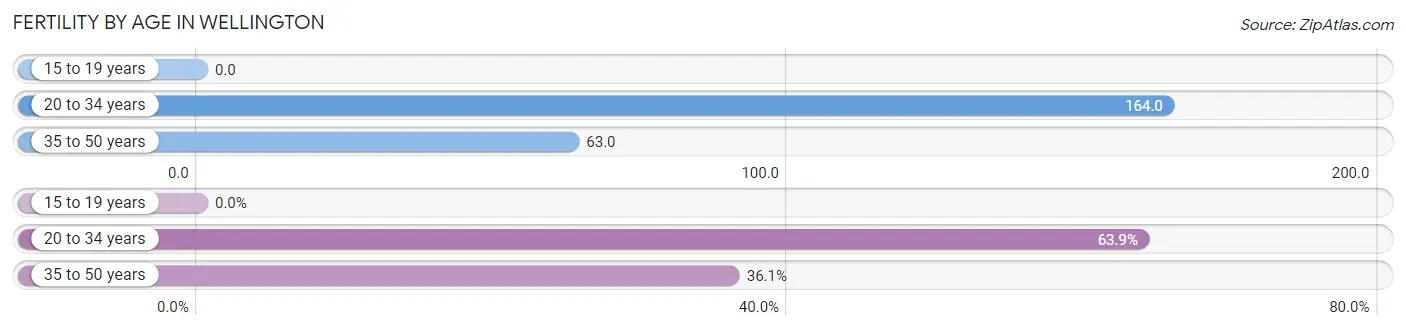
| Age Bracket | Women with Births | Births / 1,000 Women |
| 15 to 19 years | 0 (0.0%) | 0.0 |
| 20 to 34 years | 170 (63.9%) | 164.0 |
| 35 to 50 years | 96 (36.1%) | 63.0 |
| Total | 266 (100.0%) | 90.0 |
Fertility by Age by Marriage Status in Wellington
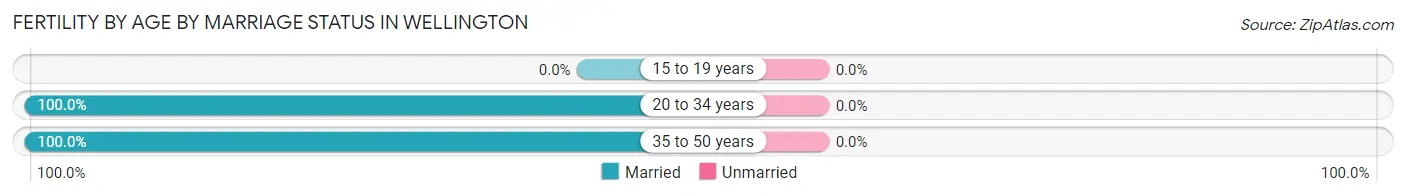
| Age Bracket | Married | Unmarried |
| 15 to 19 years | 0 (0.0%) | 0 (0.0%) |
| 20 to 34 years | 170 (100.0%) | 0 (0.0%) |
| 35 to 50 years | 96 (100.0%) | 0 (0.0%) |
| Total | 266 (100.0%) | 0 (0.0%) |
Fertility by Education in Wellington
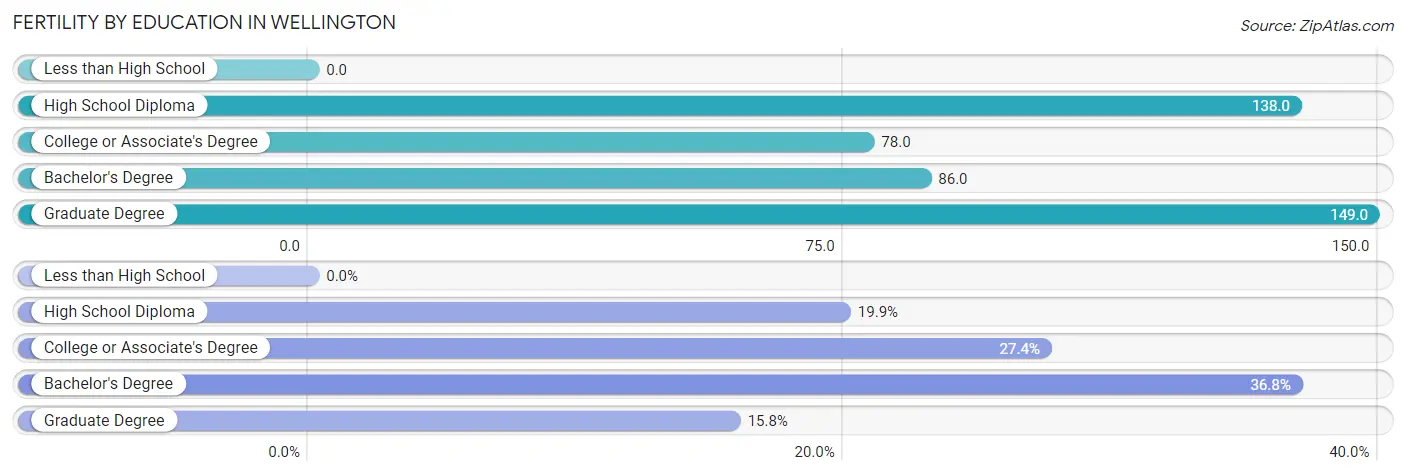
| Educational Attainment | Women with Births | Births / 1,000 Women |
| Less than High School | 0 (0.0%) | 0.0 |
| High School Diploma | 53 (19.9%) | 138.0 |
| College or Associate's Degree | 73 (27.4%) | 78.0 |
| Bachelor's Degree | 98 (36.8%) | 86.0 |
| Graduate Degree | 42 (15.8%) | 149.0 |
| Total | 266 (100.0%) | 90.0 |
Fertility by Education by Marriage Status in Wellington
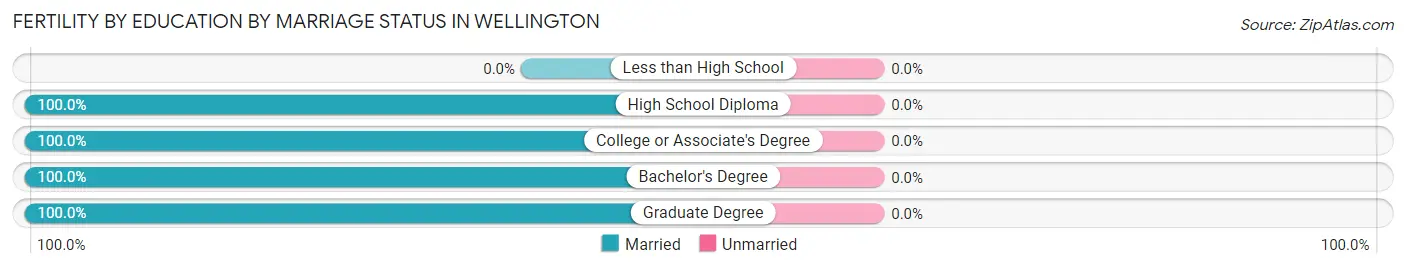
| Educational Attainment | Married | Unmarried |
| Less than High School | 0 (0.0%) | 0 (0.0%) |
| High School Diploma | 53 (100.0%) | 0 (0.0%) |
| College or Associate's Degree | 73 (100.0%) | 0 (0.0%) |
| Bachelor's Degree | 98 (100.0%) | 0 (0.0%) |
| Graduate Degree | 42 (100.0%) | 0 (0.0%) |
| Total | 266 (100.0%) | 0 (0.0%) |
Employment Characteristics in Wellington
Employment by Class of Employer in Wellington
Among the 5,262 employed individuals in Wellington, private company employees (3,314 | 63.0%), local government employees (528 | 10.0%), and state government employees (502 | 9.5%) make up the most common classes of employment.
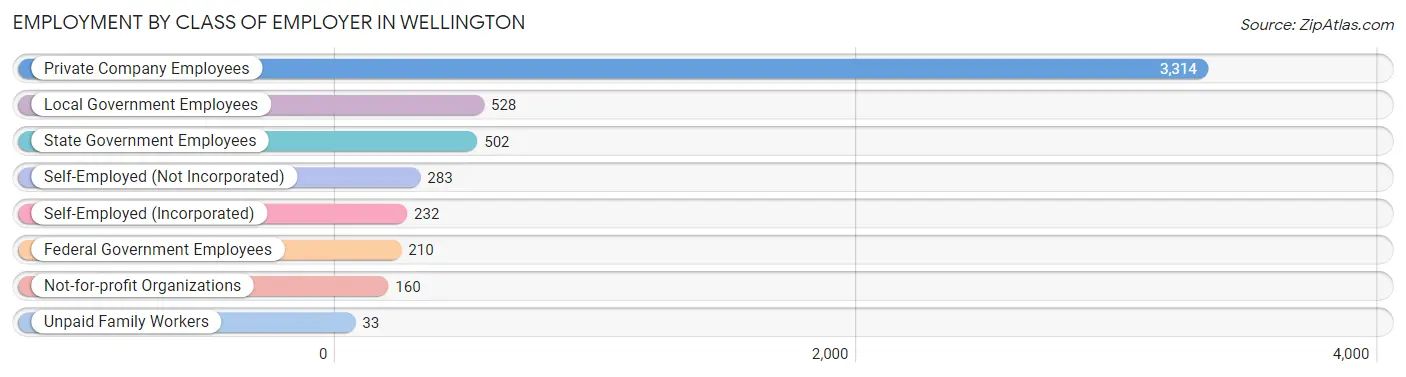
| Employer Class | # Employees | % Employees |
| Private Company Employees | 3,314 | 63.0% |
| Self-Employed (Incorporated) | 232 | 4.4% |
| Self-Employed (Not Incorporated) | 283 | 5.4% |
| Not-for-profit Organizations | 160 | 3.0% |
| Local Government Employees | 528 | 10.0% |
| State Government Employees | 502 | 9.5% |
| Federal Government Employees | 210 | 4.0% |
| Unpaid Family Workers | 33 | 0.6% |
| Total | 5,262 | 100.0% |
Employment Status by Age in Wellington
According to the labor force statistics for Wellington, out of the total population over 16 years of age (7,968), 71.8% or 5,721 individuals are in the labor force, with 7.7% or 441 of them unemployed. The age group with the highest labor force participation rate is 20 to 24 years, with 96.6% or 566 individuals in the labor force. Within the labor force, the 16 to 19 years age range has the highest percentage of unemployed individuals, with 33.6% or 91 of them being unemployed.
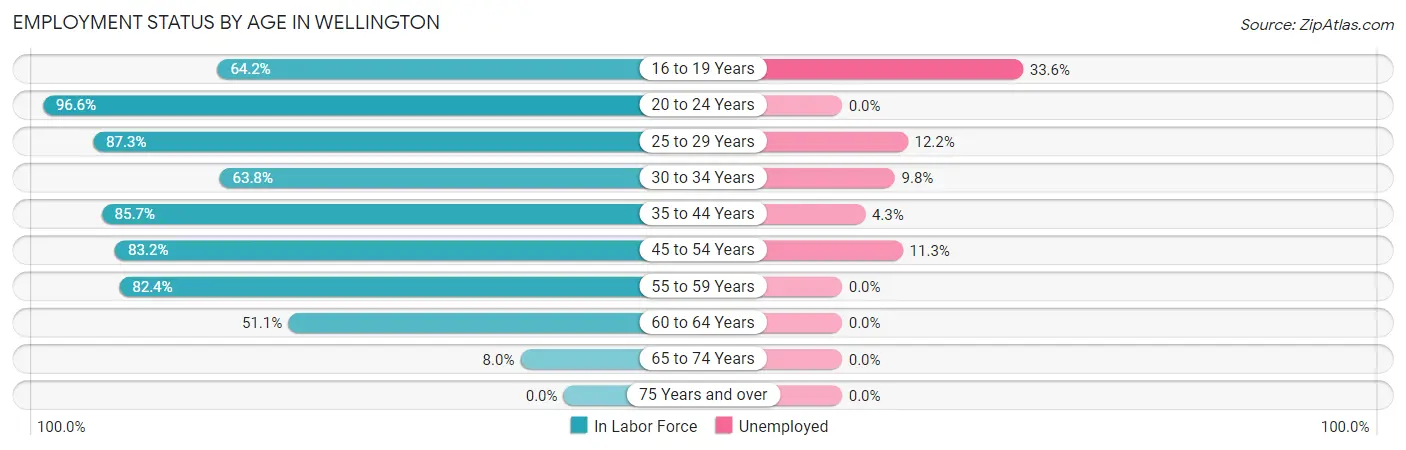
| Age Bracket | In Labor Force | Unemployed |
| 16 to 19 Years | 271 (64.2%) | 91 (33.6%) |
| 20 to 24 Years | 566 (96.6%) | 0 (0.0%) |
| 25 to 29 Years | 912 (87.3%) | 111 (12.2%) |
| 30 to 34 Years | 388 (63.8%) | 38 (9.8%) |
| 35 to 44 Years | 1,862 (85.7%) | 80 (4.3%) |
| 45 to 54 Years | 1,075 (83.2%) | 121 (11.3%) |
| 55 to 59 Years | 495 (82.4%) | 0 (0.0%) |
| 60 to 64 Years | 92 (51.1%) | 0 (0.0%) |
| 65 to 74 Years | 61 (8.0%) | 0 (0.0%) |
| 75 Years and over | 0 (0.0%) | 0 (0.0%) |
| Total | 5,721 (71.8%) | 441 (7.7%) |
Employment Status by Educational Attainment in Wellington
According to labor force statistics for Wellington, 81.8% of individuals (4,825) out of the total population between 25 and 64 years of age (5,899) are in the labor force, with 7.3% or 352 of them being unemployed. The group with the highest labor force participation rate are those with the educational attainment of college / associate degree, with 86.3% or 1,813 individuals in the labor force. Within the labor force, individuals with college / associate degree education have the highest percentage of unemployment, with 13.3% or 241 of them being unemployed.
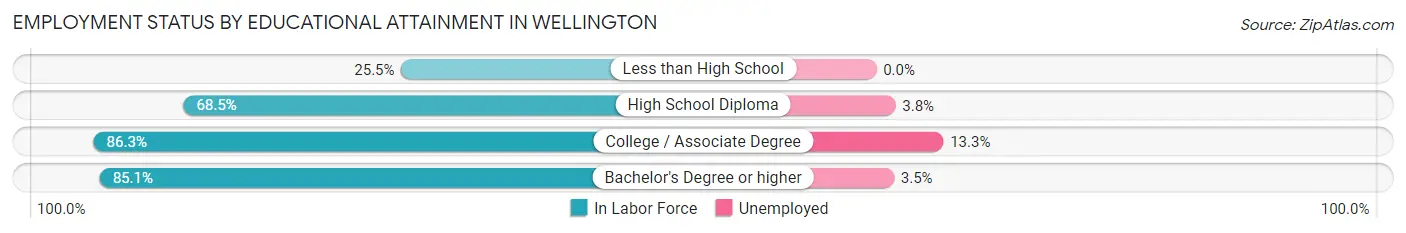
| Educational Attainment | In Labor Force | Unemployed |
| Less than High School | 12 (25.5%) | 0 (0.0%) |
| High School Diploma | 795 (68.5%) | 44 (3.8%) |
| College / Associate Degree | 1,813 (86.3%) | 279 (13.3%) |
| Bachelor's Degree or higher | 2,205 (85.1%) | 91 (3.5%) |
| Total | 4,825 (81.8%) | 431 (7.3%) |
Employment Occupations by Sex in Wellington
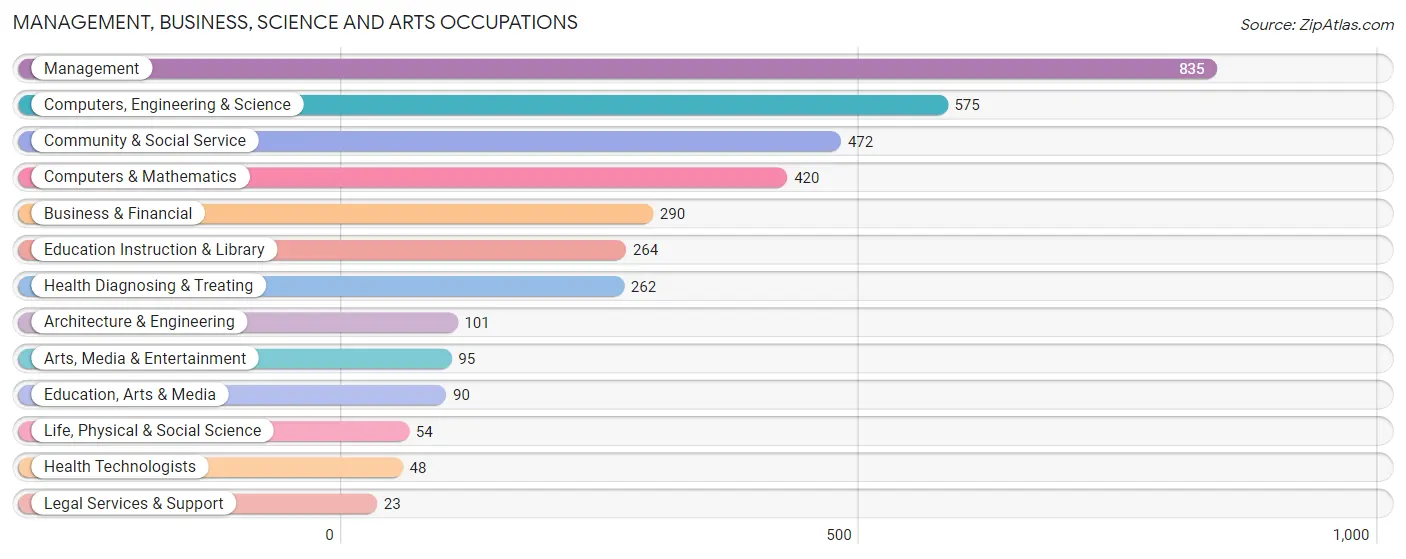
Management, Business, Science and Arts Occupations
The most common Management, Business, Science and Arts occupations in Wellington are Management (835 | 15.8%), Computers, Engineering & Science (575 | 10.9%), Community & Social Service (472 | 8.9%), Computers & Mathematics (420 | 8.0%), and Business & Financial (290 | 5.5%).
Management, Business, Science and Arts Occupations by Sex
Within the Management, Business, Science and Arts occupations in Wellington, the most male-oriented occupations are Architecture & Engineering (100.0%), Legal Services & Support (100.0%), and Health Technologists (100.0%), while the most female-oriented occupations are Education, Arts & Media (100.0%), Education Instruction & Library (82.6%), and Health Diagnosing & Treating (81.7%).
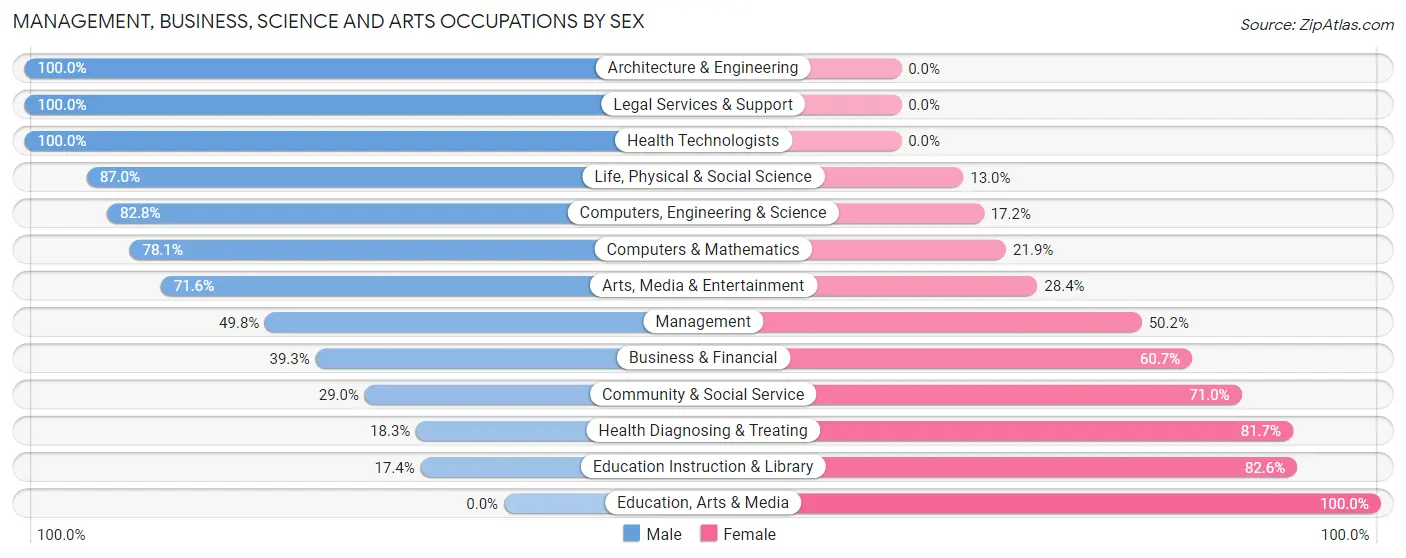
| Occupation | Male | Female |
| Management | 416 (49.8%) | 419 (50.2%) |
| Business & Financial | 114 (39.3%) | 176 (60.7%) |
| Computers, Engineering & Science | 476 (82.8%) | 99 (17.2%) |
| Computers & Mathematics | 328 (78.1%) | 92 (21.9%) |
| Architecture & Engineering | 101 (100.0%) | 0 (0.0%) |
| Life, Physical & Social Science | 47 (87.0%) | 7 (13.0%) |
| Community & Social Service | 137 (29.0%) | 335 (71.0%) |
| Education, Arts & Media | 0 (0.0%) | 90 (100.0%) |
| Legal Services & Support | 23 (100.0%) | 0 (0.0%) |
| Education Instruction & Library | 46 (17.4%) | 218 (82.6%) |
| Arts, Media & Entertainment | 68 (71.6%) | 27 (28.4%) |
| Health Diagnosing & Treating | 48 (18.3%) | 214 (81.7%) |
| Health Technologists | 48 (100.0%) | 0 (0.0%) |
| Total (Category) | 1,191 (48.9%) | 1,243 (51.1%) |
| Total (Overall) | 3,287 (62.2%) | 1,994 (37.8%) |
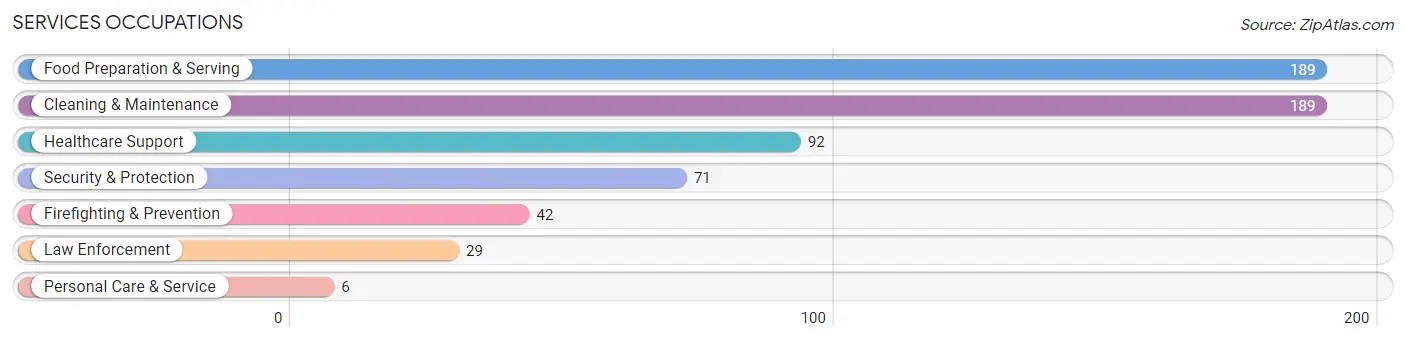
Services Occupations
The most common Services occupations in Wellington are Food Preparation & Serving (189 | 3.6%), Cleaning & Maintenance (189 | 3.6%), Healthcare Support (92 | 1.7%), Security & Protection (71 | 1.3%), and Firefighting & Prevention (42 | 0.8%).
Services Occupations by Sex
Within the Services occupations in Wellington, the most male-oriented occupations are Security & Protection (100.0%), Firefighting & Prevention (100.0%), and Law Enforcement (100.0%), while the most female-oriented occupations are Healthcare Support (100.0%), Personal Care & Service (100.0%), and Food Preparation & Serving (48.1%).
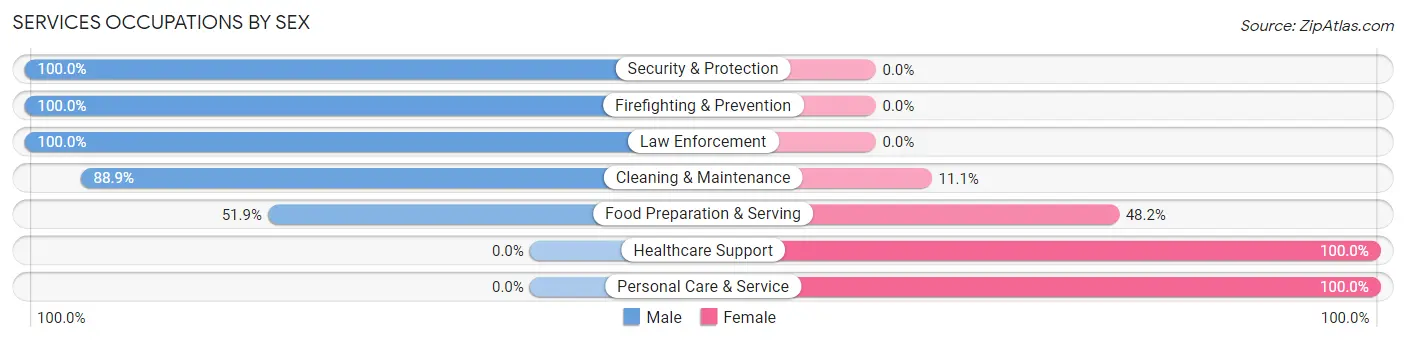
| Occupation | Male | Female |
| Healthcare Support | 0 (0.0%) | 92 (100.0%) |
| Security & Protection | 71 (100.0%) | 0 (0.0%) |
| Firefighting & Prevention | 42 (100.0%) | 0 (0.0%) |
| Law Enforcement | 29 (100.0%) | 0 (0.0%) |
| Food Preparation & Serving | 98 (51.8%) | 91 (48.1%) |
| Cleaning & Maintenance | 168 (88.9%) | 21 (11.1%) |
| Personal Care & Service | 0 (0.0%) | 6 (100.0%) |
| Total (Category) | 337 (61.6%) | 210 (38.4%) |
| Total (Overall) | 3,287 (62.2%) | 1,994 (37.8%) |
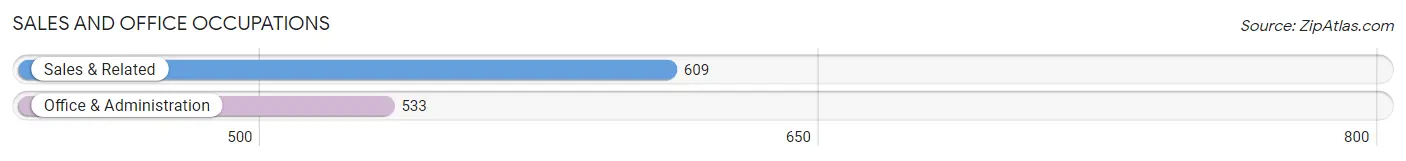
Sales and Office Occupations
The most common Sales and Office occupations in Wellington are Sales & Related (609 | 11.5%), and Office & Administration (533 | 10.1%).
Sales and Office Occupations by Sex
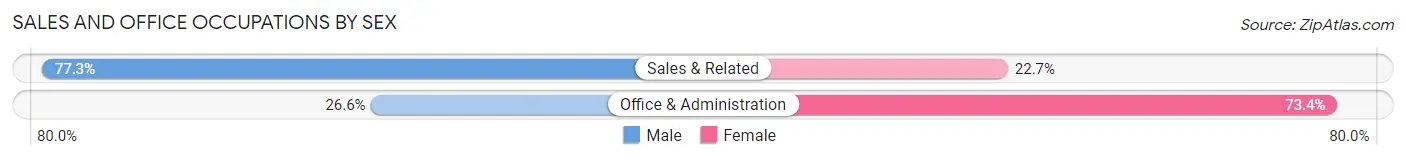
| Occupation | Male | Female |
| Sales & Related | 471 (77.3%) | 138 (22.7%) |
| Office & Administration | 142 (26.6%) | 391 (73.4%) |
| Total (Category) | 613 (53.7%) | 529 (46.3%) |
| Total (Overall) | 3,287 (62.2%) | 1,994 (37.8%) |
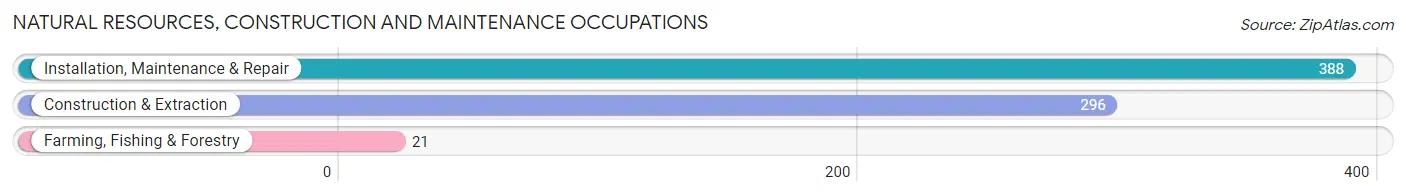
Natural Resources, Construction and Maintenance Occupations
The most common Natural Resources, Construction and Maintenance occupations in Wellington are Installation, Maintenance & Repair (388 | 7.3%), Construction & Extraction (296 | 5.6%), and Farming, Fishing & Forestry (21 | 0.4%).
Natural Resources, Construction and Maintenance Occupations by Sex
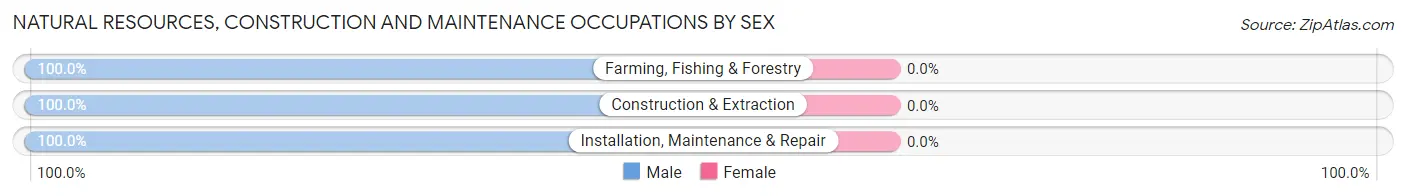
| Occupation | Male | Female |
| Farming, Fishing & Forestry | 21 (100.0%) | 0 (0.0%) |
| Construction & Extraction | 296 (100.0%) | 0 (0.0%) |
| Installation, Maintenance & Repair | 388 (100.0%) | 0 (0.0%) |
| Total (Category) | 705 (100.0%) | 0 (0.0%) |
| Total (Overall) | 3,287 (62.2%) | 1,994 (37.8%) |
Production, Transportation and Moving Occupations
The most common Production, Transportation and Moving occupations in Wellington are Transportation (294 | 5.6%), Production (147 | 2.8%), and Material Moving (12 | 0.2%).
Production, Transportation and Moving Occupations by Sex
| Occupation | Male | Female |
| Production | 147 (100.0%) | 0 (0.0%) |
| Transportation | 294 (100.0%) | 0 (0.0%) |
| Material Moving | 0 (0.0%) | 12 (100.0%) |
| Total (Category) | 441 (97.4%) | 12 (2.6%) |
| Total (Overall) | 3,287 (62.2%) | 1,994 (37.8%) |
Employment Industries by Sex in Wellington
Employment Industries in Wellington
The major employment industries in Wellington include Educational Services (700 | 13.3%), Construction (546 | 10.3%), Retail Trade (506 | 9.6%), Professional & Scientific (472 | 8.9%), and Health Care & Social Assistance (468 | 8.9%).
Employment Industries by Sex in Wellington
The Wellington industries that see more men than women are Mining, Quarrying, & Extraction (100.0%), Transportation & Warehousing (100.0%), and Utilities (100.0%), whereas the industries that tend to have a higher number of women are Health Care & Social Assistance (85.9%), Real Estate, Rental & Leasing (71.7%), and Educational Services (59.3%).
| Industry | Male | Female |
| Agriculture, Fishing & Hunting | 26 (54.2%) | 22 (45.8%) |
| Mining, Quarrying, & Extraction | 85 (100.0%) | 0 (0.0%) |
| Construction | 497 (91.0%) | 49 (9.0%) |
| Manufacturing | 413 (90.6%) | 43 (9.4%) |
| Wholesale Trade | 231 (92.8%) | 18 (7.2%) |
| Retail Trade | 293 (57.9%) | 213 (42.1%) |
| Transportation & Warehousing | 66 (100.0%) | 0 (0.0%) |
| Utilities | 111 (100.0%) | 0 (0.0%) |
| Information | 170 (100.0%) | 0 (0.0%) |
| Finance & Insurance | 103 (52.8%) | 92 (47.2%) |
| Real Estate, Rental & Leasing | 53 (28.3%) | 134 (71.7%) |
| Professional & Scientific | 243 (51.5%) | 229 (48.5%) |
| Enterprise Management | 0 (0.0%) | 0 (0.0%) |
| Administrative & Support | 88 (85.4%) | 15 (14.6%) |
| Educational Services | 285 (40.7%) | 415 (59.3%) |
| Health Care & Social Assistance | 66 (14.1%) | 402 (85.9%) |
| Arts, Entertainment & Recreation | 21 (46.7%) | 24 (53.3%) |
| Accommodation & Food Services | 141 (47.3%) | 157 (52.7%) |
| Public Administration | 246 (63.9%) | 139 (36.1%) |
| Total | 3,287 (62.2%) | 1,994 (37.8%) |
Education in Wellington
School Enrollment in Wellington
The most common levels of schooling among the 3,082 students in Wellington are elementary school (773 | 25.1%), middle school (698 | 22.7%), and college / undergraduate (544 | 17.6%).
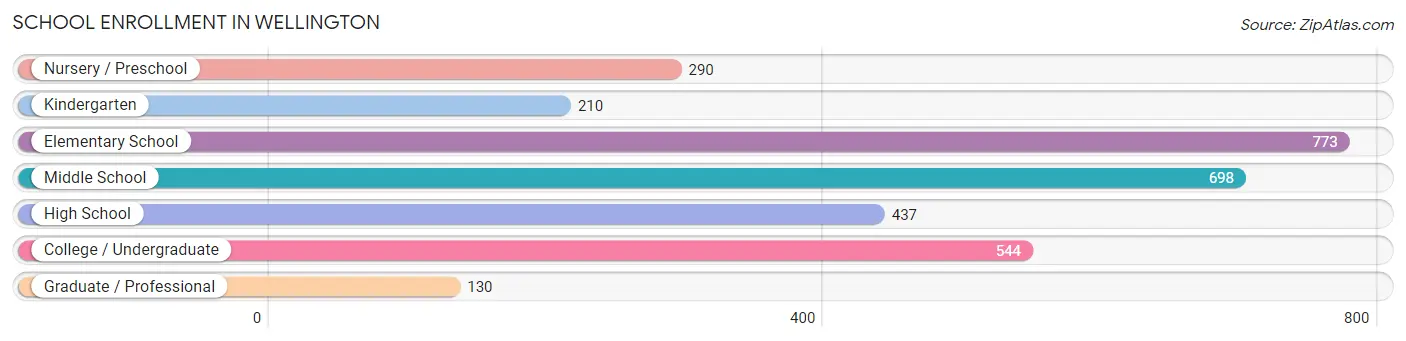
| School Level | # Students | % Students |
| Nursery / Preschool | 290 | 9.4% |
| Kindergarten | 210 | 6.8% |
| Elementary School | 773 | 25.1% |
| Middle School | 698 | 22.7% |
| High School | 437 | 14.2% |
| College / Undergraduate | 544 | 17.6% |
| Graduate / Professional | 130 | 4.2% |
| Total | 3,082 | 100.0% |
School Enrollment by Age by Funding Source in Wellington
Out of a total of 3,082 students who are enrolled in schools in Wellington, 219 (7.1%) attend a private institution, while the remaining 2,863 (92.9%) are enrolled in public schools. The age group of 35 years and over has the highest likelihood of being enrolled in private schools, with 40 (15.9% in the age bracket) enrolled. Conversely, the age group of 3 to 4 year olds has the lowest likelihood of being enrolled in a private school, with 221 (100.0% in the age bracket) attending a public institution.
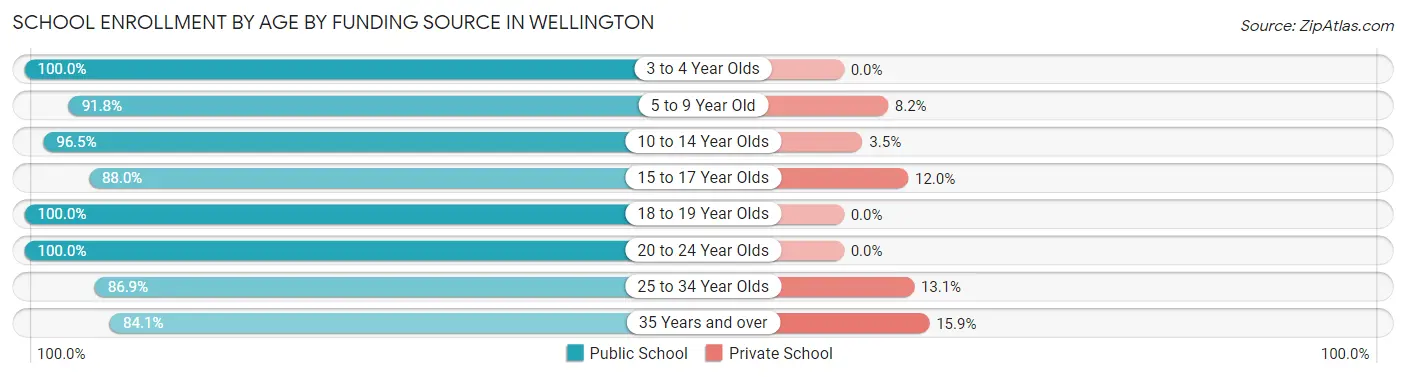
| Age Bracket | Public School | Private School |
| 3 to 4 Year Olds | 221 (100.0%) | 0 (0.0%) |
| 5 to 9 Year Old | 836 (91.8%) | 75 (8.2%) |
| 10 to 14 Year Olds | 829 (96.5%) | 30 (3.5%) |
| 15 to 17 Year Olds | 367 (88.0%) | 50 (12.0%) |
| 18 to 19 Year Olds | 97 (100.0%) | 0 (0.0%) |
| 20 to 24 Year Olds | 135 (100.0%) | 0 (0.0%) |
| 25 to 34 Year Olds | 166 (86.9%) | 25 (13.1%) |
| 35 Years and over | 211 (84.1%) | 40 (15.9%) |
| Total | 2,863 (92.9%) | 219 (7.1%) |
Educational Attainment by Field of Study in Wellington
Business (590 | 17.7%), arts & humanities (494 | 14.8%), bio, nature & agricultural (365 | 10.9%), literature & languages (318 | 9.5%), and computers & mathematics (264 | 7.9%) are the most common fields of study among 3,340 individuals in Wellington who have obtained a bachelor's degree or higher.
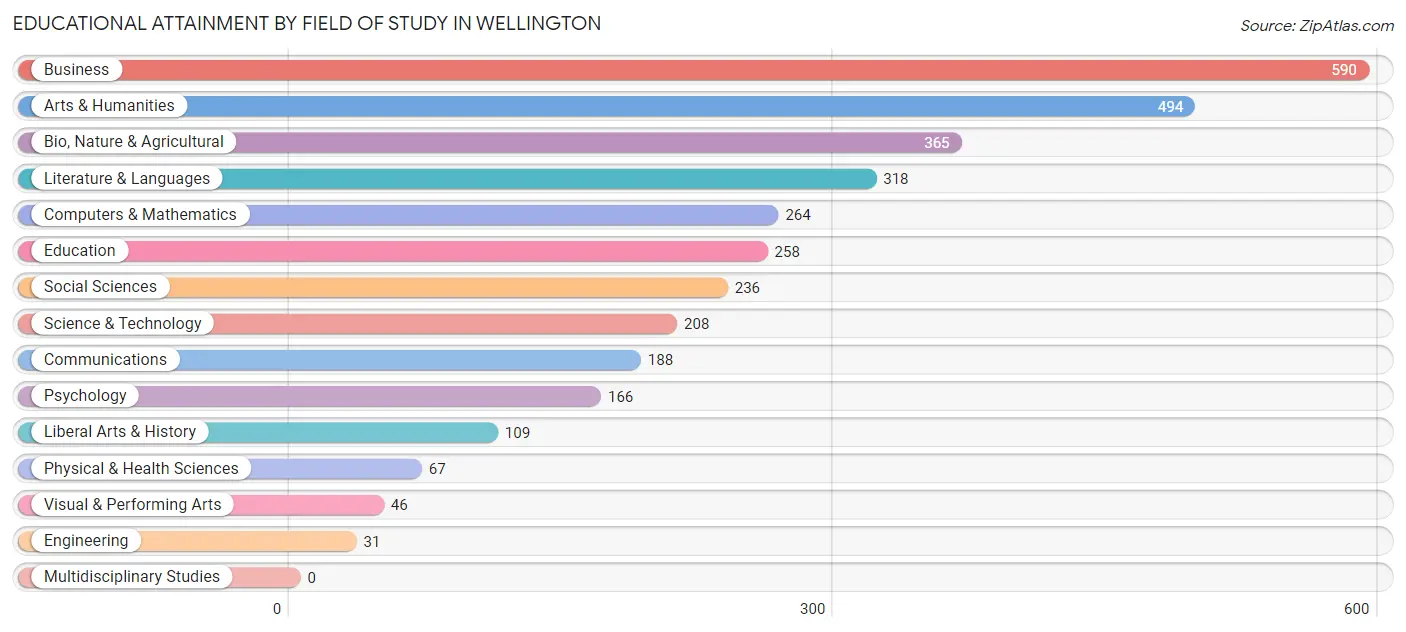
| Field of Study | # Graduates | % Graduates |
| Computers & Mathematics | 264 | 7.9% |
| Bio, Nature & Agricultural | 365 | 10.9% |
| Physical & Health Sciences | 67 | 2.0% |
| Psychology | 166 | 5.0% |
| Social Sciences | 236 | 7.1% |
| Engineering | 31 | 0.9% |
| Multidisciplinary Studies | 0 | 0.0% |
| Science & Technology | 208 | 6.2% |
| Business | 590 | 17.7% |
| Education | 258 | 7.7% |
| Literature & Languages | 318 | 9.5% |
| Liberal Arts & History | 109 | 3.3% |
| Visual & Performing Arts | 46 | 1.4% |
| Communications | 188 | 5.6% |
| Arts & Humanities | 494 | 14.8% |
| Total | 3,340 | 100.0% |
Transportation & Commute in Wellington
Vehicle Availability by Sex in Wellington
The most prevalent vehicle ownership categories in Wellington are males with 2 vehicles (1,627, accounting for 49.5%) and females with 2 vehicles (806, making up 82.4%).
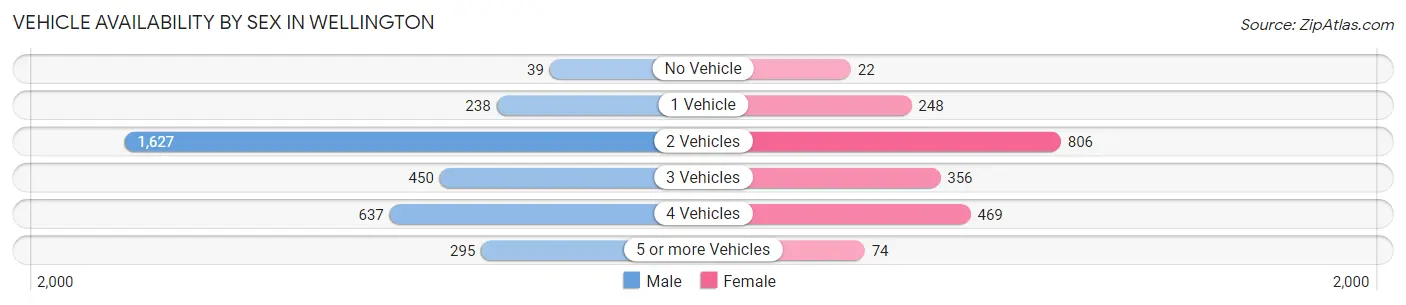
| Vehicles Available | Male | Female |
| No Vehicle | 39 (1.2%) | 22 (1.1%) |
| 1 Vehicle | 238 (7.2%) | 248 (12.6%) |
| 2 Vehicles | 1,627 (49.5%) | 806 (40.8%) |
| 3 Vehicles | 450 (13.7%) | 356 (18.0%) |
| 4 Vehicles | 637 (19.4%) | 469 (23.7%) |
| 5 or more Vehicles | 295 (9.0%) | 74 (3.7%) |
| Total | 3,286 (100.0%) | 1,975 (100.0%) |
Commute Time in Wellington
The most frequently occuring commute durations in Wellington are 20 to 24 minutes (1,261 commuters, 28.4%), 30 to 34 minutes (1,048 commuters, 23.6%), and 15 to 19 minutes (513 commuters, 11.6%).
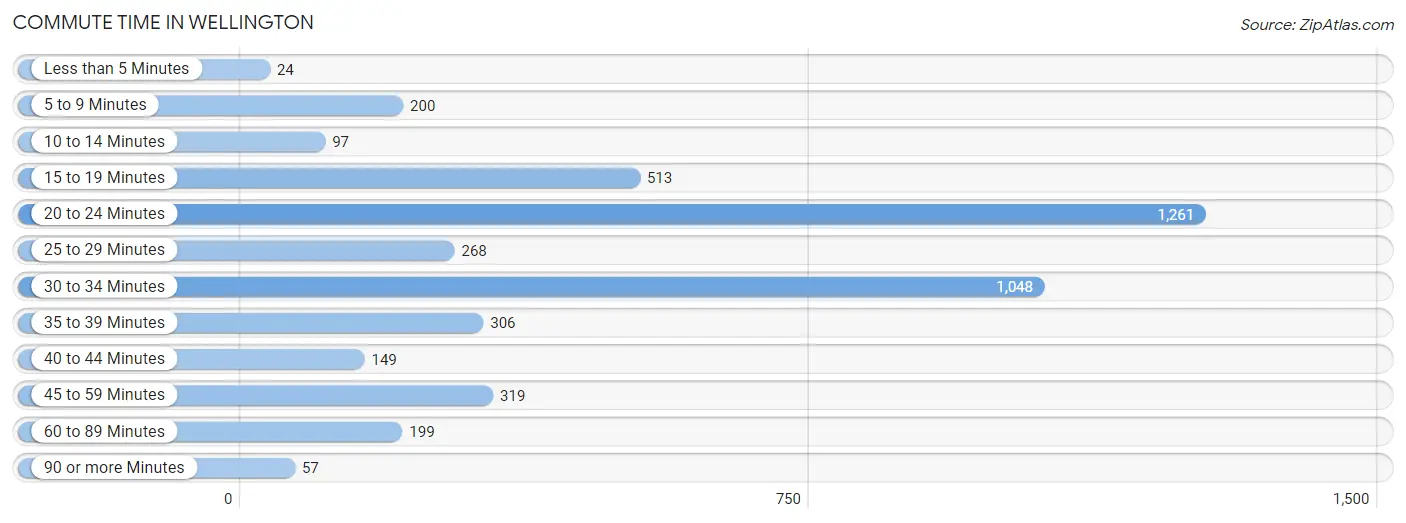
| Commute Time | # Commuters | % Commuters |
| Less than 5 Minutes | 24 | 0.5% |
| 5 to 9 Minutes | 200 | 4.5% |
| 10 to 14 Minutes | 97 | 2.2% |
| 15 to 19 Minutes | 513 | 11.6% |
| 20 to 24 Minutes | 1,261 | 28.4% |
| 25 to 29 Minutes | 268 | 6.0% |
| 30 to 34 Minutes | 1,048 | 23.6% |
| 35 to 39 Minutes | 306 | 6.9% |
| 40 to 44 Minutes | 149 | 3.4% |
| 45 to 59 Minutes | 319 | 7.2% |
| 60 to 89 Minutes | 199 | 4.5% |
| 90 or more Minutes | 57 | 1.3% |
Commute Time by Sex in Wellington
The most common commute times in Wellington are 20 to 24 minutes (876 commuters, 31.0%) for males and 30 to 34 minutes (531 commuters, 32.8%) for females.
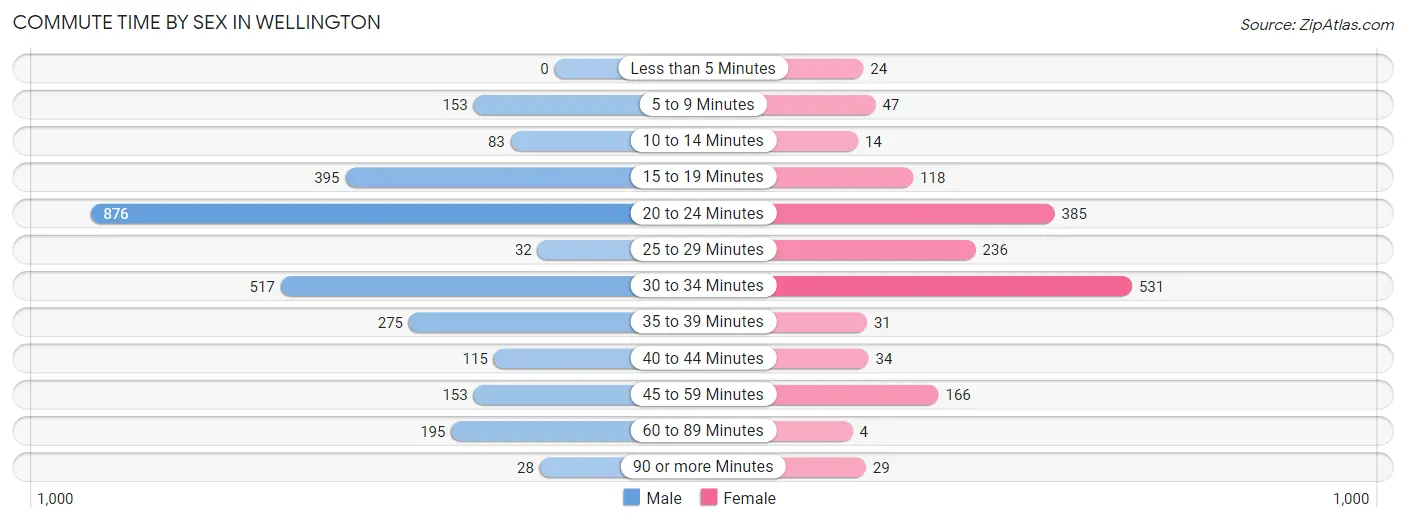
| Commute Time | Male | Female |
| Less than 5 Minutes | 0 (0.0%) | 24 (1.5%) |
| 5 to 9 Minutes | 153 (5.4%) | 47 (2.9%) |
| 10 to 14 Minutes | 83 (2.9%) | 14 (0.9%) |
| 15 to 19 Minutes | 395 (14.0%) | 118 (7.3%) |
| 20 to 24 Minutes | 876 (31.0%) | 385 (23.8%) |
| 25 to 29 Minutes | 32 (1.1%) | 236 (14.6%) |
| 30 to 34 Minutes | 517 (18.3%) | 531 (32.8%) |
| 35 to 39 Minutes | 275 (9.7%) | 31 (1.9%) |
| 40 to 44 Minutes | 115 (4.1%) | 34 (2.1%) |
| 45 to 59 Minutes | 153 (5.4%) | 166 (10.2%) |
| 60 to 89 Minutes | 195 (6.9%) | 4 (0.3%) |
| 90 or more Minutes | 28 (1.0%) | 29 (1.8%) |
Time of Departure to Work by Sex in Wellington
The most frequent times of departure to work in Wellington are 6:30 AM to 6:59 AM (683, 24.2%) for males and 6:30 AM to 6:59 AM (407, 25.1%) for females.
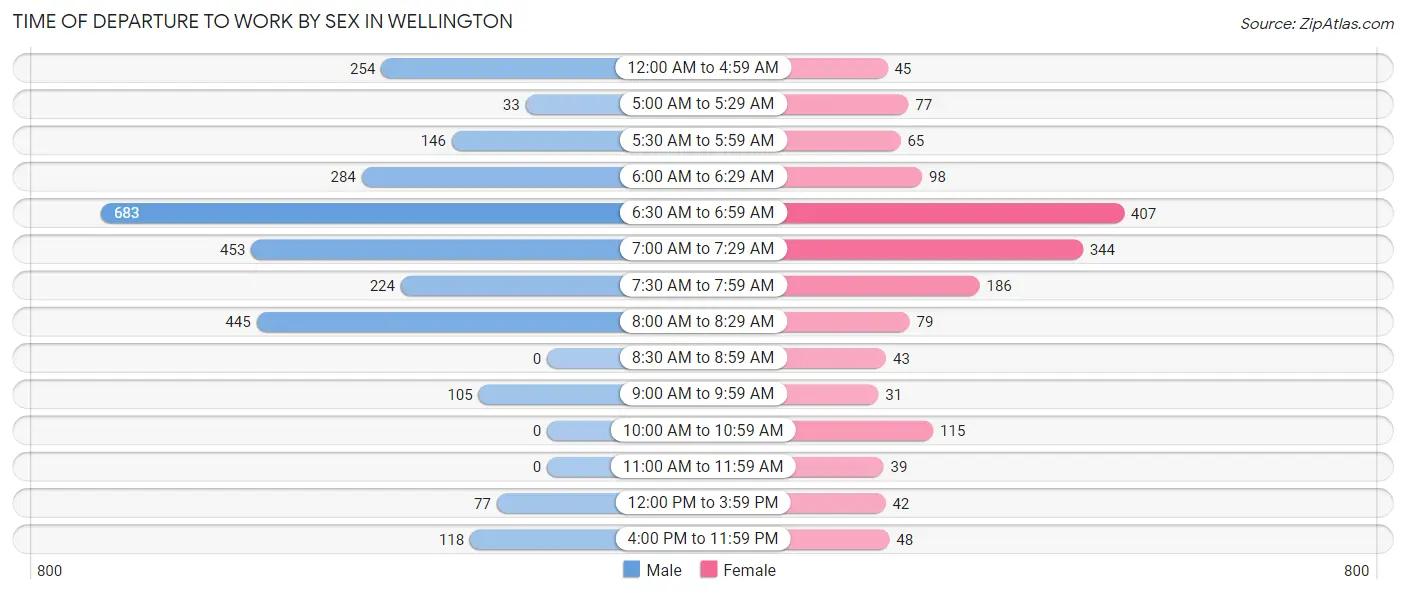
| Time of Departure | Male | Female |
| 12:00 AM to 4:59 AM | 254 (9.0%) | 45 (2.8%) |
| 5:00 AM to 5:29 AM | 33 (1.2%) | 77 (4.8%) |
| 5:30 AM to 5:59 AM | 146 (5.2%) | 65 (4.0%) |
| 6:00 AM to 6:29 AM | 284 (10.1%) | 98 (6.0%) |
| 6:30 AM to 6:59 AM | 683 (24.2%) | 407 (25.1%) |
| 7:00 AM to 7:29 AM | 453 (16.1%) | 344 (21.2%) |
| 7:30 AM to 7:59 AM | 224 (7.9%) | 186 (11.5%) |
| 8:00 AM to 8:29 AM | 445 (15.8%) | 79 (4.9%) |
| 8:30 AM to 8:59 AM | 0 (0.0%) | 43 (2.7%) |
| 9:00 AM to 9:59 AM | 105 (3.7%) | 31 (1.9%) |
| 10:00 AM to 10:59 AM | 0 (0.0%) | 115 (7.1%) |
| 11:00 AM to 11:59 AM | 0 (0.0%) | 39 (2.4%) |
| 12:00 PM to 3:59 PM | 77 (2.7%) | 42 (2.6%) |
| 4:00 PM to 11:59 PM | 118 (4.2%) | 48 (3.0%) |
| Total | 2,822 (100.0%) | 1,619 (100.0%) |
Housing Occupancy in Wellington
Occupancy by Ownership in Wellington
Of the total 4,000 dwellings in Wellington, owner-occupied units account for 3,345 (83.6%), while renter-occupied units make up 655 (16.4%).
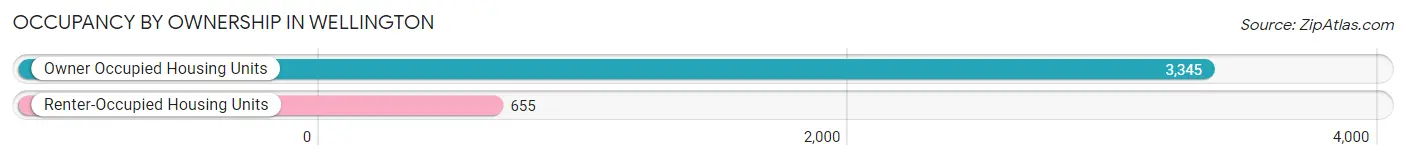
| Occupancy | # Housing Units | % Housing Units |
| Owner Occupied Housing Units | 3,345 | 83.6% |
| Renter-Occupied Housing Units | 655 | 16.4% |
| Total Occupied Housing Units | 4,000 | 100.0% |
Occupancy by Household Size in Wellington
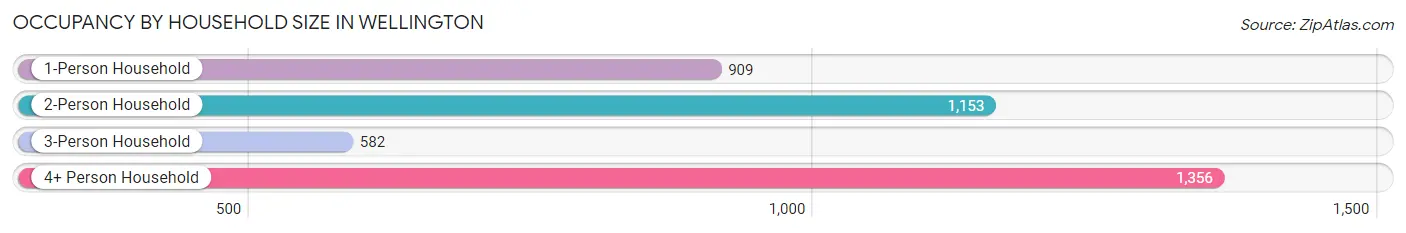
| Household Size | # Housing Units | % Housing Units |
| 1-Person Household | 909 | 22.7% |
| 2-Person Household | 1,153 | 28.8% |
| 3-Person Household | 582 | 14.5% |
| 4+ Person Household | 1,356 | 33.9% |
| Total Housing Units | 4,000 | 100.0% |
Occupancy by Ownership by Household Size in Wellington
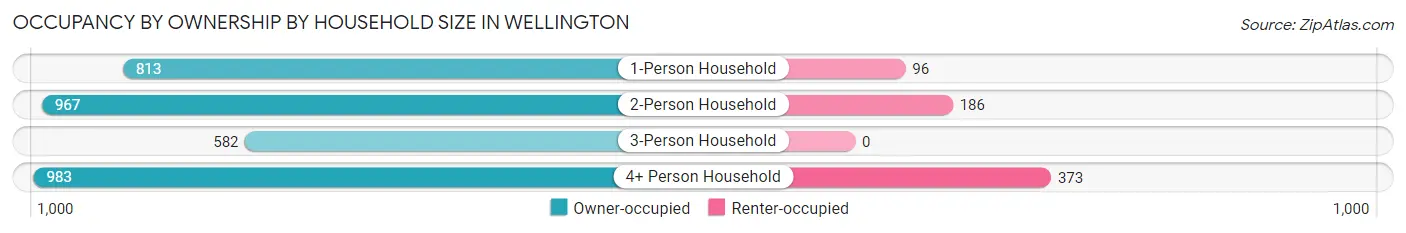
| Household Size | Owner-occupied | Renter-occupied |
| 1-Person Household | 813 (89.4%) | 96 (10.6%) |
| 2-Person Household | 967 (83.9%) | 186 (16.1%) |
| 3-Person Household | 582 (100.0%) | 0 (0.0%) |
| 4+ Person Household | 983 (72.5%) | 373 (27.5%) |
| Total Housing Units | 3,345 (83.6%) | 655 (16.4%) |
Occupancy by Educational Attainment in Wellington
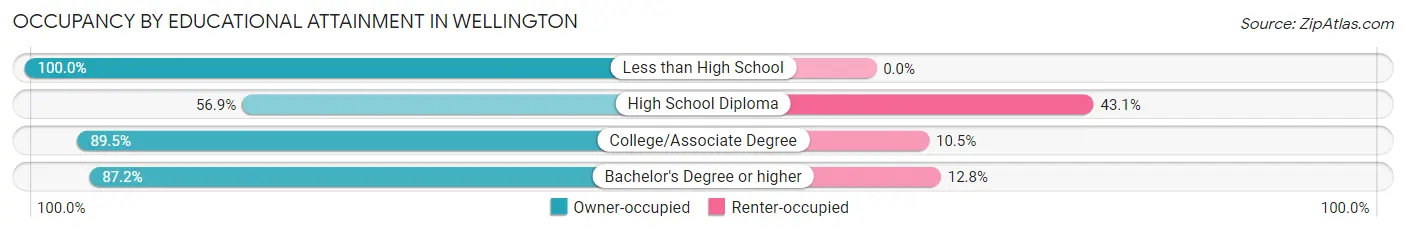
| Household Size | Owner-occupied | Renter-occupied |
| Less than High School | 149 (100.0%) | 0 (0.0%) |
| High School Diploma | 367 (56.9%) | 278 (43.1%) |
| College/Associate Degree | 1,306 (89.5%) | 153 (10.5%) |
| Bachelor's Degree or higher | 1,523 (87.2%) | 224 (12.8%) |
Occupancy by Age of Householder in Wellington
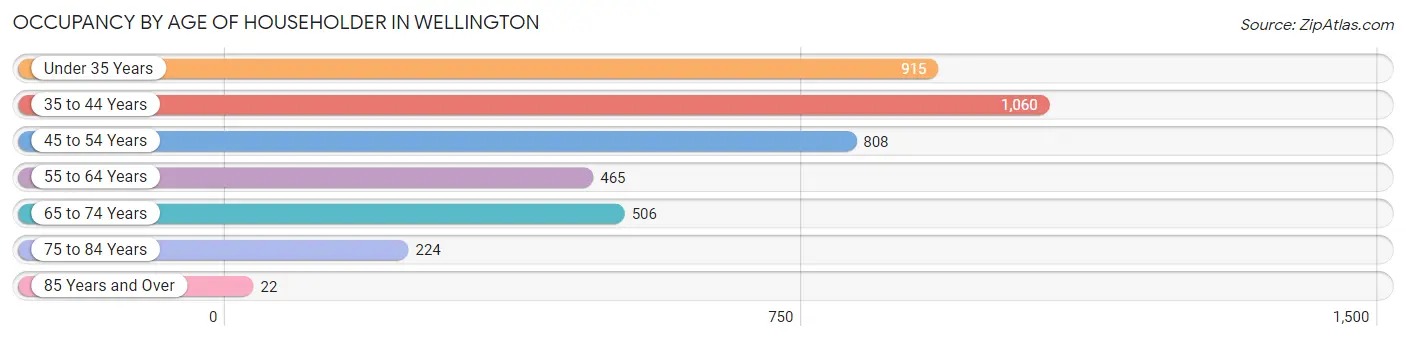
| Age Bracket | # Households | % Households |
| Under 35 Years | 915 | 22.9% |
| 35 to 44 Years | 1,060 | 26.5% |
| 45 to 54 Years | 808 | 20.2% |
| 55 to 64 Years | 465 | 11.6% |
| 65 to 74 Years | 506 | 12.7% |
| 75 to 84 Years | 224 | 5.6% |
| 85 Years and Over | 22 | 0.5% |
| Total | 4,000 | 100.0% |
Housing Finances in Wellington
Median Income by Occupancy in Wellington
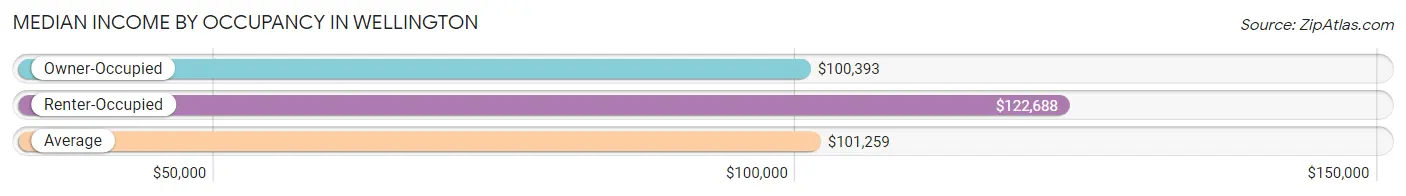
| Occupancy Type | # Households | Median Income |
| Owner-Occupied | 3,345 (83.6%) | $100,393 |
| Renter-Occupied | 655 (16.4%) | $122,688 |
| Average | 4,000 (100.0%) | $101,259 |
Occupancy by Householder Income Bracket in Wellington
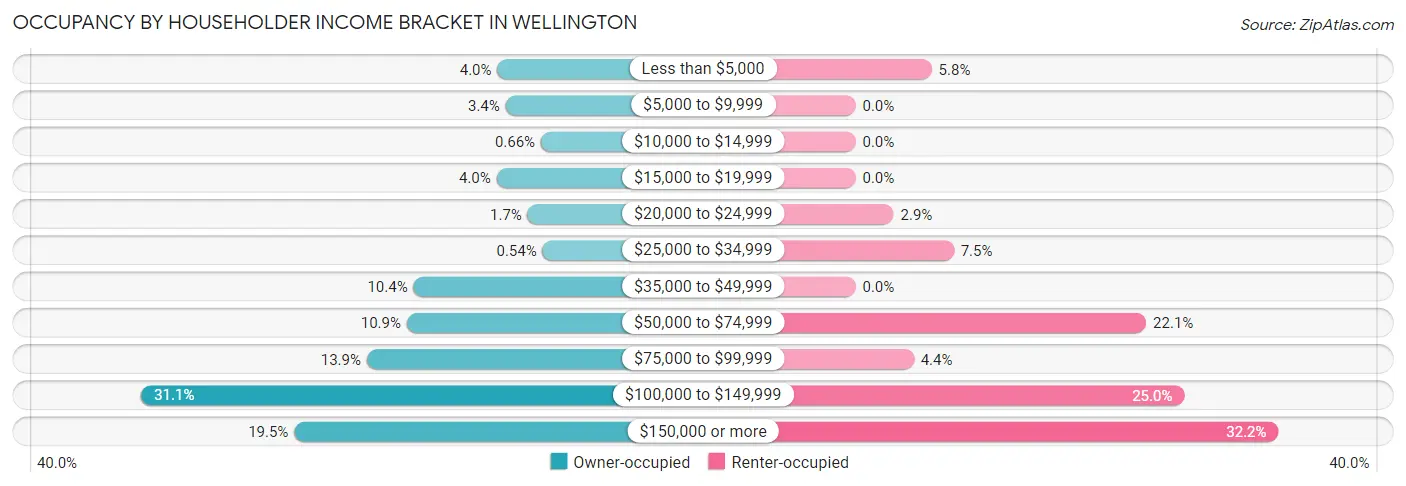
| Income Bracket | Owner-occupied | Renter-occupied |
| Less than $5,000 | 133 (4.0%) | 38 (5.8%) |
| $5,000 to $9,999 | 112 (3.4%) | 0 (0.0%) |
| $10,000 to $14,999 | 22 (0.7%) | 0 (0.0%) |
| $15,000 to $19,999 | 135 (4.0%) | 0 (0.0%) |
| $20,000 to $24,999 | 56 (1.7%) | 19 (2.9%) |
| $25,000 to $34,999 | 18 (0.5%) | 49 (7.5%) |
| $35,000 to $49,999 | 347 (10.4%) | 0 (0.0%) |
| $50,000 to $74,999 | 364 (10.9%) | 145 (22.1%) |
| $75,000 to $99,999 | 466 (13.9%) | 29 (4.4%) |
| $100,000 to $149,999 | 1,041 (31.1%) | 164 (25.0%) |
| $150,000 or more | 651 (19.5%) | 211 (32.2%) |
| Total | 3,345 (100.0%) | 655 (100.0%) |
Monthly Housing Cost Tiers in Wellington
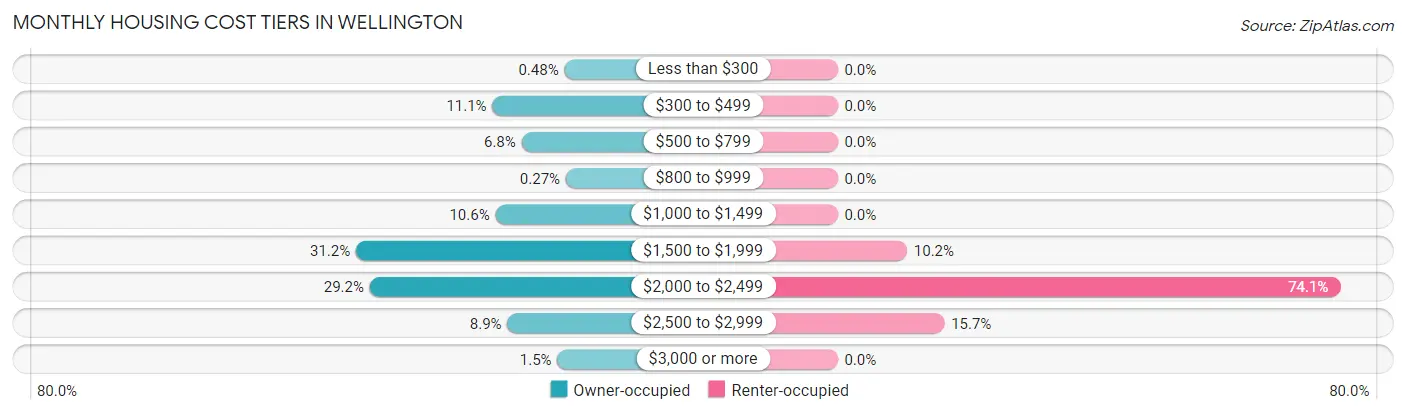
| Monthly Cost | Owner-occupied | Renter-occupied |
| Less than $300 | 16 (0.5%) | 0 (0.0%) |
| $300 to $499 | 371 (11.1%) | 0 (0.0%) |
| $500 to $799 | 227 (6.8%) | 0 (0.0%) |
| $800 to $999 | 9 (0.3%) | 0 (0.0%) |
| $1,000 to $1,499 | 356 (10.6%) | 0 (0.0%) |
| $1,500 to $1,999 | 1,043 (31.2%) | 67 (10.2%) |
| $2,000 to $2,499 | 975 (29.1%) | 485 (74.1%) |
| $2,500 to $2,999 | 297 (8.9%) | 103 (15.7%) |
| $3,000 or more | 51 (1.5%) | 0 (0.0%) |
| Total | 3,345 (100.0%) | 655 (100.0%) |
Physical Housing Characteristics in Wellington
Housing Structures in Wellington
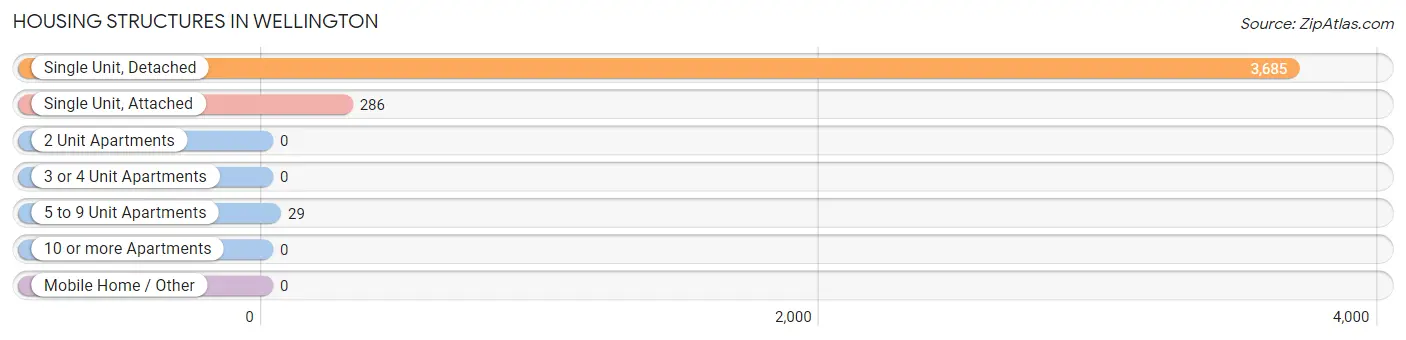
| Structure Type | # Housing Units | % Housing Units |
| Single Unit, Detached | 3,685 | 92.1% |
| Single Unit, Attached | 286 | 7.1% |
| 2 Unit Apartments | 0 | 0.0% |
| 3 or 4 Unit Apartments | 0 | 0.0% |
| 5 to 9 Unit Apartments | 29 | 0.7% |
| 10 or more Apartments | 0 | 0.0% |
| Mobile Home / Other | 0 | 0.0% |
| Total | 4,000 | 100.0% |
Housing Structures by Occupancy in Wellington
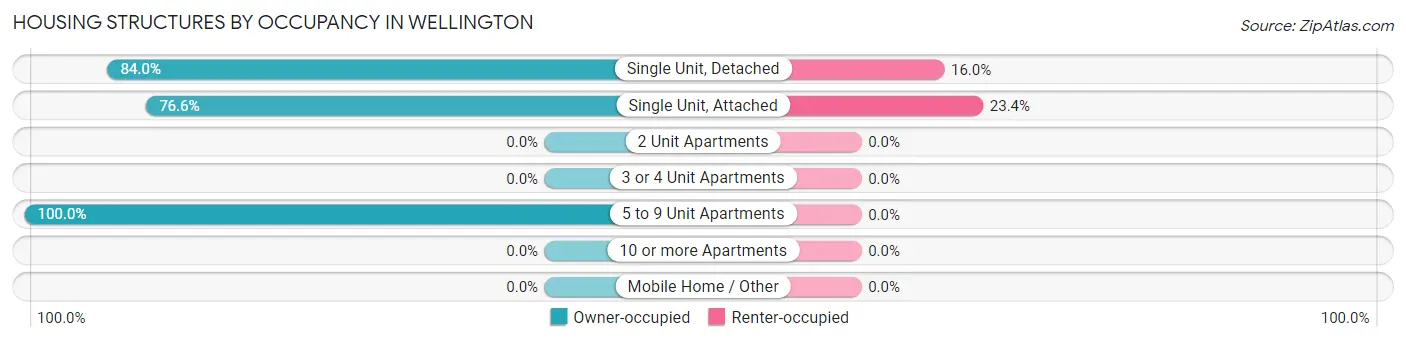
| Structure Type | Owner-occupied | Renter-occupied |
| Single Unit, Detached | 3,097 (84.0%) | 588 (16.0%) |
| Single Unit, Attached | 219 (76.6%) | 67 (23.4%) |
| 2 Unit Apartments | 0 (0.0%) | 0 (0.0%) |
| 3 or 4 Unit Apartments | 0 (0.0%) | 0 (0.0%) |
| 5 to 9 Unit Apartments | 29 (100.0%) | 0 (0.0%) |
| 10 or more Apartments | 0 (0.0%) | 0 (0.0%) |
| Mobile Home / Other | 0 (0.0%) | 0 (0.0%) |
| Total | 3,345 (83.6%) | 655 (16.4%) |
Housing Structures by Number of Rooms in Wellington
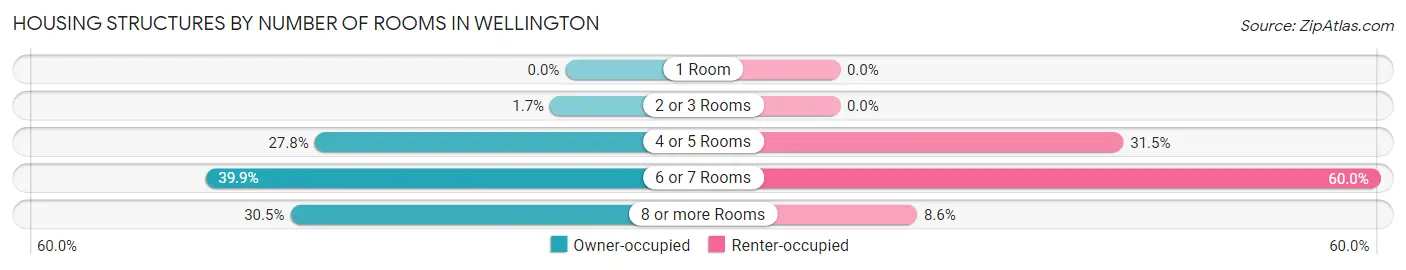
| Number of Rooms | Owner-occupied | Renter-occupied |
| 1 Room | 0 (0.0%) | 0 (0.0%) |
| 2 or 3 Rooms | 57 (1.7%) | 0 (0.0%) |
| 4 or 5 Rooms | 931 (27.8%) | 206 (31.5%) |
| 6 or 7 Rooms | 1,336 (39.9%) | 393 (60.0%) |
| 8 or more Rooms | 1,021 (30.5%) | 56 (8.6%) |
| Total | 3,345 (100.0%) | 655 (100.0%) |
Housing Structure by Heating Type in Wellington
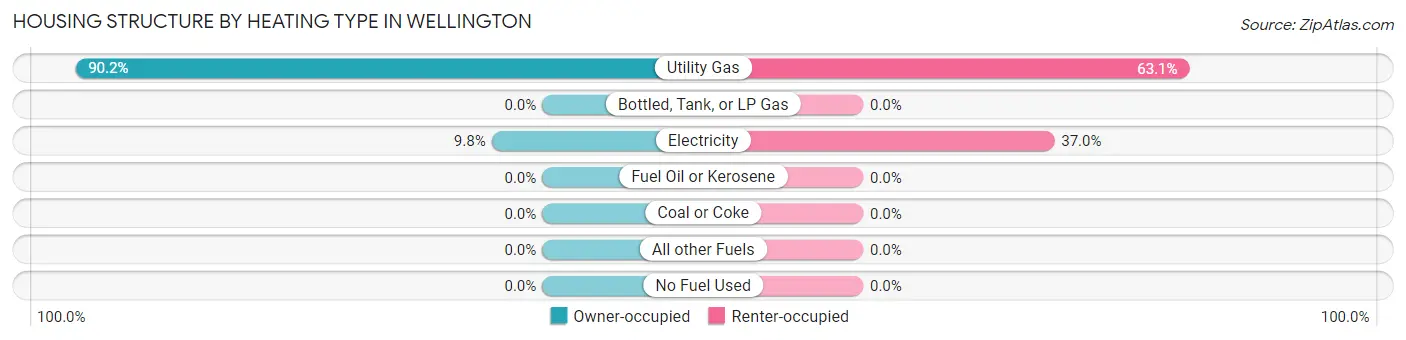
| Heating Type | Owner-occupied | Renter-occupied |
| Utility Gas | 3,018 (90.2%) | 413 (63.0%) |
| Bottled, Tank, or LP Gas | 0 (0.0%) | 0 (0.0%) |
| Electricity | 327 (9.8%) | 242 (36.9%) |
| Fuel Oil or Kerosene | 0 (0.0%) | 0 (0.0%) |
| Coal or Coke | 0 (0.0%) | 0 (0.0%) |
| All other Fuels | 0 (0.0%) | 0 (0.0%) |
| No Fuel Used | 0 (0.0%) | 0 (0.0%) |
| Total | 3,345 (100.0%) | 655 (100.0%) |
Household Vehicle Usage in Wellington
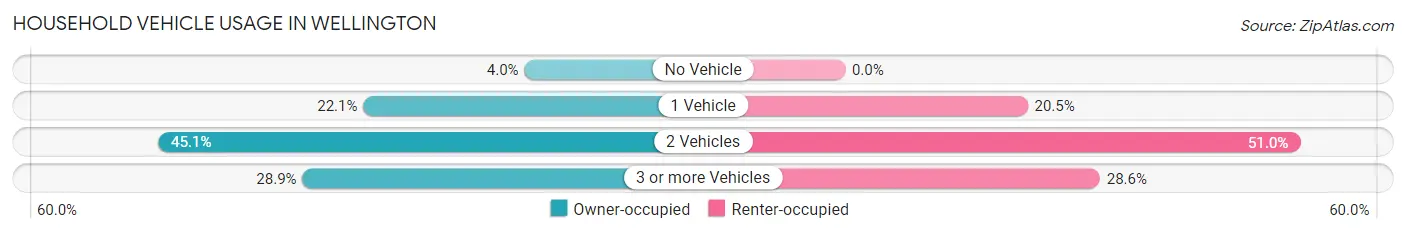
| Vehicles per Household | Owner-occupied | Renter-occupied |
| No Vehicle | 134 (4.0%) | 0 (0.0%) |
| 1 Vehicle | 738 (22.1%) | 134 (20.5%) |
| 2 Vehicles | 1,507 (45.1%) | 334 (51.0%) |
| 3 or more Vehicles | 966 (28.9%) | 187 (28.5%) |
| Total | 3,345 (100.0%) | 655 (100.0%) |
Real Estate & Mortgages in Wellington
Real Estate and Mortgage Overview in Wellington
| Characteristic | Without Mortgage | With Mortgage |
| Housing Units | 523 | 2,822 |
| Median Property Value | $423,300 | $412,500 |
| Median Household Income | - | - |
| Monthly Housing Costs | $488 | $51 |
| Real Estate Taxes | $2,254 | $0 |
Property Value by Mortgage Status in Wellington
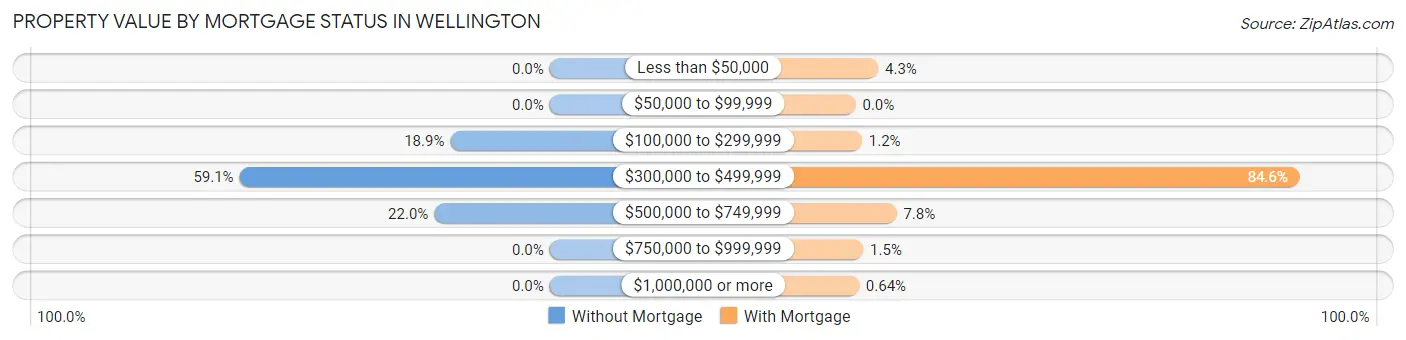
| Property Value | Without Mortgage | With Mortgage |
| Less than $50,000 | 0 (0.0%) | 121 (4.3%) |
| $50,000 to $99,999 | 0 (0.0%) | 0 (0.0%) |
| $100,000 to $299,999 | 99 (18.9%) | 34 (1.2%) |
| $300,000 to $499,999 | 309 (59.1%) | 2,388 (84.6%) |
| $500,000 to $749,999 | 115 (22.0%) | 220 (7.8%) |
| $750,000 to $999,999 | 0 (0.0%) | 41 (1.5%) |
| $1,000,000 or more | 0 (0.0%) | 18 (0.6%) |
| Total | 523 (100.0%) | 2,822 (100.0%) |
Household Income by Mortgage Status in Wellington
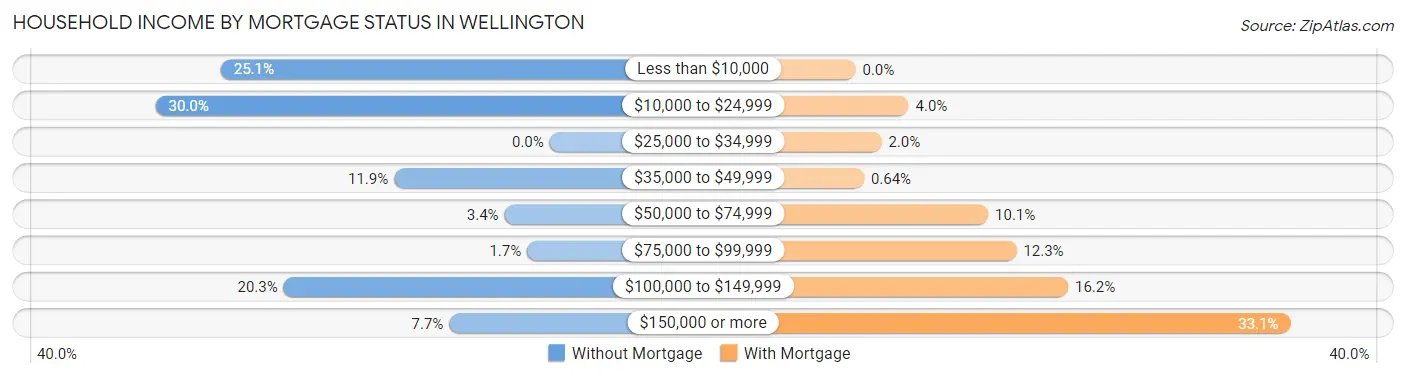
| Household Income | Without Mortgage | With Mortgage |
| Less than $10,000 | 131 (25.1%) | 0 (0.0%) |
| $10,000 to $24,999 | 157 (30.0%) | 114 (4.0%) |
| $25,000 to $34,999 | 0 (0.0%) | 56 (2.0%) |
| $35,000 to $49,999 | 62 (11.8%) | 18 (0.6%) |
| $50,000 to $74,999 | 18 (3.4%) | 285 (10.1%) |
| $75,000 to $99,999 | 9 (1.7%) | 346 (12.3%) |
| $100,000 to $149,999 | 106 (20.3%) | 457 (16.2%) |
| $150,000 or more | 40 (7.6%) | 935 (33.1%) |
| Total | 523 (100.0%) | 2,822 (100.0%) |
Property Value to Household Income Ratio in Wellington
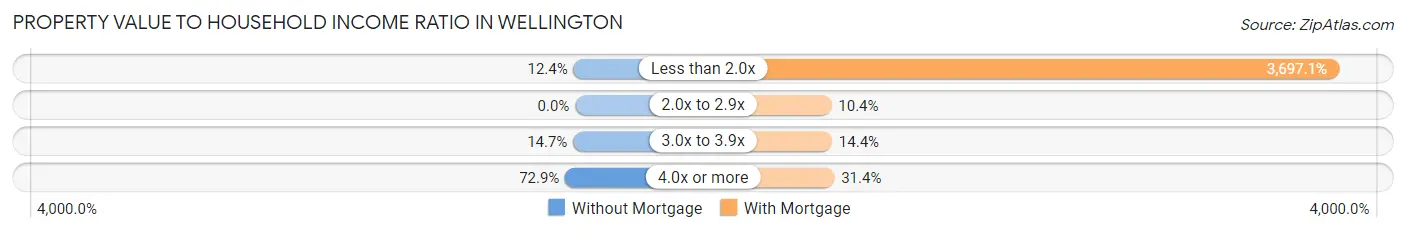
| Value-to-Income Ratio | Without Mortgage | With Mortgage |
| Less than 2.0x | 65 (12.4%) | 104,333 (3,697.1%) |
| 2.0x to 2.9x | 0 (0.0%) | 293 (10.4%) |
| 3.0x to 3.9x | 77 (14.7%) | 405 (14.3%) |
| 4.0x or more | 381 (72.9%) | 885 (31.4%) |
| Total | 523 (100.0%) | 2,822 (100.0%) |
Real Estate Taxes by Mortgage Status in Wellington
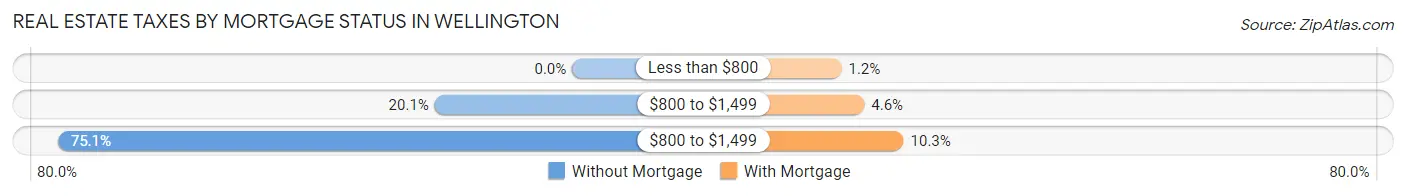
| Property Taxes | Without Mortgage | With Mortgage |
| Less than $800 | 0 (0.0%) | 35 (1.2%) |
| $800 to $1,499 | 105 (20.1%) | 129 (4.6%) |
| $800 to $1,499 | 393 (75.1%) | 291 (10.3%) |
| Total | 523 (100.0%) | 2,822 (100.0%) |
Health & Disability in Wellington
Health Insurance Coverage by Age in Wellington
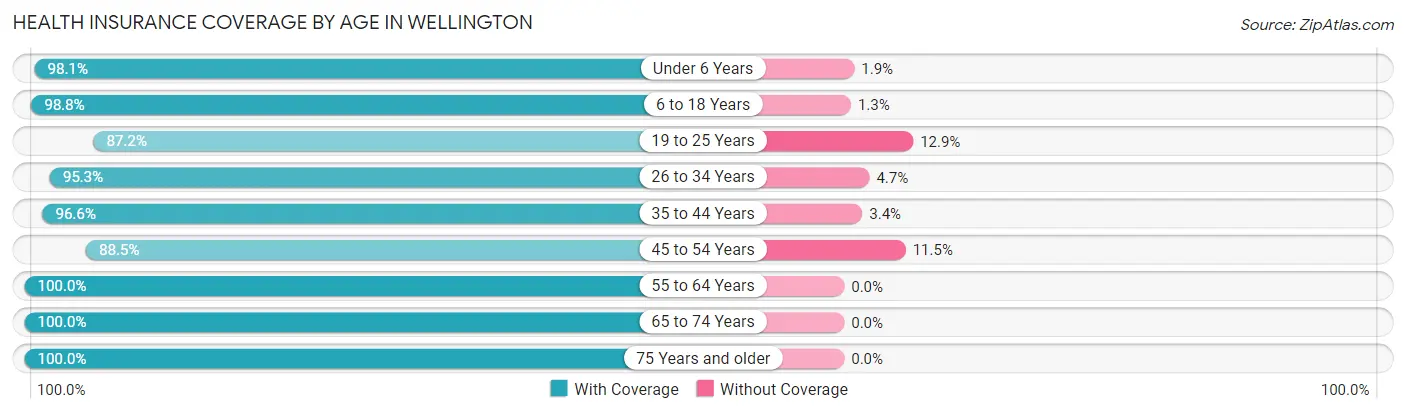
| Age Bracket | With Coverage | Without Coverage |
| Under 6 Years | 1,261 (98.1%) | 24 (1.9%) |
| 6 to 18 Years | 2,126 (98.8%) | 27 (1.3%) |
| 19 to 25 Years | 678 (87.2%) | 100 (12.9%) |
| 26 to 34 Years | 1,563 (95.3%) | 77 (4.7%) |
| 35 to 44 Years | 2,100 (96.6%) | 73 (3.4%) |
| 45 to 54 Years | 1,144 (88.5%) | 148 (11.5%) |
| 55 to 64 Years | 781 (100.0%) | 0 (0.0%) |
| 65 to 74 Years | 760 (100.0%) | 0 (0.0%) |
| 75 Years and older | 301 (100.0%) | 0 (0.0%) |
| Total | 10,714 (96.0%) | 449 (4.0%) |
Health Insurance Coverage by Citizenship Status in Wellington
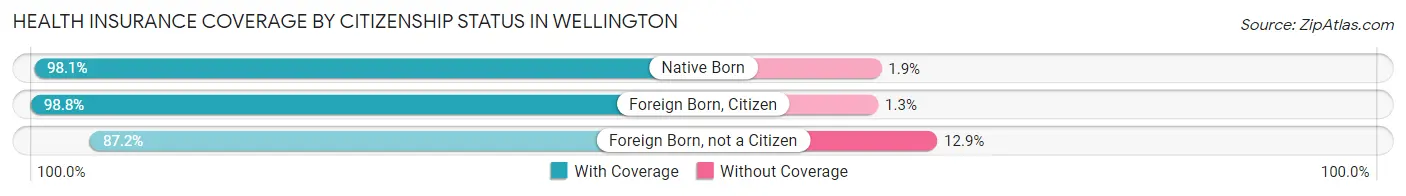
| Citizenship Status | With Coverage | Without Coverage |
| Native Born | 1,261 (98.1%) | 24 (1.9%) |
| Foreign Born, Citizen | 2,126 (98.8%) | 27 (1.3%) |
| Foreign Born, not a Citizen | 678 (87.2%) | 100 (12.9%) |
Health Insurance Coverage by Household Income in Wellington
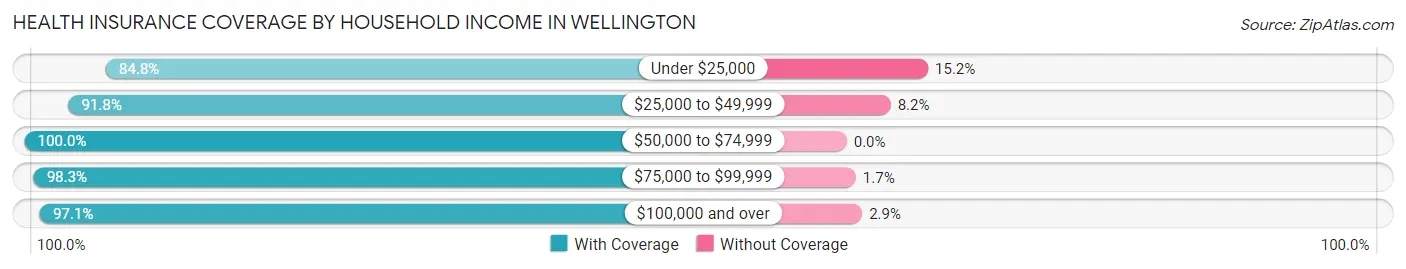
| Household Income | With Coverage | Without Coverage |
| Under $25,000 | 879 (84.8%) | 158 (15.2%) |
| $25,000 to $49,999 | 848 (91.8%) | 76 (8.2%) |
| $50,000 to $74,999 | 1,248 (100.0%) | 0 (0.0%) |
| $75,000 to $99,999 | 1,263 (98.3%) | 22 (1.7%) |
| $100,000 and over | 6,475 (97.1%) | 193 (2.9%) |
Public vs Private Health Insurance Coverage by Age in Wellington
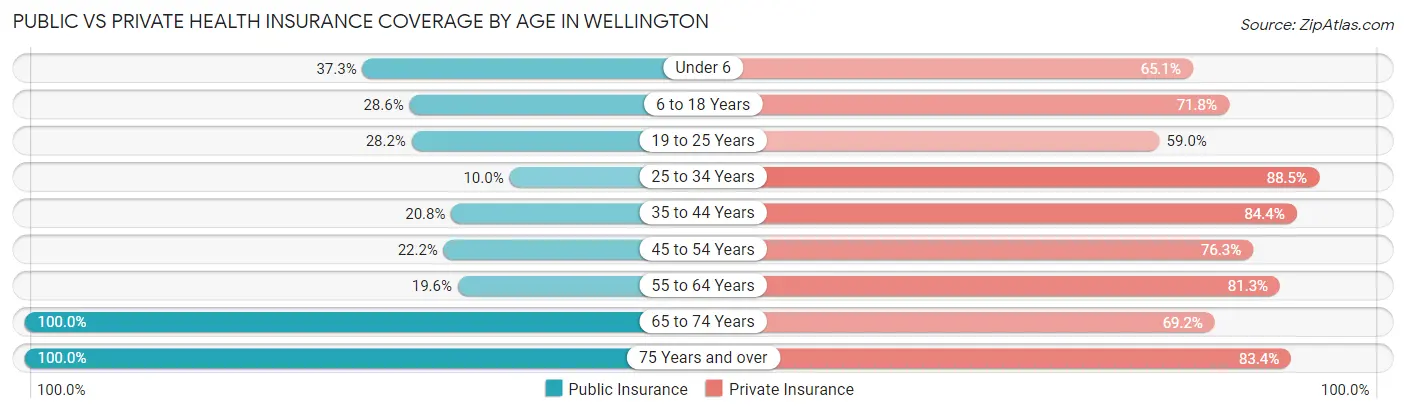
| Age Bracket | Public Insurance | Private Insurance |
| Under 6 | 479 (37.3%) | 837 (65.1%) |
| 6 to 18 Years | 615 (28.6%) | 1,546 (71.8%) |
| 19 to 25 Years | 219 (28.1%) | 459 (59.0%) |
| 25 to 34 Years | 164 (10.0%) | 1,452 (88.5%) |
| 35 to 44 Years | 452 (20.8%) | 1,834 (84.4%) |
| 45 to 54 Years | 287 (22.2%) | 986 (76.3%) |
| 55 to 64 Years | 153 (19.6%) | 635 (81.3%) |
| 65 to 74 Years | 760 (100.0%) | 526 (69.2%) |
| 75 Years and over | 301 (100.0%) | 251 (83.4%) |
| Total | 3,430 (30.7%) | 8,526 (76.4%) |
Disability Status by Sex by Age in Wellington
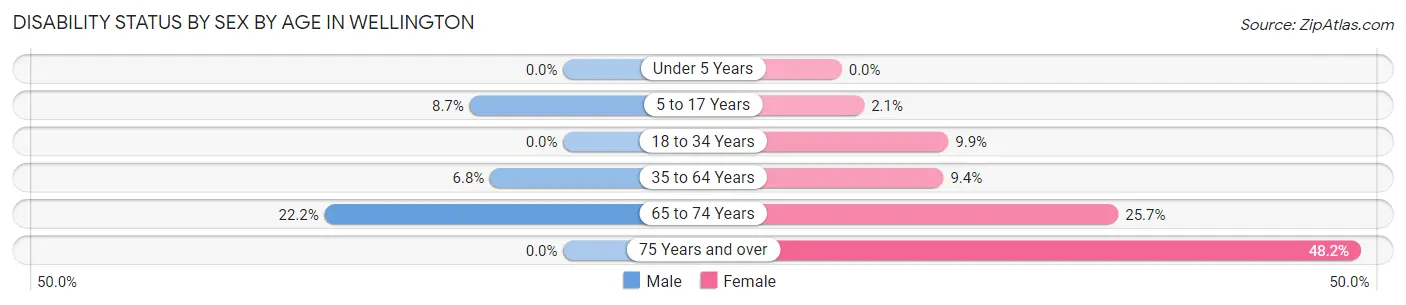
| Age Bracket | Male | Female |
| Under 5 Years | 0 (0.0%) | 0 (0.0%) |
| 5 to 17 Years | 98 (8.7%) | 23 (2.1%) |
| 18 to 34 Years | 0 (0.0%) | 120 (9.9%) |
| 35 to 64 Years | 151 (6.8%) | 191 (9.4%) |
| 65 to 74 Years | 76 (22.2%) | 107 (25.7%) |
| 75 Years and over | 0 (0.0%) | 106 (48.2%) |
Disability Class by Sex by Age in Wellington
Disability Class: Hearing Difficulty
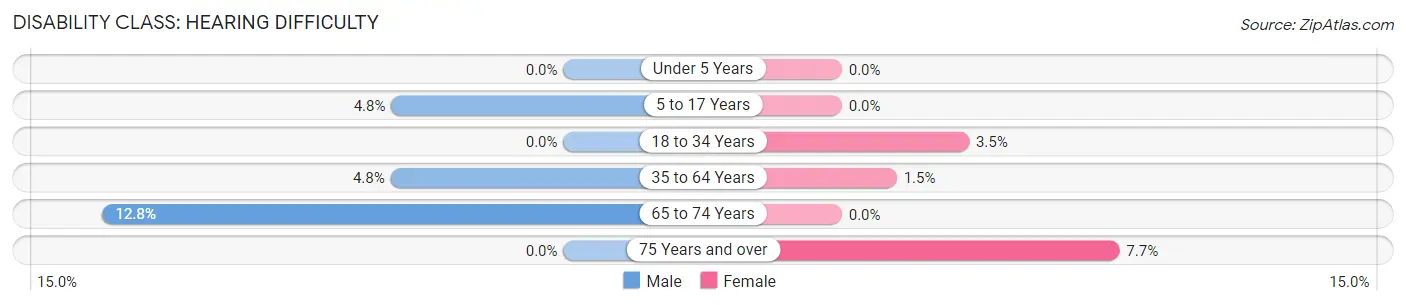
| Age Bracket | Male | Female |
| Under 5 Years | 0 (0.0%) | 0 (0.0%) |
| 5 to 17 Years | 54 (4.8%) | 0 (0.0%) |
| 18 to 34 Years | 0 (0.0%) | 43 (3.5%) |
| 35 to 64 Years | 107 (4.8%) | 31 (1.5%) |
| 65 to 74 Years | 44 (12.8%) | 0 (0.0%) |
| 75 Years and over | 0 (0.0%) | 17 (7.7%) |
Disability Class: Vision Difficulty
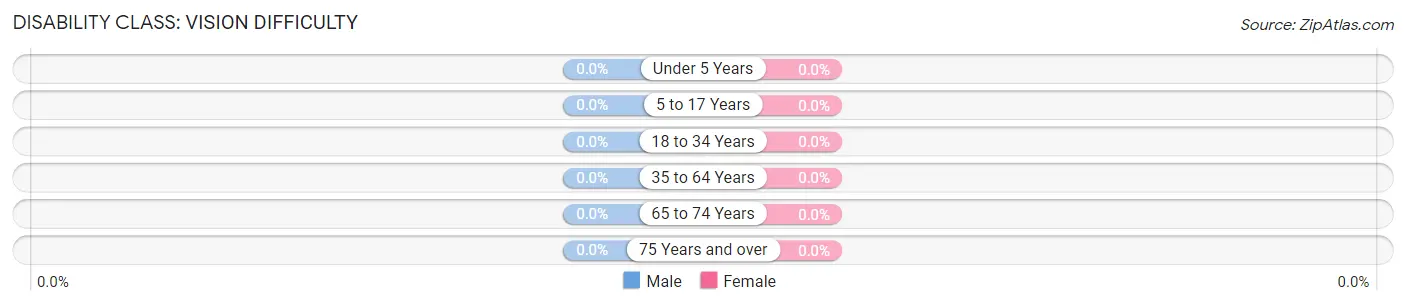
| Age Bracket | Male | Female |
| Under 5 Years | 0 (0.0%) | 0 (0.0%) |
| 5 to 17 Years | 0 (0.0%) | 0 (0.0%) |
| 18 to 34 Years | 0 (0.0%) | 0 (0.0%) |
| 35 to 64 Years | 0 (0.0%) | 0 (0.0%) |
| 65 to 74 Years | 0 (0.0%) | 0 (0.0%) |
| 75 Years and over | 0 (0.0%) | 0 (0.0%) |
Disability Class: Cognitive Difficulty
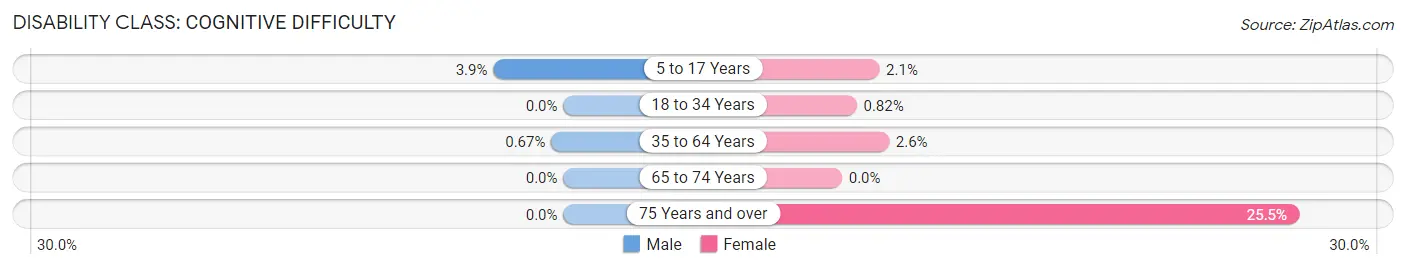
| Age Bracket | Male | Female |
| 5 to 17 Years | 44 (3.9%) | 23 (2.1%) |
| 18 to 34 Years | 0 (0.0%) | 10 (0.8%) |
| 35 to 64 Years | 15 (0.7%) | 53 (2.6%) |
| 65 to 74 Years | 0 (0.0%) | 0 (0.0%) |
| 75 Years and over | 0 (0.0%) | 56 (25.5%) |
Disability Class: Ambulatory Difficulty
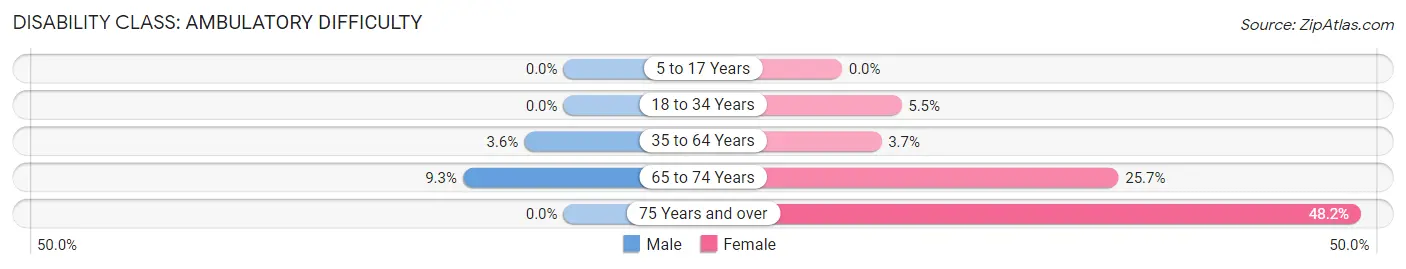
| Age Bracket | Male | Female |
| 5 to 17 Years | 0 (0.0%) | 0 (0.0%) |
| 18 to 34 Years | 0 (0.0%) | 67 (5.5%) |
| 35 to 64 Years | 81 (3.6%) | 74 (3.7%) |
| 65 to 74 Years | 32 (9.3%) | 107 (25.7%) |
| 75 Years and over | 0 (0.0%) | 106 (48.2%) |
Disability Class: Self-Care Difficulty
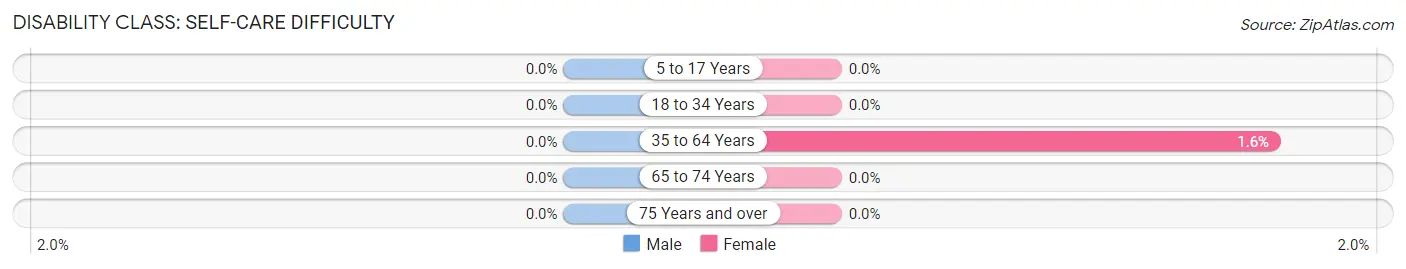
| Age Bracket | Male | Female |
| 5 to 17 Years | 0 (0.0%) | 0 (0.0%) |
| 18 to 34 Years | 0 (0.0%) | 0 (0.0%) |
| 35 to 64 Years | 0 (0.0%) | 33 (1.6%) |
| 65 to 74 Years | 0 (0.0%) | 0 (0.0%) |
| 75 Years and over | 0 (0.0%) | 0 (0.0%) |
Technology Access in Wellington
Computing Device Access in Wellington
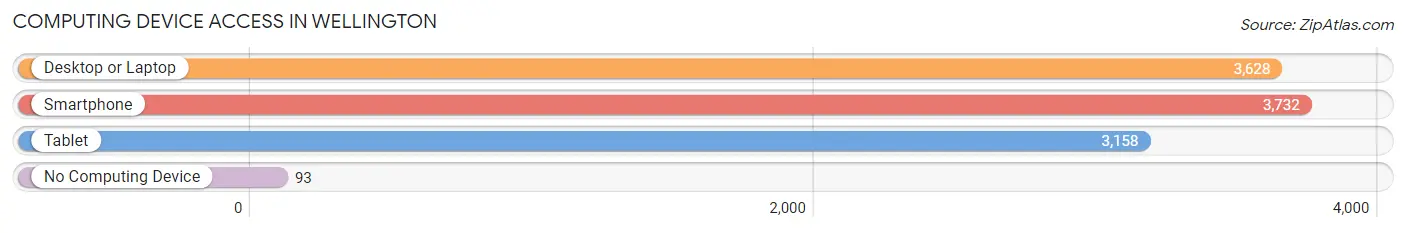
| Device Type | # Households | % Households |
| Desktop or Laptop | 3,628 | 90.7% |
| Smartphone | 3,732 | 93.3% |
| Tablet | 3,158 | 78.9% |
| No Computing Device | 93 | 2.3% |
| Total | 4,000 | 100.0% |
Internet Access in Wellington
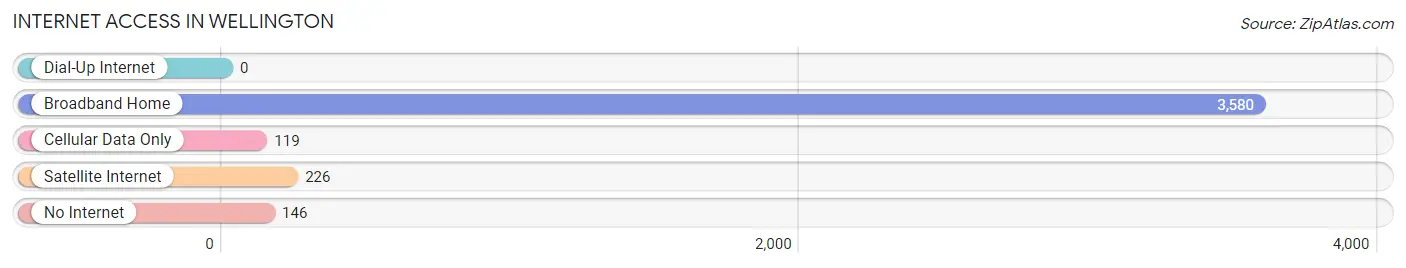
| Internet Type | # Households | % Households |
| Dial-Up Internet | 0 | 0.0% |
| Broadband Home | 3,580 | 89.5% |
| Cellular Data Only | 119 | 3.0% |
| Satellite Internet | 226 | 5.7% |
| No Internet | 146 | 3.6% |
| Total | 4,000 | 100.0% |
Wellington Summary
Wellington is a small town located in Larimer County, Colorado, United States. It is situated in the foothills of the Rocky Mountains, approximately 10 miles north of Fort Collins. The town was founded in 1871 and has a population of approximately 6,000 people.
History
The town of Wellington was founded in 1871 by a group of settlers from the Midwest. The settlers were looking for a place to settle and start a new life. The town was named after Wellington, Ohio, the hometown of one of the settlers. The town was originally a farming community, but soon became a hub for the coal mining industry. The coal mines provided jobs for many of the town's residents and helped to fuel the local economy.
In the early 1900s, the town began to experience a population boom as more people moved to the area. This growth was largely due to the construction of the Denver and Rio Grande Western Railroad, which connected Wellington to the rest of the state. The railroad also helped to bring in new businesses and industries, such as the sugar beet factory, which opened in 1906.
The town continued to grow throughout the 20th century, and by the year 2000, the population had reached 6,000 people.
Geography
Wellington is located in the foothills of the Rocky Mountains, approximately 10 miles north of Fort Collins. The town is situated at an elevation of 5,400 feet above sea level. The town is surrounded by rolling hills and is home to several small lakes and ponds. The Cache la Poudre River runs through the town, providing a source of water for the local residents.
The climate in Wellington is semi-arid, with hot summers and cold winters. The average temperature in the summer is around 80 degrees Fahrenheit, while the average temperature in the winter is around 30 degrees Fahrenheit.
Economy
The economy of Wellington is largely based on agriculture and tourism. The town is home to several farms, which produce a variety of crops, including corn, wheat, and hay. The town is also home to several wineries, which produce a variety of wines.
Tourism is also an important part of the local economy. The town is home to several attractions, such as the Wellington Lake State Park, which offers camping, fishing, and hiking opportunities. The town is also home to several museums, such as the Wellington Historical Museum, which showcases the history of the town.
Demographics
As of the 2010 census, the population of Wellington was 6,289. The racial makeup of the town was 94.3% White, 0.7% African American, 0.3% Native American, 0.7% Asian, 0.1% Pacific Islander, 1.7% from other races, and 2.1% from two or more races. Hispanic or Latino of any race were 5.2% of the population.
The median household income in Wellington was $50,945, and the median family income was $60,917. The per capita income for the town was $25,945. About 8.3% of families and 10.7% of the population were below the poverty line, including 14.2% of those under age 18 and 6.2% of those age 65 or over.
Common Questions
What is Per Capita Income in Wellington?
Per Capita income in Wellington is $39,532.
What is the Median Family Income in Wellington?
Median Family Income in Wellington is $112,478.
What is the Median Household income in Wellington?
Median Household Income in Wellington is $101,259.
What is Income or Wage Gap in Wellington?
Income or Wage Gap in Wellington is 30.7%.
Women in Wellington earn 69.3 cents for every dollar earned by a man.
What is Inequality or Gini Index in Wellington?
Inequality or Gini Index in Wellington is 0.40.
What is the Total Population of Wellington?
Total Population of Wellington is 11,163.
What is the Total Male Population of Wellington?
Total Male Population of Wellington is 5,589.
What is the Total Female Population of Wellington?
Total Female Population of Wellington is 5,574.
What is the Ratio of Males per 100 Females in Wellington?
There are 100.27 Males per 100 Females in Wellington.
What is the Ratio of Females per 100 Males in Wellington?
There are 99.73 Females per 100 Males in Wellington.
What is the Median Population Age in Wellington?
Median Population Age in Wellington is 32.4 Years.
What is the Average Family Size in Wellington
Average Family Size in Wellington is 3.4 People.
What is the Average Household Size in Wellington
Average Household Size in Wellington is 2.8 People.
How Large is the Labor Force in Wellington?
There are 5,721 People in the Labor Forcein in Wellington.
What is the Percentage of People in the Labor Force in Wellington?
71.8% of People are in the Labor Force in Wellington.
What is the Unemployment Rate in Wellington?
Unemployment Rate in Wellington is 7.7%.