Manitou Springs, CO Map & Demographics
Manitou Springs Map
Manitou Springs Overview
$55,929
PER CAPITA INCOME
$138,264
AVG FAMILY INCOME
$72,775
AVG HOUSEHOLD INCOME
3.2%
WAGE / INCOME GAP [ % ]
96.8¢/ $1
WAGE / INCOME GAP [ $ ]
0.51
INEQUALITY / GINI INDEX
4,848
TOTAL POPULATION
2,710
MALE POPULATION
2,138
FEMALE POPULATION
126.75
MALES / 100 FEMALES
78.89
FEMALES / 100 MALES
44.1
MEDIAN AGE
2.9
AVG FAMILY SIZE
2.0
AVG HOUSEHOLD SIZE
3,136
LABOR FORCE [ PEOPLE ]
73.8%
PERCENT IN LABOR FORCE
11.8%
UNEMPLOYMENT RATE
Manitou Springs Zip Codes
Manitou Springs Area Codes
Income in Manitou Springs
Income Overview in Manitou Springs
Per Capita Income in Manitou Springs is $55,929, while median incomes of families and households are $138,264 and $72,775 respectively.
| Characteristic | Number | Measure |
| Per Capita Income | 4,848 | $55,929 |
| Median Family Income | 1,159 | $138,264 |
| Mean Family Income | 1,159 | $166,292 |
| Median Household Income | 2,349 | $72,775 |
| Mean Household Income | 2,349 | $113,214 |
| Income Deficit | 1,159 | $0 |
| Wage / Income Gap (%) | 4,848 | 3.23% |
| Wage / Income Gap ($) | 4,848 | 96.77¢ per $1 |
| Gini / Inequality Index | 4,848 | 0.51 |
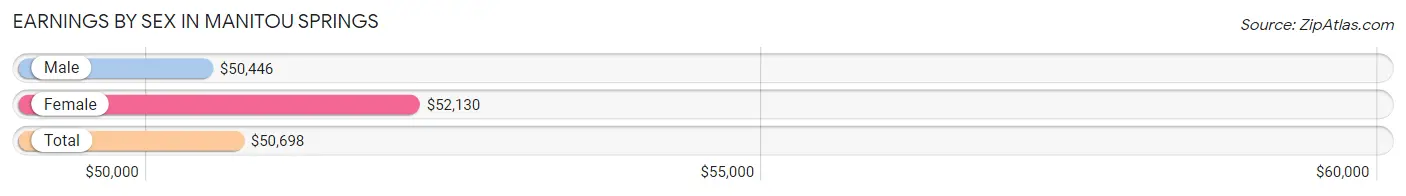
Earnings by Sex in Manitou Springs
Average Earnings in Manitou Springs are $50,698, $50,446 for men and $52,130 for women, a difference of 3.2%.
| Sex | Number | Average Earnings |
| Male | 1,785 (59.1%) | $50,446 |
| Female | 1,238 (40.9%) | $52,130 |
| Total | 3,023 (100.0%) | $50,698 |
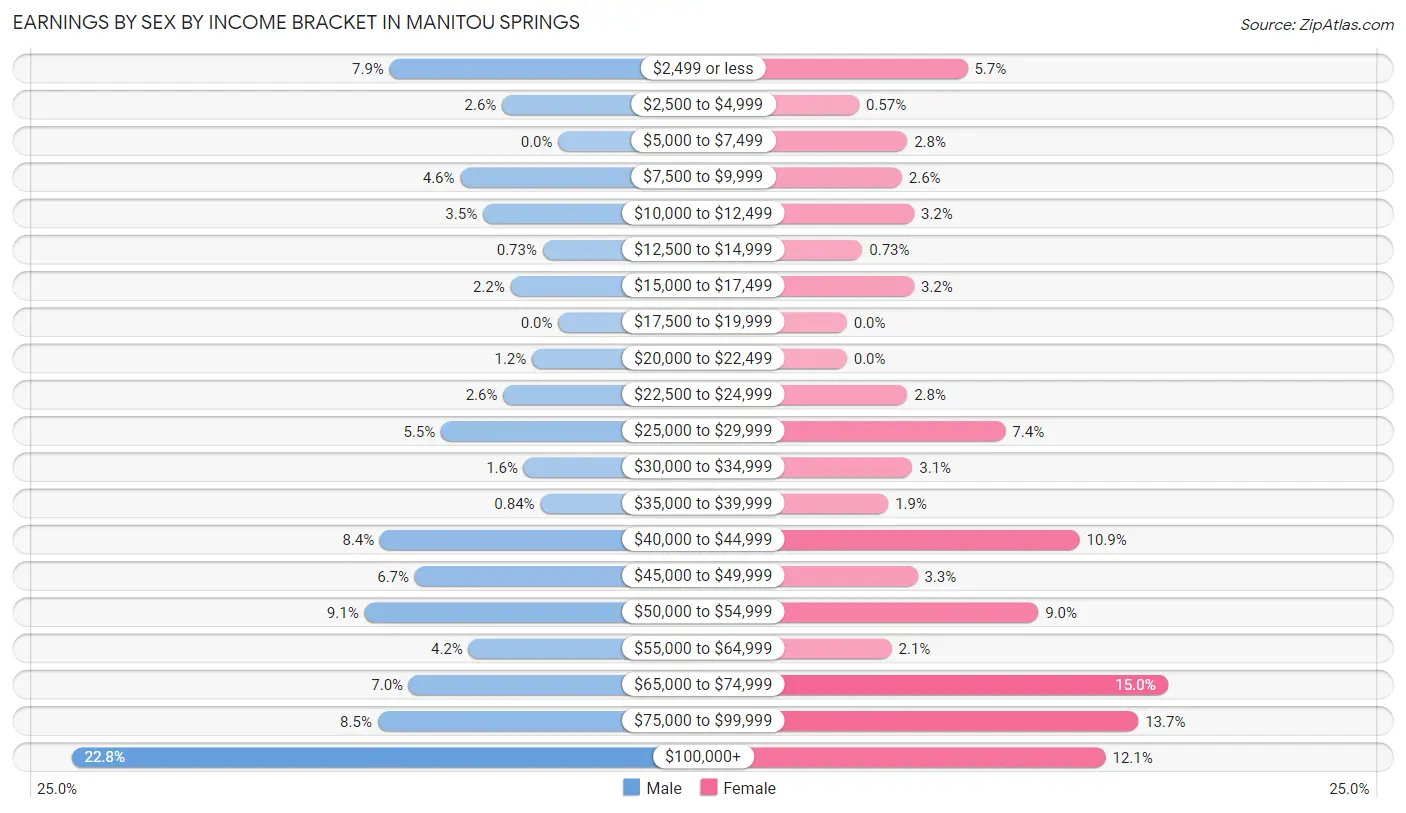
Earnings by Sex by Income Bracket in Manitou Springs
The most common earnings brackets in Manitou Springs are $100,000+ for men (407 | 22.8%) and $65,000 to $74,999 for women (186 | 15.0%).
| Income | Male | Female |
| $2,499 or less | 141 (7.9%) | 70 (5.7%) |
| $2,500 to $4,999 | 47 (2.6%) | 7 (0.6%) |
| $5,000 to $7,499 | 0 (0.0%) | 35 (2.8%) |
| $7,500 to $9,999 | 82 (4.6%) | 32 (2.6%) |
| $10,000 to $12,499 | 63 (3.5%) | 39 (3.2%) |
| $12,500 to $14,999 | 13 (0.7%) | 9 (0.7%) |
| $15,000 to $17,499 | 40 (2.2%) | 39 (3.2%) |
| $17,500 to $19,999 | 0 (0.0%) | 0 (0.0%) |
| $20,000 to $22,499 | 22 (1.2%) | 0 (0.0%) |
| $22,500 to $24,999 | 46 (2.6%) | 35 (2.8%) |
| $25,000 to $29,999 | 98 (5.5%) | 92 (7.4%) |
| $30,000 to $34,999 | 29 (1.6%) | 38 (3.1%) |
| $35,000 to $39,999 | 15 (0.8%) | 24 (1.9%) |
| $40,000 to $44,999 | 149 (8.4%) | 135 (10.9%) |
| $45,000 to $49,999 | 120 (6.7%) | 41 (3.3%) |
| $50,000 to $54,999 | 162 (9.1%) | 111 (9.0%) |
| $55,000 to $64,999 | 75 (4.2%) | 26 (2.1%) |
| $65,000 to $74,999 | 125 (7.0%) | 186 (15.0%) |
| $75,000 to $99,999 | 151 (8.5%) | 169 (13.7%) |
| $100,000+ | 407 (22.8%) | 150 (12.1%) |
| Total | 1,785 (100.0%) | 1,238 (100.0%) |
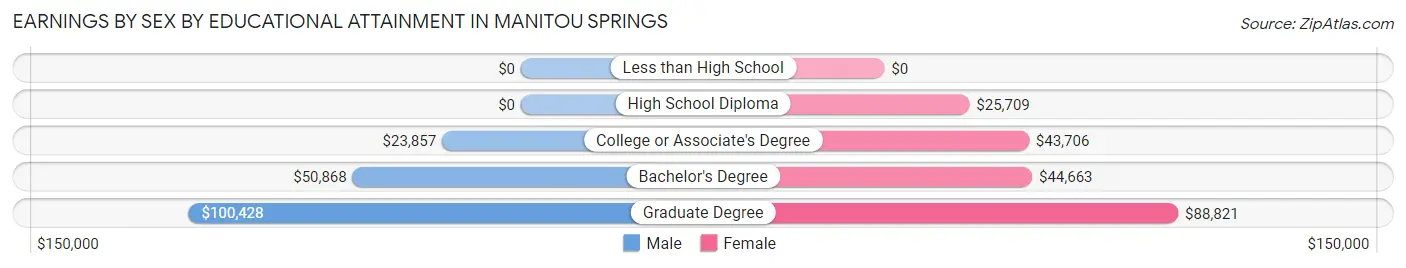
Earnings by Sex by Educational Attainment in Manitou Springs
Average earnings in Manitou Springs are $55,658 for men and $53,393 for women, a difference of 4.1%. Men with an educational attainment of graduate degree enjoy the highest average annual earnings of $100,428, while those with college or associate's degree education earn the least with $23,857. Women with an educational attainment of graduate degree earn the most with the average annual earnings of $88,821, while those with high school diploma education have the smallest earnings of $25,709.
| Educational Attainment | Male Income | Female Income |
| Less than High School | - | - |
| High School Diploma | - | - |
| College or Associate's Degree | $23,857 | $43,706 |
| Bachelor's Degree | $50,868 | $44,663 |
| Graduate Degree | $100,428 | $88,821 |
| Total | $55,658 | $53,393 |
Family Income in Manitou Springs
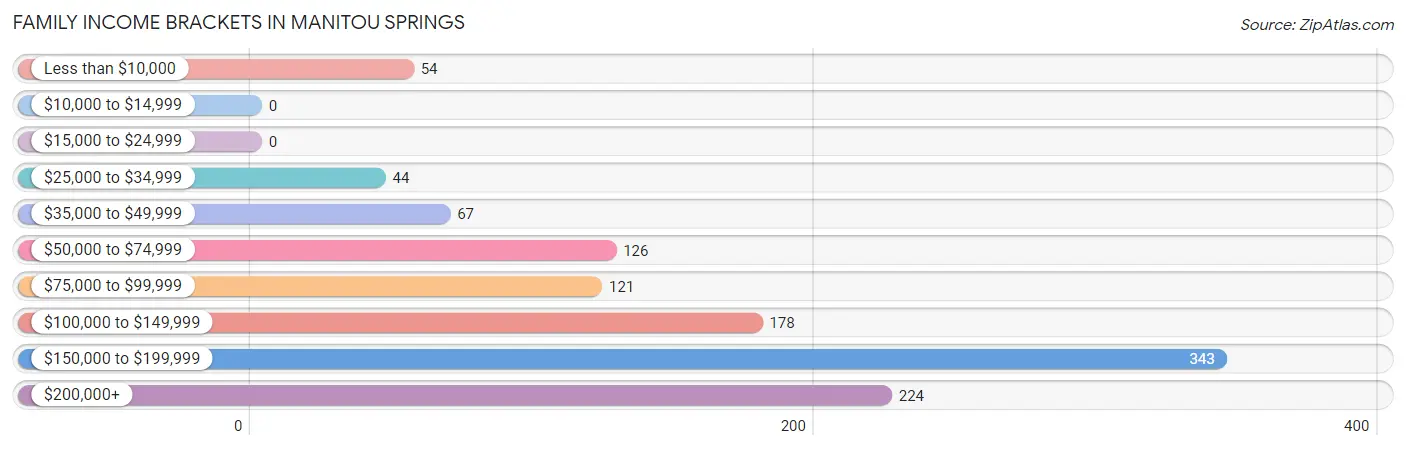
Family Income Brackets in Manitou Springs
According to the Manitou Springs family income data, there are 343 families falling into the $150,000 to $199,999 income range, which is the most common income bracket and makes up 29.6% of all families.
| Income Bracket | # Families | % Families |
| Less than $10,000 | 54 | 4.7% |
| $10,000 to $14,999 | 0 | 0.0% |
| $15,000 to $24,999 | 0 | 0.0% |
| $25,000 to $34,999 | 44 | 3.8% |
| $35,000 to $49,999 | 67 | 5.8% |
| $50,000 to $74,999 | 126 | 10.9% |
| $75,000 to $99,999 | 121 | 10.4% |
| $100,000 to $149,999 | 178 | 15.4% |
| $150,000 to $199,999 | 343 | 29.6% |
| $200,000+ | 224 | 19.3% |
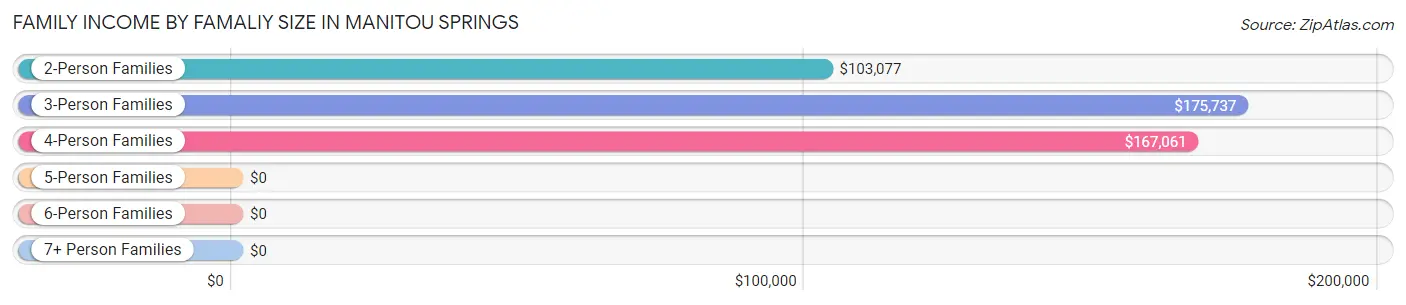
Family Income by Famaliy Size in Manitou Springs
3-person families (181 | 15.6%) account for the highest median family income in Manitou Springs with $175,737 per family, while 3-person families (181 | 15.6%) have the highest median income of $58,579 per family member.
| Income Bracket | # Families | Median Income |
| 2-Person Families | 588 (50.7%) | $103,077 |
| 3-Person Families | 181 (15.6%) | $175,737 |
| 4-Person Families | 353 (30.5%) | $167,061 |
| 5-Person Families | 37 (3.2%) | $0 |
| 6-Person Families | 0 (0.0%) | $0 |
| 7+ Person Families | 0 (0.0%) | $0 |
| Total | 1,159 (100.0%) | $138,264 |
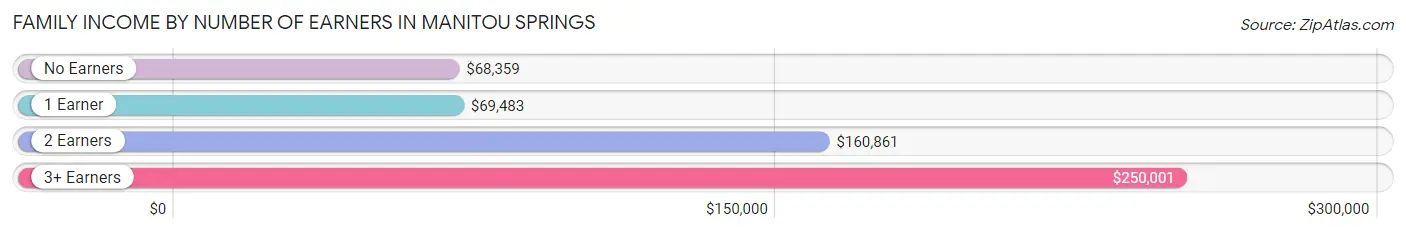
Family Income by Number of Earners in Manitou Springs
The median family income in Manitou Springs is $138,264, with families comprising 3+ earners (117) having the highest median family income of $250,001, while families with no earners (127) have the lowest median family income of $68,359, accounting for 10.1% and 11.0% of families, respectively.
| Number of Earners | # Families | Median Income |
| No Earners | 127 (11.0%) | $68,359 |
| 1 Earner | 260 (22.4%) | $69,483 |
| 2 Earners | 655 (56.5%) | $160,861 |
| 3+ Earners | 117 (10.1%) | $250,001 |
| Total | 1,159 (100.0%) | $138,264 |
Household Income in Manitou Springs
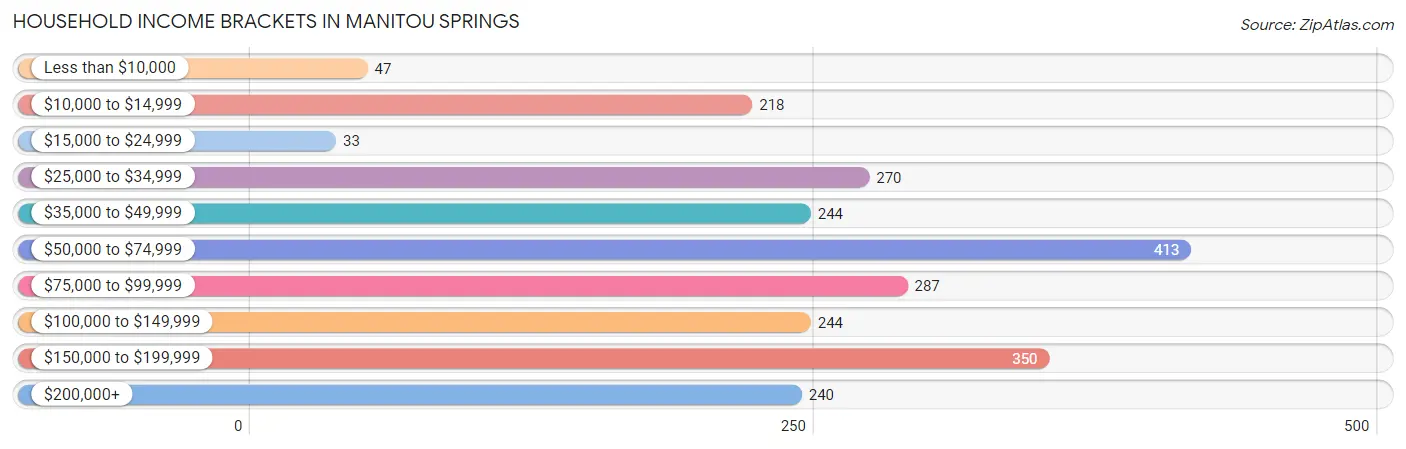
Household Income Brackets in Manitou Springs
With 413 households falling in the category, the $50,000 to $74,999 income range is the most frequent in Manitou Springs, accounting for 17.6% of all households. In contrast, only 33 households (1.4%) fall into the $15,000 to $24,999 income bracket, making it the least populous group.
| Income Bracket | # Households | % Households |
| Less than $10,000 | 47 | 2.0% |
| $10,000 to $14,999 | 218 | 9.3% |
| $15,000 to $24,999 | 33 | 1.4% |
| $25,000 to $34,999 | 270 | 11.5% |
| $35,000 to $49,999 | 244 | 10.4% |
| $50,000 to $74,999 | 413 | 17.6% |
| $75,000 to $99,999 | 287 | 12.2% |
| $100,000 to $149,999 | 244 | 10.4% |
| $150,000 to $199,999 | 350 | 14.9% |
| $200,000+ | 240 | 10.2% |
Household Income by Householder Age in Manitou Springs
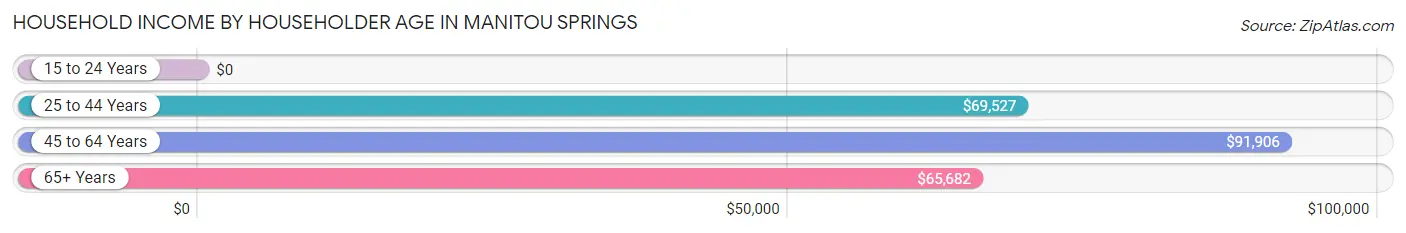
The median household income in Manitou Springs is $72,775, with the highest median household income of $91,906 found in the 45 to 64 years age bracket for the primary householder. A total of 933 households (39.7%) fall into this category.
| Income Bracket | # Households | Median Income |
| 15 to 24 Years | 0 (0.0%) | $0 |
| 25 to 44 Years | 870 (37.0%) | $69,527 |
| 45 to 64 Years | 933 (39.7%) | $91,906 |
| 65+ Years | 546 (23.2%) | $65,682 |
| Total | 2,349 (100.0%) | $72,775 |
Poverty in Manitou Springs
Income Below Poverty by Sex and Age in Manitou Springs
With 11.7% poverty level for males and 3.3% for females among the residents of Manitou Springs, 45 to 54 year old males and 6 to 11 year old females are the most vulnerable to poverty, with 186 males (35.3%) and 11 females (11.7%) in their respective age groups living below the poverty level.
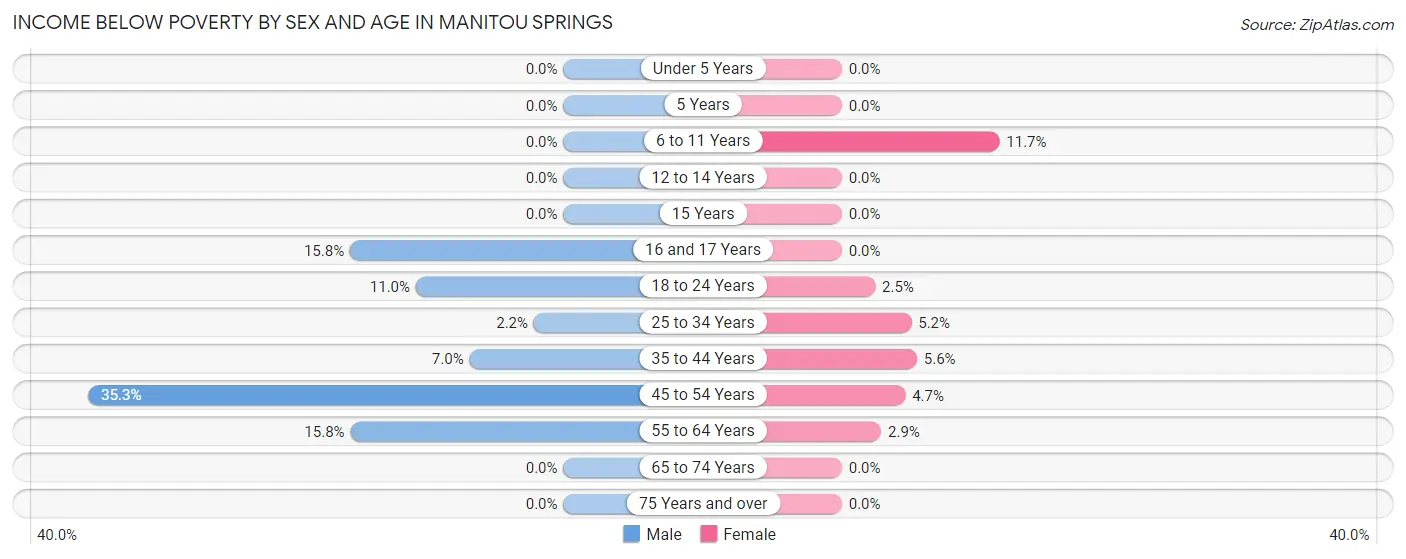
| Age Bracket | Male | Female |
| Under 5 Years | 0 (0.0%) | 0 (0.0%) |
| 5 Years | 0 (0.0%) | 0 (0.0%) |
| 6 to 11 Years | 0 (0.0%) | 11 (11.7%) |
| 12 to 14 Years | 0 (0.0%) | 0 (0.0%) |
| 15 Years | 0 (0.0%) | 0 (0.0%) |
| 16 and 17 Years | 16 (15.8%) | 0 (0.0%) |
| 18 to 24 Years | 31 (11.0%) | 4 (2.5%) |
| 25 to 34 Years | 9 (2.2%) | 13 (5.2%) |
| 35 to 44 Years | 26 (7.0%) | 18 (5.6%) |
| 45 to 54 Years | 186 (35.3%) | 12 (4.7%) |
| 55 to 64 Years | 49 (15.8%) | 11 (2.9%) |
| 65 to 74 Years | 0 (0.0%) | 0 (0.0%) |
| 75 Years and over | 0 (0.0%) | 0 (0.0%) |
| Total | 317 (11.7%) | 69 (3.3%) |
Income Above Poverty by Sex and Age in Manitou Springs
According to the poverty statistics in Manitou Springs, males aged under 5 years and females aged 5 years are the age groups that are most secure financially, with 100.0% of males and 100.0% of females in these age groups living above the poverty line.
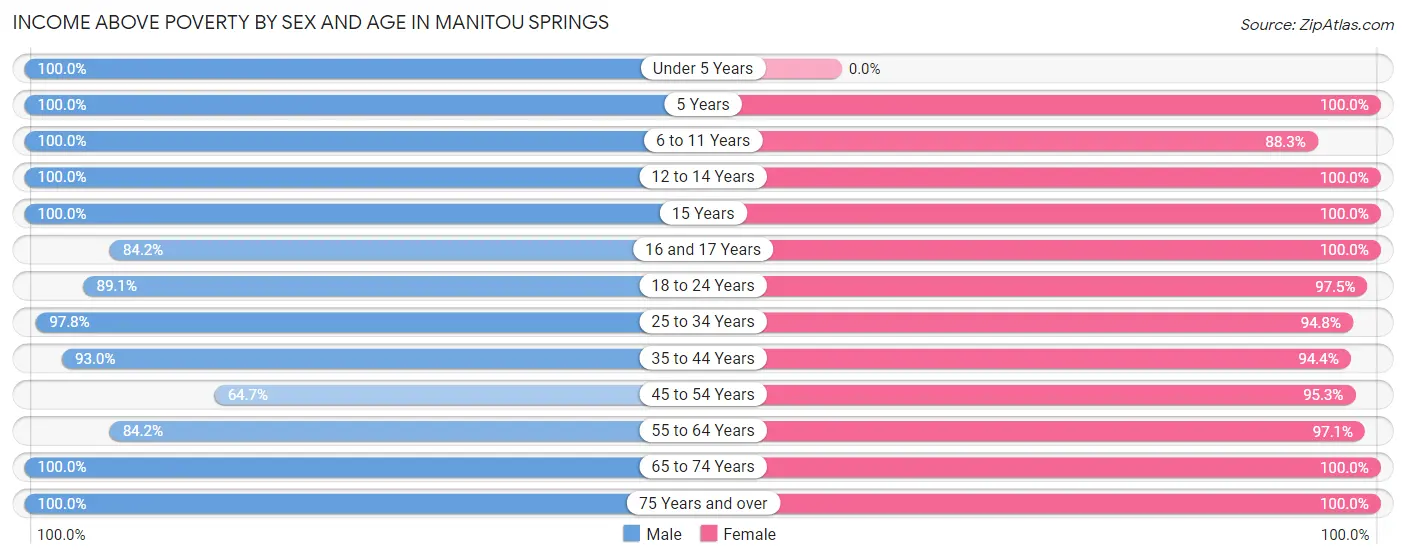
| Age Bracket | Male | Female |
| Under 5 Years | 37 (100.0%) | 0 (0.0%) |
| 5 Years | 13 (100.0%) | 31 (100.0%) |
| 6 to 11 Years | 167 (100.0%) | 83 (88.3%) |
| 12 to 14 Years | 25 (100.0%) | 65 (100.0%) |
| 15 Years | 17 (100.0%) | 132 (100.0%) |
| 16 and 17 Years | 85 (84.2%) | 46 (100.0%) |
| 18 to 24 Years | 252 (89.0%) | 158 (97.5%) |
| 25 to 34 Years | 402 (97.8%) | 239 (94.8%) |
| 35 to 44 Years | 347 (93.0%) | 305 (94.4%) |
| 45 to 54 Years | 341 (64.7%) | 243 (95.3%) |
| 55 to 64 Years | 261 (84.2%) | 366 (97.1%) |
| 65 to 74 Years | 361 (100.0%) | 240 (100.0%) |
| 75 Years and over | 85 (100.0%) | 144 (100.0%) |
| Total | 2,393 (88.3%) | 2,052 (96.8%) |
Income Below Poverty Among Married-Couple Families in Manitou Springs
The poverty statistics for married-couple families in Manitou Springs show that 1.2% or 12 of the total 1,013 families live below the poverty line. Families with no children have the highest poverty rate of 2.0%, comprising of 12 families. On the other hand, families with 1 or 2 children have the lowest poverty rate of 0.0%, which includes 0 families.
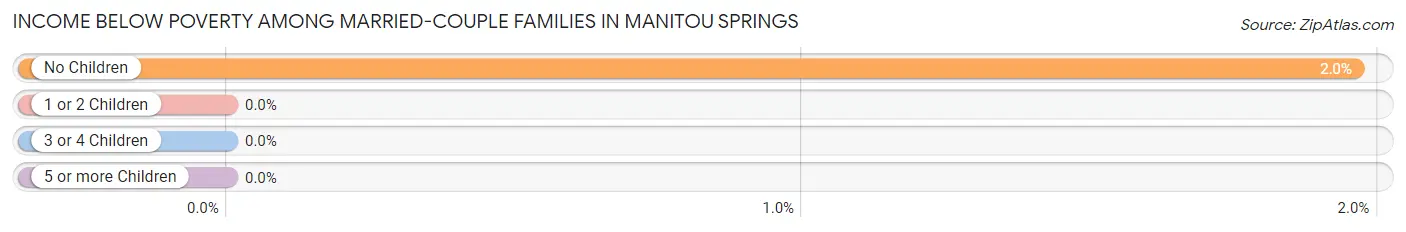
| Children | Above Poverty | Below Poverty |
| No Children | 600 (98.0%) | 12 (2.0%) |
| 1 or 2 Children | 381 (100.0%) | 0 (0.0%) |
| 3 or 4 Children | 20 (100.0%) | 0 (0.0%) |
| 5 or more Children | 0 (0.0%) | 0 (0.0%) |
| Total | 1,001 (98.8%) | 12 (1.2%) |
Income Below Poverty Among Single-Parent Households in Manitou Springs
According to the poverty data in Manitou Springs, 33.7% or 30 single-father households and 22.8% or 13 single-mother households are living below the poverty line. Among single-father households, those with 1 or 2 children have the highest poverty rate, with 19 households (36.5%) experiencing poverty. Likewise, among single-mother households, those with 1 or 2 children have the highest poverty rate, with 13 households (46.4%) falling below the poverty line.
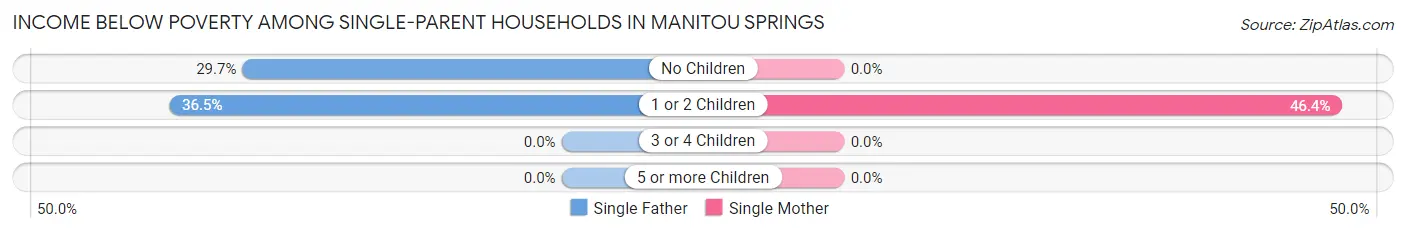
| Children | Single Father | Single Mother |
| No Children | 11 (29.7%) | 0 (0.0%) |
| 1 or 2 Children | 19 (36.5%) | 13 (46.4%) |
| 3 or 4 Children | 0 (0.0%) | 0 (0.0%) |
| 5 or more Children | 0 (0.0%) | 0 (0.0%) |
| Total | 30 (33.7%) | 13 (22.8%) |
Income Below Poverty Among Married-Couple vs Single-Parent Households in Manitou Springs
The poverty data for Manitou Springs shows that 12 of the married-couple family households (1.2%) and 43 of the single-parent households (29.4%) are living below the poverty level. Within the married-couple family households, those with no children have the highest poverty rate, with 12 households (2.0%) falling below the poverty line. Among the single-parent households, those with 1 or 2 children have the highest poverty rate, with 32 household (40.0%) living below poverty.
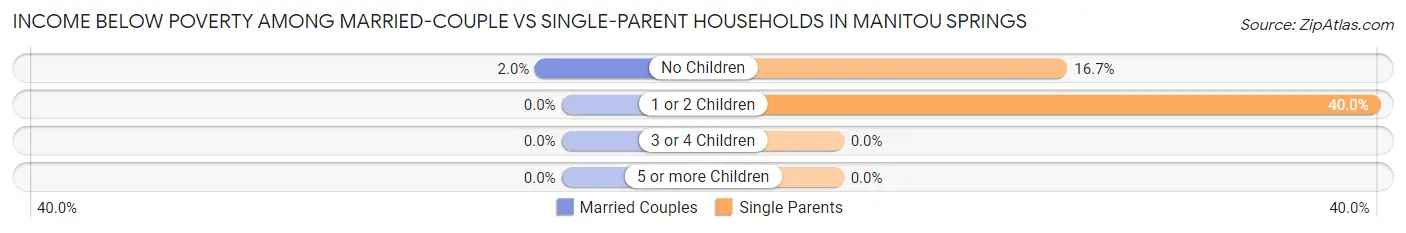
| Children | Married-Couple Families | Single-Parent Households |
| No Children | 12 (2.0%) | 11 (16.7%) |
| 1 or 2 Children | 0 (0.0%) | 32 (40.0%) |
| 3 or 4 Children | 0 (0.0%) | 0 (0.0%) |
| 5 or more Children | 0 (0.0%) | 0 (0.0%) |
| Total | 12 (1.2%) | 43 (29.4%) |
Race in Manitou Springs
The most populous races in Manitou Springs are White / Caucasian (4,384 | 90.4%), Hispanic or Latino (375 | 7.7%), and Some other Race (180 | 3.7%).
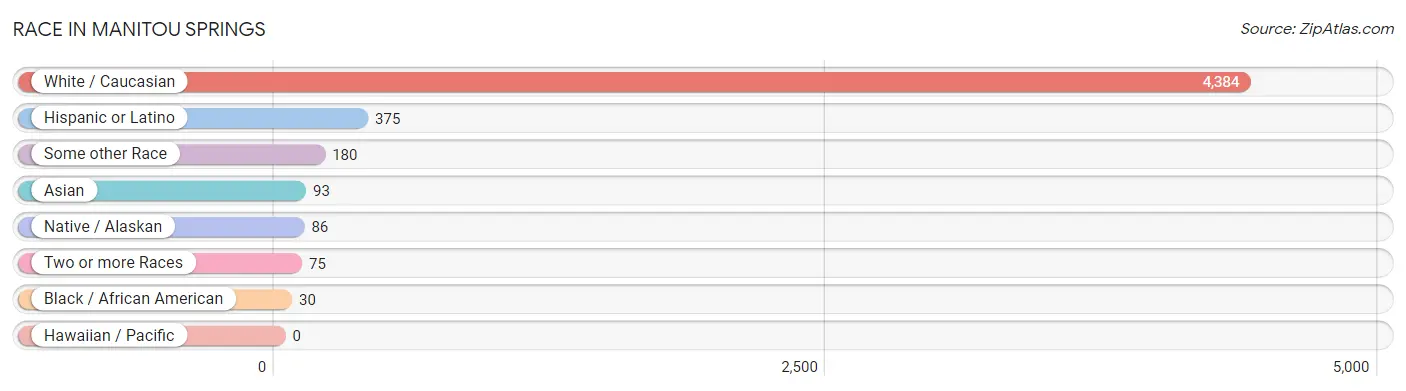
| Race | # Population | % Population |
| Asian | 93 | 1.9% |
| Black / African American | 30 | 0.6% |
| Hawaiian / Pacific | 0 | 0.0% |
| Hispanic or Latino | 375 | 7.7% |
| Native / Alaskan | 86 | 1.8% |
| White / Caucasian | 4,384 | 90.4% |
| Two or more Races | 75 | 1.5% |
| Some other Race | 180 | 3.7% |
| Total | 4,848 | 100.0% |
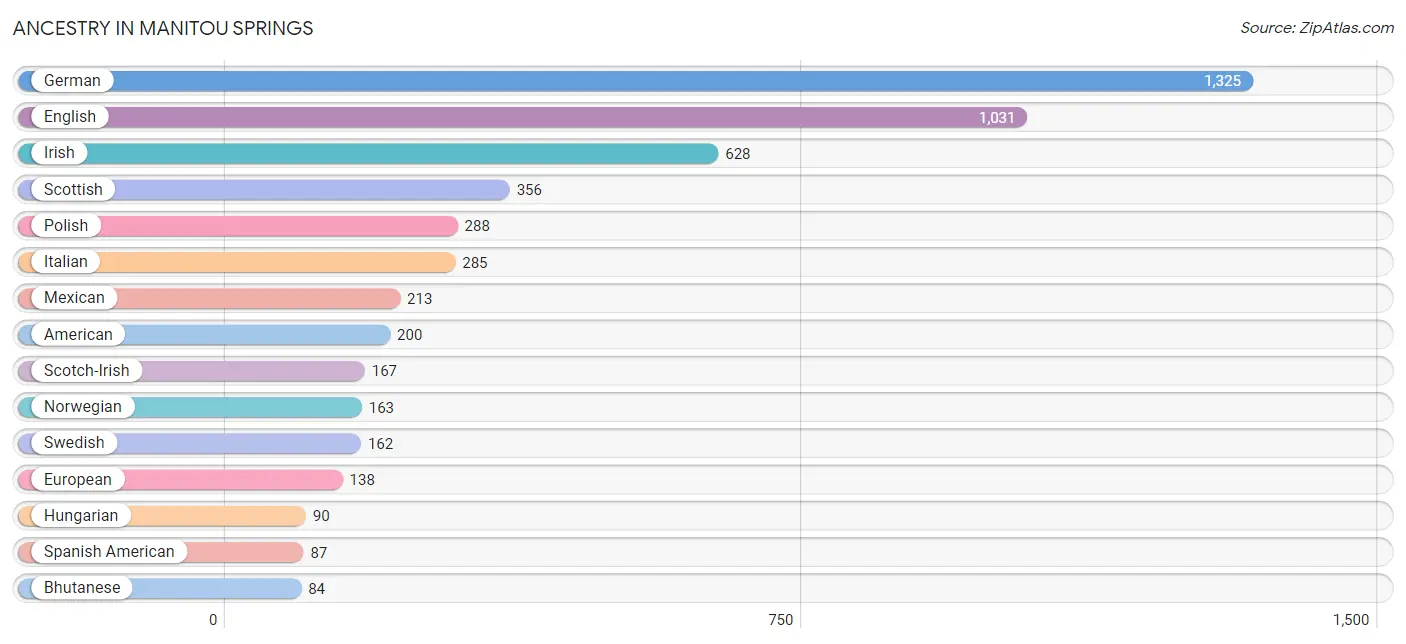
Ancestry in Manitou Springs
The most populous ancestries reported in Manitou Springs are German (1,325 | 27.3%), English (1,031 | 21.3%), Irish (628 | 13.0%), Scottish (356 | 7.3%), and Polish (288 | 5.9%), together accounting for 74.8% of all Manitou Springs residents.
| Ancestry | # Population | % Population |
| American | 200 | 4.1% |
| Arab | 54 | 1.1% |
| Belgian | 20 | 0.4% |
| Bhutanese | 84 | 1.7% |
| Blackfeet | 6 | 0.1% |
| Bolivian | 29 | 0.6% |
| British | 64 | 1.3% |
| Burmese | 15 | 0.3% |
| Central American Indian | 57 | 1.2% |
| Cherokee | 24 | 0.5% |
| Colombian | 11 | 0.2% |
| Croatian | 15 | 0.3% |
| Czech | 47 | 1.0% |
| Dutch | 49 | 1.0% |
| English | 1,031 | 21.3% |
| Estonian | 54 | 1.1% |
| Ethiopian | 25 | 0.5% |
| European | 138 | 2.9% |
| Finnish | 22 | 0.4% |
| French | 60 | 1.2% |
| French Canadian | 56 | 1.2% |
| German | 1,325 | 27.3% |
| Hungarian | 90 | 1.9% |
| Indian (Asian) | 9 | 0.2% |
| Irish | 628 | 13.0% |
| Italian | 285 | 5.9% |
| Lebanese | 46 | 0.9% |
| Lithuanian | 57 | 1.2% |
| Mexican | 213 | 4.4% |
| Mexican American Indian | 11 | 0.2% |
| Moroccan | 8 | 0.2% |
| Norwegian | 163 | 3.4% |
| Polish | 288 | 5.9% |
| Potawatomi | 6 | 0.1% |
| Russian | 75 | 1.5% |
| Scandinavian | 33 | 0.7% |
| Scotch-Irish | 167 | 3.4% |
| Scottish | 356 | 7.3% |
| South American | 40 | 0.8% |
| Spaniard | 35 | 0.7% |
| Spanish American | 87 | 1.8% |
| Subsaharan African | 25 | 0.5% |
| Swedish | 162 | 3.3% |
| Swiss | 9 | 0.2% |
| Ukrainian | 41 | 0.9% |
| Welsh | 32 | 0.7% | View All 46 Rows |
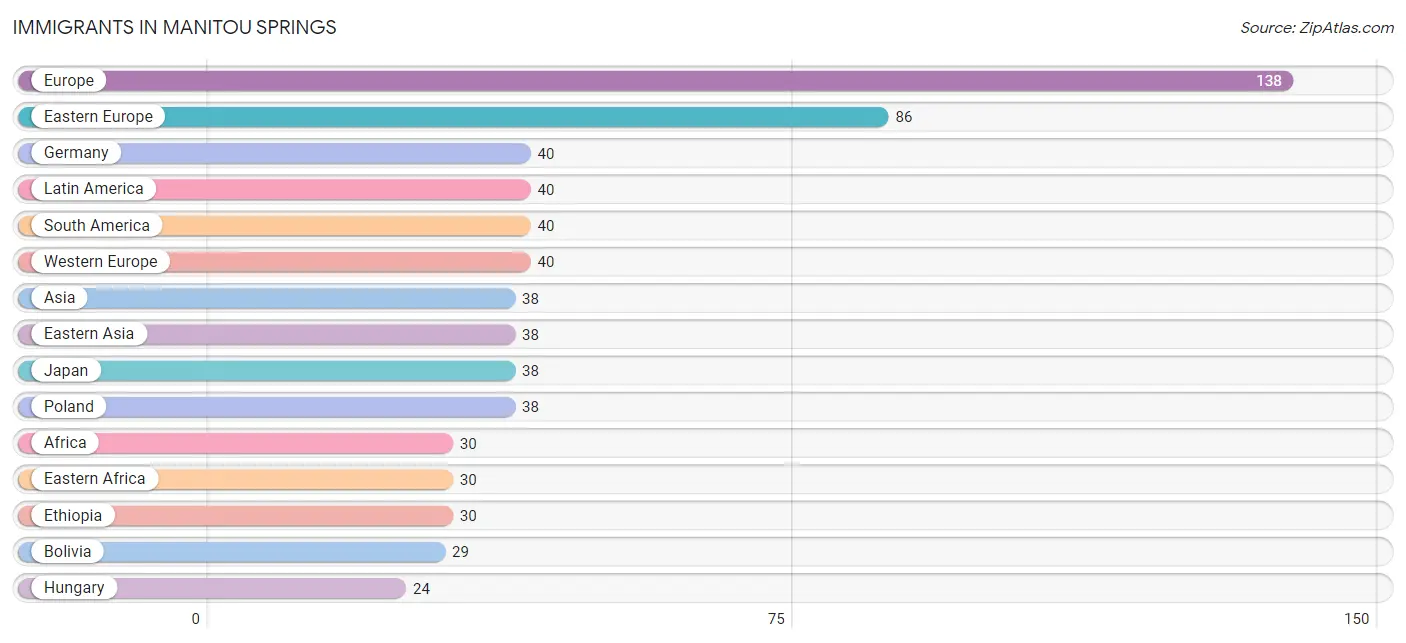
Immigrants in Manitou Springs
The most numerous immigrant groups reported in Manitou Springs came from Europe (138 | 2.9%), Eastern Europe (86 | 1.8%), Germany (40 | 0.8%), Latin America (40 | 0.8%), and South America (40 | 0.8%), together accounting for 7.1% of all Manitou Springs residents.
| Immigration Origin | # Population | % Population |
| Africa | 30 | 0.6% |
| Asia | 38 | 0.8% |
| Bolivia | 29 | 0.6% |
| Canada | 7 | 0.1% |
| Colombia | 11 | 0.2% |
| Czechoslovakia | 12 | 0.3% |
| Eastern Africa | 30 | 0.6% |
| Eastern Asia | 38 | 0.8% |
| Eastern Europe | 86 | 1.8% |
| Ethiopia | 30 | 0.6% |
| Europe | 138 | 2.9% |
| Germany | 40 | 0.8% |
| Hungary | 24 | 0.5% |
| Japan | 38 | 0.8% |
| Latin America | 40 | 0.8% |
| Northern Europe | 12 | 0.3% |
| Poland | 38 | 0.8% |
| South America | 40 | 0.8% |
| Ukraine | 12 | 0.3% |
| Western Europe | 40 | 0.8% | View All 20 Rows |
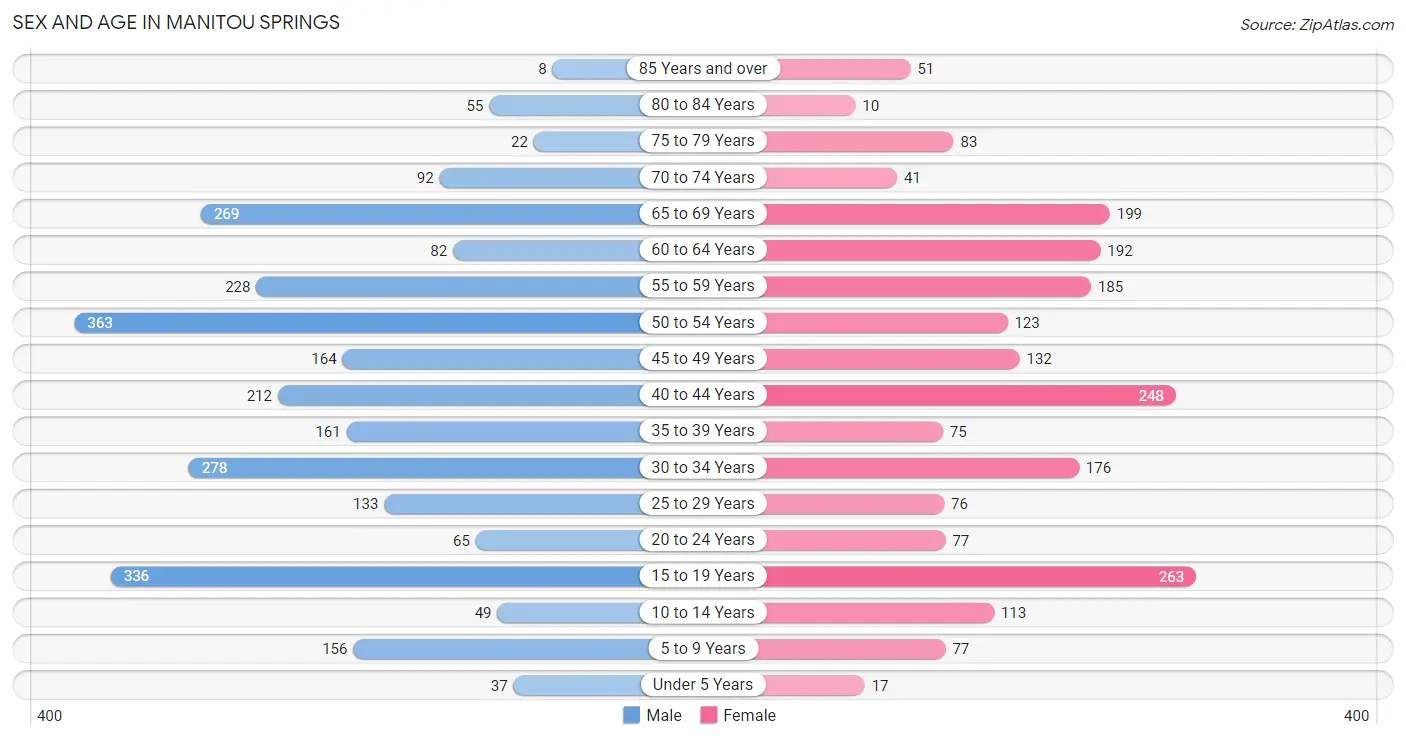
Sex and Age in Manitou Springs
Sex and Age in Manitou Springs
The most populous age groups in Manitou Springs are 50 to 54 Years (363 | 13.4%) for men and 15 to 19 Years (263 | 12.3%) for women.
| Age Bracket | Male | Female |
| Under 5 Years | 37 (1.4%) | 17 (0.8%) |
| 5 to 9 Years | 156 (5.8%) | 77 (3.6%) |
| 10 to 14 Years | 49 (1.8%) | 113 (5.3%) |
| 15 to 19 Years | 336 (12.4%) | 263 (12.3%) |
| 20 to 24 Years | 65 (2.4%) | 77 (3.6%) |
| 25 to 29 Years | 133 (4.9%) | 76 (3.5%) |
| 30 to 34 Years | 278 (10.3%) | 176 (8.2%) |
| 35 to 39 Years | 161 (5.9%) | 75 (3.5%) |
| 40 to 44 Years | 212 (7.8%) | 248 (11.6%) |
| 45 to 49 Years | 164 (6.0%) | 132 (6.2%) |
| 50 to 54 Years | 363 (13.4%) | 123 (5.8%) |
| 55 to 59 Years | 228 (8.4%) | 185 (8.6%) |
| 60 to 64 Years | 82 (3.0%) | 192 (9.0%) |
| 65 to 69 Years | 269 (9.9%) | 199 (9.3%) |
| 70 to 74 Years | 92 (3.4%) | 41 (1.9%) |
| 75 to 79 Years | 22 (0.8%) | 83 (3.9%) |
| 80 to 84 Years | 55 (2.0%) | 10 (0.5%) |
| 85 Years and over | 8 (0.3%) | 51 (2.4%) |
| Total | 2,710 (100.0%) | 2,138 (100.0%) |
Families and Households in Manitou Springs
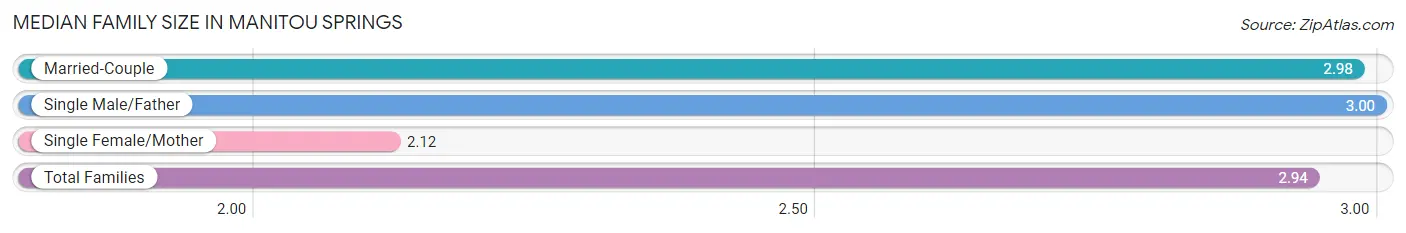
Median Family Size in Manitou Springs
The median family size in Manitou Springs is 2.94 persons per family, with single male/father families (89 | 7.7%) accounting for the largest median family size of 3 persons per family. On the other hand, single female/mother families (57 | 4.9%) represent the smallest median family size with 2.12 persons per family.
| Family Type | # Families | Family Size |
| Married-Couple | 1,013 (87.4%) | 2.98 |
| Single Male/Father | 89 (7.7%) | 3.00 |
| Single Female/Mother | 57 (4.9%) | 2.12 |
| Total Families | 1,159 (100.0%) | 2.94 |
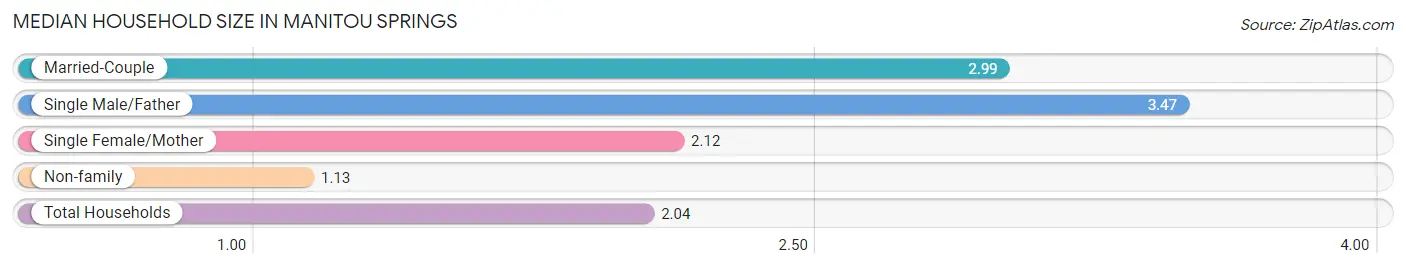
Median Household Size in Manitou Springs
The median household size in Manitou Springs is 2.04 persons per household, with single male/father households (89 | 3.8%) accounting for the largest median household size of 3.47 persons per household. non-family households (1,190 | 50.7%) represent the smallest median household size with 1.13 persons per household.
| Household Type | # Households | Household Size |
| Married-Couple | 1,013 (43.1%) | 2.99 |
| Single Male/Father | 89 (3.8%) | 3.47 |
| Single Female/Mother | 57 (2.4%) | 2.12 |
| Non-family | 1,190 (50.7%) | 1.13 |
| Total Households | 2,349 (100.0%) | 2.04 |
Household Size by Marriage Status in Manitou Springs
Out of a total of 2,349 households in Manitou Springs, 1,159 (49.3%) are family households, while 1,190 (50.7%) are nonfamily households. The most numerous type of family households are 2-person households, comprising 566, and the most common type of nonfamily households are 1-person households, comprising 1,063.
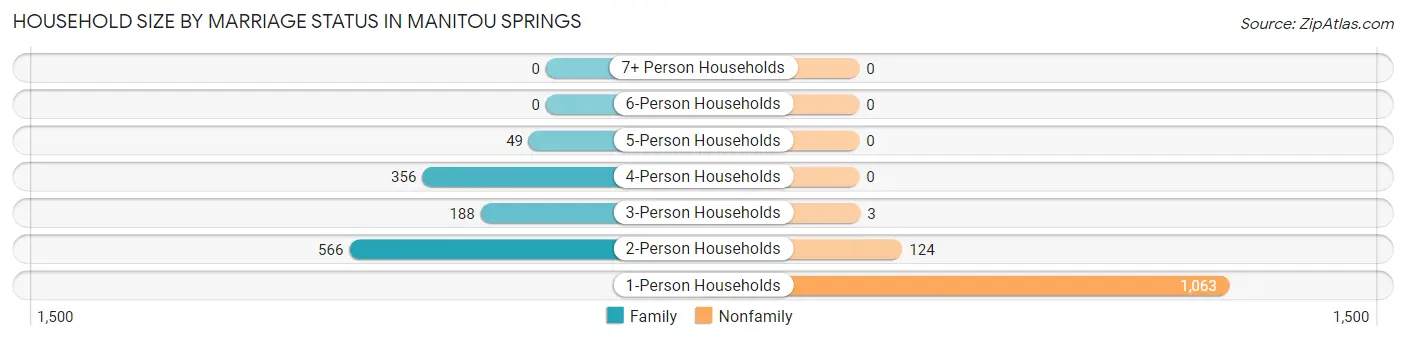
| Household Size | Family Households | Nonfamily Households |
| 1-Person Households | - | 1,063 (45.3%) |
| 2-Person Households | 566 (24.1%) | 124 (5.3%) |
| 3-Person Households | 188 (8.0%) | 3 (0.1%) |
| 4-Person Households | 356 (15.2%) | 0 (0.0%) |
| 5-Person Households | 49 (2.1%) | 0 (0.0%) |
| 6-Person Households | 0 (0.0%) | 0 (0.0%) |
| 7+ Person Households | 0 (0.0%) | 0 (0.0%) |
| Total | 1,159 (49.3%) | 1,190 (50.7%) |
Female Fertility in Manitou Springs
Fertility by Age in Manitou Springs
| Age Bracket | Women with Births | Births / 1,000 Women |
| 15 to 19 years | 0 (0.0%) | 0.0 |
| 20 to 34 years | 0 (0.0%) | 0.0 |
| 35 to 50 years | 0 (0.0%) | 0.0 |
| Total | 0 (0.0%) | 0.0 |
Fertility by Age by Marriage Status in Manitou Springs
| Age Bracket | Married | Unmarried |
| 15 to 19 years | 0 (0.0%) | 0 (0.0%) |
| 20 to 34 years | 0 (0.0%) | 0 (0.0%) |
| 35 to 50 years | 0 (0.0%) | 0 (0.0%) |
| Total | 0 (0.0%) | 0 (0.0%) |
Fertility by Education in Manitou Springs
| Educational Attainment | Women with Births | Births / 1,000 Women |
| Less than High School | 0 (0.0%) | 0.0 |
| High School Diploma | 0 (0.0%) | 0.0 |
| College or Associate's Degree | 0 (0.0%) | 0.0 |
| Bachelor's Degree | 0 (0.0%) | 0.0 |
| Graduate Degree | 0 (0.0%) | 0.0 |
| Total | 0 (0.0%) | 0.0 |
Fertility by Education by Marriage Status in Manitou Springs
| Educational Attainment | Married | Unmarried |
| Less than High School | 0 (0.0%) | 0 (0.0%) |
| High School Diploma | 0 (0.0%) | 0 (0.0%) |
| College or Associate's Degree | 0 (0.0%) | 0 (0.0%) |
| Bachelor's Degree | 0 (0.0%) | 0 (0.0%) |
| Graduate Degree | 0 (0.0%) | 0 (0.0%) |
| Total | 0 (0.0%) | 0 (0.0%) |
Employment Characteristics in Manitou Springs
Employment by Class of Employer in Manitou Springs
Among the 2,769 employed individuals in Manitou Springs, private company employees (1,508 | 54.5%), not-for-profit organizations (419 | 15.1%), and self-employed (incorporated) (301 | 10.9%) make up the most common classes of employment.
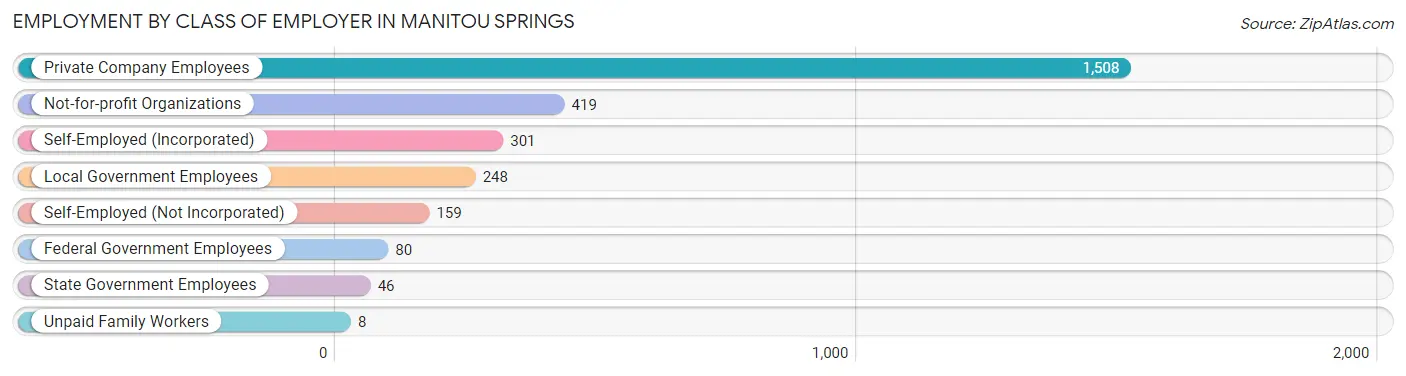
| Employer Class | # Employees | % Employees |
| Private Company Employees | 1,508 | 54.5% |
| Self-Employed (Incorporated) | 301 | 10.9% |
| Self-Employed (Not Incorporated) | 159 | 5.7% |
| Not-for-profit Organizations | 419 | 15.1% |
| Local Government Employees | 248 | 9.0% |
| State Government Employees | 46 | 1.7% |
| Federal Government Employees | 80 | 2.9% |
| Unpaid Family Workers | 8 | 0.3% |
| Total | 2,769 | 100.0% |
Employment Status by Age in Manitou Springs
According to the labor force statistics for Manitou Springs, out of the total population over 16 years of age (4,250), 73.8% or 3,136 individuals are in the labor force, with 11.8% or 370 of them unemployed. The age group with the highest labor force participation rate is 30 to 34 years, with 98.5% or 447 individuals in the labor force. Within the labor force, the 45 to 54 years age range has the highest percentage of unemployed individuals, with 29.4% or 209 of them being unemployed.
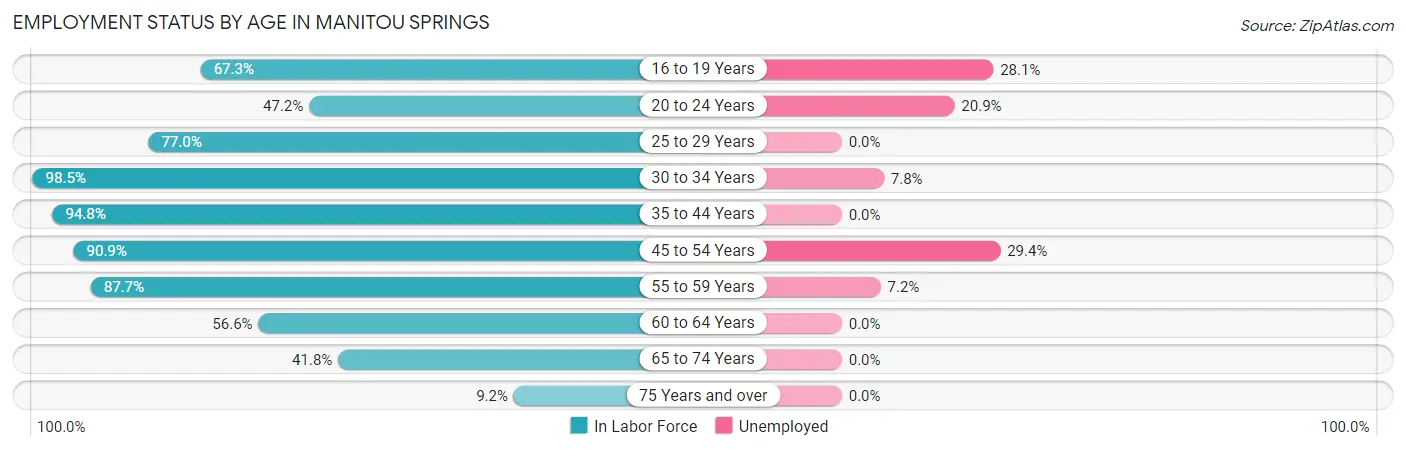
| Age Bracket | In Labor Force | Unemployed |
| 16 to 19 Years | 303 (67.3%) | 85 (28.1%) |
| 20 to 24 Years | 67 (47.2%) | 14 (20.9%) |
| 25 to 29 Years | 161 (77.0%) | 0 (0.0%) |
| 30 to 34 Years | 447 (98.5%) | 35 (7.8%) |
| 35 to 44 Years | 660 (94.8%) | 0 (0.0%) |
| 45 to 54 Years | 711 (90.9%) | 209 (29.4%) |
| 55 to 59 Years | 362 (87.7%) | 26 (7.2%) |
| 60 to 64 Years | 155 (56.6%) | 0 (0.0%) |
| 65 to 74 Years | 251 (41.8%) | 0 (0.0%) |
| 75 Years and over | 21 (9.2%) | 0 (0.0%) |
| Total | 3,136 (73.8%) | 370 (11.8%) |
Employment Status by Educational Attainment in Manitou Springs
According to labor force statistics for Manitou Springs, 88.3% of individuals (2,497) out of the total population between 25 and 64 years of age (2,828) are in the labor force, with 10.9% or 272 of them being unemployed. The group with the highest labor force participation rate are those with the educational attainment of bachelor's degree or higher, with 95.4% or 1,553 individuals in the labor force. Within the labor force, individuals with high school diploma education have the highest percentage of unemployment, with 42.5% or 147 of them being unemployed.
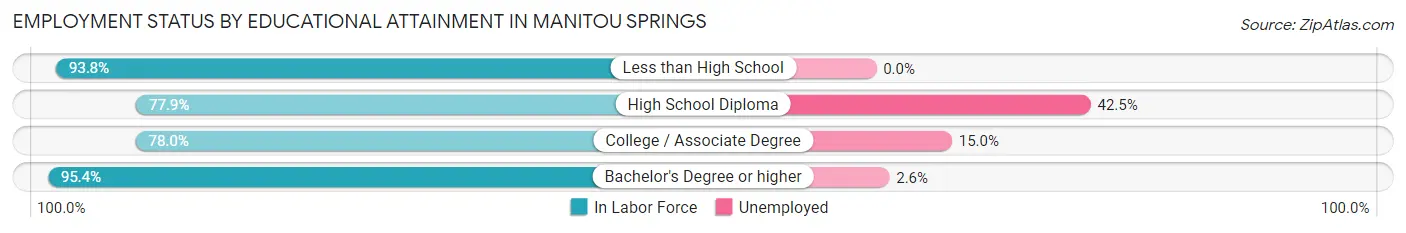
| Educational Attainment | In Labor Force | Unemployed |
| Less than High School | 45 (93.8%) | 0 (0.0%) |
| High School Diploma | 346 (77.9%) | 189 (42.5%) |
| College / Associate Degree | 552 (78.0%) | 106 (15.0%) |
| Bachelor's Degree or higher | 1,553 (95.4%) | 42 (2.6%) |
| Total | 2,497 (88.3%) | 308 (10.9%) |
Employment Occupations by Sex in Manitou Springs
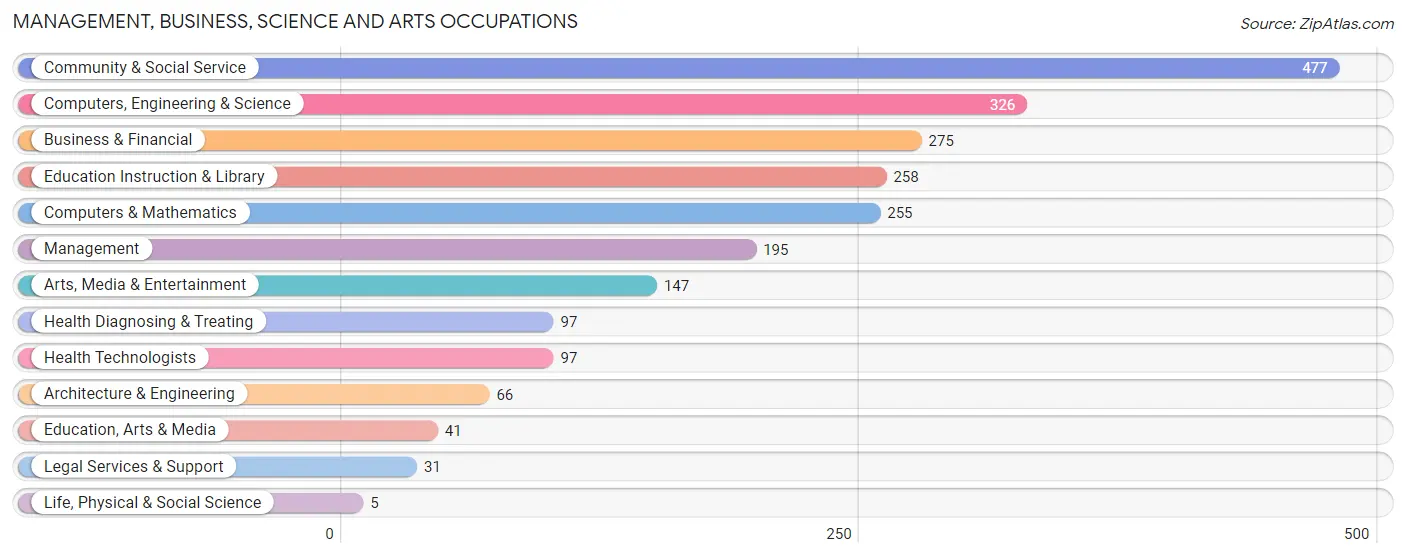
Management, Business, Science and Arts Occupations
The most common Management, Business, Science and Arts occupations in Manitou Springs are Community & Social Service (477 | 17.3%), Computers, Engineering & Science (326 | 11.8%), Business & Financial (275 | 10.0%), Education Instruction & Library (258 | 9.4%), and Computers & Mathematics (255 | 9.2%).
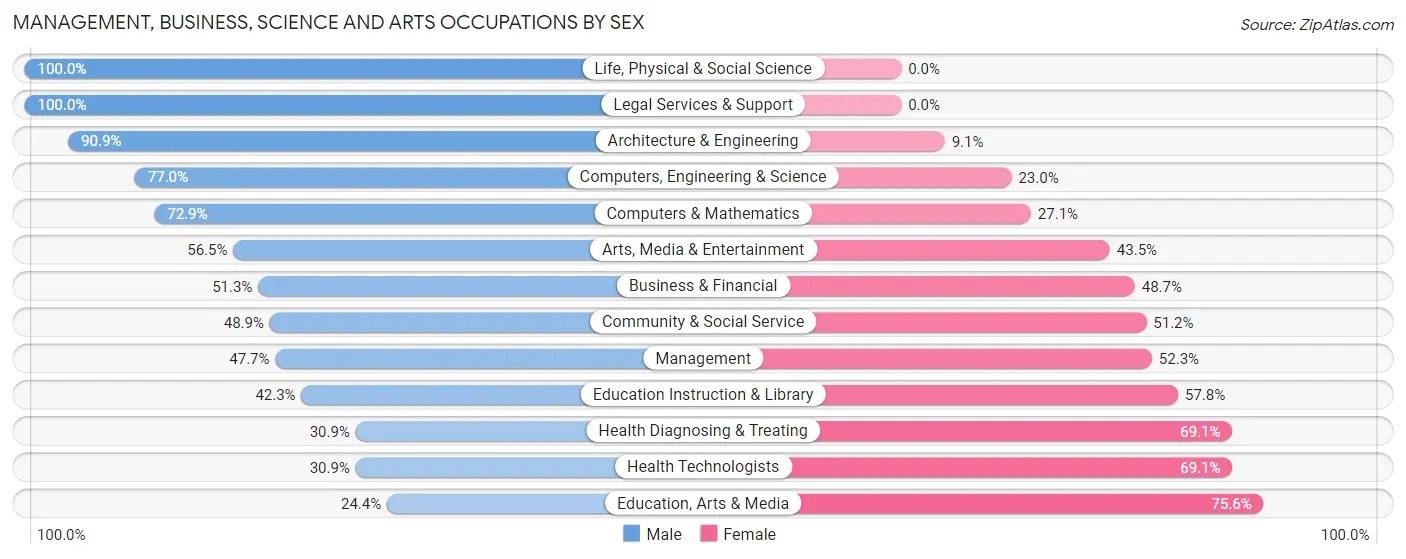
Management, Business, Science and Arts Occupations by Sex
Within the Management, Business, Science and Arts occupations in Manitou Springs, the most male-oriented occupations are Life, Physical & Social Science (100.0%), Legal Services & Support (100.0%), and Architecture & Engineering (90.9%), while the most female-oriented occupations are Education, Arts & Media (75.6%), Health Diagnosing & Treating (69.1%), and Health Technologists (69.1%).
| Occupation | Male | Female |
| Management | 93 (47.7%) | 102 (52.3%) |
| Business & Financial | 141 (51.3%) | 134 (48.7%) |
| Computers, Engineering & Science | 251 (77.0%) | 75 (23.0%) |
| Computers & Mathematics | 186 (72.9%) | 69 (27.1%) |
| Architecture & Engineering | 60 (90.9%) | 6 (9.1%) |
| Life, Physical & Social Science | 5 (100.0%) | 0 (0.0%) |
| Community & Social Service | 233 (48.8%) | 244 (51.1%) |
| Education, Arts & Media | 10 (24.4%) | 31 (75.6%) |
| Legal Services & Support | 31 (100.0%) | 0 (0.0%) |
| Education Instruction & Library | 109 (42.2%) | 149 (57.8%) |
| Arts, Media & Entertainment | 83 (56.5%) | 64 (43.5%) |
| Health Diagnosing & Treating | 30 (30.9%) | 67 (69.1%) |
| Health Technologists | 30 (30.9%) | 67 (69.1%) |
| Total (Category) | 748 (54.6%) | 622 (45.4%) |
| Total (Overall) | 1,631 (59.2%) | 1,126 (40.8%) |
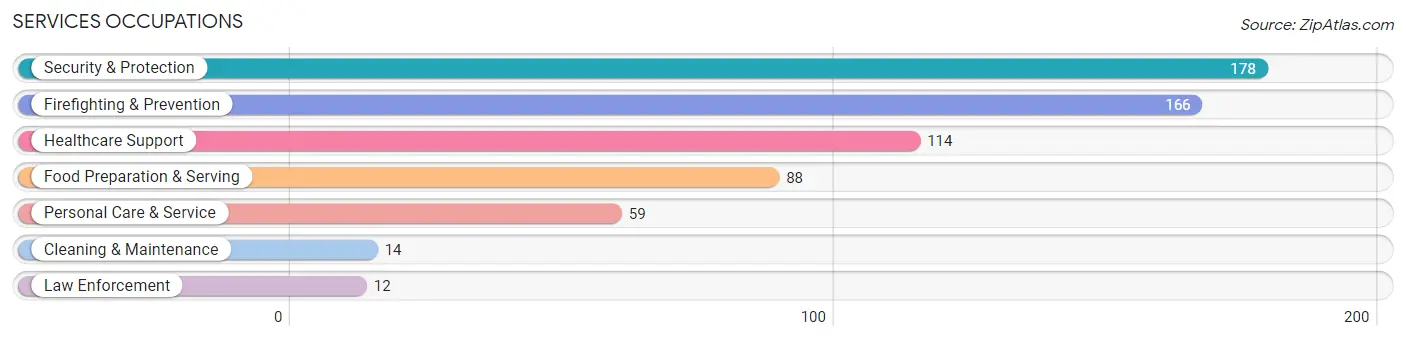
Services Occupations
The most common Services occupations in Manitou Springs are Security & Protection (178 | 6.5%), Firefighting & Prevention (166 | 6.0%), Healthcare Support (114 | 4.1%), Food Preparation & Serving (88 | 3.2%), and Personal Care & Service (59 | 2.1%).
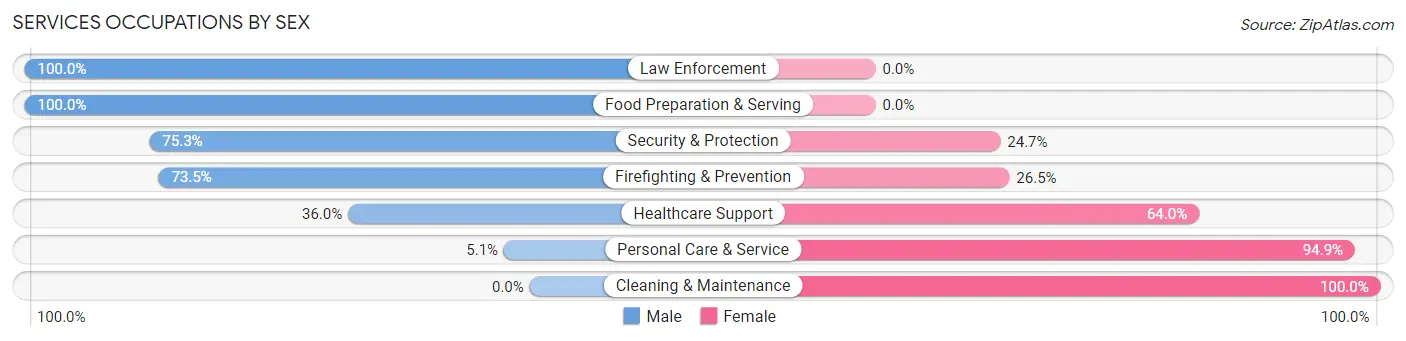
Services Occupations by Sex
Within the Services occupations in Manitou Springs, the most male-oriented occupations are Law Enforcement (100.0%), Food Preparation & Serving (100.0%), and Security & Protection (75.3%), while the most female-oriented occupations are Cleaning & Maintenance (100.0%), Personal Care & Service (94.9%), and Healthcare Support (64.0%).
| Occupation | Male | Female |
| Healthcare Support | 41 (36.0%) | 73 (64.0%) |
| Security & Protection | 134 (75.3%) | 44 (24.7%) |
| Firefighting & Prevention | 122 (73.5%) | 44 (26.5%) |
| Law Enforcement | 12 (100.0%) | 0 (0.0%) |
| Food Preparation & Serving | 88 (100.0%) | 0 (0.0%) |
| Cleaning & Maintenance | 0 (0.0%) | 14 (100.0%) |
| Personal Care & Service | 3 (5.1%) | 56 (94.9%) |
| Total (Category) | 266 (58.7%) | 187 (41.3%) |
| Total (Overall) | 1,631 (59.2%) | 1,126 (40.8%) |
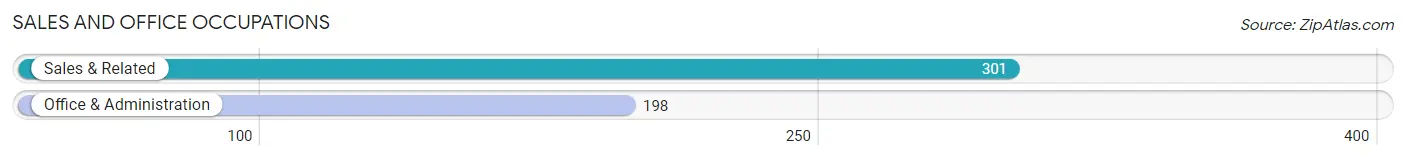
Sales and Office Occupations
The most common Sales and Office occupations in Manitou Springs are Sales & Related (301 | 10.9%), and Office & Administration (198 | 7.2%).
Sales and Office Occupations by Sex
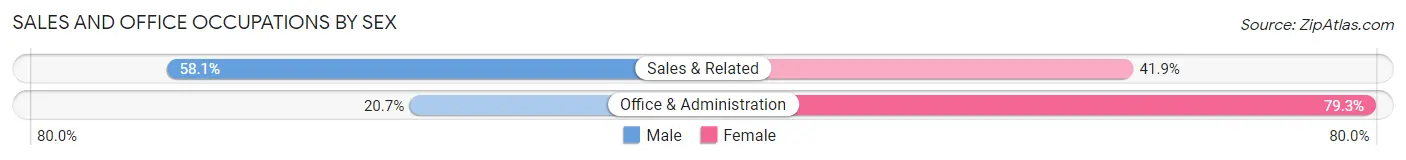
| Occupation | Male | Female |
| Sales & Related | 175 (58.1%) | 126 (41.9%) |
| Office & Administration | 41 (20.7%) | 157 (79.3%) |
| Total (Category) | 216 (43.3%) | 283 (56.7%) |
| Total (Overall) | 1,631 (59.2%) | 1,126 (40.8%) |
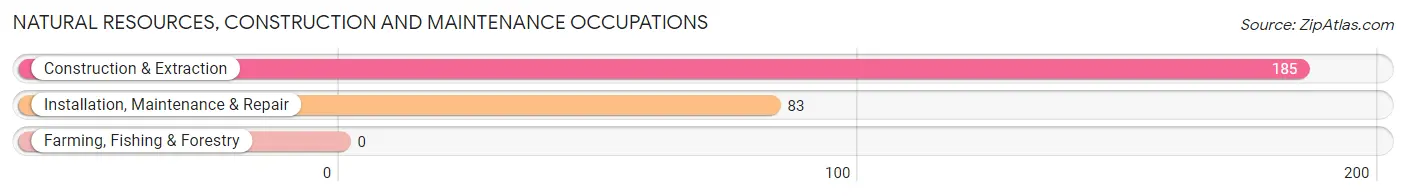
Natural Resources, Construction and Maintenance Occupations
The most common Natural Resources, Construction and Maintenance occupations in Manitou Springs are Construction & Extraction (185 | 6.7%), and Installation, Maintenance & Repair (83 | 3.0%).
Natural Resources, Construction and Maintenance Occupations by Sex
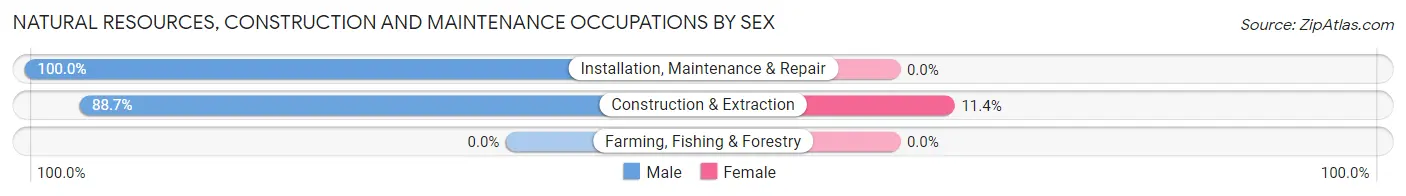
| Occupation | Male | Female |
| Farming, Fishing & Forestry | 0 (0.0%) | 0 (0.0%) |
| Construction & Extraction | 164 (88.6%) | 21 (11.4%) |
| Installation, Maintenance & Repair | 83 (100.0%) | 0 (0.0%) |
| Total (Category) | 247 (92.2%) | 21 (7.8%) |
| Total (Overall) | 1,631 (59.2%) | 1,126 (40.8%) |
Production, Transportation and Moving Occupations
The most common Production, Transportation and Moving occupations in Manitou Springs are Transportation (127 | 4.6%), Production (24 | 0.9%), and Material Moving (16 | 0.6%).
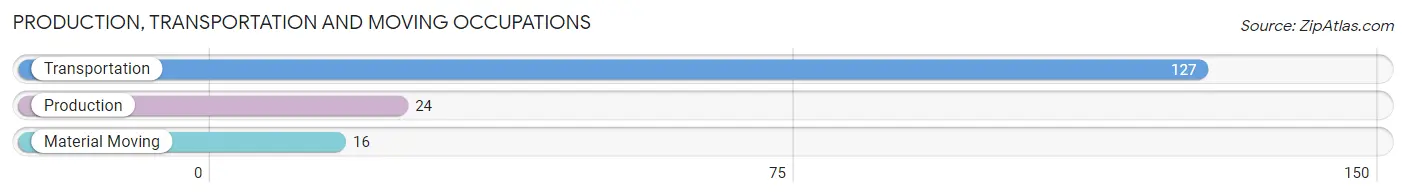
Production, Transportation and Moving Occupations by Sex
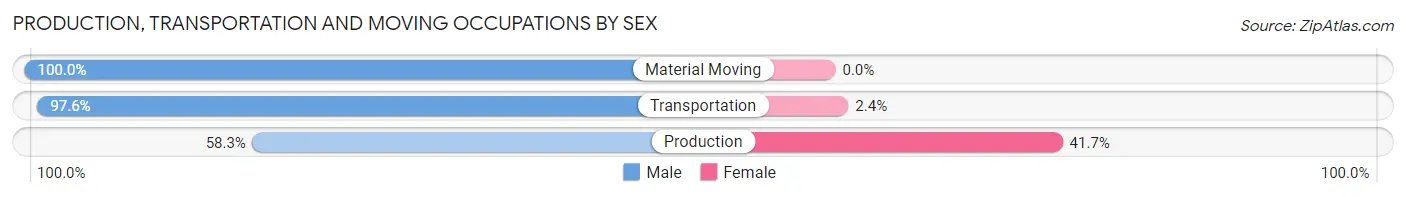
| Occupation | Male | Female |
| Production | 14 (58.3%) | 10 (41.7%) |
| Transportation | 124 (97.6%) | 3 (2.4%) |
| Material Moving | 16 (100.0%) | 0 (0.0%) |
| Total (Category) | 154 (92.2%) | 13 (7.8%) |
| Total (Overall) | 1,631 (59.2%) | 1,126 (40.8%) |
Employment Industries by Sex in Manitou Springs
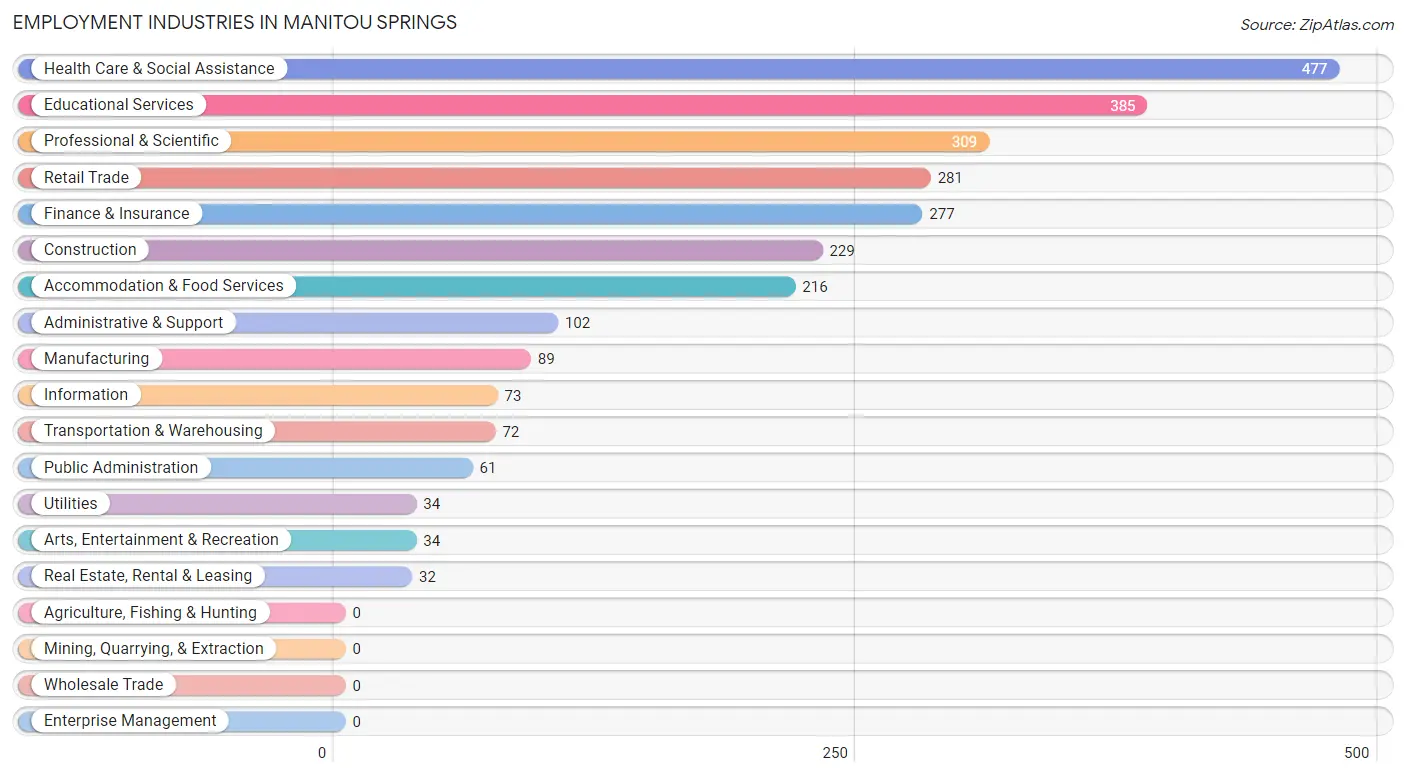
Employment Industries in Manitou Springs
The major employment industries in Manitou Springs include Health Care & Social Assistance (477 | 17.3%), Educational Services (385 | 14.0%), Professional & Scientific (309 | 11.2%), Retail Trade (281 | 10.2%), and Finance & Insurance (277 | 10.1%).
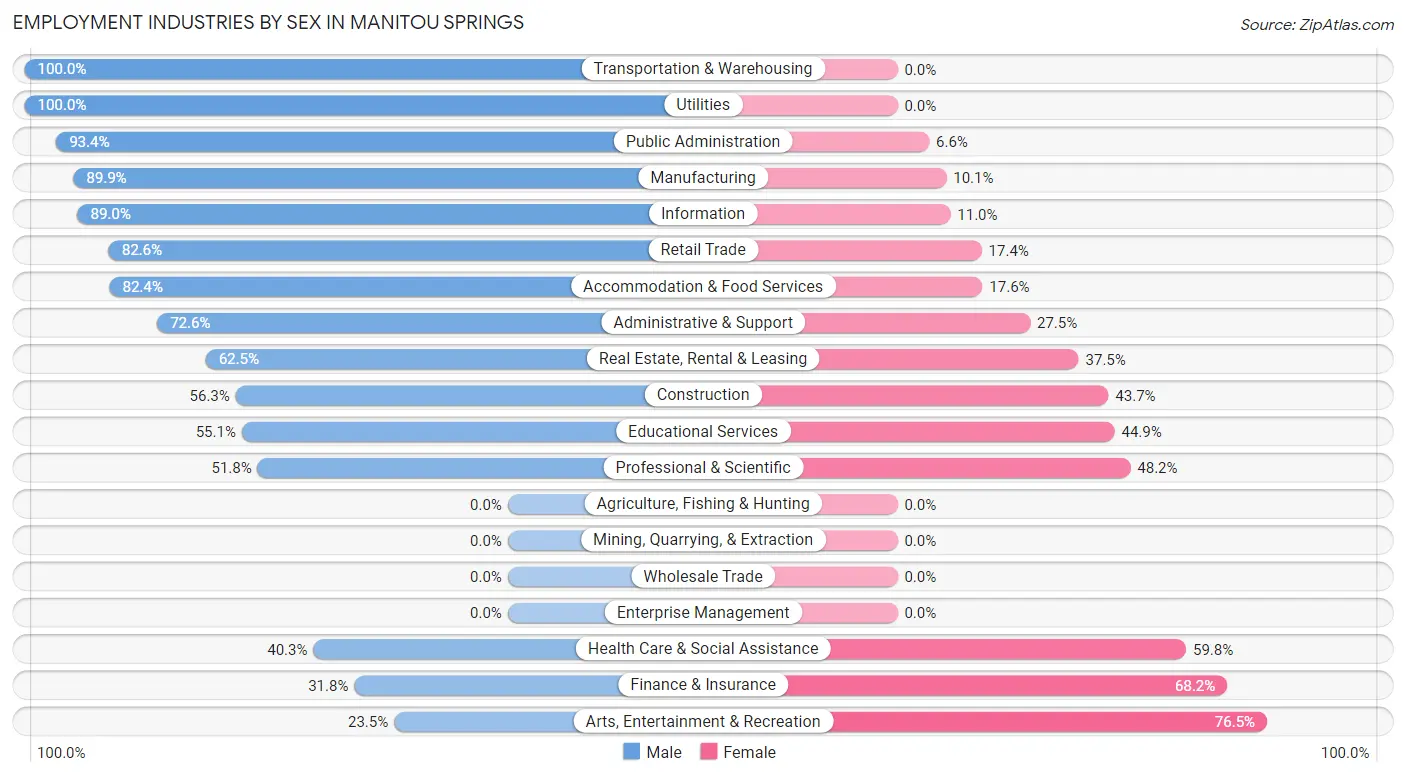
Employment Industries by Sex in Manitou Springs
The Manitou Springs industries that see more men than women are Transportation & Warehousing (100.0%), Utilities (100.0%), and Public Administration (93.4%), whereas the industries that tend to have a higher number of women are Arts, Entertainment & Recreation (76.5%), Finance & Insurance (68.2%), and Health Care & Social Assistance (59.8%).
| Industry | Male | Female |
| Agriculture, Fishing & Hunting | 0 (0.0%) | 0 (0.0%) |
| Mining, Quarrying, & Extraction | 0 (0.0%) | 0 (0.0%) |
| Construction | 129 (56.3%) | 100 (43.7%) |
| Manufacturing | 80 (89.9%) | 9 (10.1%) |
| Wholesale Trade | 0 (0.0%) | 0 (0.0%) |
| Retail Trade | 232 (82.6%) | 49 (17.4%) |
| Transportation & Warehousing | 72 (100.0%) | 0 (0.0%) |
| Utilities | 34 (100.0%) | 0 (0.0%) |
| Information | 65 (89.0%) | 8 (11.0%) |
| Finance & Insurance | 88 (31.8%) | 189 (68.2%) |
| Real Estate, Rental & Leasing | 20 (62.5%) | 12 (37.5%) |
| Professional & Scientific | 160 (51.8%) | 149 (48.2%) |
| Enterprise Management | 0 (0.0%) | 0 (0.0%) |
| Administrative & Support | 74 (72.6%) | 28 (27.5%) |
| Educational Services | 212 (55.1%) | 173 (44.9%) |
| Health Care & Social Assistance | 192 (40.3%) | 285 (59.8%) |
| Arts, Entertainment & Recreation | 8 (23.5%) | 26 (76.5%) |
| Accommodation & Food Services | 178 (82.4%) | 38 (17.6%) |
| Public Administration | 57 (93.4%) | 4 (6.6%) |
| Total | 1,631 (59.2%) | 1,126 (40.8%) |
Education in Manitou Springs
School Enrollment in Manitou Springs
The most common levels of schooling among the 1,095 students in Manitou Springs are high school (336 | 30.7%), college / undergraduate (276 | 25.2%), and elementary school (205 | 18.7%).
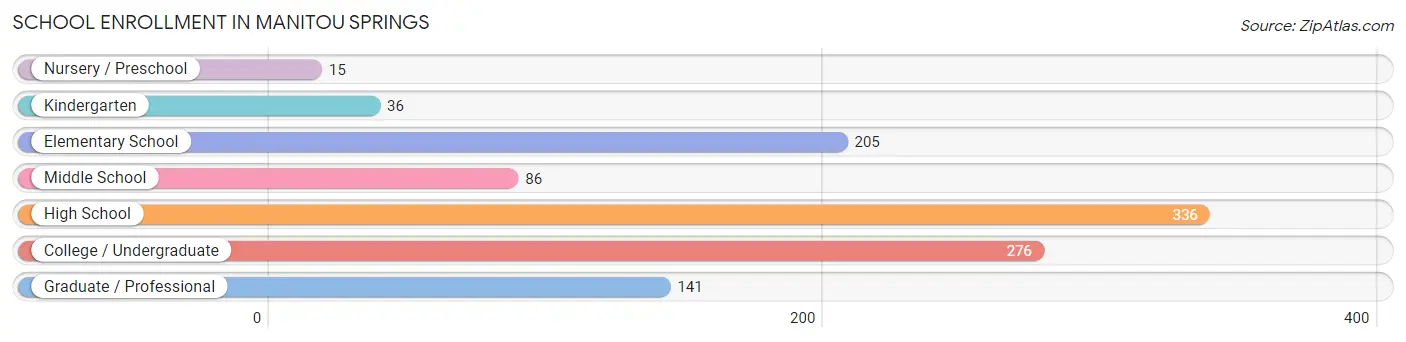
| School Level | # Students | % Students |
| Nursery / Preschool | 15 | 1.4% |
| Kindergarten | 36 | 3.3% |
| Elementary School | 205 | 18.7% |
| Middle School | 86 | 7.9% |
| High School | 336 | 30.7% |
| College / Undergraduate | 276 | 25.2% |
| Graduate / Professional | 141 | 12.9% |
| Total | 1,095 | 100.0% |
School Enrollment by Age by Funding Source in Manitou Springs
Out of a total of 1,095 students who are enrolled in schools in Manitou Springs, 87 (7.9%) attend a private institution, while the remaining 1,008 (92.1%) are enrolled in public schools. The age group of 35 years and over has the highest likelihood of being enrolled in private schools, with 49 (51.6% in the age bracket) enrolled. Conversely, the age group of 10 to 14 year olds has the lowest likelihood of being enrolled in a private school, with 162 (100.0% in the age bracket) attending a public institution.
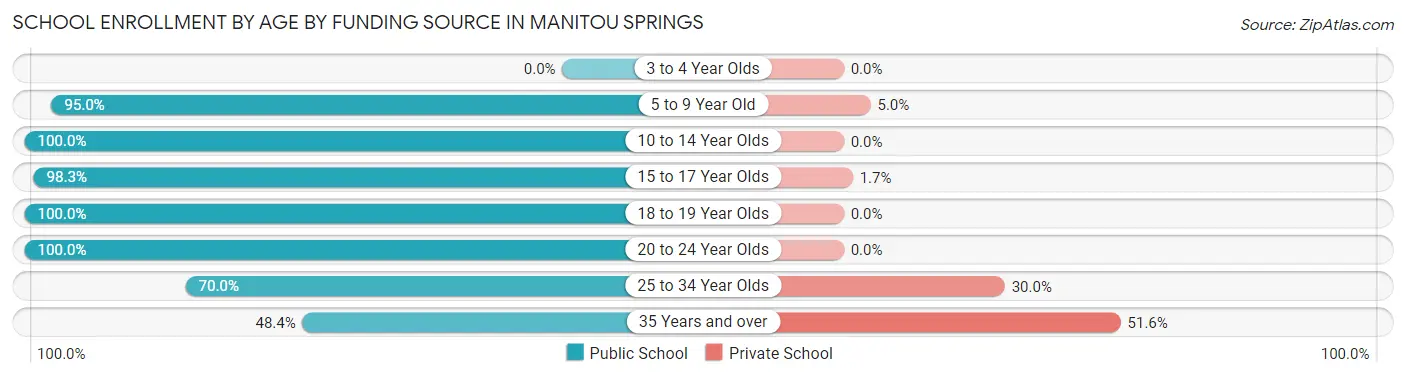
| Age Bracket | Public School | Private School |
| 3 to 4 Year Olds | 0 (0.0%) | 0 (0.0%) |
| 5 to 9 Year Old | 209 (95.0%) | 11 (5.0%) |
| 10 to 14 Year Olds | 162 (100.0%) | 0 (0.0%) |
| 15 to 17 Year Olds | 291 (98.3%) | 5 (1.7%) |
| 18 to 19 Year Olds | 206 (100.0%) | 0 (0.0%) |
| 20 to 24 Year Olds | 46 (100.0%) | 0 (0.0%) |
| 25 to 34 Year Olds | 49 (70.0%) | 21 (30.0%) |
| 35 Years and over | 46 (48.4%) | 49 (51.6%) |
| Total | 1,008 (92.1%) | 87 (7.9%) |
Educational Attainment by Field of Study in Manitou Springs
Business (274 | 11.9%), social sciences (218 | 9.4%), engineering (204 | 8.8%), communications (188 | 8.1%), and visual & performing arts (184 | 8.0%) are the most common fields of study among 2,310 individuals in Manitou Springs who have obtained a bachelor's degree or higher.
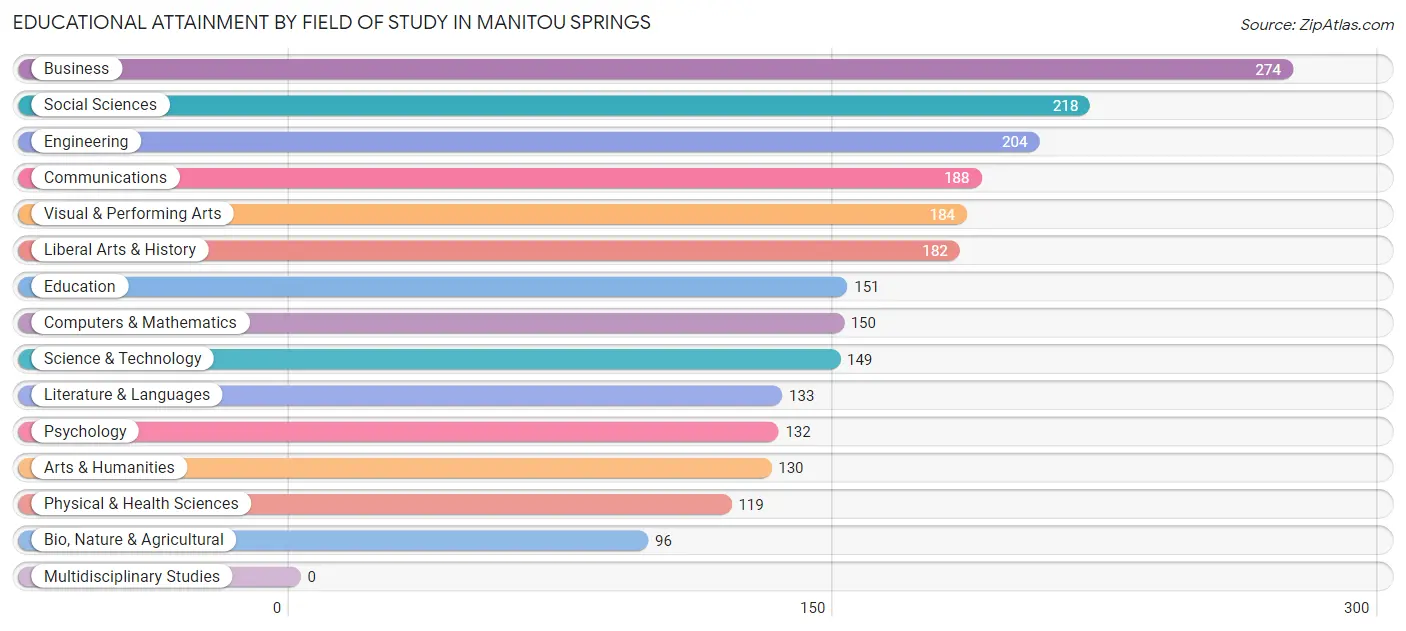
| Field of Study | # Graduates | % Graduates |
| Computers & Mathematics | 150 | 6.5% |
| Bio, Nature & Agricultural | 96 | 4.2% |
| Physical & Health Sciences | 119 | 5.1% |
| Psychology | 132 | 5.7% |
| Social Sciences | 218 | 9.4% |
| Engineering | 204 | 8.8% |
| Multidisciplinary Studies | 0 | 0.0% |
| Science & Technology | 149 | 6.5% |
| Business | 274 | 11.9% |
| Education | 151 | 6.5% |
| Literature & Languages | 133 | 5.8% |
| Liberal Arts & History | 182 | 7.9% |
| Visual & Performing Arts | 184 | 8.0% |
| Communications | 188 | 8.1% |
| Arts & Humanities | 130 | 5.6% |
| Total | 2,310 | 100.0% |
Transportation & Commute in Manitou Springs
Vehicle Availability by Sex in Manitou Springs
The most prevalent vehicle ownership categories in Manitou Springs are males with 2 vehicles (699, accounting for 42.5%) and females with 2 vehicles (438, making up 62.1%).
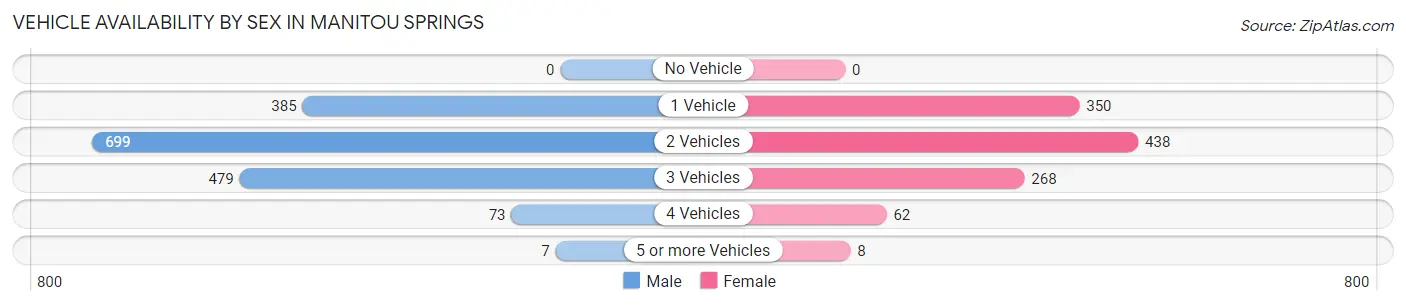
| Vehicles Available | Male | Female |
| No Vehicle | 0 (0.0%) | 0 (0.0%) |
| 1 Vehicle | 385 (23.4%) | 350 (31.1%) |
| 2 Vehicles | 699 (42.5%) | 438 (38.9%) |
| 3 Vehicles | 479 (29.1%) | 268 (23.8%) |
| 4 Vehicles | 73 (4.4%) | 62 (5.5%) |
| 5 or more Vehicles | 7 (0.4%) | 8 (0.7%) |
| Total | 1,643 (100.0%) | 1,126 (100.0%) |
Commute Time in Manitou Springs
The most frequently occuring commute durations in Manitou Springs are 30 to 34 minutes (501 commuters, 23.6%), 20 to 24 minutes (360 commuters, 16.9%), and 25 to 29 minutes (301 commuters, 14.2%).
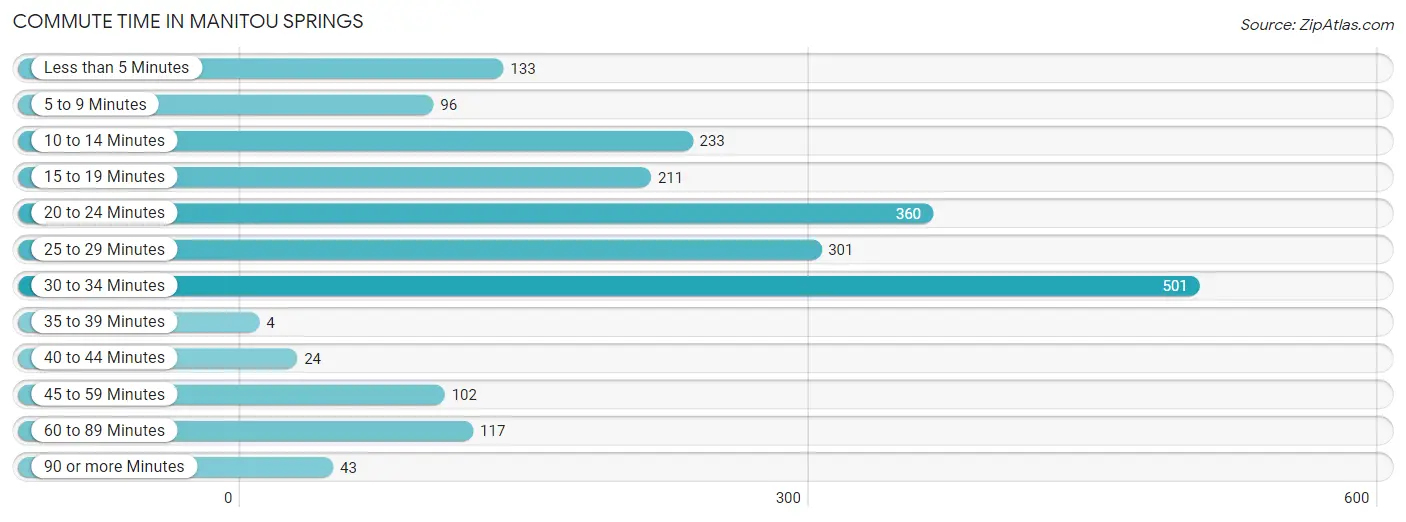
| Commute Time | # Commuters | % Commuters |
| Less than 5 Minutes | 133 | 6.3% |
| 5 to 9 Minutes | 96 | 4.5% |
| 10 to 14 Minutes | 233 | 11.0% |
| 15 to 19 Minutes | 211 | 9.9% |
| 20 to 24 Minutes | 360 | 16.9% |
| 25 to 29 Minutes | 301 | 14.2% |
| 30 to 34 Minutes | 501 | 23.6% |
| 35 to 39 Minutes | 4 | 0.2% |
| 40 to 44 Minutes | 24 | 1.1% |
| 45 to 59 Minutes | 102 | 4.8% |
| 60 to 89 Minutes | 117 | 5.5% |
| 90 or more Minutes | 43 | 2.0% |
Commute Time by Sex in Manitou Springs
The most common commute times in Manitou Springs are 20 to 24 minutes (292 commuters, 21.6%) for males and 30 to 34 minutes (216 commuters, 27.9%) for females.
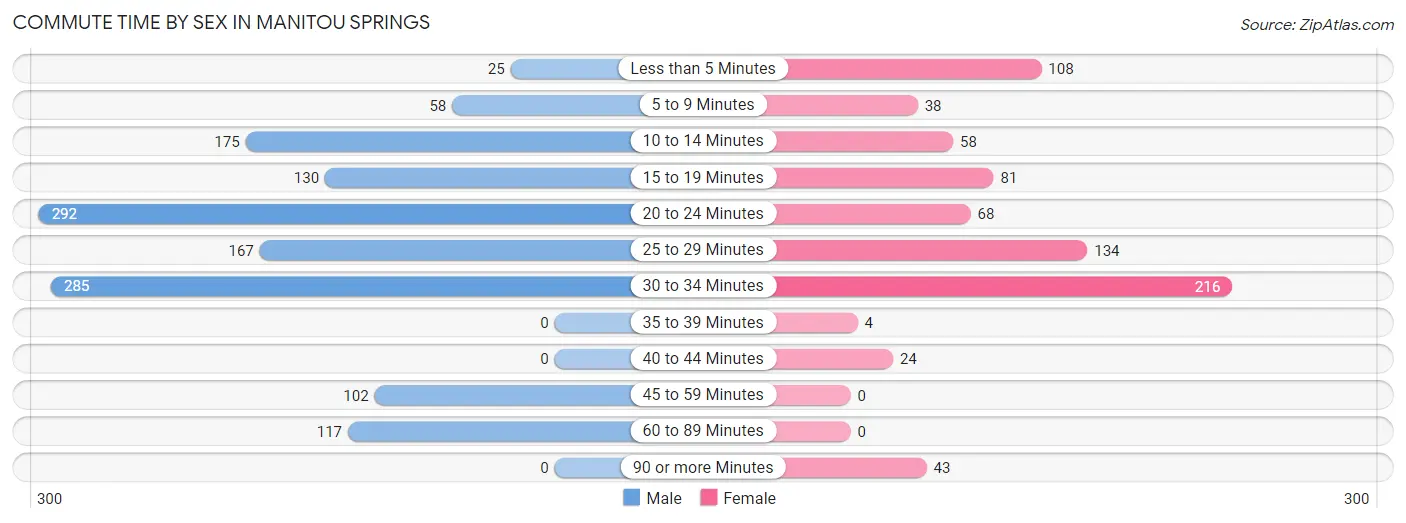
| Commute Time | Male | Female |
| Less than 5 Minutes | 25 (1.8%) | 108 (14.0%) |
| 5 to 9 Minutes | 58 (4.3%) | 38 (4.9%) |
| 10 to 14 Minutes | 175 (13.0%) | 58 (7.5%) |
| 15 to 19 Minutes | 130 (9.6%) | 81 (10.5%) |
| 20 to 24 Minutes | 292 (21.6%) | 68 (8.8%) |
| 25 to 29 Minutes | 167 (12.4%) | 134 (17.3%) |
| 30 to 34 Minutes | 285 (21.1%) | 216 (27.9%) |
| 35 to 39 Minutes | 0 (0.0%) | 4 (0.5%) |
| 40 to 44 Minutes | 0 (0.0%) | 24 (3.1%) |
| 45 to 59 Minutes | 102 (7.5%) | 0 (0.0%) |
| 60 to 89 Minutes | 117 (8.7%) | 0 (0.0%) |
| 90 or more Minutes | 0 (0.0%) | 43 (5.6%) |
Time of Departure to Work by Sex in Manitou Springs
The most frequent times of departure to work in Manitou Springs are 7:00 AM to 7:29 AM (347, 25.7%) for males and 7:00 AM to 7:29 AM (215, 27.8%) for females.
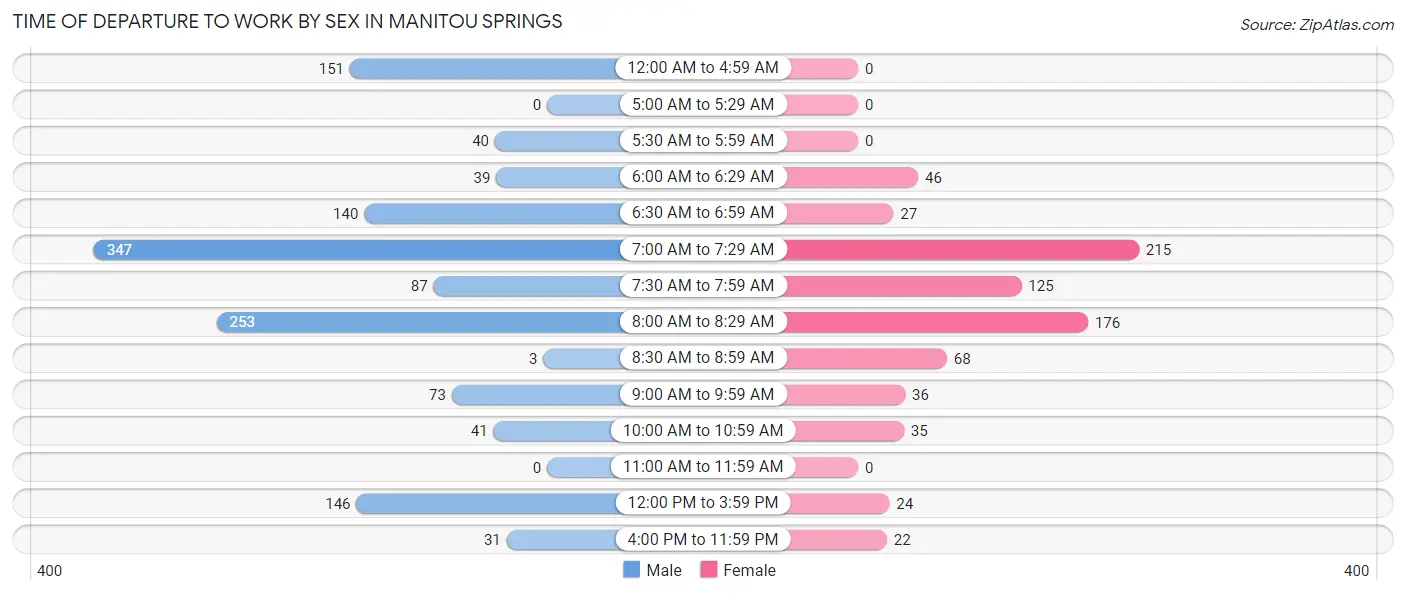
| Time of Departure | Male | Female |
| 12:00 AM to 4:59 AM | 151 (11.2%) | 0 (0.0%) |
| 5:00 AM to 5:29 AM | 0 (0.0%) | 0 (0.0%) |
| 5:30 AM to 5:59 AM | 40 (3.0%) | 0 (0.0%) |
| 6:00 AM to 6:29 AM | 39 (2.9%) | 46 (5.9%) |
| 6:30 AM to 6:59 AM | 140 (10.4%) | 27 (3.5%) |
| 7:00 AM to 7:29 AM | 347 (25.7%) | 215 (27.8%) |
| 7:30 AM to 7:59 AM | 87 (6.4%) | 125 (16.2%) |
| 8:00 AM to 8:29 AM | 253 (18.7%) | 176 (22.7%) |
| 8:30 AM to 8:59 AM | 3 (0.2%) | 68 (8.8%) |
| 9:00 AM to 9:59 AM | 73 (5.4%) | 36 (4.6%) |
| 10:00 AM to 10:59 AM | 41 (3.0%) | 35 (4.5%) |
| 11:00 AM to 11:59 AM | 0 (0.0%) | 0 (0.0%) |
| 12:00 PM to 3:59 PM | 146 (10.8%) | 24 (3.1%) |
| 4:00 PM to 11:59 PM | 31 (2.3%) | 22 (2.8%) |
| Total | 1,351 (100.0%) | 774 (100.0%) |
Housing Occupancy in Manitou Springs
Occupancy by Ownership in Manitou Springs
Of the total 2,349 dwellings in Manitou Springs, owner-occupied units account for 1,267 (53.9%), while renter-occupied units make up 1,082 (46.1%).
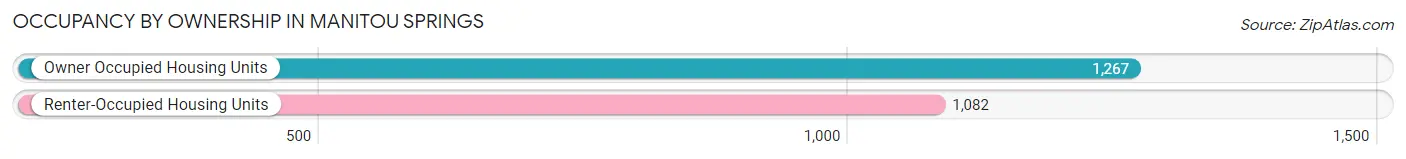
| Occupancy | # Housing Units | % Housing Units |
| Owner Occupied Housing Units | 1,267 | 53.9% |
| Renter-Occupied Housing Units | 1,082 | 46.1% |
| Total Occupied Housing Units | 2,349 | 100.0% |
Occupancy by Household Size in Manitou Springs
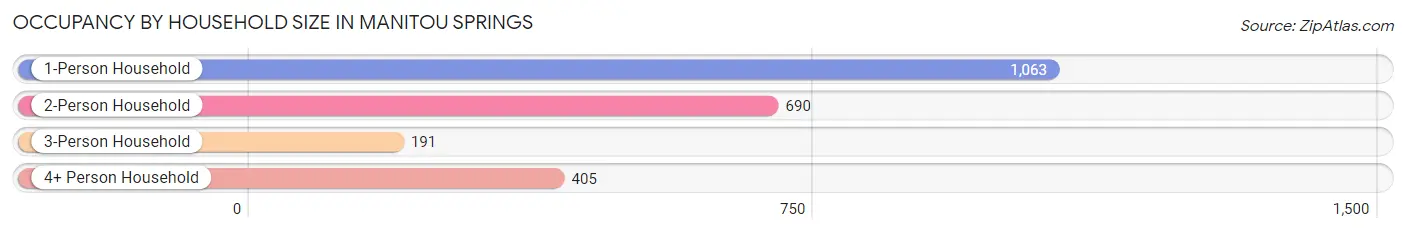
| Household Size | # Housing Units | % Housing Units |
| 1-Person Household | 1,063 | 45.3% |
| 2-Person Household | 690 | 29.4% |
| 3-Person Household | 191 | 8.1% |
| 4+ Person Household | 405 | 17.2% |
| Total Housing Units | 2,349 | 100.0% |
Occupancy by Ownership by Household Size in Manitou Springs
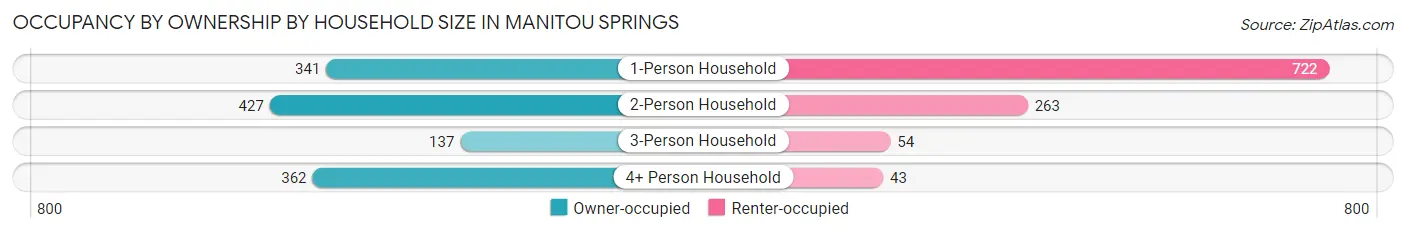
| Household Size | Owner-occupied | Renter-occupied |
| 1-Person Household | 341 (32.1%) | 722 (67.9%) |
| 2-Person Household | 427 (61.9%) | 263 (38.1%) |
| 3-Person Household | 137 (71.7%) | 54 (28.3%) |
| 4+ Person Household | 362 (89.4%) | 43 (10.6%) |
| Total Housing Units | 1,267 (53.9%) | 1,082 (46.1%) |
Occupancy by Educational Attainment in Manitou Springs
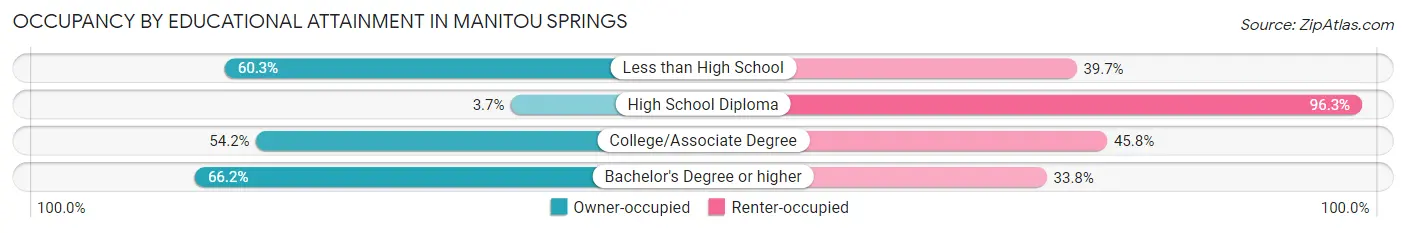
| Household Size | Owner-occupied | Renter-occupied |
| Less than High School | 82 (60.3%) | 54 (39.7%) |
| High School Diploma | 12 (3.7%) | 312 (96.3%) |
| College/Associate Degree | 352 (54.2%) | 297 (45.8%) |
| Bachelor's Degree or higher | 821 (66.2%) | 419 (33.8%) |
Occupancy by Age of Householder in Manitou Springs
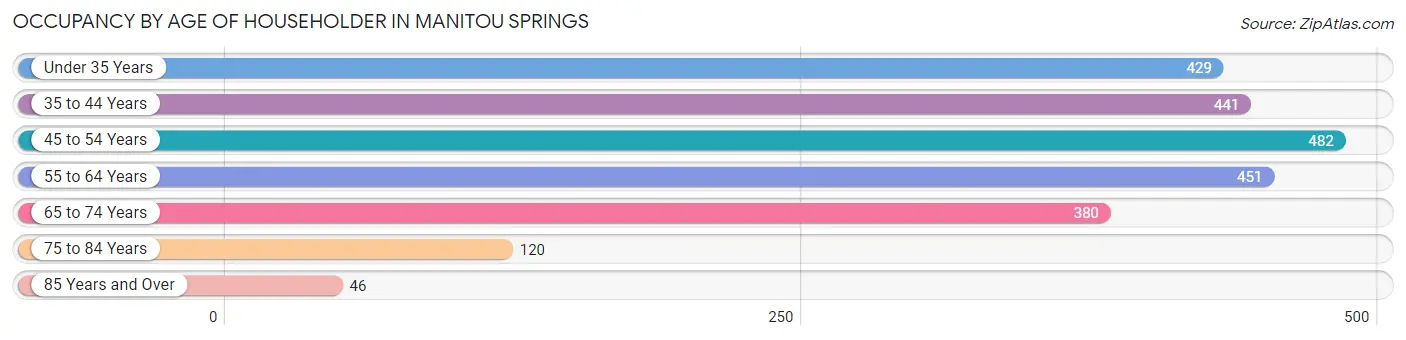
| Age Bracket | # Households | % Households |
| Under 35 Years | 429 | 18.3% |
| 35 to 44 Years | 441 | 18.8% |
| 45 to 54 Years | 482 | 20.5% |
| 55 to 64 Years | 451 | 19.2% |
| 65 to 74 Years | 380 | 16.2% |
| 75 to 84 Years | 120 | 5.1% |
| 85 Years and Over | 46 | 2.0% |
| Total | 2,349 | 100.0% |
Housing Finances in Manitou Springs
Median Income by Occupancy in Manitou Springs
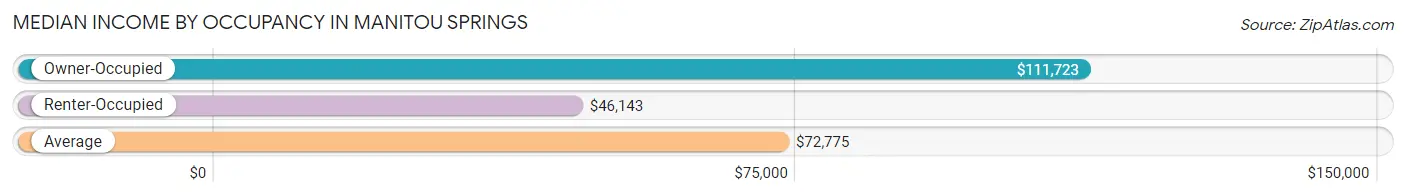
| Occupancy Type | # Households | Median Income |
| Owner-Occupied | 1,267 (53.9%) | $111,723 |
| Renter-Occupied | 1,082 (46.1%) | $46,143 |
| Average | 2,349 (100.0%) | $72,775 |
Occupancy by Householder Income Bracket in Manitou Springs
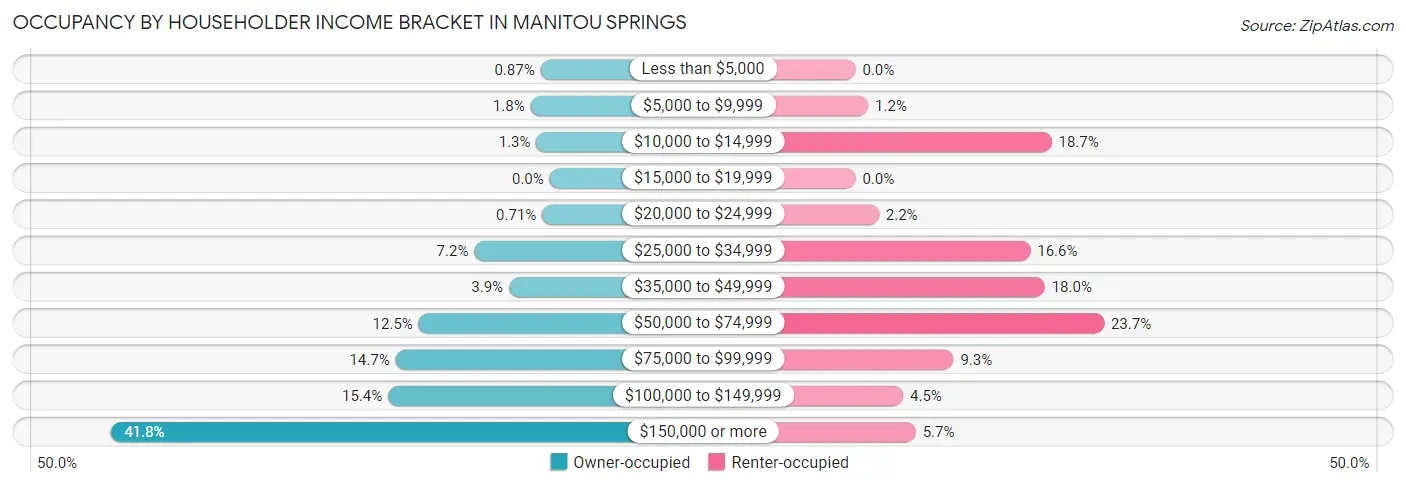
| Income Bracket | Owner-occupied | Renter-occupied |
| Less than $5,000 | 11 (0.9%) | 0 (0.0%) |
| $5,000 to $9,999 | 23 (1.8%) | 13 (1.2%) |
| $10,000 to $14,999 | 16 (1.3%) | 202 (18.7%) |
| $15,000 to $19,999 | 0 (0.0%) | 0 (0.0%) |
| $20,000 to $24,999 | 9 (0.7%) | 24 (2.2%) |
| $25,000 to $34,999 | 91 (7.2%) | 180 (16.6%) |
| $35,000 to $49,999 | 49 (3.9%) | 195 (18.0%) |
| $50,000 to $74,999 | 158 (12.5%) | 256 (23.7%) |
| $75,000 to $99,999 | 186 (14.7%) | 101 (9.3%) |
| $100,000 to $149,999 | 195 (15.4%) | 49 (4.5%) |
| $150,000 or more | 529 (41.7%) | 62 (5.7%) |
| Total | 1,267 (100.0%) | 1,082 (100.0%) |
Monthly Housing Cost Tiers in Manitou Springs
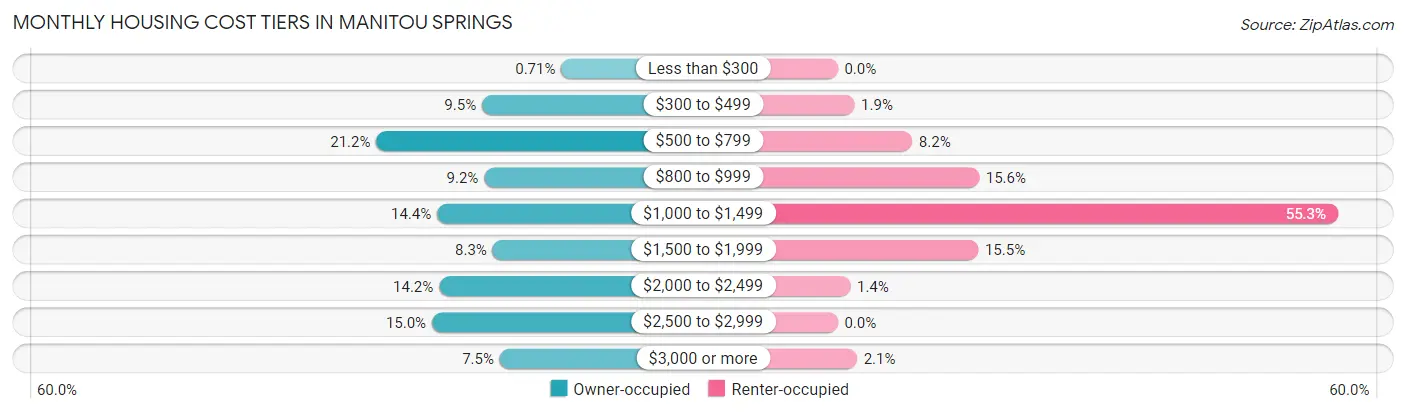
| Monthly Cost | Owner-occupied | Renter-occupied |
| Less than $300 | 9 (0.7%) | 0 (0.0%) |
| $300 to $499 | 120 (9.5%) | 20 (1.8%) |
| $500 to $799 | 268 (21.1%) | 89 (8.2%) |
| $800 to $999 | 117 (9.2%) | 169 (15.6%) |
| $1,000 to $1,499 | 183 (14.4%) | 598 (55.3%) |
| $1,500 to $1,999 | 105 (8.3%) | 168 (15.5%) |
| $2,000 to $2,499 | 180 (14.2%) | 15 (1.4%) |
| $2,500 to $2,999 | 190 (15.0%) | 0 (0.0%) |
| $3,000 or more | 95 (7.5%) | 23 (2.1%) |
| Total | 1,267 (100.0%) | 1,082 (100.0%) |
Physical Housing Characteristics in Manitou Springs
Housing Structures in Manitou Springs
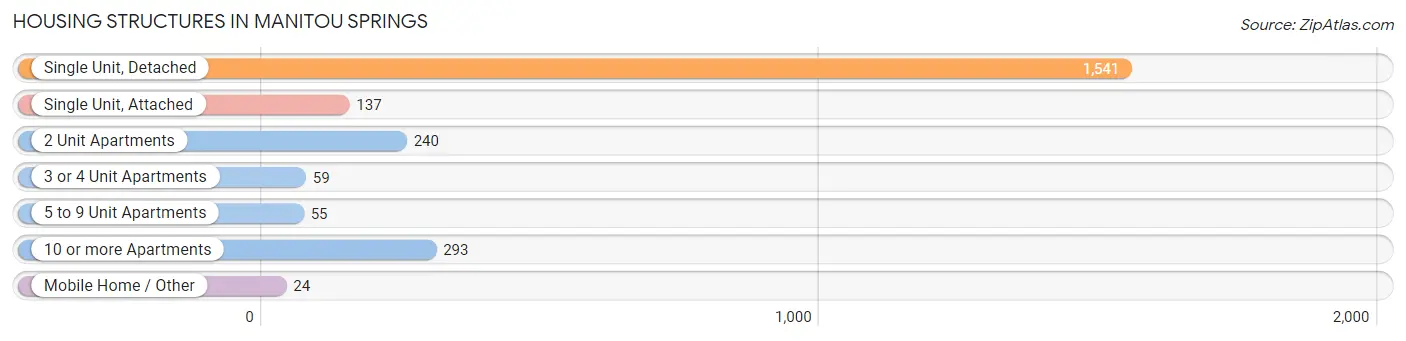
| Structure Type | # Housing Units | % Housing Units |
| Single Unit, Detached | 1,541 | 65.6% |
| Single Unit, Attached | 137 | 5.8% |
| 2 Unit Apartments | 240 | 10.2% |
| 3 or 4 Unit Apartments | 59 | 2.5% |
| 5 to 9 Unit Apartments | 55 | 2.3% |
| 10 or more Apartments | 293 | 12.5% |
| Mobile Home / Other | 24 | 1.0% |
| Total | 2,349 | 100.0% |
Housing Structures by Occupancy in Manitou Springs
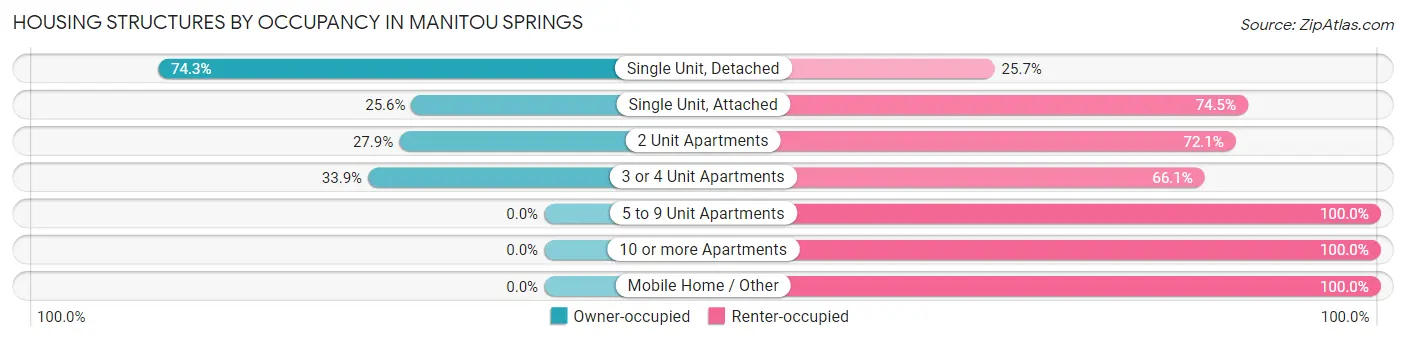
| Structure Type | Owner-occupied | Renter-occupied |
| Single Unit, Detached | 1,145 (74.3%) | 396 (25.7%) |
| Single Unit, Attached | 35 (25.6%) | 102 (74.5%) |
| 2 Unit Apartments | 67 (27.9%) | 173 (72.1%) |
| 3 or 4 Unit Apartments | 20 (33.9%) | 39 (66.1%) |
| 5 to 9 Unit Apartments | 0 (0.0%) | 55 (100.0%) |
| 10 or more Apartments | 0 (0.0%) | 293 (100.0%) |
| Mobile Home / Other | 0 (0.0%) | 24 (100.0%) |
| Total | 1,267 (53.9%) | 1,082 (46.1%) |
Housing Structures by Number of Rooms in Manitou Springs
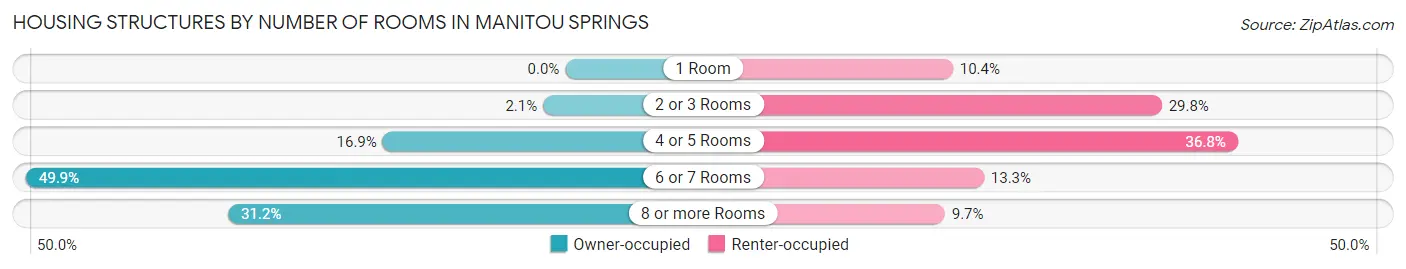
| Number of Rooms | Owner-occupied | Renter-occupied |
| 1 Room | 0 (0.0%) | 113 (10.4%) |
| 2 or 3 Rooms | 26 (2.1%) | 322 (29.8%) |
| 4 or 5 Rooms | 214 (16.9%) | 398 (36.8%) |
| 6 or 7 Rooms | 632 (49.9%) | 144 (13.3%) |
| 8 or more Rooms | 395 (31.2%) | 105 (9.7%) |
| Total | 1,267 (100.0%) | 1,082 (100.0%) |
Housing Structure by Heating Type in Manitou Springs
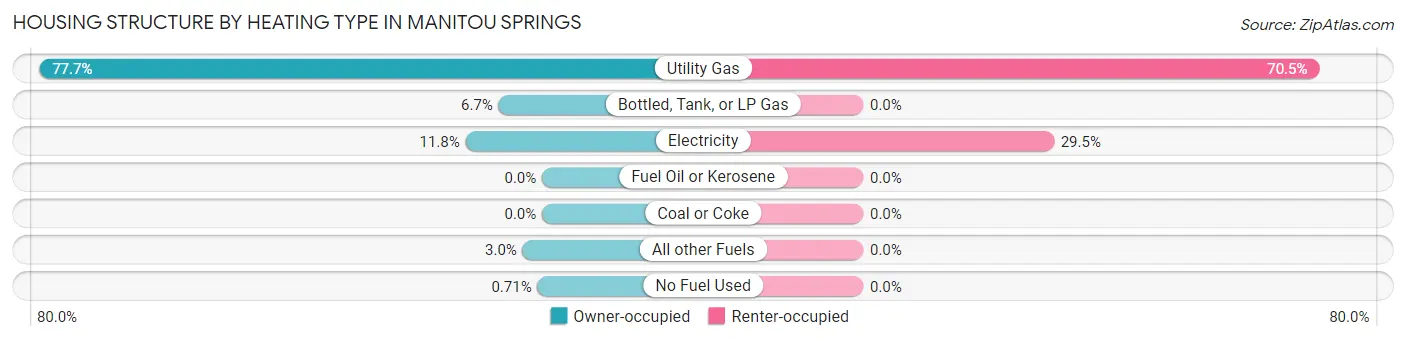
| Heating Type | Owner-occupied | Renter-occupied |
| Utility Gas | 985 (77.7%) | 763 (70.5%) |
| Bottled, Tank, or LP Gas | 85 (6.7%) | 0 (0.0%) |
| Electricity | 150 (11.8%) | 319 (29.5%) |
| Fuel Oil or Kerosene | 0 (0.0%) | 0 (0.0%) |
| Coal or Coke | 0 (0.0%) | 0 (0.0%) |
| All other Fuels | 38 (3.0%) | 0 (0.0%) |
| No Fuel Used | 9 (0.7%) | 0 (0.0%) |
| Total | 1,267 (100.0%) | 1,082 (100.0%) |
Household Vehicle Usage in Manitou Springs
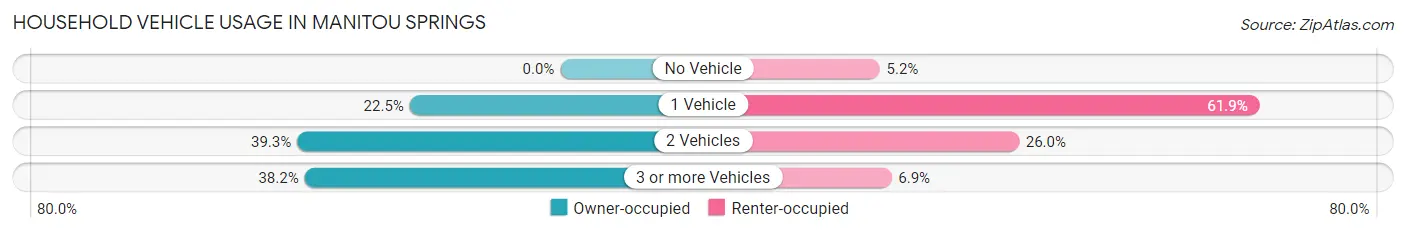
| Vehicles per Household | Owner-occupied | Renter-occupied |
| No Vehicle | 0 (0.0%) | 56 (5.2%) |
| 1 Vehicle | 285 (22.5%) | 670 (61.9%) |
| 2 Vehicles | 498 (39.3%) | 281 (26.0%) |
| 3 or more Vehicles | 484 (38.2%) | 75 (6.9%) |
| Total | 1,267 (100.0%) | 1,082 (100.0%) |
Real Estate & Mortgages in Manitou Springs
Real Estate and Mortgage Overview in Manitou Springs
| Characteristic | Without Mortgage | With Mortgage |
| Housing Units | 548 | 719 |
| Median Property Value | $541,400 | $486,000 |
| Median Household Income | $110,500 | $326 |
| Monthly Housing Costs | $701 | $95 |
| Real Estate Taxes | $2,353 | $0 |
Property Value by Mortgage Status in Manitou Springs
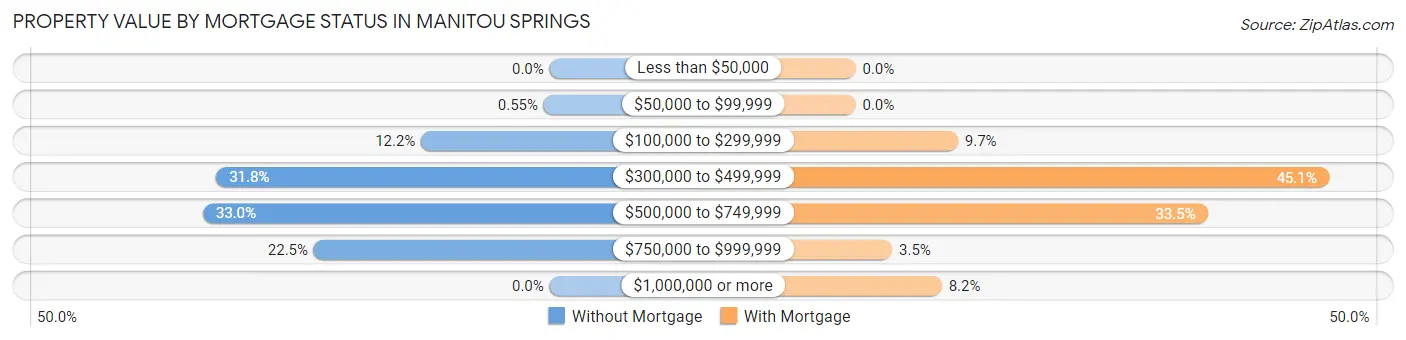
| Property Value | Without Mortgage | With Mortgage |
| Less than $50,000 | 0 (0.0%) | 0 (0.0%) |
| $50,000 to $99,999 | 3 (0.5%) | 0 (0.0%) |
| $100,000 to $299,999 | 67 (12.2%) | 70 (9.7%) |
| $300,000 to $499,999 | 174 (31.8%) | 324 (45.1%) |
| $500,000 to $749,999 | 181 (33.0%) | 241 (33.5%) |
| $750,000 to $999,999 | 123 (22.5%) | 25 (3.5%) |
| $1,000,000 or more | 0 (0.0%) | 59 (8.2%) |
| Total | 548 (100.0%) | 719 (100.0%) |
Household Income by Mortgage Status in Manitou Springs
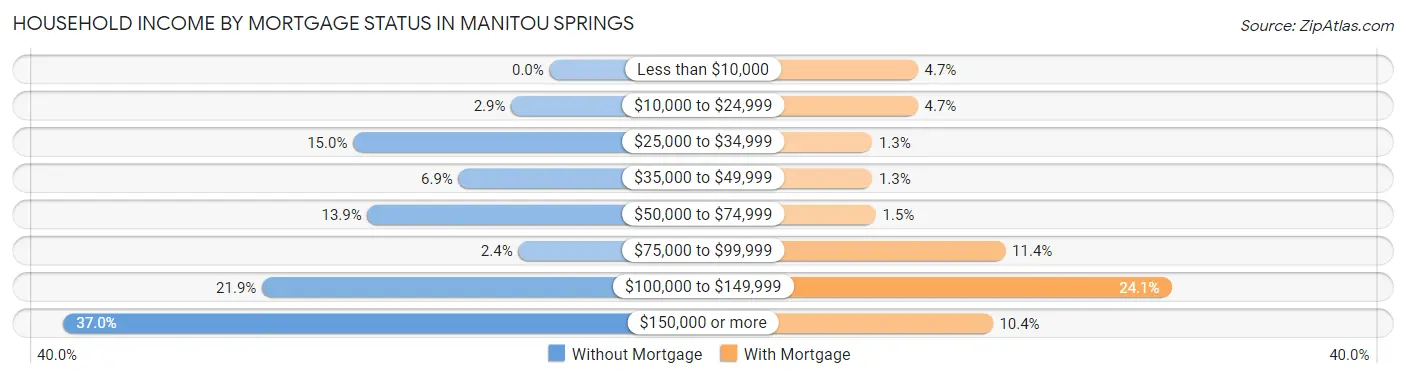
| Household Income | Without Mortgage | With Mortgage |
| Less than $10,000 | 0 (0.0%) | 34 (4.7%) |
| $10,000 to $24,999 | 16 (2.9%) | 34 (4.7%) |
| $25,000 to $34,999 | 82 (15.0%) | 9 (1.3%) |
| $35,000 to $49,999 | 38 (6.9%) | 9 (1.3%) |
| $50,000 to $74,999 | 76 (13.9%) | 11 (1.5%) |
| $75,000 to $99,999 | 13 (2.4%) | 82 (11.4%) |
| $100,000 to $149,999 | 120 (21.9%) | 173 (24.1%) |
| $150,000 or more | 203 (37.0%) | 75 (10.4%) |
| Total | 548 (100.0%) | 719 (100.0%) |
Property Value to Household Income Ratio in Manitou Springs
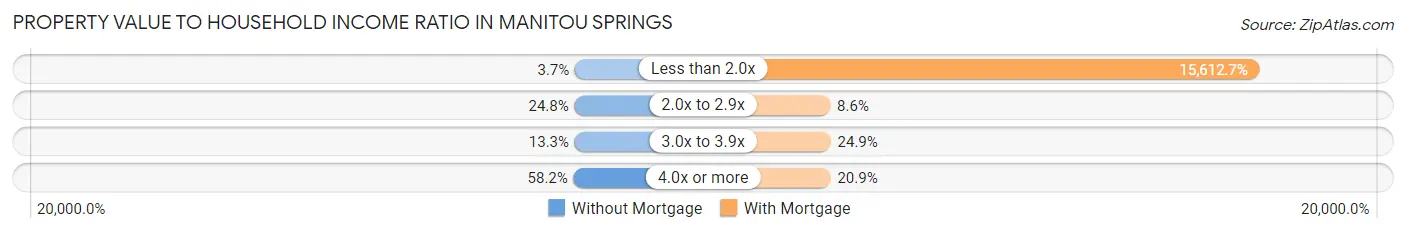
| Value-to-Income Ratio | Without Mortgage | With Mortgage |
| Less than 2.0x | 20 (3.6%) | 112,255 (15,612.7%) |
| 2.0x to 2.9x | 136 (24.8%) | 62 (8.6%) |
| 3.0x to 3.9x | 73 (13.3%) | 179 (24.9%) |
| 4.0x or more | 319 (58.2%) | 150 (20.9%) |
| Total | 548 (100.0%) | 719 (100.0%) |
Real Estate Taxes by Mortgage Status in Manitou Springs
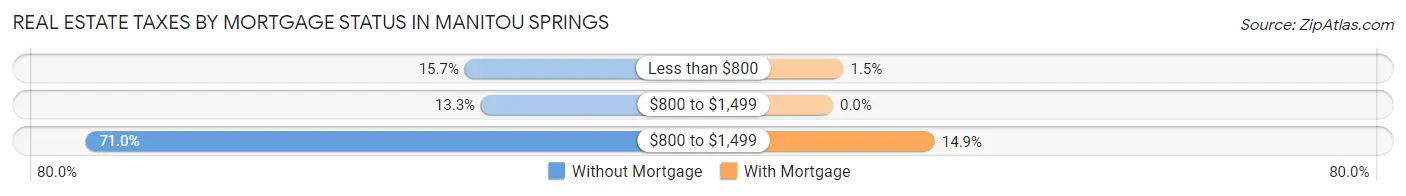
| Property Taxes | Without Mortgage | With Mortgage |
| Less than $800 | 86 (15.7%) | 11 (1.5%) |
| $800 to $1,499 | 73 (13.3%) | 0 (0.0%) |
| $800 to $1,499 | 389 (71.0%) | 107 (14.9%) |
| Total | 548 (100.0%) | 719 (100.0%) |
Health & Disability in Manitou Springs
Health Insurance Coverage by Age in Manitou Springs
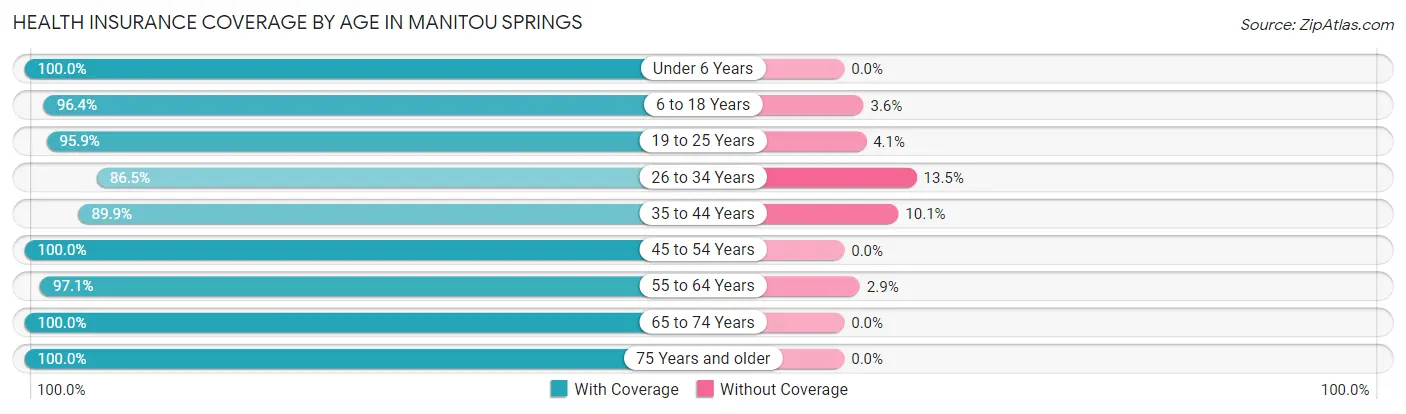
| Age Bracket | With Coverage | Without Coverage |
| Under 6 Years | 98 (100.0%) | 0 (0.0%) |
| 6 to 18 Years | 805 (96.4%) | 30 (3.6%) |
| 19 to 25 Years | 306 (95.9%) | 13 (4.1%) |
| 26 to 34 Years | 520 (86.5%) | 81 (13.5%) |
| 35 to 44 Years | 615 (89.9%) | 69 (10.1%) |
| 45 to 54 Years | 782 (100.0%) | 0 (0.0%) |
| 55 to 64 Years | 667 (97.1%) | 20 (2.9%) |
| 65 to 74 Years | 601 (100.0%) | 0 (0.0%) |
| 75 Years and older | 229 (100.0%) | 0 (0.0%) |
| Total | 4,623 (95.6%) | 213 (4.4%) |
Health Insurance Coverage by Citizenship Status in Manitou Springs
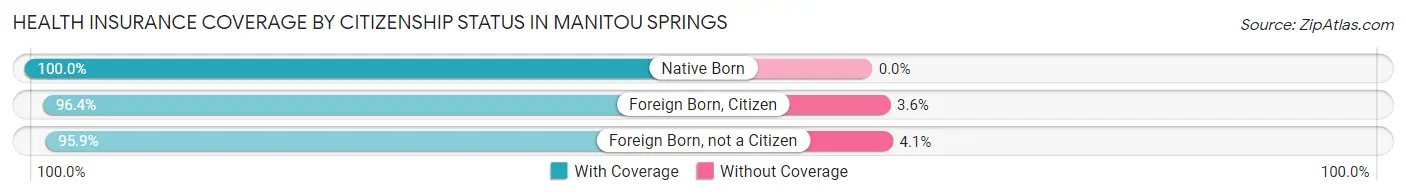
| Citizenship Status | With Coverage | Without Coverage |
| Native Born | 98 (100.0%) | 0 (0.0%) |
| Foreign Born, Citizen | 805 (96.4%) | 30 (3.6%) |
| Foreign Born, not a Citizen | 306 (95.9%) | 13 (4.1%) |
Health Insurance Coverage by Household Income in Manitou Springs
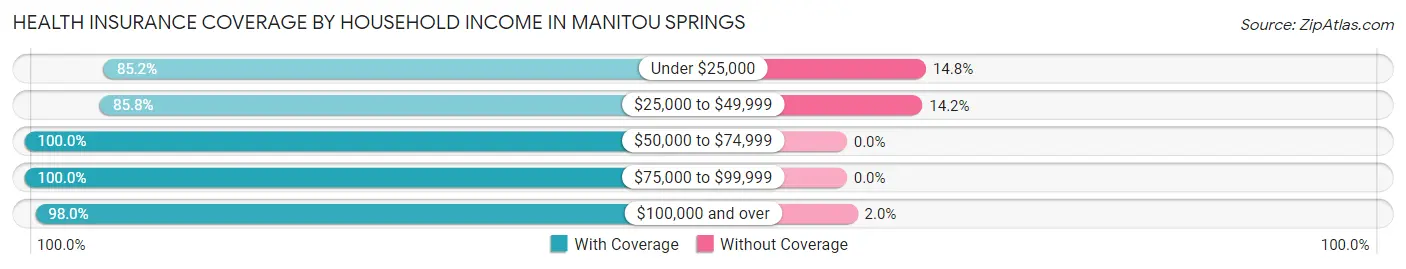
| Household Income | With Coverage | Without Coverage |
| Under $25,000 | 287 (85.2%) | 50 (14.8%) |
| $25,000 to $49,999 | 588 (85.8%) | 97 (14.2%) |
| $50,000 to $74,999 | 602 (100.0%) | 0 (0.0%) |
| $75,000 to $99,999 | 785 (100.0%) | 0 (0.0%) |
| $100,000 and over | 2,334 (98.0%) | 48 (2.0%) |
Public vs Private Health Insurance Coverage by Age in Manitou Springs
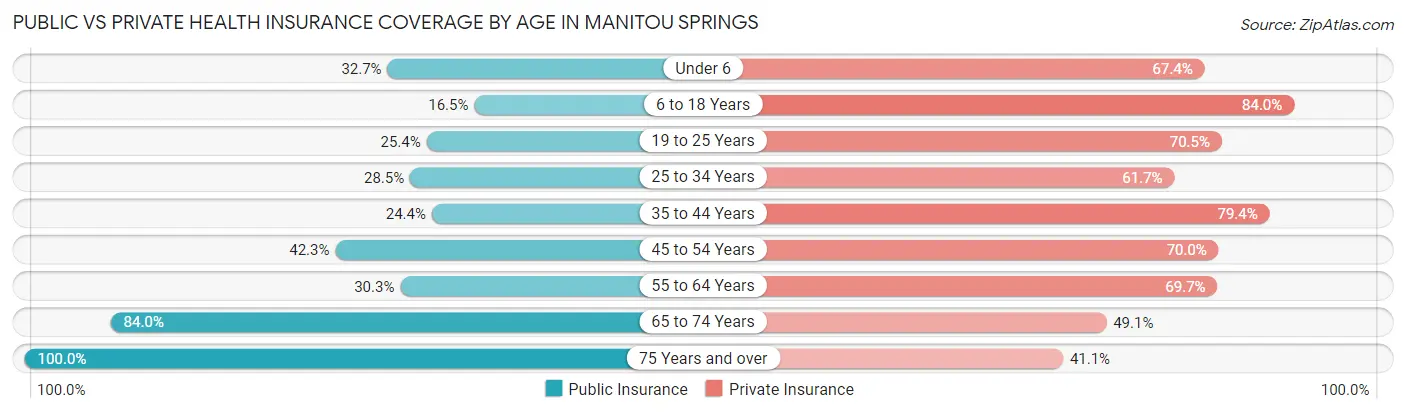
| Age Bracket | Public Insurance | Private Insurance |
| Under 6 | 32 (32.7%) | 66 (67.3%) |
| 6 to 18 Years | 138 (16.5%) | 701 (84.0%) |
| 19 to 25 Years | 81 (25.4%) | 225 (70.5%) |
| 25 to 34 Years | 171 (28.4%) | 371 (61.7%) |
| 35 to 44 Years | 167 (24.4%) | 543 (79.4%) |
| 45 to 54 Years | 331 (42.3%) | 547 (70.0%) |
| 55 to 64 Years | 208 (30.3%) | 479 (69.7%) |
| 65 to 74 Years | 505 (84.0%) | 295 (49.1%) |
| 75 Years and over | 229 (100.0%) | 94 (41.0%) |
| Total | 1,862 (38.5%) | 3,321 (68.7%) |
Disability Status by Sex by Age in Manitou Springs
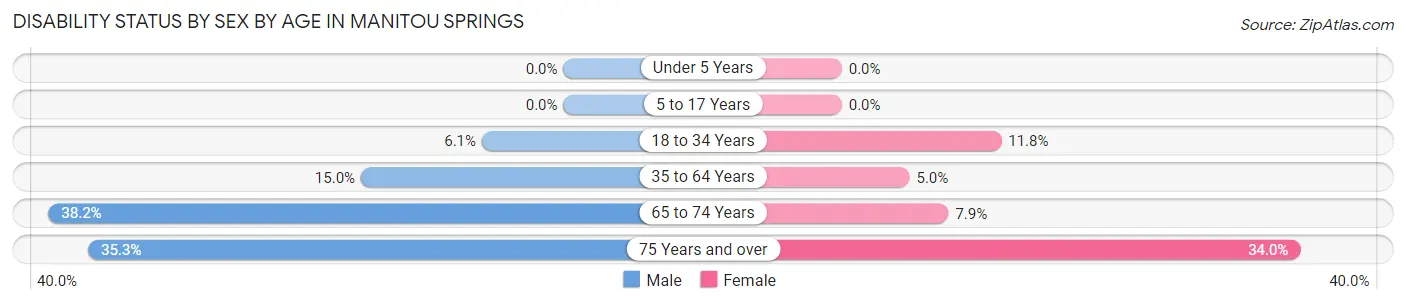
| Age Bracket | Male | Female |
| Under 5 Years | 0 (0.0%) | 0 (0.0%) |
| 5 to 17 Years | 0 (0.0%) | 0 (0.0%) |
| 18 to 34 Years | 42 (6.0%) | 49 (11.8%) |
| 35 to 64 Years | 180 (15.0%) | 48 (5.0%) |
| 65 to 74 Years | 138 (38.2%) | 19 (7.9%) |
| 75 Years and over | 30 (35.3%) | 49 (34.0%) |
Disability Class by Sex by Age in Manitou Springs
Disability Class: Hearing Difficulty
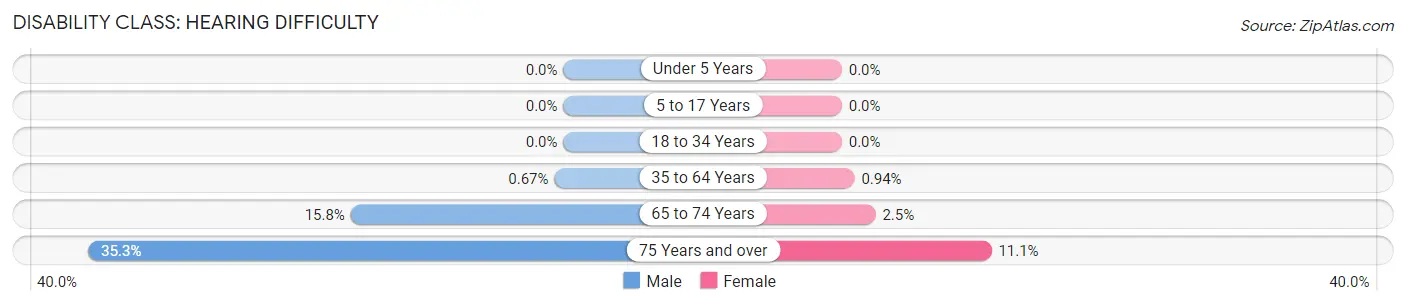
| Age Bracket | Male | Female |
| Under 5 Years | 0 (0.0%) | 0 (0.0%) |
| 5 to 17 Years | 0 (0.0%) | 0 (0.0%) |
| 18 to 34 Years | 0 (0.0%) | 0 (0.0%) |
| 35 to 64 Years | 8 (0.7%) | 9 (0.9%) |
| 65 to 74 Years | 57 (15.8%) | 6 (2.5%) |
| 75 Years and over | 30 (35.3%) | 16 (11.1%) |
Disability Class: Vision Difficulty
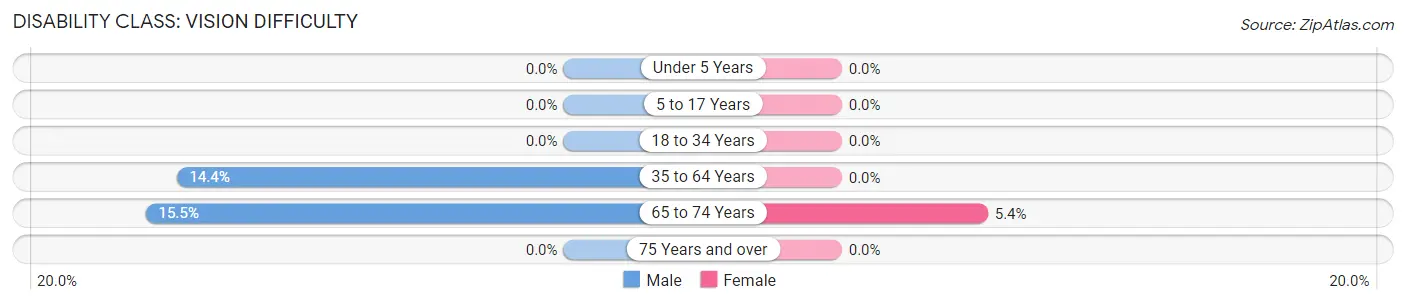
| Age Bracket | Male | Female |
| Under 5 Years | 0 (0.0%) | 0 (0.0%) |
| 5 to 17 Years | 0 (0.0%) | 0 (0.0%) |
| 18 to 34 Years | 0 (0.0%) | 0 (0.0%) |
| 35 to 64 Years | 172 (14.4%) | 0 (0.0%) |
| 65 to 74 Years | 56 (15.5%) | 13 (5.4%) |
| 75 Years and over | 0 (0.0%) | 0 (0.0%) |
Disability Class: Cognitive Difficulty
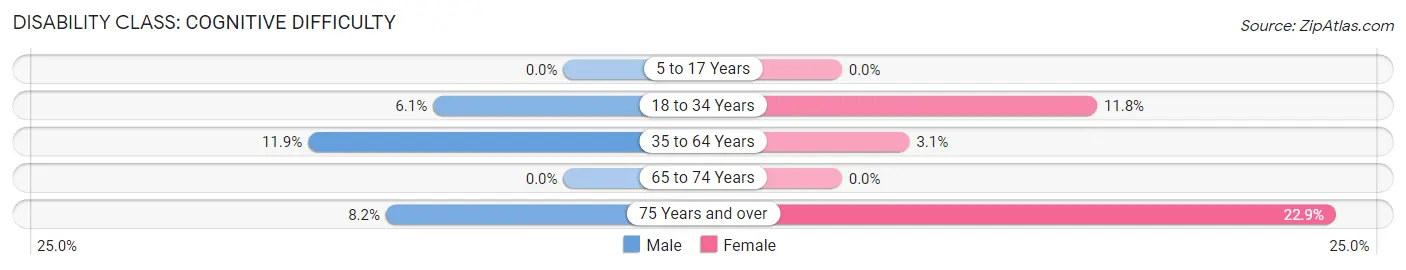
| Age Bracket | Male | Female |
| 5 to 17 Years | 0 (0.0%) | 0 (0.0%) |
| 18 to 34 Years | 42 (6.0%) | 49 (11.8%) |
| 35 to 64 Years | 142 (11.8%) | 30 (3.1%) |
| 65 to 74 Years | 0 (0.0%) | 0 (0.0%) |
| 75 Years and over | 7 (8.2%) | 33 (22.9%) |
Disability Class: Ambulatory Difficulty
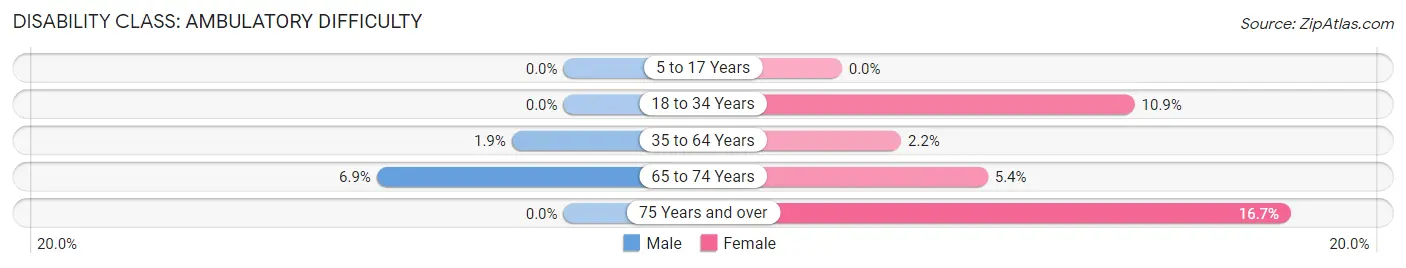
| Age Bracket | Male | Female |
| 5 to 17 Years | 0 (0.0%) | 0 (0.0%) |
| 18 to 34 Years | 0 (0.0%) | 45 (10.9%) |
| 35 to 64 Years | 23 (1.9%) | 21 (2.2%) |
| 65 to 74 Years | 25 (6.9%) | 13 (5.4%) |
| 75 Years and over | 0 (0.0%) | 24 (16.7%) |
Disability Class: Self-Care Difficulty
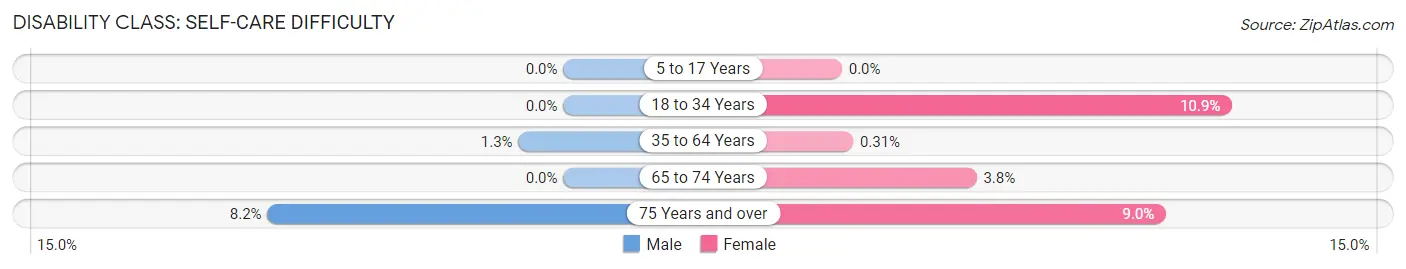
| Age Bracket | Male | Female |
| 5 to 17 Years | 0 (0.0%) | 0 (0.0%) |
| 18 to 34 Years | 0 (0.0%) | 45 (10.9%) |
| 35 to 64 Years | 15 (1.3%) | 3 (0.3%) |
| 65 to 74 Years | 0 (0.0%) | 9 (3.7%) |
| 75 Years and over | 7 (8.2%) | 13 (9.0%) |
Technology Access in Manitou Springs
Computing Device Access in Manitou Springs
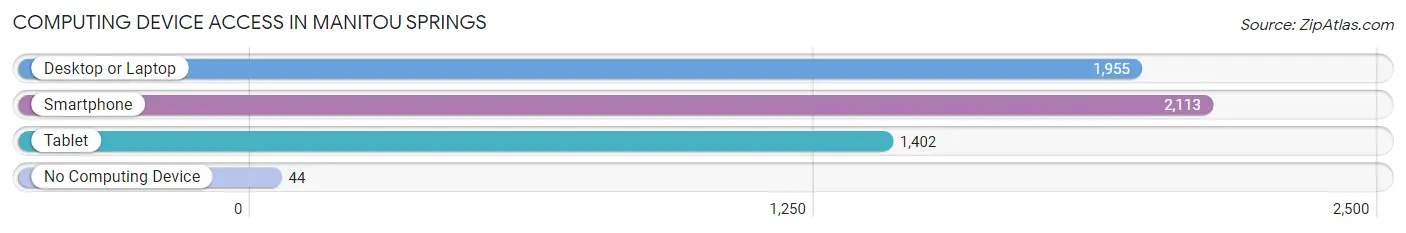
| Device Type | # Households | % Households |
| Desktop or Laptop | 1,955 | 83.2% |
| Smartphone | 2,113 | 89.9% |
| Tablet | 1,402 | 59.7% |
| No Computing Device | 44 | 1.9% |
| Total | 2,349 | 100.0% |
Internet Access in Manitou Springs
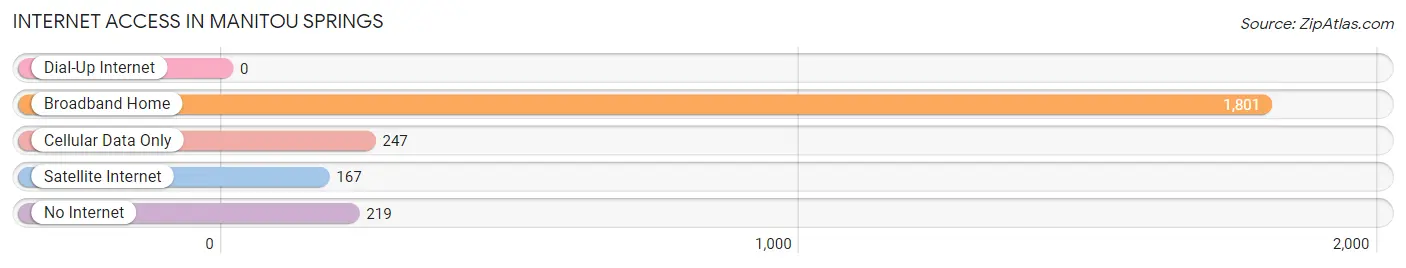
| Internet Type | # Households | % Households |
| Dial-Up Internet | 0 | 0.0% |
| Broadband Home | 1,801 | 76.7% |
| Cellular Data Only | 247 | 10.5% |
| Satellite Internet | 167 | 7.1% |
| No Internet | 219 | 9.3% |
| Total | 2,349 | 100.0% |
Manitou Springs Summary
Manitou Springs is a small city located in El Paso County, Colorado, United States. It is situated at the foot of Pikes Peak, just west of Colorado Springs. The city is known for its mineral springs, unique architecture, and vibrant culture.
History
The area that is now Manitou Springs has been inhabited by Native Americans for thousands of years. The Ute people were the first to settle in the area, followed by the Arapaho and Cheyenne. The first Europeans to arrive in the area were Spanish explorers in the late 1700s.
In 1872, General William Palmer founded the town of Manitou Springs. He named it after the mineral springs that were located in the area. The town quickly became a popular destination for tourists, who came to take advantage of the healing properties of the mineral springs.
In the late 1800s, Manitou Springs became a popular destination for artists, writers, and other creative types. The town was home to a number of famous writers, including Helen Hunt Jackson, who wrote the novel Ramona.
Geography
Manitou Springs is located in El Paso County, Colorado, at the foot of Pikes Peak. The city is situated at an elevation of 6,400 feet above sea level. The city covers an area of 2.6 square miles, and is bordered by the cities of Colorado Springs and Cascade.
The city is located in a valley surrounded by mountains. The most prominent mountain in the area is Pikes Peak, which rises to an elevation of 14,115 feet. The city is also home to several other peaks, including Red Mountain, Iron Mountain, and Mount Manitou.
The city is located in a semi-arid climate, with hot summers and cold winters. The average annual temperature is 54 degrees Fahrenheit, and the average annual precipitation is 16 inches.
Economy
Manitou Springs is a popular tourist destination, and the city’s economy is largely based on tourism. The city is home to a number of attractions, including the Manitou Cliff Dwellings, the Manitou Incline, and the Cave of the Winds.
The city is also home to a number of restaurants, shops, and galleries. The city’s economy is also supported by the nearby military bases, including Fort Carson and Peterson Air Force Base.
Demographics
As of the 2010 census, the population of Manitou Springs was 5,245. The population is predominantly white (90.2%), with small percentages of African American (2.2%), Hispanic (2.2%), and Asian (1.2%) residents.
The median household income in Manitou Springs is $50,945, and the median home value is $310,000. The city has a poverty rate of 11.3%, and the unemployment rate is 4.2%.
Conclusion
Manitou Springs is a small city located in El Paso County, Colorado, at the foot of Pikes Peak. The city is known for its mineral springs, unique architecture, and vibrant culture. The city’s economy is largely based on tourism, and the city is home to a number of attractions, restaurants, shops, and galleries. The population of Manitou Springs is predominantly white, with small percentages of African American, Hispanic, and Asian residents. The median household income in Manitou Springs is $50,945, and the median home value is $310,000.
Common Questions
What is Per Capita Income in Manitou Springs?
Per Capita income in Manitou Springs is $55,929.
What is the Median Family Income in Manitou Springs?
Median Family Income in Manitou Springs is $138,264.
What is the Median Household income in Manitou Springs?
Median Household Income in Manitou Springs is $72,775.
What is Income or Wage Gap in Manitou Springs?
Income or Wage Gap in Manitou Springs is 3.2%.
Women in Manitou Springs earn 96.8 cents for every dollar earned by a man.
What is Inequality or Gini Index in Manitou Springs?
Inequality or Gini Index in Manitou Springs is 0.51.
What is the Total Population of Manitou Springs?
Total Population of Manitou Springs is 4,848.
What is the Total Male Population of Manitou Springs?
Total Male Population of Manitou Springs is 2,710.
What is the Total Female Population of Manitou Springs?
Total Female Population of Manitou Springs is 2,138.
What is the Ratio of Males per 100 Females in Manitou Springs?
There are 126.75 Males per 100 Females in Manitou Springs.
What is the Ratio of Females per 100 Males in Manitou Springs?
There are 78.89 Females per 100 Males in Manitou Springs.
What is the Median Population Age in Manitou Springs?
Median Population Age in Manitou Springs is 44.1 Years.
What is the Average Family Size in Manitou Springs
Average Family Size in Manitou Springs is 2.9 People.
What is the Average Household Size in Manitou Springs
Average Household Size in Manitou Springs is 2.0 People.
How Large is the Labor Force in Manitou Springs?
There are 3,136 People in the Labor Forcein in Manitou Springs.
What is the Percentage of People in the Labor Force in Manitou Springs?
73.8% of People are in the Labor Force in Manitou Springs.
What is the Unemployment Rate in Manitou Springs?
Unemployment Rate in Manitou Springs is 11.8%.