Louisville, CO Map & Demographics
Louisville Map
Louisville Overview
$65,907
PER CAPITA INCOME
$173,925
AVG FAMILY INCOME
$135,840
AVG HOUSEHOLD INCOME
33.9%
WAGE / INCOME GAP [ % ]
66.1¢/ $1
WAGE / INCOME GAP [ $ ]
0.42
INEQUALITY / GINI INDEX
20,920
TOTAL POPULATION
10,588
MALE POPULATION
10,332
FEMALE POPULATION
102.48
MALES / 100 FEMALES
97.58
FEMALES / 100 MALES
41.7
MEDIAN AGE
3.1
AVG FAMILY SIZE
2.6
AVG HOUSEHOLD SIZE
11,541
LABOR FORCE [ PEOPLE ]
70.1%
PERCENT IN LABOR FORCE
3.2%
UNEMPLOYMENT RATE
Louisville Zip Codes
Louisville Area Codes
Income in Louisville
Income Overview in Louisville
Per Capita Income in Louisville is $65,907, while median incomes of families and households are $173,925 and $135,840 respectively.
| Characteristic | Number | Measure |
| Per Capita Income | 20,920 | $65,907 |
| Median Family Income | 5,385 | $173,925 |
| Mean Family Income | 5,385 | $206,430 |
| Median Household Income | 8,067 | $135,840 |
| Mean Household Income | 8,067 | $169,323 |
| Income Deficit | 5,385 | $0 |
| Wage / Income Gap (%) | 20,920 | 33.92% |
| Wage / Income Gap ($) | 20,920 | 66.08¢ per $1 |
| Gini / Inequality Index | 20,920 | 0.42 |
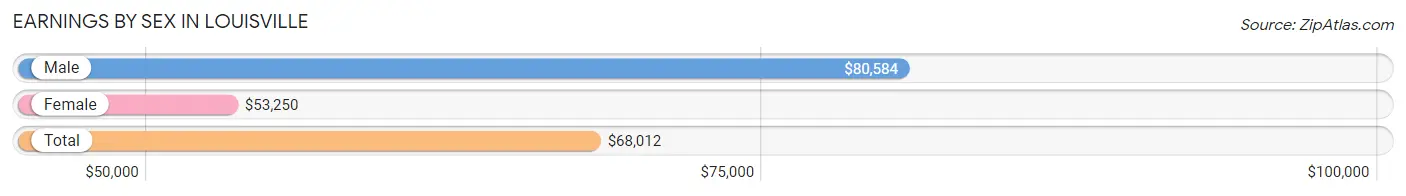
Earnings by Sex in Louisville
Average Earnings in Louisville are $68,012, $80,584 for men and $53,250 for women, a difference of 33.9%.
| Sex | Number | Average Earnings |
| Male | 6,678 (54.1%) | $80,584 |
| Female | 5,658 (45.9%) | $53,250 |
| Total | 12,336 (100.0%) | $68,012 |
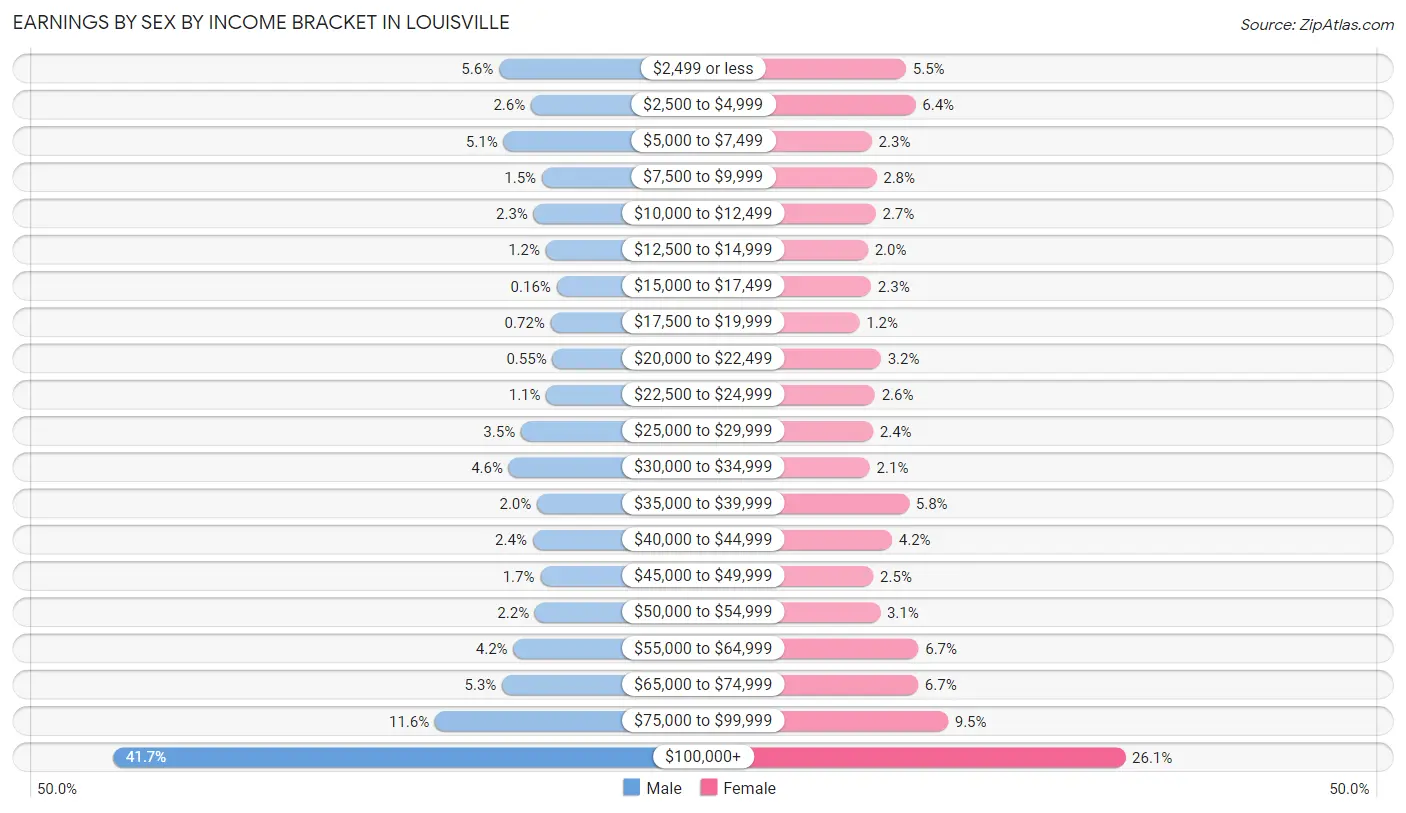
Earnings by Sex by Income Bracket in Louisville
The most common earnings brackets in Louisville are $100,000+ for men (2,787 | 41.7%) and $100,000+ for women (1,475 | 26.1%).
| Income | Male | Female |
| $2,499 or less | 371 (5.6%) | 313 (5.5%) |
| $2,500 to $4,999 | 171 (2.6%) | 363 (6.4%) |
| $5,000 to $7,499 | 343 (5.1%) | 132 (2.3%) |
| $7,500 to $9,999 | 103 (1.5%) | 156 (2.8%) |
| $10,000 to $12,499 | 154 (2.3%) | 152 (2.7%) |
| $12,500 to $14,999 | 79 (1.2%) | 111 (2.0%) |
| $15,000 to $17,499 | 11 (0.2%) | 128 (2.3%) |
| $17,500 to $19,999 | 48 (0.7%) | 66 (1.2%) |
| $20,000 to $22,499 | 37 (0.5%) | 180 (3.2%) |
| $22,500 to $24,999 | 75 (1.1%) | 148 (2.6%) |
| $25,000 to $29,999 | 234 (3.5%) | 138 (2.4%) |
| $30,000 to $34,999 | 310 (4.6%) | 121 (2.1%) |
| $35,000 to $39,999 | 133 (2.0%) | 329 (5.8%) |
| $40,000 to $44,999 | 160 (2.4%) | 239 (4.2%) |
| $45,000 to $49,999 | 113 (1.7%) | 140 (2.5%) |
| $50,000 to $54,999 | 146 (2.2%) | 176 (3.1%) |
| $55,000 to $64,999 | 281 (4.2%) | 379 (6.7%) |
| $65,000 to $74,999 | 351 (5.3%) | 377 (6.7%) |
| $75,000 to $99,999 | 771 (11.6%) | 535 (9.5%) |
| $100,000+ | 2,787 (41.7%) | 1,475 (26.1%) |
| Total | 6,678 (100.0%) | 5,658 (100.0%) |
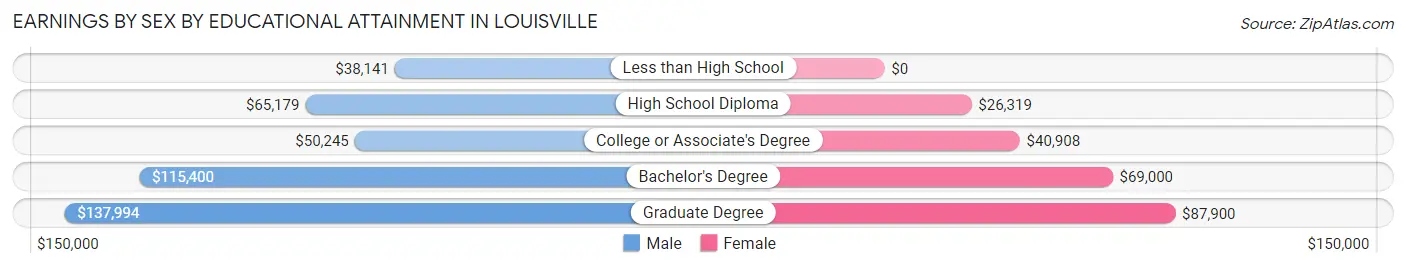
Earnings by Sex by Educational Attainment in Louisville
Average earnings in Louisville are $95,763 for men and $63,897 for women, a difference of 33.3%. Men with an educational attainment of graduate degree enjoy the highest average annual earnings of $137,994, while those with less than high school education earn the least with $38,141. Women with an educational attainment of graduate degree earn the most with the average annual earnings of $87,900, while those with high school diploma education have the smallest earnings of $26,319.
| Educational Attainment | Male Income | Female Income |
| Less than High School | $38,141 | $0 |
| High School Diploma | $65,179 | $26,319 |
| College or Associate's Degree | $50,245 | $40,908 |
| Bachelor's Degree | $115,400 | $69,000 |
| Graduate Degree | $137,994 | $87,900 |
| Total | $95,763 | $63,897 |
Family Income in Louisville
Family Income Brackets in Louisville
According to the Louisville family income data, there are 2,305 families falling into the $200,000+ income range, which is the most common income bracket and makes up 42.8% of all families. Conversely, the $10,000 to $14,999 income bracket is the least frequent group with only 5 families (0.1%) belonging to this category.
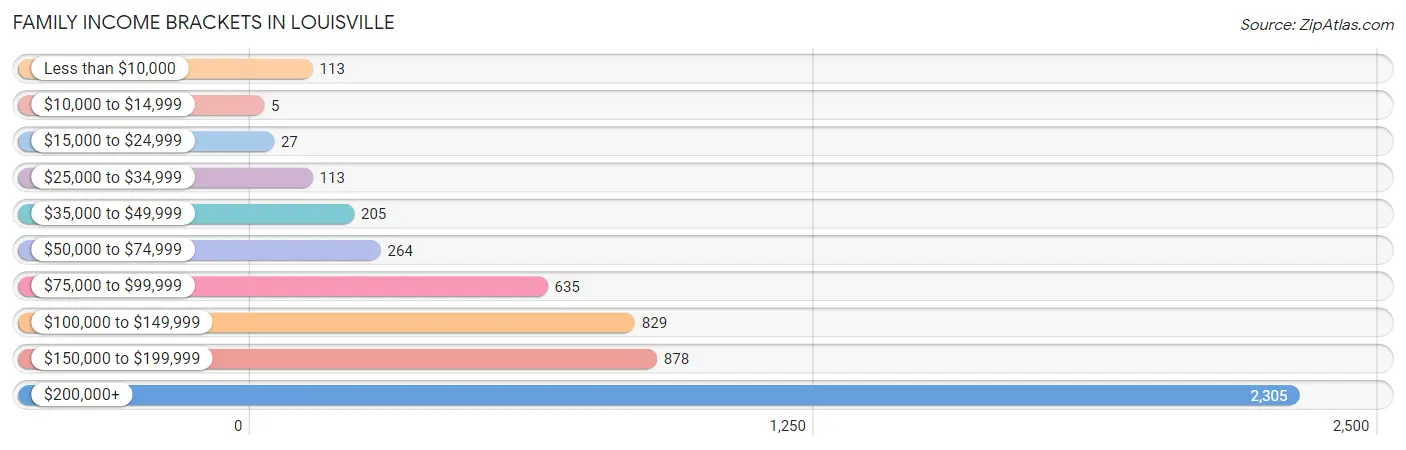
| Income Bracket | # Families | % Families |
| Less than $10,000 | 113 | 2.1% |
| $10,000 to $14,999 | 5 | 0.1% |
| $15,000 to $24,999 | 27 | 0.5% |
| $25,000 to $34,999 | 113 | 2.1% |
| $35,000 to $49,999 | 205 | 3.8% |
| $50,000 to $74,999 | 264 | 4.9% |
| $75,000 to $99,999 | 635 | 11.8% |
| $100,000 to $149,999 | 829 | 15.4% |
| $150,000 to $199,999 | 878 | 16.3% |
| $200,000+ | 2,305 | 42.8% |
Family Income by Famaliy Size in Louisville
6-person families (112 | 2.1%) account for the highest median family income in Louisville with $250,001 per family, while 2-person families (2,208 | 41.0%) have the highest median income of $67,404 per family member.
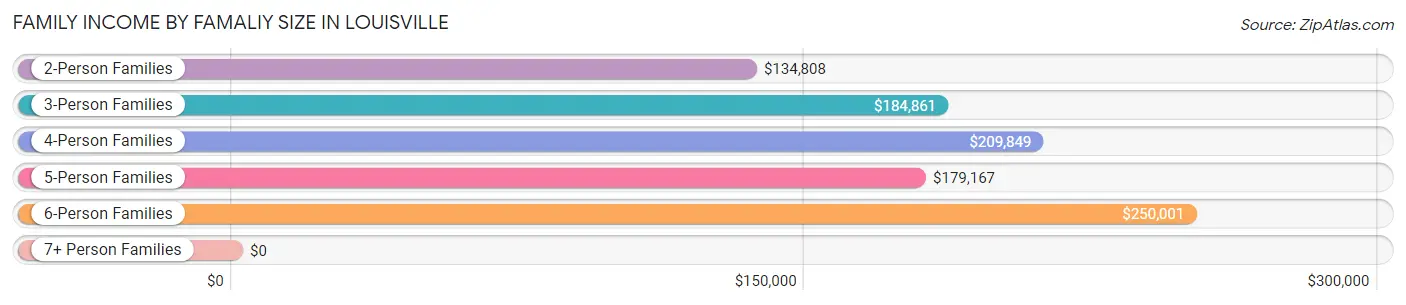
| Income Bracket | # Families | Median Income |
| 2-Person Families | 2,208 (41.0%) | $134,808 |
| 3-Person Families | 1,381 (25.7%) | $184,861 |
| 4-Person Families | 1,221 (22.7%) | $209,849 |
| 5-Person Families | 454 (8.4%) | $179,167 |
| 6-Person Families | 112 (2.1%) | $250,001 |
| 7+ Person Families | 9 (0.2%) | $0 |
| Total | 5,385 (100.0%) | $173,925 |
Family Income by Number of Earners in Louisville
The median family income in Louisville is $173,925, with families comprising 3+ earners (639) having the highest median family income of $208,710, while families with no earners (439) have the lowest median family income of $73,750, accounting for 11.9% and 8.2% of families, respectively.
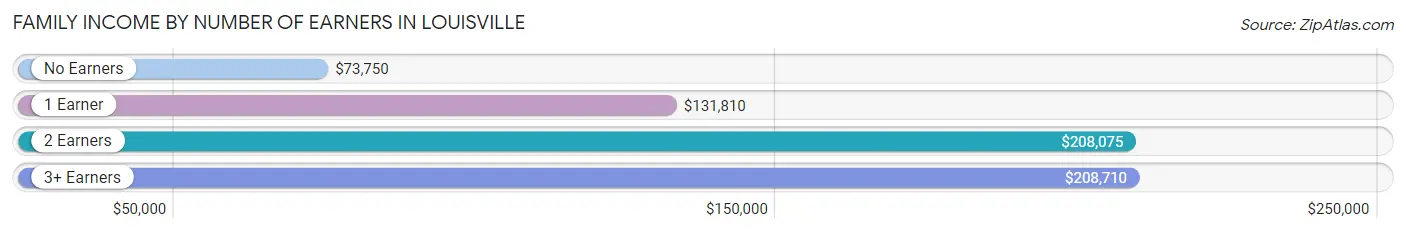
| Number of Earners | # Families | Median Income |
| No Earners | 439 (8.2%) | $73,750 |
| 1 Earner | 1,446 (26.9%) | $131,810 |
| 2 Earners | 2,861 (53.1%) | $208,075 |
| 3+ Earners | 639 (11.9%) | $208,710 |
| Total | 5,385 (100.0%) | $173,925 |
Household Income in Louisville
Household Income Brackets in Louisville
With 2,606 households falling in the category, the $200,000+ income range is the most frequent in Louisville, accounting for 32.3% of all households. In contrast, only 73 households (0.9%) fall into the $10,000 to $14,999 income bracket, making it the least populous group.
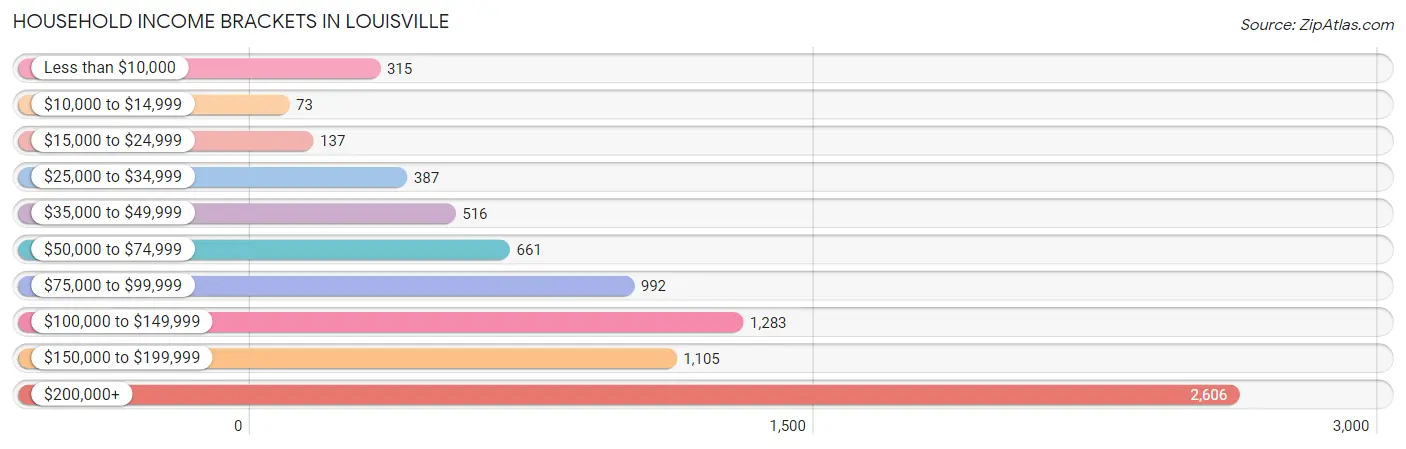
| Income Bracket | # Households | % Households |
| Less than $10,000 | 315 | 3.9% |
| $10,000 to $14,999 | 73 | 0.9% |
| $15,000 to $24,999 | 137 | 1.7% |
| $25,000 to $34,999 | 387 | 4.8% |
| $35,000 to $49,999 | 516 | 6.4% |
| $50,000 to $74,999 | 661 | 8.2% |
| $75,000 to $99,999 | 992 | 12.3% |
| $100,000 to $149,999 | 1,283 | 15.9% |
| $150,000 to $199,999 | 1,105 | 13.7% |
| $200,000+ | 2,606 | 32.3% |
Household Income by Householder Age in Louisville
The median household income in Louisville is $135,840, with the highest median household income of $163,380 found in the 25 to 44 years age bracket for the primary householder. A total of 2,329 households (28.9%) fall into this category. Meanwhile, the 65+ years age bracket for the primary householder has the lowest median household income of $73,565, with 2,038 households (25.3%) in this group.
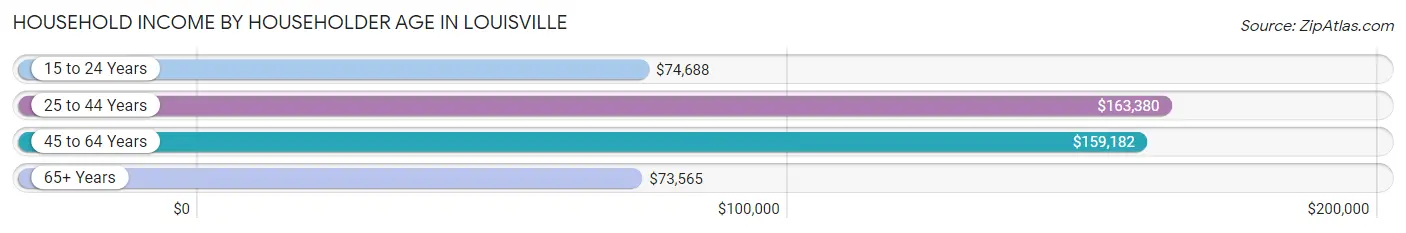
| Income Bracket | # Households | Median Income |
| 15 to 24 Years | 146 (1.8%) | $74,688 |
| 25 to 44 Years | 2,329 (28.9%) | $163,380 |
| 45 to 64 Years | 3,554 (44.1%) | $159,182 |
| 65+ Years | 2,038 (25.3%) | $73,565 |
| Total | 8,067 (100.0%) | $135,840 |
Poverty in Louisville
Income Below Poverty by Sex and Age in Louisville
With 5.9% poverty level for males and 4.8% for females among the residents of Louisville, 18 to 24 year old males and 75 year old and over females are the most vulnerable to poverty, with 181 males (19.7%) and 137 females (21.0%) in their respective age groups living below the poverty level.
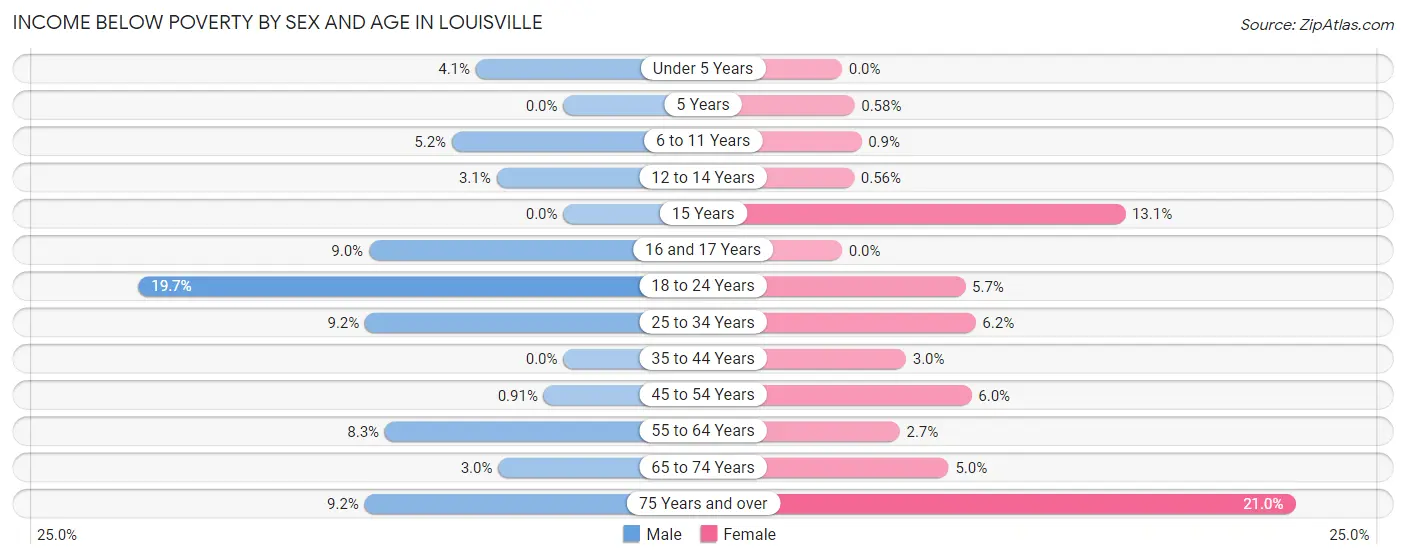
| Age Bracket | Male | Female |
| Under 5 Years | 21 (4.1%) | 0 (0.0%) |
| 5 Years | 0 (0.0%) | 1 (0.6%) |
| 6 to 11 Years | 53 (5.2%) | 8 (0.9%) |
| 12 to 14 Years | 17 (3.1%) | 3 (0.6%) |
| 15 Years | 0 (0.0%) | 18 (13.1%) |
| 16 and 17 Years | 34 (9.0%) | 0 (0.0%) |
| 18 to 24 Years | 181 (19.7%) | 38 (5.7%) |
| 25 to 34 Years | 113 (9.2%) | 65 (6.2%) |
| 35 to 44 Years | 0 (0.0%) | 43 (3.0%) |
| 45 to 54 Years | 15 (0.9%) | 88 (6.0%) |
| 55 to 64 Years | 124 (8.3%) | 41 (2.7%) |
| 65 to 74 Years | 30 (3.0%) | 48 (5.0%) |
| 75 Years and over | 33 (9.2%) | 137 (21.0%) |
| Total | 621 (5.9%) | 490 (4.8%) |
Income Above Poverty by Sex and Age in Louisville
According to the poverty statistics in Louisville, males aged 5 years and females aged under 5 years are the age groups that are most secure financially, with 100.0% of males and 100.0% of females in these age groups living above the poverty line.
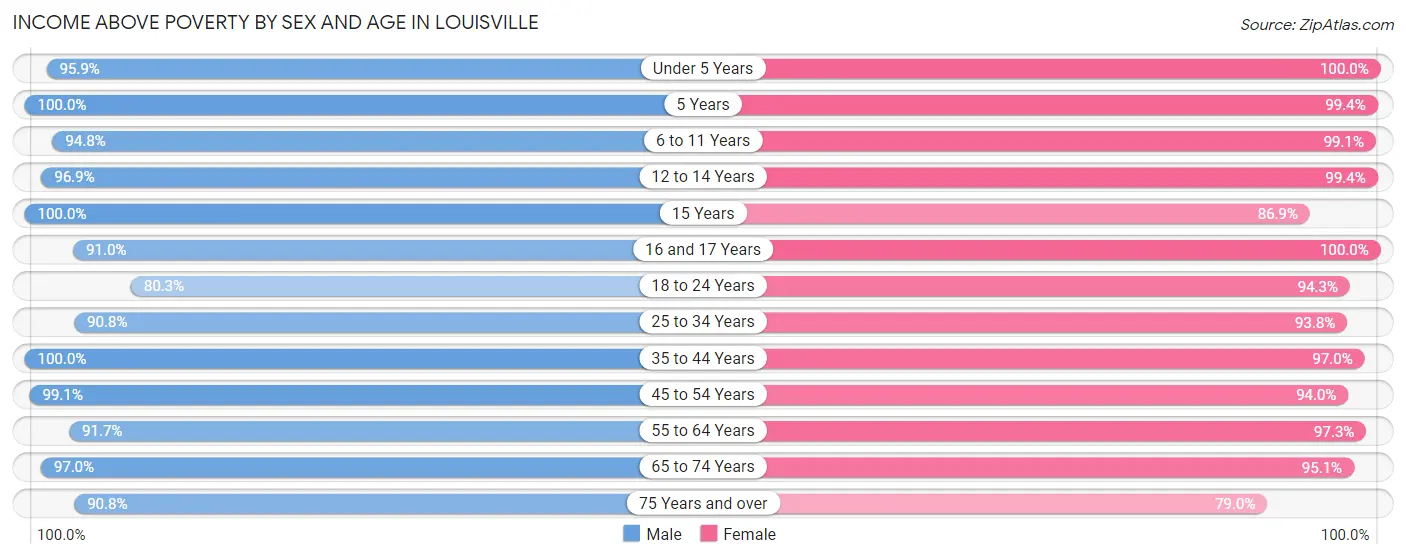
| Age Bracket | Male | Female |
| Under 5 Years | 496 (95.9%) | 409 (100.0%) |
| 5 Years | 84 (100.0%) | 172 (99.4%) |
| 6 to 11 Years | 973 (94.8%) | 880 (99.1%) |
| 12 to 14 Years | 532 (96.9%) | 533 (99.4%) |
| 15 Years | 130 (100.0%) | 119 (86.9%) |
| 16 and 17 Years | 343 (91.0%) | 288 (100.0%) |
| 18 to 24 Years | 737 (80.3%) | 626 (94.3%) |
| 25 to 34 Years | 1,115 (90.8%) | 983 (93.8%) |
| 35 to 44 Years | 1,197 (100.0%) | 1,405 (97.0%) |
| 45 to 54 Years | 1,642 (99.1%) | 1,376 (94.0%) |
| 55 to 64 Years | 1,374 (91.7%) | 1,489 (97.3%) |
| 65 to 74 Years | 964 (97.0%) | 922 (95.1%) |
| 75 Years and over | 325 (90.8%) | 514 (79.0%) |
| Total | 9,912 (94.1%) | 9,716 (95.2%) |
Income Below Poverty Among Married-Couple Families in Louisville
The poverty statistics for married-couple families in Louisville show that 1.6% or 70 of the total 4,481 families live below the poverty line. Families with no children have the highest poverty rate of 1.8%, comprising of 40 families. On the other hand, families with 5 or more children have the lowest poverty rate of 0.0%, which includes 0 families.
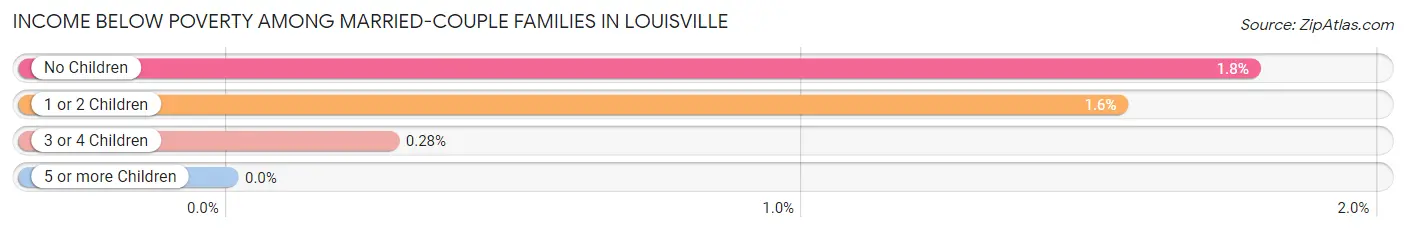
| Children | Above Poverty | Below Poverty |
| No Children | 2,204 (98.2%) | 40 (1.8%) |
| 1 or 2 Children | 1,843 (98.5%) | 29 (1.5%) |
| 3 or 4 Children | 362 (99.7%) | 1 (0.3%) |
| 5 or more Children | 2 (100.0%) | 0 (0.0%) |
| Total | 4,411 (98.4%) | 70 (1.6%) |
Income Below Poverty Among Single-Parent Households in Louisville
According to the poverty data in Louisville, 2.5% or 9 single-father households and 12.1% or 66 single-mother households are living below the poverty line. Among single-father households, those with 1 or 2 children have the highest poverty rate, with 9 households (2.8%) experiencing poverty. Likewise, among single-mother households, those with 3 or 4 children have the highest poverty rate, with 20 households (51.3%) falling below the poverty line.
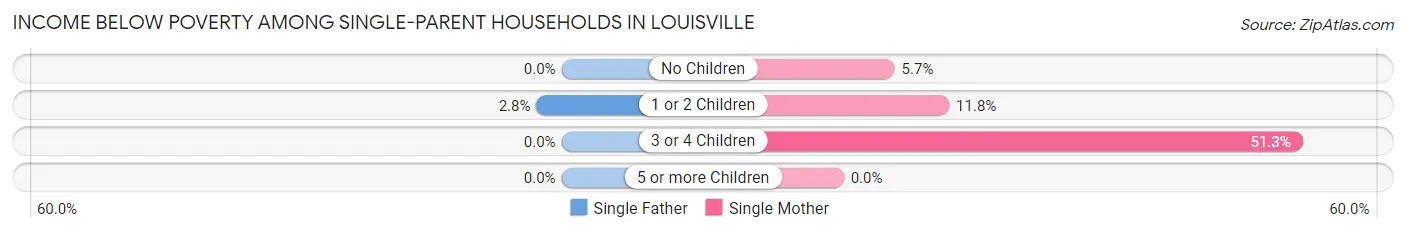
| Children | Single Father | Single Mother |
| No Children | 0 (0.0%) | 13 (5.7%) |
| 1 or 2 Children | 9 (2.8%) | 33 (11.8%) |
| 3 or 4 Children | 0 (0.0%) | 20 (51.3%) |
| 5 or more Children | 0 (0.0%) | 0 (0.0%) |
| Total | 9 (2.5%) | 66 (12.1%) |
Income Below Poverty Among Married-Couple vs Single-Parent Households in Louisville
The poverty data for Louisville shows that 70 of the married-couple family households (1.6%) and 75 of the single-parent households (8.3%) are living below the poverty level. Within the married-couple family households, those with no children have the highest poverty rate, with 40 households (1.8%) falling below the poverty line. Among the single-parent households, those with 3 or 4 children have the highest poverty rate, with 20 household (40.8%) living below poverty.
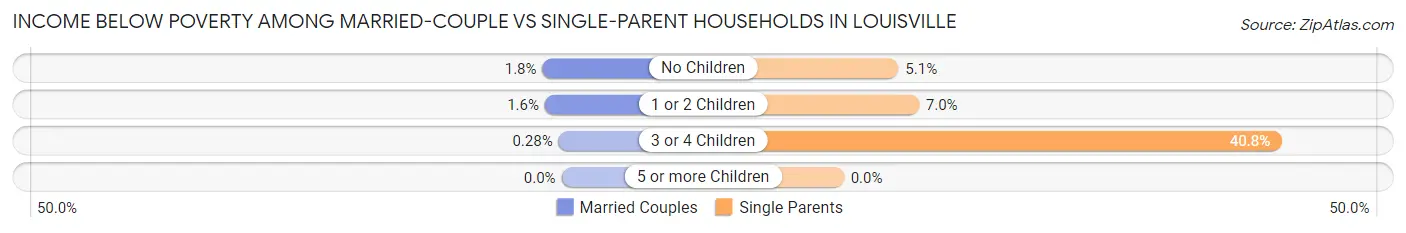
| Children | Married-Couple Families | Single-Parent Households |
| No Children | 40 (1.8%) | 13 (5.1%) |
| 1 or 2 Children | 29 (1.5%) | 42 (7.0%) |
| 3 or 4 Children | 1 (0.3%) | 20 (40.8%) |
| 5 or more Children | 0 (0.0%) | 0 (0.0%) |
| Total | 70 (1.6%) | 75 (8.3%) |
Race in Louisville
The most populous races in Louisville are White / Caucasian (17,354 | 83.0%), Two or more Races (2,234 | 10.7%), and Hispanic or Latino (2,186 | 10.4%).
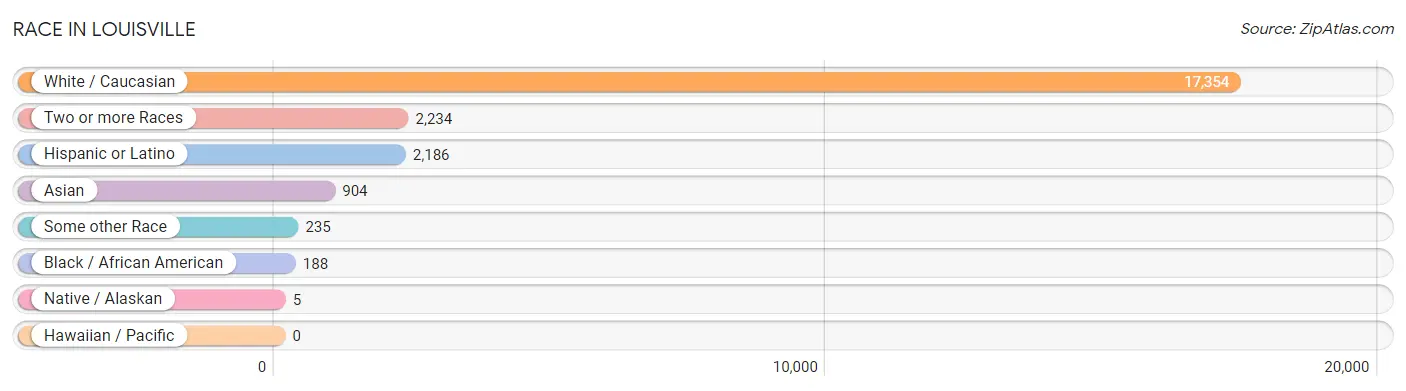
| Race | # Population | % Population |
| Asian | 904 | 4.3% |
| Black / African American | 188 | 0.9% |
| Hawaiian / Pacific | 0 | 0.0% |
| Hispanic or Latino | 2,186 | 10.4% |
| Native / Alaskan | 5 | 0.0% |
| White / Caucasian | 17,354 | 83.0% |
| Two or more Races | 2,234 | 10.7% |
| Some other Race | 235 | 1.1% |
| Total | 20,920 | 100.0% |
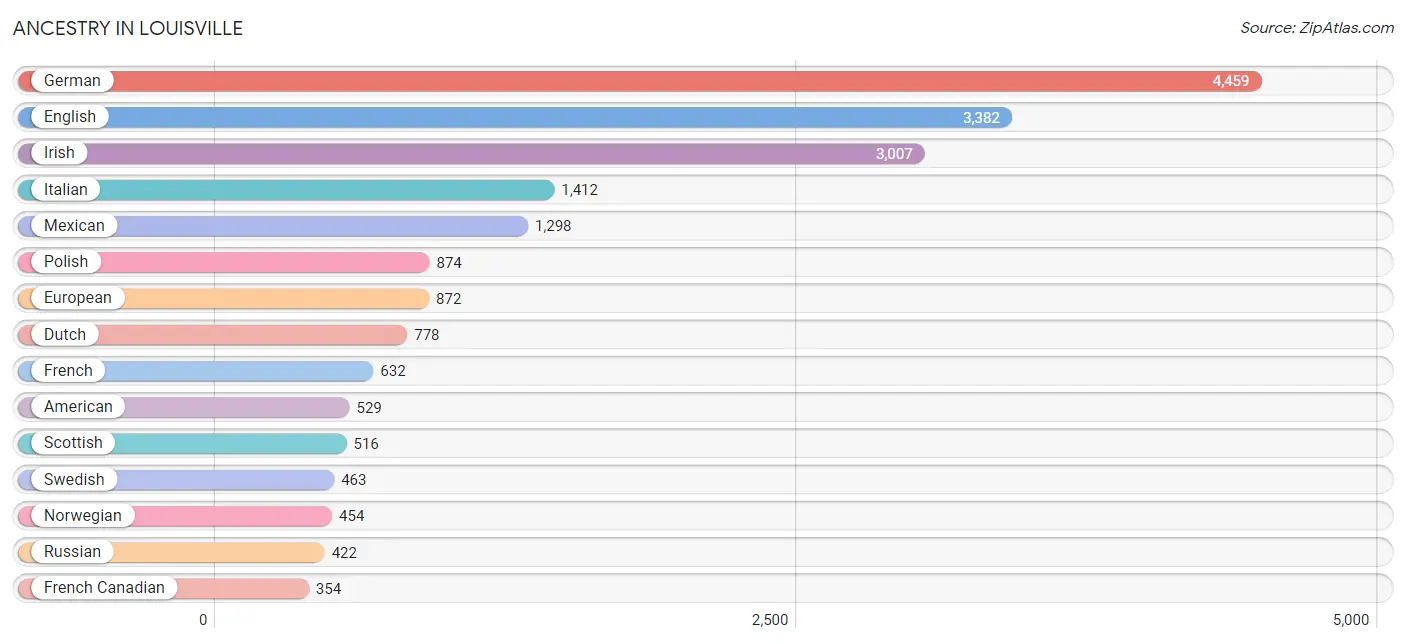
Ancestry in Louisville
The most populous ancestries reported in Louisville are German (4,459 | 21.3%), English (3,382 | 16.2%), Irish (3,007 | 14.4%), Italian (1,412 | 6.8%), and Mexican (1,298 | 6.2%), together accounting for 64.8% of all Louisville residents.
| Ancestry | # Population | % Population |
| African | 7 | 0.0% |
| Alsatian | 4 | 0.0% |
| American | 529 | 2.5% |
| Arab | 37 | 0.2% |
| Austrian | 154 | 0.7% |
| Basque | 30 | 0.1% |
| Belgian | 24 | 0.1% |
| Bhutanese | 262 | 1.3% |
| Brazilian | 6 | 0.0% |
| British | 240 | 1.1% |
| Burmese | 136 | 0.6% |
| Canadian | 66 | 0.3% |
| Celtic | 13 | 0.1% |
| Central American | 43 | 0.2% |
| Chilean | 80 | 0.4% |
| Chippewa | 19 | 0.1% |
| Choctaw | 19 | 0.1% |
| Colombian | 8 | 0.0% |
| Creek | 19 | 0.1% |
| Croatian | 106 | 0.5% |
| Cuban | 27 | 0.1% |
| Czech | 285 | 1.4% |
| Czechoslovakian | 56 | 0.3% |
| Danish | 121 | 0.6% |
| Dutch | 778 | 3.7% |
| Eastern European | 114 | 0.5% |
| Ecuadorian | 41 | 0.2% |
| English | 3,382 | 16.2% |
| European | 872 | 4.2% |
| Filipino | 4 | 0.0% |
| Finnish | 56 | 0.3% |
| French | 632 | 3.0% |
| French Canadian | 354 | 1.7% |
| German | 4,459 | 21.3% |
| Greek | 93 | 0.4% |
| Hungarian | 223 | 1.1% |
| Indian (Asian) | 292 | 1.4% |
| Iranian | 8 | 0.0% |
| Irish | 3,007 | 14.4% |
| Italian | 1,412 | 6.8% |
| Jamaican | 31 | 0.2% |
| Japanese | 74 | 0.4% |
| Korean | 332 | 1.6% |
| Laotian | 15 | 0.1% |
| Latvian | 14 | 0.1% |
| Lebanese | 37 | 0.2% |
| Lithuanian | 113 | 0.5% |
| Macedonian | 13 | 0.1% |
| Menominee | 34 | 0.2% |
| Mexican | 1,298 | 6.2% |
| New Zealander | 11 | 0.1% |
| Northern European | 162 | 0.8% |
| Norwegian | 454 | 2.2% |
| Pakistani | 68 | 0.3% |
| Paraguayan | 36 | 0.2% |
| Pennsylvania German | 23 | 0.1% |
| Polish | 874 | 4.2% |
| Portuguese | 29 | 0.1% |
| Puerto Rican | 249 | 1.2% |
| Romanian | 83 | 0.4% |
| Russian | 422 | 2.0% |
| Salvadoran | 43 | 0.2% |
| Scandinavian | 141 | 0.7% |
| Scotch-Irish | 271 | 1.3% |
| Scottish | 516 | 2.5% |
| Sioux | 2 | 0.0% |
| Slavic | 30 | 0.1% |
| Slovak | 56 | 0.3% |
| South African | 39 | 0.2% |
| South American | 165 | 0.8% |
| Spaniard | 188 | 0.9% |
| Spanish | 195 | 0.9% |
| Spanish American | 16 | 0.1% |
| Sri Lankan | 167 | 0.8% |
| Subsaharan African | 56 | 0.3% |
| Swedish | 463 | 2.2% |
| Swiss | 152 | 0.7% |
| Thai | 287 | 1.4% |
| Ukrainian | 148 | 0.7% |
| Welsh | 294 | 1.4% |
| Yugoslavian | 5 | 0.0% |
| Yuman | 41 | 0.2% | View All 82 Rows |
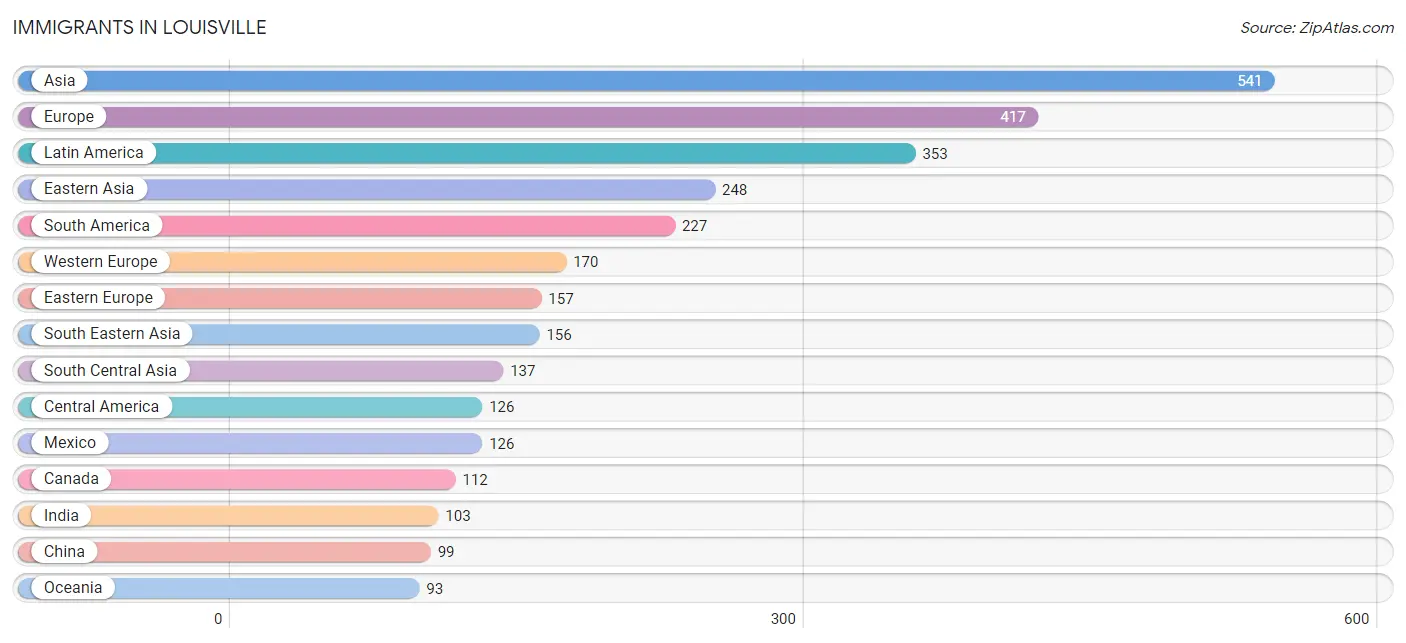
Immigrants in Louisville
The most numerous immigrant groups reported in Louisville came from Asia (541 | 2.6%), Europe (417 | 2.0%), Latin America (353 | 1.7%), Eastern Asia (248 | 1.2%), and South America (227 | 1.1%), together accounting for 8.5% of all Louisville residents.
| Immigration Origin | # Population | % Population |
| Africa | 52 | 0.3% |
| Argentina | 44 | 0.2% |
| Asia | 541 | 2.6% |
| Australia | 89 | 0.4% |
| Austria | 37 | 0.2% |
| Bangladesh | 19 | 0.1% |
| Bosnia and Herzegovina | 8 | 0.0% |
| Brazil | 70 | 0.3% |
| Cambodia | 56 | 0.3% |
| Canada | 112 | 0.5% |
| Central America | 126 | 0.6% |
| Chile | 17 | 0.1% |
| China | 99 | 0.5% |
| Colombia | 8 | 0.0% |
| Czechoslovakia | 31 | 0.2% |
| Eastern Africa | 34 | 0.2% |
| Eastern Asia | 248 | 1.2% |
| Eastern Europe | 157 | 0.7% |
| Ecuador | 11 | 0.1% |
| England | 31 | 0.2% |
| Europe | 417 | 2.0% |
| France | 7 | 0.0% |
| Germany | 81 | 0.4% |
| India | 103 | 0.5% |
| Iran | 8 | 0.0% |
| Italy | 15 | 0.1% |
| Japan | 64 | 0.3% |
| Kenya | 34 | 0.2% |
| Korea | 85 | 0.4% |
| Latin America | 353 | 1.7% |
| Mexico | 126 | 0.6% |
| Netherlands | 6 | 0.0% |
| North Macedonia | 3 | 0.0% |
| Northern Europe | 75 | 0.4% |
| Norway | 23 | 0.1% |
| Oceania | 93 | 0.4% |
| Pakistan | 7 | 0.0% |
| Peru | 41 | 0.2% |
| Poland | 61 | 0.3% |
| Russia | 42 | 0.2% |
| Singapore | 11 | 0.1% |
| South Africa | 18 | 0.1% |
| South America | 227 | 1.1% |
| South Central Asia | 137 | 0.6% |
| South Eastern Asia | 156 | 0.7% |
| Southern Europe | 15 | 0.1% |
| Switzerland | 39 | 0.2% |
| Thailand | 15 | 0.1% |
| Vietnam | 74 | 0.4% |
| Western Europe | 170 | 0.8% | View All 50 Rows |
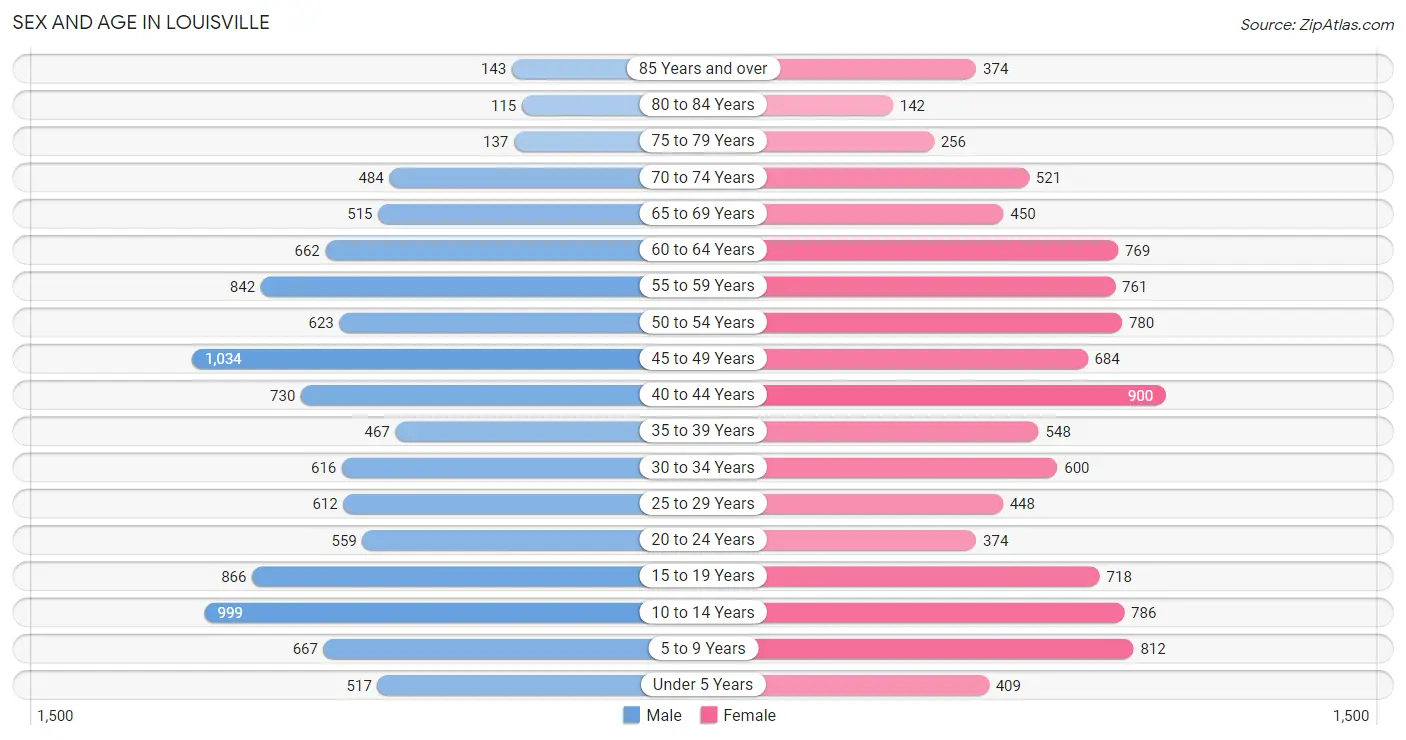
Sex and Age in Louisville
Sex and Age in Louisville
The most populous age groups in Louisville are 45 to 49 Years (1,034 | 9.8%) for men and 40 to 44 Years (900 | 8.7%) for women.
| Age Bracket | Male | Female |
| Under 5 Years | 517 (4.9%) | 409 (4.0%) |
| 5 to 9 Years | 667 (6.3%) | 812 (7.9%) |
| 10 to 14 Years | 999 (9.4%) | 786 (7.6%) |
| 15 to 19 Years | 866 (8.2%) | 718 (7.0%) |
| 20 to 24 Years | 559 (5.3%) | 374 (3.6%) |
| 25 to 29 Years | 612 (5.8%) | 448 (4.3%) |
| 30 to 34 Years | 616 (5.8%) | 600 (5.8%) |
| 35 to 39 Years | 467 (4.4%) | 548 (5.3%) |
| 40 to 44 Years | 730 (6.9%) | 900 (8.7%) |
| 45 to 49 Years | 1,034 (9.8%) | 684 (6.6%) |
| 50 to 54 Years | 623 (5.9%) | 780 (7.5%) |
| 55 to 59 Years | 842 (8.0%) | 761 (7.4%) |
| 60 to 64 Years | 662 (6.2%) | 769 (7.4%) |
| 65 to 69 Years | 515 (4.9%) | 450 (4.4%) |
| 70 to 74 Years | 484 (4.6%) | 521 (5.0%) |
| 75 to 79 Years | 137 (1.3%) | 256 (2.5%) |
| 80 to 84 Years | 115 (1.1%) | 142 (1.4%) |
| 85 Years and over | 143 (1.3%) | 374 (3.6%) |
| Total | 10,588 (100.0%) | 10,332 (100.0%) |
Families and Households in Louisville
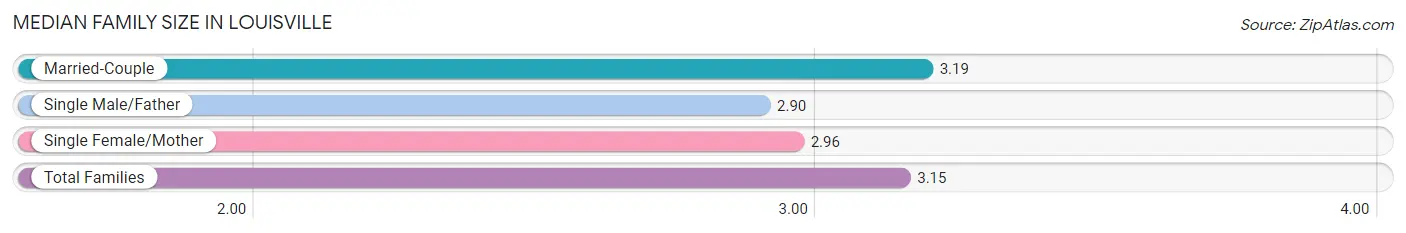
Median Family Size in Louisville
The median family size in Louisville is 3.15 persons per family, with married-couple families (4,481 | 83.2%) accounting for the largest median family size of 3.19 persons per family. On the other hand, single male/father families (357 | 6.6%) represent the smallest median family size with 2.90 persons per family.
| Family Type | # Families | Family Size |
| Married-Couple | 4,481 (83.2%) | 3.19 |
| Single Male/Father | 357 (6.6%) | 2.90 |
| Single Female/Mother | 547 (10.2%) | 2.96 |
| Total Families | 5,385 (100.0%) | 3.15 |
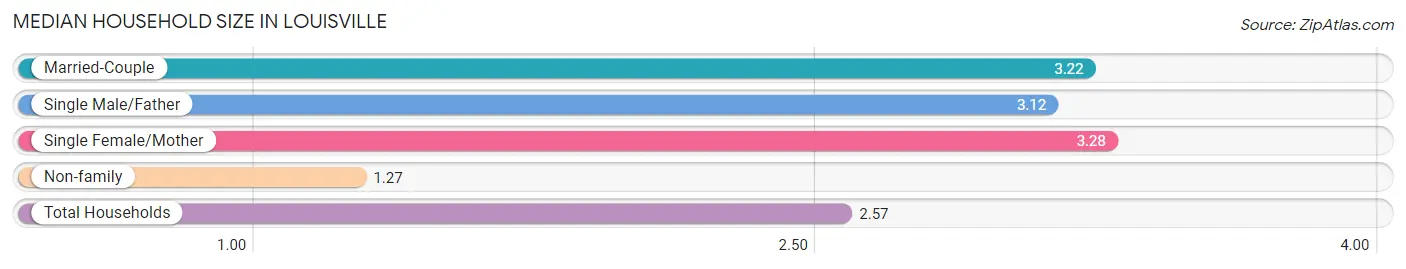
Median Household Size in Louisville
The median household size in Louisville is 2.57 persons per household, with single female/mother households (547 | 6.8%) accounting for the largest median household size of 3.28 persons per household. non-family households (2,682 | 33.3%) represent the smallest median household size with 1.27 persons per household.
| Household Type | # Households | Household Size |
| Married-Couple | 4,481 (55.5%) | 3.22 |
| Single Male/Father | 357 (4.4%) | 3.12 |
| Single Female/Mother | 547 (6.8%) | 3.28 |
| Non-family | 2,682 (33.3%) | 1.27 |
| Total Households | 8,067 (100.0%) | 2.57 |
Household Size by Marriage Status in Louisville
Out of a total of 8,067 households in Louisville, 5,385 (66.7%) are family households, while 2,682 (33.3%) are nonfamily households. The most numerous type of family households are 2-person households, comprising 2,026, and the most common type of nonfamily households are 1-person households, comprising 2,095.
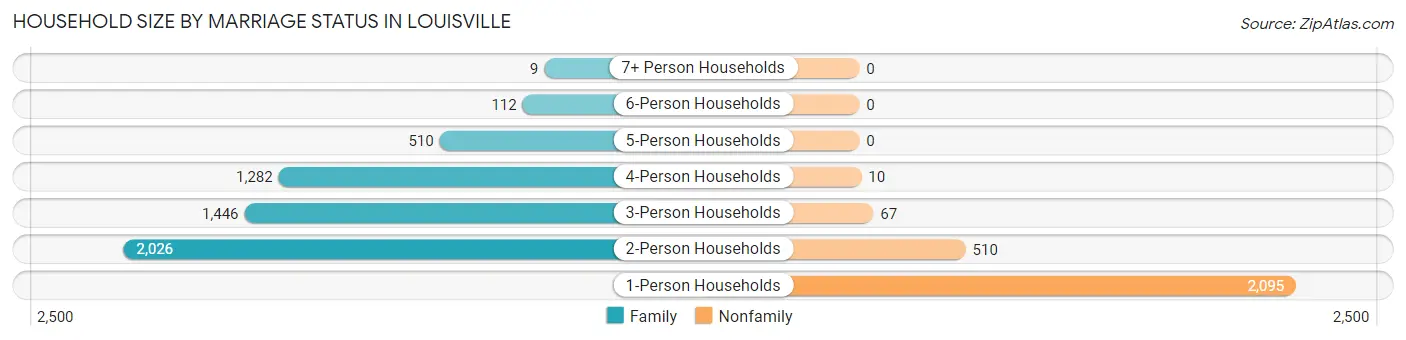
| Household Size | Family Households | Nonfamily Households |
| 1-Person Households | - | 2,095 (26.0%) |
| 2-Person Households | 2,026 (25.1%) | 510 (6.3%) |
| 3-Person Households | 1,446 (17.9%) | 67 (0.8%) |
| 4-Person Households | 1,282 (15.9%) | 10 (0.1%) |
| 5-Person Households | 510 (6.3%) | 0 (0.0%) |
| 6-Person Households | 112 (1.4%) | 0 (0.0%) |
| 7+ Person Households | 9 (0.1%) | 0 (0.0%) |
| Total | 5,385 (66.7%) | 2,682 (33.3%) |
Female Fertility in Louisville
Fertility by Age in Louisville
Average fertility rate in Louisville is 55.0 births per 1,000 women. Women in the age bracket of 20 to 34 years have the highest fertility rate with 139.0 births per 1,000 women. Women in the age bracket of 20 to 34 years acount for 82.1% of all women with births.
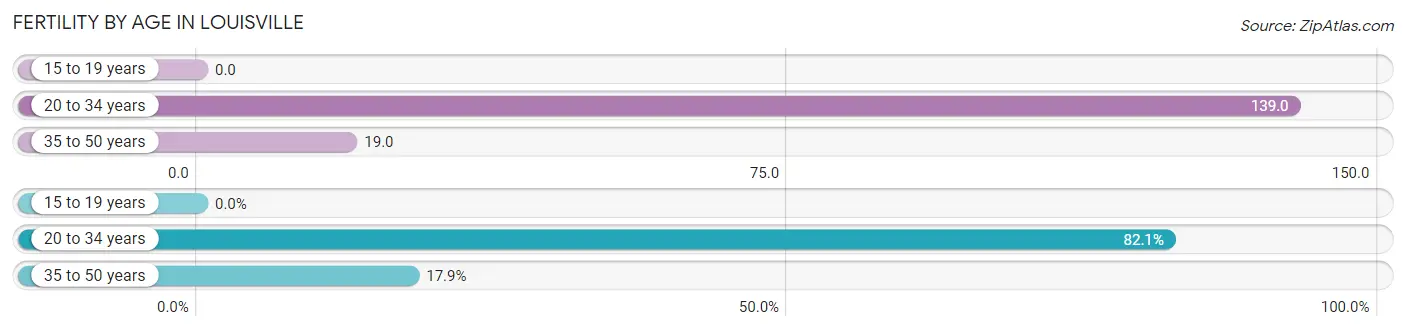
| Age Bracket | Women with Births | Births / 1,000 Women |
| 15 to 19 years | 0 (0.0%) | 0.0 |
| 20 to 34 years | 197 (82.1%) | 139.0 |
| 35 to 50 years | 43 (17.9%) | 19.0 |
| Total | 240 (100.0%) | 55.0 |
Fertility by Age by Marriage Status in Louisville
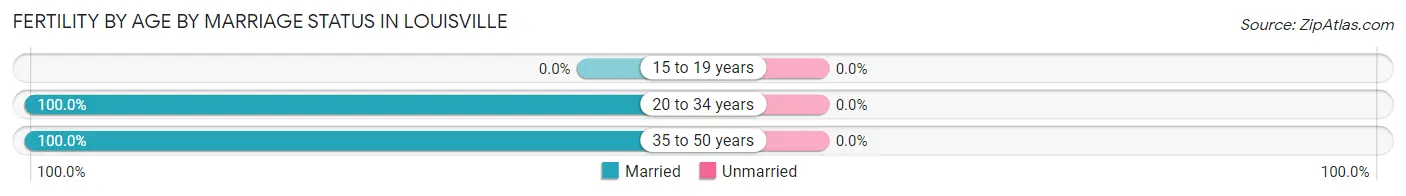
| Age Bracket | Married | Unmarried |
| 15 to 19 years | 0 (0.0%) | 0 (0.0%) |
| 20 to 34 years | 197 (100.0%) | 0 (0.0%) |
| 35 to 50 years | 43 (100.0%) | 0 (0.0%) |
| Total | 240 (100.0%) | 0 (0.0%) |
Fertility by Education in Louisville
Average fertility rate in Louisville is 55.0 births per 1,000 women. Women with the education attainment of bachelor's degree have the highest fertility rate of 106.0 births per 1,000 women, while women with the education attainment of less than high school have the lowest fertility at 9.0 births per 1,000 women. Women with the education attainment of bachelor's degree represent 62.5% of all women with births.
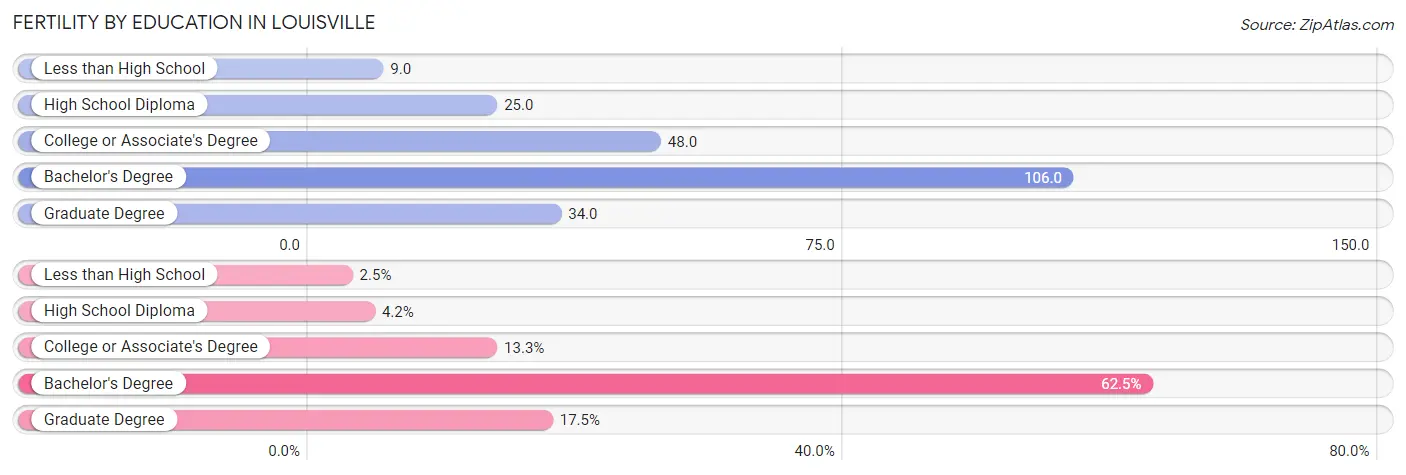
| Educational Attainment | Women with Births | Births / 1,000 Women |
| Less than High School | 6 (2.5%) | 9.0 |
| High School Diploma | 10 (4.2%) | 25.0 |
| College or Associate's Degree | 32 (13.3%) | 48.0 |
| Bachelor's Degree | 150 (62.5%) | 106.0 |
| Graduate Degree | 42 (17.5%) | 34.0 |
| Total | 240 (100.0%) | 55.0 |
Fertility by Education by Marriage Status in Louisville
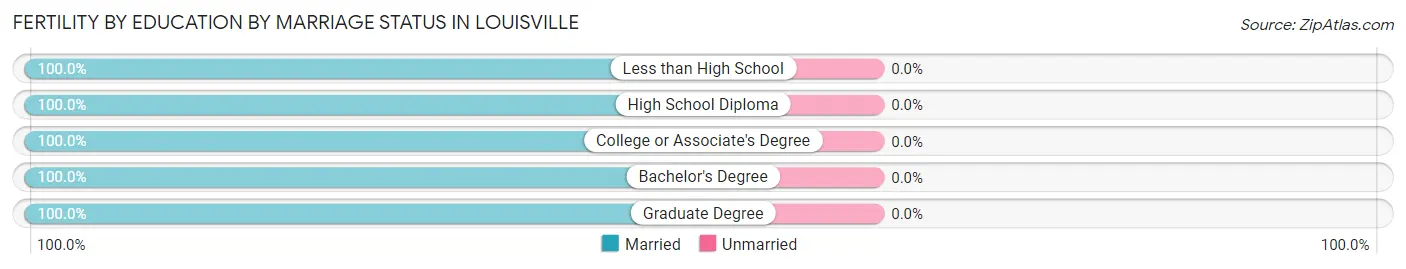
| Educational Attainment | Married | Unmarried |
| Less than High School | 6 (100.0%) | 0 (0.0%) |
| High School Diploma | 10 (100.0%) | 0 (0.0%) |
| College or Associate's Degree | 32 (100.0%) | 0 (0.0%) |
| Bachelor's Degree | 150 (100.0%) | 0 (0.0%) |
| Graduate Degree | 42 (100.0%) | 0 (0.0%) |
| Total | 240 (100.0%) | 0 (0.0%) |
Employment Characteristics in Louisville
Employment by Class of Employer in Louisville
Among the 11,019 employed individuals in Louisville, private company employees (7,192 | 65.3%), not-for-profit organizations (1,009 | 9.2%), and self-employed (not incorporated) (856 | 7.8%) make up the most common classes of employment.
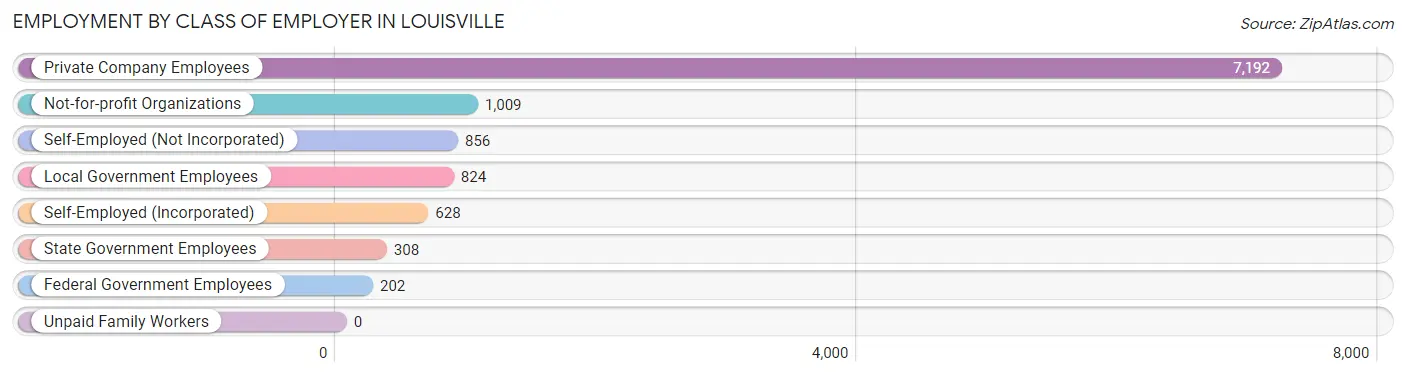
| Employer Class | # Employees | % Employees |
| Private Company Employees | 7,192 | 65.3% |
| Self-Employed (Incorporated) | 628 | 5.7% |
| Self-Employed (Not Incorporated) | 856 | 7.8% |
| Not-for-profit Organizations | 1,009 | 9.2% |
| Local Government Employees | 824 | 7.5% |
| State Government Employees | 308 | 2.8% |
| Federal Government Employees | 202 | 1.8% |
| Unpaid Family Workers | 0 | 0.0% |
| Total | 11,019 | 100.0% |
Employment Status by Age in Louisville
According to the labor force statistics for Louisville, out of the total population over 16 years of age (16,463), 70.1% or 11,541 individuals are in the labor force, with 3.2% or 369 of them unemployed. The age group with the highest labor force participation rate is 35 to 44 years, with 89.0% or 2,354 individuals in the labor force. Within the labor force, the 60 to 64 years age range has the highest percentage of unemployed individuals, with 9.5% or 95 of them being unemployed.
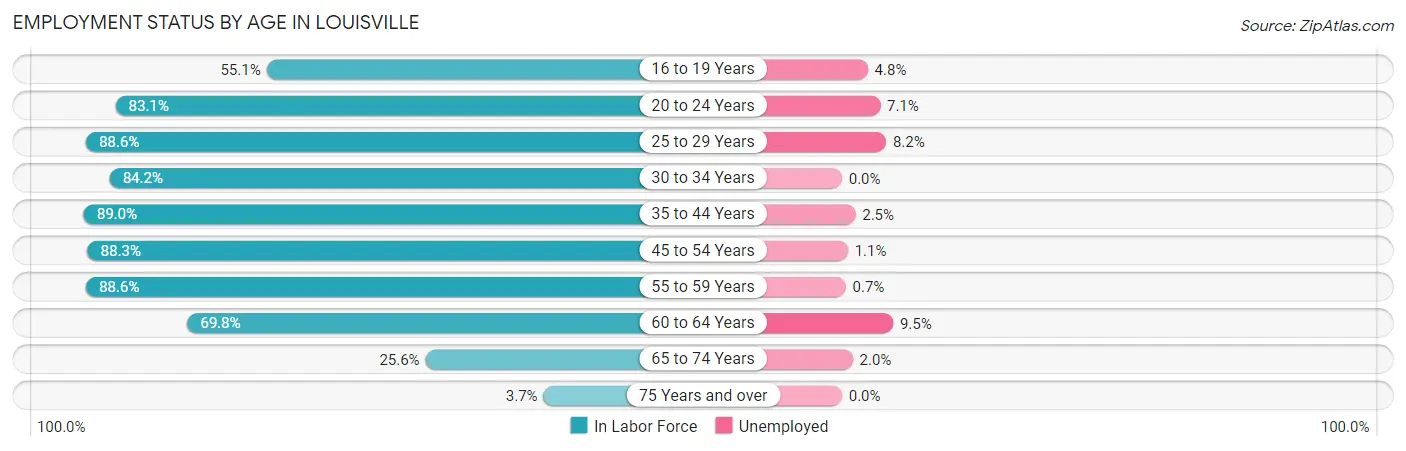
| Age Bracket | In Labor Force | Unemployed |
| 16 to 19 Years | 726 (55.1%) | 35 (4.8%) |
| 20 to 24 Years | 775 (83.1%) | 55 (7.1%) |
| 25 to 29 Years | 939 (88.6%) | 77 (8.2%) |
| 30 to 34 Years | 1,024 (84.2%) | 0 (0.0%) |
| 35 to 44 Years | 2,354 (89.0%) | 59 (2.5%) |
| 45 to 54 Years | 2,756 (88.3%) | 30 (1.1%) |
| 55 to 59 Years | 1,420 (88.6%) | 10 (0.7%) |
| 60 to 64 Years | 999 (69.8%) | 95 (9.5%) |
| 65 to 74 Years | 504 (25.6%) | 10 (2.0%) |
| 75 Years and over | 43 (3.7%) | 0 (0.0%) |
| Total | 11,541 (70.1%) | 369 (3.2%) |
Employment Status by Educational Attainment in Louisville
According to labor force statistics for Louisville, 85.7% of individuals (9,492) out of the total population between 25 and 64 years of age (11,076) are in the labor force, with 2.9% or 275 of them being unemployed. The group with the highest labor force participation rate are those with the educational attainment of bachelor's degree or higher, with 88.9% or 6,906 individuals in the labor force. Within the labor force, individuals with bachelor's degree or higher education have the highest percentage of unemployment, with 3.2% or 221 of them being unemployed.
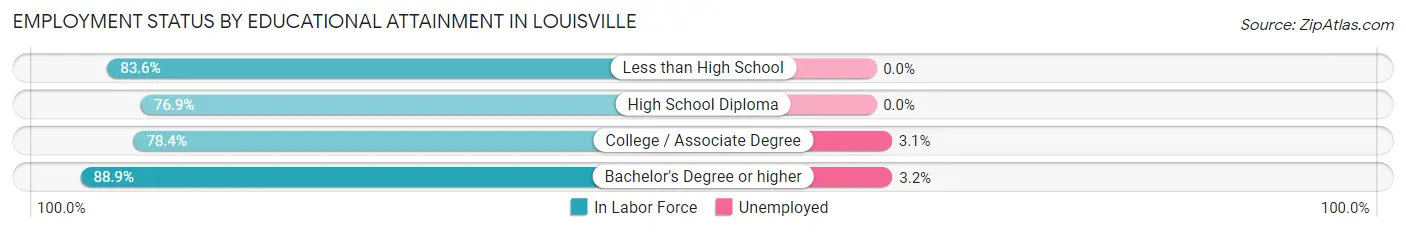
| Educational Attainment | In Labor Force | Unemployed |
| Less than High School | 127 (83.6%) | 0 (0.0%) |
| High School Diploma | 705 (76.9%) | 0 (0.0%) |
| College / Associate Degree | 1,755 (78.4%) | 69 (3.1%) |
| Bachelor's Degree or higher | 6,906 (88.9%) | 249 (3.2%) |
| Total | 9,492 (85.7%) | 321 (2.9%) |
Employment Occupations by Sex in Louisville
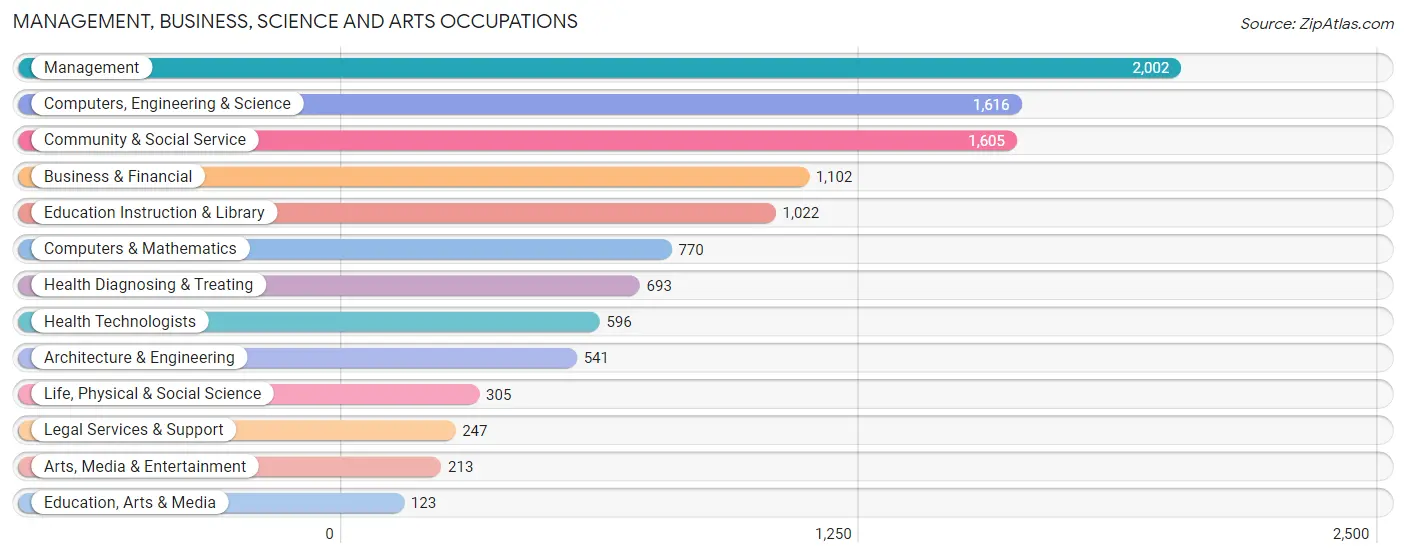
Management, Business, Science and Arts Occupations
The most common Management, Business, Science and Arts occupations in Louisville are Management (2,002 | 18.0%), Computers, Engineering & Science (1,616 | 14.5%), Community & Social Service (1,605 | 14.4%), Business & Financial (1,102 | 9.9%), and Education Instruction & Library (1,022 | 9.2%).
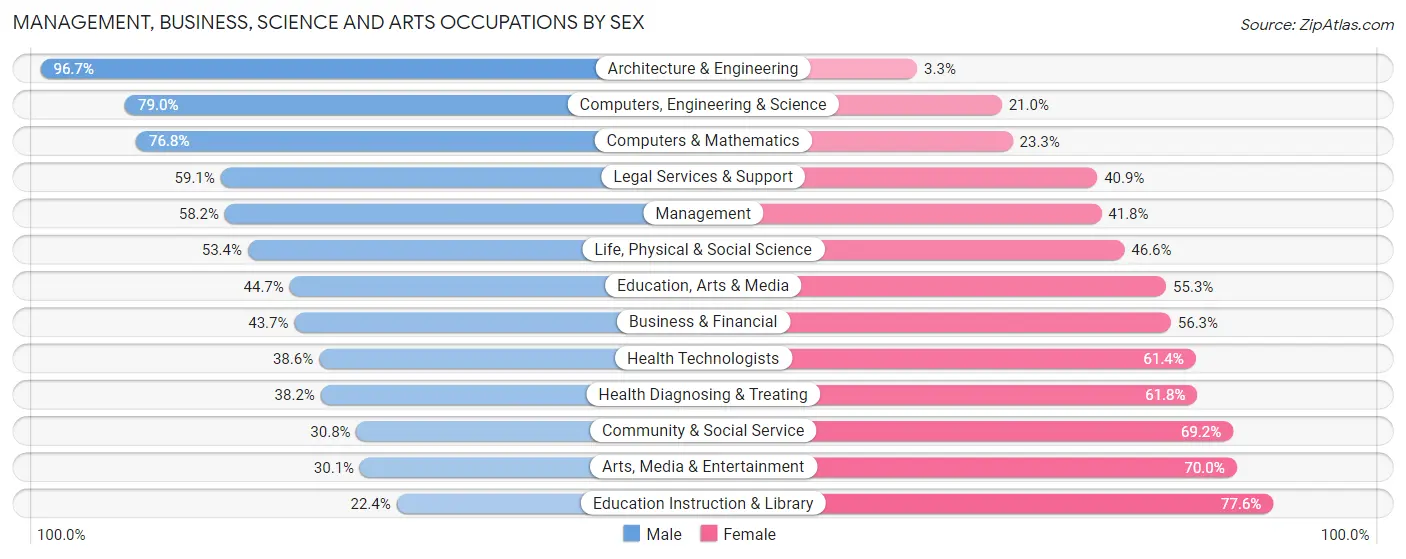
Management, Business, Science and Arts Occupations by Sex
Within the Management, Business, Science and Arts occupations in Louisville, the most male-oriented occupations are Architecture & Engineering (96.7%), Computers, Engineering & Science (79.0%), and Computers & Mathematics (76.7%), while the most female-oriented occupations are Education Instruction & Library (77.6%), Arts, Media & Entertainment (70.0%), and Community & Social Service (69.2%).
| Occupation | Male | Female |
| Management | 1,166 (58.2%) | 836 (41.8%) |
| Business & Financial | 482 (43.7%) | 620 (56.3%) |
| Computers, Engineering & Science | 1,277 (79.0%) | 339 (21.0%) |
| Computers & Mathematics | 591 (76.7%) | 179 (23.3%) |
| Architecture & Engineering | 523 (96.7%) | 18 (3.3%) |
| Life, Physical & Social Science | 163 (53.4%) | 142 (46.6%) |
| Community & Social Service | 494 (30.8%) | 1,111 (69.2%) |
| Education, Arts & Media | 55 (44.7%) | 68 (55.3%) |
| Legal Services & Support | 146 (59.1%) | 101 (40.9%) |
| Education Instruction & Library | 229 (22.4%) | 793 (77.6%) |
| Arts, Media & Entertainment | 64 (30.0%) | 149 (70.0%) |
| Health Diagnosing & Treating | 265 (38.2%) | 428 (61.8%) |
| Health Technologists | 230 (38.6%) | 366 (61.4%) |
| Total (Category) | 3,684 (52.5%) | 3,334 (47.5%) |
| Total (Overall) | 5,918 (53.1%) | 5,221 (46.9%) |
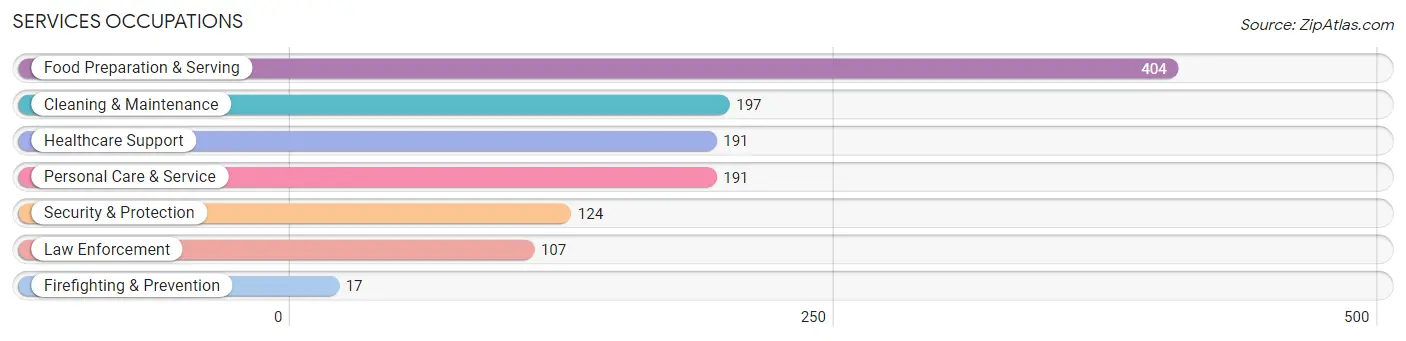
Services Occupations
The most common Services occupations in Louisville are Food Preparation & Serving (404 | 3.6%), Cleaning & Maintenance (197 | 1.8%), Healthcare Support (191 | 1.7%), Personal Care & Service (191 | 1.7%), and Security & Protection (124 | 1.1%).
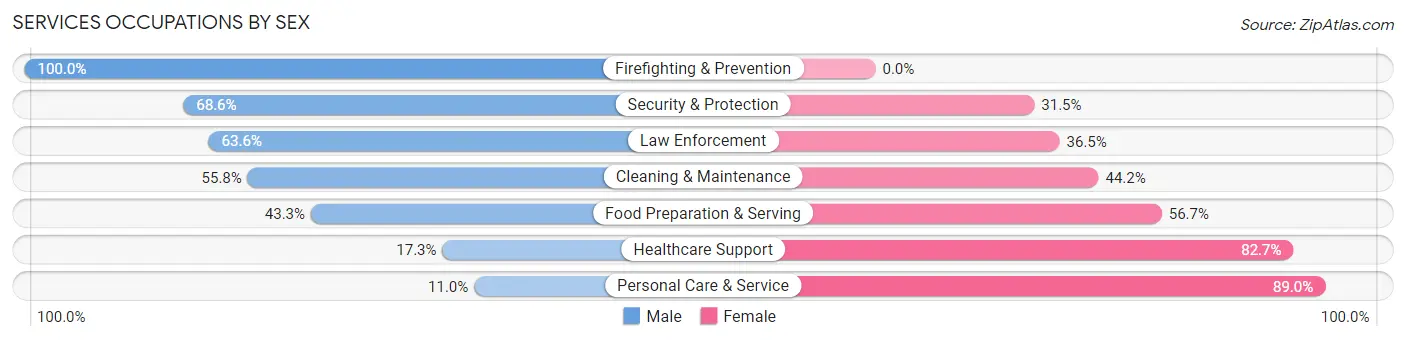
Services Occupations by Sex
Within the Services occupations in Louisville, the most male-oriented occupations are Firefighting & Prevention (100.0%), Security & Protection (68.5%), and Law Enforcement (63.5%), while the most female-oriented occupations are Personal Care & Service (89.0%), Healthcare Support (82.7%), and Food Preparation & Serving (56.7%).
| Occupation | Male | Female |
| Healthcare Support | 33 (17.3%) | 158 (82.7%) |
| Security & Protection | 85 (68.5%) | 39 (31.5%) |
| Firefighting & Prevention | 17 (100.0%) | 0 (0.0%) |
| Law Enforcement | 68 (63.5%) | 39 (36.4%) |
| Food Preparation & Serving | 175 (43.3%) | 229 (56.7%) |
| Cleaning & Maintenance | 110 (55.8%) | 87 (44.2%) |
| Personal Care & Service | 21 (11.0%) | 170 (89.0%) |
| Total (Category) | 424 (38.3%) | 683 (61.7%) |
| Total (Overall) | 5,918 (53.1%) | 5,221 (46.9%) |
Sales and Office Occupations
The most common Sales and Office occupations in Louisville are Sales & Related (1,133 | 10.2%), and Office & Administration (710 | 6.4%).

Sales and Office Occupations by Sex
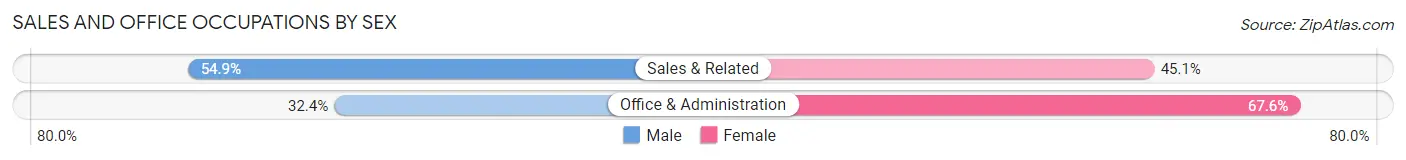
| Occupation | Male | Female |
| Sales & Related | 622 (54.9%) | 511 (45.1%) |
| Office & Administration | 230 (32.4%) | 480 (67.6%) |
| Total (Category) | 852 (46.2%) | 991 (53.8%) |
| Total (Overall) | 5,918 (53.1%) | 5,221 (46.9%) |
Natural Resources, Construction and Maintenance Occupations
The most common Natural Resources, Construction and Maintenance occupations in Louisville are Construction & Extraction (347 | 3.1%), and Installation, Maintenance & Repair (161 | 1.5%).

Natural Resources, Construction and Maintenance Occupations by Sex
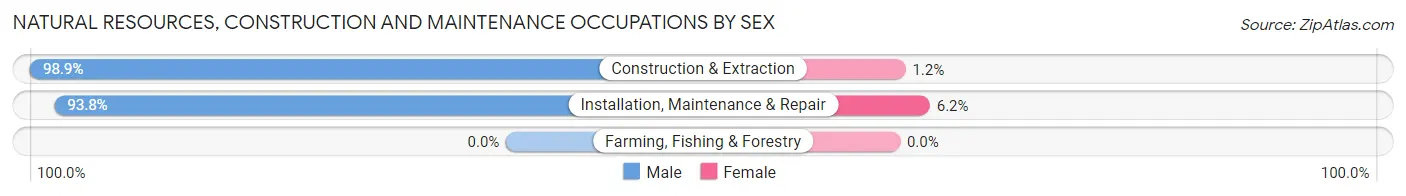
| Occupation | Male | Female |
| Farming, Fishing & Forestry | 0 (0.0%) | 0 (0.0%) |
| Construction & Extraction | 343 (98.9%) | 4 (1.1%) |
| Installation, Maintenance & Repair | 151 (93.8%) | 10 (6.2%) |
| Total (Category) | 494 (97.2%) | 14 (2.8%) |
| Total (Overall) | 5,918 (53.1%) | 5,221 (46.9%) |
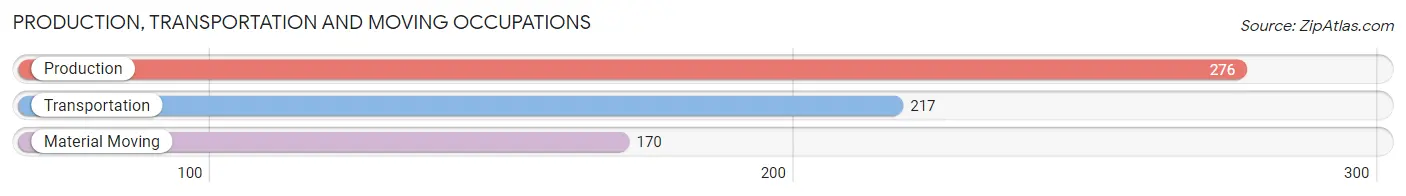
Production, Transportation and Moving Occupations
The most common Production, Transportation and Moving occupations in Louisville are Production (276 | 2.5%), Transportation (217 | 1.9%), and Material Moving (170 | 1.5%).
Production, Transportation and Moving Occupations by Sex
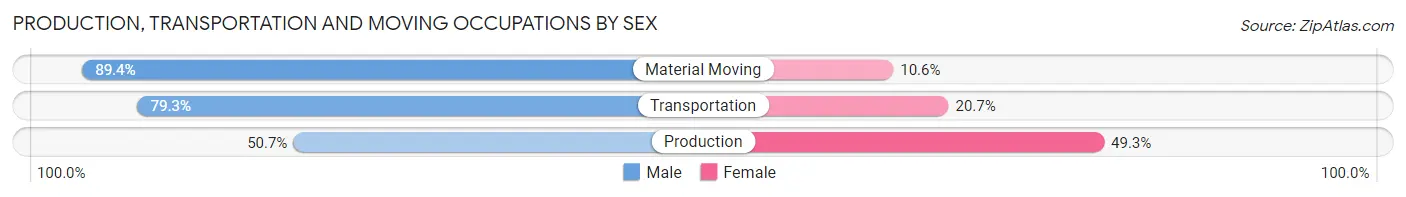
| Occupation | Male | Female |
| Production | 140 (50.7%) | 136 (49.3%) |
| Transportation | 172 (79.3%) | 45 (20.7%) |
| Material Moving | 152 (89.4%) | 18 (10.6%) |
| Total (Category) | 464 (70.0%) | 199 (30.0%) |
| Total (Overall) | 5,918 (53.1%) | 5,221 (46.9%) |
Employment Industries by Sex in Louisville
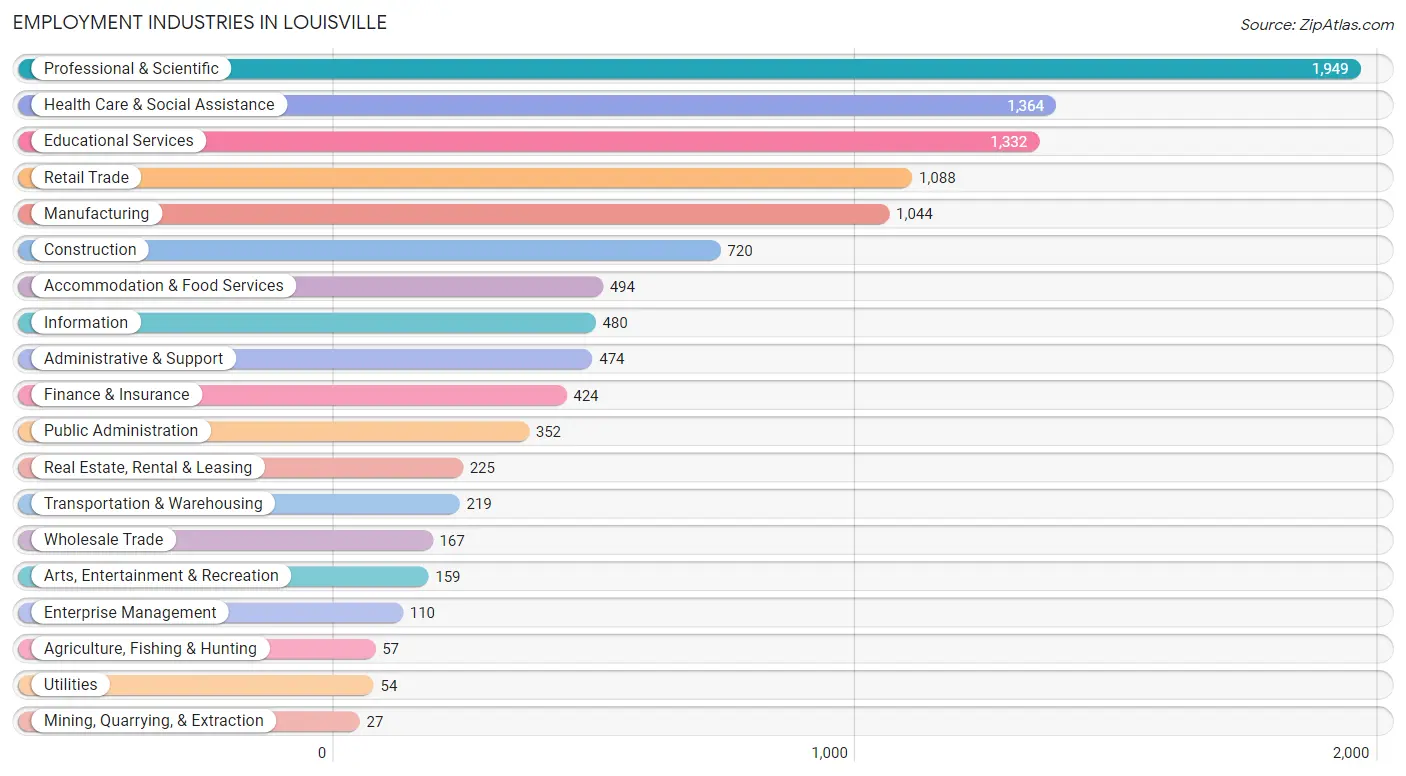
Employment Industries in Louisville
The major employment industries in Louisville include Professional & Scientific (1,949 | 17.5%), Health Care & Social Assistance (1,364 | 12.2%), Educational Services (1,332 | 12.0%), Retail Trade (1,088 | 9.8%), and Manufacturing (1,044 | 9.4%).
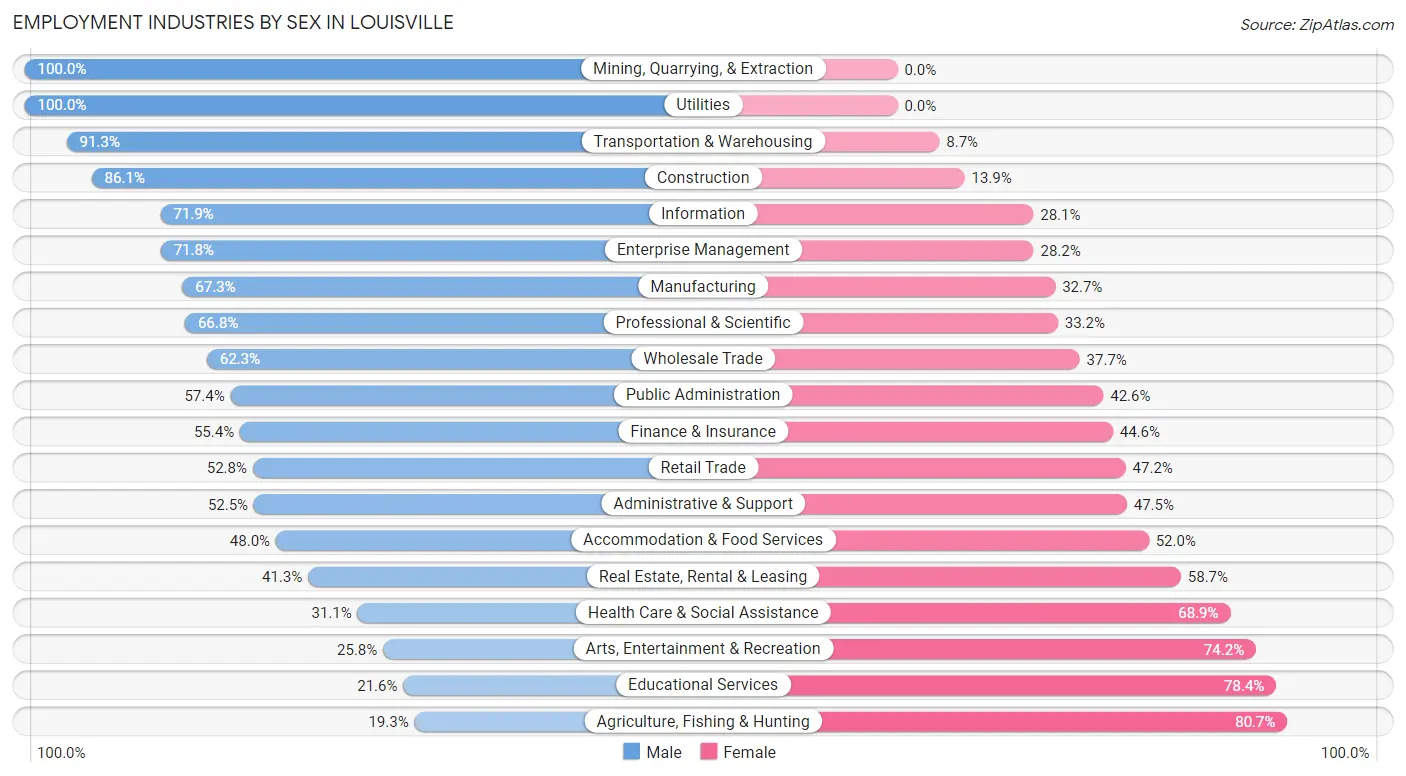
Employment Industries by Sex in Louisville
The Louisville industries that see more men than women are Mining, Quarrying, & Extraction (100.0%), Utilities (100.0%), and Transportation & Warehousing (91.3%), whereas the industries that tend to have a higher number of women are Agriculture, Fishing & Hunting (80.7%), Educational Services (78.4%), and Arts, Entertainment & Recreation (74.2%).
| Industry | Male | Female |
| Agriculture, Fishing & Hunting | 11 (19.3%) | 46 (80.7%) |
| Mining, Quarrying, & Extraction | 27 (100.0%) | 0 (0.0%) |
| Construction | 620 (86.1%) | 100 (13.9%) |
| Manufacturing | 703 (67.3%) | 341 (32.7%) |
| Wholesale Trade | 104 (62.3%) | 63 (37.7%) |
| Retail Trade | 574 (52.8%) | 514 (47.2%) |
| Transportation & Warehousing | 200 (91.3%) | 19 (8.7%) |
| Utilities | 54 (100.0%) | 0 (0.0%) |
| Information | 345 (71.9%) | 135 (28.1%) |
| Finance & Insurance | 235 (55.4%) | 189 (44.6%) |
| Real Estate, Rental & Leasing | 93 (41.3%) | 132 (58.7%) |
| Professional & Scientific | 1,302 (66.8%) | 647 (33.2%) |
| Enterprise Management | 79 (71.8%) | 31 (28.2%) |
| Administrative & Support | 249 (52.5%) | 225 (47.5%) |
| Educational Services | 288 (21.6%) | 1,044 (78.4%) |
| Health Care & Social Assistance | 424 (31.1%) | 940 (68.9%) |
| Arts, Entertainment & Recreation | 41 (25.8%) | 118 (74.2%) |
| Accommodation & Food Services | 237 (48.0%) | 257 (52.0%) |
| Public Administration | 202 (57.4%) | 150 (42.6%) |
| Total | 5,918 (53.1%) | 5,221 (46.9%) |
Education in Louisville
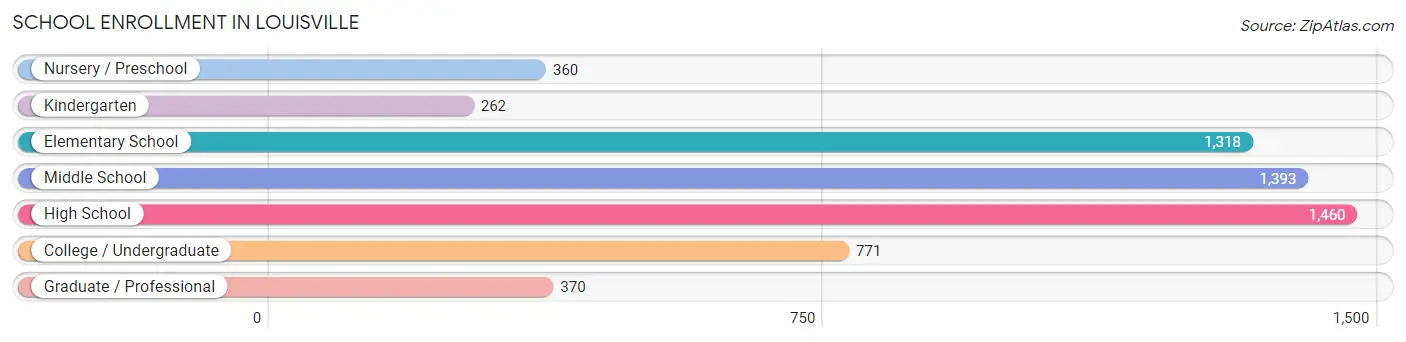
School Enrollment in Louisville
The most common levels of schooling among the 5,934 students in Louisville are high school (1,460 | 24.6%), middle school (1,393 | 23.5%), and elementary school (1,318 | 22.2%).
| School Level | # Students | % Students |
| Nursery / Preschool | 360 | 6.1% |
| Kindergarten | 262 | 4.4% |
| Elementary School | 1,318 | 22.2% |
| Middle School | 1,393 | 23.5% |
| High School | 1,460 | 24.6% |
| College / Undergraduate | 771 | 13.0% |
| Graduate / Professional | 370 | 6.2% |
| Total | 5,934 | 100.0% |
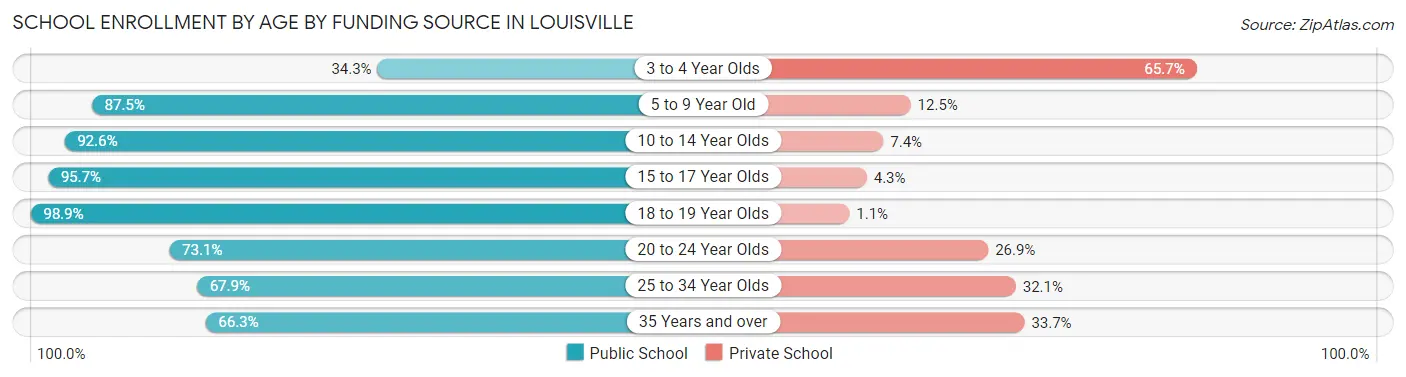
School Enrollment by Age by Funding Source in Louisville
Out of a total of 5,934 students who are enrolled in schools in Louisville, 825 (13.9%) attend a private institution, while the remaining 5,109 (86.1%) are enrolled in public schools. The age group of 3 to 4 year olds has the highest likelihood of being enrolled in private schools, with 186 (65.7% in the age bracket) enrolled. Conversely, the age group of 18 to 19 year olds has the lowest likelihood of being enrolled in a private school, with 558 (98.9% in the age bracket) attending a public institution.
| Age Bracket | Public School | Private School |
| 3 to 4 Year Olds | 97 (34.3%) | 186 (65.7%) |
| 5 to 9 Year Old | 1,283 (87.5%) | 183 (12.5%) |
| 10 to 14 Year Olds | 1,641 (92.6%) | 131 (7.4%) |
| 15 to 17 Year Olds | 889 (95.7%) | 40 (4.3%) |
| 18 to 19 Year Olds | 558 (98.9%) | 6 (1.1%) |
| 20 to 24 Year Olds | 266 (73.1%) | 98 (26.9%) |
| 25 to 34 Year Olds | 178 (67.9%) | 84 (32.1%) |
| 35 Years and over | 195 (66.3%) | 99 (33.7%) |
| Total | 5,109 (86.1%) | 825 (13.9%) |
Educational Attainment by Field of Study in Louisville
Business (1,665 | 16.2%), engineering (1,187 | 11.5%), social sciences (1,070 | 10.4%), science & technology (751 | 7.3%), and psychology (676 | 6.6%) are the most common fields of study among 10,300 individuals in Louisville who have obtained a bachelor's degree or higher.
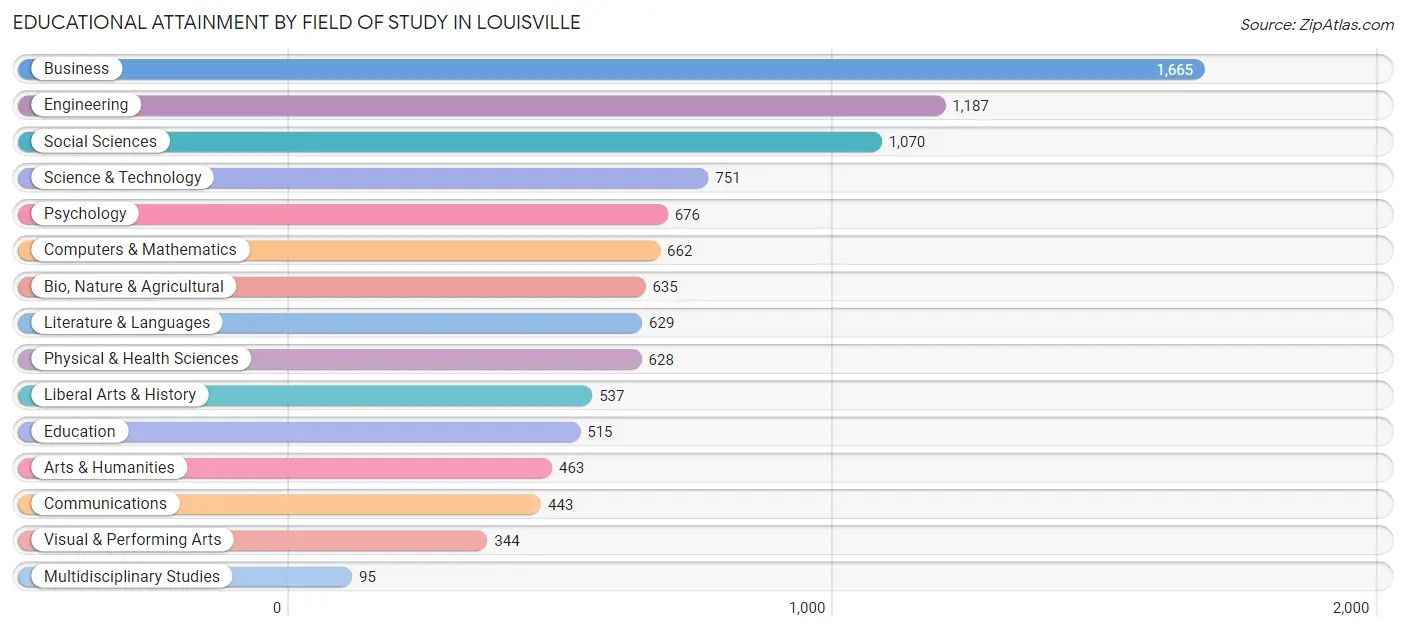
| Field of Study | # Graduates | % Graduates |
| Computers & Mathematics | 662 | 6.4% |
| Bio, Nature & Agricultural | 635 | 6.2% |
| Physical & Health Sciences | 628 | 6.1% |
| Psychology | 676 | 6.6% |
| Social Sciences | 1,070 | 10.4% |
| Engineering | 1,187 | 11.5% |
| Multidisciplinary Studies | 95 | 0.9% |
| Science & Technology | 751 | 7.3% |
| Business | 1,665 | 16.2% |
| Education | 515 | 5.0% |
| Literature & Languages | 629 | 6.1% |
| Liberal Arts & History | 537 | 5.2% |
| Visual & Performing Arts | 344 | 3.3% |
| Communications | 443 | 4.3% |
| Arts & Humanities | 463 | 4.5% |
| Total | 10,300 | 100.0% |
Transportation & Commute in Louisville
Vehicle Availability by Sex in Louisville
The most prevalent vehicle ownership categories in Louisville are males with 2 vehicles (2,841, accounting for 48.3%) and females with 2 vehicles (2,400, making up 55.2%).
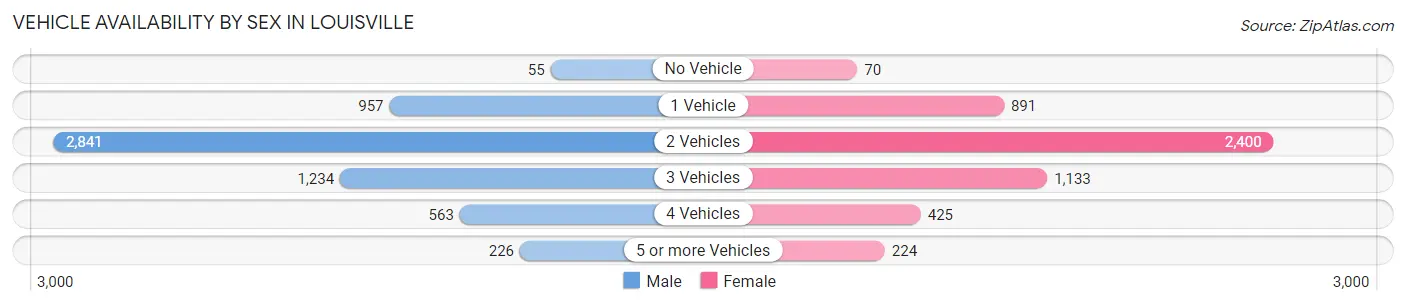
| Vehicles Available | Male | Female |
| No Vehicle | 55 (0.9%) | 70 (1.4%) |
| 1 Vehicle | 957 (16.3%) | 891 (17.3%) |
| 2 Vehicles | 2,841 (48.3%) | 2,400 (46.7%) |
| 3 Vehicles | 1,234 (21.0%) | 1,133 (22.0%) |
| 4 Vehicles | 563 (9.6%) | 425 (8.3%) |
| 5 or more Vehicles | 226 (3.8%) | 224 (4.4%) |
| Total | 5,876 (100.0%) | 5,143 (100.0%) |
Commute Time in Louisville
The most frequently occuring commute durations in Louisville are 20 to 24 minutes (1,362 commuters, 17.7%), 15 to 19 minutes (1,272 commuters, 16.6%), and 10 to 14 minutes (1,194 commuters, 15.5%).
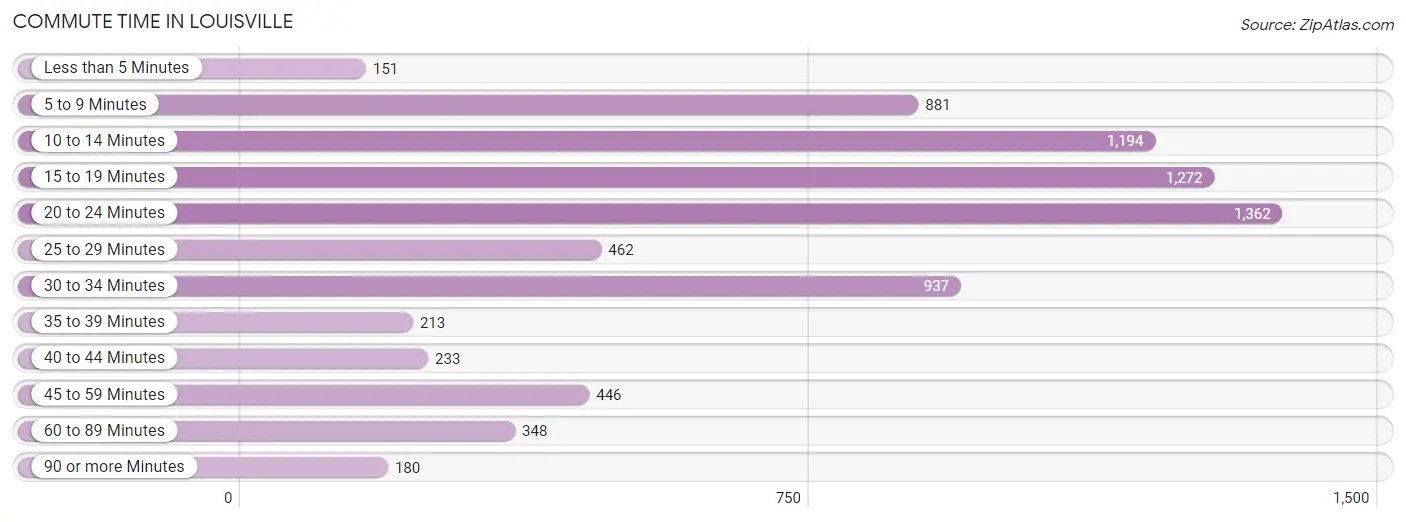
| Commute Time | # Commuters | % Commuters |
| Less than 5 Minutes | 151 | 2.0% |
| 5 to 9 Minutes | 881 | 11.5% |
| 10 to 14 Minutes | 1,194 | 15.5% |
| 15 to 19 Minutes | 1,272 | 16.6% |
| 20 to 24 Minutes | 1,362 | 17.7% |
| 25 to 29 Minutes | 462 | 6.0% |
| 30 to 34 Minutes | 937 | 12.2% |
| 35 to 39 Minutes | 213 | 2.8% |
| 40 to 44 Minutes | 233 | 3.0% |
| 45 to 59 Minutes | 446 | 5.8% |
| 60 to 89 Minutes | 348 | 4.5% |
| 90 or more Minutes | 180 | 2.3% |
Commute Time by Sex in Louisville
The most common commute times in Louisville are 20 to 24 minutes (728 commuters, 17.4%) for males and 20 to 24 minutes (634 commuters, 18.2%) for females.
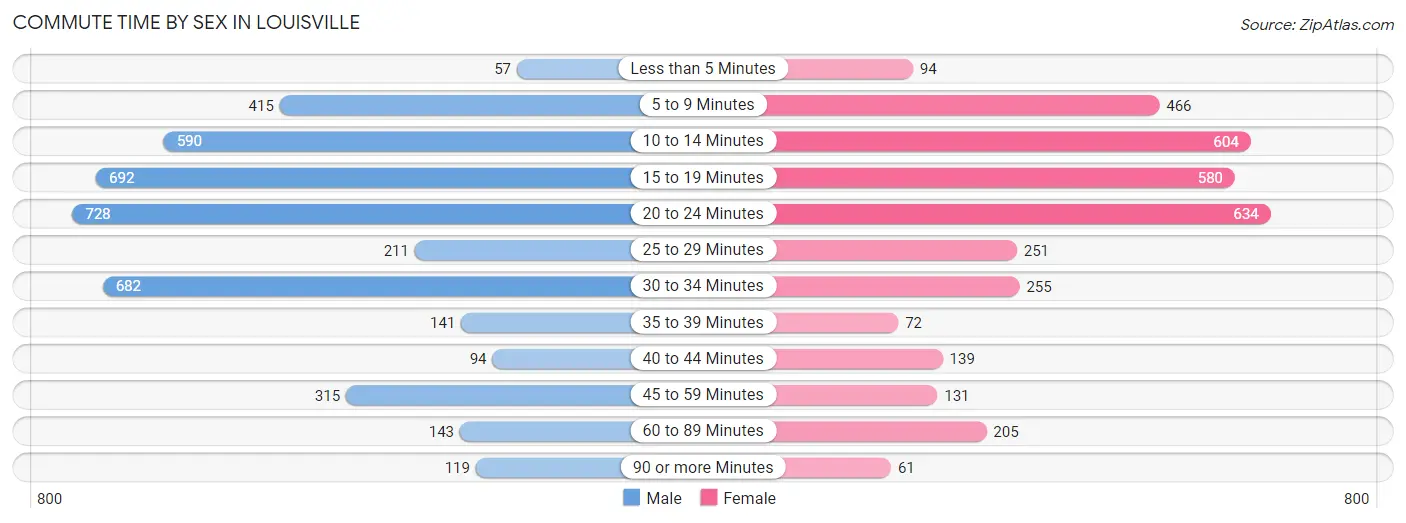
| Commute Time | Male | Female |
| Less than 5 Minutes | 57 (1.4%) | 94 (2.7%) |
| 5 to 9 Minutes | 415 (9.9%) | 466 (13.3%) |
| 10 to 14 Minutes | 590 (14.1%) | 604 (17.3%) |
| 15 to 19 Minutes | 692 (16.5%) | 580 (16.6%) |
| 20 to 24 Minutes | 728 (17.4%) | 634 (18.2%) |
| 25 to 29 Minutes | 211 (5.0%) | 251 (7.2%) |
| 30 to 34 Minutes | 682 (16.3%) | 255 (7.3%) |
| 35 to 39 Minutes | 141 (3.4%) | 72 (2.1%) |
| 40 to 44 Minutes | 94 (2.2%) | 139 (4.0%) |
| 45 to 59 Minutes | 315 (7.5%) | 131 (3.7%) |
| 60 to 89 Minutes | 143 (3.4%) | 205 (5.9%) |
| 90 or more Minutes | 119 (2.8%) | 61 (1.8%) |
Time of Departure to Work by Sex in Louisville
The most frequent times of departure to work in Louisville are 7:30 AM to 7:59 AM (717, 17.1%) for males and 7:30 AM to 7:59 AM (881, 25.2%) for females.
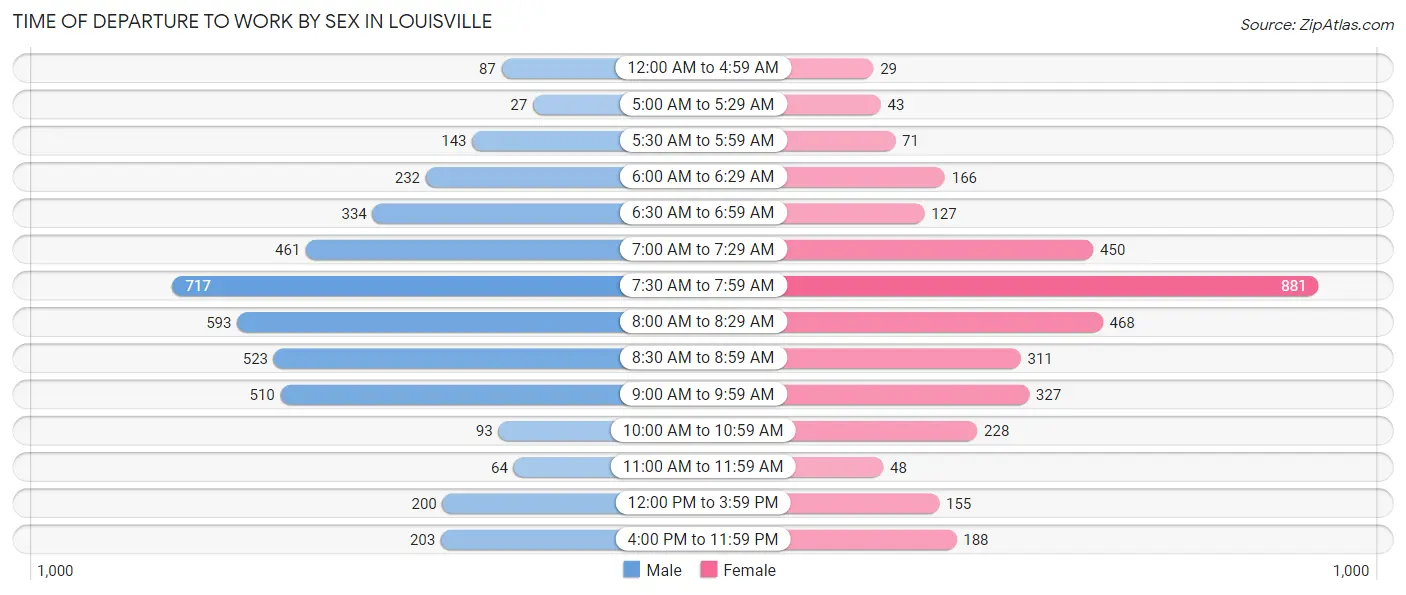
| Time of Departure | Male | Female |
| 12:00 AM to 4:59 AM | 87 (2.1%) | 29 (0.8%) |
| 5:00 AM to 5:29 AM | 27 (0.6%) | 43 (1.2%) |
| 5:30 AM to 5:59 AM | 143 (3.4%) | 71 (2.0%) |
| 6:00 AM to 6:29 AM | 232 (5.5%) | 166 (4.8%) |
| 6:30 AM to 6:59 AM | 334 (8.0%) | 127 (3.6%) |
| 7:00 AM to 7:29 AM | 461 (11.0%) | 450 (12.9%) |
| 7:30 AM to 7:59 AM | 717 (17.1%) | 881 (25.2%) |
| 8:00 AM to 8:29 AM | 593 (14.2%) | 468 (13.4%) |
| 8:30 AM to 8:59 AM | 523 (12.5%) | 311 (8.9%) |
| 9:00 AM to 9:59 AM | 510 (12.2%) | 327 (9.4%) |
| 10:00 AM to 10:59 AM | 93 (2.2%) | 228 (6.5%) |
| 11:00 AM to 11:59 AM | 64 (1.5%) | 48 (1.4%) |
| 12:00 PM to 3:59 PM | 200 (4.8%) | 155 (4.4%) |
| 4:00 PM to 11:59 PM | 203 (4.9%) | 188 (5.4%) |
| Total | 4,187 (100.0%) | 3,492 (100.0%) |
Housing Occupancy in Louisville
Occupancy by Ownership in Louisville
Of the total 8,067 dwellings in Louisville, owner-occupied units account for 5,627 (69.8%), while renter-occupied units make up 2,440 (30.2%).
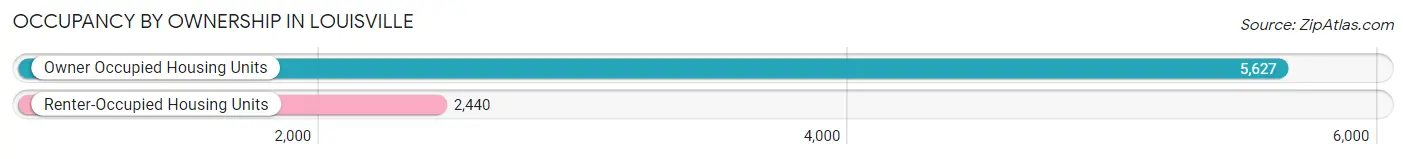
| Occupancy | # Housing Units | % Housing Units |
| Owner Occupied Housing Units | 5,627 | 69.8% |
| Renter-Occupied Housing Units | 2,440 | 30.2% |
| Total Occupied Housing Units | 8,067 | 100.0% |
Occupancy by Household Size in Louisville
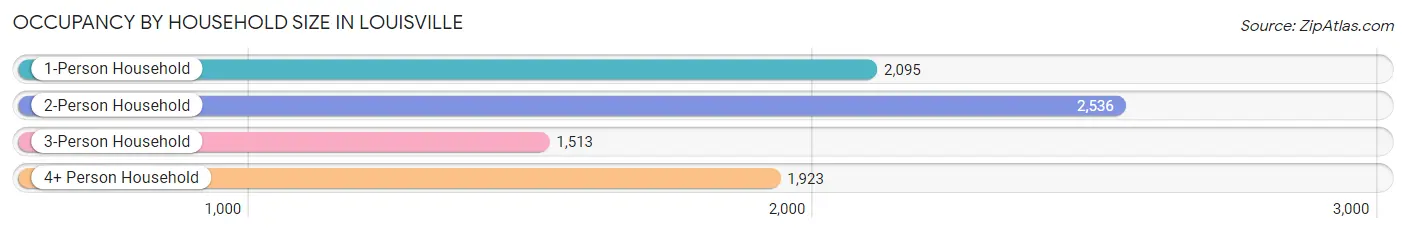
| Household Size | # Housing Units | % Housing Units |
| 1-Person Household | 2,095 | 26.0% |
| 2-Person Household | 2,536 | 31.4% |
| 3-Person Household | 1,513 | 18.8% |
| 4+ Person Household | 1,923 | 23.8% |
| Total Housing Units | 8,067 | 100.0% |
Occupancy by Ownership by Household Size in Louisville
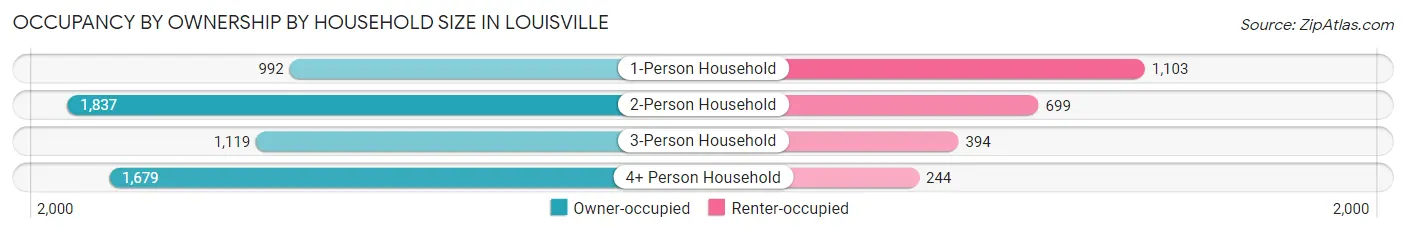
| Household Size | Owner-occupied | Renter-occupied |
| 1-Person Household | 992 (47.3%) | 1,103 (52.6%) |
| 2-Person Household | 1,837 (72.4%) | 699 (27.6%) |
| 3-Person Household | 1,119 (74.0%) | 394 (26.0%) |
| 4+ Person Household | 1,679 (87.3%) | 244 (12.7%) |
| Total Housing Units | 5,627 (69.8%) | 2,440 (30.2%) |
Occupancy by Educational Attainment in Louisville
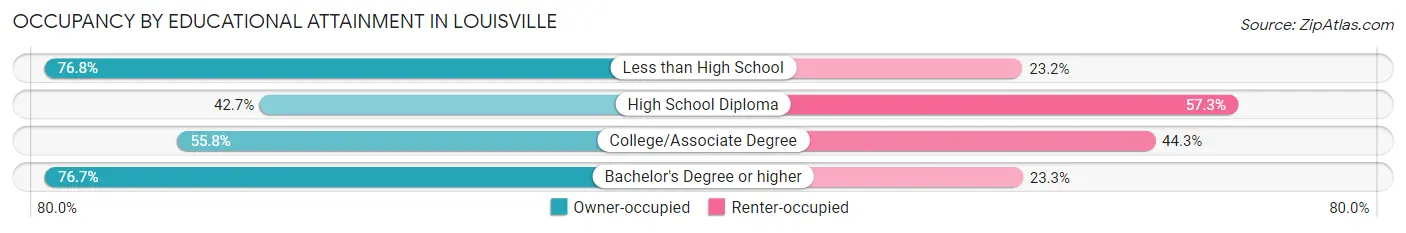
| Household Size | Owner-occupied | Renter-occupied |
| Less than High School | 53 (76.8%) | 16 (23.2%) |
| High School Diploma | 276 (42.7%) | 371 (57.3%) |
| College/Associate Degree | 911 (55.7%) | 723 (44.3%) |
| Bachelor's Degree or higher | 4,387 (76.7%) | 1,330 (23.3%) |
Occupancy by Age of Householder in Louisville
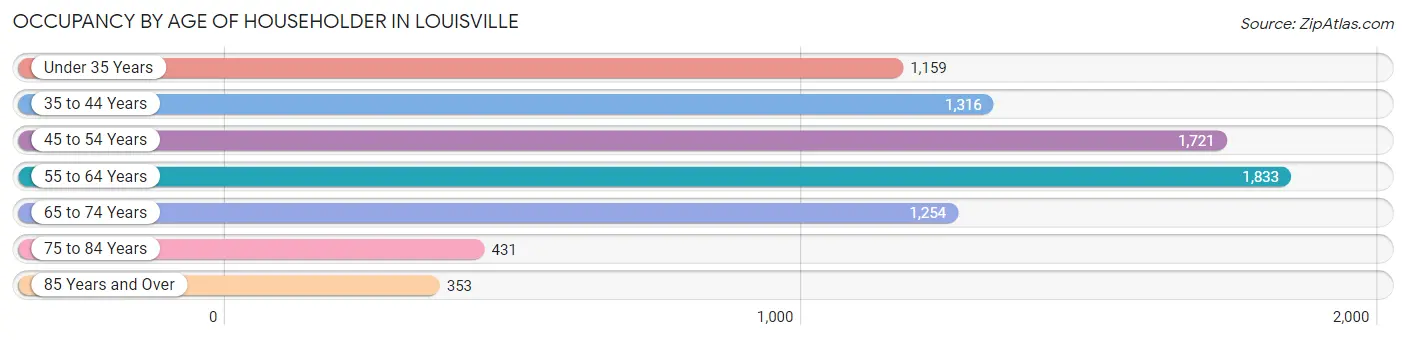
| Age Bracket | # Households | % Households |
| Under 35 Years | 1,159 | 14.4% |
| 35 to 44 Years | 1,316 | 16.3% |
| 45 to 54 Years | 1,721 | 21.3% |
| 55 to 64 Years | 1,833 | 22.7% |
| 65 to 74 Years | 1,254 | 15.5% |
| 75 to 84 Years | 431 | 5.3% |
| 85 Years and Over | 353 | 4.4% |
| Total | 8,067 | 100.0% |
Housing Finances in Louisville
Median Income by Occupancy in Louisville
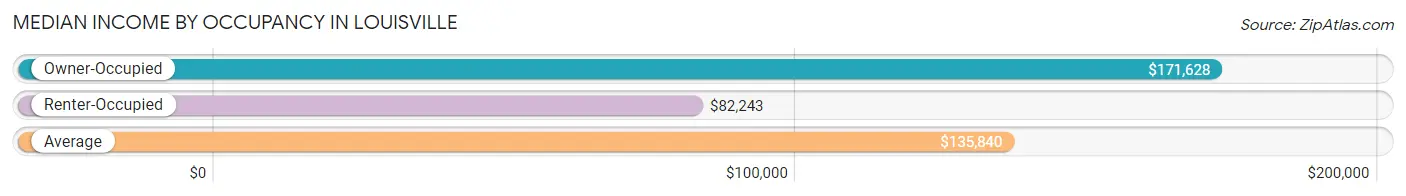
| Occupancy Type | # Households | Median Income |
| Owner-Occupied | 5,627 (69.8%) | $171,628 |
| Renter-Occupied | 2,440 (30.2%) | $82,243 |
| Average | 8,067 (100.0%) | $135,840 |
Occupancy by Householder Income Bracket in Louisville
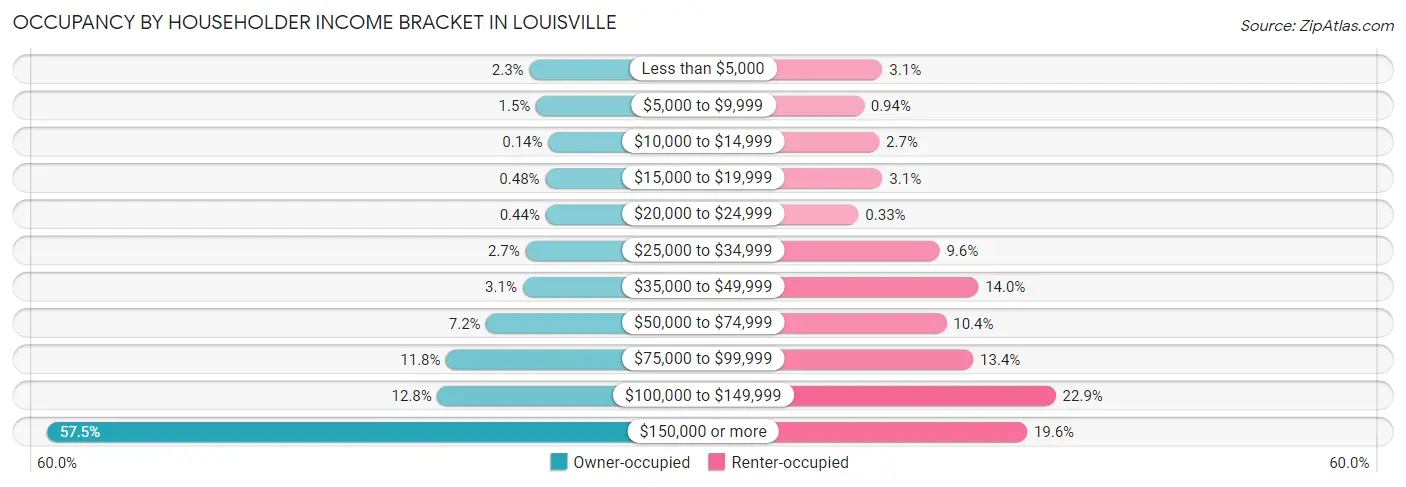
| Income Bracket | Owner-occupied | Renter-occupied |
| Less than $5,000 | 130 (2.3%) | 75 (3.1%) |
| $5,000 to $9,999 | 86 (1.5%) | 23 (0.9%) |
| $10,000 to $14,999 | 8 (0.1%) | 66 (2.7%) |
| $15,000 to $19,999 | 27 (0.5%) | 75 (3.1%) |
| $20,000 to $24,999 | 25 (0.4%) | 8 (0.3%) |
| $25,000 to $34,999 | 154 (2.7%) | 234 (9.6%) |
| $35,000 to $49,999 | 173 (3.1%) | 342 (14.0%) |
| $50,000 to $74,999 | 406 (7.2%) | 253 (10.4%) |
| $75,000 to $99,999 | 664 (11.8%) | 328 (13.4%) |
| $100,000 to $149,999 | 721 (12.8%) | 558 (22.9%) |
| $150,000 or more | 3,233 (57.5%) | 478 (19.6%) |
| Total | 5,627 (100.0%) | 2,440 (100.0%) |
Monthly Housing Cost Tiers in Louisville
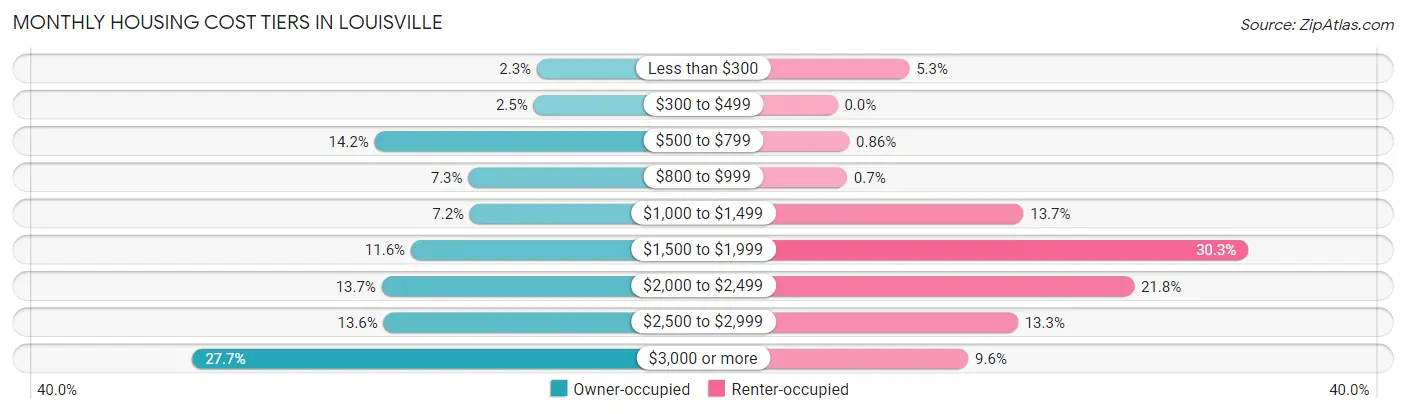
| Monthly Cost | Owner-occupied | Renter-occupied |
| Less than $300 | 128 (2.3%) | 129 (5.3%) |
| $300 to $499 | 142 (2.5%) | 0 (0.0%) |
| $500 to $799 | 800 (14.2%) | 21 (0.9%) |
| $800 to $999 | 412 (7.3%) | 17 (0.7%) |
| $1,000 to $1,499 | 405 (7.2%) | 334 (13.7%) |
| $1,500 to $1,999 | 650 (11.6%) | 738 (30.2%) |
| $2,000 to $2,499 | 771 (13.7%) | 533 (21.8%) |
| $2,500 to $2,999 | 763 (13.6%) | 324 (13.3%) |
| $3,000 or more | 1,556 (27.7%) | 235 (9.6%) |
| Total | 5,627 (100.0%) | 2,440 (100.0%) |
Physical Housing Characteristics in Louisville
Housing Structures in Louisville
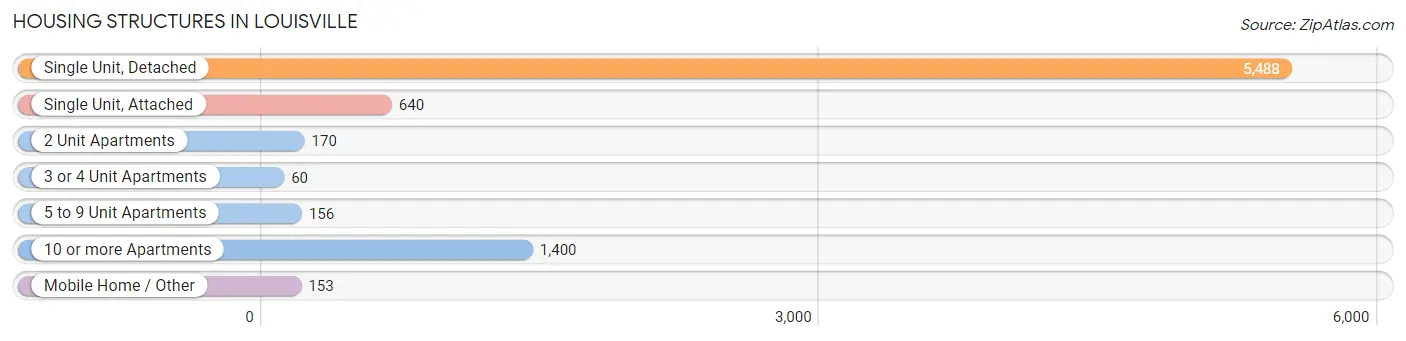
| Structure Type | # Housing Units | % Housing Units |
| Single Unit, Detached | 5,488 | 68.0% |
| Single Unit, Attached | 640 | 7.9% |
| 2 Unit Apartments | 170 | 2.1% |
| 3 or 4 Unit Apartments | 60 | 0.7% |
| 5 to 9 Unit Apartments | 156 | 1.9% |
| 10 or more Apartments | 1,400 | 17.3% |
| Mobile Home / Other | 153 | 1.9% |
| Total | 8,067 | 100.0% |
Housing Structures by Occupancy in Louisville
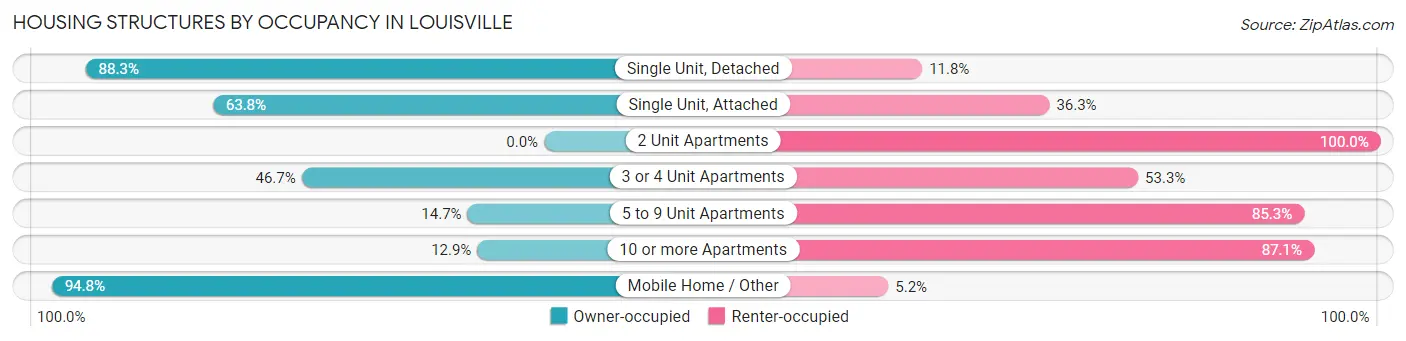
| Structure Type | Owner-occupied | Renter-occupied |
| Single Unit, Detached | 4,843 (88.2%) | 645 (11.7%) |
| Single Unit, Attached | 408 (63.7%) | 232 (36.2%) |
| 2 Unit Apartments | 0 (0.0%) | 170 (100.0%) |
| 3 or 4 Unit Apartments | 28 (46.7%) | 32 (53.3%) |
| 5 to 9 Unit Apartments | 23 (14.7%) | 133 (85.3%) |
| 10 or more Apartments | 180 (12.9%) | 1,220 (87.1%) |
| Mobile Home / Other | 145 (94.8%) | 8 (5.2%) |
| Total | 5,627 (69.8%) | 2,440 (30.2%) |
Housing Structures by Number of Rooms in Louisville
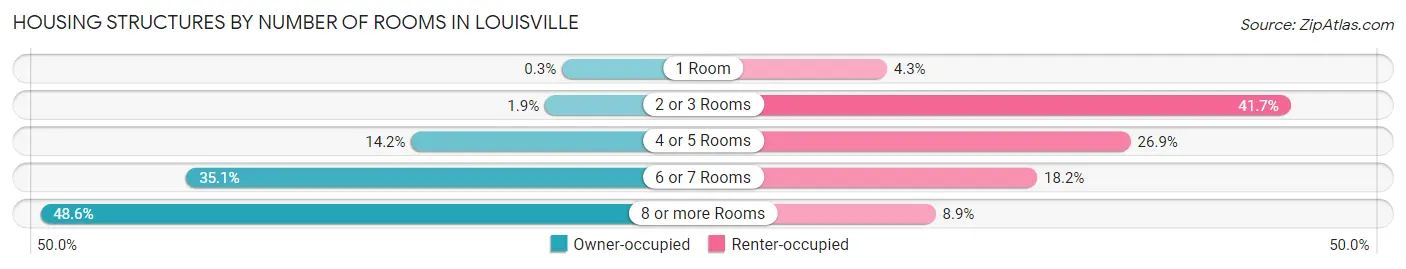
| Number of Rooms | Owner-occupied | Renter-occupied |
| 1 Room | 17 (0.3%) | 106 (4.3%) |
| 2 or 3 Rooms | 105 (1.9%) | 1,017 (41.7%) |
| 4 or 5 Rooms | 801 (14.2%) | 656 (26.9%) |
| 6 or 7 Rooms | 1,972 (35.0%) | 445 (18.2%) |
| 8 or more Rooms | 2,732 (48.5%) | 216 (8.8%) |
| Total | 5,627 (100.0%) | 2,440 (100.0%) |
Housing Structure by Heating Type in Louisville
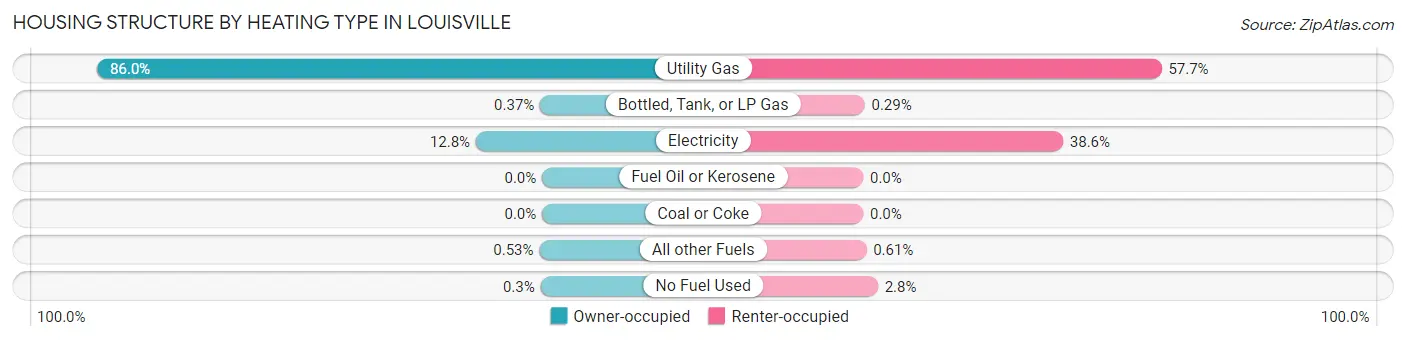
| Heating Type | Owner-occupied | Renter-occupied |
| Utility Gas | 4,840 (86.0%) | 1,407 (57.7%) |
| Bottled, Tank, or LP Gas | 21 (0.4%) | 7 (0.3%) |
| Electricity | 719 (12.8%) | 942 (38.6%) |
| Fuel Oil or Kerosene | 0 (0.0%) | 0 (0.0%) |
| Coal or Coke | 0 (0.0%) | 0 (0.0%) |
| All other Fuels | 30 (0.5%) | 15 (0.6%) |
| No Fuel Used | 17 (0.3%) | 69 (2.8%) |
| Total | 5,627 (100.0%) | 2,440 (100.0%) |
Household Vehicle Usage in Louisville
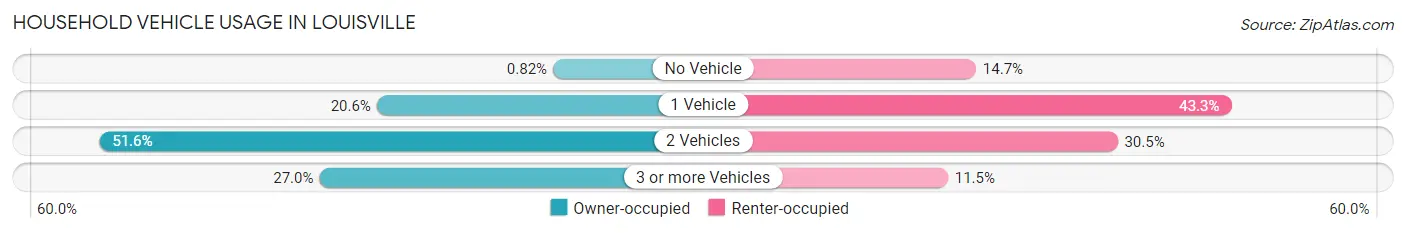
| Vehicles per Household | Owner-occupied | Renter-occupied |
| No Vehicle | 46 (0.8%) | 358 (14.7%) |
| 1 Vehicle | 1,157 (20.6%) | 1,056 (43.3%) |
| 2 Vehicles | 2,905 (51.6%) | 745 (30.5%) |
| 3 or more Vehicles | 1,519 (27.0%) | 281 (11.5%) |
| Total | 5,627 (100.0%) | 2,440 (100.0%) |
Real Estate & Mortgages in Louisville
Real Estate and Mortgage Overview in Louisville
| Characteristic | Without Mortgage | With Mortgage |
| Housing Units | 1,572 | 4,055 |
| Median Property Value | $677,500 | $819,500 |
| Median Household Income | $88,294 | $2,755 |
| Monthly Housing Costs | $692 | $1,547 |
| Real Estate Taxes | $3,683 | $10 |
Property Value by Mortgage Status in Louisville
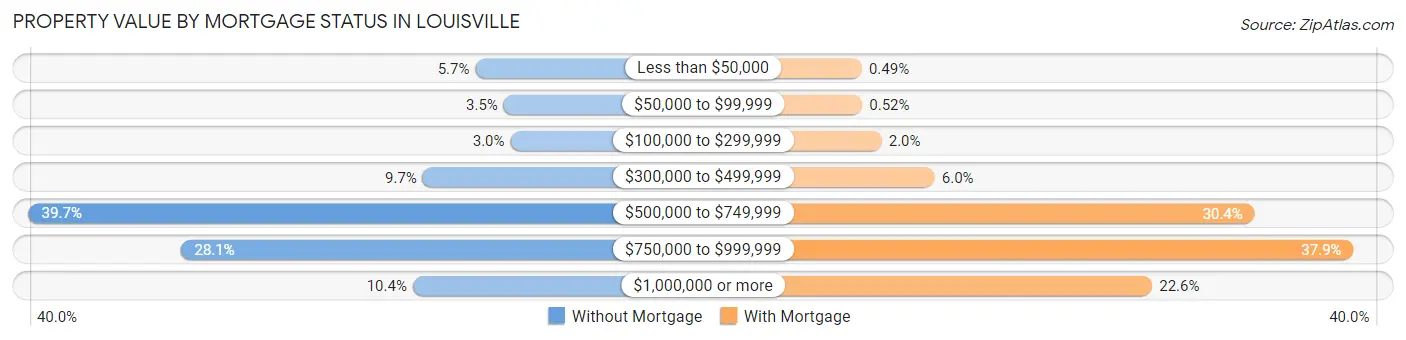
| Property Value | Without Mortgage | With Mortgage |
| Less than $50,000 | 89 (5.7%) | 20 (0.5%) |
| $50,000 to $99,999 | 55 (3.5%) | 21 (0.5%) |
| $100,000 to $299,999 | 47 (3.0%) | 81 (2.0%) |
| $300,000 to $499,999 | 152 (9.7%) | 245 (6.0%) |
| $500,000 to $749,999 | 624 (39.7%) | 1,233 (30.4%) |
| $750,000 to $999,999 | 441 (28.1%) | 1,538 (37.9%) |
| $1,000,000 or more | 164 (10.4%) | 917 (22.6%) |
| Total | 1,572 (100.0%) | 4,055 (100.0%) |
Household Income by Mortgage Status in Louisville
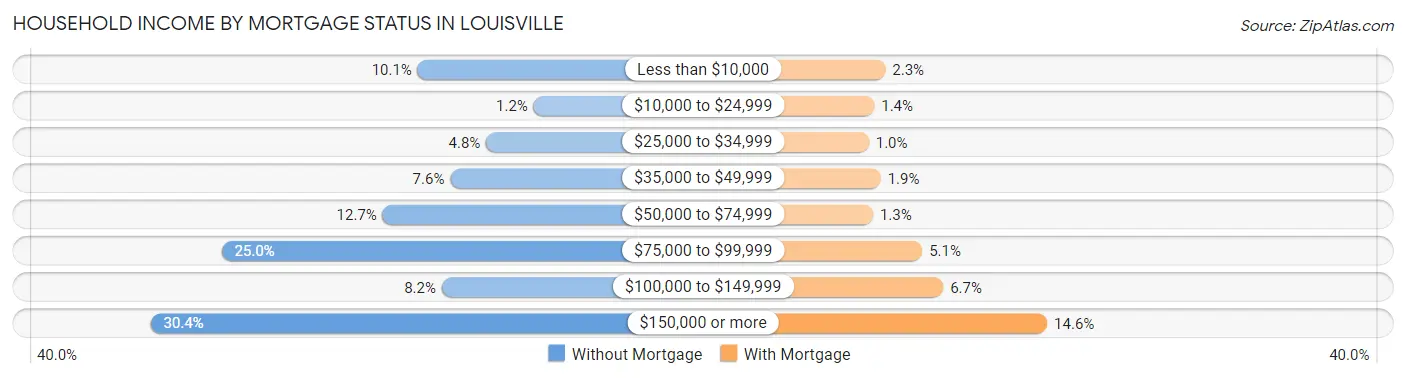
| Household Income | Without Mortgage | With Mortgage |
| Less than $10,000 | 158 (10.1%) | 92 (2.3%) |
| $10,000 to $24,999 | 19 (1.2%) | 58 (1.4%) |
| $25,000 to $34,999 | 76 (4.8%) | 41 (1.0%) |
| $35,000 to $49,999 | 119 (7.6%) | 78 (1.9%) |
| $50,000 to $74,999 | 200 (12.7%) | 54 (1.3%) |
| $75,000 to $99,999 | 393 (25.0%) | 206 (5.1%) |
| $100,000 to $149,999 | 129 (8.2%) | 271 (6.7%) |
| $150,000 or more | 478 (30.4%) | 592 (14.6%) |
| Total | 1,572 (100.0%) | 4,055 (100.0%) |
Property Value to Household Income Ratio in Louisville
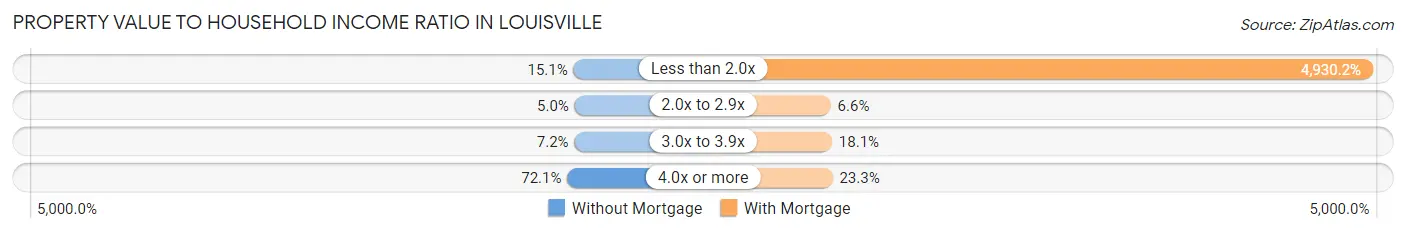
| Value-to-Income Ratio | Without Mortgage | With Mortgage |
| Less than 2.0x | 238 (15.1%) | 199,919 (4,930.2%) |
| 2.0x to 2.9x | 78 (5.0%) | 269 (6.6%) |
| 3.0x to 3.9x | 113 (7.2%) | 735 (18.1%) |
| 4.0x or more | 1,133 (72.1%) | 943 (23.3%) |
| Total | 1,572 (100.0%) | 4,055 (100.0%) |
Real Estate Taxes by Mortgage Status in Louisville
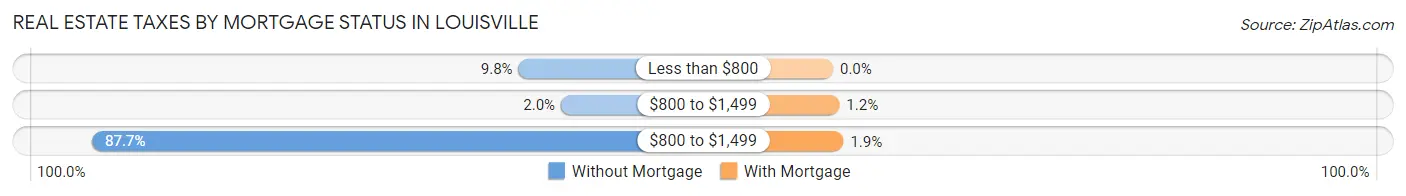
| Property Taxes | Without Mortgage | With Mortgage |
| Less than $800 | 154 (9.8%) | 0 (0.0%) |
| $800 to $1,499 | 32 (2.0%) | 47 (1.2%) |
| $800 to $1,499 | 1,378 (87.7%) | 77 (1.9%) |
| Total | 1,572 (100.0%) | 4,055 (100.0%) |
Health & Disability in Louisville
Health Insurance Coverage by Age in Louisville
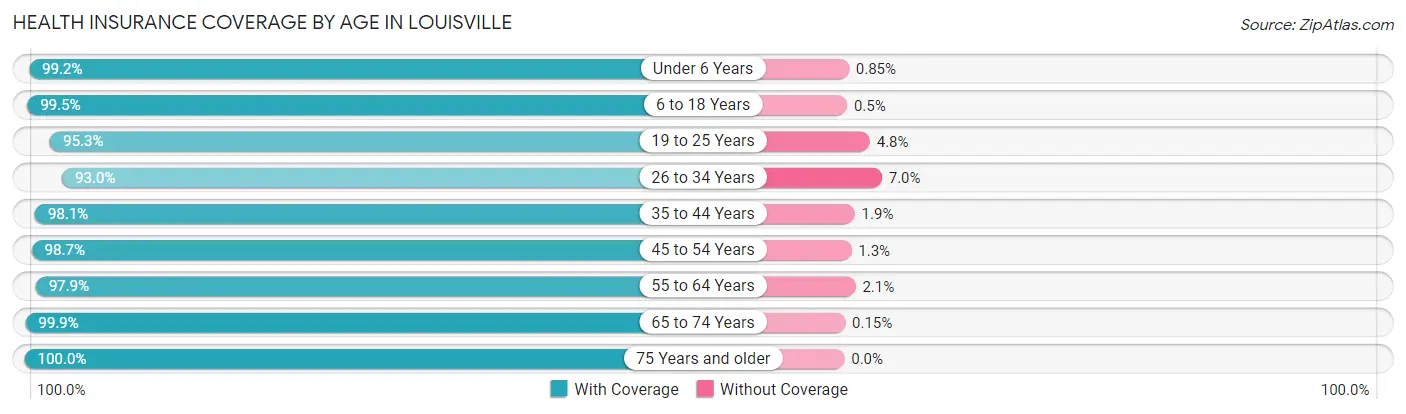
| Age Bracket | With Coverage | Without Coverage |
| Under 6 Years | 1,173 (99.2%) | 10 (0.9%) |
| 6 to 18 Years | 4,337 (99.5%) | 22 (0.5%) |
| 19 to 25 Years | 1,363 (95.3%) | 68 (4.8%) |
| 26 to 34 Years | 1,837 (93.0%) | 138 (7.0%) |
| 35 to 44 Years | 2,594 (98.1%) | 51 (1.9%) |
| 45 to 54 Years | 3,080 (98.7%) | 41 (1.3%) |
| 55 to 64 Years | 2,965 (97.9%) | 63 (2.1%) |
| 65 to 74 Years | 1,961 (99.9%) | 3 (0.2%) |
| 75 Years and older | 1,009 (100.0%) | 0 (0.0%) |
| Total | 20,319 (98.1%) | 396 (1.9%) |
Health Insurance Coverage by Citizenship Status in Louisville
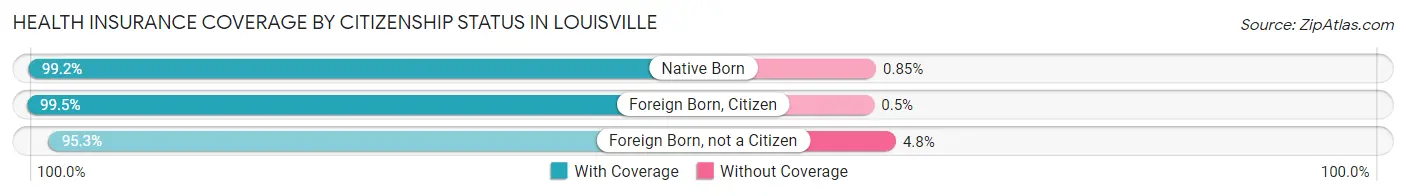
| Citizenship Status | With Coverage | Without Coverage |
| Native Born | 1,173 (99.2%) | 10 (0.9%) |
| Foreign Born, Citizen | 4,337 (99.5%) | 22 (0.5%) |
| Foreign Born, not a Citizen | 1,363 (95.3%) | 68 (4.8%) |
Health Insurance Coverage by Household Income in Louisville
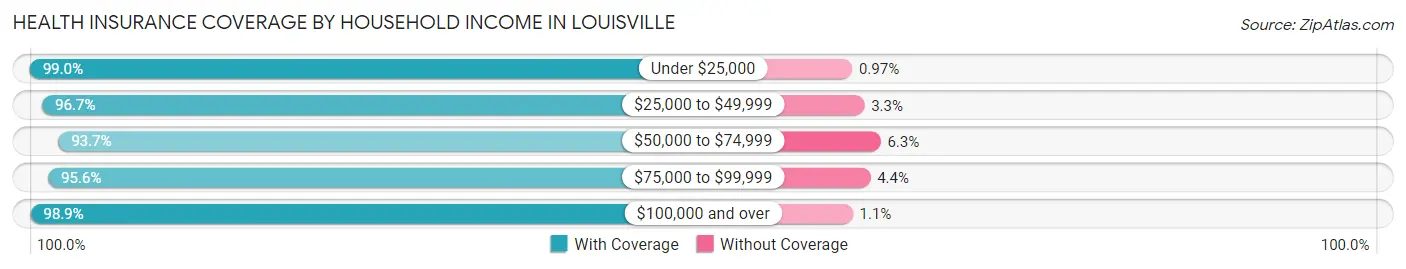
| Household Income | With Coverage | Without Coverage |
| Under $25,000 | 817 (99.0%) | 8 (1.0%) |
| $25,000 to $49,999 | 1,389 (96.7%) | 47 (3.3%) |
| $50,000 to $74,999 | 1,114 (93.7%) | 75 (6.3%) |
| $75,000 to $99,999 | 2,309 (95.6%) | 106 (4.4%) |
| $100,000 and over | 14,674 (98.9%) | 160 (1.1%) |
Public vs Private Health Insurance Coverage by Age in Louisville
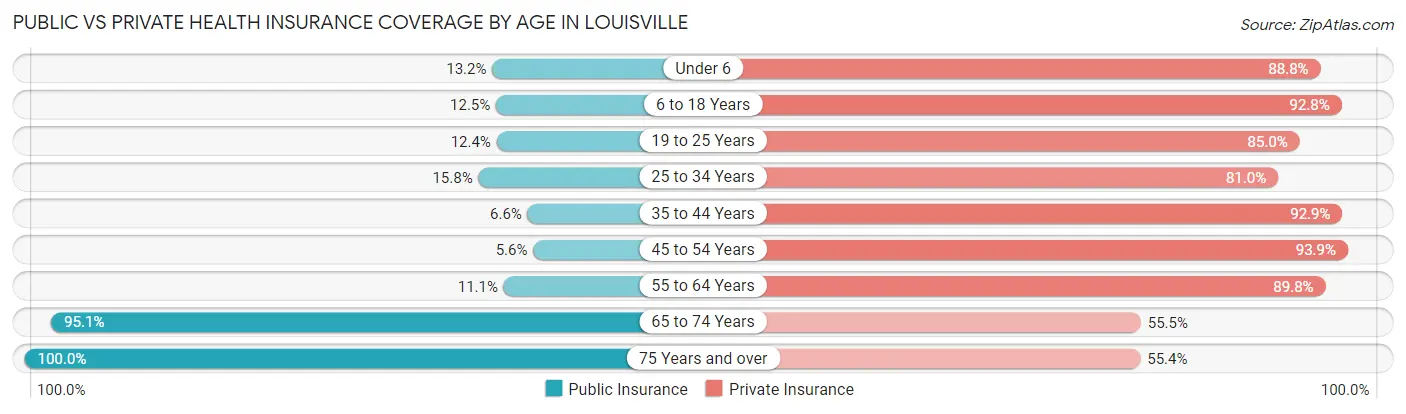
| Age Bracket | Public Insurance | Private Insurance |
| Under 6 | 156 (13.2%) | 1,051 (88.8%) |
| 6 to 18 Years | 544 (12.5%) | 4,044 (92.8%) |
| 19 to 25 Years | 177 (12.4%) | 1,216 (85.0%) |
| 25 to 34 Years | 311 (15.8%) | 1,599 (81.0%) |
| 35 to 44 Years | 175 (6.6%) | 2,457 (92.9%) |
| 45 to 54 Years | 174 (5.6%) | 2,931 (93.9%) |
| 55 to 64 Years | 335 (11.1%) | 2,718 (89.8%) |
| 65 to 74 Years | 1,867 (95.1%) | 1,090 (55.5%) |
| 75 Years and over | 1,009 (100.0%) | 559 (55.4%) |
| Total | 4,748 (22.9%) | 17,665 (85.3%) |
Disability Status by Sex by Age in Louisville
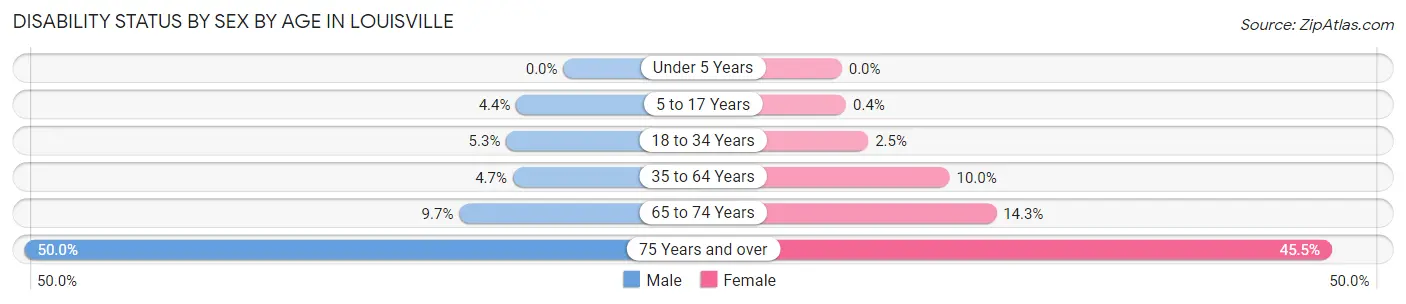
| Age Bracket | Male | Female |
| Under 5 Years | 0 (0.0%) | 0 (0.0%) |
| 5 to 17 Years | 95 (4.4%) | 8 (0.4%) |
| 18 to 34 Years | 112 (5.3%) | 42 (2.5%) |
| 35 to 64 Years | 204 (4.7%) | 444 (10.0%) |
| 65 to 74 Years | 96 (9.7%) | 139 (14.3%) |
| 75 Years and over | 179 (50.0%) | 296 (45.5%) |
Disability Class by Sex by Age in Louisville
Disability Class: Hearing Difficulty
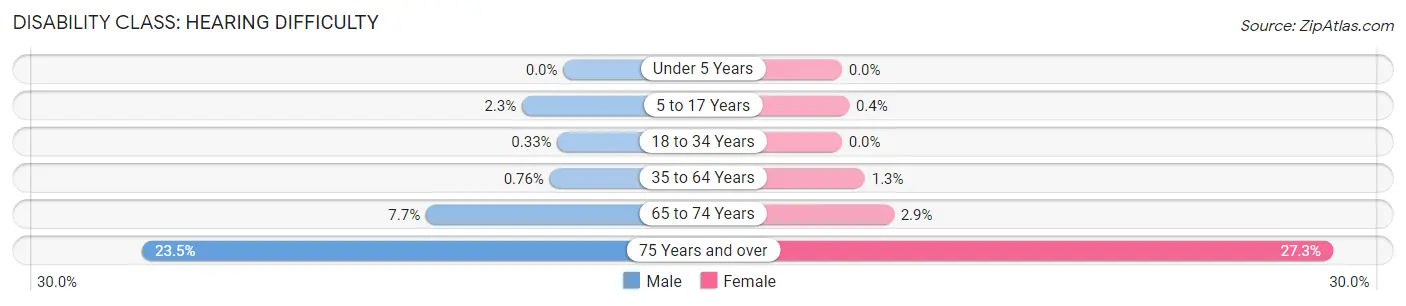
| Age Bracket | Male | Female |
| Under 5 Years | 0 (0.0%) | 0 (0.0%) |
| 5 to 17 Years | 50 (2.3%) | 8 (0.4%) |
| 18 to 34 Years | 7 (0.3%) | 0 (0.0%) |
| 35 to 64 Years | 33 (0.8%) | 57 (1.3%) |
| 65 to 74 Years | 76 (7.6%) | 28 (2.9%) |
| 75 Years and over | 84 (23.5%) | 178 (27.3%) |
Disability Class: Vision Difficulty
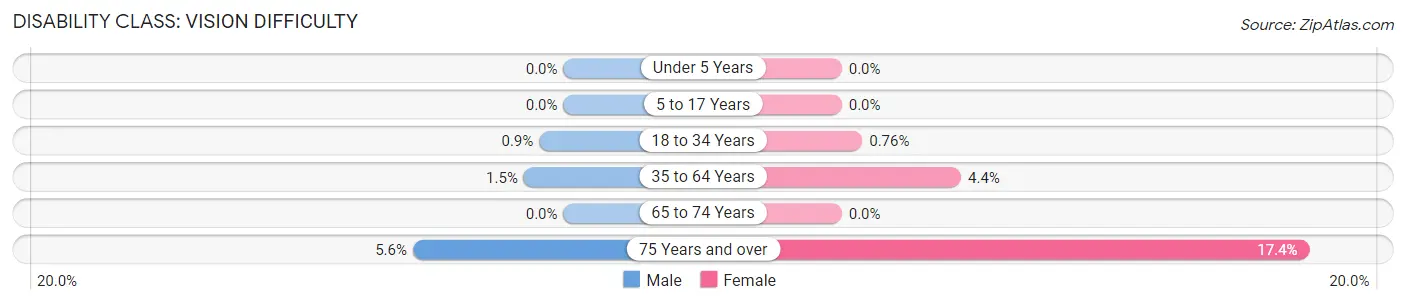
| Age Bracket | Male | Female |
| Under 5 Years | 0 (0.0%) | 0 (0.0%) |
| 5 to 17 Years | 0 (0.0%) | 0 (0.0%) |
| 18 to 34 Years | 19 (0.9%) | 13 (0.8%) |
| 35 to 64 Years | 64 (1.5%) | 197 (4.4%) |
| 65 to 74 Years | 0 (0.0%) | 0 (0.0%) |
| 75 Years and over | 20 (5.6%) | 113 (17.4%) |
Disability Class: Cognitive Difficulty
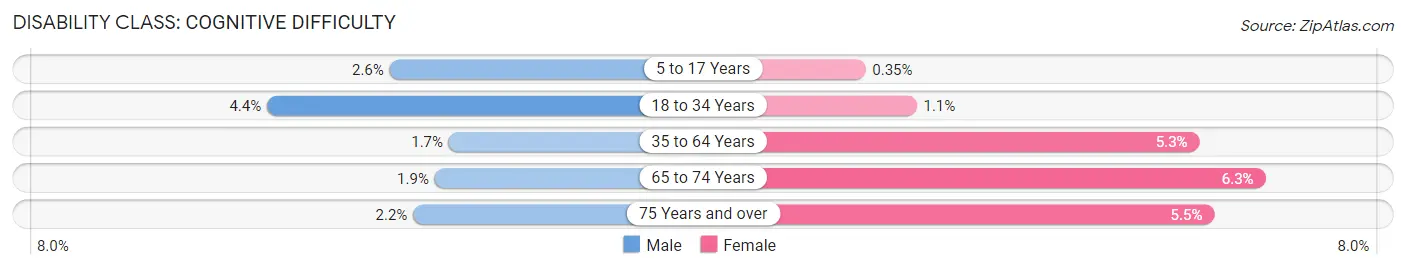
| Age Bracket | Male | Female |
| 5 to 17 Years | 56 (2.6%) | 7 (0.4%) |
| 18 to 34 Years | 93 (4.4%) | 19 (1.1%) |
| 35 to 64 Years | 74 (1.7%) | 236 (5.3%) |
| 65 to 74 Years | 19 (1.9%) | 61 (6.3%) |
| 75 Years and over | 8 (2.2%) | 36 (5.5%) |
Disability Class: Ambulatory Difficulty
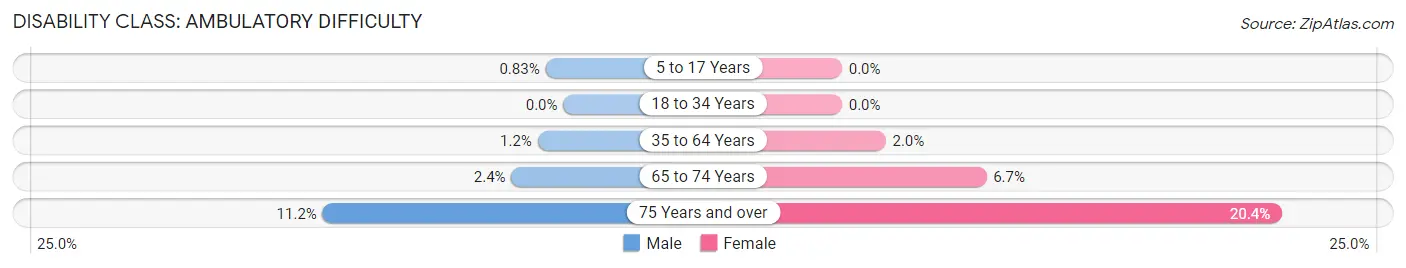
| Age Bracket | Male | Female |
| 5 to 17 Years | 18 (0.8%) | 0 (0.0%) |
| 18 to 34 Years | 0 (0.0%) | 0 (0.0%) |
| 35 to 64 Years | 52 (1.2%) | 90 (2.0%) |
| 65 to 74 Years | 24 (2.4%) | 65 (6.7%) |
| 75 Years and over | 40 (11.2%) | 133 (20.4%) |
Disability Class: Self-Care Difficulty
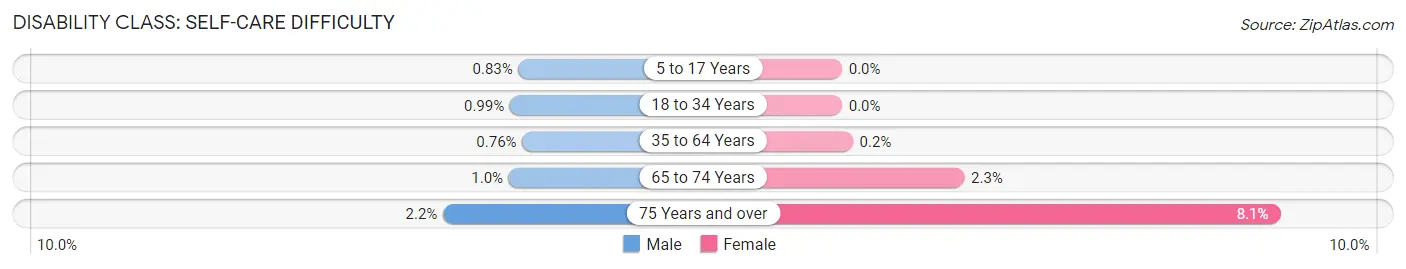
| Age Bracket | Male | Female |
| 5 to 17 Years | 18 (0.8%) | 0 (0.0%) |
| 18 to 34 Years | 21 (1.0%) | 0 (0.0%) |
| 35 to 64 Years | 33 (0.8%) | 9 (0.2%) |
| 65 to 74 Years | 10 (1.0%) | 22 (2.3%) |
| 75 Years and over | 8 (2.2%) | 53 (8.1%) |
Technology Access in Louisville
Computing Device Access in Louisville
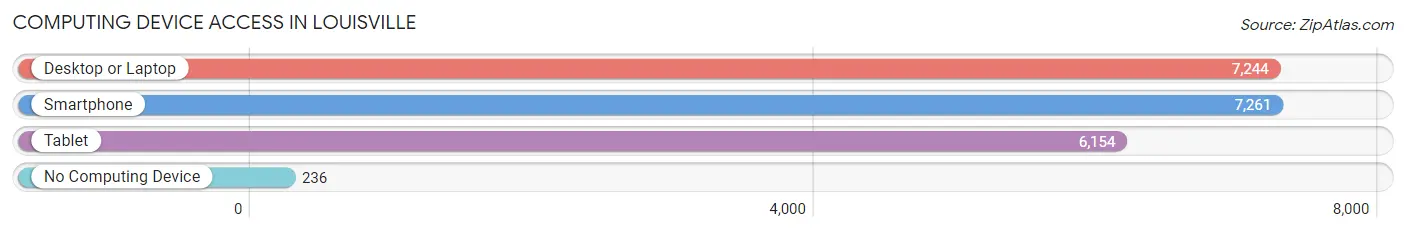
| Device Type | # Households | % Households |
| Desktop or Laptop | 7,244 | 89.8% |
| Smartphone | 7,261 | 90.0% |
| Tablet | 6,154 | 76.3% |
| No Computing Device | 236 | 2.9% |
| Total | 8,067 | 100.0% |
Internet Access in Louisville
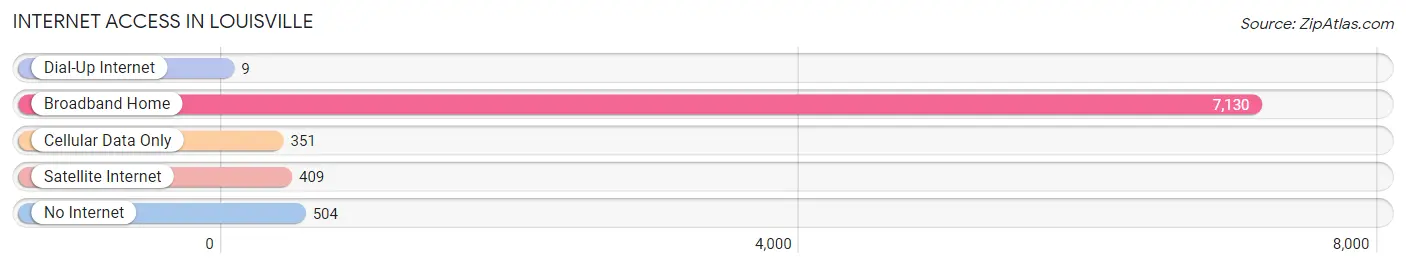
| Internet Type | # Households | % Households |
| Dial-Up Internet | 9 | 0.1% |
| Broadband Home | 7,130 | 88.4% |
| Cellular Data Only | 351 | 4.3% |
| Satellite Internet | 409 | 5.1% |
| No Internet | 504 | 6.2% |
| Total | 8,067 | 100.0% |
Louisville Summary
Louisville, Colorado is a small city located in Boulder County, Colorado. It is situated in the foothills of the Rocky Mountains, approximately 20 miles northwest of Denver. The city has a population of approximately 21,000 people and is known for its small-town charm and outdoor recreation opportunities.
History
The area that is now Louisville was first settled in 1877 by a group of miners who were looking for gold. The town was originally called Cottonwood, but the name was changed to Louisville in 1882 in honor of a local miner, Louis Nawatny. The town grew slowly over the next few decades, and by the early 1900s, it had become a popular destination for tourists and outdoor enthusiasts.
In the 1950s, Louisville began to experience rapid growth as people moved to the area from other parts of the country. This growth was fueled by the development of the nearby Rocky Flats nuclear weapons plant, which provided jobs for many of the new residents. The city continued to grow throughout the 1970s and 1980s, and by the 1990s, it had become a popular bedroom community for Denver.
Geography
Louisville is located in the foothills of the Rocky Mountains, approximately 20 miles northwest of Denver. The city is situated at an elevation of 5,400 feet and is surrounded by rolling hills and open space. The city is located in the South Platte River Valley, and the nearby mountains provide a stunning backdrop.
The climate in Louisville is mild and dry, with hot summers and cold winters. The average annual temperature is around 50 degrees Fahrenheit, and the average annual precipitation is around 16 inches.
Economy
The economy of Louisville is largely based on the service industry, with many residents employed in retail, hospitality, and healthcare. The city is also home to several technology companies, including IBM, Oracle, and Google. The city is also home to several educational institutions, including the University of Colorado Boulder and the University of Denver.
The city is also home to several large employers, including the Rocky Flats nuclear weapons plant, which is now closed. The city is also home to several large employers, including the University of Colorado Boulder, IBM, Oracle, and Google.
Demographics
As of the 2010 census, the population of Louisville was 21,000. The racial makeup of the city was 87.3% White, 4.2% Hispanic or Latino, 3.7% Asian, 2.2% African American, and 2.6% from other races. The median household income was $77,000, and the median age was 38.
The city is home to a diverse population, with many residents of different backgrounds and cultures. The city is also home to a large number of immigrants, with many coming from Mexico, India, and China.
Conclusion
Louisville, Colorado is a small city located in Boulder County, Colorado. It is situated in the foothills of the Rocky Mountains, approximately 20 miles northwest of Denver. The city has a population of approximately 21,000 people and is known for its small-town charm and outdoor recreation opportunities. The economy of Louisville is largely based on the service industry, with many residents employed in retail, hospitality, and healthcare. The city is also home to several technology companies, including IBM, Oracle, and Google. The city is also home to a diverse population, with many residents of different backgrounds and cultures. Louisville is a great place to live, work, and play, and it is a great example of a small city with big city amenities.
Common Questions
What is Per Capita Income in Louisville?
Per Capita income in Louisville is $65,907.
What is the Median Family Income in Louisville?
Median Family Income in Louisville is $173,925.
What is the Median Household income in Louisville?
Median Household Income in Louisville is $135,840.
What is Income or Wage Gap in Louisville?
Income or Wage Gap in Louisville is 33.9%.
Women in Louisville earn 66.1 cents for every dollar earned by a man.
What is Inequality or Gini Index in Louisville?
Inequality or Gini Index in Louisville is 0.42.
What is the Total Population of Louisville?
Total Population of Louisville is 20,920.
What is the Total Male Population of Louisville?
Total Male Population of Louisville is 10,588.
What is the Total Female Population of Louisville?
Total Female Population of Louisville is 10,332.
What is the Ratio of Males per 100 Females in Louisville?
There are 102.48 Males per 100 Females in Louisville.
What is the Ratio of Females per 100 Males in Louisville?
There are 97.58 Females per 100 Males in Louisville.
What is the Median Population Age in Louisville?
Median Population Age in Louisville is 41.7 Years.
What is the Average Family Size in Louisville
Average Family Size in Louisville is 3.1 People.
What is the Average Household Size in Louisville
Average Household Size in Louisville is 2.6 People.
How Large is the Labor Force in Louisville?
There are 11,541 People in the Labor Forcein in Louisville.
What is the Percentage of People in the Labor Force in Louisville?
70.1% of People are in the Labor Force in Louisville.
What is the Unemployment Rate in Louisville?
Unemployment Rate in Louisville is 3.2%.