Cities with the Highest Percentage of Swiss Population in Colorado
RELATED REPORTS & OPTIONS
Swiss
Colorado
Compare Cities
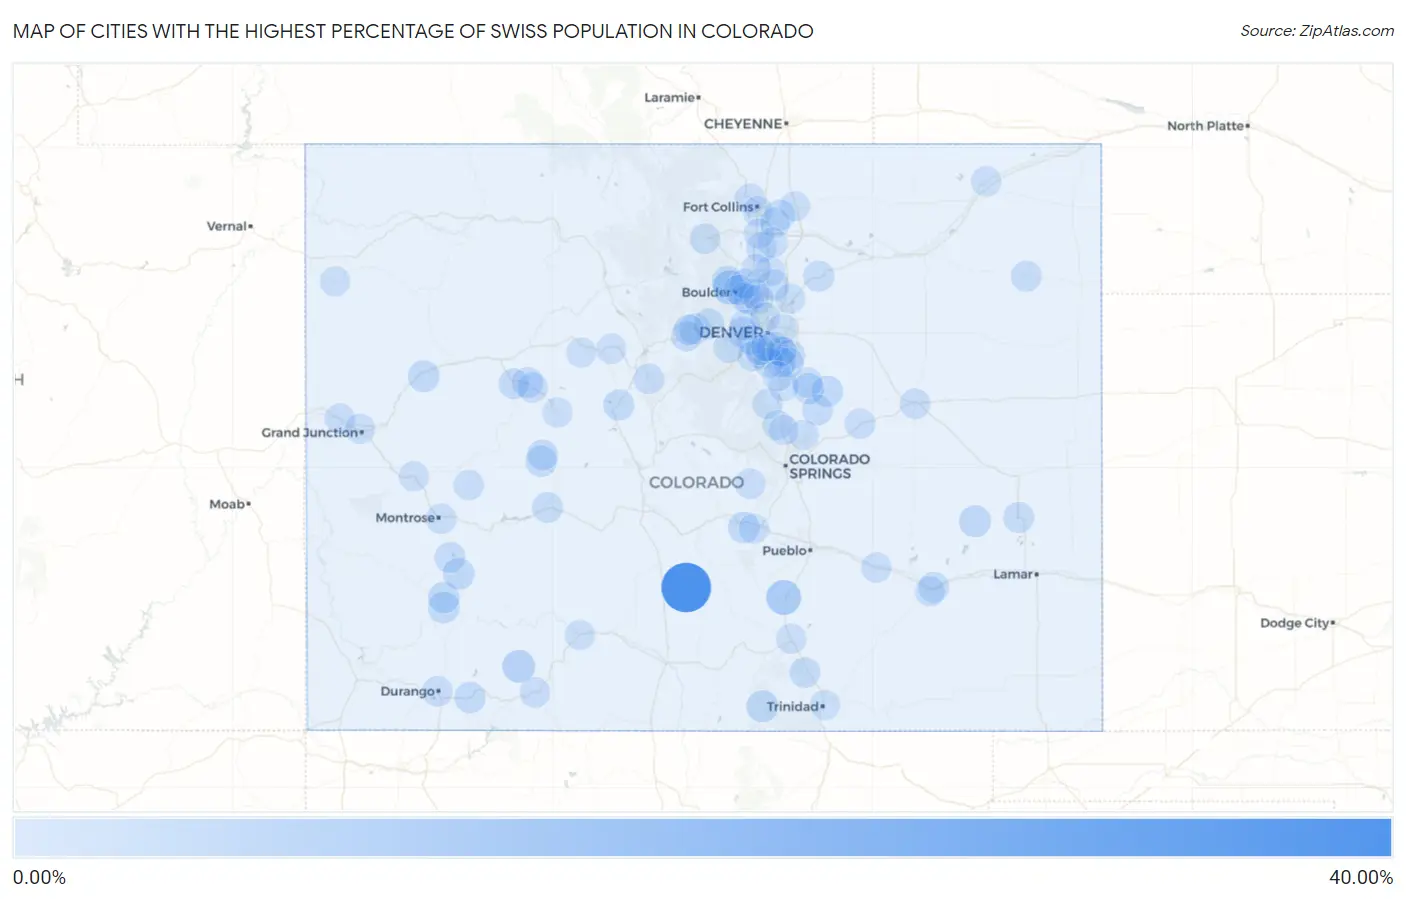
Map of Cities with the Highest Percentage of Swiss Population in Colorado
0.00%
40.00%
Cities with the Highest Percentage of Swiss Population in Colorado
| City | Swiss | vs State | vs National | |
| 1. | Crestone | 36.36% | 0.38%(+36.0)#1 | 0.26%(+36.1)#11 |
| 2. | Colorado City | 8.70% | 0.38%(+8.31)#2 | 0.26%(+8.43)#157 |
| 3. | Pine Brook Hill | 7.29% | 0.38%(+6.91)#3 | 0.26%(+7.03)#191 |
| 4. | Piedra | 5.00% | 0.38%(+4.62)#4 | 0.26%(+4.74)#316 |
| 5. | Pine Valley | 3.42% | 0.38%(+3.04)#5 | 0.26%(+3.16)#512 |
| 6. | Haswell | 3.28% | 0.38%(+2.90)#6 | 0.26%(+3.01)#528 |
| 7. | Stonewall Gap | 3.16% | 0.38%(+2.78)#7 | 0.26%(+2.89)#554 |
| 8. | Battlement Mesa | 3.05% | 0.38%(+2.67)#8 | 0.26%(+2.78)#583 |
| 9. | Cherry Hills Village | 2.92% | 0.38%(+2.54)#9 | 0.26%(+2.65)#612 |
| 10. | Ophir | 2.78% | 0.38%(+2.40)#10 | 0.26%(+2.51)#658 |
| 11. | Brookside | 2.76% | 0.38%(+2.38)#11 | 0.26%(+2.49)#666 |
| 12. | Telluride | 2.75% | 0.38%(+2.37)#12 | 0.26%(+2.48)#670 |
| 13. | Portland | 2.54% | 0.38%(+2.16)#13 | 0.26%(+2.28)#736 |
| 14. | Crested Butte | 2.44% | 0.38%(+2.06)#14 | 0.26%(+2.18)#763 |
| 15. | Kiowa | 2.30% | 0.38%(+1.92)#15 | 0.26%(+2.03)#819 |
| 16. | Bayfield | 2.24% | 0.38%(+1.86)#16 | 0.26%(+1.98)#846 |
| 17. | Downieville Lawson Dumont | 2.15% | 0.38%(+1.77)#17 | 0.26%(+1.89)#887 |
| 18. | Brook Forest | 2.06% | 0.38%(+1.68)#18 | 0.26%(+1.79)#940 |
| 19. | Lazy Acres | 1.97% | 0.38%(+1.59)#19 | 0.26%(+1.71)#978 |
| 20. | Leadville | 1.91% | 0.38%(+1.53)#20 | 0.26%(+1.64)#1,023 |
| 21. | Elizabeth | 1.86% | 0.38%(+1.48)#21 | 0.26%(+1.59)#1,054 |
| 22. | Loghill Village | 1.78% | 0.38%(+1.40)#22 | 0.26%(+1.52)#1,121 |
| 23. | Keenesburg | 1.74% | 0.38%(+1.36)#23 | 0.26%(+1.47)#1,151 |
| 24. | Severance | 1.72% | 0.38%(+1.34)#24 | 0.26%(+1.46)#1,168 |
| 25. | Eads | 1.70% | 0.38%(+1.32)#25 | 0.26%(+1.44)#1,191 |
| 26. | Dacono | 1.69% | 0.38%(+1.31)#26 | 0.26%(+1.43)#1,199 |
| 27. | Gunnison | 1.67% | 0.38%(+1.29)#27 | 0.26%(+1.41)#1,219 |
| 28. | Black Hawk | 1.55% | 0.38%(+1.17)#28 | 0.26%(+1.29)#1,319 |
| 29. | North La Junta | 1.52% | 0.38%(+1.14)#29 | 0.26%(+1.25)#1,354 |
| 30. | El Jebel | 1.50% | 0.38%(+1.12)#30 | 0.26%(+1.24)#1,388 |
| 31. | Elbert | 1.48% | 0.38%(+1.10)#31 | 0.26%(+1.21)#1,423 |
| 32. | Golden | 1.36% | 0.38%(+0.978)#32 | 0.26%(+1.09)#1,568 |
| 33. | Yuma | 1.34% | 0.38%(+0.955)#33 | 0.26%(+1.07)#1,597 |
| 34. | Carbondale | 1.32% | 0.38%(+0.943)#34 | 0.26%(+1.06)#1,617 |
| 35. | Aguilar | 1.32% | 0.38%(+0.935)#35 | 0.26%(+1.05)#1,622 |
| 36. | Mount Crested Butte | 1.27% | 0.38%(+0.885)#36 | 0.26%(+1.00)#1,685 |
| 37. | Basalt | 1.18% | 0.38%(+0.799)#37 | 0.26%(+0.915)#1,820 |
| 38. | Limon | 1.15% | 0.38%(+0.769)#38 | 0.26%(+0.885)#1,872 |
| 39. | Ramah | 1.15% | 0.38%(+0.769)#39 | 0.26%(+0.885)#1,877 |
| 40. | Evergreen | 1.11% | 0.38%(+0.734)#40 | 0.26%(+0.850)#1,940 |
| 41. | Pagosa Springs | 1.10% | 0.38%(+0.715)#41 | 0.26%(+0.831)#1,971 |
| 42. | Crawford | 1.09% | 0.38%(+0.709)#42 | 0.26%(+0.825)#1,987 |
| 43. | Berthoud | 1.08% | 0.38%(+0.703)#43 | 0.26%(+0.819)#2,002 |
| 44. | Blue River | 1.05% | 0.38%(+0.669)#44 | 0.26%(+0.785)#2,070 |
| 45. | Durango | 1.05% | 0.38%(+0.669)#45 | 0.26%(+0.785)#2,071 |
| 46. | Fruita | 1.01% | 0.38%(+0.630)#46 | 0.26%(+0.745)#2,165 |
| 47. | Victor | 0.97% | 0.38%(+0.587)#47 | 0.26%(+0.703)#2,273 |
| 48. | Columbine Valley | 0.93% | 0.38%(+0.553)#48 | 0.26%(+0.669)#2,347 |
| 49. | Paragon Estates | 0.93% | 0.38%(+0.553)#49 | 0.26%(+0.669)#2,348 |
| 50. | Georgetown | 0.91% | 0.38%(+0.525)#50 | 0.26%(+0.641)#2,415 |
| 51. | Empire | 0.89% | 0.38%(+0.514)#51 | 0.26%(+0.630)#2,447 |
| 52. | Fowler | 0.81% | 0.38%(+0.426)#52 | 0.26%(+0.542)#2,713 |
| 53. | Montrose | 0.77% | 0.38%(+0.394)#53 | 0.26%(+0.510)#2,823 |
| 54. | Estes Park | 0.76% | 0.38%(+0.381)#54 | 0.26%(+0.497)#2,878 |
| 55. | Laporte | 0.76% | 0.38%(+0.381)#55 | 0.26%(+0.496)#2,884 |
| 56. | Perry Park | 0.76% | 0.38%(+0.379)#56 | 0.26%(+0.495)#2,896 |
| 57. | Foxfield | 0.74% | 0.38%(+0.362)#57 | 0.26%(+0.478)#2,967 |
| 58. | Louisville | 0.73% | 0.38%(+0.346)#58 | 0.26%(+0.462)#3,019 |
| 59. | Fairmount | 0.71% | 0.38%(+0.331)#59 | 0.26%(+0.447)#3,080 |
| 60. | Ponderosa Park | 0.64% | 0.38%(+0.262)#60 | 0.26%(+0.378)#3,388 |
| 61. | Gunbarrel | 0.62% | 0.38%(+0.243)#61 | 0.26%(+0.358)#3,503 |
| 62. | Centennial | 0.61% | 0.38%(+0.227)#62 | 0.26%(+0.342)#3,586 |
| 63. | Iliff | 0.60% | 0.38%(+0.220)#63 | 0.26%(+0.336)#3,613 |
| 64. | Vail | 0.60% | 0.38%(+0.219)#64 | 0.26%(+0.335)#3,622 |
| 65. | Castle Rock | 0.59% | 0.38%(+0.213)#65 | 0.26%(+0.329)#3,653 |
| 66. | Rangely | 0.59% | 0.38%(+0.207)#66 | 0.26%(+0.323)#3,697 |
| 67. | Walsenburg | 0.59% | 0.38%(+0.205)#67 | 0.26%(+0.321)#3,705 |
| 68. | Stonegate | 0.58% | 0.38%(+0.203)#68 | 0.26%(+0.319)#3,720 |
| 69. | La Junta | 0.58% | 0.38%(+0.199)#69 | 0.26%(+0.315)#3,741 |
| 70. | Lone Tree | 0.58% | 0.38%(+0.198)#70 | 0.26%(+0.314)#3,743 |
| 71. | Lafayette | 0.58% | 0.38%(+0.197)#71 | 0.26%(+0.313)#3,749 |
| 72. | Fort Collins | 0.57% | 0.38%(+0.188)#72 | 0.26%(+0.304)#3,785 |
| 73. | Boulder | 0.57% | 0.38%(+0.186)#73 | 0.26%(+0.302)#3,802 |
| 74. | Broomfield | 0.54% | 0.38%(+0.156)#74 | 0.26%(+0.272)#3,986 |
| 75. | Highlands Ranch | 0.53% | 0.38%(+0.151)#75 | 0.26%(+0.267)#4,011 |
| 76. | Delta | 0.53% | 0.38%(+0.145)#76 | 0.26%(+0.261)#4,054 |
| 77. | Aspen | 0.52% | 0.38%(+0.137)#77 | 0.26%(+0.253)#4,103 |
| 78. | Grand Junction | 0.51% | 0.38%(+0.129)#78 | 0.26%(+0.245)#4,160 |
| 79. | Firestone | 0.50% | 0.38%(+0.122)#79 | 0.26%(+0.238)#4,203 |
| 80. | Lakewood | 0.47% | 0.38%(+0.088)#80 | 0.26%(+0.204)#4,419 |
| 81. | Denver | 0.45% | 0.38%(+0.074)#81 | 0.26%(+0.189)#4,535 |
| 82. | Longmont | 0.45% | 0.38%(+0.072)#82 | 0.26%(+0.188)#4,550 |
| 83. | Ken Caryl | 0.45% | 0.38%(+0.067)#83 | 0.26%(+0.183)#4,582 |
| 84. | Florence | 0.44% | 0.38%(+0.058)#84 | 0.26%(+0.174)#4,638 |
| 85. | Brighton | 0.44% | 0.38%(+0.058)#85 | 0.26%(+0.174)#4,641 |
| 86. | South Fork | 0.44% | 0.38%(+0.056)#86 | 0.26%(+0.172)#4,659 |
| 87. | Black Forest | 0.44% | 0.38%(+0.056)#87 | 0.26%(+0.172)#4,663 |
| 88. | Loveland | 0.42% | 0.38%(+0.043)#88 | 0.26%(+0.159)#4,771 |
| 89. | Palmer Lake | 0.42% | 0.38%(+0.036)#89 | 0.26%(+0.152)#4,829 |
| 90. | Cherry Creek | 0.41% | 0.38%(+0.032)#90 | 0.26%(+0.147)#4,854 |
| 91. | Trinidad | 0.41% | 0.38%(+0.027)#91 | 0.26%(+0.143)#4,893 |
| 92. | Sherrelwood | 0.41% | 0.38%(+0.024)#92 | 0.26%(+0.140)#4,917 |
| 93. | Windsor | 0.40% | 0.38%(+0.023)#93 | 0.26%(+0.139)#4,929 |
| 94. | Bow Mar | 0.40% | 0.38%(+0.021)#94 | 0.26%(+0.137)#4,949 |
| 95. | Englewood | 0.40% | 0.38%(+0.021)#95 | 0.26%(+0.137)#4,952 |
| 96. | Monument | 0.40% | 0.38%(+0.018)#96 | 0.26%(+0.133)#4,979 |
| 97. | Castle Pines Village | 0.38% | 0.38%(+0.000)#97 | 0.26%(+0.116)#5,164 |
| 98. | Ault | 0.37% | 0.38%(-0.006)#98 | 0.26%(+0.110)#5,203 |
| 99. | Edwards | 0.36% | 0.38%(-0.017)#99 | 0.26%(+0.099)#5,296 |
| 100. | Johnstown | 0.36% | 0.38%(-0.023)#100 | 0.26%(+0.093)#5,349 |
Common Questions
What are the Top 10 Cities with the Highest Percentage of Swiss Population in Colorado?
Top 10 Cities with the Highest Percentage of Swiss Population in Colorado are:
#1
36.36%
#2
8.70%
#3
7.29%
#4
5.00%
#5
3.28%
#6
3.16%
#7
3.05%
#8
2.92%
#9
2.78%
#10
2.76%
What city has the Highest Percentage of Swiss Population in Colorado?
Crestone has the Highest Percentage of Swiss Population in Colorado with 36.36%.
What is the Percentage of Swiss Population in the State of Colorado?
Percentage of Swiss Population in Colorado is 0.38%.
What is the Percentage of Swiss Population in the United States?
Percentage of Swiss Population in the United States is 0.26%.