Pine Brook Hill, CO Map & Demographics
Pine Brook Hill Map
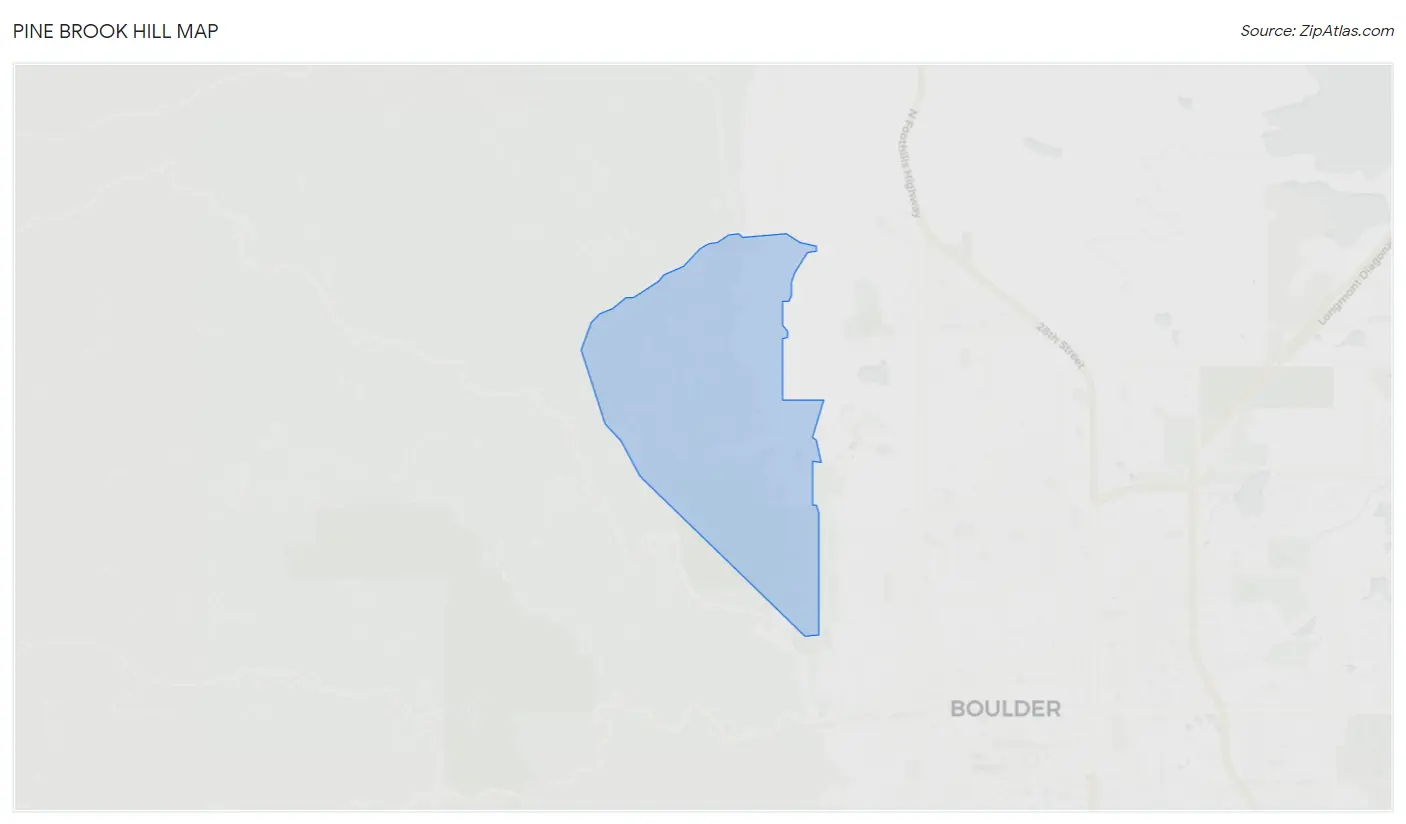
Pine Brook Hill Overview
$115,599
PER CAPITA INCOME
0.48
INEQUALITY / GINI INDEX
521
TOTAL POPULATION
282
MALE POPULATION
239
FEMALE POPULATION
117.99
MALES / 100 FEMALES
84.75
FEMALES / 100 MALES
57.6
MEDIAN AGE
2.4
AVG FAMILY SIZE
1.9
AVG HOUSEHOLD SIZE
277
LABOR FORCE [ PEOPLE ]
56.3%
PERCENT IN LABOR FORCE
Income in Pine Brook Hill
Income Overview in Pine Brook Hill
| Characteristic | Number | Measure |
| Per Capita Income | 521 | $115,599 |
| Median Family Income | 161 | $0 |
| Mean Family Income | 161 | $256,312 |
| Median Household Income | 273 | $0 |
| Mean Household Income | 273 | $217,926 |
| Income Deficit | 161 | $0 |
| Wage / Income Gap (%) | 521 | 0.00% |
| Wage / Income Gap ($) | 521 | 100.00¢ per $1 |
| Gini / Inequality Index | 521 | 0.48 |
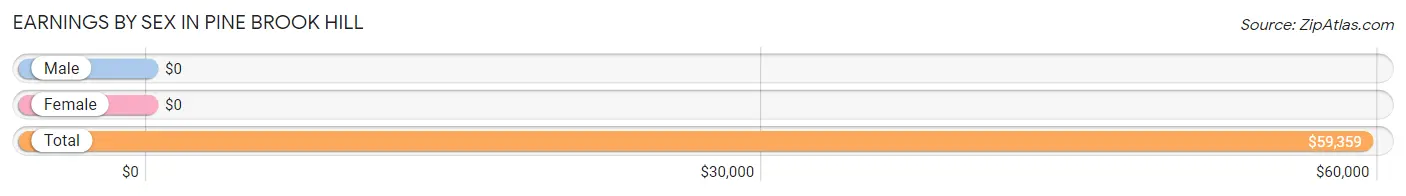
Earnings by Sex in Pine Brook Hill
| Sex | Number | Average Earnings |
| Male | 184 (53.8%) | $0 |
| Female | 158 (46.2%) | $0 |
| Total | 342 (100.0%) | $59,359 |
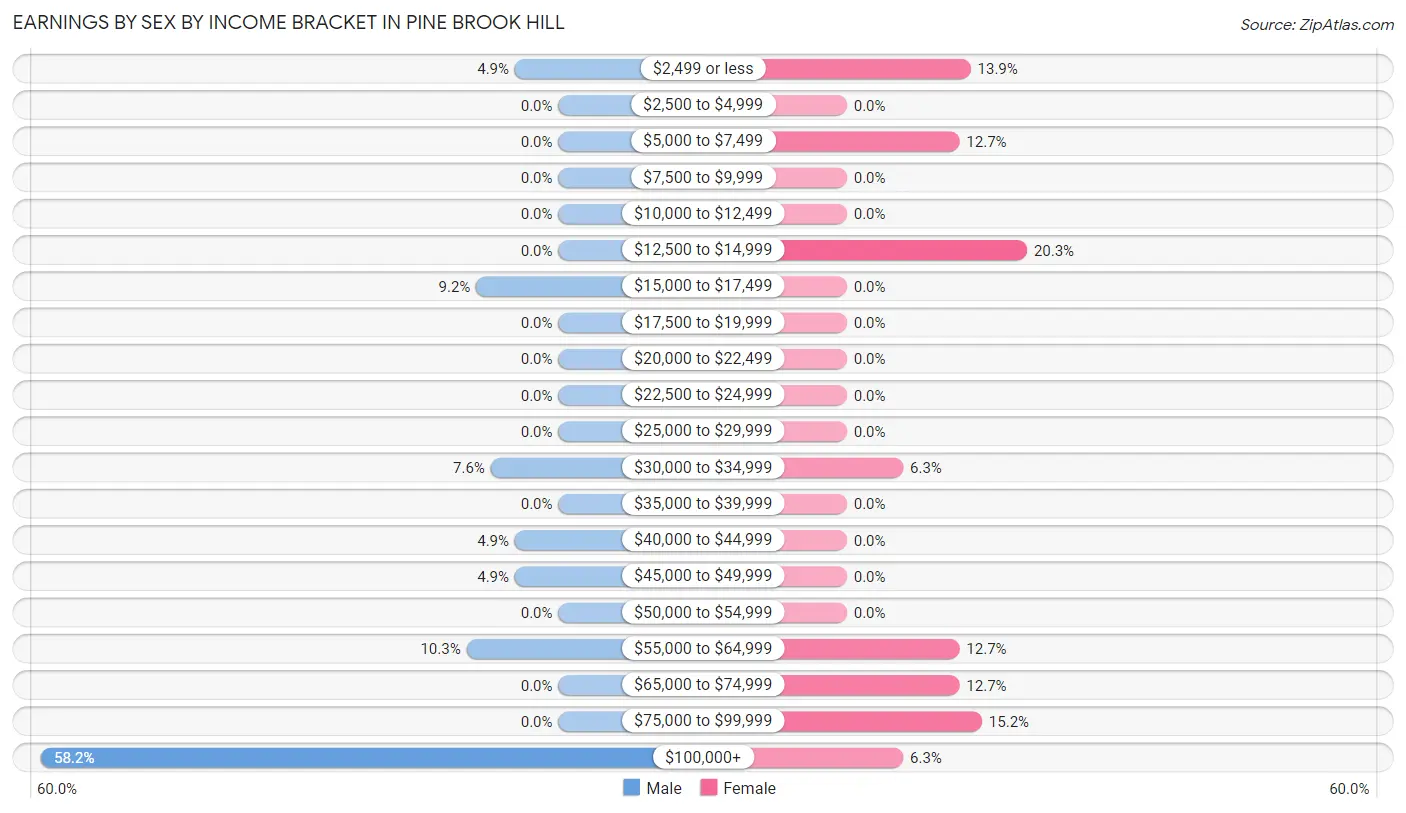
Earnings by Sex by Income Bracket in Pine Brook Hill
The most common earnings brackets in Pine Brook Hill are $100,000+ for men (107 | 58.2%) and $12,500 to $14,999 for women (32 | 20.3%).
| Income | Male | Female |
| $2,499 or less | 9 (4.9%) | 22 (13.9%) |
| $2,500 to $4,999 | 0 (0.0%) | 0 (0.0%) |
| $5,000 to $7,499 | 0 (0.0%) | 20 (12.7%) |
| $7,500 to $9,999 | 0 (0.0%) | 0 (0.0%) |
| $10,000 to $12,499 | 0 (0.0%) | 0 (0.0%) |
| $12,500 to $14,999 | 0 (0.0%) | 32 (20.3%) |
| $15,000 to $17,499 | 17 (9.2%) | 0 (0.0%) |
| $17,500 to $19,999 | 0 (0.0%) | 0 (0.0%) |
| $20,000 to $22,499 | 0 (0.0%) | 0 (0.0%) |
| $22,500 to $24,999 | 0 (0.0%) | 0 (0.0%) |
| $25,000 to $29,999 | 0 (0.0%) | 0 (0.0%) |
| $30,000 to $34,999 | 14 (7.6%) | 10 (6.3%) |
| $35,000 to $39,999 | 0 (0.0%) | 0 (0.0%) |
| $40,000 to $44,999 | 9 (4.9%) | 0 (0.0%) |
| $45,000 to $49,999 | 9 (4.9%) | 0 (0.0%) |
| $50,000 to $54,999 | 0 (0.0%) | 0 (0.0%) |
| $55,000 to $64,999 | 19 (10.3%) | 20 (12.7%) |
| $65,000 to $74,999 | 0 (0.0%) | 20 (12.7%) |
| $75,000 to $99,999 | 0 (0.0%) | 24 (15.2%) |
| $100,000+ | 107 (58.2%) | 10 (6.3%) |
| Total | 184 (100.0%) | 158 (100.0%) |
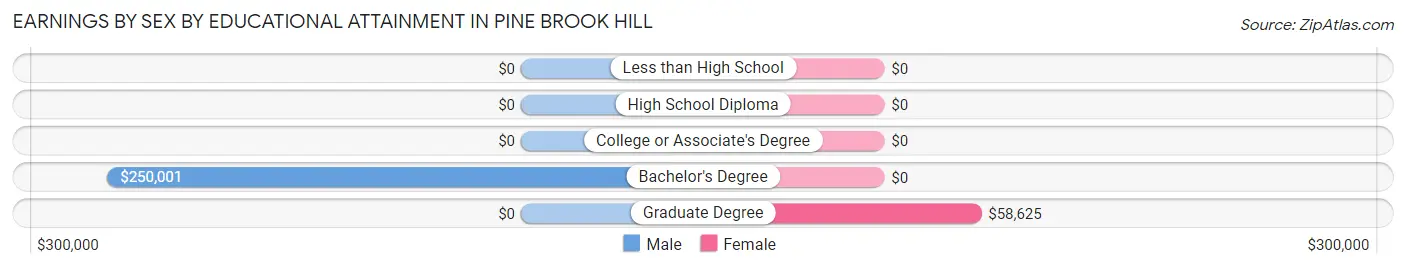
Earnings by Sex by Educational Attainment in Pine Brook Hill
| Educational Attainment | Male Income | Female Income |
| Less than High School | - | - |
| High School Diploma | - | - |
| College or Associate's Degree | - | - |
| Bachelor's Degree | $250,001 | $0 |
| Graduate Degree | - | - |
| Total | - | - |
Family Income in Pine Brook Hill
Family Income Brackets in Pine Brook Hill
According to the Pine Brook Hill family income data, there are 61 families falling into the $200,000+ income range, which is the most common income bracket and makes up 37.9% of all families.
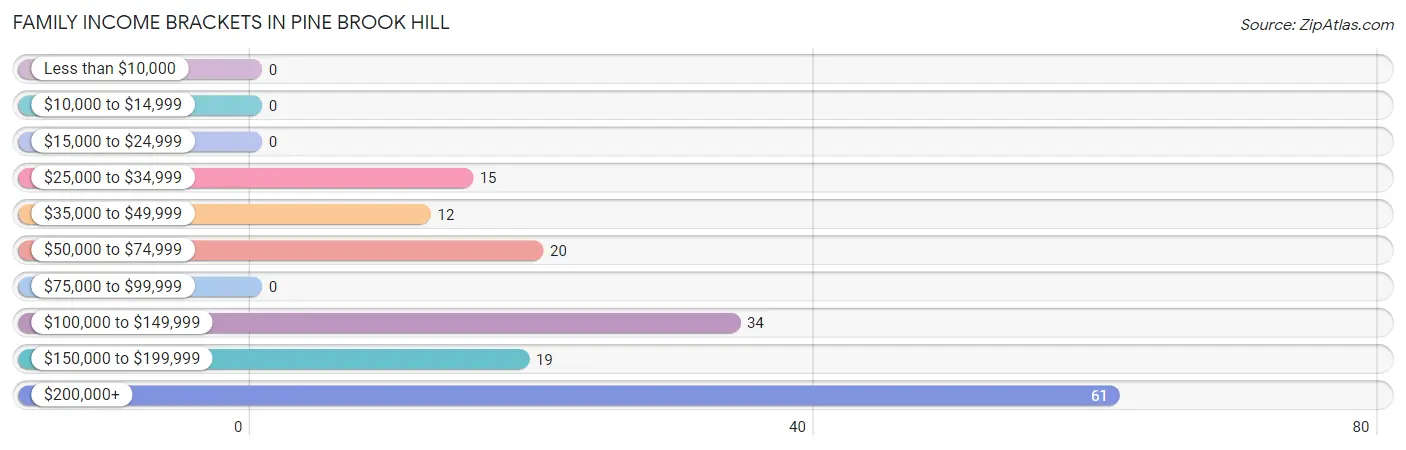
| Income Bracket | # Families | % Families |
| Less than $10,000 | 0 | 0.0% |
| $10,000 to $14,999 | 0 | 0.0% |
| $15,000 to $24,999 | 0 | 0.0% |
| $25,000 to $34,999 | 15 | 9.3% |
| $35,000 to $49,999 | 12 | 7.5% |
| $50,000 to $74,999 | 20 | 12.4% |
| $75,000 to $99,999 | 0 | 0.0% |
| $100,000 to $149,999 | 34 | 21.1% |
| $150,000 to $199,999 | 19 | 11.8% |
| $200,000+ | 61 | 37.9% |
Family Income by Famaliy Size in Pine Brook Hill
3-person families (40 | 24.8%) account for the highest median family income in Pine Brook Hill with $250,001 per family, while 3-person families (40 | 24.8%) have the highest median income of $83,334 per family member.
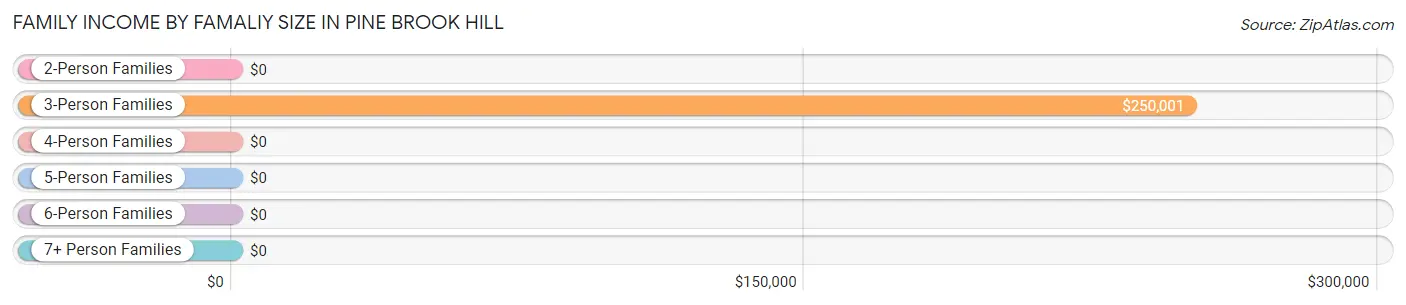
| Income Bracket | # Families | Median Income |
| 2-Person Families | 121 (75.2%) | $0 |
| 3-Person Families | 40 (24.8%) | $250,001 |
| 4-Person Families | 0 (0.0%) | $0 |
| 5-Person Families | 0 (0.0%) | $0 |
| 6-Person Families | 0 (0.0%) | $0 |
| 7+ Person Families | 0 (0.0%) | $0 |
| Total | 161 (100.0%) | $0 |
Family Income by Number of Earners in Pine Brook Hill
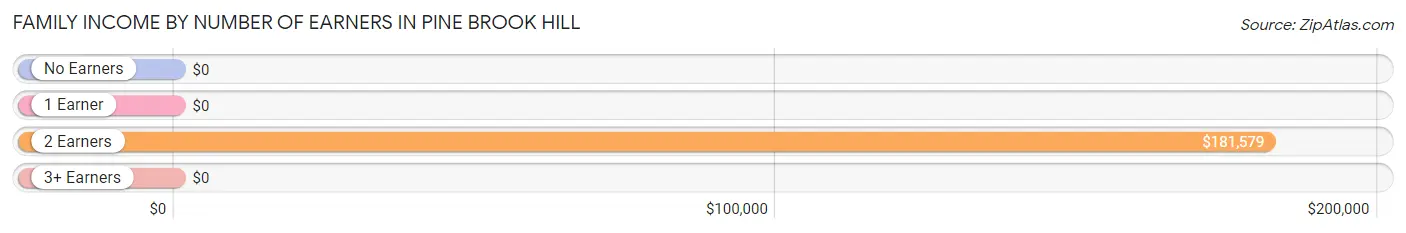
| Number of Earners | # Families | Median Income |
| No Earners | 31 (19.3%) | $0 |
| 1 Earner | 26 (16.2%) | $0 |
| 2 Earners | 104 (64.6%) | $181,579 |
| 3+ Earners | 0 (0.0%) | $0 |
| Total | 161 (100.0%) | $0 |
Household Income in Pine Brook Hill
Household Income Brackets in Pine Brook Hill
With 113 households falling in the category, the $200,000+ income range is the most frequent in Pine Brook Hill, accounting for 41.4% of all households.
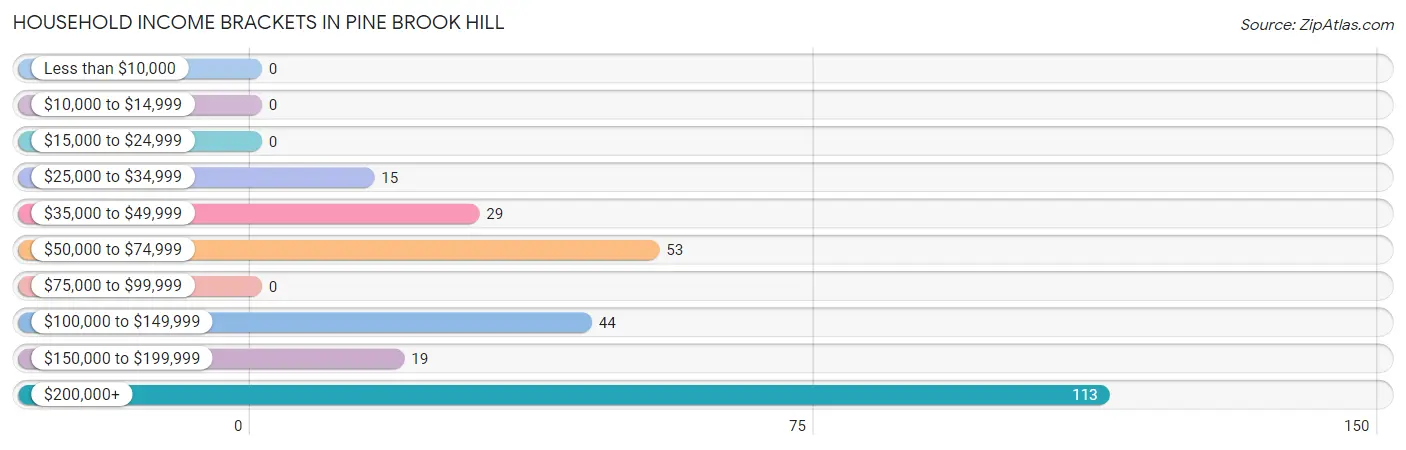
| Income Bracket | # Households | % Households |
| Less than $10,000 | 0 | 0.0% |
| $10,000 to $14,999 | 0 | 0.0% |
| $15,000 to $24,999 | 0 | 0.0% |
| $25,000 to $34,999 | 15 | 5.5% |
| $35,000 to $49,999 | 29 | 10.6% |
| $50,000 to $74,999 | 53 | 19.4% |
| $75,000 to $99,999 | 0 | 0.0% |
| $100,000 to $149,999 | 44 | 16.1% |
| $150,000 to $199,999 | 19 | 7.0% |
| $200,000+ | 113 | 41.4% |
Household Income by Householder Age in Pine Brook Hill
The median household income in Pine Brook Hill is $0, with the highest median household income of $250,001 found in the 45 to 64 years age bracket for the primary householder. A total of 139 households (50.9%) fall into this category.
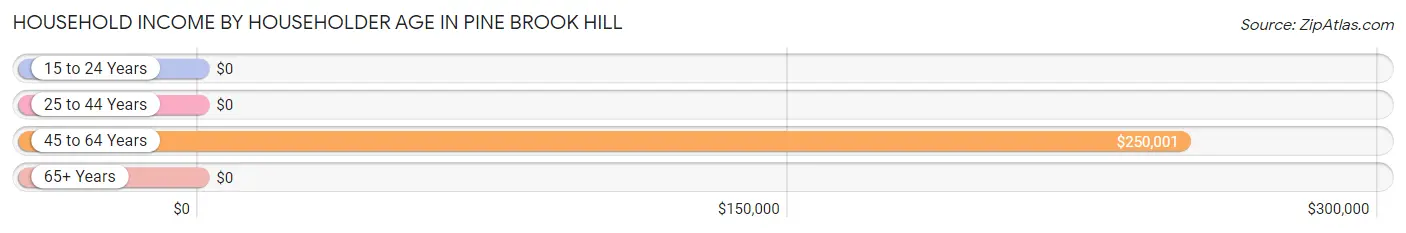
| Income Bracket | # Households | Median Income |
| 15 to 24 Years | 0 (0.0%) | $0 |
| 25 to 44 Years | 20 (7.3%) | $0 |
| 45 to 64 Years | 139 (50.9%) | $250,001 |
| 65+ Years | 114 (41.8%) | $0 |
| Total | 273 (100.0%) | $0 |
Poverty in Pine Brook Hill
Income Below Poverty by Sex and Age in Pine Brook Hill
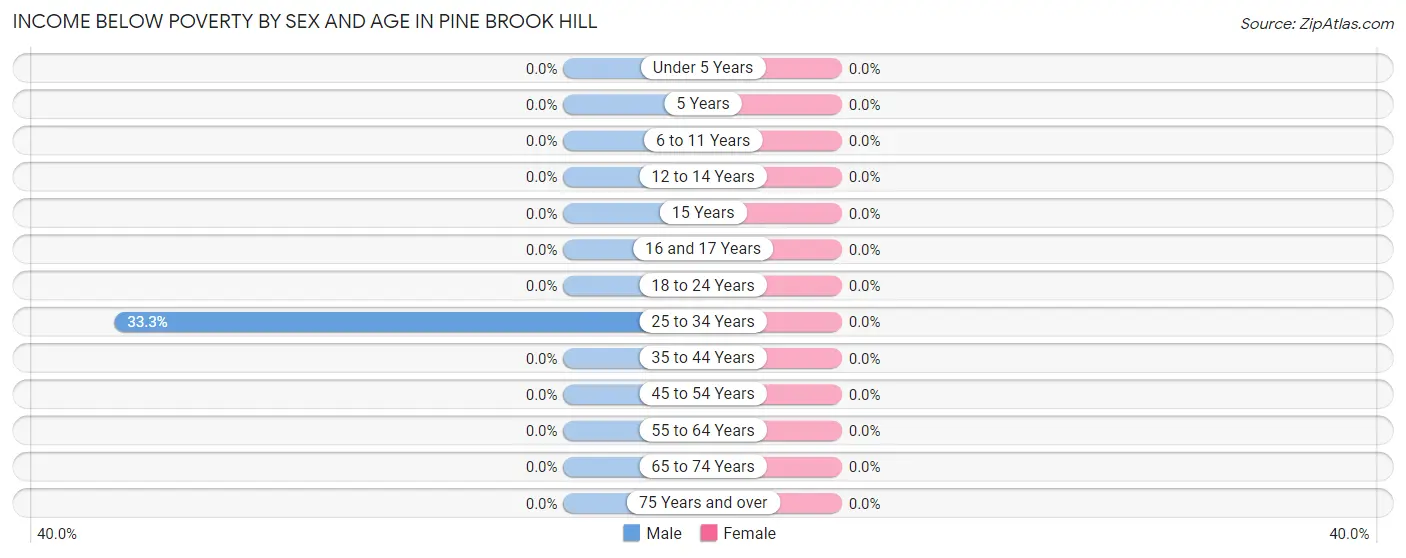
| Age Bracket | Male | Female |
| Under 5 Years | 0 (0.0%) | 0 (0.0%) |
| 5 Years | 0 (0.0%) | 0 (0.0%) |
| 6 to 11 Years | 0 (0.0%) | 0 (0.0%) |
| 12 to 14 Years | 0 (0.0%) | 0 (0.0%) |
| 15 Years | 0 (0.0%) | 0 (0.0%) |
| 16 and 17 Years | 0 (0.0%) | 0 (0.0%) |
| 18 to 24 Years | 0 (0.0%) | 0 (0.0%) |
| 25 to 34 Years | 9 (33.3%) | 0 (0.0%) |
| 35 to 44 Years | 0 (0.0%) | 0 (0.0%) |
| 45 to 54 Years | 0 (0.0%) | 0 (0.0%) |
| 55 to 64 Years | 0 (0.0%) | 0 (0.0%) |
| 65 to 74 Years | 0 (0.0%) | 0 (0.0%) |
| 75 Years and over | 0 (0.0%) | 0 (0.0%) |
| Total | 9 (3.2%) | 0 (0.0%) |
Income Above Poverty by Sex and Age in Pine Brook Hill
According to the poverty statistics in Pine Brook Hill, males aged 6 to 11 years and females aged 12 to 14 years are the age groups that are most secure financially, with 100.0% of males and 100.0% of females in these age groups living above the poverty line.
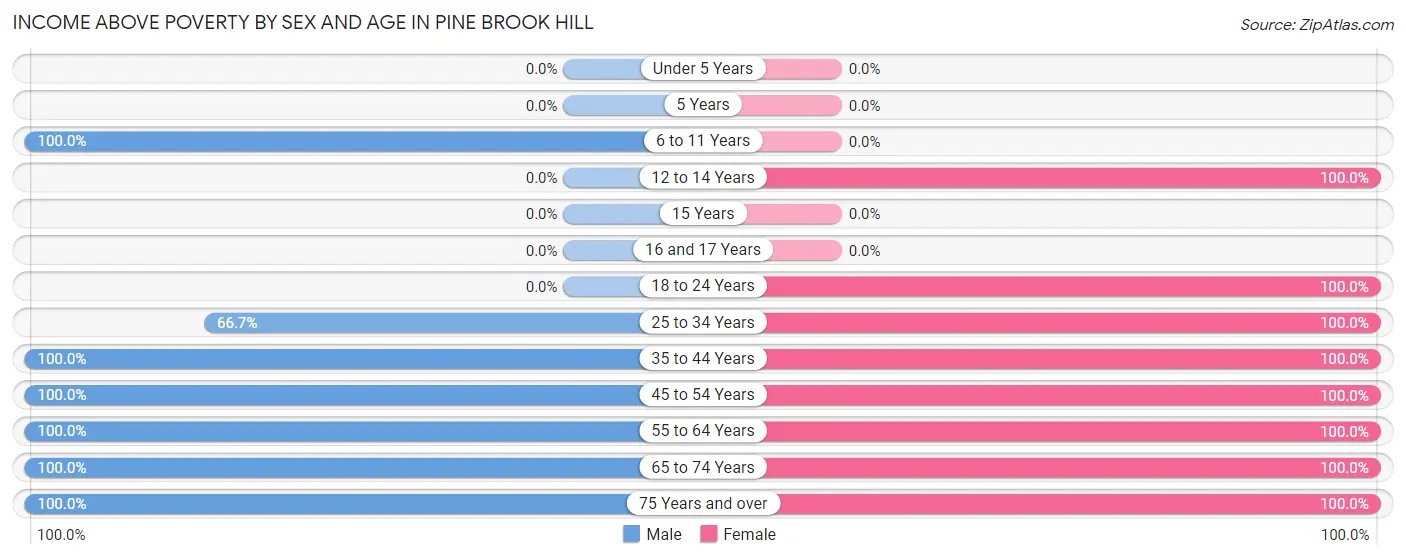
| Age Bracket | Male | Female |
| Under 5 Years | 0 (0.0%) | 0 (0.0%) |
| 5 Years | 0 (0.0%) | 0 (0.0%) |
| 6 to 11 Years | 19 (100.0%) | 0 (0.0%) |
| 12 to 14 Years | 0 (0.0%) | 10 (100.0%) |
| 15 Years | 0 (0.0%) | 0 (0.0%) |
| 16 and 17 Years | 0 (0.0%) | 0 (0.0%) |
| 18 to 24 Years | 0 (0.0%) | 22 (100.0%) |
| 25 to 34 Years | 18 (66.7%) | 10 (100.0%) |
| 35 to 44 Years | 17 (100.0%) | 30 (100.0%) |
| 45 to 54 Years | 66 (100.0%) | 11 (100.0%) |
| 55 to 64 Years | 73 (100.0%) | 91 (100.0%) |
| 65 to 74 Years | 32 (100.0%) | 51 (100.0%) |
| 75 Years and over | 48 (100.0%) | 14 (100.0%) |
| Total | 273 (96.8%) | 239 (100.0%) |
Income Below Poverty Among Married-Couple Families in Pine Brook Hill
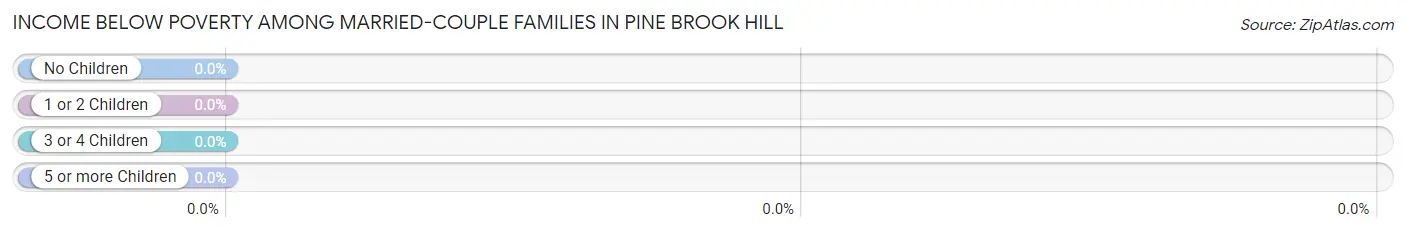
| Children | Above Poverty | Below Poverty |
| No Children | 132 (100.0%) | 0 (0.0%) |
| 1 or 2 Children | 29 (100.0%) | 0 (0.0%) |
| 3 or 4 Children | 0 (0.0%) | 0 (0.0%) |
| 5 or more Children | 0 (0.0%) | 0 (0.0%) |
| Total | 161 (100.0%) | 0 (0.0%) |
Income Below Poverty Among Single-Parent Households in Pine Brook Hill
| Children | Single Father | Single Mother |
| No Children | 0 (0.0%) | 0 (0.0%) |
| 1 or 2 Children | 0 (0.0%) | 0 (0.0%) |
| 3 or 4 Children | 0 (0.0%) | 0 (0.0%) |
| 5 or more Children | 0 (0.0%) | 0 (0.0%) |
| Total | 0 (0.0%) | 0 (0.0%) |
Income Below Poverty Among Married-Couple vs Single-Parent Households in Pine Brook Hill
| Children | Married-Couple Families | Single-Parent Households |
| No Children | 0 (0.0%) | 0 (0.0%) |
| 1 or 2 Children | 0 (0.0%) | 0 (0.0%) |
| 3 or 4 Children | 0 (0.0%) | 0 (0.0%) |
| 5 or more Children | 0 (0.0%) | 0 (0.0%) |
| Total | 0 (0.0%) | 0 (0.0%) |
Race in Pine Brook Hill
The most populous races in Pine Brook Hill are White / Caucasian (419 | 80.4%), Hispanic or Latino (63 | 12.1%), and Two or more Races (63 | 12.1%).
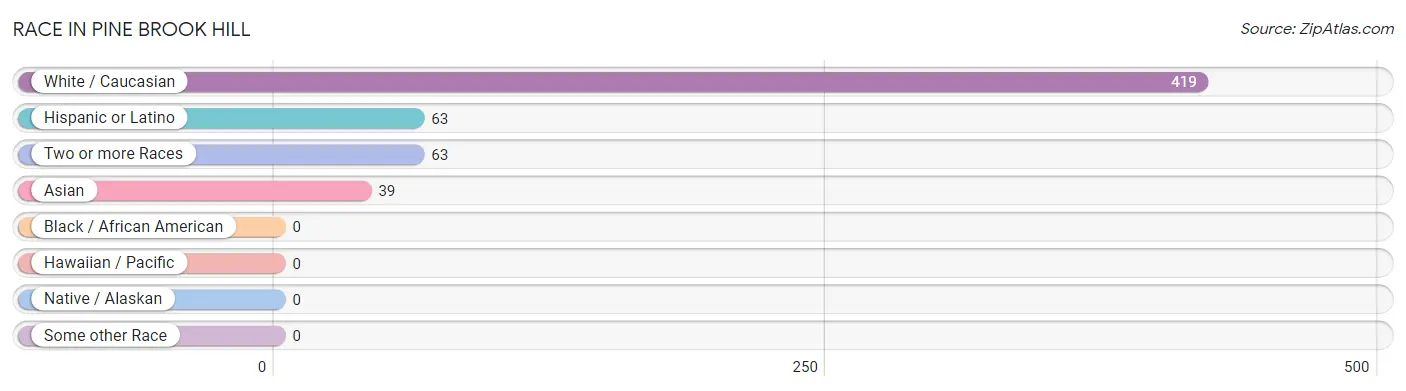
| Race | # Population | % Population |
| Asian | 39 | 7.5% |
| Black / African American | 0 | 0.0% |
| Hawaiian / Pacific | 0 | 0.0% |
| Hispanic or Latino | 63 | 12.1% |
| Native / Alaskan | 0 | 0.0% |
| White / Caucasian | 419 | 80.4% |
| Two or more Races | 63 | 12.1% |
| Some other Race | 0 | 0.0% |
| Total | 521 | 100.0% |
Ancestry in Pine Brook Hill
The most populous ancestries reported in Pine Brook Hill are German (144 | 27.6%), Irish (61 | 11.7%), Polish (51 | 9.8%), English (49 | 9.4%), and Bhutanese (39 | 7.5%), together accounting for 66.0% of all Pine Brook Hill residents.
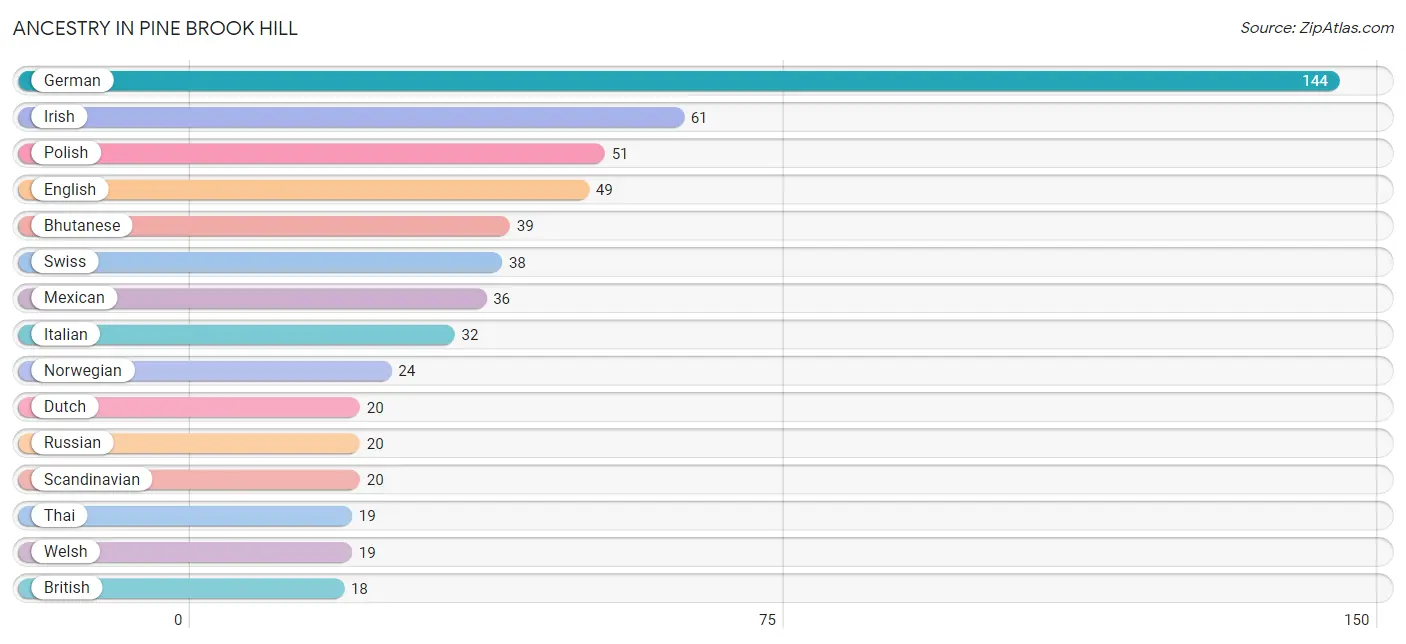
| Ancestry | # Population | % Population |
| Austrian | 16 | 3.1% |
| Bhutanese | 39 | 7.5% |
| British | 18 | 3.5% |
| Dutch | 20 | 3.8% |
| English | 49 | 9.4% |
| French | 9 | 1.7% |
| German | 144 | 27.6% |
| Irish | 61 | 11.7% |
| Italian | 32 | 6.1% |
| Mexican | 36 | 6.9% |
| Norwegian | 24 | 4.6% |
| Polish | 51 | 9.8% |
| Russian | 20 | 3.8% |
| Scandinavian | 20 | 3.8% |
| Swiss | 38 | 7.3% |
| Thai | 19 | 3.6% |
| Welsh | 19 | 3.6% | View All 17 Rows |
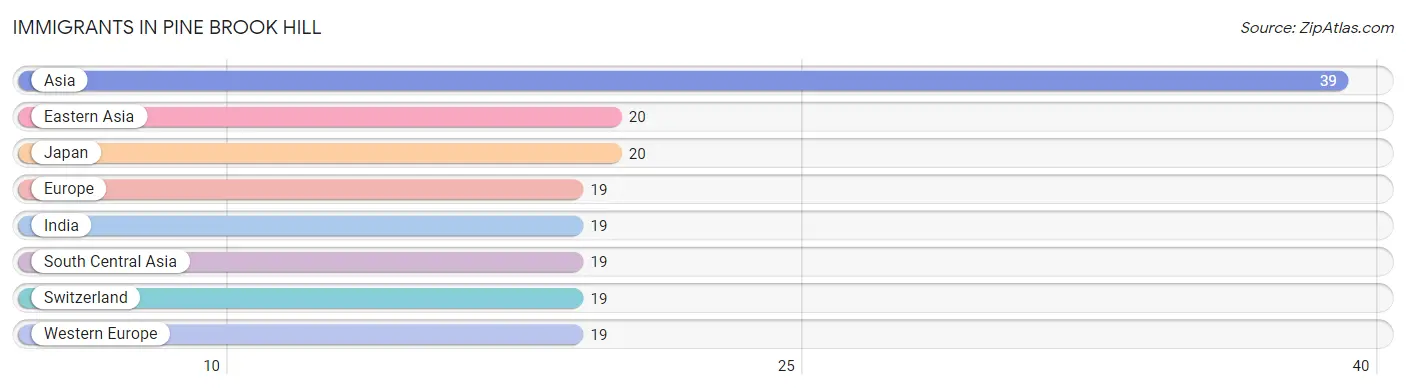
Immigrants in Pine Brook Hill
The most numerous immigrant groups reported in Pine Brook Hill came from Asia (39 | 7.5%), Eastern Asia (20 | 3.8%), Japan (20 | 3.8%), Europe (19 | 3.6%), and India (19 | 3.6%), together accounting for 22.5% of all Pine Brook Hill residents.
| Immigration Origin | # Population | % Population |
| Asia | 39 | 7.5% |
| Eastern Asia | 20 | 3.8% |
| Europe | 19 | 3.6% |
| India | 19 | 3.6% |
| Japan | 20 | 3.8% |
| South Central Asia | 19 | 3.6% |
| Switzerland | 19 | 3.6% |
| Western Europe | 19 | 3.6% | View All 8 Rows |
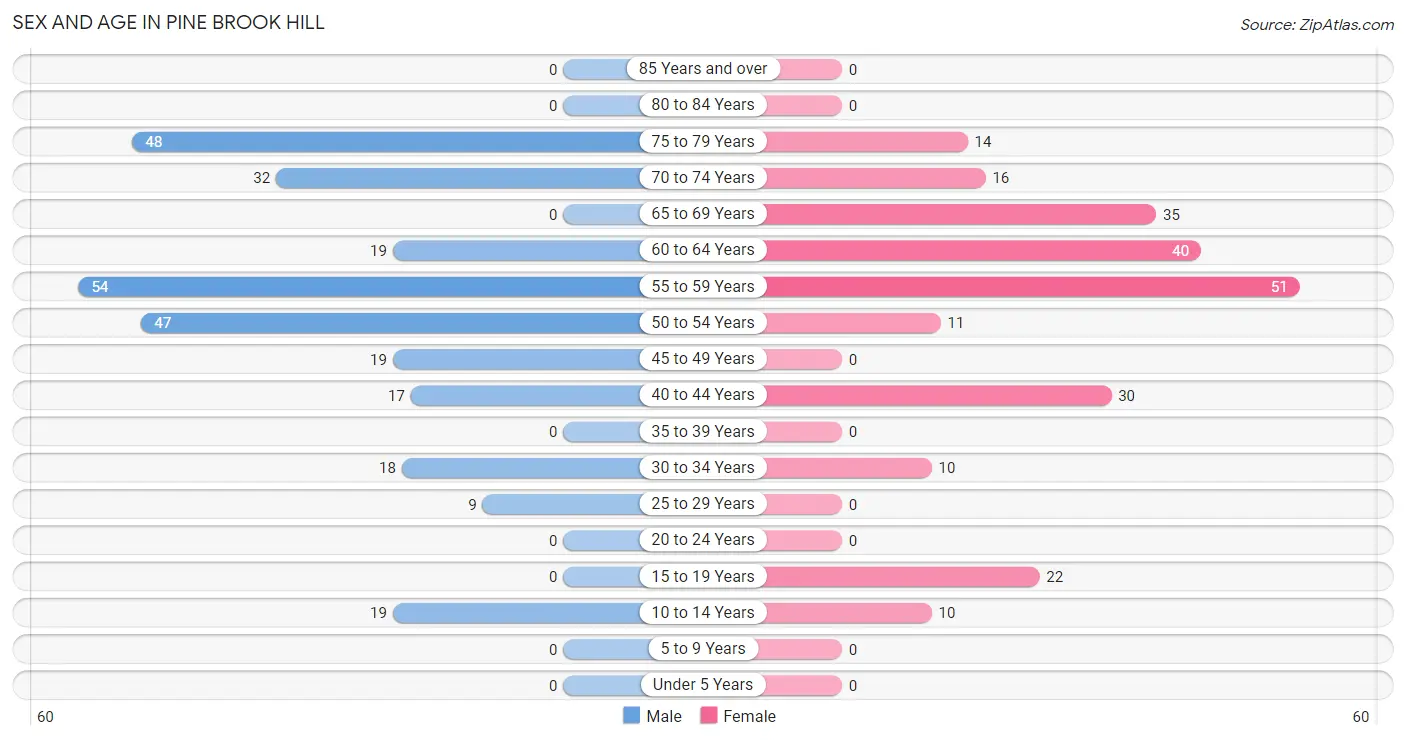
Sex and Age in Pine Brook Hill
Sex and Age in Pine Brook Hill
The most populous age groups in Pine Brook Hill are 55 to 59 Years (54 | 19.2%) for men and 55 to 59 Years (51 | 21.3%) for women.
| Age Bracket | Male | Female |
| Under 5 Years | 0 (0.0%) | 0 (0.0%) |
| 5 to 9 Years | 0 (0.0%) | 0 (0.0%) |
| 10 to 14 Years | 19 (6.7%) | 10 (4.2%) |
| 15 to 19 Years | 0 (0.0%) | 22 (9.2%) |
| 20 to 24 Years | 0 (0.0%) | 0 (0.0%) |
| 25 to 29 Years | 9 (3.2%) | 0 (0.0%) |
| 30 to 34 Years | 18 (6.4%) | 10 (4.2%) |
| 35 to 39 Years | 0 (0.0%) | 0 (0.0%) |
| 40 to 44 Years | 17 (6.0%) | 30 (12.6%) |
| 45 to 49 Years | 19 (6.7%) | 0 (0.0%) |
| 50 to 54 Years | 47 (16.7%) | 11 (4.6%) |
| 55 to 59 Years | 54 (19.2%) | 51 (21.3%) |
| 60 to 64 Years | 19 (6.7%) | 40 (16.7%) |
| 65 to 69 Years | 0 (0.0%) | 35 (14.6%) |
| 70 to 74 Years | 32 (11.4%) | 16 (6.7%) |
| 75 to 79 Years | 48 (17.0%) | 14 (5.9%) |
| 80 to 84 Years | 0 (0.0%) | 0 (0.0%) |
| 85 Years and over | 0 (0.0%) | 0 (0.0%) |
| Total | 282 (100.0%) | 239 (100.0%) |
Families and Households in Pine Brook Hill
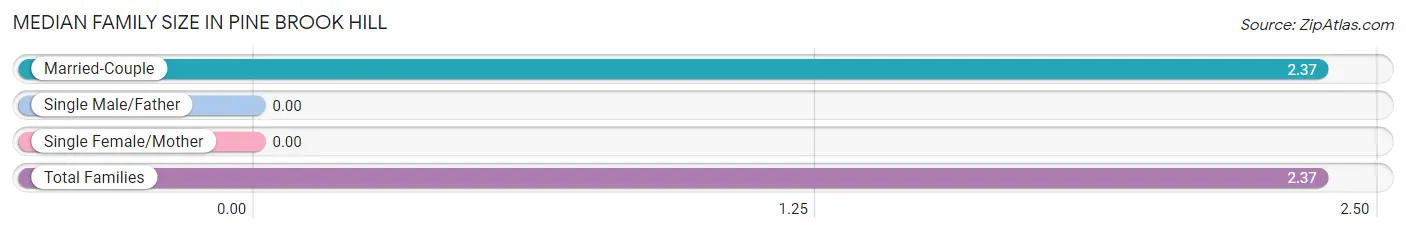
Median Family Size in Pine Brook Hill
| Family Type | # Families | Family Size |
| Married-Couple | 161 (100.0%) | 2.37 |
| Single Male/Father | 0 (0.0%) | - |
| Single Female/Mother | 0 (0.0%) | - |
| Total Families | 161 (100.0%) | 2.37 |
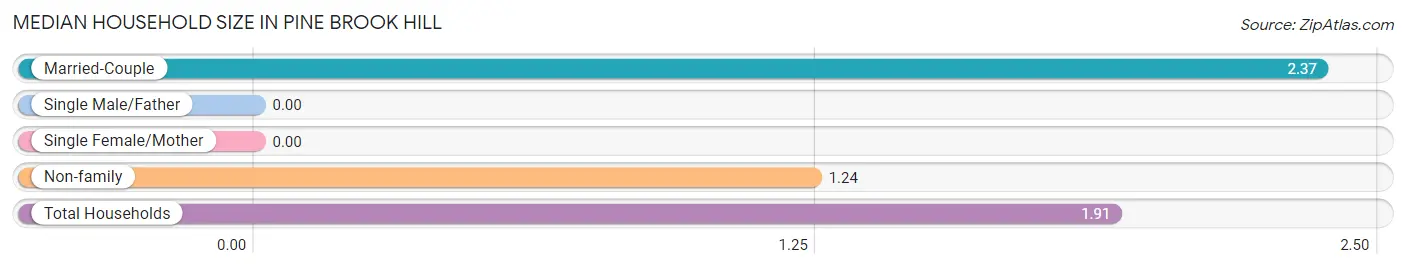
Median Household Size in Pine Brook Hill
| Household Type | # Households | Household Size |
| Married-Couple | 161 (59.0%) | 2.37 |
| Single Male/Father | 0 (0.0%) | - |
| Single Female/Mother | 0 (0.0%) | - |
| Non-family | 112 (41.0%) | 1.24 |
| Total Households | 273 (100.0%) | 1.91 |
Household Size by Marriage Status in Pine Brook Hill
Out of a total of 273 households in Pine Brook Hill, 161 (59.0%) are family households, while 112 (41.0%) are nonfamily households. The most numerous type of family households are 2-person households, comprising 121, and the most common type of nonfamily households are 1-person households, comprising 102.
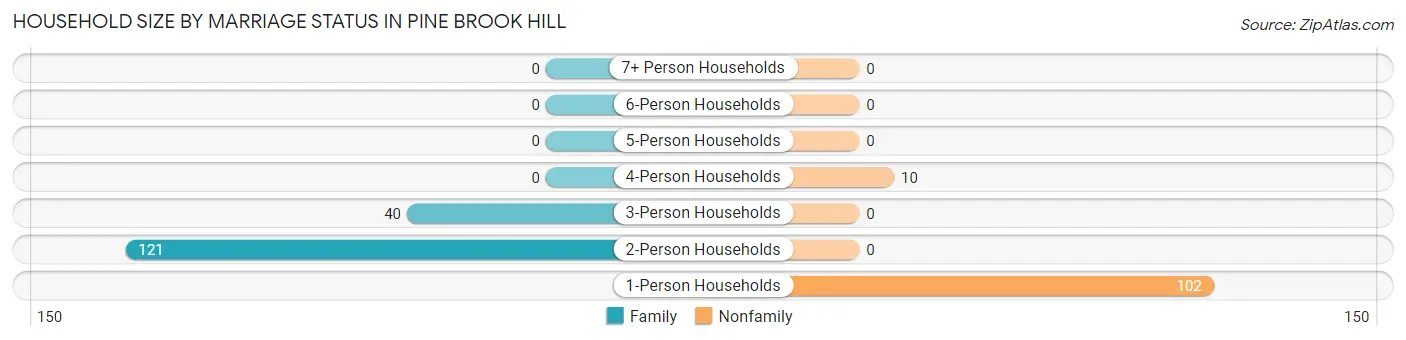
| Household Size | Family Households | Nonfamily Households |
| 1-Person Households | - | 102 (37.4%) |
| 2-Person Households | 121 (44.3%) | 0 (0.0%) |
| 3-Person Households | 40 (14.6%) | 0 (0.0%) |
| 4-Person Households | 0 (0.0%) | 10 (3.7%) |
| 5-Person Households | 0 (0.0%) | 0 (0.0%) |
| 6-Person Households | 0 (0.0%) | 0 (0.0%) |
| 7+ Person Households | 0 (0.0%) | 0 (0.0%) |
| Total | 161 (59.0%) | 112 (41.0%) |
Female Fertility in Pine Brook Hill
Fertility by Age in Pine Brook Hill
| Age Bracket | Women with Births | Births / 1,000 Women |
| 15 to 19 years | 0 (0.0%) | 0.0 |
| 20 to 34 years | 0 (0.0%) | 0.0 |
| 35 to 50 years | 0 (0.0%) | 0.0 |
| Total | 0 (0.0%) | 0.0 |
Fertility by Age by Marriage Status in Pine Brook Hill
| Age Bracket | Married | Unmarried |
| 15 to 19 years | 0 (0.0%) | 0 (0.0%) |
| 20 to 34 years | 0 (0.0%) | 0 (0.0%) |
| 35 to 50 years | 0 (0.0%) | 0 (0.0%) |
| Total | 0 (0.0%) | 0 (0.0%) |
Fertility by Education in Pine Brook Hill
| Educational Attainment | Women with Births | Births / 1,000 Women |
| Less than High School | 0 (0.0%) | 0.0 |
| High School Diploma | 0 (0.0%) | 0.0 |
| College or Associate's Degree | 0 (0.0%) | 0.0 |
| Bachelor's Degree | 0 (0.0%) | 0.0 |
| Graduate Degree | 0 (0.0%) | 0.0 |
| Total | 0 (0.0%) | 0.0 |
Fertility by Education by Marriage Status in Pine Brook Hill
| Educational Attainment | Married | Unmarried |
| Less than High School | 0 (0.0%) | 0 (0.0%) |
| High School Diploma | 0 (0.0%) | 0 (0.0%) |
| College or Associate's Degree | 0 (0.0%) | 0 (0.0%) |
| Bachelor's Degree | 0 (0.0%) | 0 (0.0%) |
| Graduate Degree | 0 (0.0%) | 0 (0.0%) |
| Total | 0 (0.0%) | 0 (0.0%) |
Employment Characteristics in Pine Brook Hill
Employment by Class of Employer in Pine Brook Hill
Among the 277 employed individuals in Pine Brook Hill, self-employed (incorporated) (95 | 34.3%), private company employees (78 | 28.2%), and state government employees (39 | 14.1%) make up the most common classes of employment.
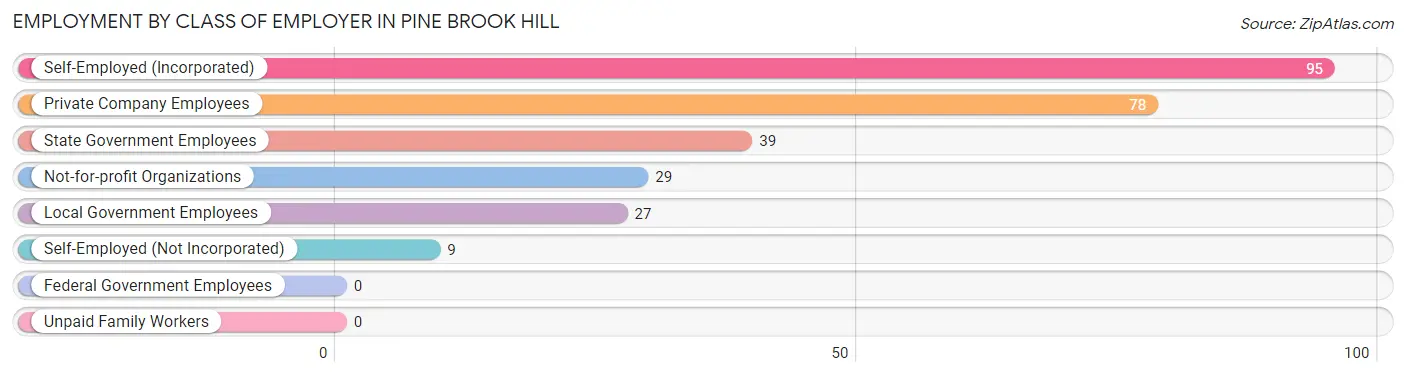
| Employer Class | # Employees | % Employees |
| Private Company Employees | 78 | 28.2% |
| Self-Employed (Incorporated) | 95 | 34.3% |
| Self-Employed (Not Incorporated) | 9 | 3.3% |
| Not-for-profit Organizations | 29 | 10.5% |
| Local Government Employees | 27 | 9.8% |
| State Government Employees | 39 | 14.1% |
| Federal Government Employees | 0 | 0.0% |
| Unpaid Family Workers | 0 | 0.0% |
| Total | 277 | 100.0% |
Employment Status by Age in Pine Brook Hill
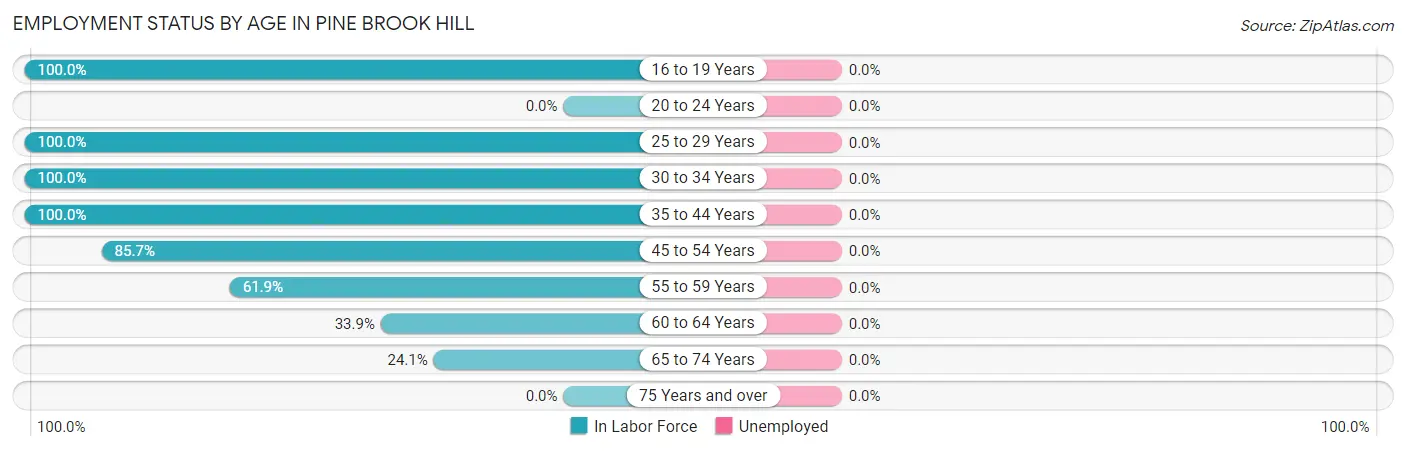
| Age Bracket | In Labor Force | Unemployed |
| 16 to 19 Years | 22 (100.0%) | 0 (0.0%) |
| 20 to 24 Years | 0 (0.0%) | 0 (0.0%) |
| 25 to 29 Years | 9 (100.0%) | 0 (0.0%) |
| 30 to 34 Years | 28 (100.0%) | 0 (0.0%) |
| 35 to 44 Years | 47 (100.0%) | 0 (0.0%) |
| 45 to 54 Years | 66 (85.7%) | 0 (0.0%) |
| 55 to 59 Years | 65 (61.9%) | 0 (0.0%) |
| 60 to 64 Years | 20 (33.9%) | 0 (0.0%) |
| 65 to 74 Years | 20 (24.1%) | 0 (0.0%) |
| 75 Years and over | 0 (0.0%) | 0 (0.0%) |
| Total | 277 (56.3%) | 0 (0.0%) |
Employment Status by Educational Attainment in Pine Brook Hill
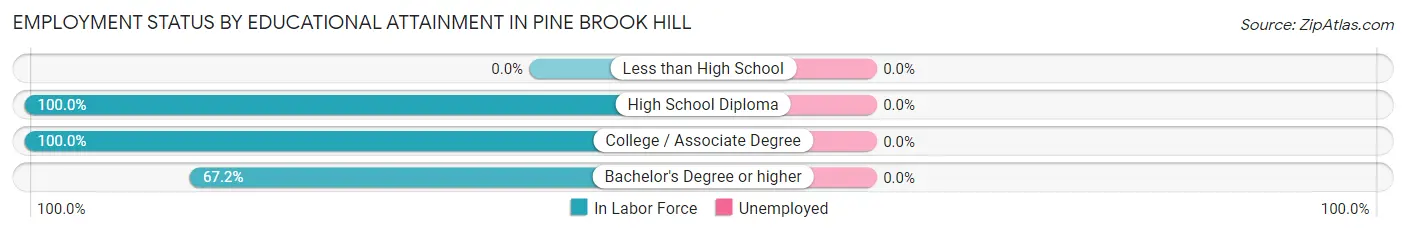
| Educational Attainment | In Labor Force | Unemployed |
| Less than High School | 0 (0.0%) | 0 (0.0%) |
| High School Diploma | 17 (100.0%) | 0 (0.0%) |
| College / Associate Degree | 34 (100.0%) | 0 (0.0%) |
| Bachelor's Degree or higher | 184 (67.2%) | 0 (0.0%) |
| Total | 235 (72.3%) | 0 (0.0%) |
Employment Occupations by Sex in Pine Brook Hill
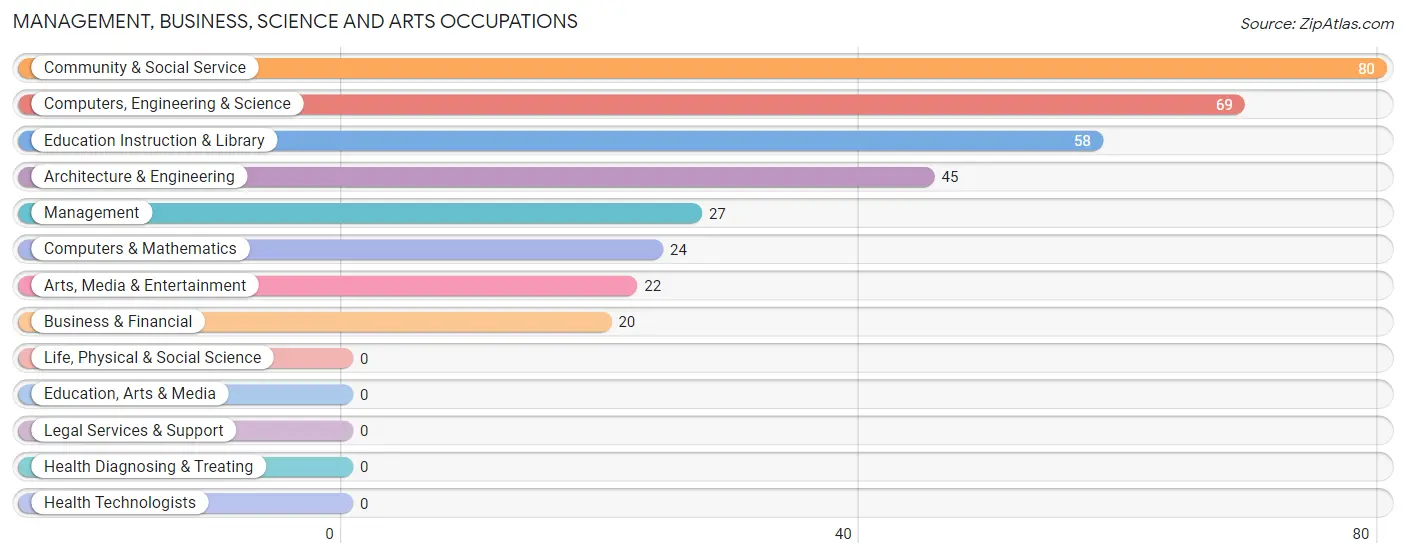
Management, Business, Science and Arts Occupations
The most common Management, Business, Science and Arts occupations in Pine Brook Hill are Community & Social Service (80 | 28.9%), Computers, Engineering & Science (69 | 24.9%), Education Instruction & Library (58 | 20.9%), Architecture & Engineering (45 | 16.3%), and Management (27 | 9.8%).
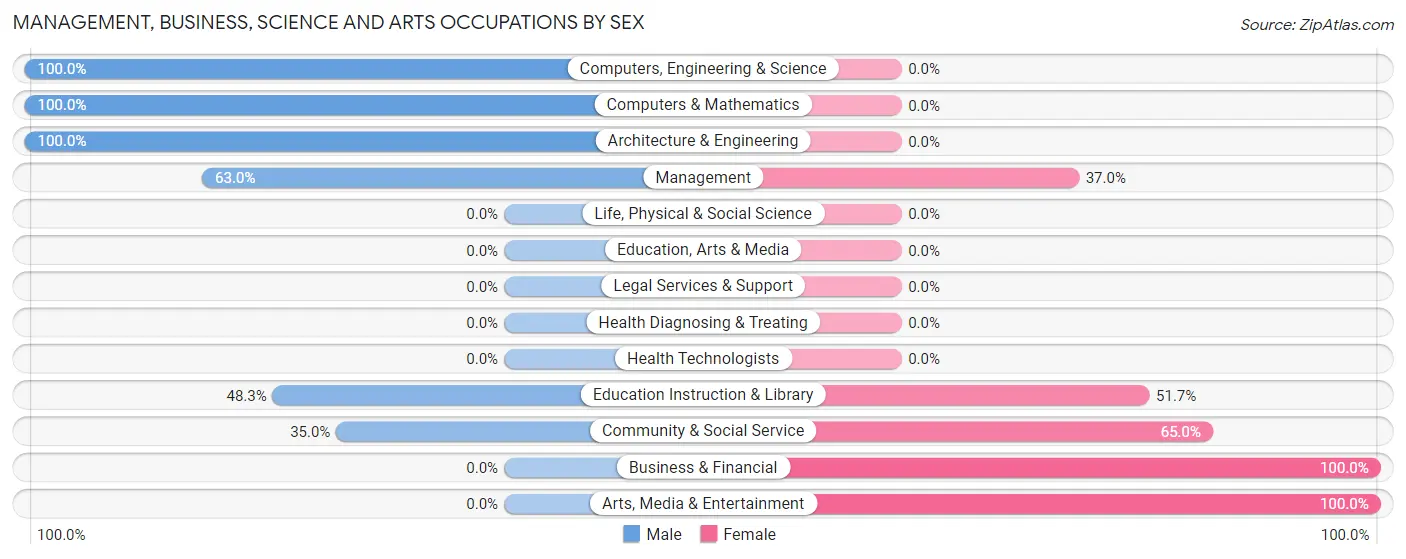
Management, Business, Science and Arts Occupations by Sex
Within the Management, Business, Science and Arts occupations in Pine Brook Hill, the most male-oriented occupations are Computers, Engineering & Science (100.0%), Computers & Mathematics (100.0%), and Architecture & Engineering (100.0%), while the most female-oriented occupations are Business & Financial (100.0%), Arts, Media & Entertainment (100.0%), and Community & Social Service (65.0%).
| Occupation | Male | Female |
| Management | 17 (63.0%) | 10 (37.0%) |
| Business & Financial | 0 (0.0%) | 20 (100.0%) |
| Computers, Engineering & Science | 69 (100.0%) | 0 (0.0%) |
| Computers & Mathematics | 24 (100.0%) | 0 (0.0%) |
| Architecture & Engineering | 45 (100.0%) | 0 (0.0%) |
| Life, Physical & Social Science | 0 (0.0%) | 0 (0.0%) |
| Community & Social Service | 28 (35.0%) | 52 (65.0%) |
| Education, Arts & Media | 0 (0.0%) | 0 (0.0%) |
| Legal Services & Support | 0 (0.0%) | 0 (0.0%) |
| Education Instruction & Library | 28 (48.3%) | 30 (51.7%) |
| Arts, Media & Entertainment | 0 (0.0%) | 22 (100.0%) |
| Health Diagnosing & Treating | 0 (0.0%) | 0 (0.0%) |
| Health Technologists | 0 (0.0%) | 0 (0.0%) |
| Total (Category) | 114 (58.2%) | 82 (41.8%) |
| Total (Overall) | 151 (54.5%) | 126 (45.5%) |
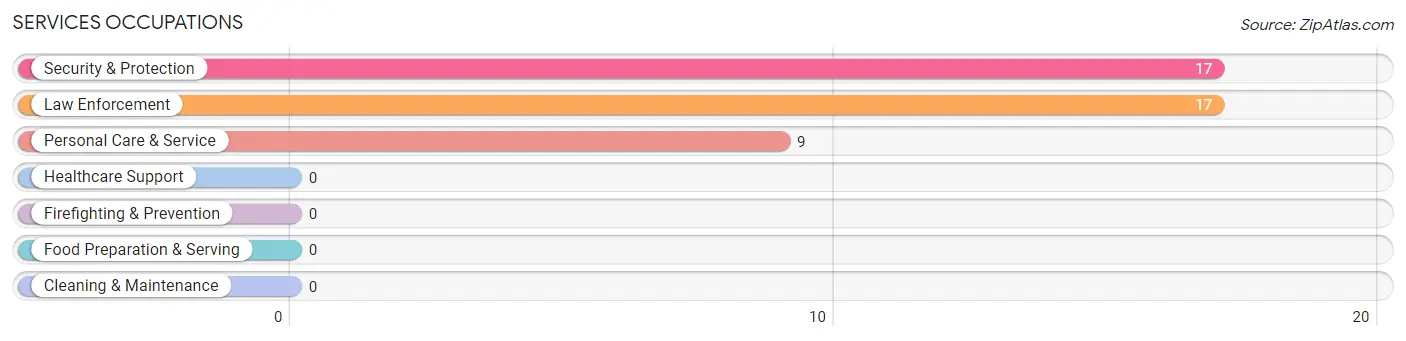
Services Occupations
The most common Services occupations in Pine Brook Hill are Security & Protection (17 | 6.1%), Law Enforcement (17 | 6.1%), and Personal Care & Service (9 | 3.3%).
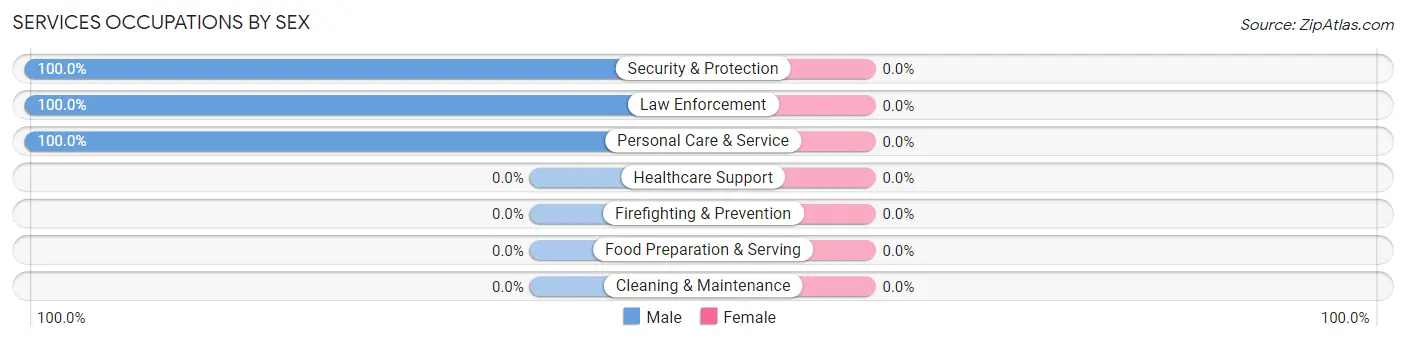
Services Occupations by Sex
| Occupation | Male | Female |
| Healthcare Support | 0 (0.0%) | 0 (0.0%) |
| Security & Protection | 17 (100.0%) | 0 (0.0%) |
| Firefighting & Prevention | 0 (0.0%) | 0 (0.0%) |
| Law Enforcement | 17 (100.0%) | 0 (0.0%) |
| Food Preparation & Serving | 0 (0.0%) | 0 (0.0%) |
| Cleaning & Maintenance | 0 (0.0%) | 0 (0.0%) |
| Personal Care & Service | 9 (100.0%) | 0 (0.0%) |
| Total (Category) | 26 (100.0%) | 0 (0.0%) |
| Total (Overall) | 151 (54.5%) | 126 (45.5%) |
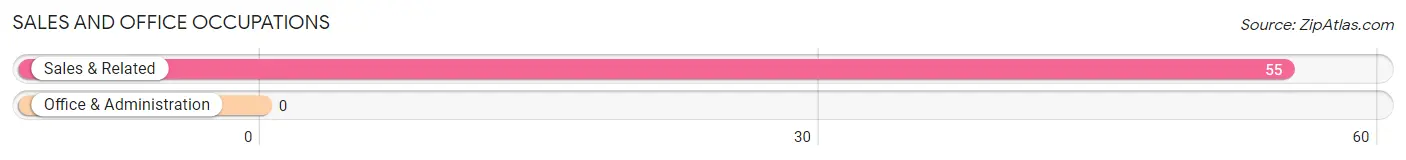
Sales and Office Occupations
The most common Sales and Office occupations in Pine Brook Hill are , and Sales & Related (55 | 19.9%).
Sales and Office Occupations by Sex
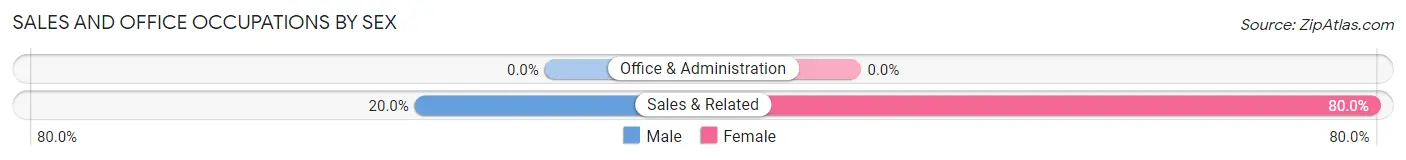
| Occupation | Male | Female |
| Sales & Related | 11 (20.0%) | 44 (80.0%) |
| Office & Administration | 0 (0.0%) | 0 (0.0%) |
| Total (Category) | 11 (20.0%) | 44 (80.0%) |
| Total (Overall) | 151 (54.5%) | 126 (45.5%) |
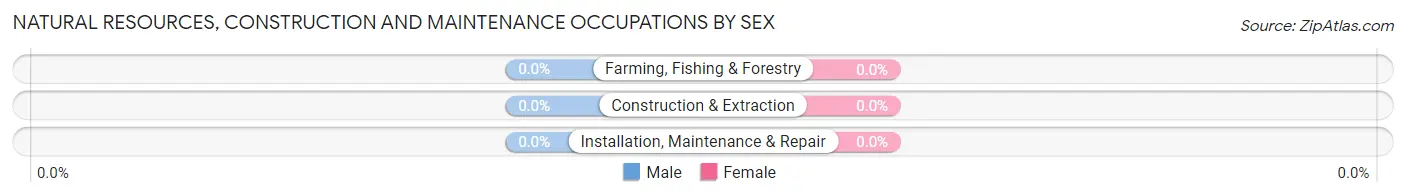
Natural Resources, Construction and Maintenance Occupations

Natural Resources, Construction and Maintenance Occupations by Sex
| Occupation | Male | Female |
| Farming, Fishing & Forestry | 0 (0.0%) | 0 (0.0%) |
| Construction & Extraction | 0 (0.0%) | 0 (0.0%) |
| Installation, Maintenance & Repair | 0 (0.0%) | 0 (0.0%) |
| Total (Category) | 0 (0.0%) | 0 (0.0%) |
| Total (Overall) | 151 (54.5%) | 126 (45.5%) |
Production, Transportation and Moving Occupations
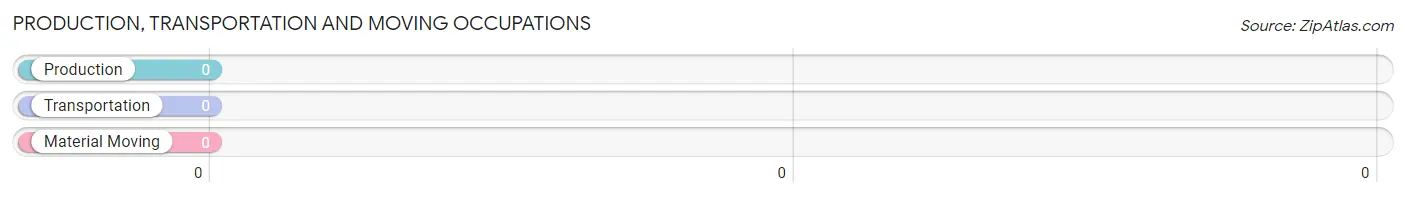
Production, Transportation and Moving Occupations by Sex
| Occupation | Male | Female |
| Production | 0 (0.0%) | 0 (0.0%) |
| Transportation | 0 (0.0%) | 0 (0.0%) |
| Material Moving | 0 (0.0%) | 0 (0.0%) |
| Total (Category) | 0 (0.0%) | 0 (0.0%) |
| Total (Overall) | 151 (54.5%) | 126 (45.5%) |
Employment Industries by Sex in Pine Brook Hill
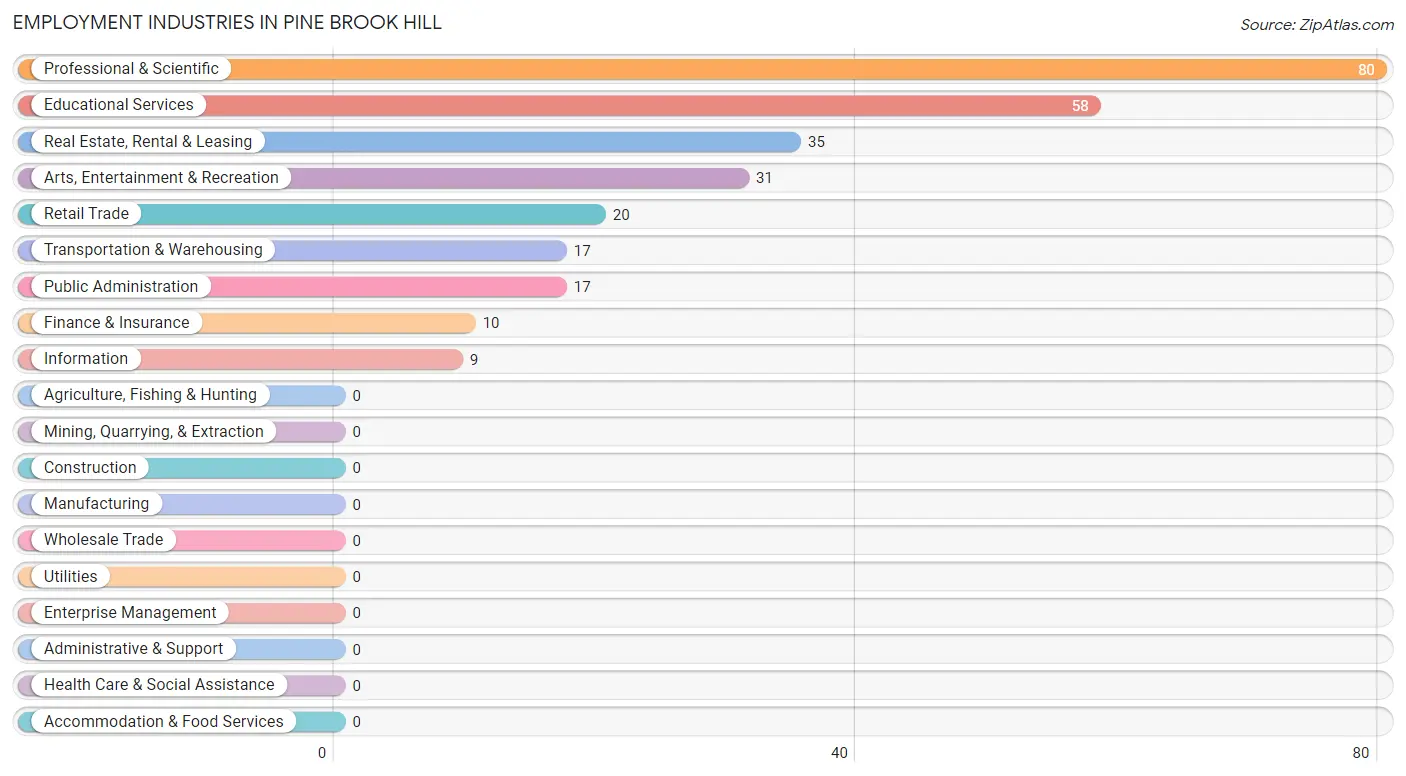
Employment Industries in Pine Brook Hill
The major employment industries in Pine Brook Hill include Professional & Scientific (80 | 28.9%), Educational Services (58 | 20.9%), Real Estate, Rental & Leasing (35 | 12.6%), Arts, Entertainment & Recreation (31 | 11.2%), and Retail Trade (20 | 7.2%).
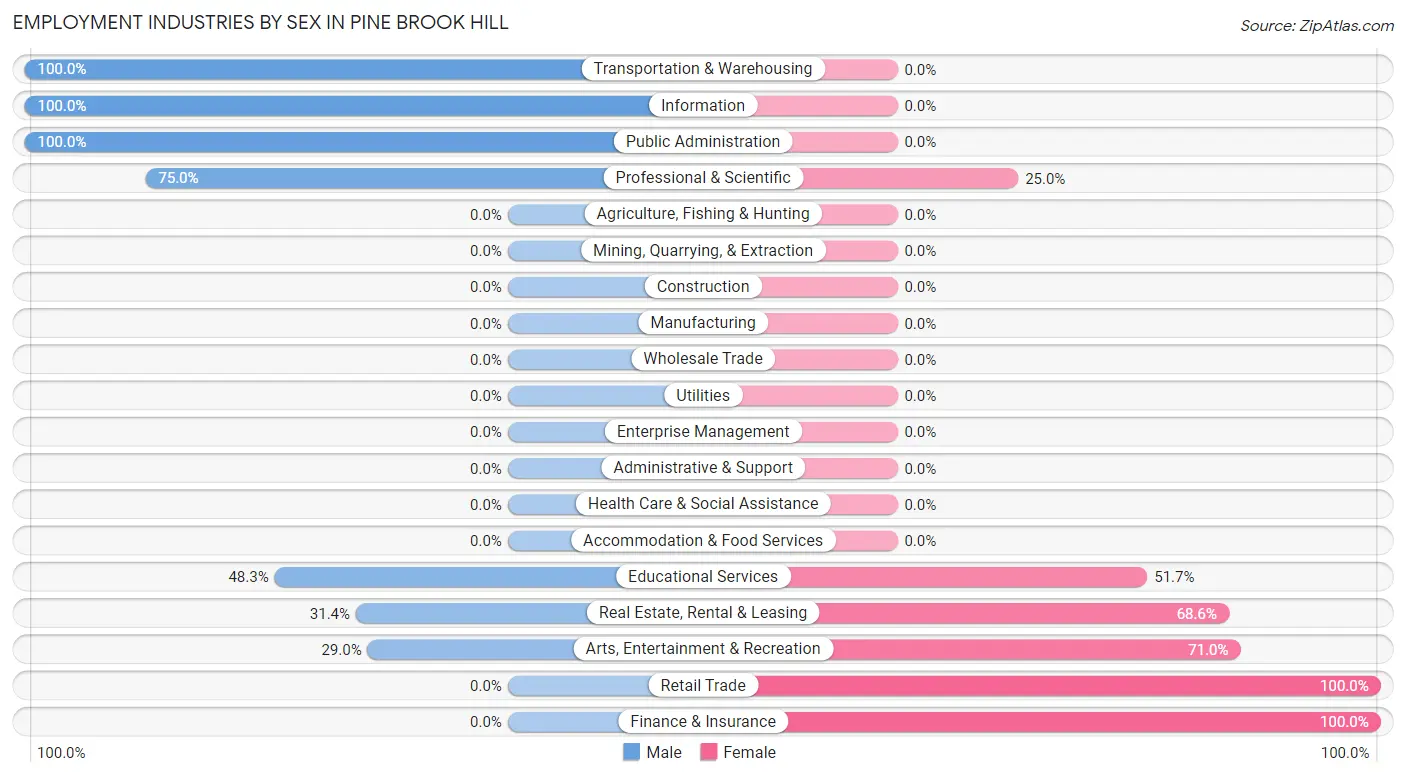
Employment Industries by Sex in Pine Brook Hill
The Pine Brook Hill industries that see more men than women are Transportation & Warehousing (100.0%), Information (100.0%), and Public Administration (100.0%), whereas the industries that tend to have a higher number of women are Retail Trade (100.0%), Finance & Insurance (100.0%), and Arts, Entertainment & Recreation (71.0%).
| Industry | Male | Female |
| Agriculture, Fishing & Hunting | 0 (0.0%) | 0 (0.0%) |
| Mining, Quarrying, & Extraction | 0 (0.0%) | 0 (0.0%) |
| Construction | 0 (0.0%) | 0 (0.0%) |
| Manufacturing | 0 (0.0%) | 0 (0.0%) |
| Wholesale Trade | 0 (0.0%) | 0 (0.0%) |
| Retail Trade | 0 (0.0%) | 20 (100.0%) |
| Transportation & Warehousing | 17 (100.0%) | 0 (0.0%) |
| Utilities | 0 (0.0%) | 0 (0.0%) |
| Information | 9 (100.0%) | 0 (0.0%) |
| Finance & Insurance | 0 (0.0%) | 10 (100.0%) |
| Real Estate, Rental & Leasing | 11 (31.4%) | 24 (68.6%) |
| Professional & Scientific | 60 (75.0%) | 20 (25.0%) |
| Enterprise Management | 0 (0.0%) | 0 (0.0%) |
| Administrative & Support | 0 (0.0%) | 0 (0.0%) |
| Educational Services | 28 (48.3%) | 30 (51.7%) |
| Health Care & Social Assistance | 0 (0.0%) | 0 (0.0%) |
| Arts, Entertainment & Recreation | 9 (29.0%) | 22 (71.0%) |
| Accommodation & Food Services | 0 (0.0%) | 0 (0.0%) |
| Public Administration | 17 (100.0%) | 0 (0.0%) |
| Total | 151 (54.5%) | 126 (45.5%) |
Education in Pine Brook Hill
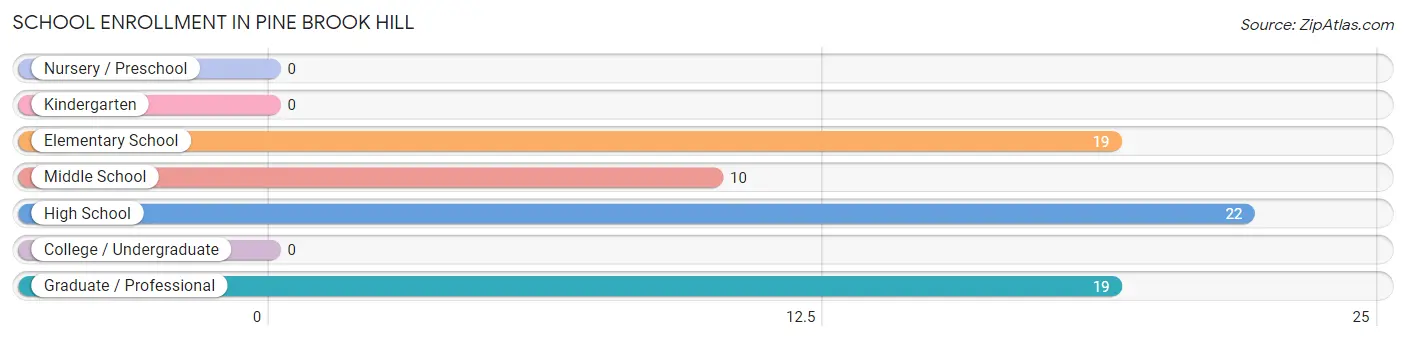
School Enrollment in Pine Brook Hill
The most common levels of schooling among the 70 students in Pine Brook Hill are high school (22 | 31.4%), elementary school (19 | 27.1%), and graduate / professional (19 | 27.1%).
| School Level | # Students | % Students |
| Nursery / Preschool | 0 | 0.0% |
| Kindergarten | 0 | 0.0% |
| Elementary School | 19 | 27.1% |
| Middle School | 10 | 14.3% |
| High School | 22 | 31.4% |
| College / Undergraduate | 0 | 0.0% |
| Graduate / Professional | 19 | 27.1% |
| Total | 70 | 100.0% |
School Enrollment by Age by Funding Source in Pine Brook Hill
Out of a total of 70 students who are enrolled in schools in Pine Brook Hill, 22 (31.4%) attend a private institution, while the remaining 48 (68.6%) are enrolled in public schools. The age group of 18 to 19 year olds has the highest likelihood of being enrolled in private schools, with 22 (100.0% in the age bracket) enrolled. Conversely, the age group of 10 to 14 year olds has the lowest likelihood of being enrolled in a private school, with 29 (100.0% in the age bracket) attending a public institution.
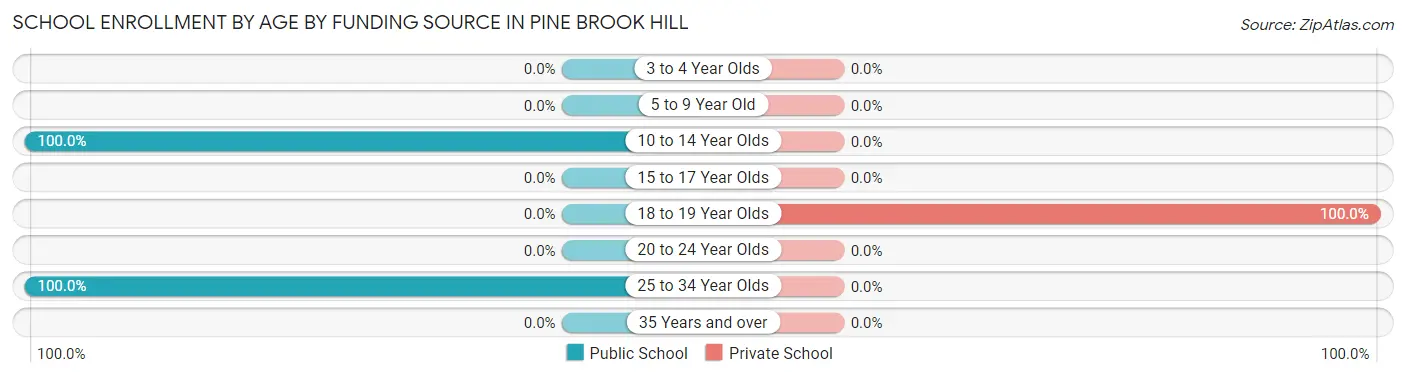
| Age Bracket | Public School | Private School |
| 3 to 4 Year Olds | 0 (0.0%) | 0 (0.0%) |
| 5 to 9 Year Old | 0 (0.0%) | 0 (0.0%) |
| 10 to 14 Year Olds | 29 (100.0%) | 0 (0.0%) |
| 15 to 17 Year Olds | 0 (0.0%) | 0 (0.0%) |
| 18 to 19 Year Olds | 0 (0.0%) | 22 (100.0%) |
| 20 to 24 Year Olds | 0 (0.0%) | 0 (0.0%) |
| 25 to 34 Year Olds | 19 (100.0%) | 0 (0.0%) |
| 35 Years and over | 0 (0.0%) | 0 (0.0%) |
| Total | 48 (68.6%) | 22 (31.4%) |
Educational Attainment by Field of Study in Pine Brook Hill
Engineering (72 | 17.3%), business (69 | 16.6%), psychology (36 | 8.7%), physical & health sciences (33 | 8.0%), and social sciences (31 | 7.5%) are the most common fields of study among 415 individuals in Pine Brook Hill who have obtained a bachelor's degree or higher.
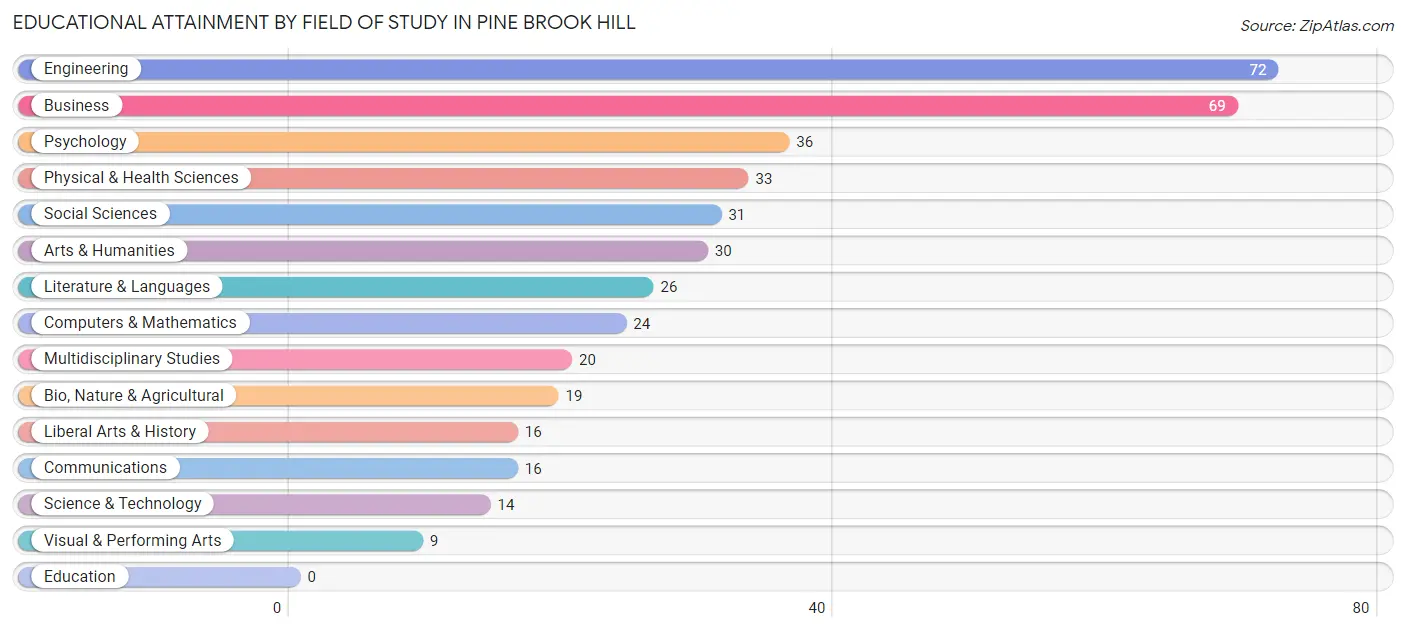
| Field of Study | # Graduates | % Graduates |
| Computers & Mathematics | 24 | 5.8% |
| Bio, Nature & Agricultural | 19 | 4.6% |
| Physical & Health Sciences | 33 | 8.0% |
| Psychology | 36 | 8.7% |
| Social Sciences | 31 | 7.5% |
| Engineering | 72 | 17.3% |
| Multidisciplinary Studies | 20 | 4.8% |
| Science & Technology | 14 | 3.4% |
| Business | 69 | 16.6% |
| Education | 0 | 0.0% |
| Literature & Languages | 26 | 6.3% |
| Liberal Arts & History | 16 | 3.9% |
| Visual & Performing Arts | 9 | 2.2% |
| Communications | 16 | 3.9% |
| Arts & Humanities | 30 | 7.2% |
| Total | 415 | 100.0% |
Transportation & Commute in Pine Brook Hill
Vehicle Availability by Sex in Pine Brook Hill
The most prevalent vehicle ownership categories in Pine Brook Hill are males with 2 vehicles (79, accounting for 52.3%) and females with 2 vehicles (84, making up 62.7%).
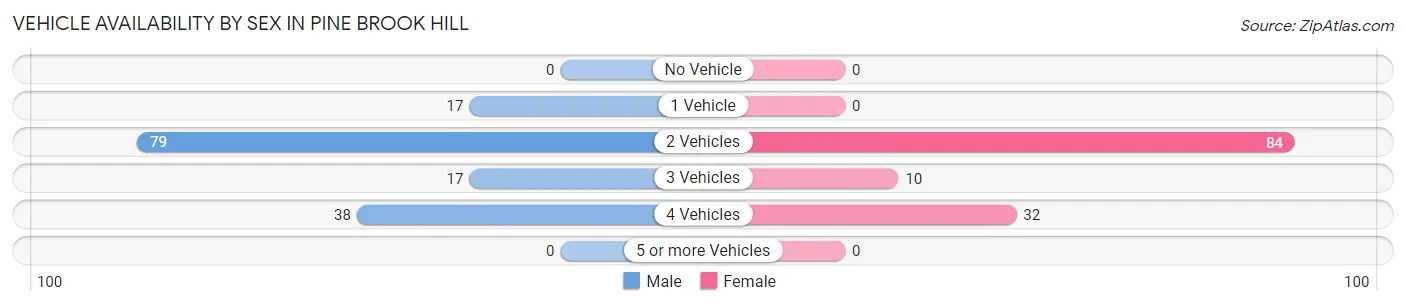
| Vehicles Available | Male | Female |
| No Vehicle | 0 (0.0%) | 0 (0.0%) |
| 1 Vehicle | 17 (11.3%) | 0 (0.0%) |
| 2 Vehicles | 79 (52.3%) | 84 (66.7%) |
| 3 Vehicles | 17 (11.3%) | 10 (7.9%) |
| 4 Vehicles | 38 (25.2%) | 32 (25.4%) |
| 5 or more Vehicles | 0 (0.0%) | 0 (0.0%) |
| Total | 151 (100.0%) | 126 (100.0%) |
Commute Time in Pine Brook Hill
The most frequently occuring commute durations in Pine Brook Hill are 10 to 14 minutes (49 commuters, 30.1%), 20 to 24 minutes (49 commuters, 30.1%), and 30 to 34 minutes (22 commuters, 13.5%).
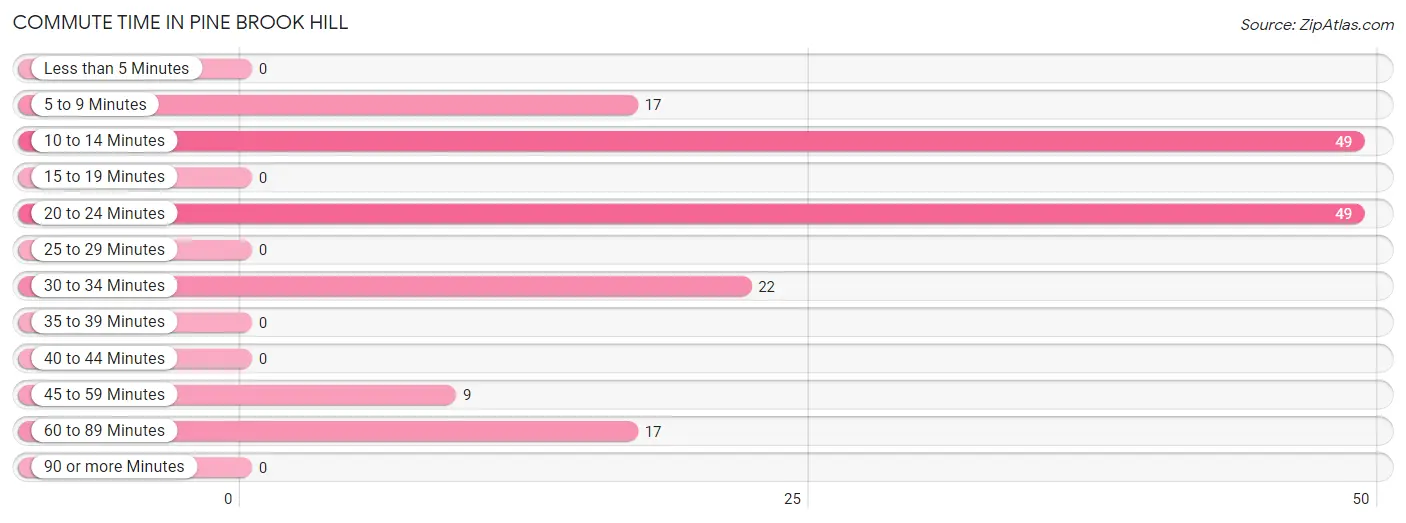
| Commute Time | # Commuters | % Commuters |
| Less than 5 Minutes | 0 | 0.0% |
| 5 to 9 Minutes | 17 | 10.4% |
| 10 to 14 Minutes | 49 | 30.1% |
| 15 to 19 Minutes | 0 | 0.0% |
| 20 to 24 Minutes | 49 | 30.1% |
| 25 to 29 Minutes | 0 | 0.0% |
| 30 to 34 Minutes | 22 | 13.5% |
| 35 to 39 Minutes | 0 | 0.0% |
| 40 to 44 Minutes | 0 | 0.0% |
| 45 to 59 Minutes | 9 | 5.5% |
| 60 to 89 Minutes | 17 | 10.4% |
| 90 or more Minutes | 0 | 0.0% |
Commute Time by Sex in Pine Brook Hill
The most common commute times in Pine Brook Hill are 10 to 14 minutes (29 commuters, 31.9%) for males and 20 to 24 minutes (30 commuters, 41.7%) for females.
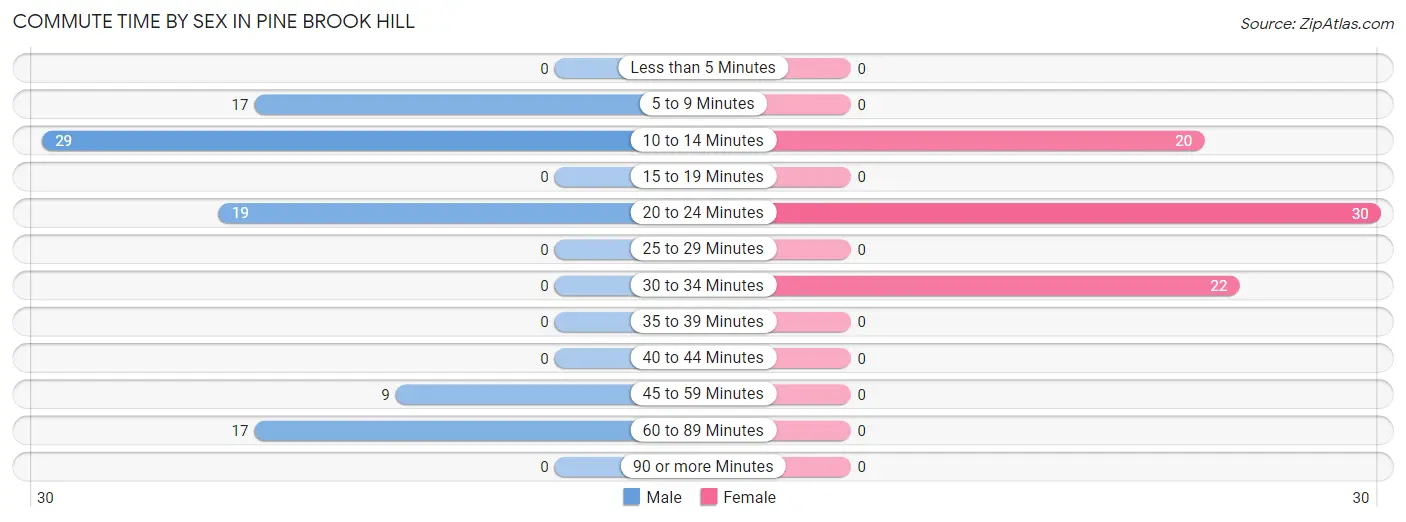
| Commute Time | Male | Female |
| Less than 5 Minutes | 0 (0.0%) | 0 (0.0%) |
| 5 to 9 Minutes | 17 (18.7%) | 0 (0.0%) |
| 10 to 14 Minutes | 29 (31.9%) | 20 (27.8%) |
| 15 to 19 Minutes | 0 (0.0%) | 0 (0.0%) |
| 20 to 24 Minutes | 19 (20.9%) | 30 (41.7%) |
| 25 to 29 Minutes | 0 (0.0%) | 0 (0.0%) |
| 30 to 34 Minutes | 0 (0.0%) | 22 (30.6%) |
| 35 to 39 Minutes | 0 (0.0%) | 0 (0.0%) |
| 40 to 44 Minutes | 0 (0.0%) | 0 (0.0%) |
| 45 to 59 Minutes | 9 (9.9%) | 0 (0.0%) |
| 60 to 89 Minutes | 17 (18.7%) | 0 (0.0%) |
| 90 or more Minutes | 0 (0.0%) | 0 (0.0%) |
Time of Departure to Work by Sex in Pine Brook Hill
The most frequent times of departure to work in Pine Brook Hill are 8:00 AM to 8:29 AM (30, 33.0%) for males and 8:00 AM to 8:29 AM (30, 41.7%) for females.
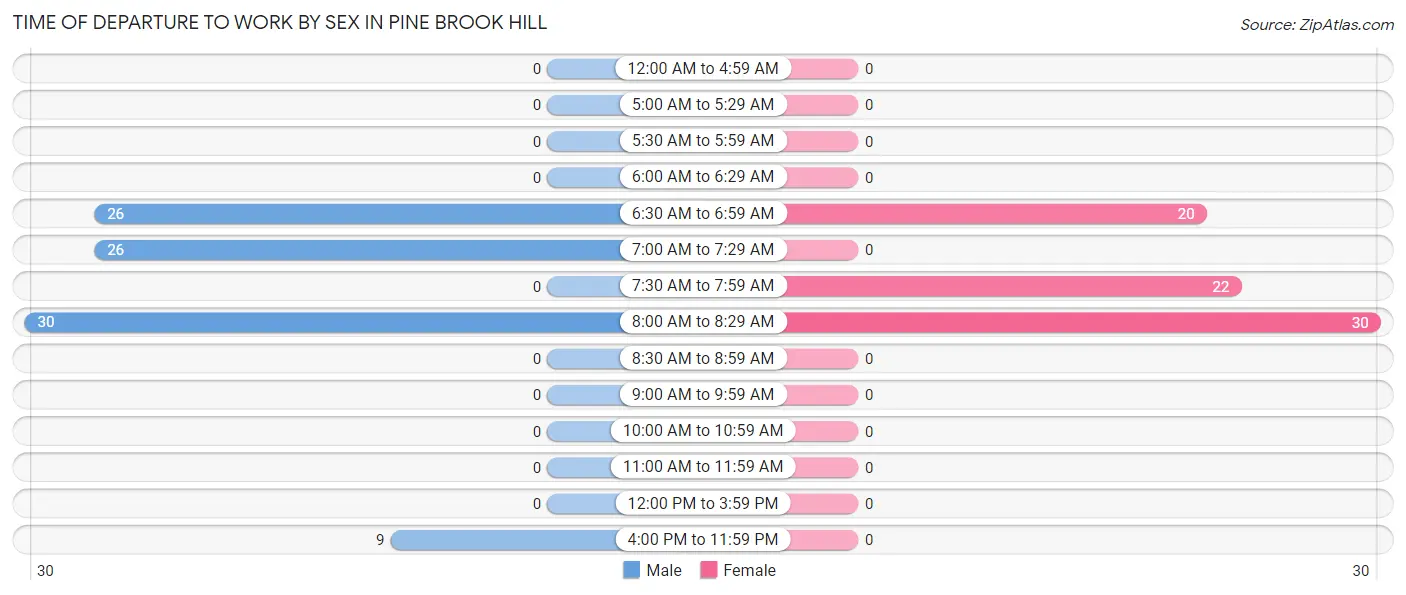
| Time of Departure | Male | Female |
| 12:00 AM to 4:59 AM | 0 (0.0%) | 0 (0.0%) |
| 5:00 AM to 5:29 AM | 0 (0.0%) | 0 (0.0%) |
| 5:30 AM to 5:59 AM | 0 (0.0%) | 0 (0.0%) |
| 6:00 AM to 6:29 AM | 0 (0.0%) | 0 (0.0%) |
| 6:30 AM to 6:59 AM | 26 (28.6%) | 20 (27.8%) |
| 7:00 AM to 7:29 AM | 26 (28.6%) | 0 (0.0%) |
| 7:30 AM to 7:59 AM | 0 (0.0%) | 22 (30.6%) |
| 8:00 AM to 8:29 AM | 30 (33.0%) | 30 (41.7%) |
| 8:30 AM to 8:59 AM | 0 (0.0%) | 0 (0.0%) |
| 9:00 AM to 9:59 AM | 0 (0.0%) | 0 (0.0%) |
| 10:00 AM to 10:59 AM | 0 (0.0%) | 0 (0.0%) |
| 11:00 AM to 11:59 AM | 0 (0.0%) | 0 (0.0%) |
| 12:00 PM to 3:59 PM | 0 (0.0%) | 0 (0.0%) |
| 4:00 PM to 11:59 PM | 9 (9.9%) | 0 (0.0%) |
| Total | 91 (100.0%) | 72 (100.0%) |
Housing Occupancy in Pine Brook Hill
Occupancy by Ownership in Pine Brook Hill
Of the total 273 dwellings in Pine Brook Hill, owner-occupied units account for 261 (95.6%), while renter-occupied units make up 12 (4.4%).
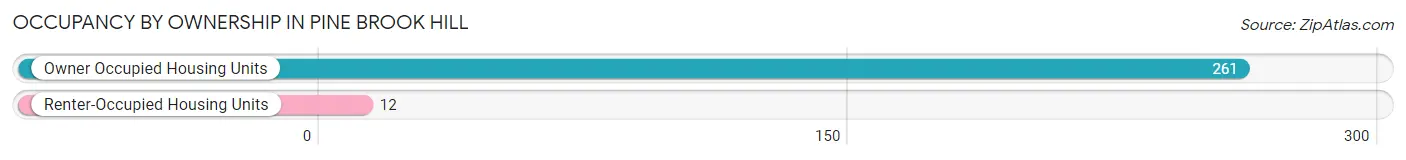
| Occupancy | # Housing Units | % Housing Units |
| Owner Occupied Housing Units | 261 | 95.6% |
| Renter-Occupied Housing Units | 12 | 4.4% |
| Total Occupied Housing Units | 273 | 100.0% |
Occupancy by Household Size in Pine Brook Hill
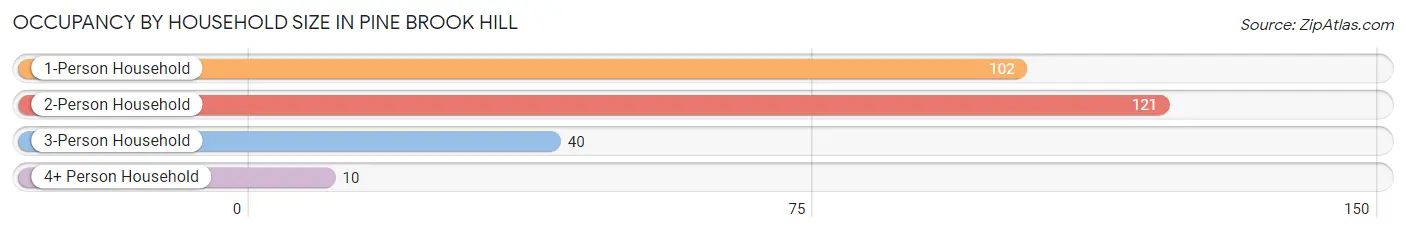
| Household Size | # Housing Units | % Housing Units |
| 1-Person Household | 102 | 37.4% |
| 2-Person Household | 121 | 44.3% |
| 3-Person Household | 40 | 14.6% |
| 4+ Person Household | 10 | 3.7% |
| Total Housing Units | 273 | 100.0% |
Occupancy by Ownership by Household Size in Pine Brook Hill
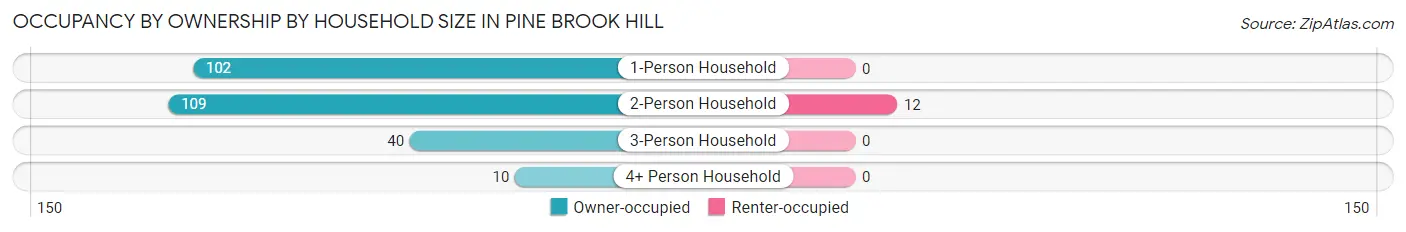
| Household Size | Owner-occupied | Renter-occupied |
| 1-Person Household | 102 (100.0%) | 0 (0.0%) |
| 2-Person Household | 109 (90.1%) | 12 (9.9%) |
| 3-Person Household | 40 (100.0%) | 0 (0.0%) |
| 4+ Person Household | 10 (100.0%) | 0 (0.0%) |
| Total Housing Units | 261 (95.6%) | 12 (4.4%) |
Occupancy by Educational Attainment in Pine Brook Hill
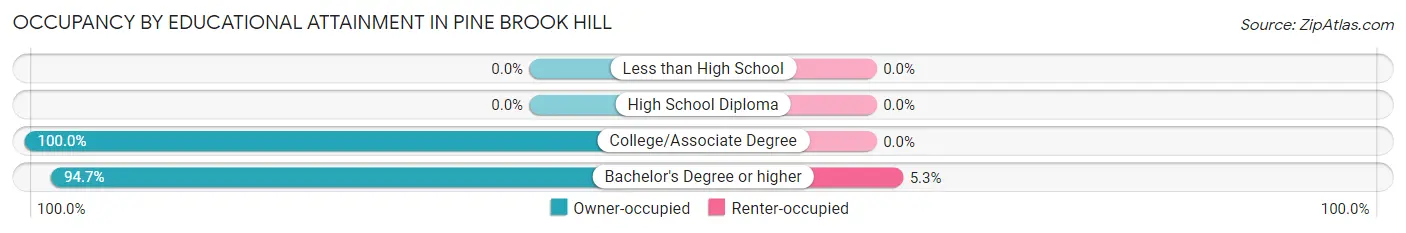
| Household Size | Owner-occupied | Renter-occupied |
| Less than High School | 0 (0.0%) | 0 (0.0%) |
| High School Diploma | 0 (0.0%) | 0 (0.0%) |
| College/Associate Degree | 45 (100.0%) | 0 (0.0%) |
| Bachelor's Degree or higher | 216 (94.7%) | 12 (5.3%) |
Occupancy by Age of Householder in Pine Brook Hill
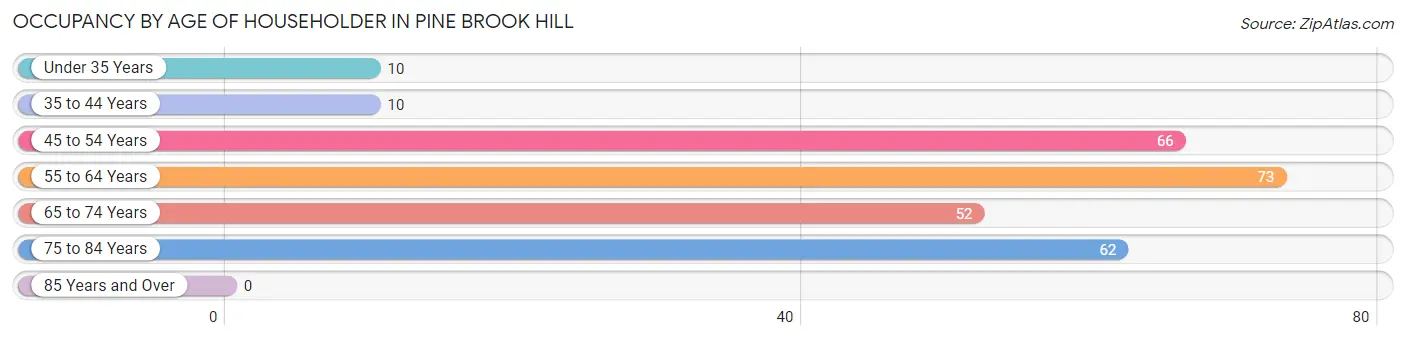
| Age Bracket | # Households | % Households |
| Under 35 Years | 10 | 3.7% |
| 35 to 44 Years | 10 | 3.7% |
| 45 to 54 Years | 66 | 24.2% |
| 55 to 64 Years | 73 | 26.7% |
| 65 to 74 Years | 52 | 19.1% |
| 75 to 84 Years | 62 | 22.7% |
| 85 Years and Over | 0 | 0.0% |
| Total | 273 | 100.0% |
Housing Finances in Pine Brook Hill
Median Income by Occupancy in Pine Brook Hill
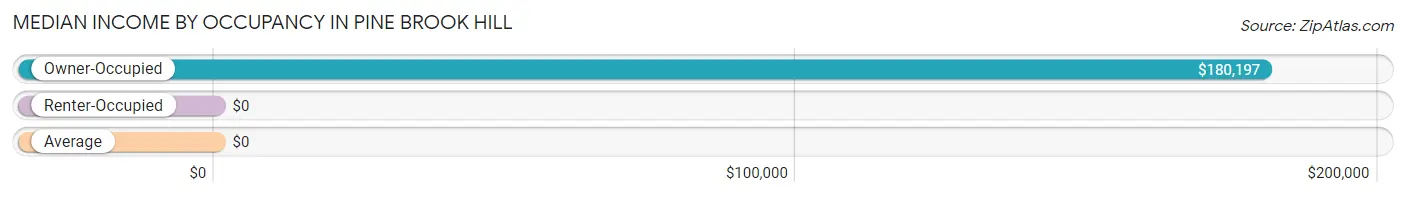
| Occupancy Type | # Households | Median Income |
| Owner-Occupied | 261 (95.6%) | $180,197 |
| Renter-Occupied | 12 (4.4%) | $0 |
| Average | 273 (100.0%) | $0 |
Occupancy by Householder Income Bracket in Pine Brook Hill
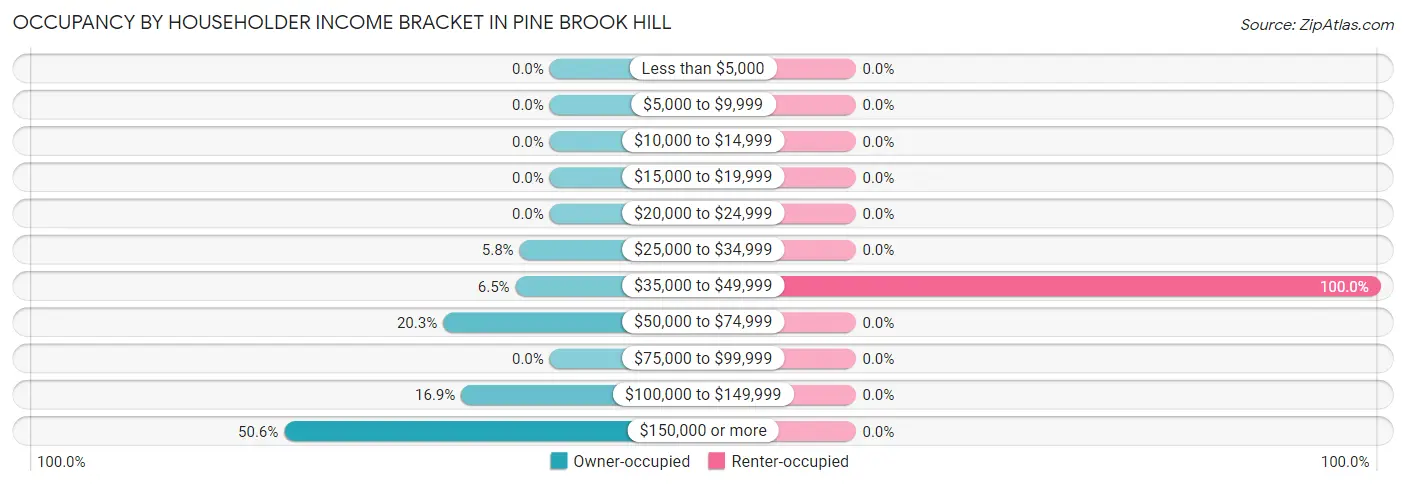
| Income Bracket | Owner-occupied | Renter-occupied |
| Less than $5,000 | 0 (0.0%) | 0 (0.0%) |
| $5,000 to $9,999 | 0 (0.0%) | 0 (0.0%) |
| $10,000 to $14,999 | 0 (0.0%) | 0 (0.0%) |
| $15,000 to $19,999 | 0 (0.0%) | 0 (0.0%) |
| $20,000 to $24,999 | 0 (0.0%) | 0 (0.0%) |
| $25,000 to $34,999 | 15 (5.8%) | 0 (0.0%) |
| $35,000 to $49,999 | 17 (6.5%) | 12 (100.0%) |
| $50,000 to $74,999 | 53 (20.3%) | 0 (0.0%) |
| $75,000 to $99,999 | 0 (0.0%) | 0 (0.0%) |
| $100,000 to $149,999 | 44 (16.9%) | 0 (0.0%) |
| $150,000 or more | 132 (50.6%) | 0 (0.0%) |
| Total | 261 (100.0%) | 12 (100.0%) |
Monthly Housing Cost Tiers in Pine Brook Hill
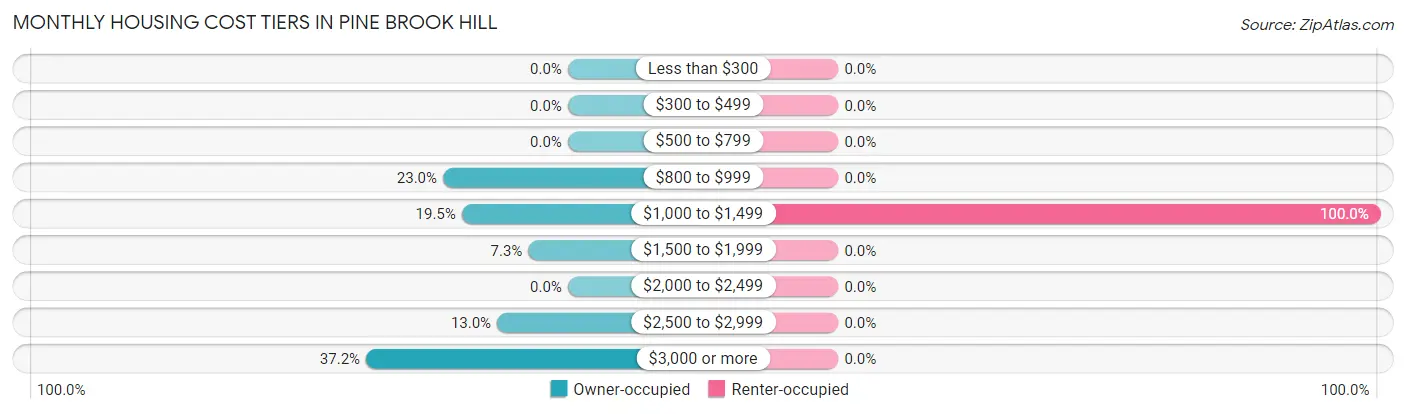
| Monthly Cost | Owner-occupied | Renter-occupied |
| Less than $300 | 0 (0.0%) | 0 (0.0%) |
| $300 to $499 | 0 (0.0%) | 0 (0.0%) |
| $500 to $799 | 0 (0.0%) | 0 (0.0%) |
| $800 to $999 | 60 (23.0%) | 0 (0.0%) |
| $1,000 to $1,499 | 51 (19.5%) | 12 (100.0%) |
| $1,500 to $1,999 | 19 (7.3%) | 0 (0.0%) |
| $2,000 to $2,499 | 0 (0.0%) | 0 (0.0%) |
| $2,500 to $2,999 | 34 (13.0%) | 0 (0.0%) |
| $3,000 or more | 97 (37.2%) | 0 (0.0%) |
| Total | 261 (100.0%) | 12 (100.0%) |
Physical Housing Characteristics in Pine Brook Hill
Housing Structures in Pine Brook Hill
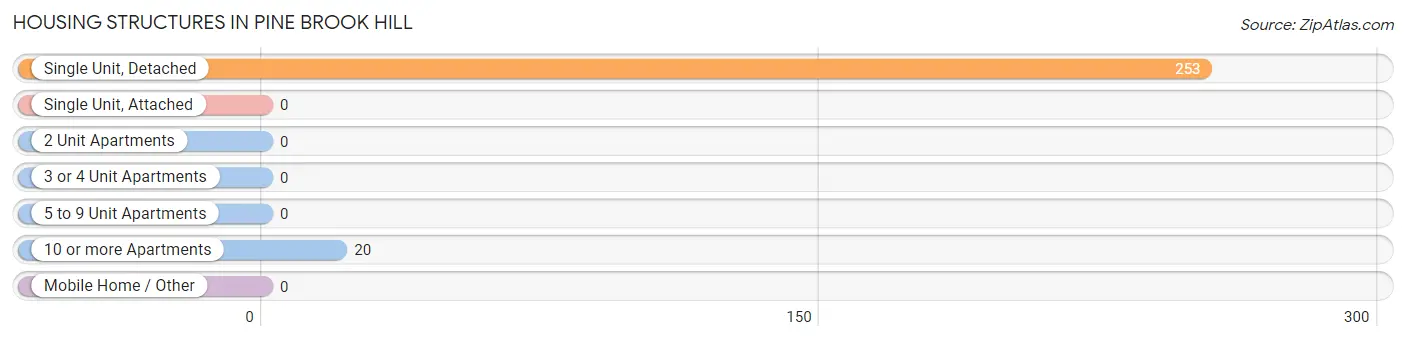
| Structure Type | # Housing Units | % Housing Units |
| Single Unit, Detached | 253 | 92.7% |
| Single Unit, Attached | 0 | 0.0% |
| 2 Unit Apartments | 0 | 0.0% |
| 3 or 4 Unit Apartments | 0 | 0.0% |
| 5 to 9 Unit Apartments | 0 | 0.0% |
| 10 or more Apartments | 20 | 7.3% |
| Mobile Home / Other | 0 | 0.0% |
| Total | 273 | 100.0% |
Housing Structures by Occupancy in Pine Brook Hill
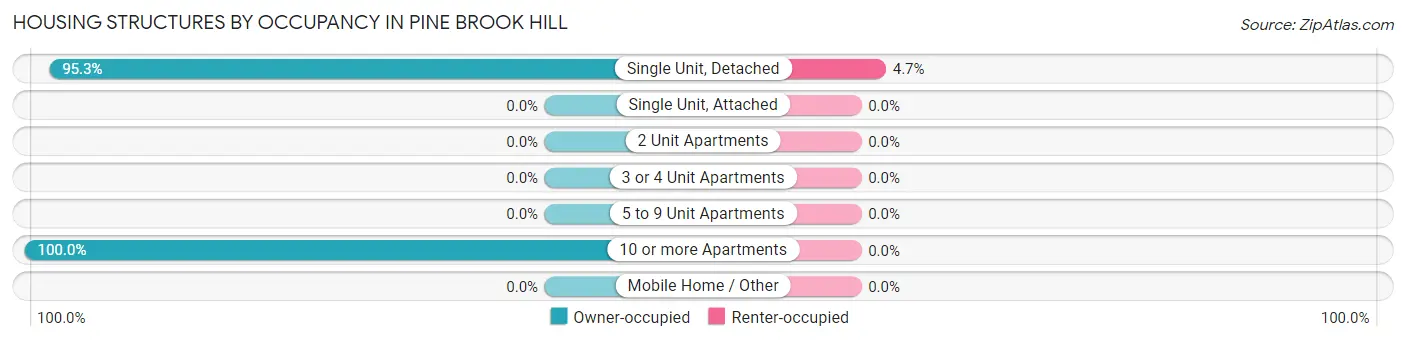
| Structure Type | Owner-occupied | Renter-occupied |
| Single Unit, Detached | 241 (95.3%) | 12 (4.7%) |
| Single Unit, Attached | 0 (0.0%) | 0 (0.0%) |
| 2 Unit Apartments | 0 (0.0%) | 0 (0.0%) |
| 3 or 4 Unit Apartments | 0 (0.0%) | 0 (0.0%) |
| 5 to 9 Unit Apartments | 0 (0.0%) | 0 (0.0%) |
| 10 or more Apartments | 20 (100.0%) | 0 (0.0%) |
| Mobile Home / Other | 0 (0.0%) | 0 (0.0%) |
| Total | 261 (95.6%) | 12 (4.4%) |
Housing Structures by Number of Rooms in Pine Brook Hill
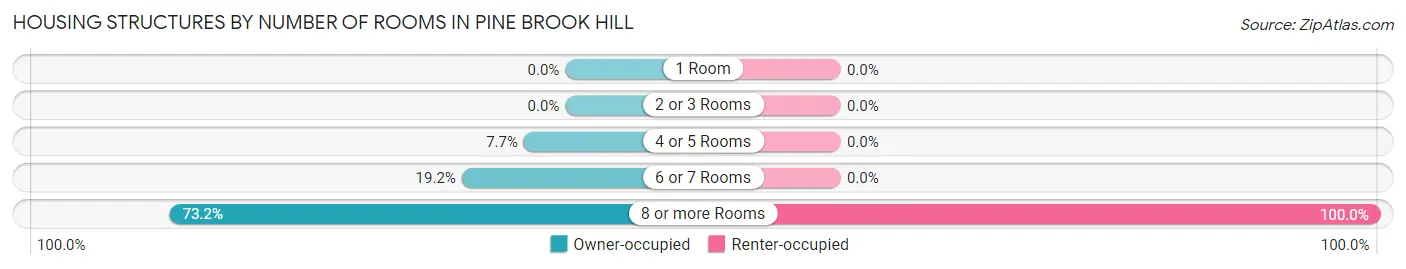
| Number of Rooms | Owner-occupied | Renter-occupied |
| 1 Room | 0 (0.0%) | 0 (0.0%) |
| 2 or 3 Rooms | 0 (0.0%) | 0 (0.0%) |
| 4 or 5 Rooms | 20 (7.7%) | 0 (0.0%) |
| 6 or 7 Rooms | 50 (19.2%) | 0 (0.0%) |
| 8 or more Rooms | 191 (73.2%) | 12 (100.0%) |
| Total | 261 (100.0%) | 12 (100.0%) |
Housing Structure by Heating Type in Pine Brook Hill
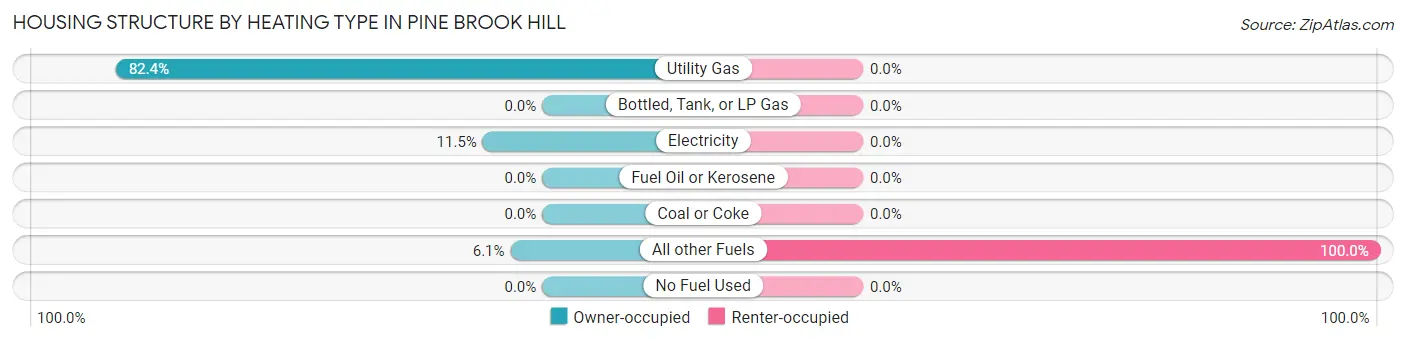
| Heating Type | Owner-occupied | Renter-occupied |
| Utility Gas | 215 (82.4%) | 0 (0.0%) |
| Bottled, Tank, or LP Gas | 0 (0.0%) | 0 (0.0%) |
| Electricity | 30 (11.5%) | 0 (0.0%) |
| Fuel Oil or Kerosene | 0 (0.0%) | 0 (0.0%) |
| Coal or Coke | 0 (0.0%) | 0 (0.0%) |
| All other Fuels | 16 (6.1%) | 12 (100.0%) |
| No Fuel Used | 0 (0.0%) | 0 (0.0%) |
| Total | 261 (100.0%) | 12 (100.0%) |
Household Vehicle Usage in Pine Brook Hill
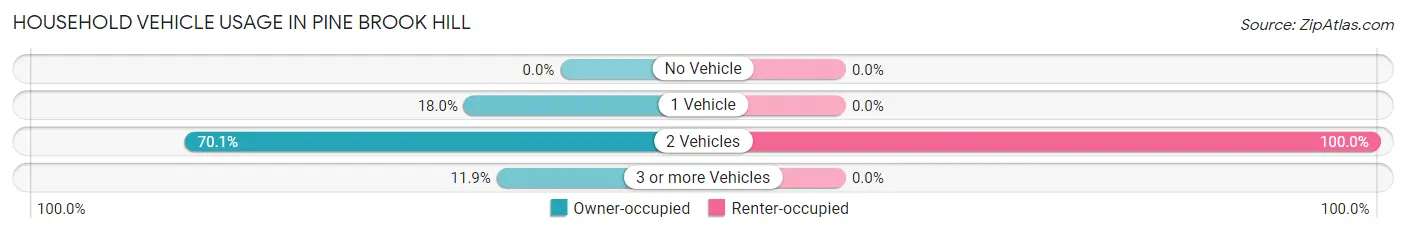
| Vehicles per Household | Owner-occupied | Renter-occupied |
| No Vehicle | 0 (0.0%) | 0 (0.0%) |
| 1 Vehicle | 47 (18.0%) | 0 (0.0%) |
| 2 Vehicles | 183 (70.1%) | 12 (100.0%) |
| 3 or more Vehicles | 31 (11.9%) | 0 (0.0%) |
| Total | 261 (100.0%) | 12 (100.0%) |
Real Estate & Mortgages in Pine Brook Hill
Real Estate and Mortgage Overview in Pine Brook Hill
| Characteristic | Without Mortgage | With Mortgage |
| Housing Units | 95 | 166 |
| Median Property Value | - | - |
| Median Household Income | - | - |
| Monthly Housing Costs | $1,015 | $97 |
| Real Estate Taxes | $7,083 | $0 |
Property Value by Mortgage Status in Pine Brook Hill
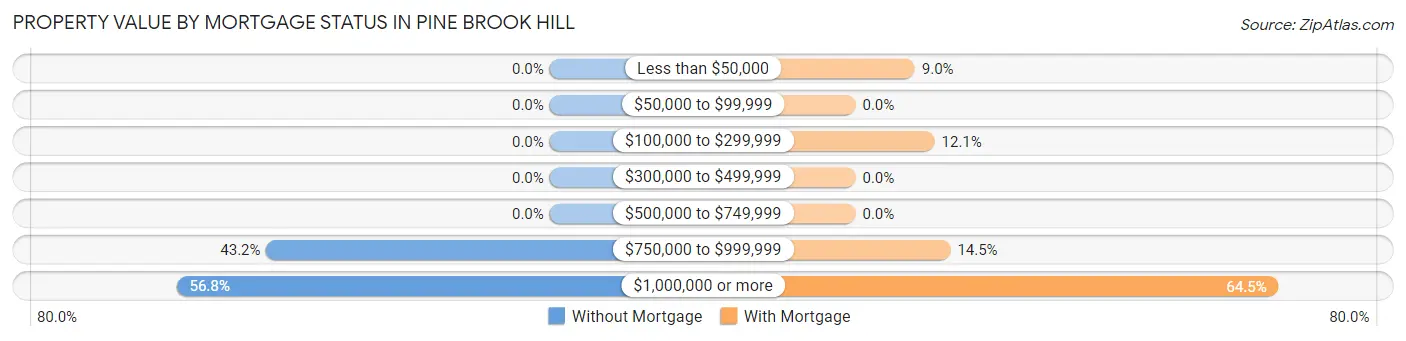
| Property Value | Without Mortgage | With Mortgage |
| Less than $50,000 | 0 (0.0%) | 15 (9.0%) |
| $50,000 to $99,999 | 0 (0.0%) | 0 (0.0%) |
| $100,000 to $299,999 | 0 (0.0%) | 20 (12.0%) |
| $300,000 to $499,999 | 0 (0.0%) | 0 (0.0%) |
| $500,000 to $749,999 | 0 (0.0%) | 0 (0.0%) |
| $750,000 to $999,999 | 41 (43.2%) | 24 (14.5%) |
| $1,000,000 or more | 54 (56.8%) | 107 (64.5%) |
| Total | 95 (100.0%) | 166 (100.0%) |
Household Income by Mortgage Status in Pine Brook Hill
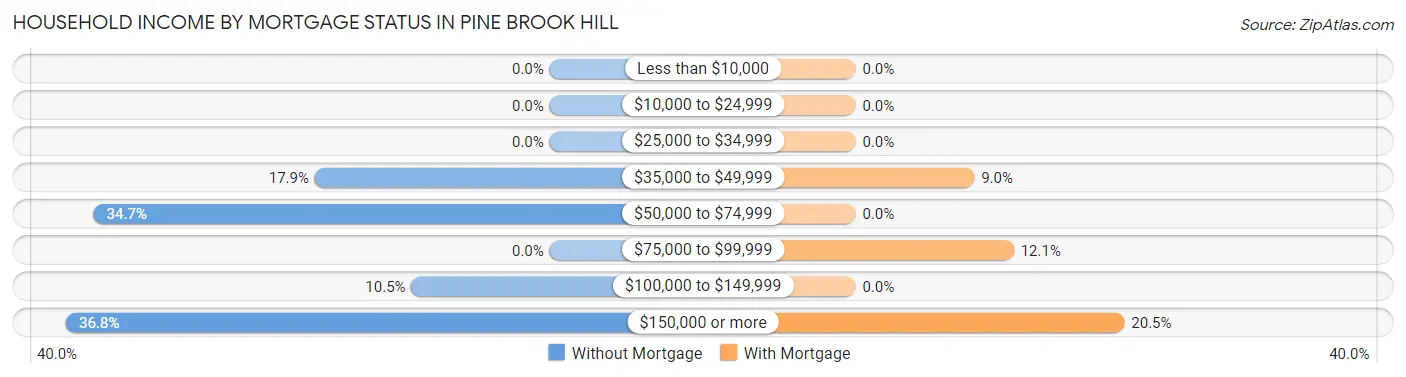
| Household Income | Without Mortgage | With Mortgage |
| Less than $10,000 | 0 (0.0%) | 0 (0.0%) |
| $10,000 to $24,999 | 0 (0.0%) | 0 (0.0%) |
| $25,000 to $34,999 | 0 (0.0%) | 0 (0.0%) |
| $35,000 to $49,999 | 17 (17.9%) | 15 (9.0%) |
| $50,000 to $74,999 | 33 (34.7%) | 0 (0.0%) |
| $75,000 to $99,999 | 0 (0.0%) | 20 (12.0%) |
| $100,000 to $149,999 | 10 (10.5%) | 0 (0.0%) |
| $150,000 or more | 35 (36.8%) | 34 (20.5%) |
| Total | 95 (100.0%) | 166 (100.0%) |
Property Value to Household Income Ratio in Pine Brook Hill
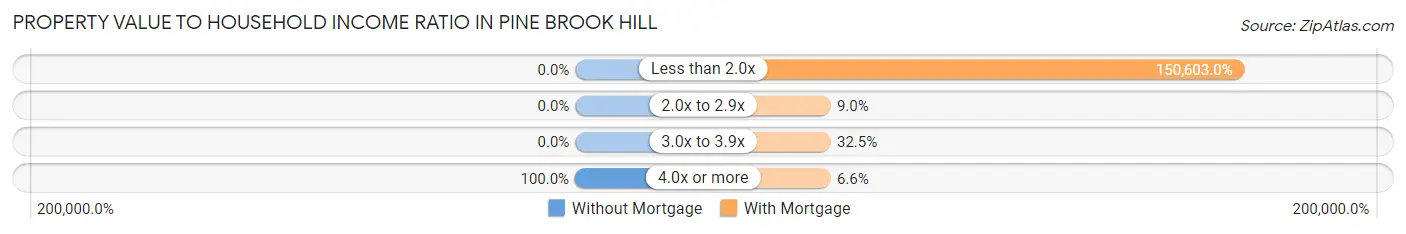
| Value-to-Income Ratio | Without Mortgage | With Mortgage |
| Less than 2.0x | 0 (0.0%) | 250,001 (150,603.0%) |
| 2.0x to 2.9x | 0 (0.0%) | 15 (9.0%) |
| 3.0x to 3.9x | 0 (0.0%) | 54 (32.5%) |
| 4.0x or more | 95 (100.0%) | 11 (6.6%) |
| Total | 95 (100.0%) | 166 (100.0%) |
Real Estate Taxes by Mortgage Status in Pine Brook Hill
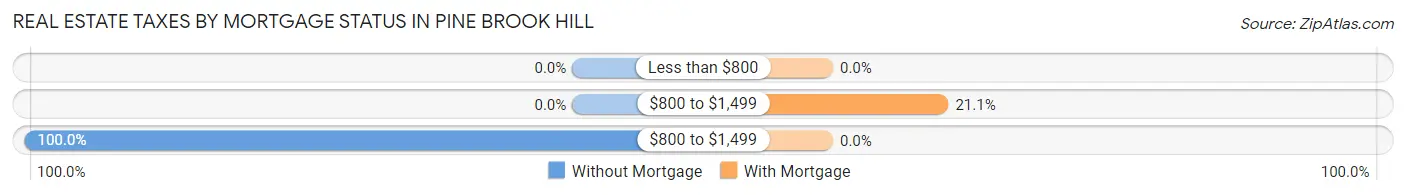
| Property Taxes | Without Mortgage | With Mortgage |
| Less than $800 | 0 (0.0%) | 0 (0.0%) |
| $800 to $1,499 | 0 (0.0%) | 35 (21.1%) |
| $800 to $1,499 | 95 (100.0%) | 0 (0.0%) |
| Total | 95 (100.0%) | 166 (100.0%) |
Health & Disability in Pine Brook Hill
Health Insurance Coverage by Age in Pine Brook Hill
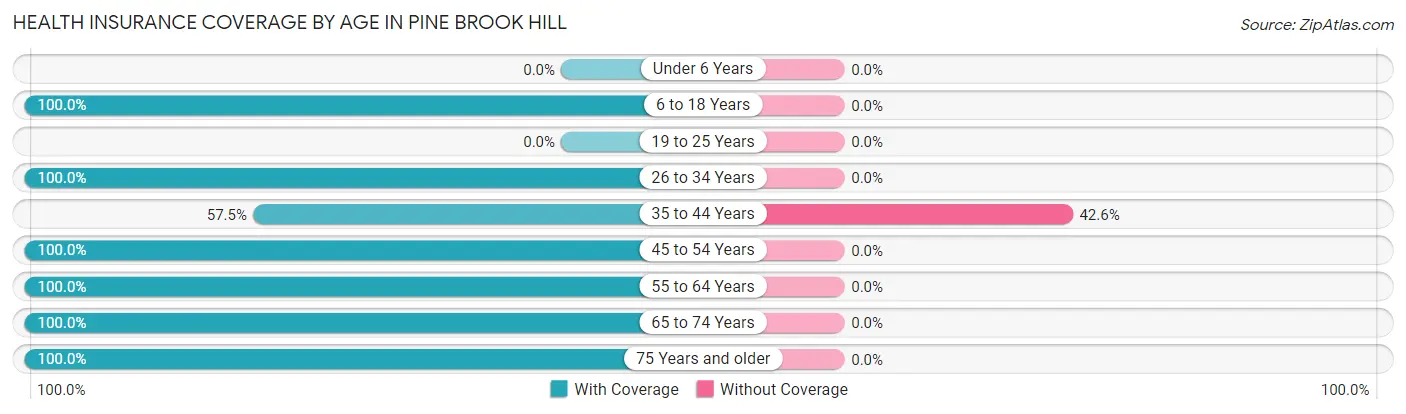
| Age Bracket | With Coverage | Without Coverage |
| Under 6 Years | 0 (0.0%) | 0 (0.0%) |
| 6 to 18 Years | 51 (100.0%) | 0 (0.0%) |
| 19 to 25 Years | 0 (0.0%) | 0 (0.0%) |
| 26 to 34 Years | 37 (100.0%) | 0 (0.0%) |
| 35 to 44 Years | 27 (57.5%) | 20 (42.5%) |
| 45 to 54 Years | 77 (100.0%) | 0 (0.0%) |
| 55 to 64 Years | 164 (100.0%) | 0 (0.0%) |
| 65 to 74 Years | 83 (100.0%) | 0 (0.0%) |
| 75 Years and older | 62 (100.0%) | 0 (0.0%) |
| Total | 501 (96.2%) | 20 (3.8%) |
Health Insurance Coverage by Citizenship Status in Pine Brook Hill

| Citizenship Status | With Coverage | Without Coverage |
| Native Born | 0 (0.0%) | 0 (0.0%) |
| Foreign Born, Citizen | 51 (100.0%) | 0 (0.0%) |
| Foreign Born, not a Citizen | 0 (0.0%) | 0 (0.0%) |
Health Insurance Coverage by Household Income in Pine Brook Hill
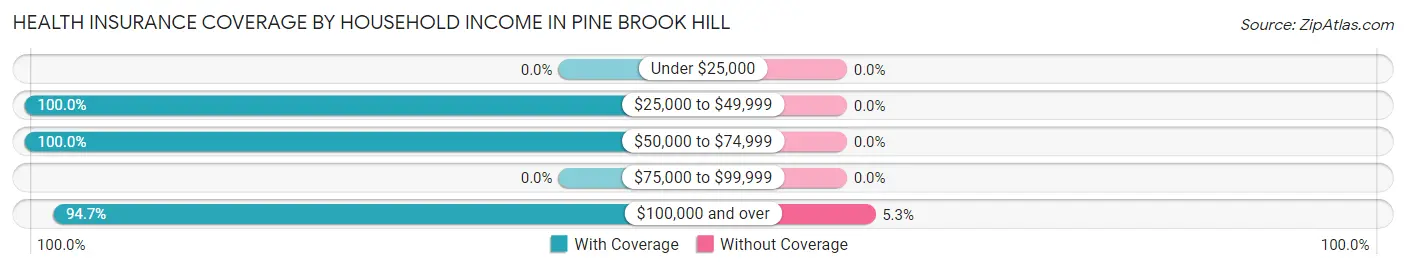
| Household Income | With Coverage | Without Coverage |
| Under $25,000 | 0 (0.0%) | 0 (0.0%) |
| $25,000 to $49,999 | 72 (100.0%) | 0 (0.0%) |
| $50,000 to $74,999 | 73 (100.0%) | 0 (0.0%) |
| $75,000 to $99,999 | 0 (0.0%) | 0 (0.0%) |
| $100,000 and over | 356 (94.7%) | 20 (5.3%) |
Public vs Private Health Insurance Coverage by Age in Pine Brook Hill
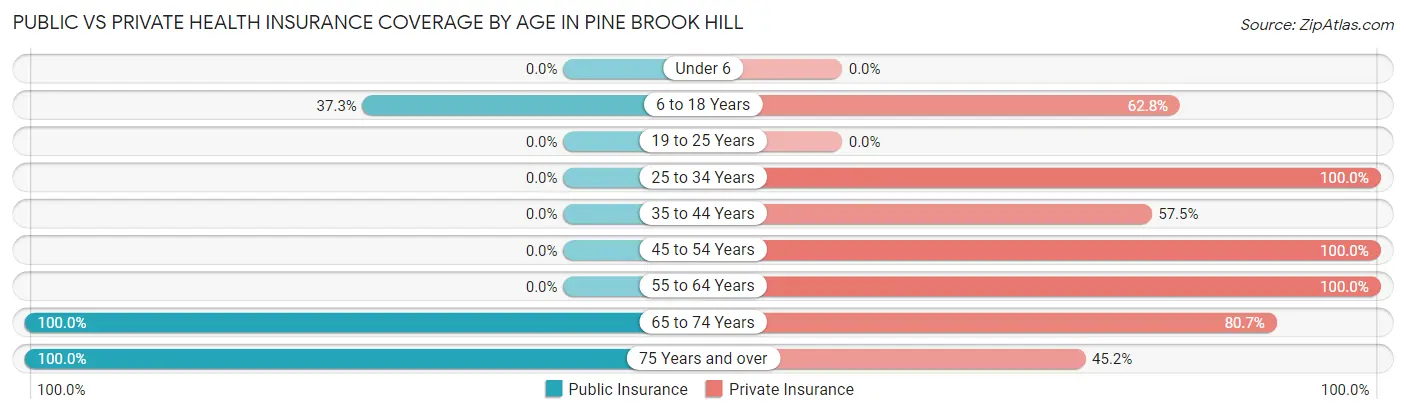
| Age Bracket | Public Insurance | Private Insurance |
| Under 6 | 0 (0.0%) | 0 (0.0%) |
| 6 to 18 Years | 19 (37.2%) | 32 (62.7%) |
| 19 to 25 Years | 0 (0.0%) | 0 (0.0%) |
| 25 to 34 Years | 0 (0.0%) | 37 (100.0%) |
| 35 to 44 Years | 0 (0.0%) | 27 (57.5%) |
| 45 to 54 Years | 0 (0.0%) | 77 (100.0%) |
| 55 to 64 Years | 0 (0.0%) | 164 (100.0%) |
| 65 to 74 Years | 83 (100.0%) | 67 (80.7%) |
| 75 Years and over | 62 (100.0%) | 28 (45.2%) |
| Total | 164 (31.5%) | 432 (82.9%) |
Disability Status by Sex by Age in Pine Brook Hill
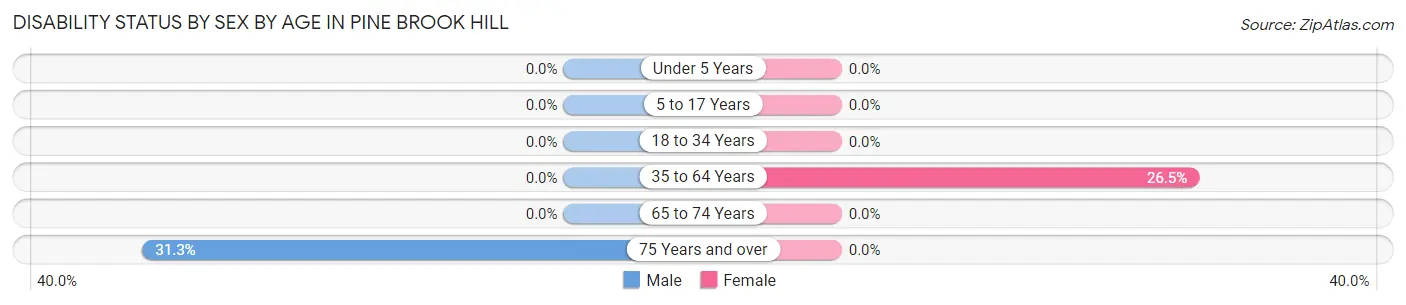
| Age Bracket | Male | Female |
| Under 5 Years | 0 (0.0%) | 0 (0.0%) |
| 5 to 17 Years | 0 (0.0%) | 0 (0.0%) |
| 18 to 34 Years | 0 (0.0%) | 0 (0.0%) |
| 35 to 64 Years | 0 (0.0%) | 35 (26.5%) |
| 65 to 74 Years | 0 (0.0%) | 0 (0.0%) |
| 75 Years and over | 15 (31.2%) | 0 (0.0%) |
Disability Class by Sex by Age in Pine Brook Hill
Disability Class: Hearing Difficulty
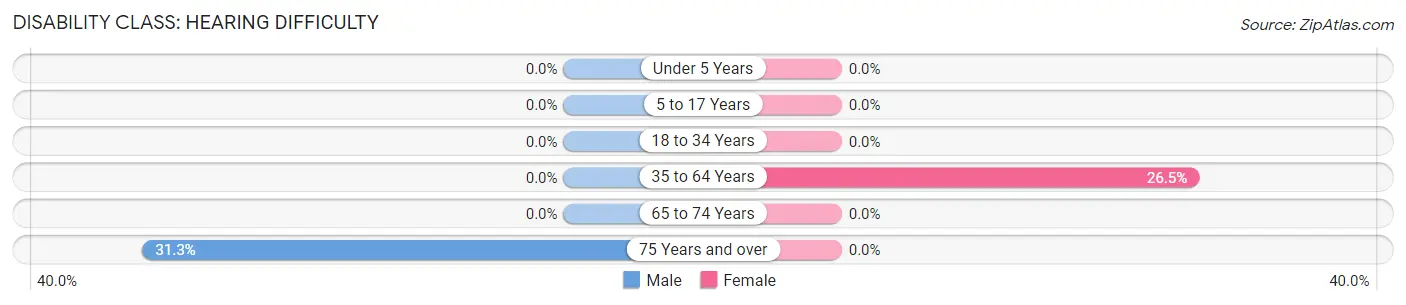
| Age Bracket | Male | Female |
| Under 5 Years | 0 (0.0%) | 0 (0.0%) |
| 5 to 17 Years | 0 (0.0%) | 0 (0.0%) |
| 18 to 34 Years | 0 (0.0%) | 0 (0.0%) |
| 35 to 64 Years | 0 (0.0%) | 35 (26.5%) |
| 65 to 74 Years | 0 (0.0%) | 0 (0.0%) |
| 75 Years and over | 15 (31.2%) | 0 (0.0%) |
Disability Class: Vision Difficulty
| Age Bracket | Male | Female |
| Under 5 Years | 0 (0.0%) | 0 (0.0%) |
| 5 to 17 Years | 0 (0.0%) | 0 (0.0%) |
| 18 to 34 Years | 0 (0.0%) | 0 (0.0%) |
| 35 to 64 Years | 0 (0.0%) | 0 (0.0%) |
| 65 to 74 Years | 0 (0.0%) | 0 (0.0%) |
| 75 Years and over | 0 (0.0%) | 0 (0.0%) |
Disability Class: Cognitive Difficulty
| Age Bracket | Male | Female |
| 5 to 17 Years | 0 (0.0%) | 0 (0.0%) |
| 18 to 34 Years | 0 (0.0%) | 0 (0.0%) |
| 35 to 64 Years | 0 (0.0%) | 0 (0.0%) |
| 65 to 74 Years | 0 (0.0%) | 0 (0.0%) |
| 75 Years and over | 0 (0.0%) | 0 (0.0%) |
Disability Class: Ambulatory Difficulty
| Age Bracket | Male | Female |
| 5 to 17 Years | 0 (0.0%) | 0 (0.0%) |
| 18 to 34 Years | 0 (0.0%) | 0 (0.0%) |
| 35 to 64 Years | 0 (0.0%) | 0 (0.0%) |
| 65 to 74 Years | 0 (0.0%) | 0 (0.0%) |
| 75 Years and over | 0 (0.0%) | 0 (0.0%) |
Disability Class: Self-Care Difficulty
| Age Bracket | Male | Female |
| 5 to 17 Years | 0 (0.0%) | 0 (0.0%) |
| 18 to 34 Years | 0 (0.0%) | 0 (0.0%) |
| 35 to 64 Years | 0 (0.0%) | 0 (0.0%) |
| 65 to 74 Years | 0 (0.0%) | 0 (0.0%) |
| 75 Years and over | 0 (0.0%) | 0 (0.0%) |
Technology Access in Pine Brook Hill
Computing Device Access in Pine Brook Hill
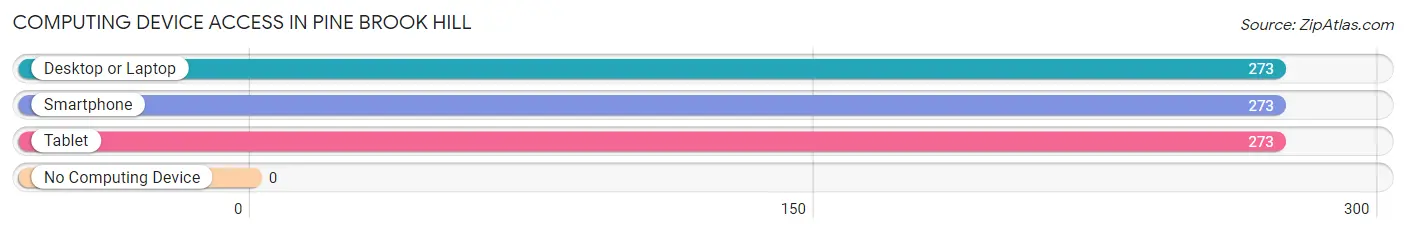
| Device Type | # Households | % Households |
| Desktop or Laptop | 273 | 100.0% |
| Smartphone | 273 | 100.0% |
| Tablet | 273 | 100.0% |
| No Computing Device | 0 | 0.0% |
| Total | 273 | 100.0% |
Internet Access in Pine Brook Hill
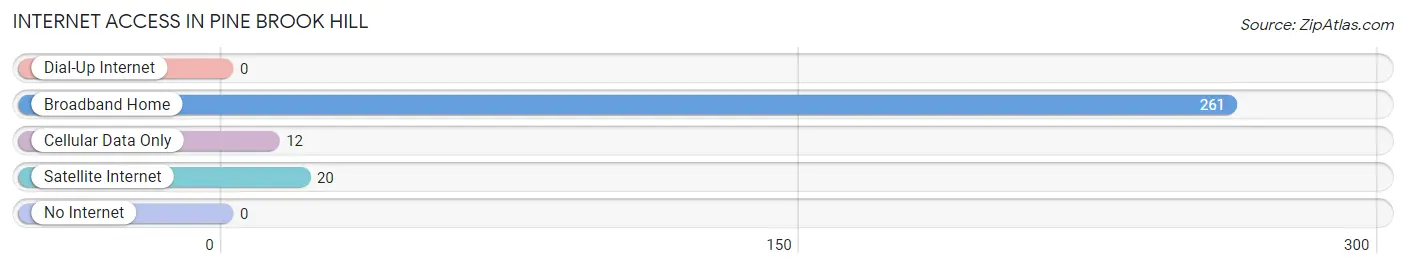
| Internet Type | # Households | % Households |
| Dial-Up Internet | 0 | 0.0% |
| Broadband Home | 261 | 95.6% |
| Cellular Data Only | 12 | 4.4% |
| Satellite Internet | 20 | 7.3% |
| No Internet | 0 | 0.0% |
| Total | 273 | 100.0% |
Pine Brook Hill Summary
Pine Brook Hill is a small town located in the foothills of the Rocky Mountains in Colorado. It is situated in the northern part of the state, about 25 miles northwest of Denver. The town has a population of approximately 1,500 people and is known for its rural charm and scenic beauty.
History
Pine Brook Hill was founded in 1876 by a group of settlers from the Midwest. The town was named after the nearby Pine Brook Creek, which was named for the abundance of pine trees in the area. The settlers were attracted to the area by its rich soil and abundant wildlife.
The town quickly grew and by the early 1900s, it had become a thriving agricultural community. The town was home to several farms, a general store, a post office, a school, and a church. The town also had a small sawmill and a blacksmith shop.
In the 1920s, the town began to experience a decline in population as many of the younger residents moved away to pursue opportunities in larger cities. However, the town was able to maintain its rural charm and scenic beauty.
Geography
Pine Brook Hill is located in the foothills of the Rocky Mountains in northern Colorado. The town is situated at an elevation of 6,500 feet and is surrounded by rolling hills and lush forests. The town is located about 25 miles northwest of Denver and is accessible by car or bus.
The town is located in a temperate climate zone and experiences mild winters and warm summers. The average annual temperature is around 50 degrees Fahrenheit. The town receives an average of 18 inches of precipitation per year, most of which falls in the form of snow.
Economy
Pine Brook Hill is a small, rural town with a limited economy. The town is primarily supported by agriculture and tourism. The town is home to several farms, which produce a variety of crops, including hay, corn, wheat, and oats. The town also has a small sawmill and a blacksmith shop.
The town is also a popular tourist destination due to its scenic beauty and rural charm. The town is home to several bed and breakfasts, as well as a few restaurants and shops. The town also hosts several festivals and events throughout the year, including the annual Pine Brook Hill Harvest Festival.
Demographics
As of the 2010 census, the population of Pine Brook Hill was 1,500. The town is predominantly white, with a small Hispanic population. The median household income is $45,000 and the median home value is $200,000. The town has a low unemployment rate and a high rate of homeownership.
Conclusion
Pine Brook Hill is a small, rural town located in the foothills of the Rocky Mountains in northern Colorado. The town has a population of approximately 1,500 people and is known for its rural charm and scenic beauty. The town is primarily supported by agriculture and tourism and is a popular tourist destination due to its scenic beauty and rural charm. The town is predominantly white, with a small Hispanic population, and has a median household income of $45,000 and a median home value of $200,000.
Common Questions
What is Per Capita Income in Pine Brook Hill?
Per Capita income in Pine Brook Hill is $115,599.
What is Inequality or Gini Index in Pine Brook Hill?
Inequality or Gini Index in Pine Brook Hill is 0.48.
What is the Total Population of Pine Brook Hill?
Total Population of Pine Brook Hill is 521.
What is the Total Male Population of Pine Brook Hill?
Total Male Population of Pine Brook Hill is 282.
What is the Total Female Population of Pine Brook Hill?
Total Female Population of Pine Brook Hill is 239.
What is the Ratio of Males per 100 Females in Pine Brook Hill?
There are 117.99 Males per 100 Females in Pine Brook Hill.
What is the Ratio of Females per 100 Males in Pine Brook Hill?
There are 84.75 Females per 100 Males in Pine Brook Hill.
What is the Median Population Age in Pine Brook Hill?
Median Population Age in Pine Brook Hill is 57.6 Years.
What is the Average Family Size in Pine Brook Hill
Average Family Size in Pine Brook Hill is 2.4 People.
What is the Average Household Size in Pine Brook Hill
Average Household Size in Pine Brook Hill is 1.9 People.
How Large is the Labor Force in Pine Brook Hill?
There are 277 People in the Labor Forcein in Pine Brook Hill.
What is the Percentage of People in the Labor Force in Pine Brook Hill?
56.3% of People are in the Labor Force in Pine Brook Hill.