Fairmount, CO Map & Demographics
Fairmount Map
Fairmount Overview
$68,135
PER CAPITA INCOME
$169,268
AVG FAMILY INCOME
$153,600
AVG HOUSEHOLD INCOME
43.2%
WAGE / INCOME GAP [ % ]
56.8¢/ $1
WAGE / INCOME GAP [ $ ]
0.39
INEQUALITY / GINI INDEX
10,398
TOTAL POPULATION
4,742
MALE POPULATION
5,656
FEMALE POPULATION
83.84
MALES / 100 FEMALES
119.27
FEMALES / 100 MALES
42.5
MEDIAN AGE
3.1
AVG FAMILY SIZE
2.8
AVG HOUSEHOLD SIZE
5,664
LABOR FORCE [ PEOPLE ]
67.5%
PERCENT IN LABOR FORCE
2.4%
UNEMPLOYMENT RATE
Income in Fairmount
Income Overview in Fairmount
Per Capita Income in Fairmount is $68,135, while median incomes of families and households are $169,268 and $153,600 respectively.
| Characteristic | Number | Measure |
| Per Capita Income | 10,398 | $68,135 |
| Median Family Income | 2,952 | $169,268 |
| Mean Family Income | 2,952 | $207,502 |
| Median Household Income | 3,718 | $153,600 |
| Mean Household Income | 3,718 | $186,889 |
| Income Deficit | 2,952 | $0 |
| Wage / Income Gap (%) | 10,398 | 43.21% |
| Wage / Income Gap ($) | 10,398 | 56.79¢ per $1 |
| Gini / Inequality Index | 10,398 | 0.39 |
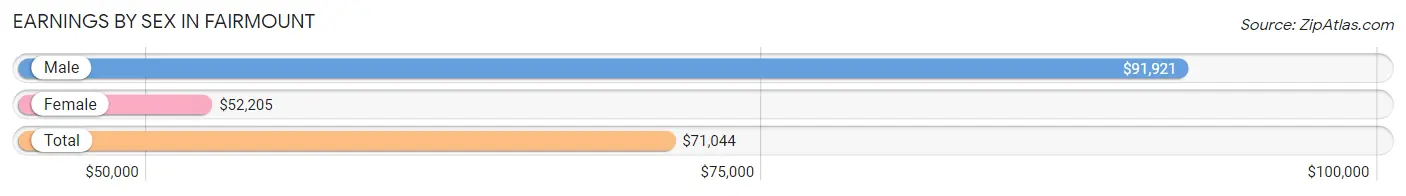
Earnings by Sex in Fairmount
Average Earnings in Fairmount are $71,044, $91,921 for men and $52,205 for women, a difference of 43.2%.
| Sex | Number | Average Earnings |
| Male | 3,128 (52.1%) | $91,921 |
| Female | 2,871 (47.9%) | $52,205 |
| Total | 5,999 (100.0%) | $71,044 |
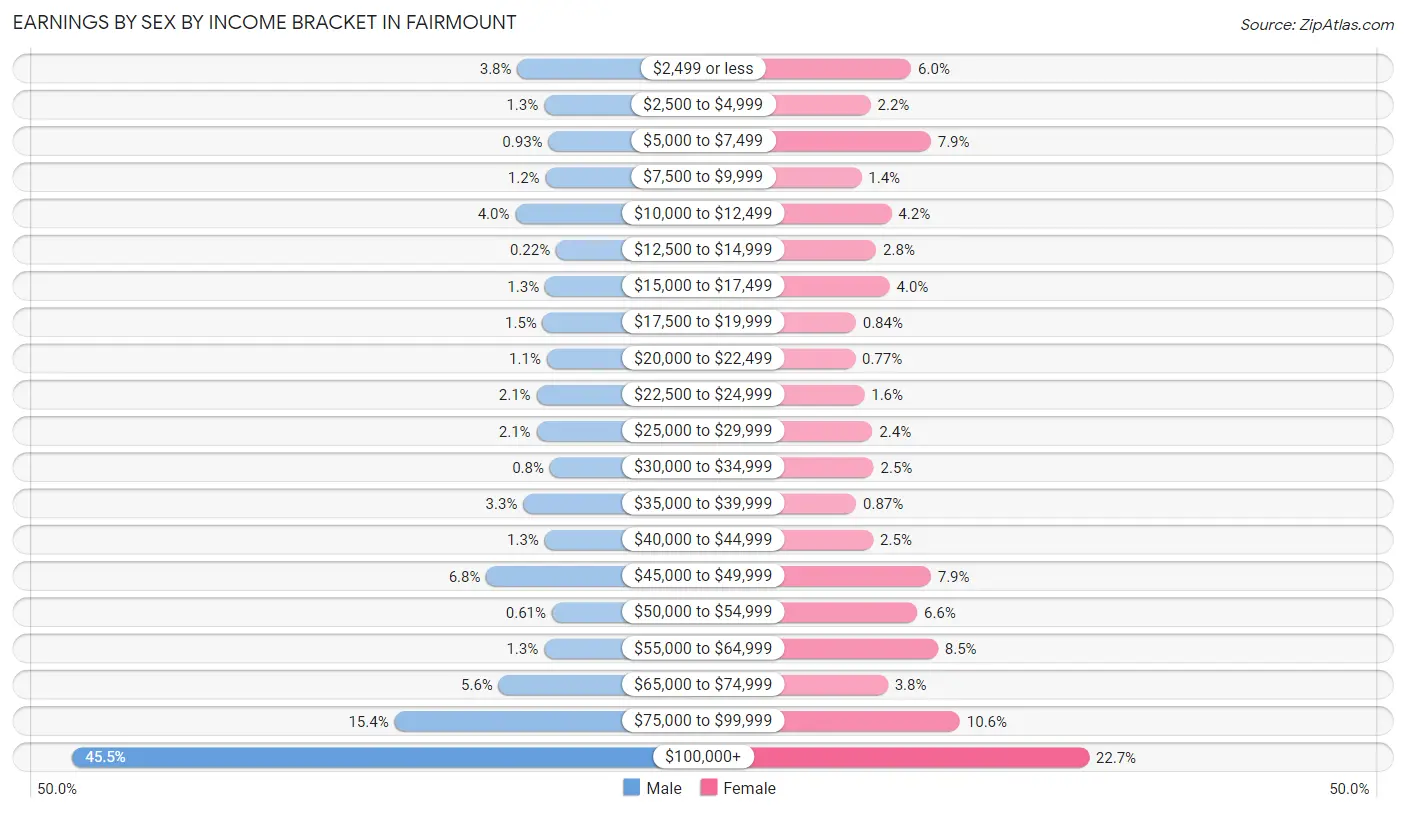
Earnings by Sex by Income Bracket in Fairmount
The most common earnings brackets in Fairmount are $100,000+ for men (1,424 | 45.5%) and $100,000+ for women (651 | 22.7%).
| Income | Male | Female |
| $2,499 or less | 120 (3.8%) | 173 (6.0%) |
| $2,500 to $4,999 | 42 (1.3%) | 64 (2.2%) |
| $5,000 to $7,499 | 29 (0.9%) | 226 (7.9%) |
| $7,500 to $9,999 | 38 (1.2%) | 39 (1.4%) |
| $10,000 to $12,499 | 126 (4.0%) | 120 (4.2%) |
| $12,500 to $14,999 | 7 (0.2%) | 79 (2.8%) |
| $15,000 to $17,499 | 39 (1.3%) | 115 (4.0%) |
| $17,500 to $19,999 | 46 (1.5%) | 24 (0.8%) |
| $20,000 to $22,499 | 34 (1.1%) | 22 (0.8%) |
| $22,500 to $24,999 | 64 (2.1%) | 47 (1.6%) |
| $25,000 to $29,999 | 64 (2.1%) | 69 (2.4%) |
| $30,000 to $34,999 | 25 (0.8%) | 72 (2.5%) |
| $35,000 to $39,999 | 103 (3.3%) | 25 (0.9%) |
| $40,000 to $44,999 | 40 (1.3%) | 71 (2.5%) |
| $45,000 to $49,999 | 211 (6.8%) | 226 (7.9%) |
| $50,000 to $54,999 | 19 (0.6%) | 189 (6.6%) |
| $55,000 to $64,999 | 42 (1.3%) | 245 (8.5%) |
| $65,000 to $74,999 | 175 (5.6%) | 110 (3.8%) |
| $75,000 to $99,999 | 480 (15.3%) | 304 (10.6%) |
| $100,000+ | 1,424 (45.5%) | 651 (22.7%) |
| Total | 3,128 (100.0%) | 2,871 (100.0%) |
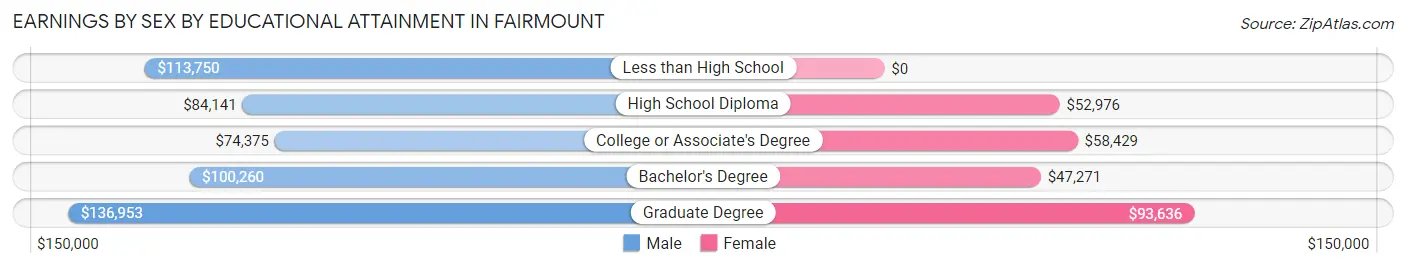
Earnings by Sex by Educational Attainment in Fairmount
Average earnings in Fairmount are $101,080 for men and $58,286 for women, a difference of 42.3%. Men with an educational attainment of graduate degree enjoy the highest average annual earnings of $136,953, while those with college or associate's degree education earn the least with $74,375. Women with an educational attainment of graduate degree earn the most with the average annual earnings of $93,636, while those with bachelor's degree education have the smallest earnings of $47,271.
| Educational Attainment | Male Income | Female Income |
| Less than High School | $113,750 | $0 |
| High School Diploma | $84,141 | $52,976 |
| College or Associate's Degree | $74,375 | $58,429 |
| Bachelor's Degree | $100,260 | $47,271 |
| Graduate Degree | $136,953 | $93,636 |
| Total | $101,080 | $58,286 |
Family Income in Fairmount
Family Income Brackets in Fairmount
According to the Fairmount family income data, there are 1,219 families falling into the $200,000+ income range, which is the most common income bracket and makes up 41.3% of all families. Conversely, the $15,000 to $24,999 income bracket is the least frequent group with only 6 families (0.2%) belonging to this category.
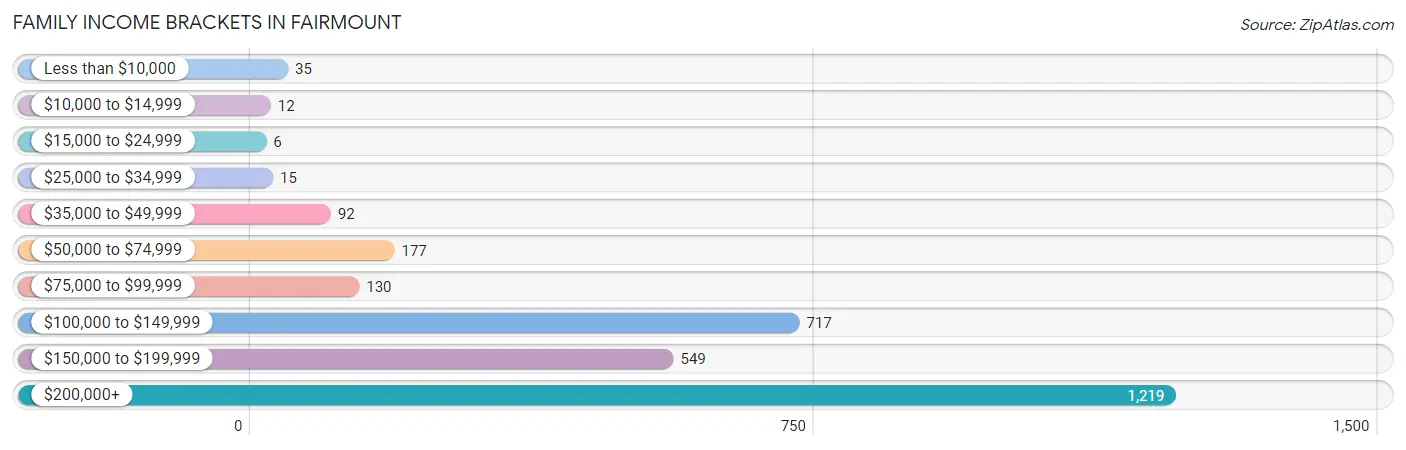
| Income Bracket | # Families | % Families |
| Less than $10,000 | 35 | 1.2% |
| $10,000 to $14,999 | 12 | 0.4% |
| $15,000 to $24,999 | 6 | 0.2% |
| $25,000 to $34,999 | 15 | 0.5% |
| $35,000 to $49,999 | 92 | 3.1% |
| $50,000 to $74,999 | 177 | 6.0% |
| $75,000 to $99,999 | 130 | 4.4% |
| $100,000 to $149,999 | 717 | 24.3% |
| $150,000 to $199,999 | 549 | 18.6% |
| $200,000+ | 1,219 | 41.3% |
Family Income by Famaliy Size in Fairmount
3-person families (554 | 18.8%) account for the highest median family income in Fairmount with $224,868 per family, while 2-person families (1,374 | 46.5%) have the highest median income of $79,540 per family member.
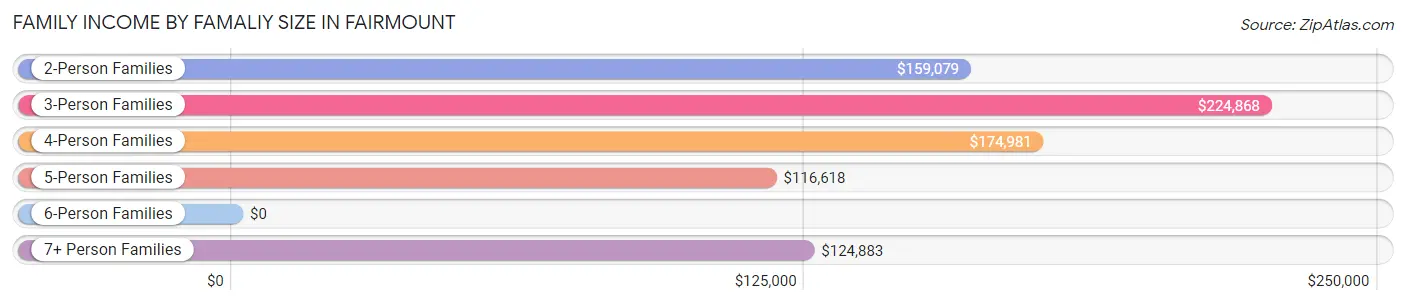
| Income Bracket | # Families | Median Income |
| 2-Person Families | 1,374 (46.5%) | $159,079 |
| 3-Person Families | 554 (18.8%) | $224,868 |
| 4-Person Families | 661 (22.4%) | $174,981 |
| 5-Person Families | 268 (9.1%) | $116,618 |
| 6-Person Families | 34 (1.1%) | $0 |
| 7+ Person Families | 61 (2.1%) | $124,883 |
| Total | 2,952 (100.0%) | $169,268 |
Family Income by Number of Earners in Fairmount
The median family income in Fairmount is $169,268, with families comprising 3+ earners (446) having the highest median family income of $210,119, while families with no earners (373) have the lowest median family income of $103,618, accounting for 15.1% and 12.6% of families, respectively.
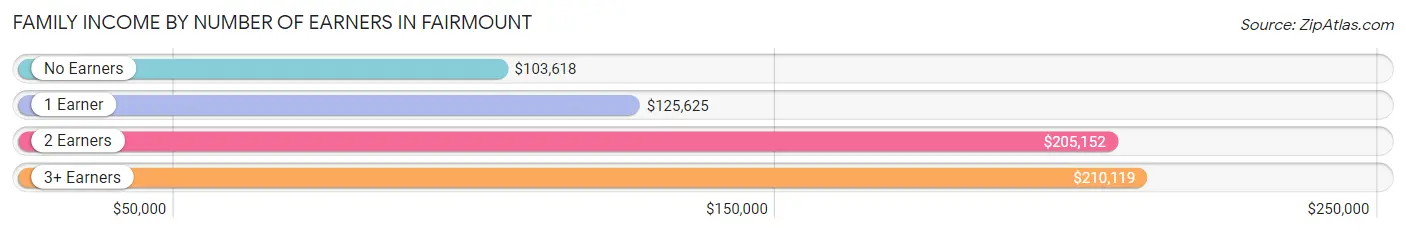
| Number of Earners | # Families | Median Income |
| No Earners | 373 (12.6%) | $103,618 |
| 1 Earner | 693 (23.5%) | $125,625 |
| 2 Earners | 1,440 (48.8%) | $205,152 |
| 3+ Earners | 446 (15.1%) | $210,119 |
| Total | 2,952 (100.0%) | $169,268 |
Household Income in Fairmount
Household Income Brackets in Fairmount
With 1,324 households falling in the category, the $200,000+ income range is the most frequent in Fairmount, accounting for 35.6% of all households. In contrast, only 30 households (0.8%) fall into the $10,000 to $14,999 income bracket, making it the least populous group.
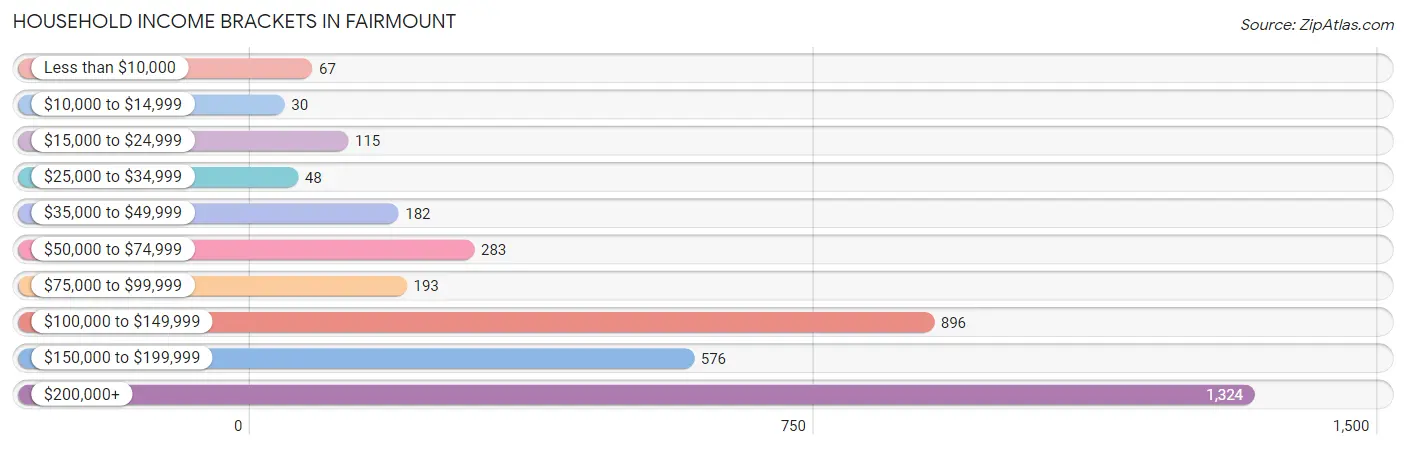
| Income Bracket | # Households | % Households |
| Less than $10,000 | 67 | 1.8% |
| $10,000 to $14,999 | 30 | 0.8% |
| $15,000 to $24,999 | 115 | 3.1% |
| $25,000 to $34,999 | 48 | 1.3% |
| $35,000 to $49,999 | 182 | 4.9% |
| $50,000 to $74,999 | 283 | 7.6% |
| $75,000 to $99,999 | 193 | 5.2% |
| $100,000 to $149,999 | 896 | 24.1% |
| $150,000 to $199,999 | 576 | 15.5% |
| $200,000+ | 1,324 | 35.6% |
Household Income by Householder Age in Fairmount
The median household income in Fairmount is $153,600, with the highest median household income of $178,250 found in the 25 to 44 years age bracket for the primary householder. A total of 1,110 households (29.8%) fall into this category. Meanwhile, the 15 to 24 years age bracket for the primary householder has the lowest median household income of $0, with 30 households (0.8%) in this group.
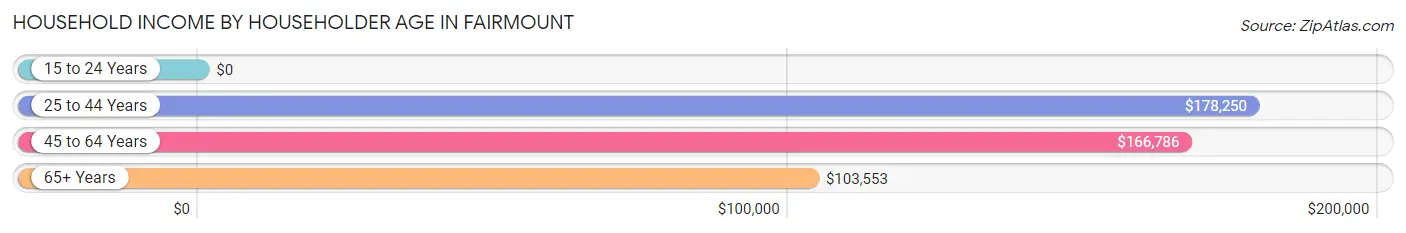
| Income Bracket | # Households | Median Income |
| 15 to 24 Years | 30 (0.8%) | $0 |
| 25 to 44 Years | 1,110 (29.8%) | $178,250 |
| 45 to 64 Years | 1,714 (46.1%) | $166,786 |
| 65+ Years | 864 (23.2%) | $103,553 |
| Total | 3,718 (100.0%) | $153,600 |
Poverty in Fairmount
Income Below Poverty by Sex and Age in Fairmount
With 4.1% poverty level for males and 2.5% for females among the residents of Fairmount, 18 to 24 year old males and 65 to 74 year old females are the most vulnerable to poverty, with 69 males (27.0%) and 28 females (5.3%) in their respective age groups living below the poverty level.
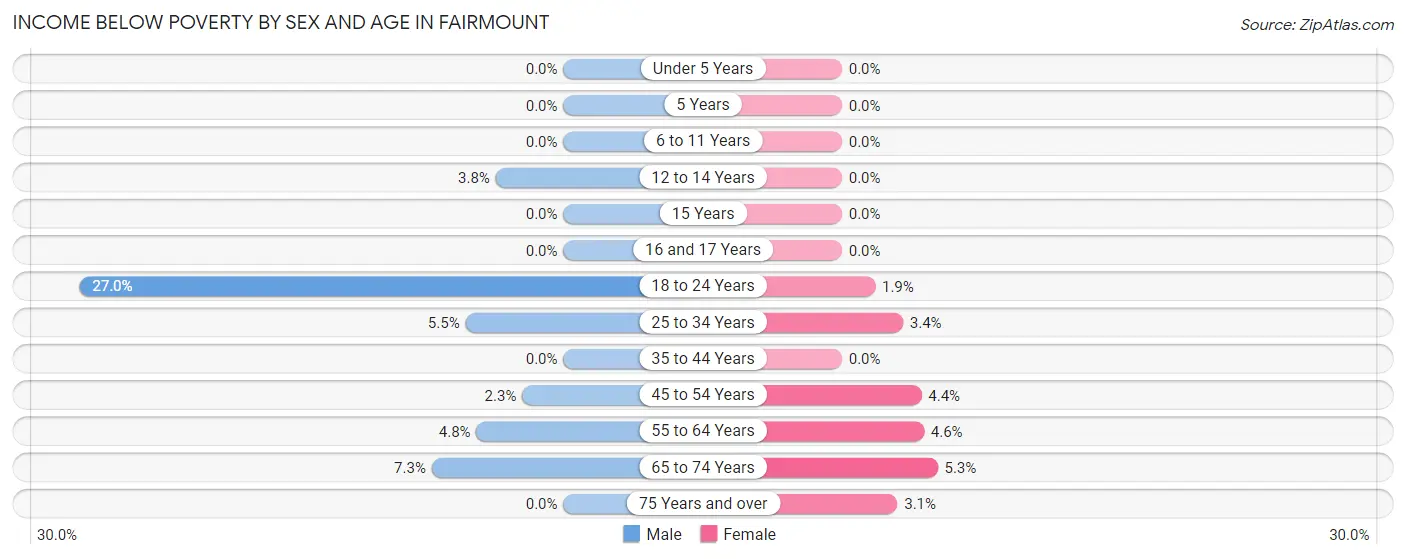
| Age Bracket | Male | Female |
| Under 5 Years | 0 (0.0%) | 0 (0.0%) |
| 5 Years | 0 (0.0%) | 0 (0.0%) |
| 6 to 11 Years | 0 (0.0%) | 0 (0.0%) |
| 12 to 14 Years | 6 (3.8%) | 0 (0.0%) |
| 15 Years | 0 (0.0%) | 0 (0.0%) |
| 16 and 17 Years | 0 (0.0%) | 0 (0.0%) |
| 18 to 24 Years | 69 (27.0%) | 8 (1.8%) |
| 25 to 34 Years | 24 (5.4%) | 15 (3.4%) |
| 35 to 44 Years | 0 (0.0%) | 0 (0.0%) |
| 45 to 54 Years | 19 (2.3%) | 34 (4.4%) |
| 55 to 64 Years | 42 (4.8%) | 44 (4.6%) |
| 65 to 74 Years | 33 (7.3%) | 28 (5.3%) |
| 75 Years and over | 0 (0.0%) | 11 (3.1%) |
| Total | 193 (4.1%) | 140 (2.5%) |
Income Above Poverty by Sex and Age in Fairmount
According to the poverty statistics in Fairmount, males aged under 5 years and females aged under 5 years are the age groups that are most secure financially, with 100.0% of males and 100.0% of females in these age groups living above the poverty line.
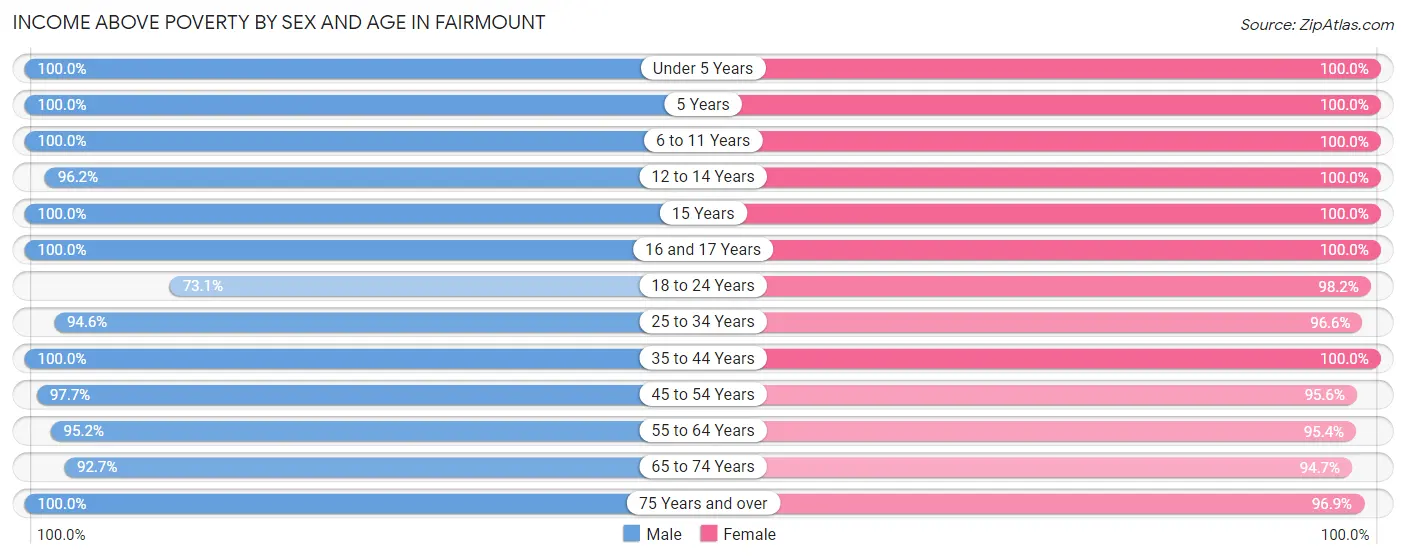
| Age Bracket | Male | Female |
| Under 5 Years | 221 (100.0%) | 412 (100.0%) |
| 5 Years | 94 (100.0%) | 48 (100.0%) |
| 6 to 11 Years | 275 (100.0%) | 391 (100.0%) |
| 12 to 14 Years | 153 (96.2%) | 253 (100.0%) |
| 15 Years | 57 (100.0%) | 97 (100.0%) |
| 16 and 17 Years | 116 (100.0%) | 241 (100.0%) |
| 18 to 24 Years | 187 (73.1%) | 424 (98.2%) |
| 25 to 34 Years | 416 (94.6%) | 426 (96.6%) |
| 35 to 44 Years | 758 (100.0%) | 728 (100.0%) |
| 45 to 54 Years | 812 (97.7%) | 734 (95.6%) |
| 55 to 64 Years | 826 (95.2%) | 919 (95.4%) |
| 65 to 74 Years | 417 (92.7%) | 497 (94.7%) |
| 75 Years and over | 217 (100.0%) | 345 (96.9%) |
| Total | 4,549 (95.9%) | 5,515 (97.5%) |
Income Below Poverty Among Married-Couple Families in Fairmount
The poverty statistics for married-couple families in Fairmount show that 1.4% or 37 of the total 2,666 families live below the poverty line. Families with no children have the highest poverty rate of 2.4%, comprising of 37 families. On the other hand, families with 1 or 2 children have the lowest poverty rate of 0.0%, which includes 0 families.
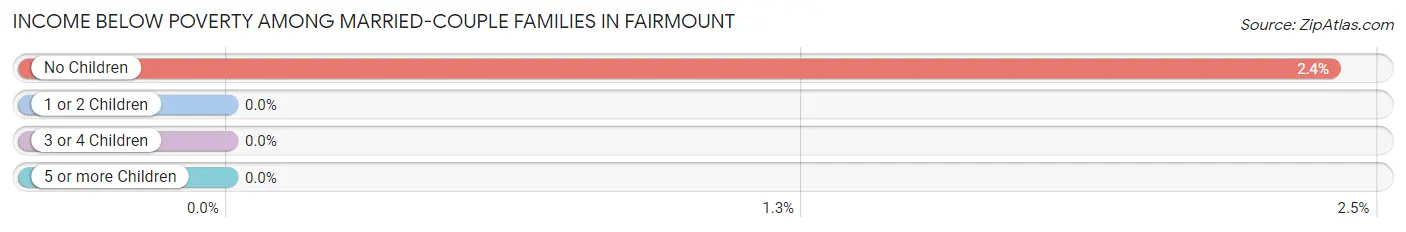
| Children | Above Poverty | Below Poverty |
| No Children | 1,505 (97.6%) | 37 (2.4%) |
| 1 or 2 Children | 906 (100.0%) | 0 (0.0%) |
| 3 or 4 Children | 186 (100.0%) | 0 (0.0%) |
| 5 or more Children | 32 (100.0%) | 0 (0.0%) |
| Total | 2,629 (98.6%) | 37 (1.4%) |
Income Below Poverty Among Single-Parent Households in Fairmount
According to the poverty data in Fairmount, 6.9% or 7 single-father households and 5.9% or 11 single-mother households are living below the poverty line. Among single-father households, those with 1 or 2 children have the highest poverty rate, with 7 households (13.2%) experiencing poverty. Likewise, among single-mother households, those with no children have the highest poverty rate, with 11 households (9.8%) falling below the poverty line.
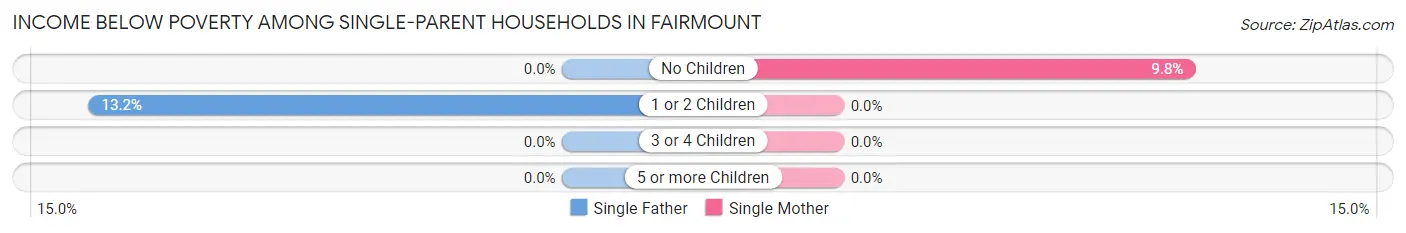
| Children | Single Father | Single Mother |
| No Children | 0 (0.0%) | 11 (9.8%) |
| 1 or 2 Children | 7 (13.2%) | 0 (0.0%) |
| 3 or 4 Children | 0 (0.0%) | 0 (0.0%) |
| 5 or more Children | 0 (0.0%) | 0 (0.0%) |
| Total | 7 (6.9%) | 11 (5.9%) |
Income Below Poverty Among Married-Couple vs Single-Parent Households in Fairmount
The poverty data for Fairmount shows that 37 of the married-couple family households (1.4%) and 18 of the single-parent households (6.3%) are living below the poverty level. Within the married-couple family households, those with no children have the highest poverty rate, with 37 households (2.4%) falling below the poverty line. Among the single-parent households, those with no children have the highest poverty rate, with 11 household (6.9%) living below poverty.
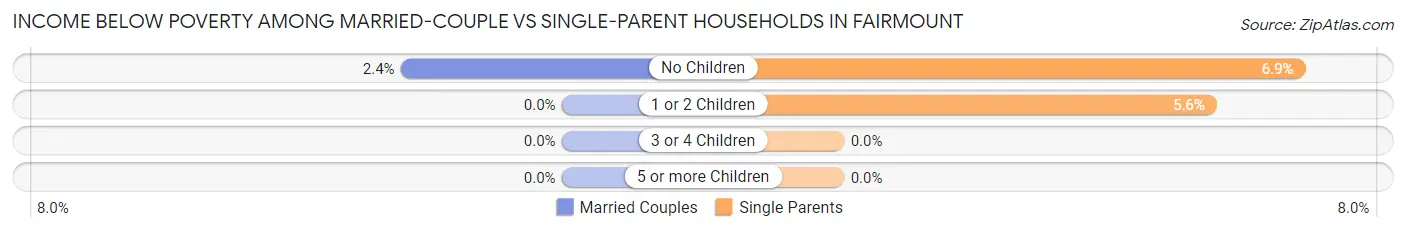
| Children | Married-Couple Families | Single-Parent Households |
| No Children | 37 (2.4%) | 11 (6.9%) |
| 1 or 2 Children | 0 (0.0%) | 7 (5.6%) |
| 3 or 4 Children | 0 (0.0%) | 0 (0.0%) |
| 5 or more Children | 0 (0.0%) | 0 (0.0%) |
| Total | 37 (1.4%) | 18 (6.3%) |
Race in Fairmount
The most populous races in Fairmount are White / Caucasian (9,669 | 93.0%), Hispanic or Latino (601 | 5.8%), and Two or more Races (363 | 3.5%).
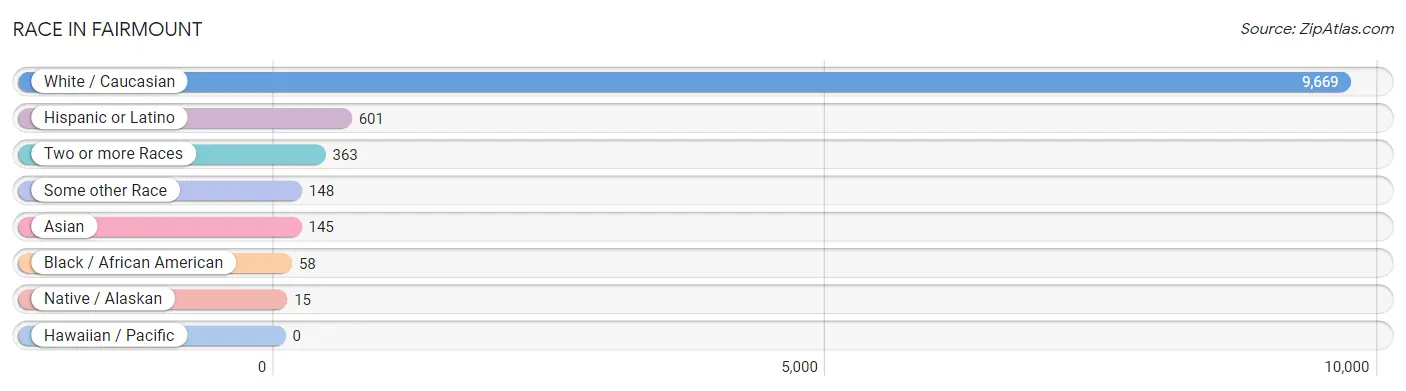
| Race | # Population | % Population |
| Asian | 145 | 1.4% |
| Black / African American | 58 | 0.6% |
| Hawaiian / Pacific | 0 | 0.0% |
| Hispanic or Latino | 601 | 5.8% |
| Native / Alaskan | 15 | 0.1% |
| White / Caucasian | 9,669 | 93.0% |
| Two or more Races | 363 | 3.5% |
| Some other Race | 148 | 1.4% |
| Total | 10,398 | 100.0% |
Ancestry in Fairmount
The most populous ancestries reported in Fairmount are German (2,261 | 21.7%), English (1,933 | 18.6%), Irish (939 | 9.0%), Italian (461 | 4.4%), and American (406 | 3.9%), together accounting for 57.7% of all Fairmount residents.
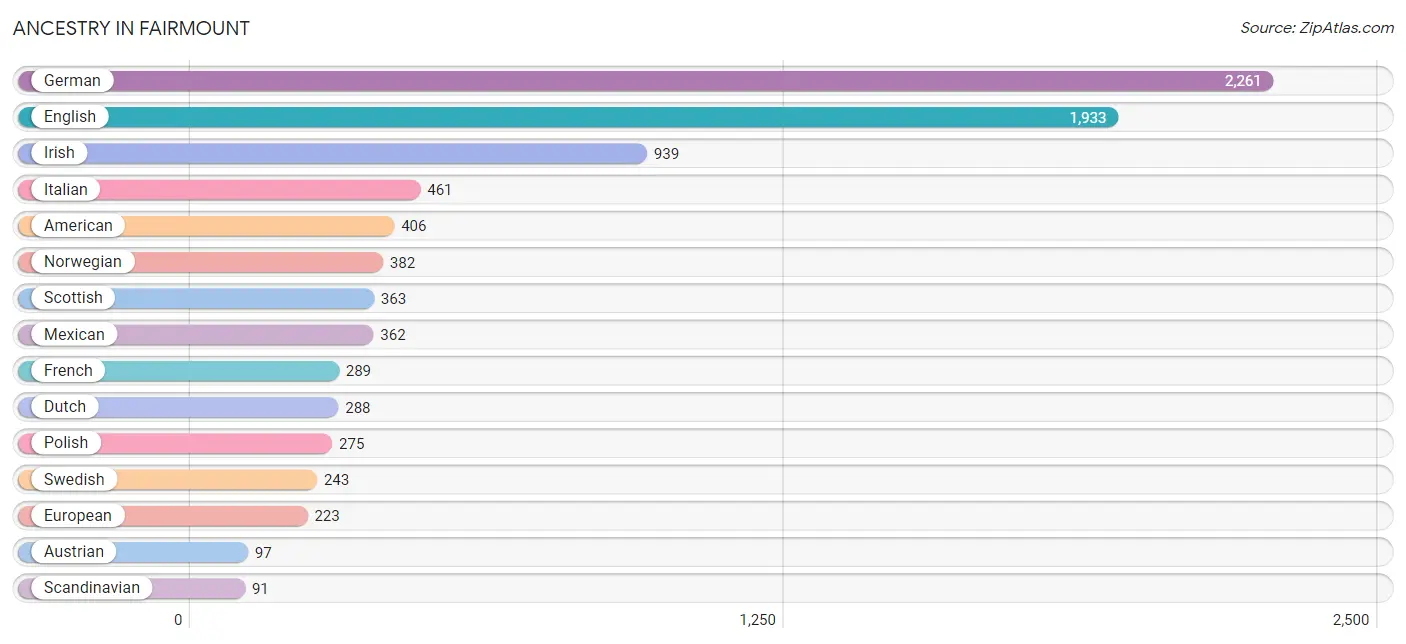
| Ancestry | # Population | % Population |
| American | 406 | 3.9% |
| Arab | 76 | 0.7% |
| Australian | 12 | 0.1% |
| Austrian | 97 | 0.9% |
| Belgian | 25 | 0.2% |
| Bhutanese | 12 | 0.1% |
| British | 35 | 0.3% |
| Bulgarian | 19 | 0.2% |
| Burmese | 43 | 0.4% |
| Canadian | 8 | 0.1% |
| Central American | 22 | 0.2% |
| Cherokee | 6 | 0.1% |
| Chilean | 21 | 0.2% |
| Choctaw | 25 | 0.2% |
| Colombian | 39 | 0.4% |
| Costa Rican | 22 | 0.2% |
| Croatian | 26 | 0.3% |
| Cuban | 9 | 0.1% |
| Czech | 57 | 0.5% |
| Danish | 71 | 0.7% |
| Dominican | 1 | 0.0% |
| Dutch | 288 | 2.8% |
| Eastern European | 37 | 0.4% |
| English | 1,933 | 18.6% |
| European | 223 | 2.1% |
| Filipino | 29 | 0.3% |
| French | 289 | 2.8% |
| French Canadian | 55 | 0.5% |
| German | 2,261 | 21.7% |
| Greek | 69 | 0.7% |
| Hungarian | 30 | 0.3% |
| Indian (Asian) | 72 | 0.7% |
| Irish | 939 | 9.0% |
| Italian | 461 | 4.4% |
| Lithuanian | 9 | 0.1% |
| Luxembourger | 6 | 0.1% |
| Mexican | 362 | 3.5% |
| Northern European | 14 | 0.1% |
| Norwegian | 382 | 3.7% |
| Peruvian | 28 | 0.3% |
| Polish | 275 | 2.6% |
| Portuguese | 40 | 0.4% |
| Puerto Rican | 9 | 0.1% |
| Romanian | 8 | 0.1% |
| Russian | 46 | 0.4% |
| Scandinavian | 91 | 0.9% |
| Scotch-Irish | 30 | 0.3% |
| Scottish | 363 | 3.5% |
| Slovak | 16 | 0.2% |
| Slovene | 28 | 0.3% |
| South American | 88 | 0.9% |
| Spaniard | 86 | 0.8% |
| Spanish | 7 | 0.1% |
| Sri Lankan | 40 | 0.4% |
| Swedish | 243 | 2.3% |
| Swiss | 74 | 0.7% |
| Syrian | 55 | 0.5% |
| Thai | 12 | 0.1% |
| Ukrainian | 60 | 0.6% |
| Welsh | 45 | 0.4% | View All 60 Rows |
Immigrants in Fairmount
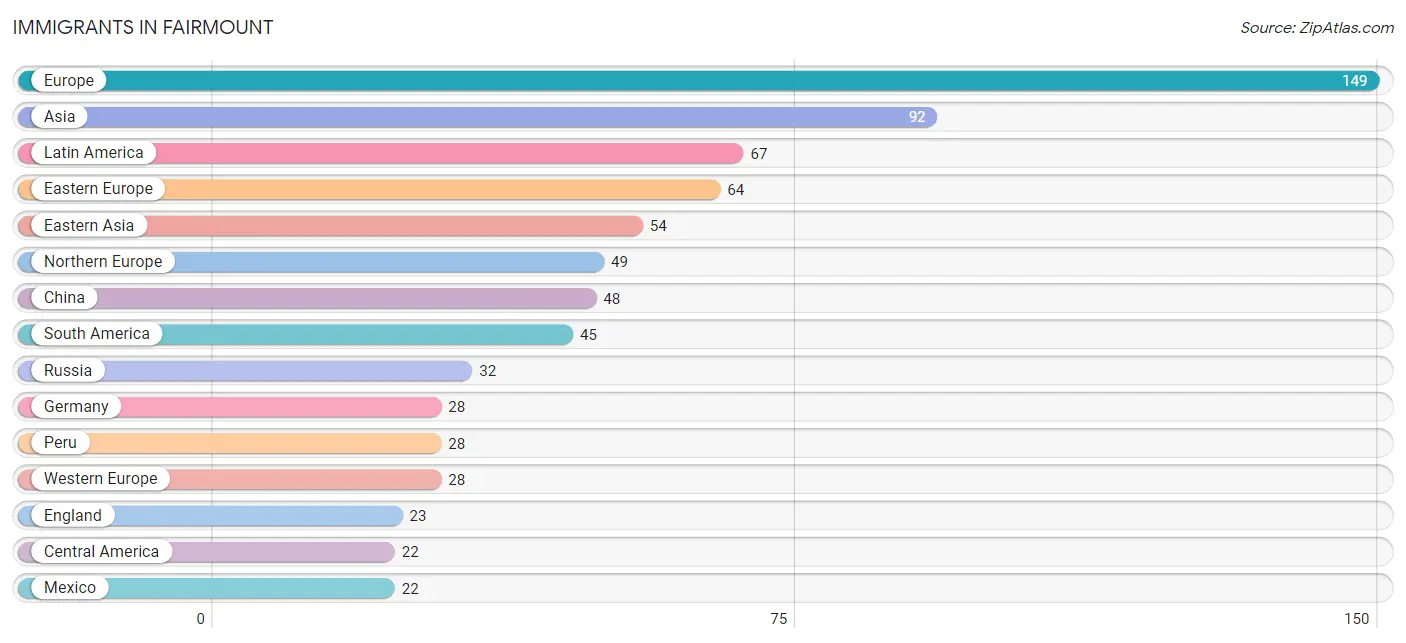
The most numerous immigrant groups reported in Fairmount came from Europe (149 | 1.4%), Asia (92 | 0.9%), Latin America (67 | 0.6%), Eastern Europe (64 | 0.6%), and Eastern Asia (54 | 0.5%), together accounting for 4.1% of all Fairmount residents.
| Immigration Origin | # Population | % Population |
| Africa | 19 | 0.2% |
| Asia | 92 | 0.9% |
| Australia | 11 | 0.1% |
| Canada | 16 | 0.2% |
| Central America | 22 | 0.2% |
| Chile | 7 | 0.1% |
| China | 48 | 0.5% |
| Colombia | 10 | 0.1% |
| Eastern Asia | 54 | 0.5% |
| Eastern Europe | 64 | 0.6% |
| England | 23 | 0.2% |
| Europe | 149 | 1.4% |
| Germany | 28 | 0.3% |
| India | 12 | 0.1% |
| Ireland | 12 | 0.1% |
| Israel | 9 | 0.1% |
| Italy | 8 | 0.1% |
| Japan | 6 | 0.1% |
| Latin America | 67 | 0.6% |
| Mexico | 22 | 0.2% |
| Northern Europe | 49 | 0.5% |
| Oceania | 11 | 0.1% |
| Peru | 28 | 0.3% |
| Poland | 12 | 0.1% |
| Russia | 32 | 0.3% |
| Scotland | 7 | 0.1% |
| South Africa | 19 | 0.2% |
| South America | 45 | 0.4% |
| South Central Asia | 12 | 0.1% |
| South Eastern Asia | 17 | 0.2% |
| Southern Europe | 8 | 0.1% |
| Sweden | 7 | 0.1% |
| Taiwan | 20 | 0.2% |
| Ukraine | 20 | 0.2% |
| Vietnam | 17 | 0.2% |
| Western Asia | 9 | 0.1% |
| Western Europe | 28 | 0.3% | View All 37 Rows |
Sex and Age in Fairmount
Sex and Age in Fairmount
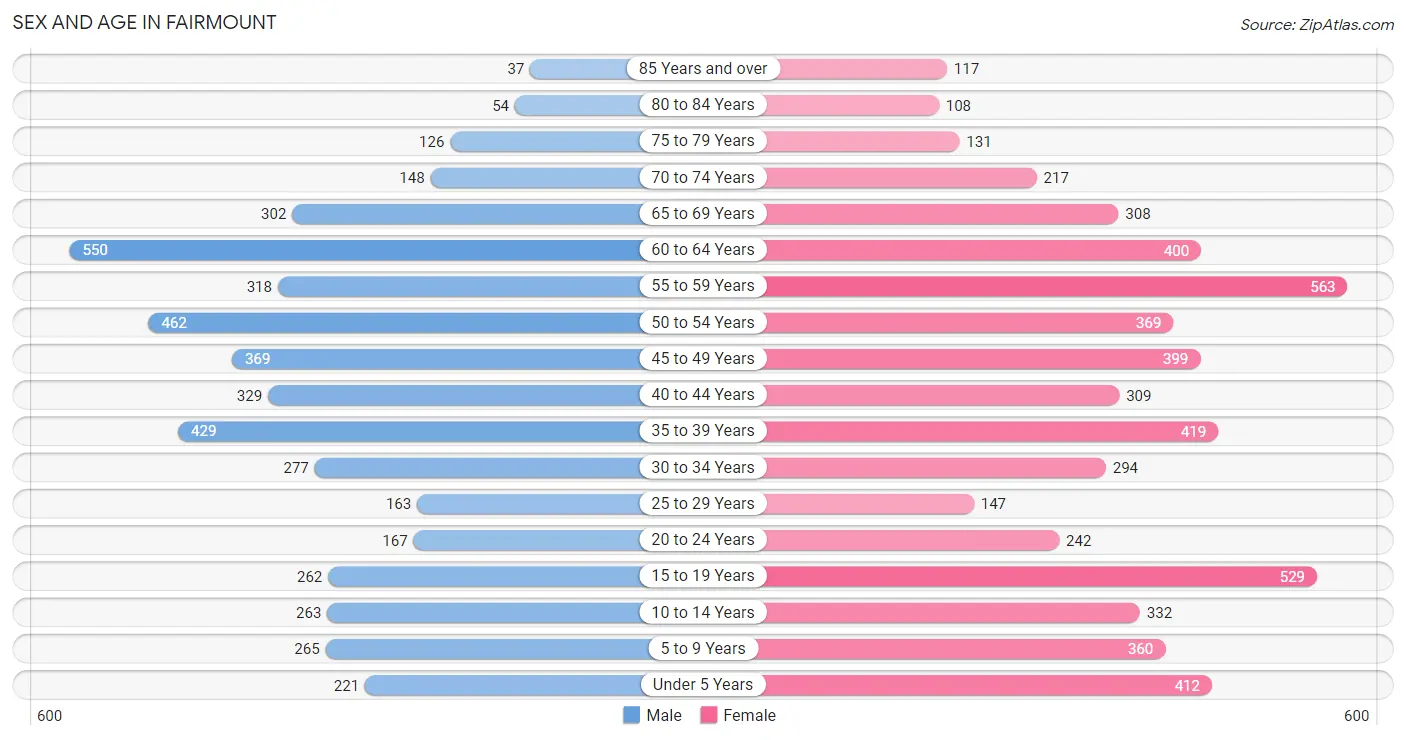
The most populous age groups in Fairmount are 60 to 64 Years (550 | 11.6%) for men and 55 to 59 Years (563 | 10.0%) for women.
| Age Bracket | Male | Female |
| Under 5 Years | 221 (4.7%) | 412 (7.3%) |
| 5 to 9 Years | 265 (5.6%) | 360 (6.4%) |
| 10 to 14 Years | 263 (5.6%) | 332 (5.9%) |
| 15 to 19 Years | 262 (5.5%) | 529 (9.3%) |
| 20 to 24 Years | 167 (3.5%) | 242 (4.3%) |
| 25 to 29 Years | 163 (3.4%) | 147 (2.6%) |
| 30 to 34 Years | 277 (5.8%) | 294 (5.2%) |
| 35 to 39 Years | 429 (9.0%) | 419 (7.4%) |
| 40 to 44 Years | 329 (6.9%) | 309 (5.5%) |
| 45 to 49 Years | 369 (7.8%) | 399 (7.0%) |
| 50 to 54 Years | 462 (9.7%) | 369 (6.5%) |
| 55 to 59 Years | 318 (6.7%) | 563 (10.0%) |
| 60 to 64 Years | 550 (11.6%) | 400 (7.1%) |
| 65 to 69 Years | 302 (6.4%) | 308 (5.4%) |
| 70 to 74 Years | 148 (3.1%) | 217 (3.8%) |
| 75 to 79 Years | 126 (2.7%) | 131 (2.3%) |
| 80 to 84 Years | 54 (1.1%) | 108 (1.9%) |
| 85 Years and over | 37 (0.8%) | 117 (2.1%) |
| Total | 4,742 (100.0%) | 5,656 (100.0%) |
Families and Households in Fairmount
Median Family Size in Fairmount
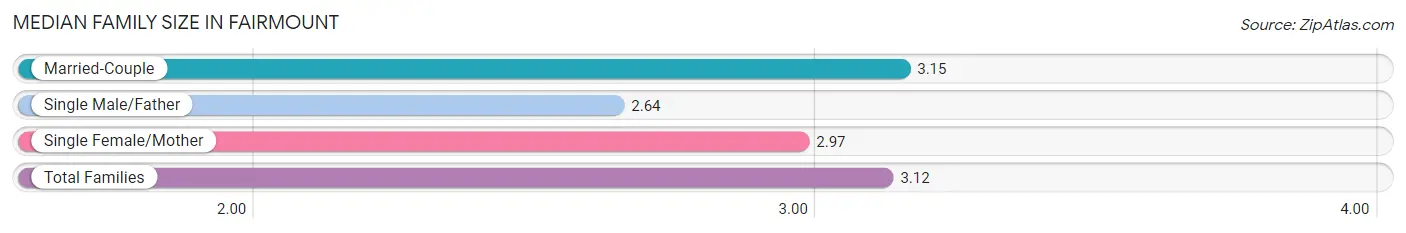
The median family size in Fairmount is 3.12 persons per family, with married-couple families (2,666 | 90.3%) accounting for the largest median family size of 3.15 persons per family. On the other hand, single male/father families (101 | 3.4%) represent the smallest median family size with 2.64 persons per family.
| Family Type | # Families | Family Size |
| Married-Couple | 2,666 (90.3%) | 3.15 |
| Single Male/Father | 101 (3.4%) | 2.64 |
| Single Female/Mother | 185 (6.3%) | 2.97 |
| Total Families | 2,952 (100.0%) | 3.12 |
Median Household Size in Fairmount
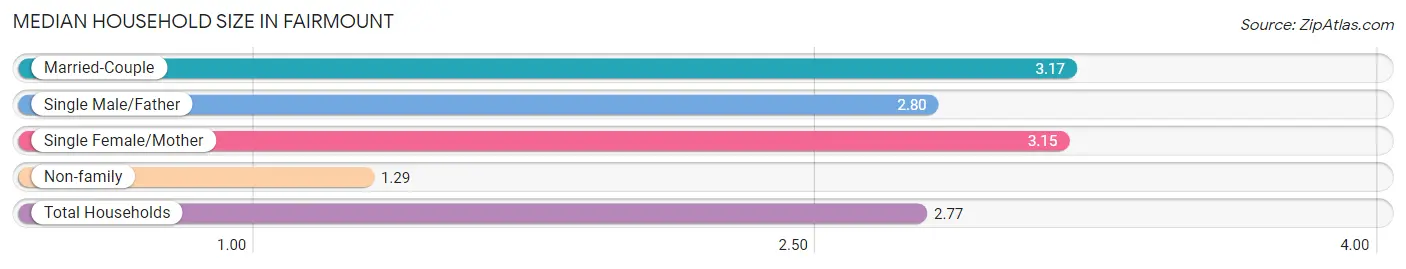
The median household size in Fairmount is 2.77 persons per household, with married-couple households (2,666 | 71.7%) accounting for the largest median household size of 3.17 persons per household. non-family households (766 | 20.6%) represent the smallest median household size with 1.29 persons per household.
| Household Type | # Households | Household Size |
| Married-Couple | 2,666 (71.7%) | 3.17 |
| Single Male/Father | 101 (2.7%) | 2.80 |
| Single Female/Mother | 185 (5.0%) | 3.15 |
| Non-family | 766 (20.6%) | 1.29 |
| Total Households | 3,718 (100.0%) | 2.77 |
Household Size by Marriage Status in Fairmount
Out of a total of 3,718 households in Fairmount, 2,952 (79.4%) are family households, while 766 (20.6%) are nonfamily households. The most numerous type of family households are 2-person households, comprising 1,373, and the most common type of nonfamily households are 1-person households, comprising 577.
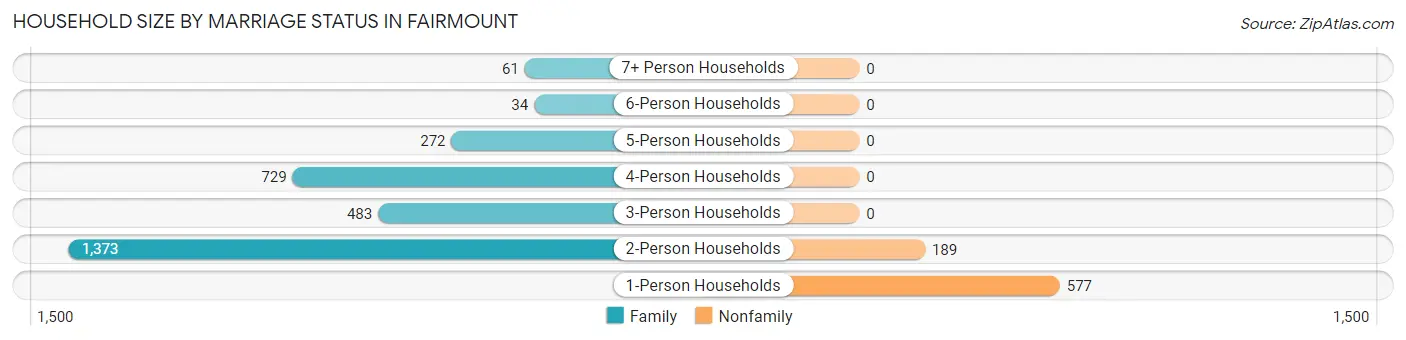
| Household Size | Family Households | Nonfamily Households |
| 1-Person Households | - | 577 (15.5%) |
| 2-Person Households | 1,373 (36.9%) | 189 (5.1%) |
| 3-Person Households | 483 (13.0%) | 0 (0.0%) |
| 4-Person Households | 729 (19.6%) | 0 (0.0%) |
| 5-Person Households | 272 (7.3%) | 0 (0.0%) |
| 6-Person Households | 34 (0.9%) | 0 (0.0%) |
| 7+ Person Households | 61 (1.6%) | 0 (0.0%) |
| Total | 2,952 (79.4%) | 766 (20.6%) |
Female Fertility in Fairmount
Fertility by Age in Fairmount
Average fertility rate in Fairmount is 12.0 births per 1,000 women. Women in the age bracket of 20 to 34 years have the highest fertility rate with 20.0 births per 1,000 women. Women in the age bracket of 35 to 50 years acount for 53.3% of all women with births.
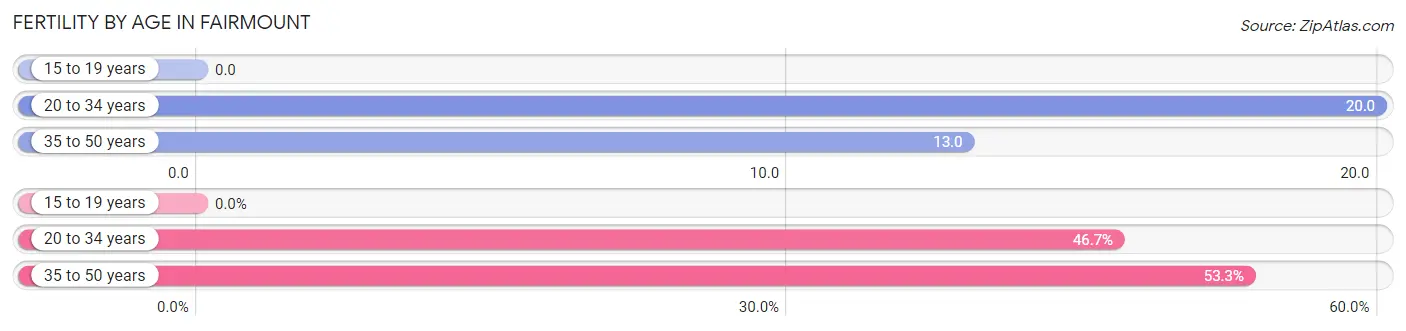
| Age Bracket | Women with Births | Births / 1,000 Women |
| 15 to 19 years | 0 (0.0%) | 0.0 |
| 20 to 34 years | 14 (46.7%) | 20.0 |
| 35 to 50 years | 16 (53.3%) | 13.0 |
| Total | 30 (100.0%) | 12.0 |
Fertility by Age by Marriage Status in Fairmount
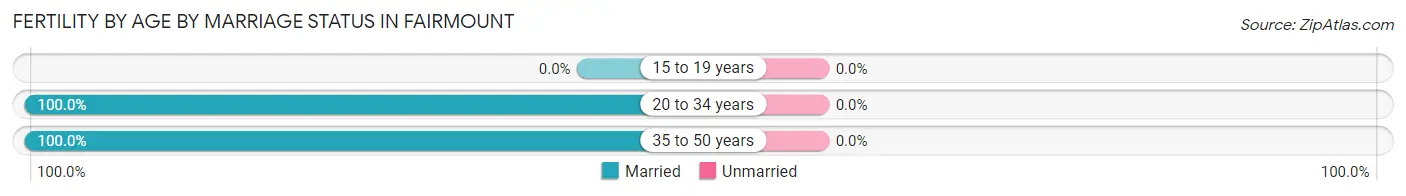
| Age Bracket | Married | Unmarried |
| 15 to 19 years | 0 (0.0%) | 0 (0.0%) |
| 20 to 34 years | 14 (100.0%) | 0 (0.0%) |
| 35 to 50 years | 16 (100.0%) | 0 (0.0%) |
| Total | 30 (100.0%) | 0 (0.0%) |
Fertility by Education in Fairmount
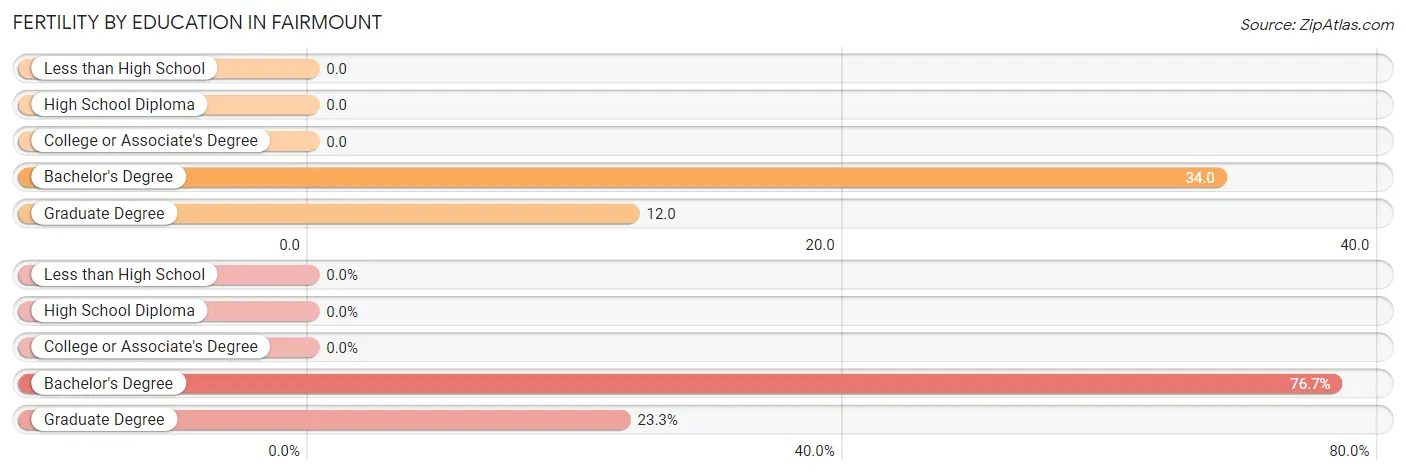
| Educational Attainment | Women with Births | Births / 1,000 Women |
| Less than High School | 0 (0.0%) | 0.0 |
| High School Diploma | 0 (0.0%) | 0.0 |
| College or Associate's Degree | 0 (0.0%) | 0.0 |
| Bachelor's Degree | 23 (76.7%) | 34.0 |
| Graduate Degree | 7 (23.3%) | 12.0 |
| Total | 30 (100.0%) | 12.0 |
Fertility by Education by Marriage Status in Fairmount
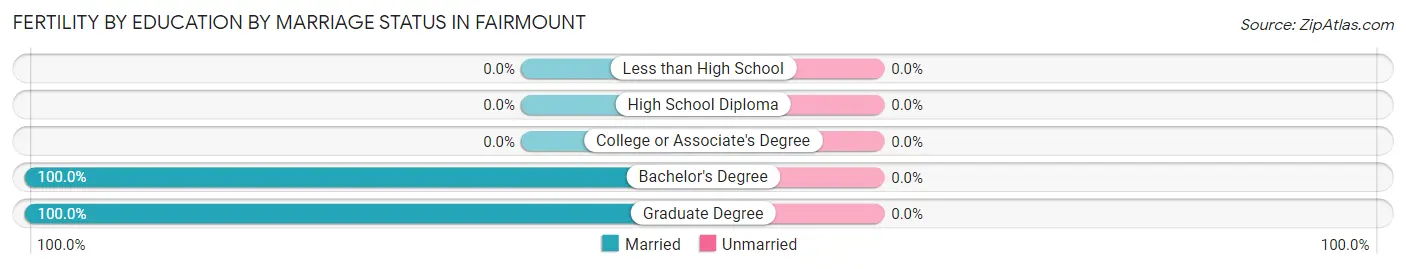
| Educational Attainment | Married | Unmarried |
| Less than High School | 0 (0.0%) | 0 (0.0%) |
| High School Diploma | 0 (0.0%) | 0 (0.0%) |
| College or Associate's Degree | 0 (0.0%) | 0 (0.0%) |
| Bachelor's Degree | 23 (100.0%) | 0 (0.0%) |
| Graduate Degree | 7 (100.0%) | 0 (0.0%) |
| Total | 30 (100.0%) | 0 (0.0%) |
Employment Characteristics in Fairmount
Employment by Class of Employer in Fairmount
Among the 5,483 employed individuals in Fairmount, private company employees (3,509 | 64.0%), not-for-profit organizations (545 | 9.9%), and self-employed (incorporated) (431 | 7.9%) make up the most common classes of employment.
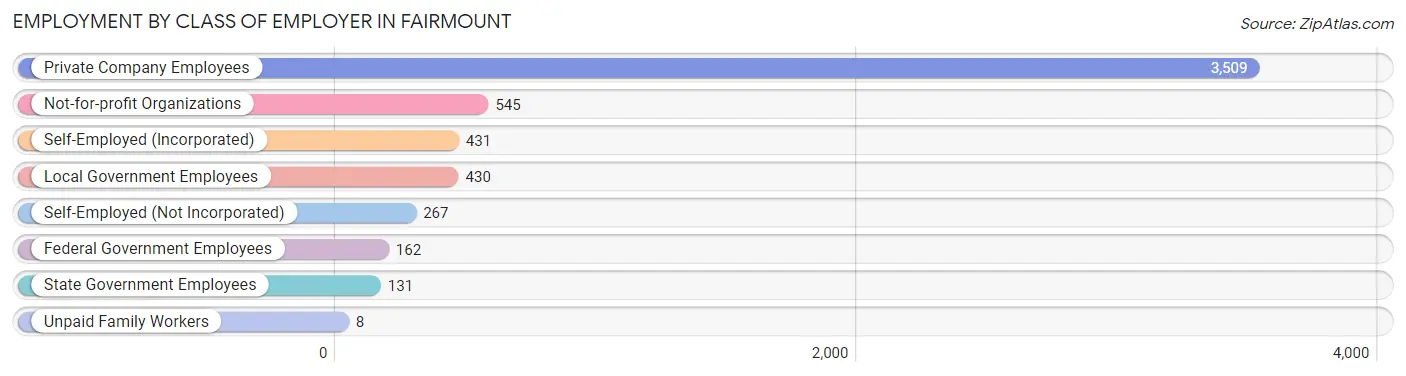
| Employer Class | # Employees | % Employees |
| Private Company Employees | 3,509 | 64.0% |
| Self-Employed (Incorporated) | 431 | 7.9% |
| Self-Employed (Not Incorporated) | 267 | 4.9% |
| Not-for-profit Organizations | 545 | 9.9% |
| Local Government Employees | 430 | 7.8% |
| State Government Employees | 131 | 2.4% |
| Federal Government Employees | 162 | 2.9% |
| Unpaid Family Workers | 8 | 0.2% |
| Total | 5,483 | 100.0% |
Employment Status by Age in Fairmount
According to the labor force statistics for Fairmount, out of the total population over 16 years of age (8,391), 67.5% or 5,664 individuals are in the labor force, with 2.4% or 136 of them unemployed. The age group with the highest labor force participation rate is 25 to 29 years, with 95.2% or 295 individuals in the labor force. Within the labor force, the 20 to 24 years age range has the highest percentage of unemployed individuals, with 9.5% or 24 of them being unemployed.
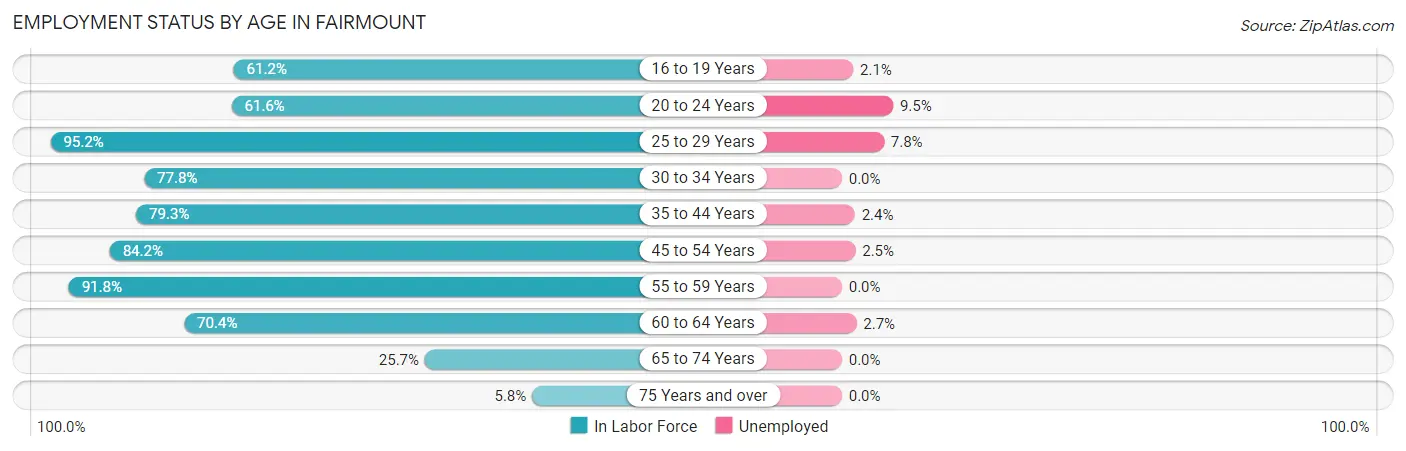
| Age Bracket | In Labor Force | Unemployed |
| 16 to 19 Years | 390 (61.2%) | 8 (2.1%) |
| 20 to 24 Years | 252 (61.6%) | 24 (9.5%) |
| 25 to 29 Years | 295 (95.2%) | 23 (7.8%) |
| 30 to 34 Years | 444 (77.8%) | 0 (0.0%) |
| 35 to 44 Years | 1,178 (79.3%) | 28 (2.4%) |
| 45 to 54 Years | 1,346 (84.2%) | 34 (2.5%) |
| 55 to 59 Years | 809 (91.8%) | 0 (0.0%) |
| 60 to 64 Years | 669 (70.4%) | 18 (2.7%) |
| 65 to 74 Years | 251 (25.7%) | 0 (0.0%) |
| 75 Years and over | 33 (5.8%) | 0 (0.0%) |
| Total | 5,664 (67.5%) | 136 (2.4%) |
Employment Status by Educational Attainment in Fairmount
According to labor force statistics for Fairmount, 81.8% of individuals (4,742) out of the total population between 25 and 64 years of age (5,797) are in the labor force, with 2.2% or 104 of them being unemployed. The group with the highest labor force participation rate are those with the educational attainment of high school diploma, with 86.8% or 590 individuals in the labor force. Within the labor force, individuals with high school diploma education have the highest percentage of unemployment, with 3.4% or 20 of them being unemployed.
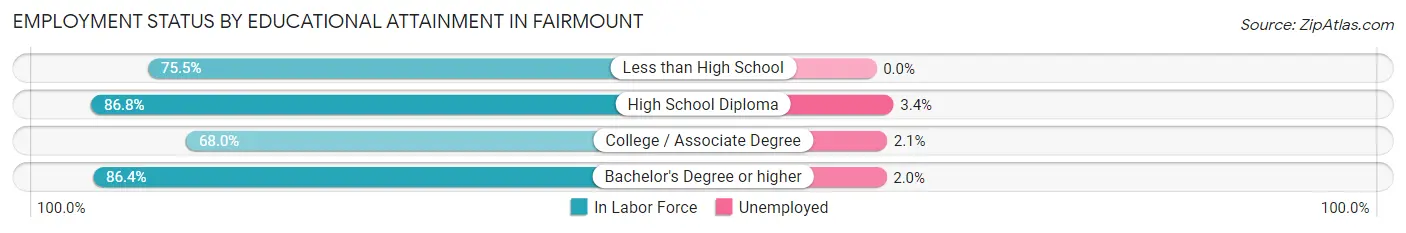
| Educational Attainment | In Labor Force | Unemployed |
| Less than High School | 163 (75.5%) | 0 (0.0%) |
| High School Diploma | 590 (86.8%) | 23 (3.4%) |
| College / Associate Degree | 906 (68.0%) | 28 (2.1%) |
| Bachelor's Degree or higher | 3,083 (86.4%) | 71 (2.0%) |
| Total | 4,742 (81.8%) | 128 (2.2%) |
Employment Occupations by Sex in Fairmount
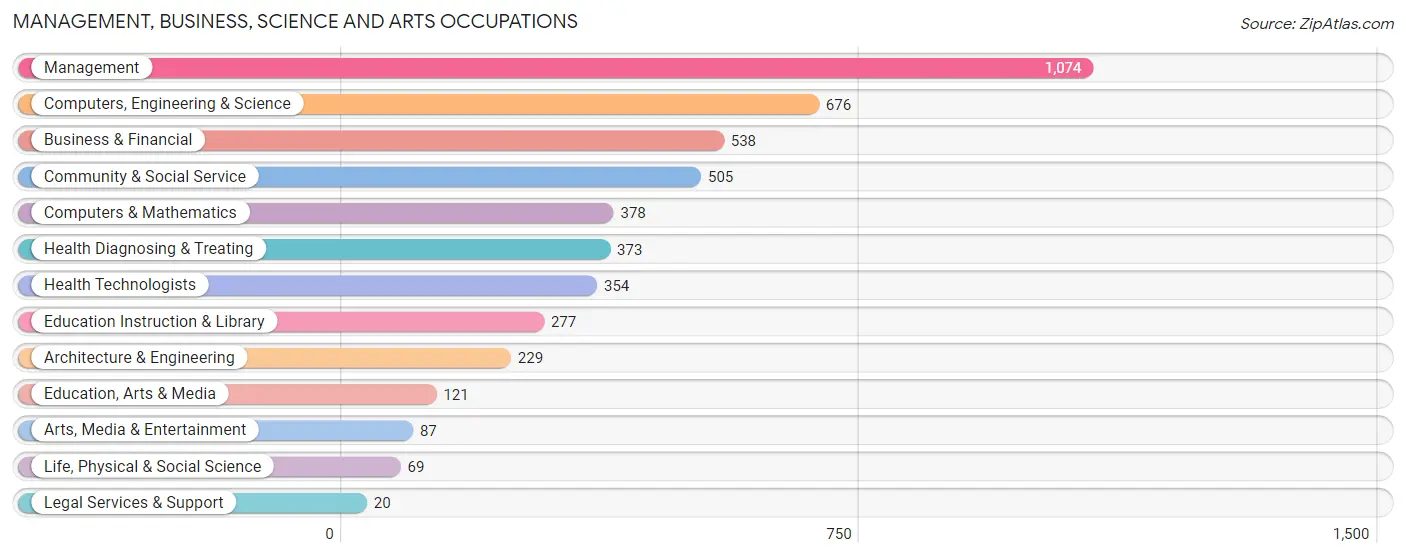
Management, Business, Science and Arts Occupations
The most common Management, Business, Science and Arts occupations in Fairmount are Management (1,074 | 19.4%), Computers, Engineering & Science (676 | 12.2%), Business & Financial (538 | 9.7%), Community & Social Service (505 | 9.1%), and Computers & Mathematics (378 | 6.8%).
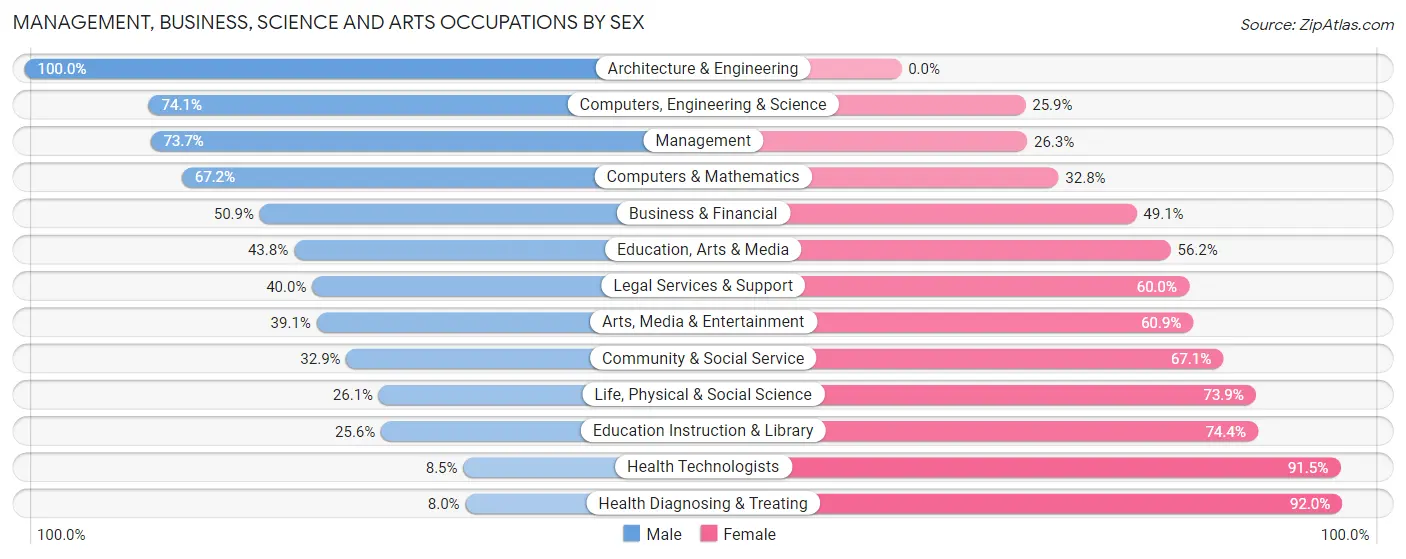
Management, Business, Science and Arts Occupations by Sex
Within the Management, Business, Science and Arts occupations in Fairmount, the most male-oriented occupations are Architecture & Engineering (100.0%), Computers, Engineering & Science (74.1%), and Management (73.7%), while the most female-oriented occupations are Health Diagnosing & Treating (92.0%), Health Technologists (91.5%), and Education Instruction & Library (74.4%).
| Occupation | Male | Female |
| Management | 792 (73.7%) | 282 (26.3%) |
| Business & Financial | 274 (50.9%) | 264 (49.1%) |
| Computers, Engineering & Science | 501 (74.1%) | 175 (25.9%) |
| Computers & Mathematics | 254 (67.2%) | 124 (32.8%) |
| Architecture & Engineering | 229 (100.0%) | 0 (0.0%) |
| Life, Physical & Social Science | 18 (26.1%) | 51 (73.9%) |
| Community & Social Service | 166 (32.9%) | 339 (67.1%) |
| Education, Arts & Media | 53 (43.8%) | 68 (56.2%) |
| Legal Services & Support | 8 (40.0%) | 12 (60.0%) |
| Education Instruction & Library | 71 (25.6%) | 206 (74.4%) |
| Arts, Media & Entertainment | 34 (39.1%) | 53 (60.9%) |
| Health Diagnosing & Treating | 30 (8.0%) | 343 (92.0%) |
| Health Technologists | 30 (8.5%) | 324 (91.5%) |
| Total (Category) | 1,763 (55.7%) | 1,403 (44.3%) |
| Total (Overall) | 2,903 (52.5%) | 2,630 (47.5%) |
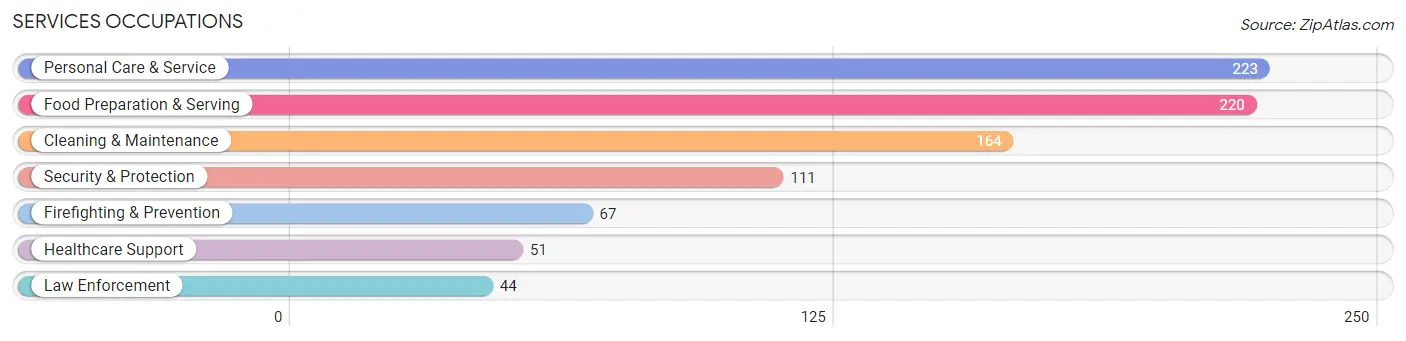
Services Occupations
The most common Services occupations in Fairmount are Personal Care & Service (223 | 4.0%), Food Preparation & Serving (220 | 4.0%), Cleaning & Maintenance (164 | 3.0%), Security & Protection (111 | 2.0%), and Firefighting & Prevention (67 | 1.2%).
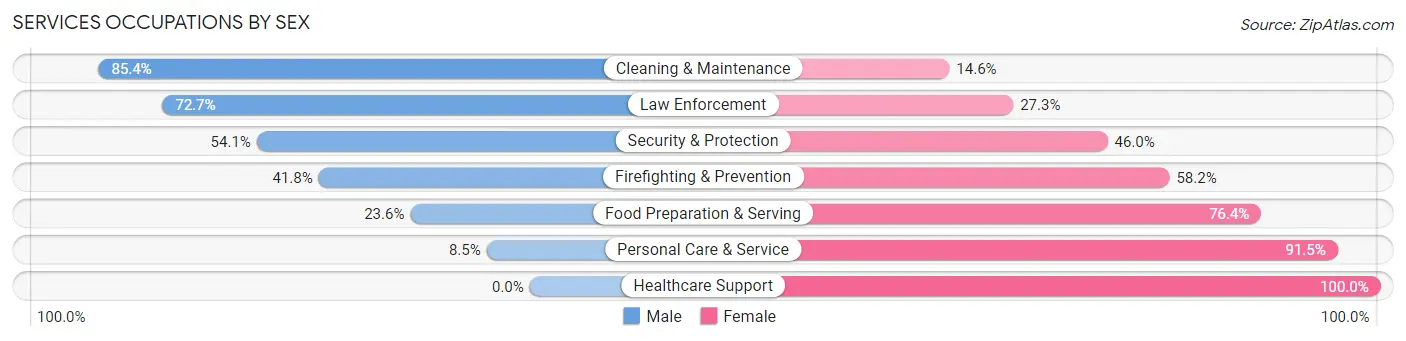
Services Occupations by Sex
Within the Services occupations in Fairmount, the most male-oriented occupations are Cleaning & Maintenance (85.4%), Law Enforcement (72.7%), and Security & Protection (54.0%), while the most female-oriented occupations are Healthcare Support (100.0%), Personal Care & Service (91.5%), and Food Preparation & Serving (76.4%).
| Occupation | Male | Female |
| Healthcare Support | 0 (0.0%) | 51 (100.0%) |
| Security & Protection | 60 (54.0%) | 51 (46.0%) |
| Firefighting & Prevention | 28 (41.8%) | 39 (58.2%) |
| Law Enforcement | 32 (72.7%) | 12 (27.3%) |
| Food Preparation & Serving | 52 (23.6%) | 168 (76.4%) |
| Cleaning & Maintenance | 140 (85.4%) | 24 (14.6%) |
| Personal Care & Service | 19 (8.5%) | 204 (91.5%) |
| Total (Category) | 271 (35.2%) | 498 (64.8%) |
| Total (Overall) | 2,903 (52.5%) | 2,630 (47.5%) |
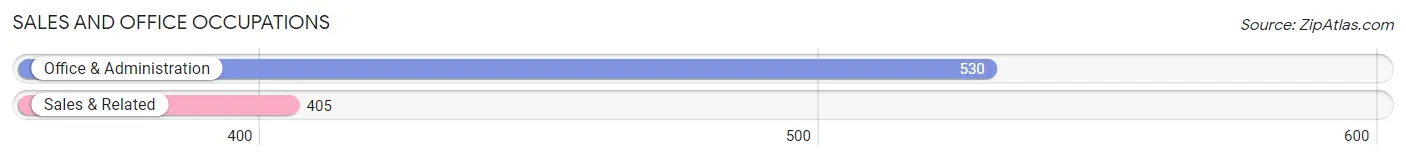
Sales and Office Occupations
The most common Sales and Office occupations in Fairmount are Office & Administration (530 | 9.6%), and Sales & Related (405 | 7.3%).
Sales and Office Occupations by Sex
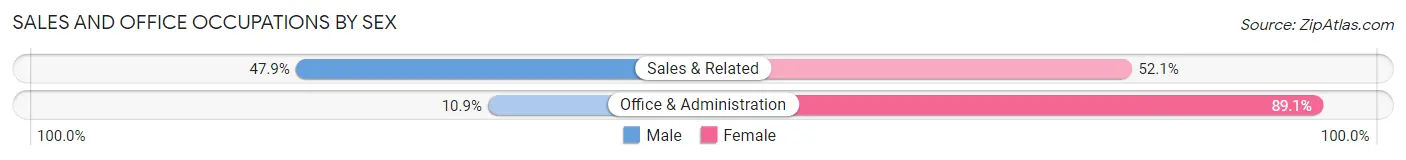
| Occupation | Male | Female |
| Sales & Related | 194 (47.9%) | 211 (52.1%) |
| Office & Administration | 58 (10.9%) | 472 (89.1%) |
| Total (Category) | 252 (27.0%) | 683 (73.1%) |
| Total (Overall) | 2,903 (52.5%) | 2,630 (47.5%) |
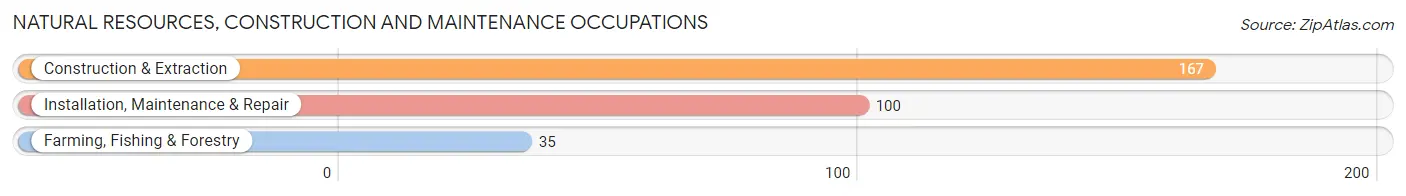
Natural Resources, Construction and Maintenance Occupations
The most common Natural Resources, Construction and Maintenance occupations in Fairmount are Construction & Extraction (167 | 3.0%), Installation, Maintenance & Repair (100 | 1.8%), and Farming, Fishing & Forestry (35 | 0.6%).
Natural Resources, Construction and Maintenance Occupations by Sex
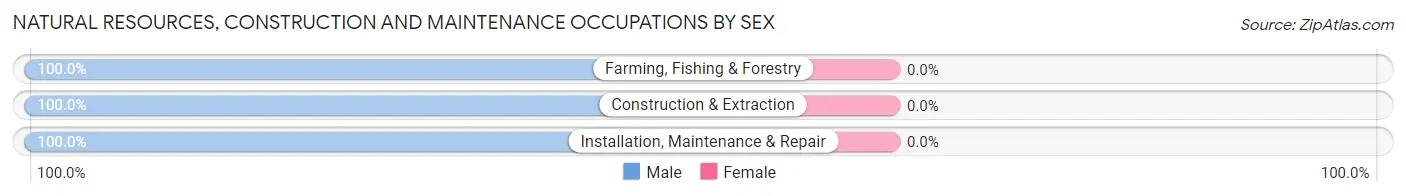
| Occupation | Male | Female |
| Farming, Fishing & Forestry | 35 (100.0%) | 0 (0.0%) |
| Construction & Extraction | 167 (100.0%) | 0 (0.0%) |
| Installation, Maintenance & Repair | 100 (100.0%) | 0 (0.0%) |
| Total (Category) | 302 (100.0%) | 0 (0.0%) |
| Total (Overall) | 2,903 (52.5%) | 2,630 (47.5%) |
Production, Transportation and Moving Occupations
The most common Production, Transportation and Moving occupations in Fairmount are Transportation (206 | 3.7%), Production (91 | 1.6%), and Material Moving (64 | 1.2%).
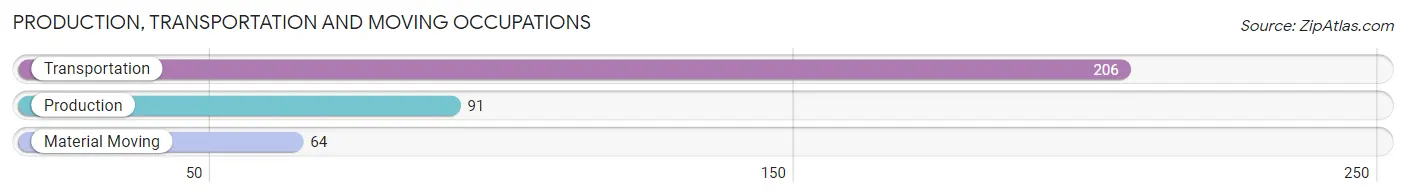
Production, Transportation and Moving Occupations by Sex
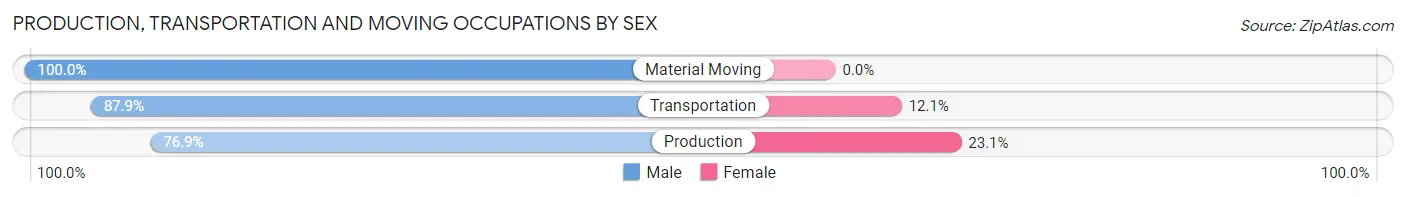
| Occupation | Male | Female |
| Production | 70 (76.9%) | 21 (23.1%) |
| Transportation | 181 (87.9%) | 25 (12.1%) |
| Material Moving | 64 (100.0%) | 0 (0.0%) |
| Total (Category) | 315 (87.3%) | 46 (12.7%) |
| Total (Overall) | 2,903 (52.5%) | 2,630 (47.5%) |
Employment Industries by Sex in Fairmount
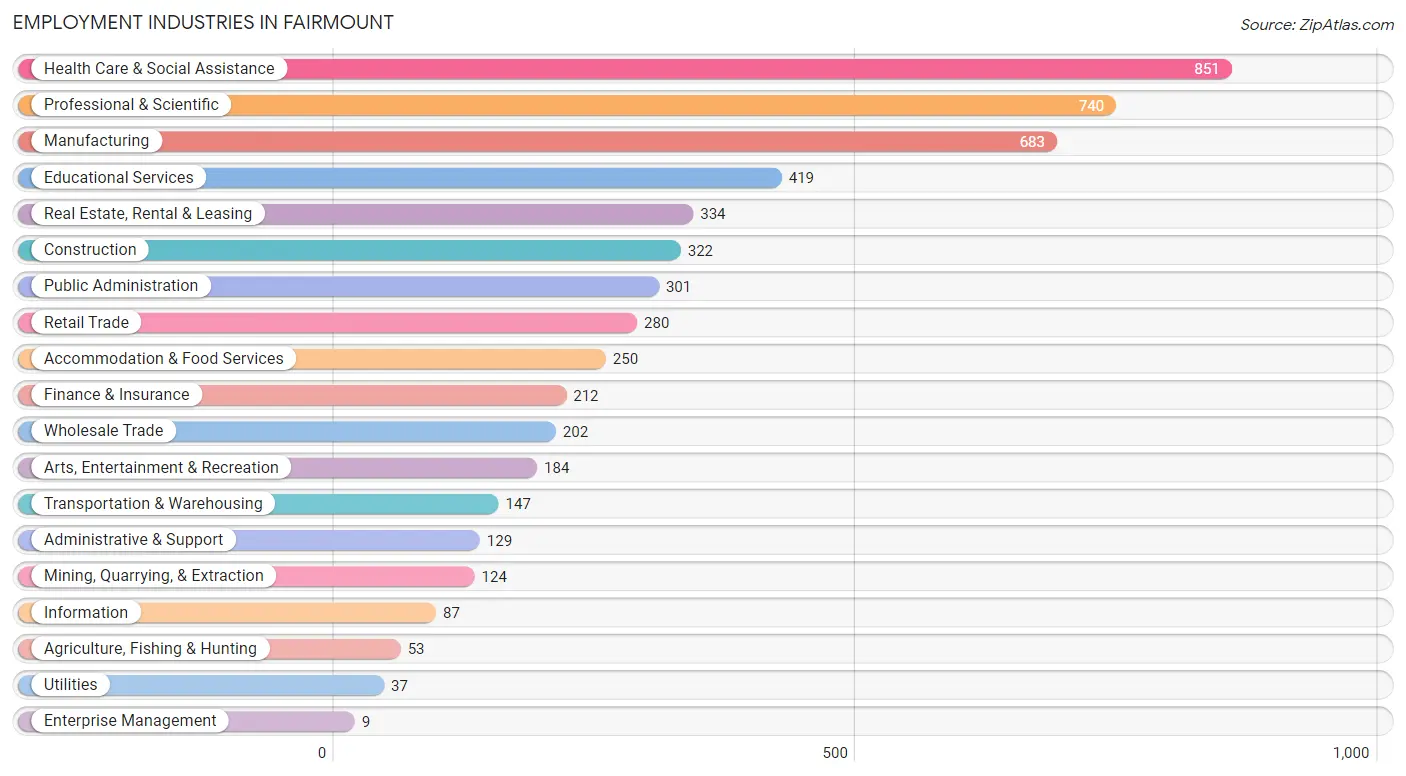
Employment Industries in Fairmount
The major employment industries in Fairmount include Health Care & Social Assistance (851 | 15.4%), Professional & Scientific (740 | 13.4%), Manufacturing (683 | 12.3%), Educational Services (419 | 7.6%), and Real Estate, Rental & Leasing (334 | 6.0%).
Employment Industries by Sex in Fairmount
The Fairmount industries that see more men than women are Enterprise Management (100.0%), Mining, Quarrying, & Extraction (83.9%), and Wholesale Trade (82.2%), whereas the industries that tend to have a higher number of women are Real Estate, Rental & Leasing (85.6%), Accommodation & Food Services (75.2%), and Health Care & Social Assistance (72.9%).
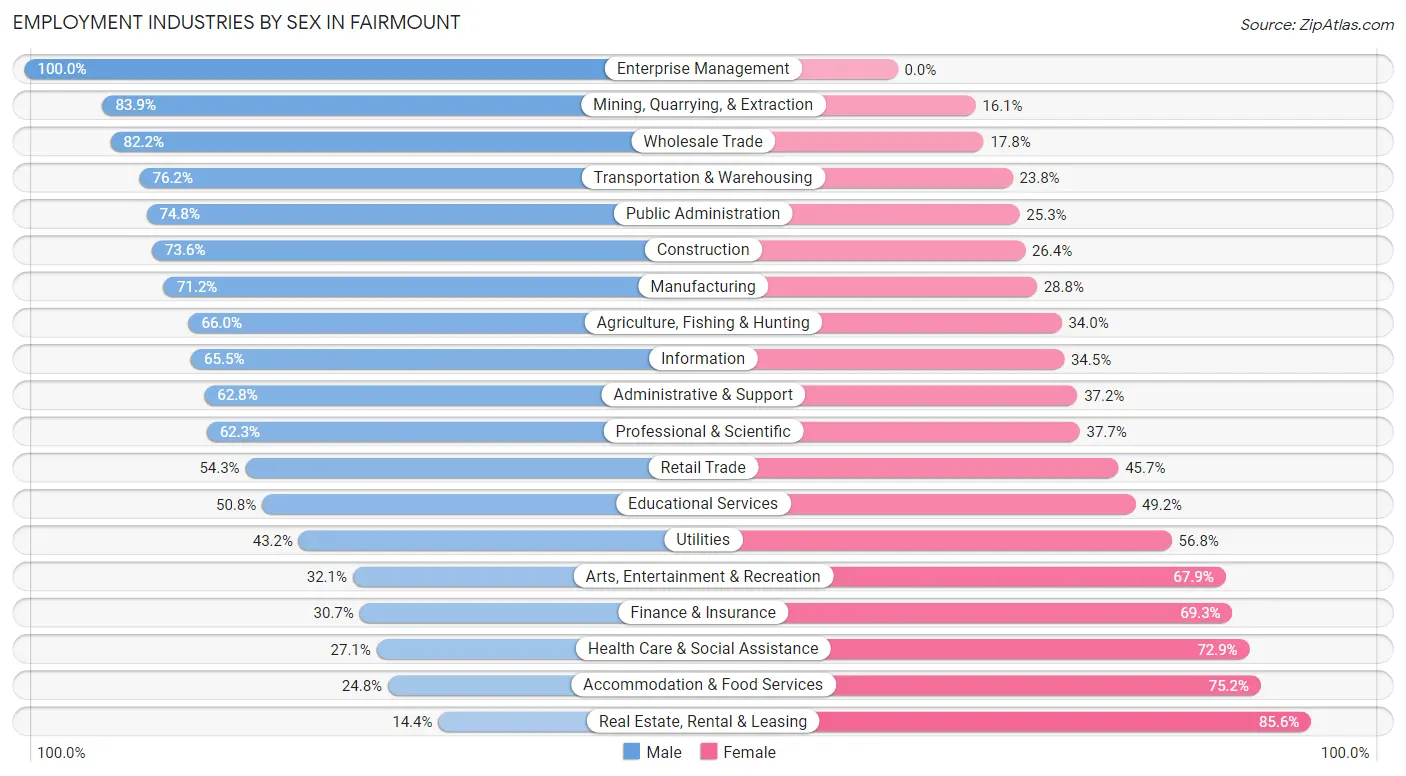
| Industry | Male | Female |
| Agriculture, Fishing & Hunting | 35 (66.0%) | 18 (34.0%) |
| Mining, Quarrying, & Extraction | 104 (83.9%) | 20 (16.1%) |
| Construction | 237 (73.6%) | 85 (26.4%) |
| Manufacturing | 486 (71.2%) | 197 (28.8%) |
| Wholesale Trade | 166 (82.2%) | 36 (17.8%) |
| Retail Trade | 152 (54.3%) | 128 (45.7%) |
| Transportation & Warehousing | 112 (76.2%) | 35 (23.8%) |
| Utilities | 16 (43.2%) | 21 (56.8%) |
| Information | 57 (65.5%) | 30 (34.5%) |
| Finance & Insurance | 65 (30.7%) | 147 (69.3%) |
| Real Estate, Rental & Leasing | 48 (14.4%) | 286 (85.6%) |
| Professional & Scientific | 461 (62.3%) | 279 (37.7%) |
| Enterprise Management | 9 (100.0%) | 0 (0.0%) |
| Administrative & Support | 81 (62.8%) | 48 (37.2%) |
| Educational Services | 213 (50.8%) | 206 (49.2%) |
| Health Care & Social Assistance | 231 (27.1%) | 620 (72.9%) |
| Arts, Entertainment & Recreation | 59 (32.1%) | 125 (67.9%) |
| Accommodation & Food Services | 62 (24.8%) | 188 (75.2%) |
| Public Administration | 225 (74.8%) | 76 (25.3%) |
| Total | 2,903 (52.5%) | 2,630 (47.5%) |
Education in Fairmount
School Enrollment in Fairmount
The most common levels of schooling among the 2,490 students in Fairmount are high school (631 | 25.3%), middle school (490 | 19.7%), and elementary school (488 | 19.6%).
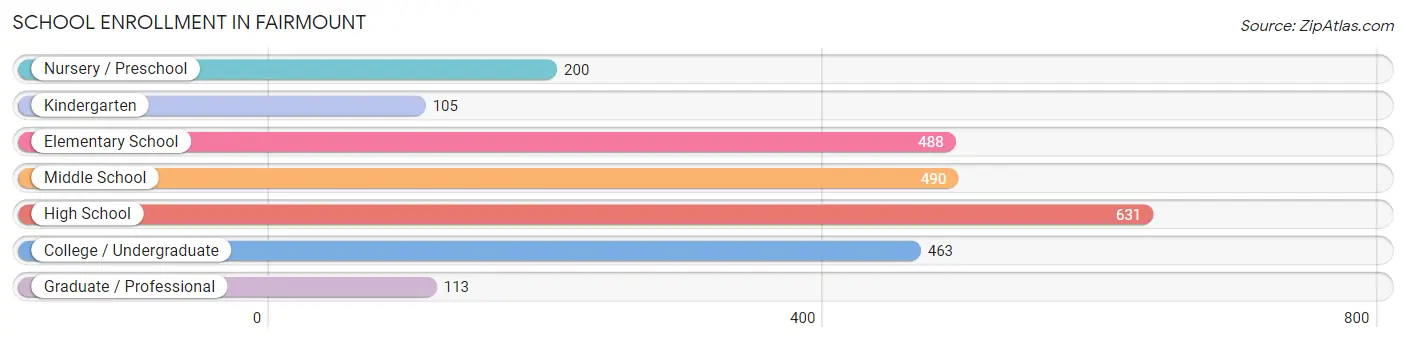
| School Level | # Students | % Students |
| Nursery / Preschool | 200 | 8.0% |
| Kindergarten | 105 | 4.2% |
| Elementary School | 488 | 19.6% |
| Middle School | 490 | 19.7% |
| High School | 631 | 25.3% |
| College / Undergraduate | 463 | 18.6% |
| Graduate / Professional | 113 | 4.5% |
| Total | 2,490 | 100.0% |
School Enrollment by Age by Funding Source in Fairmount
Out of a total of 2,490 students who are enrolled in schools in Fairmount, 326 (13.1%) attend a private institution, while the remaining 2,164 (86.9%) are enrolled in public schools. The age group of 20 to 24 year olds has the highest likelihood of being enrolled in private schools, with 92 (44.2% in the age bracket) enrolled. Conversely, the age group of 18 to 19 year olds has the lowest likelihood of being enrolled in a private school, with 196 (100.0% in the age bracket) attending a public institution.
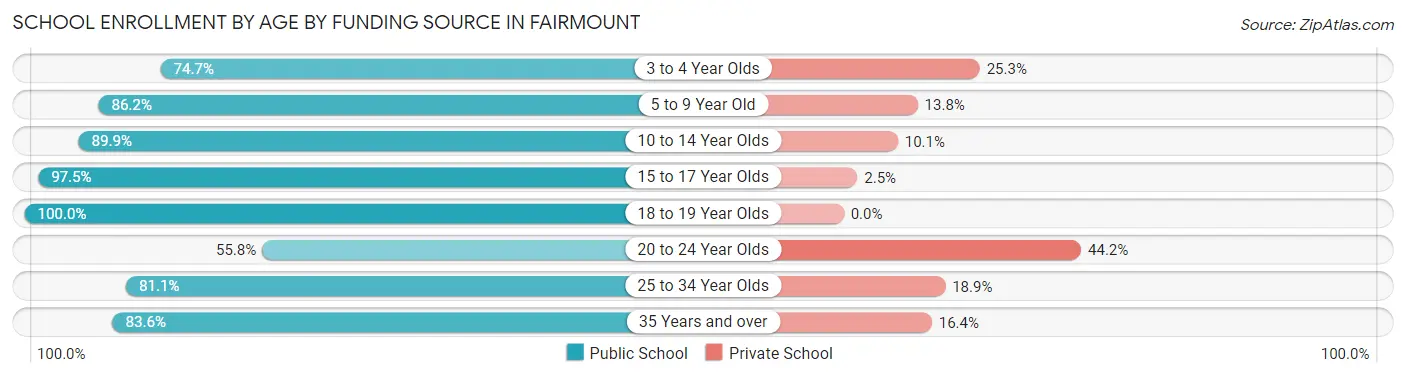
| Age Bracket | Public School | Private School |
| 3 to 4 Year Olds | 109 (74.7%) | 37 (25.3%) |
| 5 to 9 Year Old | 513 (86.2%) | 82 (13.8%) |
| 10 to 14 Year Olds | 535 (89.9%) | 60 (10.1%) |
| 15 to 17 Year Olds | 498 (97.5%) | 13 (2.5%) |
| 18 to 19 Year Olds | 196 (100.0%) | 0 (0.0%) |
| 20 to 24 Year Olds | 116 (55.8%) | 92 (44.2%) |
| 25 to 34 Year Olds | 90 (81.1%) | 21 (18.9%) |
| 35 Years and over | 107 (83.6%) | 21 (16.4%) |
| Total | 2,164 (86.9%) | 326 (13.1%) |
Educational Attainment by Field of Study in Fairmount
Business (1,197 | 25.4%), bio, nature & agricultural (509 | 10.8%), engineering (456 | 9.7%), education (420 | 8.9%), and social sciences (416 | 8.8%) are the most common fields of study among 4,722 individuals in Fairmount who have obtained a bachelor's degree or higher.
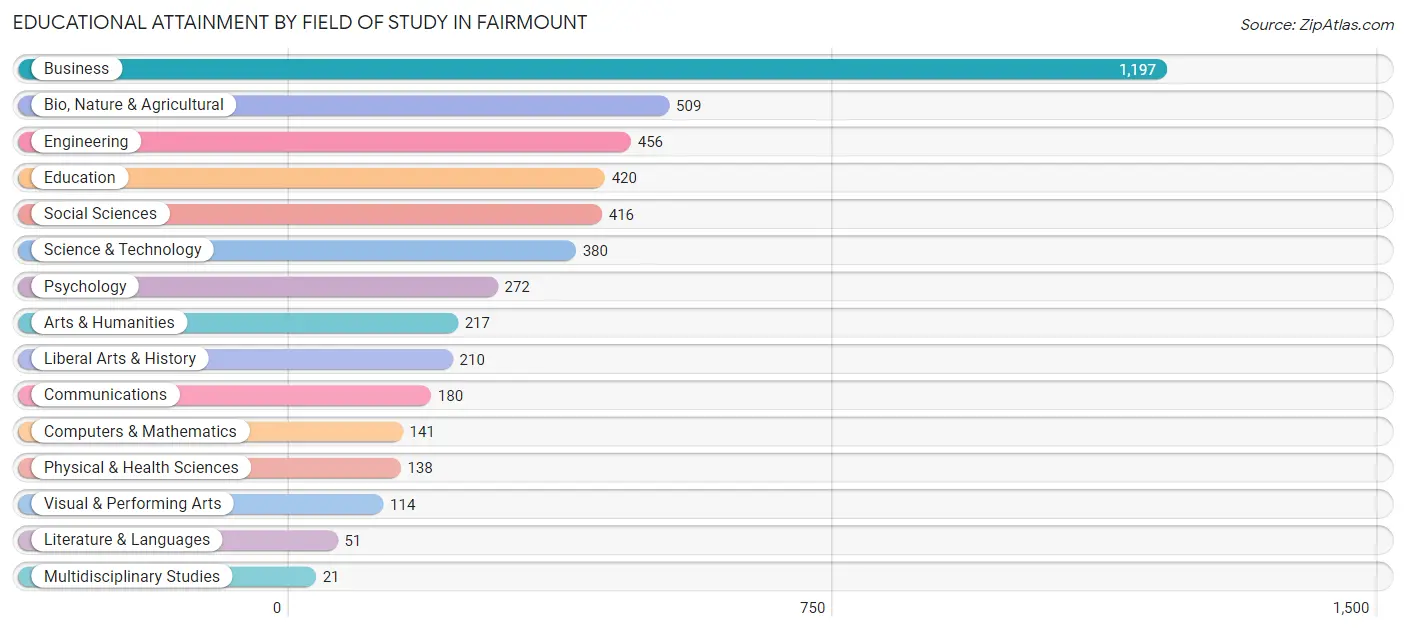
| Field of Study | # Graduates | % Graduates |
| Computers & Mathematics | 141 | 3.0% |
| Bio, Nature & Agricultural | 509 | 10.8% |
| Physical & Health Sciences | 138 | 2.9% |
| Psychology | 272 | 5.8% |
| Social Sciences | 416 | 8.8% |
| Engineering | 456 | 9.7% |
| Multidisciplinary Studies | 21 | 0.4% |
| Science & Technology | 380 | 8.1% |
| Business | 1,197 | 25.4% |
| Education | 420 | 8.9% |
| Literature & Languages | 51 | 1.1% |
| Liberal Arts & History | 210 | 4.4% |
| Visual & Performing Arts | 114 | 2.4% |
| Communications | 180 | 3.8% |
| Arts & Humanities | 217 | 4.6% |
| Total | 4,722 | 100.0% |
Transportation & Commute in Fairmount
Vehicle Availability by Sex in Fairmount
The most prevalent vehicle ownership categories in Fairmount are males with 2 vehicles (1,290, accounting for 44.9%) and females with 2 vehicles (1,115, making up 49.5%).
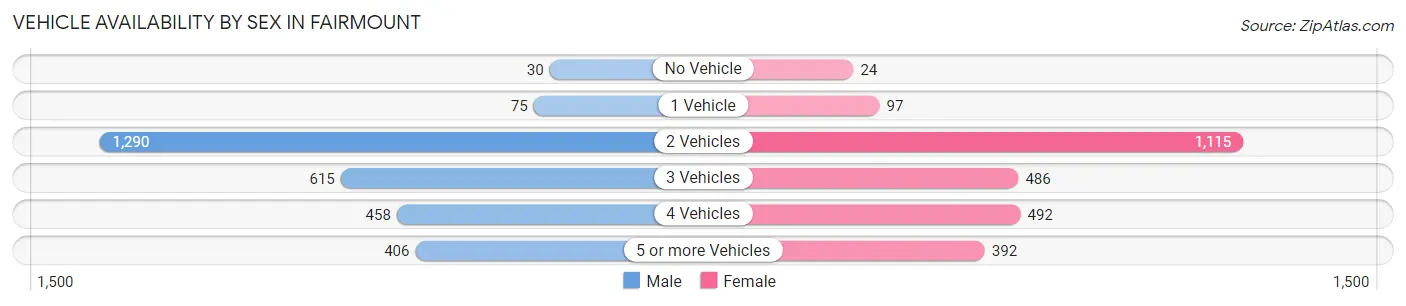
| Vehicles Available | Male | Female |
| No Vehicle | 30 (1.0%) | 24 (0.9%) |
| 1 Vehicle | 75 (2.6%) | 97 (3.7%) |
| 2 Vehicles | 1,290 (44.9%) | 1,115 (42.8%) |
| 3 Vehicles | 615 (21.4%) | 486 (18.6%) |
| 4 Vehicles | 458 (15.9%) | 492 (18.9%) |
| 5 or more Vehicles | 406 (14.1%) | 392 (15.0%) |
| Total | 2,874 (100.0%) | 2,606 (100.0%) |
Commute Time in Fairmount
The most frequently occuring commute durations in Fairmount are 30 to 34 minutes (993 commuters, 22.4%), 20 to 24 minutes (610 commuters, 13.8%), and 15 to 19 minutes (555 commuters, 12.5%).
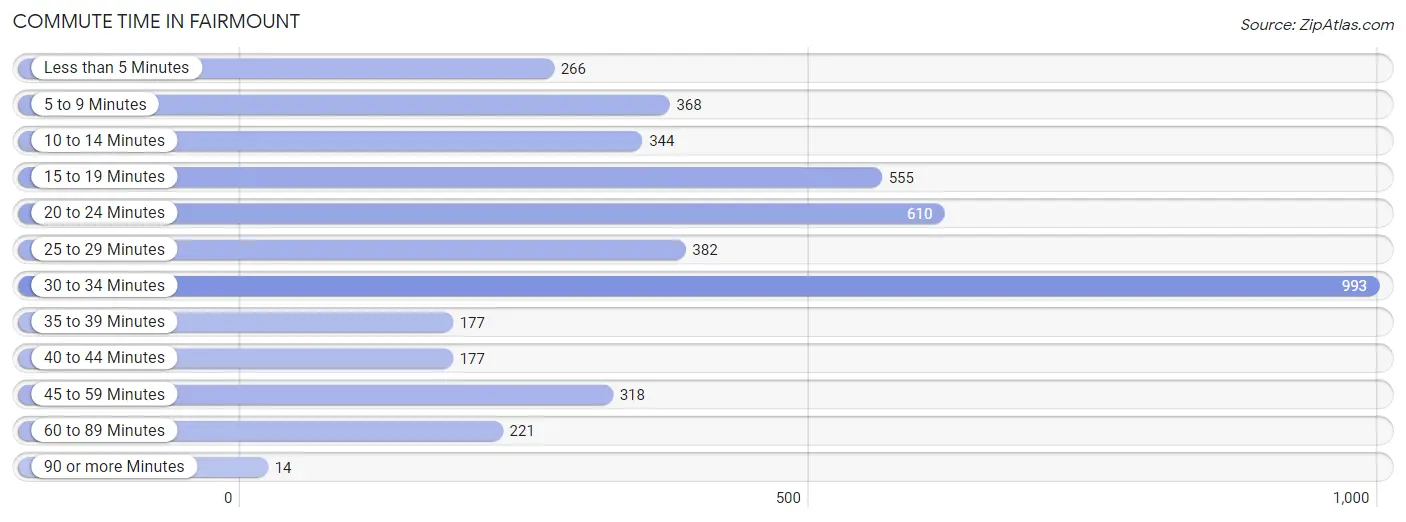
| Commute Time | # Commuters | % Commuters |
| Less than 5 Minutes | 266 | 6.0% |
| 5 to 9 Minutes | 368 | 8.3% |
| 10 to 14 Minutes | 344 | 7.8% |
| 15 to 19 Minutes | 555 | 12.5% |
| 20 to 24 Minutes | 610 | 13.8% |
| 25 to 29 Minutes | 382 | 8.6% |
| 30 to 34 Minutes | 993 | 22.4% |
| 35 to 39 Minutes | 177 | 4.0% |
| 40 to 44 Minutes | 177 | 4.0% |
| 45 to 59 Minutes | 318 | 7.2% |
| 60 to 89 Minutes | 221 | 5.0% |
| 90 or more Minutes | 14 | 0.3% |
Commute Time by Sex in Fairmount
The most common commute times in Fairmount are 30 to 34 minutes (615 commuters, 26.0%) for males and 30 to 34 minutes (378 commuters, 18.4%) for females.
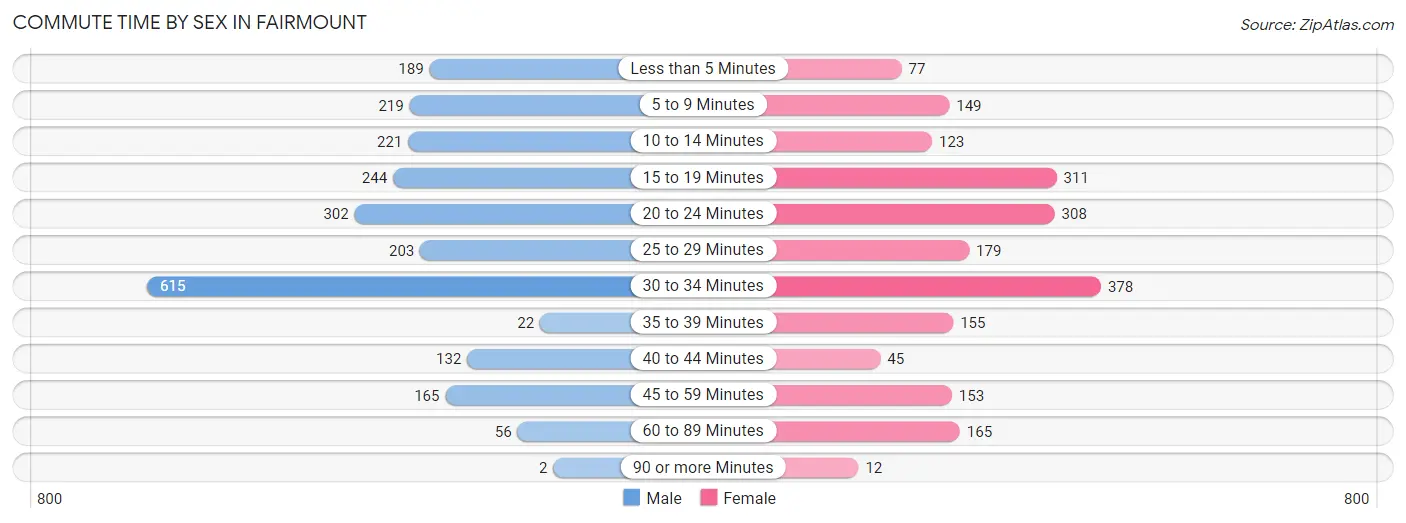
| Commute Time | Male | Female |
| Less than 5 Minutes | 189 (8.0%) | 77 (3.7%) |
| 5 to 9 Minutes | 219 (9.2%) | 149 (7.2%) |
| 10 to 14 Minutes | 221 (9.3%) | 123 (6.0%) |
| 15 to 19 Minutes | 244 (10.3%) | 311 (15.1%) |
| 20 to 24 Minutes | 302 (12.7%) | 308 (15.0%) |
| 25 to 29 Minutes | 203 (8.6%) | 179 (8.7%) |
| 30 to 34 Minutes | 615 (26.0%) | 378 (18.4%) |
| 35 to 39 Minutes | 22 (0.9%) | 155 (7.5%) |
| 40 to 44 Minutes | 132 (5.6%) | 45 (2.2%) |
| 45 to 59 Minutes | 165 (7.0%) | 153 (7.4%) |
| 60 to 89 Minutes | 56 (2.4%) | 165 (8.0%) |
| 90 or more Minutes | 2 (0.1%) | 12 (0.6%) |
Time of Departure to Work by Sex in Fairmount
The most frequent times of departure to work in Fairmount are 7:30 AM to 7:59 AM (467, 19.7%) for males and 6:30 AM to 6:59 AM (338, 16.5%) for females.
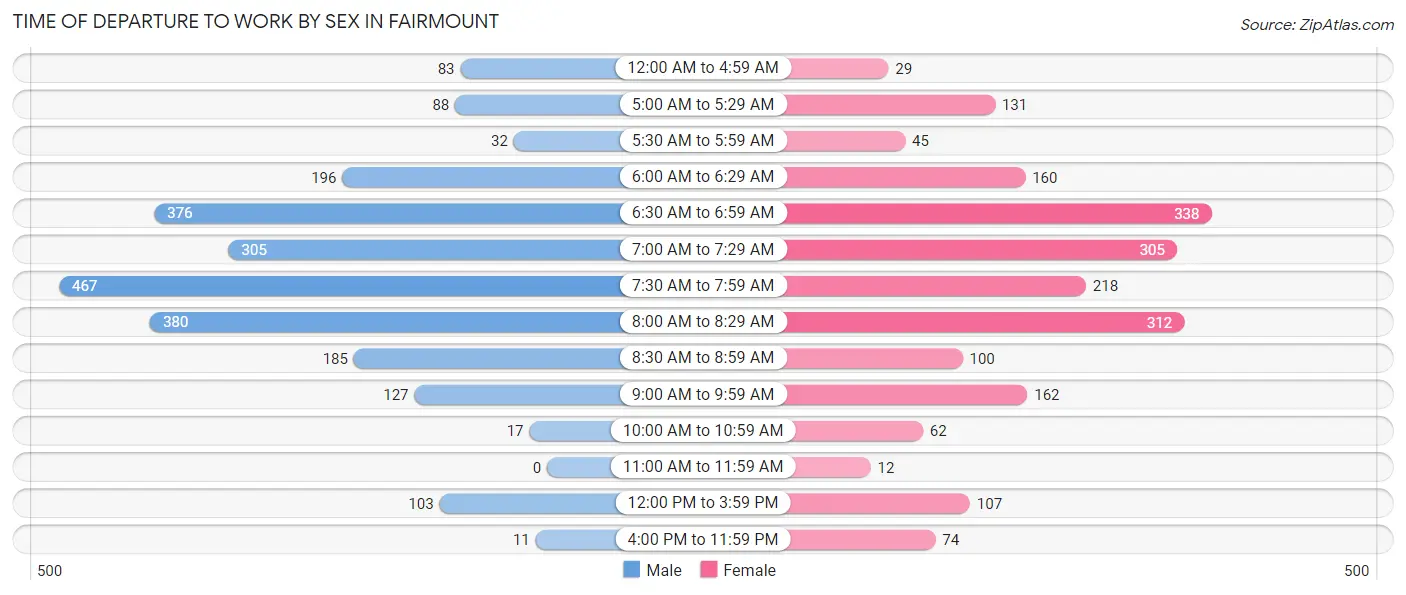
| Time of Departure | Male | Female |
| 12:00 AM to 4:59 AM | 83 (3.5%) | 29 (1.4%) |
| 5:00 AM to 5:29 AM | 88 (3.7%) | 131 (6.4%) |
| 5:30 AM to 5:59 AM | 32 (1.3%) | 45 (2.2%) |
| 6:00 AM to 6:29 AM | 196 (8.3%) | 160 (7.8%) |
| 6:30 AM to 6:59 AM | 376 (15.9%) | 338 (16.5%) |
| 7:00 AM to 7:29 AM | 305 (12.9%) | 305 (14.8%) |
| 7:30 AM to 7:59 AM | 467 (19.7%) | 218 (10.6%) |
| 8:00 AM to 8:29 AM | 380 (16.0%) | 312 (15.2%) |
| 8:30 AM to 8:59 AM | 185 (7.8%) | 100 (4.9%) |
| 9:00 AM to 9:59 AM | 127 (5.4%) | 162 (7.9%) |
| 10:00 AM to 10:59 AM | 17 (0.7%) | 62 (3.0%) |
| 11:00 AM to 11:59 AM | 0 (0.0%) | 12 (0.6%) |
| 12:00 PM to 3:59 PM | 103 (4.3%) | 107 (5.2%) |
| 4:00 PM to 11:59 PM | 11 (0.5%) | 74 (3.6%) |
| Total | 2,370 (100.0%) | 2,055 (100.0%) |
Housing Occupancy in Fairmount
Occupancy by Ownership in Fairmount
Of the total 3,718 dwellings in Fairmount, owner-occupied units account for 3,405 (91.6%), while renter-occupied units make up 313 (8.4%).
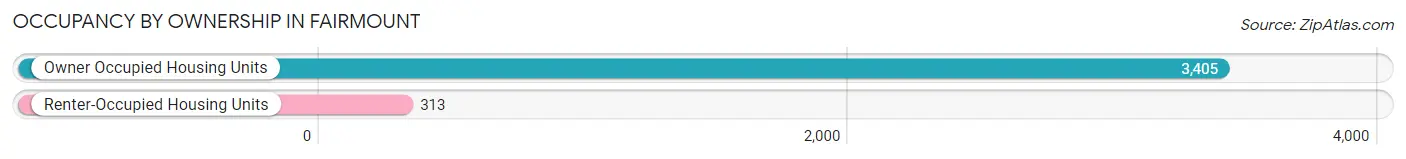
| Occupancy | # Housing Units | % Housing Units |
| Owner Occupied Housing Units | 3,405 | 91.6% |
| Renter-Occupied Housing Units | 313 | 8.4% |
| Total Occupied Housing Units | 3,718 | 100.0% |
Occupancy by Household Size in Fairmount
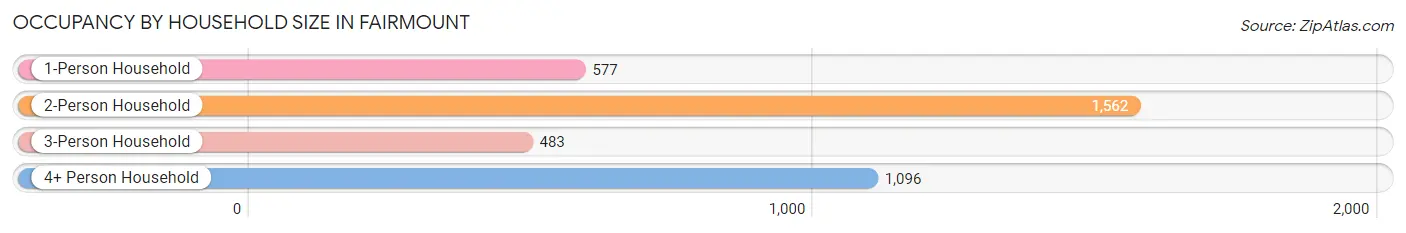
| Household Size | # Housing Units | % Housing Units |
| 1-Person Household | 577 | 15.5% |
| 2-Person Household | 1,562 | 42.0% |
| 3-Person Household | 483 | 13.0% |
| 4+ Person Household | 1,096 | 29.5% |
| Total Housing Units | 3,718 | 100.0% |
Occupancy by Ownership by Household Size in Fairmount
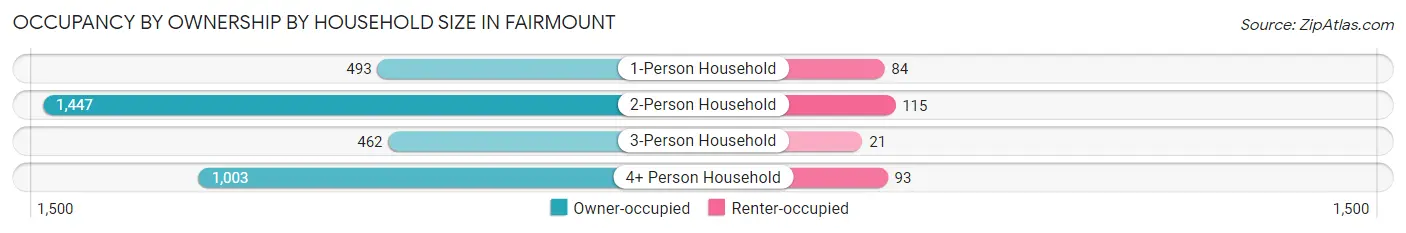
| Household Size | Owner-occupied | Renter-occupied |
| 1-Person Household | 493 (85.4%) | 84 (14.6%) |
| 2-Person Household | 1,447 (92.6%) | 115 (7.4%) |
| 3-Person Household | 462 (95.7%) | 21 (4.3%) |
| 4+ Person Household | 1,003 (91.5%) | 93 (8.5%) |
| Total Housing Units | 3,405 (91.6%) | 313 (8.4%) |
Occupancy by Educational Attainment in Fairmount
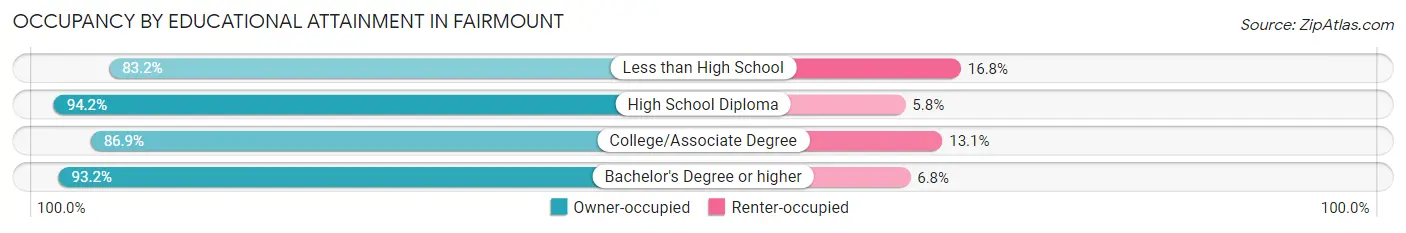
| Household Size | Owner-occupied | Renter-occupied |
| Less than High School | 114 (83.2%) | 23 (16.8%) |
| High School Diploma | 390 (94.2%) | 24 (5.8%) |
| College/Associate Degree | 709 (86.9%) | 107 (13.1%) |
| Bachelor's Degree or higher | 2,192 (93.2%) | 159 (6.8%) |
Occupancy by Age of Householder in Fairmount
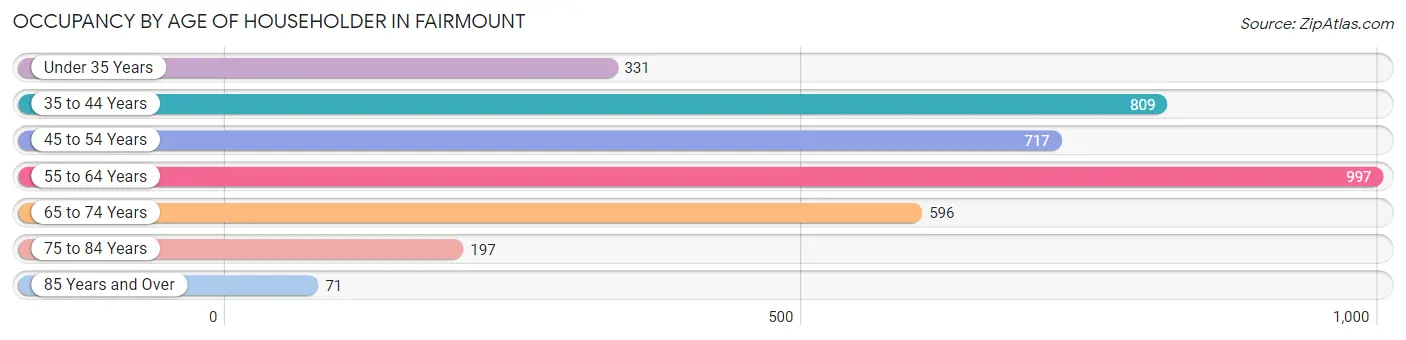
| Age Bracket | # Households | % Households |
| Under 35 Years | 331 | 8.9% |
| 35 to 44 Years | 809 | 21.8% |
| 45 to 54 Years | 717 | 19.3% |
| 55 to 64 Years | 997 | 26.8% |
| 65 to 74 Years | 596 | 16.0% |
| 75 to 84 Years | 197 | 5.3% |
| 85 Years and Over | 71 | 1.9% |
| Total | 3,718 | 100.0% |
Housing Finances in Fairmount
Median Income by Occupancy in Fairmount
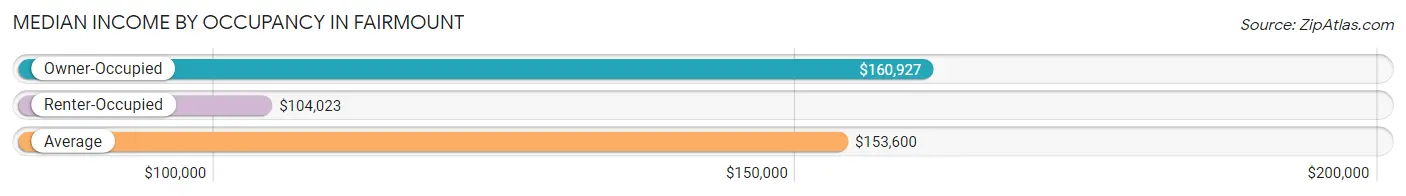
| Occupancy Type | # Households | Median Income |
| Owner-Occupied | 3,405 (91.6%) | $160,927 |
| Renter-Occupied | 313 (8.4%) | $104,023 |
| Average | 3,718 (100.0%) | $153,600 |
Occupancy by Householder Income Bracket in Fairmount
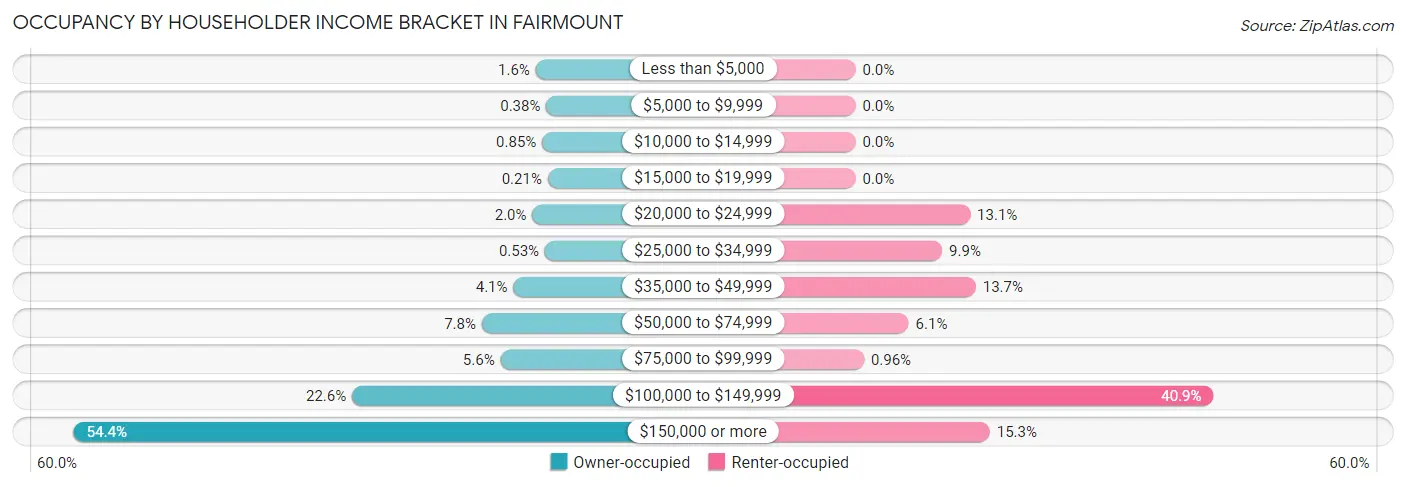
| Income Bracket | Owner-occupied | Renter-occupied |
| Less than $5,000 | 54 (1.6%) | 0 (0.0%) |
| $5,000 to $9,999 | 13 (0.4%) | 0 (0.0%) |
| $10,000 to $14,999 | 29 (0.9%) | 0 (0.0%) |
| $15,000 to $19,999 | 7 (0.2%) | 0 (0.0%) |
| $20,000 to $24,999 | 67 (2.0%) | 41 (13.1%) |
| $25,000 to $34,999 | 18 (0.5%) | 31 (9.9%) |
| $35,000 to $49,999 | 141 (4.1%) | 43 (13.7%) |
| $50,000 to $74,999 | 264 (7.7%) | 19 (6.1%) |
| $75,000 to $99,999 | 191 (5.6%) | 3 (1.0%) |
| $100,000 to $149,999 | 769 (22.6%) | 128 (40.9%) |
| $150,000 or more | 1,852 (54.4%) | 48 (15.3%) |
| Total | 3,405 (100.0%) | 313 (100.0%) |
Monthly Housing Cost Tiers in Fairmount
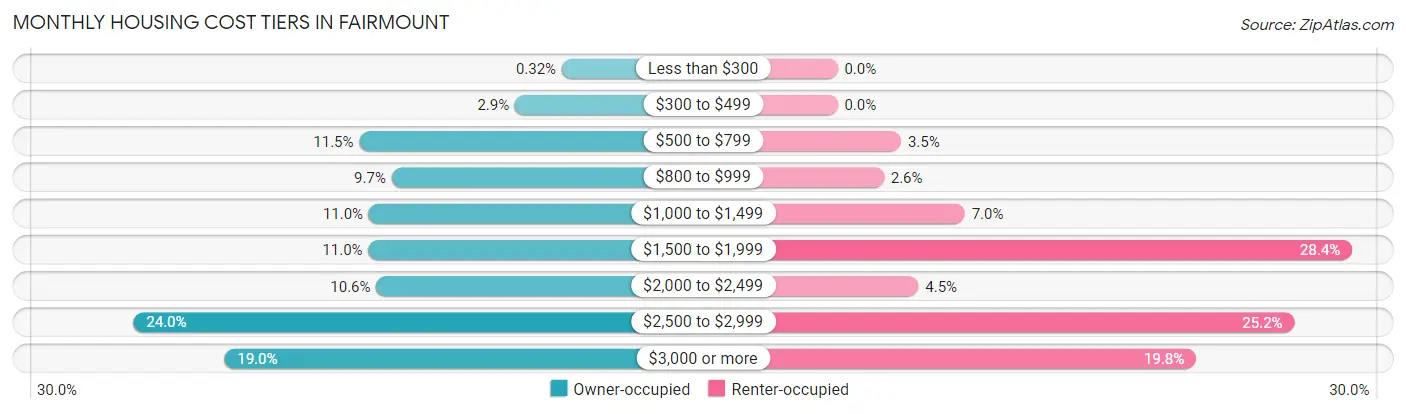
| Monthly Cost | Owner-occupied | Renter-occupied |
| Less than $300 | 11 (0.3%) | 0 (0.0%) |
| $300 to $499 | 99 (2.9%) | 0 (0.0%) |
| $500 to $799 | 392 (11.5%) | 11 (3.5%) |
| $800 to $999 | 331 (9.7%) | 8 (2.6%) |
| $1,000 to $1,499 | 374 (11.0%) | 22 (7.0%) |
| $1,500 to $1,999 | 375 (11.0%) | 89 (28.4%) |
| $2,000 to $2,499 | 360 (10.6%) | 14 (4.5%) |
| $2,500 to $2,999 | 817 (24.0%) | 79 (25.2%) |
| $3,000 or more | 646 (19.0%) | 62 (19.8%) |
| Total | 3,405 (100.0%) | 313 (100.0%) |
Physical Housing Characteristics in Fairmount
Housing Structures in Fairmount
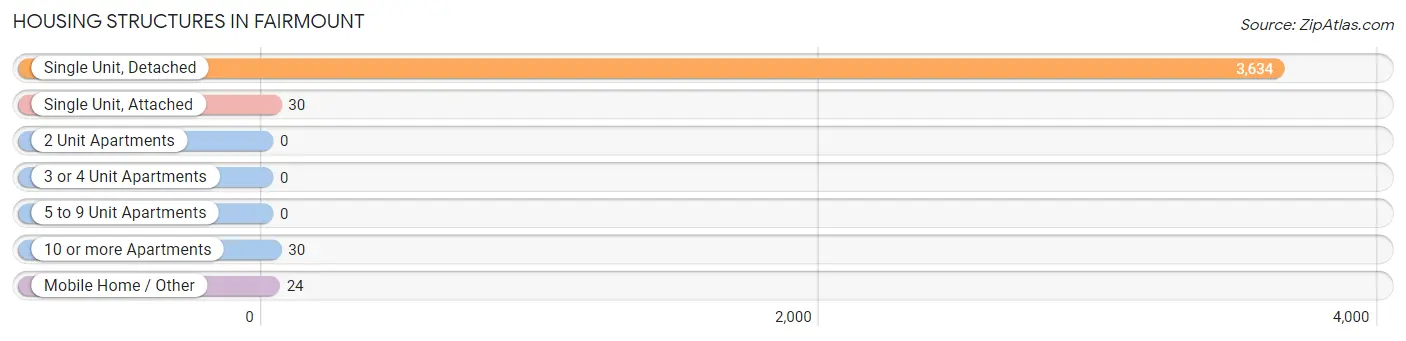
| Structure Type | # Housing Units | % Housing Units |
| Single Unit, Detached | 3,634 | 97.7% |
| Single Unit, Attached | 30 | 0.8% |
| 2 Unit Apartments | 0 | 0.0% |
| 3 or 4 Unit Apartments | 0 | 0.0% |
| 5 to 9 Unit Apartments | 0 | 0.0% |
| 10 or more Apartments | 30 | 0.8% |
| Mobile Home / Other | 24 | 0.6% |
| Total | 3,718 | 100.0% |
Housing Structures by Occupancy in Fairmount
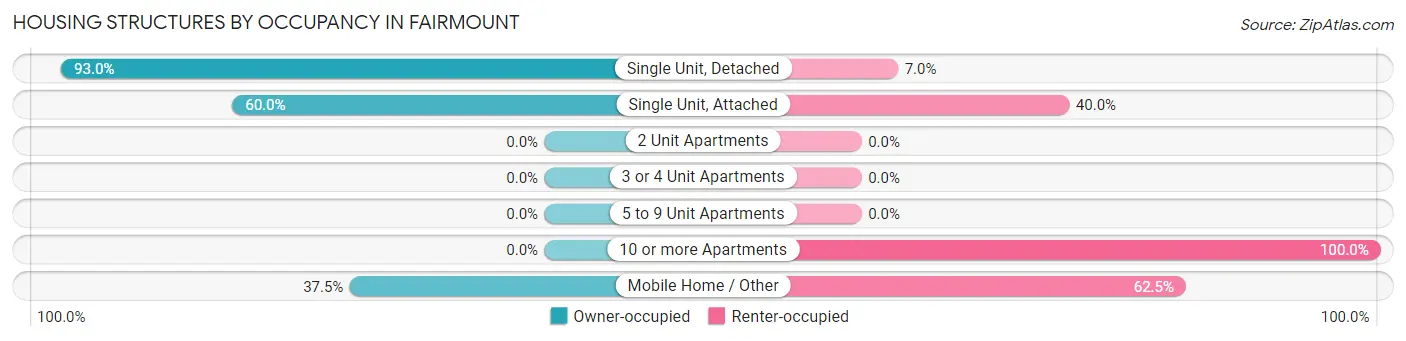
| Structure Type | Owner-occupied | Renter-occupied |
| Single Unit, Detached | 3,378 (93.0%) | 256 (7.0%) |
| Single Unit, Attached | 18 (60.0%) | 12 (40.0%) |
| 2 Unit Apartments | 0 (0.0%) | 0 (0.0%) |
| 3 or 4 Unit Apartments | 0 (0.0%) | 0 (0.0%) |
| 5 to 9 Unit Apartments | 0 (0.0%) | 0 (0.0%) |
| 10 or more Apartments | 0 (0.0%) | 30 (100.0%) |
| Mobile Home / Other | 9 (37.5%) | 15 (62.5%) |
| Total | 3,405 (91.6%) | 313 (8.4%) |
Housing Structures by Number of Rooms in Fairmount
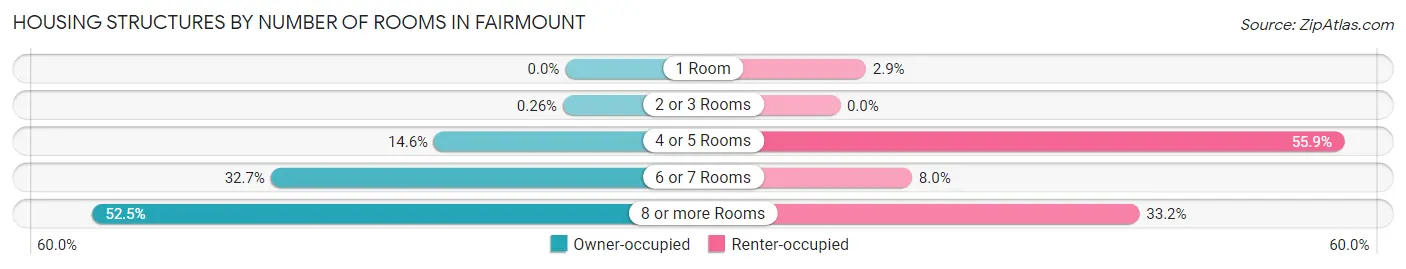
| Number of Rooms | Owner-occupied | Renter-occupied |
| 1 Room | 0 (0.0%) | 9 (2.9%) |
| 2 or 3 Rooms | 9 (0.3%) | 0 (0.0%) |
| 4 or 5 Rooms | 496 (14.6%) | 175 (55.9%) |
| 6 or 7 Rooms | 1,113 (32.7%) | 25 (8.0%) |
| 8 or more Rooms | 1,787 (52.5%) | 104 (33.2%) |
| Total | 3,405 (100.0%) | 313 (100.0%) |
Housing Structure by Heating Type in Fairmount
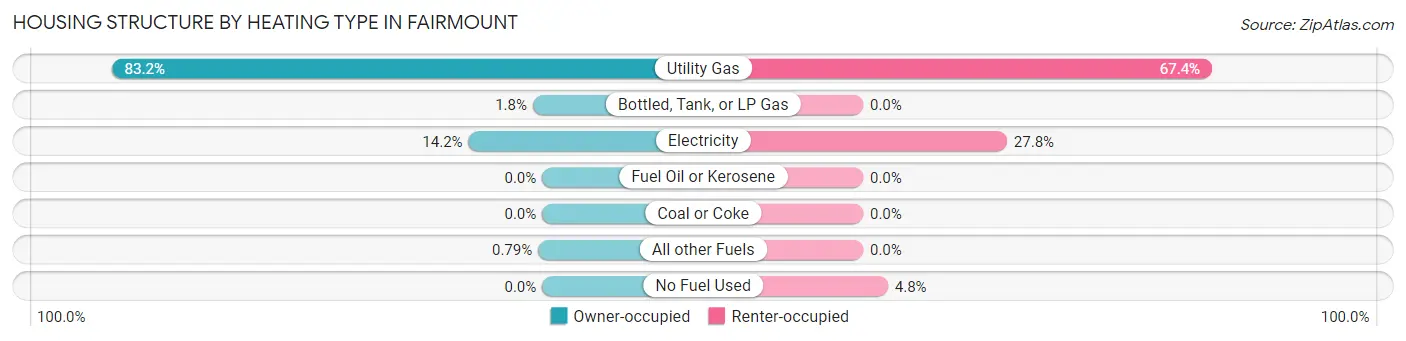
| Heating Type | Owner-occupied | Renter-occupied |
| Utility Gas | 2,832 (83.2%) | 211 (67.4%) |
| Bottled, Tank, or LP Gas | 61 (1.8%) | 0 (0.0%) |
| Electricity | 485 (14.2%) | 87 (27.8%) |
| Fuel Oil or Kerosene | 0 (0.0%) | 0 (0.0%) |
| Coal or Coke | 0 (0.0%) | 0 (0.0%) |
| All other Fuels | 27 (0.8%) | 0 (0.0%) |
| No Fuel Used | 0 (0.0%) | 15 (4.8%) |
| Total | 3,405 (100.0%) | 313 (100.0%) |
Household Vehicle Usage in Fairmount
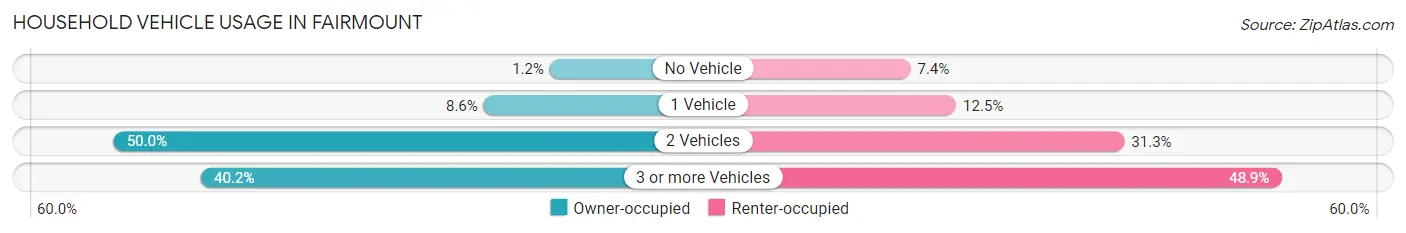
| Vehicles per Household | Owner-occupied | Renter-occupied |
| No Vehicle | 40 (1.2%) | 23 (7.3%) |
| 1 Vehicle | 292 (8.6%) | 39 (12.5%) |
| 2 Vehicles | 1,703 (50.0%) | 98 (31.3%) |
| 3 or more Vehicles | 1,370 (40.2%) | 153 (48.9%) |
| Total | 3,405 (100.0%) | 313 (100.0%) |
Real Estate & Mortgages in Fairmount
Real Estate and Mortgage Overview in Fairmount
| Characteristic | Without Mortgage | With Mortgage |
| Housing Units | 1,003 | 2,402 |
| Median Property Value | $754,100 | $715,700 |
| Median Household Income | $138,831 | $1,373 |
| Monthly Housing Costs | $808 | $646 |
| Real Estate Taxes | $3,964 | $0 |
Property Value by Mortgage Status in Fairmount
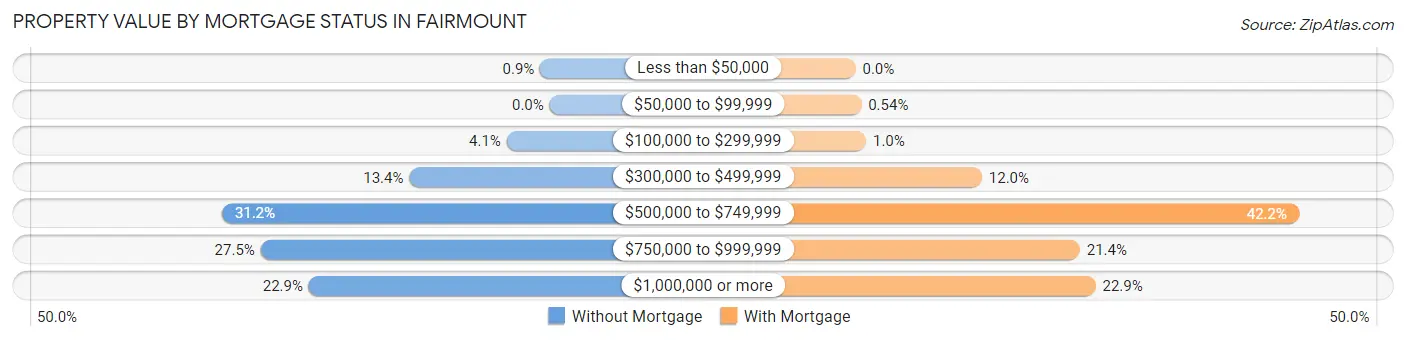
| Property Value | Without Mortgage | With Mortgage |
| Less than $50,000 | 9 (0.9%) | 0 (0.0%) |
| $50,000 to $99,999 | 0 (0.0%) | 13 (0.5%) |
| $100,000 to $299,999 | 41 (4.1%) | 24 (1.0%) |
| $300,000 to $499,999 | 134 (13.4%) | 289 (12.0%) |
| $500,000 to $749,999 | 313 (31.2%) | 1,014 (42.2%) |
| $750,000 to $999,999 | 276 (27.5%) | 513 (21.4%) |
| $1,000,000 or more | 230 (22.9%) | 549 (22.9%) |
| Total | 1,003 (100.0%) | 2,402 (100.0%) |
Household Income by Mortgage Status in Fairmount
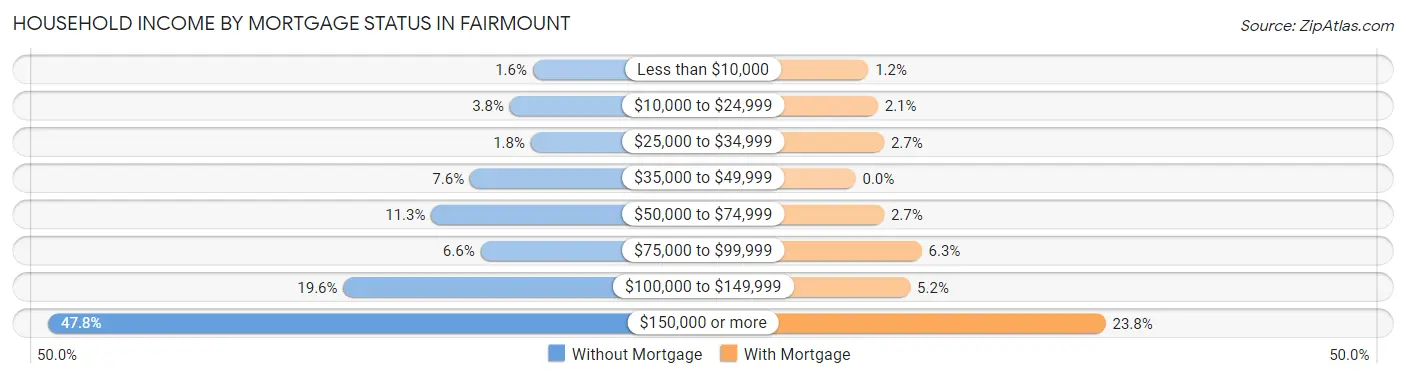
| Household Income | Without Mortgage | With Mortgage |
| Less than $10,000 | 16 (1.6%) | 29 (1.2%) |
| $10,000 to $24,999 | 38 (3.8%) | 51 (2.1%) |
| $25,000 to $34,999 | 18 (1.8%) | 65 (2.7%) |
| $35,000 to $49,999 | 76 (7.6%) | 0 (0.0%) |
| $50,000 to $74,999 | 113 (11.3%) | 65 (2.7%) |
| $75,000 to $99,999 | 66 (6.6%) | 151 (6.3%) |
| $100,000 to $149,999 | 197 (19.6%) | 125 (5.2%) |
| $150,000 or more | 479 (47.8%) | 572 (23.8%) |
| Total | 1,003 (100.0%) | 2,402 (100.0%) |
Property Value to Household Income Ratio in Fairmount
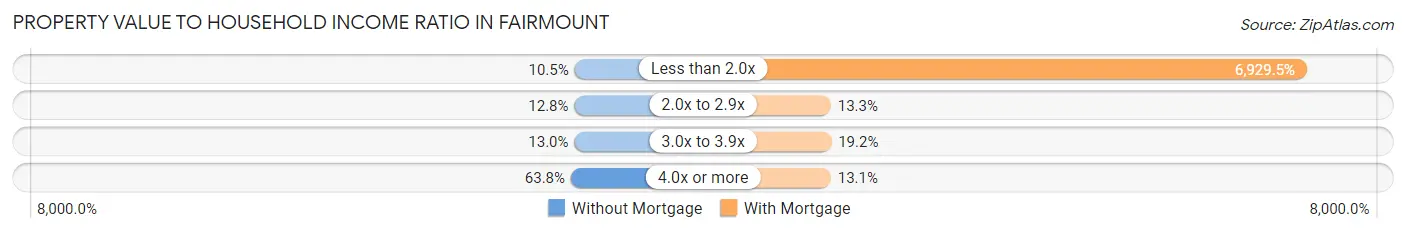
| Value-to-Income Ratio | Without Mortgage | With Mortgage |
| Less than 2.0x | 105 (10.5%) | 166,447 (6,929.5%) |
| 2.0x to 2.9x | 128 (12.8%) | 319 (13.3%) |
| 3.0x to 3.9x | 130 (13.0%) | 461 (19.2%) |
| 4.0x or more | 640 (63.8%) | 314 (13.1%) |
| Total | 1,003 (100.0%) | 2,402 (100.0%) |
Real Estate Taxes by Mortgage Status in Fairmount
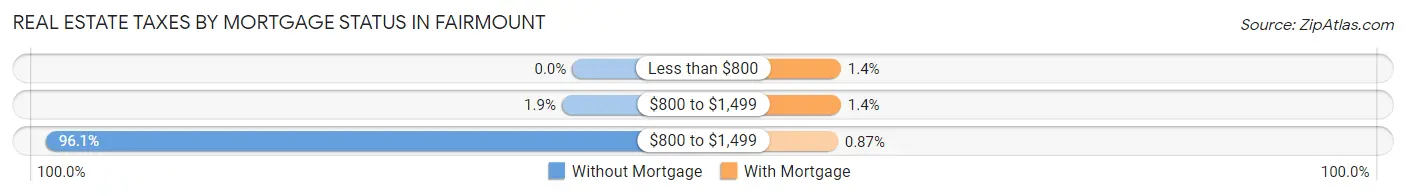
| Property Taxes | Without Mortgage | With Mortgage |
| Less than $800 | 0 (0.0%) | 34 (1.4%) |
| $800 to $1,499 | 19 (1.9%) | 34 (1.4%) |
| $800 to $1,499 | 964 (96.1%) | 21 (0.9%) |
| Total | 1,003 (100.0%) | 2,402 (100.0%) |
Health & Disability in Fairmount
Health Insurance Coverage by Age in Fairmount
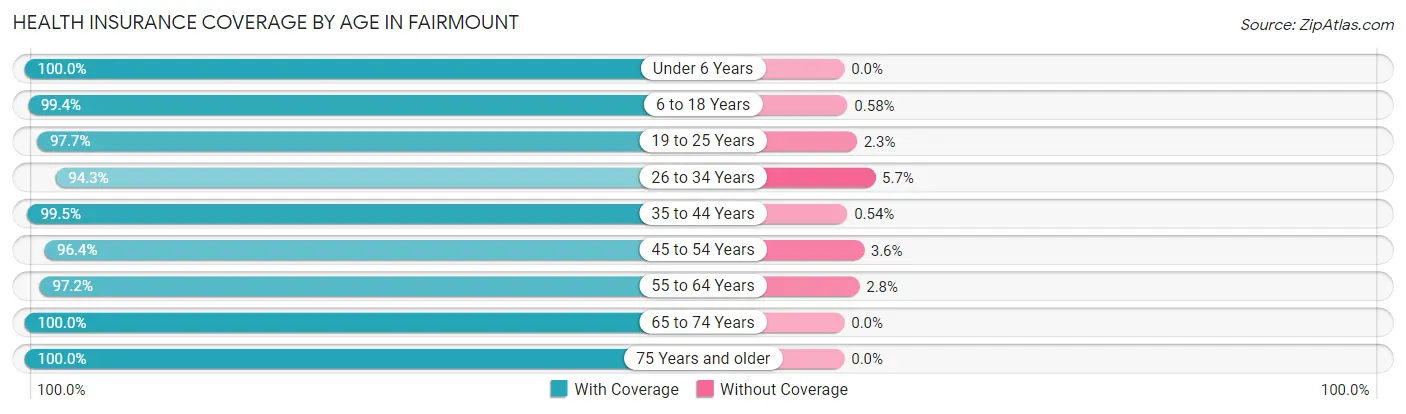
| Age Bracket | With Coverage | Without Coverage |
| Under 6 Years | 775 (100.0%) | 0 (0.0%) |
| 6 to 18 Years | 1,717 (99.4%) | 10 (0.6%) |
| 19 to 25 Years | 632 (97.7%) | 15 (2.3%) |
| 26 to 34 Years | 739 (94.3%) | 45 (5.7%) |
| 35 to 44 Years | 1,478 (99.5%) | 8 (0.5%) |
| 45 to 54 Years | 1,541 (96.4%) | 58 (3.6%) |
| 55 to 64 Years | 1,780 (97.2%) | 51 (2.8%) |
| 65 to 74 Years | 975 (100.0%) | 0 (0.0%) |
| 75 Years and older | 573 (100.0%) | 0 (0.0%) |
| Total | 10,210 (98.2%) | 187 (1.8%) |
Health Insurance Coverage by Citizenship Status in Fairmount
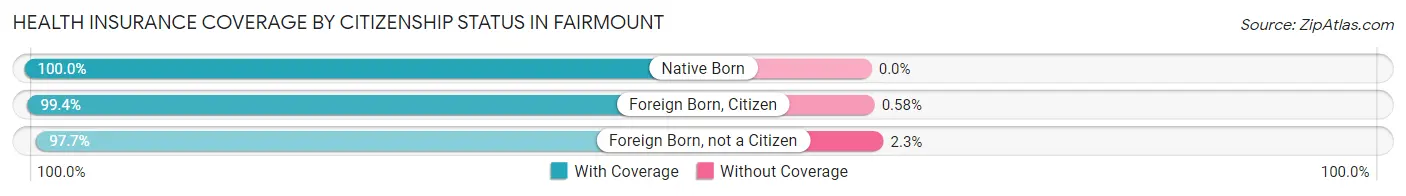
| Citizenship Status | With Coverage | Without Coverage |
| Native Born | 775 (100.0%) | 0 (0.0%) |
| Foreign Born, Citizen | 1,717 (99.4%) | 10 (0.6%) |
| Foreign Born, not a Citizen | 632 (97.7%) | 15 (2.3%) |
Health Insurance Coverage by Household Income in Fairmount
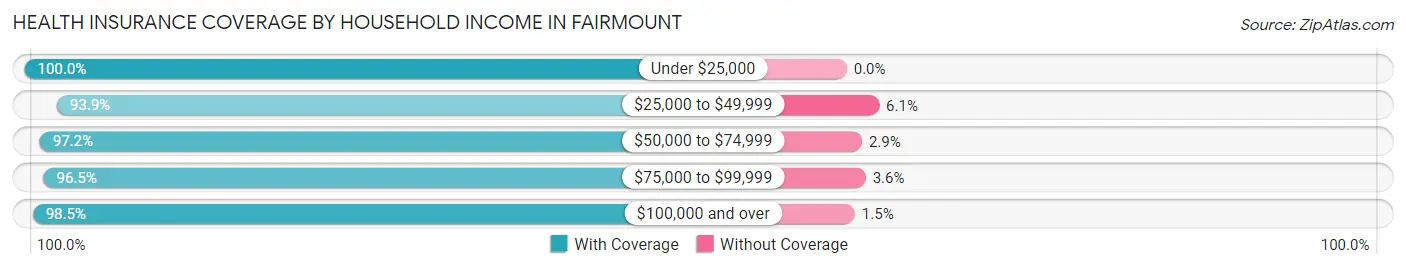
| Household Income | With Coverage | Without Coverage |
| Under $25,000 | 324 (100.0%) | 0 (0.0%) |
| $25,000 to $49,999 | 372 (93.9%) | 24 (6.1%) |
| $50,000 to $74,999 | 717 (97.2%) | 21 (2.9%) |
| $75,000 to $99,999 | 380 (96.5%) | 14 (3.5%) |
| $100,000 and over | 8,316 (98.5%) | 128 (1.5%) |
Public vs Private Health Insurance Coverage by Age in Fairmount
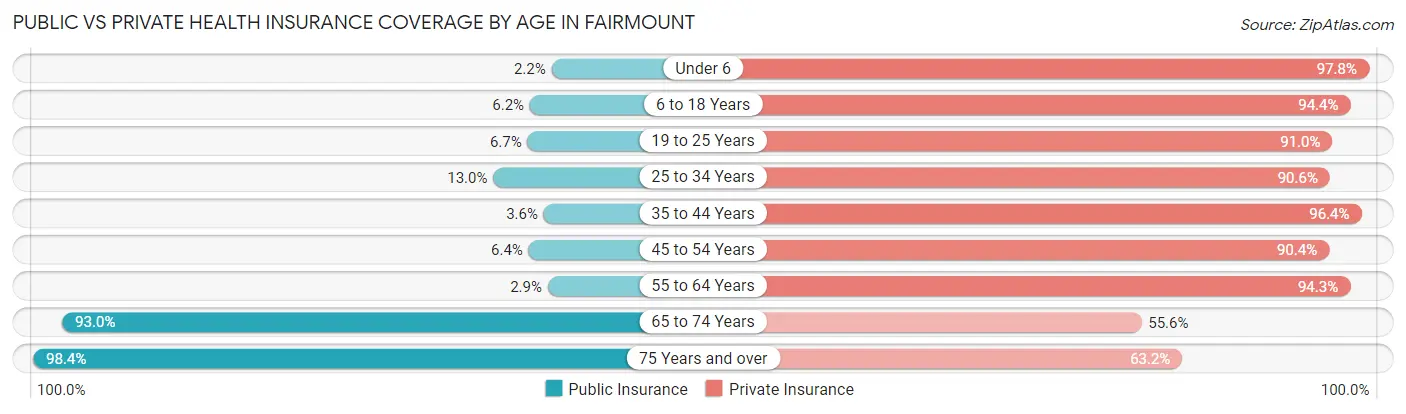
| Age Bracket | Public Insurance | Private Insurance |
| Under 6 | 17 (2.2%) | 758 (97.8%) |
| 6 to 18 Years | 107 (6.2%) | 1,630 (94.4%) |
| 19 to 25 Years | 43 (6.7%) | 589 (91.0%) |
| 25 to 34 Years | 102 (13.0%) | 710 (90.6%) |
| 35 to 44 Years | 54 (3.6%) | 1,433 (96.4%) |
| 45 to 54 Years | 103 (6.4%) | 1,446 (90.4%) |
| 55 to 64 Years | 53 (2.9%) | 1,727 (94.3%) |
| 65 to 74 Years | 907 (93.0%) | 542 (55.6%) |
| 75 Years and over | 564 (98.4%) | 362 (63.2%) |
| Total | 1,950 (18.8%) | 9,197 (88.5%) |
Disability Status by Sex by Age in Fairmount
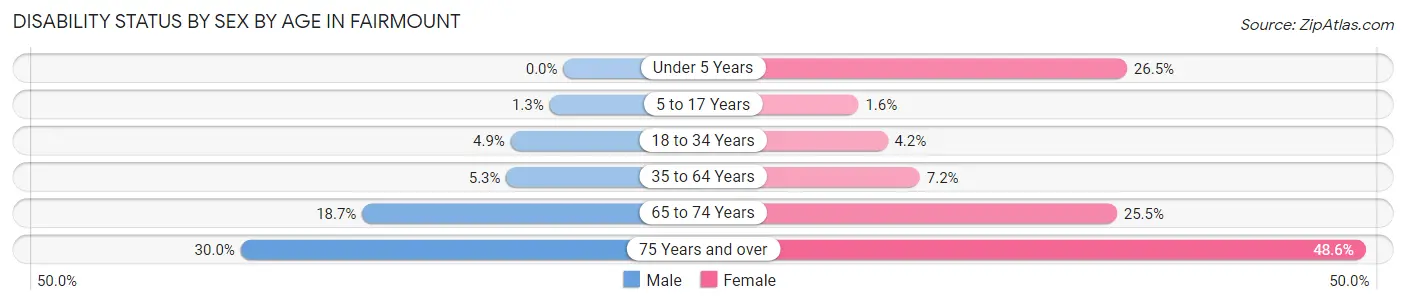
| Age Bracket | Male | Female |
| Under 5 Years | 0 (0.0%) | 109 (26.5%) |
| 5 to 17 Years | 9 (1.3%) | 16 (1.5%) |
| 18 to 34 Years | 34 (4.9%) | 37 (4.2%) |
| 35 to 64 Years | 130 (5.3%) | 178 (7.2%) |
| 65 to 74 Years | 84 (18.7%) | 134 (25.5%) |
| 75 Years and over | 65 (29.9%) | 173 (48.6%) |
Disability Class by Sex by Age in Fairmount
Disability Class: Hearing Difficulty
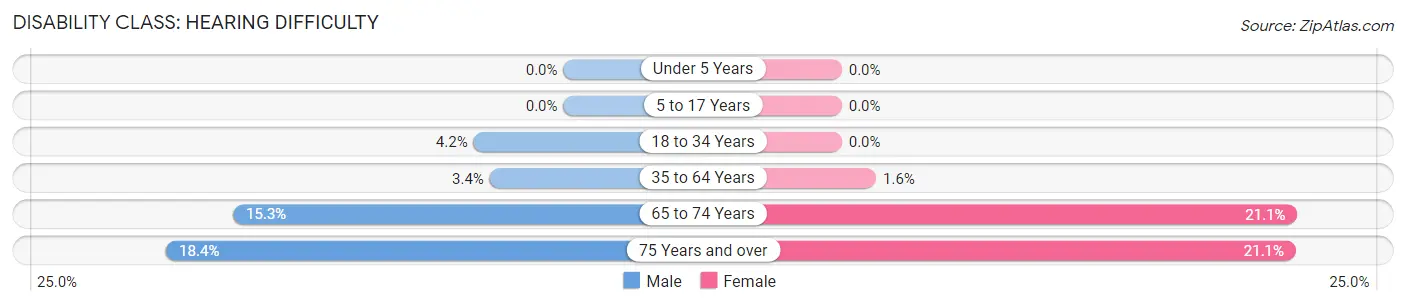
| Age Bracket | Male | Female |
| Under 5 Years | 0 (0.0%) | 0 (0.0%) |
| 5 to 17 Years | 0 (0.0%) | 0 (0.0%) |
| 18 to 34 Years | 29 (4.2%) | 0 (0.0%) |
| 35 to 64 Years | 84 (3.4%) | 39 (1.6%) |
| 65 to 74 Years | 69 (15.3%) | 111 (21.1%) |
| 75 Years and over | 40 (18.4%) | 75 (21.1%) |
Disability Class: Vision Difficulty
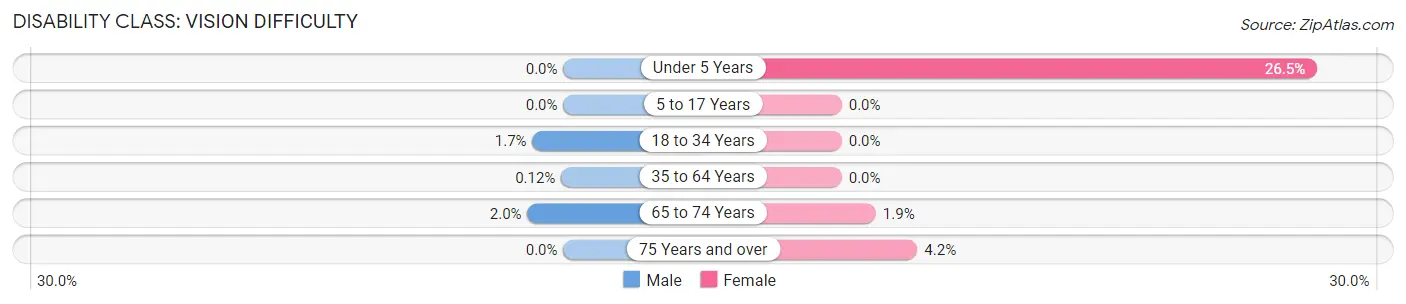
| Age Bracket | Male | Female |
| Under 5 Years | 0 (0.0%) | 109 (26.5%) |
| 5 to 17 Years | 0 (0.0%) | 0 (0.0%) |
| 18 to 34 Years | 12 (1.7%) | 0 (0.0%) |
| 35 to 64 Years | 3 (0.1%) | 0 (0.0%) |
| 65 to 74 Years | 9 (2.0%) | 10 (1.9%) |
| 75 Years and over | 0 (0.0%) | 15 (4.2%) |
Disability Class: Cognitive Difficulty
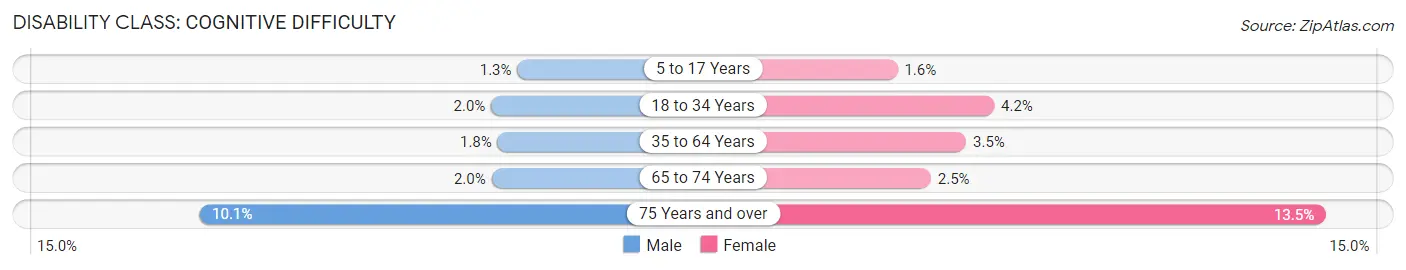
| Age Bracket | Male | Female |
| 5 to 17 Years | 9 (1.3%) | 16 (1.5%) |
| 18 to 34 Years | 14 (2.0%) | 37 (4.2%) |
| 35 to 64 Years | 45 (1.8%) | 85 (3.5%) |
| 65 to 74 Years | 9 (2.0%) | 13 (2.5%) |
| 75 Years and over | 22 (10.1%) | 48 (13.5%) |
Disability Class: Ambulatory Difficulty
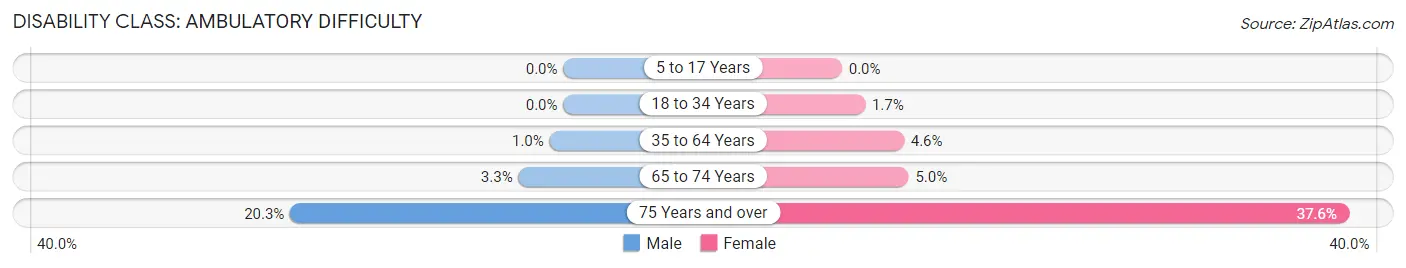
| Age Bracket | Male | Female |
| 5 to 17 Years | 0 (0.0%) | 0 (0.0%) |
| 18 to 34 Years | 0 (0.0%) | 15 (1.7%) |
| 35 to 64 Years | 25 (1.0%) | 113 (4.6%) |
| 65 to 74 Years | 15 (3.3%) | 26 (5.0%) |
| 75 Years and over | 44 (20.3%) | 134 (37.6%) |
Disability Class: Self-Care Difficulty
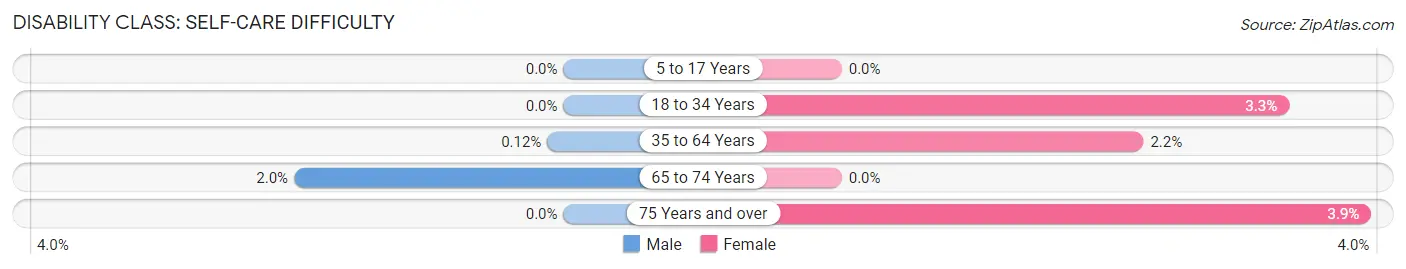
| Age Bracket | Male | Female |
| 5 to 17 Years | 0 (0.0%) | 0 (0.0%) |
| 18 to 34 Years | 0 (0.0%) | 29 (3.3%) |
| 35 to 64 Years | 3 (0.1%) | 55 (2.2%) |
| 65 to 74 Years | 9 (2.0%) | 0 (0.0%) |
| 75 Years and over | 0 (0.0%) | 14 (3.9%) |
Technology Access in Fairmount
Computing Device Access in Fairmount
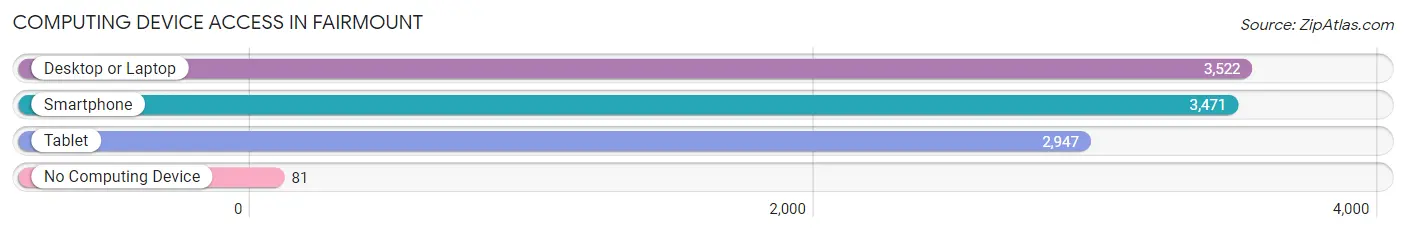
| Device Type | # Households | % Households |
| Desktop or Laptop | 3,522 | 94.7% |
| Smartphone | 3,471 | 93.4% |
| Tablet | 2,947 | 79.3% |
| No Computing Device | 81 | 2.2% |
| Total | 3,718 | 100.0% |
Internet Access in Fairmount
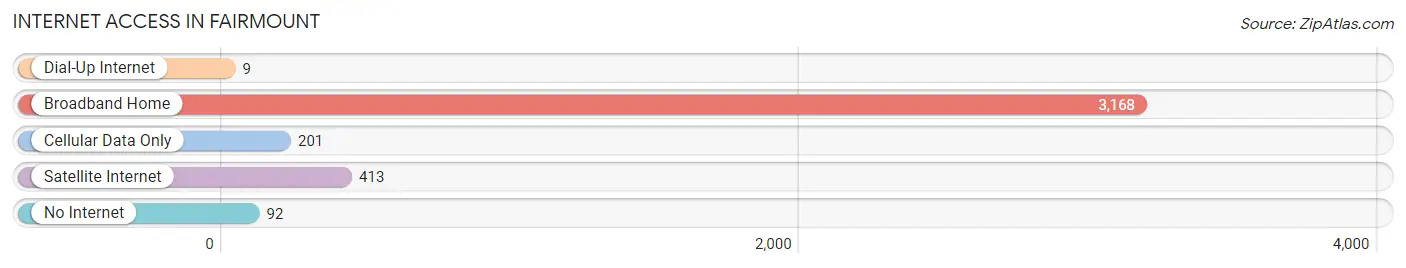
| Internet Type | # Households | % Households |
| Dial-Up Internet | 9 | 0.2% |
| Broadband Home | 3,168 | 85.2% |
| Cellular Data Only | 201 | 5.4% |
| Satellite Internet | 413 | 11.1% |
| No Internet | 92 | 2.5% |
| Total | 3,718 | 100.0% |
Fairmount Summary
Introduction
Fairmount is a small town located in the San Luis Valley of Colorado. It is situated in the northern part of the valley, near the Rio Grande River. The town was founded in 1881 and has a population of approximately 500 people. The town is known for its rich history, beautiful scenery, and unique culture.
History
Fairmount was founded in 1881 by a group of settlers from the Midwest. The settlers were looking for a place to settle and start a new life. They chose the San Luis Valley because of its fertile soil and abundant water. The town was named after the nearby Fairmount Hill, which was named after the nearby Fairmount Park in Chicago.
The town quickly grew and became a thriving community. The first school was built in 1883 and the first church was built in 1885. The town also had a post office, a general store, and a blacksmith shop.
In the early 1900s, the town began to experience a decline in population. This was due to the Great Depression and the Dust Bowl. Many of the town’s residents moved away in search of better opportunities.
In the 1950s, the town began to experience a resurgence in population. This was due to the development of the nearby ski resort, Wolf Creek Ski Area. The ski resort brought in many new visitors and residents to the area.
Geography
Fairmount is located in the San Luis Valley of Colorado. The town is situated in the northern part of the valley, near the Rio Grande River. The town is surrounded by mountains, including the Sangre de Cristo Mountains to the east and the San Juan Mountains to the west.
The town is located at an elevation of 7,800 feet above sea level. The climate in the area is semi-arid, with hot summers and cold winters. The average annual precipitation is approximately 12 inches.
Economy
The economy of Fairmount is largely based on tourism. The town is home to the Wolf Creek Ski Area, which attracts visitors from all over the world. The ski area is the largest in Colorado and is known for its excellent skiing and snowboarding conditions.
The town also has a number of other businesses, including restaurants, shops, and lodging. The town is also home to a number of small farms and ranches.
Demographics
As of the 2010 census, the population of Fairmount was 498. The racial makeup of the town was 95.2% White, 0.2% African American, 0.4% Native American, 0.2% Asian, 0.2% Pacific Islander, and 3.8% from other races.
The median household income in Fairmount was $37,500, and the median family income was $41,250. The per capita income was $17,500.
Conclusion
Fairmount is a small town located in the San Luis Valley of Colorado. The town has a rich history, beautiful scenery, and unique culture. The economy of the town is largely based on tourism, with the Wolf Creek Ski Area being the main attraction. The town has a population of approximately 500 people, with a median household income of $37,500.
Common Questions
What is Per Capita Income in Fairmount?
Per Capita income in Fairmount is $68,135.
What is the Median Family Income in Fairmount?
Median Family Income in Fairmount is $169,268.
What is the Median Household income in Fairmount?
Median Household Income in Fairmount is $153,600.
What is Income or Wage Gap in Fairmount?
Income or Wage Gap in Fairmount is 43.2%.
Women in Fairmount earn 56.8 cents for every dollar earned by a man.
What is Inequality or Gini Index in Fairmount?
Inequality or Gini Index in Fairmount is 0.39.
What is the Total Population of Fairmount?
Total Population of Fairmount is 10,398.
What is the Total Male Population of Fairmount?
Total Male Population of Fairmount is 4,742.
What is the Total Female Population of Fairmount?
Total Female Population of Fairmount is 5,656.
What is the Ratio of Males per 100 Females in Fairmount?
There are 83.84 Males per 100 Females in Fairmount.
What is the Ratio of Females per 100 Males in Fairmount?
There are 119.27 Females per 100 Males in Fairmount.
What is the Median Population Age in Fairmount?
Median Population Age in Fairmount is 42.5 Years.
What is the Average Family Size in Fairmount
Average Family Size in Fairmount is 3.1 People.
What is the Average Household Size in Fairmount
Average Household Size in Fairmount is 2.8 People.
How Large is the Labor Force in Fairmount?
There are 5,664 People in the Labor Forcein in Fairmount.
What is the Percentage of People in the Labor Force in Fairmount?
67.5% of People are in the Labor Force in Fairmount.
What is the Unemployment Rate in Fairmount?
Unemployment Rate in Fairmount is 2.4%.