Perry Park, CO Map & Demographics
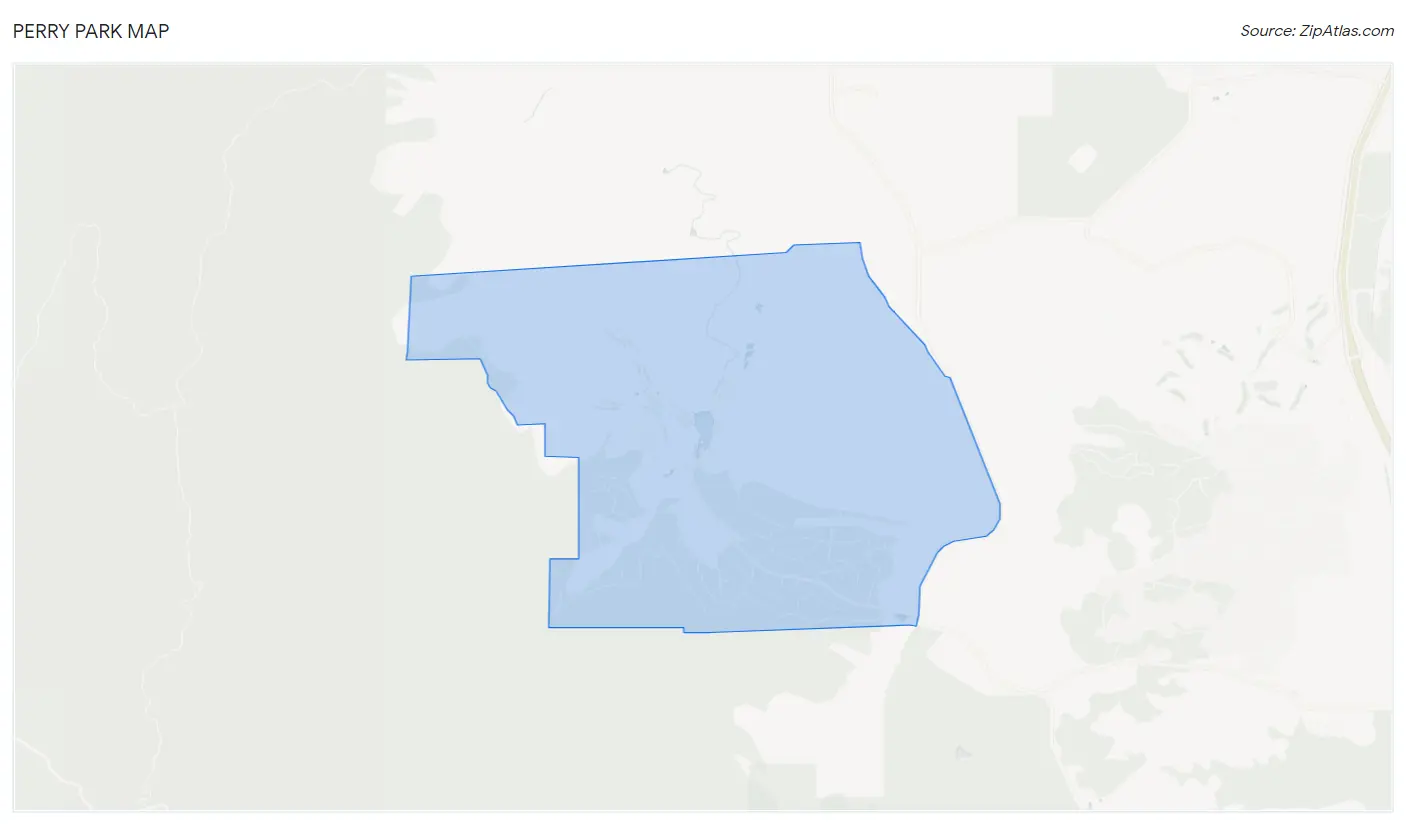
Perry Park Map
Perry Park Overview
$71,463
PER CAPITA INCOME
$149,231
AVG FAMILY INCOME
$147,548
AVG HOUSEHOLD INCOME
24.3%
WAGE / INCOME GAP [ % ]
75.7¢/ $1
WAGE / INCOME GAP [ $ ]
0.34
INEQUALITY / GINI INDEX
1,712
TOTAL POPULATION
933
MALE POPULATION
779
FEMALE POPULATION
119.77
MALES / 100 FEMALES
83.49
FEMALES / 100 MALES
57.2
MEDIAN AGE
2.6
AVG FAMILY SIZE
2.3
AVG HOUSEHOLD SIZE
900
LABOR FORCE [ PEOPLE ]
58.5%
PERCENT IN LABOR FORCE
Income in Perry Park
Income Overview in Perry Park
Per Capita Income in Perry Park is $71,463, while median incomes of families and households are $149,231 and $147,548 respectively.
| Characteristic | Number | Measure |
| Per Capita Income | 1,712 | $71,463 |
| Median Family Income | 602 | $149,231 |
| Mean Family Income | 602 | $165,794 |
| Median Household Income | 733 | $147,548 |
| Mean Household Income | 733 | $164,077 |
| Income Deficit | 602 | $0 |
| Wage / Income Gap (%) | 1,712 | 24.33% |
| Wage / Income Gap ($) | 1,712 | 75.67¢ per $1 |
| Gini / Inequality Index | 1,712 | 0.34 |
Earnings by Sex in Perry Park
Average Earnings in Perry Park are $73,902, $81,838 for men and $61,927 for women, a difference of 24.3%.
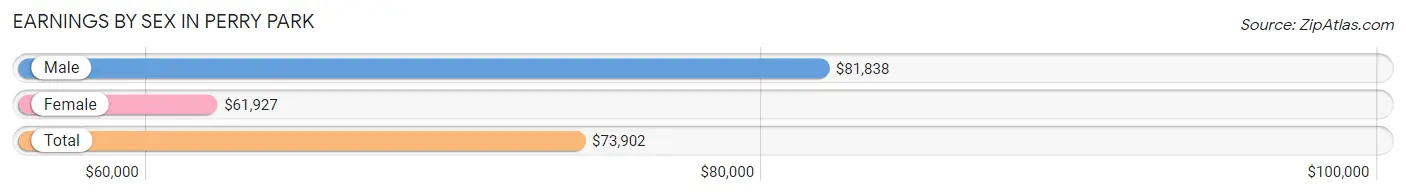
| Sex | Number | Average Earnings |
| Male | 531 (54.8%) | $81,838 |
| Female | 438 (45.2%) | $61,927 |
| Total | 969 (100.0%) | $73,902 |
Earnings by Sex by Income Bracket in Perry Park
The most common earnings brackets in Perry Park are $100,000+ for men (200 | 37.7%) and $100,000+ for women (98 | 22.4%).
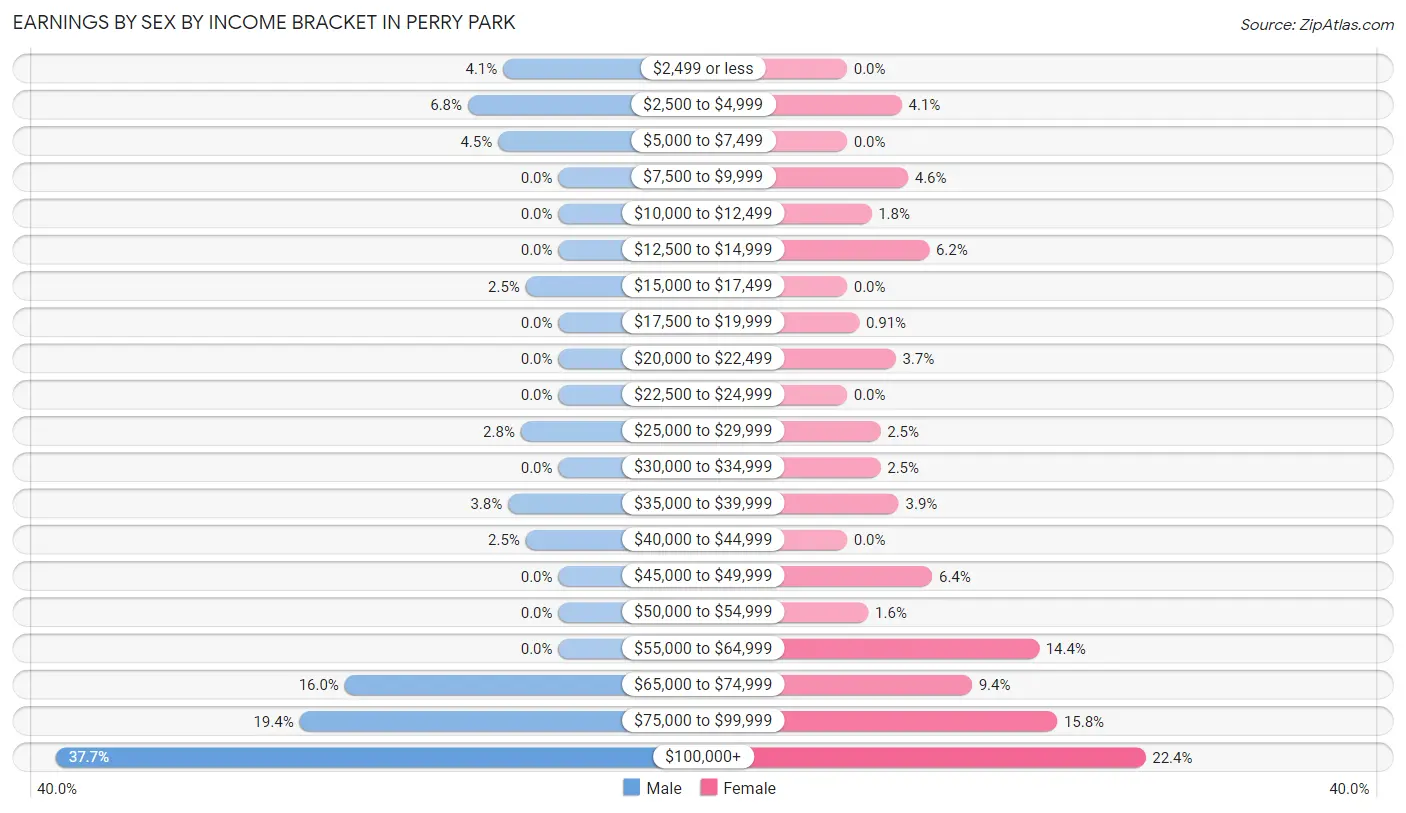
| Income | Male | Female |
| $2,499 or less | 22 (4.1%) | 0 (0.0%) |
| $2,500 to $4,999 | 36 (6.8%) | 18 (4.1%) |
| $5,000 to $7,499 | 24 (4.5%) | 0 (0.0%) |
| $7,500 to $9,999 | 0 (0.0%) | 20 (4.6%) |
| $10,000 to $12,499 | 0 (0.0%) | 8 (1.8%) |
| $12,500 to $14,999 | 0 (0.0%) | 27 (6.2%) |
| $15,000 to $17,499 | 13 (2.5%) | 0 (0.0%) |
| $17,500 to $19,999 | 0 (0.0%) | 4 (0.9%) |
| $20,000 to $22,499 | 0 (0.0%) | 16 (3.6%) |
| $22,500 to $24,999 | 0 (0.0%) | 0 (0.0%) |
| $25,000 to $29,999 | 15 (2.8%) | 11 (2.5%) |
| $30,000 to $34,999 | 0 (0.0%) | 11 (2.5%) |
| $35,000 to $39,999 | 20 (3.8%) | 17 (3.9%) |
| $40,000 to $44,999 | 13 (2.5%) | 0 (0.0%) |
| $45,000 to $49,999 | 0 (0.0%) | 28 (6.4%) |
| $50,000 to $54,999 | 0 (0.0%) | 7 (1.6%) |
| $55,000 to $64,999 | 0 (0.0%) | 63 (14.4%) |
| $65,000 to $74,999 | 85 (16.0%) | 41 (9.4%) |
| $75,000 to $99,999 | 103 (19.4%) | 69 (15.8%) |
| $100,000+ | 200 (37.7%) | 98 (22.4%) |
| Total | 531 (100.0%) | 438 (100.0%) |
Earnings by Sex by Educational Attainment in Perry Park
Average earnings in Perry Park are $89,107 for men and $62,396 for women, a difference of 30.0%. Men with an educational attainment of bachelor's degree enjoy the highest average annual earnings of $104,500, while those with high school diploma education earn the least with $66,310. Women with an educational attainment of graduate degree earn the most with the average annual earnings of $89,107, while those with college or associate's degree education have the smallest earnings of $59,875.
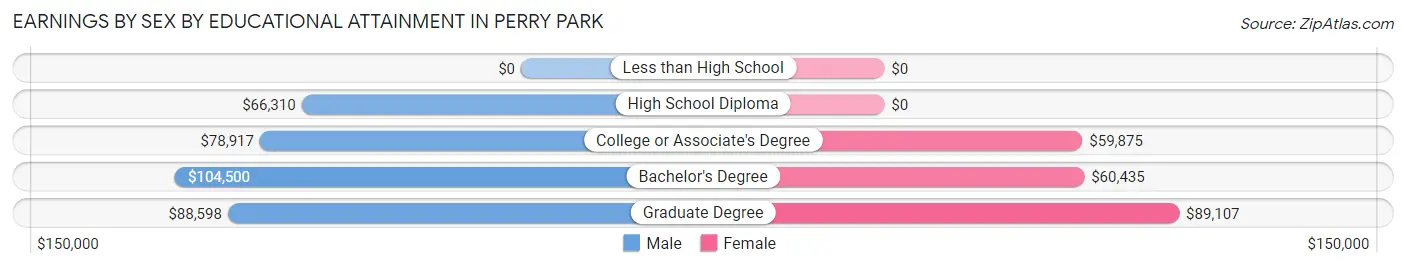
| Educational Attainment | Male Income | Female Income |
| Less than High School | - | - |
| High School Diploma | $66,310 | $0 |
| College or Associate's Degree | $78,917 | $59,875 |
| Bachelor's Degree | $104,500 | $60,435 |
| Graduate Degree | $88,598 | $89,107 |
| Total | $89,107 | $62,396 |
Family Income in Perry Park
Family Income Brackets in Perry Park
According to the Perry Park family income data, there are 183 families falling into the $200,000+ income range, which is the most common income bracket and makes up 30.4% of all families.
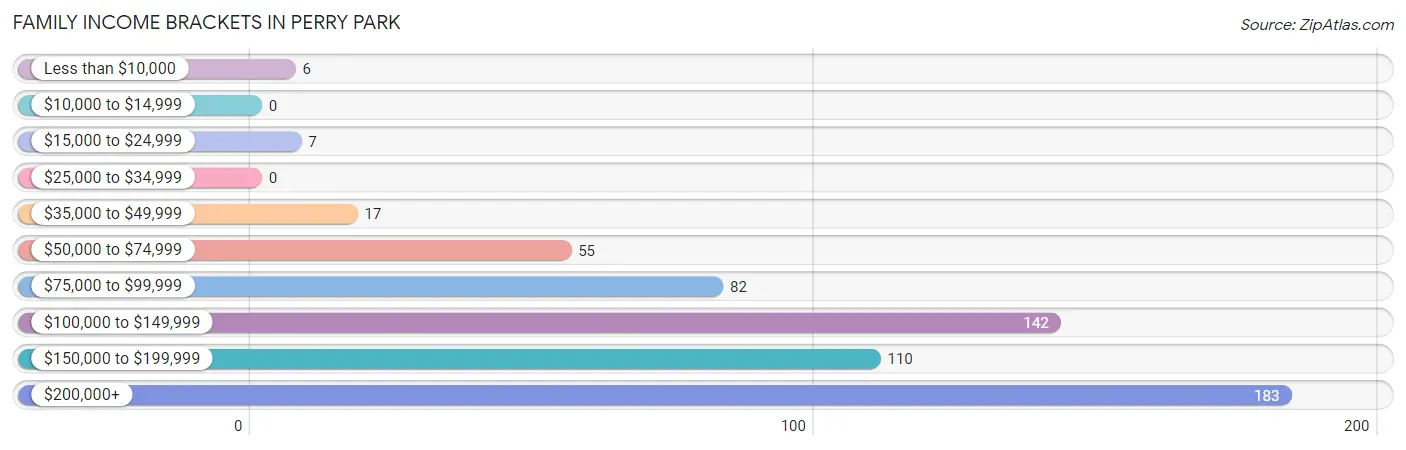
| Income Bracket | # Families | % Families |
| Less than $10,000 | 6 | 1.0% |
| $10,000 to $14,999 | 0 | 0.0% |
| $15,000 to $24,999 | 7 | 1.2% |
| $25,000 to $34,999 | 0 | 0.0% |
| $35,000 to $49,999 | 17 | 2.8% |
| $50,000 to $74,999 | 55 | 9.1% |
| $75,000 to $99,999 | 82 | 13.6% |
| $100,000 to $149,999 | 142 | 23.6% |
| $150,000 to $199,999 | 110 | 18.3% |
| $200,000+ | 183 | 30.4% |
Family Income by Famaliy Size in Perry Park
2-person families (439 | 72.9%) account for the highest median family income in Perry Park with $148,125 per family, while 2-person families (439 | 72.9%) have the highest median income of $74,062 per family member.
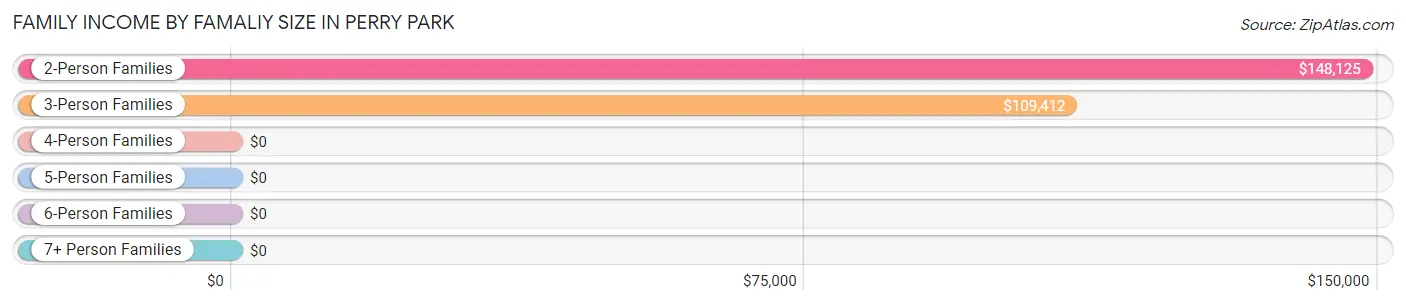
| Income Bracket | # Families | Median Income |
| 2-Person Families | 439 (72.9%) | $148,125 |
| 3-Person Families | 98 (16.3%) | $109,412 |
| 4-Person Families | 0 (0.0%) | $0 |
| 5-Person Families | 51 (8.5%) | $0 |
| 6-Person Families | 0 (0.0%) | $0 |
| 7+ Person Families | 14 (2.3%) | $0 |
| Total | 602 (100.0%) | $149,231 |
Family Income by Number of Earners in Perry Park
The median family income in Perry Park is $149,231, with families comprising 3+ earners (53) having the highest median family income of $233,580, while families with no earners (144) have the lowest median family income of $109,667, accounting for 8.8% and 23.9% of families, respectively.
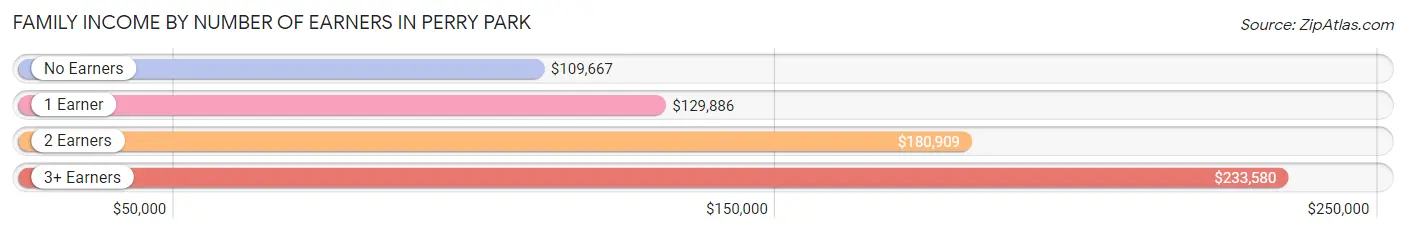
| Number of Earners | # Families | Median Income |
| No Earners | 144 (23.9%) | $109,667 |
| 1 Earner | 151 (25.1%) | $129,886 |
| 2 Earners | 254 (42.2%) | $180,909 |
| 3+ Earners | 53 (8.8%) | $233,580 |
| Total | 602 (100.0%) | $149,231 |
Household Income in Perry Park
Household Income Brackets in Perry Park
With 212 households falling in the category, the $200,000+ income range is the most frequent in Perry Park, accounting for 28.9% of all households.
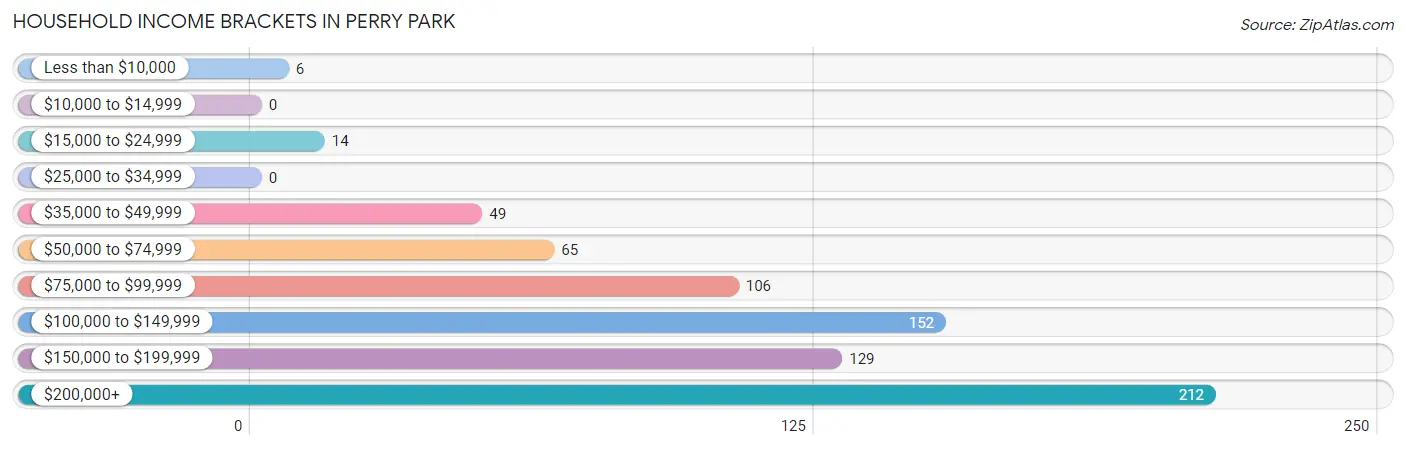
| Income Bracket | # Households | % Households |
| Less than $10,000 | 6 | 0.8% |
| $10,000 to $14,999 | 0 | 0.0% |
| $15,000 to $24,999 | 14 | 1.9% |
| $25,000 to $34,999 | 0 | 0.0% |
| $35,000 to $49,999 | 49 | 6.7% |
| $50,000 to $74,999 | 65 | 8.9% |
| $75,000 to $99,999 | 106 | 14.5% |
| $100,000 to $149,999 | 152 | 20.7% |
| $150,000 to $199,999 | 129 | 17.6% |
| $200,000+ | 212 | 28.9% |
Household Income by Householder Age in Perry Park
The median household income in Perry Park is $147,548, with the highest median household income of $156,509 found in the 25 to 44 years age bracket for the primary householder. A total of 143 households (19.5%) fall into this category.
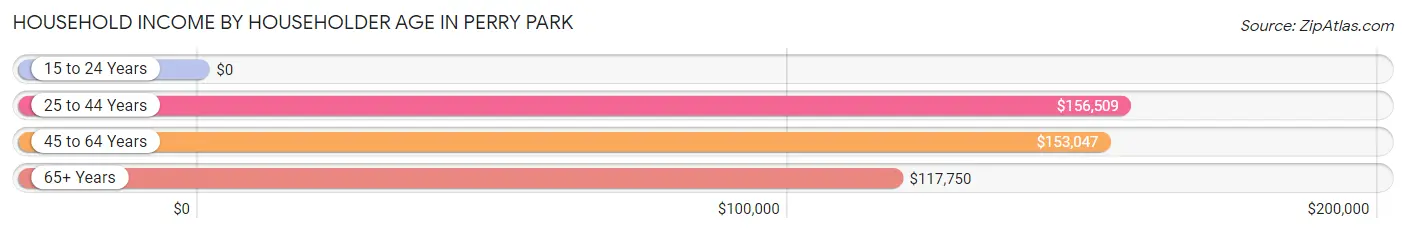
| Income Bracket | # Households | Median Income |
| 15 to 24 Years | 0 (0.0%) | $0 |
| 25 to 44 Years | 143 (19.5%) | $156,509 |
| 45 to 64 Years | 323 (44.1%) | $153,047 |
| 65+ Years | 267 (36.4%) | $117,750 |
| Total | 733 (100.0%) | $147,548 |
Poverty in Perry Park
Income Below Poverty by Sex and Age in Perry Park
With 1.4% poverty level for males and 1.3% for females among the residents of Perry Park, 75 year old and over males and 75 year old and over females are the most vulnerable to poverty, with 6 males (6.9%) and 4 females (7.7%) in their respective age groups living below the poverty level.
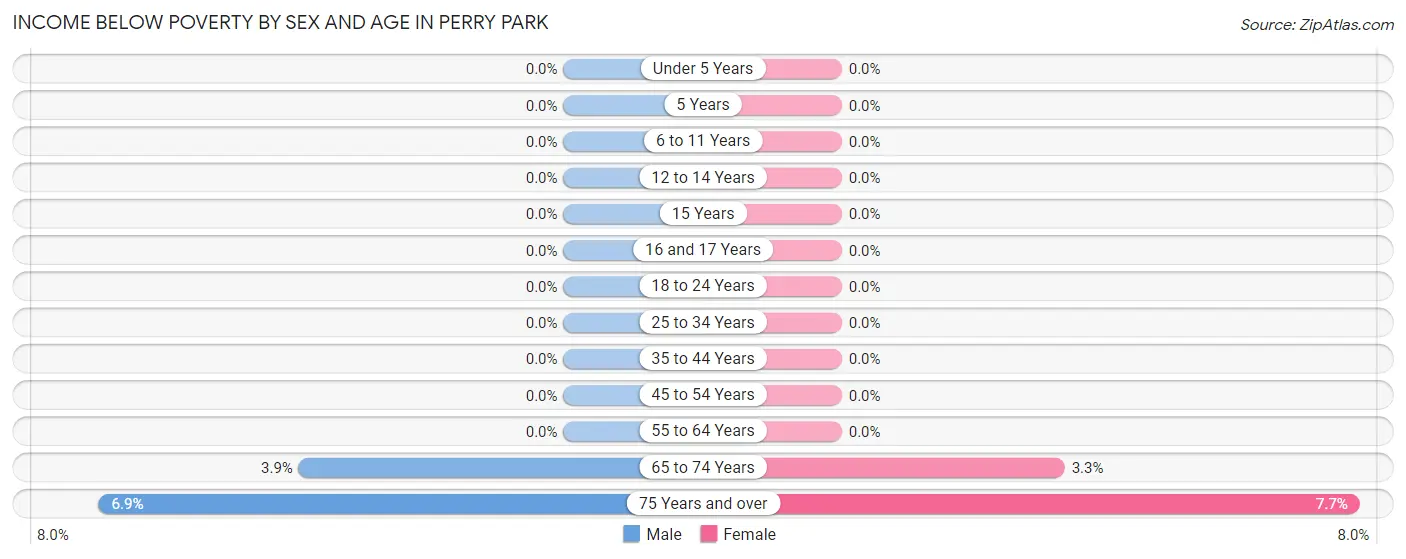
| Age Bracket | Male | Female |
| Under 5 Years | 0 (0.0%) | 0 (0.0%) |
| 5 Years | 0 (0.0%) | 0 (0.0%) |
| 6 to 11 Years | 0 (0.0%) | 0 (0.0%) |
| 12 to 14 Years | 0 (0.0%) | 0 (0.0%) |
| 15 Years | 0 (0.0%) | 0 (0.0%) |
| 16 and 17 Years | 0 (0.0%) | 0 (0.0%) |
| 18 to 24 Years | 0 (0.0%) | 0 (0.0%) |
| 25 to 34 Years | 0 (0.0%) | 0 (0.0%) |
| 35 to 44 Years | 0 (0.0%) | 0 (0.0%) |
| 45 to 54 Years | 0 (0.0%) | 0 (0.0%) |
| 55 to 64 Years | 0 (0.0%) | 0 (0.0%) |
| 65 to 74 Years | 7 (3.9%) | 6 (3.3%) |
| 75 Years and over | 6 (6.9%) | 4 (7.7%) |
| Total | 13 (1.4%) | 10 (1.3%) |
Income Above Poverty by Sex and Age in Perry Park
According to the poverty statistics in Perry Park, males aged under 5 years and females aged 6 to 11 years are the age groups that are most secure financially, with 100.0% of males and 100.0% of females in these age groups living above the poverty line.
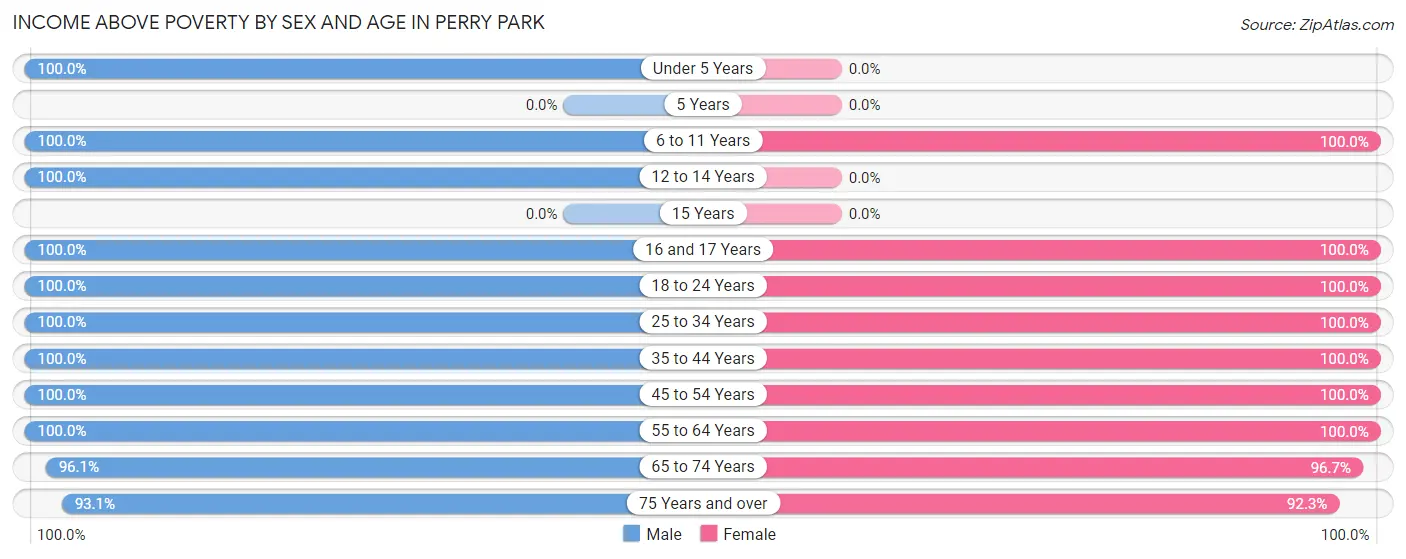
| Age Bracket | Male | Female |
| Under 5 Years | 97 (100.0%) | 0 (0.0%) |
| 5 Years | 0 (0.0%) | 0 (0.0%) |
| 6 to 11 Years | 26 (100.0%) | 31 (100.0%) |
| 12 to 14 Years | 19 (100.0%) | 0 (0.0%) |
| 15 Years | 0 (0.0%) | 0 (0.0%) |
| 16 and 17 Years | 39 (100.0%) | 8 (100.0%) |
| 18 to 24 Years | 24 (100.0%) | 18 (100.0%) |
| 25 to 34 Years | 48 (100.0%) | 55 (100.0%) |
| 35 to 44 Years | 88 (100.0%) | 117 (100.0%) |
| 45 to 54 Years | 106 (100.0%) | 96 (100.0%) |
| 55 to 64 Years | 221 (100.0%) | 221 (100.0%) |
| 65 to 74 Years | 171 (96.1%) | 175 (96.7%) |
| 75 Years and over | 81 (93.1%) | 48 (92.3%) |
| Total | 920 (98.6%) | 769 (98.7%) |
Income Below Poverty Among Married-Couple Families in Perry Park
The poverty statistics for married-couple families in Perry Park show that 2.2% or 13 of the total 586 families live below the poverty line. Families with no children have the highest poverty rate of 2.8%, comprising of 13 families. On the other hand, families with 1 or 2 children have the lowest poverty rate of 0.0%, which includes 0 families.
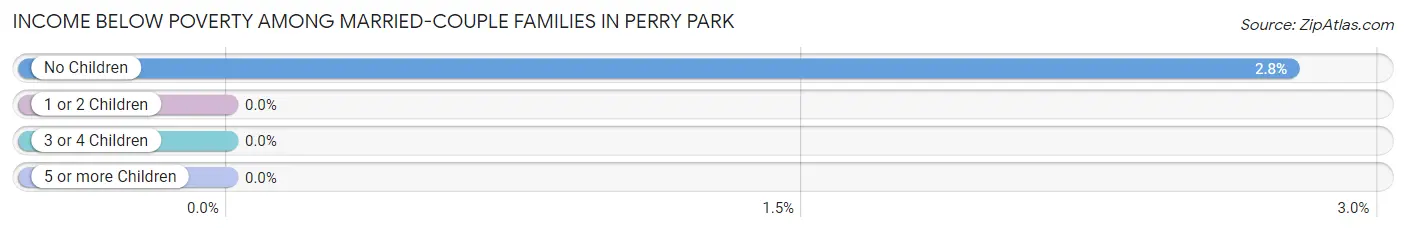
| Children | Above Poverty | Below Poverty |
| No Children | 457 (97.2%) | 13 (2.8%) |
| 1 or 2 Children | 65 (100.0%) | 0 (0.0%) |
| 3 or 4 Children | 51 (100.0%) | 0 (0.0%) |
| 5 or more Children | 0 (0.0%) | 0 (0.0%) |
| Total | 573 (97.8%) | 13 (2.2%) |
Income Below Poverty Among Single-Parent Households in Perry Park
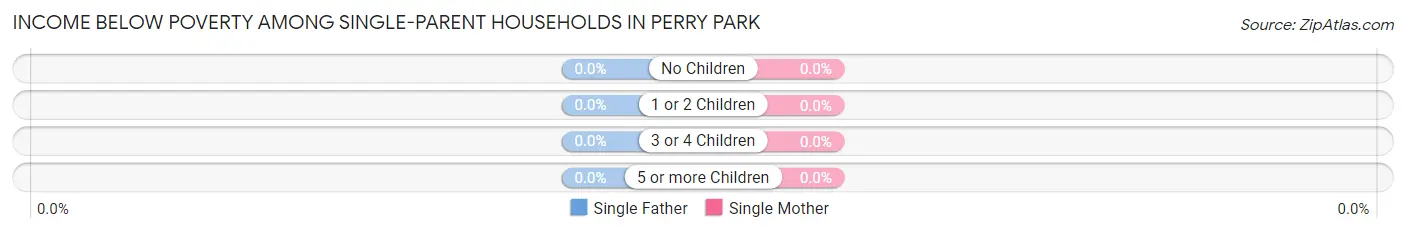
| Children | Single Father | Single Mother |
| No Children | 0 (0.0%) | 0 (0.0%) |
| 1 or 2 Children | 0 (0.0%) | 0 (0.0%) |
| 3 or 4 Children | 0 (0.0%) | 0 (0.0%) |
| 5 or more Children | 0 (0.0%) | 0 (0.0%) |
| Total | 0 (0.0%) | 0 (0.0%) |
Income Below Poverty Among Married-Couple vs Single-Parent Households in Perry Park
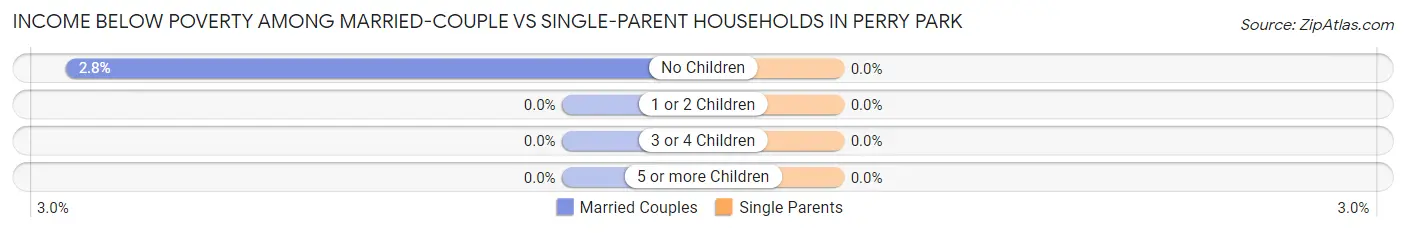
| Children | Married-Couple Families | Single-Parent Households |
| No Children | 13 (2.8%) | 0 (0.0%) |
| 1 or 2 Children | 0 (0.0%) | 0 (0.0%) |
| 3 or 4 Children | 0 (0.0%) | 0 (0.0%) |
| 5 or more Children | 0 (0.0%) | 0 (0.0%) |
| Total | 13 (2.2%) | 0 (0.0%) |
Race in Perry Park
The most populous races in Perry Park are White / Caucasian (1,607 | 93.9%), Asian (36 | 2.1%), and Hispanic or Latino (36 | 2.1%).
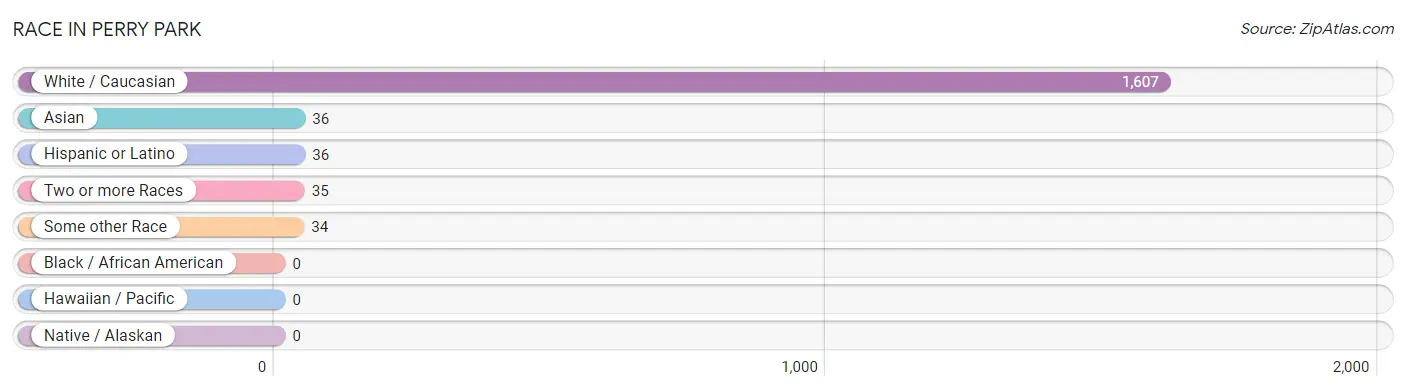
| Race | # Population | % Population |
| Asian | 36 | 2.1% |
| Black / African American | 0 | 0.0% |
| Hawaiian / Pacific | 0 | 0.0% |
| Hispanic or Latino | 36 | 2.1% |
| Native / Alaskan | 0 | 0.0% |
| White / Caucasian | 1,607 | 93.9% |
| Two or more Races | 35 | 2.0% |
| Some other Race | 34 | 2.0% |
| Total | 1,712 | 100.0% |
Ancestry in Perry Park
The most populous ancestries reported in Perry Park are German (492 | 28.7%), English (343 | 20.0%), Irish (183 | 10.7%), Italian (130 | 7.6%), and American (102 | 6.0%), together accounting for 73.0% of all Perry Park residents.
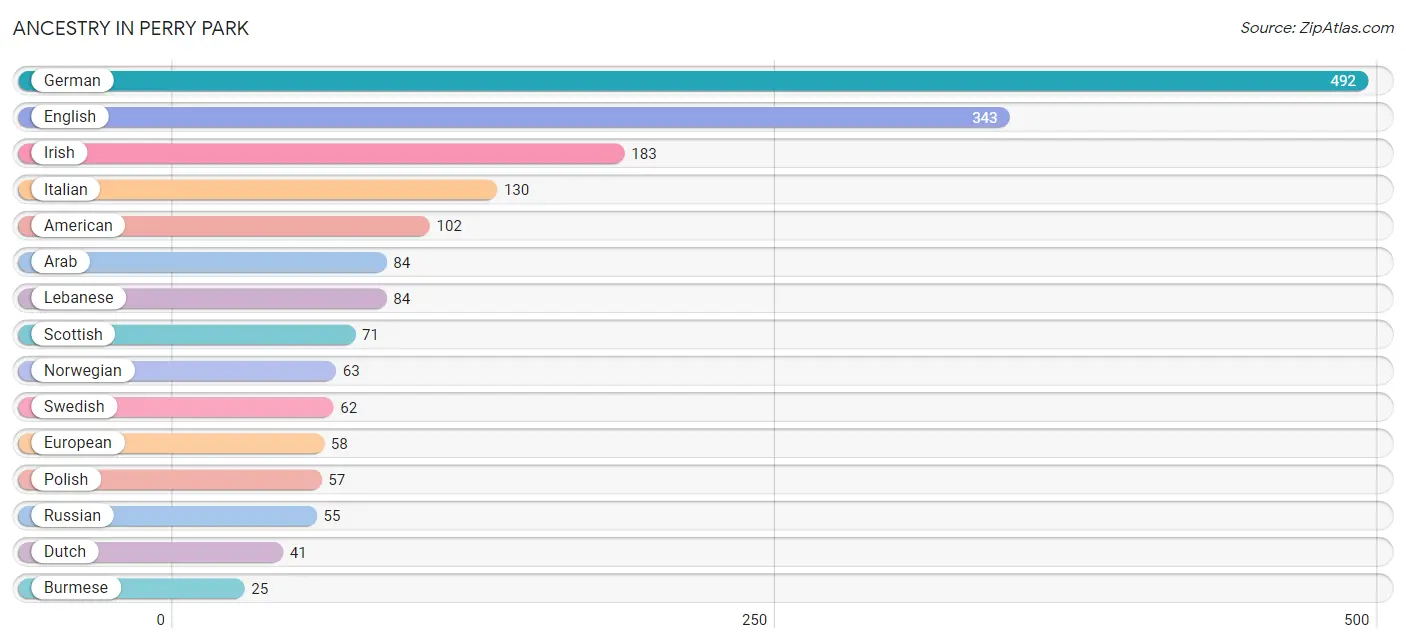
| Ancestry | # Population | % Population |
| American | 102 | 6.0% |
| Arab | 84 | 4.9% |
| Argentinean | 10 | 0.6% |
| Austrian | 8 | 0.5% |
| Burmese | 25 | 1.5% |
| Cypriot | 10 | 0.6% |
| Czechoslovakian | 15 | 0.9% |
| Danish | 12 | 0.7% |
| Dutch | 41 | 2.4% |
| English | 343 | 20.0% |
| European | 58 | 3.4% |
| French | 14 | 0.8% |
| German | 492 | 28.7% |
| Greek | 10 | 0.6% |
| Indian (Asian) | 7 | 0.4% |
| Irish | 183 | 10.7% |
| Israeli | 11 | 0.6% |
| Italian | 130 | 7.6% |
| Lebanese | 84 | 4.9% |
| Mexican | 9 | 0.5% |
| Norwegian | 63 | 3.7% |
| Polish | 57 | 3.3% |
| Portuguese | 8 | 0.5% |
| Puerto Rican | 9 | 0.5% |
| Russian | 55 | 3.2% |
| Scandinavian | 11 | 0.6% |
| Scotch-Irish | 23 | 1.3% |
| Scottish | 71 | 4.2% |
| Slovak | 14 | 0.8% |
| Slovene | 9 | 0.5% |
| South American | 10 | 0.6% |
| Spaniard | 8 | 0.5% |
| Sri Lankan | 4 | 0.2% |
| Swedish | 62 | 3.6% |
| Swiss | 13 | 0.8% |
| Ukrainian | 16 | 0.9% |
| Welsh | 4 | 0.2% | View All 37 Rows |
Immigrants in Perry Park
The most numerous immigrant groups reported in Perry Park came from Europe (98 | 5.7%), Eastern Europe (69 | 4.0%), Russia (55 | 3.2%), Asia (36 | 2.1%), and Eastern Asia (32 | 1.9%), together accounting for 16.9% of all Perry Park residents.
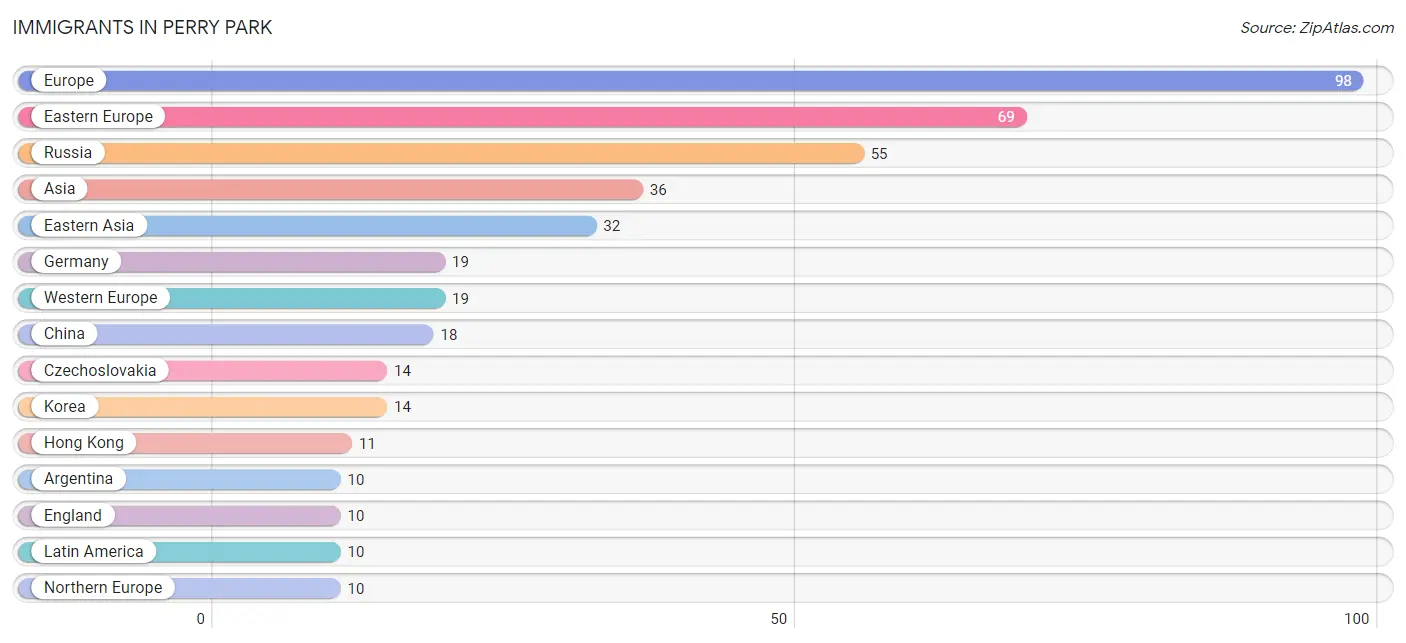
| Immigration Origin | # Population | % Population |
| Argentina | 10 | 0.6% |
| Asia | 36 | 2.1% |
| China | 18 | 1.1% |
| Czechoslovakia | 14 | 0.8% |
| Eastern Asia | 32 | 1.9% |
| Eastern Europe | 69 | 4.0% |
| England | 10 | 0.6% |
| Europe | 98 | 5.7% |
| Germany | 19 | 1.1% |
| Hong Kong | 11 | 0.6% |
| Korea | 14 | 0.8% |
| Latin America | 10 | 0.6% |
| Northern Europe | 10 | 0.6% |
| Russia | 55 | 3.2% |
| South America | 10 | 0.6% |
| South Eastern Asia | 4 | 0.2% |
| Vietnam | 4 | 0.2% |
| Western Europe | 19 | 1.1% | View All 18 Rows |
Sex and Age in Perry Park
Sex and Age in Perry Park
The most populous age groups in Perry Park are 60 to 64 Years (127 | 13.6%) for men and 55 to 59 Years (122 | 15.7%) for women.
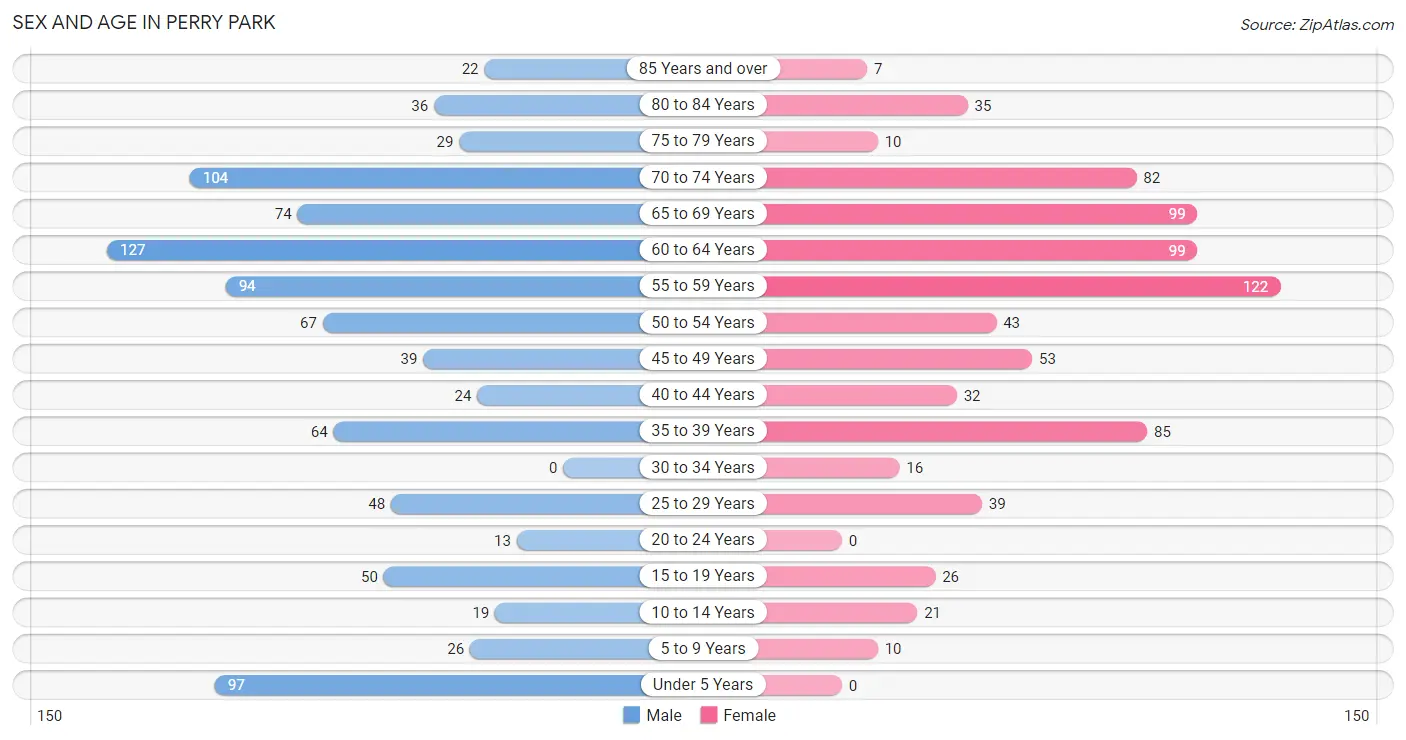
| Age Bracket | Male | Female |
| Under 5 Years | 97 (10.4%) | 0 (0.0%) |
| 5 to 9 Years | 26 (2.8%) | 10 (1.3%) |
| 10 to 14 Years | 19 (2.0%) | 21 (2.7%) |
| 15 to 19 Years | 50 (5.4%) | 26 (3.3%) |
| 20 to 24 Years | 13 (1.4%) | 0 (0.0%) |
| 25 to 29 Years | 48 (5.1%) | 39 (5.0%) |
| 30 to 34 Years | 0 (0.0%) | 16 (2.1%) |
| 35 to 39 Years | 64 (6.9%) | 85 (10.9%) |
| 40 to 44 Years | 24 (2.6%) | 32 (4.1%) |
| 45 to 49 Years | 39 (4.2%) | 53 (6.8%) |
| 50 to 54 Years | 67 (7.2%) | 43 (5.5%) |
| 55 to 59 Years | 94 (10.1%) | 122 (15.7%) |
| 60 to 64 Years | 127 (13.6%) | 99 (12.7%) |
| 65 to 69 Years | 74 (7.9%) | 99 (12.7%) |
| 70 to 74 Years | 104 (11.2%) | 82 (10.5%) |
| 75 to 79 Years | 29 (3.1%) | 10 (1.3%) |
| 80 to 84 Years | 36 (3.9%) | 35 (4.5%) |
| 85 Years and over | 22 (2.4%) | 7 (0.9%) |
| Total | 933 (100.0%) | 779 (100.0%) |
Families and Households in Perry Park
Median Family Size in Perry Park
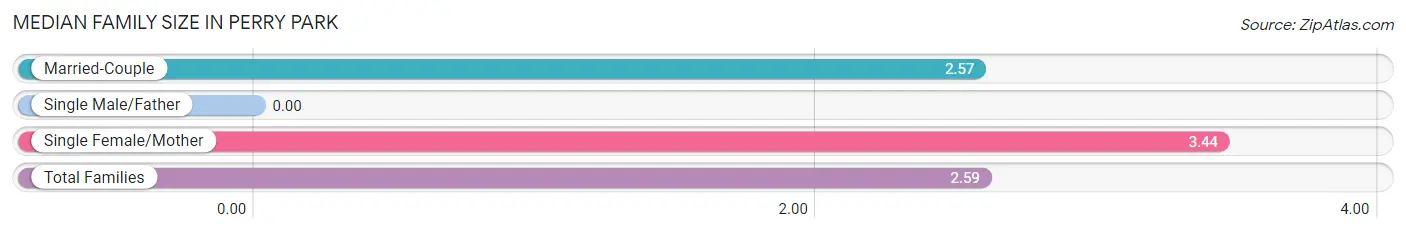
| Family Type | # Families | Family Size |
| Married-Couple | 586 (97.3%) | 2.57 |
| Single Male/Father | 0 (0.0%) | - |
| Single Female/Mother | 16 (2.7%) | 3.44 |
| Total Families | 602 (100.0%) | 2.59 |
Median Household Size in Perry Park
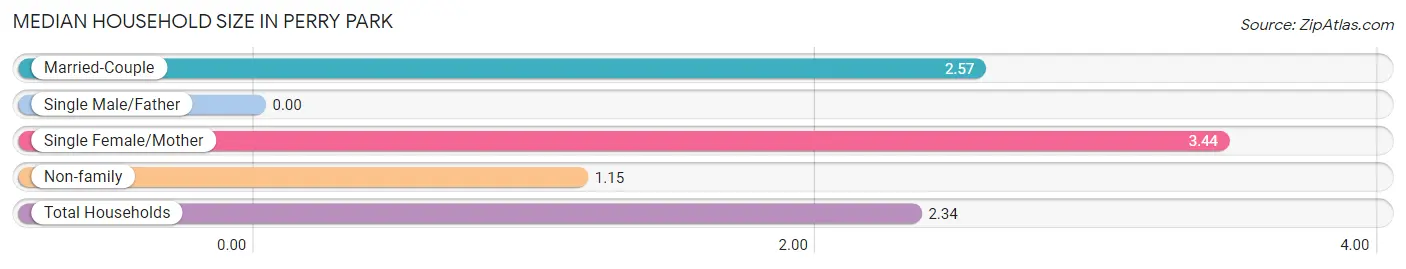
| Household Type | # Households | Household Size |
| Married-Couple | 586 (79.9%) | 2.57 |
| Single Male/Father | 0 (0.0%) | - |
| Single Female/Mother | 16 (2.2%) | 3.44 |
| Non-family | 131 (17.9%) | 1.15 |
| Total Households | 733 (100.0%) | 2.34 |
Household Size by Marriage Status in Perry Park
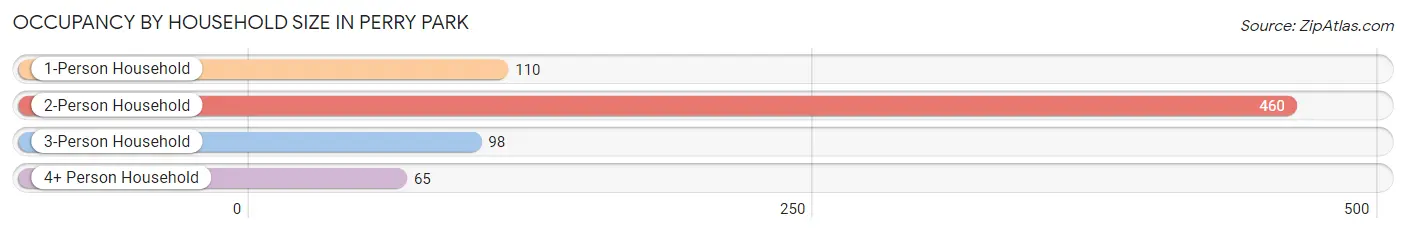
Out of a total of 733 households in Perry Park, 602 (82.1%) are family households, while 131 (17.9%) are nonfamily households. The most numerous type of family households are 2-person households, comprising 439, and the most common type of nonfamily households are 1-person households, comprising 110.
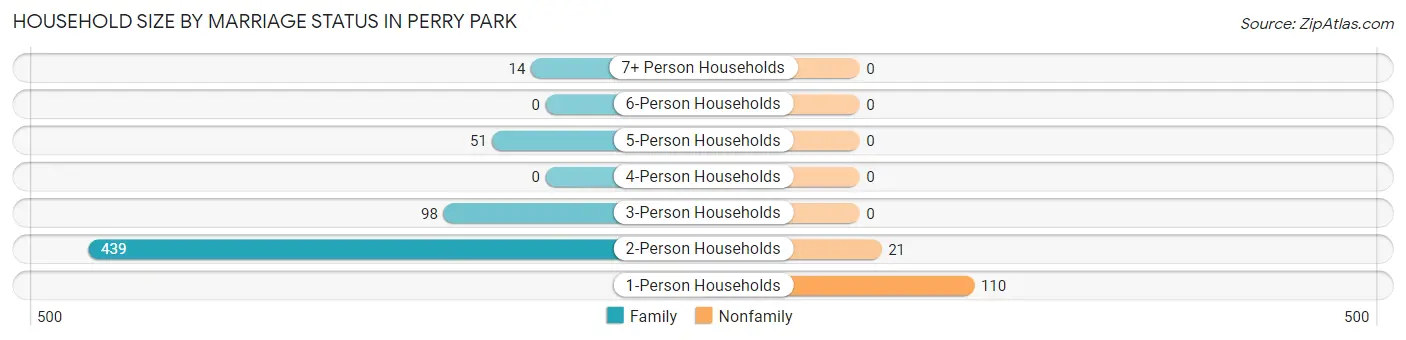
| Household Size | Family Households | Nonfamily Households |
| 1-Person Households | - | 110 (15.0%) |
| 2-Person Households | 439 (59.9%) | 21 (2.9%) |
| 3-Person Households | 98 (13.4%) | 0 (0.0%) |
| 4-Person Households | 0 (0.0%) | 0 (0.0%) |
| 5-Person Households | 51 (7.0%) | 0 (0.0%) |
| 6-Person Households | 0 (0.0%) | 0 (0.0%) |
| 7+ Person Households | 14 (1.9%) | 0 (0.0%) |
| Total | 602 (82.1%) | 131 (17.9%) |
Female Fertility in Perry Park
Fertility by Age in Perry Park
Average fertility rate in Perry Park is 230.0 births per 1,000 women. Women in the age bracket of 20 to 34 years have the highest fertility rate with 309.0 births per 1,000 women. Women in the age bracket of 35 to 50 years acount for 71.2% of all women with births.
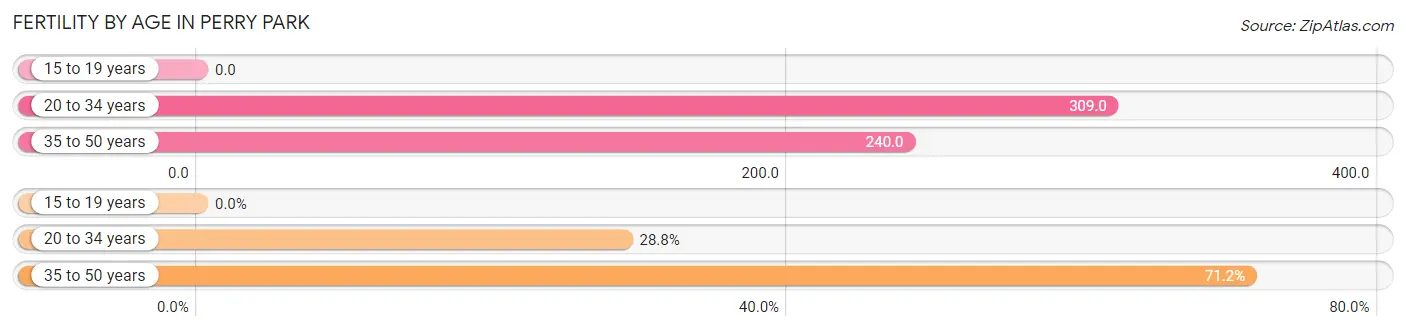
| Age Bracket | Women with Births | Births / 1,000 Women |
| 15 to 19 years | 0 (0.0%) | 0.0 |
| 20 to 34 years | 17 (28.8%) | 309.0 |
| 35 to 50 years | 42 (71.2%) | 240.0 |
| Total | 59 (100.0%) | 230.0 |
Fertility by Age by Marriage Status in Perry Park
71.2% of women with births (59) in Perry Park are married. The highest percentage of unmarried women with births falls into 20 to 34 years age bracket with 100.0% of them unmarried at the time of birth, while the lowest percentage of unmarried women with births belong to 35 to 50 years age bracket with 0.0% of them unmarried.
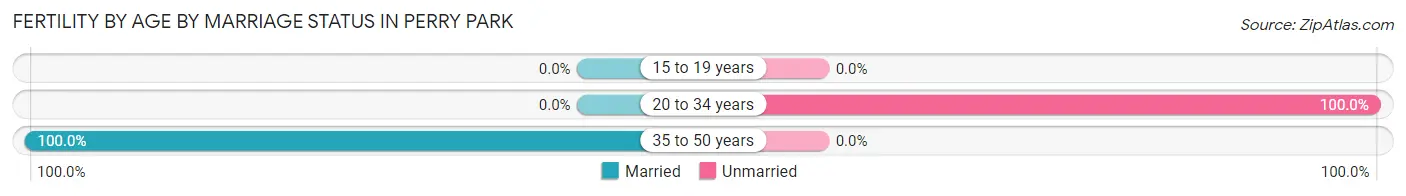
| Age Bracket | Married | Unmarried |
| 15 to 19 years | 0 (0.0%) | 0 (0.0%) |
| 20 to 34 years | 0 (0.0%) | 17 (100.0%) |
| 35 to 50 years | 42 (100.0%) | 0 (0.0%) |
| Total | 42 (71.2%) | 17 (28.8%) |
Fertility by Education in Perry Park
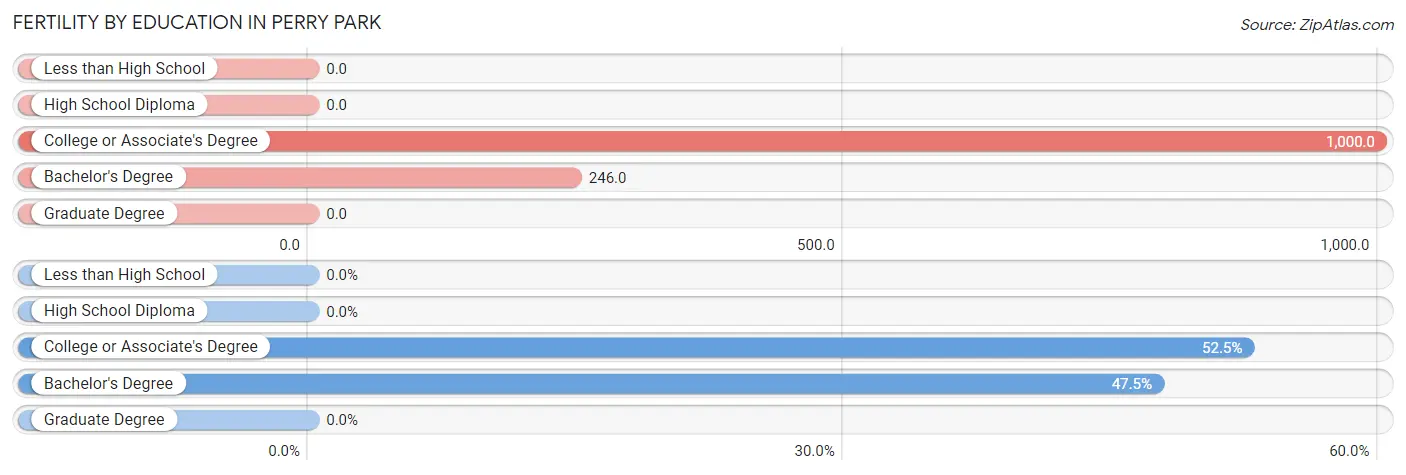
| Educational Attainment | Women with Births | Births / 1,000 Women |
| Less than High School | 0 (0.0%) | 0.0 |
| High School Diploma | 0 (0.0%) | 0.0 |
| College or Associate's Degree | 31 (52.5%) | 1,000.0 |
| Bachelor's Degree | 28 (47.5%) | 246.0 |
| Graduate Degree | 0 (0.0%) | 0.0 |
| Total | 59 (100.0%) | 230.0 |
Fertility by Education by Marriage Status in Perry Park
28.8% of women with births in Perry Park are unmarried. Women with the educational attainment of bachelor's degree are most likely to be married with 100.0% of them married at childbirth, while women with the educational attainment of college or associate's degree are least likely to be married with 54.8% of them unmarried at childbirth.
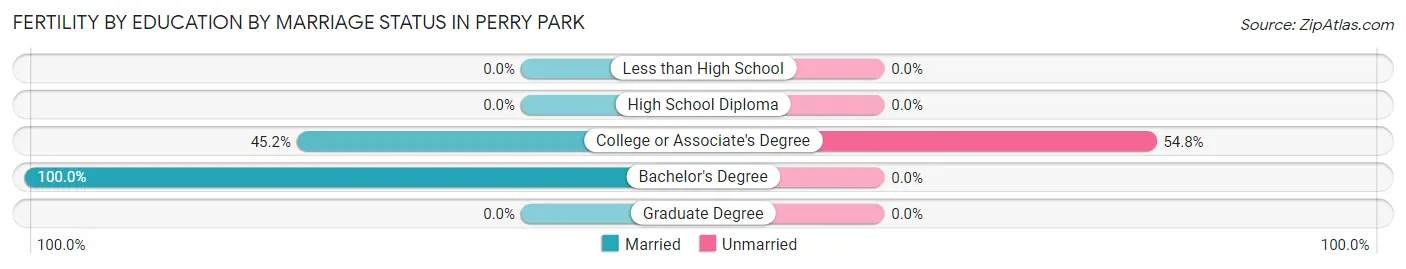
| Educational Attainment | Married | Unmarried |
| Less than High School | 0 (0.0%) | 0 (0.0%) |
| High School Diploma | 0 (0.0%) | 0 (0.0%) |
| College or Associate's Degree | 14 (45.2%) | 17 (54.8%) |
| Bachelor's Degree | 28 (100.0%) | 0 (0.0%) |
| Graduate Degree | 0 (0.0%) | 0 (0.0%) |
| Total | 42 (71.2%) | 17 (28.8%) |
Employment Characteristics in Perry Park
Employment by Class of Employer in Perry Park
Among the 901 employed individuals in Perry Park, private company employees (428 | 47.5%), not-for-profit organizations (150 | 16.7%), and self-employed (incorporated) (107 | 11.9%) make up the most common classes of employment.
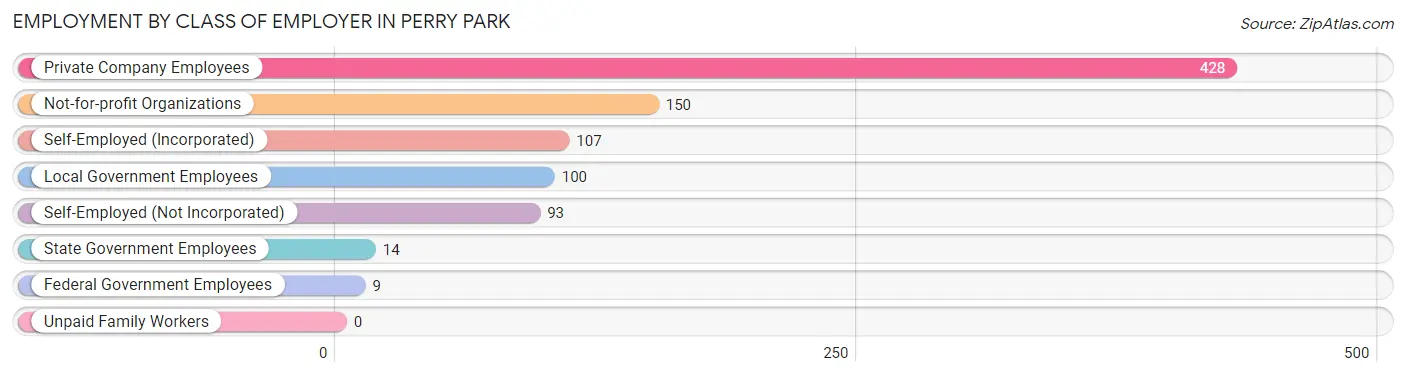
| Employer Class | # Employees | % Employees |
| Private Company Employees | 428 | 47.5% |
| Self-Employed (Incorporated) | 107 | 11.9% |
| Self-Employed (Not Incorporated) | 93 | 10.3% |
| Not-for-profit Organizations | 150 | 16.7% |
| Local Government Employees | 100 | 11.1% |
| State Government Employees | 14 | 1.5% |
| Federal Government Employees | 9 | 1.0% |
| Unpaid Family Workers | 0 | 0.0% |
| Total | 901 | 100.0% |
Employment Status by Age in Perry Park
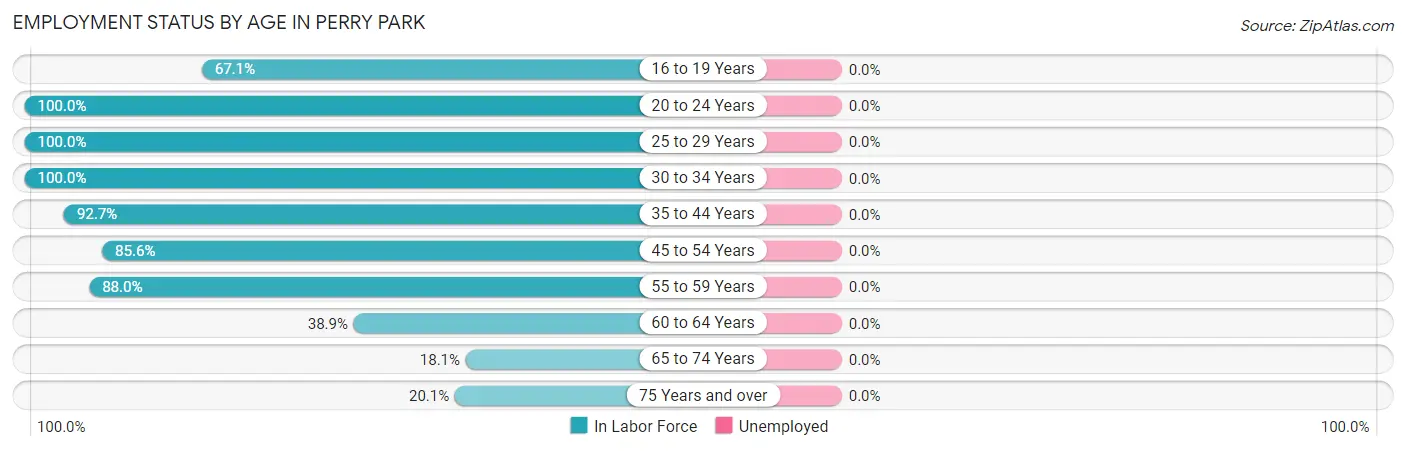
| Age Bracket | In Labor Force | Unemployed |
| 16 to 19 Years | 51 (67.1%) | 0 (0.0%) |
| 20 to 24 Years | 13 (100.0%) | 0 (0.0%) |
| 25 to 29 Years | 87 (100.0%) | 0 (0.0%) |
| 30 to 34 Years | 16 (100.0%) | 0 (0.0%) |
| 35 to 44 Years | 190 (92.7%) | 0 (0.0%) |
| 45 to 54 Years | 173 (85.6%) | 0 (0.0%) |
| 55 to 59 Years | 190 (88.0%) | 0 (0.0%) |
| 60 to 64 Years | 88 (38.9%) | 0 (0.0%) |
| 65 to 74 Years | 65 (18.1%) | 0 (0.0%) |
| 75 Years and over | 28 (20.1%) | 0 (0.0%) |
| Total | 900 (58.5%) | 0 (0.0%) |
Employment Status by Educational Attainment in Perry Park
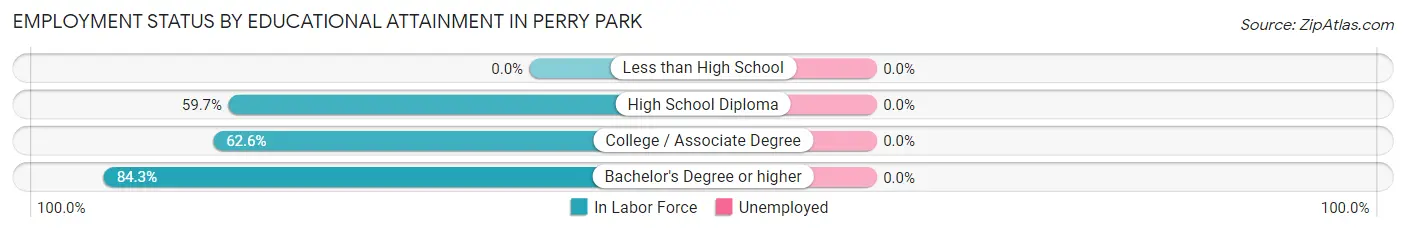
| Educational Attainment | In Labor Force | Unemployed |
| Less than High School | 0 (0.0%) | 0 (0.0%) |
| High School Diploma | 40 (59.7%) | 0 (0.0%) |
| College / Associate Degree | 122 (62.6%) | 0 (0.0%) |
| Bachelor's Degree or higher | 582 (84.3%) | 0 (0.0%) |
| Total | 744 (78.2%) | 0 (0.0%) |
Employment Occupations by Sex in Perry Park
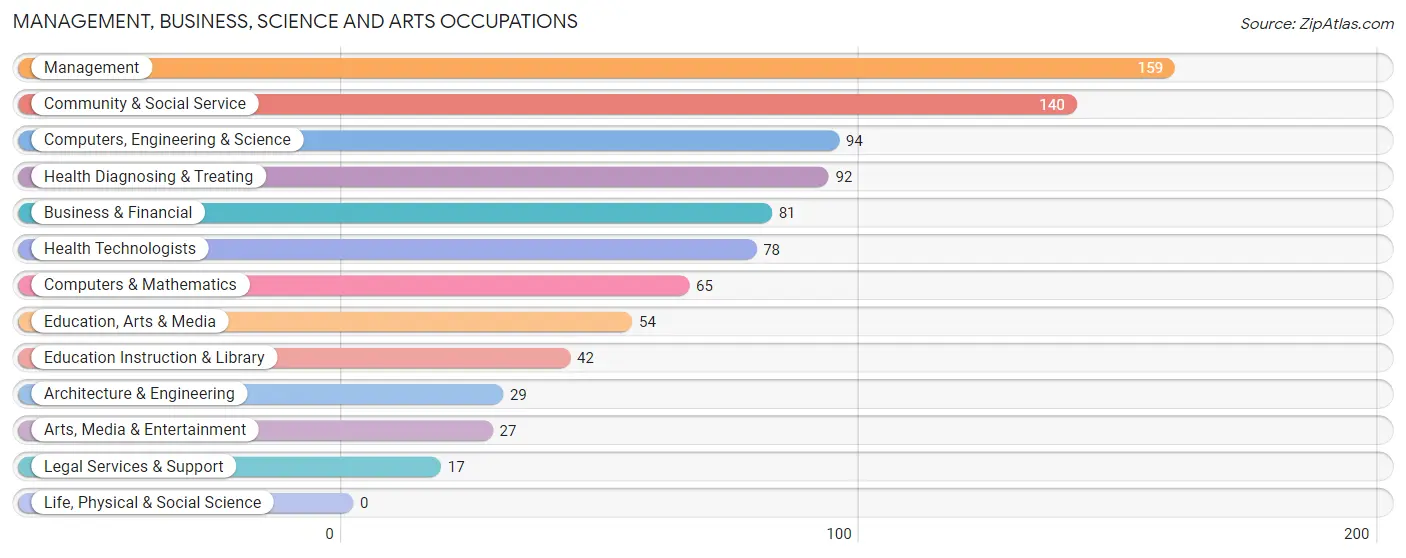
Management, Business, Science and Arts Occupations
The most common Management, Business, Science and Arts occupations in Perry Park are Management (159 | 17.6%), Community & Social Service (140 | 15.5%), Computers, Engineering & Science (94 | 10.4%), Health Diagnosing & Treating (92 | 10.2%), and Business & Financial (81 | 9.0%).
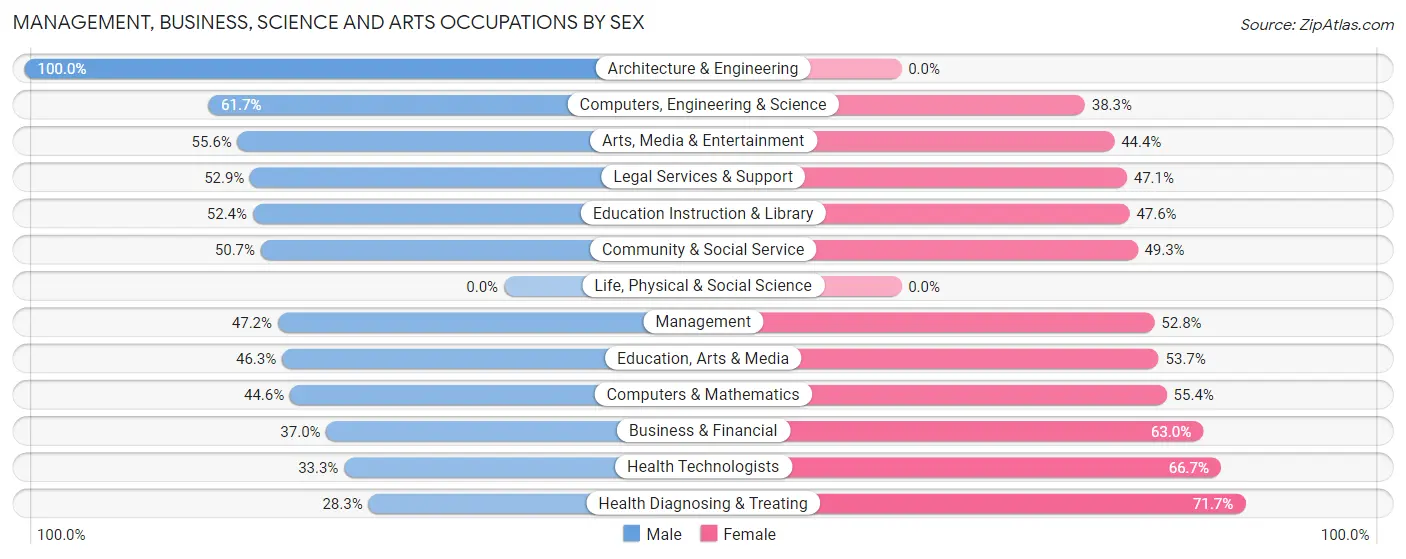
Management, Business, Science and Arts Occupations by Sex
Within the Management, Business, Science and Arts occupations in Perry Park, the most male-oriented occupations are Architecture & Engineering (100.0%), Computers, Engineering & Science (61.7%), and Arts, Media & Entertainment (55.6%), while the most female-oriented occupations are Health Diagnosing & Treating (71.7%), Health Technologists (66.7%), and Business & Financial (63.0%).
| Occupation | Male | Female |
| Management | 75 (47.2%) | 84 (52.8%) |
| Business & Financial | 30 (37.0%) | 51 (63.0%) |
| Computers, Engineering & Science | 58 (61.7%) | 36 (38.3%) |
| Computers & Mathematics | 29 (44.6%) | 36 (55.4%) |
| Architecture & Engineering | 29 (100.0%) | 0 (0.0%) |
| Life, Physical & Social Science | 0 (0.0%) | 0 (0.0%) |
| Community & Social Service | 71 (50.7%) | 69 (49.3%) |
| Education, Arts & Media | 25 (46.3%) | 29 (53.7%) |
| Legal Services & Support | 9 (52.9%) | 8 (47.1%) |
| Education Instruction & Library | 22 (52.4%) | 20 (47.6%) |
| Arts, Media & Entertainment | 15 (55.6%) | 12 (44.4%) |
| Health Diagnosing & Treating | 26 (28.3%) | 66 (71.7%) |
| Health Technologists | 26 (33.3%) | 52 (66.7%) |
| Total (Category) | 260 (45.9%) | 306 (54.1%) |
| Total (Overall) | 481 (53.4%) | 420 (46.6%) |
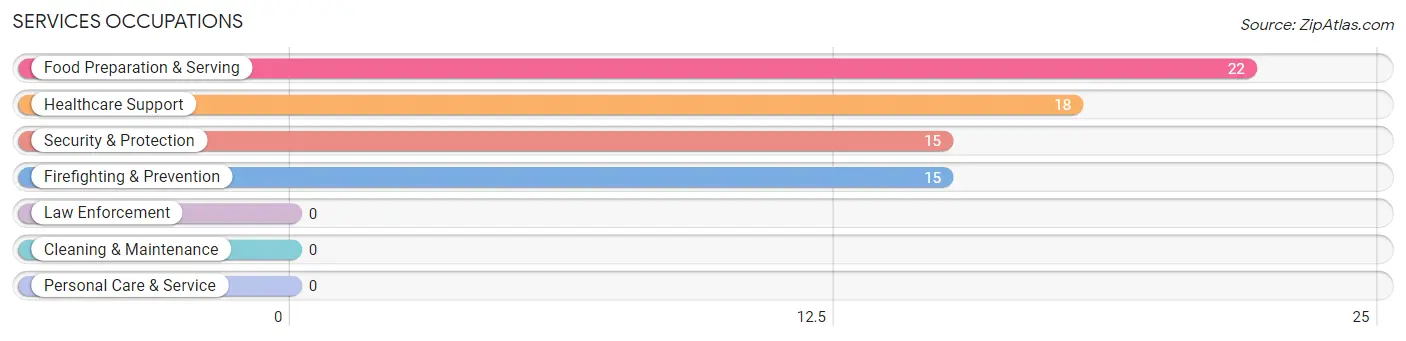
Services Occupations
The most common Services occupations in Perry Park are Food Preparation & Serving (22 | 2.4%), Healthcare Support (18 | 2.0%), Security & Protection (15 | 1.7%), and Firefighting & Prevention (15 | 1.7%).
Services Occupations by Sex
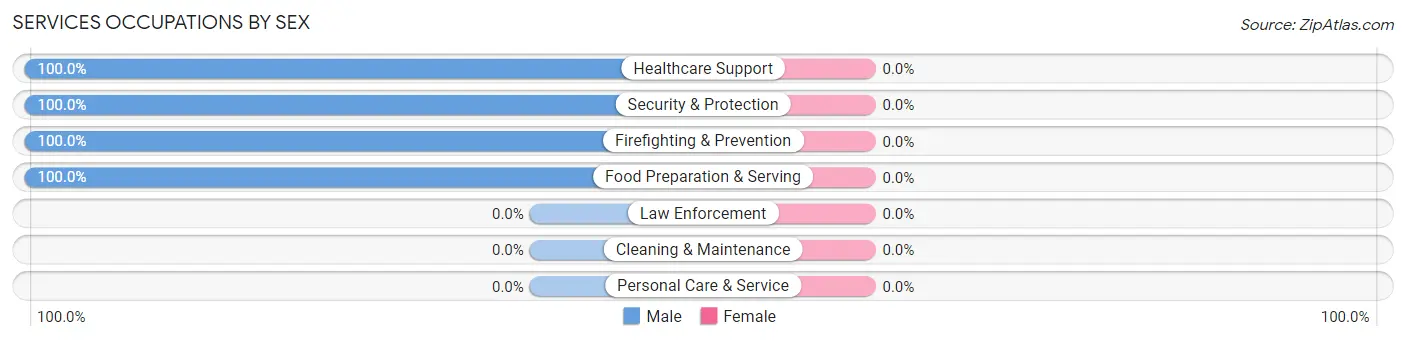
| Occupation | Male | Female |
| Healthcare Support | 18 (100.0%) | 0 (0.0%) |
| Security & Protection | 15 (100.0%) | 0 (0.0%) |
| Firefighting & Prevention | 15 (100.0%) | 0 (0.0%) |
| Law Enforcement | 0 (0.0%) | 0 (0.0%) |
| Food Preparation & Serving | 22 (100.0%) | 0 (0.0%) |
| Cleaning & Maintenance | 0 (0.0%) | 0 (0.0%) |
| Personal Care & Service | 0 (0.0%) | 0 (0.0%) |
| Total (Category) | 55 (100.0%) | 0 (0.0%) |
| Total (Overall) | 481 (53.4%) | 420 (46.6%) |
Sales and Office Occupations
The most common Sales and Office occupations in Perry Park are Sales & Related (108 | 12.0%), and Office & Administration (54 | 6.0%).
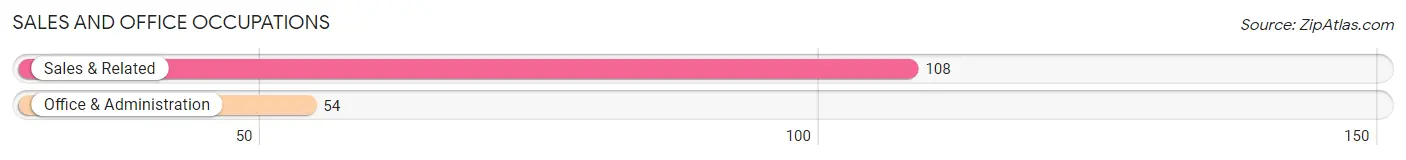
Sales and Office Occupations by Sex
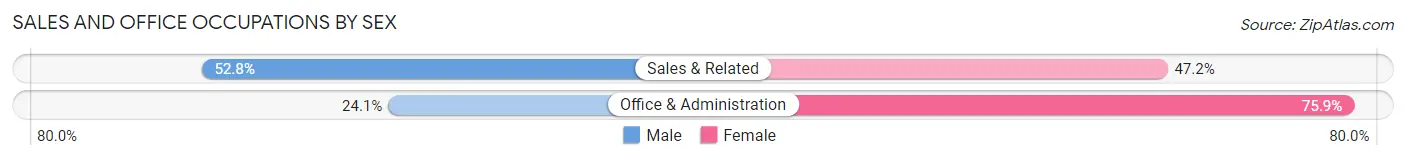
| Occupation | Male | Female |
| Sales & Related | 57 (52.8%) | 51 (47.2%) |
| Office & Administration | 13 (24.1%) | 41 (75.9%) |
| Total (Category) | 70 (43.2%) | 92 (56.8%) |
| Total (Overall) | 481 (53.4%) | 420 (46.6%) |
Natural Resources, Construction and Maintenance Occupations
The most common Natural Resources, Construction and Maintenance occupations in Perry Park are Installation, Maintenance & Repair (33 | 3.7%), and Construction & Extraction (21 | 2.3%).
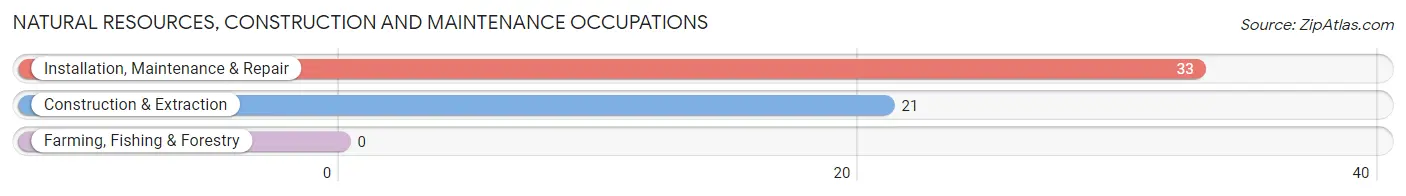
Natural Resources, Construction and Maintenance Occupations by Sex
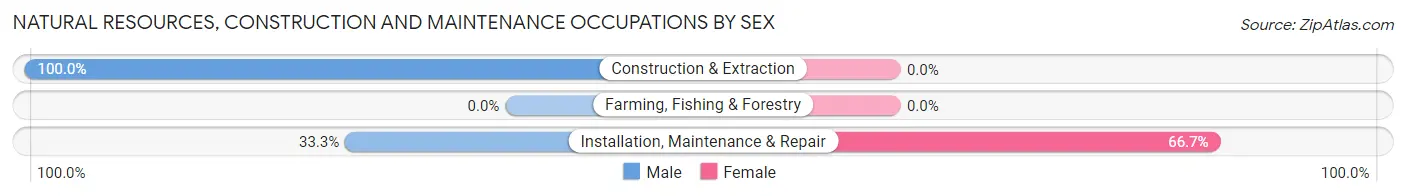
| Occupation | Male | Female |
| Farming, Fishing & Forestry | 0 (0.0%) | 0 (0.0%) |
| Construction & Extraction | 21 (100.0%) | 0 (0.0%) |
| Installation, Maintenance & Repair | 11 (33.3%) | 22 (66.7%) |
| Total (Category) | 32 (59.3%) | 22 (40.7%) |
| Total (Overall) | 481 (53.4%) | 420 (46.6%) |
Production, Transportation and Moving Occupations
The most common Production, Transportation and Moving occupations in Perry Park are Transportation (43 | 4.8%), and Production (21 | 2.3%).
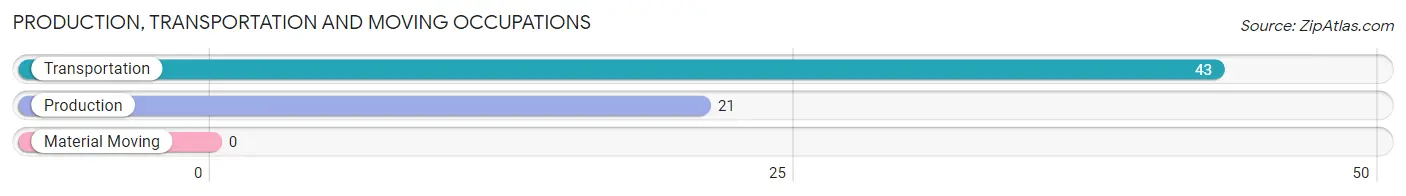
Production, Transportation and Moving Occupations by Sex
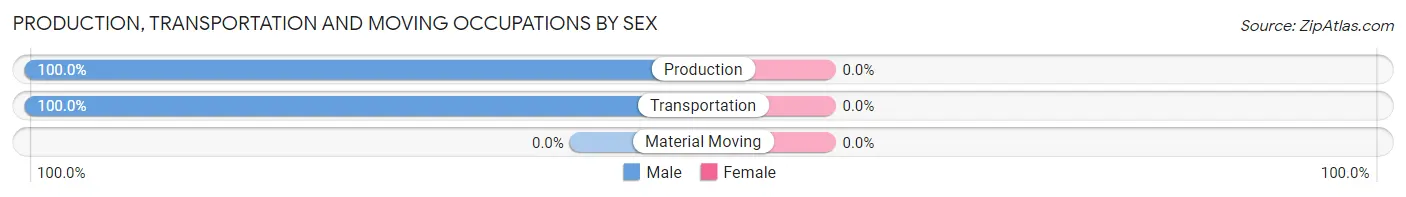
| Occupation | Male | Female |
| Production | 21 (100.0%) | 0 (0.0%) |
| Transportation | 43 (100.0%) | 0 (0.0%) |
| Material Moving | 0 (0.0%) | 0 (0.0%) |
| Total (Category) | 64 (100.0%) | 0 (0.0%) |
| Total (Overall) | 481 (53.4%) | 420 (46.6%) |
Employment Industries by Sex in Perry Park
Employment Industries in Perry Park
The major employment industries in Perry Park include Professional & Scientific (173 | 19.2%), Health Care & Social Assistance (152 | 16.9%), Educational Services (76 | 8.4%), Finance & Insurance (70 | 7.8%), and Retail Trade (60 | 6.7%).
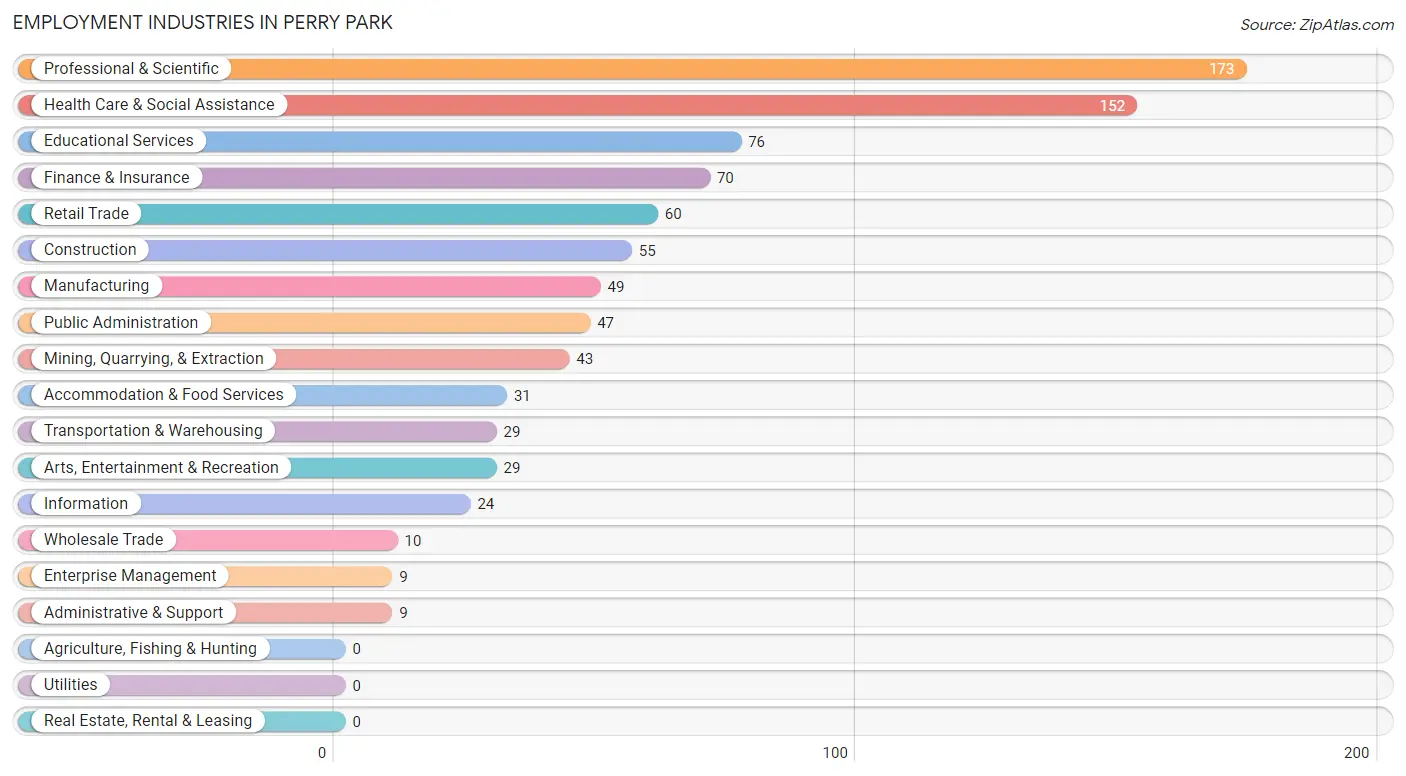
Employment Industries by Sex in Perry Park
The Perry Park industries that see more men than women are Wholesale Trade (100.0%), Transportation & Warehousing (100.0%), and Accommodation & Food Services (100.0%), whereas the industries that tend to have a higher number of women are Enterprise Management (100.0%), Administrative & Support (100.0%), and Arts, Entertainment & Recreation (79.3%).
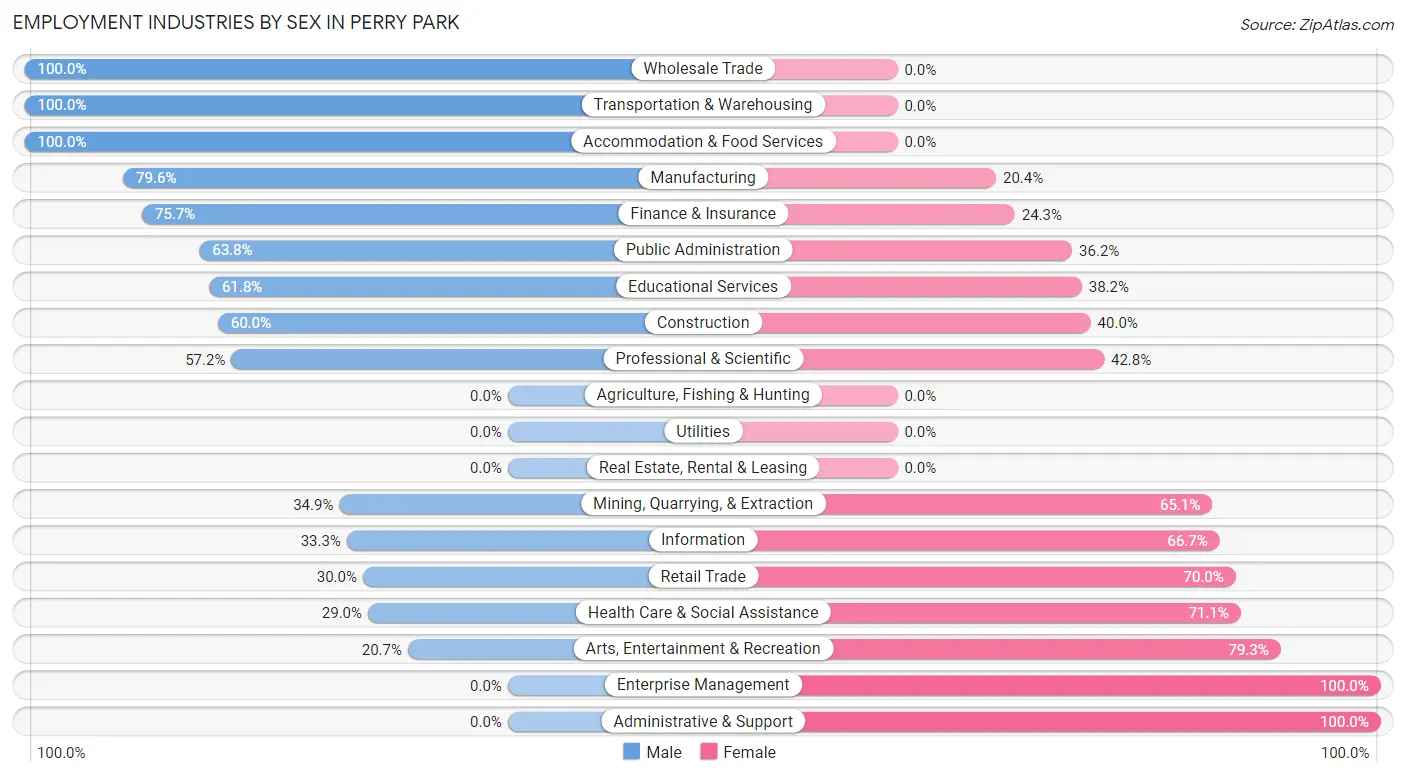
| Industry | Male | Female |
| Agriculture, Fishing & Hunting | 0 (0.0%) | 0 (0.0%) |
| Mining, Quarrying, & Extraction | 15 (34.9%) | 28 (65.1%) |
| Construction | 33 (60.0%) | 22 (40.0%) |
| Manufacturing | 39 (79.6%) | 10 (20.4%) |
| Wholesale Trade | 10 (100.0%) | 0 (0.0%) |
| Retail Trade | 18 (30.0%) | 42 (70.0%) |
| Transportation & Warehousing | 29 (100.0%) | 0 (0.0%) |
| Utilities | 0 (0.0%) | 0 (0.0%) |
| Information | 8 (33.3%) | 16 (66.7%) |
| Finance & Insurance | 53 (75.7%) | 17 (24.3%) |
| Real Estate, Rental & Leasing | 0 (0.0%) | 0 (0.0%) |
| Professional & Scientific | 99 (57.2%) | 74 (42.8%) |
| Enterprise Management | 0 (0.0%) | 9 (100.0%) |
| Administrative & Support | 0 (0.0%) | 9 (100.0%) |
| Educational Services | 47 (61.8%) | 29 (38.2%) |
| Health Care & Social Assistance | 44 (28.9%) | 108 (71.1%) |
| Arts, Entertainment & Recreation | 6 (20.7%) | 23 (79.3%) |
| Accommodation & Food Services | 31 (100.0%) | 0 (0.0%) |
| Public Administration | 30 (63.8%) | 17 (36.2%) |
| Total | 481 (53.4%) | 420 (46.6%) |
Education in Perry Park
School Enrollment in Perry Park
The most common levels of schooling among the 249 students in Perry Park are high school (65 | 26.1%), college / undergraduate (42 | 16.9%), and nursery / preschool (41 | 16.5%).
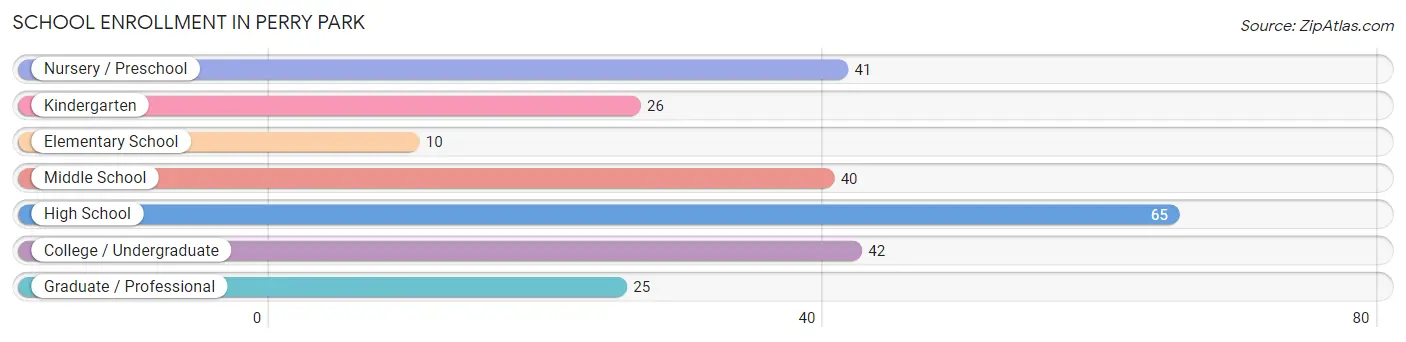
| School Level | # Students | % Students |
| Nursery / Preschool | 41 | 16.5% |
| Kindergarten | 26 | 10.4% |
| Elementary School | 10 | 4.0% |
| Middle School | 40 | 16.1% |
| High School | 65 | 26.1% |
| College / Undergraduate | 42 | 16.9% |
| Graduate / Professional | 25 | 10.0% |
| Total | 249 | 100.0% |
School Enrollment by Age by Funding Source in Perry Park
Out of a total of 249 students who are enrolled in schools in Perry Park, 59 (23.7%) attend a private institution, while the remaining 190 (76.3%) are enrolled in public schools. The age group of 3 to 4 year olds has the highest likelihood of being enrolled in private schools, with 41 (100.0% in the age bracket) enrolled. Conversely, the age group of 5 to 9 year old has the lowest likelihood of being enrolled in a private school, with 36 (100.0% in the age bracket) attending a public institution.
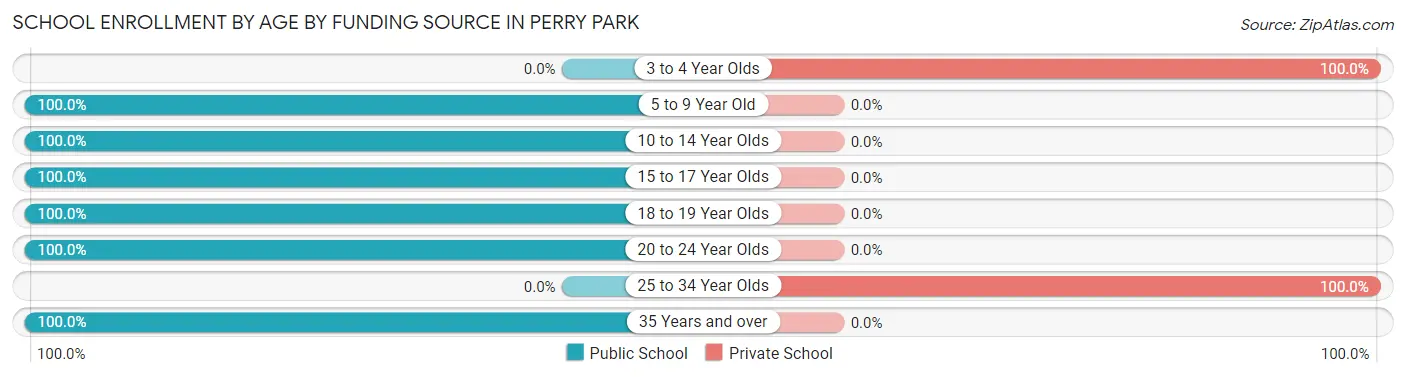
| Age Bracket | Public School | Private School |
| 3 to 4 Year Olds | 0 (0.0%) | 41 (100.0%) |
| 5 to 9 Year Old | 36 (100.0%) | 0 (0.0%) |
| 10 to 14 Year Olds | 40 (100.0%) | 0 (0.0%) |
| 15 to 17 Year Olds | 47 (100.0%) | 0 (0.0%) |
| 18 to 19 Year Olds | 29 (100.0%) | 0 (0.0%) |
| 20 to 24 Year Olds | 13 (100.0%) | 0 (0.0%) |
| 25 to 34 Year Olds | 0 (0.0%) | 18 (100.0%) |
| 35 Years and over | 25 (100.0%) | 0 (0.0%) |
| Total | 190 (76.3%) | 59 (23.7%) |
Educational Attainment by Field of Study in Perry Park
Business (286 | 26.9%), engineering (194 | 18.2%), arts & humanities (120 | 11.3%), science & technology (77 | 7.2%), and bio, nature & agricultural (65 | 6.1%) are the most common fields of study among 1,063 individuals in Perry Park who have obtained a bachelor's degree or higher.
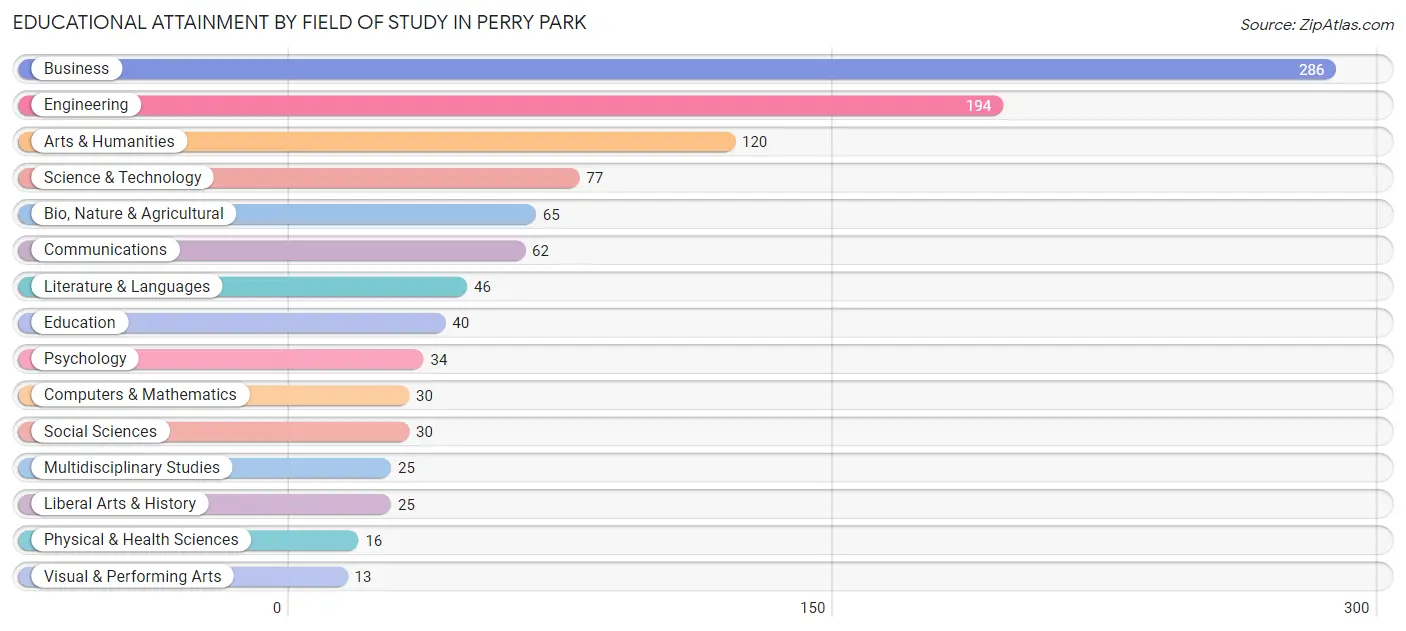
| Field of Study | # Graduates | % Graduates |
| Computers & Mathematics | 30 | 2.8% |
| Bio, Nature & Agricultural | 65 | 6.1% |
| Physical & Health Sciences | 16 | 1.5% |
| Psychology | 34 | 3.2% |
| Social Sciences | 30 | 2.8% |
| Engineering | 194 | 18.2% |
| Multidisciplinary Studies | 25 | 2.4% |
| Science & Technology | 77 | 7.2% |
| Business | 286 | 26.9% |
| Education | 40 | 3.8% |
| Literature & Languages | 46 | 4.3% |
| Liberal Arts & History | 25 | 2.4% |
| Visual & Performing Arts | 13 | 1.2% |
| Communications | 62 | 5.8% |
| Arts & Humanities | 120 | 11.3% |
| Total | 1,063 | 100.0% |
Transportation & Commute in Perry Park
Vehicle Availability by Sex in Perry Park
The most prevalent vehicle ownership categories in Perry Park are males with 3 vehicles (178, accounting for 37.0%) and females with 3 vehicles (146, making up 42.4%).
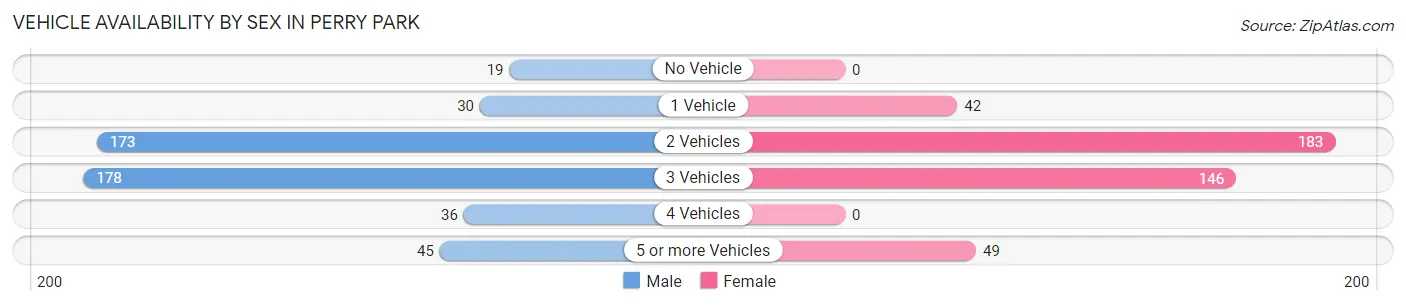
| Vehicles Available | Male | Female |
| No Vehicle | 19 (4.0%) | 0 (0.0%) |
| 1 Vehicle | 30 (6.2%) | 42 (10.0%) |
| 2 Vehicles | 173 (36.0%) | 183 (43.6%) |
| 3 Vehicles | 178 (37.0%) | 146 (34.8%) |
| 4 Vehicles | 36 (7.5%) | 0 (0.0%) |
| 5 or more Vehicles | 45 (9.4%) | 49 (11.7%) |
| Total | 481 (100.0%) | 420 (100.0%) |
Commute Time in Perry Park
The most frequently occuring commute durations in Perry Park are 45 to 59 minutes (100 commuters, 16.6%), 30 to 34 minutes (84 commuters, 13.9%), and 90 or more minutes (84 commuters, 13.9%).
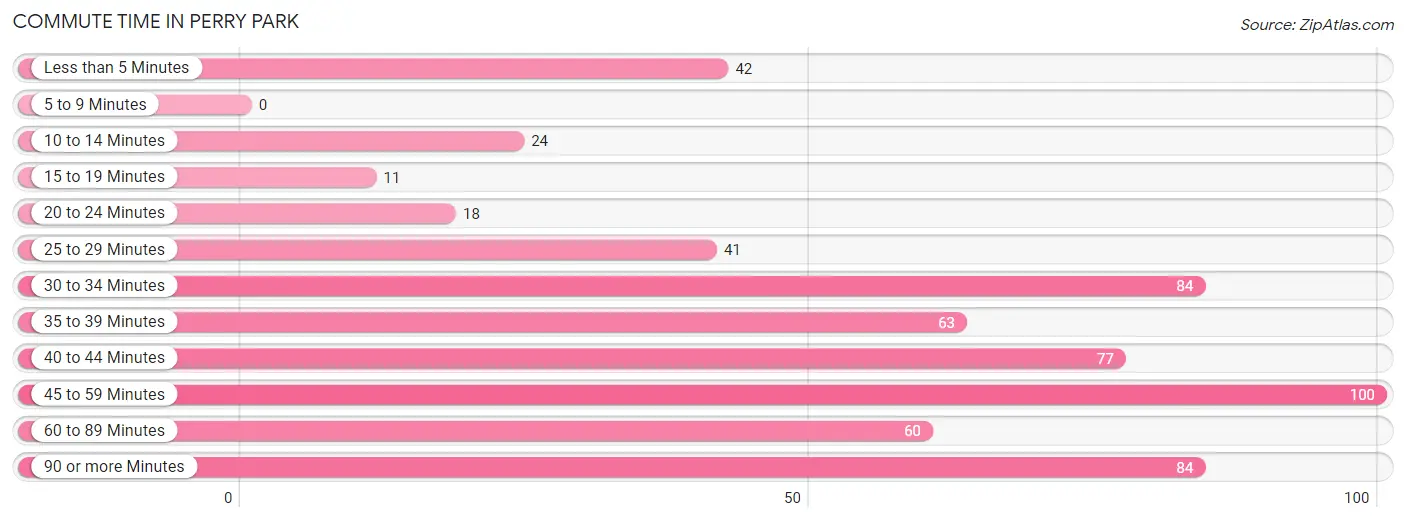
| Commute Time | # Commuters | % Commuters |
| Less than 5 Minutes | 42 | 7.0% |
| 5 to 9 Minutes | 0 | 0.0% |
| 10 to 14 Minutes | 24 | 4.0% |
| 15 to 19 Minutes | 11 | 1.8% |
| 20 to 24 Minutes | 18 | 3.0% |
| 25 to 29 Minutes | 41 | 6.8% |
| 30 to 34 Minutes | 84 | 13.9% |
| 35 to 39 Minutes | 63 | 10.4% |
| 40 to 44 Minutes | 77 | 12.8% |
| 45 to 59 Minutes | 100 | 16.6% |
| 60 to 89 Minutes | 60 | 9.9% |
| 90 or more Minutes | 84 | 13.9% |
Commute Time by Sex in Perry Park
The most common commute times in Perry Park are 45 to 59 minutes (81 commuters, 26.0%) for males and 90 or more minutes (54 commuters, 18.5%) for females.
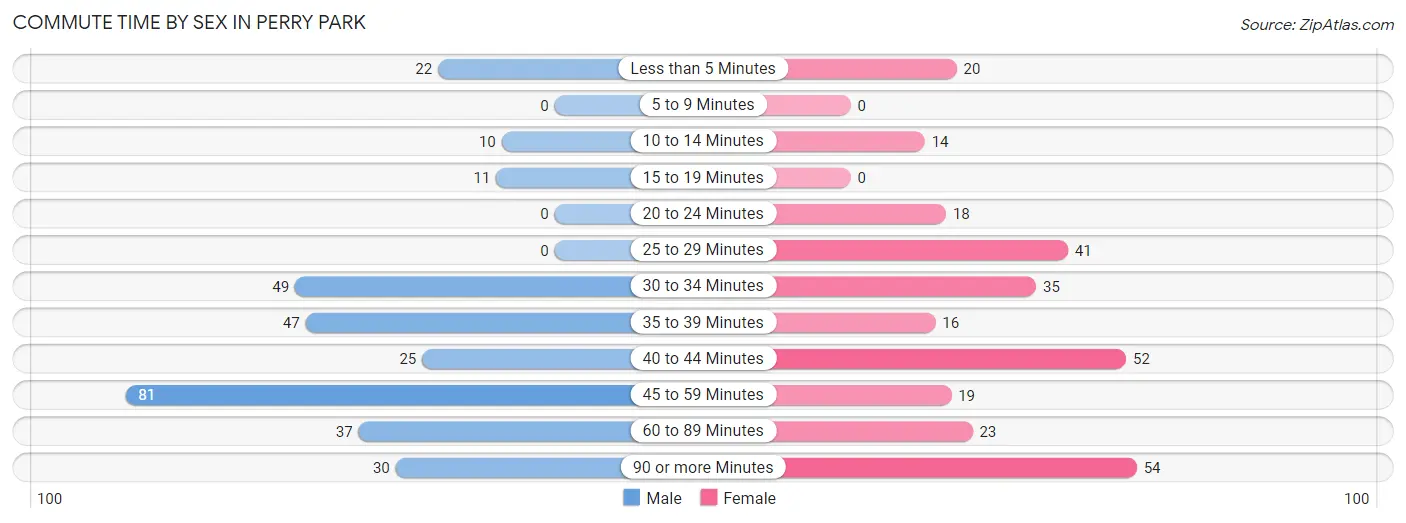
| Commute Time | Male | Female |
| Less than 5 Minutes | 22 (7.0%) | 20 (6.9%) |
| 5 to 9 Minutes | 0 (0.0%) | 0 (0.0%) |
| 10 to 14 Minutes | 10 (3.2%) | 14 (4.8%) |
| 15 to 19 Minutes | 11 (3.5%) | 0 (0.0%) |
| 20 to 24 Minutes | 0 (0.0%) | 18 (6.2%) |
| 25 to 29 Minutes | 0 (0.0%) | 41 (14.0%) |
| 30 to 34 Minutes | 49 (15.7%) | 35 (12.0%) |
| 35 to 39 Minutes | 47 (15.1%) | 16 (5.5%) |
| 40 to 44 Minutes | 25 (8.0%) | 52 (17.8%) |
| 45 to 59 Minutes | 81 (26.0%) | 19 (6.5%) |
| 60 to 89 Minutes | 37 (11.9%) | 23 (7.9%) |
| 90 or more Minutes | 30 (9.6%) | 54 (18.5%) |
Time of Departure to Work by Sex in Perry Park
The most frequent times of departure to work in Perry Park are 6:30 AM to 6:59 AM (61, 19.6%) for males and 7:00 AM to 7:29 AM (127, 43.5%) for females.
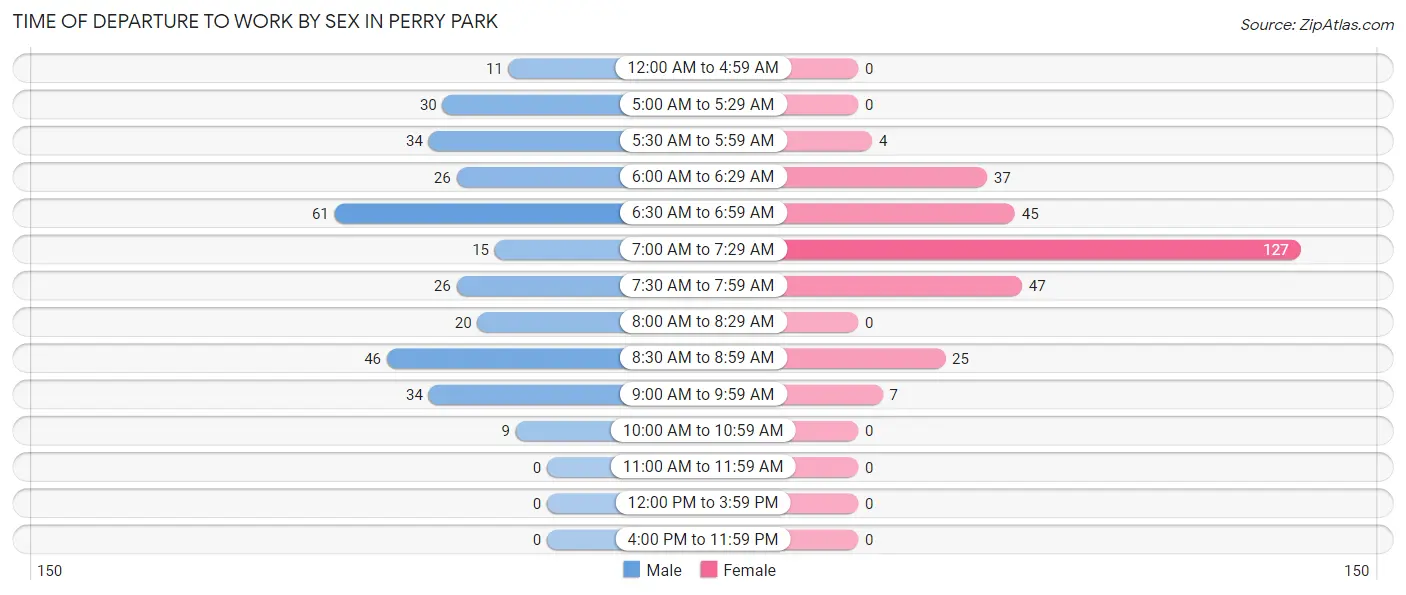
| Time of Departure | Male | Female |
| 12:00 AM to 4:59 AM | 11 (3.5%) | 0 (0.0%) |
| 5:00 AM to 5:29 AM | 30 (9.6%) | 0 (0.0%) |
| 5:30 AM to 5:59 AM | 34 (10.9%) | 4 (1.4%) |
| 6:00 AM to 6:29 AM | 26 (8.3%) | 37 (12.7%) |
| 6:30 AM to 6:59 AM | 61 (19.6%) | 45 (15.4%) |
| 7:00 AM to 7:29 AM | 15 (4.8%) | 127 (43.5%) |
| 7:30 AM to 7:59 AM | 26 (8.3%) | 47 (16.1%) |
| 8:00 AM to 8:29 AM | 20 (6.4%) | 0 (0.0%) |
| 8:30 AM to 8:59 AM | 46 (14.7%) | 25 (8.6%) |
| 9:00 AM to 9:59 AM | 34 (10.9%) | 7 (2.4%) |
| 10:00 AM to 10:59 AM | 9 (2.9%) | 0 (0.0%) |
| 11:00 AM to 11:59 AM | 0 (0.0%) | 0 (0.0%) |
| 12:00 PM to 3:59 PM | 0 (0.0%) | 0 (0.0%) |
| 4:00 PM to 11:59 PM | 0 (0.0%) | 0 (0.0%) |
| Total | 312 (100.0%) | 292 (100.0%) |
Housing Occupancy in Perry Park
Occupancy by Ownership in Perry Park
Of the total 733 dwellings in Perry Park, owner-occupied units account for 699 (95.4%), while renter-occupied units make up 34 (4.6%).
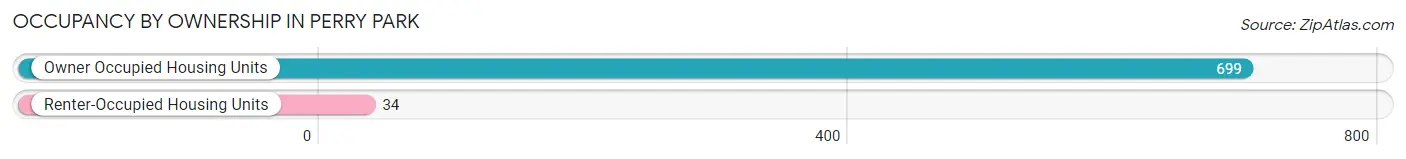
| Occupancy | # Housing Units | % Housing Units |
| Owner Occupied Housing Units | 699 | 95.4% |
| Renter-Occupied Housing Units | 34 | 4.6% |
| Total Occupied Housing Units | 733 | 100.0% |
Occupancy by Household Size in Perry Park
| Household Size | # Housing Units | % Housing Units |
| 1-Person Household | 110 | 15.0% |
| 2-Person Household | 460 | 62.8% |
| 3-Person Household | 98 | 13.4% |
| 4+ Person Household | 65 | 8.9% |
| Total Housing Units | 733 | 100.0% |
Occupancy by Ownership by Household Size in Perry Park
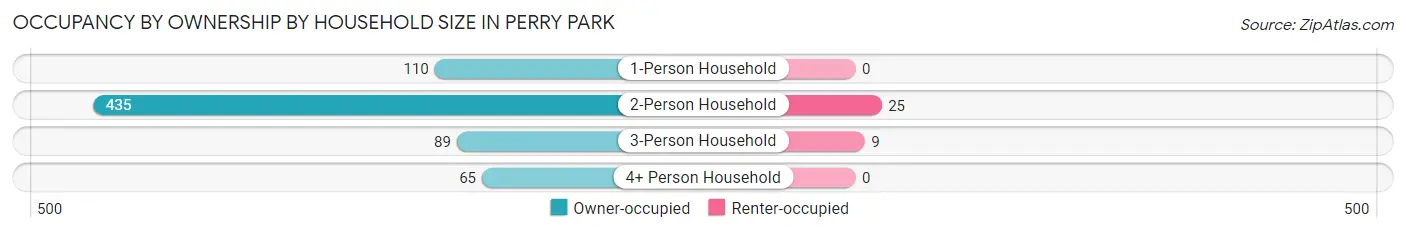
| Household Size | Owner-occupied | Renter-occupied |
| 1-Person Household | 110 (100.0%) | 0 (0.0%) |
| 2-Person Household | 435 (94.6%) | 25 (5.4%) |
| 3-Person Household | 89 (90.8%) | 9 (9.2%) |
| 4+ Person Household | 65 (100.0%) | 0 (0.0%) |
| Total Housing Units | 699 (95.4%) | 34 (4.6%) |
Occupancy by Educational Attainment in Perry Park
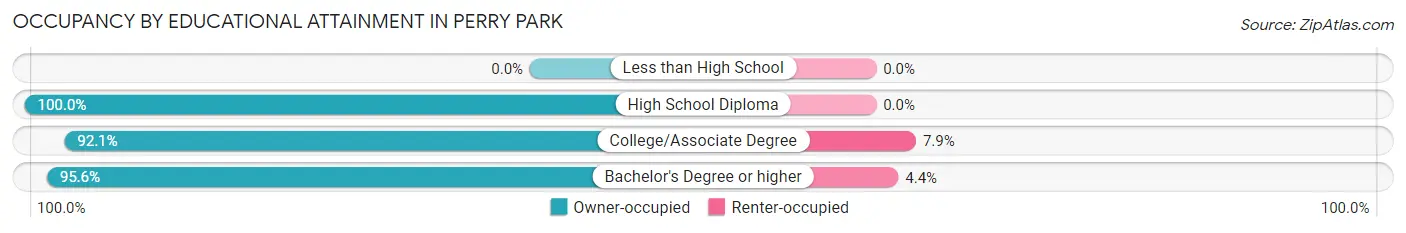
| Household Size | Owner-occupied | Renter-occupied |
| Less than High School | 0 (0.0%) | 0 (0.0%) |
| High School Diploma | 51 (100.0%) | 0 (0.0%) |
| College/Associate Degree | 105 (92.1%) | 9 (7.9%) |
| Bachelor's Degree or higher | 543 (95.6%) | 25 (4.4%) |
Occupancy by Age of Householder in Perry Park
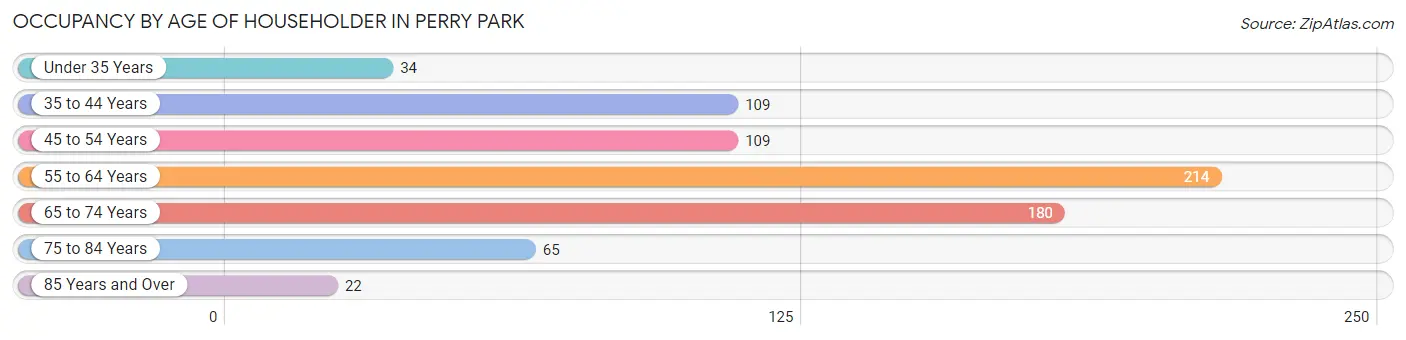
| Age Bracket | # Households | % Households |
| Under 35 Years | 34 | 4.6% |
| 35 to 44 Years | 109 | 14.9% |
| 45 to 54 Years | 109 | 14.9% |
| 55 to 64 Years | 214 | 29.2% |
| 65 to 74 Years | 180 | 24.6% |
| 75 to 84 Years | 65 | 8.9% |
| 85 Years and Over | 22 | 3.0% |
| Total | 733 | 100.0% |
Housing Finances in Perry Park
Median Income by Occupancy in Perry Park
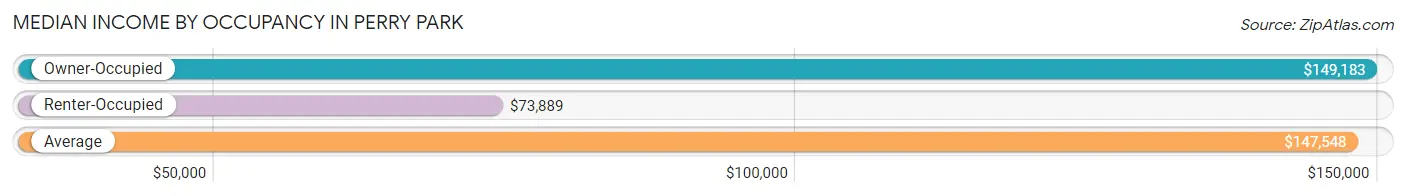
| Occupancy Type | # Households | Median Income |
| Owner-Occupied | 699 (95.4%) | $149,183 |
| Renter-Occupied | 34 (4.6%) | $73,889 |
| Average | 733 (100.0%) | $147,548 |
Occupancy by Householder Income Bracket in Perry Park
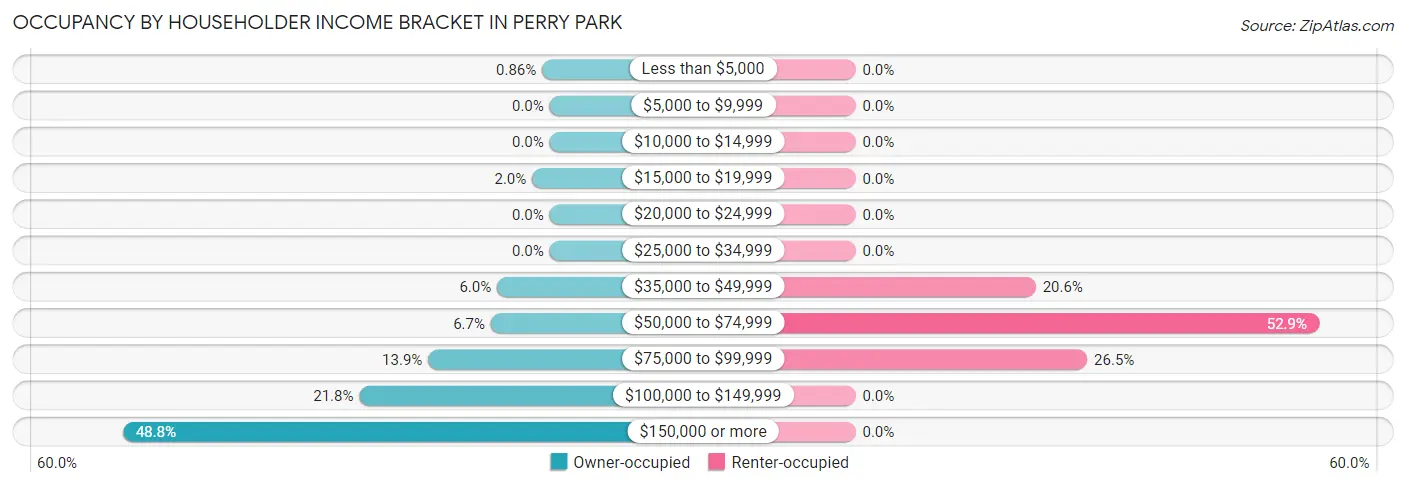
| Income Bracket | Owner-occupied | Renter-occupied |
| Less than $5,000 | 6 (0.9%) | 0 (0.0%) |
| $5,000 to $9,999 | 0 (0.0%) | 0 (0.0%) |
| $10,000 to $14,999 | 0 (0.0%) | 0 (0.0%) |
| $15,000 to $19,999 | 14 (2.0%) | 0 (0.0%) |
| $20,000 to $24,999 | 0 (0.0%) | 0 (0.0%) |
| $25,000 to $34,999 | 0 (0.0%) | 0 (0.0%) |
| $35,000 to $49,999 | 42 (6.0%) | 7 (20.6%) |
| $50,000 to $74,999 | 47 (6.7%) | 18 (52.9%) |
| $75,000 to $99,999 | 97 (13.9%) | 9 (26.5%) |
| $100,000 to $149,999 | 152 (21.7%) | 0 (0.0%) |
| $150,000 or more | 341 (48.8%) | 0 (0.0%) |
| Total | 699 (100.0%) | 34 (100.0%) |
Monthly Housing Cost Tiers in Perry Park
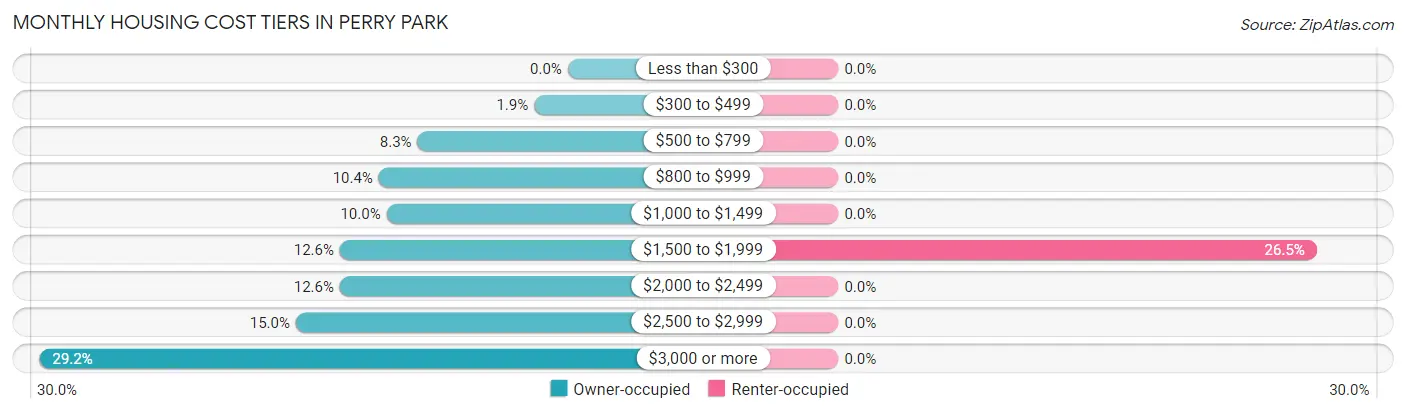
| Monthly Cost | Owner-occupied | Renter-occupied |
| Less than $300 | 0 (0.0%) | 0 (0.0%) |
| $300 to $499 | 13 (1.9%) | 0 (0.0%) |
| $500 to $799 | 58 (8.3%) | 0 (0.0%) |
| $800 to $999 | 73 (10.4%) | 0 (0.0%) |
| $1,000 to $1,499 | 70 (10.0%) | 0 (0.0%) |
| $1,500 to $1,999 | 88 (12.6%) | 9 (26.5%) |
| $2,000 to $2,499 | 88 (12.6%) | 0 (0.0%) |
| $2,500 to $2,999 | 105 (15.0%) | 0 (0.0%) |
| $3,000 or more | 204 (29.2%) | 0 (0.0%) |
| Total | 699 (100.0%) | 34 (100.0%) |
Physical Housing Characteristics in Perry Park
Housing Structures in Perry Park
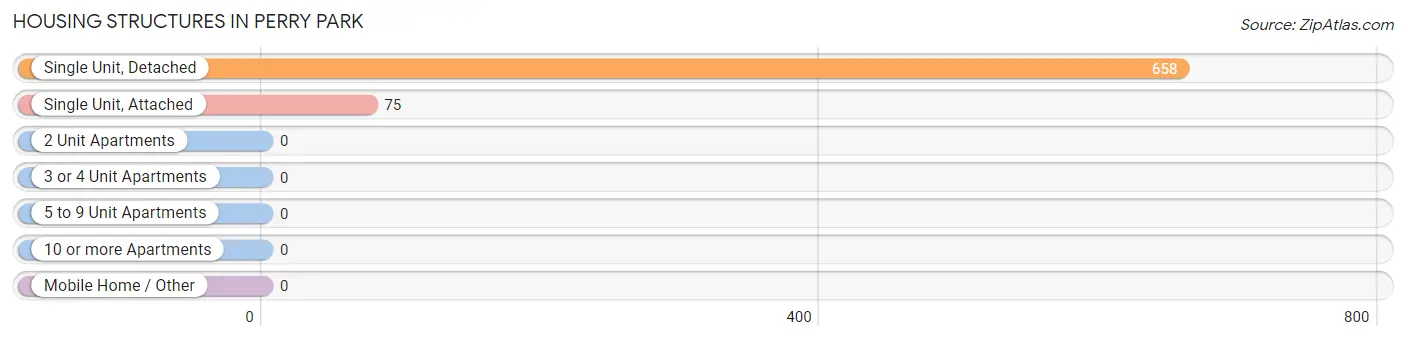
| Structure Type | # Housing Units | % Housing Units |
| Single Unit, Detached | 658 | 89.8% |
| Single Unit, Attached | 75 | 10.2% |
| 2 Unit Apartments | 0 | 0.0% |
| 3 or 4 Unit Apartments | 0 | 0.0% |
| 5 to 9 Unit Apartments | 0 | 0.0% |
| 10 or more Apartments | 0 | 0.0% |
| Mobile Home / Other | 0 | 0.0% |
| Total | 733 | 100.0% |
Housing Structures by Occupancy in Perry Park
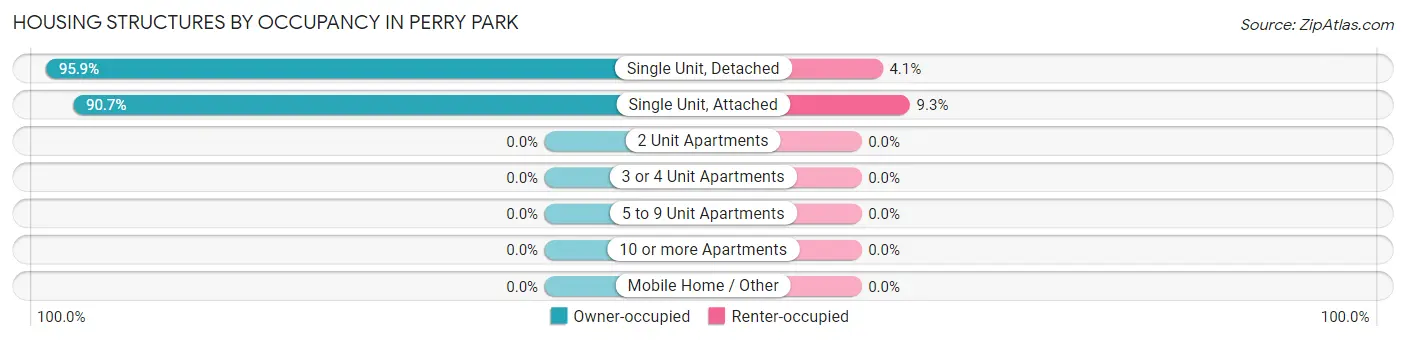
| Structure Type | Owner-occupied | Renter-occupied |
| Single Unit, Detached | 631 (95.9%) | 27 (4.1%) |
| Single Unit, Attached | 68 (90.7%) | 7 (9.3%) |
| 2 Unit Apartments | 0 (0.0%) | 0 (0.0%) |
| 3 or 4 Unit Apartments | 0 (0.0%) | 0 (0.0%) |
| 5 to 9 Unit Apartments | 0 (0.0%) | 0 (0.0%) |
| 10 or more Apartments | 0 (0.0%) | 0 (0.0%) |
| Mobile Home / Other | 0 (0.0%) | 0 (0.0%) |
| Total | 699 (95.4%) | 34 (4.6%) |
Housing Structures by Number of Rooms in Perry Park
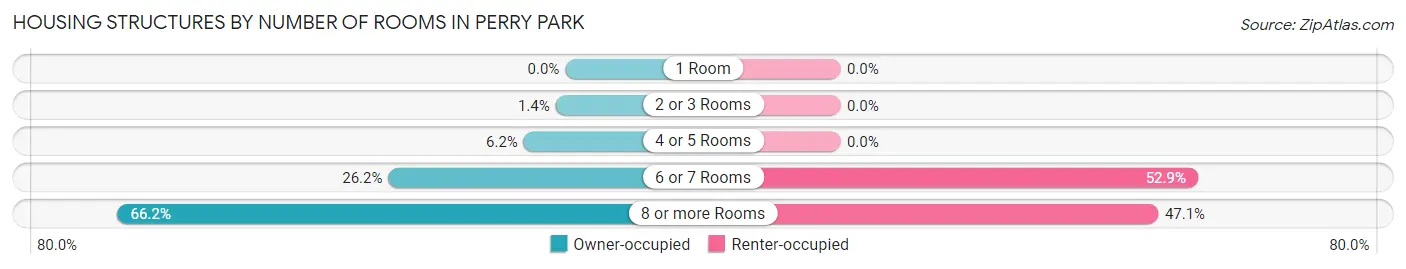
| Number of Rooms | Owner-occupied | Renter-occupied |
| 1 Room | 0 (0.0%) | 0 (0.0%) |
| 2 or 3 Rooms | 10 (1.4%) | 0 (0.0%) |
| 4 or 5 Rooms | 43 (6.1%) | 0 (0.0%) |
| 6 or 7 Rooms | 183 (26.2%) | 18 (52.9%) |
| 8 or more Rooms | 463 (66.2%) | 16 (47.1%) |
| Total | 699 (100.0%) | 34 (100.0%) |
Housing Structure by Heating Type in Perry Park
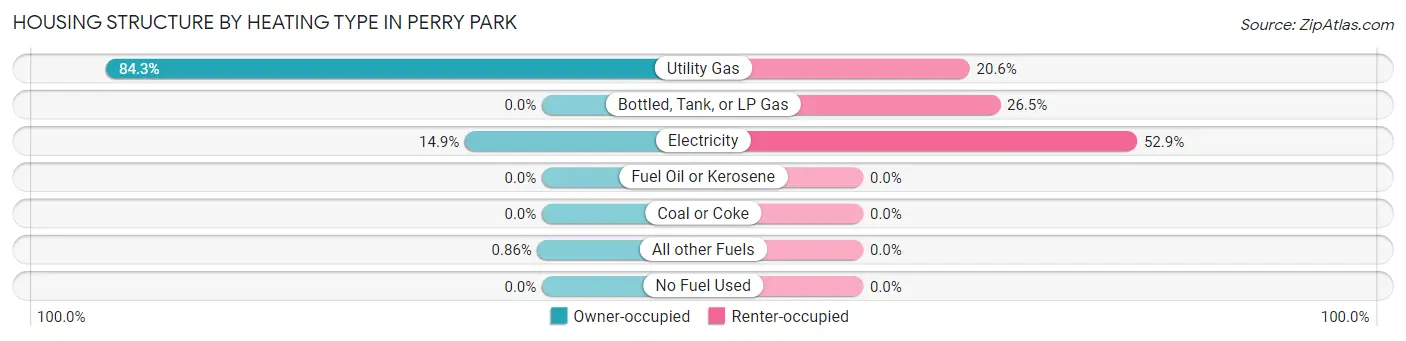
| Heating Type | Owner-occupied | Renter-occupied |
| Utility Gas | 589 (84.3%) | 7 (20.6%) |
| Bottled, Tank, or LP Gas | 0 (0.0%) | 9 (26.5%) |
| Electricity | 104 (14.9%) | 18 (52.9%) |
| Fuel Oil or Kerosene | 0 (0.0%) | 0 (0.0%) |
| Coal or Coke | 0 (0.0%) | 0 (0.0%) |
| All other Fuels | 6 (0.9%) | 0 (0.0%) |
| No Fuel Used | 0 (0.0%) | 0 (0.0%) |
| Total | 699 (100.0%) | 34 (100.0%) |
Household Vehicle Usage in Perry Park
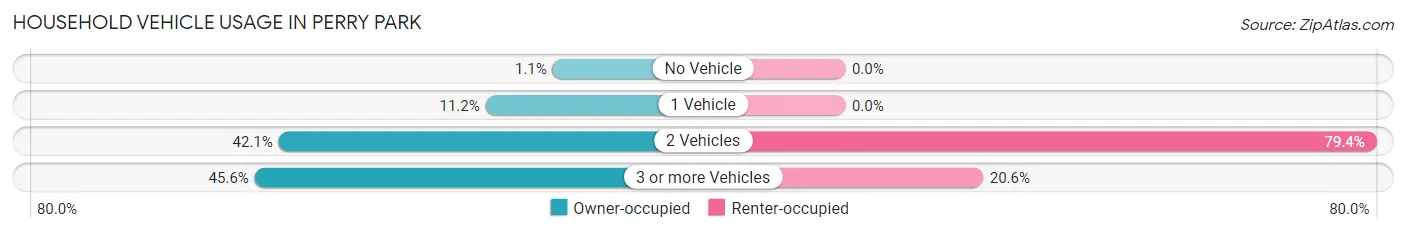
| Vehicles per Household | Owner-occupied | Renter-occupied |
| No Vehicle | 8 (1.1%) | 0 (0.0%) |
| 1 Vehicle | 78 (11.2%) | 0 (0.0%) |
| 2 Vehicles | 294 (42.1%) | 27 (79.4%) |
| 3 or more Vehicles | 319 (45.6%) | 7 (20.6%) |
| Total | 699 (100.0%) | 34 (100.0%) |
Real Estate & Mortgages in Perry Park
Real Estate and Mortgage Overview in Perry Park
| Characteristic | Without Mortgage | With Mortgage |
| Housing Units | 214 | 485 |
| Median Property Value | $710,000 | $735,000 |
| Median Household Income | $133,929 | $246 |
| Monthly Housing Costs | $914 | $204 |
| Real Estate Taxes | $3,841 | $0 |
Property Value by Mortgage Status in Perry Park
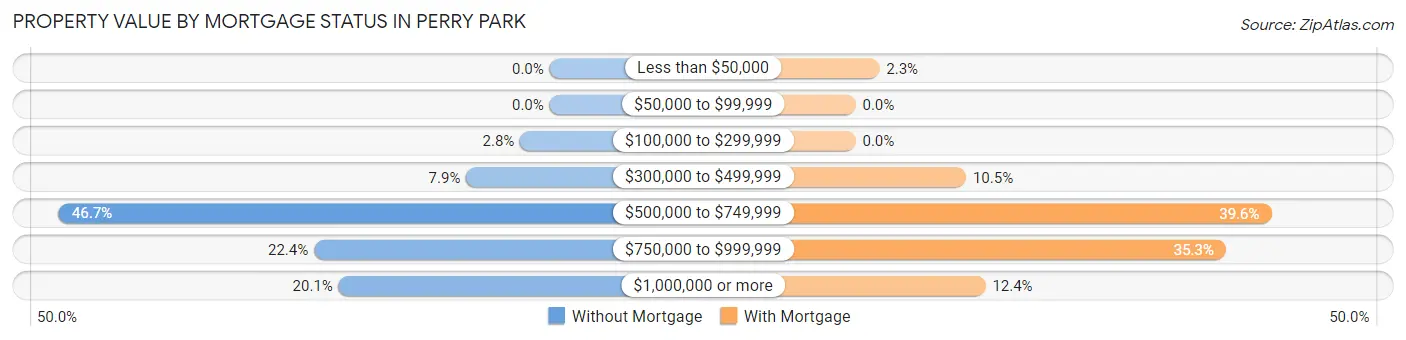
| Property Value | Without Mortgage | With Mortgage |
| Less than $50,000 | 0 (0.0%) | 11 (2.3%) |
| $50,000 to $99,999 | 0 (0.0%) | 0 (0.0%) |
| $100,000 to $299,999 | 6 (2.8%) | 0 (0.0%) |
| $300,000 to $499,999 | 17 (7.9%) | 51 (10.5%) |
| $500,000 to $749,999 | 100 (46.7%) | 192 (39.6%) |
| $750,000 to $999,999 | 48 (22.4%) | 171 (35.3%) |
| $1,000,000 or more | 43 (20.1%) | 60 (12.4%) |
| Total | 214 (100.0%) | 485 (100.0%) |
Household Income by Mortgage Status in Perry Park
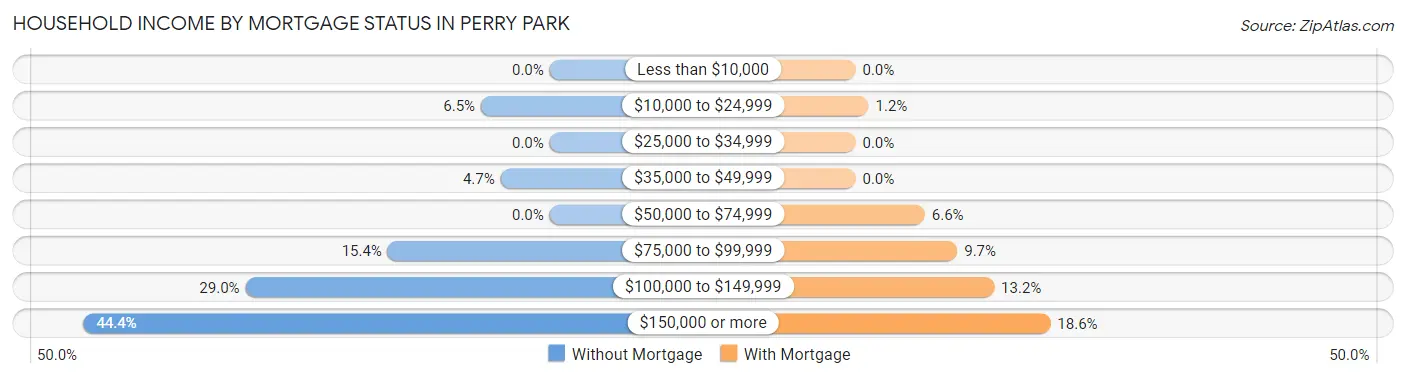
| Household Income | Without Mortgage | With Mortgage |
| Less than $10,000 | 0 (0.0%) | 0 (0.0%) |
| $10,000 to $24,999 | 14 (6.5%) | 6 (1.2%) |
| $25,000 to $34,999 | 0 (0.0%) | 0 (0.0%) |
| $35,000 to $49,999 | 10 (4.7%) | 0 (0.0%) |
| $50,000 to $74,999 | 0 (0.0%) | 32 (6.6%) |
| $75,000 to $99,999 | 33 (15.4%) | 47 (9.7%) |
| $100,000 to $149,999 | 62 (29.0%) | 64 (13.2%) |
| $150,000 or more | 95 (44.4%) | 90 (18.6%) |
| Total | 214 (100.0%) | 485 (100.0%) |
Property Value to Household Income Ratio in Perry Park
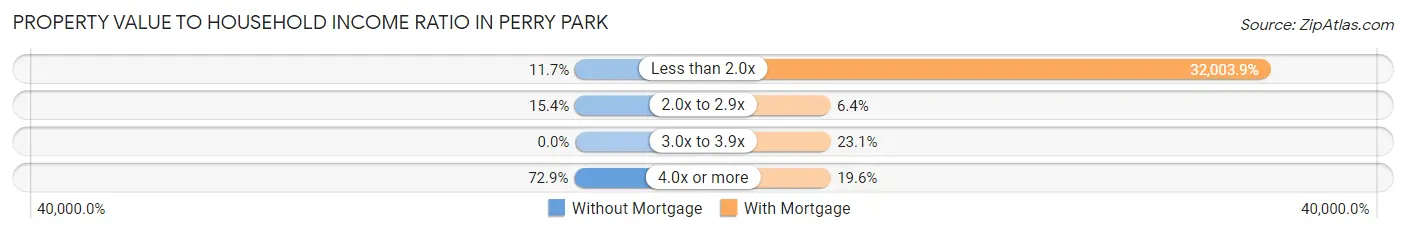
| Value-to-Income Ratio | Without Mortgage | With Mortgage |
| Less than 2.0x | 25 (11.7%) | 155,219 (32,003.9%) |
| 2.0x to 2.9x | 33 (15.4%) | 31 (6.4%) |
| 3.0x to 3.9x | 0 (0.0%) | 112 (23.1%) |
| 4.0x or more | 156 (72.9%) | 95 (19.6%) |
| Total | 214 (100.0%) | 485 (100.0%) |
Real Estate Taxes by Mortgage Status in Perry Park
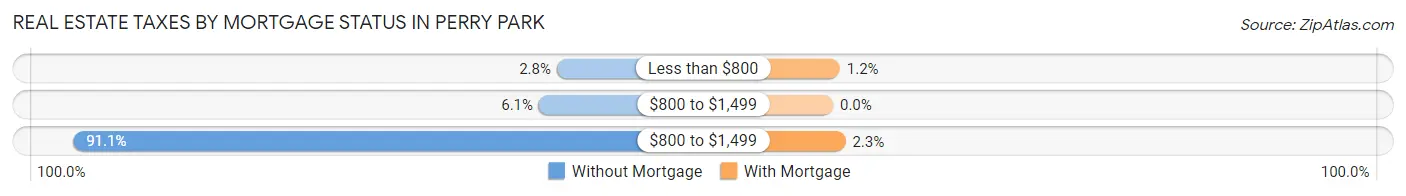
| Property Taxes | Without Mortgage | With Mortgage |
| Less than $800 | 6 (2.8%) | 6 (1.2%) |
| $800 to $1,499 | 13 (6.1%) | 0 (0.0%) |
| $800 to $1,499 | 195 (91.1%) | 11 (2.3%) |
| Total | 214 (100.0%) | 485 (100.0%) |
Health & Disability in Perry Park
Health Insurance Coverage by Age in Perry Park
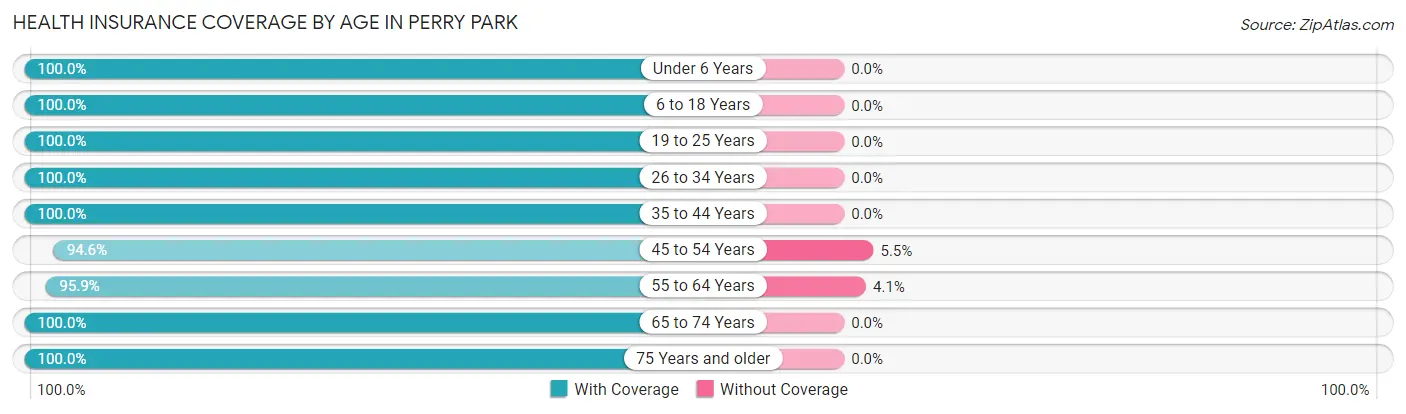
| Age Bracket | With Coverage | Without Coverage |
| Under 6 Years | 97 (100.0%) | 0 (0.0%) |
| 6 to 18 Years | 134 (100.0%) | 0 (0.0%) |
| 19 to 25 Years | 48 (100.0%) | 0 (0.0%) |
| 26 to 34 Years | 86 (100.0%) | 0 (0.0%) |
| 35 to 44 Years | 205 (100.0%) | 0 (0.0%) |
| 45 to 54 Years | 191 (94.6%) | 11 (5.4%) |
| 55 to 64 Years | 424 (95.9%) | 18 (4.1%) |
| 65 to 74 Years | 359 (100.0%) | 0 (0.0%) |
| 75 Years and older | 139 (100.0%) | 0 (0.0%) |
| Total | 1,683 (98.3%) | 29 (1.7%) |
Health Insurance Coverage by Citizenship Status in Perry Park
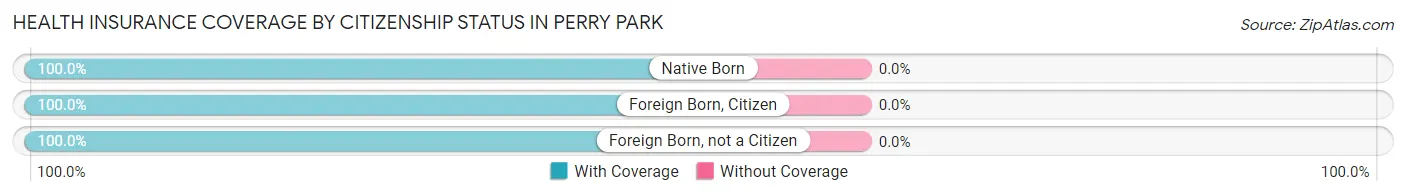
| Citizenship Status | With Coverage | Without Coverage |
| Native Born | 97 (100.0%) | 0 (0.0%) |
| Foreign Born, Citizen | 134 (100.0%) | 0 (0.0%) |
| Foreign Born, not a Citizen | 48 (100.0%) | 0 (0.0%) |
Health Insurance Coverage by Household Income in Perry Park
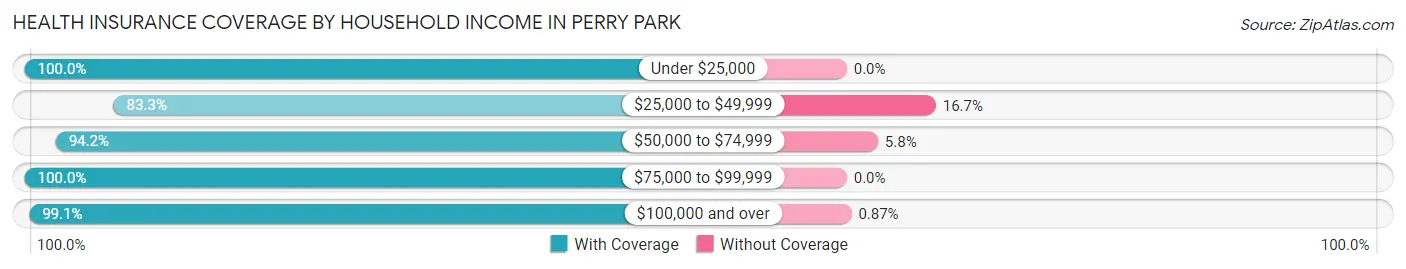
| Household Income | With Coverage | Without Coverage |
| Under $25,000 | 30 (100.0%) | 0 (0.0%) |
| $25,000 to $49,999 | 55 (83.3%) | 11 (16.7%) |
| $50,000 to $74,999 | 113 (94.2%) | 7 (5.8%) |
| $75,000 to $99,999 | 231 (100.0%) | 0 (0.0%) |
| $100,000 and over | 1,254 (99.1%) | 11 (0.9%) |
Public vs Private Health Insurance Coverage by Age in Perry Park
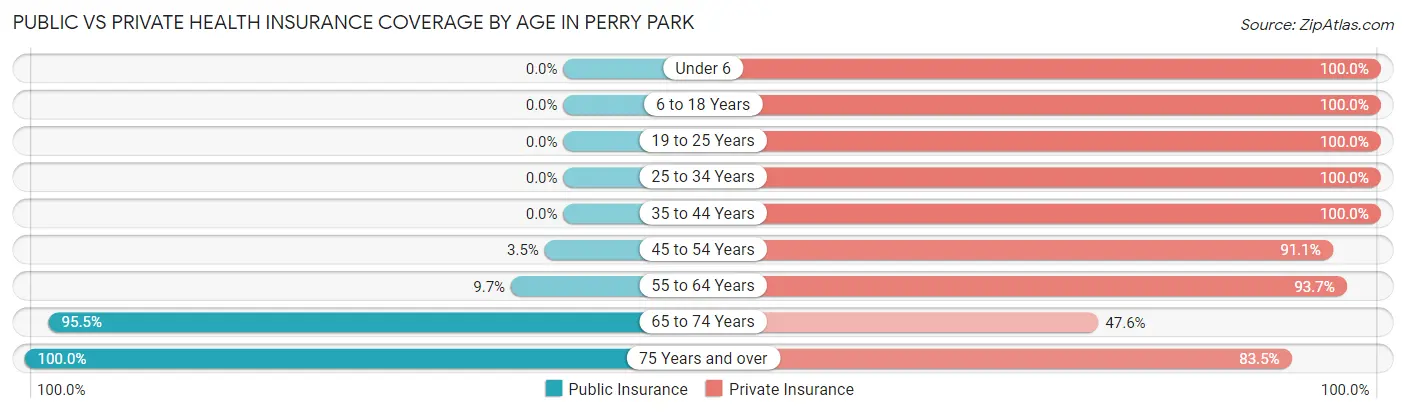
| Age Bracket | Public Insurance | Private Insurance |
| Under 6 | 0 (0.0%) | 97 (100.0%) |
| 6 to 18 Years | 0 (0.0%) | 134 (100.0%) |
| 19 to 25 Years | 0 (0.0%) | 48 (100.0%) |
| 25 to 34 Years | 0 (0.0%) | 86 (100.0%) |
| 35 to 44 Years | 0 (0.0%) | 205 (100.0%) |
| 45 to 54 Years | 7 (3.5%) | 184 (91.1%) |
| 55 to 64 Years | 43 (9.7%) | 414 (93.7%) |
| 65 to 74 Years | 343 (95.5%) | 171 (47.6%) |
| 75 Years and over | 139 (100.0%) | 116 (83.5%) |
| Total | 532 (31.1%) | 1,455 (85.0%) |
Disability Status by Sex by Age in Perry Park
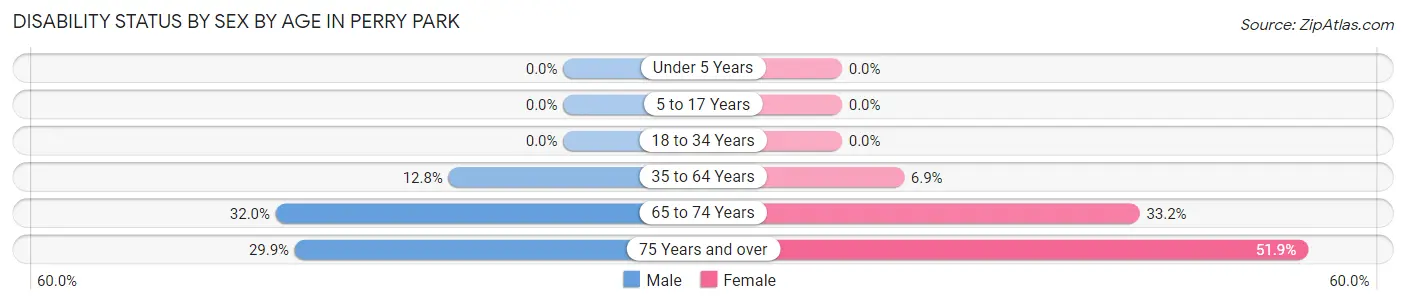
| Age Bracket | Male | Female |
| Under 5 Years | 0 (0.0%) | 0 (0.0%) |
| 5 to 17 Years | 0 (0.0%) | 0 (0.0%) |
| 18 to 34 Years | 0 (0.0%) | 0 (0.0%) |
| 35 to 64 Years | 53 (12.8%) | 30 (6.9%) |
| 65 to 74 Years | 57 (32.0%) | 60 (33.2%) |
| 75 Years and over | 26 (29.9%) | 27 (51.9%) |
Disability Class by Sex by Age in Perry Park
Disability Class: Hearing Difficulty
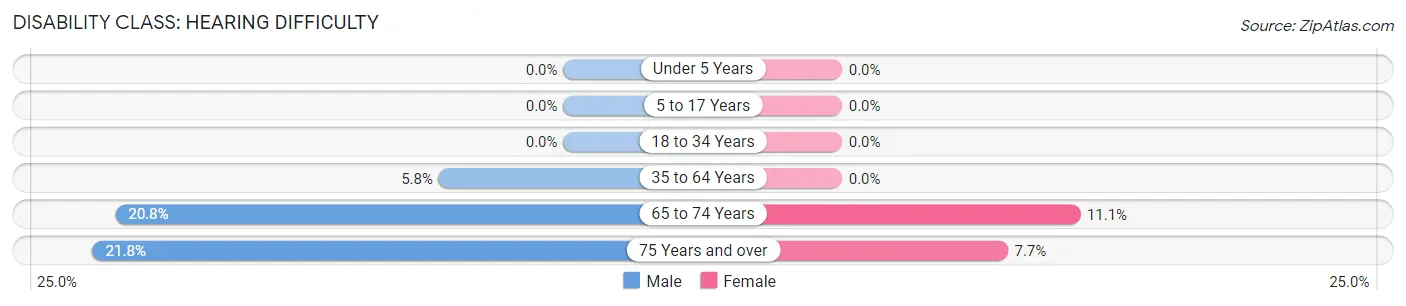
| Age Bracket | Male | Female |
| Under 5 Years | 0 (0.0%) | 0 (0.0%) |
| 5 to 17 Years | 0 (0.0%) | 0 (0.0%) |
| 18 to 34 Years | 0 (0.0%) | 0 (0.0%) |
| 35 to 64 Years | 24 (5.8%) | 0 (0.0%) |
| 65 to 74 Years | 37 (20.8%) | 20 (11.1%) |
| 75 Years and over | 19 (21.8%) | 4 (7.7%) |
Disability Class: Vision Difficulty
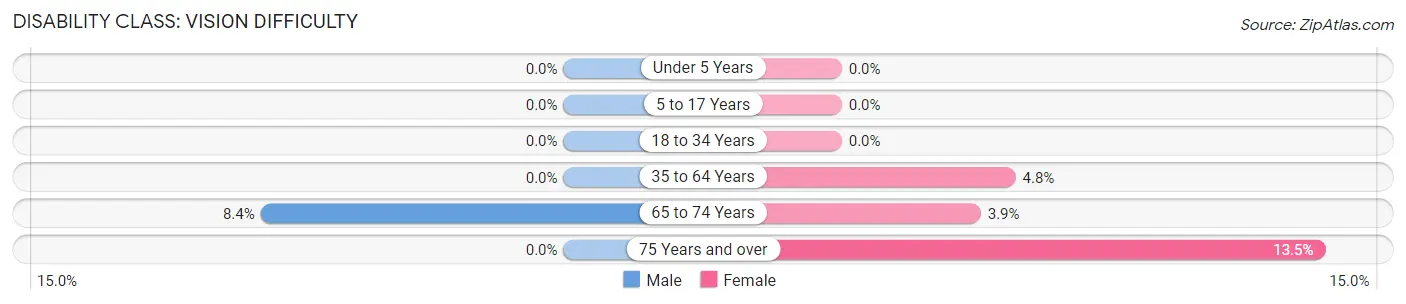
| Age Bracket | Male | Female |
| Under 5 Years | 0 (0.0%) | 0 (0.0%) |
| 5 to 17 Years | 0 (0.0%) | 0 (0.0%) |
| 18 to 34 Years | 0 (0.0%) | 0 (0.0%) |
| 35 to 64 Years | 0 (0.0%) | 21 (4.8%) |
| 65 to 74 Years | 15 (8.4%) | 7 (3.9%) |
| 75 Years and over | 0 (0.0%) | 7 (13.5%) |
Disability Class: Cognitive Difficulty
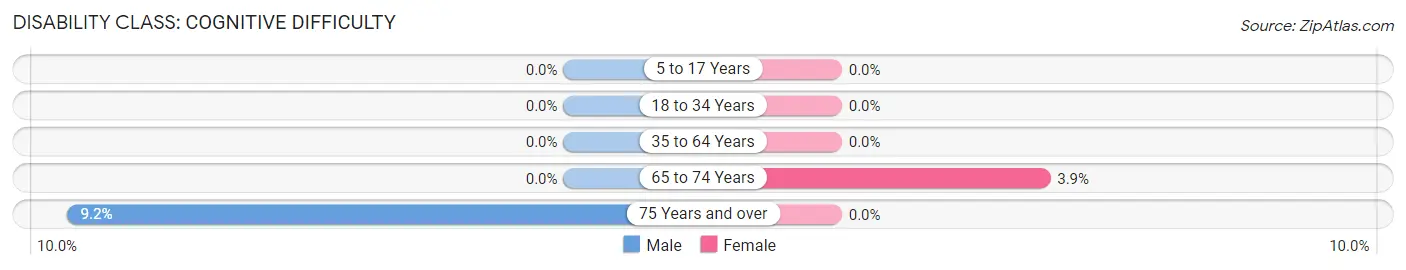
| Age Bracket | Male | Female |
| 5 to 17 Years | 0 (0.0%) | 0 (0.0%) |
| 18 to 34 Years | 0 (0.0%) | 0 (0.0%) |
| 35 to 64 Years | 0 (0.0%) | 0 (0.0%) |
| 65 to 74 Years | 0 (0.0%) | 7 (3.9%) |
| 75 Years and over | 8 (9.2%) | 0 (0.0%) |
Disability Class: Ambulatory Difficulty
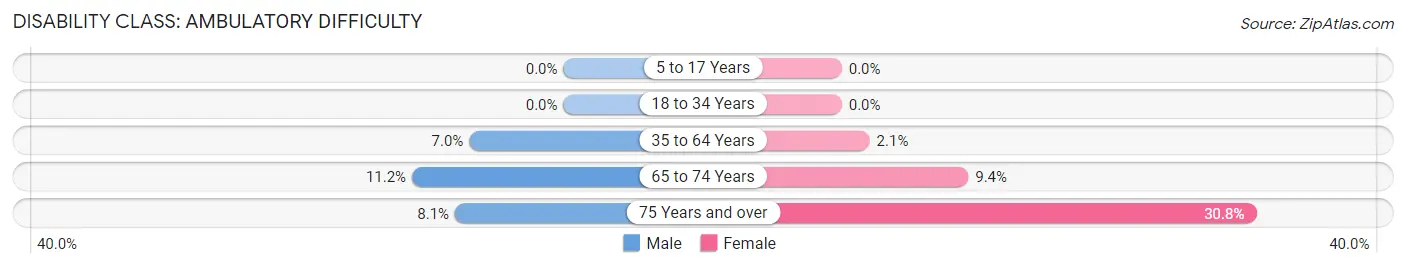
| Age Bracket | Male | Female |
| 5 to 17 Years | 0 (0.0%) | 0 (0.0%) |
| 18 to 34 Years | 0 (0.0%) | 0 (0.0%) |
| 35 to 64 Years | 29 (7.0%) | 9 (2.1%) |
| 65 to 74 Years | 20 (11.2%) | 17 (9.4%) |
| 75 Years and over | 7 (8.1%) | 16 (30.8%) |
Disability Class: Self-Care Difficulty
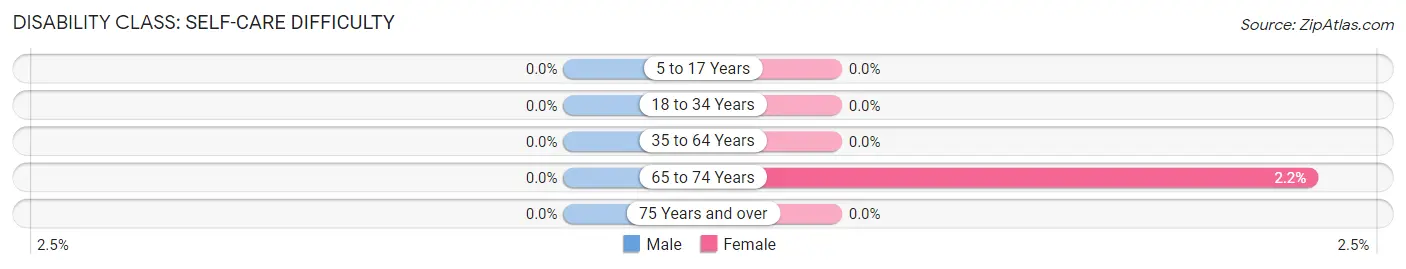
| Age Bracket | Male | Female |
| 5 to 17 Years | 0 (0.0%) | 0 (0.0%) |
| 18 to 34 Years | 0 (0.0%) | 0 (0.0%) |
| 35 to 64 Years | 0 (0.0%) | 0 (0.0%) |
| 65 to 74 Years | 0 (0.0%) | 4 (2.2%) |
| 75 Years and over | 0 (0.0%) | 0 (0.0%) |
Technology Access in Perry Park
Computing Device Access in Perry Park
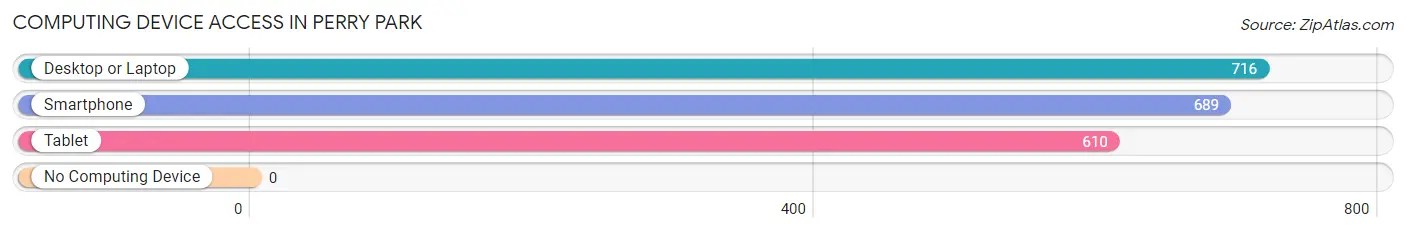
| Device Type | # Households | % Households |
| Desktop or Laptop | 716 | 97.7% |
| Smartphone | 689 | 94.0% |
| Tablet | 610 | 83.2% |
| No Computing Device | 0 | 0.0% |
| Total | 733 | 100.0% |
Internet Access in Perry Park
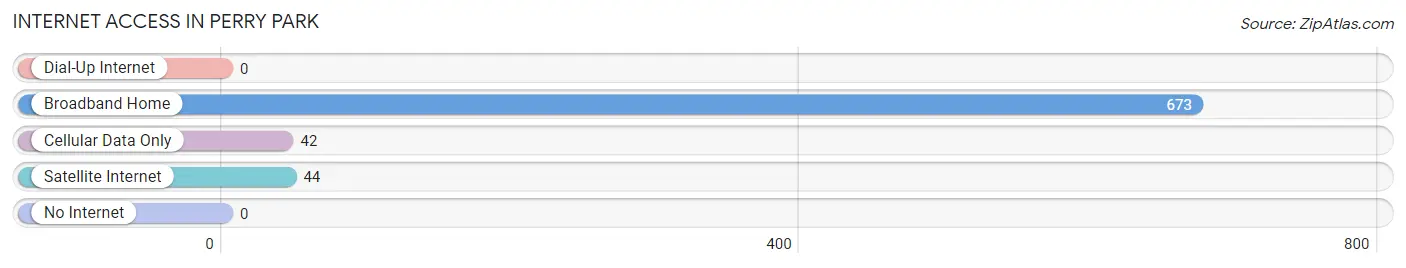
| Internet Type | # Households | % Households |
| Dial-Up Internet | 0 | 0.0% |
| Broadband Home | 673 | 91.8% |
| Cellular Data Only | 42 | 5.7% |
| Satellite Internet | 44 | 6.0% |
| No Internet | 0 | 0.0% |
| Total | 733 | 100.0% |
Perry Park Summary
Perry Park is a census-designated place located in Douglas County, Colorado, United States. It is situated in the foothills of the Rocky Mountains, approximately 25 miles south of Denver. The population was 1,845 at the 2010 census.
History
Perry Park was founded in 1859 by William Perry, a former miner who had come to Colorado in search of gold. He purchased the land from the U.S. government and began to develop it into a farming and ranching community. The town was named after him and was officially incorporated in 1876.
In the late 1800s, Perry Park was a popular destination for tourists and vacationers. The town was known for its natural beauty and its proximity to Denver. It was also a popular spot for hunting and fishing.
In the early 1900s, the town began to experience a decline in population as people moved away to larger cities. However, in the 1950s, the town experienced a resurgence in popularity as people began to move back to the area.
Geography
Perry Park is located in the foothills of the Rocky Mountains at an elevation of 6,845 feet. It is situated in the northern part of Douglas County, approximately 25 miles south of Denver. The town is surrounded by rolling hills and is home to several small lakes and reservoirs.
The climate in Perry Park is semi-arid, with hot summers and cold winters. The average annual temperature is around 50 degrees Fahrenheit.
Economy
The economy of Perry Park is largely based on tourism and recreation. The town is home to several golf courses, as well as a ski resort. There are also several restaurants and shops in the area.
In addition, Perry Park is home to several small businesses, including a winery, a brewery, and a distillery. The town is also home to several horse ranches and farms.
Demographics
As of the 2010 census, the population of Perry Park was 1,845. The racial makeup of the town was 94.3% White, 0.7% African American, 0.3% Native American, 0.7% Asian, 0.1% Pacific Islander, 1.7% from other races, and 2.1% from two or more races. Hispanic or Latino of any race were 4.2% of the population.
The median income for a household in Perry Park was $68,750, and the median income for a family was $76,250. The per capita income for the town was $31,945. About 4.3% of families and 5.3% of the population were below the poverty line, including 6.3% of those under age 18 and 4.2% of those age 65 or over.
Conclusion
Perry Park is a small town located in the foothills of the Rocky Mountains in Douglas County, Colorado. It was founded in 1859 by William Perry and was officially incorporated in 1876. The town is known for its natural beauty and its proximity to Denver. The economy of Perry Park is largely based on tourism and recreation, and the town is home to several small businesses. As of the 2010 census, the population of Perry Park was 1,845.
Common Questions
What is Per Capita Income in Perry Park?
Per Capita income in Perry Park is $71,463.
What is the Median Family Income in Perry Park?
Median Family Income in Perry Park is $149,231.
What is the Median Household income in Perry Park?
Median Household Income in Perry Park is $147,548.
What is Income or Wage Gap in Perry Park?
Income or Wage Gap in Perry Park is 24.3%.
Women in Perry Park earn 75.7 cents for every dollar earned by a man.
What is Inequality or Gini Index in Perry Park?
Inequality or Gini Index in Perry Park is 0.34.
What is the Total Population of Perry Park?
Total Population of Perry Park is 1,712.
What is the Total Male Population of Perry Park?
Total Male Population of Perry Park is 933.
What is the Total Female Population of Perry Park?
Total Female Population of Perry Park is 779.
What is the Ratio of Males per 100 Females in Perry Park?
There are 119.77 Males per 100 Females in Perry Park.
What is the Ratio of Females per 100 Males in Perry Park?
There are 83.49 Females per 100 Males in Perry Park.
What is the Median Population Age in Perry Park?
Median Population Age in Perry Park is 57.2 Years.
What is the Average Family Size in Perry Park
Average Family Size in Perry Park is 2.6 People.
What is the Average Household Size in Perry Park
Average Household Size in Perry Park is 2.3 People.
How Large is the Labor Force in Perry Park?
There are 900 People in the Labor Forcein in Perry Park.
What is the Percentage of People in the Labor Force in Perry Park?
58.5% of People are in the Labor Force in Perry Park.