Superior, WY Map & Demographics
Superior Map
Superior Overview
$26,852
PER CAPITA INCOME
$92,232
AVG FAMILY INCOME
$90,982
AVG HOUSEHOLD INCOME
25.3%
WAGE / INCOME GAP [ % ]
74.7¢/ $1
WAGE / INCOME GAP [ $ ]
0.28
INEQUALITY / GINI INDEX
220
TOTAL POPULATION
100
MALE POPULATION
120
FEMALE POPULATION
83.33
MALES / 100 FEMALES
120.00
FEMALES / 100 MALES
37.8
MEDIAN AGE
4.0
AVG FAMILY SIZE
3.4
AVG HOUSEHOLD SIZE
104
LABOR FORCE [ PEOPLE ]
63.4%
PERCENT IN LABOR FORCE
Superior Zip Codes
Superior Area Codes
Income in Superior
Income Overview in Superior
Per Capita Income in Superior is $26,852, while median incomes of families and households are $92,232 and $90,982 respectively.
| Characteristic | Number | Measure |
| Per Capita Income | 220 | $26,852 |
| Median Family Income | 51 | $92,232 |
| Mean Family Income | 51 | $102,947 |
| Median Household Income | 65 | $90,982 |
| Mean Household Income | 65 | $84,406 |
| Income Deficit | 51 | $0 |
| Wage / Income Gap (%) | 220 | 25.30% |
| Wage / Income Gap ($) | 220 | 74.70¢ per $1 |
| Gini / Inequality Index | 220 | 0.28 |
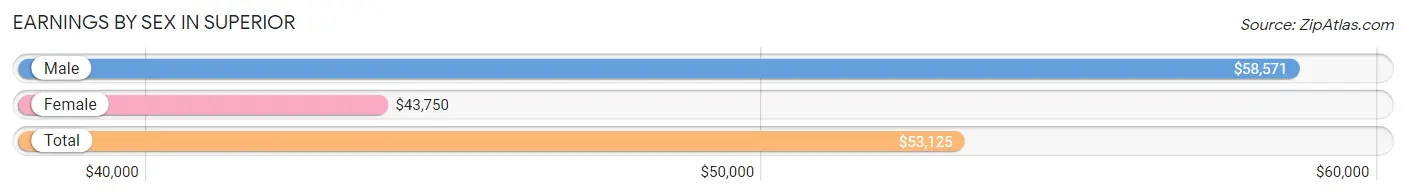
Earnings by Sex in Superior
Average Earnings in Superior are $53,125, $58,571 for men and $43,750 for women, a difference of 25.3%.
| Sex | Number | Average Earnings |
| Male | 64 (61.5%) | $58,571 |
| Female | 40 (38.5%) | $43,750 |
| Total | 104 (100.0%) | $53,125 |
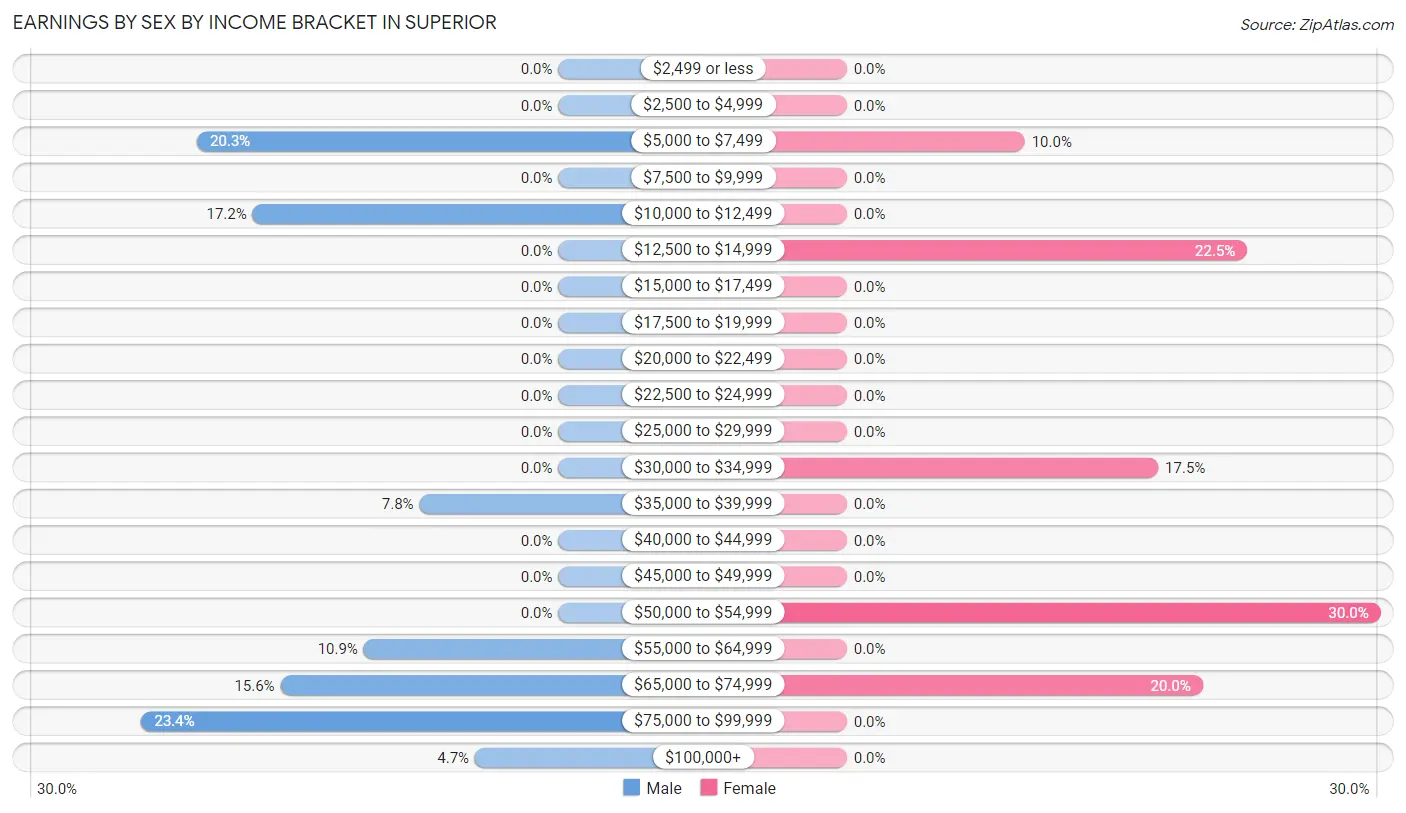
Earnings by Sex by Income Bracket in Superior
The most common earnings brackets in Superior are $75,000 to $99,999 for men (15 | 23.4%) and $50,000 to $54,999 for women (12 | 30.0%).
| Income | Male | Female |
| $2,499 or less | 0 (0.0%) | 0 (0.0%) |
| $2,500 to $4,999 | 0 (0.0%) | 0 (0.0%) |
| $5,000 to $7,499 | 13 (20.3%) | 4 (10.0%) |
| $7,500 to $9,999 | 0 (0.0%) | 0 (0.0%) |
| $10,000 to $12,499 | 11 (17.2%) | 0 (0.0%) |
| $12,500 to $14,999 | 0 (0.0%) | 9 (22.5%) |
| $15,000 to $17,499 | 0 (0.0%) | 0 (0.0%) |
| $17,500 to $19,999 | 0 (0.0%) | 0 (0.0%) |
| $20,000 to $22,499 | 0 (0.0%) | 0 (0.0%) |
| $22,500 to $24,999 | 0 (0.0%) | 0 (0.0%) |
| $25,000 to $29,999 | 0 (0.0%) | 0 (0.0%) |
| $30,000 to $34,999 | 0 (0.0%) | 7 (17.5%) |
| $35,000 to $39,999 | 5 (7.8%) | 0 (0.0%) |
| $40,000 to $44,999 | 0 (0.0%) | 0 (0.0%) |
| $45,000 to $49,999 | 0 (0.0%) | 0 (0.0%) |
| $50,000 to $54,999 | 0 (0.0%) | 12 (30.0%) |
| $55,000 to $64,999 | 7 (10.9%) | 0 (0.0%) |
| $65,000 to $74,999 | 10 (15.6%) | 8 (20.0%) |
| $75,000 to $99,999 | 15 (23.4%) | 0 (0.0%) |
| $100,000+ | 3 (4.7%) | 0 (0.0%) |
| Total | 64 (100.0%) | 40 (100.0%) |
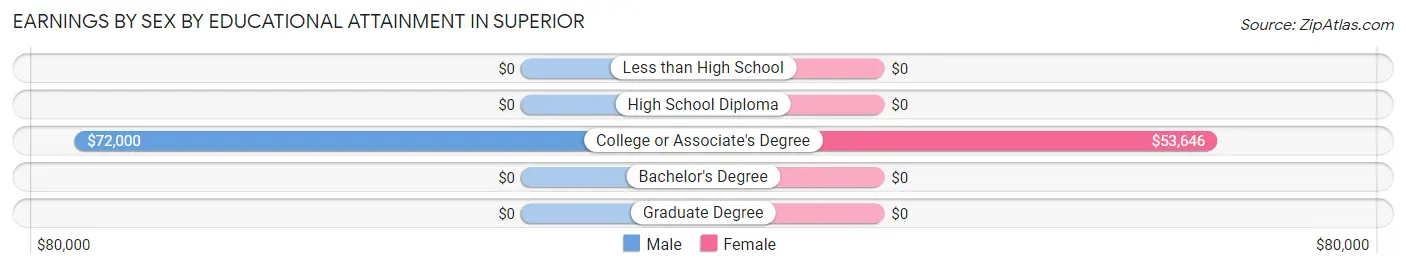
Earnings by Sex by Educational Attainment in Superior
Average earnings in Superior are $71,500 for men and $43,750 for women, a difference of 38.8%. Men with an educational attainment of college or associate's degree enjoy the highest average annual earnings of $72,000, while those with college or associate's degree education earn the least with $72,000. Women with an educational attainment of college or associate's degree earn the most with the average annual earnings of $53,646, while those with college or associate's degree education have the smallest earnings of $53,646.
| Educational Attainment | Male Income | Female Income |
| Less than High School | - | - |
| High School Diploma | - | - |
| College or Associate's Degree | $72,000 | $53,646 |
| Bachelor's Degree | - | - |
| Graduate Degree | - | - |
| Total | $71,500 | $43,750 |
Family Income in Superior
Family Income Brackets in Superior
According to the Superior family income data, there are 27 families falling into the $75,000 to $99,999 income range, which is the most common income bracket and makes up 52.9% of all families.
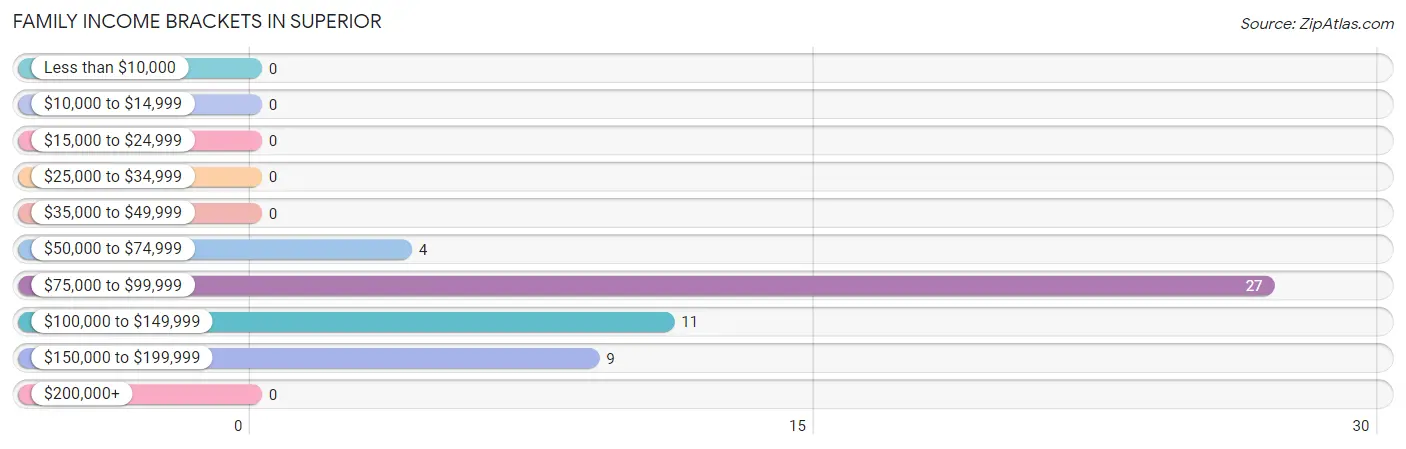
| Income Bracket | # Families | % Families |
| Less than $10,000 | 0 | 0.0% |
| $10,000 to $14,999 | 0 | 0.0% |
| $15,000 to $24,999 | 0 | 0.0% |
| $25,000 to $34,999 | 0 | 0.0% |
| $35,000 to $49,999 | 0 | 0.0% |
| $50,000 to $74,999 | 4 | 7.8% |
| $75,000 to $99,999 | 27 | 52.9% |
| $100,000 to $149,999 | 11 | 21.6% |
| $150,000 to $199,999 | 9 | 17.6% |
| $200,000+ | 0 | 0.0% |
Family Income by Famaliy Size in Superior
2-person families (11 | 21.6%) account for the highest median family income in Superior with $95,938 per family, while 2-person families (11 | 21.6%) have the highest median income of $47,969 per family member.
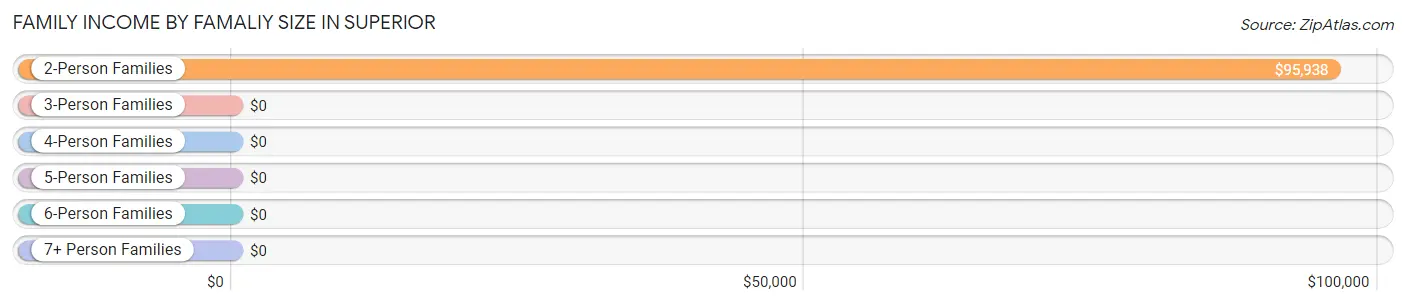
| Income Bracket | # Families | Median Income |
| 2-Person Families | 11 (21.6%) | $95,938 |
| 3-Person Families | 17 (33.3%) | $0 |
| 4-Person Families | 14 (27.5%) | $0 |
| 5-Person Families | 0 (0.0%) | $0 |
| 6-Person Families | 0 (0.0%) | $0 |
| 7+ Person Families | 9 (17.6%) | $0 |
| Total | 51 (100.0%) | $92,232 |
Family Income by Number of Earners in Superior
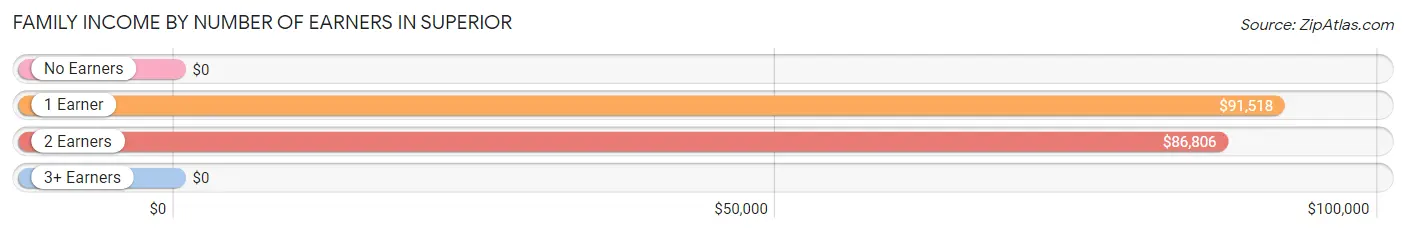
| Number of Earners | # Families | Median Income |
| No Earners | 4 (7.8%) | $0 |
| 1 Earner | 17 (33.3%) | $91,518 |
| 2 Earners | 21 (41.2%) | $86,806 |
| 3+ Earners | 9 (17.6%) | $0 |
| Total | 51 (100.0%) | $92,232 |
Household Income in Superior
Household Income Brackets in Superior
With 27 households falling in the category, the $75,000 to $99,999 income range is the most frequent in Superior, accounting for 41.5% of all households.
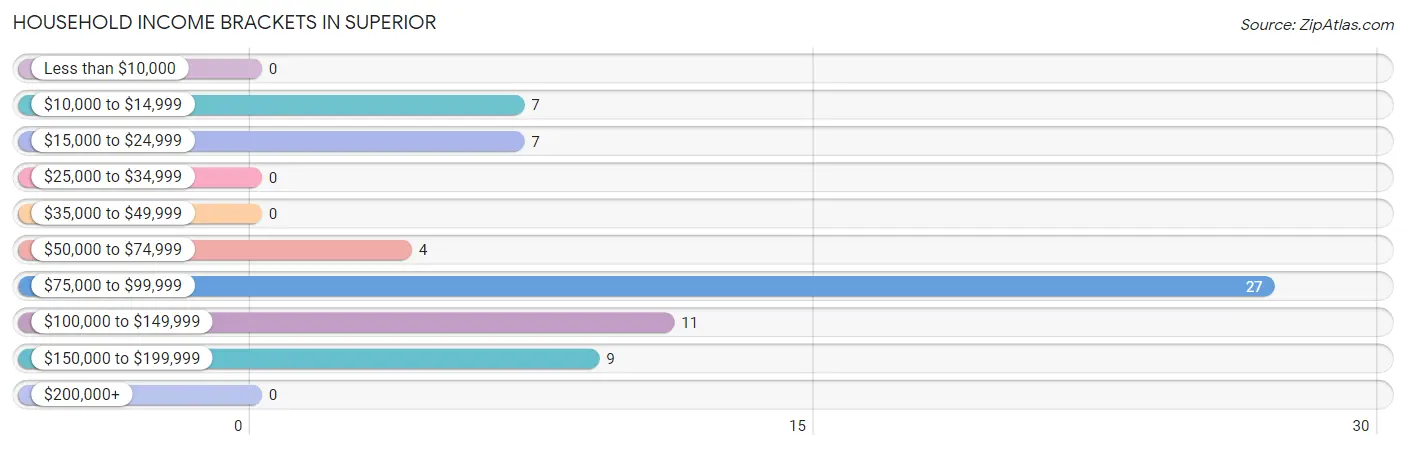
| Income Bracket | # Households | % Households |
| Less than $10,000 | 0 | 0.0% |
| $10,000 to $14,999 | 7 | 10.8% |
| $15,000 to $24,999 | 7 | 10.8% |
| $25,000 to $34,999 | 0 | 0.0% |
| $35,000 to $49,999 | 0 | 0.0% |
| $50,000 to $74,999 | 4 | 6.2% |
| $75,000 to $99,999 | 27 | 41.5% |
| $100,000 to $149,999 | 11 | 16.9% |
| $150,000 to $199,999 | 9 | 13.8% |
| $200,000+ | 0 | 0.0% |
Household Income by Householder Age in Superior
The median household income in Superior is $90,982, with the highest median household income of $91,161 found in the 25 to 44 years age bracket for the primary householder. A total of 31 households (47.7%) fall into this category.
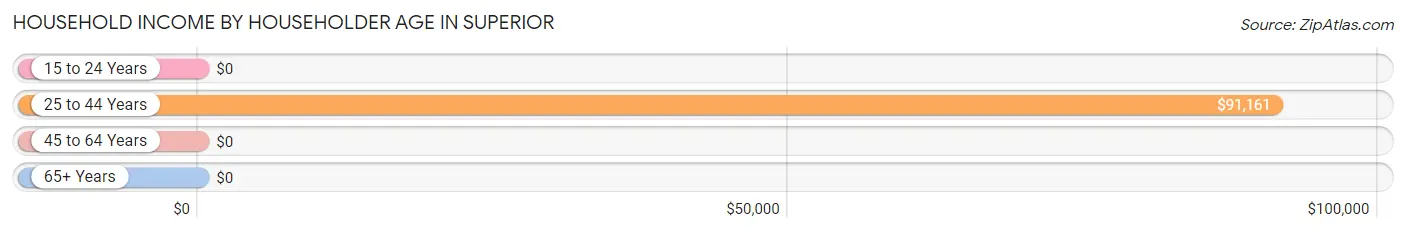
| Income Bracket | # Households | Median Income |
| 15 to 24 Years | 0 (0.0%) | $0 |
| 25 to 44 Years | 31 (47.7%) | $91,161 |
| 45 to 64 Years | 26 (40.0%) | $0 |
| 65+ Years | 8 (12.3%) | $0 |
| Total | 65 (100.0%) | $90,982 |
Poverty in Superior
Income Below Poverty by Sex and Age in Superior
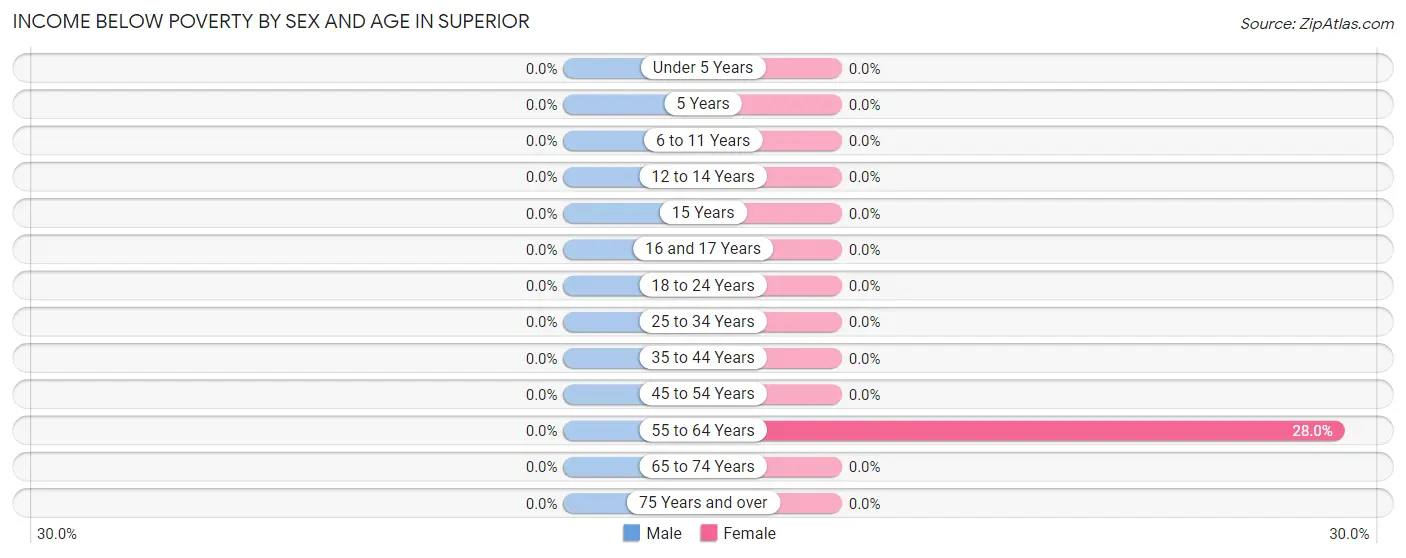
| Age Bracket | Male | Female |
| Under 5 Years | 0 (0.0%) | 0 (0.0%) |
| 5 Years | 0 (0.0%) | 0 (0.0%) |
| 6 to 11 Years | 0 (0.0%) | 0 (0.0%) |
| 12 to 14 Years | 0 (0.0%) | 0 (0.0%) |
| 15 Years | 0 (0.0%) | 0 (0.0%) |
| 16 and 17 Years | 0 (0.0%) | 0 (0.0%) |
| 18 to 24 Years | 0 (0.0%) | 0 (0.0%) |
| 25 to 34 Years | 0 (0.0%) | 0 (0.0%) |
| 35 to 44 Years | 0 (0.0%) | 0 (0.0%) |
| 45 to 54 Years | 0 (0.0%) | 0 (0.0%) |
| 55 to 64 Years | 0 (0.0%) | 7 (28.0%) |
| 65 to 74 Years | 0 (0.0%) | 0 (0.0%) |
| 75 Years and over | 0 (0.0%) | 0 (0.0%) |
| Total | 0 (0.0%) | 7 (5.8%) |
Income Above Poverty by Sex and Age in Superior
According to the poverty statistics in Superior, males aged under 5 years and females aged 6 to 11 years are the age groups that are most secure financially, with 100.0% of males and 100.0% of females in these age groups living above the poverty line.
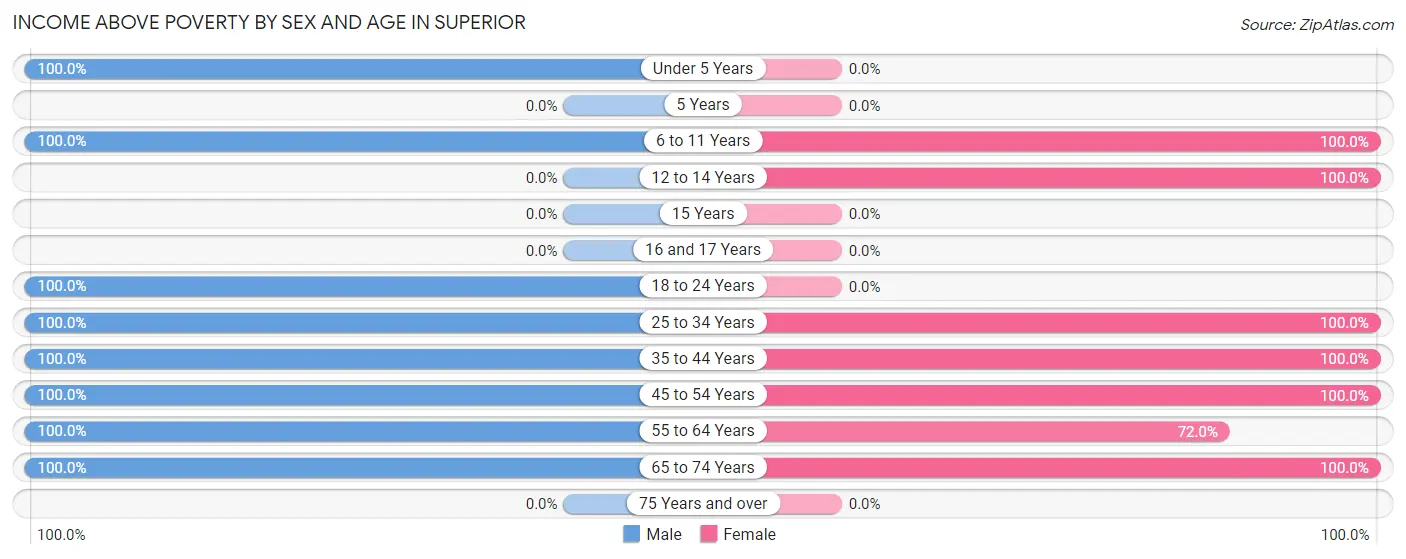
| Age Bracket | Male | Female |
| Under 5 Years | 9 (100.0%) | 0 (0.0%) |
| 5 Years | 0 (0.0%) | 0 (0.0%) |
| 6 to 11 Years | 22 (100.0%) | 16 (100.0%) |
| 12 to 14 Years | 0 (0.0%) | 9 (100.0%) |
| 15 Years | 0 (0.0%) | 0 (0.0%) |
| 16 and 17 Years | 0 (0.0%) | 0 (0.0%) |
| 18 to 24 Years | 20 (100.0%) | 0 (0.0%) |
| 25 to 34 Years | 10 (100.0%) | 5 (100.0%) |
| 35 to 44 Years | 26 (100.0%) | 38 (100.0%) |
| 45 to 54 Years | 3 (100.0%) | 11 (100.0%) |
| 55 to 64 Years | 5 (100.0%) | 18 (72.0%) |
| 65 to 74 Years | 5 (100.0%) | 16 (100.0%) |
| 75 Years and over | 0 (0.0%) | 0 (0.0%) |
| Total | 100 (100.0%) | 113 (94.2%) |
Income Below Poverty Among Married-Couple Families in Superior
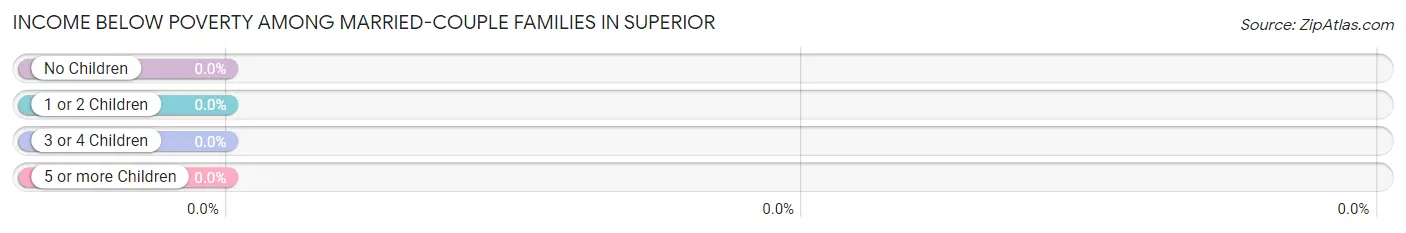
| Children | Above Poverty | Below Poverty |
| No Children | 11 (100.0%) | 0 (0.0%) |
| 1 or 2 Children | 14 (100.0%) | 0 (0.0%) |
| 3 or 4 Children | 9 (100.0%) | 0 (0.0%) |
| 5 or more Children | 0 (0.0%) | 0 (0.0%) |
| Total | 34 (100.0%) | 0 (0.0%) |
Income Below Poverty Among Single-Parent Households in Superior
| Children | Single Father | Single Mother |
| No Children | 0 (0.0%) | 0 (0.0%) |
| 1 or 2 Children | 0 (0.0%) | 0 (0.0%) |
| 3 or 4 Children | 0 (0.0%) | 0 (0.0%) |
| 5 or more Children | 0 (0.0%) | 0 (0.0%) |
| Total | 0 (0.0%) | 0 (0.0%) |
Income Below Poverty Among Married-Couple vs Single-Parent Households in Superior
| Children | Married-Couple Families | Single-Parent Households |
| No Children | 0 (0.0%) | 0 (0.0%) |
| 1 or 2 Children | 0 (0.0%) | 0 (0.0%) |
| 3 or 4 Children | 0 (0.0%) | 0 (0.0%) |
| 5 or more Children | 0 (0.0%) | 0 (0.0%) |
| Total | 0 (0.0%) | 0 (0.0%) |
Race in Superior
The most populous races in Superior are White / Caucasian (195 | 88.6%), Two or more Races (25 | 11.4%), and Hispanic or Latino (21 | 9.6%).
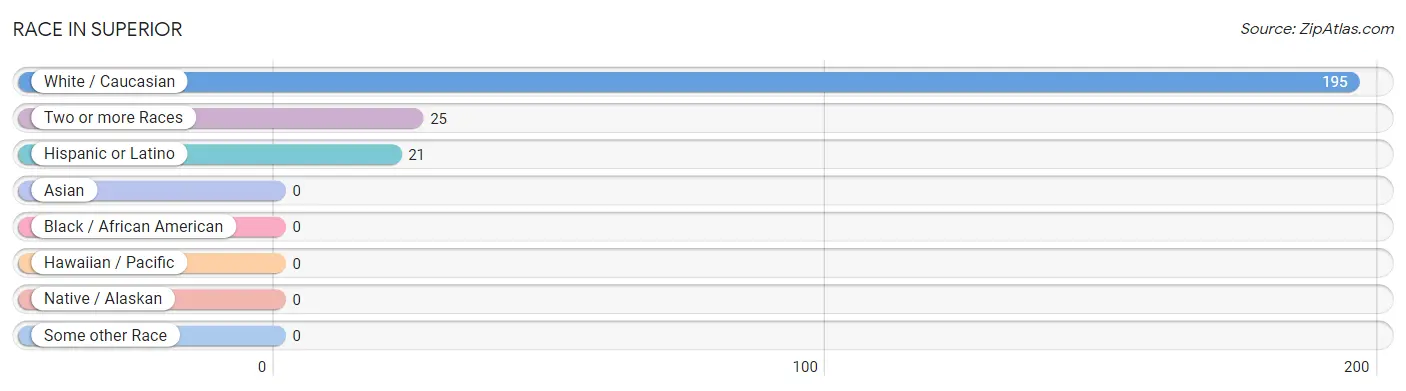
| Race | # Population | % Population |
| Asian | 0 | 0.0% |
| Black / African American | 0 | 0.0% |
| Hawaiian / Pacific | 0 | 0.0% |
| Hispanic or Latino | 21 | 9.6% |
| Native / Alaskan | 0 | 0.0% |
| White / Caucasian | 195 | 88.6% |
| Two or more Races | 25 | 11.4% |
| Some other Race | 0 | 0.0% |
| Total | 220 | 100.0% |
Ancestry in Superior
The most populous ancestries reported in Superior are European (83 | 37.7%), German (54 | 24.5%), English (36 | 16.4%), Scandinavian (29 | 13.2%), and Swedish (25 | 11.4%), together accounting for 103.2% of all Superior residents.
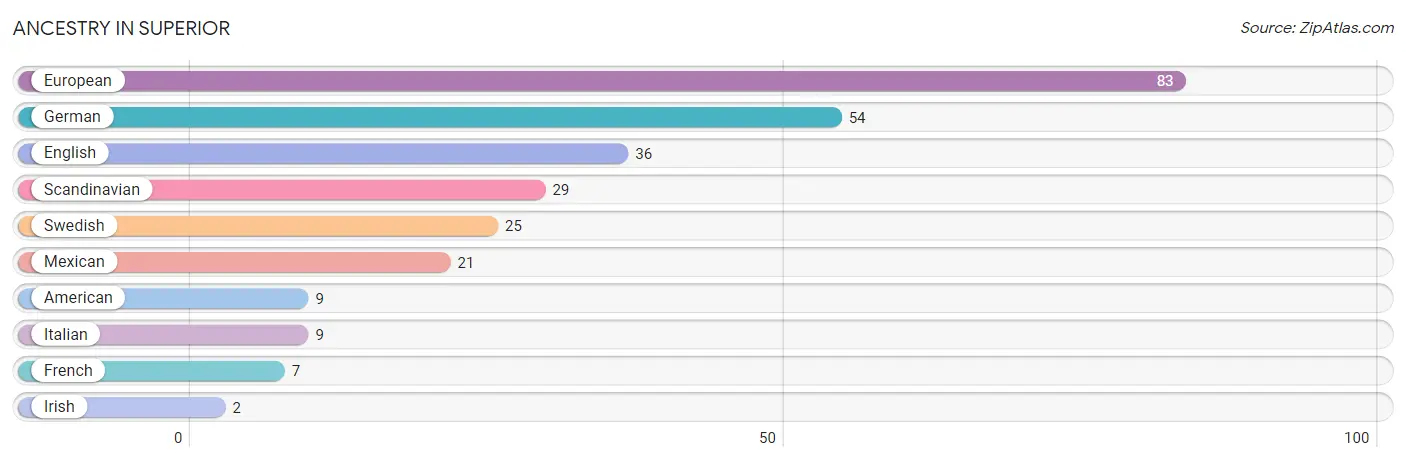
| Ancestry | # Population | % Population |
| American | 9 | 4.1% |
| English | 36 | 16.4% |
| European | 83 | 37.7% |
| French | 7 | 3.2% |
| German | 54 | 24.5% |
| Irish | 2 | 0.9% |
| Italian | 9 | 4.1% |
| Mexican | 21 | 9.6% |
| Scandinavian | 29 | 13.2% |
| Swedish | 25 | 11.4% | View All 10 Rows |
Immigrants in Superior
The most numerous immigrant groups reported in Superior came from , and Canada (2 | 0.9%), together accounting for 0.9% of all Superior residents.

| Immigration Origin | # Population | % Population |
| Canada | 2 | 0.9% | View All 1 Rows |
Sex and Age in Superior
Sex and Age in Superior
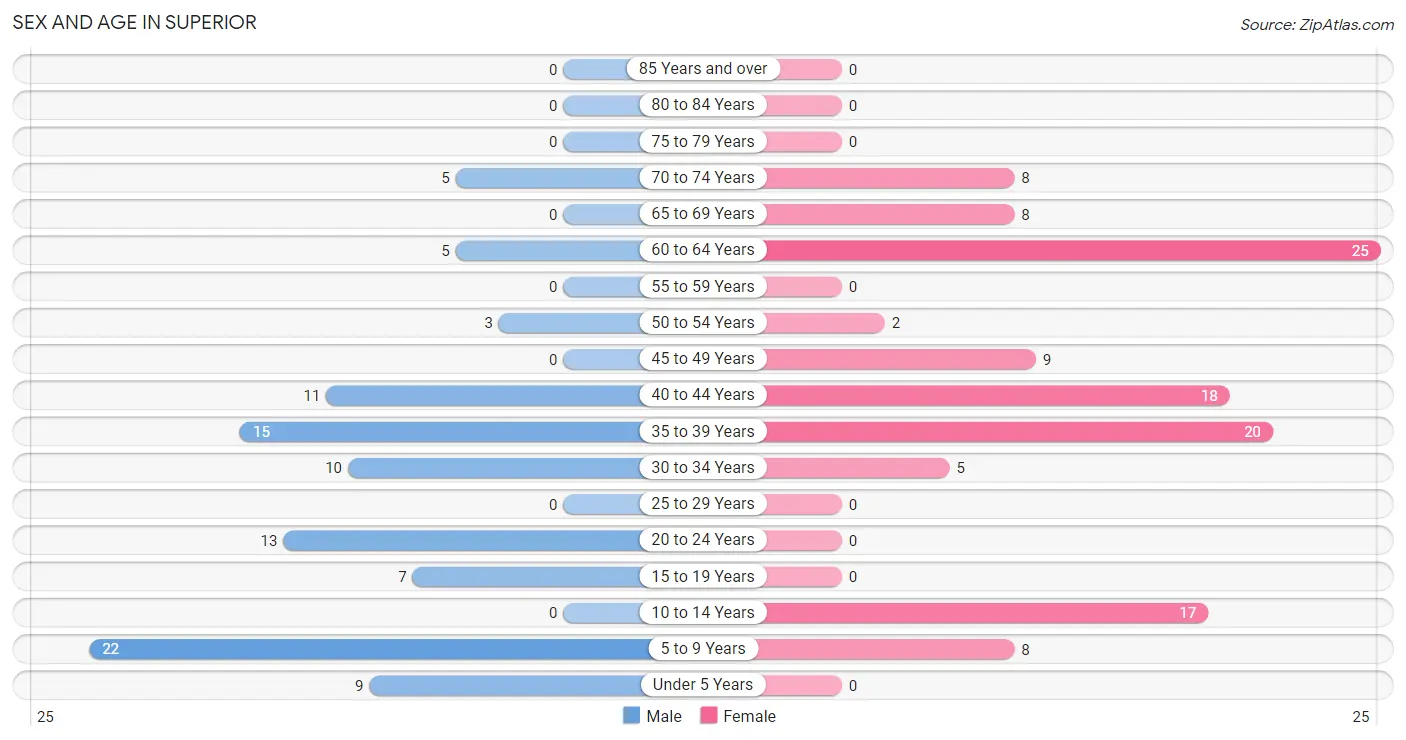
The most populous age groups in Superior are 5 to 9 Years (22 | 22.0%) for men and 60 to 64 Years (25 | 20.8%) for women.
| Age Bracket | Male | Female |
| Under 5 Years | 9 (9.0%) | 0 (0.0%) |
| 5 to 9 Years | 22 (22.0%) | 8 (6.7%) |
| 10 to 14 Years | 0 (0.0%) | 17 (14.2%) |
| 15 to 19 Years | 7 (7.0%) | 0 (0.0%) |
| 20 to 24 Years | 13 (13.0%) | 0 (0.0%) |
| 25 to 29 Years | 0 (0.0%) | 0 (0.0%) |
| 30 to 34 Years | 10 (10.0%) | 5 (4.2%) |
| 35 to 39 Years | 15 (15.0%) | 20 (16.7%) |
| 40 to 44 Years | 11 (11.0%) | 18 (15.0%) |
| 45 to 49 Years | 0 (0.0%) | 9 (7.5%) |
| 50 to 54 Years | 3 (3.0%) | 2 (1.7%) |
| 55 to 59 Years | 0 (0.0%) | 0 (0.0%) |
| 60 to 64 Years | 5 (5.0%) | 25 (20.8%) |
| 65 to 69 Years | 0 (0.0%) | 8 (6.7%) |
| 70 to 74 Years | 5 (5.0%) | 8 (6.7%) |
| 75 to 79 Years | 0 (0.0%) | 0 (0.0%) |
| 80 to 84 Years | 0 (0.0%) | 0 (0.0%) |
| 85 Years and over | 0 (0.0%) | 0 (0.0%) |
| Total | 100 (100.0%) | 120 (100.0%) |
Families and Households in Superior
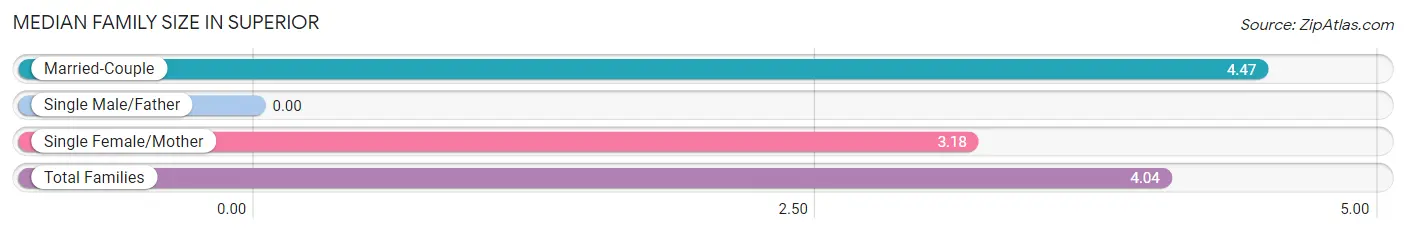
Median Family Size in Superior
| Family Type | # Families | Family Size |
| Married-Couple | 34 (66.7%) | 4.47 |
| Single Male/Father | 0 (0.0%) | - |
| Single Female/Mother | 17 (33.3%) | 3.18 |
| Total Families | 51 (100.0%) | 4.04 |
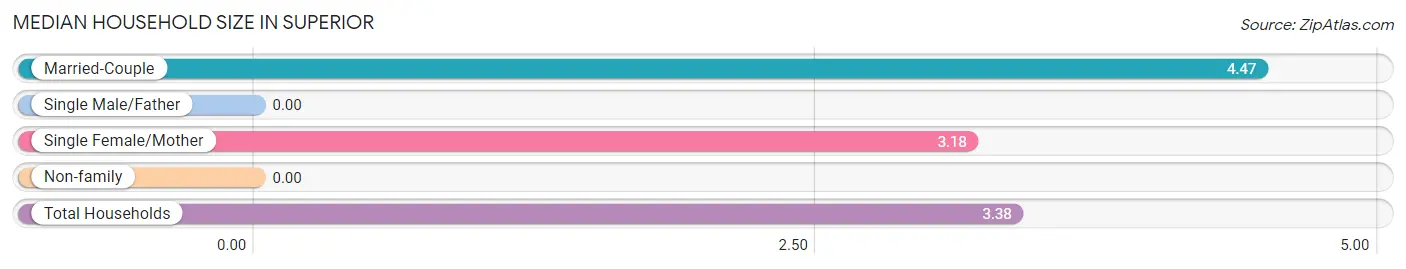
Median Household Size in Superior
| Household Type | # Households | Household Size |
| Married-Couple | 34 (52.3%) | 4.47 |
| Single Male/Father | 0 (0.0%) | - |
| Single Female/Mother | 17 (26.2%) | 3.18 |
| Non-family | 14 (21.5%) | - |
| Total Households | 65 (100.0%) | 3.38 |
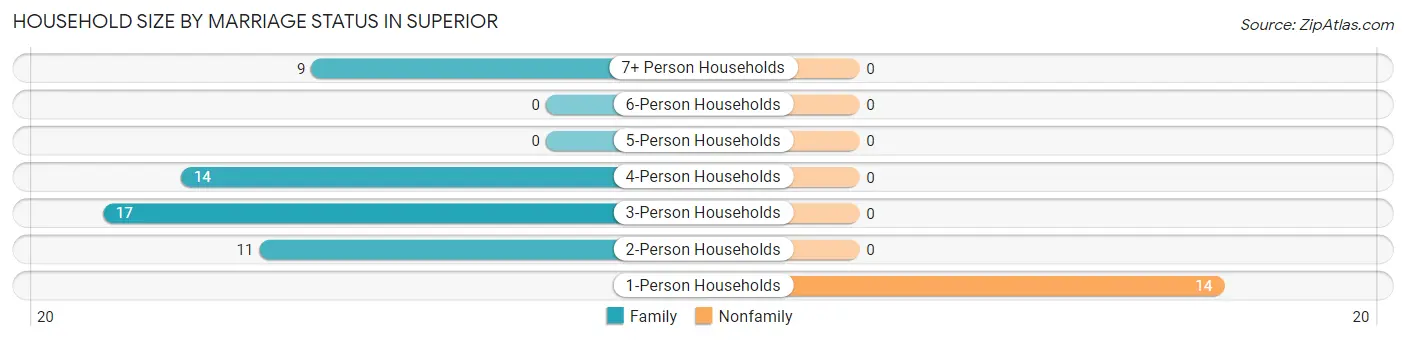
Household Size by Marriage Status in Superior
Out of a total of 65 households in Superior, 51 (78.5%) are family households, while 14 (21.5%) are nonfamily households. The most numerous type of family households are 3-person households, comprising 17, and the most common type of nonfamily households are 1-person households, comprising 14.
| Household Size | Family Households | Nonfamily Households |
| 1-Person Households | - | 14 (21.5%) |
| 2-Person Households | 11 (16.9%) | 0 (0.0%) |
| 3-Person Households | 17 (26.2%) | 0 (0.0%) |
| 4-Person Households | 14 (21.5%) | 0 (0.0%) |
| 5-Person Households | 0 (0.0%) | 0 (0.0%) |
| 6-Person Households | 0 (0.0%) | 0 (0.0%) |
| 7+ Person Households | 9 (13.9%) | 0 (0.0%) |
| Total | 51 (78.5%) | 14 (21.5%) |
Female Fertility in Superior
Fertility by Age in Superior
| Age Bracket | Women with Births | Births / 1,000 Women |
| 15 to 19 years | 0 (0.0%) | 0.0 |
| 20 to 34 years | 0 (0.0%) | 0.0 |
| 35 to 50 years | 0 (0.0%) | 0.0 |
| Total | 0 (0.0%) | 0.0 |
Fertility by Age by Marriage Status in Superior
| Age Bracket | Married | Unmarried |
| 15 to 19 years | 0 (0.0%) | 0 (0.0%) |
| 20 to 34 years | 0 (0.0%) | 0 (0.0%) |
| 35 to 50 years | 0 (0.0%) | 0 (0.0%) |
| Total | 0 (0.0%) | 0 (0.0%) |
Fertility by Education in Superior
| Educational Attainment | Women with Births | Births / 1,000 Women |
| Less than High School | 0 (0.0%) | 0.0 |
| High School Diploma | 0 (0.0%) | 0.0 |
| College or Associate's Degree | 0 (0.0%) | 0.0 |
| Bachelor's Degree | 0 (0.0%) | 0.0 |
| Graduate Degree | 0 (0.0%) | 0.0 |
| Total | 0 (0.0%) | 0.0 |
Fertility by Education by Marriage Status in Superior
| Educational Attainment | Married | Unmarried |
| Less than High School | 0 (0.0%) | 0 (0.0%) |
| High School Diploma | 0 (0.0%) | 0 (0.0%) |
| College or Associate's Degree | 0 (0.0%) | 0 (0.0%) |
| Bachelor's Degree | 0 (0.0%) | 0 (0.0%) |
| Graduate Degree | 0 (0.0%) | 0 (0.0%) |
| Total | 0 (0.0%) | 0 (0.0%) |
Employment Characteristics in Superior
Employment by Class of Employer in Superior
Among the 104 employed individuals in Superior, private company employees (68 | 65.4%), state government employees (13 | 12.5%), and not-for-profit organizations (12 | 11.5%) make up the most common classes of employment.
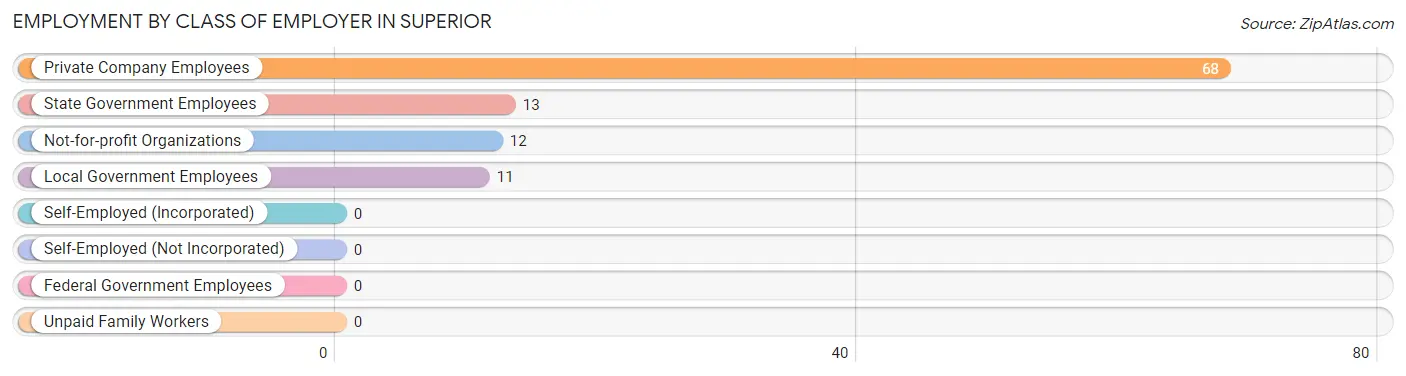
| Employer Class | # Employees | % Employees |
| Private Company Employees | 68 | 65.4% |
| Self-Employed (Incorporated) | 0 | 0.0% |
| Self-Employed (Not Incorporated) | 0 | 0.0% |
| Not-for-profit Organizations | 12 | 11.5% |
| Local Government Employees | 11 | 10.6% |
| State Government Employees | 13 | 12.5% |
| Federal Government Employees | 0 | 0.0% |
| Unpaid Family Workers | 0 | 0.0% |
| Total | 104 | 100.0% |
Employment Status by Age in Superior
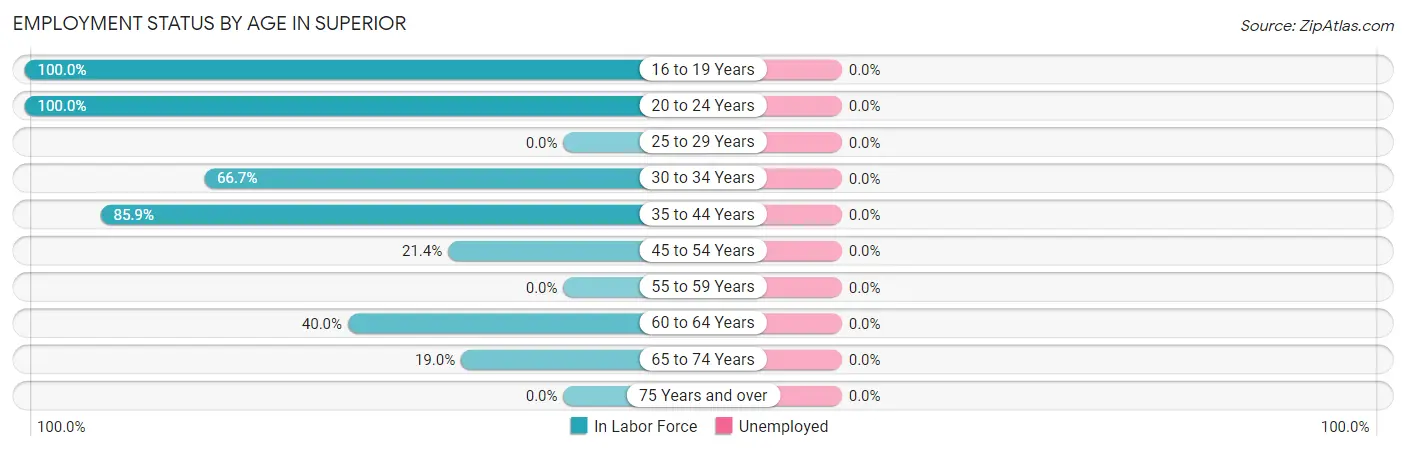
| Age Bracket | In Labor Force | Unemployed |
| 16 to 19 Years | 7 (100.0%) | 0 (0.0%) |
| 20 to 24 Years | 13 (100.0%) | 0 (0.0%) |
| 25 to 29 Years | 0 (0.0%) | 0 (0.0%) |
| 30 to 34 Years | 10 (66.7%) | 0 (0.0%) |
| 35 to 44 Years | 55 (85.9%) | 0 (0.0%) |
| 45 to 54 Years | 3 (21.4%) | 0 (0.0%) |
| 55 to 59 Years | 0 (0.0%) | 0 (0.0%) |
| 60 to 64 Years | 12 (40.0%) | 0 (0.0%) |
| 65 to 74 Years | 4 (19.0%) | 0 (0.0%) |
| 75 Years and over | 0 (0.0%) | 0 (0.0%) |
| Total | 104 (63.4%) | 0 (0.0%) |
Employment Status by Educational Attainment in Superior
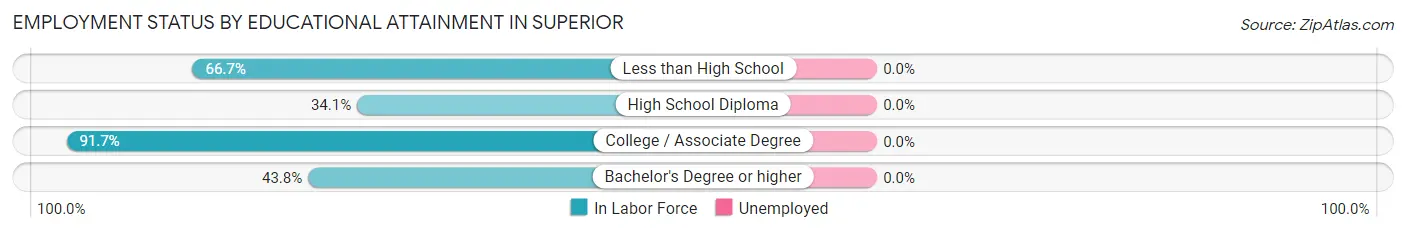
| Educational Attainment | In Labor Force | Unemployed |
| Less than High School | 4 (66.7%) | 0 (0.0%) |
| High School Diploma | 14 (34.1%) | 0 (0.0%) |
| College / Associate Degree | 55 (91.7%) | 0 (0.0%) |
| Bachelor's Degree or higher | 7 (43.8%) | 0 (0.0%) |
| Total | 80 (65.0%) | 0 (0.0%) |
Employment Occupations by Sex in Superior
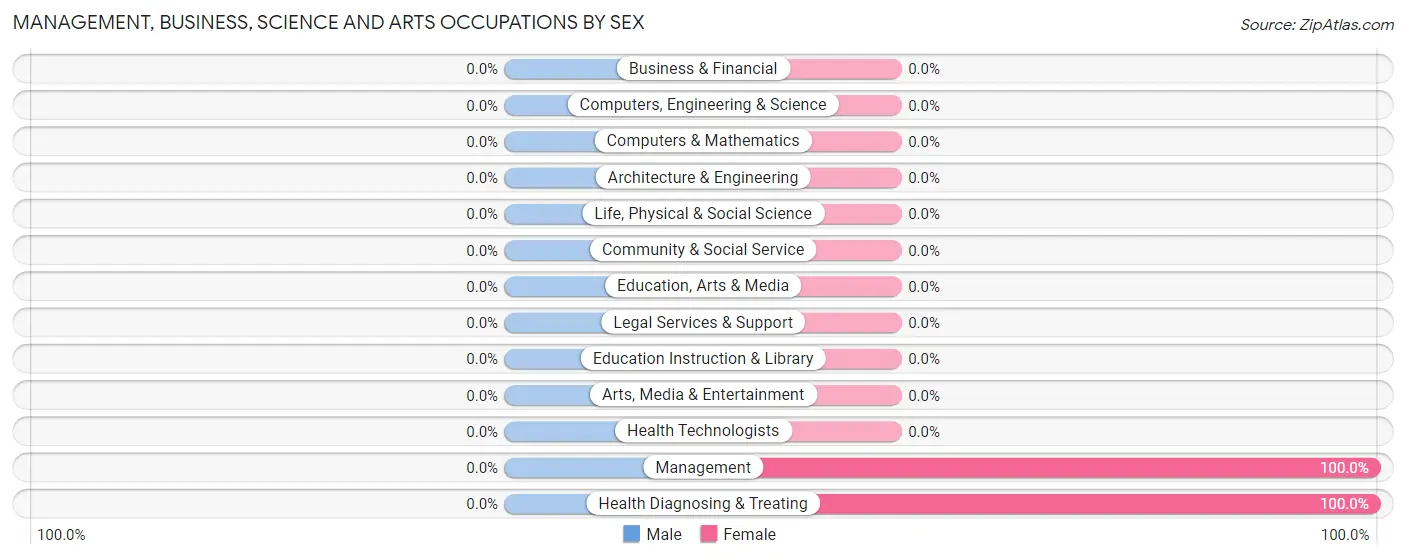
Management, Business, Science and Arts Occupations
The most common Management, Business, Science and Arts occupations in Superior are Health Diagnosing & Treating (12 | 11.5%), and Management (4 | 3.8%).
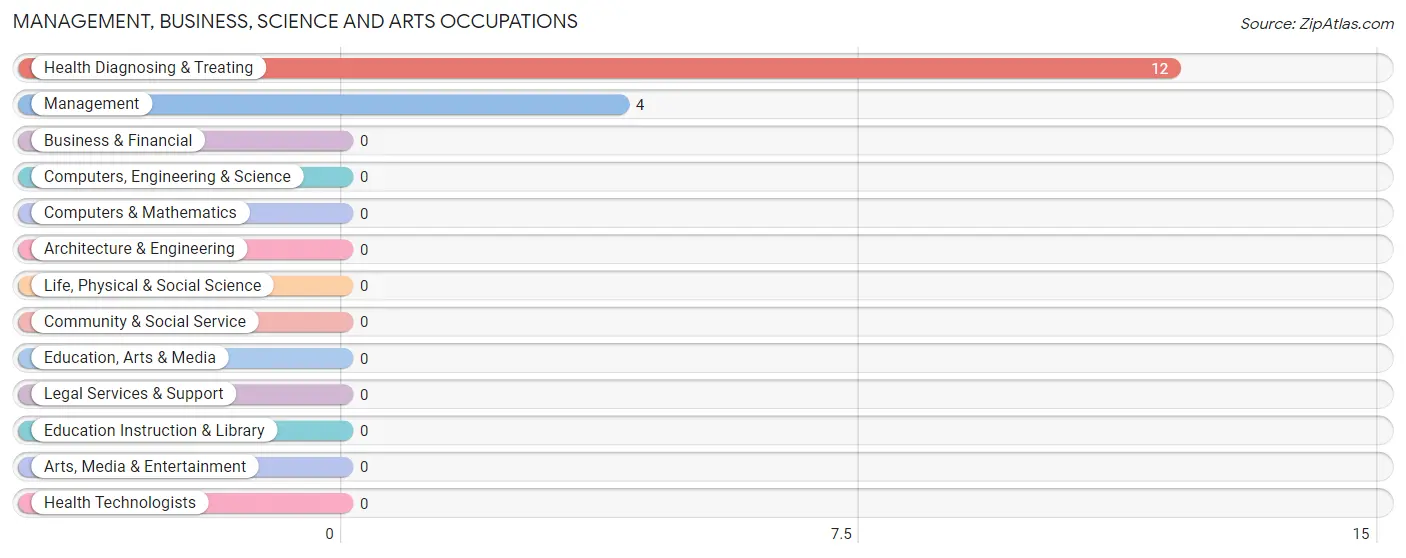
Management, Business, Science and Arts Occupations by Sex
| Occupation | Male | Female |
| Management | 0 (0.0%) | 4 (100.0%) |
| Business & Financial | 0 (0.0%) | 0 (0.0%) |
| Computers, Engineering & Science | 0 (0.0%) | 0 (0.0%) |
| Computers & Mathematics | 0 (0.0%) | 0 (0.0%) |
| Architecture & Engineering | 0 (0.0%) | 0 (0.0%) |
| Life, Physical & Social Science | 0 (0.0%) | 0 (0.0%) |
| Community & Social Service | 0 (0.0%) | 0 (0.0%) |
| Education, Arts & Media | 0 (0.0%) | 0 (0.0%) |
| Legal Services & Support | 0 (0.0%) | 0 (0.0%) |
| Education Instruction & Library | 0 (0.0%) | 0 (0.0%) |
| Arts, Media & Entertainment | 0 (0.0%) | 0 (0.0%) |
| Health Diagnosing & Treating | 0 (0.0%) | 12 (100.0%) |
| Health Technologists | 0 (0.0%) | 0 (0.0%) |
| Total (Category) | 0 (0.0%) | 16 (100.0%) |
| Total (Overall) | 64 (61.5%) | 40 (38.5%) |
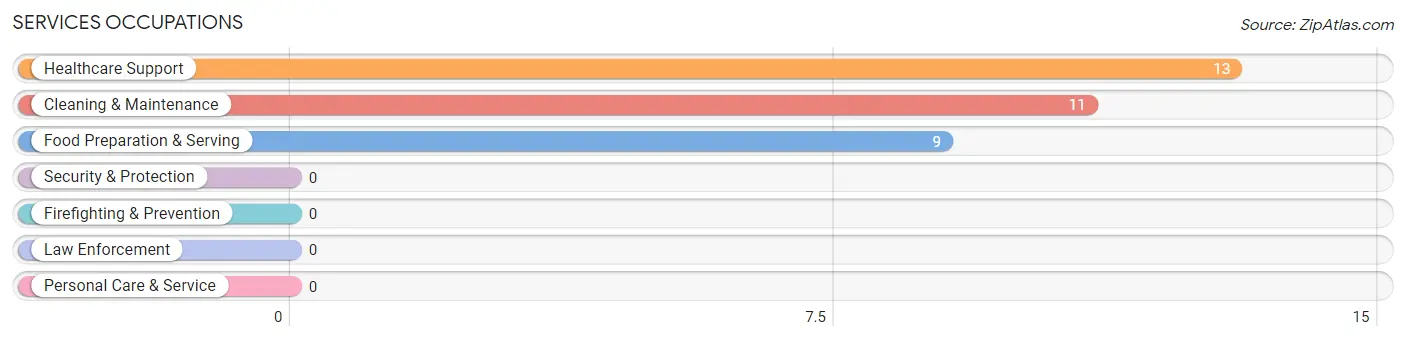
Services Occupations
The most common Services occupations in Superior are Healthcare Support (13 | 12.5%), Cleaning & Maintenance (11 | 10.6%), and Food Preparation & Serving (9 | 8.6%).
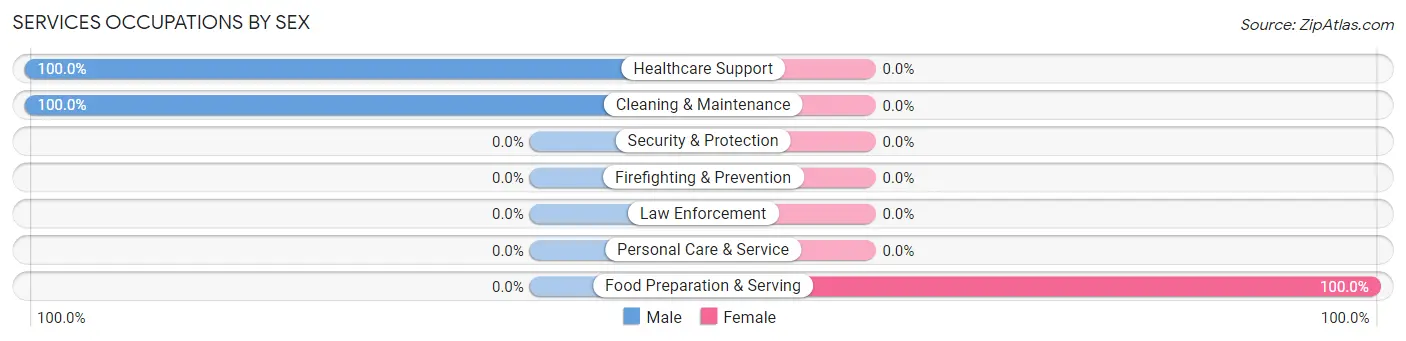
Services Occupations by Sex
| Occupation | Male | Female |
| Healthcare Support | 13 (100.0%) | 0 (0.0%) |
| Security & Protection | 0 (0.0%) | 0 (0.0%) |
| Firefighting & Prevention | 0 (0.0%) | 0 (0.0%) |
| Law Enforcement | 0 (0.0%) | 0 (0.0%) |
| Food Preparation & Serving | 0 (0.0%) | 9 (100.0%) |
| Cleaning & Maintenance | 11 (100.0%) | 0 (0.0%) |
| Personal Care & Service | 0 (0.0%) | 0 (0.0%) |
| Total (Category) | 24 (72.7%) | 9 (27.3%) |
| Total (Overall) | 64 (61.5%) | 40 (38.5%) |
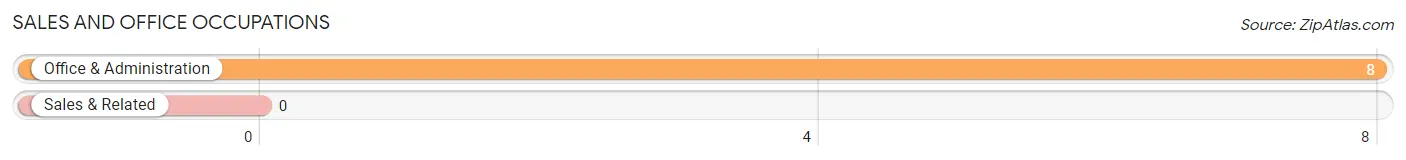
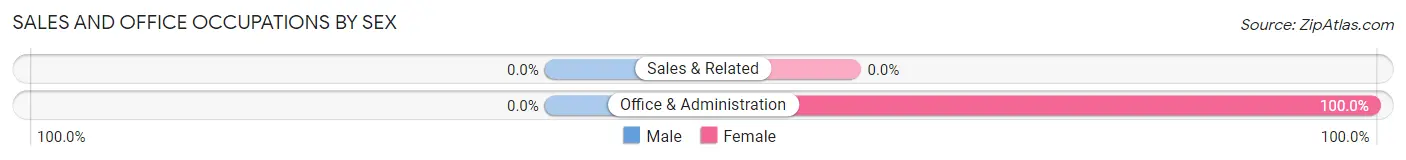
Sales and Office Occupations
The most common Sales and Office occupations in Superior are , and Office & Administration (8 | 7.7%).
Sales and Office Occupations by Sex
| Occupation | Male | Female |
| Sales & Related | 0 (0.0%) | 0 (0.0%) |
| Office & Administration | 0 (0.0%) | 8 (100.0%) |
| Total (Category) | 0 (0.0%) | 8 (100.0%) |
| Total (Overall) | 64 (61.5%) | 40 (38.5%) |
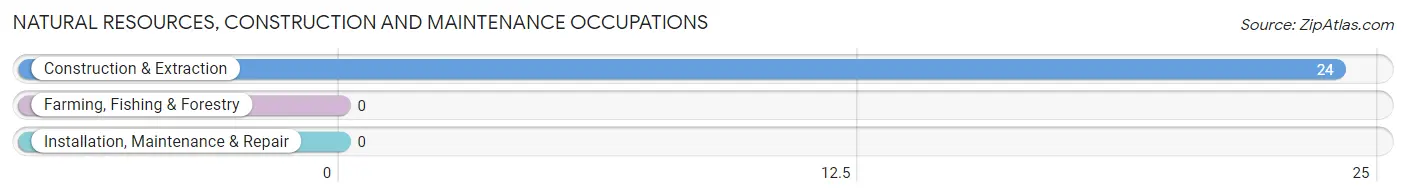
Natural Resources, Construction and Maintenance Occupations
The most common Natural Resources, Construction and Maintenance occupations in Superior are , and Construction & Extraction (24 | 23.1%).
Natural Resources, Construction and Maintenance Occupations by Sex
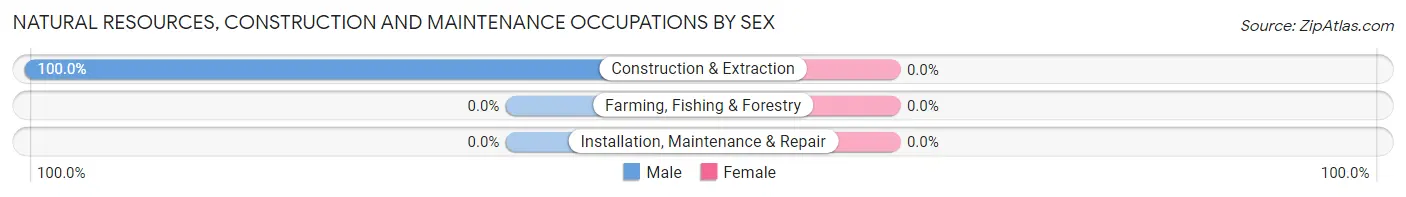
| Occupation | Male | Female |
| Farming, Fishing & Forestry | 0 (0.0%) | 0 (0.0%) |
| Construction & Extraction | 24 (100.0%) | 0 (0.0%) |
| Installation, Maintenance & Repair | 0 (0.0%) | 0 (0.0%) |
| Total (Category) | 24 (100.0%) | 0 (0.0%) |
| Total (Overall) | 64 (61.5%) | 40 (38.5%) |
Production, Transportation and Moving Occupations
The most common Production, Transportation and Moving occupations in Superior are Transportation (19 | 18.3%), and Material Moving (4 | 3.8%).
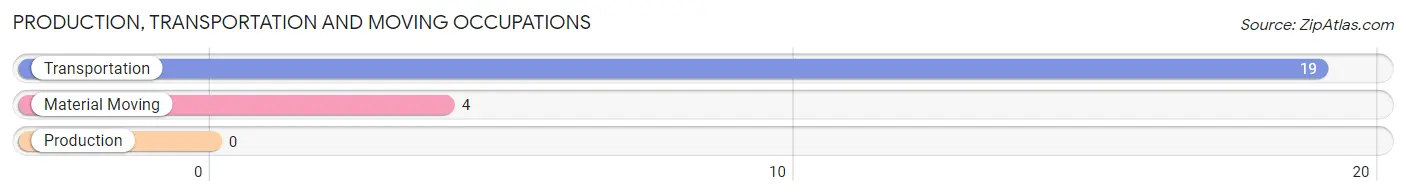
Production, Transportation and Moving Occupations by Sex
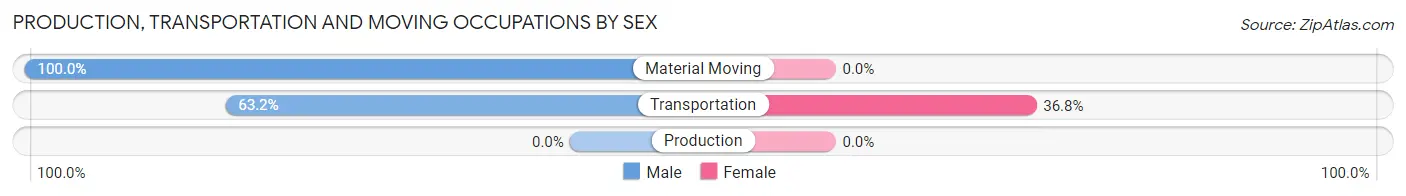
| Occupation | Male | Female |
| Production | 0 (0.0%) | 0 (0.0%) |
| Transportation | 12 (63.2%) | 7 (36.8%) |
| Material Moving | 4 (100.0%) | 0 (0.0%) |
| Total (Category) | 16 (69.6%) | 7 (30.4%) |
| Total (Overall) | 64 (61.5%) | 40 (38.5%) |
Employment Industries by Sex in Superior
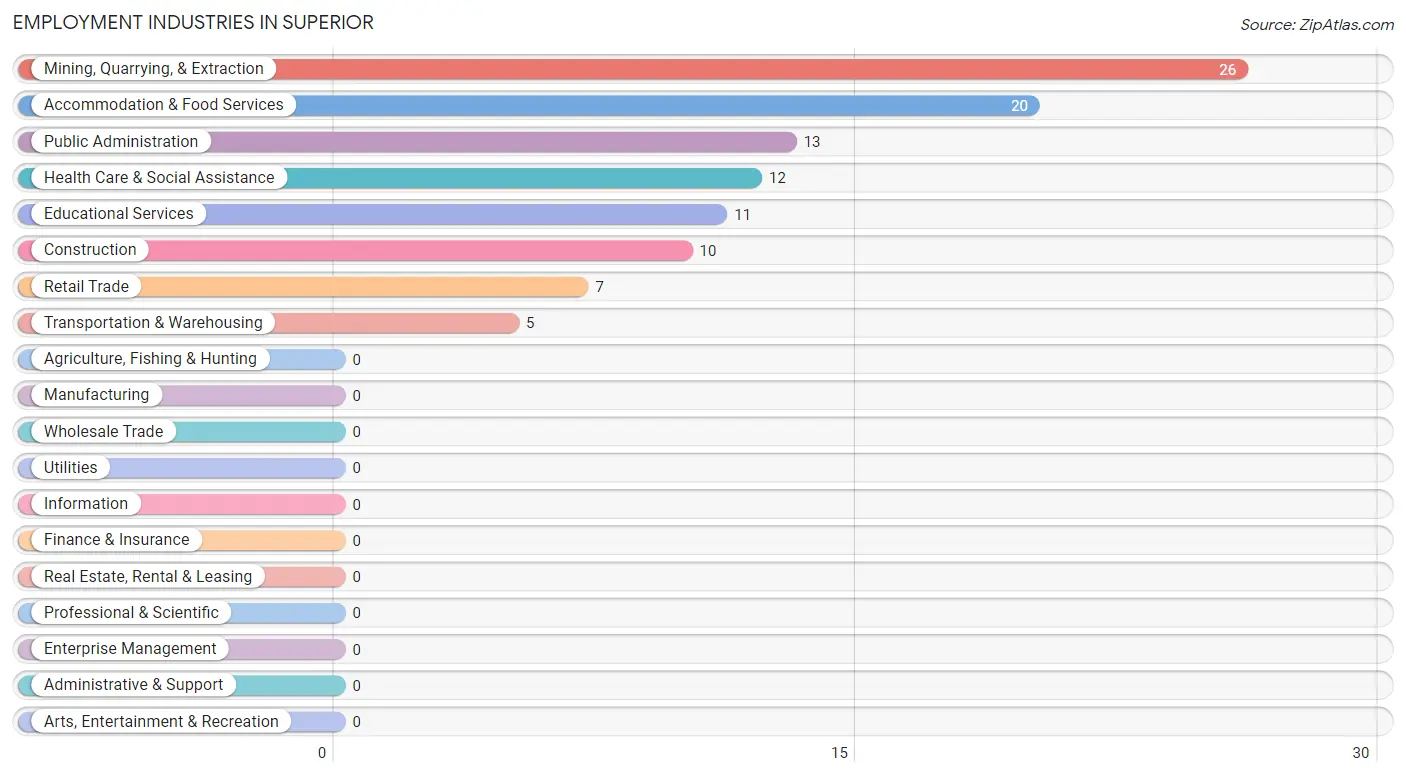
Employment Industries in Superior
The major employment industries in Superior include Mining, Quarrying, & Extraction (26 | 25.0%), Accommodation & Food Services (20 | 19.2%), Public Administration (13 | 12.5%), Health Care & Social Assistance (12 | 11.5%), and Educational Services (11 | 10.6%).
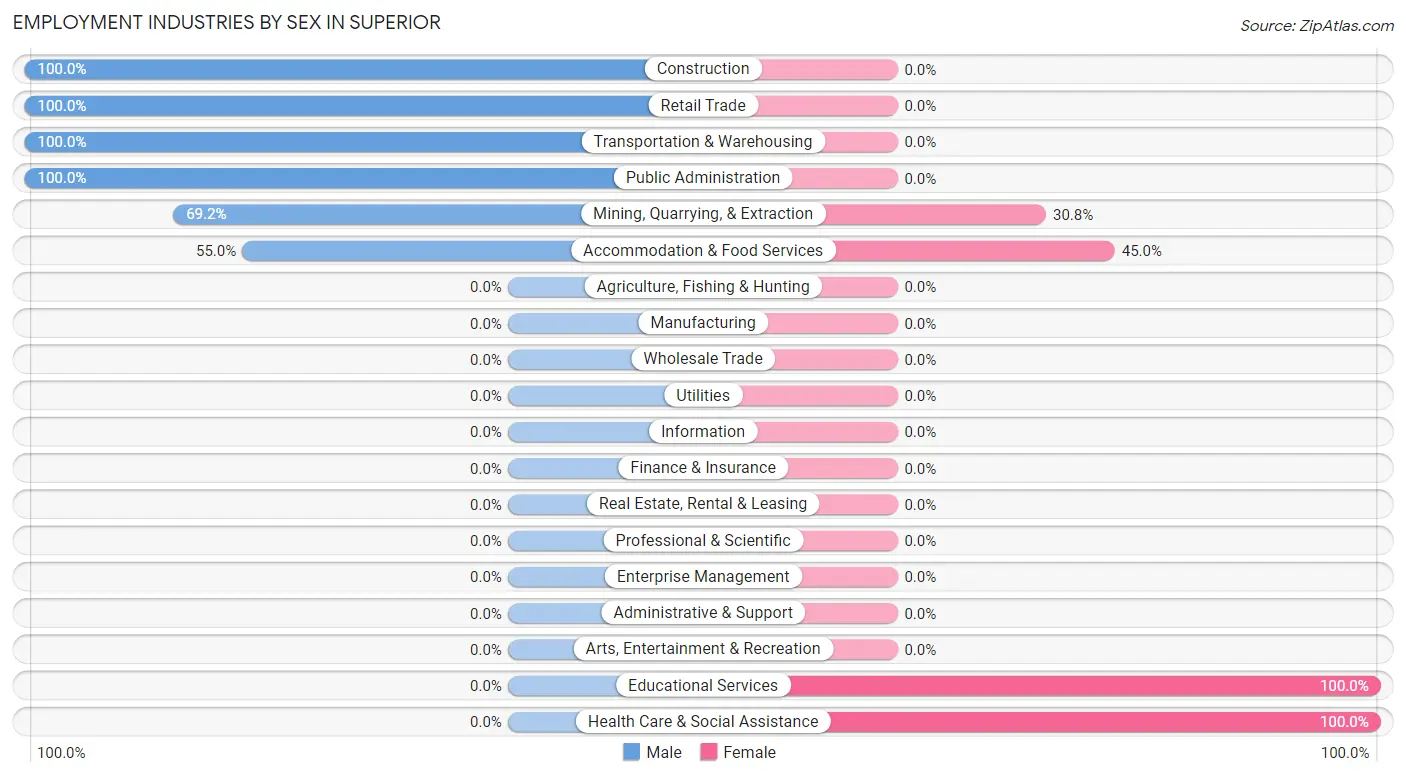
Employment Industries by Sex in Superior
The Superior industries that see more men than women are Construction (100.0%), Retail Trade (100.0%), and Transportation & Warehousing (100.0%), whereas the industries that tend to have a higher number of women are Educational Services (100.0%), Health Care & Social Assistance (100.0%), and Accommodation & Food Services (45.0%).
| Industry | Male | Female |
| Agriculture, Fishing & Hunting | 0 (0.0%) | 0 (0.0%) |
| Mining, Quarrying, & Extraction | 18 (69.2%) | 8 (30.8%) |
| Construction | 10 (100.0%) | 0 (0.0%) |
| Manufacturing | 0 (0.0%) | 0 (0.0%) |
| Wholesale Trade | 0 (0.0%) | 0 (0.0%) |
| Retail Trade | 7 (100.0%) | 0 (0.0%) |
| Transportation & Warehousing | 5 (100.0%) | 0 (0.0%) |
| Utilities | 0 (0.0%) | 0 (0.0%) |
| Information | 0 (0.0%) | 0 (0.0%) |
| Finance & Insurance | 0 (0.0%) | 0 (0.0%) |
| Real Estate, Rental & Leasing | 0 (0.0%) | 0 (0.0%) |
| Professional & Scientific | 0 (0.0%) | 0 (0.0%) |
| Enterprise Management | 0 (0.0%) | 0 (0.0%) |
| Administrative & Support | 0 (0.0%) | 0 (0.0%) |
| Educational Services | 0 (0.0%) | 11 (100.0%) |
| Health Care & Social Assistance | 0 (0.0%) | 12 (100.0%) |
| Arts, Entertainment & Recreation | 0 (0.0%) | 0 (0.0%) |
| Accommodation & Food Services | 11 (55.0%) | 9 (45.0%) |
| Public Administration | 13 (100.0%) | 0 (0.0%) |
| Total | 64 (61.5%) | 40 (38.5%) |
Education in Superior
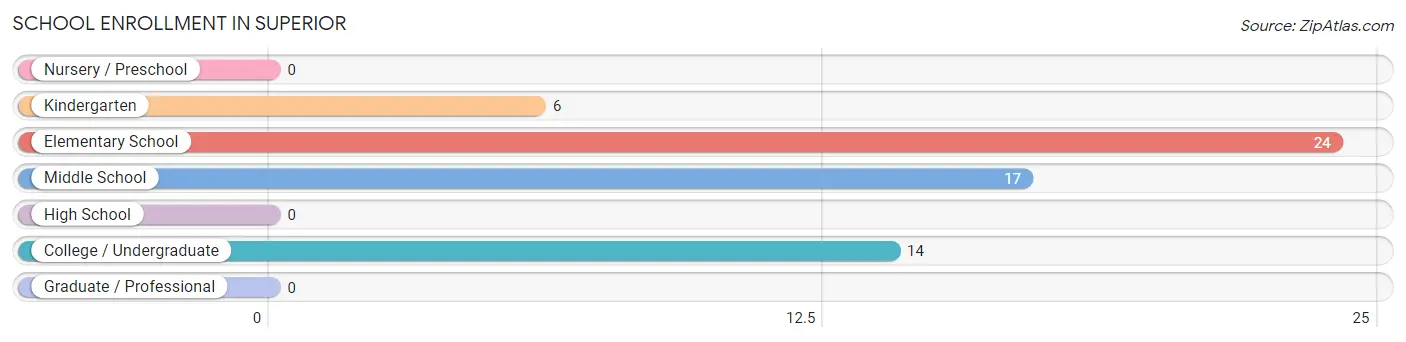
School Enrollment in Superior
The most common levels of schooling among the 61 students in Superior are elementary school (24 | 39.3%), middle school (17 | 27.9%), and college / undergraduate (14 | 23.0%).
| School Level | # Students | % Students |
| Nursery / Preschool | 0 | 0.0% |
| Kindergarten | 6 | 9.8% |
| Elementary School | 24 | 39.3% |
| Middle School | 17 | 27.9% |
| High School | 0 | 0.0% |
| College / Undergraduate | 14 | 23.0% |
| Graduate / Professional | 0 | 0.0% |
| Total | 61 | 100.0% |
School Enrollment by Age by Funding Source in Superior
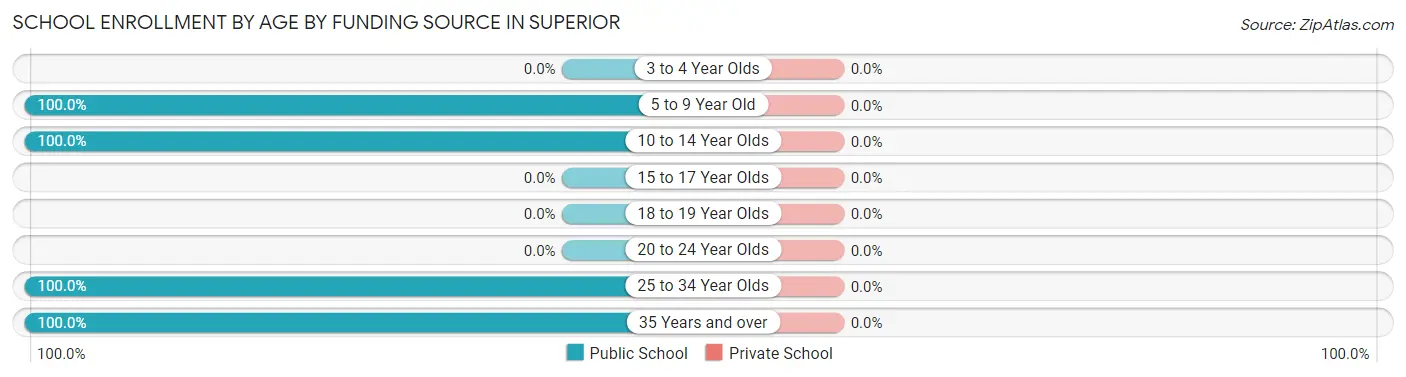
| Age Bracket | Public School | Private School |
| 3 to 4 Year Olds | 0 (0.0%) | 0 (0.0%) |
| 5 to 9 Year Old | 30 (100.0%) | 0 (0.0%) |
| 10 to 14 Year Olds | 17 (100.0%) | 0 (0.0%) |
| 15 to 17 Year Olds | 0 (0.0%) | 0 (0.0%) |
| 18 to 19 Year Olds | 0 (0.0%) | 0 (0.0%) |
| 20 to 24 Year Olds | 0 (0.0%) | 0 (0.0%) |
| 25 to 34 Year Olds | 5 (100.0%) | 0 (0.0%) |
| 35 Years and over | 9 (100.0%) | 0 (0.0%) |
| Total | 61 (100.0%) | 0 (0.0%) |
Educational Attainment by Field of Study in Superior
Liberal arts & history (9 | 56.2%), and education (7 | 43.8%) are the most common fields of study among 16 individuals in Superior who have obtained a bachelor's degree or higher.
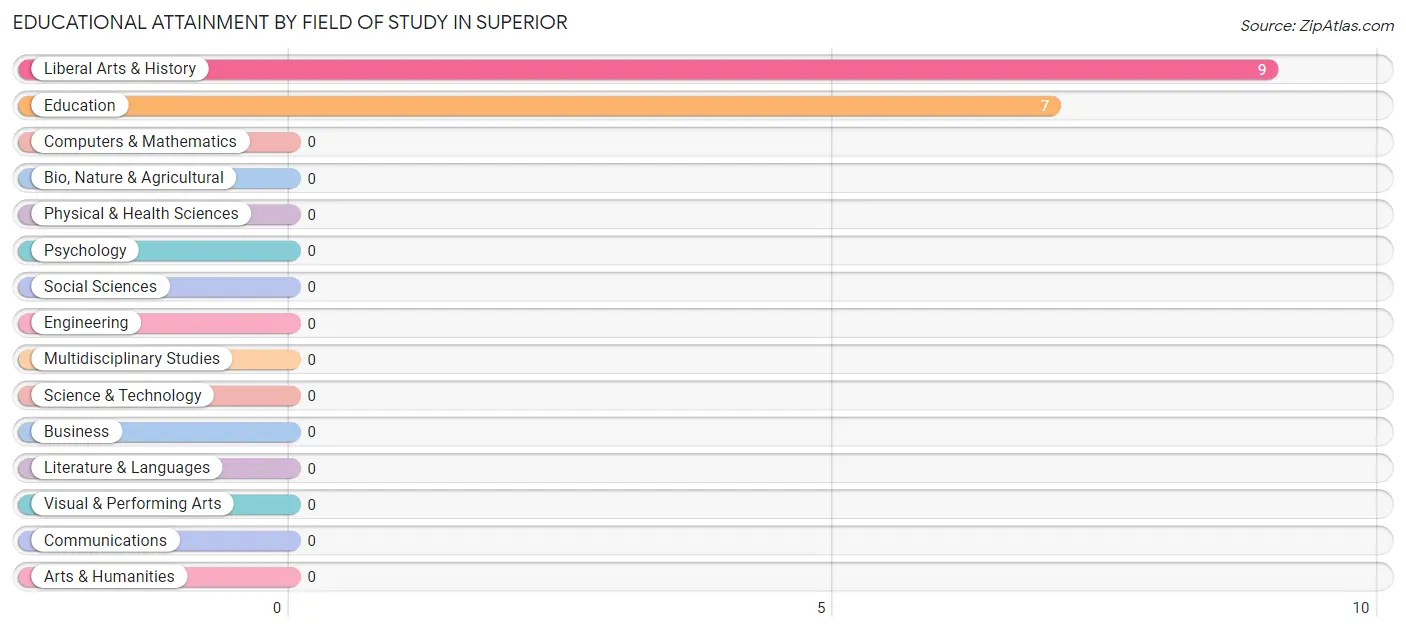
| Field of Study | # Graduates | % Graduates |
| Computers & Mathematics | 0 | 0.0% |
| Bio, Nature & Agricultural | 0 | 0.0% |
| Physical & Health Sciences | 0 | 0.0% |
| Psychology | 0 | 0.0% |
| Social Sciences | 0 | 0.0% |
| Engineering | 0 | 0.0% |
| Multidisciplinary Studies | 0 | 0.0% |
| Science & Technology | 0 | 0.0% |
| Business | 0 | 0.0% |
| Education | 7 | 43.8% |
| Literature & Languages | 0 | 0.0% |
| Liberal Arts & History | 9 | 56.2% |
| Visual & Performing Arts | 0 | 0.0% |
| Communications | 0 | 0.0% |
| Arts & Humanities | 0 | 0.0% |
| Total | 16 | 100.0% |
Transportation & Commute in Superior
Vehicle Availability by Sex in Superior
The most prevalent vehicle ownership categories in Superior are males with 3 vehicles (45, accounting for 70.3%) and females with 3 vehicles (29, making up 112.5%).
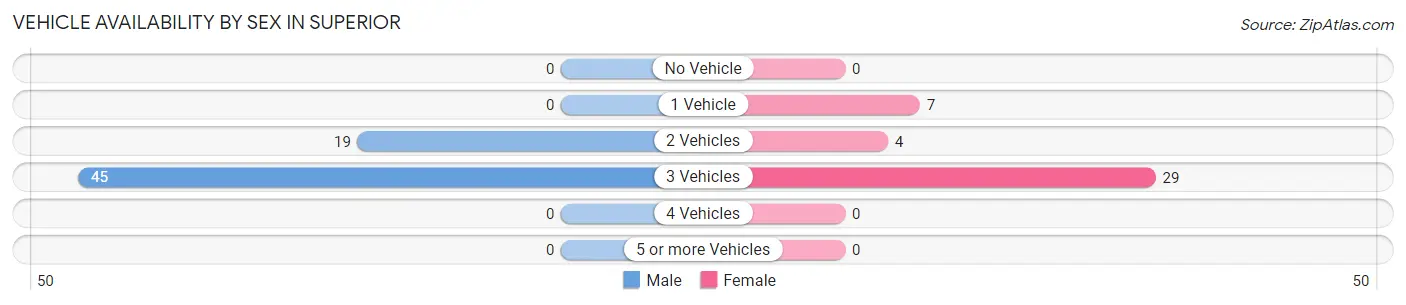
| Vehicles Available | Male | Female |
| No Vehicle | 0 (0.0%) | 0 (0.0%) |
| 1 Vehicle | 0 (0.0%) | 7 (17.5%) |
| 2 Vehicles | 19 (29.7%) | 4 (10.0%) |
| 3 Vehicles | 45 (70.3%) | 29 (72.5%) |
| 4 Vehicles | 0 (0.0%) | 0 (0.0%) |
| 5 or more Vehicles | 0 (0.0%) | 0 (0.0%) |
| Total | 64 (100.0%) | 40 (100.0%) |
Commute Time in Superior
The most frequently occuring commute durations in Superior are 30 to 34 minutes (36 commuters, 39.6%), 20 to 24 minutes (16 commuters, 17.6%), and 35 to 39 minutes (11 commuters, 12.1%).
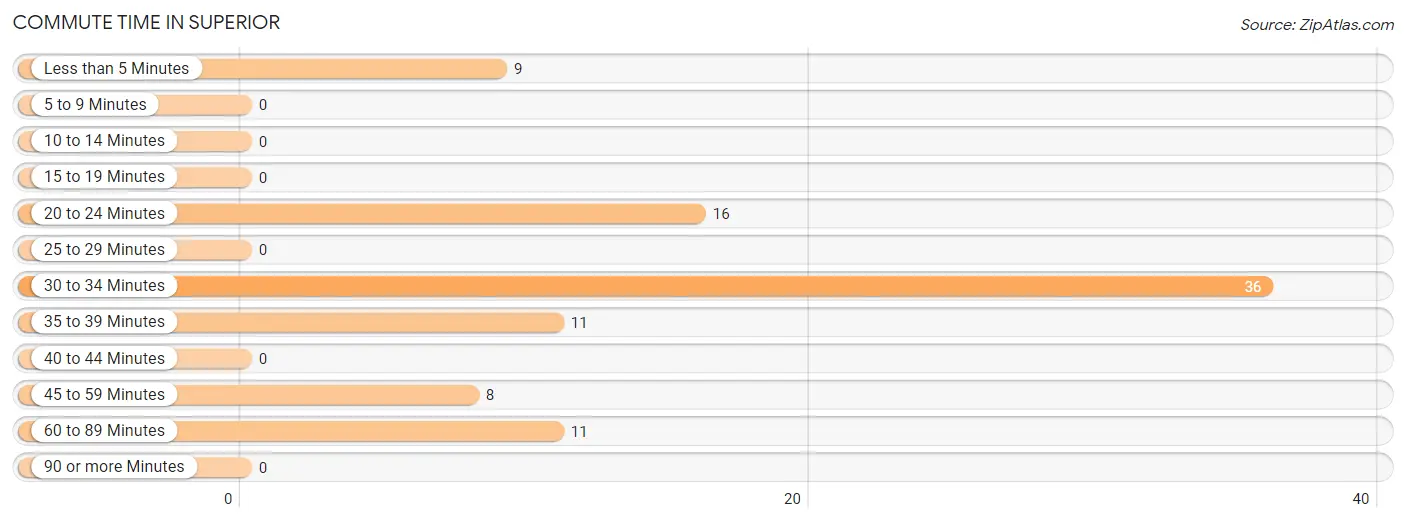
| Commute Time | # Commuters | % Commuters |
| Less than 5 Minutes | 9 | 9.9% |
| 5 to 9 Minutes | 0 | 0.0% |
| 10 to 14 Minutes | 0 | 0.0% |
| 15 to 19 Minutes | 0 | 0.0% |
| 20 to 24 Minutes | 16 | 17.6% |
| 25 to 29 Minutes | 0 | 0.0% |
| 30 to 34 Minutes | 36 | 39.6% |
| 35 to 39 Minutes | 11 | 12.1% |
| 40 to 44 Minutes | 0 | 0.0% |
| 45 to 59 Minutes | 8 | 8.8% |
| 60 to 89 Minutes | 11 | 12.1% |
| 90 or more Minutes | 0 | 0.0% |
Commute Time by Sex in Superior
The most common commute times in Superior are 30 to 34 minutes (29 commuters, 56.9%) for males and 20 to 24 minutes (16 commuters, 40.0%) for females.
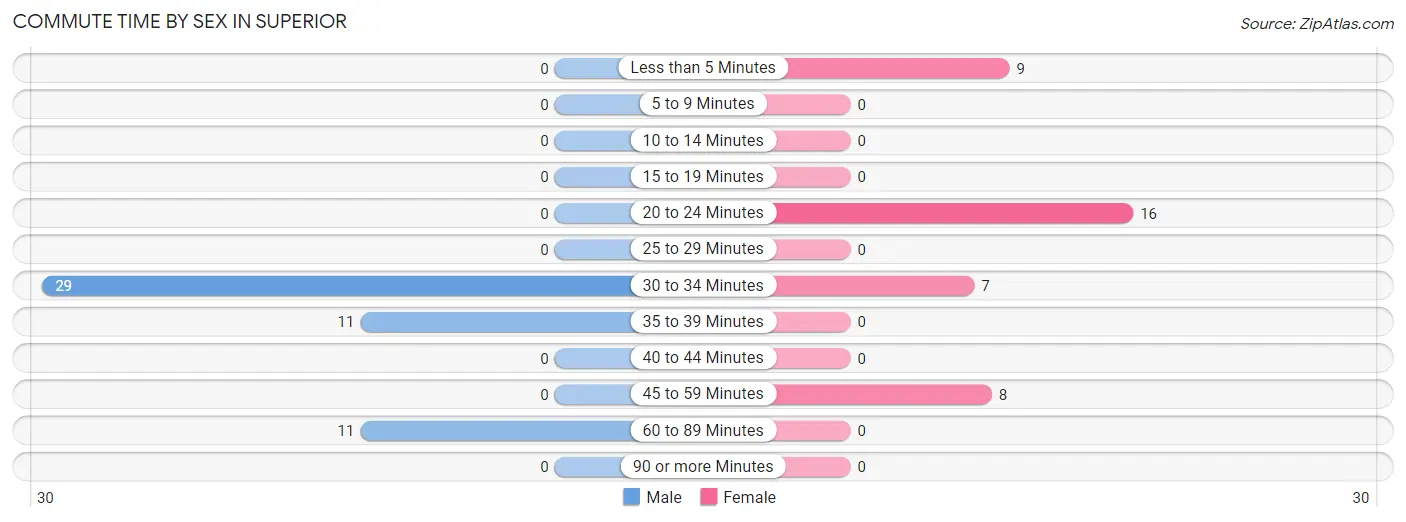
| Commute Time | Male | Female |
| Less than 5 Minutes | 0 (0.0%) | 9 (22.5%) |
| 5 to 9 Minutes | 0 (0.0%) | 0 (0.0%) |
| 10 to 14 Minutes | 0 (0.0%) | 0 (0.0%) |
| 15 to 19 Minutes | 0 (0.0%) | 0 (0.0%) |
| 20 to 24 Minutes | 0 (0.0%) | 16 (40.0%) |
| 25 to 29 Minutes | 0 (0.0%) | 0 (0.0%) |
| 30 to 34 Minutes | 29 (56.9%) | 7 (17.5%) |
| 35 to 39 Minutes | 11 (21.6%) | 0 (0.0%) |
| 40 to 44 Minutes | 0 (0.0%) | 0 (0.0%) |
| 45 to 59 Minutes | 0 (0.0%) | 8 (20.0%) |
| 60 to 89 Minutes | 11 (21.6%) | 0 (0.0%) |
| 90 or more Minutes | 0 (0.0%) | 0 (0.0%) |
Time of Departure to Work by Sex in Superior
The most frequent times of departure to work in Superior are 6:30 AM to 6:59 AM (17, 33.3%) for males and 8:00 AM to 8:29 AM (12, 30.0%) for females.
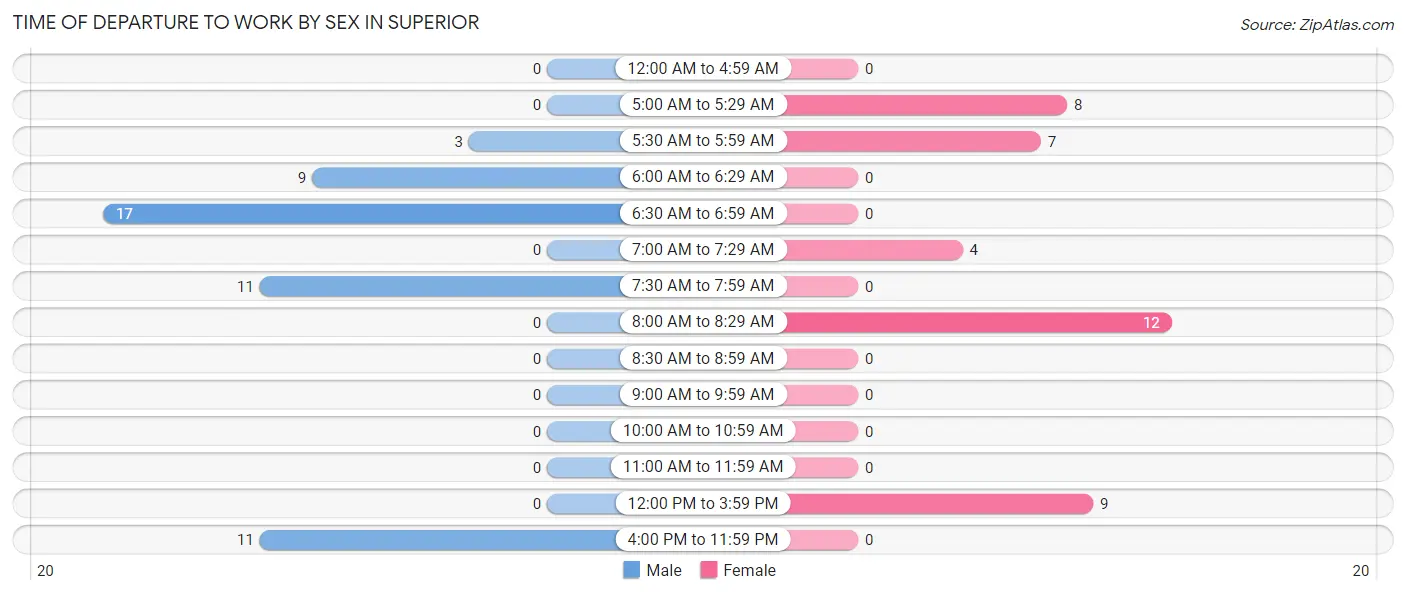
| Time of Departure | Male | Female |
| 12:00 AM to 4:59 AM | 0 (0.0%) | 0 (0.0%) |
| 5:00 AM to 5:29 AM | 0 (0.0%) | 8 (20.0%) |
| 5:30 AM to 5:59 AM | 3 (5.9%) | 7 (17.5%) |
| 6:00 AM to 6:29 AM | 9 (17.6%) | 0 (0.0%) |
| 6:30 AM to 6:59 AM | 17 (33.3%) | 0 (0.0%) |
| 7:00 AM to 7:29 AM | 0 (0.0%) | 4 (10.0%) |
| 7:30 AM to 7:59 AM | 11 (21.6%) | 0 (0.0%) |
| 8:00 AM to 8:29 AM | 0 (0.0%) | 12 (30.0%) |
| 8:30 AM to 8:59 AM | 0 (0.0%) | 0 (0.0%) |
| 9:00 AM to 9:59 AM | 0 (0.0%) | 0 (0.0%) |
| 10:00 AM to 10:59 AM | 0 (0.0%) | 0 (0.0%) |
| 11:00 AM to 11:59 AM | 0 (0.0%) | 0 (0.0%) |
| 12:00 PM to 3:59 PM | 0 (0.0%) | 9 (22.5%) |
| 4:00 PM to 11:59 PM | 11 (21.6%) | 0 (0.0%) |
| Total | 51 (100.0%) | 40 (100.0%) |
Housing Occupancy in Superior
Occupancy by Ownership in Superior
Of the total 65 dwellings in Superior, owner-occupied units account for 57 (87.7%), while renter-occupied units make up 8 (12.3%).
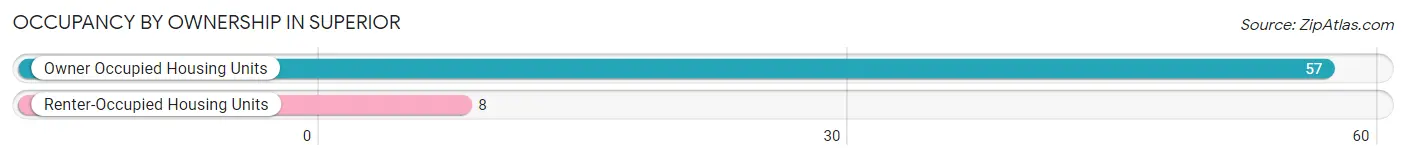
| Occupancy | # Housing Units | % Housing Units |
| Owner Occupied Housing Units | 57 | 87.7% |
| Renter-Occupied Housing Units | 8 | 12.3% |
| Total Occupied Housing Units | 65 | 100.0% |
Occupancy by Household Size in Superior
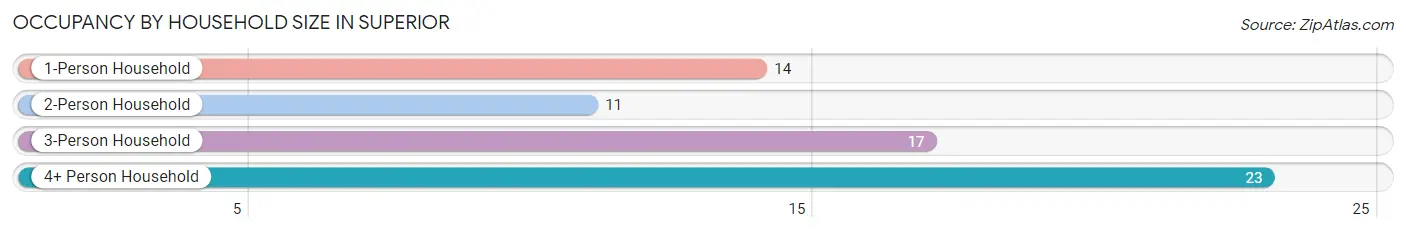
| Household Size | # Housing Units | % Housing Units |
| 1-Person Household | 14 | 21.5% |
| 2-Person Household | 11 | 16.9% |
| 3-Person Household | 17 | 26.2% |
| 4+ Person Household | 23 | 35.4% |
| Total Housing Units | 65 | 100.0% |
Occupancy by Ownership by Household Size in Superior
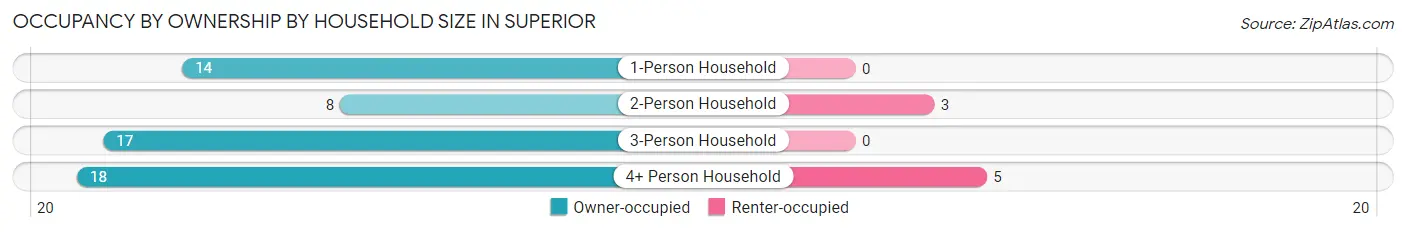
| Household Size | Owner-occupied | Renter-occupied |
| 1-Person Household | 14 (100.0%) | 0 (0.0%) |
| 2-Person Household | 8 (72.7%) | 3 (27.3%) |
| 3-Person Household | 17 (100.0%) | 0 (0.0%) |
| 4+ Person Household | 18 (78.3%) | 5 (21.7%) |
| Total Housing Units | 57 (87.7%) | 8 (12.3%) |
Occupancy by Educational Attainment in Superior
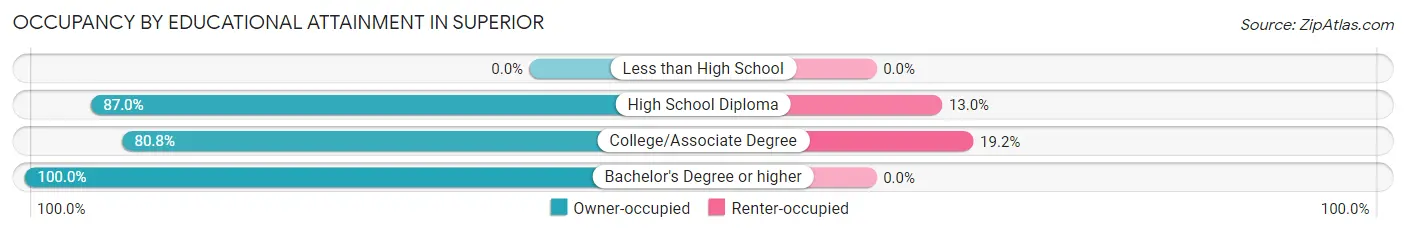
| Household Size | Owner-occupied | Renter-occupied |
| Less than High School | 0 (0.0%) | 0 (0.0%) |
| High School Diploma | 20 (87.0%) | 3 (13.0%) |
| College/Associate Degree | 21 (80.8%) | 5 (19.2%) |
| Bachelor's Degree or higher | 16 (100.0%) | 0 (0.0%) |
Occupancy by Age of Householder in Superior
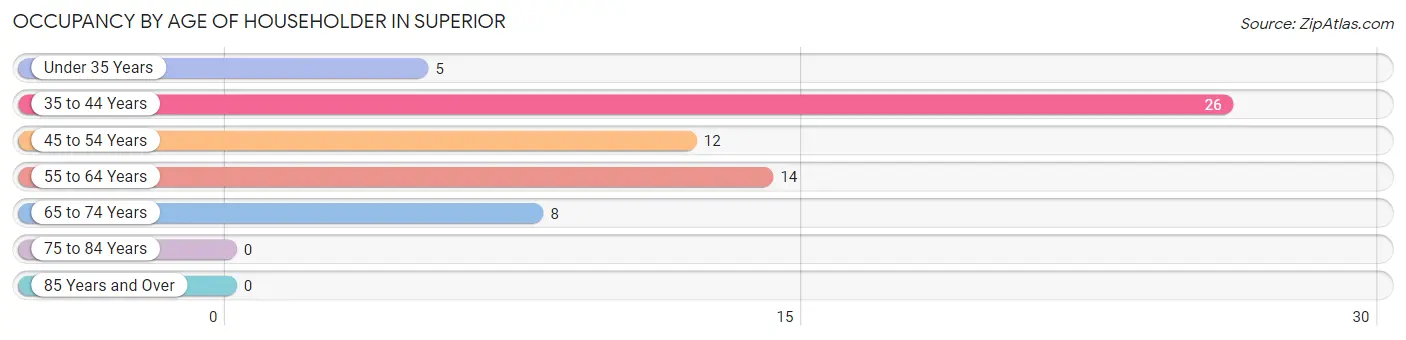
| Age Bracket | # Households | % Households |
| Under 35 Years | 5 | 7.7% |
| 35 to 44 Years | 26 | 40.0% |
| 45 to 54 Years | 12 | 18.5% |
| 55 to 64 Years | 14 | 21.5% |
| 65 to 74 Years | 8 | 12.3% |
| 75 to 84 Years | 0 | 0.0% |
| 85 Years and Over | 0 | 0.0% |
| Total | 65 | 100.0% |
Housing Finances in Superior
Median Income by Occupancy in Superior
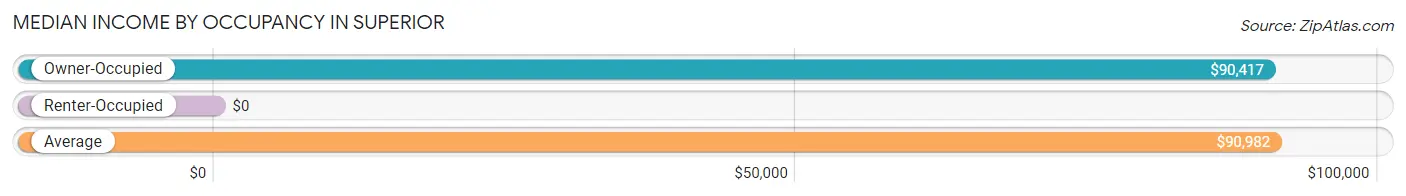
| Occupancy Type | # Households | Median Income |
| Owner-Occupied | 57 (87.7%) | $90,417 |
| Renter-Occupied | 8 (12.3%) | $0 |
| Average | 65 (100.0%) | $90,982 |
Occupancy by Householder Income Bracket in Superior
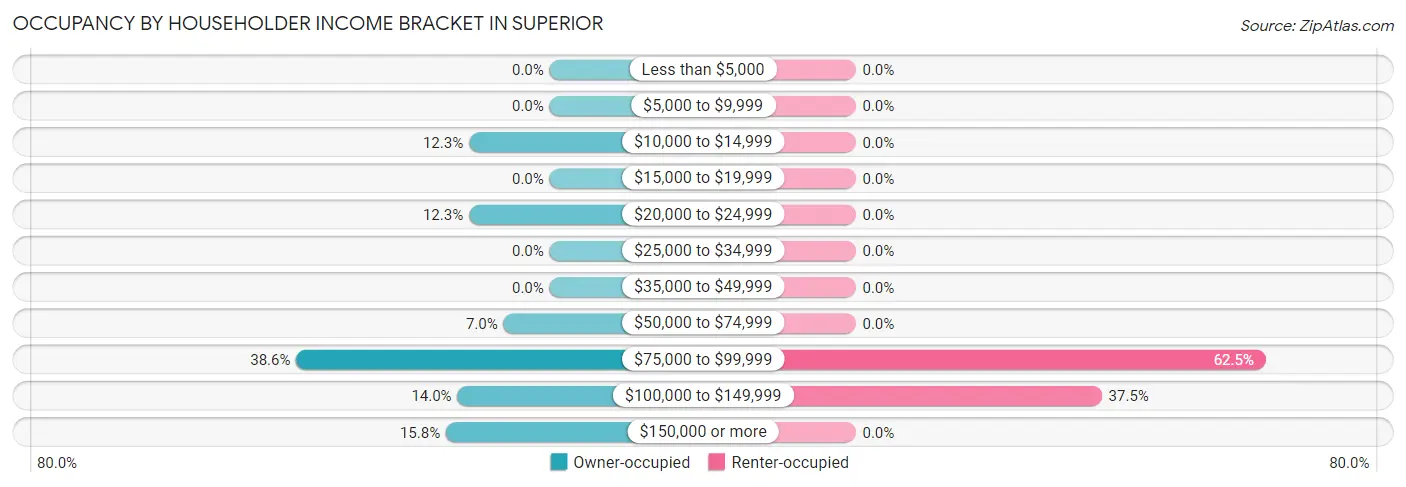
| Income Bracket | Owner-occupied | Renter-occupied |
| Less than $5,000 | 0 (0.0%) | 0 (0.0%) |
| $5,000 to $9,999 | 0 (0.0%) | 0 (0.0%) |
| $10,000 to $14,999 | 7 (12.3%) | 0 (0.0%) |
| $15,000 to $19,999 | 0 (0.0%) | 0 (0.0%) |
| $20,000 to $24,999 | 7 (12.3%) | 0 (0.0%) |
| $25,000 to $34,999 | 0 (0.0%) | 0 (0.0%) |
| $35,000 to $49,999 | 0 (0.0%) | 0 (0.0%) |
| $50,000 to $74,999 | 4 (7.0%) | 0 (0.0%) |
| $75,000 to $99,999 | 22 (38.6%) | 5 (62.5%) |
| $100,000 to $149,999 | 8 (14.0%) | 3 (37.5%) |
| $150,000 or more | 9 (15.8%) | 0 (0.0%) |
| Total | 57 (100.0%) | 8 (100.0%) |
Monthly Housing Cost Tiers in Superior
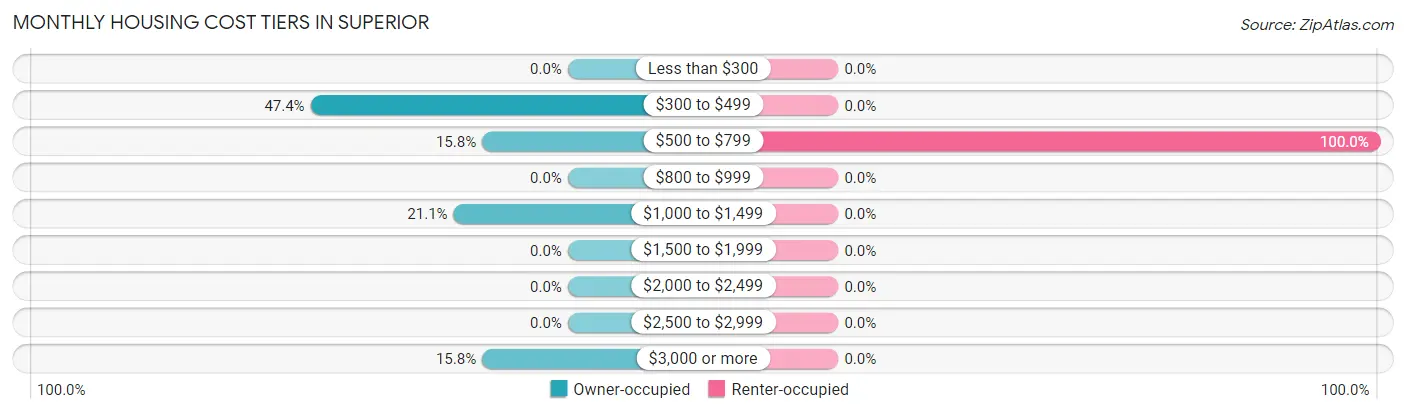
| Monthly Cost | Owner-occupied | Renter-occupied |
| Less than $300 | 0 (0.0%) | 0 (0.0%) |
| $300 to $499 | 27 (47.4%) | 0 (0.0%) |
| $500 to $799 | 9 (15.8%) | 8 (100.0%) |
| $800 to $999 | 0 (0.0%) | 0 (0.0%) |
| $1,000 to $1,499 | 12 (21.0%) | 0 (0.0%) |
| $1,500 to $1,999 | 0 (0.0%) | 0 (0.0%) |
| $2,000 to $2,499 | 0 (0.0%) | 0 (0.0%) |
| $2,500 to $2,999 | 0 (0.0%) | 0 (0.0%) |
| $3,000 or more | 9 (15.8%) | 0 (0.0%) |
| Total | 57 (100.0%) | 8 (100.0%) |
Physical Housing Characteristics in Superior
Housing Structures in Superior
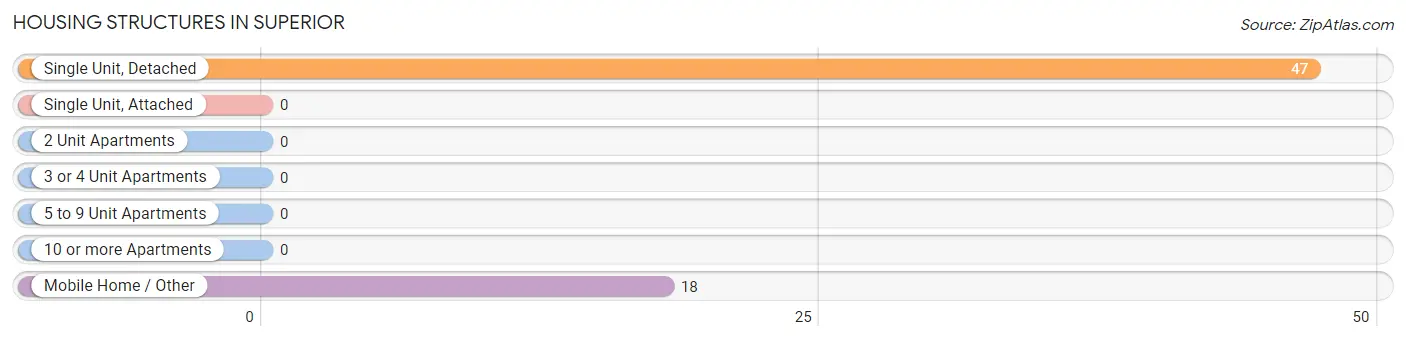
| Structure Type | # Housing Units | % Housing Units |
| Single Unit, Detached | 47 | 72.3% |
| Single Unit, Attached | 0 | 0.0% |
| 2 Unit Apartments | 0 | 0.0% |
| 3 or 4 Unit Apartments | 0 | 0.0% |
| 5 to 9 Unit Apartments | 0 | 0.0% |
| 10 or more Apartments | 0 | 0.0% |
| Mobile Home / Other | 18 | 27.7% |
| Total | 65 | 100.0% |
Housing Structures by Occupancy in Superior
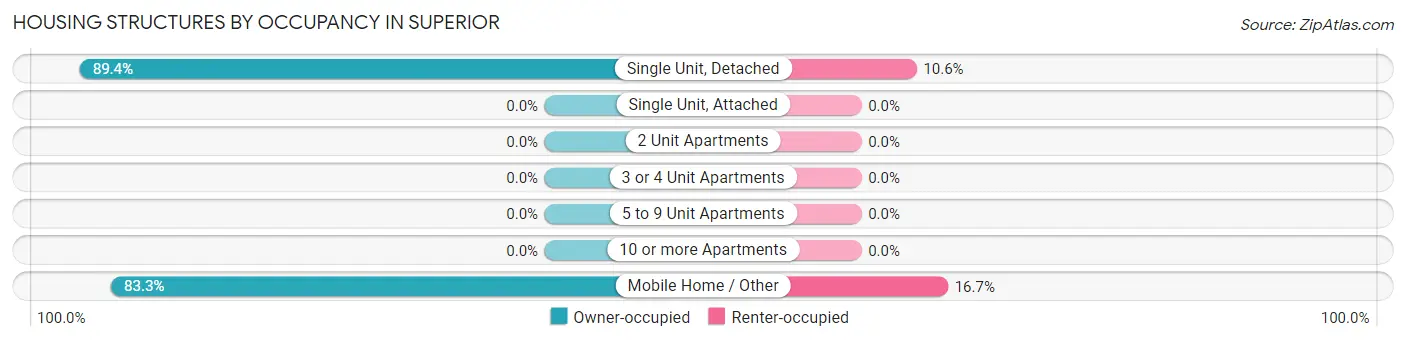
| Structure Type | Owner-occupied | Renter-occupied |
| Single Unit, Detached | 42 (89.4%) | 5 (10.6%) |
| Single Unit, Attached | 0 (0.0%) | 0 (0.0%) |
| 2 Unit Apartments | 0 (0.0%) | 0 (0.0%) |
| 3 or 4 Unit Apartments | 0 (0.0%) | 0 (0.0%) |
| 5 to 9 Unit Apartments | 0 (0.0%) | 0 (0.0%) |
| 10 or more Apartments | 0 (0.0%) | 0 (0.0%) |
| Mobile Home / Other | 15 (83.3%) | 3 (16.7%) |
| Total | 57 (87.7%) | 8 (12.3%) |
Housing Structures by Number of Rooms in Superior
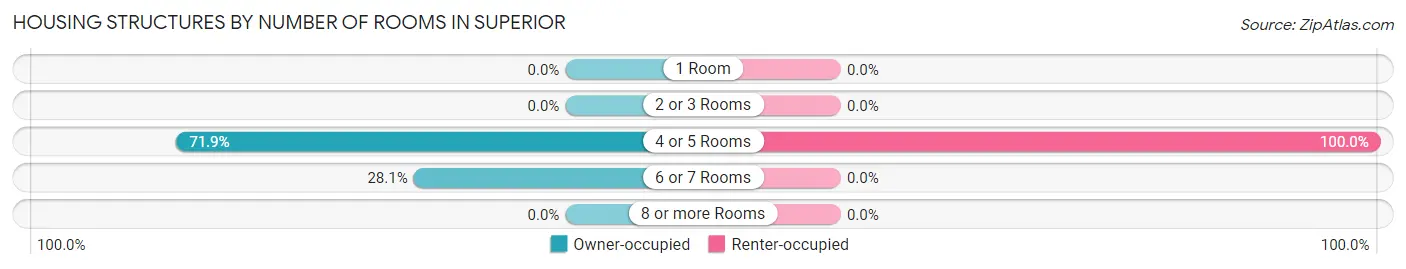
| Number of Rooms | Owner-occupied | Renter-occupied |
| 1 Room | 0 (0.0%) | 0 (0.0%) |
| 2 or 3 Rooms | 0 (0.0%) | 0 (0.0%) |
| 4 or 5 Rooms | 41 (71.9%) | 8 (100.0%) |
| 6 or 7 Rooms | 16 (28.1%) | 0 (0.0%) |
| 8 or more Rooms | 0 (0.0%) | 0 (0.0%) |
| Total | 57 (100.0%) | 8 (100.0%) |
Housing Structure by Heating Type in Superior
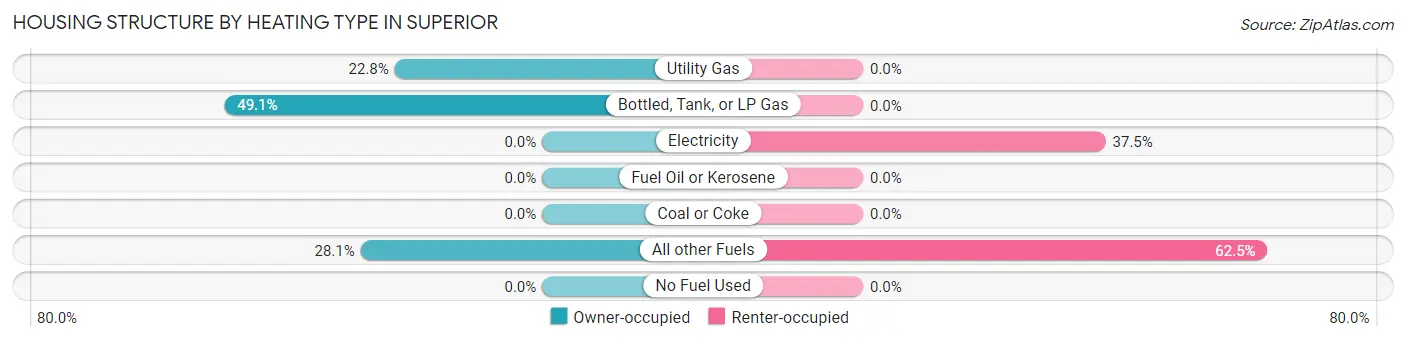
| Heating Type | Owner-occupied | Renter-occupied |
| Utility Gas | 13 (22.8%) | 0 (0.0%) |
| Bottled, Tank, or LP Gas | 28 (49.1%) | 0 (0.0%) |
| Electricity | 0 (0.0%) | 3 (37.5%) |
| Fuel Oil or Kerosene | 0 (0.0%) | 0 (0.0%) |
| Coal or Coke | 0 (0.0%) | 0 (0.0%) |
| All other Fuels | 16 (28.1%) | 5 (62.5%) |
| No Fuel Used | 0 (0.0%) | 0 (0.0%) |
| Total | 57 (100.0%) | 8 (100.0%) |
Household Vehicle Usage in Superior
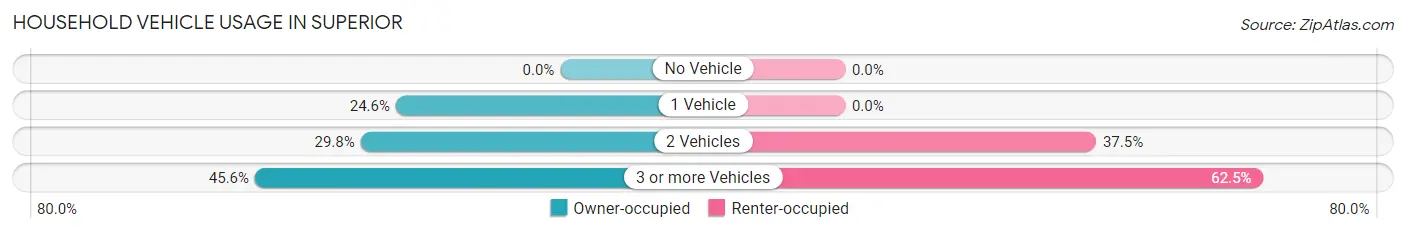
| Vehicles per Household | Owner-occupied | Renter-occupied |
| No Vehicle | 0 (0.0%) | 0 (0.0%) |
| 1 Vehicle | 14 (24.6%) | 0 (0.0%) |
| 2 Vehicles | 17 (29.8%) | 3 (37.5%) |
| 3 or more Vehicles | 26 (45.6%) | 5 (62.5%) |
| Total | 57 (100.0%) | 8 (100.0%) |
Real Estate & Mortgages in Superior
Real Estate and Mortgage Overview in Superior
| Characteristic | Without Mortgage | With Mortgage |
| Housing Units | 36 | 21 |
| Median Property Value | $72,200 | $0 |
| Median Household Income | $71,250 | $9 |
| Monthly Housing Costs | $444 | $9 |
| Real Estate Taxes | $200 | $0 |
Property Value by Mortgage Status in Superior
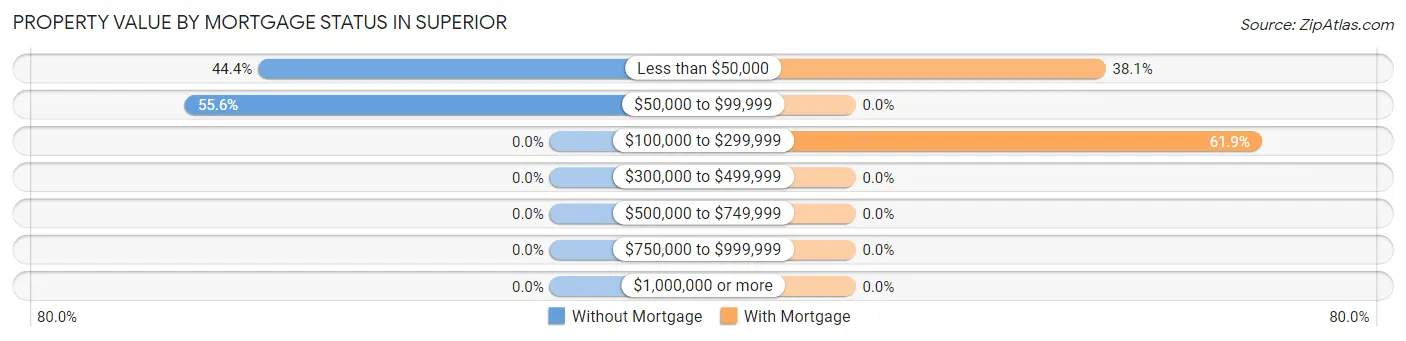
| Property Value | Without Mortgage | With Mortgage |
| Less than $50,000 | 16 (44.4%) | 8 (38.1%) |
| $50,000 to $99,999 | 20 (55.6%) | 0 (0.0%) |
| $100,000 to $299,999 | 0 (0.0%) | 13 (61.9%) |
| $300,000 to $499,999 | 0 (0.0%) | 0 (0.0%) |
| $500,000 to $749,999 | 0 (0.0%) | 0 (0.0%) |
| $750,000 to $999,999 | 0 (0.0%) | 0 (0.0%) |
| $1,000,000 or more | 0 (0.0%) | 0 (0.0%) |
| Total | 36 (100.0%) | 21 (100.0%) |
Household Income by Mortgage Status in Superior
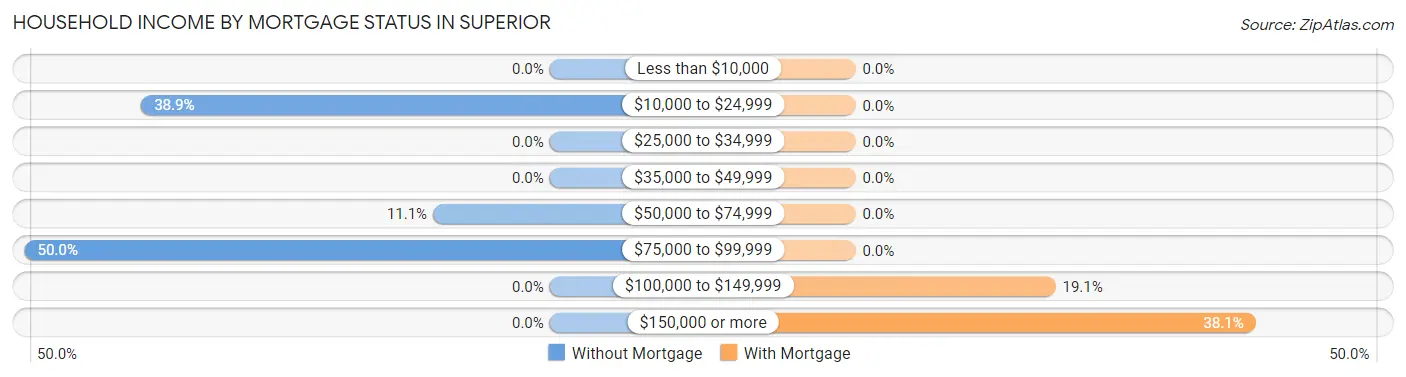
| Household Income | Without Mortgage | With Mortgage |
| Less than $10,000 | 0 (0.0%) | 0 (0.0%) |
| $10,000 to $24,999 | 14 (38.9%) | 0 (0.0%) |
| $25,000 to $34,999 | 0 (0.0%) | 0 (0.0%) |
| $35,000 to $49,999 | 0 (0.0%) | 0 (0.0%) |
| $50,000 to $74,999 | 4 (11.1%) | 0 (0.0%) |
| $75,000 to $99,999 | 18 (50.0%) | 0 (0.0%) |
| $100,000 to $149,999 | 0 (0.0%) | 4 (19.1%) |
| $150,000 or more | 0 (0.0%) | 8 (38.1%) |
| Total | 36 (100.0%) | 21 (100.0%) |
Property Value to Household Income Ratio in Superior
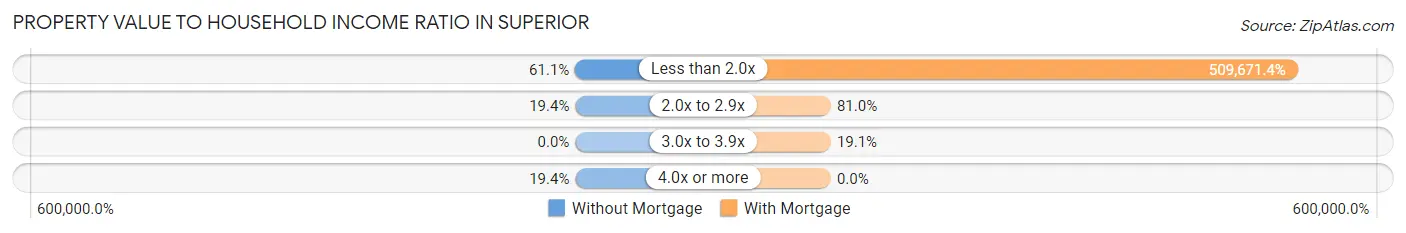
| Value-to-Income Ratio | Without Mortgage | With Mortgage |
| Less than 2.0x | 22 (61.1%) | 107,031 (509,671.4%) |
| 2.0x to 2.9x | 7 (19.4%) | 17 (80.9%) |
| 3.0x to 3.9x | 0 (0.0%) | 4 (19.1%) |
| 4.0x or more | 7 (19.4%) | 0 (0.0%) |
| Total | 36 (100.0%) | 21 (100.0%) |
Real Estate Taxes by Mortgage Status in Superior
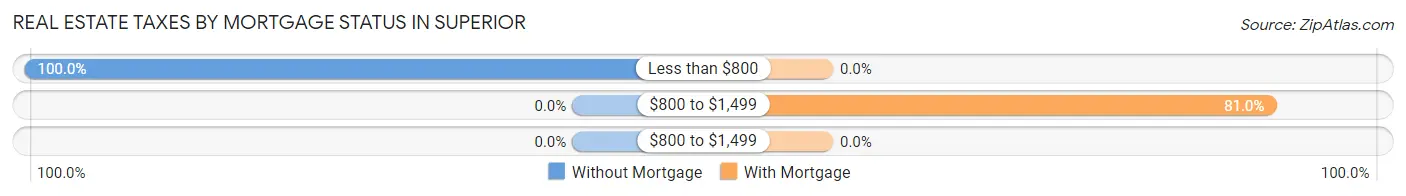
| Property Taxes | Without Mortgage | With Mortgage |
| Less than $800 | 36 (100.0%) | 0 (0.0%) |
| $800 to $1,499 | 0 (0.0%) | 17 (80.9%) |
| $800 to $1,499 | 0 (0.0%) | 0 (0.0%) |
| Total | 36 (100.0%) | 21 (100.0%) |
Health & Disability in Superior
Health Insurance Coverage by Age in Superior
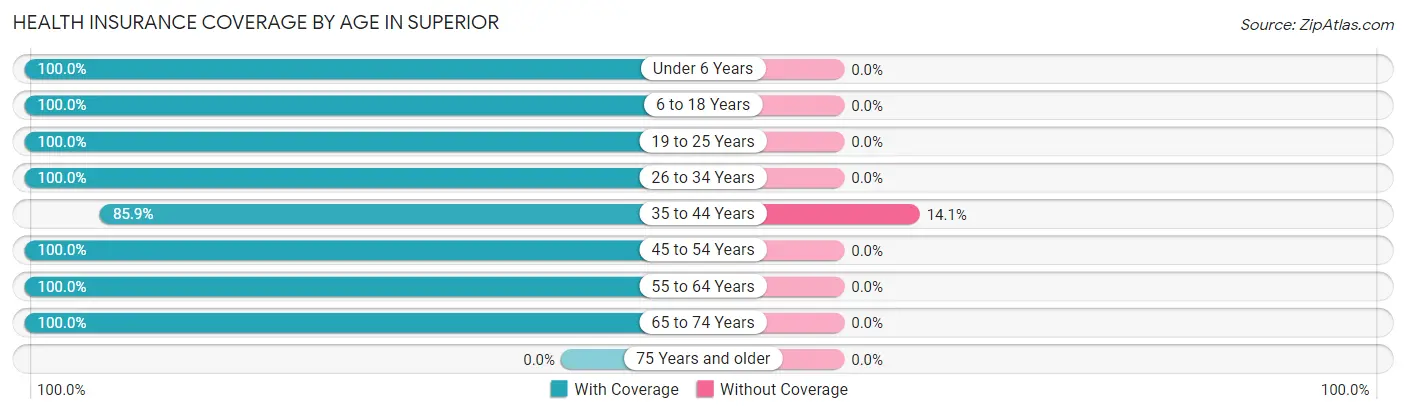
| Age Bracket | With Coverage | Without Coverage |
| Under 6 Years | 9 (100.0%) | 0 (0.0%) |
| 6 to 18 Years | 47 (100.0%) | 0 (0.0%) |
| 19 to 25 Years | 20 (100.0%) | 0 (0.0%) |
| 26 to 34 Years | 15 (100.0%) | 0 (0.0%) |
| 35 to 44 Years | 55 (85.9%) | 9 (14.1%) |
| 45 to 54 Years | 14 (100.0%) | 0 (0.0%) |
| 55 to 64 Years | 30 (100.0%) | 0 (0.0%) |
| 65 to 74 Years | 21 (100.0%) | 0 (0.0%) |
| 75 Years and older | 0 (0.0%) | 0 (0.0%) |
| Total | 211 (95.9%) | 9 (4.1%) |
Health Insurance Coverage by Citizenship Status in Superior
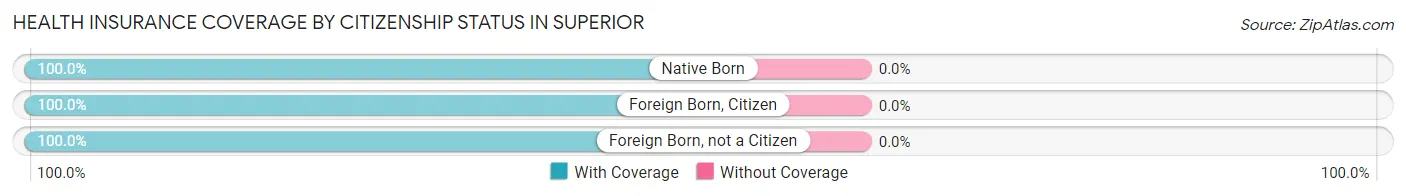
| Citizenship Status | With Coverage | Without Coverage |
| Native Born | 9 (100.0%) | 0 (0.0%) |
| Foreign Born, Citizen | 47 (100.0%) | 0 (0.0%) |
| Foreign Born, not a Citizen | 20 (100.0%) | 0 (0.0%) |
Health Insurance Coverage by Household Income in Superior
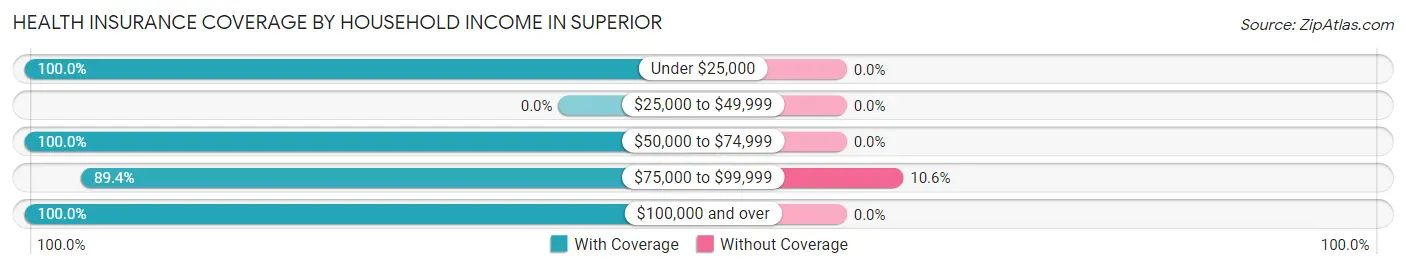
| Household Income | With Coverage | Without Coverage |
| Under $25,000 | 14 (100.0%) | 0 (0.0%) |
| $25,000 to $49,999 | 0 (0.0%) | 0 (0.0%) |
| $50,000 to $74,999 | 9 (100.0%) | 0 (0.0%) |
| $75,000 to $99,999 | 76 (89.4%) | 9 (10.6%) |
| $100,000 and over | 112 (100.0%) | 0 (0.0%) |
Public vs Private Health Insurance Coverage by Age in Superior
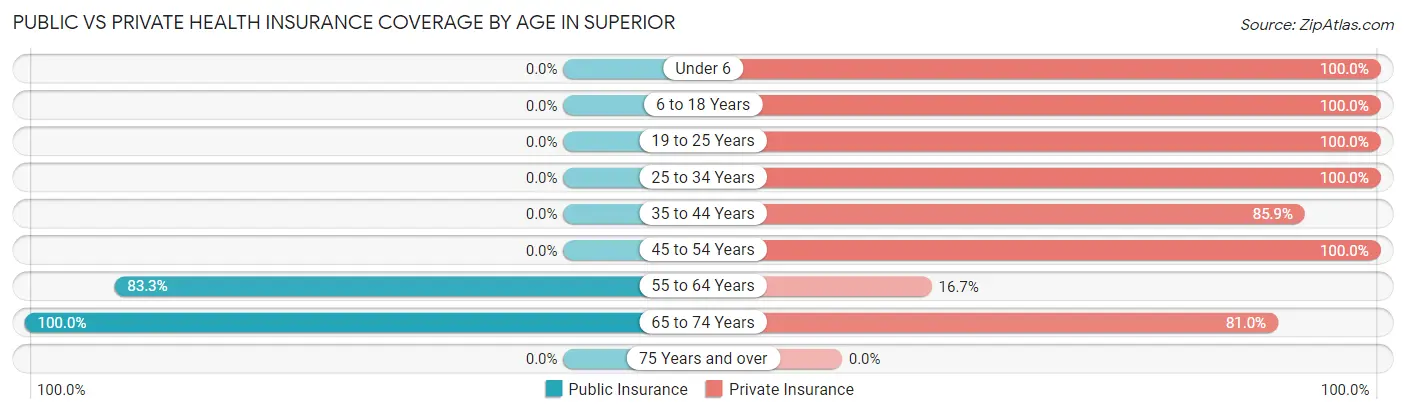
| Age Bracket | Public Insurance | Private Insurance |
| Under 6 | 0 (0.0%) | 9 (100.0%) |
| 6 to 18 Years | 0 (0.0%) | 47 (100.0%) |
| 19 to 25 Years | 0 (0.0%) | 20 (100.0%) |
| 25 to 34 Years | 0 (0.0%) | 15 (100.0%) |
| 35 to 44 Years | 0 (0.0%) | 55 (85.9%) |
| 45 to 54 Years | 0 (0.0%) | 14 (100.0%) |
| 55 to 64 Years | 25 (83.3%) | 5 (16.7%) |
| 65 to 74 Years | 21 (100.0%) | 17 (80.9%) |
| 75 Years and over | 0 (0.0%) | 0 (0.0%) |
| Total | 46 (20.9%) | 182 (82.7%) |
Disability Status by Sex by Age in Superior
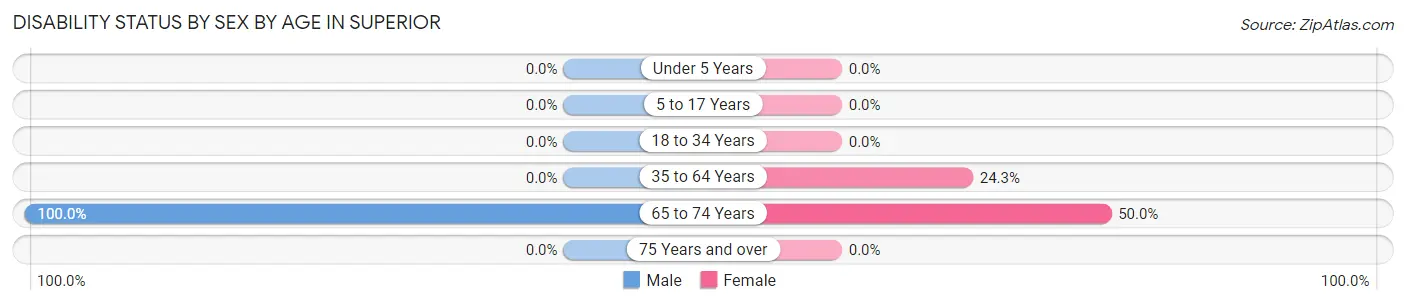
| Age Bracket | Male | Female |
| Under 5 Years | 0 (0.0%) | 0 (0.0%) |
| 5 to 17 Years | 0 (0.0%) | 0 (0.0%) |
| 18 to 34 Years | 0 (0.0%) | 0 (0.0%) |
| 35 to 64 Years | 0 (0.0%) | 18 (24.3%) |
| 65 to 74 Years | 5 (100.0%) | 8 (50.0%) |
| 75 Years and over | 0 (0.0%) | 0 (0.0%) |
Disability Class by Sex by Age in Superior
Disability Class: Hearing Difficulty
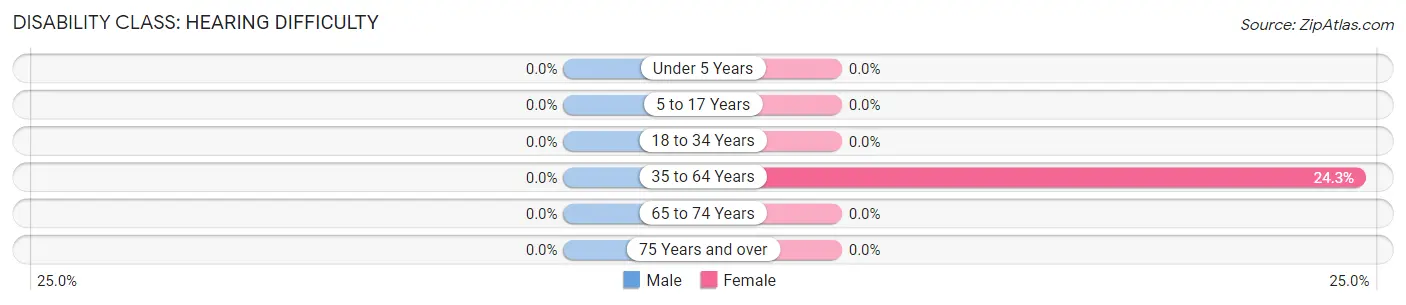
| Age Bracket | Male | Female |
| Under 5 Years | 0 (0.0%) | 0 (0.0%) |
| 5 to 17 Years | 0 (0.0%) | 0 (0.0%) |
| 18 to 34 Years | 0 (0.0%) | 0 (0.0%) |
| 35 to 64 Years | 0 (0.0%) | 18 (24.3%) |
| 65 to 74 Years | 0 (0.0%) | 0 (0.0%) |
| 75 Years and over | 0 (0.0%) | 0 (0.0%) |
Disability Class: Vision Difficulty
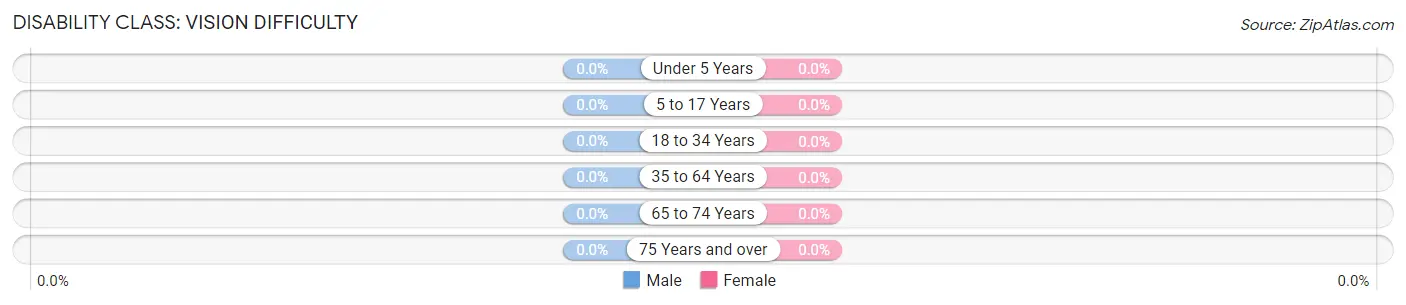
| Age Bracket | Male | Female |
| Under 5 Years | 0 (0.0%) | 0 (0.0%) |
| 5 to 17 Years | 0 (0.0%) | 0 (0.0%) |
| 18 to 34 Years | 0 (0.0%) | 0 (0.0%) |
| 35 to 64 Years | 0 (0.0%) | 0 (0.0%) |
| 65 to 74 Years | 0 (0.0%) | 0 (0.0%) |
| 75 Years and over | 0 (0.0%) | 0 (0.0%) |
Disability Class: Cognitive Difficulty
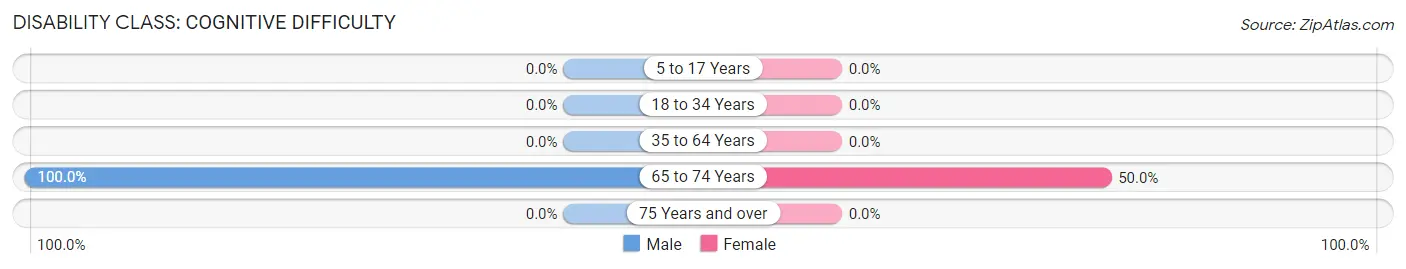
| Age Bracket | Male | Female |
| 5 to 17 Years | 0 (0.0%) | 0 (0.0%) |
| 18 to 34 Years | 0 (0.0%) | 0 (0.0%) |
| 35 to 64 Years | 0 (0.0%) | 0 (0.0%) |
| 65 to 74 Years | 5 (100.0%) | 8 (50.0%) |
| 75 Years and over | 0 (0.0%) | 0 (0.0%) |
Disability Class: Ambulatory Difficulty
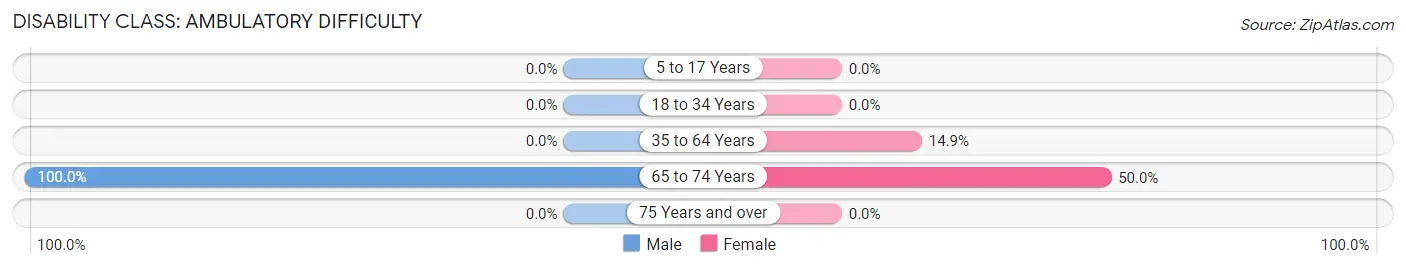
| Age Bracket | Male | Female |
| 5 to 17 Years | 0 (0.0%) | 0 (0.0%) |
| 18 to 34 Years | 0 (0.0%) | 0 (0.0%) |
| 35 to 64 Years | 0 (0.0%) | 11 (14.9%) |
| 65 to 74 Years | 5 (100.0%) | 8 (50.0%) |
| 75 Years and over | 0 (0.0%) | 0 (0.0%) |
Disability Class: Self-Care Difficulty
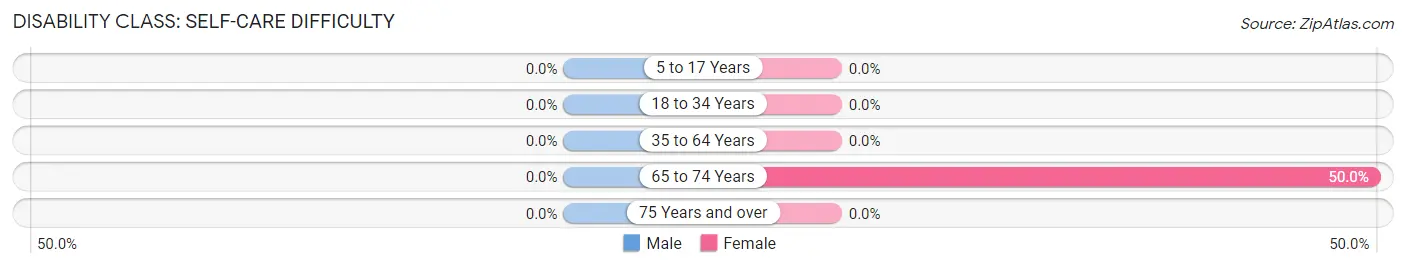
| Age Bracket | Male | Female |
| 5 to 17 Years | 0 (0.0%) | 0 (0.0%) |
| 18 to 34 Years | 0 (0.0%) | 0 (0.0%) |
| 35 to 64 Years | 0 (0.0%) | 0 (0.0%) |
| 65 to 74 Years | 0 (0.0%) | 8 (50.0%) |
| 75 Years and over | 0 (0.0%) | 0 (0.0%) |
Technology Access in Superior
Computing Device Access in Superior
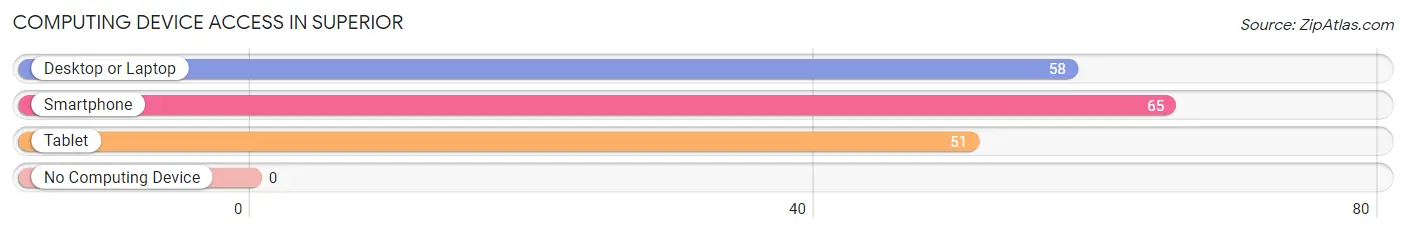
| Device Type | # Households | % Households |
| Desktop or Laptop | 58 | 89.2% |
| Smartphone | 65 | 100.0% |
| Tablet | 51 | 78.5% |
| No Computing Device | 0 | 0.0% |
| Total | 65 | 100.0% |
Internet Access in Superior
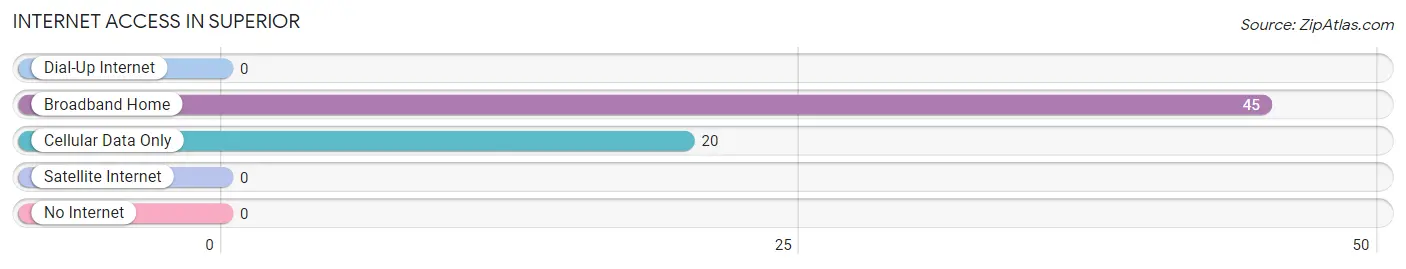
| Internet Type | # Households | % Households |
| Dial-Up Internet | 0 | 0.0% |
| Broadband Home | 45 | 69.2% |
| Cellular Data Only | 20 | 30.8% |
| Satellite Internet | 0 | 0.0% |
| No Internet | 0 | 0.0% |
| Total | 65 | 100.0% |
Superior Summary
Superior, Wyoming is a small town located in the southeastern corner of the state. It is situated in the foothills of the Wind River Range, and is surrounded by the Bridger-Teton National Forest. The town was founded in 1884 and has a population of approximately 500 people.
History
The town of Superior was founded in 1884 by a group of settlers from the Midwest. The settlers were looking for a place to settle and start a new life, and they chose the area around Superior because of its abundance of natural resources. The town was named after the nearby Superior Creek, which was named by the early settlers for its superior quality of water.
The town quickly grew and became a hub for the surrounding area. It was a popular stop for travelers and traders, and soon became a center for commerce and industry. The town was home to several businesses, including a sawmill, a flour mill, a blacksmith shop, and a general store.
In the early 1900s, the town began to decline as the railroad bypassed it and the nearby towns of Pinedale and Big Piney began to grow. However, the town was able to survive and remain a small but vibrant community.
Geography
Superior is located in the southeastern corner of Wyoming, in the foothills of the Wind River Range. The town is surrounded by the Bridger-Teton National Forest, and is situated at an elevation of 6,000 feet. The town is located near the headwaters of the Green River, and is approximately 30 miles from the Wyoming-Utah border.
The town is located in a semi-arid climate, with hot summers and cold winters. The average annual temperature is around 50 degrees Fahrenheit, and the average annual precipitation is around 10 inches.
Economy
The economy of Superior is largely based on tourism and recreation. The town is a popular destination for outdoor enthusiasts, and is home to several ski resorts, hiking trails, and fishing spots. The town is also home to several small businesses, including restaurants, shops, and lodging.
The town is also home to several energy companies, including oil and gas exploration and production companies. The town is also home to several ranches and farms, which produce hay, cattle, and other agricultural products.
Demographics
As of the 2010 census, the population of Superior was 498 people. The town is predominantly white, with a small Hispanic population. The median household income is around $45,000, and the median home value is around $150,000. The town has a low unemployment rate, and the majority of the population is employed in the tourism and recreation industry.
Common Questions
What is Per Capita Income in Superior?
Per Capita income in Superior is $26,852.
What is the Median Family Income in Superior?
Median Family Income in Superior is $92,232.
What is the Median Household income in Superior?
Median Household Income in Superior is $90,982.
What is Income or Wage Gap in Superior?
Income or Wage Gap in Superior is 25.3%.
Women in Superior earn 74.7 cents for every dollar earned by a man.
What is Inequality or Gini Index in Superior?
Inequality or Gini Index in Superior is 0.28.
What is the Total Population of Superior?
Total Population of Superior is 220.
What is the Total Male Population of Superior?
Total Male Population of Superior is 100.
What is the Total Female Population of Superior?
Total Female Population of Superior is 120.
What is the Ratio of Males per 100 Females in Superior?
There are 83.33 Males per 100 Females in Superior.
What is the Ratio of Females per 100 Males in Superior?
There are 120.00 Females per 100 Males in Superior.
What is the Median Population Age in Superior?
Median Population Age in Superior is 37.8 Years.
What is the Average Family Size in Superior
Average Family Size in Superior is 4.0 People.
What is the Average Household Size in Superior
Average Household Size in Superior is 3.4 People.
How Large is the Labor Force in Superior?
There are 104 People in the Labor Forcein in Superior.
What is the Percentage of People in the Labor Force in Superior?
63.4% of People are in the Labor Force in Superior.