Annex, OR Map & Demographics
Annex Map
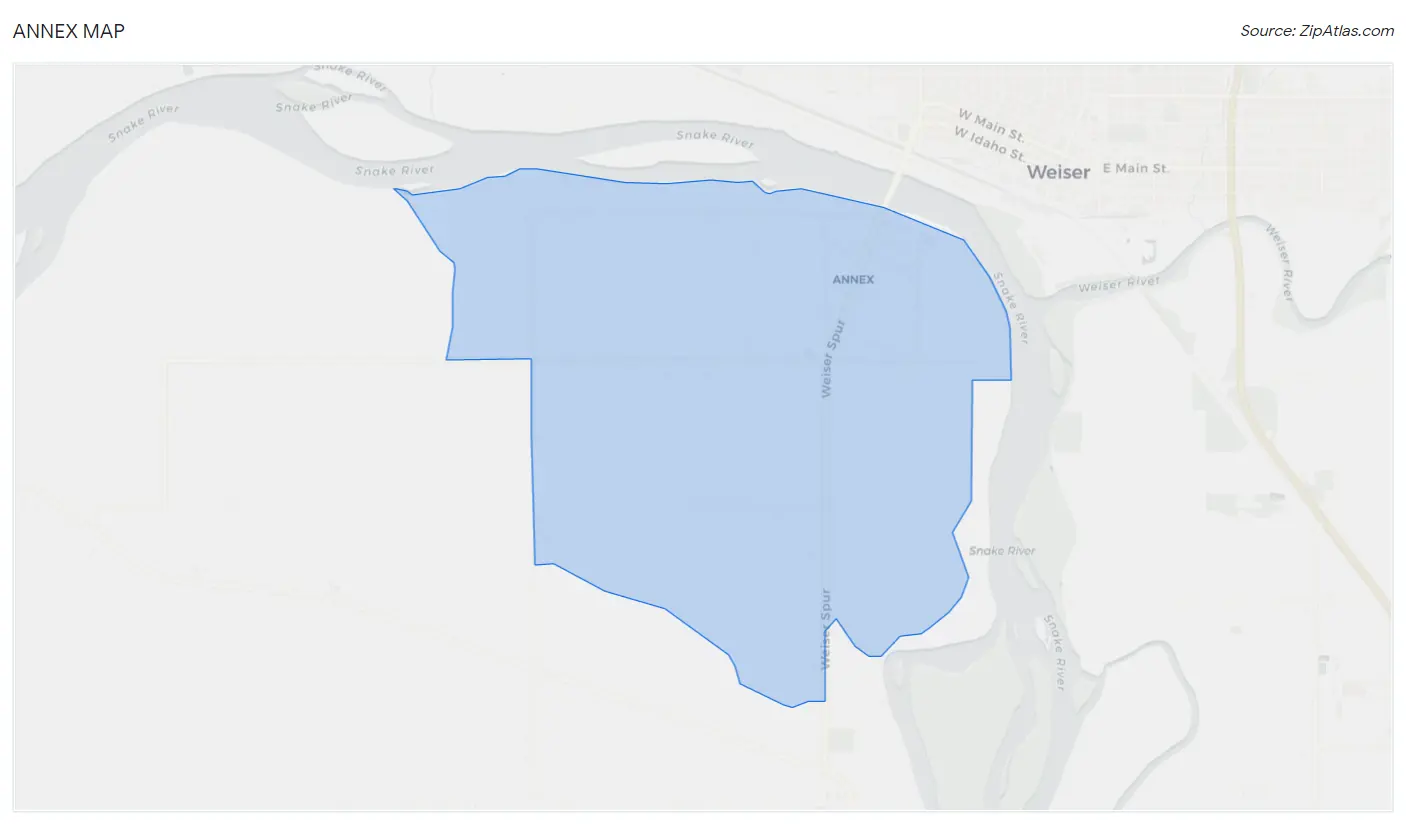
Annex Overview
$21,677
PER CAPITA INCOME
$44,643
AVG FAMILY INCOME
$47,500
AVG HOUSEHOLD INCOME
26.1%
WAGE / INCOME GAP [ % ]
73.9¢/ $1
WAGE / INCOME GAP [ $ ]
0.40
INEQUALITY / GINI INDEX
333
TOTAL POPULATION
165
MALE POPULATION
168
FEMALE POPULATION
98.21
MALES / 100 FEMALES
101.82
FEMALES / 100 MALES
37.3
MEDIAN AGE
3.6
AVG FAMILY SIZE
3.2
AVG HOUSEHOLD SIZE
171
LABOR FORCE [ PEOPLE ]
61.1%
PERCENT IN LABOR FORCE
1.2%
UNEMPLOYMENT RATE
Income in Annex
Income Overview in Annex
Per Capita Income in Annex is $21,677, while median incomes of families and households are $44,643 and $47,500 respectively.
| Characteristic | Number | Measure |
| Per Capita Income | 333 | $21,677 |
| Median Family Income | 70 | $44,643 |
| Mean Family Income | 70 | $67,397 |
| Median Household Income | 104 | $47,500 |
| Mean Household Income | 104 | $63,187 |
| Income Deficit | 70 | $0 |
| Wage / Income Gap (%) | 333 | 26.10% |
| Wage / Income Gap ($) | 333 | 73.90¢ per $1 |
| Gini / Inequality Index | 333 | 0.40 |
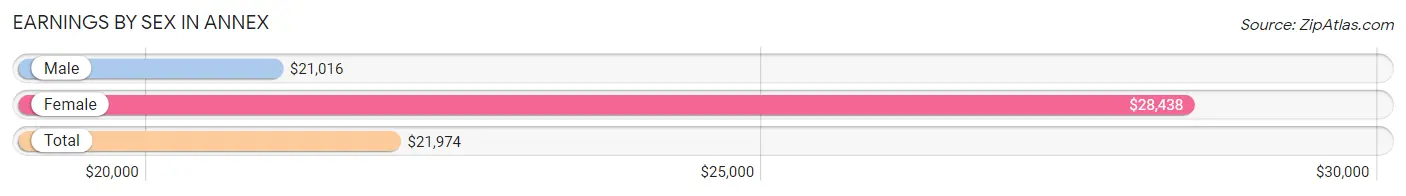
Earnings by Sex in Annex
Average Earnings in Annex are $21,974, $21,016 for men and $28,438 for women, a difference of 26.1%.
| Sex | Number | Average Earnings |
| Male | 105 (59.7%) | $21,016 |
| Female | 71 (40.3%) | $28,438 |
| Total | 176 (100.0%) | $21,974 |
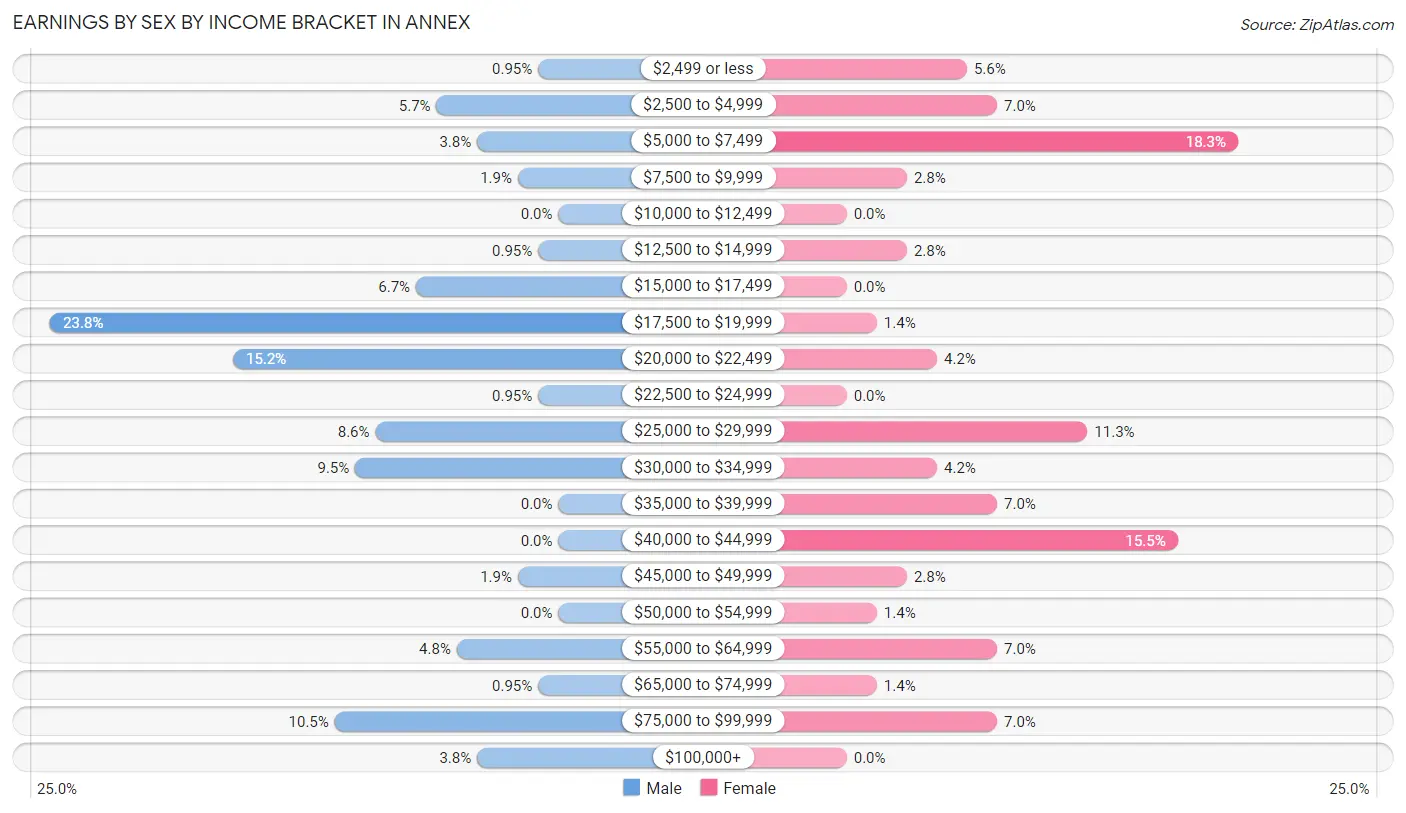
Earnings by Sex by Income Bracket in Annex
The most common earnings brackets in Annex are $17,500 to $19,999 for men (25 | 23.8%) and $5,000 to $7,499 for women (13 | 18.3%).
| Income | Male | Female |
| $2,499 or less | 1 (0.9%) | 4 (5.6%) |
| $2,500 to $4,999 | 6 (5.7%) | 5 (7.0%) |
| $5,000 to $7,499 | 4 (3.8%) | 13 (18.3%) |
| $7,500 to $9,999 | 2 (1.9%) | 2 (2.8%) |
| $10,000 to $12,499 | 0 (0.0%) | 0 (0.0%) |
| $12,500 to $14,999 | 1 (0.9%) | 2 (2.8%) |
| $15,000 to $17,499 | 7 (6.7%) | 0 (0.0%) |
| $17,500 to $19,999 | 25 (23.8%) | 1 (1.4%) |
| $20,000 to $22,499 | 16 (15.2%) | 3 (4.2%) |
| $22,500 to $24,999 | 1 (0.9%) | 0 (0.0%) |
| $25,000 to $29,999 | 9 (8.6%) | 8 (11.3%) |
| $30,000 to $34,999 | 10 (9.5%) | 3 (4.2%) |
| $35,000 to $39,999 | 0 (0.0%) | 5 (7.0%) |
| $40,000 to $44,999 | 0 (0.0%) | 11 (15.5%) |
| $45,000 to $49,999 | 2 (1.9%) | 2 (2.8%) |
| $50,000 to $54,999 | 0 (0.0%) | 1 (1.4%) |
| $55,000 to $64,999 | 5 (4.8%) | 5 (7.0%) |
| $65,000 to $74,999 | 1 (0.9%) | 1 (1.4%) |
| $75,000 to $99,999 | 11 (10.5%) | 5 (7.0%) |
| $100,000+ | 4 (3.8%) | 0 (0.0%) |
| Total | 105 (100.0%) | 71 (100.0%) |
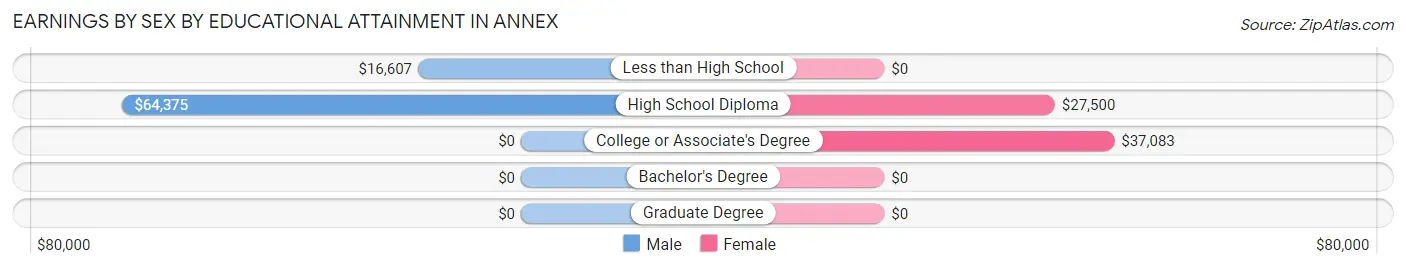
Earnings by Sex by Educational Attainment in Annex
| Educational Attainment | Male Income | Female Income |
| Less than High School | $16,607 | $0 |
| High School Diploma | $64,375 | $27,500 |
| College or Associate's Degree | - | - |
| Bachelor's Degree | - | - |
| Graduate Degree | - | - |
| Total | - | - |
Family Income in Annex
Family Income Brackets in Annex
According to the Annex family income data, there are 16 families falling into the $25,000 to $34,999 income range, which is the most common income bracket and makes up 22.9% of all families.
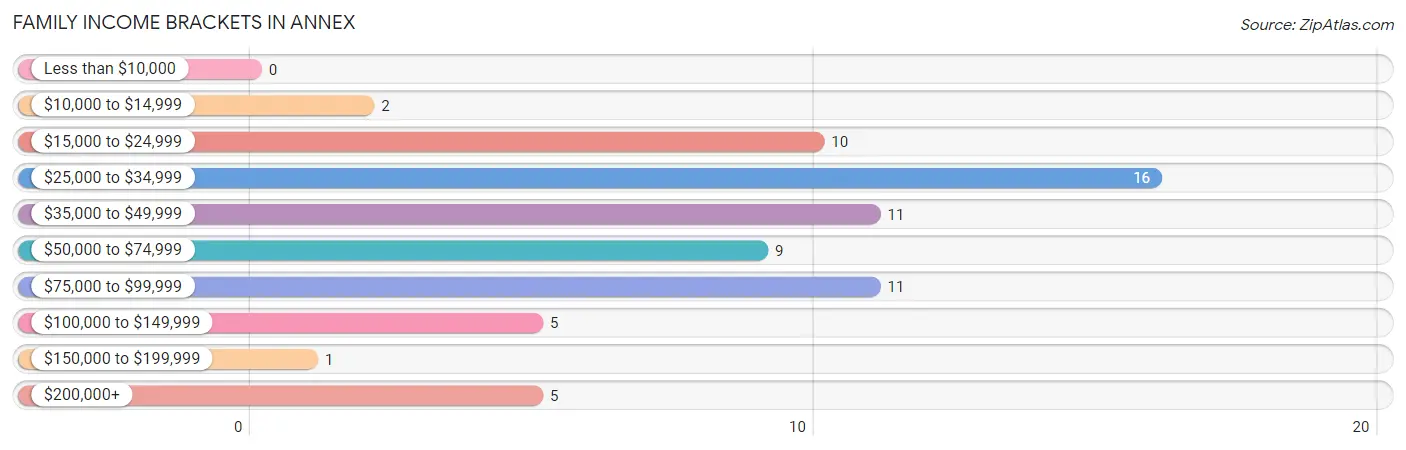
| Income Bracket | # Families | % Families |
| Less than $10,000 | 0 | 0.0% |
| $10,000 to $14,999 | 2 | 2.9% |
| $15,000 to $24,999 | 10 | 14.3% |
| $25,000 to $34,999 | 16 | 22.9% |
| $35,000 to $49,999 | 11 | 15.7% |
| $50,000 to $74,999 | 9 | 12.9% |
| $75,000 to $99,999 | 11 | 15.7% |
| $100,000 to $149,999 | 5 | 7.1% |
| $150,000 to $199,999 | 1 | 1.4% |
| $200,000+ | 5 | 7.1% |
Family Income by Famaliy Size in Annex
4-person families (19 | 27.1%) account for the highest median family income in Annex with $46,875 per family, while 4-person families (19 | 27.1%) have the highest median income of $11,719 per family member.
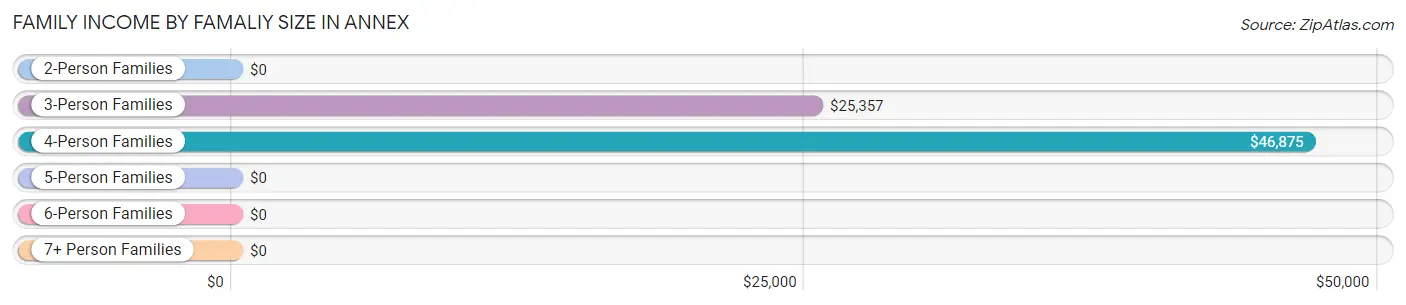
| Income Bracket | # Families | Median Income |
| 2-Person Families | 30 (42.9%) | $0 |
| 3-Person Families | 12 (17.1%) | $25,357 |
| 4-Person Families | 19 (27.1%) | $46,875 |
| 5-Person Families | 5 (7.1%) | $0 |
| 6-Person Families | 4 (5.7%) | $0 |
| 7+ Person Families | 0 (0.0%) | $0 |
| Total | 70 (100.0%) | $44,643 |
Family Income by Number of Earners in Annex
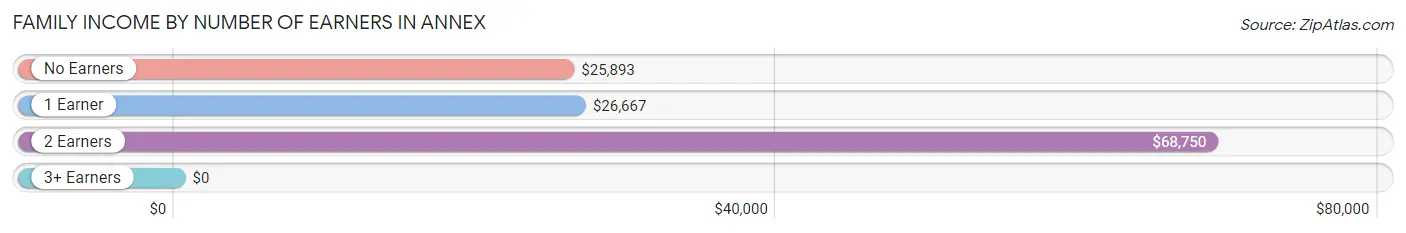
| Number of Earners | # Families | Median Income |
| No Earners | 11 (15.7%) | $25,893 |
| 1 Earner | 24 (34.3%) | $26,667 |
| 2 Earners | 26 (37.1%) | $68,750 |
| 3+ Earners | 9 (12.9%) | $0 |
| Total | 70 (100.0%) | $44,643 |
Household Income in Annex
Household Income Brackets in Annex
With 26 households falling in the category, the $35,000 to $49,999 income range is the most frequent in Annex, accounting for 25.0% of all households.
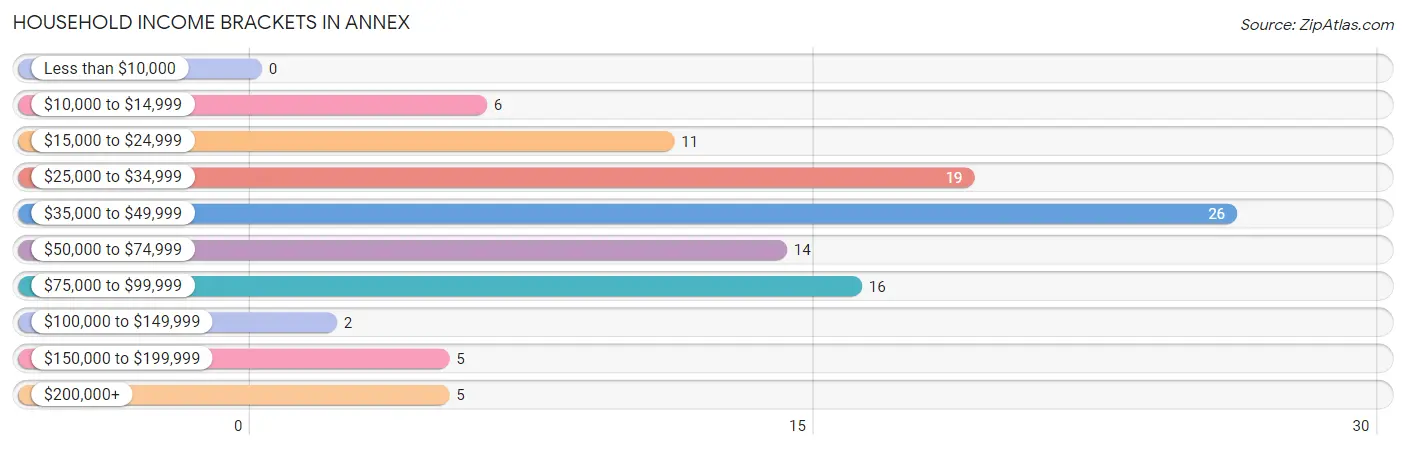
| Income Bracket | # Households | % Households |
| Less than $10,000 | 0 | 0.0% |
| $10,000 to $14,999 | 6 | 5.8% |
| $15,000 to $24,999 | 11 | 10.6% |
| $25,000 to $34,999 | 19 | 18.3% |
| $35,000 to $49,999 | 26 | 25.0% |
| $50,000 to $74,999 | 14 | 13.5% |
| $75,000 to $99,999 | 16 | 15.4% |
| $100,000 to $149,999 | 2 | 1.9% |
| $150,000 to $199,999 | 5 | 4.8% |
| $200,000+ | 5 | 4.8% |
Household Income by Householder Age in Annex
The median household income in Annex is $47,500, with the highest median household income of $72,500 found in the 45 to 64 years age bracket for the primary householder. A total of 46 households (44.2%) fall into this category. Meanwhile, the 15 to 24 years age bracket for the primary householder has the lowest median household income of $0, with 10 households (9.6%) in this group.
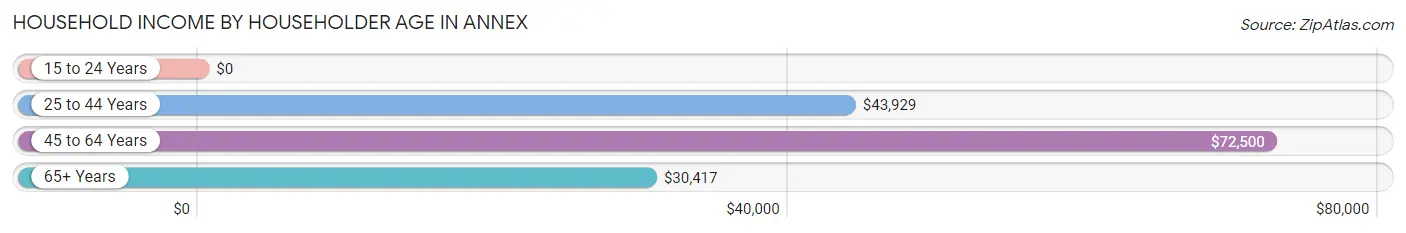
| Income Bracket | # Households | Median Income |
| 15 to 24 Years | 10 (9.6%) | $0 |
| 25 to 44 Years | 16 (15.4%) | $43,929 |
| 45 to 64 Years | 46 (44.2%) | $72,500 |
| 65+ Years | 32 (30.8%) | $30,417 |
| Total | 104 (100.0%) | $47,500 |
Poverty in Annex
Income Below Poverty by Sex and Age in Annex
With 12.1% poverty level for males and 22.6% for females among the residents of Annex, 15 year old males and 75 year old and over females are the most vulnerable to poverty, with 2 males (100.0%) and 7 females (77.8%) in their respective age groups living below the poverty level.
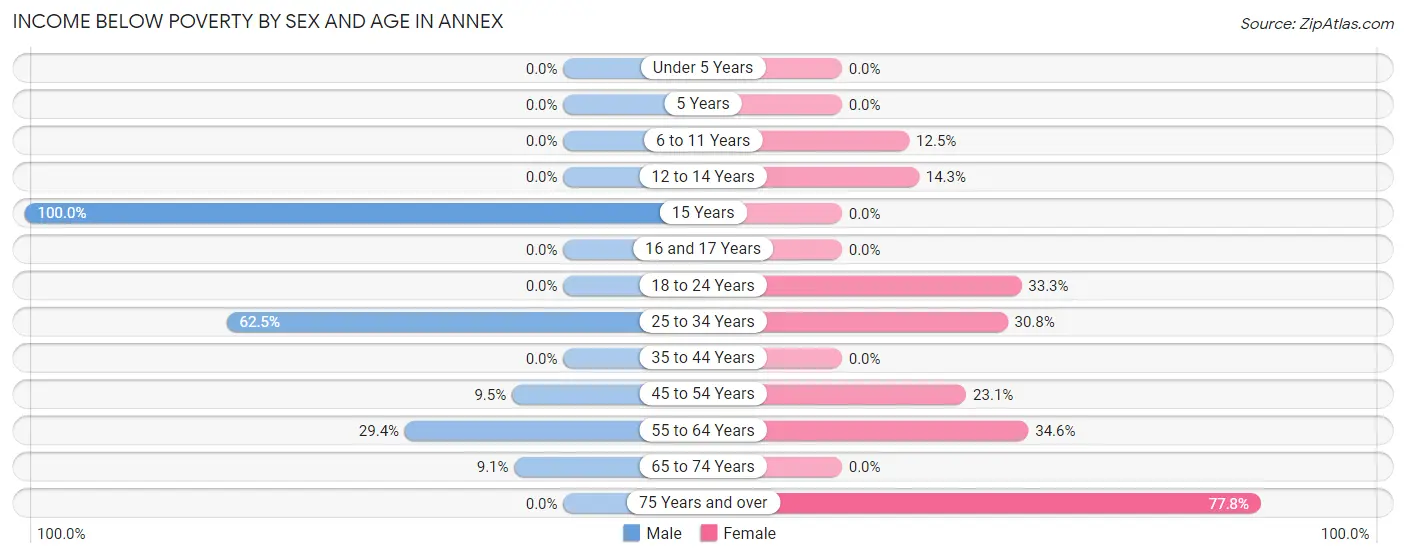
| Age Bracket | Male | Female |
| Under 5 Years | 0 (0.0%) | 0 (0.0%) |
| 5 Years | 0 (0.0%) | 0 (0.0%) |
| 6 to 11 Years | 0 (0.0%) | 2 (12.5%) |
| 12 to 14 Years | 0 (0.0%) | 1 (14.3%) |
| 15 Years | 2 (100.0%) | 0 (0.0%) |
| 16 and 17 Years | 0 (0.0%) | 0 (0.0%) |
| 18 to 24 Years | 0 (0.0%) | 5 (33.3%) |
| 25 to 34 Years | 5 (62.5%) | 8 (30.8%) |
| 35 to 44 Years | 0 (0.0%) | 0 (0.0%) |
| 45 to 54 Years | 2 (9.5%) | 6 (23.1%) |
| 55 to 64 Years | 10 (29.4%) | 9 (34.6%) |
| 65 to 74 Years | 1 (9.1%) | 0 (0.0%) |
| 75 Years and over | 0 (0.0%) | 7 (77.8%) |
| Total | 20 (12.1%) | 38 (22.6%) |
Income Above Poverty by Sex and Age in Annex
According to the poverty statistics in Annex, males aged under 5 years and females aged under 5 years are the age groups that are most secure financially, with 100.0% of males and 100.0% of females in these age groups living above the poverty line.
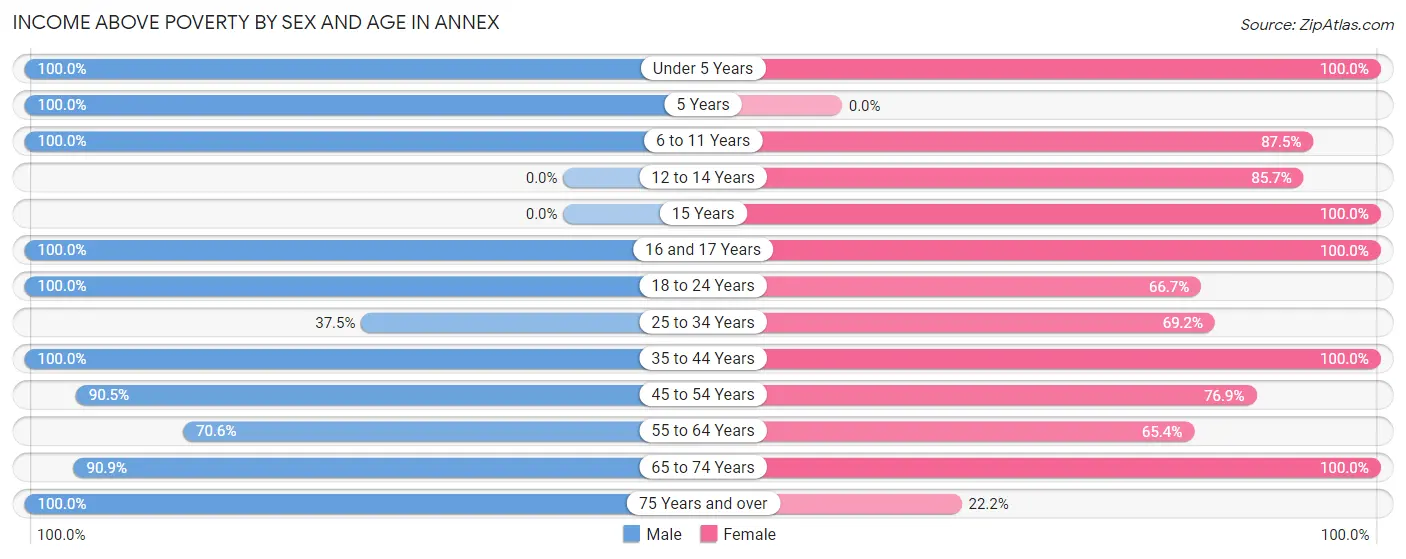
| Age Bracket | Male | Female |
| Under 5 Years | 3 (100.0%) | 4 (100.0%) |
| 5 Years | 4 (100.0%) | 0 (0.0%) |
| 6 to 11 Years | 14 (100.0%) | 14 (87.5%) |
| 12 to 14 Years | 0 (0.0%) | 6 (85.7%) |
| 15 Years | 0 (0.0%) | 3 (100.0%) |
| 16 and 17 Years | 8 (100.0%) | 5 (100.0%) |
| 18 to 24 Years | 47 (100.0%) | 10 (66.7%) |
| 25 to 34 Years | 3 (37.5%) | 18 (69.2%) |
| 35 to 44 Years | 7 (100.0%) | 15 (100.0%) |
| 45 to 54 Years | 19 (90.5%) | 20 (76.9%) |
| 55 to 64 Years | 24 (70.6%) | 17 (65.4%) |
| 65 to 74 Years | 10 (90.9%) | 16 (100.0%) |
| 75 Years and over | 6 (100.0%) | 2 (22.2%) |
| Total | 145 (87.9%) | 130 (77.4%) |
Income Below Poverty Among Married-Couple Families in Annex
The poverty statistics for married-couple families in Annex show that 8.3% or 3 of the total 36 families live below the poverty line. Families with 1 or 2 children have the highest poverty rate of 17.6%, comprising of 3 families. On the other hand, families with no children have the lowest poverty rate of 0.0%, which includes 0 families.
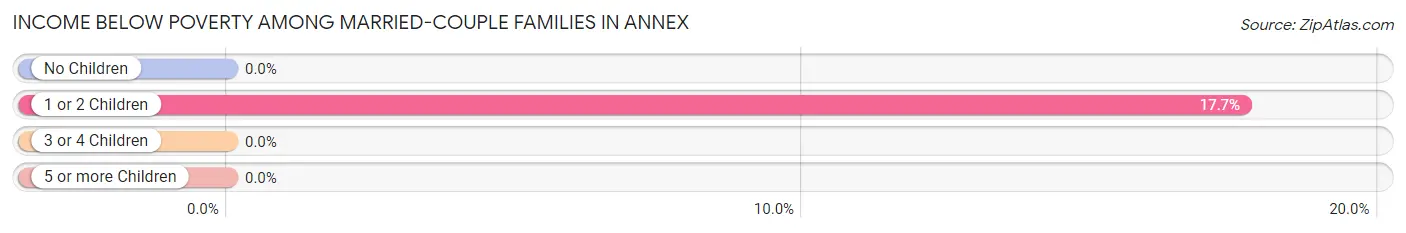
| Children | Above Poverty | Below Poverty |
| No Children | 15 (100.0%) | 0 (0.0%) |
| 1 or 2 Children | 14 (82.4%) | 3 (17.6%) |
| 3 or 4 Children | 4 (100.0%) | 0 (0.0%) |
| 5 or more Children | 0 (0.0%) | 0 (0.0%) |
| Total | 33 (91.7%) | 3 (8.3%) |
Income Below Poverty Among Single-Parent Households in Annex
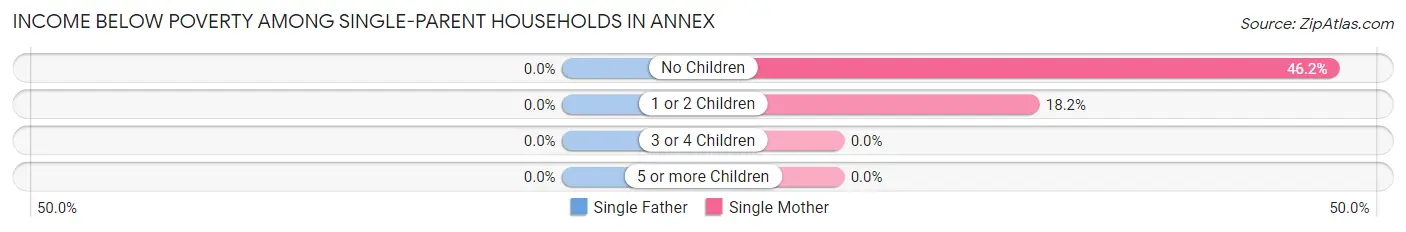
| Children | Single Father | Single Mother |
| No Children | 0 (0.0%) | 6 (46.2%) |
| 1 or 2 Children | 0 (0.0%) | 2 (18.2%) |
| 3 or 4 Children | 0 (0.0%) | 0 (0.0%) |
| 5 or more Children | 0 (0.0%) | 0 (0.0%) |
| Total | 0 (0.0%) | 8 (33.3%) |
Income Below Poverty Among Married-Couple vs Single-Parent Households in Annex
The poverty data for Annex shows that 3 of the married-couple family households (8.3%) and 8 of the single-parent households (23.5%) are living below the poverty level. Within the married-couple family households, those with 1 or 2 children have the highest poverty rate, with 3 households (17.6%) falling below the poverty line. Among the single-parent households, those with no children have the highest poverty rate, with 6 household (42.9%) living below poverty.
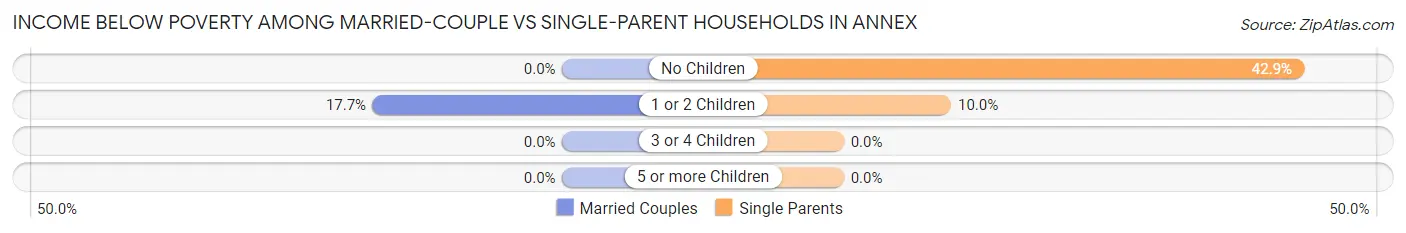
| Children | Married-Couple Families | Single-Parent Households |
| No Children | 0 (0.0%) | 6 (42.9%) |
| 1 or 2 Children | 3 (17.6%) | 2 (10.0%) |
| 3 or 4 Children | 0 (0.0%) | 0 (0.0%) |
| 5 or more Children | 0 (0.0%) | 0 (0.0%) |
| Total | 3 (8.3%) | 8 (23.5%) |
Race in Annex
The most populous races in Annex are White / Caucasian (286 | 85.9%), Hispanic or Latino (74 | 22.2%), and Some other Race (33 | 9.9%).
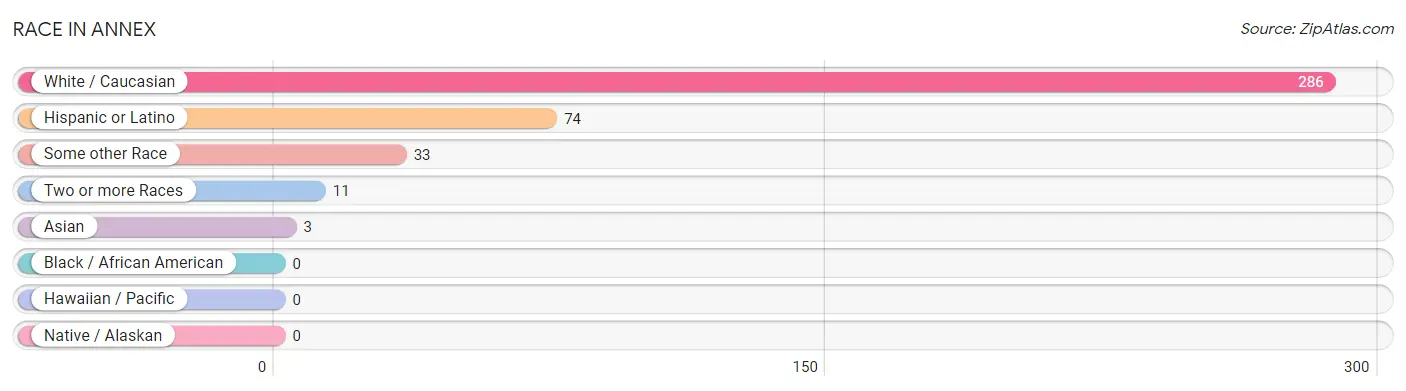
| Race | # Population | % Population |
| Asian | 3 | 0.9% |
| Black / African American | 0 | 0.0% |
| Hawaiian / Pacific | 0 | 0.0% |
| Hispanic or Latino | 74 | 22.2% |
| Native / Alaskan | 0 | 0.0% |
| White / Caucasian | 286 | 85.9% |
| Two or more Races | 11 | 3.3% |
| Some other Race | 33 | 9.9% |
| Total | 333 | 100.0% |
Ancestry in Annex
The most populous ancestries reported in Annex are Mexican (68 | 20.4%), English (61 | 18.3%), Scandinavian (39 | 11.7%), Irish (28 | 8.4%), and German (24 | 7.2%), together accounting for 66.1% of all Annex residents.
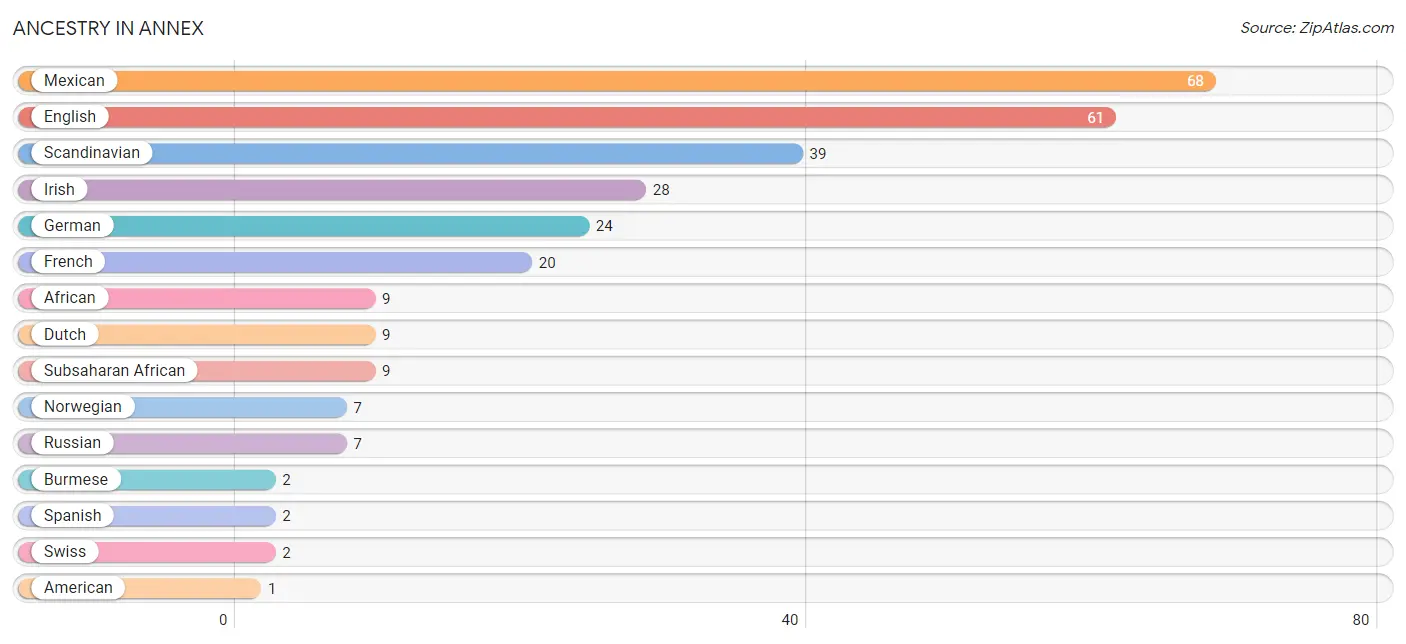
| Ancestry | # Population | % Population |
| African | 9 | 2.7% |
| American | 1 | 0.3% |
| Bhutanese | 1 | 0.3% |
| Burmese | 2 | 0.6% |
| Cherokee | 1 | 0.3% |
| Dutch | 9 | 2.7% |
| English | 61 | 18.3% |
| French | 20 | 6.0% |
| German | 24 | 7.2% |
| Irish | 28 | 8.4% |
| Mexican | 68 | 20.4% |
| Native Hawaiian | 1 | 0.3% |
| Norwegian | 7 | 2.1% |
| Polish | 1 | 0.3% |
| Russian | 7 | 2.1% |
| Scandinavian | 39 | 11.7% |
| Scottish | 1 | 0.3% |
| Spanish | 2 | 0.6% |
| Subsaharan African | 9 | 2.7% |
| Swedish | 1 | 0.3% |
| Swiss | 2 | 0.6% | View All 21 Rows |
Immigrants in Annex
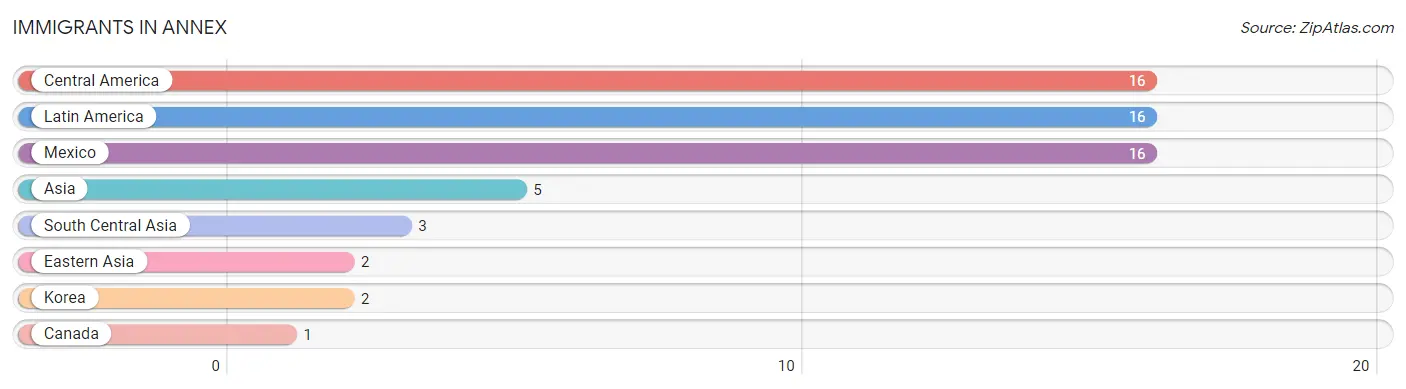
The most numerous immigrant groups reported in Annex came from Central America (16 | 4.8%), Latin America (16 | 4.8%), Mexico (16 | 4.8%), Asia (5 | 1.5%), and South Central Asia (3 | 0.9%), together accounting for 16.8% of all Annex residents.
| Immigration Origin | # Population | % Population |
| Asia | 5 | 1.5% |
| Canada | 1 | 0.3% |
| Central America | 16 | 4.8% |
| Eastern Asia | 2 | 0.6% |
| Korea | 2 | 0.6% |
| Latin America | 16 | 4.8% |
| Mexico | 16 | 4.8% |
| South Central Asia | 3 | 0.9% | View All 8 Rows |
Sex and Age in Annex
Sex and Age in Annex
The most populous age groups in Annex are 20 to 24 Years (47 | 28.5%) for men and 15 to 19 Years (17 | 10.1%) for women.
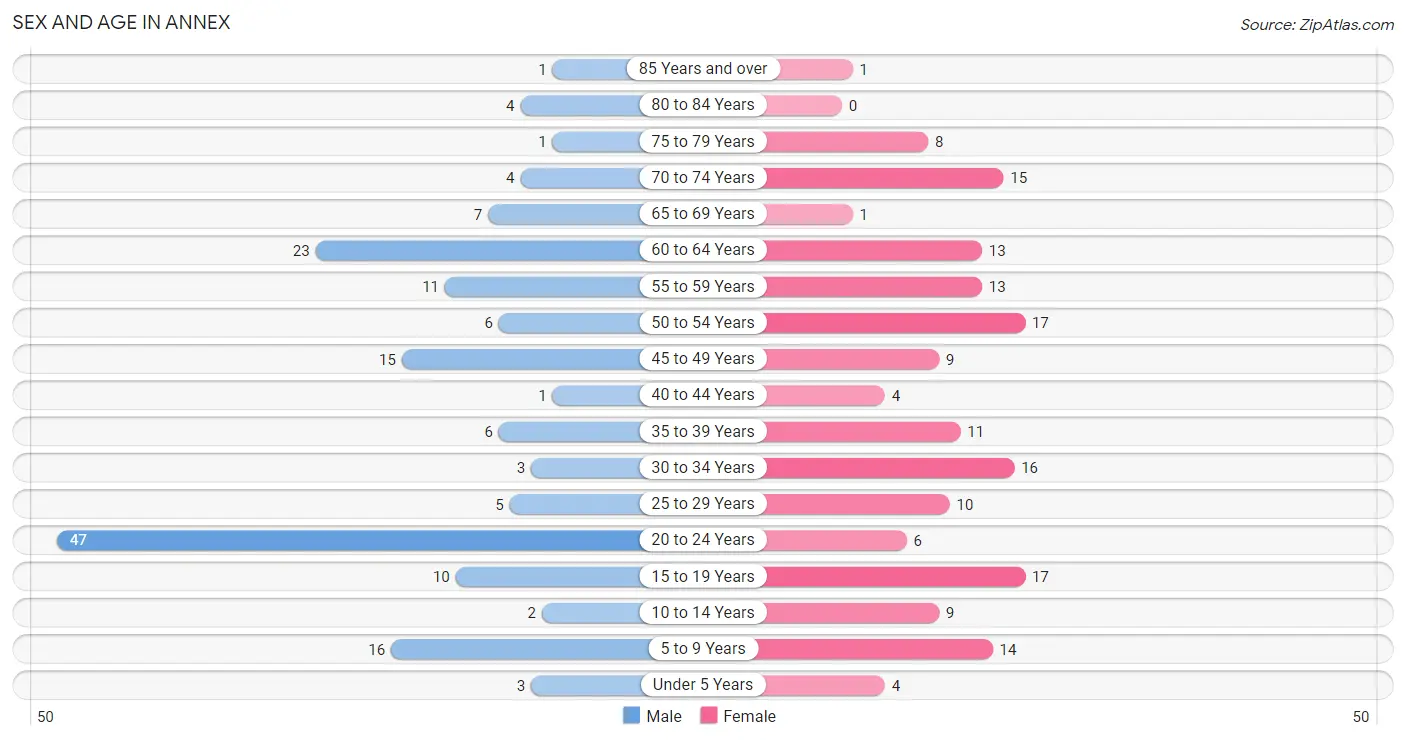
| Age Bracket | Male | Female |
| Under 5 Years | 3 (1.8%) | 4 (2.4%) |
| 5 to 9 Years | 16 (9.7%) | 14 (8.3%) |
| 10 to 14 Years | 2 (1.2%) | 9 (5.4%) |
| 15 to 19 Years | 10 (6.1%) | 17 (10.1%) |
| 20 to 24 Years | 47 (28.5%) | 6 (3.6%) |
| 25 to 29 Years | 5 (3.0%) | 10 (5.9%) |
| 30 to 34 Years | 3 (1.8%) | 16 (9.5%) |
| 35 to 39 Years | 6 (3.6%) | 11 (6.6%) |
| 40 to 44 Years | 1 (0.6%) | 4 (2.4%) |
| 45 to 49 Years | 15 (9.1%) | 9 (5.4%) |
| 50 to 54 Years | 6 (3.6%) | 17 (10.1%) |
| 55 to 59 Years | 11 (6.7%) | 13 (7.7%) |
| 60 to 64 Years | 23 (13.9%) | 13 (7.7%) |
| 65 to 69 Years | 7 (4.2%) | 1 (0.6%) |
| 70 to 74 Years | 4 (2.4%) | 15 (8.9%) |
| 75 to 79 Years | 1 (0.6%) | 8 (4.8%) |
| 80 to 84 Years | 4 (2.4%) | 0 (0.0%) |
| 85 Years and over | 1 (0.6%) | 1 (0.6%) |
| Total | 165 (100.0%) | 168 (100.0%) |
Families and Households in Annex
Median Family Size in Annex
The median family size in Annex is 3.64 persons per family, with married-couple families (36 | 51.4%) accounting for the largest median family size of 4.31 persons per family. On the other hand, single male/father families (10 | 14.3%) represent the smallest median family size with 1.80 persons per family.
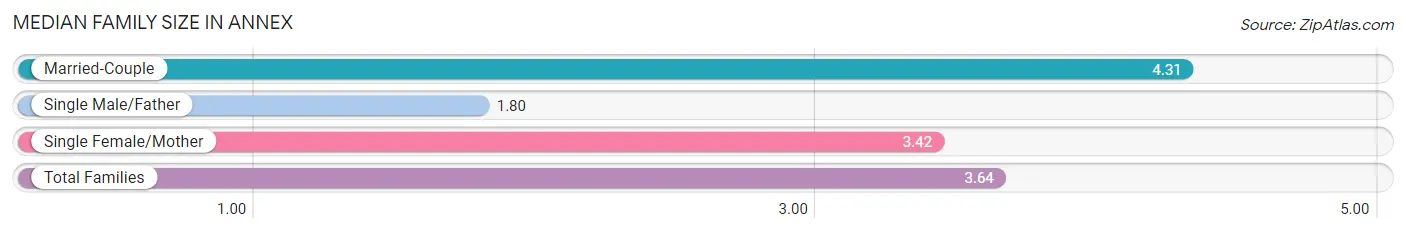
| Family Type | # Families | Family Size |
| Married-Couple | 36 (51.4%) | 4.31 |
| Single Male/Father | 10 (14.3%) | 1.80 |
| Single Female/Mother | 24 (34.3%) | 3.42 |
| Total Families | 70 (100.0%) | 3.64 |
Median Household Size in Annex
The median household size in Annex is 3.20 persons per household, with married-couple households (36 | 34.6%) accounting for the largest median household size of 4.64 persons per household. non-family households (34 | 32.7%) represent the smallest median household size with 1.65 persons per household.
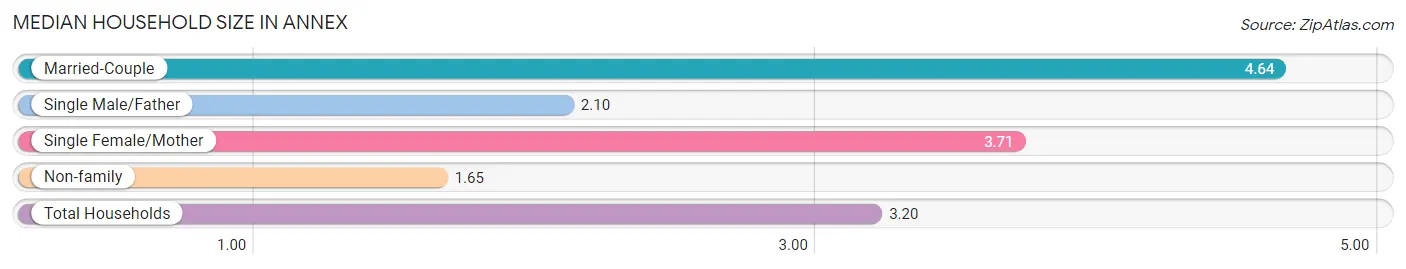
| Household Type | # Households | Household Size |
| Married-Couple | 36 (34.6%) | 4.64 |
| Single Male/Father | 10 (9.6%) | 2.10 |
| Single Female/Mother | 24 (23.1%) | 3.71 |
| Non-family | 34 (32.7%) | 1.65 |
| Total Households | 104 (100.0%) | 3.20 |
Household Size by Marriage Status in Annex
Out of a total of 104 households in Annex, 70 (67.3%) are family households, while 34 (32.7%) are nonfamily households. The most numerous type of family households are 3-person households, comprising 31, and the most common type of nonfamily households are 1-person households, comprising 17.
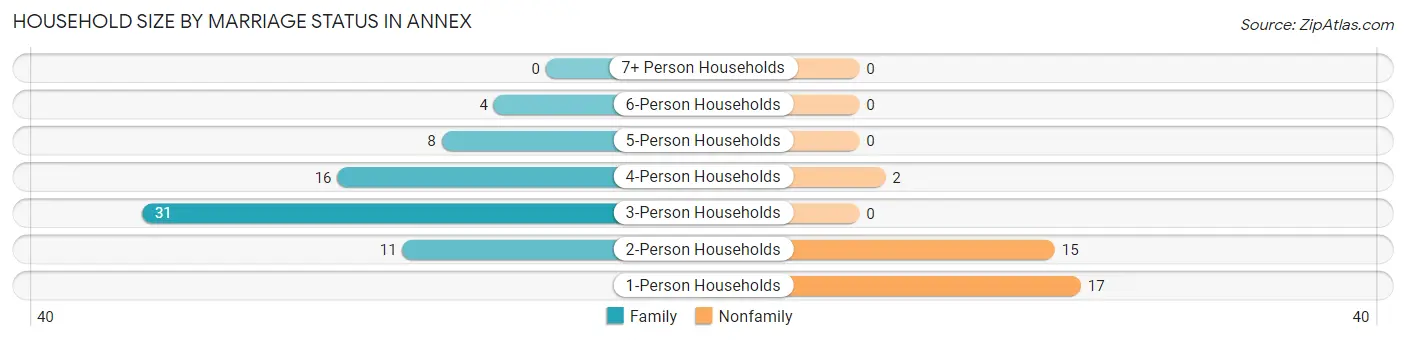
| Household Size | Family Households | Nonfamily Households |
| 1-Person Households | - | 17 (16.4%) |
| 2-Person Households | 11 (10.6%) | 15 (14.4%) |
| 3-Person Households | 31 (29.8%) | 0 (0.0%) |
| 4-Person Households | 16 (15.4%) | 2 (1.9%) |
| 5-Person Households | 8 (7.7%) | 0 (0.0%) |
| 6-Person Households | 4 (3.8%) | 0 (0.0%) |
| 7+ Person Households | 0 (0.0%) | 0 (0.0%) |
| Total | 70 (67.3%) | 34 (32.7%) |
Female Fertility in Annex
Fertility by Age in Annex
Average fertility rate in Annex is 55.0 births per 1,000 women. Women in the age bracket of 35 to 50 years have the highest fertility rate with 83.0 births per 1,000 women. Women in the age bracket of 20 to 34 years acount for 50.0% of all women with births.
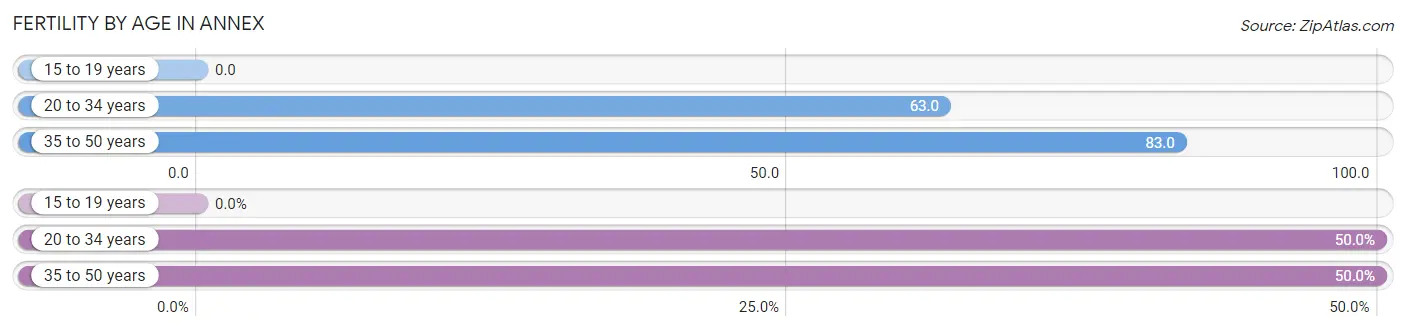
| Age Bracket | Women with Births | Births / 1,000 Women |
| 15 to 19 years | 0 (0.0%) | 0.0 |
| 20 to 34 years | 2 (50.0%) | 63.0 |
| 35 to 50 years | 2 (50.0%) | 83.0 |
| Total | 4 (100.0%) | 55.0 |
Fertility by Age by Marriage Status in Annex
50.0% of women with births (4) in Annex are married. The highest percentage of unmarried women with births falls into 20 to 34 years age bracket with 100.0% of them unmarried at the time of birth, while the lowest percentage of unmarried women with births belong to 35 to 50 years age bracket with 0.0% of them unmarried.
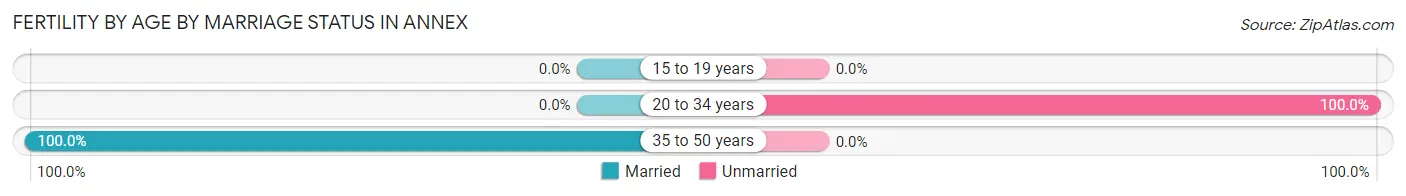
| Age Bracket | Married | Unmarried |
| 15 to 19 years | 0 (0.0%) | 0 (0.0%) |
| 20 to 34 years | 0 (0.0%) | 2 (100.0%) |
| 35 to 50 years | 2 (100.0%) | 0 (0.0%) |
| Total | 2 (50.0%) | 2 (50.0%) |
Fertility by Education in Annex
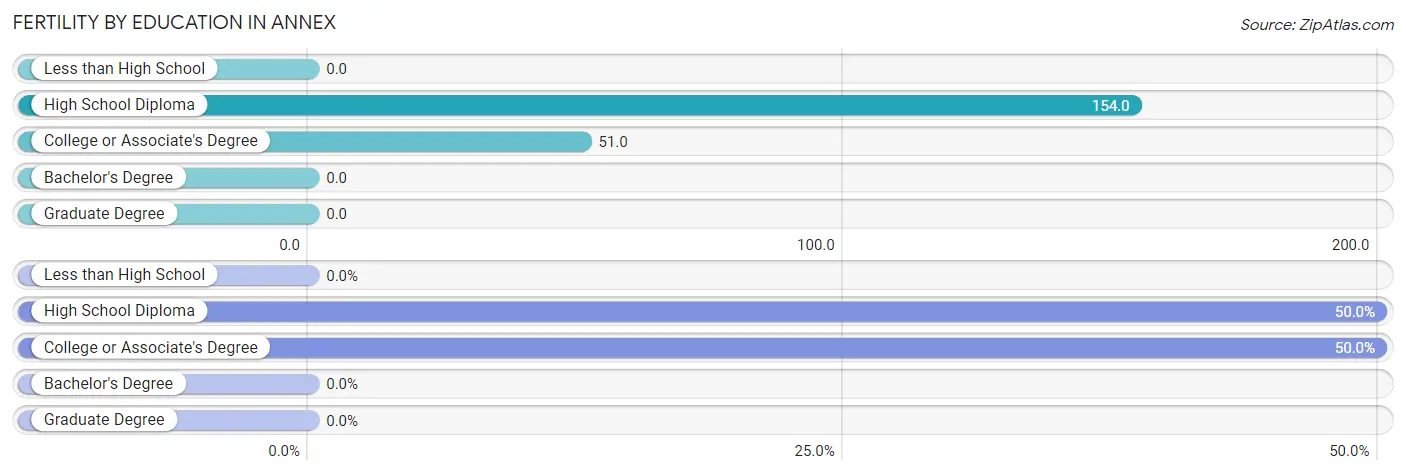
| Educational Attainment | Women with Births | Births / 1,000 Women |
| Less than High School | 0 (0.0%) | 0.0 |
| High School Diploma | 2 (50.0%) | 154.0 |
| College or Associate's Degree | 2 (50.0%) | 51.0 |
| Bachelor's Degree | 0 (0.0%) | 0.0 |
| Graduate Degree | 0 (0.0%) | 0.0 |
| Total | 4 (100.0%) | 55.0 |
Fertility by Education by Marriage Status in Annex
50.0% of women with births in Annex are unmarried. Women with the educational attainment of high school diploma are most likely to be married with 100.0% of them married at childbirth, while women with the educational attainment of college or associate's degree are least likely to be married with 100.0% of them unmarried at childbirth.
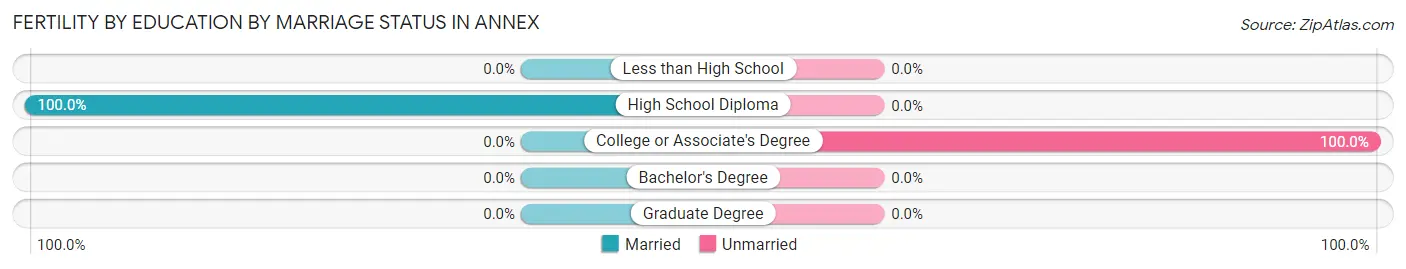
| Educational Attainment | Married | Unmarried |
| Less than High School | 0 (0.0%) | 0 (0.0%) |
| High School Diploma | 2 (100.0%) | 0 (0.0%) |
| College or Associate's Degree | 0 (0.0%) | 2 (100.0%) |
| Bachelor's Degree | 0 (0.0%) | 0 (0.0%) |
| Graduate Degree | 0 (0.0%) | 0 (0.0%) |
| Total | 2 (50.0%) | 2 (50.0%) |
Employment Characteristics in Annex
Employment by Class of Employer in Annex
Among the 164 employed individuals in Annex, private company employees (125 | 76.2%), not-for-profit organizations (14 | 8.5%), and state government employees (12 | 7.3%) make up the most common classes of employment.
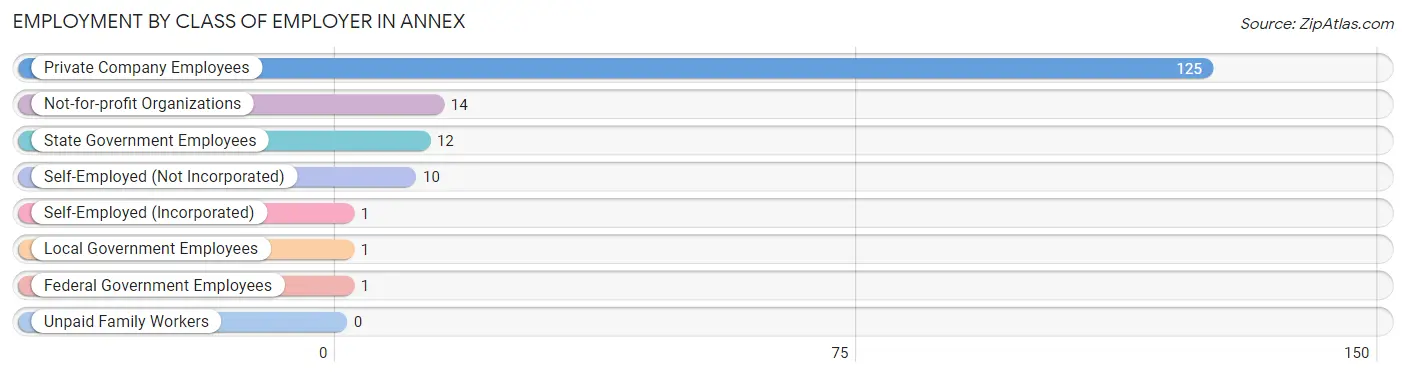
| Employer Class | # Employees | % Employees |
| Private Company Employees | 125 | 76.2% |
| Self-Employed (Incorporated) | 1 | 0.6% |
| Self-Employed (Not Incorporated) | 10 | 6.1% |
| Not-for-profit Organizations | 14 | 8.5% |
| Local Government Employees | 1 | 0.6% |
| State Government Employees | 12 | 7.3% |
| Federal Government Employees | 1 | 0.6% |
| Unpaid Family Workers | 0 | 0.0% |
| Total | 164 | 100.0% |
Employment Status by Age in Annex
According to the labor force statistics for Annex, out of the total population over 16 years of age (280), 61.1% or 171 individuals are in the labor force, with 1.2% or 2 of them unemployed. The age group with the highest labor force participation rate is 20 to 24 years, with 100.0% or 53 individuals in the labor force. Within the labor force, the 35 to 44 years age range has the highest percentage of unemployed individuals, with 9.5% or 2 of them being unemployed.
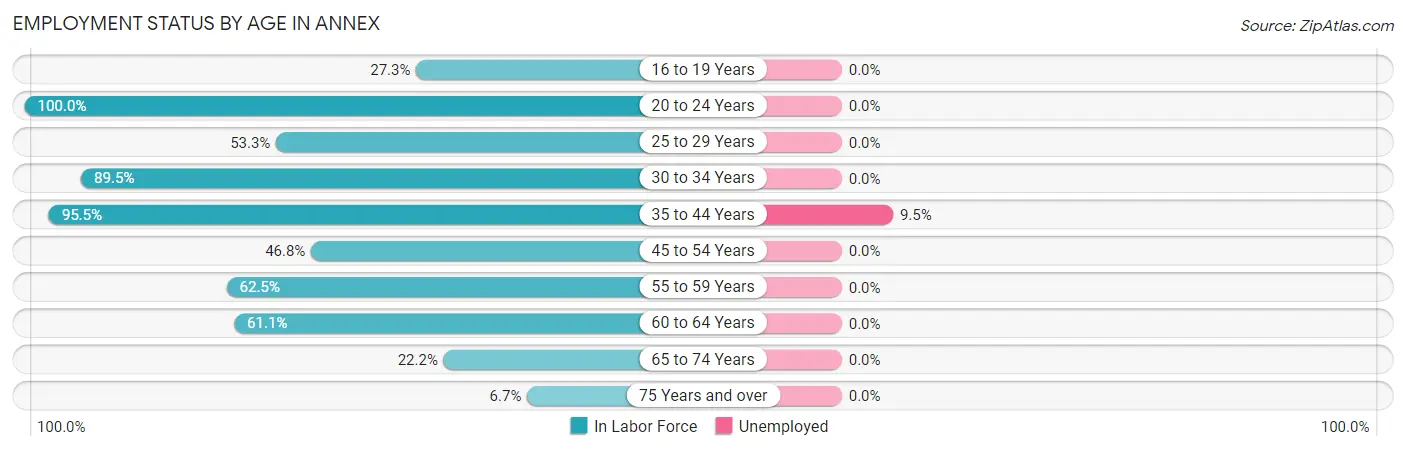
| Age Bracket | In Labor Force | Unemployed |
| 16 to 19 Years | 6 (27.3%) | 0 (0.0%) |
| 20 to 24 Years | 53 (100.0%) | 0 (0.0%) |
| 25 to 29 Years | 8 (53.3%) | 0 (0.0%) |
| 30 to 34 Years | 17 (89.5%) | 0 (0.0%) |
| 35 to 44 Years | 21 (95.5%) | 2 (9.5%) |
| 45 to 54 Years | 22 (46.8%) | 0 (0.0%) |
| 55 to 59 Years | 15 (62.5%) | 0 (0.0%) |
| 60 to 64 Years | 22 (61.1%) | 0 (0.0%) |
| 65 to 74 Years | 6 (22.2%) | 0 (0.0%) |
| 75 Years and over | 1 (6.7%) | 0 (0.0%) |
| Total | 171 (61.1%) | 2 (1.2%) |
Employment Status by Educational Attainment in Annex
According to labor force statistics for Annex, 64.4% of individuals (105) out of the total population between 25 and 64 years of age (163) are in the labor force, with 1.9% or 2 of them being unemployed. The group with the highest labor force participation rate are those with the educational attainment of college / associate degree, with 92.1% or 58 individuals in the labor force. Within the labor force, individuals with college / associate degree education have the highest percentage of unemployment, with 3.4% or 2 of them being unemployed.
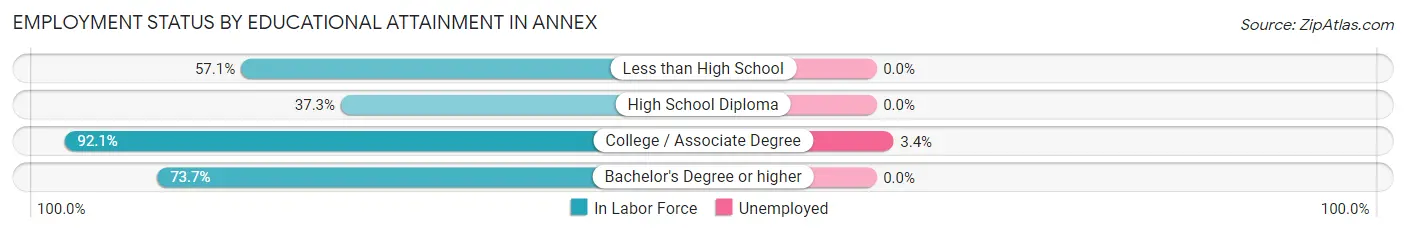
| Educational Attainment | In Labor Force | Unemployed |
| Less than High School | 8 (57.1%) | 0 (0.0%) |
| High School Diploma | 25 (37.3%) | 0 (0.0%) |
| College / Associate Degree | 58 (92.1%) | 2 (3.4%) |
| Bachelor's Degree or higher | 14 (73.7%) | 0 (0.0%) |
| Total | 105 (64.4%) | 3 (1.9%) |
Employment Occupations by Sex in Annex
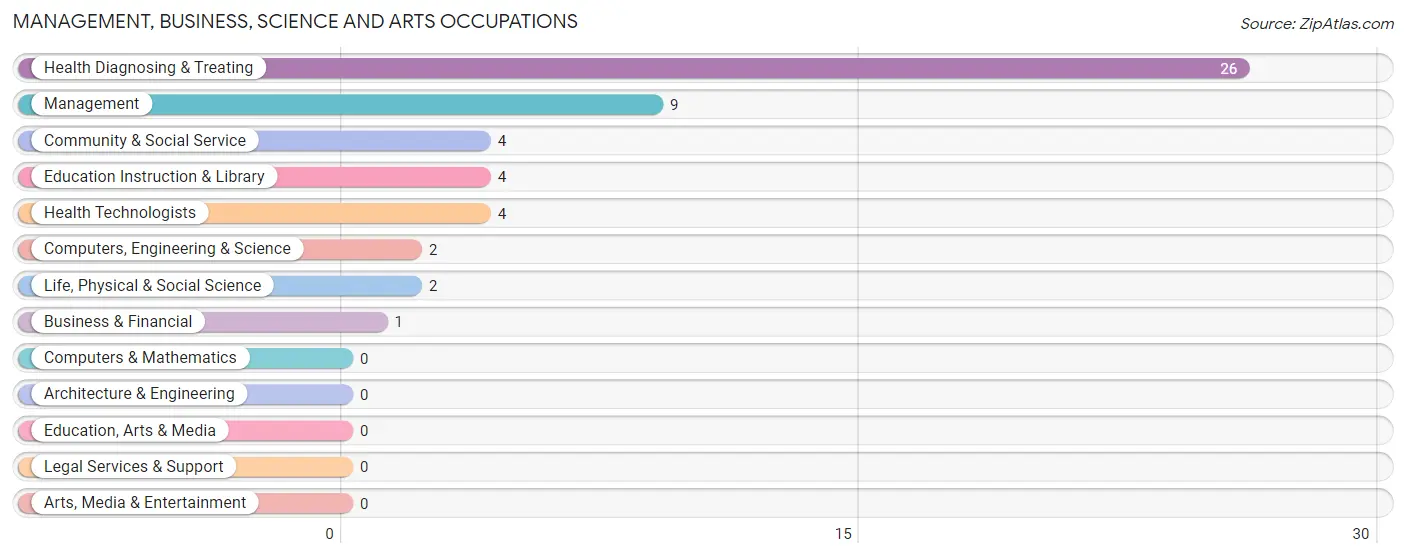
Management, Business, Science and Arts Occupations
The most common Management, Business, Science and Arts occupations in Annex are Health Diagnosing & Treating (26 | 15.4%), Management (9 | 5.3%), Community & Social Service (4 | 2.4%), Education Instruction & Library (4 | 2.4%), and Health Technologists (4 | 2.4%).
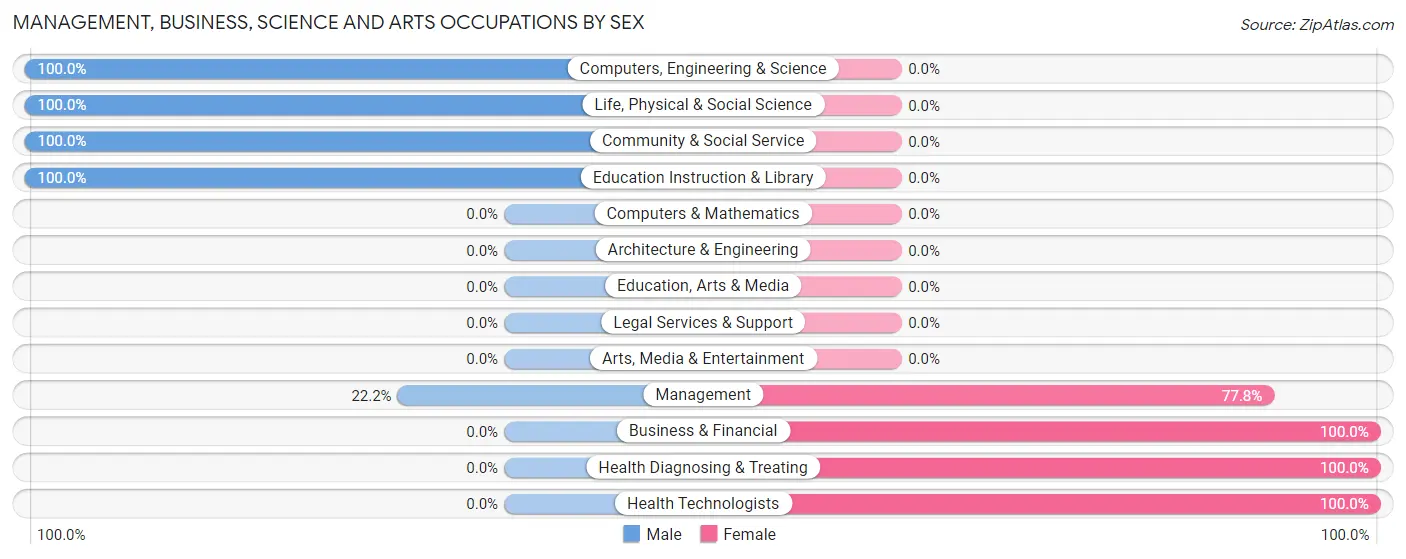
Management, Business, Science and Arts Occupations by Sex
Within the Management, Business, Science and Arts occupations in Annex, the most male-oriented occupations are Computers, Engineering & Science (100.0%), Life, Physical & Social Science (100.0%), and Community & Social Service (100.0%), while the most female-oriented occupations are Business & Financial (100.0%), Health Diagnosing & Treating (100.0%), and Health Technologists (100.0%).
| Occupation | Male | Female |
| Management | 2 (22.2%) | 7 (77.8%) |
| Business & Financial | 0 (0.0%) | 1 (100.0%) |
| Computers, Engineering & Science | 2 (100.0%) | 0 (0.0%) |
| Computers & Mathematics | 0 (0.0%) | 0 (0.0%) |
| Architecture & Engineering | 0 (0.0%) | 0 (0.0%) |
| Life, Physical & Social Science | 2 (100.0%) | 0 (0.0%) |
| Community & Social Service | 4 (100.0%) | 0 (0.0%) |
| Education, Arts & Media | 0 (0.0%) | 0 (0.0%) |
| Legal Services & Support | 0 (0.0%) | 0 (0.0%) |
| Education Instruction & Library | 4 (100.0%) | 0 (0.0%) |
| Arts, Media & Entertainment | 0 (0.0%) | 0 (0.0%) |
| Health Diagnosing & Treating | 0 (0.0%) | 26 (100.0%) |
| Health Technologists | 0 (0.0%) | 4 (100.0%) |
| Total (Category) | 8 (19.1%) | 34 (80.9%) |
| Total (Overall) | 105 (62.1%) | 64 (37.9%) |
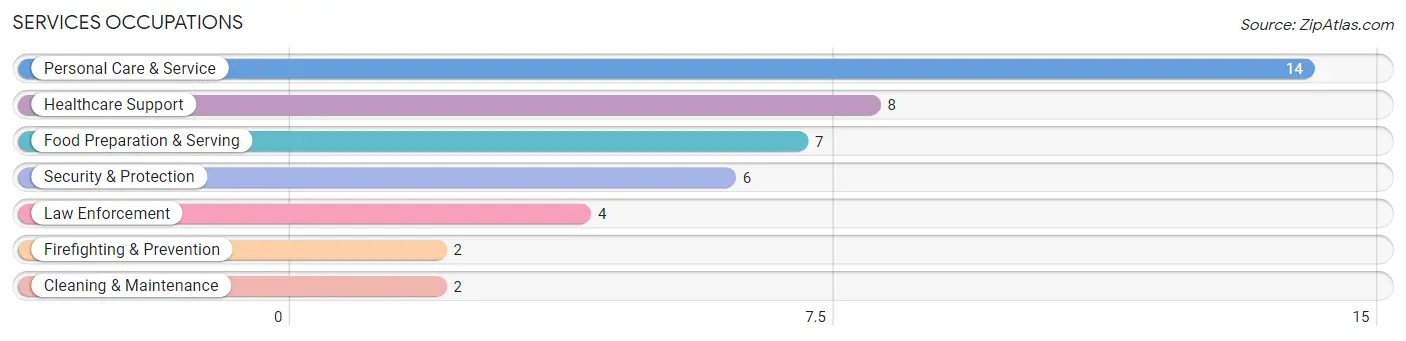
Services Occupations
The most common Services occupations in Annex are Personal Care & Service (14 | 8.3%), Healthcare Support (8 | 4.7%), Food Preparation & Serving (7 | 4.1%), Security & Protection (6 | 3.5%), and Law Enforcement (4 | 2.4%).
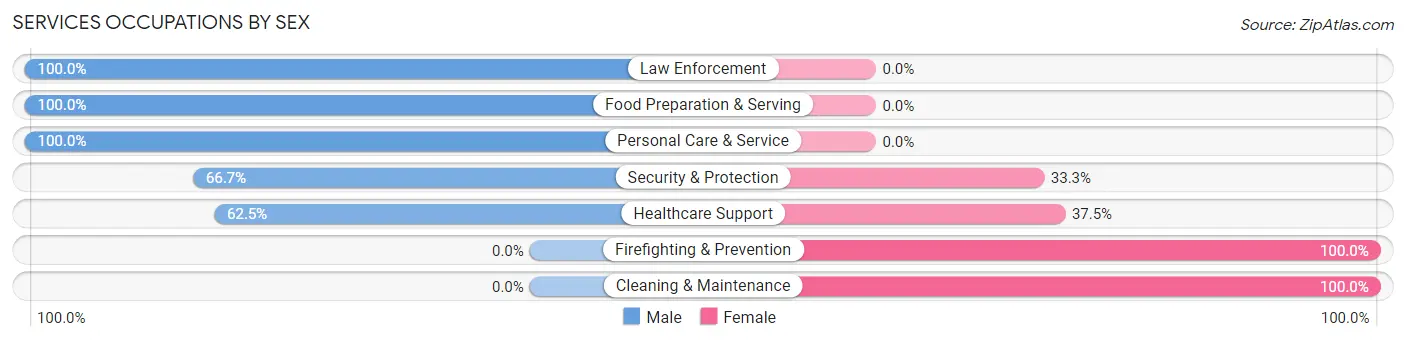
Services Occupations by Sex
Within the Services occupations in Annex, the most male-oriented occupations are Law Enforcement (100.0%), Food Preparation & Serving (100.0%), and Personal Care & Service (100.0%), while the most female-oriented occupations are Firefighting & Prevention (100.0%), Cleaning & Maintenance (100.0%), and Healthcare Support (37.5%).
| Occupation | Male | Female |
| Healthcare Support | 5 (62.5%) | 3 (37.5%) |
| Security & Protection | 4 (66.7%) | 2 (33.3%) |
| Firefighting & Prevention | 0 (0.0%) | 2 (100.0%) |
| Law Enforcement | 4 (100.0%) | 0 (0.0%) |
| Food Preparation & Serving | 7 (100.0%) | 0 (0.0%) |
| Cleaning & Maintenance | 0 (0.0%) | 2 (100.0%) |
| Personal Care & Service | 14 (100.0%) | 0 (0.0%) |
| Total (Category) | 30 (81.1%) | 7 (18.9%) |
| Total (Overall) | 105 (62.1%) | 64 (37.9%) |
Sales and Office Occupations
The most common Sales and Office occupations in Annex are Office & Administration (13 | 7.7%), and Sales & Related (11 | 6.5%).
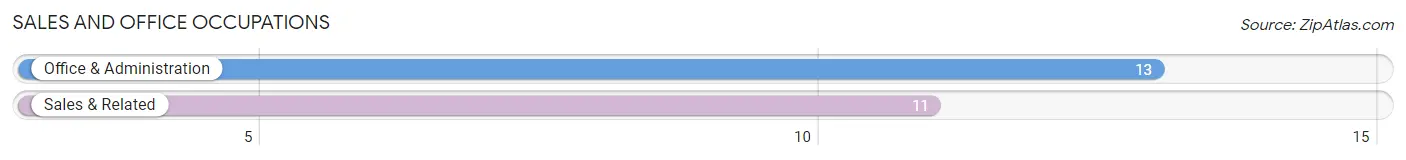
Sales and Office Occupations by Sex
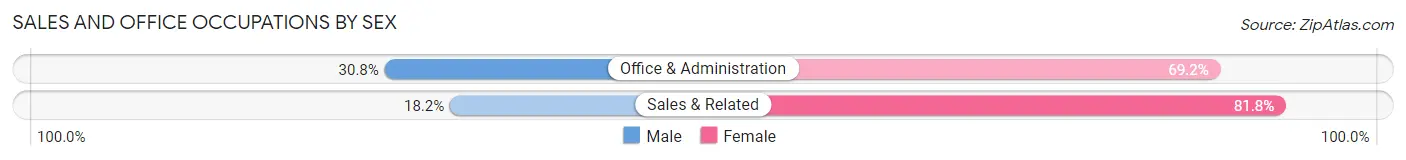
| Occupation | Male | Female |
| Sales & Related | 2 (18.2%) | 9 (81.8%) |
| Office & Administration | 4 (30.8%) | 9 (69.2%) |
| Total (Category) | 6 (25.0%) | 18 (75.0%) |
| Total (Overall) | 105 (62.1%) | 64 (37.9%) |
Natural Resources, Construction and Maintenance Occupations
The most common Natural Resources, Construction and Maintenance occupations in Annex are Installation, Maintenance & Repair (29 | 17.2%), Construction & Extraction (13 | 7.7%), and Farming, Fishing & Forestry (6 | 3.5%).
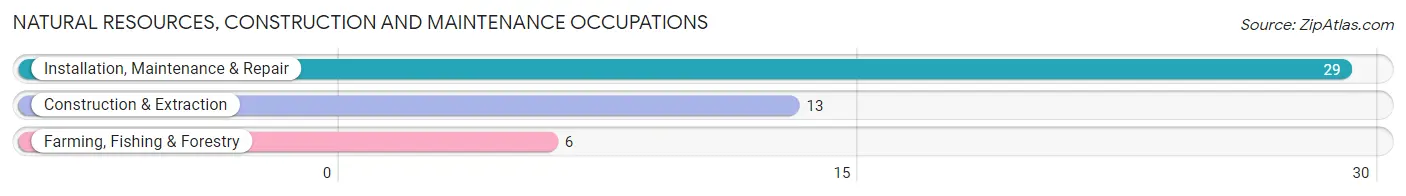
Natural Resources, Construction and Maintenance Occupations by Sex
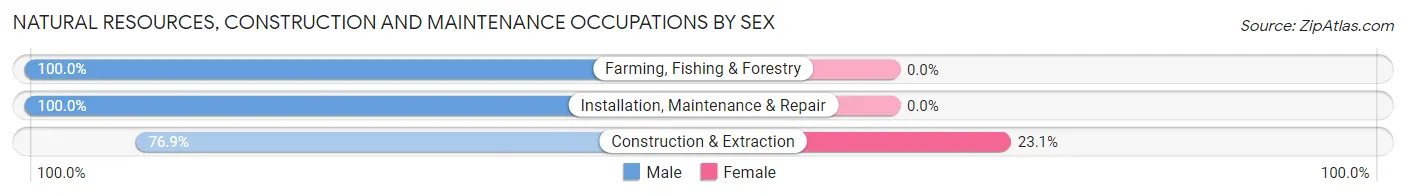
| Occupation | Male | Female |
| Farming, Fishing & Forestry | 6 (100.0%) | 0 (0.0%) |
| Construction & Extraction | 10 (76.9%) | 3 (23.1%) |
| Installation, Maintenance & Repair | 29 (100.0%) | 0 (0.0%) |
| Total (Category) | 45 (93.8%) | 3 (6.2%) |
| Total (Overall) | 105 (62.1%) | 64 (37.9%) |
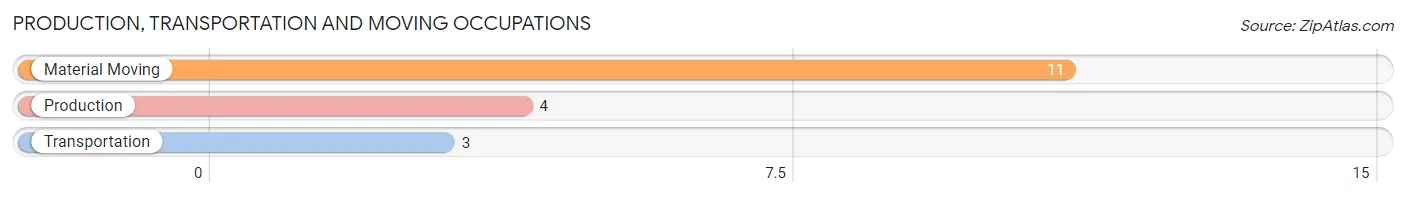
Production, Transportation and Moving Occupations
The most common Production, Transportation and Moving occupations in Annex are Material Moving (11 | 6.5%), Production (4 | 2.4%), and Transportation (3 | 1.8%).
Production, Transportation and Moving Occupations by Sex
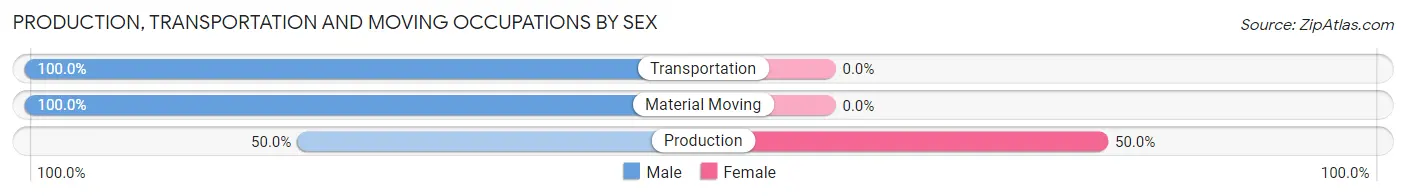
| Occupation | Male | Female |
| Production | 2 (50.0%) | 2 (50.0%) |
| Transportation | 3 (100.0%) | 0 (0.0%) |
| Material Moving | 11 (100.0%) | 0 (0.0%) |
| Total (Category) | 16 (88.9%) | 2 (11.1%) |
| Total (Overall) | 105 (62.1%) | 64 (37.9%) |
Employment Industries by Sex in Annex
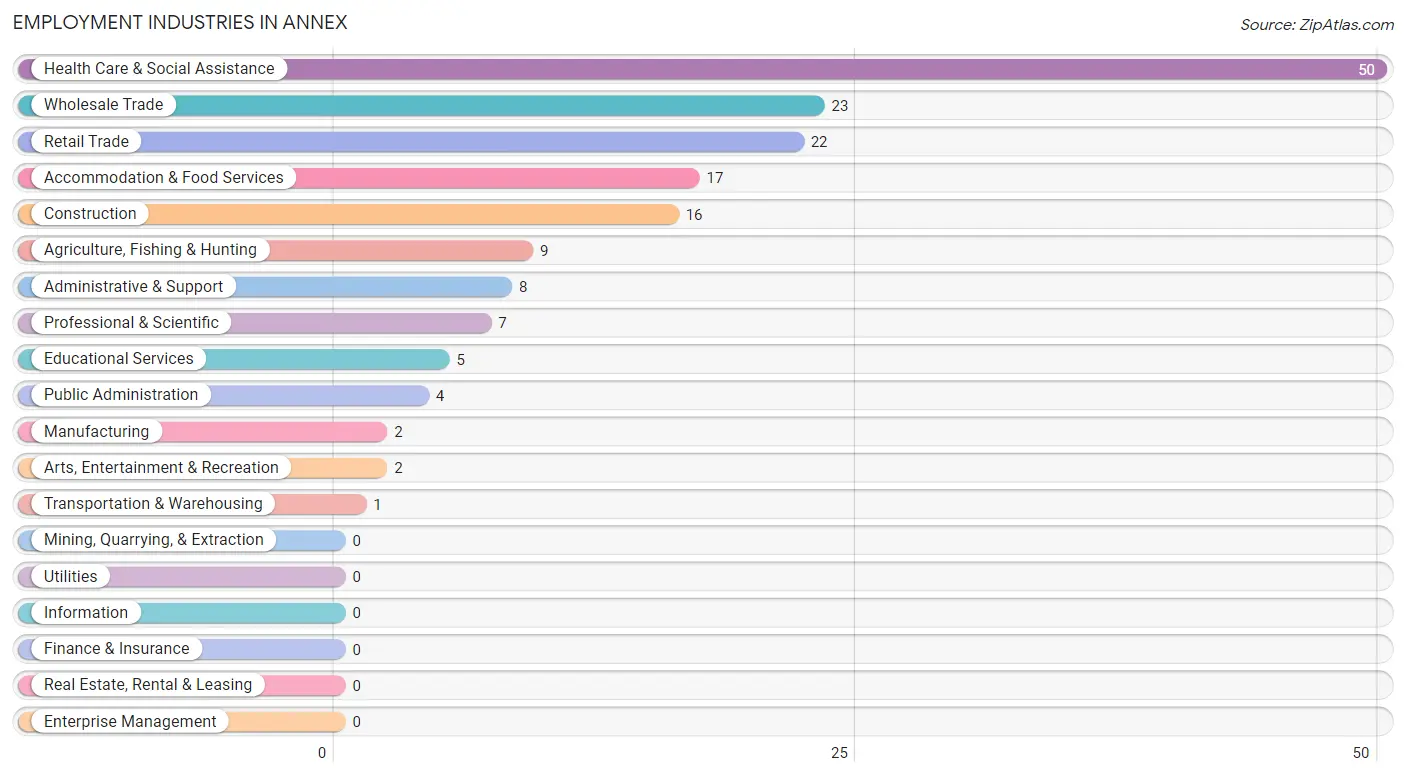
Employment Industries in Annex
The major employment industries in Annex include Health Care & Social Assistance (50 | 29.6%), Wholesale Trade (23 | 13.6%), Retail Trade (22 | 13.0%), Accommodation & Food Services (17 | 10.1%), and Construction (16 | 9.5%).
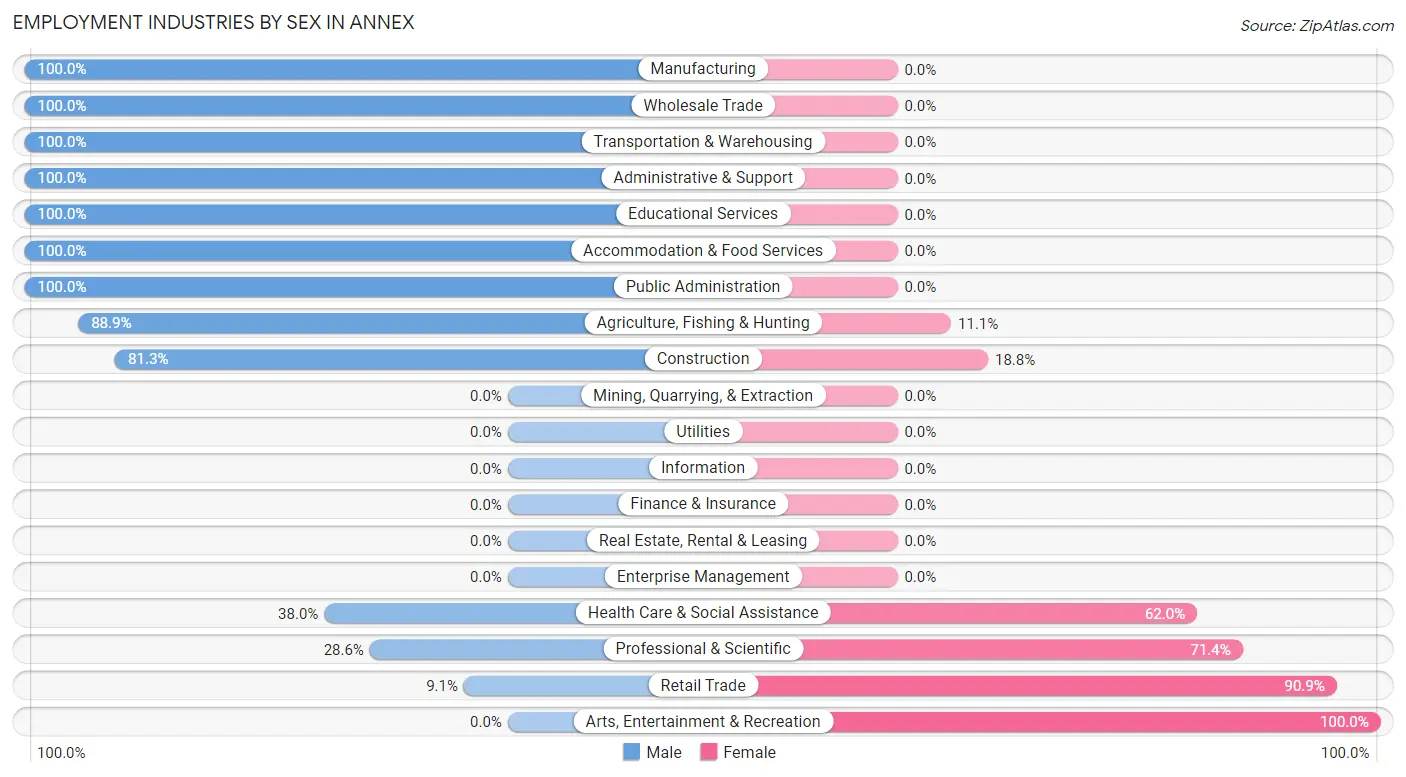
Employment Industries by Sex in Annex
The Annex industries that see more men than women are Manufacturing (100.0%), Wholesale Trade (100.0%), and Transportation & Warehousing (100.0%), whereas the industries that tend to have a higher number of women are Arts, Entertainment & Recreation (100.0%), Retail Trade (90.9%), and Professional & Scientific (71.4%).
| Industry | Male | Female |
| Agriculture, Fishing & Hunting | 8 (88.9%) | 1 (11.1%) |
| Mining, Quarrying, & Extraction | 0 (0.0%) | 0 (0.0%) |
| Construction | 13 (81.2%) | 3 (18.8%) |
| Manufacturing | 2 (100.0%) | 0 (0.0%) |
| Wholesale Trade | 23 (100.0%) | 0 (0.0%) |
| Retail Trade | 2 (9.1%) | 20 (90.9%) |
| Transportation & Warehousing | 1 (100.0%) | 0 (0.0%) |
| Utilities | 0 (0.0%) | 0 (0.0%) |
| Information | 0 (0.0%) | 0 (0.0%) |
| Finance & Insurance | 0 (0.0%) | 0 (0.0%) |
| Real Estate, Rental & Leasing | 0 (0.0%) | 0 (0.0%) |
| Professional & Scientific | 2 (28.6%) | 5 (71.4%) |
| Enterprise Management | 0 (0.0%) | 0 (0.0%) |
| Administrative & Support | 8 (100.0%) | 0 (0.0%) |
| Educational Services | 5 (100.0%) | 0 (0.0%) |
| Health Care & Social Assistance | 19 (38.0%) | 31 (62.0%) |
| Arts, Entertainment & Recreation | 0 (0.0%) | 2 (100.0%) |
| Accommodation & Food Services | 17 (100.0%) | 0 (0.0%) |
| Public Administration | 4 (100.0%) | 0 (0.0%) |
| Total | 105 (62.1%) | 64 (37.9%) |
Education in Annex
School Enrollment in Annex
The most common levels of schooling among the 69 students in Annex are elementary school (26 | 37.7%), high school (19 | 27.5%), and college / undergraduate (14 | 20.3%).
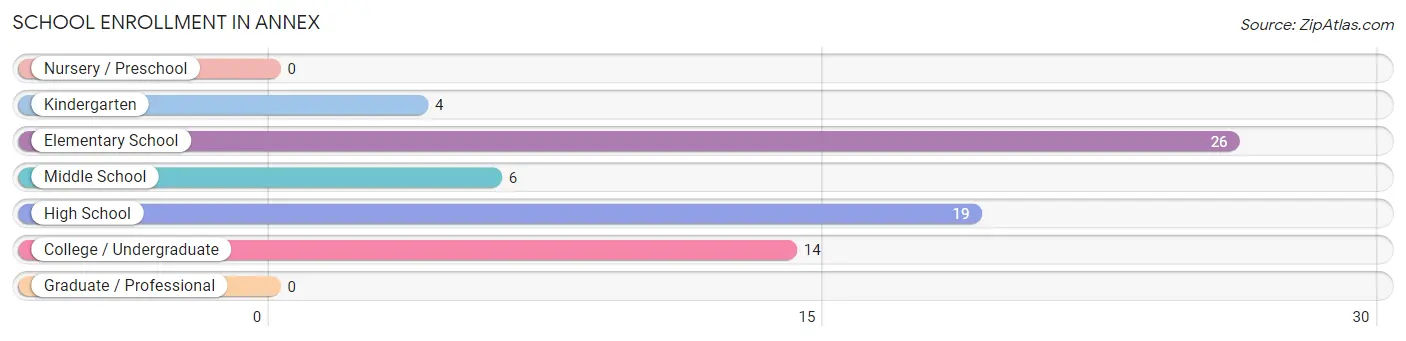
| School Level | # Students | % Students |
| Nursery / Preschool | 0 | 0.0% |
| Kindergarten | 4 | 5.8% |
| Elementary School | 26 | 37.7% |
| Middle School | 6 | 8.7% |
| High School | 19 | 27.5% |
| College / Undergraduate | 14 | 20.3% |
| Graduate / Professional | 0 | 0.0% |
| Total | 69 | 100.0% |
School Enrollment by Age by Funding Source in Annex
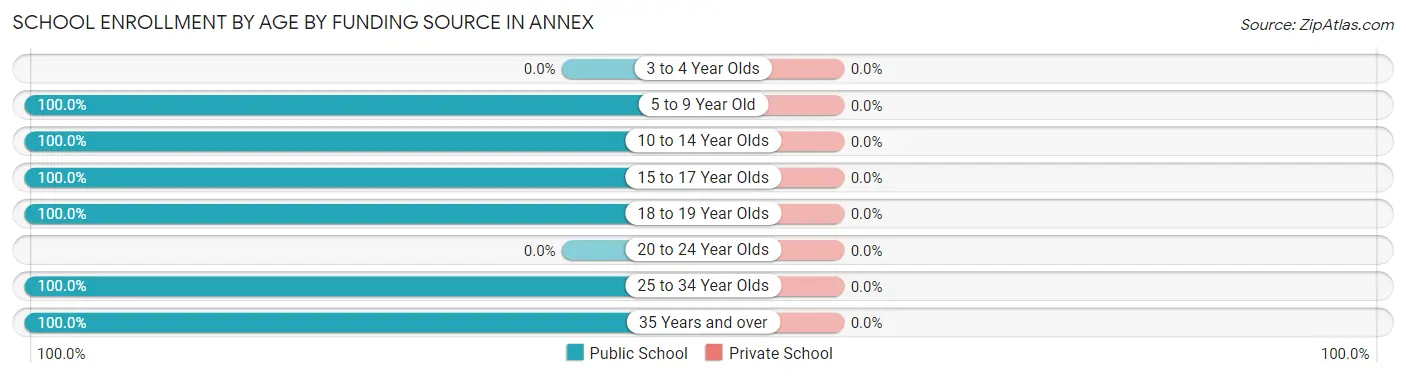
| Age Bracket | Public School | Private School |
| 3 to 4 Year Olds | 0 (0.0%) | 0 (0.0%) |
| 5 to 9 Year Old | 26 (100.0%) | 0 (0.0%) |
| 10 to 14 Year Olds | 11 (100.0%) | 0 (0.0%) |
| 15 to 17 Year Olds | 18 (100.0%) | 0 (0.0%) |
| 18 to 19 Year Olds | 9 (100.0%) | 0 (0.0%) |
| 20 to 24 Year Olds | 0 (0.0%) | 0 (0.0%) |
| 25 to 34 Year Olds | 3 (100.0%) | 0 (0.0%) |
| 35 Years and over | 2 (100.0%) | 0 (0.0%) |
| Total | 69 (100.0%) | 0 (0.0%) |
Educational Attainment by Field of Study in Annex
Psychology (5 | 26.3%), business (5 | 26.3%), liberal arts & history (5 | 26.3%), engineering (2 | 10.5%), and arts & humanities (2 | 10.5%) are the most common fields of study among 19 individuals in Annex who have obtained a bachelor's degree or higher.
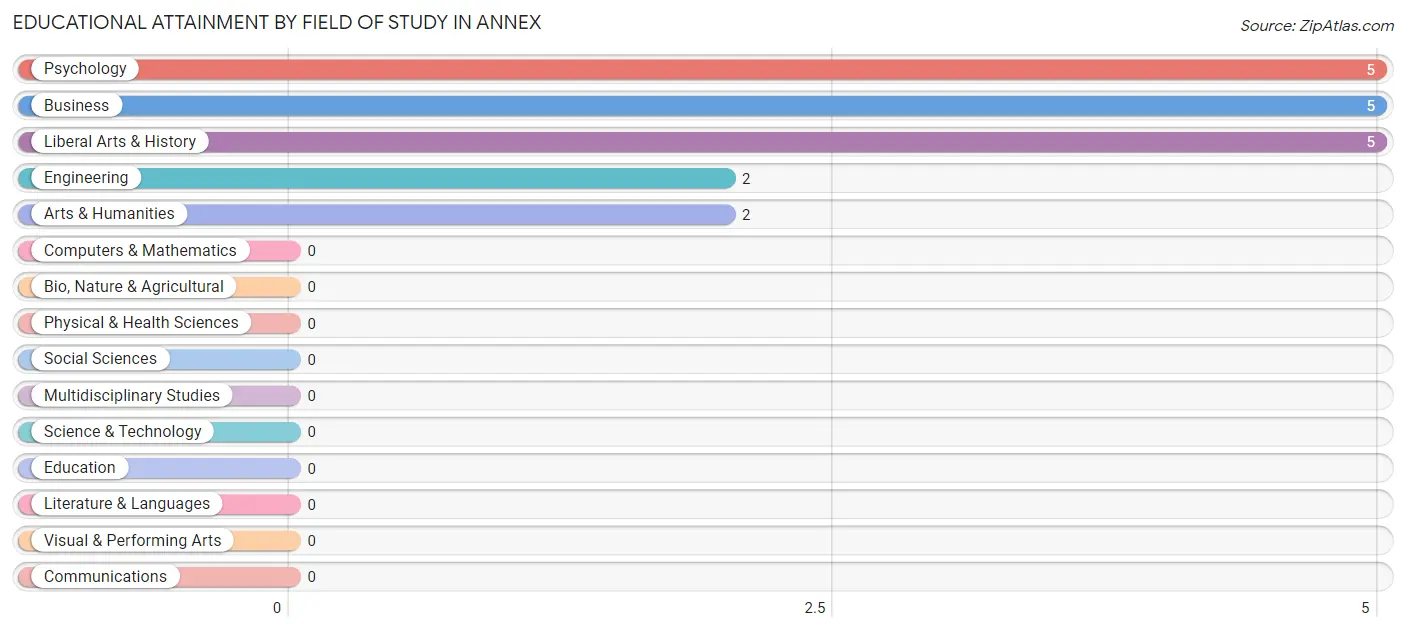
| Field of Study | # Graduates | % Graduates |
| Computers & Mathematics | 0 | 0.0% |
| Bio, Nature & Agricultural | 0 | 0.0% |
| Physical & Health Sciences | 0 | 0.0% |
| Psychology | 5 | 26.3% |
| Social Sciences | 0 | 0.0% |
| Engineering | 2 | 10.5% |
| Multidisciplinary Studies | 0 | 0.0% |
| Science & Technology | 0 | 0.0% |
| Business | 5 | 26.3% |
| Education | 0 | 0.0% |
| Literature & Languages | 0 | 0.0% |
| Liberal Arts & History | 5 | 26.3% |
| Visual & Performing Arts | 0 | 0.0% |
| Communications | 0 | 0.0% |
| Arts & Humanities | 2 | 10.5% |
| Total | 19 | 100.0% |
Transportation & Commute in Annex
Vehicle Availability by Sex in Annex
The most prevalent vehicle ownership categories in Annex are males with 1 vehicle (39, accounting for 39.0%) and females with 1 vehicle (23, making up 60.9%).
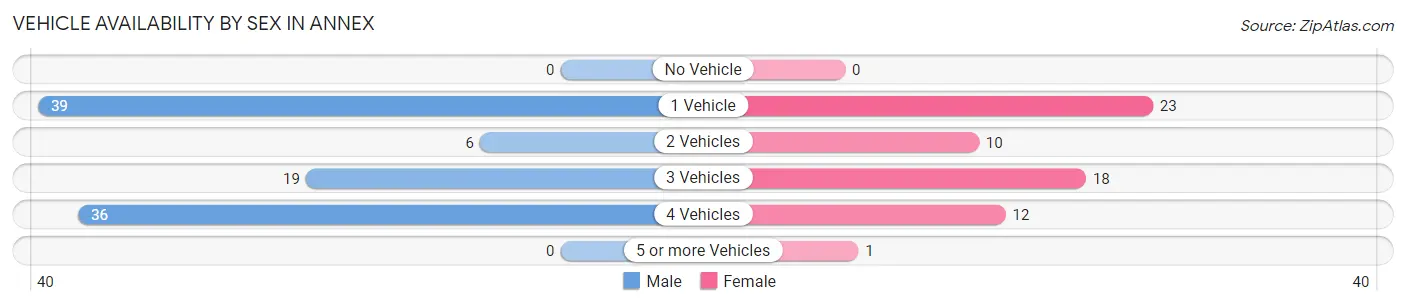
| Vehicles Available | Male | Female |
| No Vehicle | 0 (0.0%) | 0 (0.0%) |
| 1 Vehicle | 39 (39.0%) | 23 (35.9%) |
| 2 Vehicles | 6 (6.0%) | 10 (15.6%) |
| 3 Vehicles | 19 (19.0%) | 18 (28.1%) |
| 4 Vehicles | 36 (36.0%) | 12 (18.8%) |
| 5 or more Vehicles | 0 (0.0%) | 1 (1.6%) |
| Total | 100 (100.0%) | 64 (100.0%) |
Commute Time in Annex
The most frequently occuring commute durations in Annex are 10 to 14 minutes (52 commuters, 32.1%), 30 to 34 minutes (21 commuters, 13.0%), and 15 to 19 minutes (18 commuters, 11.1%).
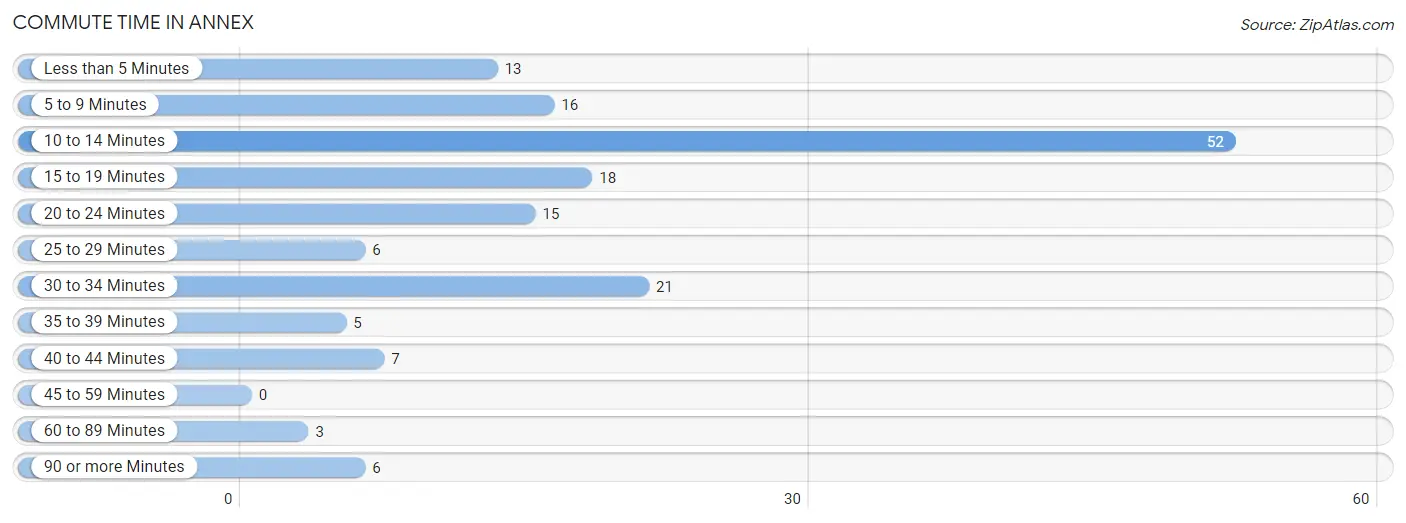
| Commute Time | # Commuters | % Commuters |
| Less than 5 Minutes | 13 | 8.0% |
| 5 to 9 Minutes | 16 | 9.9% |
| 10 to 14 Minutes | 52 | 32.1% |
| 15 to 19 Minutes | 18 | 11.1% |
| 20 to 24 Minutes | 15 | 9.3% |
| 25 to 29 Minutes | 6 | 3.7% |
| 30 to 34 Minutes | 21 | 13.0% |
| 35 to 39 Minutes | 5 | 3.1% |
| 40 to 44 Minutes | 7 | 4.3% |
| 45 to 59 Minutes | 0 | 0.0% |
| 60 to 89 Minutes | 3 | 1.8% |
| 90 or more Minutes | 6 | 3.7% |
Commute Time by Sex in Annex
The most common commute times in Annex are 10 to 14 minutes (42 commuters, 42.0%) for males and 5 to 9 minutes (10 commuters, 16.1%) for females.
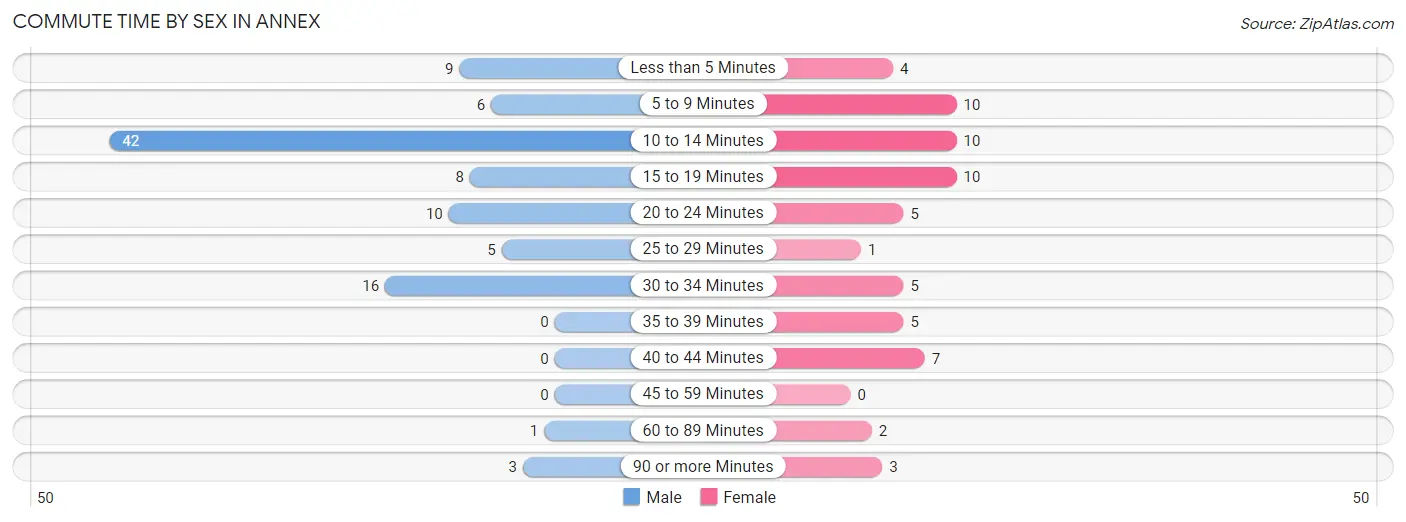
| Commute Time | Male | Female |
| Less than 5 Minutes | 9 (9.0%) | 4 (6.5%) |
| 5 to 9 Minutes | 6 (6.0%) | 10 (16.1%) |
| 10 to 14 Minutes | 42 (42.0%) | 10 (16.1%) |
| 15 to 19 Minutes | 8 (8.0%) | 10 (16.1%) |
| 20 to 24 Minutes | 10 (10.0%) | 5 (8.1%) |
| 25 to 29 Minutes | 5 (5.0%) | 1 (1.6%) |
| 30 to 34 Minutes | 16 (16.0%) | 5 (8.1%) |
| 35 to 39 Minutes | 0 (0.0%) | 5 (8.1%) |
| 40 to 44 Minutes | 0 (0.0%) | 7 (11.3%) |
| 45 to 59 Minutes | 0 (0.0%) | 0 (0.0%) |
| 60 to 89 Minutes | 1 (1.0%) | 2 (3.2%) |
| 90 or more Minutes | 3 (3.0%) | 3 (4.8%) |
Time of Departure to Work by Sex in Annex
The most frequent times of departure to work in Annex are 7:00 AM to 7:29 AM (33, 33.0%) for males and 7:00 AM to 7:29 AM (16, 25.8%) for females.
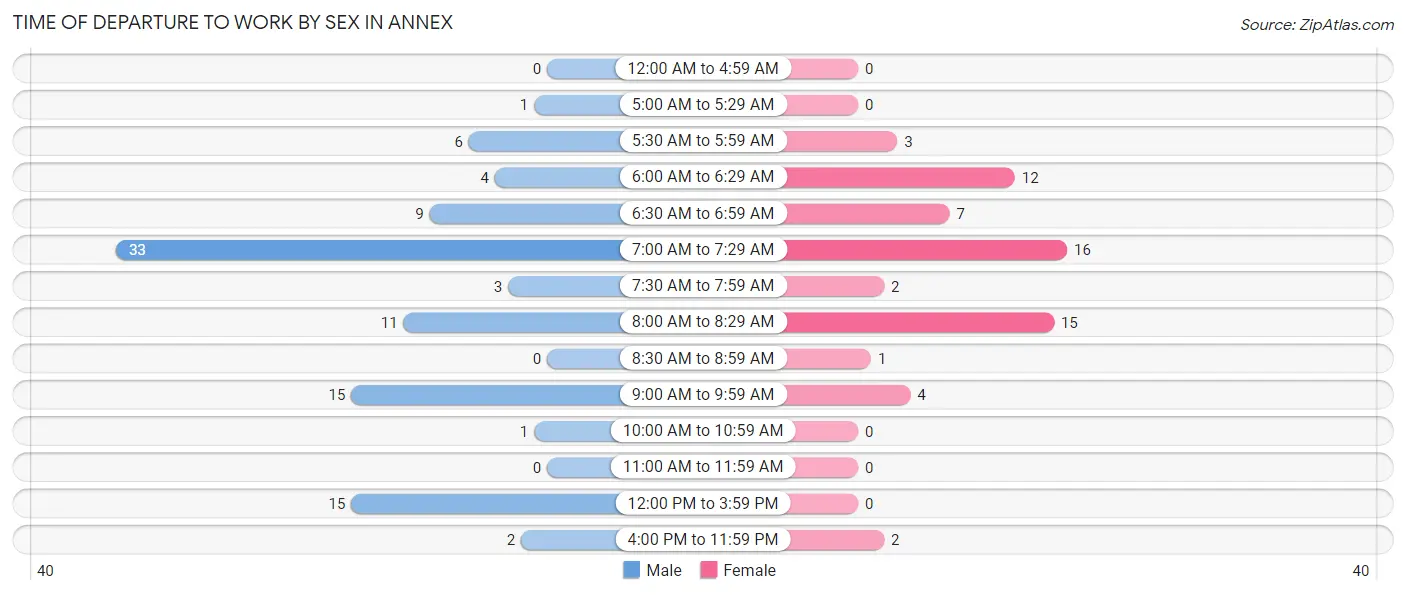
| Time of Departure | Male | Female |
| 12:00 AM to 4:59 AM | 0 (0.0%) | 0 (0.0%) |
| 5:00 AM to 5:29 AM | 1 (1.0%) | 0 (0.0%) |
| 5:30 AM to 5:59 AM | 6 (6.0%) | 3 (4.8%) |
| 6:00 AM to 6:29 AM | 4 (4.0%) | 12 (19.4%) |
| 6:30 AM to 6:59 AM | 9 (9.0%) | 7 (11.3%) |
| 7:00 AM to 7:29 AM | 33 (33.0%) | 16 (25.8%) |
| 7:30 AM to 7:59 AM | 3 (3.0%) | 2 (3.2%) |
| 8:00 AM to 8:29 AM | 11 (11.0%) | 15 (24.2%) |
| 8:30 AM to 8:59 AM | 0 (0.0%) | 1 (1.6%) |
| 9:00 AM to 9:59 AM | 15 (15.0%) | 4 (6.5%) |
| 10:00 AM to 10:59 AM | 1 (1.0%) | 0 (0.0%) |
| 11:00 AM to 11:59 AM | 0 (0.0%) | 0 (0.0%) |
| 12:00 PM to 3:59 PM | 15 (15.0%) | 0 (0.0%) |
| 4:00 PM to 11:59 PM | 2 (2.0%) | 2 (3.2%) |
| Total | 100 (100.0%) | 62 (100.0%) |
Housing Occupancy in Annex
Occupancy by Ownership in Annex
Of the total 104 dwellings in Annex, owner-occupied units account for 69 (66.3%), while renter-occupied units make up 35 (33.7%).
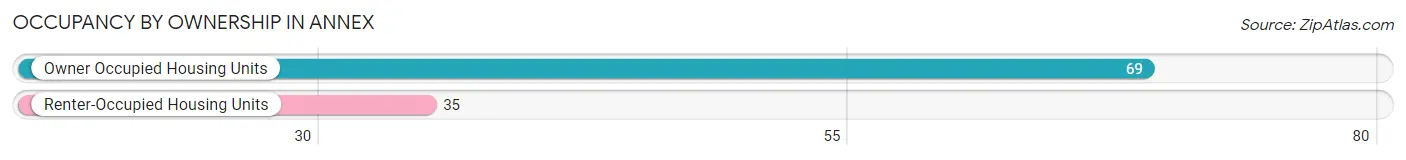
| Occupancy | # Housing Units | % Housing Units |
| Owner Occupied Housing Units | 69 | 66.3% |
| Renter-Occupied Housing Units | 35 | 33.7% |
| Total Occupied Housing Units | 104 | 100.0% |
Occupancy by Household Size in Annex
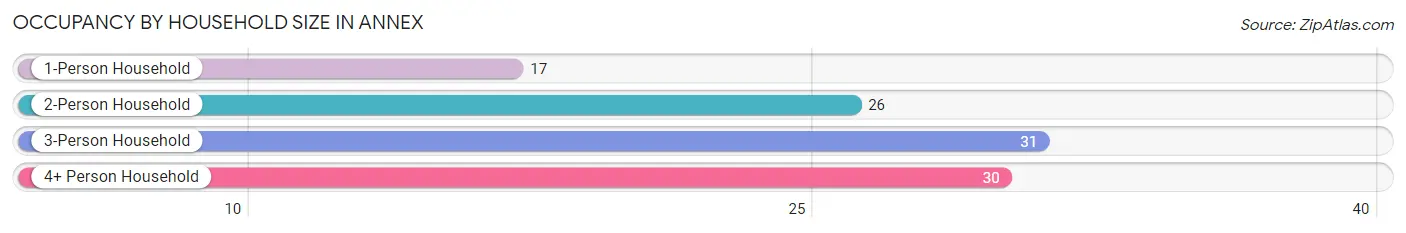
| Household Size | # Housing Units | % Housing Units |
| 1-Person Household | 17 | 16.4% |
| 2-Person Household | 26 | 25.0% |
| 3-Person Household | 31 | 29.8% |
| 4+ Person Household | 30 | 28.8% |
| Total Housing Units | 104 | 100.0% |
Occupancy by Ownership by Household Size in Annex
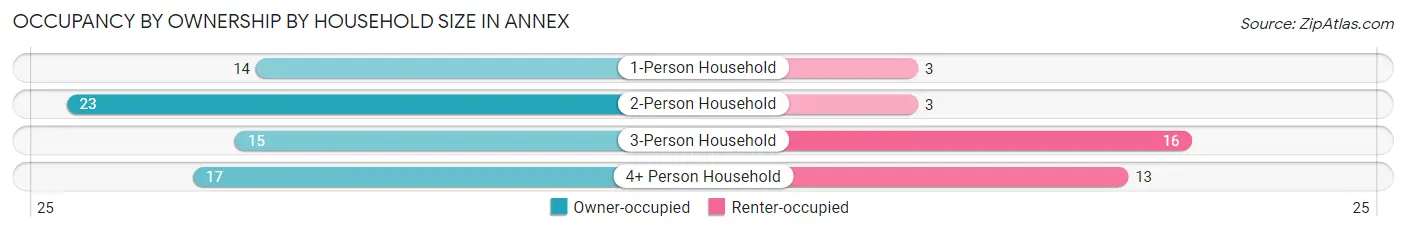
| Household Size | Owner-occupied | Renter-occupied |
| 1-Person Household | 14 (82.4%) | 3 (17.6%) |
| 2-Person Household | 23 (88.5%) | 3 (11.5%) |
| 3-Person Household | 15 (48.4%) | 16 (51.6%) |
| 4+ Person Household | 17 (56.7%) | 13 (43.3%) |
| Total Housing Units | 69 (66.3%) | 35 (33.7%) |
Occupancy by Educational Attainment in Annex
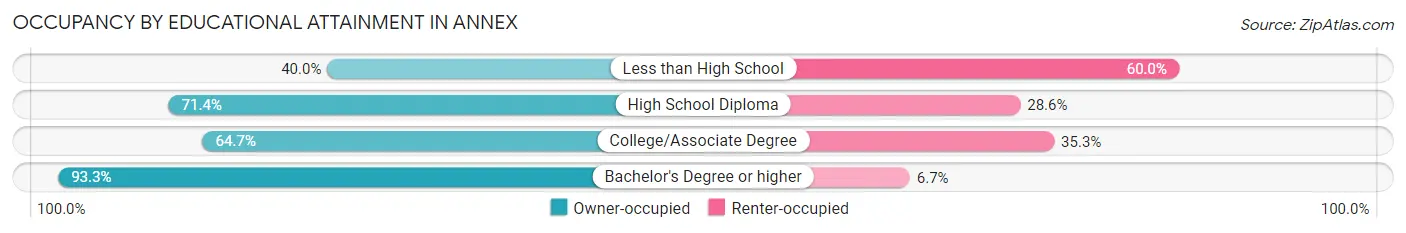
| Household Size | Owner-occupied | Renter-occupied |
| Less than High School | 8 (40.0%) | 12 (60.0%) |
| High School Diploma | 25 (71.4%) | 10 (28.6%) |
| College/Associate Degree | 22 (64.7%) | 12 (35.3%) |
| Bachelor's Degree or higher | 14 (93.3%) | 1 (6.7%) |
Occupancy by Age of Householder in Annex
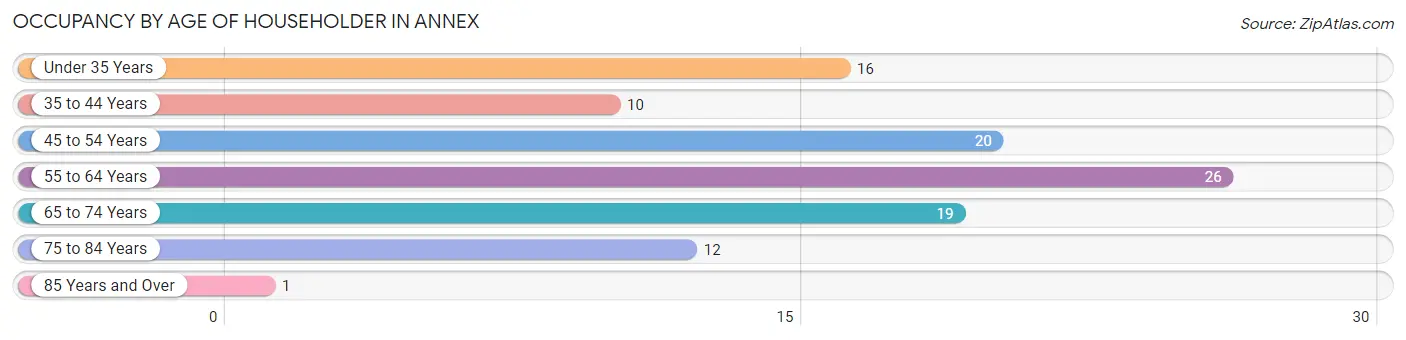
| Age Bracket | # Households | % Households |
| Under 35 Years | 16 | 15.4% |
| 35 to 44 Years | 10 | 9.6% |
| 45 to 54 Years | 20 | 19.2% |
| 55 to 64 Years | 26 | 25.0% |
| 65 to 74 Years | 19 | 18.3% |
| 75 to 84 Years | 12 | 11.5% |
| 85 Years and Over | 1 | 1.0% |
| Total | 104 | 100.0% |
Housing Finances in Annex
Median Income by Occupancy in Annex
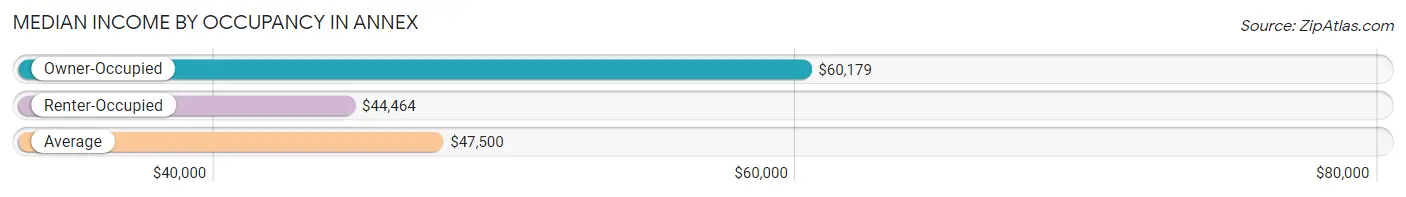
| Occupancy Type | # Households | Median Income |
| Owner-Occupied | 69 (66.3%) | $60,179 |
| Renter-Occupied | 35 (33.7%) | $44,464 |
| Average | 104 (100.0%) | $47,500 |
Occupancy by Householder Income Bracket in Annex
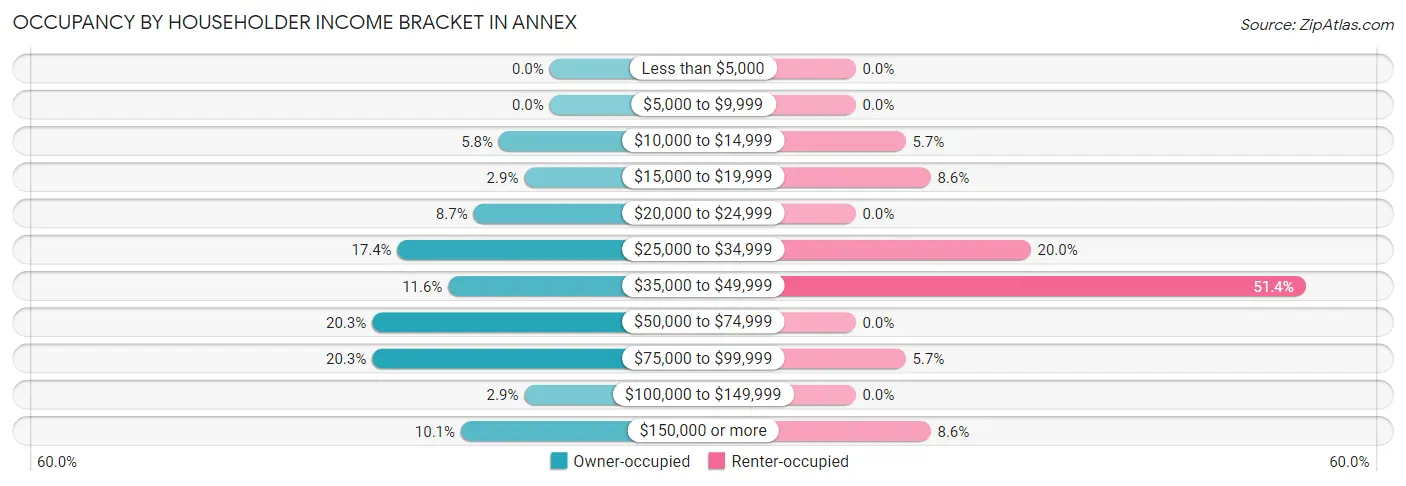
| Income Bracket | Owner-occupied | Renter-occupied |
| Less than $5,000 | 0 (0.0%) | 0 (0.0%) |
| $5,000 to $9,999 | 0 (0.0%) | 0 (0.0%) |
| $10,000 to $14,999 | 4 (5.8%) | 2 (5.7%) |
| $15,000 to $19,999 | 2 (2.9%) | 3 (8.6%) |
| $20,000 to $24,999 | 6 (8.7%) | 0 (0.0%) |
| $25,000 to $34,999 | 12 (17.4%) | 7 (20.0%) |
| $35,000 to $49,999 | 8 (11.6%) | 18 (51.4%) |
| $50,000 to $74,999 | 14 (20.3%) | 0 (0.0%) |
| $75,000 to $99,999 | 14 (20.3%) | 2 (5.7%) |
| $100,000 to $149,999 | 2 (2.9%) | 0 (0.0%) |
| $150,000 or more | 7 (10.1%) | 3 (8.6%) |
| Total | 69 (100.0%) | 35 (100.0%) |
Monthly Housing Cost Tiers in Annex
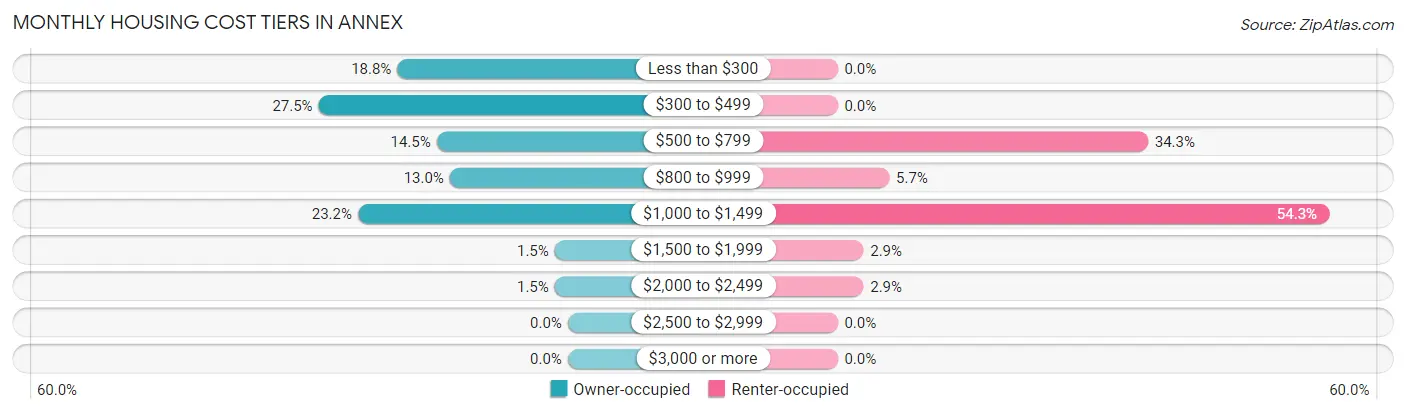
| Monthly Cost | Owner-occupied | Renter-occupied |
| Less than $300 | 13 (18.8%) | 0 (0.0%) |
| $300 to $499 | 19 (27.5%) | 0 (0.0%) |
| $500 to $799 | 10 (14.5%) | 12 (34.3%) |
| $800 to $999 | 9 (13.0%) | 2 (5.7%) |
| $1,000 to $1,499 | 16 (23.2%) | 19 (54.3%) |
| $1,500 to $1,999 | 1 (1.5%) | 1 (2.9%) |
| $2,000 to $2,499 | 1 (1.5%) | 1 (2.9%) |
| $2,500 to $2,999 | 0 (0.0%) | 0 (0.0%) |
| $3,000 or more | 0 (0.0%) | 0 (0.0%) |
| Total | 69 (100.0%) | 35 (100.0%) |
Physical Housing Characteristics in Annex
Housing Structures in Annex
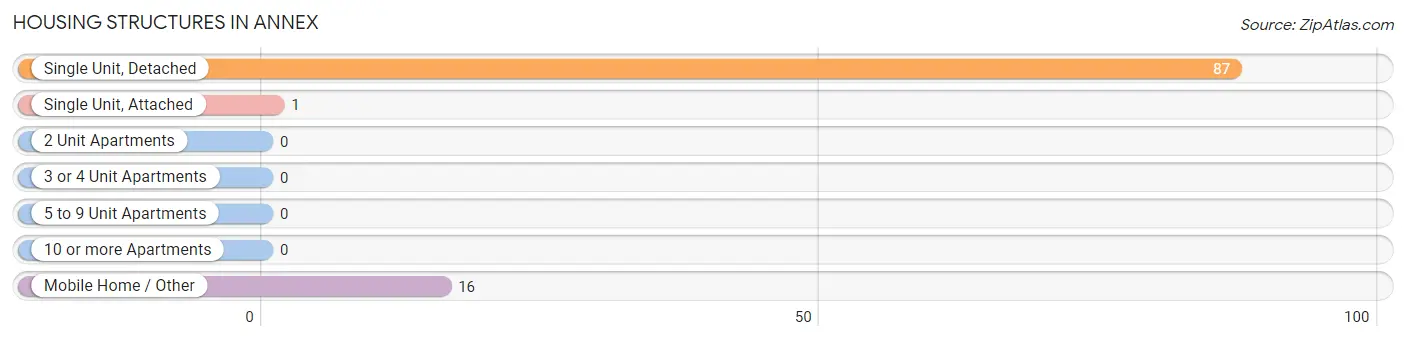
| Structure Type | # Housing Units | % Housing Units |
| Single Unit, Detached | 87 | 83.7% |
| Single Unit, Attached | 1 | 1.0% |
| 2 Unit Apartments | 0 | 0.0% |
| 3 or 4 Unit Apartments | 0 | 0.0% |
| 5 to 9 Unit Apartments | 0 | 0.0% |
| 10 or more Apartments | 0 | 0.0% |
| Mobile Home / Other | 16 | 15.4% |
| Total | 104 | 100.0% |
Housing Structures by Occupancy in Annex
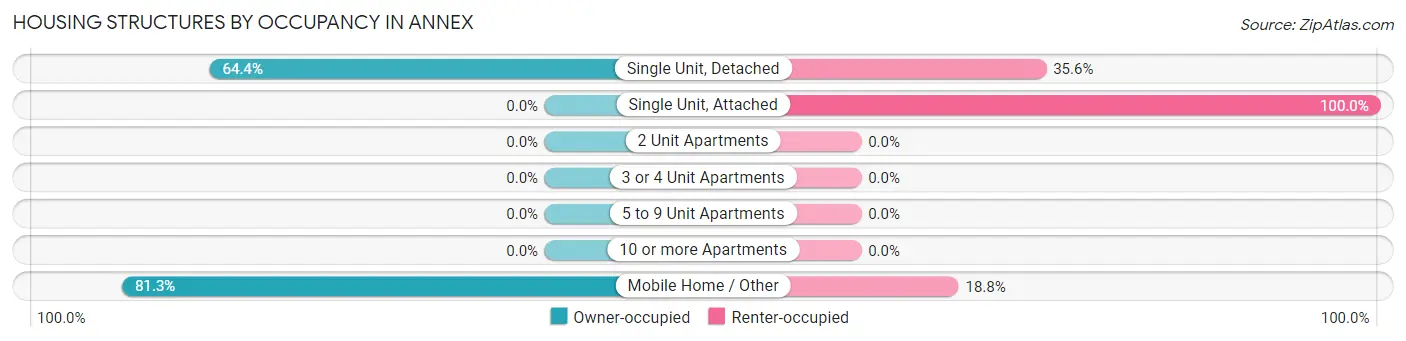
| Structure Type | Owner-occupied | Renter-occupied |
| Single Unit, Detached | 56 (64.4%) | 31 (35.6%) |
| Single Unit, Attached | 0 (0.0%) | 1 (100.0%) |
| 2 Unit Apartments | 0 (0.0%) | 0 (0.0%) |
| 3 or 4 Unit Apartments | 0 (0.0%) | 0 (0.0%) |
| 5 to 9 Unit Apartments | 0 (0.0%) | 0 (0.0%) |
| 10 or more Apartments | 0 (0.0%) | 0 (0.0%) |
| Mobile Home / Other | 13 (81.2%) | 3 (18.8%) |
| Total | 69 (66.3%) | 35 (33.7%) |
Housing Structures by Number of Rooms in Annex
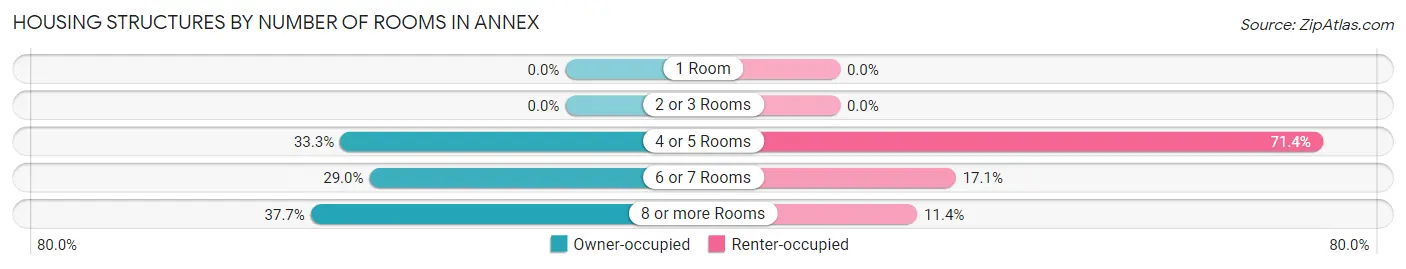
| Number of Rooms | Owner-occupied | Renter-occupied |
| 1 Room | 0 (0.0%) | 0 (0.0%) |
| 2 or 3 Rooms | 0 (0.0%) | 0 (0.0%) |
| 4 or 5 Rooms | 23 (33.3%) | 25 (71.4%) |
| 6 or 7 Rooms | 20 (29.0%) | 6 (17.1%) |
| 8 or more Rooms | 26 (37.7%) | 4 (11.4%) |
| Total | 69 (100.0%) | 35 (100.0%) |
Housing Structure by Heating Type in Annex
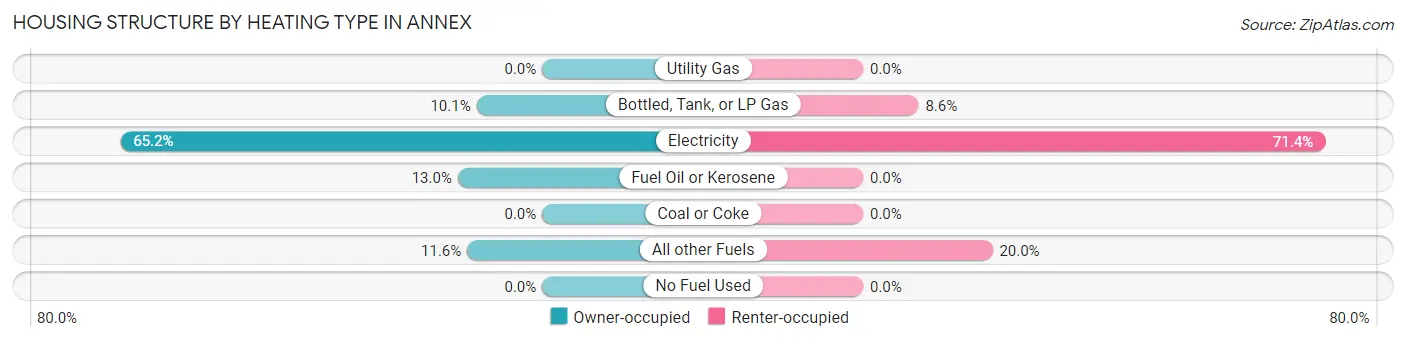
| Heating Type | Owner-occupied | Renter-occupied |
| Utility Gas | 0 (0.0%) | 0 (0.0%) |
| Bottled, Tank, or LP Gas | 7 (10.1%) | 3 (8.6%) |
| Electricity | 45 (65.2%) | 25 (71.4%) |
| Fuel Oil or Kerosene | 9 (13.0%) | 0 (0.0%) |
| Coal or Coke | 0 (0.0%) | 0 (0.0%) |
| All other Fuels | 8 (11.6%) | 7 (20.0%) |
| No Fuel Used | 0 (0.0%) | 0 (0.0%) |
| Total | 69 (100.0%) | 35 (100.0%) |
Household Vehicle Usage in Annex
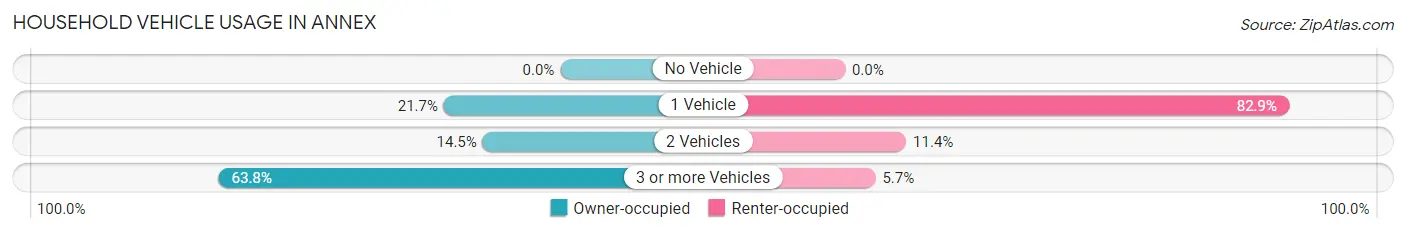
| Vehicles per Household | Owner-occupied | Renter-occupied |
| No Vehicle | 0 (0.0%) | 0 (0.0%) |
| 1 Vehicle | 15 (21.7%) | 29 (82.9%) |
| 2 Vehicles | 10 (14.5%) | 4 (11.4%) |
| 3 or more Vehicles | 44 (63.8%) | 2 (5.7%) |
| Total | 69 (100.0%) | 35 (100.0%) |
Real Estate & Mortgages in Annex
Real Estate and Mortgage Overview in Annex
| Characteristic | Without Mortgage | With Mortgage |
| Housing Units | 35 | 34 |
| Median Property Value | $147,900 | $189,300 |
| Median Household Income | - | - |
| Monthly Housing Costs | $364 | $0 |
| Real Estate Taxes | $600 | $0 |
Property Value by Mortgage Status in Annex
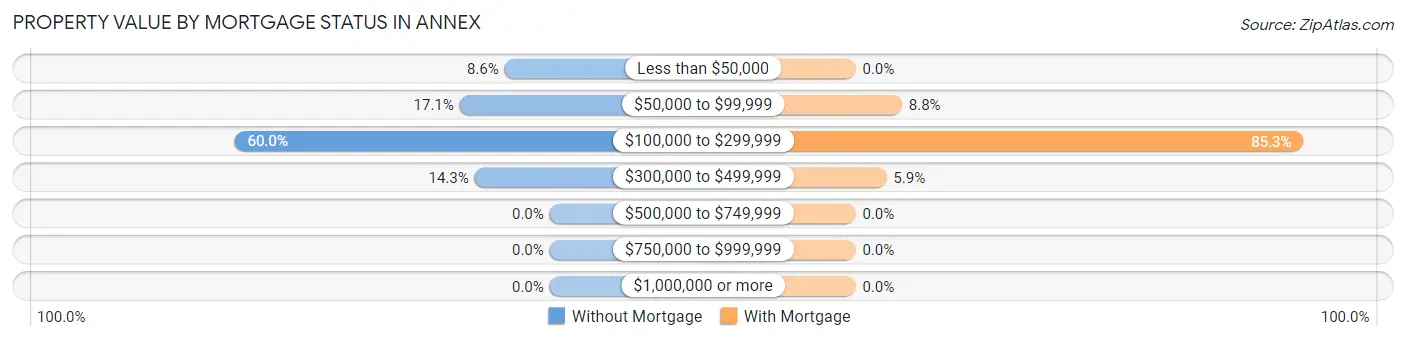
| Property Value | Without Mortgage | With Mortgage |
| Less than $50,000 | 3 (8.6%) | 0 (0.0%) |
| $50,000 to $99,999 | 6 (17.1%) | 3 (8.8%) |
| $100,000 to $299,999 | 21 (60.0%) | 29 (85.3%) |
| $300,000 to $499,999 | 5 (14.3%) | 2 (5.9%) |
| $500,000 to $749,999 | 0 (0.0%) | 0 (0.0%) |
| $750,000 to $999,999 | 0 (0.0%) | 0 (0.0%) |
| $1,000,000 or more | 0 (0.0%) | 0 (0.0%) |
| Total | 35 (100.0%) | 34 (100.0%) |
Household Income by Mortgage Status in Annex
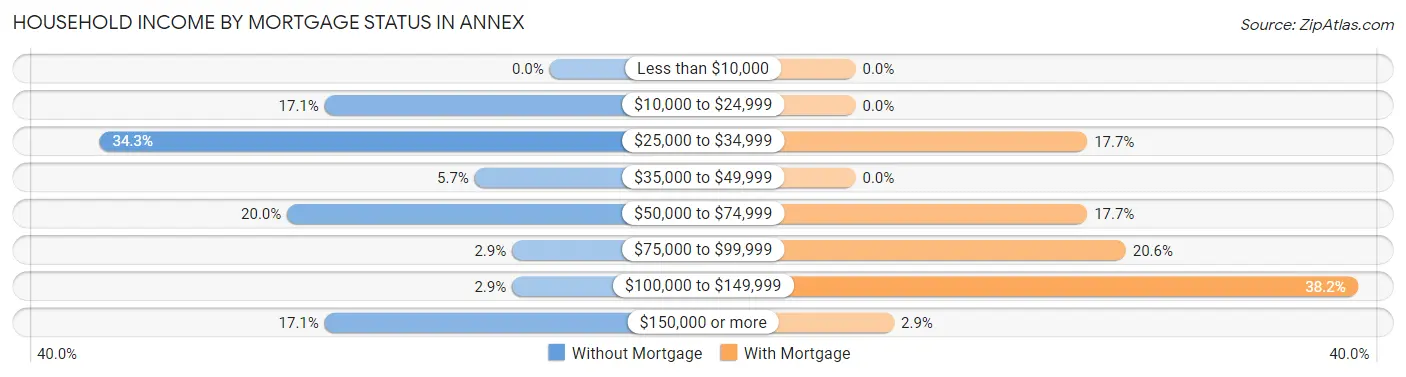
| Household Income | Without Mortgage | With Mortgage |
| Less than $10,000 | 0 (0.0%) | 0 (0.0%) |
| $10,000 to $24,999 | 6 (17.1%) | 0 (0.0%) |
| $25,000 to $34,999 | 12 (34.3%) | 6 (17.6%) |
| $35,000 to $49,999 | 2 (5.7%) | 0 (0.0%) |
| $50,000 to $74,999 | 7 (20.0%) | 6 (17.6%) |
| $75,000 to $99,999 | 1 (2.9%) | 7 (20.6%) |
| $100,000 to $149,999 | 1 (2.9%) | 13 (38.2%) |
| $150,000 or more | 6 (17.1%) | 1 (2.9%) |
| Total | 35 (100.0%) | 34 (100.0%) |
Property Value to Household Income Ratio in Annex
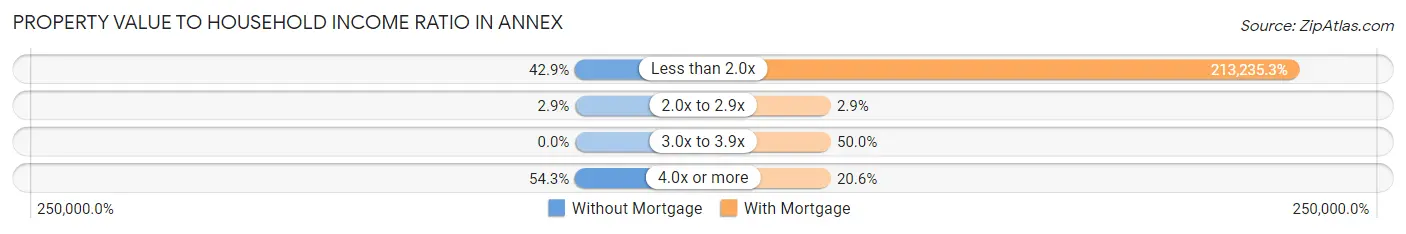
| Value-to-Income Ratio | Without Mortgage | With Mortgage |
| Less than 2.0x | 15 (42.9%) | 72,500 (213,235.3%) |
| 2.0x to 2.9x | 1 (2.9%) | 1 (2.9%) |
| 3.0x to 3.9x | 0 (0.0%) | 17 (50.0%) |
| 4.0x or more | 19 (54.3%) | 7 (20.6%) |
| Total | 35 (100.0%) | 34 (100.0%) |
Real Estate Taxes by Mortgage Status in Annex
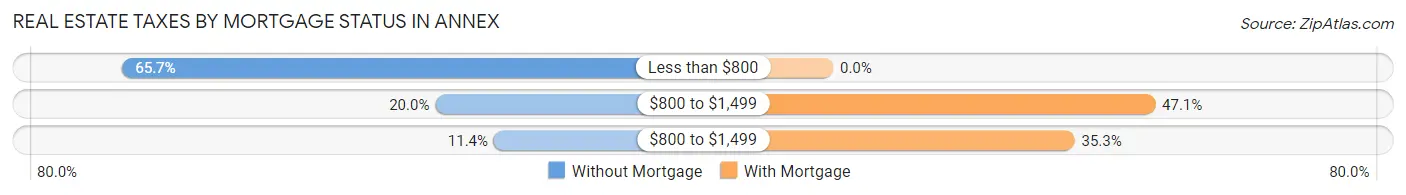
| Property Taxes | Without Mortgage | With Mortgage |
| Less than $800 | 23 (65.7%) | 0 (0.0%) |
| $800 to $1,499 | 7 (20.0%) | 16 (47.1%) |
| $800 to $1,499 | 4 (11.4%) | 12 (35.3%) |
| Total | 35 (100.0%) | 34 (100.0%) |
Health & Disability in Annex
Health Insurance Coverage by Age in Annex
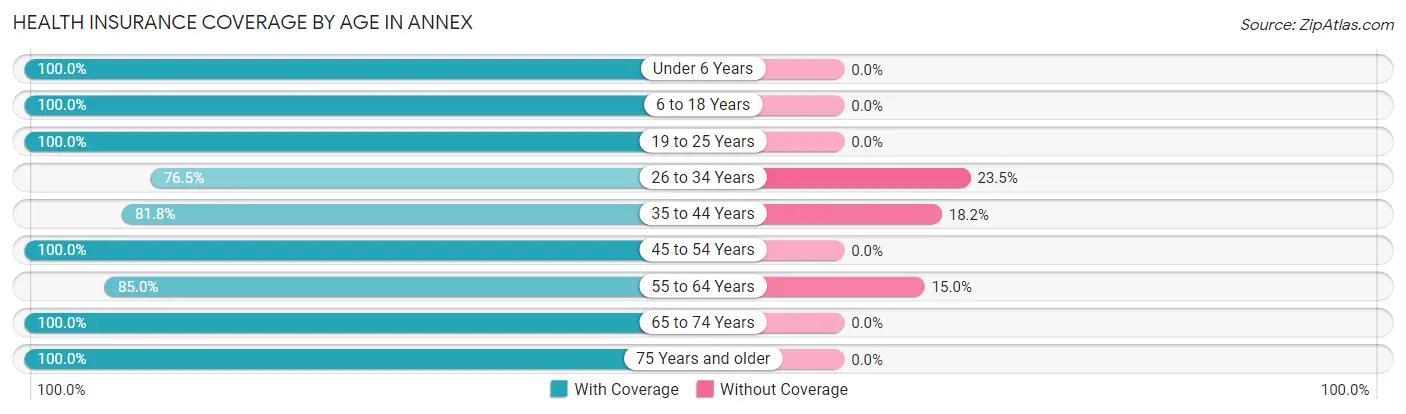
| Age Bracket | With Coverage | Without Coverage |
| Under 6 Years | 11 (100.0%) | 0 (0.0%) |
| 6 to 18 Years | 55 (100.0%) | 0 (0.0%) |
| 19 to 25 Years | 62 (100.0%) | 0 (0.0%) |
| 26 to 34 Years | 26 (76.5%) | 8 (23.5%) |
| 35 to 44 Years | 18 (81.8%) | 4 (18.2%) |
| 45 to 54 Years | 47 (100.0%) | 0 (0.0%) |
| 55 to 64 Years | 51 (85.0%) | 9 (15.0%) |
| 65 to 74 Years | 27 (100.0%) | 0 (0.0%) |
| 75 Years and older | 15 (100.0%) | 0 (0.0%) |
| Total | 312 (93.7%) | 21 (6.3%) |
Health Insurance Coverage by Citizenship Status in Annex
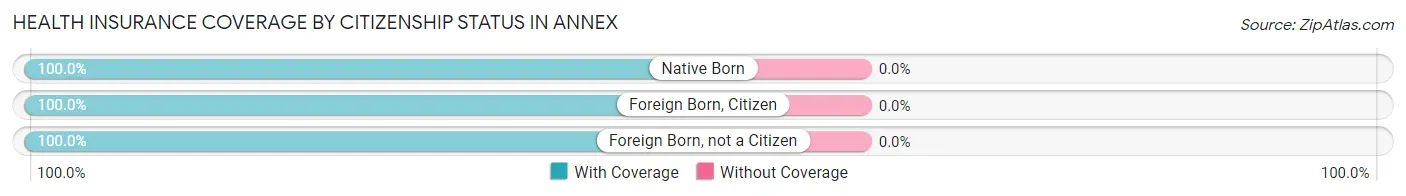
| Citizenship Status | With Coverage | Without Coverage |
| Native Born | 11 (100.0%) | 0 (0.0%) |
| Foreign Born, Citizen | 55 (100.0%) | 0 (0.0%) |
| Foreign Born, not a Citizen | 62 (100.0%) | 0 (0.0%) |
Health Insurance Coverage by Household Income in Annex
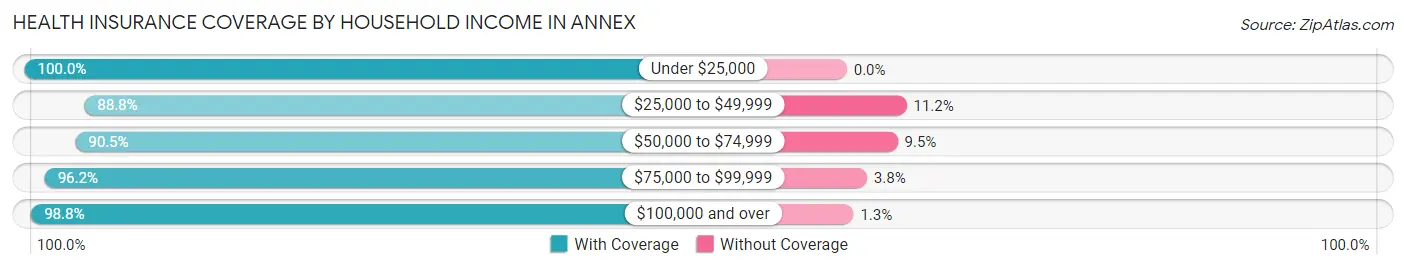
| Household Income | With Coverage | Without Coverage |
| Under $25,000 | 33 (100.0%) | 0 (0.0%) |
| $25,000 to $49,999 | 111 (88.8%) | 14 (11.2%) |
| $50,000 to $74,999 | 38 (90.5%) | 4 (9.5%) |
| $75,000 to $99,999 | 51 (96.2%) | 2 (3.8%) |
| $100,000 and over | 79 (98.8%) | 1 (1.3%) |
Public vs Private Health Insurance Coverage by Age in Annex
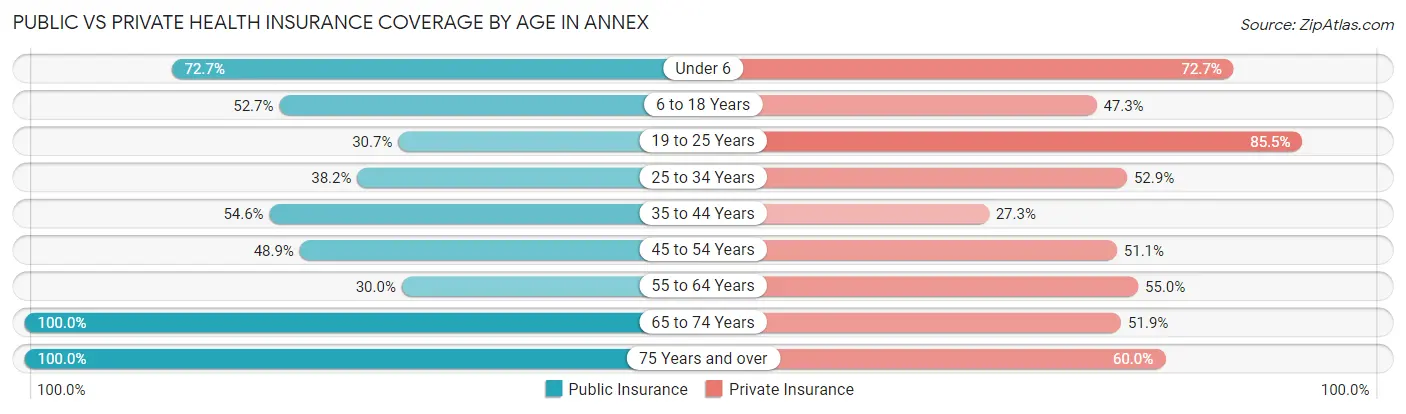
| Age Bracket | Public Insurance | Private Insurance |
| Under 6 | 8 (72.7%) | 8 (72.7%) |
| 6 to 18 Years | 29 (52.7%) | 26 (47.3%) |
| 19 to 25 Years | 19 (30.6%) | 53 (85.5%) |
| 25 to 34 Years | 13 (38.2%) | 18 (52.9%) |
| 35 to 44 Years | 12 (54.5%) | 6 (27.3%) |
| 45 to 54 Years | 23 (48.9%) | 24 (51.1%) |
| 55 to 64 Years | 18 (30.0%) | 33 (55.0%) |
| 65 to 74 Years | 27 (100.0%) | 14 (51.8%) |
| 75 Years and over | 15 (100.0%) | 9 (60.0%) |
| Total | 164 (49.2%) | 191 (57.4%) |
Disability Status by Sex by Age in Annex
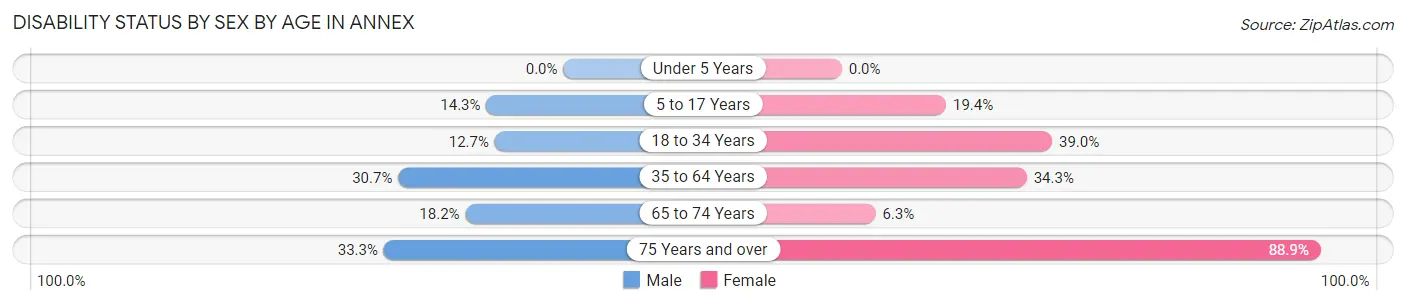
| Age Bracket | Male | Female |
| Under 5 Years | 0 (0.0%) | 0 (0.0%) |
| 5 to 17 Years | 4 (14.3%) | 6 (19.4%) |
| 18 to 34 Years | 7 (12.7%) | 16 (39.0%) |
| 35 to 64 Years | 19 (30.6%) | 23 (34.3%) |
| 65 to 74 Years | 2 (18.2%) | 1 (6.2%) |
| 75 Years and over | 2 (33.3%) | 8 (88.9%) |
Disability Class by Sex by Age in Annex
Disability Class: Hearing Difficulty
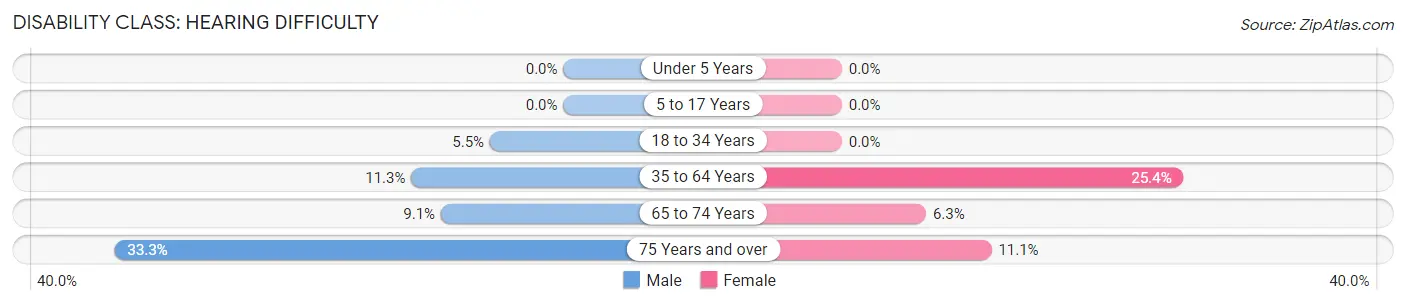
| Age Bracket | Male | Female |
| Under 5 Years | 0 (0.0%) | 0 (0.0%) |
| 5 to 17 Years | 0 (0.0%) | 0 (0.0%) |
| 18 to 34 Years | 3 (5.4%) | 0 (0.0%) |
| 35 to 64 Years | 7 (11.3%) | 17 (25.4%) |
| 65 to 74 Years | 1 (9.1%) | 1 (6.2%) |
| 75 Years and over | 2 (33.3%) | 1 (11.1%) |
Disability Class: Vision Difficulty
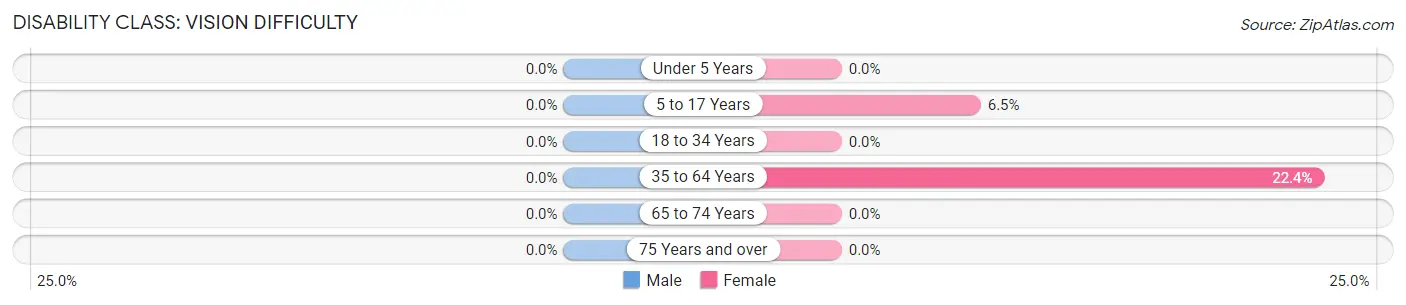
| Age Bracket | Male | Female |
| Under 5 Years | 0 (0.0%) | 0 (0.0%) |
| 5 to 17 Years | 0 (0.0%) | 2 (6.5%) |
| 18 to 34 Years | 0 (0.0%) | 0 (0.0%) |
| 35 to 64 Years | 0 (0.0%) | 15 (22.4%) |
| 65 to 74 Years | 0 (0.0%) | 0 (0.0%) |
| 75 Years and over | 0 (0.0%) | 0 (0.0%) |
Disability Class: Cognitive Difficulty
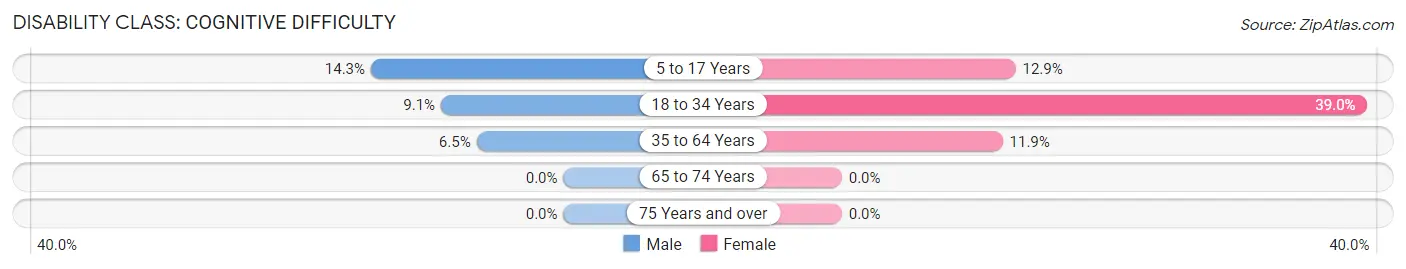
| Age Bracket | Male | Female |
| 5 to 17 Years | 4 (14.3%) | 4 (12.9%) |
| 18 to 34 Years | 5 (9.1%) | 16 (39.0%) |
| 35 to 64 Years | 4 (6.5%) | 8 (11.9%) |
| 65 to 74 Years | 0 (0.0%) | 0 (0.0%) |
| 75 Years and over | 0 (0.0%) | 0 (0.0%) |
Disability Class: Ambulatory Difficulty
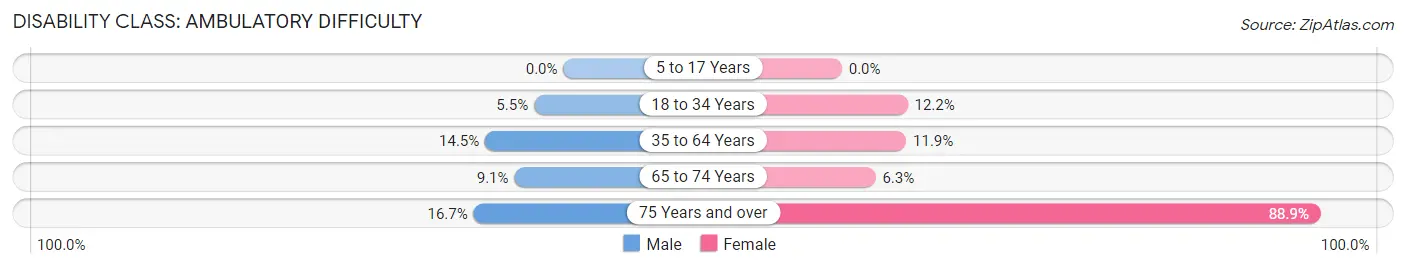
| Age Bracket | Male | Female |
| 5 to 17 Years | 0 (0.0%) | 0 (0.0%) |
| 18 to 34 Years | 3 (5.4%) | 5 (12.2%) |
| 35 to 64 Years | 9 (14.5%) | 8 (11.9%) |
| 65 to 74 Years | 1 (9.1%) | 1 (6.2%) |
| 75 Years and over | 1 (16.7%) | 8 (88.9%) |
Disability Class: Self-Care Difficulty
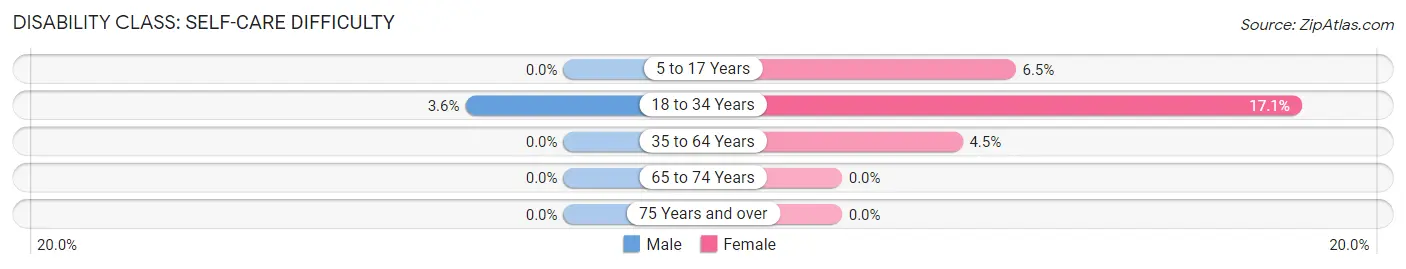
| Age Bracket | Male | Female |
| 5 to 17 Years | 0 (0.0%) | 2 (6.5%) |
| 18 to 34 Years | 2 (3.6%) | 7 (17.1%) |
| 35 to 64 Years | 0 (0.0%) | 3 (4.5%) |
| 65 to 74 Years | 0 (0.0%) | 0 (0.0%) |
| 75 Years and over | 0 (0.0%) | 0 (0.0%) |
Technology Access in Annex
Computing Device Access in Annex
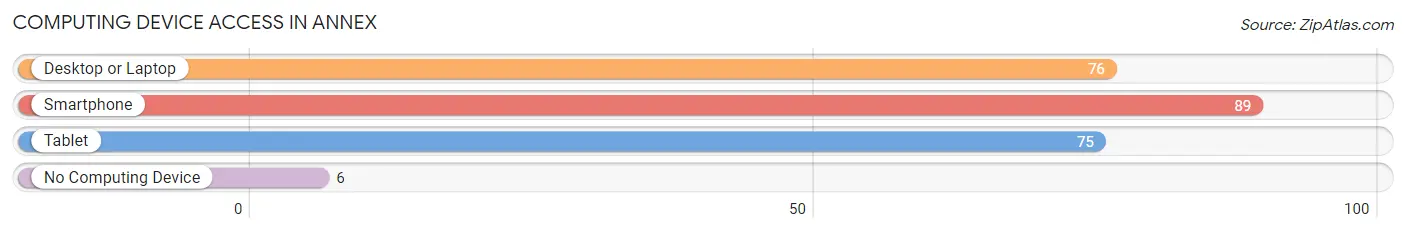
| Device Type | # Households | % Households |
| Desktop or Laptop | 76 | 73.1% |
| Smartphone | 89 | 85.6% |
| Tablet | 75 | 72.1% |
| No Computing Device | 6 | 5.8% |
| Total | 104 | 100.0% |
Internet Access in Annex
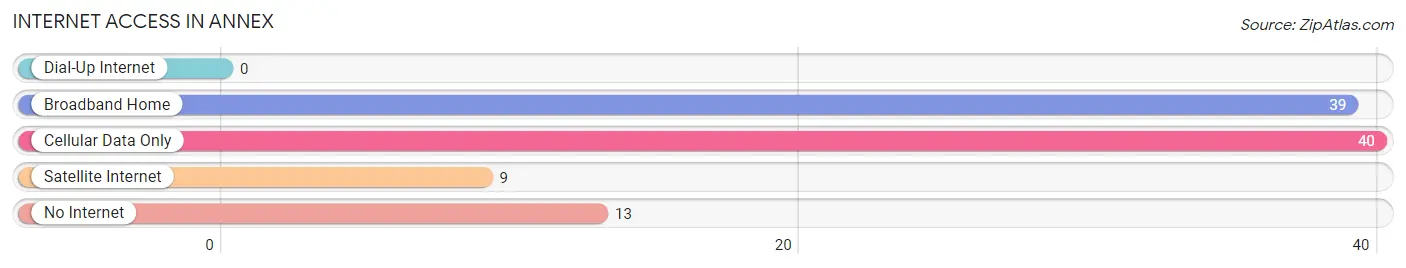
| Internet Type | # Households | % Households |
| Dial-Up Internet | 0 | 0.0% |
| Broadband Home | 39 | 37.5% |
| Cellular Data Only | 40 | 38.5% |
| Satellite Internet | 9 | 8.6% |
| No Internet | 13 | 12.5% |
| Total | 104 | 100.0% |
Annex Summary
History
Annex is a small unincorporated community located in the state of Oregon, United States. It is situated in the foothills of the Cascade Mountains, approximately 20 miles east of Eugene. The area was first settled in the late 1800s by homesteaders who were attracted to the area by its abundant natural resources. The community was originally known as “Annexville” and was named after the nearby Annex Creek.
The first post office in Annex was established in 1891 and the town was officially incorporated in 1895. The town was originally a logging and farming community, but in the early 1900s, the area began to develop into a tourist destination. The town was home to several resorts, including the Annex Hotel, which was built in 1910 and was the largest hotel in the area.
The Annex area was also home to several sawmills and lumber mills, which provided employment for many of the town’s residents. The town also had a thriving agricultural industry, with many of the local farms producing hay, grain, and vegetables.
In the 1950s, the town began to decline as the logging industry began to decline and the population began to move away. The town’s population decreased from a peak of over 500 in the 1940s to just over 200 in the 2000s.
Geography
Annex is located in the foothills of the Cascade Mountains in Lane County, Oregon. The town is situated at an elevation of 1,400 feet and is surrounded by the Willamette National Forest. The town is located approximately 20 miles east of Eugene and is accessible via Highway 58.
The climate in Annex is generally mild, with temperatures ranging from the mid-30s in the winter to the mid-80s in the summer. The area receives an average of 40 inches of precipitation annually, with most of the precipitation occurring in the winter months.
Economy
The economy of Annex is largely based on tourism and agriculture. The town is home to several resorts, including the Annex Hotel, which was built in 1910 and is the largest hotel in the area. The town also has several restaurants, cafes, and shops.
The town is also home to several farms, which produce hay, grain, and vegetables. The town also has a thriving logging industry, with several sawmills and lumber mills located in the area.
Demographics
As of the 2010 census, the population of Annex was estimated to be 206. The racial makeup of the town was 94.3% White, 0.5% African American, 0.5% Native American, 0.5% Asian, 0.5% Pacific Islander, and 3.4% from other races. The median household income in Annex was $37,500, and the median age was 44.7 years.
Common Questions
What is Per Capita Income in Annex?
Per Capita income in Annex is $21,677.
What is the Median Family Income in Annex?
Median Family Income in Annex is $44,643.
What is the Median Household income in Annex?
Median Household Income in Annex is $47,500.
What is Income or Wage Gap in Annex?
Income or Wage Gap in Annex is 26.1%.
Women in Annex earn 73.9 cents for every dollar earned by a man.
What is Inequality or Gini Index in Annex?
Inequality or Gini Index in Annex is 0.40.
What is the Total Population of Annex?
Total Population of Annex is 333.
What is the Total Male Population of Annex?
Total Male Population of Annex is 165.
What is the Total Female Population of Annex?
Total Female Population of Annex is 168.
What is the Ratio of Males per 100 Females in Annex?
There are 98.21 Males per 100 Females in Annex.
What is the Ratio of Females per 100 Males in Annex?
There are 101.82 Females per 100 Males in Annex.
What is the Median Population Age in Annex?
Median Population Age in Annex is 37.3 Years.
What is the Average Family Size in Annex
Average Family Size in Annex is 3.6 People.
What is the Average Household Size in Annex
Average Household Size in Annex is 3.2 People.
How Large is the Labor Force in Annex?
There are 171 People in the Labor Forcein in Annex.
What is the Percentage of People in the Labor Force in Annex?
61.1% of People are in the Labor Force in Annex.
What is the Unemployment Rate in Annex?
Unemployment Rate in Annex is 1.2%.