Avery, CA Map & Demographics
Avery Map
Avery Overview
$31,822
PER CAPITA INCOME
$53,882
AVG FAMILY INCOME
$53,289
AVG HOUSEHOLD INCOME
0.44
INEQUALITY / GINI INDEX
422
TOTAL POPULATION
183
MALE POPULATION
239
FEMALE POPULATION
76.57
MALES / 100 FEMALES
130.60
FEMALES / 100 MALES
63.0
MEDIAN AGE
2.5
AVG FAMILY SIZE
1.9
AVG HOUSEHOLD SIZE
230
LABOR FORCE [ PEOPLE ]
62.7%
PERCENT IN LABOR FORCE
20.9%
UNEMPLOYMENT RATE
Avery Zip Codes
Avery Area Codes
Income in Avery
Income Overview in Avery
Per Capita Income in Avery is $31,822, while median incomes of families and households are $53,882 and $53,289 respectively.
| Characteristic | Number | Measure |
| Per Capita Income | 422 | $31,822 |
| Median Family Income | 121 | $53,882 |
| Mean Family Income | 121 | $62,986 |
| Median Household Income | 220 | $53,289 |
| Mean Household Income | 220 | $59,195 |
| Income Deficit | 121 | $0 |
| Wage / Income Gap (%) | 422 | 0.00% |
| Wage / Income Gap ($) | 422 | 100.00¢ per $1 |
| Gini / Inequality Index | 422 | 0.44 |
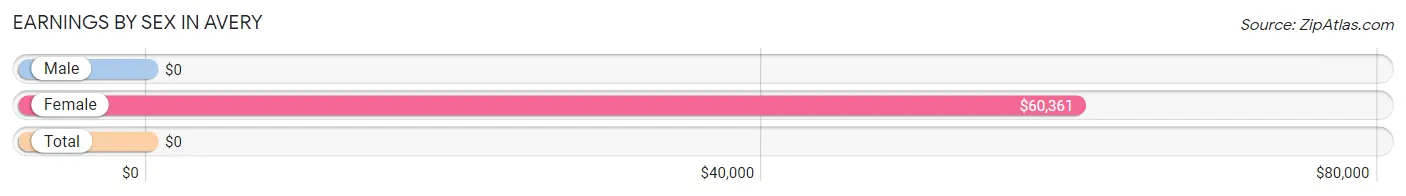
Earnings by Sex in Avery
| Sex | Number | Average Earnings |
| Male | 77 (42.3%) | $0 |
| Female | 105 (57.7%) | $60,361 |
| Total | 182 (100.0%) | $0 |
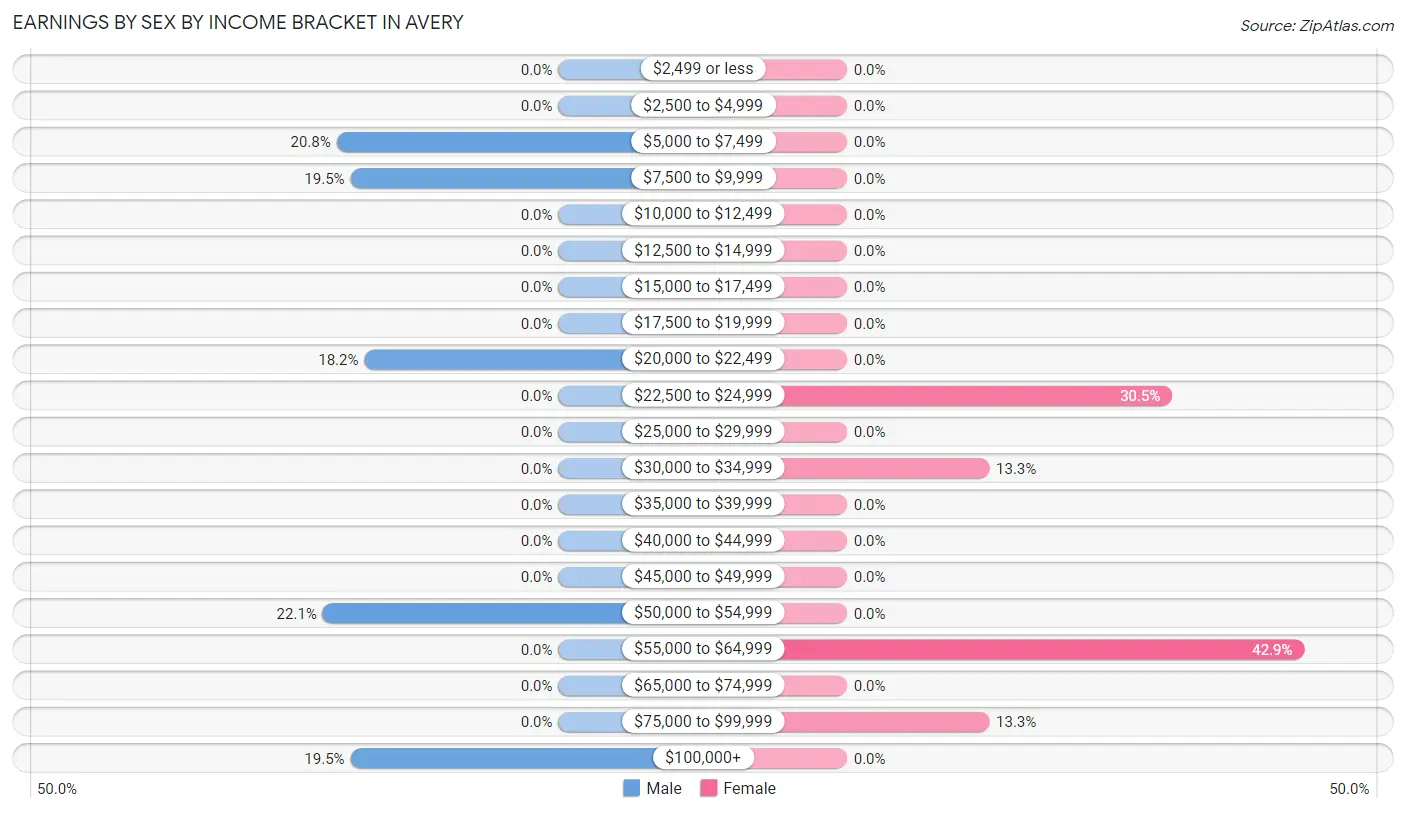
Earnings by Sex by Income Bracket in Avery
The most common earnings brackets in Avery are $50,000 to $54,999 for men (17 | 22.1%) and $55,000 to $64,999 for women (45 | 42.9%).
| Income | Male | Female |
| $2,499 or less | 0 (0.0%) | 0 (0.0%) |
| $2,500 to $4,999 | 0 (0.0%) | 0 (0.0%) |
| $5,000 to $7,499 | 16 (20.8%) | 0 (0.0%) |
| $7,500 to $9,999 | 15 (19.5%) | 0 (0.0%) |
| $10,000 to $12,499 | 0 (0.0%) | 0 (0.0%) |
| $12,500 to $14,999 | 0 (0.0%) | 0 (0.0%) |
| $15,000 to $17,499 | 0 (0.0%) | 0 (0.0%) |
| $17,500 to $19,999 | 0 (0.0%) | 0 (0.0%) |
| $20,000 to $22,499 | 14 (18.2%) | 0 (0.0%) |
| $22,500 to $24,999 | 0 (0.0%) | 32 (30.5%) |
| $25,000 to $29,999 | 0 (0.0%) | 0 (0.0%) |
| $30,000 to $34,999 | 0 (0.0%) | 14 (13.3%) |
| $35,000 to $39,999 | 0 (0.0%) | 0 (0.0%) |
| $40,000 to $44,999 | 0 (0.0%) | 0 (0.0%) |
| $45,000 to $49,999 | 0 (0.0%) | 0 (0.0%) |
| $50,000 to $54,999 | 17 (22.1%) | 0 (0.0%) |
| $55,000 to $64,999 | 0 (0.0%) | 45 (42.9%) |
| $65,000 to $74,999 | 0 (0.0%) | 0 (0.0%) |
| $75,000 to $99,999 | 0 (0.0%) | 14 (13.3%) |
| $100,000+ | 15 (19.5%) | 0 (0.0%) |
| Total | 77 (100.0%) | 105 (100.0%) |
Earnings by Sex by Educational Attainment in Avery
| Educational Attainment | Male Income | Female Income |
| Less than High School | - | - |
| High School Diploma | - | - |
| College or Associate's Degree | - | - |
| Bachelor's Degree | - | - |
| Graduate Degree | - | - |
| Total | - | - |
Family Income in Avery
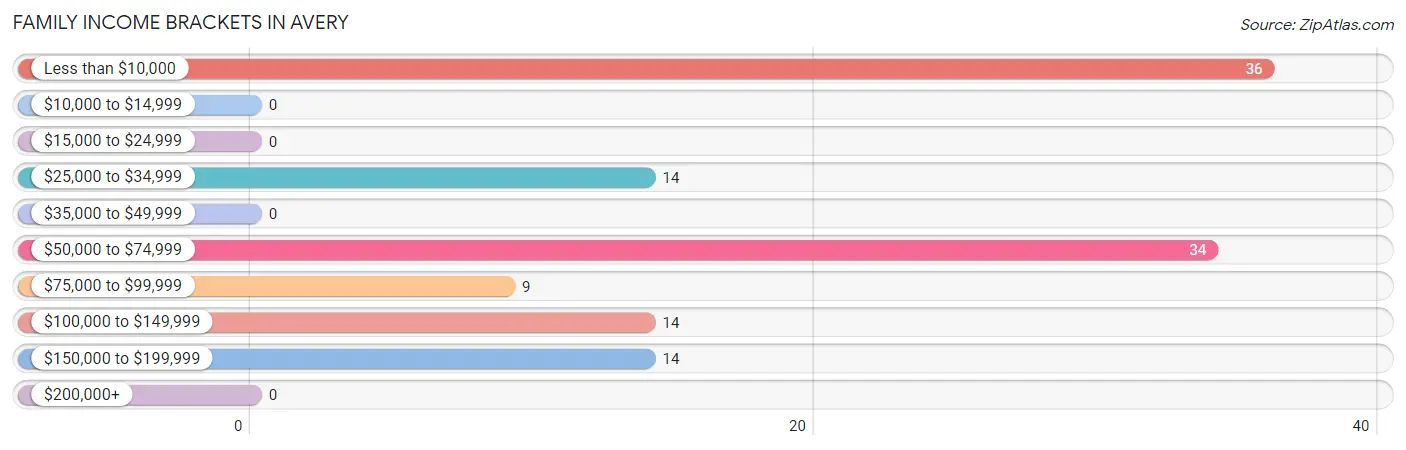
Family Income Brackets in Avery
According to the Avery family income data, there are 36 families falling into the less than $10,000 income range, which is the most common income bracket and makes up 29.7% of all families.
| Income Bracket | # Families | % Families |
| Less than $10,000 | 36 | 29.8% |
| $10,000 to $14,999 | 0 | 0.0% |
| $15,000 to $24,999 | 0 | 0.0% |
| $25,000 to $34,999 | 14 | 11.6% |
| $35,000 to $49,999 | 0 | 0.0% |
| $50,000 to $74,999 | 34 | 28.1% |
| $75,000 to $99,999 | 9 | 7.4% |
| $100,000 to $149,999 | 14 | 11.6% |
| $150,000 to $199,999 | 14 | 11.6% |
| $200,000+ | 0 | 0.0% |
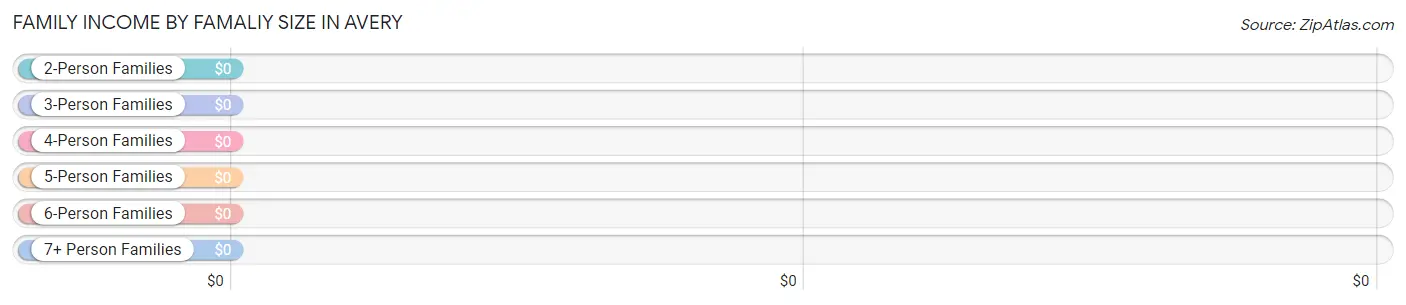
Family Income by Famaliy Size in Avery
| Income Bracket | # Families | Median Income |
| 2-Person Families | 72 (59.5%) | $0 |
| 3-Person Families | 49 (40.5%) | $0 |
| 4-Person Families | 0 (0.0%) | $0 |
| 5-Person Families | 0 (0.0%) | $0 |
| 6-Person Families | 0 (0.0%) | $0 |
| 7+ Person Families | 0 (0.0%) | $0 |
| Total | 121 (100.0%) | $53,882 |
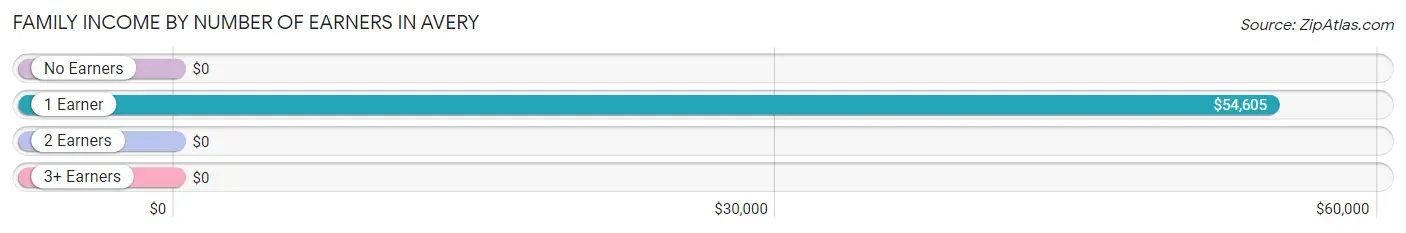
Family Income by Number of Earners in Avery
| Number of Earners | # Families | Median Income |
| No Earners | 43 (35.5%) | $0 |
| 1 Earner | 64 (52.9%) | $54,605 |
| 2 Earners | 0 (0.0%) | $0 |
| 3+ Earners | 14 (11.6%) | $0 |
| Total | 121 (100.0%) | $53,882 |
Household Income in Avery
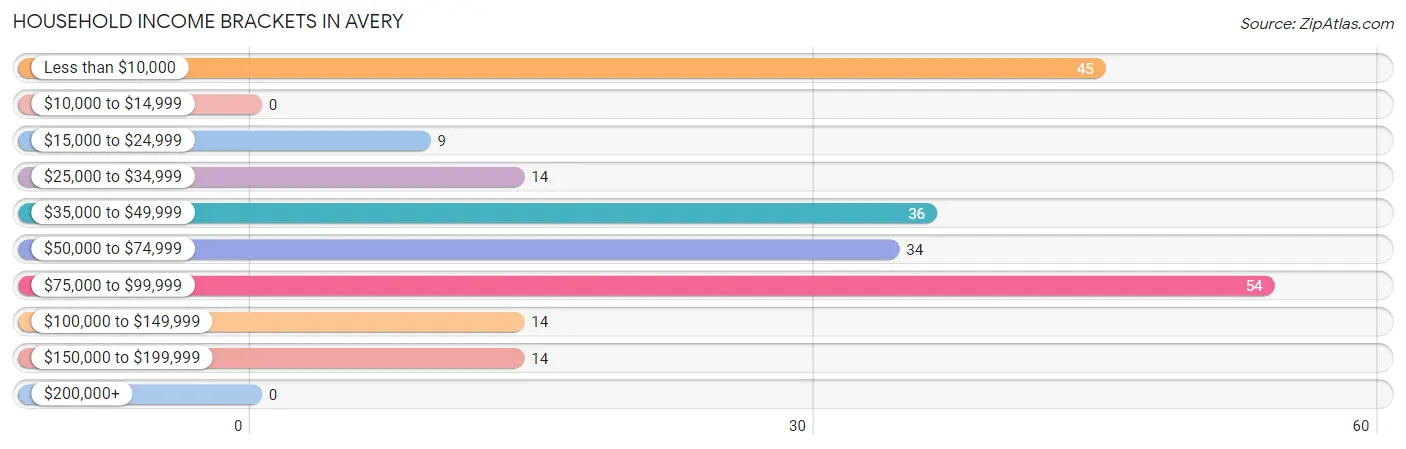
Household Income Brackets in Avery
With 54 households falling in the category, the $75,000 to $99,999 income range is the most frequent in Avery, accounting for 24.5% of all households.
| Income Bracket | # Households | % Households |
| Less than $10,000 | 45 | 20.5% |
| $10,000 to $14,999 | 0 | 0.0% |
| $15,000 to $24,999 | 9 | 4.1% |
| $25,000 to $34,999 | 14 | 6.4% |
| $35,000 to $49,999 | 36 | 16.4% |
| $50,000 to $74,999 | 34 | 15.5% |
| $75,000 to $99,999 | 54 | 24.5% |
| $100,000 to $149,999 | 14 | 6.4% |
| $150,000 to $199,999 | 14 | 6.4% |
| $200,000+ | 0 | 0.0% |
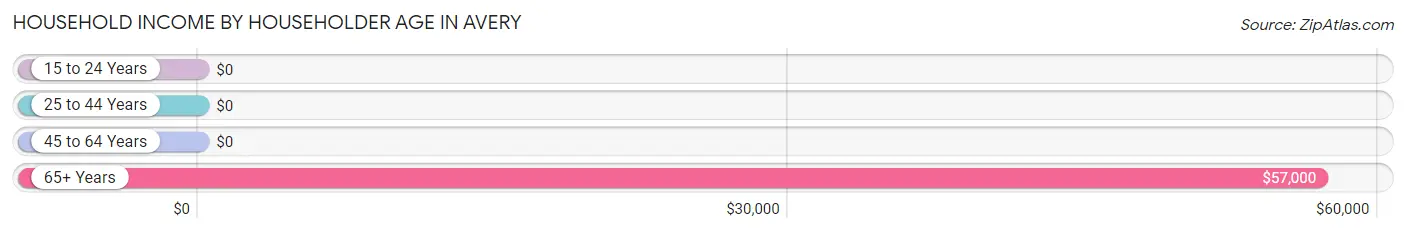
Household Income by Householder Age in Avery
The median household income in Avery is $53,289, with the highest median household income of $57,000 found in the 65+ years age bracket for the primary householder. A total of 142 households (64.5%) fall into this category.
| Income Bracket | # Households | Median Income |
| 15 to 24 Years | 0 (0.0%) | $0 |
| 25 to 44 Years | 44 (20.0%) | $0 |
| 45 to 64 Years | 34 (15.4%) | $0 |
| 65+ Years | 142 (64.5%) | $57,000 |
| Total | 220 (100.0%) | $53,289 |
Poverty in Avery
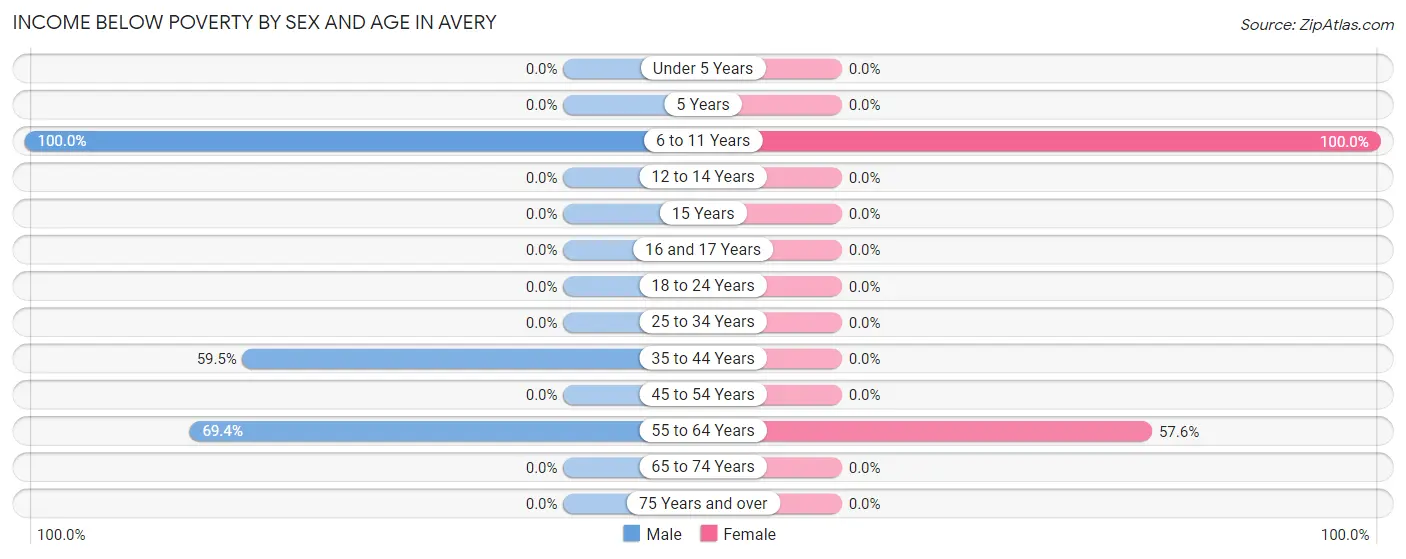
Income Below Poverty by Sex and Age in Avery
With 42.1% poverty level for males and 16.7% for females among the residents of Avery, 6 to 11 year old males and 6 to 11 year old females are the most vulnerable to poverty, with 18 males (100.0%) and 21 females (100.0%) in their respective age groups living below the poverty level.
| Age Bracket | Male | Female |
| Under 5 Years | 0 (0.0%) | 0 (0.0%) |
| 5 Years | 0 (0.0%) | 0 (0.0%) |
| 6 to 11 Years | 18 (100.0%) | 21 (100.0%) |
| 12 to 14 Years | 0 (0.0%) | 0 (0.0%) |
| 15 Years | 0 (0.0%) | 0 (0.0%) |
| 16 and 17 Years | 0 (0.0%) | 0 (0.0%) |
| 18 to 24 Years | 0 (0.0%) | 0 (0.0%) |
| 25 to 34 Years | 0 (0.0%) | 0 (0.0%) |
| 35 to 44 Years | 25 (59.5%) | 0 (0.0%) |
| 45 to 54 Years | 0 (0.0%) | 0 (0.0%) |
| 55 to 64 Years | 34 (69.4%) | 19 (57.6%) |
| 65 to 74 Years | 0 (0.0%) | 0 (0.0%) |
| 75 Years and over | 0 (0.0%) | 0 (0.0%) |
| Total | 77 (42.1%) | 40 (16.7%) |
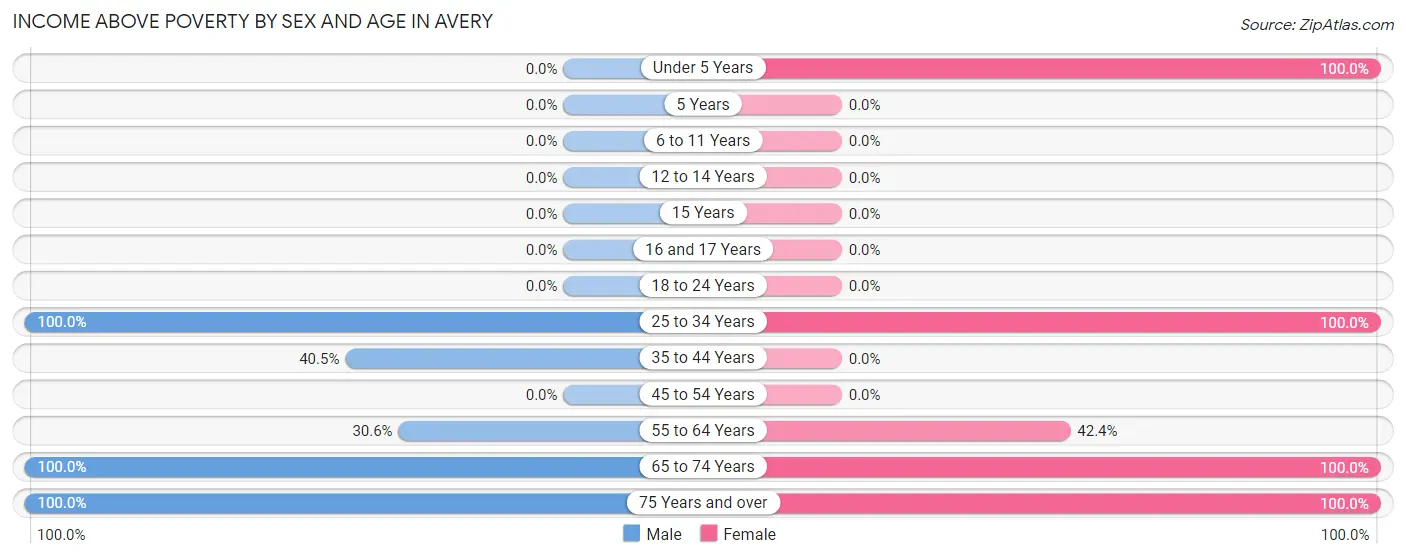
Income Above Poverty by Sex and Age in Avery
According to the poverty statistics in Avery, males aged 25 to 34 years and females aged under 5 years are the age groups that are most secure financially, with 100.0% of males and 100.0% of females in these age groups living above the poverty line.
| Age Bracket | Male | Female |
| Under 5 Years | 0 (0.0%) | 16 (100.0%) |
| 5 Years | 0 (0.0%) | 0 (0.0%) |
| 6 to 11 Years | 0 (0.0%) | 0 (0.0%) |
| 12 to 14 Years | 0 (0.0%) | 0 (0.0%) |
| 15 Years | 0 (0.0%) | 0 (0.0%) |
| 16 and 17 Years | 0 (0.0%) | 0 (0.0%) |
| 18 to 24 Years | 0 (0.0%) | 0 (0.0%) |
| 25 to 34 Years | 14 (100.0%) | 19 (100.0%) |
| 35 to 44 Years | 17 (40.5%) | 0 (0.0%) |
| 45 to 54 Years | 0 (0.0%) | 0 (0.0%) |
| 55 to 64 Years | 15 (30.6%) | 14 (42.4%) |
| 65 to 74 Years | 18 (100.0%) | 64 (100.0%) |
| 75 Years and over | 42 (100.0%) | 86 (100.0%) |
| Total | 106 (57.9%) | 199 (83.3%) |
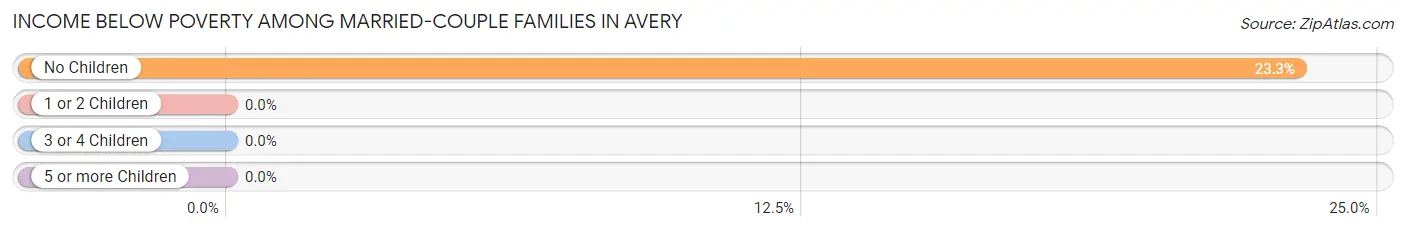
Income Below Poverty Among Married-Couple Families in Avery
The poverty statistics for married-couple families in Avery show that 19.1% or 20 of the total 105 families live below the poverty line. Families with no children have the highest poverty rate of 23.3%, comprising of 20 families. On the other hand, families with 1 or 2 children have the lowest poverty rate of 0.0%, which includes 0 families.
| Children | Above Poverty | Below Poverty |
| No Children | 66 (76.7%) | 20 (23.3%) |
| 1 or 2 Children | 19 (100.0%) | 0 (0.0%) |
| 3 or 4 Children | 0 (0.0%) | 0 (0.0%) |
| 5 or more Children | 0 (0.0%) | 0 (0.0%) |
| Total | 85 (80.9%) | 20 (19.1%) |
Income Below Poverty Among Single-Parent Households in Avery
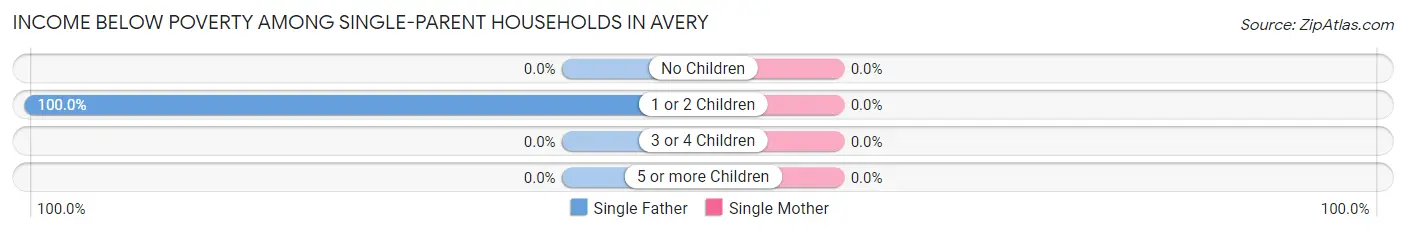
| Children | Single Father | Single Mother |
| No Children | 0 (0.0%) | 0 (0.0%) |
| 1 or 2 Children | 16 (100.0%) | 0 (0.0%) |
| 3 or 4 Children | 0 (0.0%) | 0 (0.0%) |
| 5 or more Children | 0 (0.0%) | 0 (0.0%) |
| Total | 16 (100.0%) | 0 (0.0%) |
Income Below Poverty Among Married-Couple vs Single-Parent Households in Avery
The poverty data for Avery shows that 20 of the married-couple family households (19.1%) and 16 of the single-parent households (100.0%) are living below the poverty level. Within the married-couple family households, those with no children have the highest poverty rate, with 20 households (23.3%) falling below the poverty line. Among the single-parent households, those with 1 or 2 children have the highest poverty rate, with 16 household (100.0%) living below poverty.
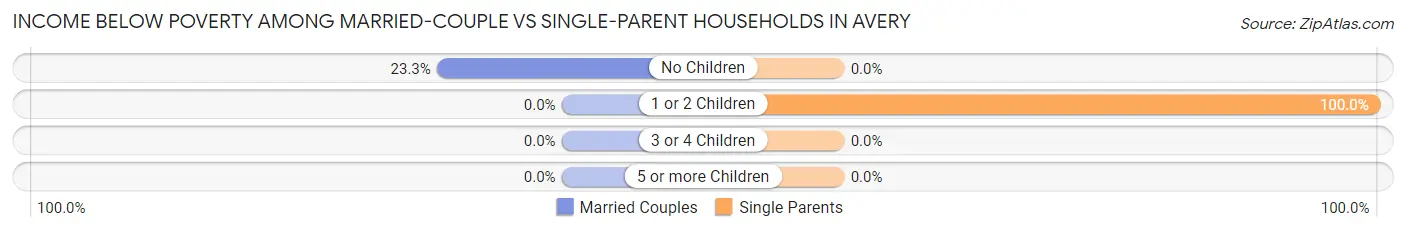
| Children | Married-Couple Families | Single-Parent Households |
| No Children | 20 (23.3%) | 0 (0.0%) |
| 1 or 2 Children | 0 (0.0%) | 16 (100.0%) |
| 3 or 4 Children | 0 (0.0%) | 0 (0.0%) |
| 5 or more Children | 0 (0.0%) | 0 (0.0%) |
| Total | 20 (19.1%) | 16 (100.0%) |
Race in Avery
The most populous races in Avery are , and White / Caucasian (422 | 100.0%).
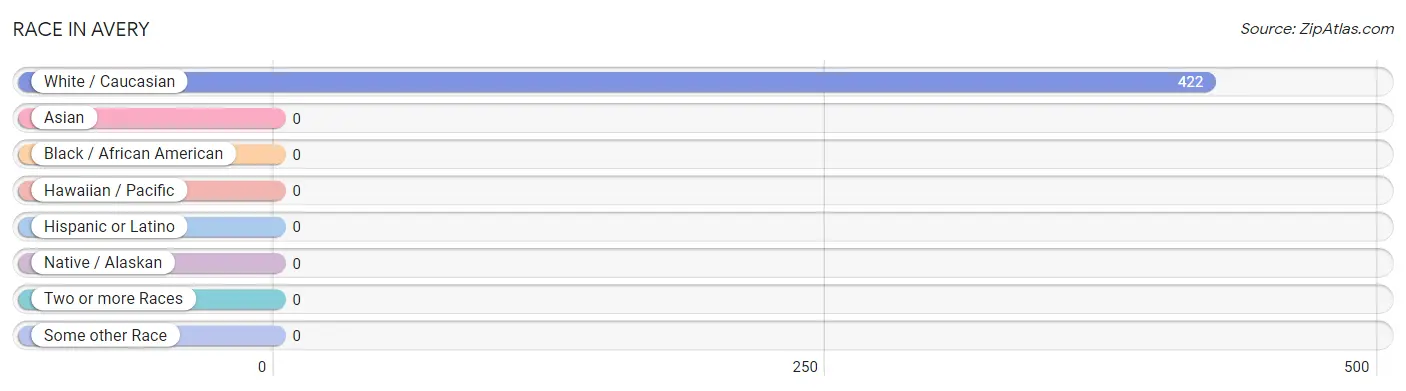
| Race | # Population | % Population |
| Asian | 0 | 0.0% |
| Black / African American | 0 | 0.0% |
| Hawaiian / Pacific | 0 | 0.0% |
| Hispanic or Latino | 0 | 0.0% |
| Native / Alaskan | 0 | 0.0% |
| White / Caucasian | 422 | 100.0% |
| Two or more Races | 0 | 0.0% |
| Some other Race | 0 | 0.0% |
| Total | 422 | 100.0% |
Ancestry in Avery
The most populous ancestries reported in Avery are English (161 | 38.2%), German (93 | 22.0%), Irish (87 | 20.6%), Scandinavian (52 | 12.3%), and French (29 | 6.9%), together accounting for 100.0% of all Avery residents.
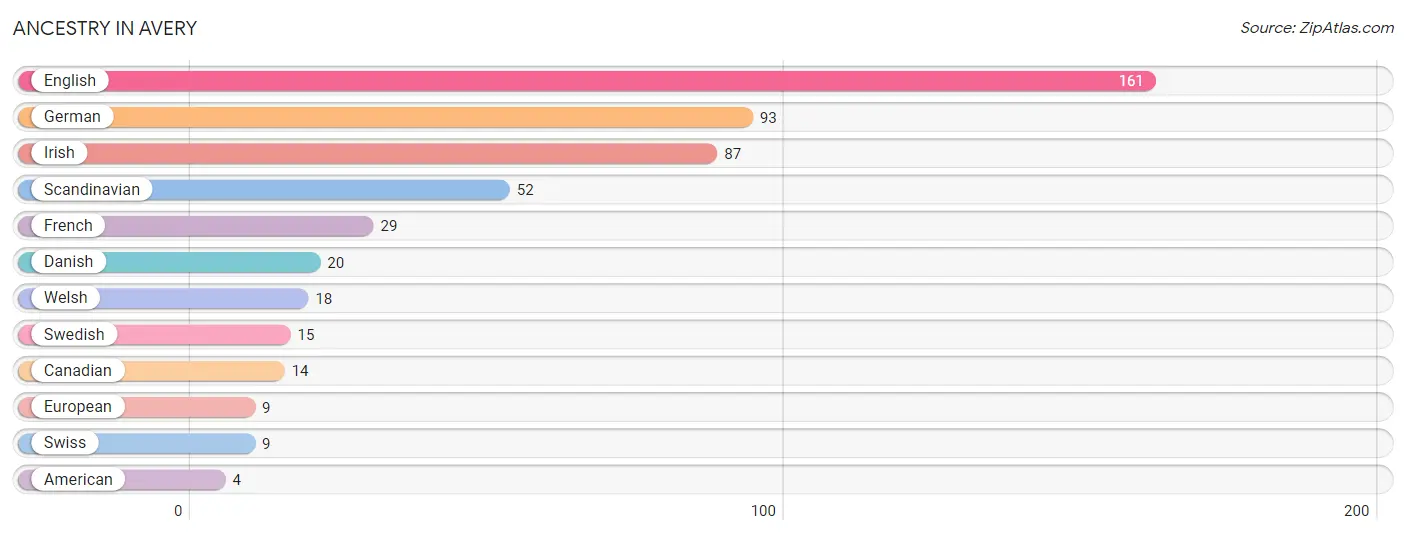
| Ancestry | # Population | % Population |
| American | 4 | 0.9% |
| Canadian | 14 | 3.3% |
| Danish | 20 | 4.7% |
| English | 161 | 38.2% |
| European | 9 | 2.1% |
| French | 29 | 6.9% |
| German | 93 | 22.0% |
| Irish | 87 | 20.6% |
| Scandinavian | 52 | 12.3% |
| Swedish | 15 | 3.5% |
| Swiss | 9 | 2.1% |
| Welsh | 18 | 4.3% | View All 12 Rows |
Immigrants in Avery

| Immigration Origin | # Population | % Population | View All 0 Rows |
Sex and Age in Avery
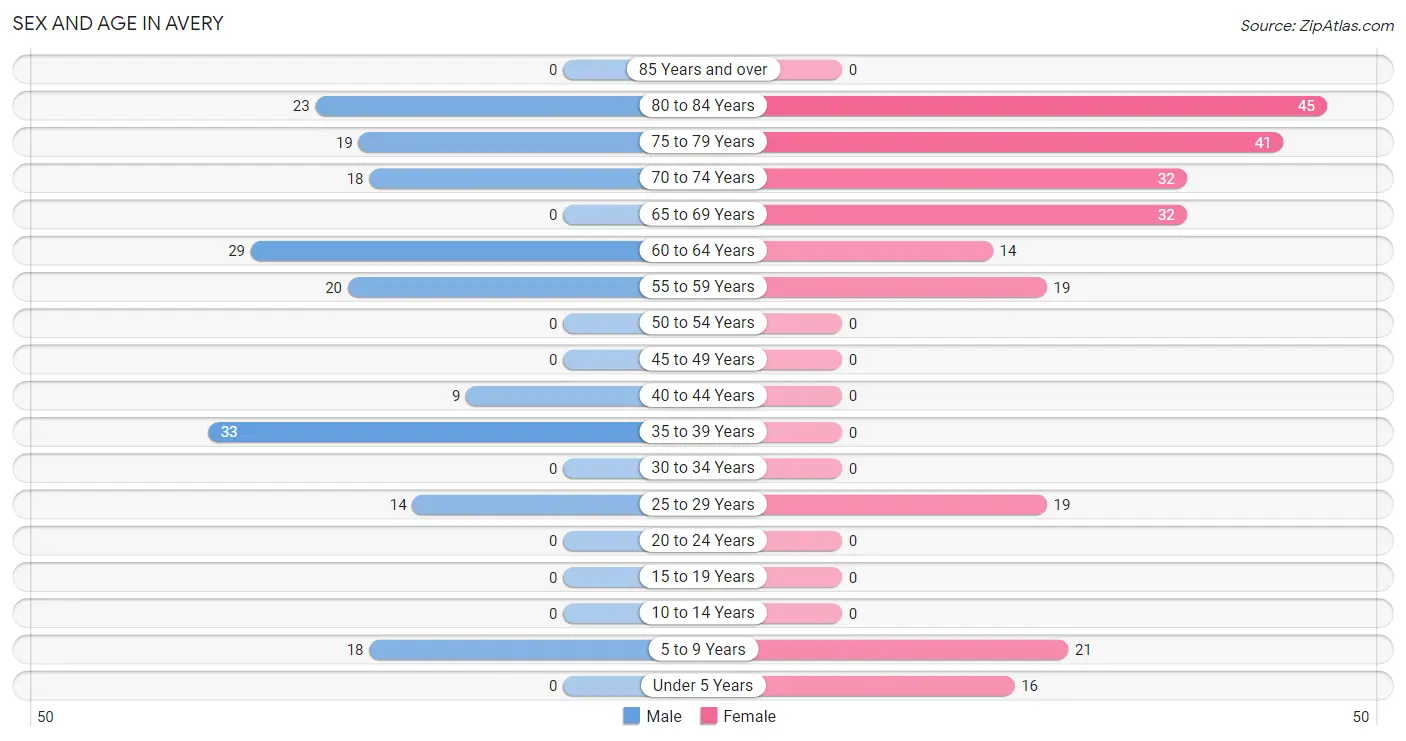
Sex and Age in Avery
The most populous age groups in Avery are 35 to 39 Years (33 | 18.0%) for men and 80 to 84 Years (45 | 18.8%) for women.
| Age Bracket | Male | Female |
| Under 5 Years | 0 (0.0%) | 16 (6.7%) |
| 5 to 9 Years | 18 (9.8%) | 21 (8.8%) |
| 10 to 14 Years | 0 (0.0%) | 0 (0.0%) |
| 15 to 19 Years | 0 (0.0%) | 0 (0.0%) |
| 20 to 24 Years | 0 (0.0%) | 0 (0.0%) |
| 25 to 29 Years | 14 (7.6%) | 19 (8.0%) |
| 30 to 34 Years | 0 (0.0%) | 0 (0.0%) |
| 35 to 39 Years | 33 (18.0%) | 0 (0.0%) |
| 40 to 44 Years | 9 (4.9%) | 0 (0.0%) |
| 45 to 49 Years | 0 (0.0%) | 0 (0.0%) |
| 50 to 54 Years | 0 (0.0%) | 0 (0.0%) |
| 55 to 59 Years | 20 (10.9%) | 19 (8.0%) |
| 60 to 64 Years | 29 (15.9%) | 14 (5.9%) |
| 65 to 69 Years | 0 (0.0%) | 32 (13.4%) |
| 70 to 74 Years | 18 (9.8%) | 32 (13.4%) |
| 75 to 79 Years | 19 (10.4%) | 41 (17.2%) |
| 80 to 84 Years | 23 (12.6%) | 45 (18.8%) |
| 85 Years and over | 0 (0.0%) | 0 (0.0%) |
| Total | 183 (100.0%) | 239 (100.0%) |
Families and Households in Avery
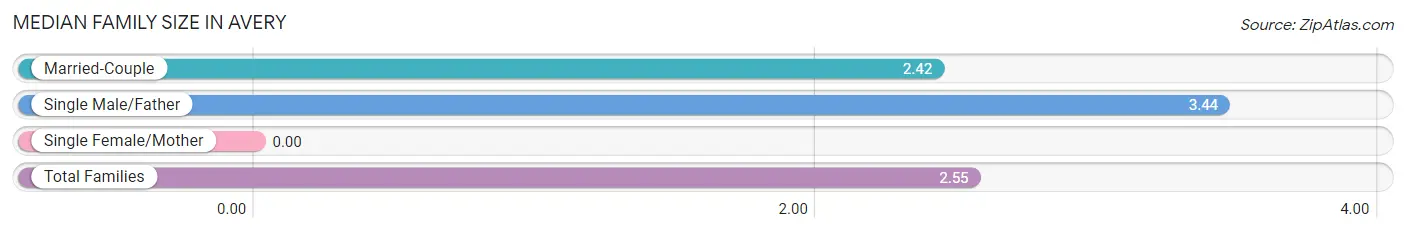
Median Family Size in Avery
| Family Type | # Families | Family Size |
| Married-Couple | 105 (86.8%) | 2.42 |
| Single Male/Father | 16 (13.2%) | 3.44 |
| Single Female/Mother | 0 (0.0%) | - |
| Total Families | 121 (100.0%) | 2.55 |
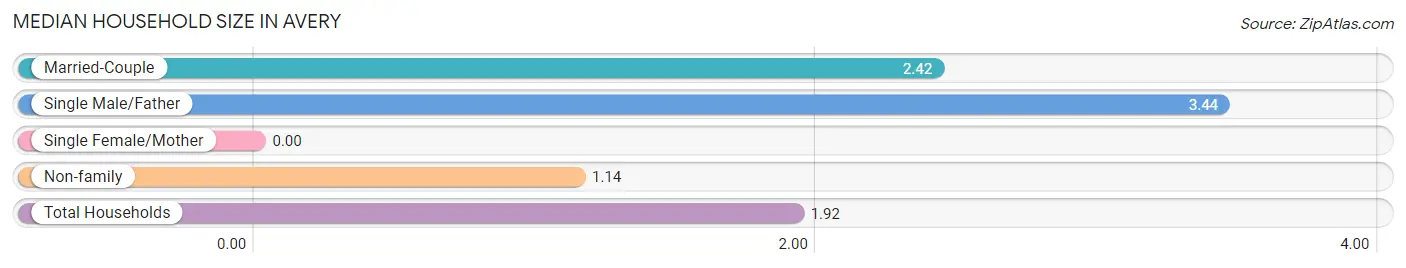
Median Household Size in Avery
| Household Type | # Households | Household Size |
| Married-Couple | 105 (47.7%) | 2.42 |
| Single Male/Father | 16 (7.3%) | 3.44 |
| Single Female/Mother | 0 (0.0%) | - |
| Non-family | 99 (45.0%) | 1.14 |
| Total Households | 220 (100.0%) | 1.92 |
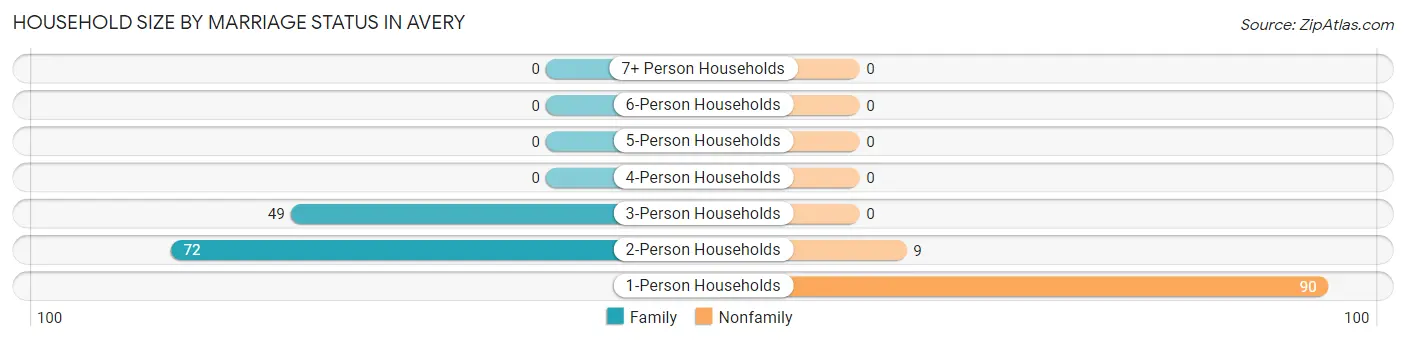
Household Size by Marriage Status in Avery
Out of a total of 220 households in Avery, 121 (55.0%) are family households, while 99 (45.0%) are nonfamily households. The most numerous type of family households are 2-person households, comprising 72, and the most common type of nonfamily households are 1-person households, comprising 90.
| Household Size | Family Households | Nonfamily Households |
| 1-Person Households | - | 90 (40.9%) |
| 2-Person Households | 72 (32.7%) | 9 (4.1%) |
| 3-Person Households | 49 (22.3%) | 0 (0.0%) |
| 4-Person Households | 0 (0.0%) | 0 (0.0%) |
| 5-Person Households | 0 (0.0%) | 0 (0.0%) |
| 6-Person Households | 0 (0.0%) | 0 (0.0%) |
| 7+ Person Households | 0 (0.0%) | 0 (0.0%) |
| Total | 121 (55.0%) | 99 (45.0%) |
Female Fertility in Avery
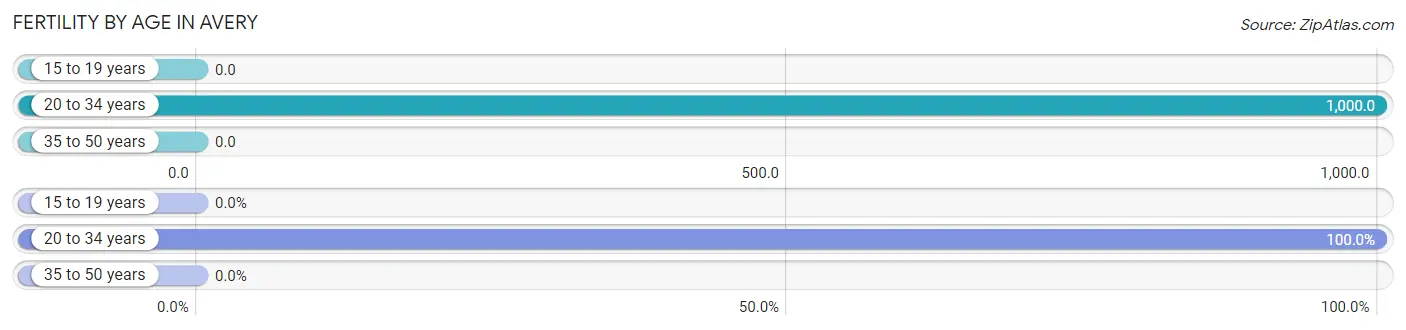
Fertility by Age in Avery
Average fertility rate in Avery is 1,000.0 births per 1,000 women. Women in the age bracket of 20 to 34 years have the highest fertility rate with 1,000.0 births per 1,000 women. Women in the age bracket of 20 to 34 years acount for 100.0% of all women with births.
| Age Bracket | Women with Births | Births / 1,000 Women |
| 15 to 19 years | 0 (0.0%) | 0.0 |
| 20 to 34 years | 19 (100.0%) | 1,000.0 |
| 35 to 50 years | 0 (0.0%) | 0.0 |
| Total | 19 (100.0%) | 1,000.0 |
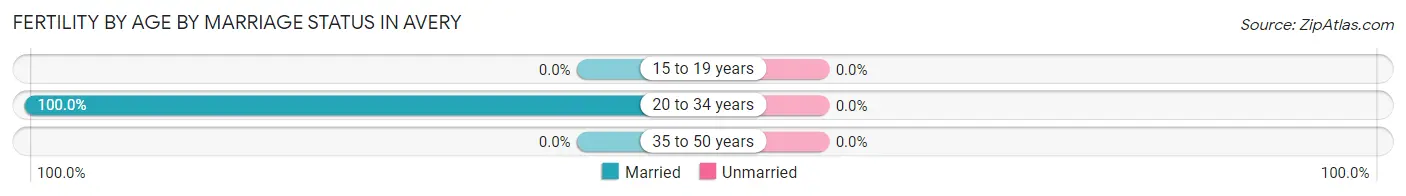
Fertility by Age by Marriage Status in Avery
| Age Bracket | Married | Unmarried |
| 15 to 19 years | 0 (0.0%) | 0 (0.0%) |
| 20 to 34 years | 19 (100.0%) | 0 (0.0%) |
| 35 to 50 years | 0 (0.0%) | 0 (0.0%) |
| Total | 19 (100.0%) | 0 (0.0%) |
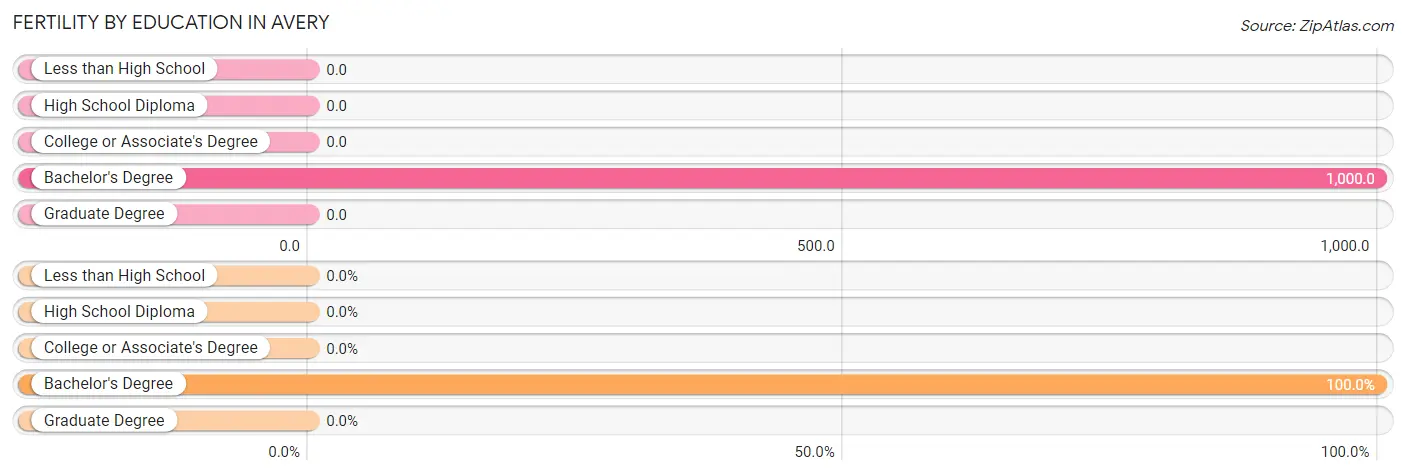
Fertility by Education in Avery
| Educational Attainment | Women with Births | Births / 1,000 Women |
| Less than High School | 0 (0.0%) | 0.0 |
| High School Diploma | 0 (0.0%) | 0.0 |
| College or Associate's Degree | 0 (0.0%) | 0.0 |
| Bachelor's Degree | 19 (100.0%) | 1,000.0 |
| Graduate Degree | 0 (0.0%) | 0.0 |
| Total | 19 (100.0%) | 1,000.0 |
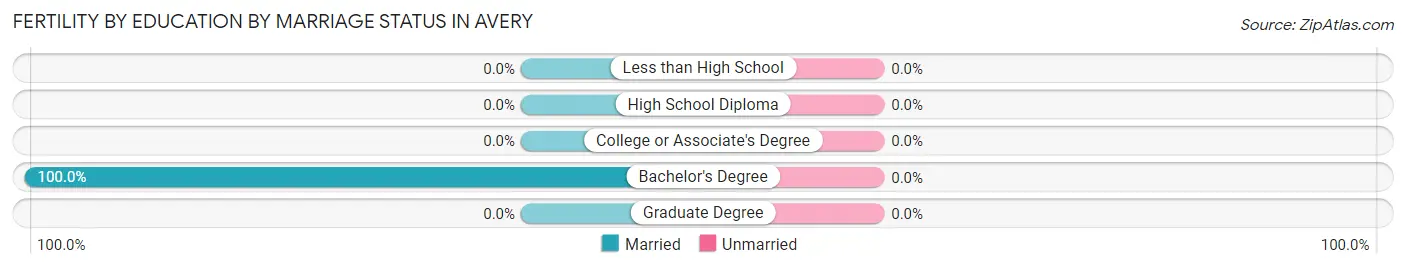
Fertility by Education by Marriage Status in Avery
| Educational Attainment | Married | Unmarried |
| Less than High School | 0 (0.0%) | 0 (0.0%) |
| High School Diploma | 0 (0.0%) | 0 (0.0%) |
| College or Associate's Degree | 0 (0.0%) | 0 (0.0%) |
| Bachelor's Degree | 19 (100.0%) | 0 (0.0%) |
| Graduate Degree | 0 (0.0%) | 0 (0.0%) |
| Total | 19 (100.0%) | 0 (0.0%) |
Employment Characteristics in Avery
Employment by Class of Employer in Avery
Among the 182 employed individuals in Avery, private company employees (108 | 59.3%), self-employed (not incorporated) (45 | 24.7%), and not-for-profit organizations (15 | 8.2%) make up the most common classes of employment.
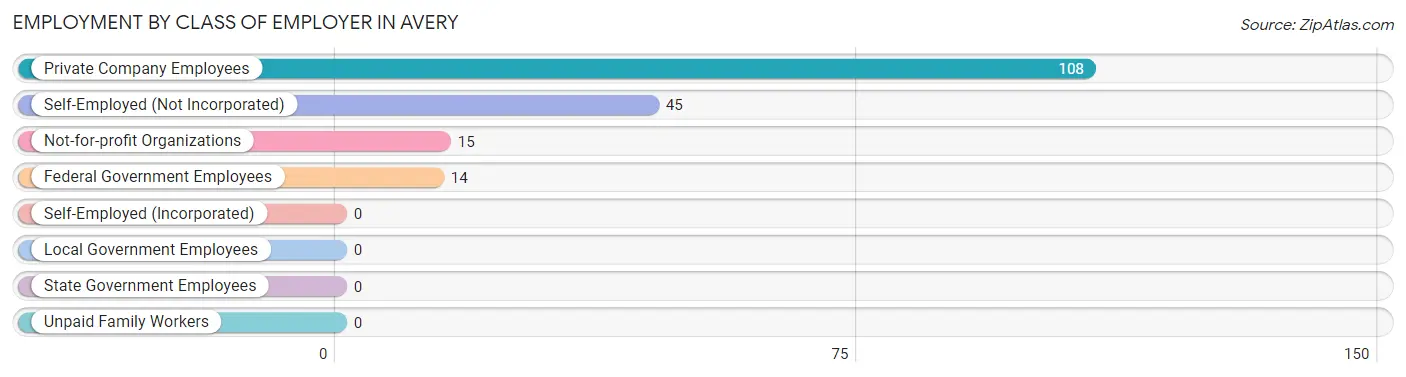
| Employer Class | # Employees | % Employees |
| Private Company Employees | 108 | 59.3% |
| Self-Employed (Incorporated) | 0 | 0.0% |
| Self-Employed (Not Incorporated) | 45 | 24.7% |
| Not-for-profit Organizations | 15 | 8.2% |
| Local Government Employees | 0 | 0.0% |
| State Government Employees | 0 | 0.0% |
| Federal Government Employees | 14 | 7.7% |
| Unpaid Family Workers | 0 | 0.0% |
| Total | 182 | 100.0% |
Employment Status by Age in Avery
According to the labor force statistics for Avery, out of the total population over 16 years of age (367), 62.7% or 230 individuals are in the labor force, with 20.9% or 48 of them unemployed. The age group with the highest labor force participation rate is 35 to 44 years, with 100.0% or 42 individuals in the labor force. Within the labor force, the 55 to 59 years age range has the highest percentage of unemployed individuals, with 100.0% or 39 of them being unemployed.
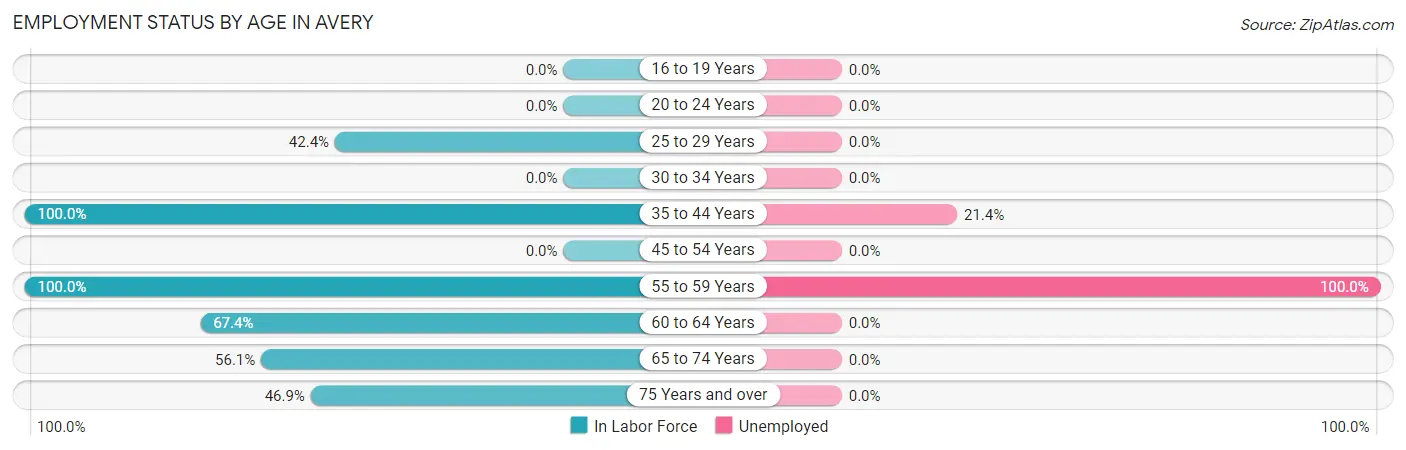
| Age Bracket | In Labor Force | Unemployed |
| 16 to 19 Years | 0 (0.0%) | 0 (0.0%) |
| 20 to 24 Years | 0 (0.0%) | 0 (0.0%) |
| 25 to 29 Years | 14 (42.4%) | 0 (0.0%) |
| 30 to 34 Years | 0 (0.0%) | 0 (0.0%) |
| 35 to 44 Years | 42 (100.0%) | 9 (21.4%) |
| 45 to 54 Years | 0 (0.0%) | 0 (0.0%) |
| 55 to 59 Years | 39 (100.0%) | 39 (100.0%) |
| 60 to 64 Years | 29 (67.4%) | 0 (0.0%) |
| 65 to 74 Years | 46 (56.1%) | 0 (0.0%) |
| 75 Years and over | 60 (46.9%) | 0 (0.0%) |
| Total | 230 (62.7%) | 48 (20.9%) |
Employment Status by Educational Attainment in Avery
According to labor force statistics for Avery, 79.0% of individuals (124) out of the total population between 25 and 64 years of age (157) are in the labor force, with 38.7% or 48 of them being unemployed. The group with the highest labor force participation rate are those with the educational attainment of college / associate degree, with 100.0% or 44 individuals in the labor force. Within the labor force, individuals with high school diploma education have the highest percentage of unemployment, with 100.0% or 28 of them being unemployed.
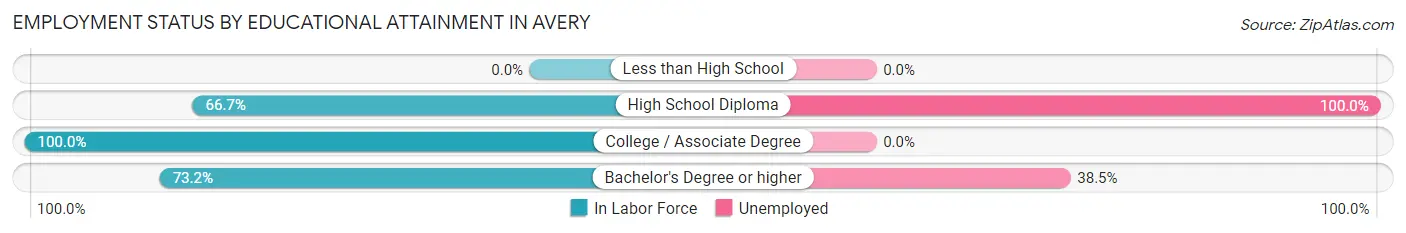
| Educational Attainment | In Labor Force | Unemployed |
| Less than High School | 0 (0.0%) | 0 (0.0%) |
| High School Diploma | 28 (66.7%) | 42 (100.0%) |
| College / Associate Degree | 44 (100.0%) | 0 (0.0%) |
| Bachelor's Degree or higher | 52 (73.2%) | 27 (38.5%) |
| Total | 124 (79.0%) | 61 (38.7%) |
Employment Occupations by Sex in Avery
Management, Business, Science and Arts Occupations
The most common Management, Business, Science and Arts occupations in Avery are Computers, Engineering & Science (60 | 33.0%), Life, Physical & Social Science (60 | 33.0%), and Management (29 | 15.9%).
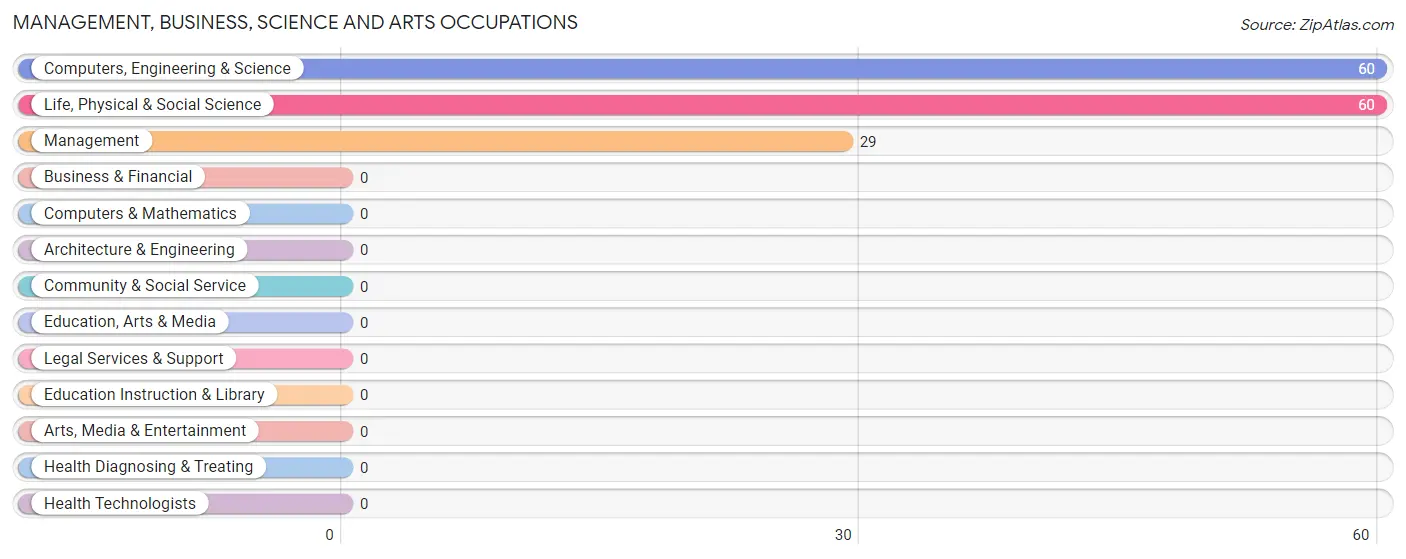
Management, Business, Science and Arts Occupations by Sex
Within the Management, Business, Science and Arts occupations in Avery, the most male-oriented occupations are Management (51.7%), Computers, Engineering & Science (25.0%), and Life, Physical & Social Science (25.0%), while the most female-oriented occupations are Computers, Engineering & Science (75.0%), Life, Physical & Social Science (75.0%), and Management (48.3%).
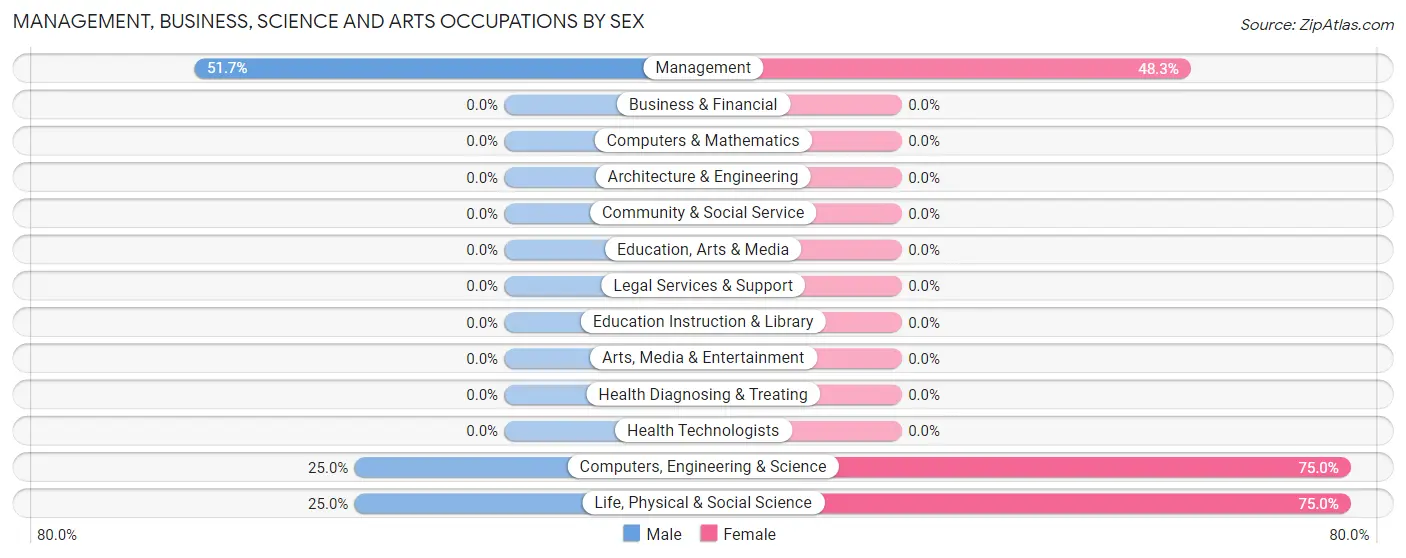
| Occupation | Male | Female |
| Management | 15 (51.7%) | 14 (48.3%) |
| Business & Financial | 0 (0.0%) | 0 (0.0%) |
| Computers, Engineering & Science | 15 (25.0%) | 45 (75.0%) |
| Computers & Mathematics | 0 (0.0%) | 0 (0.0%) |
| Architecture & Engineering | 0 (0.0%) | 0 (0.0%) |
| Life, Physical & Social Science | 15 (25.0%) | 45 (75.0%) |
| Community & Social Service | 0 (0.0%) | 0 (0.0%) |
| Education, Arts & Media | 0 (0.0%) | 0 (0.0%) |
| Legal Services & Support | 0 (0.0%) | 0 (0.0%) |
| Education Instruction & Library | 0 (0.0%) | 0 (0.0%) |
| Arts, Media & Entertainment | 0 (0.0%) | 0 (0.0%) |
| Health Diagnosing & Treating | 0 (0.0%) | 0 (0.0%) |
| Health Technologists | 0 (0.0%) | 0 (0.0%) |
| Total (Category) | 30 (33.7%) | 59 (66.3%) |
| Total (Overall) | 77 (42.3%) | 105 (57.7%) |
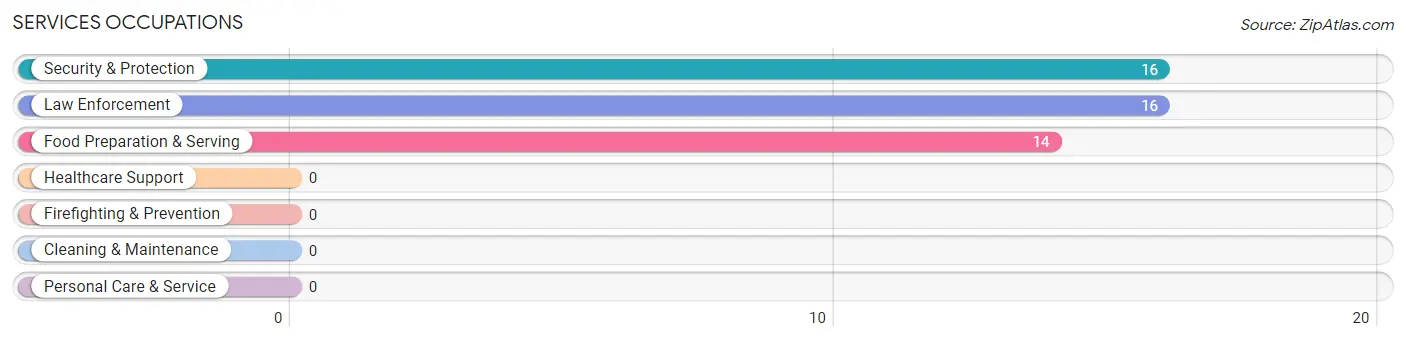
Services Occupations
The most common Services occupations in Avery are Security & Protection (16 | 8.8%), Law Enforcement (16 | 8.8%), and Food Preparation & Serving (14 | 7.7%).
Services Occupations by Sex
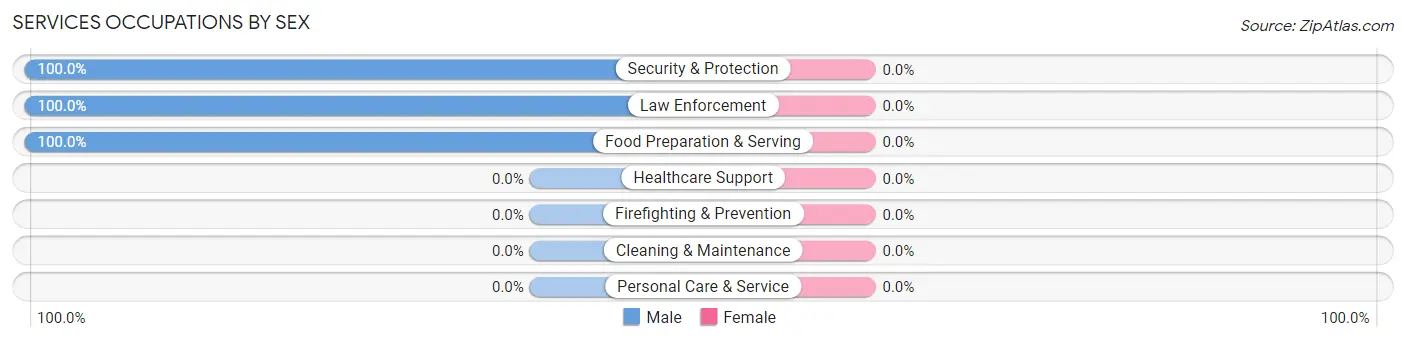
| Occupation | Male | Female |
| Healthcare Support | 0 (0.0%) | 0 (0.0%) |
| Security & Protection | 16 (100.0%) | 0 (0.0%) |
| Firefighting & Prevention | 0 (0.0%) | 0 (0.0%) |
| Law Enforcement | 16 (100.0%) | 0 (0.0%) |
| Food Preparation & Serving | 14 (100.0%) | 0 (0.0%) |
| Cleaning & Maintenance | 0 (0.0%) | 0 (0.0%) |
| Personal Care & Service | 0 (0.0%) | 0 (0.0%) |
| Total (Category) | 30 (100.0%) | 0 (0.0%) |
| Total (Overall) | 77 (42.3%) | 105 (57.7%) |
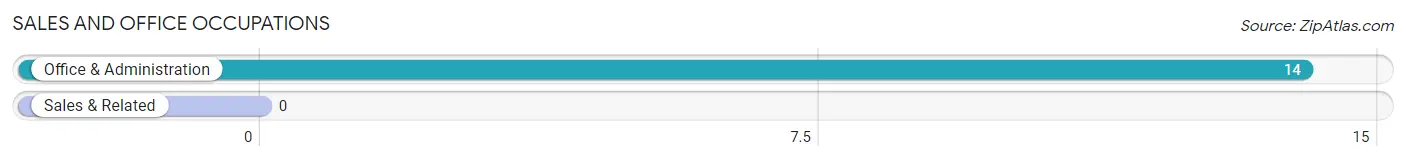
Sales and Office Occupations
The most common Sales and Office occupations in Avery are , and Office & Administration (14 | 7.7%).
Sales and Office Occupations by Sex
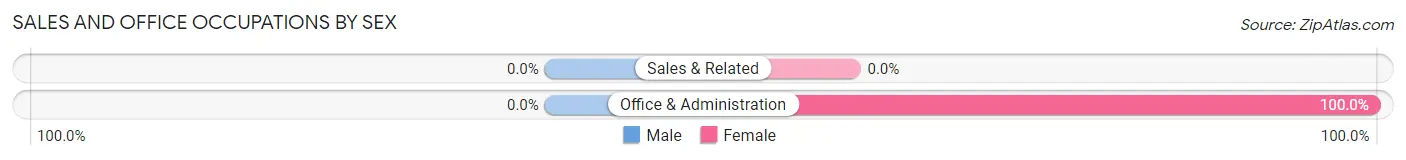
| Occupation | Male | Female |
| Sales & Related | 0 (0.0%) | 0 (0.0%) |
| Office & Administration | 0 (0.0%) | 14 (100.0%) |
| Total (Category) | 0 (0.0%) | 14 (100.0%) |
| Total (Overall) | 77 (42.3%) | 105 (57.7%) |
Natural Resources, Construction and Maintenance Occupations
The most common Natural Resources, Construction and Maintenance occupations in Avery are , and Construction & Extraction (17 | 9.3%).
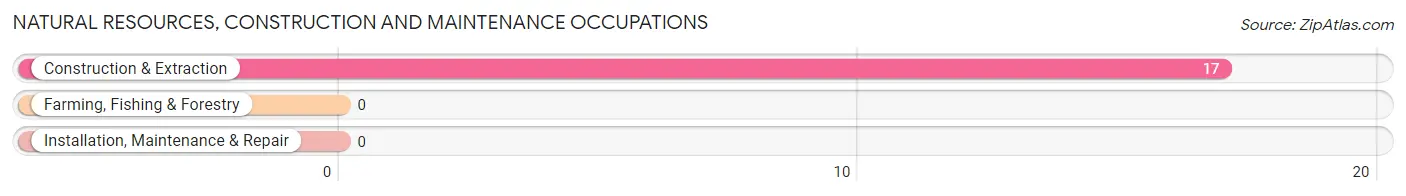
Natural Resources, Construction and Maintenance Occupations by Sex
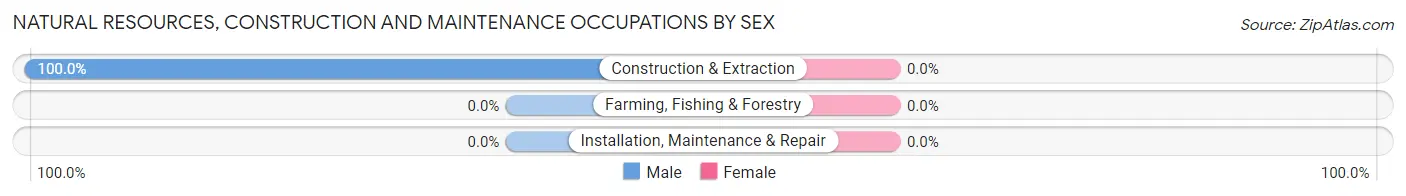
| Occupation | Male | Female |
| Farming, Fishing & Forestry | 0 (0.0%) | 0 (0.0%) |
| Construction & Extraction | 17 (100.0%) | 0 (0.0%) |
| Installation, Maintenance & Repair | 0 (0.0%) | 0 (0.0%) |
| Total (Category) | 17 (100.0%) | 0 (0.0%) |
| Total (Overall) | 77 (42.3%) | 105 (57.7%) |
Production, Transportation and Moving Occupations
The most common Production, Transportation and Moving occupations in Avery are , and Material Moving (32 | 17.6%).
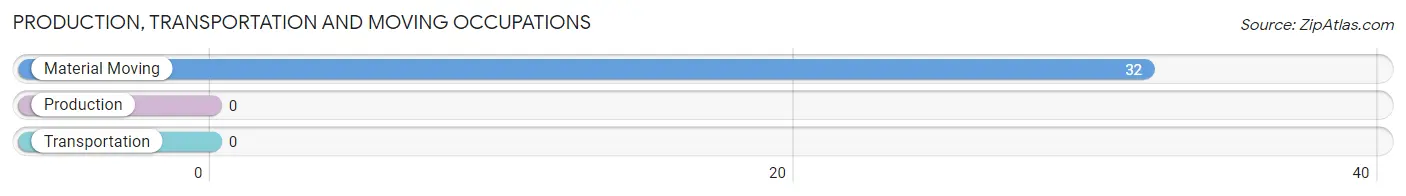
Production, Transportation and Moving Occupations by Sex
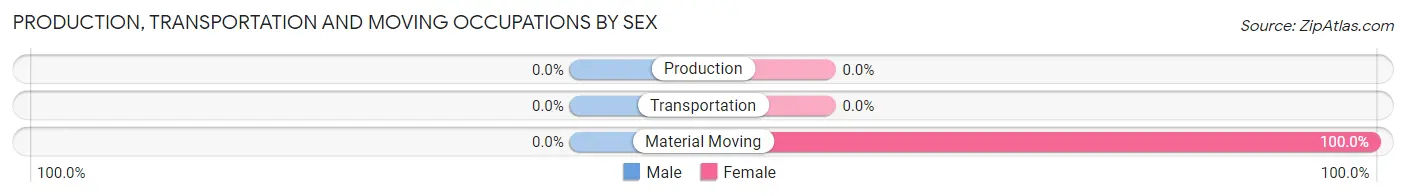
| Occupation | Male | Female |
| Production | 0 (0.0%) | 0 (0.0%) |
| Transportation | 0 (0.0%) | 0 (0.0%) |
| Material Moving | 0 (0.0%) | 32 (100.0%) |
| Total (Category) | 0 (0.0%) | 32 (100.0%) |
| Total (Overall) | 77 (42.3%) | 105 (57.7%) |
Employment Industries by Sex in Avery
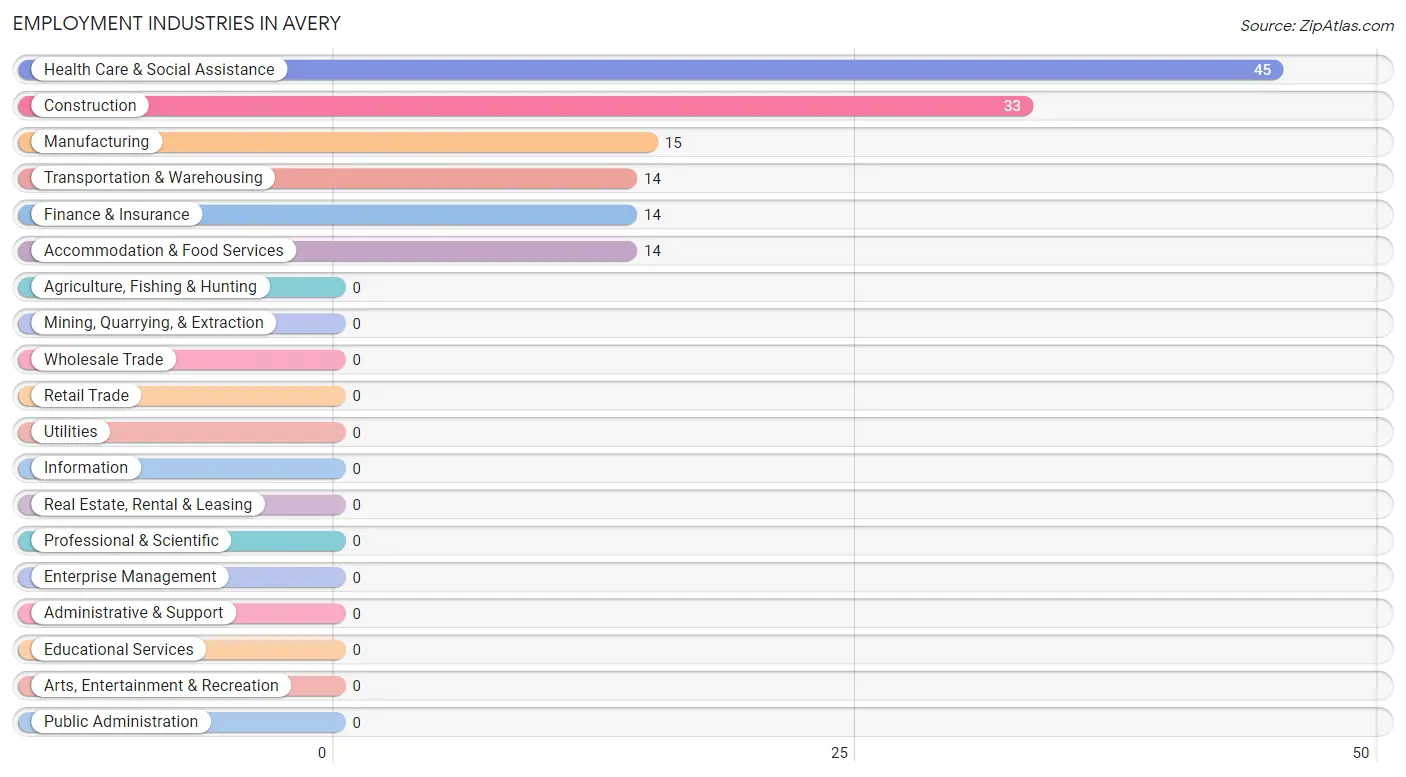
Employment Industries in Avery
The major employment industries in Avery include Health Care & Social Assistance (45 | 24.7%), Construction (33 | 18.1%), Manufacturing (15 | 8.2%), Transportation & Warehousing (14 | 7.7%), and Finance & Insurance (14 | 7.7%).
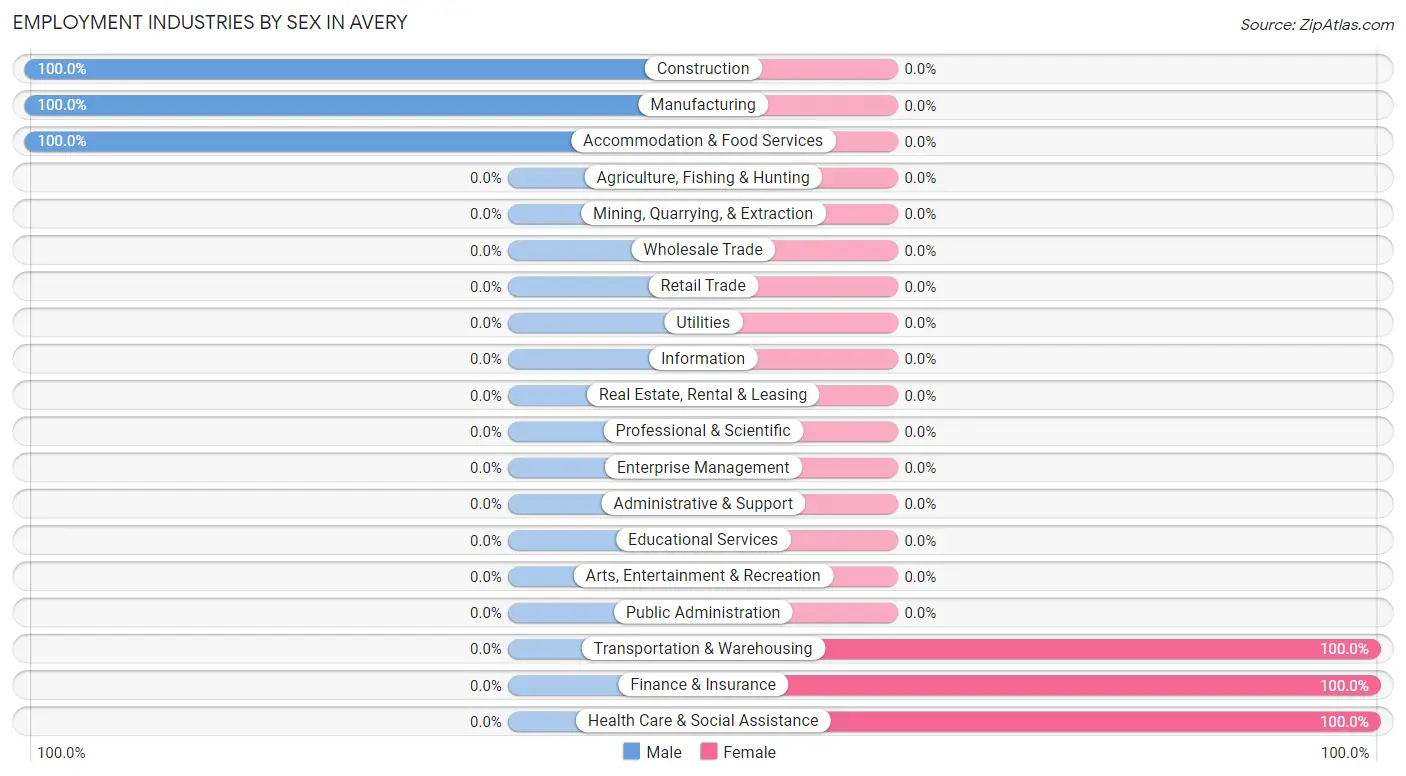
Employment Industries by Sex in Avery
The Avery industries that see more men than women are Construction (100.0%), Manufacturing (100.0%), and Accommodation & Food Services (100.0%), whereas the industries that tend to have a higher number of women are Transportation & Warehousing (100.0%), Finance & Insurance (100.0%), and Health Care & Social Assistance (100.0%).
| Industry | Male | Female |
| Agriculture, Fishing & Hunting | 0 (0.0%) | 0 (0.0%) |
| Mining, Quarrying, & Extraction | 0 (0.0%) | 0 (0.0%) |
| Construction | 33 (100.0%) | 0 (0.0%) |
| Manufacturing | 15 (100.0%) | 0 (0.0%) |
| Wholesale Trade | 0 (0.0%) | 0 (0.0%) |
| Retail Trade | 0 (0.0%) | 0 (0.0%) |
| Transportation & Warehousing | 0 (0.0%) | 14 (100.0%) |
| Utilities | 0 (0.0%) | 0 (0.0%) |
| Information | 0 (0.0%) | 0 (0.0%) |
| Finance & Insurance | 0 (0.0%) | 14 (100.0%) |
| Real Estate, Rental & Leasing | 0 (0.0%) | 0 (0.0%) |
| Professional & Scientific | 0 (0.0%) | 0 (0.0%) |
| Enterprise Management | 0 (0.0%) | 0 (0.0%) |
| Administrative & Support | 0 (0.0%) | 0 (0.0%) |
| Educational Services | 0 (0.0%) | 0 (0.0%) |
| Health Care & Social Assistance | 0 (0.0%) | 45 (100.0%) |
| Arts, Entertainment & Recreation | 0 (0.0%) | 0 (0.0%) |
| Accommodation & Food Services | 14 (100.0%) | 0 (0.0%) |
| Public Administration | 0 (0.0%) | 0 (0.0%) |
| Total | 77 (42.3%) | 105 (57.7%) |
Education in Avery
School Enrollment in Avery
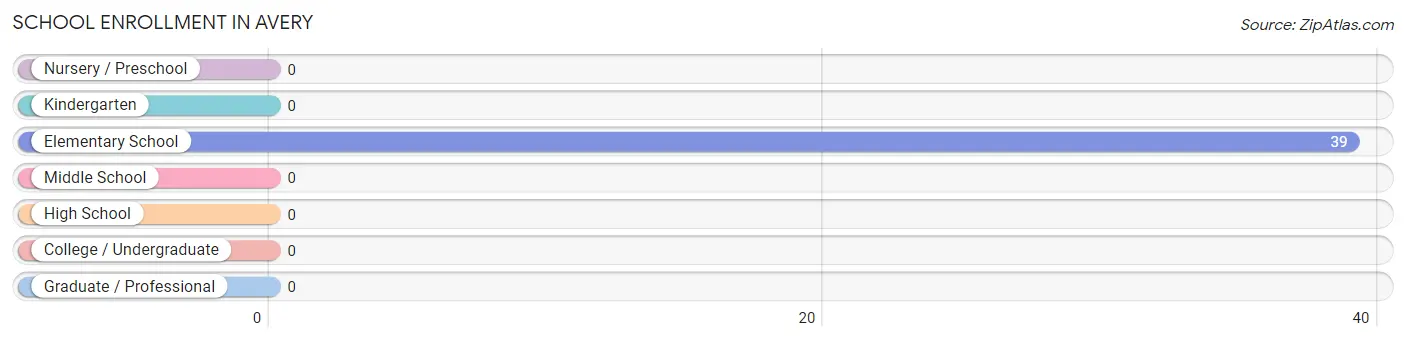
| School Level | # Students | % Students |
| Nursery / Preschool | 0 | 0.0% |
| Kindergarten | 0 | 0.0% |
| Elementary School | 39 | 100.0% |
| Middle School | 0 | 0.0% |
| High School | 0 | 0.0% |
| College / Undergraduate | 0 | 0.0% |
| Graduate / Professional | 0 | 0.0% |
| Total | 39 | 100.0% |
School Enrollment by Age by Funding Source in Avery
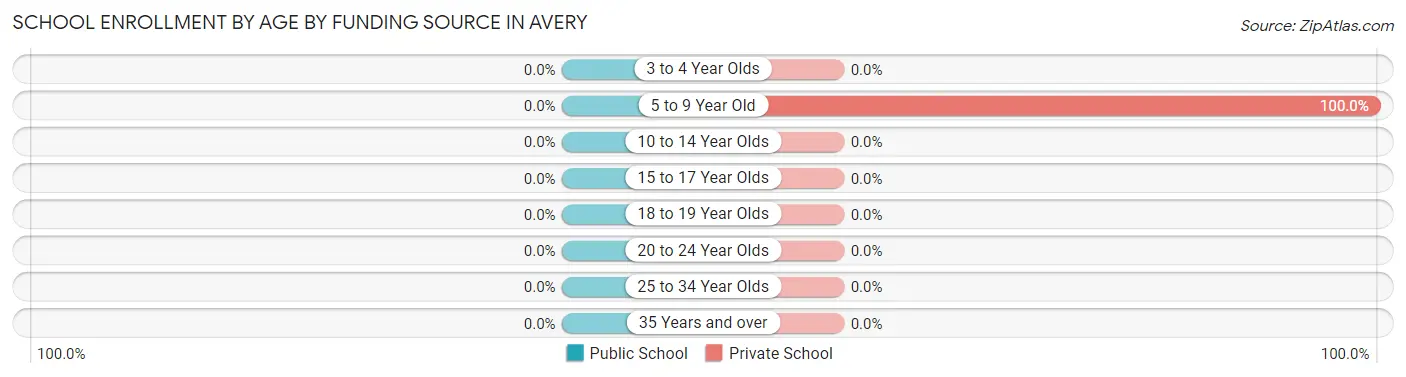
| Age Bracket | Public School | Private School |
| 3 to 4 Year Olds | 0 (0.0%) | 0 (0.0%) |
| 5 to 9 Year Old | 0 (0.0%) | 39 (100.0%) |
| 10 to 14 Year Olds | 0 (0.0%) | 0 (0.0%) |
| 15 to 17 Year Olds | 0 (0.0%) | 0 (0.0%) |
| 18 to 19 Year Olds | 0 (0.0%) | 0 (0.0%) |
| 20 to 24 Year Olds | 0 (0.0%) | 0 (0.0%) |
| 25 to 34 Year Olds | 0 (0.0%) | 0 (0.0%) |
| 35 Years and over | 0 (0.0%) | 0 (0.0%) |
| Total | 0 (0.0%) | 39 (100.0%) |
Educational Attainment by Field of Study in Avery
Psychology (45 | 36.0%), social sciences (36 | 28.8%), bio, nature & agricultural (35 | 28.0%), and business (9 | 7.2%) are the most common fields of study among 125 individuals in Avery who have obtained a bachelor's degree or higher.
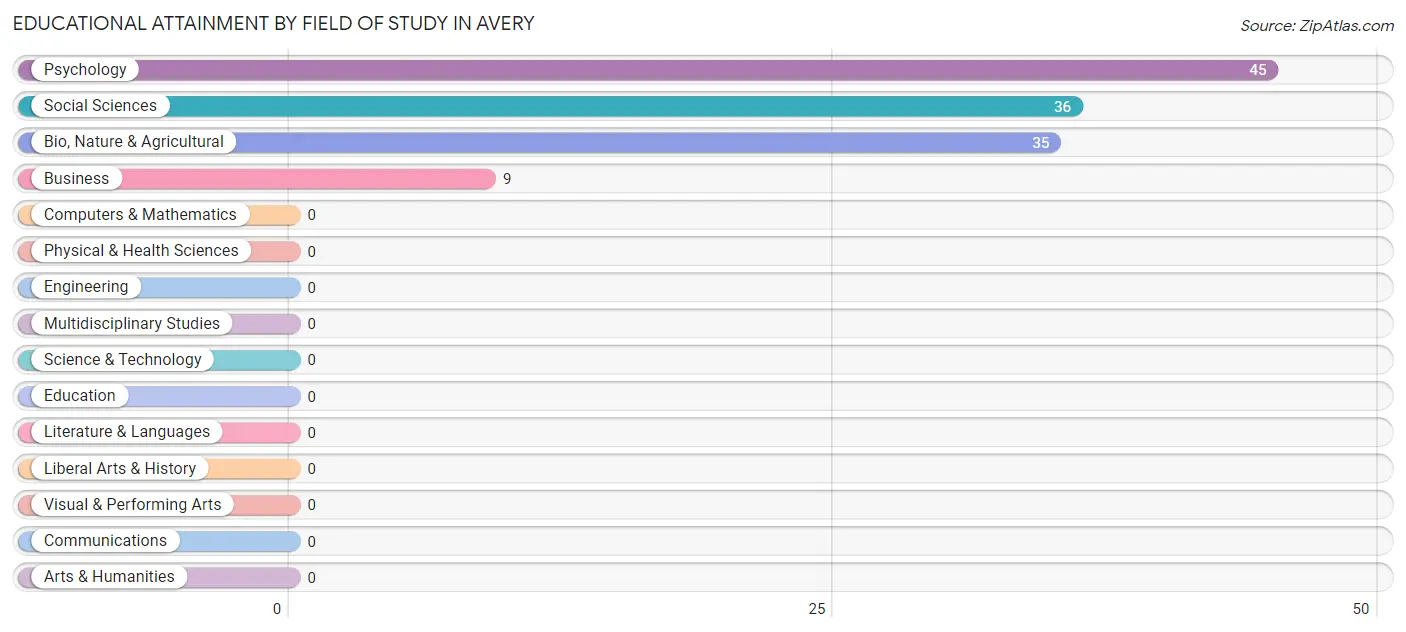
| Field of Study | # Graduates | % Graduates |
| Computers & Mathematics | 0 | 0.0% |
| Bio, Nature & Agricultural | 35 | 28.0% |
| Physical & Health Sciences | 0 | 0.0% |
| Psychology | 45 | 36.0% |
| Social Sciences | 36 | 28.8% |
| Engineering | 0 | 0.0% |
| Multidisciplinary Studies | 0 | 0.0% |
| Science & Technology | 0 | 0.0% |
| Business | 9 | 7.2% |
| Education | 0 | 0.0% |
| Literature & Languages | 0 | 0.0% |
| Liberal Arts & History | 0 | 0.0% |
| Visual & Performing Arts | 0 | 0.0% |
| Communications | 0 | 0.0% |
| Arts & Humanities | 0 | 0.0% |
| Total | 125 | 100.0% |
Transportation & Commute in Avery
Vehicle Availability by Sex in Avery
The most prevalent vehicle ownership categories in Avery are males with 4 vehicles (29, accounting for 37.7%) and females with 4 vehicles (14, making up 27.6%).
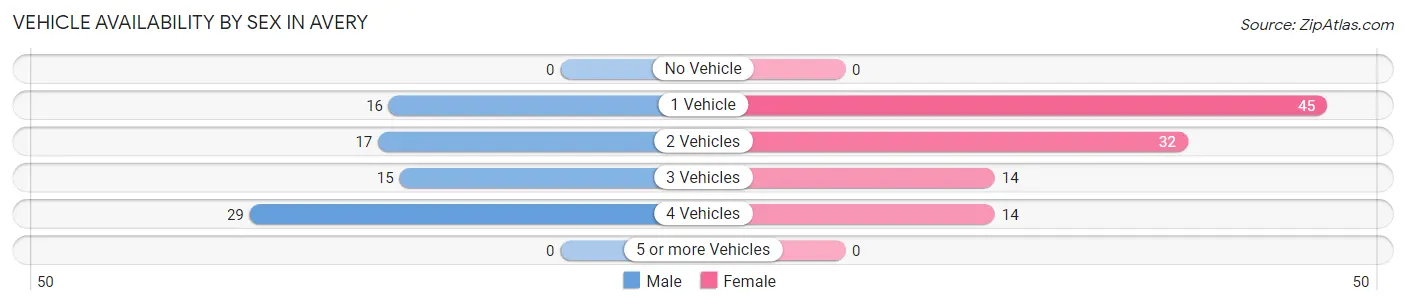
| Vehicles Available | Male | Female |
| No Vehicle | 0 (0.0%) | 0 (0.0%) |
| 1 Vehicle | 16 (20.8%) | 45 (42.9%) |
| 2 Vehicles | 17 (22.1%) | 32 (30.5%) |
| 3 Vehicles | 15 (19.5%) | 14 (13.3%) |
| 4 Vehicles | 29 (37.7%) | 14 (13.3%) |
| 5 or more Vehicles | 0 (0.0%) | 0 (0.0%) |
| Total | 77 (100.0%) | 105 (100.0%) |
Commute Time in Avery
The most frequently occuring commute durations in Avery are 10 to 14 minutes (43 commuters, 47.8%), 20 to 24 minutes (17 commuters, 18.9%), and 30 to 34 minutes (16 commuters, 17.8%).
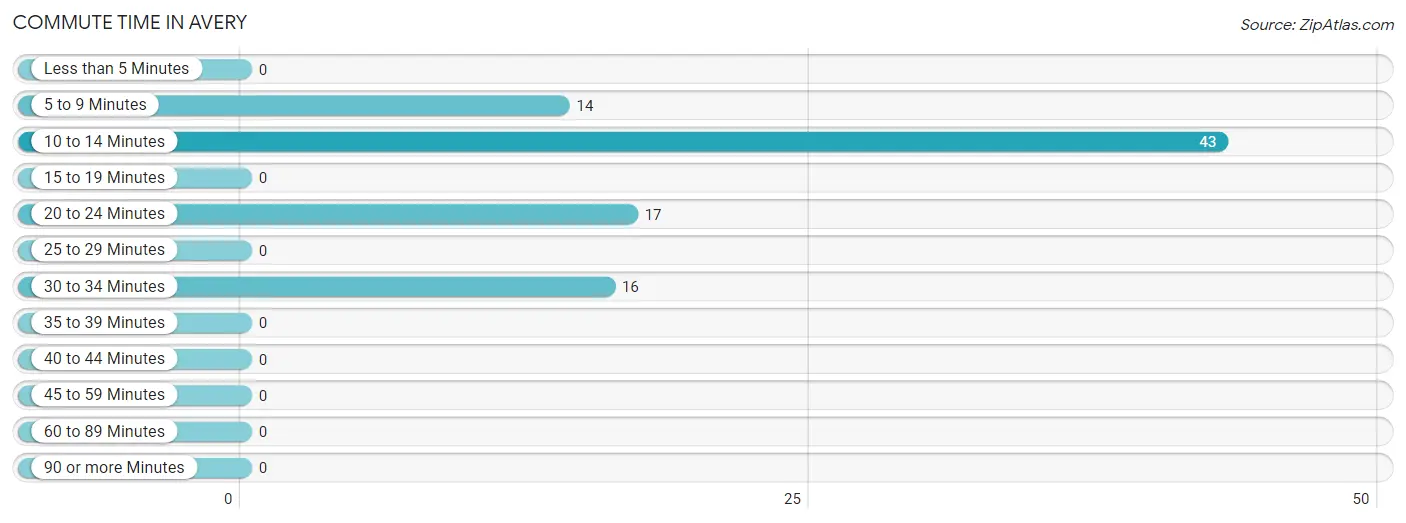
| Commute Time | # Commuters | % Commuters |
| Less than 5 Minutes | 0 | 0.0% |
| 5 to 9 Minutes | 14 | 15.6% |
| 10 to 14 Minutes | 43 | 47.8% |
| 15 to 19 Minutes | 0 | 0.0% |
| 20 to 24 Minutes | 17 | 18.9% |
| 25 to 29 Minutes | 0 | 0.0% |
| 30 to 34 Minutes | 16 | 17.8% |
| 35 to 39 Minutes | 0 | 0.0% |
| 40 to 44 Minutes | 0 | 0.0% |
| 45 to 59 Minutes | 0 | 0.0% |
| 60 to 89 Minutes | 0 | 0.0% |
| 90 or more Minutes | 0 | 0.0% |
Commute Time by Sex in Avery
The most common commute times in Avery are 10 to 14 minutes (29 commuters, 46.8%) for males and 5 to 9 minutes (14 commuters, 50.0%) for females.
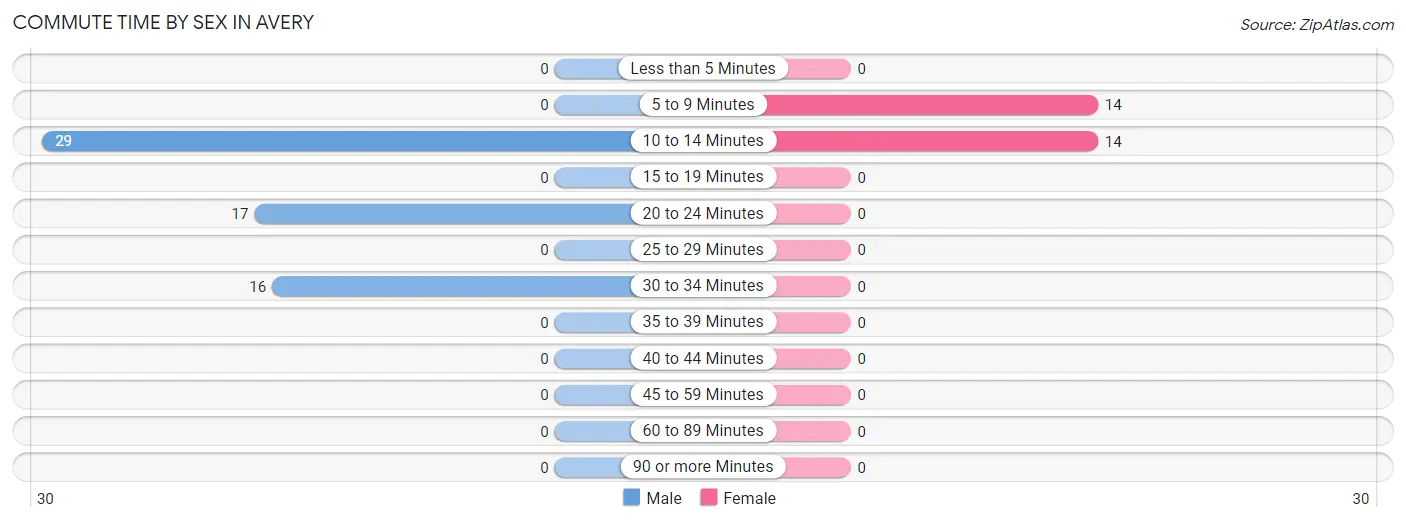
| Commute Time | Male | Female |
| Less than 5 Minutes | 0 (0.0%) | 0 (0.0%) |
| 5 to 9 Minutes | 0 (0.0%) | 14 (50.0%) |
| 10 to 14 Minutes | 29 (46.8%) | 14 (50.0%) |
| 15 to 19 Minutes | 0 (0.0%) | 0 (0.0%) |
| 20 to 24 Minutes | 17 (27.4%) | 0 (0.0%) |
| 25 to 29 Minutes | 0 (0.0%) | 0 (0.0%) |
| 30 to 34 Minutes | 16 (25.8%) | 0 (0.0%) |
| 35 to 39 Minutes | 0 (0.0%) | 0 (0.0%) |
| 40 to 44 Minutes | 0 (0.0%) | 0 (0.0%) |
| 45 to 59 Minutes | 0 (0.0%) | 0 (0.0%) |
| 60 to 89 Minutes | 0 (0.0%) | 0 (0.0%) |
| 90 or more Minutes | 0 (0.0%) | 0 (0.0%) |
Time of Departure to Work by Sex in Avery
The most frequent times of departure to work in Avery are 7:30 AM to 7:59 AM (33, 53.2%) for males and 7:30 AM to 7:59 AM (14, 50.0%) for females.
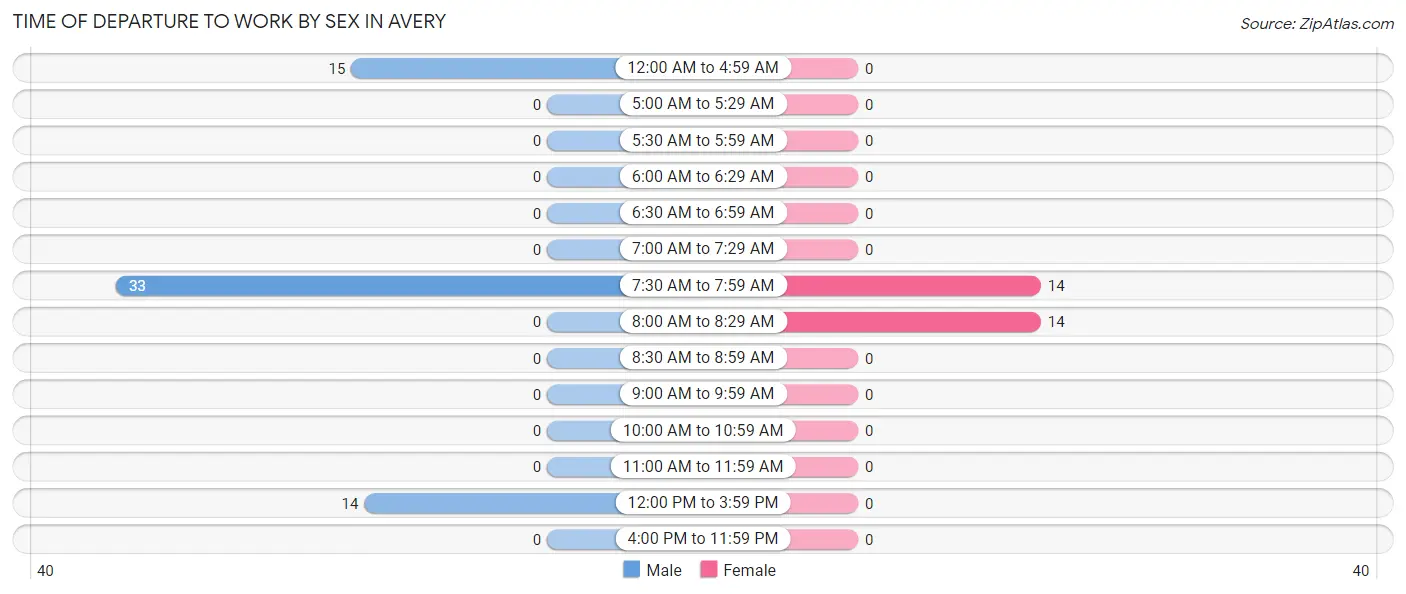
| Time of Departure | Male | Female |
| 12:00 AM to 4:59 AM | 15 (24.2%) | 0 (0.0%) |
| 5:00 AM to 5:29 AM | 0 (0.0%) | 0 (0.0%) |
| 5:30 AM to 5:59 AM | 0 (0.0%) | 0 (0.0%) |
| 6:00 AM to 6:29 AM | 0 (0.0%) | 0 (0.0%) |
| 6:30 AM to 6:59 AM | 0 (0.0%) | 0 (0.0%) |
| 7:00 AM to 7:29 AM | 0 (0.0%) | 0 (0.0%) |
| 7:30 AM to 7:59 AM | 33 (53.2%) | 14 (50.0%) |
| 8:00 AM to 8:29 AM | 0 (0.0%) | 14 (50.0%) |
| 8:30 AM to 8:59 AM | 0 (0.0%) | 0 (0.0%) |
| 9:00 AM to 9:59 AM | 0 (0.0%) | 0 (0.0%) |
| 10:00 AM to 10:59 AM | 0 (0.0%) | 0 (0.0%) |
| 11:00 AM to 11:59 AM | 0 (0.0%) | 0 (0.0%) |
| 12:00 PM to 3:59 PM | 14 (22.6%) | 0 (0.0%) |
| 4:00 PM to 11:59 PM | 0 (0.0%) | 0 (0.0%) |
| Total | 62 (100.0%) | 28 (100.0%) |
Housing Occupancy in Avery
Occupancy by Ownership in Avery
Of the total 220 dwellings in Avery, owner-occupied units account for 206 (93.6%), while renter-occupied units make up 14 (6.4%).
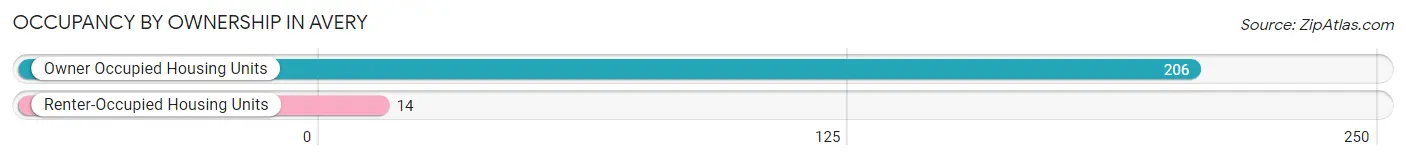
| Occupancy | # Housing Units | % Housing Units |
| Owner Occupied Housing Units | 206 | 93.6% |
| Renter-Occupied Housing Units | 14 | 6.4% |
| Total Occupied Housing Units | 220 | 100.0% |
Occupancy by Household Size in Avery
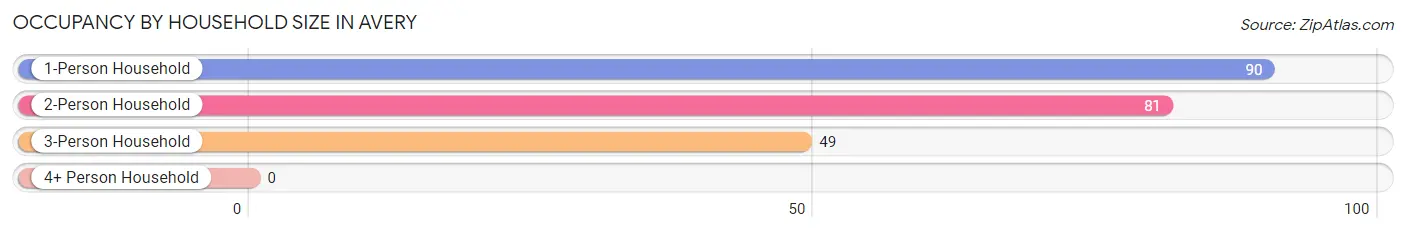
| Household Size | # Housing Units | % Housing Units |
| 1-Person Household | 90 | 40.9% |
| 2-Person Household | 81 | 36.8% |
| 3-Person Household | 49 | 22.3% |
| 4+ Person Household | 0 | 0.0% |
| Total Housing Units | 220 | 100.0% |
Occupancy by Ownership by Household Size in Avery
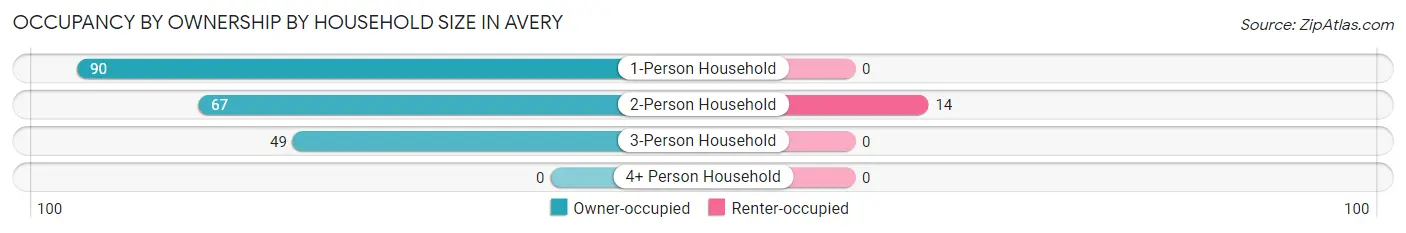
| Household Size | Owner-occupied | Renter-occupied |
| 1-Person Household | 90 (100.0%) | 0 (0.0%) |
| 2-Person Household | 67 (82.7%) | 14 (17.3%) |
| 3-Person Household | 49 (100.0%) | 0 (0.0%) |
| 4+ Person Household | 0 (0.0%) | 0 (0.0%) |
| Total Housing Units | 206 (93.6%) | 14 (6.4%) |
Occupancy by Educational Attainment in Avery
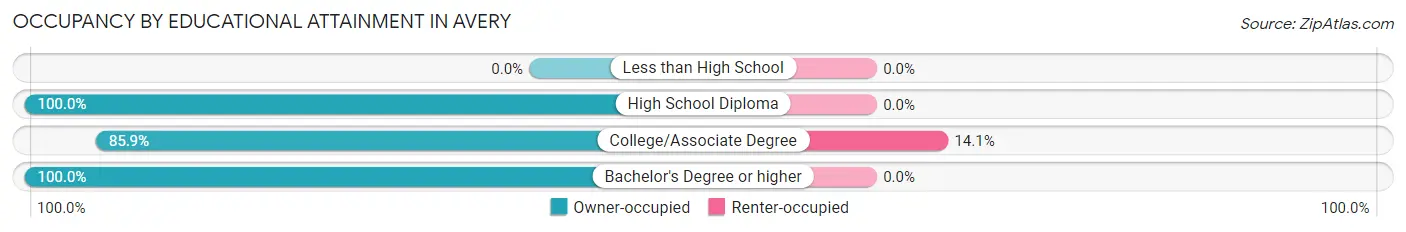
| Household Size | Owner-occupied | Renter-occupied |
| Less than High School | 0 (0.0%) | 0 (0.0%) |
| High School Diploma | 28 (100.0%) | 0 (0.0%) |
| College/Associate Degree | 85 (85.9%) | 14 (14.1%) |
| Bachelor's Degree or higher | 93 (100.0%) | 0 (0.0%) |
Occupancy by Age of Householder in Avery
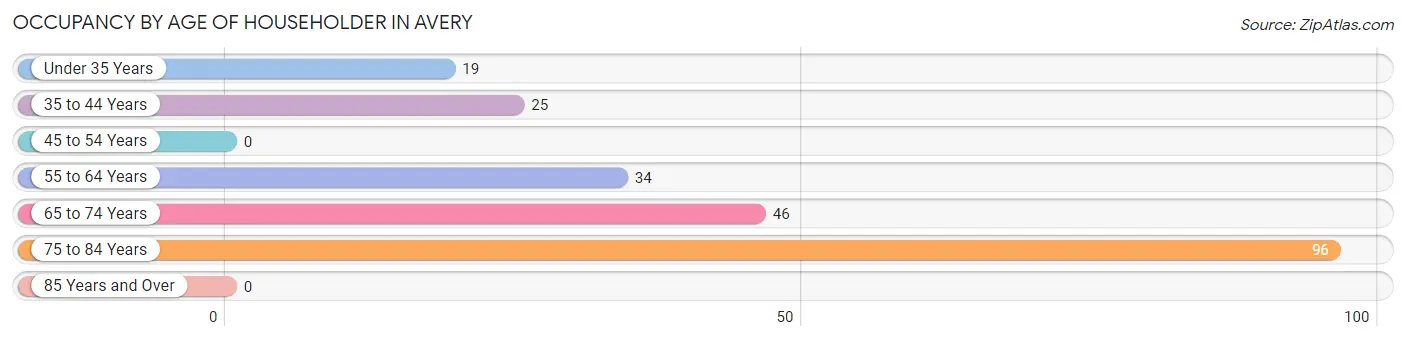
| Age Bracket | # Households | % Households |
| Under 35 Years | 19 | 8.6% |
| 35 to 44 Years | 25 | 11.4% |
| 45 to 54 Years | 0 | 0.0% |
| 55 to 64 Years | 34 | 15.4% |
| 65 to 74 Years | 46 | 20.9% |
| 75 to 84 Years | 96 | 43.6% |
| 85 Years and Over | 0 | 0.0% |
| Total | 220 | 100.0% |
Housing Finances in Avery
Median Income by Occupancy in Avery
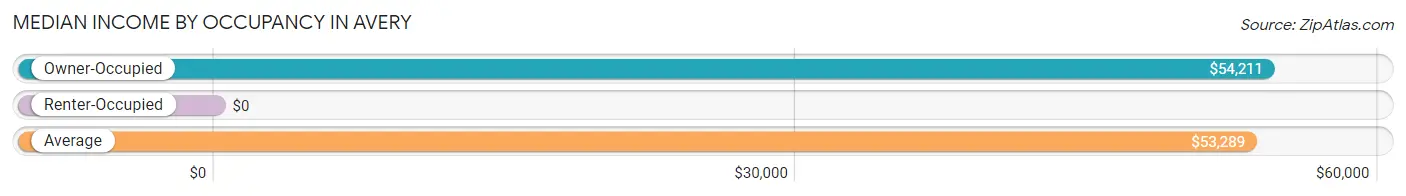
| Occupancy Type | # Households | Median Income |
| Owner-Occupied | 206 (93.6%) | $54,211 |
| Renter-Occupied | 14 (6.4%) | $0 |
| Average | 220 (100.0%) | $53,289 |
Occupancy by Householder Income Bracket in Avery
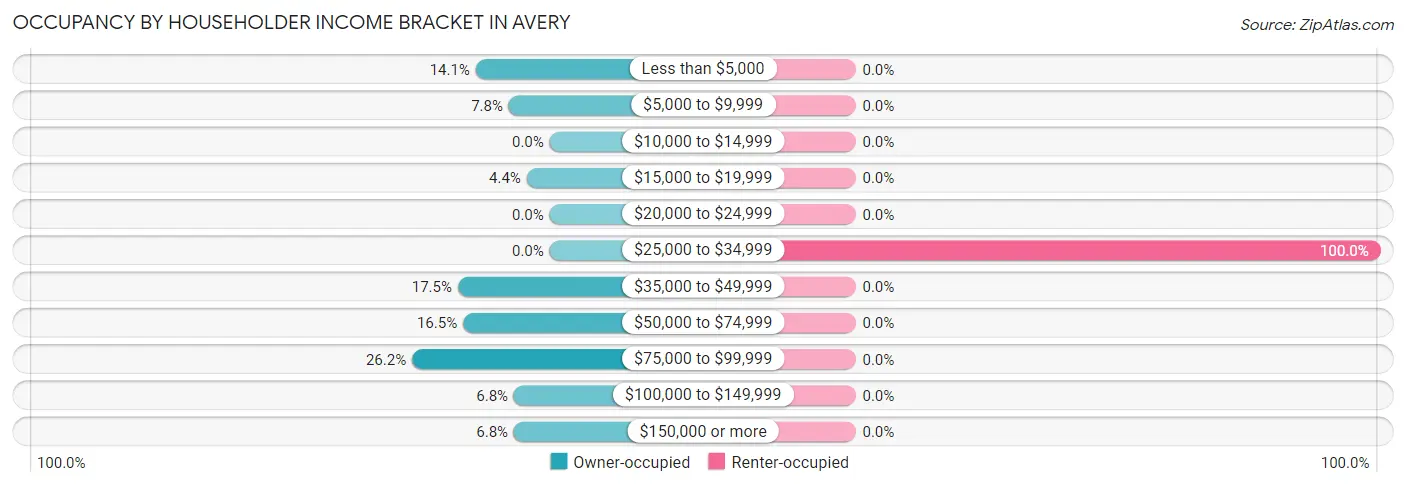
| Income Bracket | Owner-occupied | Renter-occupied |
| Less than $5,000 | 29 (14.1%) | 0 (0.0%) |
| $5,000 to $9,999 | 16 (7.8%) | 0 (0.0%) |
| $10,000 to $14,999 | 0 (0.0%) | 0 (0.0%) |
| $15,000 to $19,999 | 9 (4.4%) | 0 (0.0%) |
| $20,000 to $24,999 | 0 (0.0%) | 0 (0.0%) |
| $25,000 to $34,999 | 0 (0.0%) | 14 (100.0%) |
| $35,000 to $49,999 | 36 (17.5%) | 0 (0.0%) |
| $50,000 to $74,999 | 34 (16.5%) | 0 (0.0%) |
| $75,000 to $99,999 | 54 (26.2%) | 0 (0.0%) |
| $100,000 to $149,999 | 14 (6.8%) | 0 (0.0%) |
| $150,000 or more | 14 (6.8%) | 0 (0.0%) |
| Total | 206 (100.0%) | 14 (100.0%) |
Monthly Housing Cost Tiers in Avery
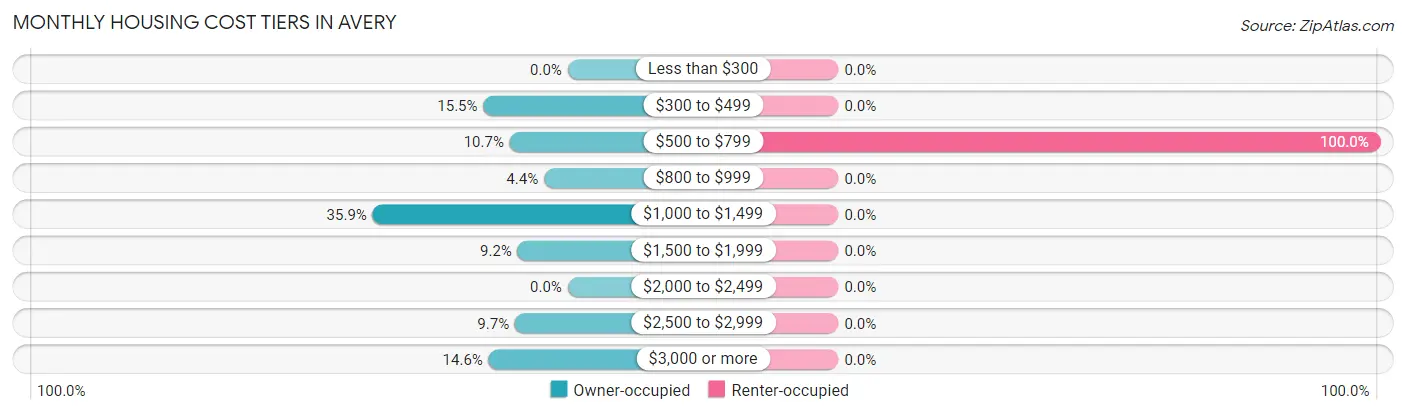
| Monthly Cost | Owner-occupied | Renter-occupied |
| Less than $300 | 0 (0.0%) | 0 (0.0%) |
| $300 to $499 | 32 (15.5%) | 0 (0.0%) |
| $500 to $799 | 22 (10.7%) | 14 (100.0%) |
| $800 to $999 | 9 (4.4%) | 0 (0.0%) |
| $1,000 to $1,499 | 74 (35.9%) | 0 (0.0%) |
| $1,500 to $1,999 | 19 (9.2%) | 0 (0.0%) |
| $2,000 to $2,499 | 0 (0.0%) | 0 (0.0%) |
| $2,500 to $2,999 | 20 (9.7%) | 0 (0.0%) |
| $3,000 or more | 30 (14.6%) | 0 (0.0%) |
| Total | 206 (100.0%) | 14 (100.0%) |
Physical Housing Characteristics in Avery
Housing Structures in Avery
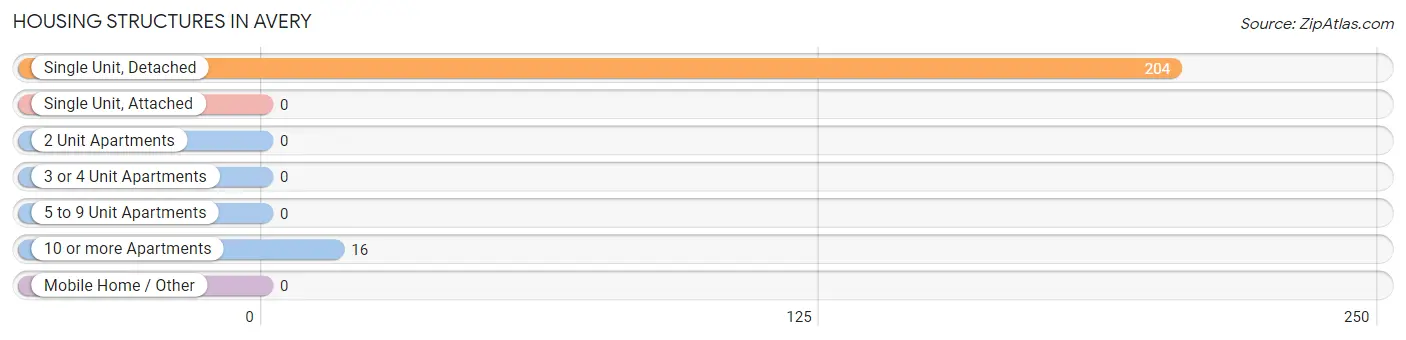
| Structure Type | # Housing Units | % Housing Units |
| Single Unit, Detached | 204 | 92.7% |
| Single Unit, Attached | 0 | 0.0% |
| 2 Unit Apartments | 0 | 0.0% |
| 3 or 4 Unit Apartments | 0 | 0.0% |
| 5 to 9 Unit Apartments | 0 | 0.0% |
| 10 or more Apartments | 16 | 7.3% |
| Mobile Home / Other | 0 | 0.0% |
| Total | 220 | 100.0% |
Housing Structures by Occupancy in Avery
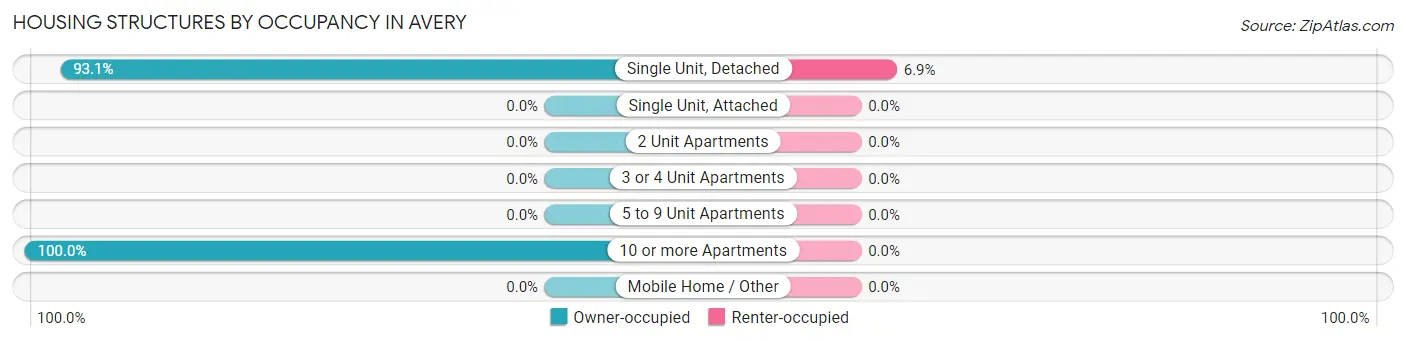
| Structure Type | Owner-occupied | Renter-occupied |
| Single Unit, Detached | 190 (93.1%) | 14 (6.9%) |
| Single Unit, Attached | 0 (0.0%) | 0 (0.0%) |
| 2 Unit Apartments | 0 (0.0%) | 0 (0.0%) |
| 3 or 4 Unit Apartments | 0 (0.0%) | 0 (0.0%) |
| 5 to 9 Unit Apartments | 0 (0.0%) | 0 (0.0%) |
| 10 or more Apartments | 16 (100.0%) | 0 (0.0%) |
| Mobile Home / Other | 0 (0.0%) | 0 (0.0%) |
| Total | 206 (93.6%) | 14 (6.4%) |
Housing Structures by Number of Rooms in Avery
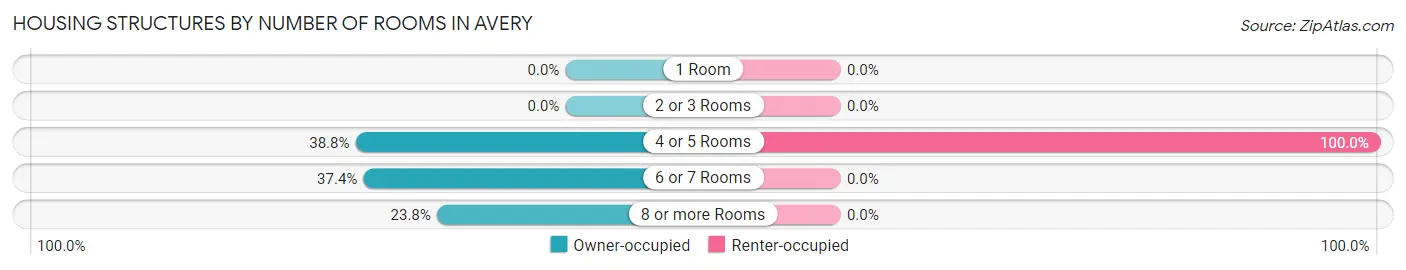
| Number of Rooms | Owner-occupied | Renter-occupied |
| 1 Room | 0 (0.0%) | 0 (0.0%) |
| 2 or 3 Rooms | 0 (0.0%) | 0 (0.0%) |
| 4 or 5 Rooms | 80 (38.8%) | 14 (100.0%) |
| 6 or 7 Rooms | 77 (37.4%) | 0 (0.0%) |
| 8 or more Rooms | 49 (23.8%) | 0 (0.0%) |
| Total | 206 (100.0%) | 14 (100.0%) |
Housing Structure by Heating Type in Avery
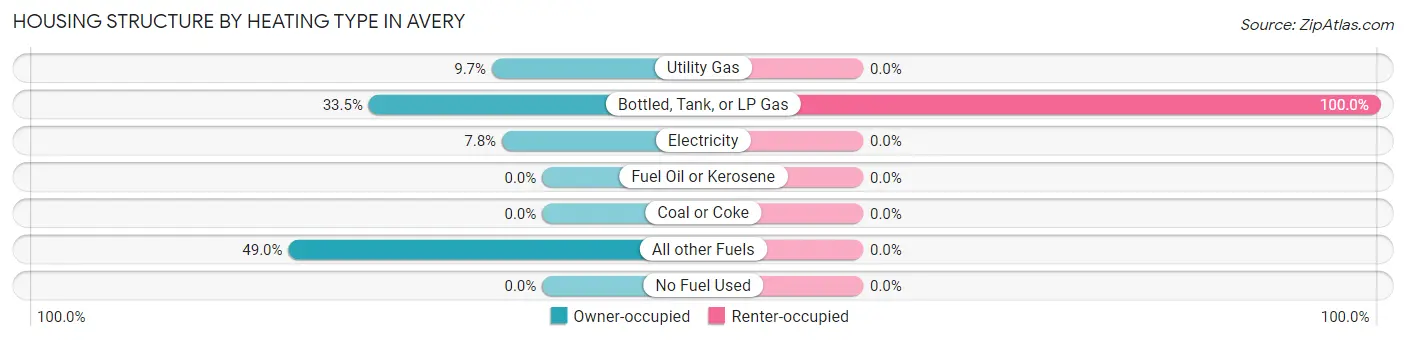
| Heating Type | Owner-occupied | Renter-occupied |
| Utility Gas | 20 (9.7%) | 0 (0.0%) |
| Bottled, Tank, or LP Gas | 69 (33.5%) | 14 (100.0%) |
| Electricity | 16 (7.8%) | 0 (0.0%) |
| Fuel Oil or Kerosene | 0 (0.0%) | 0 (0.0%) |
| Coal or Coke | 0 (0.0%) | 0 (0.0%) |
| All other Fuels | 101 (49.0%) | 0 (0.0%) |
| No Fuel Used | 0 (0.0%) | 0 (0.0%) |
| Total | 206 (100.0%) | 14 (100.0%) |
Household Vehicle Usage in Avery
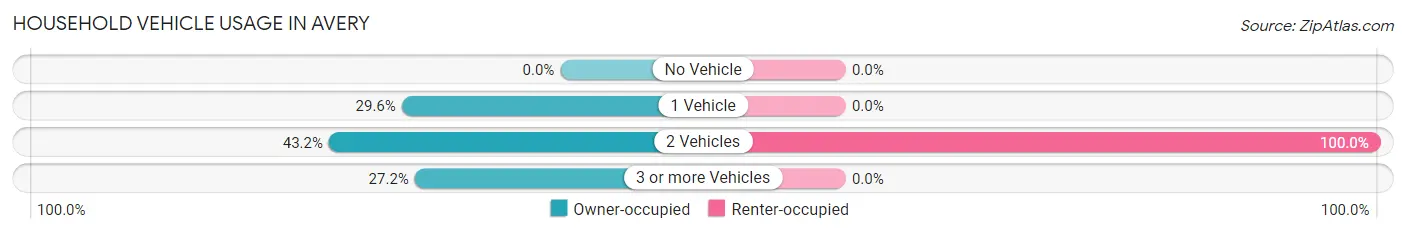
| Vehicles per Household | Owner-occupied | Renter-occupied |
| No Vehicle | 0 (0.0%) | 0 (0.0%) |
| 1 Vehicle | 61 (29.6%) | 0 (0.0%) |
| 2 Vehicles | 89 (43.2%) | 14 (100.0%) |
| 3 or more Vehicles | 56 (27.2%) | 0 (0.0%) |
| Total | 206 (100.0%) | 14 (100.0%) |
Real Estate & Mortgages in Avery
Real Estate and Mortgage Overview in Avery
| Characteristic | Without Mortgage | With Mortgage |
| Housing Units | 78 | 128 |
| Median Property Value | $290,600 | $400,000 |
| Median Household Income | $46,328 | $14 |
| Monthly Housing Costs | $532 | $30 |
| Real Estate Taxes | $1,875 | $0 |
Property Value by Mortgage Status in Avery
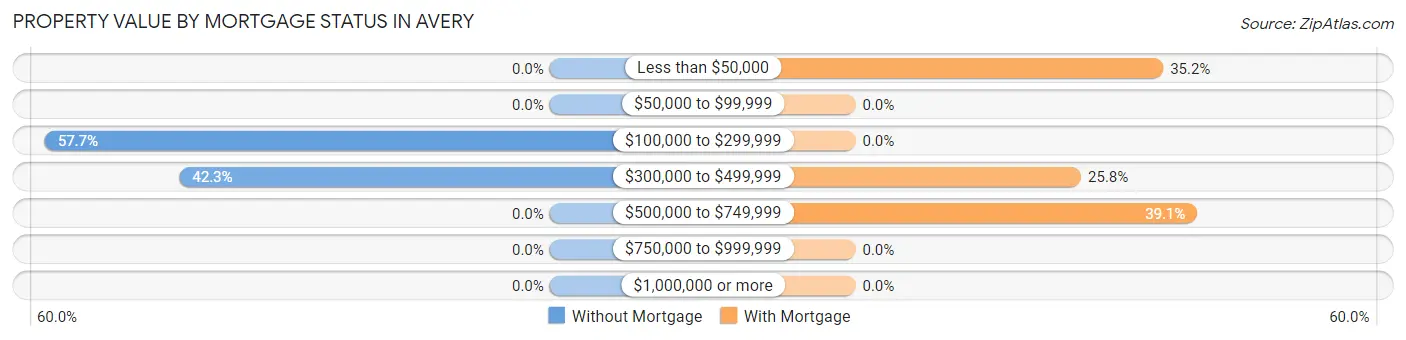
| Property Value | Without Mortgage | With Mortgage |
| Less than $50,000 | 0 (0.0%) | 45 (35.2%) |
| $50,000 to $99,999 | 0 (0.0%) | 0 (0.0%) |
| $100,000 to $299,999 | 45 (57.7%) | 0 (0.0%) |
| $300,000 to $499,999 | 33 (42.3%) | 33 (25.8%) |
| $500,000 to $749,999 | 0 (0.0%) | 50 (39.1%) |
| $750,000 to $999,999 | 0 (0.0%) | 0 (0.0%) |
| $1,000,000 or more | 0 (0.0%) | 0 (0.0%) |
| Total | 78 (100.0%) | 128 (100.0%) |
Household Income by Mortgage Status in Avery
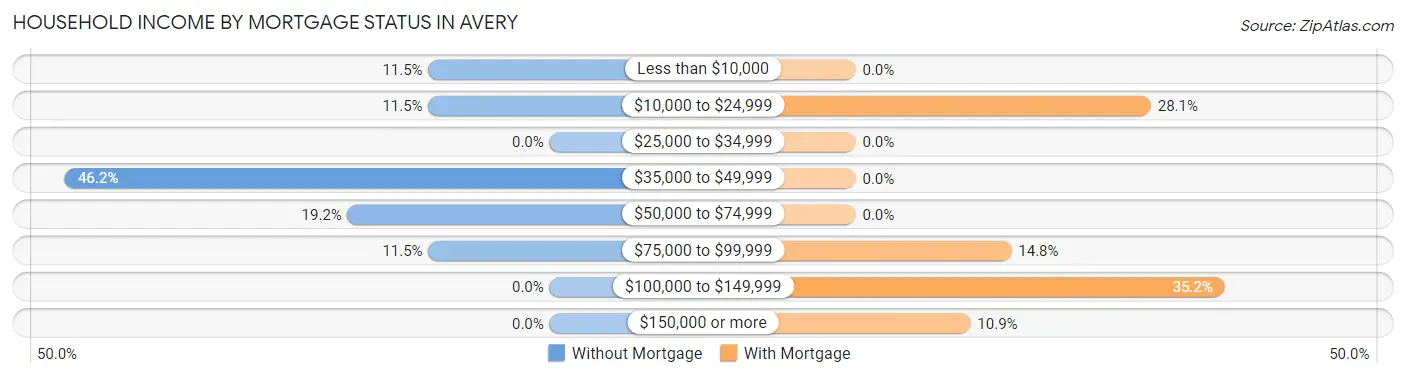
| Household Income | Without Mortgage | With Mortgage |
| Less than $10,000 | 9 (11.5%) | 0 (0.0%) |
| $10,000 to $24,999 | 9 (11.5%) | 36 (28.1%) |
| $25,000 to $34,999 | 0 (0.0%) | 0 (0.0%) |
| $35,000 to $49,999 | 36 (46.2%) | 0 (0.0%) |
| $50,000 to $74,999 | 15 (19.2%) | 0 (0.0%) |
| $75,000 to $99,999 | 9 (11.5%) | 19 (14.8%) |
| $100,000 to $149,999 | 0 (0.0%) | 45 (35.2%) |
| $150,000 or more | 0 (0.0%) | 14 (10.9%) |
| Total | 78 (100.0%) | 128 (100.0%) |
Property Value to Household Income Ratio in Avery
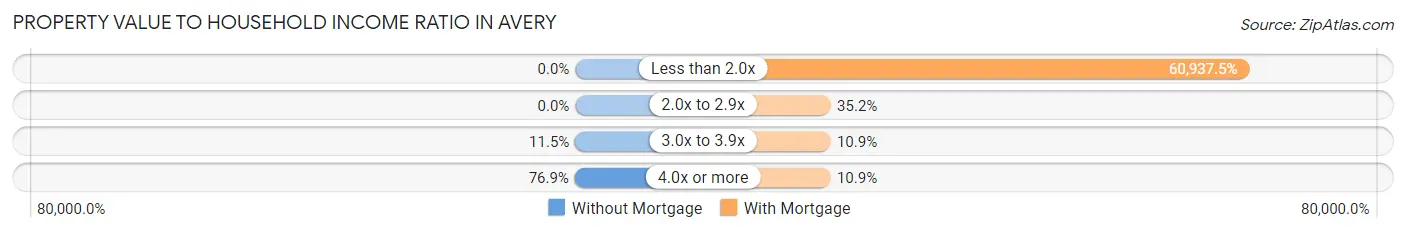
| Value-to-Income Ratio | Without Mortgage | With Mortgage |
| Less than 2.0x | 0 (0.0%) | 78,000 (60,937.5%) |
| 2.0x to 2.9x | 0 (0.0%) | 45 (35.2%) |
| 3.0x to 3.9x | 9 (11.5%) | 14 (10.9%) |
| 4.0x or more | 60 (76.9%) | 14 (10.9%) |
| Total | 78 (100.0%) | 128 (100.0%) |
Real Estate Taxes by Mortgage Status in Avery
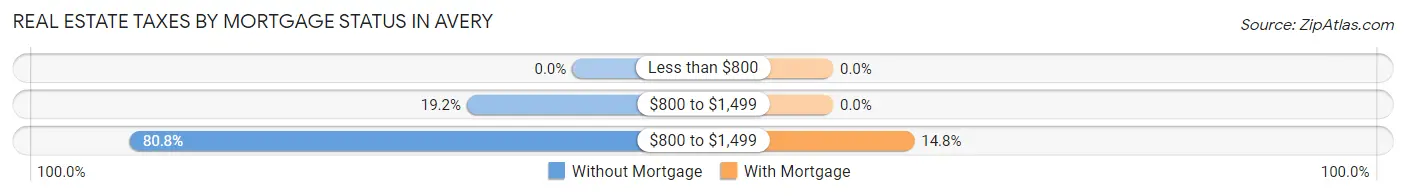
| Property Taxes | Without Mortgage | With Mortgage |
| Less than $800 | 0 (0.0%) | 0 (0.0%) |
| $800 to $1,499 | 15 (19.2%) | 0 (0.0%) |
| $800 to $1,499 | 63 (80.8%) | 19 (14.8%) |
| Total | 78 (100.0%) | 128 (100.0%) |
Health & Disability in Avery
Health Insurance Coverage by Age in Avery
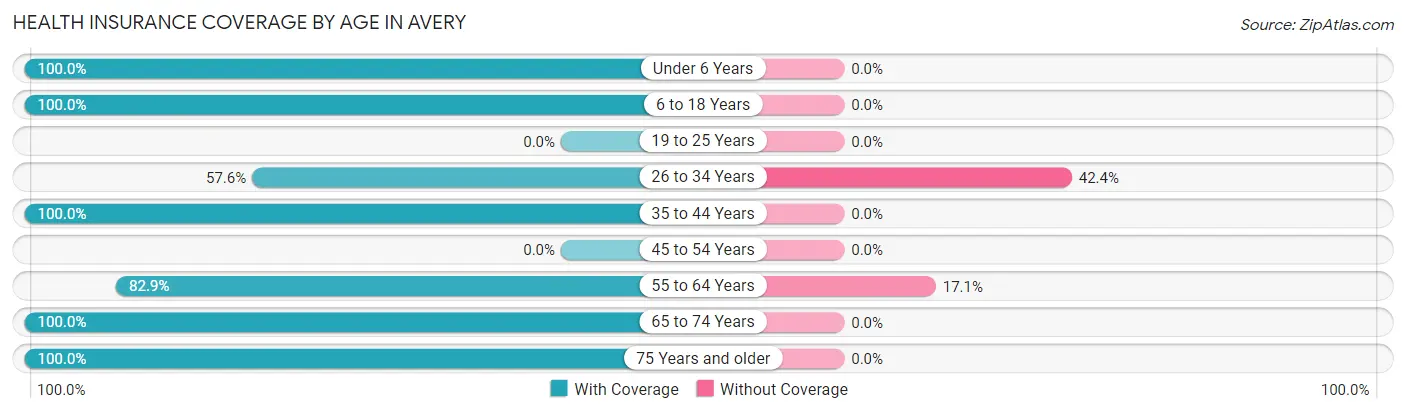
| Age Bracket | With Coverage | Without Coverage |
| Under 6 Years | 16 (100.0%) | 0 (0.0%) |
| 6 to 18 Years | 39 (100.0%) | 0 (0.0%) |
| 19 to 25 Years | 0 (0.0%) | 0 (0.0%) |
| 26 to 34 Years | 19 (57.6%) | 14 (42.4%) |
| 35 to 44 Years | 42 (100.0%) | 0 (0.0%) |
| 45 to 54 Years | 0 (0.0%) | 0 (0.0%) |
| 55 to 64 Years | 68 (82.9%) | 14 (17.1%) |
| 65 to 74 Years | 82 (100.0%) | 0 (0.0%) |
| 75 Years and older | 128 (100.0%) | 0 (0.0%) |
| Total | 394 (93.4%) | 28 (6.6%) |
Health Insurance Coverage by Citizenship Status in Avery
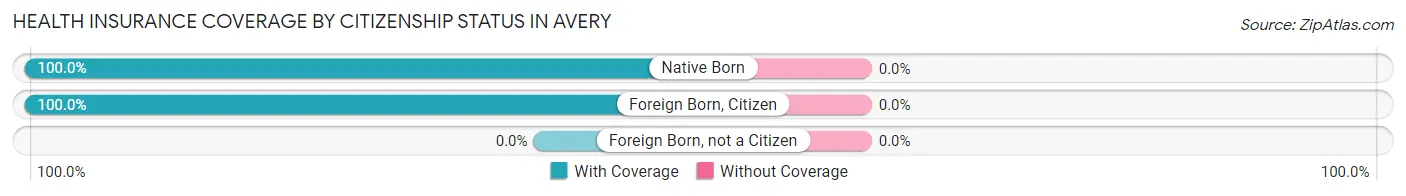
| Citizenship Status | With Coverage | Without Coverage |
| Native Born | 16 (100.0%) | 0 (0.0%) |
| Foreign Born, Citizen | 39 (100.0%) | 0 (0.0%) |
| Foreign Born, not a Citizen | 0 (0.0%) | 0 (0.0%) |
Health Insurance Coverage by Household Income in Avery
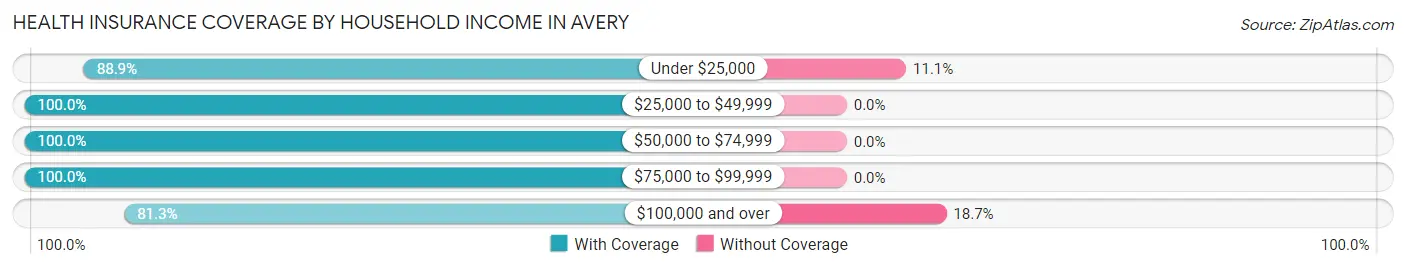
| Household Income | With Coverage | Without Coverage |
| Under $25,000 | 112 (88.9%) | 14 (11.1%) |
| $25,000 to $49,999 | 67 (100.0%) | 0 (0.0%) |
| $50,000 to $74,999 | 85 (100.0%) | 0 (0.0%) |
| $75,000 to $99,999 | 69 (100.0%) | 0 (0.0%) |
| $100,000 and over | 61 (81.3%) | 14 (18.7%) |
Public vs Private Health Insurance Coverage by Age in Avery
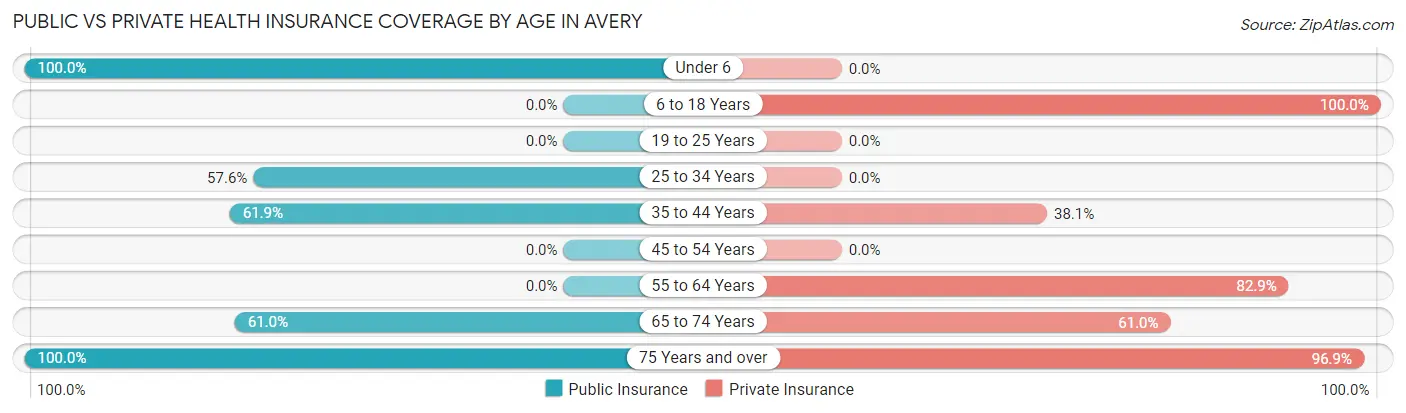
| Age Bracket | Public Insurance | Private Insurance |
| Under 6 | 16 (100.0%) | 0 (0.0%) |
| 6 to 18 Years | 0 (0.0%) | 39 (100.0%) |
| 19 to 25 Years | 0 (0.0%) | 0 (0.0%) |
| 25 to 34 Years | 19 (57.6%) | 0 (0.0%) |
| 35 to 44 Years | 26 (61.9%) | 16 (38.1%) |
| 45 to 54 Years | 0 (0.0%) | 0 (0.0%) |
| 55 to 64 Years | 0 (0.0%) | 68 (82.9%) |
| 65 to 74 Years | 50 (61.0%) | 50 (61.0%) |
| 75 Years and over | 128 (100.0%) | 124 (96.9%) |
| Total | 239 (56.6%) | 297 (70.4%) |
Disability Status by Sex by Age in Avery
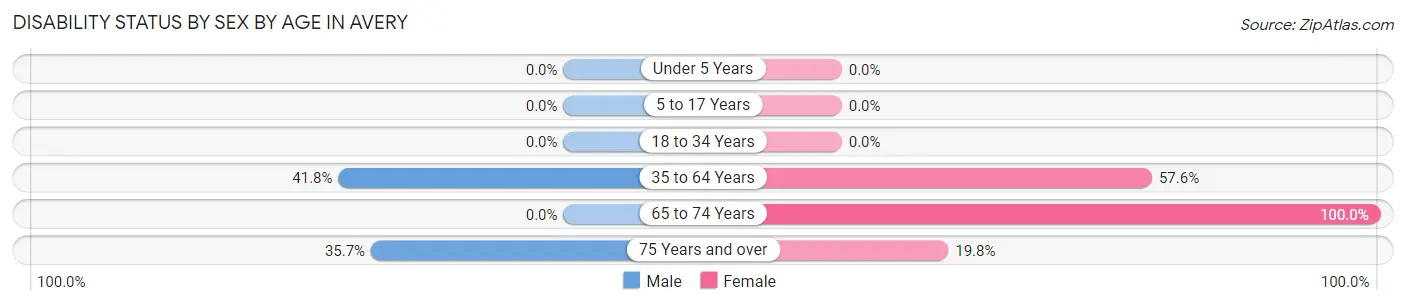
| Age Bracket | Male | Female |
| Under 5 Years | 0 (0.0%) | 0 (0.0%) |
| 5 to 17 Years | 0 (0.0%) | 0 (0.0%) |
| 18 to 34 Years | 0 (0.0%) | 0 (0.0%) |
| 35 to 64 Years | 38 (41.8%) | 19 (57.6%) |
| 65 to 74 Years | 0 (0.0%) | 64 (100.0%) |
| 75 Years and over | 15 (35.7%) | 17 (19.8%) |
Disability Class by Sex by Age in Avery
Disability Class: Hearing Difficulty
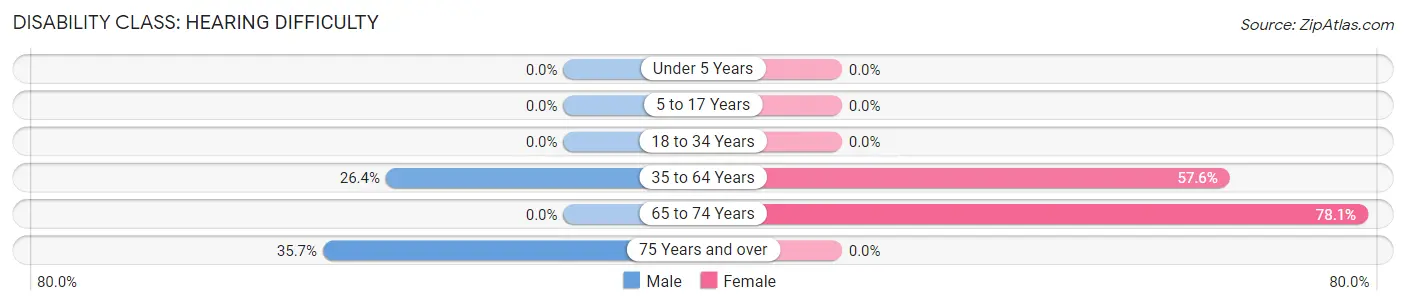
| Age Bracket | Male | Female |
| Under 5 Years | 0 (0.0%) | 0 (0.0%) |
| 5 to 17 Years | 0 (0.0%) | 0 (0.0%) |
| 18 to 34 Years | 0 (0.0%) | 0 (0.0%) |
| 35 to 64 Years | 24 (26.4%) | 19 (57.6%) |
| 65 to 74 Years | 0 (0.0%) | 50 (78.1%) |
| 75 Years and over | 15 (35.7%) | 0 (0.0%) |
Disability Class: Vision Difficulty
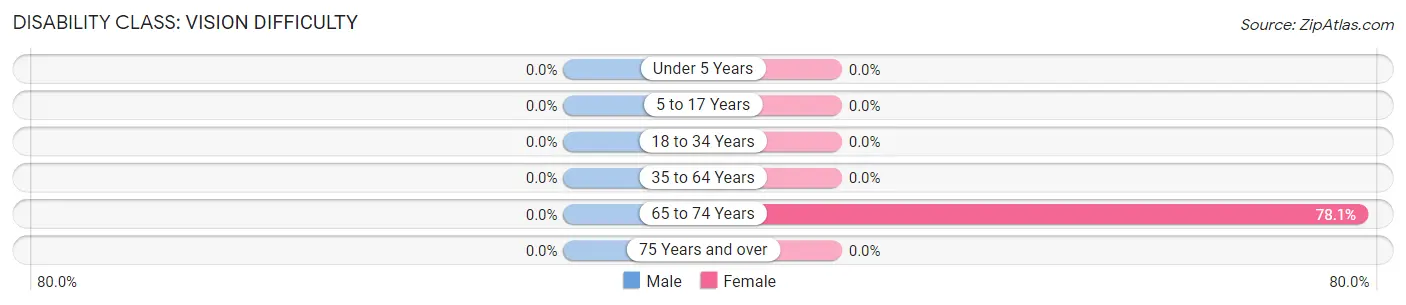
| Age Bracket | Male | Female |
| Under 5 Years | 0 (0.0%) | 0 (0.0%) |
| 5 to 17 Years | 0 (0.0%) | 0 (0.0%) |
| 18 to 34 Years | 0 (0.0%) | 0 (0.0%) |
| 35 to 64 Years | 0 (0.0%) | 0 (0.0%) |
| 65 to 74 Years | 0 (0.0%) | 50 (78.1%) |
| 75 Years and over | 0 (0.0%) | 0 (0.0%) |
Disability Class: Cognitive Difficulty
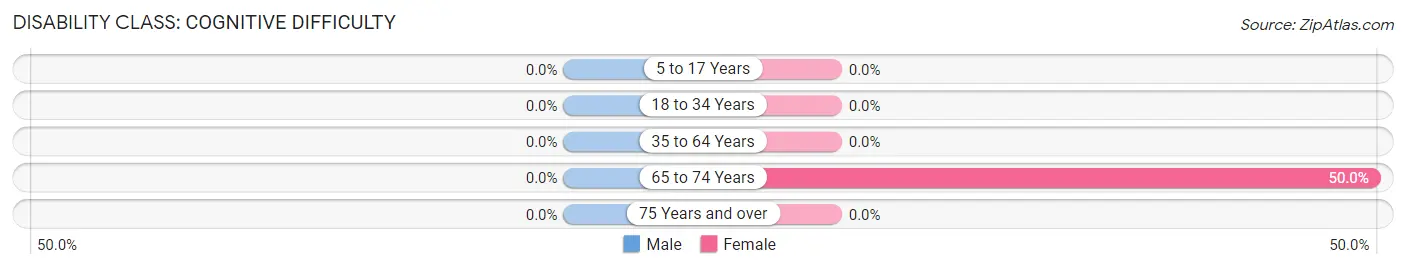
| Age Bracket | Male | Female |
| 5 to 17 Years | 0 (0.0%) | 0 (0.0%) |
| 18 to 34 Years | 0 (0.0%) | 0 (0.0%) |
| 35 to 64 Years | 0 (0.0%) | 0 (0.0%) |
| 65 to 74 Years | 0 (0.0%) | 32 (50.0%) |
| 75 Years and over | 0 (0.0%) | 0 (0.0%) |
Disability Class: Ambulatory Difficulty
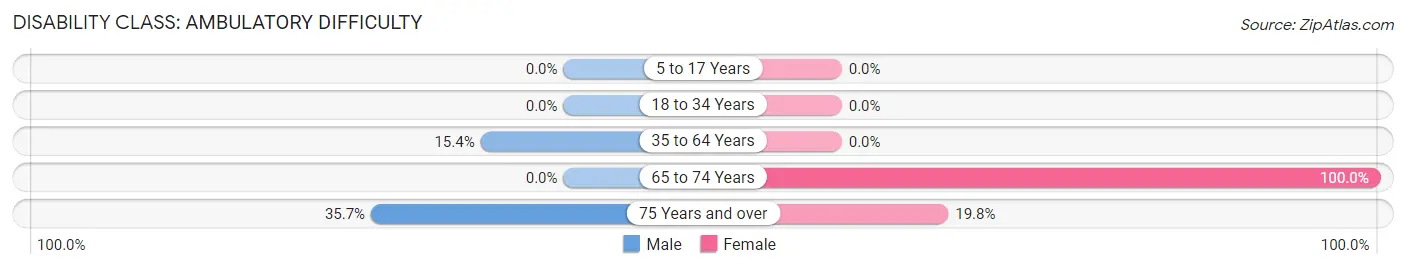
| Age Bracket | Male | Female |
| 5 to 17 Years | 0 (0.0%) | 0 (0.0%) |
| 18 to 34 Years | 0 (0.0%) | 0 (0.0%) |
| 35 to 64 Years | 14 (15.4%) | 0 (0.0%) |
| 65 to 74 Years | 0 (0.0%) | 64 (100.0%) |
| 75 Years and over | 15 (35.7%) | 17 (19.8%) |
Disability Class: Self-Care Difficulty
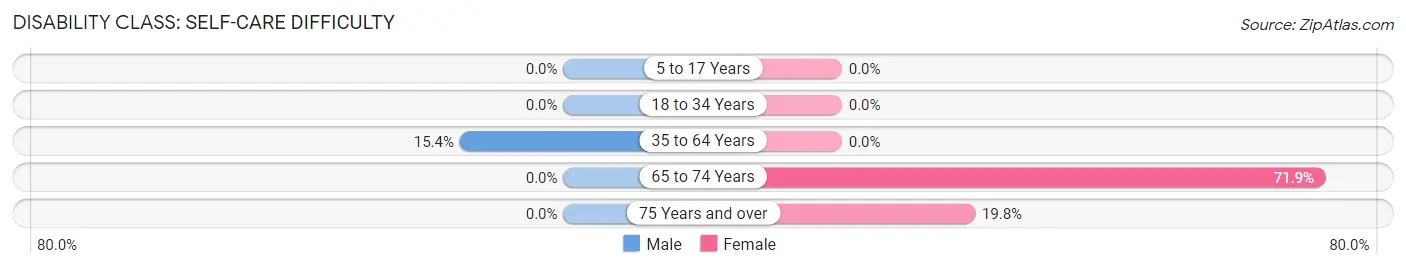
| Age Bracket | Male | Female |
| 5 to 17 Years | 0 (0.0%) | 0 (0.0%) |
| 18 to 34 Years | 0 (0.0%) | 0 (0.0%) |
| 35 to 64 Years | 14 (15.4%) | 0 (0.0%) |
| 65 to 74 Years | 0 (0.0%) | 46 (71.9%) |
| 75 Years and over | 0 (0.0%) | 17 (19.8%) |
Technology Access in Avery
Computing Device Access in Avery
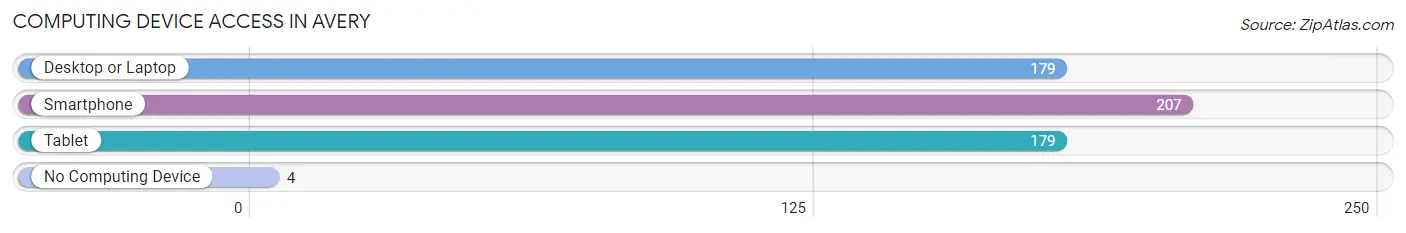
| Device Type | # Households | % Households |
| Desktop or Laptop | 179 | 81.4% |
| Smartphone | 207 | 94.1% |
| Tablet | 179 | 81.4% |
| No Computing Device | 4 | 1.8% |
| Total | 220 | 100.0% |
Internet Access in Avery
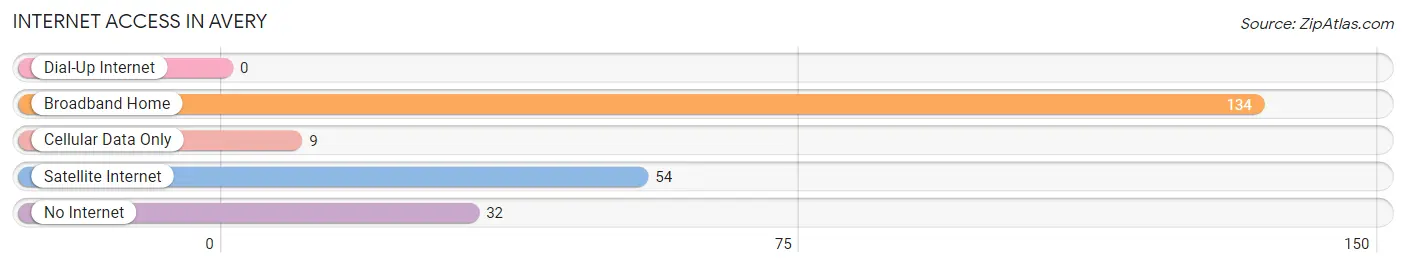
| Internet Type | # Households | % Households |
| Dial-Up Internet | 0 | 0.0% |
| Broadband Home | 134 | 60.9% |
| Cellular Data Only | 9 | 4.1% |
| Satellite Internet | 54 | 24.5% |
| No Internet | 32 | 14.5% |
| Total | 220 | 100.0% |
Avery Summary
Avery, California is a small unincorporated community located in the Sierra Nevada Mountains of California. It is situated in the Plumas National Forest, approximately 20 miles east of Quincy. The town is named after the Avery family, who settled in the area in the late 1800s.
Geography
Avery is located in the Sierra Nevada Mountains of California, in Plumas County. It is situated in the Plumas National Forest, approximately 20 miles east of Quincy. The town is located at an elevation of 4,890 feet, and is surrounded by the Sierra Nevada Mountains. The nearest major city is Reno, Nevada, which is about 90 miles away.
The climate in Avery is typical of the Sierra Nevada Mountains, with cold winters and warm summers. The average annual temperature is around 45 degrees Fahrenheit, with an average high of around 70 degrees in the summer and an average low of around 20 degrees in the winter. The area receives an average of around 30 inches of precipitation per year, with most of it falling in the winter months.
Economy
Avery is a small, rural community with a population of around 200 people. The economy of Avery is largely based on tourism, with many visitors coming to the area to enjoy the natural beauty of the Sierra Nevada Mountains. The town is also home to a few small businesses, including a general store, a gas station, and a few restaurants.
The town is also home to a few small farms, which produce hay, cattle, and other agricultural products. The area is also home to a few logging operations, which provide timber for the local economy.
Demographics
As of the 2010 census, Avery had a population of 200 people. The racial makeup of the town was 95.5% White, 0.5% African American, 0.5% Native American, 0.5% Asian, 0.5% Pacific Islander, and 2.0% from two or more races. The median age of the population was 44.7 years, with a median household income of $37,500.
Conclusion
Avery, California is a small, rural community located in the Sierra Nevada Mountains of California. It is situated in the Plumas National Forest, approximately 20 miles east of Quincy. The town is named after the Avery family, who settled in the area in the late 1800s. The economy of Avery is largely based on tourism, with many visitors coming to the area to enjoy the natural beauty of the Sierra Nevada Mountains. The town is also home to a few small businesses, including a general store, a gas station, and a few restaurants. As of the 2010 census, Avery had a population of 200 people. The racial makeup of the town was 95.5% White, 0.5% African American, 0.5% Native American, 0.5% Asian, 0.5% Pacific Islander, and 2.0% from two or more races. The median age of the population was 44.7 years, with a median household income of $37,500.
Common Questions
What is Per Capita Income in Avery?
Per Capita income in Avery is $31,822.
What is the Median Family Income in Avery?
Median Family Income in Avery is $53,882.
What is the Median Household income in Avery?
Median Household Income in Avery is $53,289.
What is Inequality or Gini Index in Avery?
Inequality or Gini Index in Avery is 0.44.
What is the Total Population of Avery?
Total Population of Avery is 422.
What is the Total Male Population of Avery?
Total Male Population of Avery is 183.
What is the Total Female Population of Avery?
Total Female Population of Avery is 239.
What is the Ratio of Males per 100 Females in Avery?
There are 76.57 Males per 100 Females in Avery.
What is the Ratio of Females per 100 Males in Avery?
There are 130.60 Females per 100 Males in Avery.
What is the Median Population Age in Avery?
Median Population Age in Avery is 63.0 Years.
What is the Average Family Size in Avery
Average Family Size in Avery is 2.5 People.
What is the Average Household Size in Avery
Average Household Size in Avery is 1.9 People.
How Large is the Labor Force in Avery?
There are 230 People in the Labor Forcein in Avery.
What is the Percentage of People in the Labor Force in Avery?
62.7% of People are in the Labor Force in Avery.
What is the Unemployment Rate in Avery?
Unemployment Rate in Avery is 20.9%.