Cedar, MI Map & Demographics
Cedar Map
Cedar Overview
$35,763
PER CAPITA INCOME
$50,833
AVG HOUSEHOLD INCOME
0.14
INEQUALITY / GINI INDEX
41
TOTAL POPULATION
9
MALE POPULATION
32
FEMALE POPULATION
28.12
MALES / 100 FEMALES
355.56
FEMALES / 100 MALES
70.2
MEDIAN AGE
2.0
AVG FAMILY SIZE
1.3
AVG HOUSEHOLD SIZE
20
LABOR FORCE [ PEOPLE ]
48.8%
PERCENT IN LABOR FORCE
Cedar Zip Codes
Cedar Area Codes
Income in Cedar
Income Overview in Cedar
| Characteristic | Number | Measure |
| Per Capita Income | 41 | $35,763 |
| Median Family Income | 9 | $0 |
| Mean Family Income | 9 | $0 |
| Median Household Income | 32 | $50,833 |
| Mean Household Income | 32 | $45,822 |
| Income Deficit | 9 | $0 |
| Wage / Income Gap (%) | 41 | 0.00% |
| Wage / Income Gap ($) | 41 | 100.00¢ per $1 |
| Gini / Inequality Index | 41 | 0.14 |
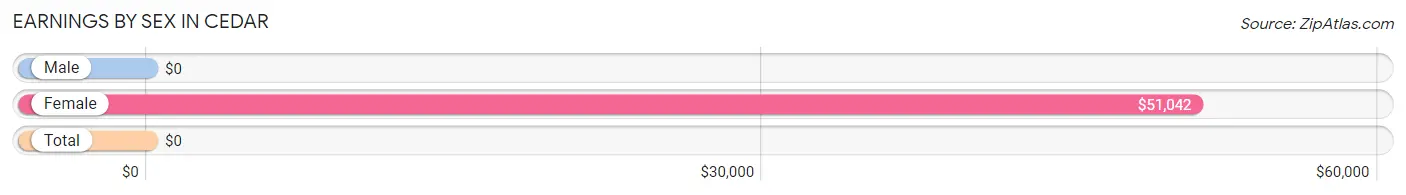
Earnings by Sex in Cedar
| Sex | Number | Average Earnings |
| Male | 6 (30.0%) | $0 |
| Female | 14 (70.0%) | $51,042 |
| Total | 20 (100.0%) | $0 |
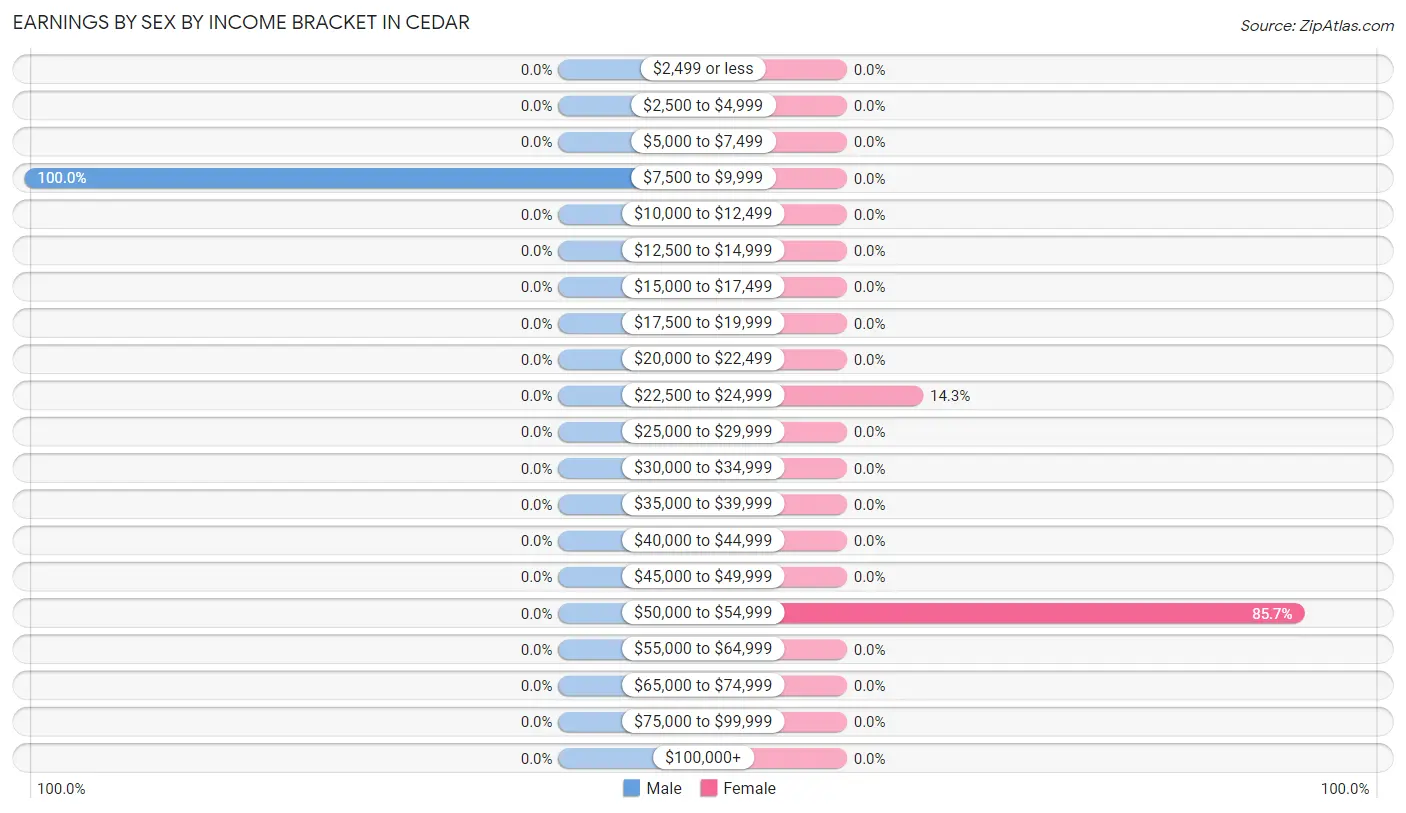
Earnings by Sex by Income Bracket in Cedar
The most common earnings brackets in Cedar are $7,500 to $9,999 for men (6 | 100.0%) and $50,000 to $54,999 for women (12 | 85.7%).
| Income | Male | Female |
| $2,499 or less | 0 (0.0%) | 0 (0.0%) |
| $2,500 to $4,999 | 0 (0.0%) | 0 (0.0%) |
| $5,000 to $7,499 | 0 (0.0%) | 0 (0.0%) |
| $7,500 to $9,999 | 6 (100.0%) | 0 (0.0%) |
| $10,000 to $12,499 | 0 (0.0%) | 0 (0.0%) |
| $12,500 to $14,999 | 0 (0.0%) | 0 (0.0%) |
| $15,000 to $17,499 | 0 (0.0%) | 0 (0.0%) |
| $17,500 to $19,999 | 0 (0.0%) | 0 (0.0%) |
| $20,000 to $22,499 | 0 (0.0%) | 0 (0.0%) |
| $22,500 to $24,999 | 0 (0.0%) | 2 (14.3%) |
| $25,000 to $29,999 | 0 (0.0%) | 0 (0.0%) |
| $30,000 to $34,999 | 0 (0.0%) | 0 (0.0%) |
| $35,000 to $39,999 | 0 (0.0%) | 0 (0.0%) |
| $40,000 to $44,999 | 0 (0.0%) | 0 (0.0%) |
| $45,000 to $49,999 | 0 (0.0%) | 0 (0.0%) |
| $50,000 to $54,999 | 0 (0.0%) | 12 (85.7%) |
| $55,000 to $64,999 | 0 (0.0%) | 0 (0.0%) |
| $65,000 to $74,999 | 0 (0.0%) | 0 (0.0%) |
| $75,000 to $99,999 | 0 (0.0%) | 0 (0.0%) |
| $100,000+ | 0 (0.0%) | 0 (0.0%) |
| Total | 6 (100.0%) | 14 (100.0%) |
Earnings by Sex by Educational Attainment in Cedar
| Educational Attainment | Male Income | Female Income |
| Less than High School | - | - |
| High School Diploma | - | - |
| College or Associate's Degree | - | - |
| Bachelor's Degree | - | - |
| Graduate Degree | - | - |
| Total | - | - |
Family Income in Cedar
Family Income Brackets in Cedar
According to the Cedar family income data, there are 6 families falling into the $25,000 to $34,999 income range, which is the most common income bracket and makes up 66.7% of all families.
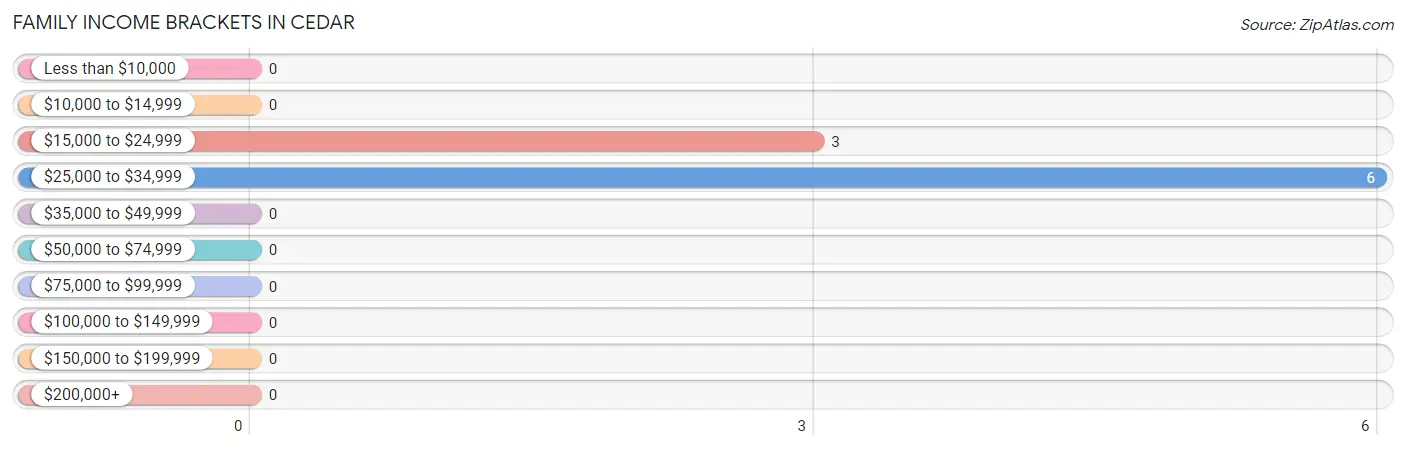
| Income Bracket | # Families | % Families |
| Less than $10,000 | 0 | 0.0% |
| $10,000 to $14,999 | 0 | 0.0% |
| $15,000 to $24,999 | 3 | 33.3% |
| $25,000 to $34,999 | 6 | 66.7% |
| $35,000 to $49,999 | 0 | 0.0% |
| $50,000 to $74,999 | 0 | 0.0% |
| $75,000 to $99,999 | 0 | 0.0% |
| $100,000 to $149,999 | 0 | 0.0% |
| $150,000 to $199,999 | 0 | 0.0% |
| $200,000+ | 0 | 0.0% |
Family Income by Famaliy Size in Cedar
| Income Bracket | # Families | Median Income |
| 2-Person Families | 9 (100.0%) | $0 |
| 3-Person Families | 0 (0.0%) | $0 |
| 4-Person Families | 0 (0.0%) | $0 |
| 5-Person Families | 0 (0.0%) | $0 |
| 6-Person Families | 0 (0.0%) | $0 |
| 7+ Person Families | 0 (0.0%) | $0 |
| Total | 9 (100.0%) | $0 |
Family Income by Number of Earners in Cedar
| Number of Earners | # Families | Median Income |
| No Earners | 3 (33.3%) | $0 |
| 1 Earner | 6 (66.7%) | $0 |
| 2 Earners | 0 (0.0%) | $0 |
| 3+ Earners | 0 (0.0%) | $0 |
| Total | 9 (100.0%) | $0 |
Household Income in Cedar
Household Income Brackets in Cedar
With 23 households falling in the category, the $50,000 to $74,999 income range is the most frequent in Cedar, accounting for 71.9% of all households.
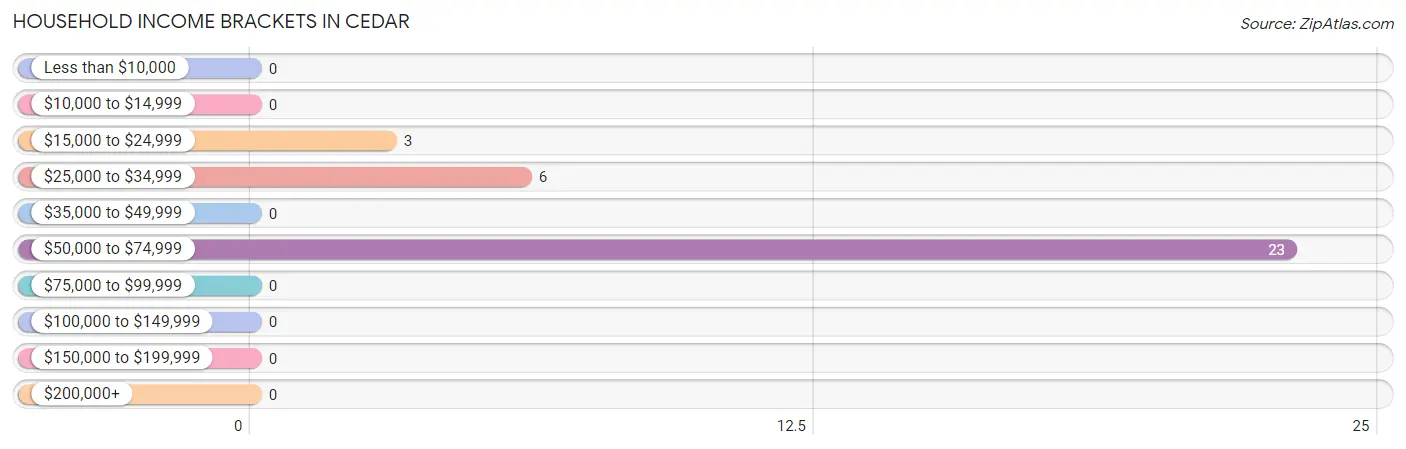
| Income Bracket | # Households | % Households |
| Less than $10,000 | 0 | 0.0% |
| $10,000 to $14,999 | 0 | 0.0% |
| $15,000 to $24,999 | 3 | 9.4% |
| $25,000 to $34,999 | 6 | 18.8% |
| $35,000 to $49,999 | 0 | 0.0% |
| $50,000 to $74,999 | 23 | 71.9% |
| $75,000 to $99,999 | 0 | 0.0% |
| $100,000 to $149,999 | 0 | 0.0% |
| $150,000 to $199,999 | 0 | 0.0% |
| $200,000+ | 0 | 0.0% |
Household Income by Householder Age in Cedar
The median household income in Cedar is $50,833, with the highest median household income of $41,250 found in the 65+ years age bracket for the primary householder. A total of 18 households (56.2%) fall into this category.
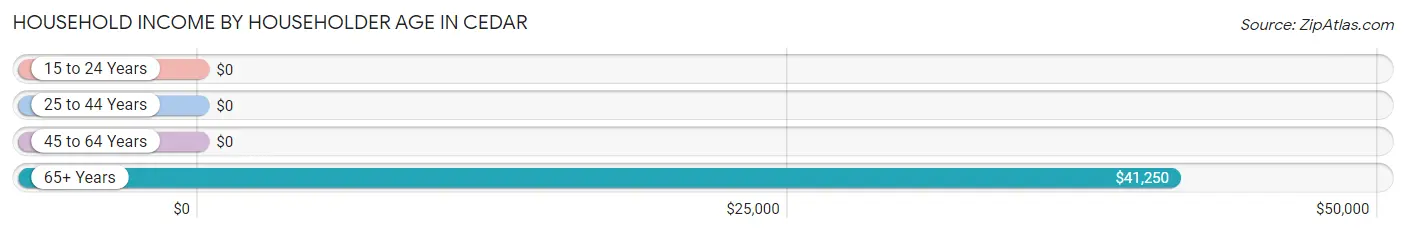
| Income Bracket | # Households | Median Income |
| 15 to 24 Years | 0 (0.0%) | $0 |
| 25 to 44 Years | 3 (9.4%) | $0 |
| 45 to 64 Years | 11 (34.4%) | $0 |
| 65+ Years | 18 (56.2%) | $41,250 |
| Total | 32 (100.0%) | $50,833 |
Poverty in Cedar
Income Below Poverty by Sex and Age in Cedar
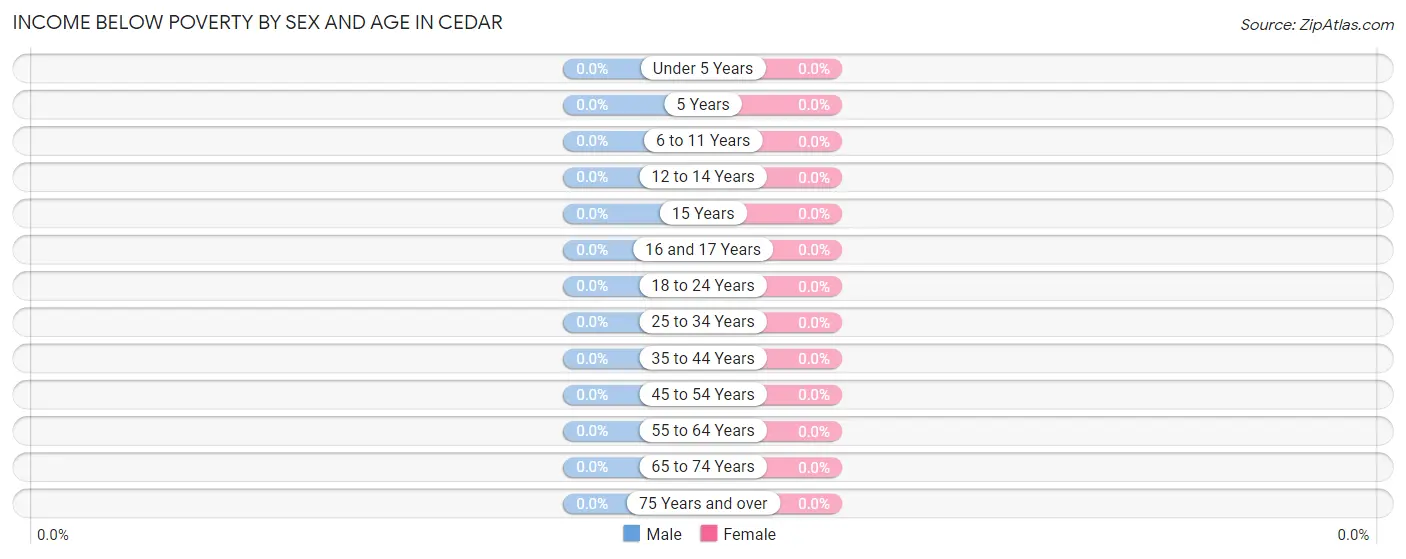
| Age Bracket | Male | Female |
| Under 5 Years | 0 (0.0%) | 0 (0.0%) |
| 5 Years | 0 (0.0%) | 0 (0.0%) |
| 6 to 11 Years | 0 (0.0%) | 0 (0.0%) |
| 12 to 14 Years | 0 (0.0%) | 0 (0.0%) |
| 15 Years | 0 (0.0%) | 0 (0.0%) |
| 16 and 17 Years | 0 (0.0%) | 0 (0.0%) |
| 18 to 24 Years | 0 (0.0%) | 0 (0.0%) |
| 25 to 34 Years | 0 (0.0%) | 0 (0.0%) |
| 35 to 44 Years | 0 (0.0%) | 0 (0.0%) |
| 45 to 54 Years | 0 (0.0%) | 0 (0.0%) |
| 55 to 64 Years | 0 (0.0%) | 0 (0.0%) |
| 65 to 74 Years | 0 (0.0%) | 0 (0.0%) |
| 75 Years and over | 0 (0.0%) | 0 (0.0%) |
| Total | 0 (0.0%) | 0 (0.0%) |
Income Above Poverty by Sex and Age in Cedar
According to the poverty statistics in Cedar, males aged 65 to 74 years and females aged 35 to 44 years are the age groups that are most secure financially, with 100.0% of males and 100.0% of females in these age groups living above the poverty line.
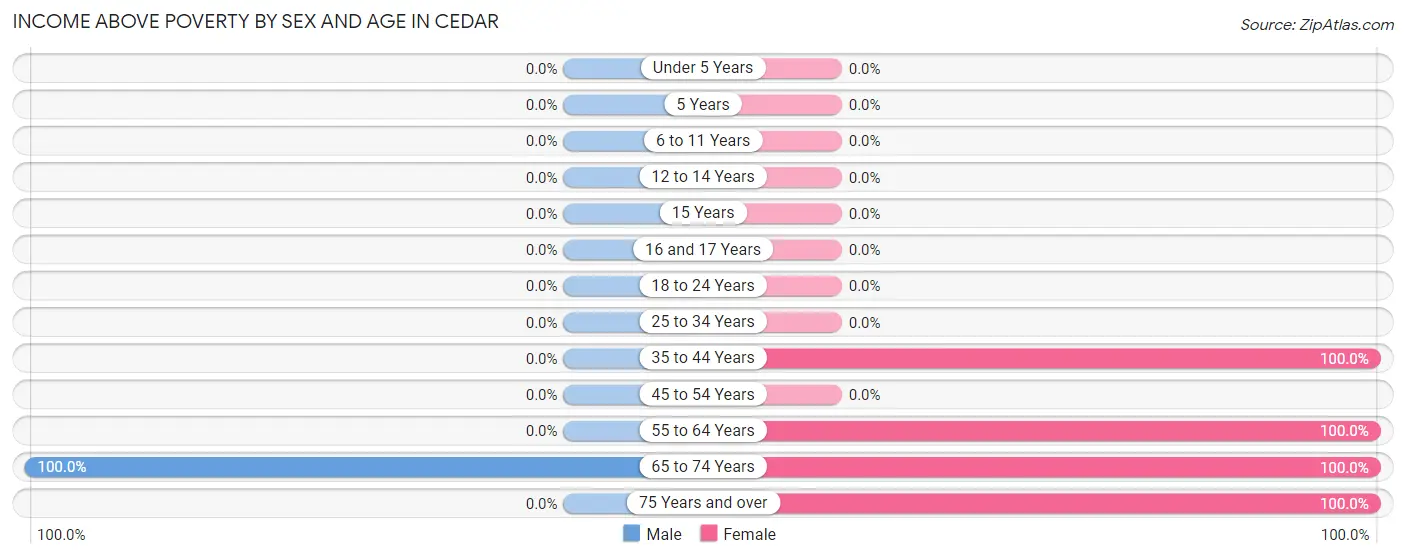
| Age Bracket | Male | Female |
| Under 5 Years | 0 (0.0%) | 0 (0.0%) |
| 5 Years | 0 (0.0%) | 0 (0.0%) |
| 6 to 11 Years | 0 (0.0%) | 0 (0.0%) |
| 12 to 14 Years | 0 (0.0%) | 0 (0.0%) |
| 15 Years | 0 (0.0%) | 0 (0.0%) |
| 16 and 17 Years | 0 (0.0%) | 0 (0.0%) |
| 18 to 24 Years | 0 (0.0%) | 0 (0.0%) |
| 25 to 34 Years | 0 (0.0%) | 0 (0.0%) |
| 35 to 44 Years | 0 (0.0%) | 3 (100.0%) |
| 45 to 54 Years | 0 (0.0%) | 0 (0.0%) |
| 55 to 64 Years | 0 (0.0%) | 11 (100.0%) |
| 65 to 74 Years | 9 (100.0%) | 9 (100.0%) |
| 75 Years and over | 0 (0.0%) | 9 (100.0%) |
| Total | 9 (100.0%) | 32 (100.0%) |
Income Below Poverty Among Married-Couple Families in Cedar
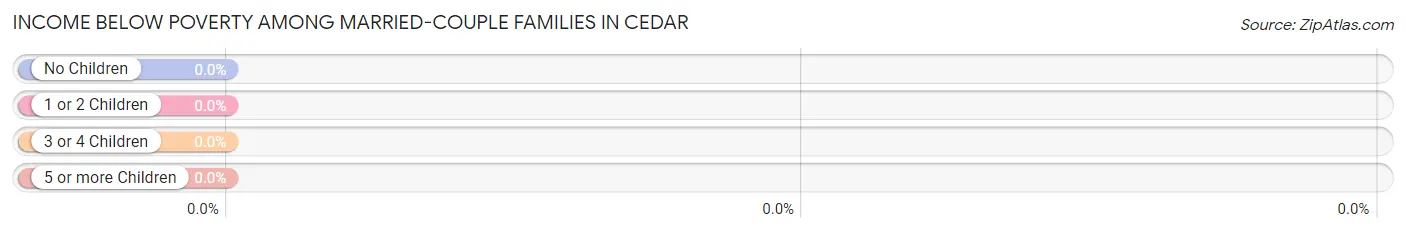
| Children | Above Poverty | Below Poverty |
| No Children | 9 (100.0%) | 0 (0.0%) |
| 1 or 2 Children | 0 (0.0%) | 0 (0.0%) |
| 3 or 4 Children | 0 (0.0%) | 0 (0.0%) |
| 5 or more Children | 0 (0.0%) | 0 (0.0%) |
| Total | 9 (100.0%) | 0 (0.0%) |
Income Below Poverty Among Single-Parent Households in Cedar
| Children | Single Father | Single Mother |
| No Children | 0 (0.0%) | 0 (0.0%) |
| 1 or 2 Children | 0 (0.0%) | 0 (0.0%) |
| 3 or 4 Children | 0 (0.0%) | 0 (0.0%) |
| 5 or more Children | 0 (0.0%) | 0 (0.0%) |
| Total | 0 (0.0%) | 0 (0.0%) |
Income Below Poverty Among Married-Couple vs Single-Parent Households in Cedar
| Children | Married-Couple Families | Single-Parent Households |
| No Children | 0 (0.0%) | 0 (0.0%) |
| 1 or 2 Children | 0 (0.0%) | 0 (0.0%) |
| 3 or 4 Children | 0 (0.0%) | 0 (0.0%) |
| 5 or more Children | 0 (0.0%) | 0 (0.0%) |
| Total | 0 (0.0%) | 0 (0.0%) |
Race in Cedar
The most populous races in Cedar are , and White / Caucasian (41 | 100.0%).
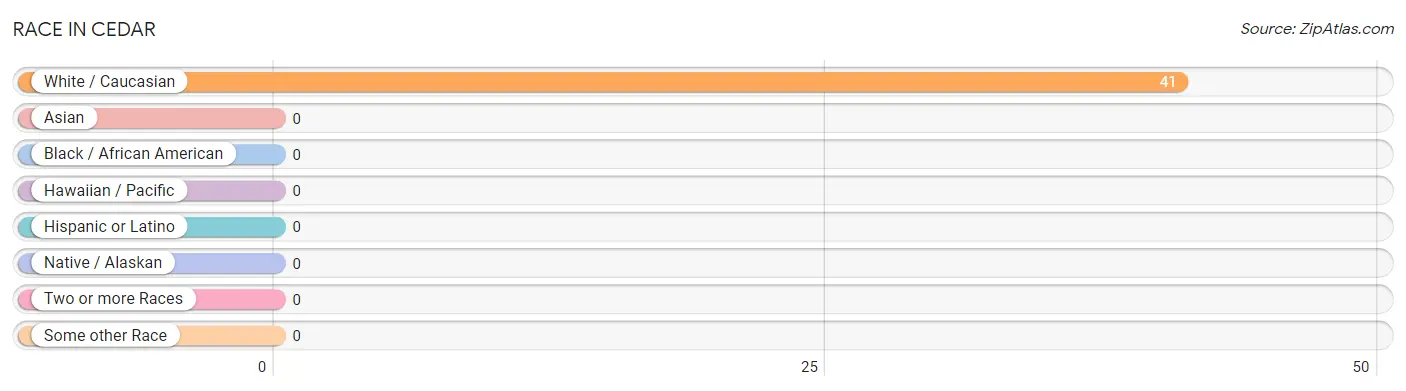
| Race | # Population | % Population |
| Asian | 0 | 0.0% |
| Black / African American | 0 | 0.0% |
| Hawaiian / Pacific | 0 | 0.0% |
| Hispanic or Latino | 0 | 0.0% |
| Native / Alaskan | 0 | 0.0% |
| White / Caucasian | 41 | 100.0% |
| Two or more Races | 0 | 0.0% |
| Some other Race | 0 | 0.0% |
| Total | 41 | 100.0% |
Ancestry in Cedar
The most populous ancestries reported in Cedar are Irish (21 | 51.2%), German (18 | 43.9%), French (9 | 22.0%), Scandinavian (9 | 22.0%), and Polish (5 | 12.2%), together accounting for 151.2% of all Cedar residents.
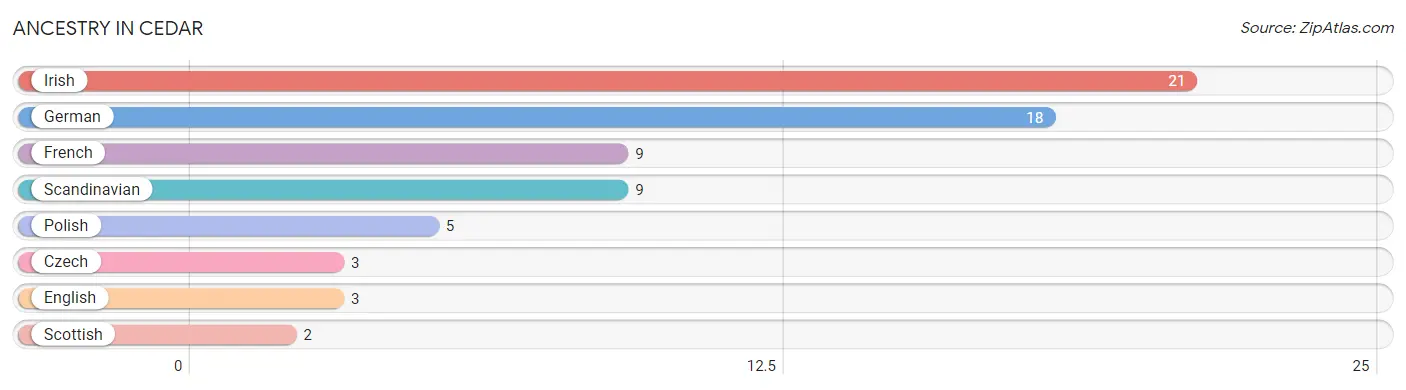
| Ancestry | # Population | % Population |
| Czech | 3 | 7.3% |
| English | 3 | 7.3% |
| French | 9 | 22.0% |
| German | 18 | 43.9% |
| Irish | 21 | 51.2% |
| Polish | 5 | 12.2% |
| Scandinavian | 9 | 22.0% |
| Scottish | 2 | 4.9% | View All 8 Rows |
Immigrants in Cedar

| Immigration Origin | # Population | % Population | View All 0 Rows |
Sex and Age in Cedar
Sex and Age in Cedar
The most populous age groups in Cedar are 65 to 69 Years (6 | 66.7%) for men and 60 to 64 Years (11 | 34.4%) for women.
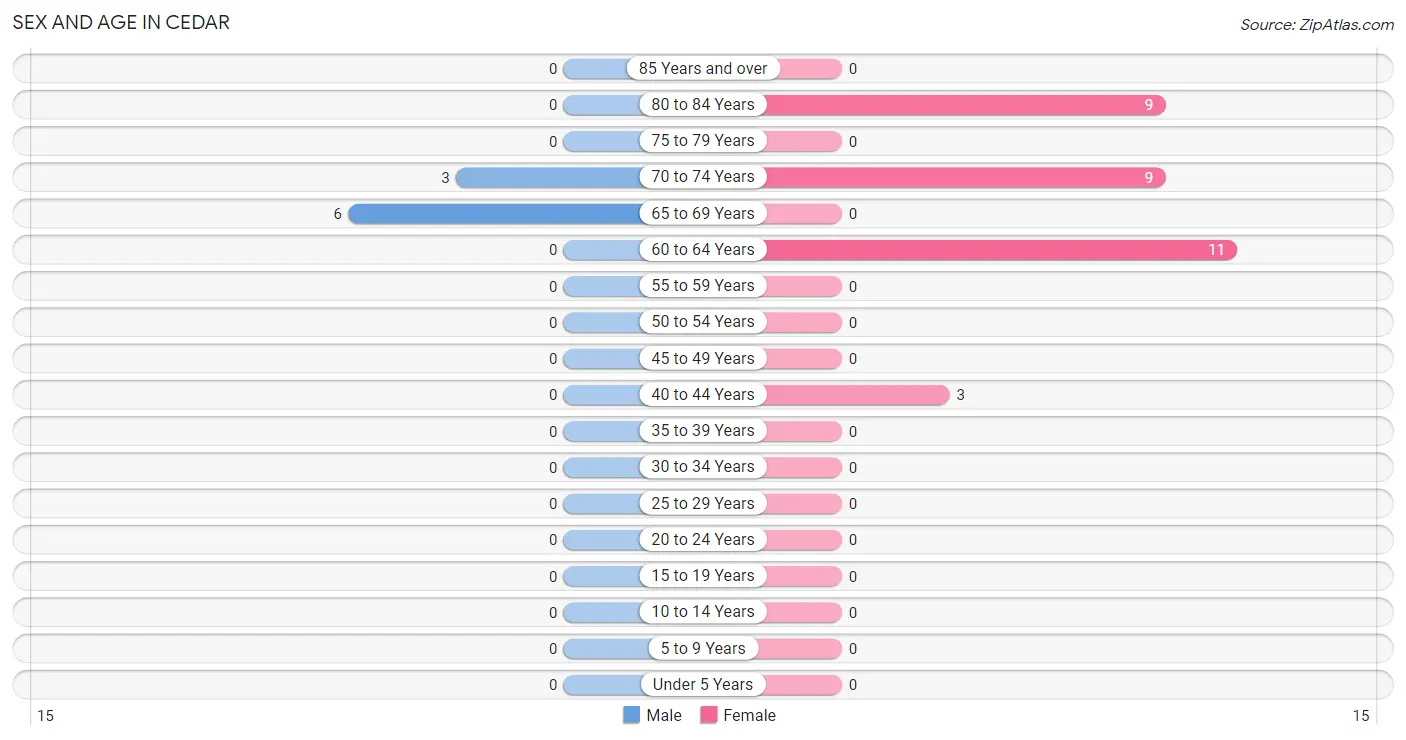
| Age Bracket | Male | Female |
| Under 5 Years | 0 (0.0%) | 0 (0.0%) |
| 5 to 9 Years | 0 (0.0%) | 0 (0.0%) |
| 10 to 14 Years | 0 (0.0%) | 0 (0.0%) |
| 15 to 19 Years | 0 (0.0%) | 0 (0.0%) |
| 20 to 24 Years | 0 (0.0%) | 0 (0.0%) |
| 25 to 29 Years | 0 (0.0%) | 0 (0.0%) |
| 30 to 34 Years | 0 (0.0%) | 0 (0.0%) |
| 35 to 39 Years | 0 (0.0%) | 0 (0.0%) |
| 40 to 44 Years | 0 (0.0%) | 3 (9.4%) |
| 45 to 49 Years | 0 (0.0%) | 0 (0.0%) |
| 50 to 54 Years | 0 (0.0%) | 0 (0.0%) |
| 55 to 59 Years | 0 (0.0%) | 0 (0.0%) |
| 60 to 64 Years | 0 (0.0%) | 11 (34.4%) |
| 65 to 69 Years | 6 (66.7%) | 0 (0.0%) |
| 70 to 74 Years | 3 (33.3%) | 9 (28.1%) |
| 75 to 79 Years | 0 (0.0%) | 0 (0.0%) |
| 80 to 84 Years | 0 (0.0%) | 9 (28.1%) |
| 85 Years and over | 0 (0.0%) | 0 (0.0%) |
| Total | 9 (100.0%) | 32 (100.0%) |
Families and Households in Cedar
Median Family Size in Cedar
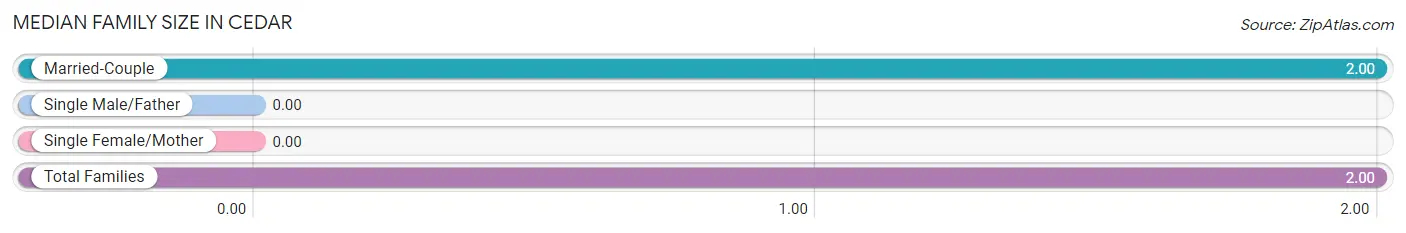
| Family Type | # Families | Family Size |
| Married-Couple | 9 (100.0%) | 2.00 |
| Single Male/Father | 0 (0.0%) | - |
| Single Female/Mother | 0 (0.0%) | - |
| Total Families | 9 (100.0%) | 2.00 |
Median Household Size in Cedar
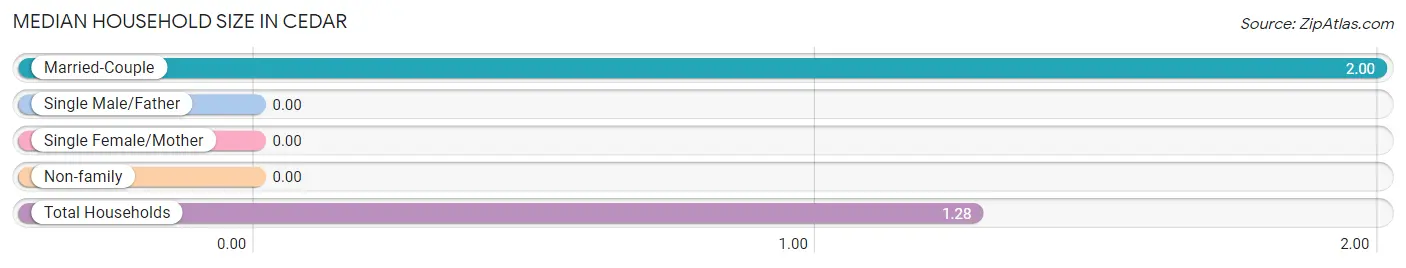
| Household Type | # Households | Household Size |
| Married-Couple | 9 (28.1%) | 2.00 |
| Single Male/Father | 0 (0.0%) | - |
| Single Female/Mother | 0 (0.0%) | - |
| Non-family | 23 (71.9%) | - |
| Total Households | 32 (100.0%) | 1.28 |
Household Size by Marriage Status in Cedar
Out of a total of 32 households in Cedar, 9 (28.1%) are family households, while 23 (71.9%) are nonfamily households. The most numerous type of family households are 2-person households, comprising 9, and the most common type of nonfamily households are 1-person households, comprising 23.
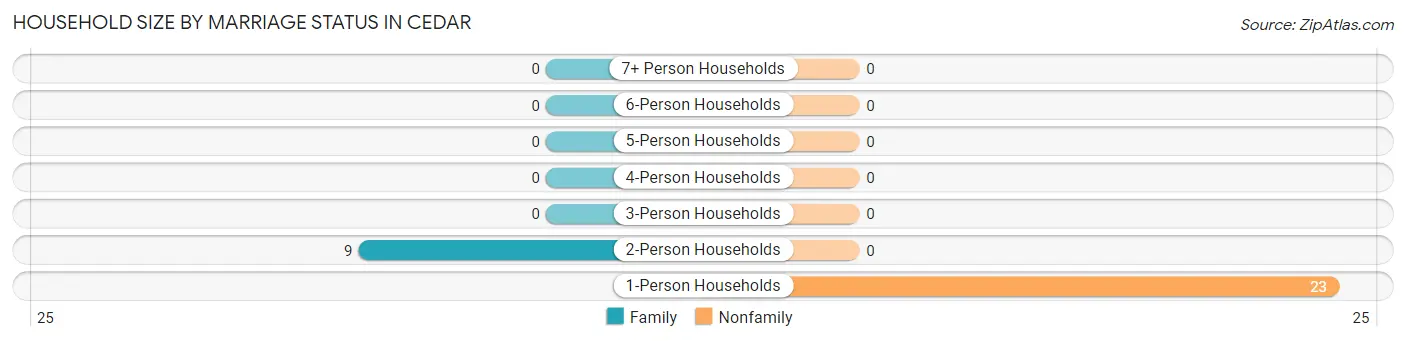
| Household Size | Family Households | Nonfamily Households |
| 1-Person Households | - | 23 (71.9%) |
| 2-Person Households | 9 (28.1%) | 0 (0.0%) |
| 3-Person Households | 0 (0.0%) | 0 (0.0%) |
| 4-Person Households | 0 (0.0%) | 0 (0.0%) |
| 5-Person Households | 0 (0.0%) | 0 (0.0%) |
| 6-Person Households | 0 (0.0%) | 0 (0.0%) |
| 7+ Person Households | 0 (0.0%) | 0 (0.0%) |
| Total | 9 (28.1%) | 23 (71.9%) |
Female Fertility in Cedar
Fertility by Age in Cedar
| Age Bracket | Women with Births | Births / 1,000 Women |
| 15 to 19 years | 0 (0.0%) | 0.0 |
| 20 to 34 years | 0 (0.0%) | 0.0 |
| 35 to 50 years | 0 (0.0%) | 0.0 |
| Total | 0 (0.0%) | 0.0 |
Fertility by Age by Marriage Status in Cedar
| Age Bracket | Married | Unmarried |
| 15 to 19 years | 0 (0.0%) | 0 (0.0%) |
| 20 to 34 years | 0 (0.0%) | 0 (0.0%) |
| 35 to 50 years | 0 (0.0%) | 0 (0.0%) |
| Total | 0 (0.0%) | 0 (0.0%) |
Fertility by Education in Cedar
| Educational Attainment | Women with Births | Births / 1,000 Women |
| Less than High School | 0 (0.0%) | 0.0 |
| High School Diploma | 0 (0.0%) | 0.0 |
| College or Associate's Degree | 0 (0.0%) | 0.0 |
| Bachelor's Degree | 0 (0.0%) | 0.0 |
| Graduate Degree | 0 (0.0%) | 0.0 |
| Total | 0 (0.0%) | 0.0 |
Fertility by Education by Marriage Status in Cedar
| Educational Attainment | Married | Unmarried |
| Less than High School | 0 (0.0%) | 0 (0.0%) |
| High School Diploma | 0 (0.0%) | 0 (0.0%) |
| College or Associate's Degree | 0 (0.0%) | 0 (0.0%) |
| Bachelor's Degree | 0 (0.0%) | 0 (0.0%) |
| Graduate Degree | 0 (0.0%) | 0 (0.0%) |
| Total | 0 (0.0%) | 0 (0.0%) |
Employment Characteristics in Cedar
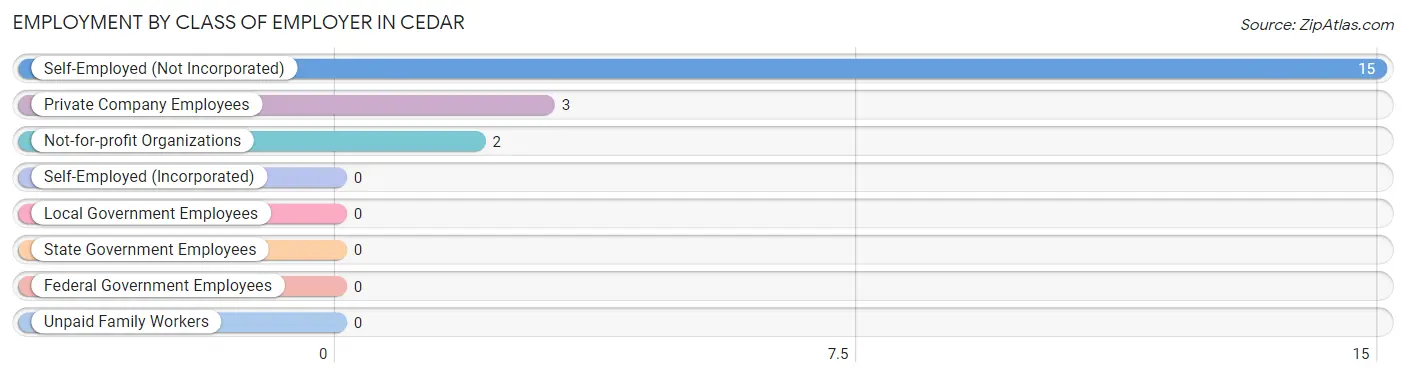
Employment by Class of Employer in Cedar
Among the 20 employed individuals in Cedar, self-employed (not incorporated) (15 | 75.0%), private company employees (3 | 15.0%), and not-for-profit organizations (2 | 10.0%) make up the most common classes of employment.
| Employer Class | # Employees | % Employees |
| Private Company Employees | 3 | 15.0% |
| Self-Employed (Incorporated) | 0 | 0.0% |
| Self-Employed (Not Incorporated) | 15 | 75.0% |
| Not-for-profit Organizations | 2 | 10.0% |
| Local Government Employees | 0 | 0.0% |
| State Government Employees | 0 | 0.0% |
| Federal Government Employees | 0 | 0.0% |
| Unpaid Family Workers | 0 | 0.0% |
| Total | 20 | 100.0% |
Employment Status by Age in Cedar
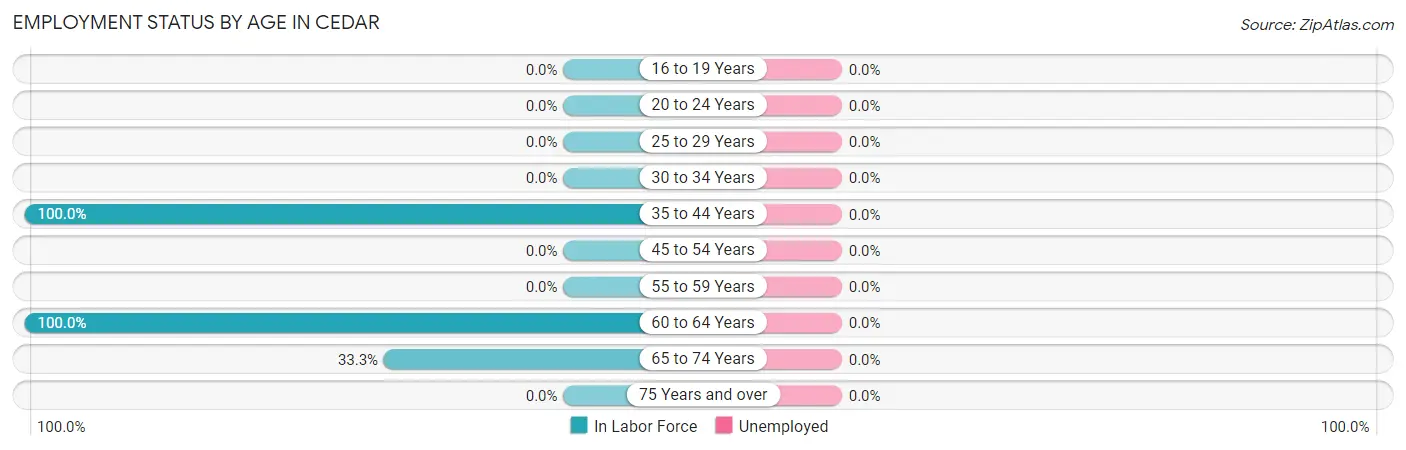
| Age Bracket | In Labor Force | Unemployed |
| 16 to 19 Years | 0 (0.0%) | 0 (0.0%) |
| 20 to 24 Years | 0 (0.0%) | 0 (0.0%) |
| 25 to 29 Years | 0 (0.0%) | 0 (0.0%) |
| 30 to 34 Years | 0 (0.0%) | 0 (0.0%) |
| 35 to 44 Years | 3 (100.0%) | 0 (0.0%) |
| 45 to 54 Years | 0 (0.0%) | 0 (0.0%) |
| 55 to 59 Years | 0 (0.0%) | 0 (0.0%) |
| 60 to 64 Years | 11 (100.0%) | 0 (0.0%) |
| 65 to 74 Years | 6 (33.3%) | 0 (0.0%) |
| 75 Years and over | 0 (0.0%) | 0 (0.0%) |
| Total | 20 (48.8%) | 0 (0.0%) |
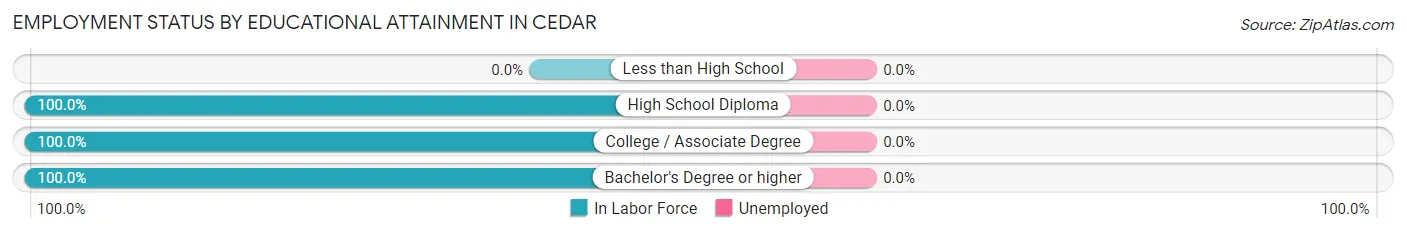
Employment Status by Educational Attainment in Cedar
| Educational Attainment | In Labor Force | Unemployed |
| Less than High School | 0 (0.0%) | 0 (0.0%) |
| High School Diploma | 9 (100.0%) | 0 (0.0%) |
| College / Associate Degree | 3 (100.0%) | 0 (0.0%) |
| Bachelor's Degree or higher | 2 (100.0%) | 0 (0.0%) |
| Total | 14 (100.0%) | 0 (0.0%) |
Employment Occupations by Sex in Cedar
Management, Business, Science and Arts Occupations
The most common Management, Business, Science and Arts occupations in Cedar are Community & Social Service (6 | 30.0%), Arts, Media & Entertainment (6 | 30.0%), and Management (2 | 10.0%).
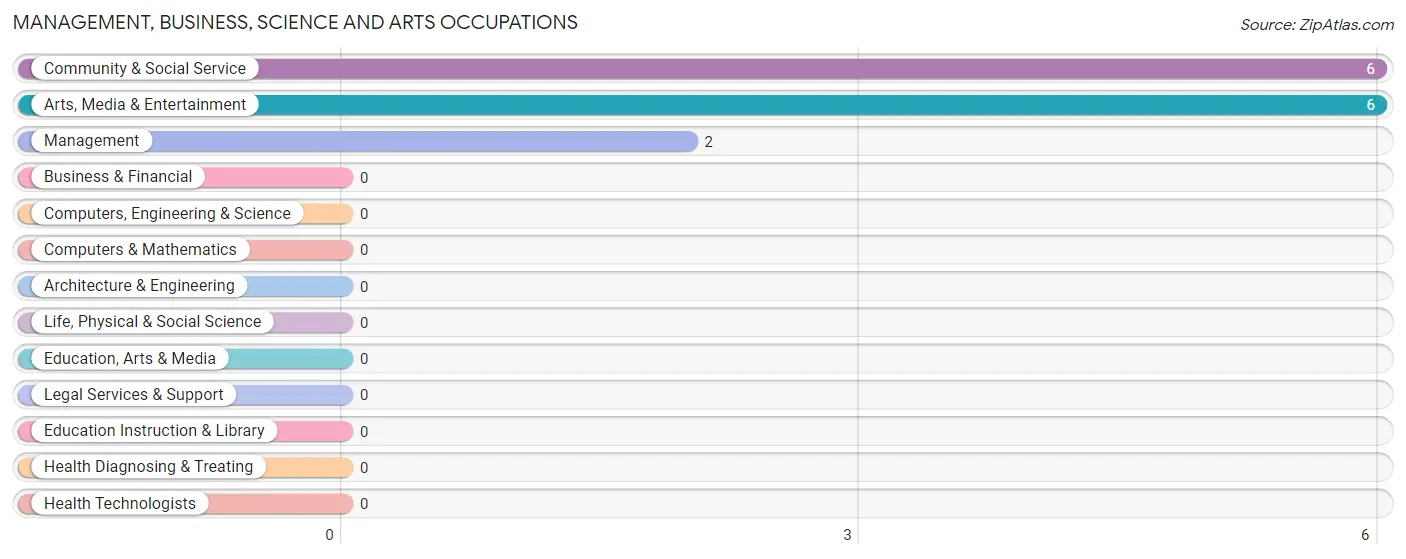
Management, Business, Science and Arts Occupations by Sex
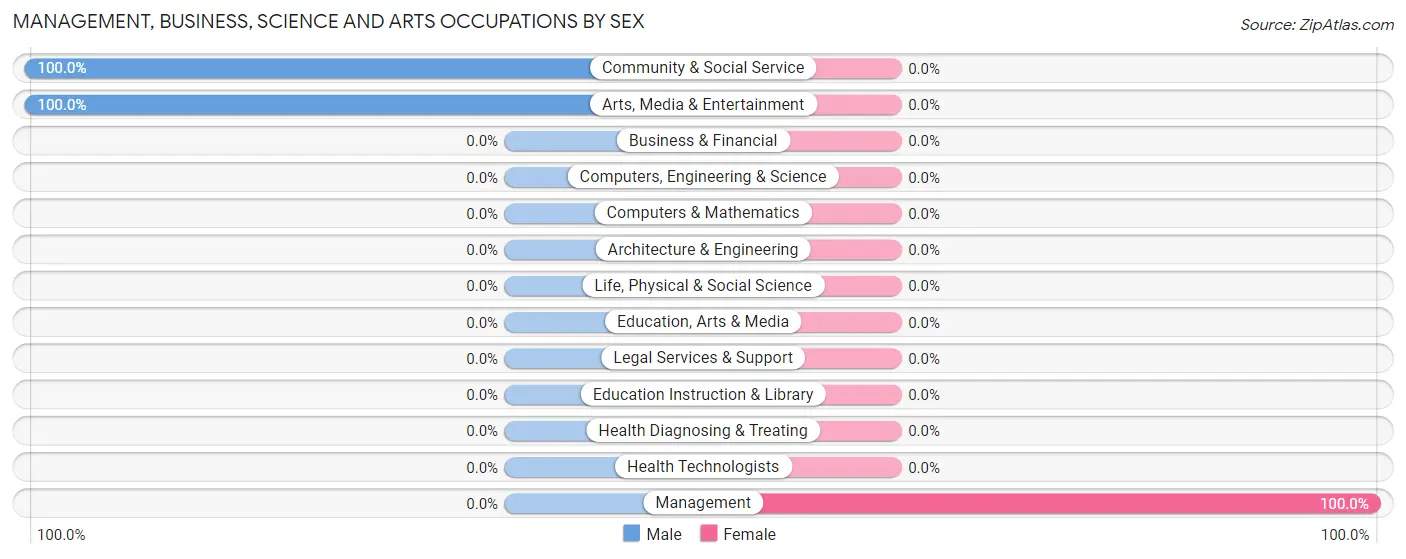
| Occupation | Male | Female |
| Management | 0 (0.0%) | 2 (100.0%) |
| Business & Financial | 0 (0.0%) | 0 (0.0%) |
| Computers, Engineering & Science | 0 (0.0%) | 0 (0.0%) |
| Computers & Mathematics | 0 (0.0%) | 0 (0.0%) |
| Architecture & Engineering | 0 (0.0%) | 0 (0.0%) |
| Life, Physical & Social Science | 0 (0.0%) | 0 (0.0%) |
| Community & Social Service | 6 (100.0%) | 0 (0.0%) |
| Education, Arts & Media | 0 (0.0%) | 0 (0.0%) |
| Legal Services & Support | 0 (0.0%) | 0 (0.0%) |
| Education Instruction & Library | 0 (0.0%) | 0 (0.0%) |
| Arts, Media & Entertainment | 6 (100.0%) | 0 (0.0%) |
| Health Diagnosing & Treating | 0 (0.0%) | 0 (0.0%) |
| Health Technologists | 0 (0.0%) | 0 (0.0%) |
| Total (Category) | 6 (75.0%) | 2 (25.0%) |
| Total (Overall) | 6 (30.0%) | 14 (70.0%) |
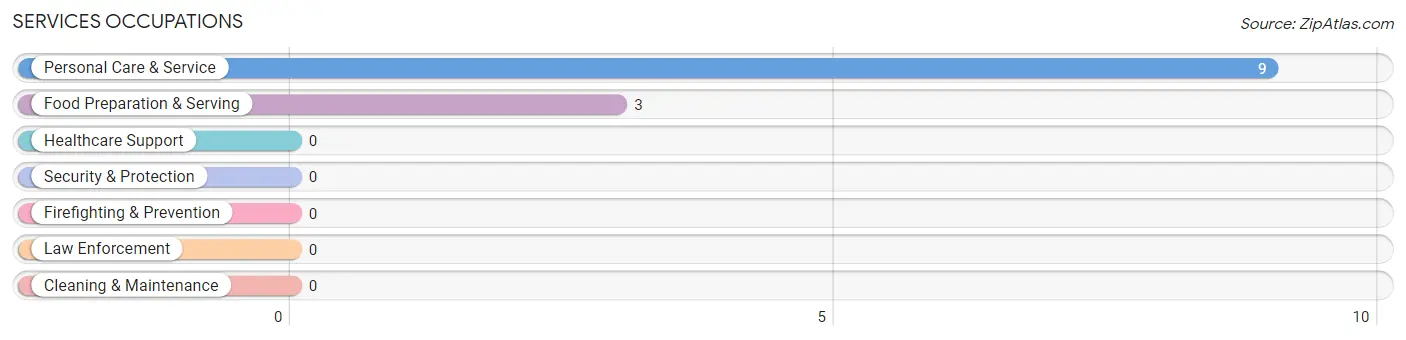
Services Occupations
The most common Services occupations in Cedar are Personal Care & Service (9 | 45.0%), and Food Preparation & Serving (3 | 15.0%).
Services Occupations by Sex
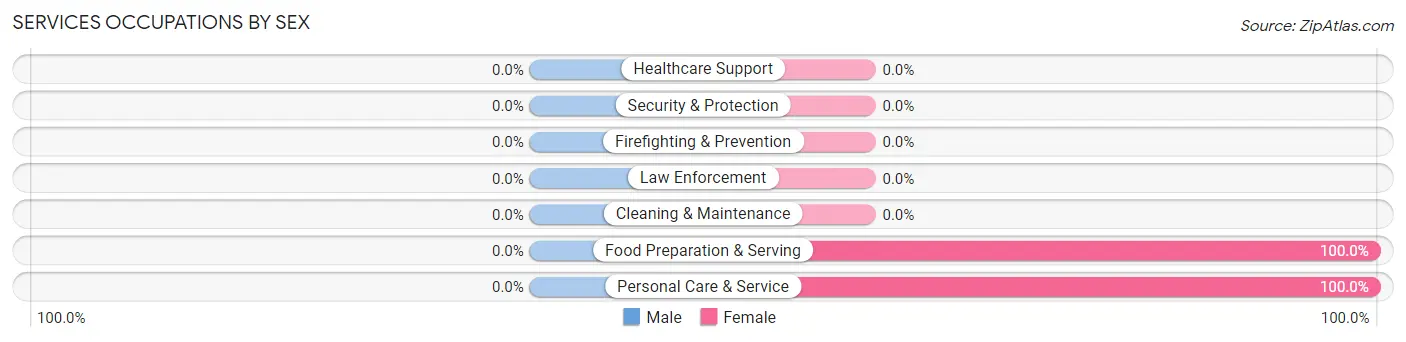
| Occupation | Male | Female |
| Healthcare Support | 0 (0.0%) | 0 (0.0%) |
| Security & Protection | 0 (0.0%) | 0 (0.0%) |
| Firefighting & Prevention | 0 (0.0%) | 0 (0.0%) |
| Law Enforcement | 0 (0.0%) | 0 (0.0%) |
| Food Preparation & Serving | 0 (0.0%) | 3 (100.0%) |
| Cleaning & Maintenance | 0 (0.0%) | 0 (0.0%) |
| Personal Care & Service | 0 (0.0%) | 9 (100.0%) |
| Total (Category) | 0 (0.0%) | 12 (100.0%) |
| Total (Overall) | 6 (30.0%) | 14 (70.0%) |
Sales and Office Occupations
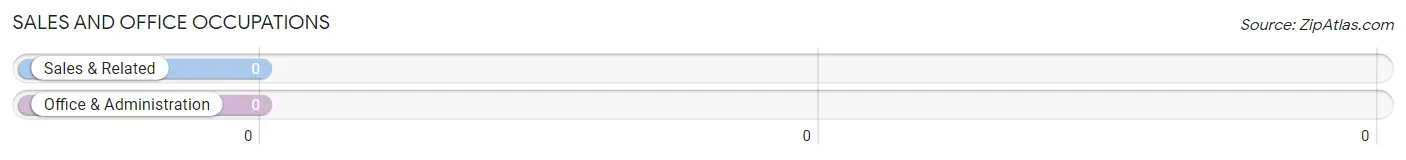
Sales and Office Occupations by Sex
| Occupation | Male | Female |
| Sales & Related | 0 (0.0%) | 0 (0.0%) |
| Office & Administration | 0 (0.0%) | 0 (0.0%) |
| Total (Category) | 0 (0.0%) | 0 (0.0%) |
| Total (Overall) | 6 (30.0%) | 14 (70.0%) |
Natural Resources, Construction and Maintenance Occupations
Natural Resources, Construction and Maintenance Occupations by Sex
| Occupation | Male | Female |
| Farming, Fishing & Forestry | 0 (0.0%) | 0 (0.0%) |
| Construction & Extraction | 0 (0.0%) | 0 (0.0%) |
| Installation, Maintenance & Repair | 0 (0.0%) | 0 (0.0%) |
| Total (Category) | 0 (0.0%) | 0 (0.0%) |
| Total (Overall) | 6 (30.0%) | 14 (70.0%) |
Production, Transportation and Moving Occupations
Production, Transportation and Moving Occupations by Sex
| Occupation | Male | Female |
| Production | 0 (0.0%) | 0 (0.0%) |
| Transportation | 0 (0.0%) | 0 (0.0%) |
| Material Moving | 0 (0.0%) | 0 (0.0%) |
| Total (Category) | 0 (0.0%) | 0 (0.0%) |
| Total (Overall) | 6 (30.0%) | 14 (70.0%) |
Employment Industries by Sex in Cedar
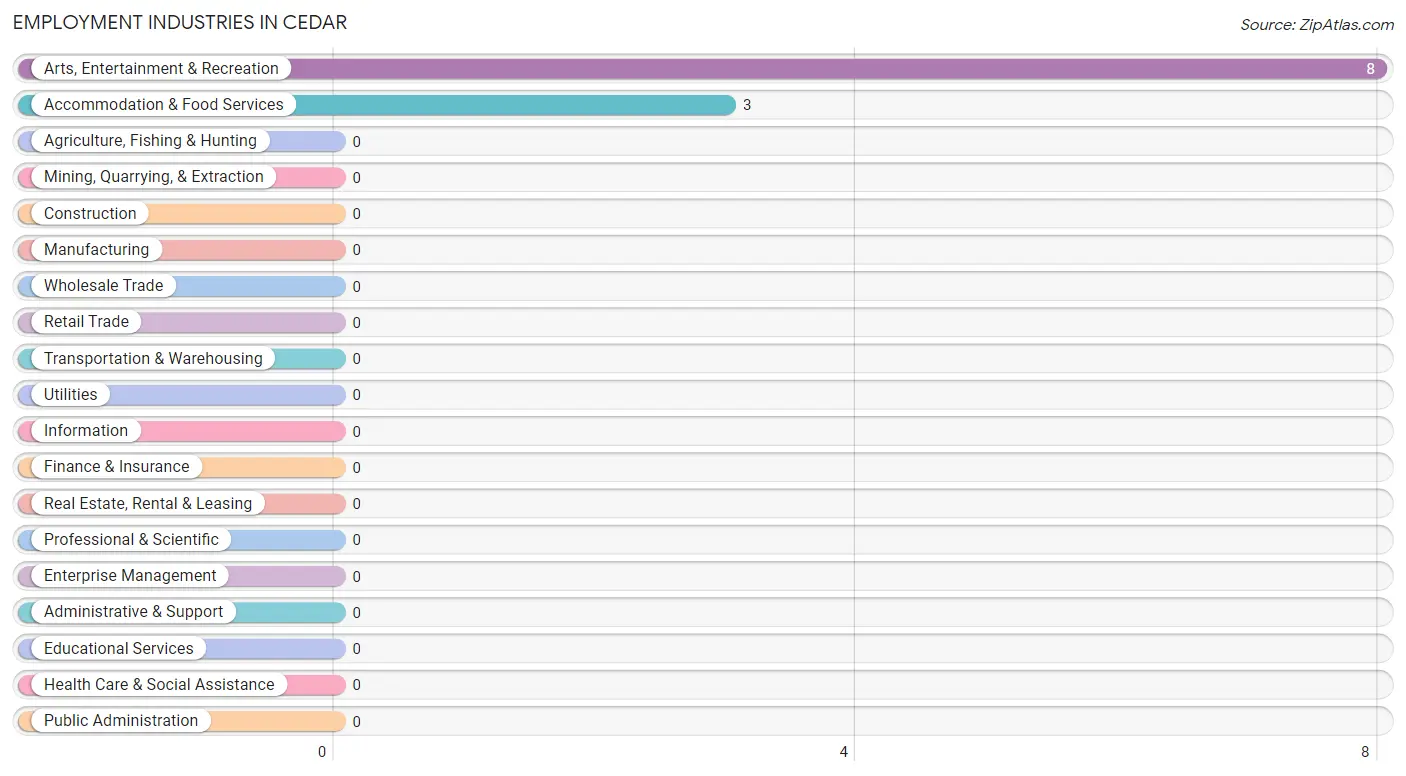
Employment Industries in Cedar
The major employment industries in Cedar include Arts, Entertainment & Recreation (8 | 40.0%), and Accommodation & Food Services (3 | 15.0%).
Employment Industries by Sex in Cedar
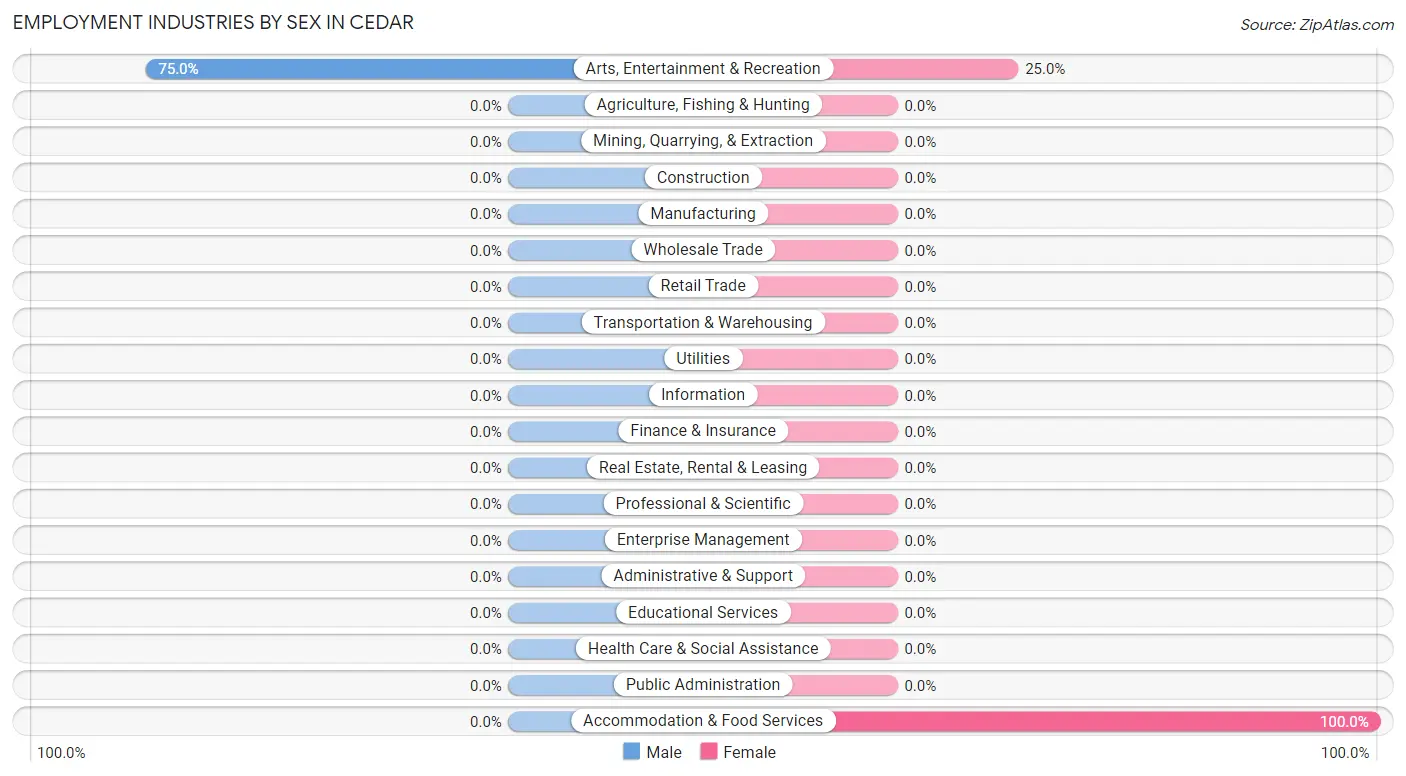
| Industry | Male | Female |
| Agriculture, Fishing & Hunting | 0 (0.0%) | 0 (0.0%) |
| Mining, Quarrying, & Extraction | 0 (0.0%) | 0 (0.0%) |
| Construction | 0 (0.0%) | 0 (0.0%) |
| Manufacturing | 0 (0.0%) | 0 (0.0%) |
| Wholesale Trade | 0 (0.0%) | 0 (0.0%) |
| Retail Trade | 0 (0.0%) | 0 (0.0%) |
| Transportation & Warehousing | 0 (0.0%) | 0 (0.0%) |
| Utilities | 0 (0.0%) | 0 (0.0%) |
| Information | 0 (0.0%) | 0 (0.0%) |
| Finance & Insurance | 0 (0.0%) | 0 (0.0%) |
| Real Estate, Rental & Leasing | 0 (0.0%) | 0 (0.0%) |
| Professional & Scientific | 0 (0.0%) | 0 (0.0%) |
| Enterprise Management | 0 (0.0%) | 0 (0.0%) |
| Administrative & Support | 0 (0.0%) | 0 (0.0%) |
| Educational Services | 0 (0.0%) | 0 (0.0%) |
| Health Care & Social Assistance | 0 (0.0%) | 0 (0.0%) |
| Arts, Entertainment & Recreation | 6 (75.0%) | 2 (25.0%) |
| Accommodation & Food Services | 0 (0.0%) | 3 (100.0%) |
| Public Administration | 0 (0.0%) | 0 (0.0%) |
| Total | 6 (30.0%) | 14 (70.0%) |
Education in Cedar
School Enrollment in Cedar
| School Level | # Students | % Students |
| Nursery / Preschool | 0 | 0.0% |
| Kindergarten | 0 | 0.0% |
| Elementary School | 0 | 0.0% |
| Middle School | 0 | 0.0% |
| High School | 0 | 0.0% |
| College / Undergraduate | 0 | 0.0% |
| Graduate / Professional | 0 | 0.0% |
| Total | 0 | 0.0% |
School Enrollment by Age by Funding Source in Cedar
| Age Bracket | Public School | Private School |
| 3 to 4 Year Olds | 0 (0.0%) | 0 (0.0%) |
| 5 to 9 Year Old | 0 (0.0%) | 0 (0.0%) |
| 10 to 14 Year Olds | 0 (0.0%) | 0 (0.0%) |
| 15 to 17 Year Olds | 0 (0.0%) | 0 (0.0%) |
| 18 to 19 Year Olds | 0 (0.0%) | 0 (0.0%) |
| 20 to 24 Year Olds | 0 (0.0%) | 0 (0.0%) |
| 25 to 34 Year Olds | 0 (0.0%) | 0 (0.0%) |
| 35 Years and over | 0 (0.0%) | 0 (0.0%) |
| Total | 0 (0.0%) | 0 (0.0%) |
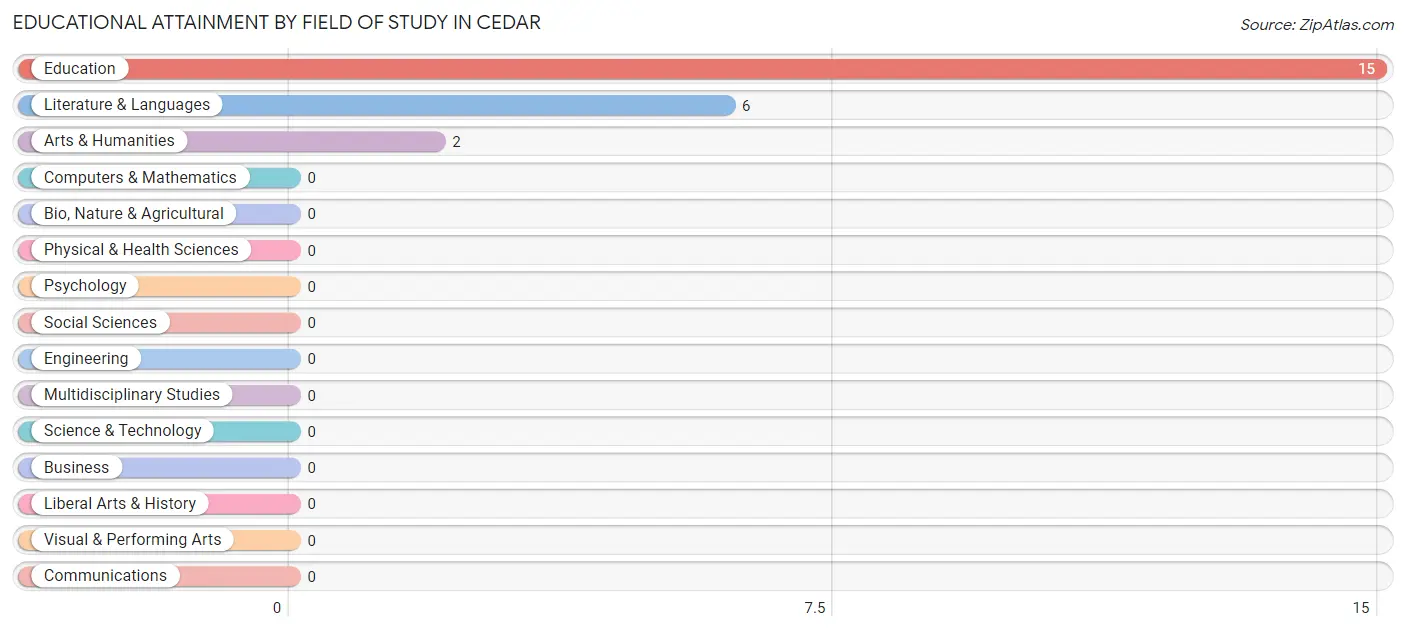
Educational Attainment by Field of Study in Cedar
Education (15 | 65.2%), literature & languages (6 | 26.1%), and arts & humanities (2 | 8.7%) are the most common fields of study among 23 individuals in Cedar who have obtained a bachelor's degree or higher.
| Field of Study | # Graduates | % Graduates |
| Computers & Mathematics | 0 | 0.0% |
| Bio, Nature & Agricultural | 0 | 0.0% |
| Physical & Health Sciences | 0 | 0.0% |
| Psychology | 0 | 0.0% |
| Social Sciences | 0 | 0.0% |
| Engineering | 0 | 0.0% |
| Multidisciplinary Studies | 0 | 0.0% |
| Science & Technology | 0 | 0.0% |
| Business | 0 | 0.0% |
| Education | 15 | 65.2% |
| Literature & Languages | 6 | 26.1% |
| Liberal Arts & History | 0 | 0.0% |
| Visual & Performing Arts | 0 | 0.0% |
| Communications | 0 | 0.0% |
| Arts & Humanities | 2 | 8.7% |
| Total | 23 | 100.0% |
Transportation & Commute in Cedar
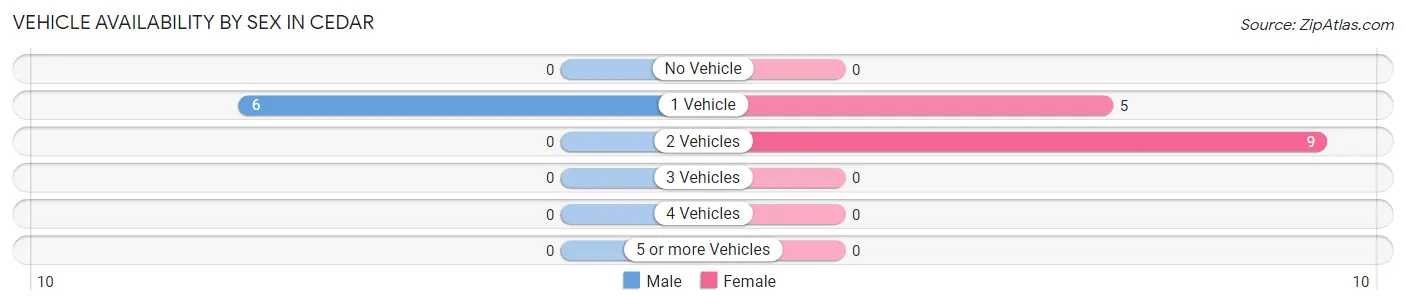
Vehicle Availability by Sex in Cedar
The most prevalent vehicle ownership categories in Cedar are males with 1 vehicle (6, accounting for 100.0%) and females with 1 vehicle (5, making up 42.9%).
| Vehicles Available | Male | Female |
| No Vehicle | 0 (0.0%) | 0 (0.0%) |
| 1 Vehicle | 6 (100.0%) | 5 (35.7%) |
| 2 Vehicles | 0 (0.0%) | 9 (64.3%) |
| 3 Vehicles | 0 (0.0%) | 0 (0.0%) |
| 4 Vehicles | 0 (0.0%) | 0 (0.0%) |
| 5 or more Vehicles | 0 (0.0%) | 0 (0.0%) |
| Total | 6 (100.0%) | 14 (100.0%) |
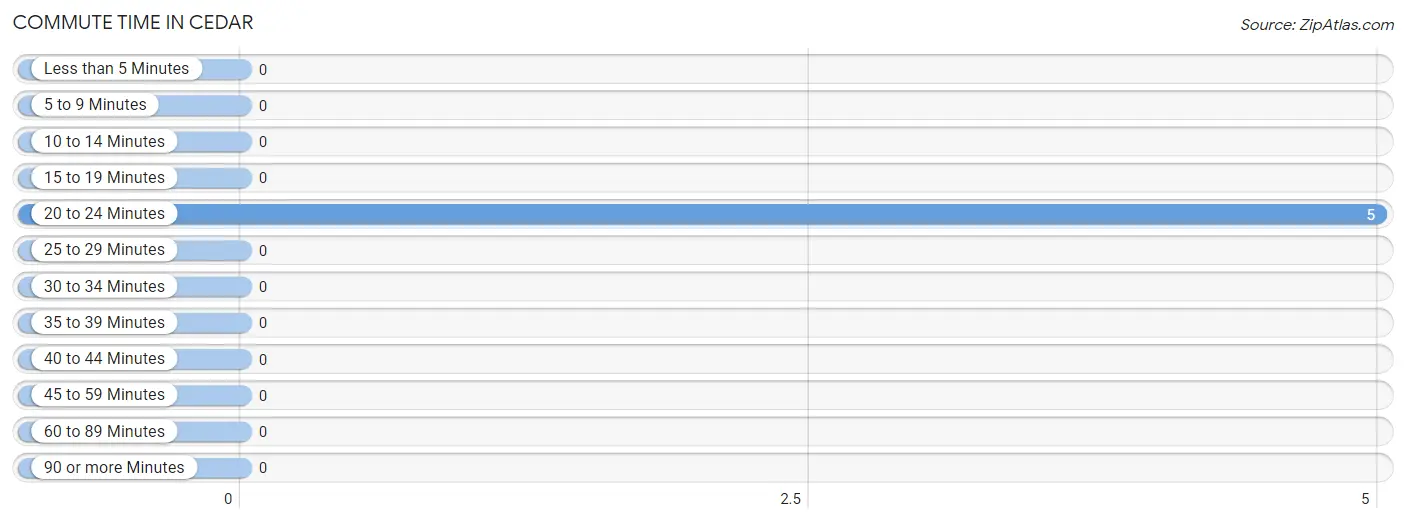
Commute Time in Cedar
The most frequently occuring commute durations in Cedar are 20 to 24 minutes (5 commuters, 100.0%), less than 5 minutes (0 commuters, 0.0%), and 5 to 9 minutes (0 commuters, 0.0%).
| Commute Time | # Commuters | % Commuters |
| Less than 5 Minutes | 0 | 0.0% |
| 5 to 9 Minutes | 0 | 0.0% |
| 10 to 14 Minutes | 0 | 0.0% |
| 15 to 19 Minutes | 0 | 0.0% |
| 20 to 24 Minutes | 5 | 100.0% |
| 25 to 29 Minutes | 0 | 0.0% |
| 30 to 34 Minutes | 0 | 0.0% |
| 35 to 39 Minutes | 0 | 0.0% |
| 40 to 44 Minutes | 0 | 0.0% |
| 45 to 59 Minutes | 0 | 0.0% |
| 60 to 89 Minutes | 0 | 0.0% |
| 90 or more Minutes | 0 | 0.0% |
Commute Time by Sex in Cedar
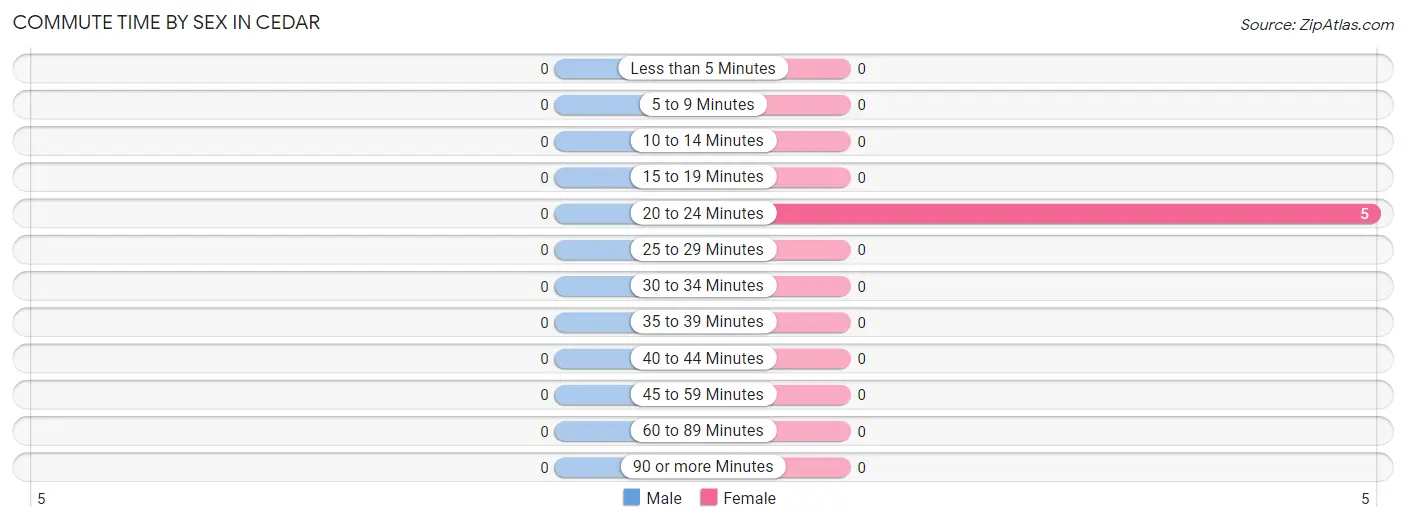
| Commute Time | Male | Female |
| Less than 5 Minutes | 0 (0.0%) | 0 (0.0%) |
| 5 to 9 Minutes | 0 (0.0%) | 0 (0.0%) |
| 10 to 14 Minutes | 0 (0.0%) | 0 (0.0%) |
| 15 to 19 Minutes | 0 (0.0%) | 0 (0.0%) |
| 20 to 24 Minutes | 0 (0.0%) | 5 (100.0%) |
| 25 to 29 Minutes | 0 (0.0%) | 0 (0.0%) |
| 30 to 34 Minutes | 0 (0.0%) | 0 (0.0%) |
| 35 to 39 Minutes | 0 (0.0%) | 0 (0.0%) |
| 40 to 44 Minutes | 0 (0.0%) | 0 (0.0%) |
| 45 to 59 Minutes | 0 (0.0%) | 0 (0.0%) |
| 60 to 89 Minutes | 0 (0.0%) | 0 (0.0%) |
| 90 or more Minutes | 0 (0.0%) | 0 (0.0%) |
Time of Departure to Work by Sex in Cedar
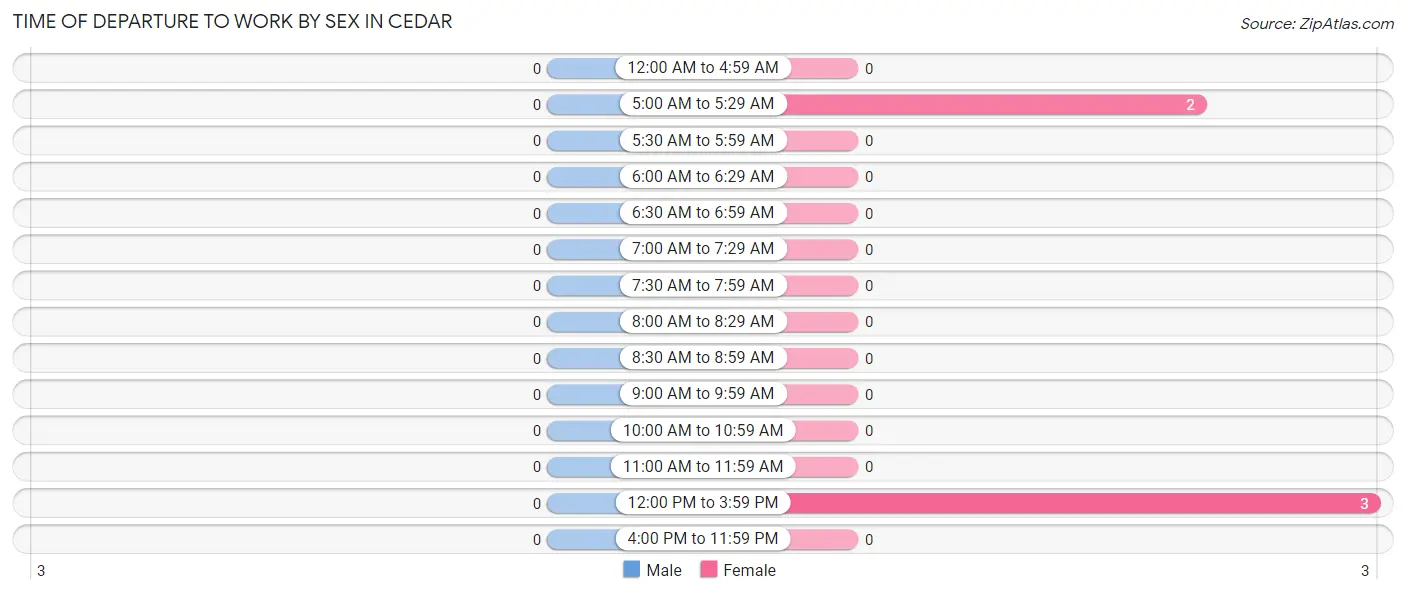
| Time of Departure | Male | Female |
| 12:00 AM to 4:59 AM | 0 (0.0%) | 0 (0.0%) |
| 5:00 AM to 5:29 AM | 0 (0.0%) | 2 (40.0%) |
| 5:30 AM to 5:59 AM | 0 (0.0%) | 0 (0.0%) |
| 6:00 AM to 6:29 AM | 0 (0.0%) | 0 (0.0%) |
| 6:30 AM to 6:59 AM | 0 (0.0%) | 0 (0.0%) |
| 7:00 AM to 7:29 AM | 0 (0.0%) | 0 (0.0%) |
| 7:30 AM to 7:59 AM | 0 (0.0%) | 0 (0.0%) |
| 8:00 AM to 8:29 AM | 0 (0.0%) | 0 (0.0%) |
| 8:30 AM to 8:59 AM | 0 (0.0%) | 0 (0.0%) |
| 9:00 AM to 9:59 AM | 0 (0.0%) | 0 (0.0%) |
| 10:00 AM to 10:59 AM | 0 (0.0%) | 0 (0.0%) |
| 11:00 AM to 11:59 AM | 0 (0.0%) | 0 (0.0%) |
| 12:00 PM to 3:59 PM | 0 (0.0%) | 3 (60.0%) |
| 4:00 PM to 11:59 PM | 0 (0.0%) | 0 (0.0%) |
| Total | 0 (0.0%) | 5 (100.0%) |
Housing Occupancy in Cedar
Occupancy by Ownership in Cedar
Of the total 32 dwellings in Cedar, owner-occupied units account for 26 (81.2%), while renter-occupied units make up 6 (18.8%).
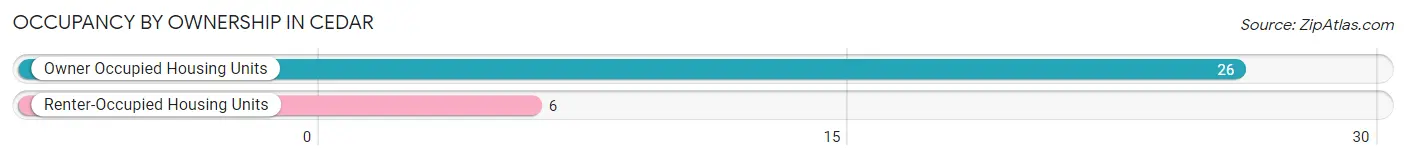
| Occupancy | # Housing Units | % Housing Units |
| Owner Occupied Housing Units | 26 | 81.2% |
| Renter-Occupied Housing Units | 6 | 18.8% |
| Total Occupied Housing Units | 32 | 100.0% |
Occupancy by Household Size in Cedar
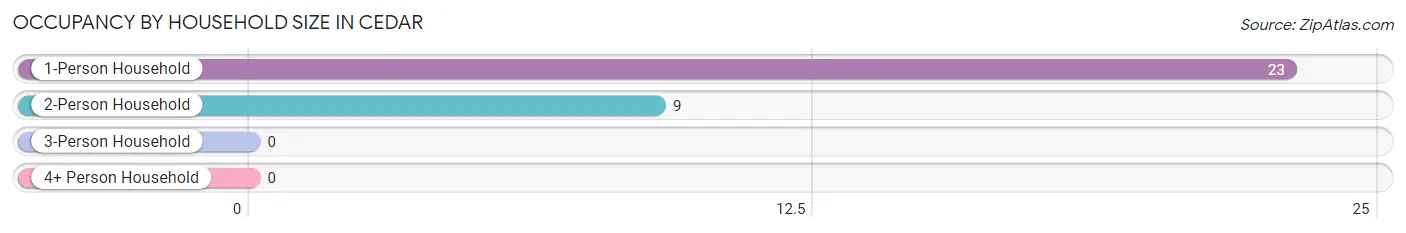
| Household Size | # Housing Units | % Housing Units |
| 1-Person Household | 23 | 71.9% |
| 2-Person Household | 9 | 28.1% |
| 3-Person Household | 0 | 0.0% |
| 4+ Person Household | 0 | 0.0% |
| Total Housing Units | 32 | 100.0% |
Occupancy by Ownership by Household Size in Cedar
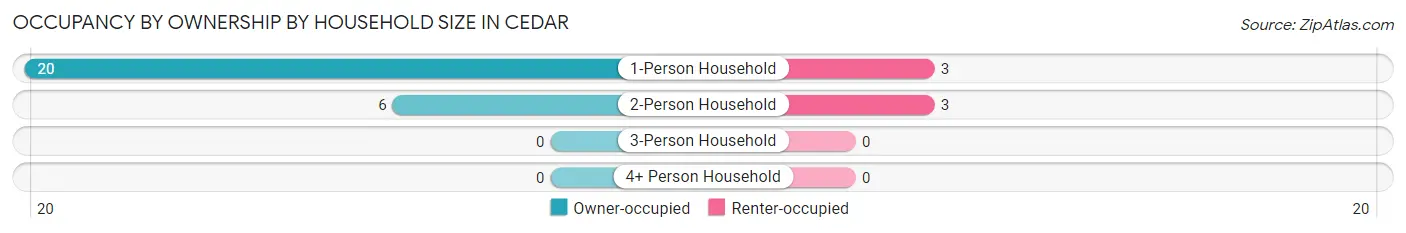
| Household Size | Owner-occupied | Renter-occupied |
| 1-Person Household | 20 (87.0%) | 3 (13.0%) |
| 2-Person Household | 6 (66.7%) | 3 (33.3%) |
| 3-Person Household | 0 (0.0%) | 0 (0.0%) |
| 4+ Person Household | 0 (0.0%) | 0 (0.0%) |
| Total Housing Units | 26 (81.2%) | 6 (18.8%) |
Occupancy by Educational Attainment in Cedar
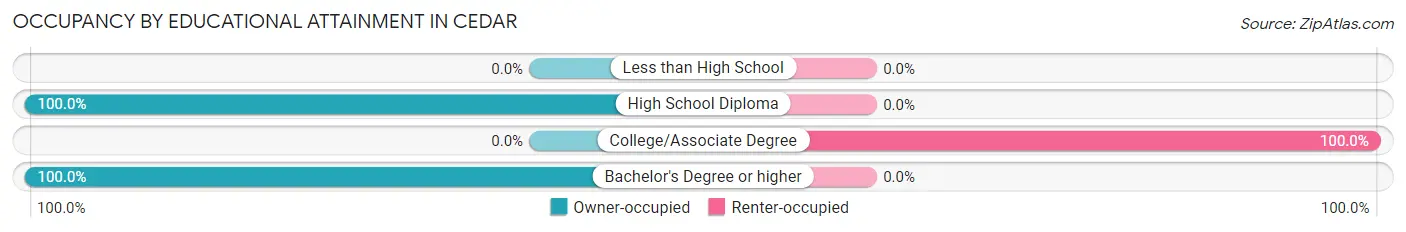
| Household Size | Owner-occupied | Renter-occupied |
| Less than High School | 0 (0.0%) | 0 (0.0%) |
| High School Diploma | 9 (100.0%) | 0 (0.0%) |
| College/Associate Degree | 0 (0.0%) | 6 (100.0%) |
| Bachelor's Degree or higher | 17 (100.0%) | 0 (0.0%) |
Occupancy by Age of Householder in Cedar
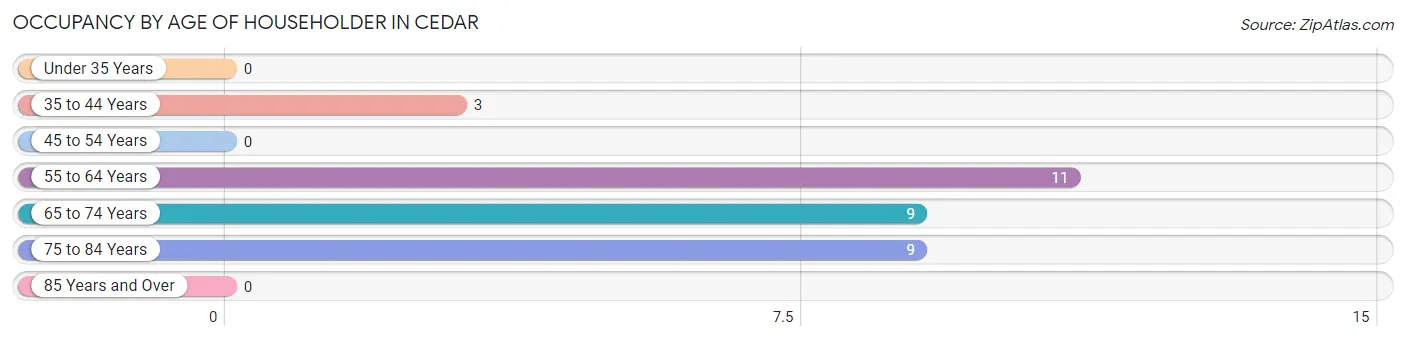
| Age Bracket | # Households | % Households |
| Under 35 Years | 0 | 0.0% |
| 35 to 44 Years | 3 | 9.4% |
| 45 to 54 Years | 0 | 0.0% |
| 55 to 64 Years | 11 | 34.4% |
| 65 to 74 Years | 9 | 28.1% |
| 75 to 84 Years | 9 | 28.1% |
| 85 Years and Over | 0 | 0.0% |
| Total | 32 | 100.0% |
Housing Finances in Cedar
Median Income by Occupancy in Cedar
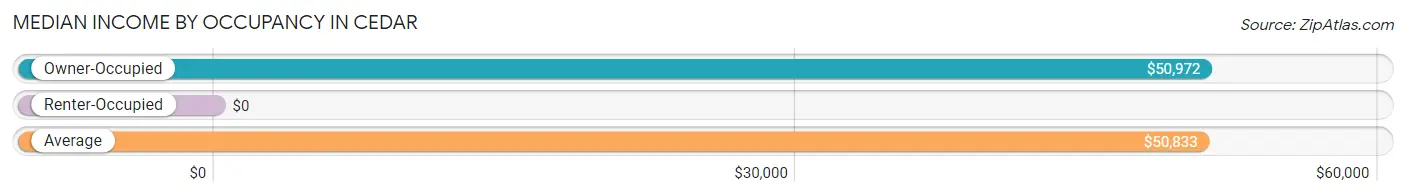
| Occupancy Type | # Households | Median Income |
| Owner-Occupied | 26 (81.2%) | $50,972 |
| Renter-Occupied | 6 (18.8%) | $0 |
| Average | 32 (100.0%) | $50,833 |
Occupancy by Householder Income Bracket in Cedar
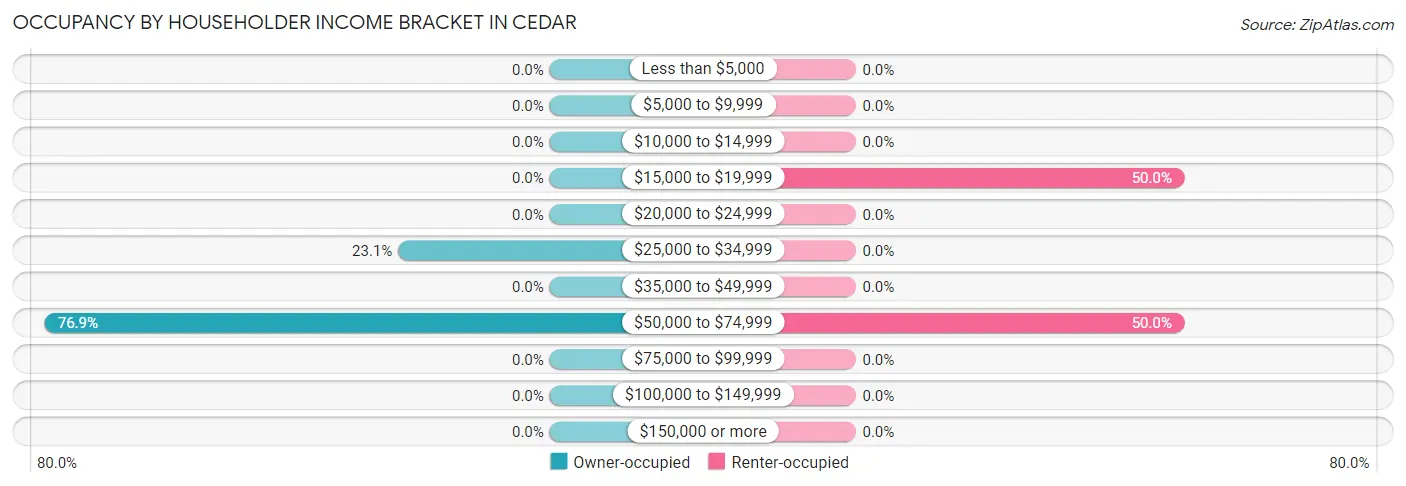
| Income Bracket | Owner-occupied | Renter-occupied |
| Less than $5,000 | 0 (0.0%) | 0 (0.0%) |
| $5,000 to $9,999 | 0 (0.0%) | 0 (0.0%) |
| $10,000 to $14,999 | 0 (0.0%) | 0 (0.0%) |
| $15,000 to $19,999 | 0 (0.0%) | 3 (50.0%) |
| $20,000 to $24,999 | 0 (0.0%) | 0 (0.0%) |
| $25,000 to $34,999 | 6 (23.1%) | 0 (0.0%) |
| $35,000 to $49,999 | 0 (0.0%) | 0 (0.0%) |
| $50,000 to $74,999 | 20 (76.9%) | 3 (50.0%) |
| $75,000 to $99,999 | 0 (0.0%) | 0 (0.0%) |
| $100,000 to $149,999 | 0 (0.0%) | 0 (0.0%) |
| $150,000 or more | 0 (0.0%) | 0 (0.0%) |
| Total | 26 (100.0%) | 6 (100.0%) |
Monthly Housing Cost Tiers in Cedar
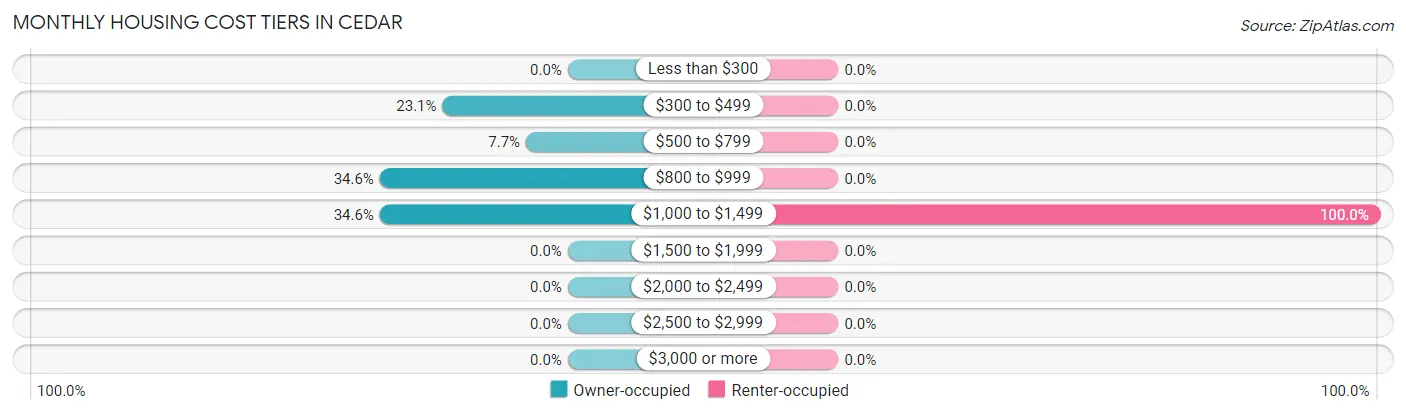
| Monthly Cost | Owner-occupied | Renter-occupied |
| Less than $300 | 0 (0.0%) | 0 (0.0%) |
| $300 to $499 | 6 (23.1%) | 0 (0.0%) |
| $500 to $799 | 2 (7.7%) | 0 (0.0%) |
| $800 to $999 | 9 (34.6%) | 0 (0.0%) |
| $1,000 to $1,499 | 9 (34.6%) | 6 (100.0%) |
| $1,500 to $1,999 | 0 (0.0%) | 0 (0.0%) |
| $2,000 to $2,499 | 0 (0.0%) | 0 (0.0%) |
| $2,500 to $2,999 | 0 (0.0%) | 0 (0.0%) |
| $3,000 or more | 0 (0.0%) | 0 (0.0%) |
| Total | 26 (100.0%) | 6 (100.0%) |
Physical Housing Characteristics in Cedar
Housing Structures in Cedar
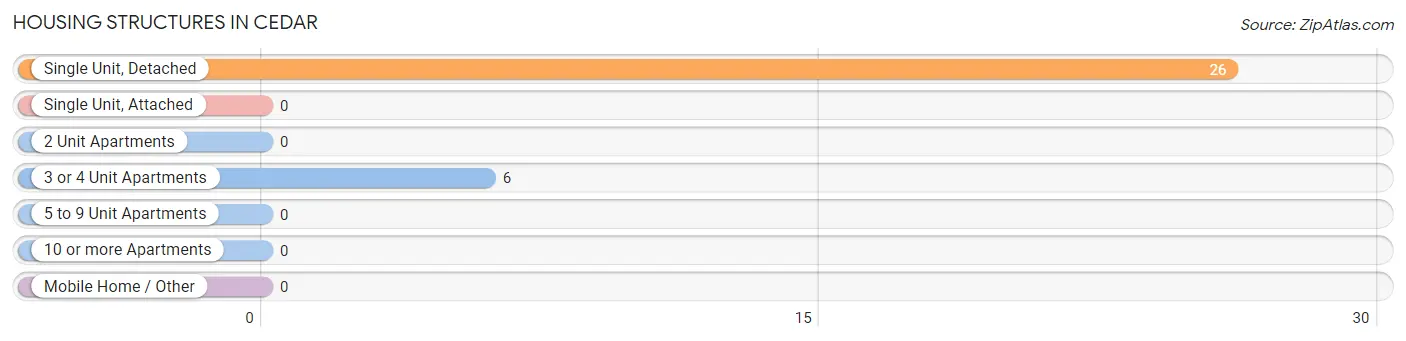
| Structure Type | # Housing Units | % Housing Units |
| Single Unit, Detached | 26 | 81.2% |
| Single Unit, Attached | 0 | 0.0% |
| 2 Unit Apartments | 0 | 0.0% |
| 3 or 4 Unit Apartments | 6 | 18.8% |
| 5 to 9 Unit Apartments | 0 | 0.0% |
| 10 or more Apartments | 0 | 0.0% |
| Mobile Home / Other | 0 | 0.0% |
| Total | 32 | 100.0% |
Housing Structures by Occupancy in Cedar
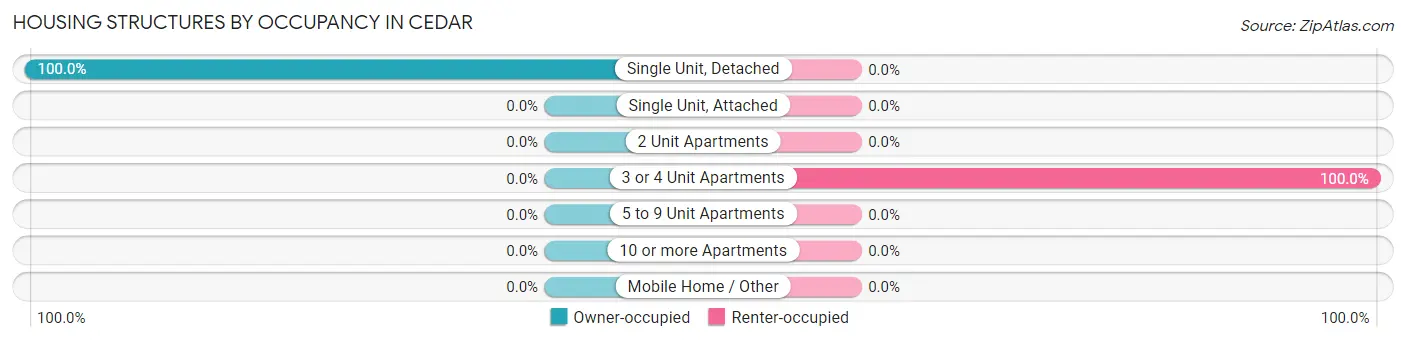
| Structure Type | Owner-occupied | Renter-occupied |
| Single Unit, Detached | 26 (100.0%) | 0 (0.0%) |
| Single Unit, Attached | 0 (0.0%) | 0 (0.0%) |
| 2 Unit Apartments | 0 (0.0%) | 0 (0.0%) |
| 3 or 4 Unit Apartments | 0 (0.0%) | 6 (100.0%) |
| 5 to 9 Unit Apartments | 0 (0.0%) | 0 (0.0%) |
| 10 or more Apartments | 0 (0.0%) | 0 (0.0%) |
| Mobile Home / Other | 0 (0.0%) | 0 (0.0%) |
| Total | 26 (81.2%) | 6 (18.8%) |
Housing Structures by Number of Rooms in Cedar
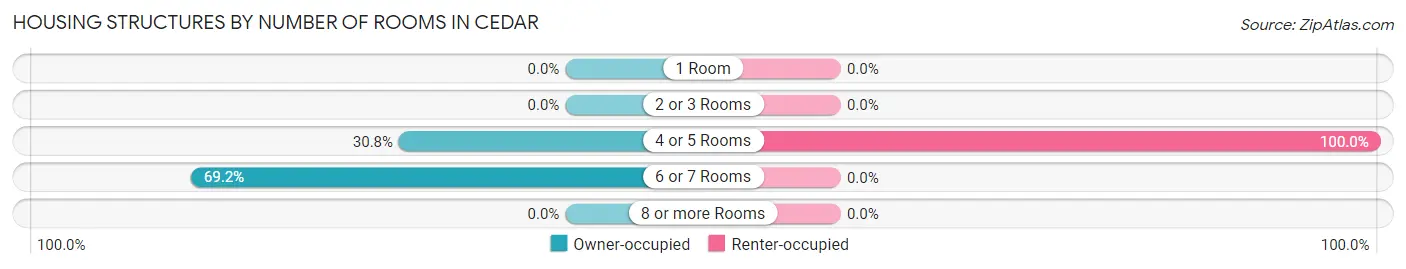
| Number of Rooms | Owner-occupied | Renter-occupied |
| 1 Room | 0 (0.0%) | 0 (0.0%) |
| 2 or 3 Rooms | 0 (0.0%) | 0 (0.0%) |
| 4 or 5 Rooms | 8 (30.8%) | 6 (100.0%) |
| 6 or 7 Rooms | 18 (69.2%) | 0 (0.0%) |
| 8 or more Rooms | 0 (0.0%) | 0 (0.0%) |
| Total | 26 (100.0%) | 6 (100.0%) |
Housing Structure by Heating Type in Cedar
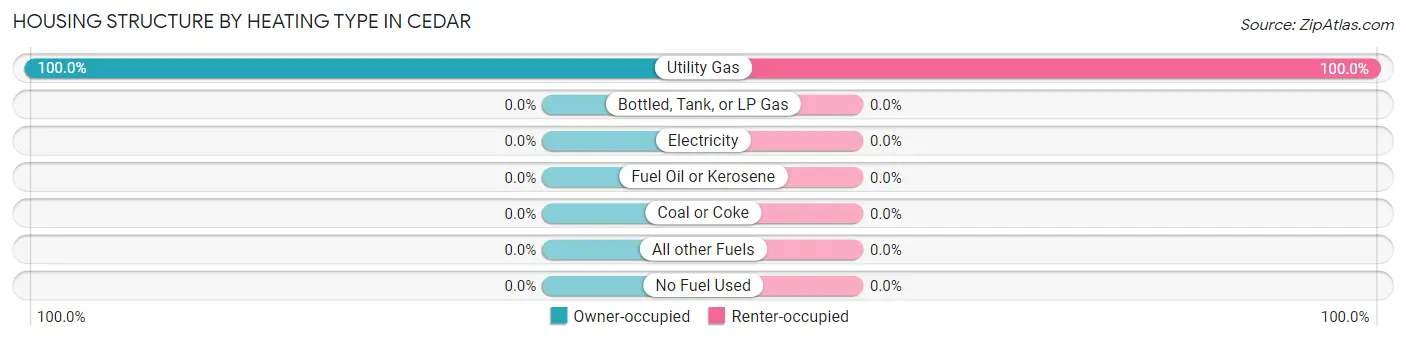
| Heating Type | Owner-occupied | Renter-occupied |
| Utility Gas | 26 (100.0%) | 6 (100.0%) |
| Bottled, Tank, or LP Gas | 0 (0.0%) | 0 (0.0%) |
| Electricity | 0 (0.0%) | 0 (0.0%) |
| Fuel Oil or Kerosene | 0 (0.0%) | 0 (0.0%) |
| Coal or Coke | 0 (0.0%) | 0 (0.0%) |
| All other Fuels | 0 (0.0%) | 0 (0.0%) |
| No Fuel Used | 0 (0.0%) | 0 (0.0%) |
| Total | 26 (100.0%) | 6 (100.0%) |
Household Vehicle Usage in Cedar
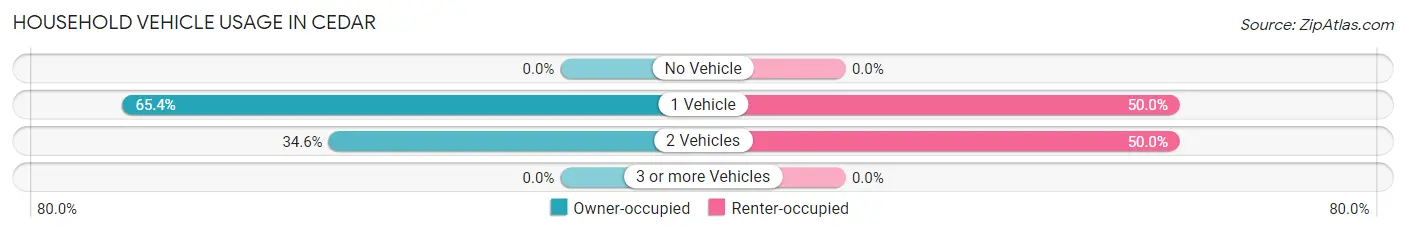
| Vehicles per Household | Owner-occupied | Renter-occupied |
| No Vehicle | 0 (0.0%) | 0 (0.0%) |
| 1 Vehicle | 17 (65.4%) | 3 (50.0%) |
| 2 Vehicles | 9 (34.6%) | 3 (50.0%) |
| 3 or more Vehicles | 0 (0.0%) | 0 (0.0%) |
| Total | 26 (100.0%) | 6 (100.0%) |
Real Estate & Mortgages in Cedar
Real Estate and Mortgage Overview in Cedar
| Characteristic | Without Mortgage | With Mortgage |
| Housing Units | 8 | 18 |
| Median Property Value | - | - |
| Median Household Income | - | - |
| Monthly Housing Costs | - | - |
| Real Estate Taxes | - | - |
Property Value by Mortgage Status in Cedar
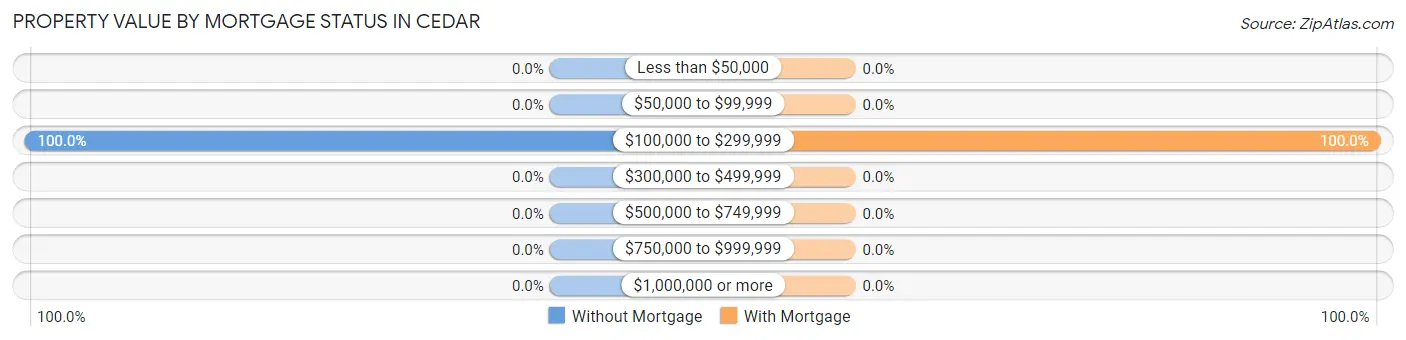
| Property Value | Without Mortgage | With Mortgage |
| Less than $50,000 | 0 (0.0%) | 0 (0.0%) |
| $50,000 to $99,999 | 0 (0.0%) | 0 (0.0%) |
| $100,000 to $299,999 | 8 (100.0%) | 18 (100.0%) |
| $300,000 to $499,999 | 0 (0.0%) | 0 (0.0%) |
| $500,000 to $749,999 | 0 (0.0%) | 0 (0.0%) |
| $750,000 to $999,999 | 0 (0.0%) | 0 (0.0%) |
| $1,000,000 or more | 0 (0.0%) | 0 (0.0%) |
| Total | 8 (100.0%) | 18 (100.0%) |
Household Income by Mortgage Status in Cedar
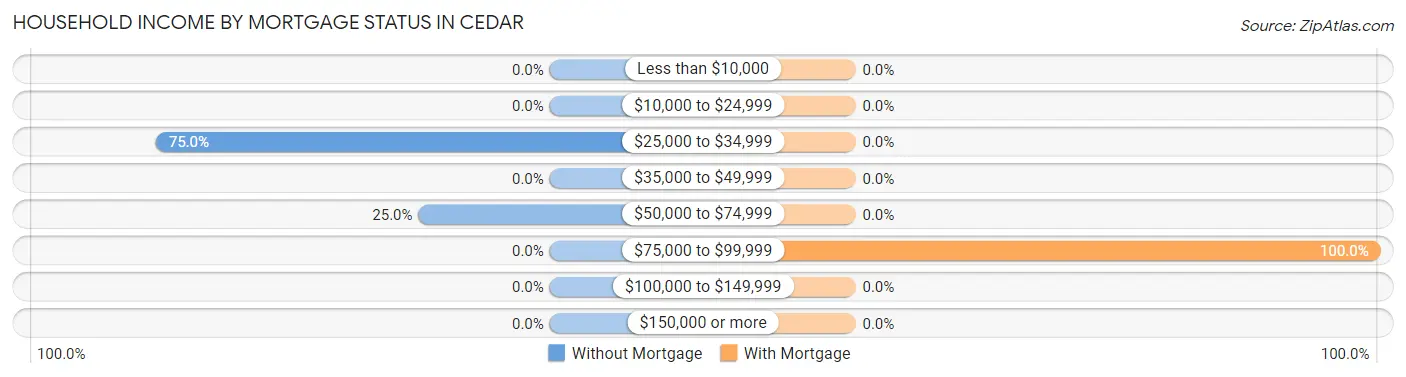
| Household Income | Without Mortgage | With Mortgage |
| Less than $10,000 | 0 (0.0%) | 0 (0.0%) |
| $10,000 to $24,999 | 0 (0.0%) | 0 (0.0%) |
| $25,000 to $34,999 | 6 (75.0%) | 0 (0.0%) |
| $35,000 to $49,999 | 0 (0.0%) | 0 (0.0%) |
| $50,000 to $74,999 | 2 (25.0%) | 0 (0.0%) |
| $75,000 to $99,999 | 0 (0.0%) | 18 (100.0%) |
| $100,000 to $149,999 | 0 (0.0%) | 0 (0.0%) |
| $150,000 or more | 0 (0.0%) | 0 (0.0%) |
| Total | 8 (100.0%) | 18 (100.0%) |
Property Value to Household Income Ratio in Cedar
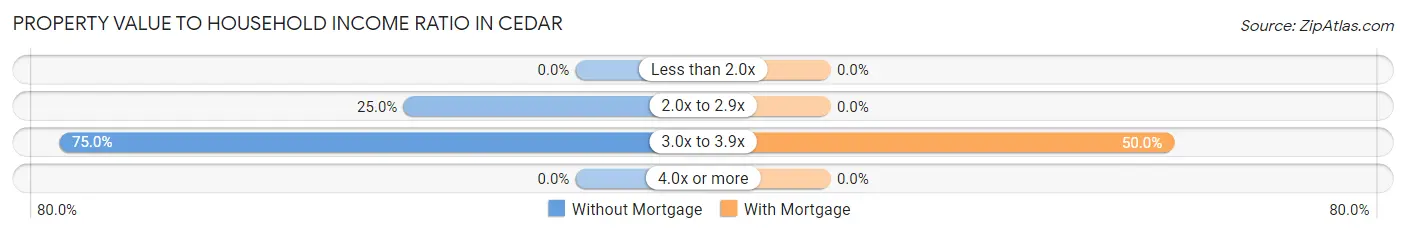
| Value-to-Income Ratio | Without Mortgage | With Mortgage |
| Less than 2.0x | 0 (0.0%) | 0 (0.0%) |
| 2.0x to 2.9x | 2 (25.0%) | 0 (0.0%) |
| 3.0x to 3.9x | 6 (75.0%) | 9 (50.0%) |
| 4.0x or more | 0 (0.0%) | 0 (0.0%) |
| Total | 8 (100.0%) | 18 (100.0%) |
Real Estate Taxes by Mortgage Status in Cedar
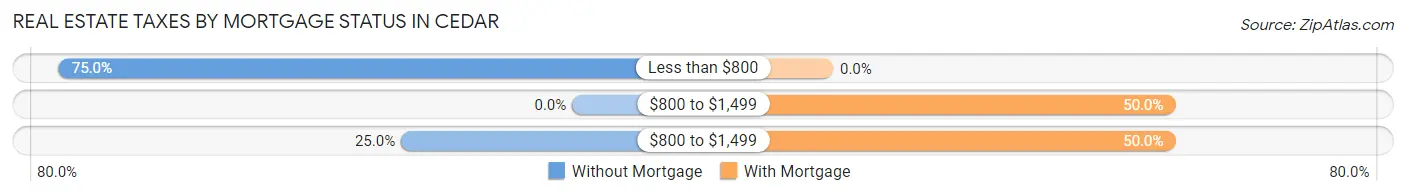
| Property Taxes | Without Mortgage | With Mortgage |
| Less than $800 | 6 (75.0%) | 0 (0.0%) |
| $800 to $1,499 | 0 (0.0%) | 9 (50.0%) |
| $800 to $1,499 | 2 (25.0%) | 9 (50.0%) |
| Total | 8 (100.0%) | 18 (100.0%) |
Health & Disability in Cedar
Health Insurance Coverage by Age in Cedar
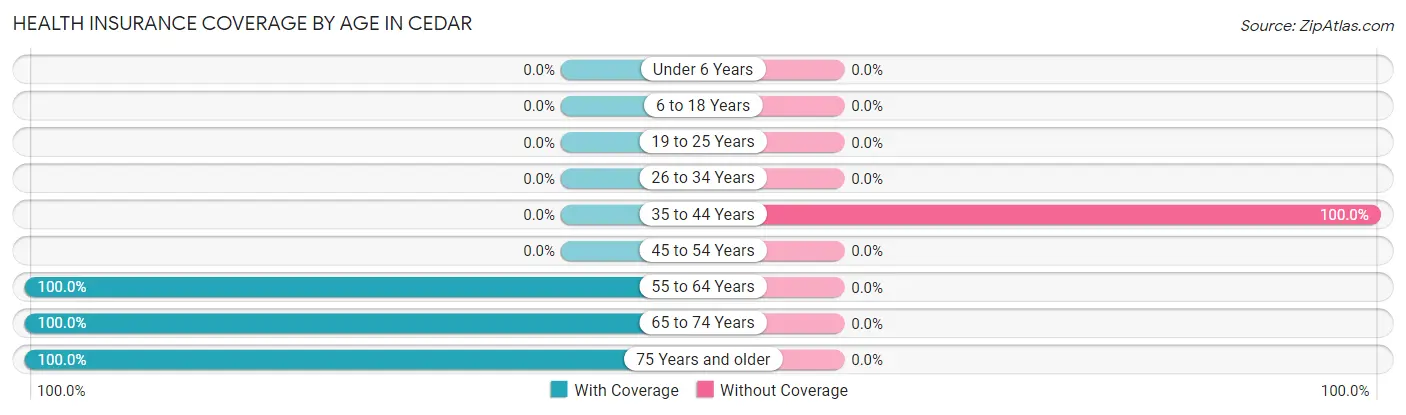
| Age Bracket | With Coverage | Without Coverage |
| Under 6 Years | 0 (0.0%) | 0 (0.0%) |
| 6 to 18 Years | 0 (0.0%) | 0 (0.0%) |
| 19 to 25 Years | 0 (0.0%) | 0 (0.0%) |
| 26 to 34 Years | 0 (0.0%) | 0 (0.0%) |
| 35 to 44 Years | 0 (0.0%) | 3 (100.0%) |
| 45 to 54 Years | 0 (0.0%) | 0 (0.0%) |
| 55 to 64 Years | 11 (100.0%) | 0 (0.0%) |
| 65 to 74 Years | 18 (100.0%) | 0 (0.0%) |
| 75 Years and older | 9 (100.0%) | 0 (0.0%) |
| Total | 38 (92.7%) | 3 (7.3%) |
Health Insurance Coverage by Citizenship Status in Cedar
| Citizenship Status | With Coverage | Without Coverage |
| Native Born | 0 (0.0%) | 0 (0.0%) |
| Foreign Born, Citizen | 0 (0.0%) | 0 (0.0%) |
| Foreign Born, not a Citizen | 0 (0.0%) | 0 (0.0%) |
Health Insurance Coverage by Household Income in Cedar
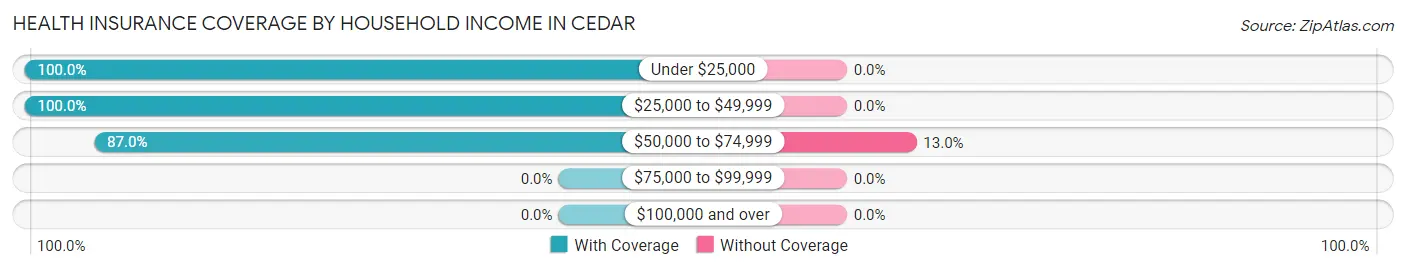
| Household Income | With Coverage | Without Coverage |
| Under $25,000 | 6 (100.0%) | 0 (0.0%) |
| $25,000 to $49,999 | 12 (100.0%) | 0 (0.0%) |
| $50,000 to $74,999 | 20 (87.0%) | 3 (13.0%) |
| $75,000 to $99,999 | 0 (0.0%) | 0 (0.0%) |
| $100,000 and over | 0 (0.0%) | 0 (0.0%) |
Public vs Private Health Insurance Coverage by Age in Cedar
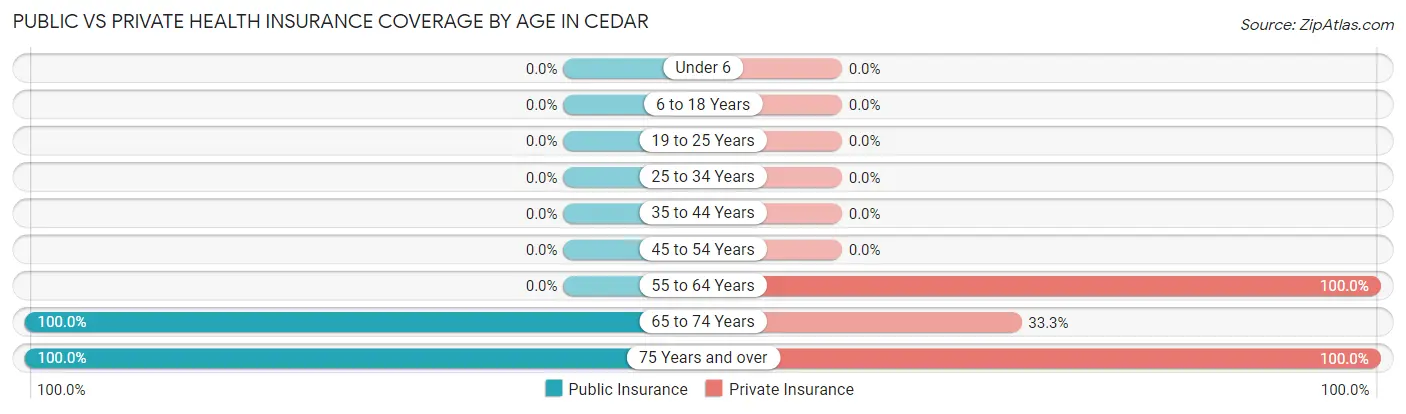
| Age Bracket | Public Insurance | Private Insurance |
| Under 6 | 0 (0.0%) | 0 (0.0%) |
| 6 to 18 Years | 0 (0.0%) | 0 (0.0%) |
| 19 to 25 Years | 0 (0.0%) | 0 (0.0%) |
| 25 to 34 Years | 0 (0.0%) | 0 (0.0%) |
| 35 to 44 Years | 0 (0.0%) | 0 (0.0%) |
| 45 to 54 Years | 0 (0.0%) | 0 (0.0%) |
| 55 to 64 Years | 0 (0.0%) | 11 (100.0%) |
| 65 to 74 Years | 18 (100.0%) | 6 (33.3%) |
| 75 Years and over | 9 (100.0%) | 9 (100.0%) |
| Total | 27 (65.8%) | 26 (63.4%) |
Disability Status by Sex by Age in Cedar
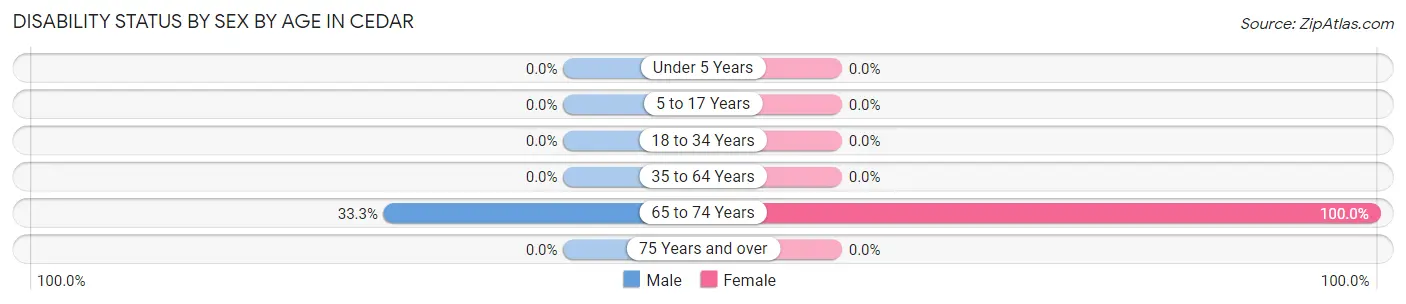
| Age Bracket | Male | Female |
| Under 5 Years | 0 (0.0%) | 0 (0.0%) |
| 5 to 17 Years | 0 (0.0%) | 0 (0.0%) |
| 18 to 34 Years | 0 (0.0%) | 0 (0.0%) |
| 35 to 64 Years | 0 (0.0%) | 0 (0.0%) |
| 65 to 74 Years | 3 (33.3%) | 9 (100.0%) |
| 75 Years and over | 0 (0.0%) | 0 (0.0%) |
Disability Class by Sex by Age in Cedar
Disability Class: Hearing Difficulty
| Age Bracket | Male | Female |
| Under 5 Years | 0 (0.0%) | 0 (0.0%) |
| 5 to 17 Years | 0 (0.0%) | 0 (0.0%) |
| 18 to 34 Years | 0 (0.0%) | 0 (0.0%) |
| 35 to 64 Years | 0 (0.0%) | 0 (0.0%) |
| 65 to 74 Years | 0 (0.0%) | 0 (0.0%) |
| 75 Years and over | 0 (0.0%) | 0 (0.0%) |
Disability Class: Vision Difficulty
| Age Bracket | Male | Female |
| Under 5 Years | 0 (0.0%) | 0 (0.0%) |
| 5 to 17 Years | 0 (0.0%) | 0 (0.0%) |
| 18 to 34 Years | 0 (0.0%) | 0 (0.0%) |
| 35 to 64 Years | 0 (0.0%) | 0 (0.0%) |
| 65 to 74 Years | 0 (0.0%) | 0 (0.0%) |
| 75 Years and over | 0 (0.0%) | 0 (0.0%) |
Disability Class: Cognitive Difficulty
| Age Bracket | Male | Female |
| 5 to 17 Years | 0 (0.0%) | 0 (0.0%) |
| 18 to 34 Years | 0 (0.0%) | 0 (0.0%) |
| 35 to 64 Years | 0 (0.0%) | 0 (0.0%) |
| 65 to 74 Years | 0 (0.0%) | 0 (0.0%) |
| 75 Years and over | 0 (0.0%) | 0 (0.0%) |
Disability Class: Ambulatory Difficulty
| Age Bracket | Male | Female |
| 5 to 17 Years | 0 (0.0%) | 0 (0.0%) |
| 18 to 34 Years | 0 (0.0%) | 0 (0.0%) |
| 35 to 64 Years | 0 (0.0%) | 0 (0.0%) |
| 65 to 74 Years | 3 (33.3%) | 9 (100.0%) |
| 75 Years and over | 0 (0.0%) | 0 (0.0%) |
Disability Class: Self-Care Difficulty
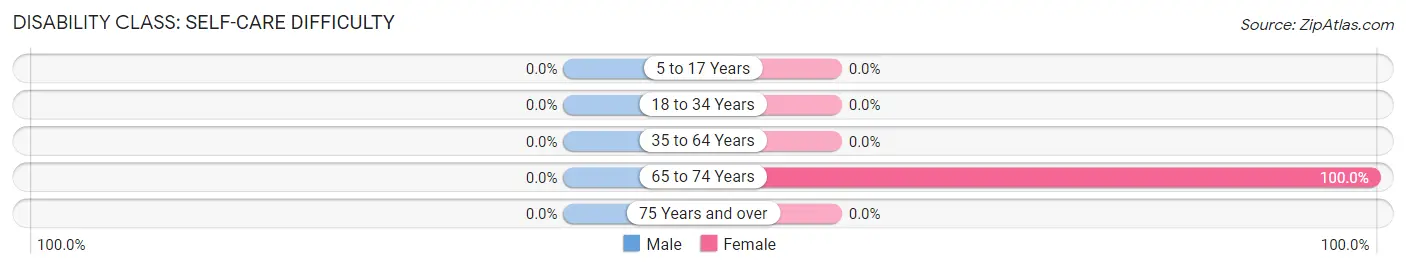
| Age Bracket | Male | Female |
| 5 to 17 Years | 0 (0.0%) | 0 (0.0%) |
| 18 to 34 Years | 0 (0.0%) | 0 (0.0%) |
| 35 to 64 Years | 0 (0.0%) | 0 (0.0%) |
| 65 to 74 Years | 0 (0.0%) | 9 (100.0%) |
| 75 Years and over | 0 (0.0%) | 0 (0.0%) |
Technology Access in Cedar
Computing Device Access in Cedar
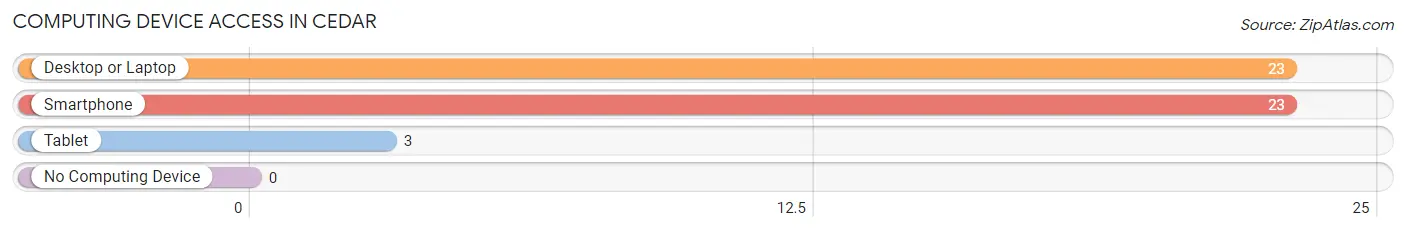
| Device Type | # Households | % Households |
| Desktop or Laptop | 23 | 71.9% |
| Smartphone | 23 | 71.9% |
| Tablet | 3 | 9.4% |
| No Computing Device | 0 | 0.0% |
| Total | 32 | 100.0% |
Internet Access in Cedar
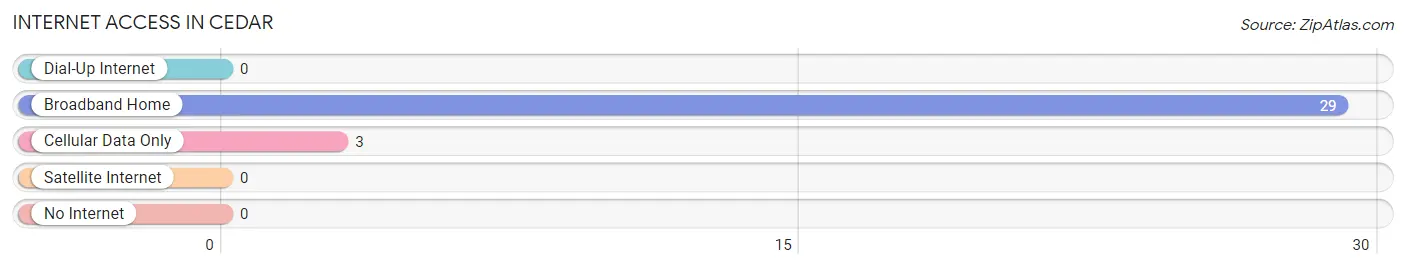
| Internet Type | # Households | % Households |
| Dial-Up Internet | 0 | 0.0% |
| Broadband Home | 29 | 90.6% |
| Cellular Data Only | 3 | 9.4% |
| Satellite Internet | 0 | 0.0% |
| No Internet | 0 | 0.0% |
| Total | 32 | 100.0% |
Cedar Summary
Cedar is a small unincorporated community located in the Upper Peninsula of Michigan, in the county of Menominee. It is situated on the Menominee River, near the Wisconsin border. The population of Cedar was estimated to be around 1,000 in 2020.
Geography
Cedar is located in the Upper Peninsula of Michigan, in the county of Menominee. It is situated on the Menominee River, near the Wisconsin border. The community is surrounded by forests and lakes, and is located in a rural area. The nearest major city is Green Bay, Wisconsin, which is about 40 miles away.
The climate in Cedar is humid continental, with cold winters and warm summers. The average temperature in the summer is around 70 degrees Fahrenheit, and the average temperature in the winter is around 20 degrees Fahrenheit. The average annual precipitation is around 30 inches.
Economy
The economy of Cedar is largely based on tourism and forestry. The area is popular for hunting, fishing, and camping, and there are several resorts and campgrounds in the area. The area is also home to several logging companies, which provide jobs for many of the residents.
The area is also home to several small businesses, including restaurants, stores, and other services. The community also has a small airport, which provides transportation to and from the area.
Demographics
The population of Cedar was estimated to be around 1,000 in 2020. The racial makeup of the community is predominantly white, with a small percentage of African Americans, Native Americans, and other races. The median household income in Cedar is around $35,000, and the median age is around 40 years old.
The majority of the population is Christian, with a small percentage of other religions. The primary language spoken in Cedar is English, although some residents also speak French and German.
Conclusion
Cedar is a small unincorporated community located in the Upper Peninsula of Michigan, in the county of Menominee. It is situated on the Menominee River, near the Wisconsin border. The population of Cedar was estimated to be around 1,000 in 2020. The economy of Cedar is largely based on tourism and forestry, and the area is popular for hunting, fishing, and camping. The racial makeup of the community is predominantly white, with a small percentage of African Americans, Native Americans, and other races. The primary language spoken in Cedar is English, although some residents also speak French and German.
Common Questions
What is Per Capita Income in Cedar?
Per Capita income in Cedar is $35,763.
What is the Median Household income in Cedar?
Median Household Income in Cedar is $50,833.
What is Inequality or Gini Index in Cedar?
Inequality or Gini Index in Cedar is 0.14.
What is the Total Population of Cedar?
Total Population of Cedar is 41.
What is the Total Male Population of Cedar?
Total Male Population of Cedar is 9.
What is the Total Female Population of Cedar?
Total Female Population of Cedar is 32.
What is the Ratio of Males per 100 Females in Cedar?
There are 28.12 Males per 100 Females in Cedar.
What is the Ratio of Females per 100 Males in Cedar?
There are 355.56 Females per 100 Males in Cedar.
What is the Median Population Age in Cedar?
Median Population Age in Cedar is 70.2 Years.
What is the Average Family Size in Cedar
Average Family Size in Cedar is 2.0 People.
What is the Average Household Size in Cedar
Average Household Size in Cedar is 1.3 People.
How Large is the Labor Force in Cedar?
There are 20 People in the Labor Forcein in Cedar.
What is the Percentage of People in the Labor Force in Cedar?
48.8% of People are in the Labor Force in Cedar.