Brooks, OR Map & Demographics
Brooks Map
Brooks Overview
$25,844
PER CAPITA INCOME
$86,042
AVG FAMILY INCOME
$86,667
AVG HOUSEHOLD INCOME
0.21
INEQUALITY / GINI INDEX
311
TOTAL POPULATION
175
MALE POPULATION
136
FEMALE POPULATION
128.68
MALES / 100 FEMALES
77.71
FEMALES / 100 MALES
45.4
MEDIAN AGE
6.0
AVG FAMILY SIZE
4.4
AVG HOUSEHOLD SIZE
184
LABOR FORCE [ PEOPLE ]
80.0%
PERCENT IN LABOR FORCE
Income in Brooks
Income Overview in Brooks
Per Capita Income in Brooks is $25,844, while median incomes of families and households are $86,042 and $86,667 respectively.
| Characteristic | Number | Measure |
| Per Capita Income | 311 | $25,844 |
| Median Family Income | 43 | $86,042 |
| Mean Family Income | 43 | $92,491 |
| Median Household Income | 66 | $86,667 |
| Mean Household Income | 66 | $81,114 |
| Income Deficit | 43 | $0 |
| Wage / Income Gap (%) | 311 | 0.00% |
| Wage / Income Gap ($) | 311 | 100.00¢ per $1 |
| Gini / Inequality Index | 311 | 0.21 |
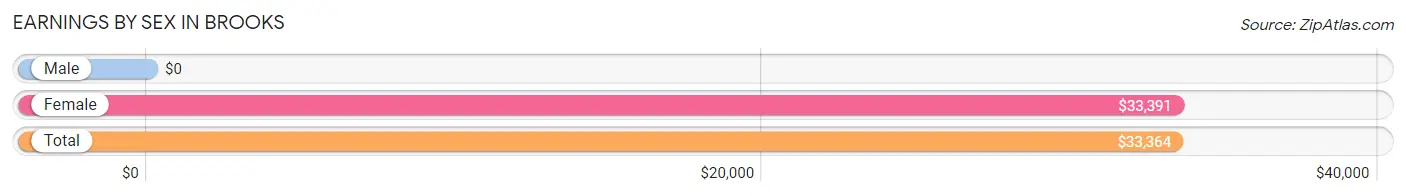
Earnings by Sex in Brooks
| Sex | Number | Average Earnings |
| Male | 76 (38.6%) | $0 |
| Female | 121 (61.4%) | $33,391 |
| Total | 197 (100.0%) | $33,364 |
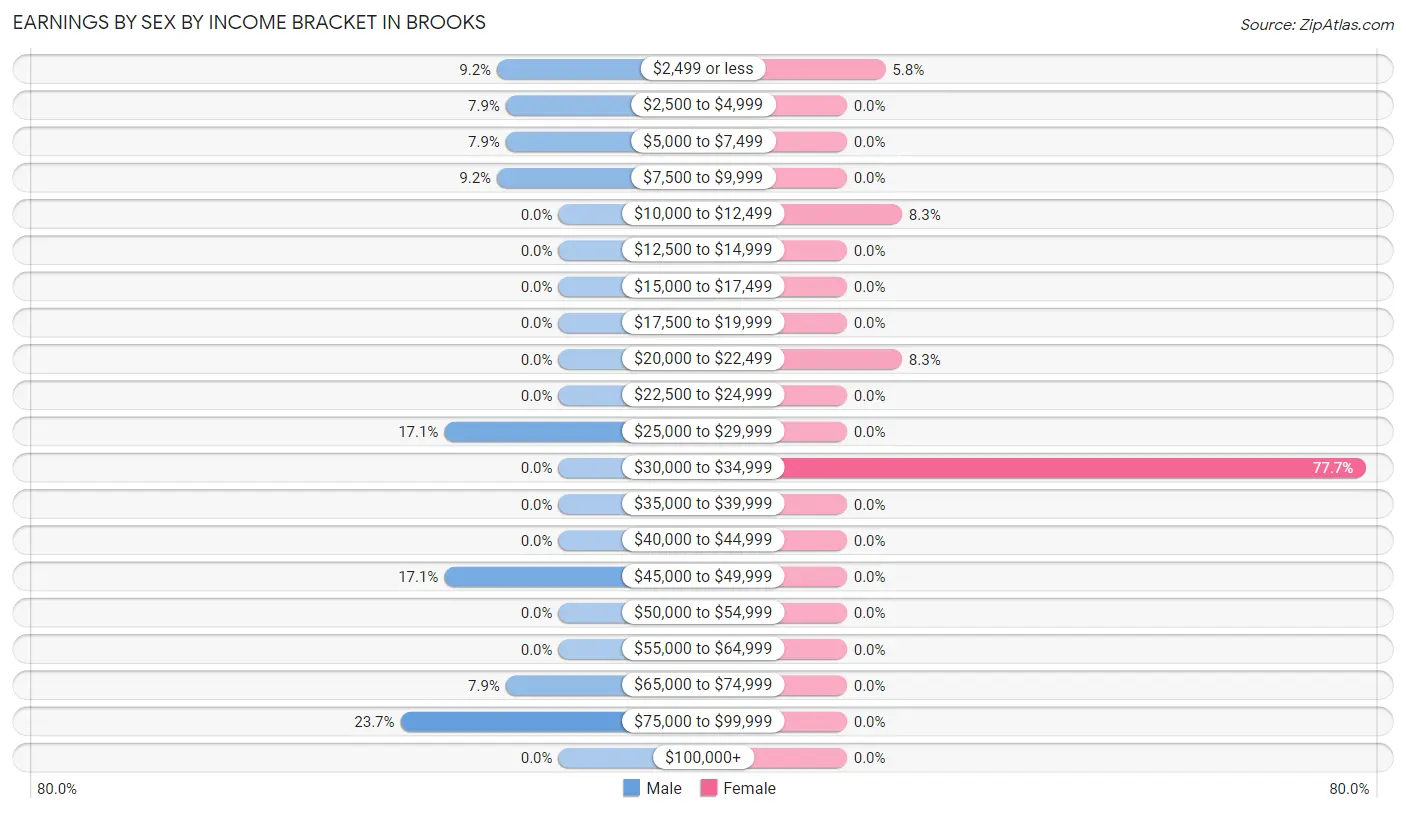
Earnings by Sex by Income Bracket in Brooks
The most common earnings brackets in Brooks are $75,000 to $99,999 for men (18 | 23.7%) and $30,000 to $34,999 for women (94 | 77.7%).
| Income | Male | Female |
| $2,499 or less | 7 (9.2%) | 7 (5.8%) |
| $2,500 to $4,999 | 6 (7.9%) | 0 (0.0%) |
| $5,000 to $7,499 | 6 (7.9%) | 0 (0.0%) |
| $7,500 to $9,999 | 7 (9.2%) | 0 (0.0%) |
| $10,000 to $12,499 | 0 (0.0%) | 10 (8.3%) |
| $12,500 to $14,999 | 0 (0.0%) | 0 (0.0%) |
| $15,000 to $17,499 | 0 (0.0%) | 0 (0.0%) |
| $17,500 to $19,999 | 0 (0.0%) | 0 (0.0%) |
| $20,000 to $22,499 | 0 (0.0%) | 10 (8.3%) |
| $22,500 to $24,999 | 0 (0.0%) | 0 (0.0%) |
| $25,000 to $29,999 | 13 (17.1%) | 0 (0.0%) |
| $30,000 to $34,999 | 0 (0.0%) | 94 (77.7%) |
| $35,000 to $39,999 | 0 (0.0%) | 0 (0.0%) |
| $40,000 to $44,999 | 0 (0.0%) | 0 (0.0%) |
| $45,000 to $49,999 | 13 (17.1%) | 0 (0.0%) |
| $50,000 to $54,999 | 0 (0.0%) | 0 (0.0%) |
| $55,000 to $64,999 | 0 (0.0%) | 0 (0.0%) |
| $65,000 to $74,999 | 6 (7.9%) | 0 (0.0%) |
| $75,000 to $99,999 | 18 (23.7%) | 0 (0.0%) |
| $100,000+ | 0 (0.0%) | 0 (0.0%) |
| Total | 76 (100.0%) | 121 (100.0%) |
Earnings by Sex by Educational Attainment in Brooks
| Educational Attainment | Male Income | Female Income |
| Less than High School | - | - |
| High School Diploma | - | - |
| College or Associate's Degree | - | - |
| Bachelor's Degree | - | - |
| Graduate Degree | - | - |
| Total | - | - |
Family Income in Brooks
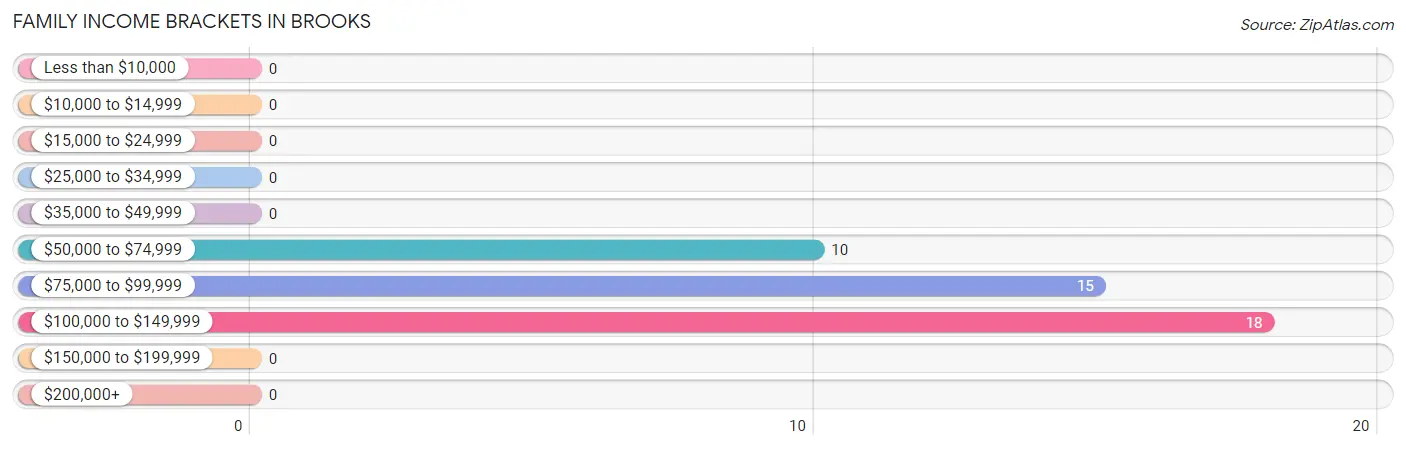
Family Income Brackets in Brooks
According to the Brooks family income data, there are 18 families falling into the $100,000 to $149,999 income range, which is the most common income bracket and makes up 41.9% of all families.
| Income Bracket | # Families | % Families |
| Less than $10,000 | 0 | 0.0% |
| $10,000 to $14,999 | 0 | 0.0% |
| $15,000 to $24,999 | 0 | 0.0% |
| $25,000 to $34,999 | 0 | 0.0% |
| $35,000 to $49,999 | 0 | 0.0% |
| $50,000 to $74,999 | 10 | 23.3% |
| $75,000 to $99,999 | 15 | 34.9% |
| $100,000 to $149,999 | 18 | 41.9% |
| $150,000 to $199,999 | 0 | 0.0% |
| $200,000+ | 0 | 0.0% |
Family Income by Famaliy Size in Brooks
| Income Bracket | # Families | Median Income |
| 2-Person Families | 19 (44.2%) | $0 |
| 3-Person Families | 0 (0.0%) | $0 |
| 4-Person Families | 18 (41.9%) | $0 |
| 5-Person Families | 6 (14.0%) | $0 |
| 6-Person Families | 0 (0.0%) | $0 |
| 7+ Person Families | 0 (0.0%) | $0 |
| Total | 43 (100.0%) | $86,042 |
Family Income by Number of Earners in Brooks
| Number of Earners | # Families | Median Income |
| No Earners | 9 (20.9%) | $0 |
| 1 Earner | 10 (23.3%) | $0 |
| 2 Earners | 18 (41.9%) | $0 |
| 3+ Earners | 6 (14.0%) | $0 |
| Total | 43 (100.0%) | $86,042 |
Household Income in Brooks
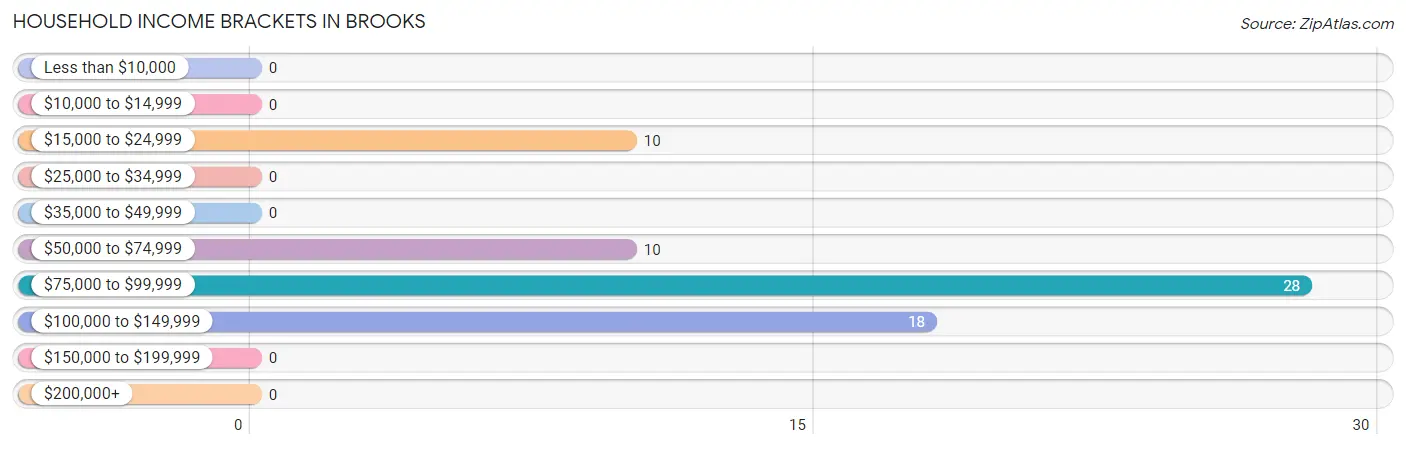
Household Income Brackets in Brooks
With 28 households falling in the category, the $75,000 to $99,999 income range is the most frequent in Brooks, accounting for 42.4% of all households.
| Income Bracket | # Households | % Households |
| Less than $10,000 | 0 | 0.0% |
| $10,000 to $14,999 | 0 | 0.0% |
| $15,000 to $24,999 | 10 | 15.2% |
| $25,000 to $34,999 | 0 | 0.0% |
| $35,000 to $49,999 | 0 | 0.0% |
| $50,000 to $74,999 | 10 | 15.2% |
| $75,000 to $99,999 | 28 | 42.4% |
| $100,000 to $149,999 | 18 | 27.3% |
| $150,000 to $199,999 | 0 | 0.0% |
| $200,000+ | 0 | 0.0% |
Household Income by Householder Age in Brooks
The median household income in Brooks is $86,667, with the highest median household income of $88,942 found in the 45 to 64 years age bracket for the primary householder. A total of 47 households (71.2%) fall into this category.
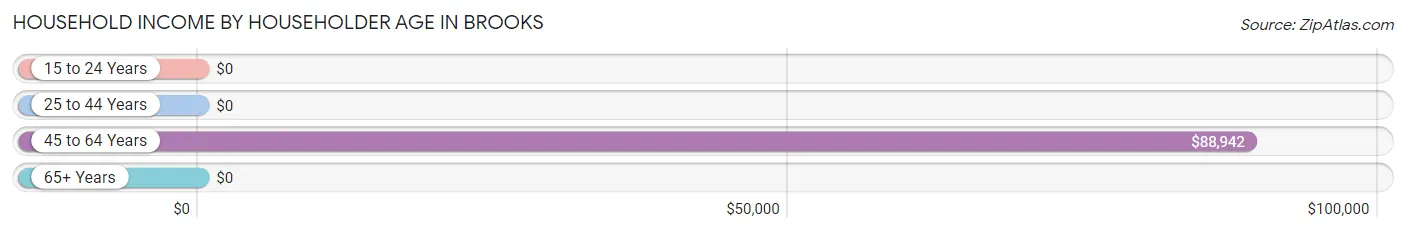
| Income Bracket | # Households | Median Income |
| 15 to 24 Years | 0 (0.0%) | $0 |
| 25 to 44 Years | 0 (0.0%) | $0 |
| 45 to 64 Years | 47 (71.2%) | $88,942 |
| 65+ Years | 19 (28.8%) | $0 |
| Total | 66 (100.0%) | $86,667 |
Poverty in Brooks
Income Below Poverty by Sex and Age in Brooks
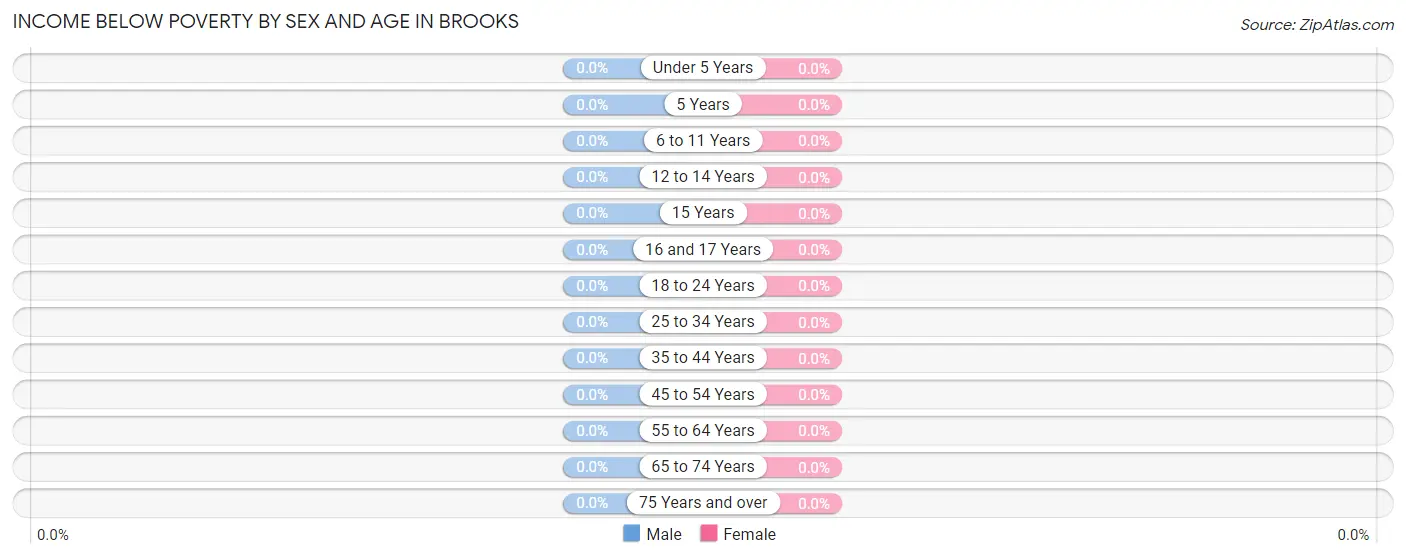
| Age Bracket | Male | Female |
| Under 5 Years | 0 (0.0%) | 0 (0.0%) |
| 5 Years | 0 (0.0%) | 0 (0.0%) |
| 6 to 11 Years | 0 (0.0%) | 0 (0.0%) |
| 12 to 14 Years | 0 (0.0%) | 0 (0.0%) |
| 15 Years | 0 (0.0%) | 0 (0.0%) |
| 16 and 17 Years | 0 (0.0%) | 0 (0.0%) |
| 18 to 24 Years | 0 (0.0%) | 0 (0.0%) |
| 25 to 34 Years | 0 (0.0%) | 0 (0.0%) |
| 35 to 44 Years | 0 (0.0%) | 0 (0.0%) |
| 45 to 54 Years | 0 (0.0%) | 0 (0.0%) |
| 55 to 64 Years | 0 (0.0%) | 0 (0.0%) |
| 65 to 74 Years | 0 (0.0%) | 0 (0.0%) |
| 75 Years and over | 0 (0.0%) | 0 (0.0%) |
| Total | 0 (0.0%) | 0 (0.0%) |
Income Above Poverty by Sex and Age in Brooks
According to the poverty statistics in Brooks, males aged 12 to 14 years and females aged 45 to 54 years are the age groups that are most secure financially, with 100.0% of males and 100.0% of females in these age groups living above the poverty line.
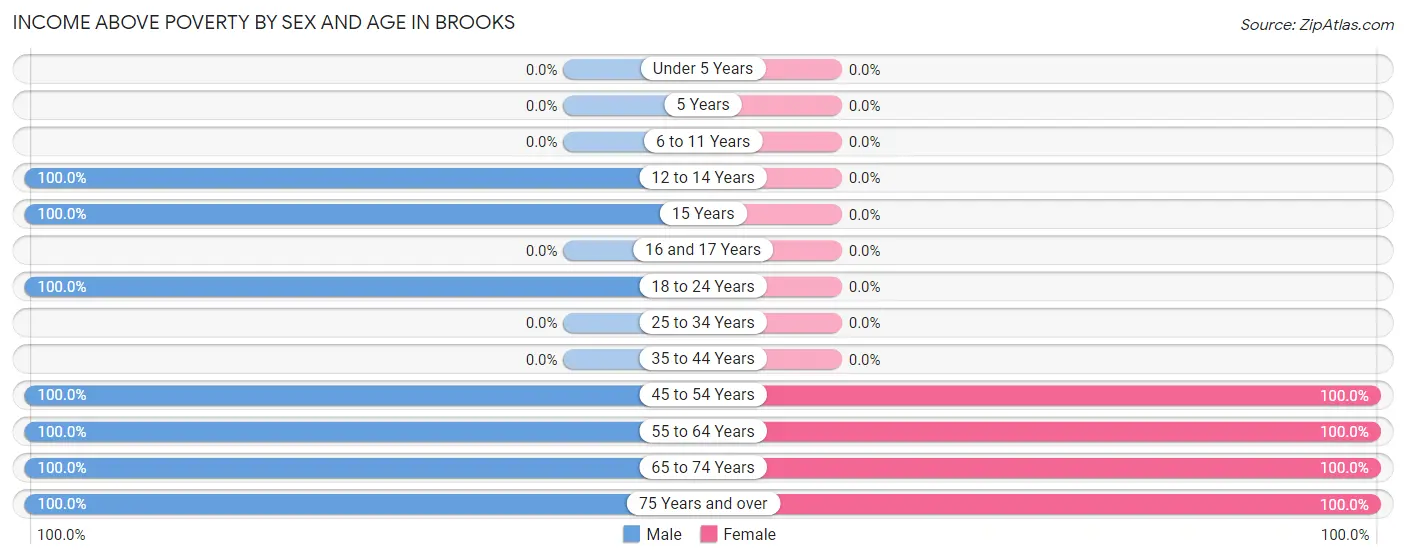
| Age Bracket | Male | Female |
| Under 5 Years | 0 (0.0%) | 0 (0.0%) |
| 5 Years | 0 (0.0%) | 0 (0.0%) |
| 6 to 11 Years | 0 (0.0%) | 0 (0.0%) |
| 12 to 14 Years | 74 (100.0%) | 0 (0.0%) |
| 15 Years | 7 (100.0%) | 0 (0.0%) |
| 16 and 17 Years | 0 (0.0%) | 0 (0.0%) |
| 18 to 24 Years | 14 (100.0%) | 0 (0.0%) |
| 25 to 34 Years | 0 (0.0%) | 0 (0.0%) |
| 35 to 44 Years | 0 (0.0%) | 0 (0.0%) |
| 45 to 54 Years | 24 (100.0%) | 94 (100.0%) |
| 55 to 64 Years | 26 (100.0%) | 16 (100.0%) |
| 65 to 74 Years | 9 (100.0%) | 10 (100.0%) |
| 75 Years and over | 9 (100.0%) | 9 (100.0%) |
| Total | 163 (100.0%) | 129 (100.0%) |
Income Below Poverty Among Married-Couple Families in Brooks
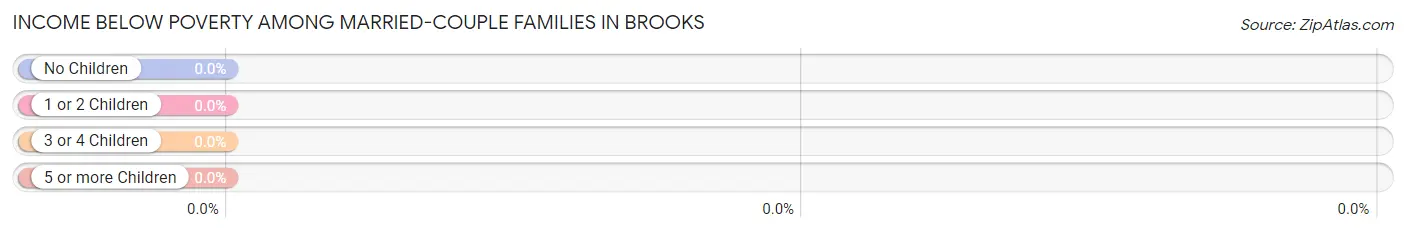
| Children | Above Poverty | Below Poverty |
| No Children | 19 (100.0%) | 0 (0.0%) |
| 1 or 2 Children | 24 (100.0%) | 0 (0.0%) |
| 3 or 4 Children | 0 (0.0%) | 0 (0.0%) |
| 5 or more Children | 0 (0.0%) | 0 (0.0%) |
| Total | 43 (100.0%) | 0 (0.0%) |
Income Below Poverty Among Single-Parent Households in Brooks
| Children | Single Father | Single Mother |
| No Children | 0 (0.0%) | 0 (0.0%) |
| 1 or 2 Children | 0 (0.0%) | 0 (0.0%) |
| 3 or 4 Children | 0 (0.0%) | 0 (0.0%) |
| 5 or more Children | 0 (0.0%) | 0 (0.0%) |
| Total | 0 (0.0%) | 0 (0.0%) |
Income Below Poverty Among Married-Couple vs Single-Parent Households in Brooks
| Children | Married-Couple Families | Single-Parent Households |
| No Children | 0 (0.0%) | 0 (0.0%) |
| 1 or 2 Children | 0 (0.0%) | 0 (0.0%) |
| 3 or 4 Children | 0 (0.0%) | 0 (0.0%) |
| 5 or more Children | 0 (0.0%) | 0 (0.0%) |
| Total | 0 (0.0%) | 0 (0.0%) |
Race in Brooks
The most populous races in Brooks are White / Caucasian (213 | 68.5%), Two or more Races (92 | 29.6%), and Hispanic or Latino (7 | 2.2%).
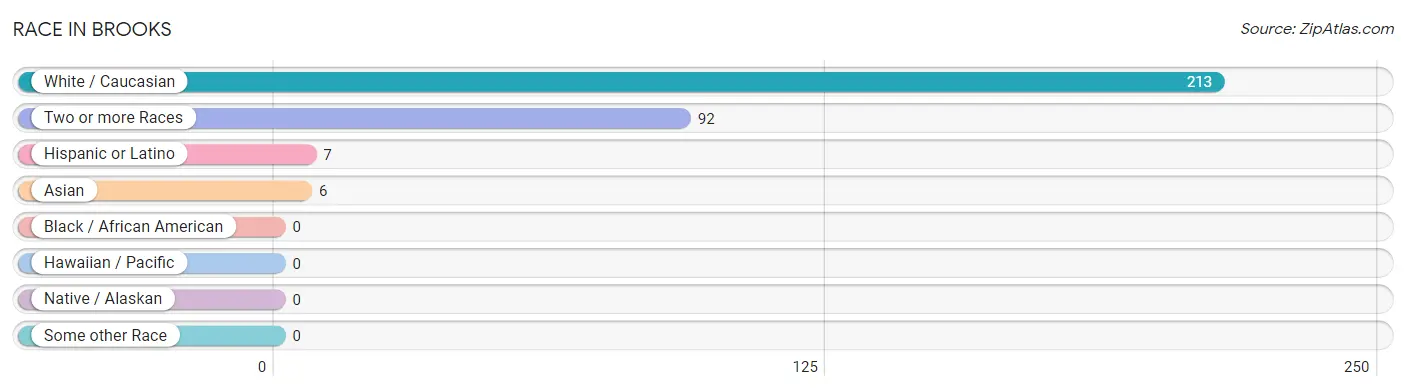
| Race | # Population | % Population |
| Asian | 6 | 1.9% |
| Black / African American | 0 | 0.0% |
| Hawaiian / Pacific | 0 | 0.0% |
| Hispanic or Latino | 7 | 2.2% |
| Native / Alaskan | 0 | 0.0% |
| White / Caucasian | 213 | 68.5% |
| Two or more Races | 92 | 29.6% |
| Some other Race | 0 | 0.0% |
| Total | 311 | 100.0% |
Ancestry in Brooks
The most populous ancestries reported in Brooks are Swedish (101 | 32.5%), Scandinavian (94 | 30.2%), Irish (92 | 29.6%), German (65 | 20.9%), and Dutch (37 | 11.9%), together accounting for 125.1% of all Brooks residents.
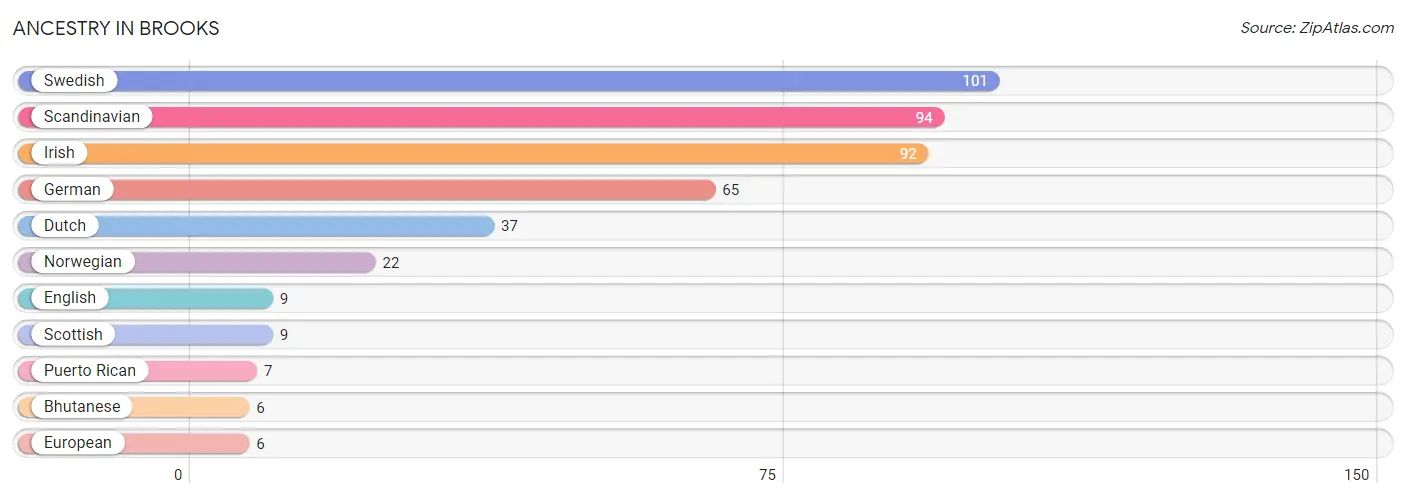
| Ancestry | # Population | % Population |
| Bhutanese | 6 | 1.9% |
| Dutch | 37 | 11.9% |
| English | 9 | 2.9% |
| European | 6 | 1.9% |
| German | 65 | 20.9% |
| Irish | 92 | 29.6% |
| Norwegian | 22 | 7.1% |
| Puerto Rican | 7 | 2.2% |
| Scandinavian | 94 | 30.2% |
| Scottish | 9 | 2.9% |
| Swedish | 101 | 32.5% | View All 11 Rows |
Immigrants in Brooks

| Immigration Origin | # Population | % Population | View All 0 Rows |
Sex and Age in Brooks
Sex and Age in Brooks
The most populous age groups in Brooks are 10 to 14 Years (74 | 42.3%) for men and 45 to 49 Years (94 | 69.1%) for women.
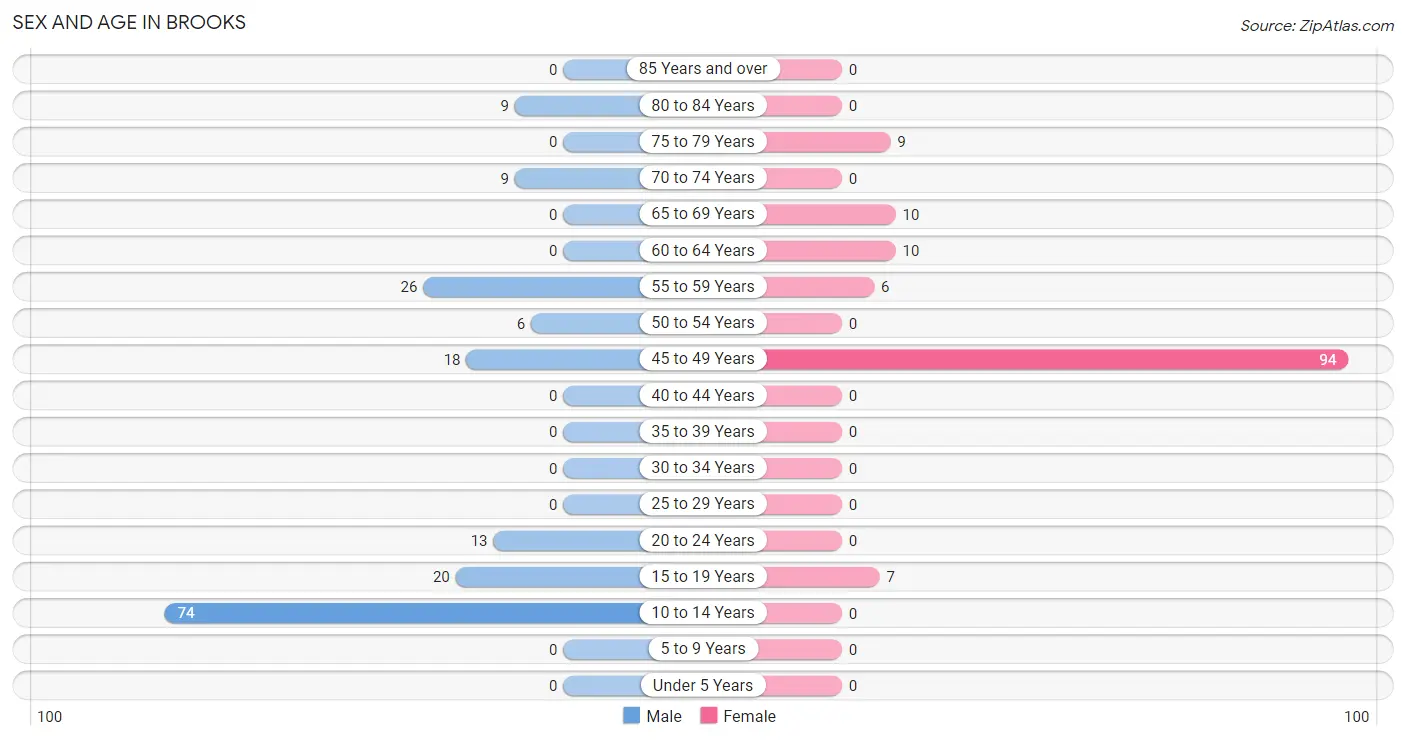
| Age Bracket | Male | Female |
| Under 5 Years | 0 (0.0%) | 0 (0.0%) |
| 5 to 9 Years | 0 (0.0%) | 0 (0.0%) |
| 10 to 14 Years | 74 (42.3%) | 0 (0.0%) |
| 15 to 19 Years | 20 (11.4%) | 7 (5.1%) |
| 20 to 24 Years | 13 (7.4%) | 0 (0.0%) |
| 25 to 29 Years | 0 (0.0%) | 0 (0.0%) |
| 30 to 34 Years | 0 (0.0%) | 0 (0.0%) |
| 35 to 39 Years | 0 (0.0%) | 0 (0.0%) |
| 40 to 44 Years | 0 (0.0%) | 0 (0.0%) |
| 45 to 49 Years | 18 (10.3%) | 94 (69.1%) |
| 50 to 54 Years | 6 (3.4%) | 0 (0.0%) |
| 55 to 59 Years | 26 (14.9%) | 6 (4.4%) |
| 60 to 64 Years | 0 (0.0%) | 10 (7.3%) |
| 65 to 69 Years | 0 (0.0%) | 10 (7.3%) |
| 70 to 74 Years | 9 (5.1%) | 0 (0.0%) |
| 75 to 79 Years | 0 (0.0%) | 9 (6.6%) |
| 80 to 84 Years | 9 (5.1%) | 0 (0.0%) |
| 85 Years and over | 0 (0.0%) | 0 (0.0%) |
| Total | 175 (100.0%) | 136 (100.0%) |
Families and Households in Brooks
Median Family Size in Brooks
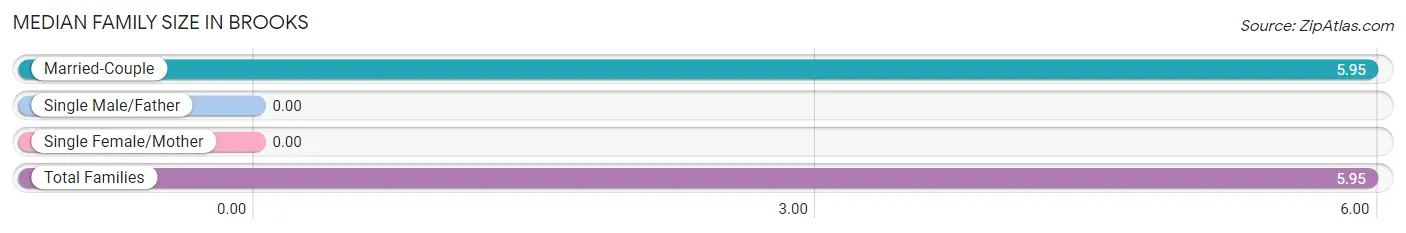
| Family Type | # Families | Family Size |
| Married-Couple | 43 (100.0%) | 5.95 |
| Single Male/Father | 0 (0.0%) | - |
| Single Female/Mother | 0 (0.0%) | - |
| Total Families | 43 (100.0%) | 5.95 |
Median Household Size in Brooks
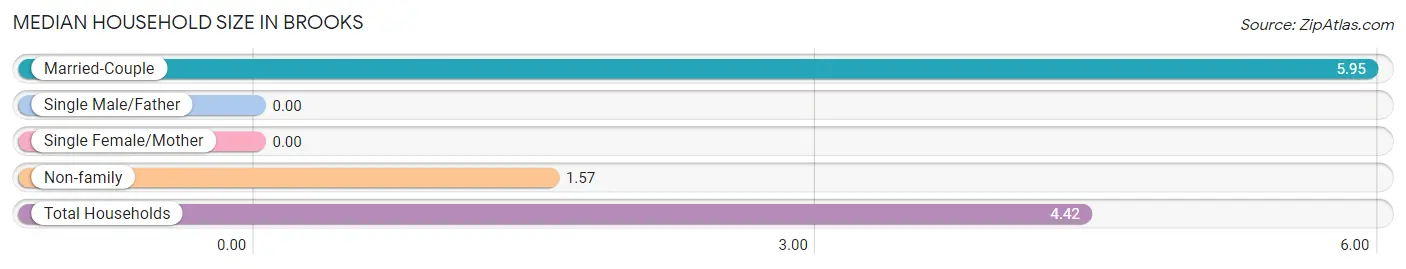
| Household Type | # Households | Household Size |
| Married-Couple | 43 (65.1%) | 5.95 |
| Single Male/Father | 0 (0.0%) | - |
| Single Female/Mother | 0 (0.0%) | - |
| Non-family | 23 (34.8%) | 1.57 |
| Total Households | 66 (100.0%) | 4.42 |
Household Size by Marriage Status in Brooks
Out of a total of 66 households in Brooks, 43 (65.1%) are family households, while 23 (34.8%) are nonfamily households. The most numerous type of family households are 2-person households, comprising 19, and the most common type of nonfamily households are 2-person households, comprising 13.
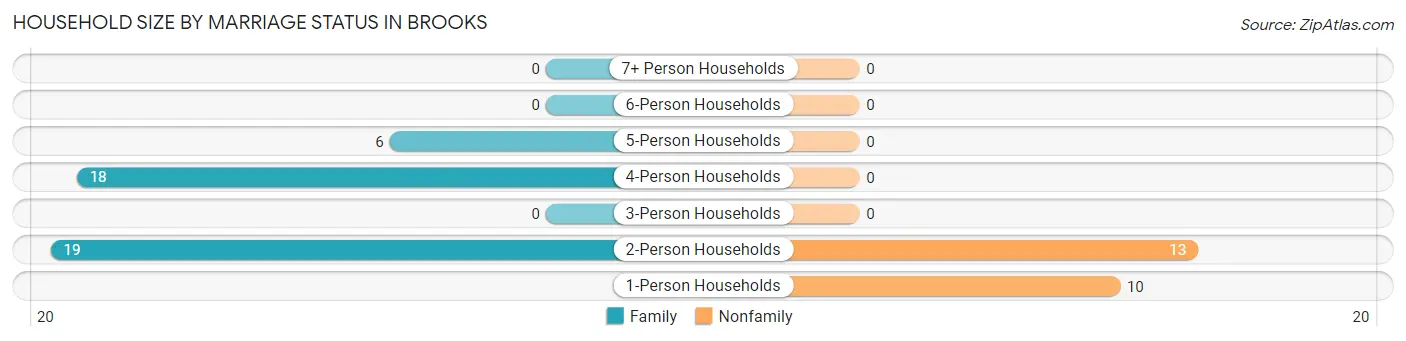
| Household Size | Family Households | Nonfamily Households |
| 1-Person Households | - | 10 (15.1%) |
| 2-Person Households | 19 (28.8%) | 13 (19.7%) |
| 3-Person Households | 0 (0.0%) | 0 (0.0%) |
| 4-Person Households | 18 (27.3%) | 0 (0.0%) |
| 5-Person Households | 6 (9.1%) | 0 (0.0%) |
| 6-Person Households | 0 (0.0%) | 0 (0.0%) |
| 7+ Person Households | 0 (0.0%) | 0 (0.0%) |
| Total | 43 (65.1%) | 23 (34.8%) |
Female Fertility in Brooks
Fertility by Age in Brooks
| Age Bracket | Women with Births | Births / 1,000 Women |
| 15 to 19 years | 0 (0.0%) | 0.0 |
| 20 to 34 years | 0 (0.0%) | 0.0 |
| 35 to 50 years | 0 (0.0%) | 0.0 |
| Total | 0 (0.0%) | 0.0 |
Fertility by Age by Marriage Status in Brooks
| Age Bracket | Married | Unmarried |
| 15 to 19 years | 0 (0.0%) | 0 (0.0%) |
| 20 to 34 years | 0 (0.0%) | 0 (0.0%) |
| 35 to 50 years | 0 (0.0%) | 0 (0.0%) |
| Total | 0 (0.0%) | 0 (0.0%) |
Fertility by Education in Brooks
| Educational Attainment | Women with Births | Births / 1,000 Women |
| Less than High School | 0 (0.0%) | 0.0 |
| High School Diploma | 0 (0.0%) | 0.0 |
| College or Associate's Degree | 0 (0.0%) | 0.0 |
| Bachelor's Degree | 0 (0.0%) | 0.0 |
| Graduate Degree | 0 (0.0%) | 0.0 |
| Total | 0 (0.0%) | 0.0 |
Fertility by Education by Marriage Status in Brooks
| Educational Attainment | Married | Unmarried |
| Less than High School | 0 (0.0%) | 0 (0.0%) |
| High School Diploma | 0 (0.0%) | 0 (0.0%) |
| College or Associate's Degree | 0 (0.0%) | 0 (0.0%) |
| Bachelor's Degree | 0 (0.0%) | 0 (0.0%) |
| Graduate Degree | 0 (0.0%) | 0 (0.0%) |
| Total | 0 (0.0%) | 0 (0.0%) |
Employment Characteristics in Brooks
Employment by Class of Employer in Brooks
Among the 184 employed individuals in Brooks, self-employed (incorporated) (94 | 51.1%), private company employees (54 | 29.3%), and local government employees (13 | 7.1%) make up the most common classes of employment.
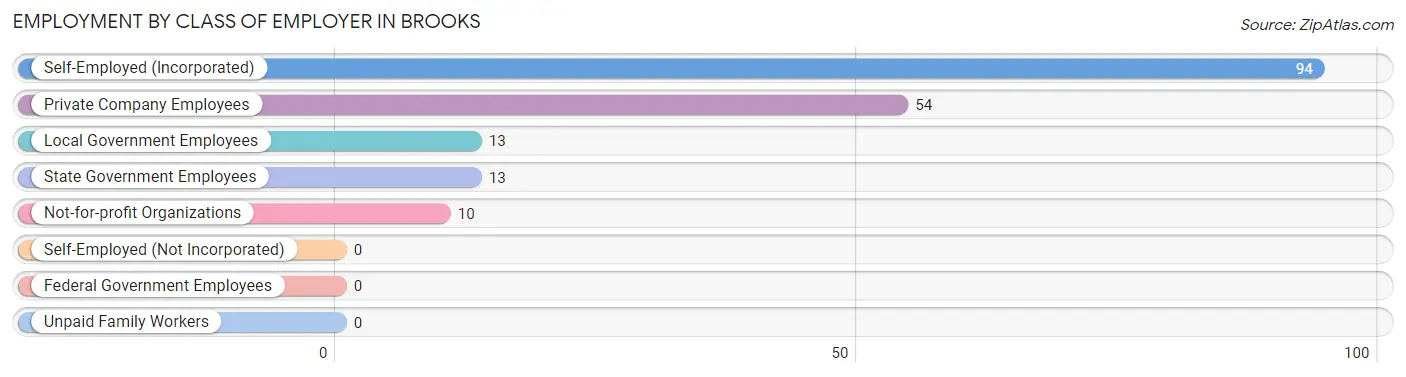
| Employer Class | # Employees | % Employees |
| Private Company Employees | 54 | 29.3% |
| Self-Employed (Incorporated) | 94 | 51.1% |
| Self-Employed (Not Incorporated) | 0 | 0.0% |
| Not-for-profit Organizations | 10 | 5.4% |
| Local Government Employees | 13 | 7.1% |
| State Government Employees | 13 | 7.1% |
| Federal Government Employees | 0 | 0.0% |
| Unpaid Family Workers | 0 | 0.0% |
| Total | 184 | 100.0% |
Employment Status by Age in Brooks
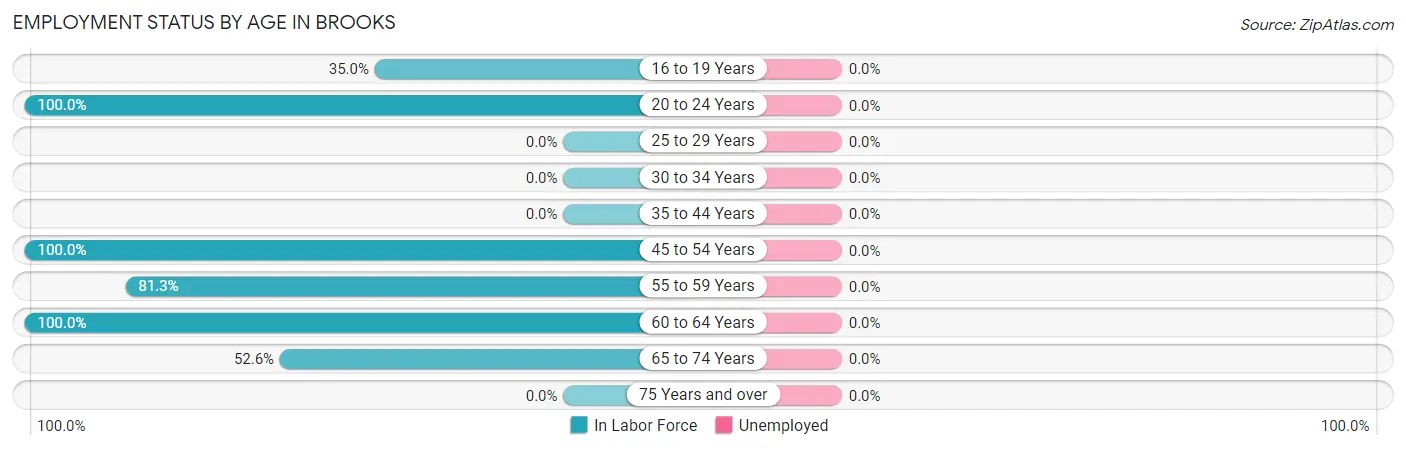
| Age Bracket | In Labor Force | Unemployed |
| 16 to 19 Years | 7 (35.0%) | 0 (0.0%) |
| 20 to 24 Years | 13 (100.0%) | 0 (0.0%) |
| 25 to 29 Years | 0 (0.0%) | 0 (0.0%) |
| 30 to 34 Years | 0 (0.0%) | 0 (0.0%) |
| 35 to 44 Years | 0 (0.0%) | 0 (0.0%) |
| 45 to 54 Years | 118 (100.0%) | 0 (0.0%) |
| 55 to 59 Years | 26 (81.3%) | 0 (0.0%) |
| 60 to 64 Years | 10 (100.0%) | 0 (0.0%) |
| 65 to 74 Years | 10 (52.6%) | 0 (0.0%) |
| 75 Years and over | 0 (0.0%) | 0 (0.0%) |
| Total | 184 (80.0%) | 0 (0.0%) |
Employment Status by Educational Attainment in Brooks
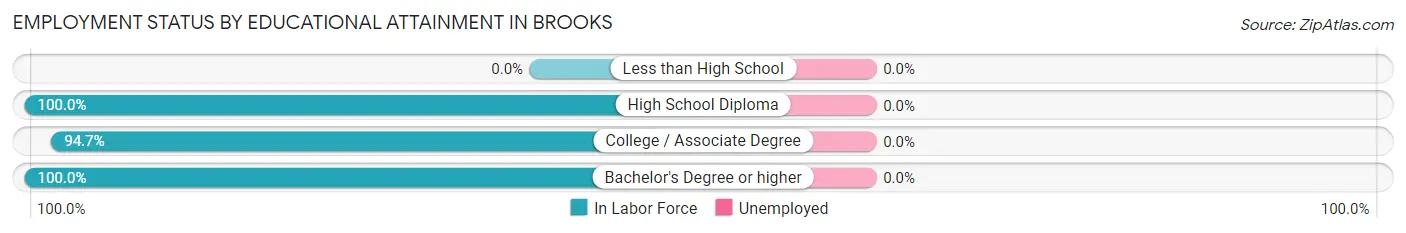
| Educational Attainment | In Labor Force | Unemployed |
| Less than High School | 0 (0.0%) | 0 (0.0%) |
| High School Diploma | 16 (100.0%) | 0 (0.0%) |
| College / Associate Degree | 107 (94.7%) | 0 (0.0%) |
| Bachelor's Degree or higher | 31 (100.0%) | 0 (0.0%) |
| Total | 154 (96.3%) | 0 (0.0%) |
Employment Occupations by Sex in Brooks
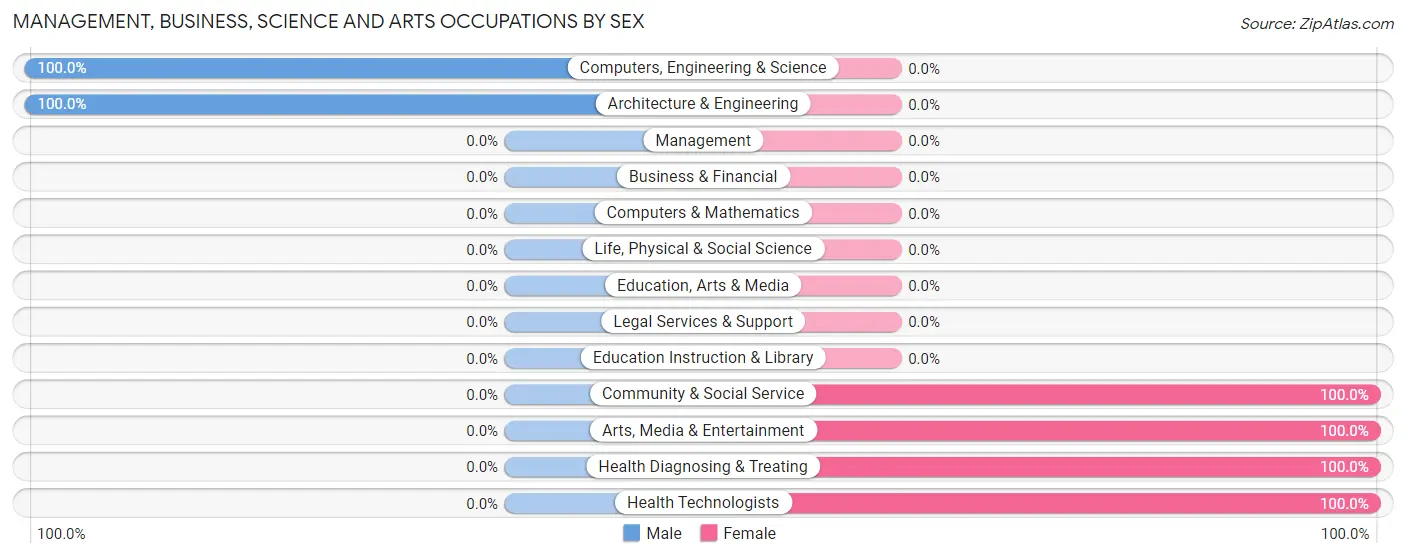
Management, Business, Science and Arts Occupations
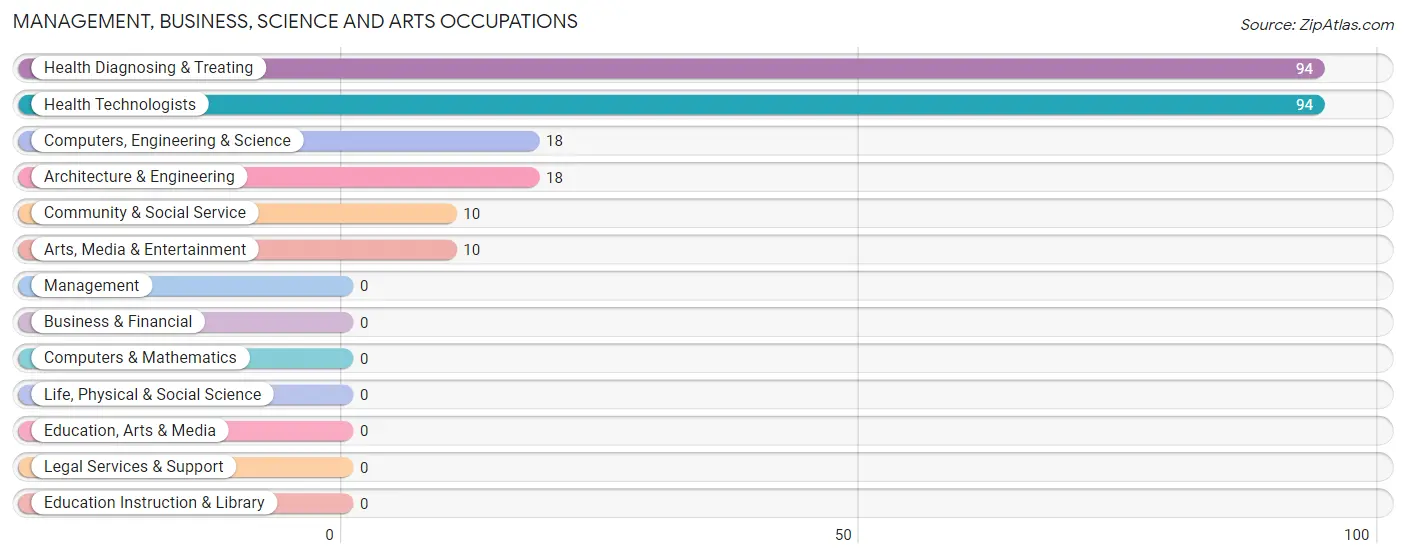
The most common Management, Business, Science and Arts occupations in Brooks are Health Diagnosing & Treating (94 | 51.1%), Health Technologists (94 | 51.1%), Computers, Engineering & Science (18 | 9.8%), Architecture & Engineering (18 | 9.8%), and Community & Social Service (10 | 5.4%).
Management, Business, Science and Arts Occupations by Sex
Within the Management, Business, Science and Arts occupations in Brooks, the most male-oriented occupations are Computers, Engineering & Science (100.0%), and Architecture & Engineering (100.0%), while the most female-oriented occupations are Community & Social Service (100.0%), Arts, Media & Entertainment (100.0%), and Health Diagnosing & Treating (100.0%).
| Occupation | Male | Female |
| Management | 0 (0.0%) | 0 (0.0%) |
| Business & Financial | 0 (0.0%) | 0 (0.0%) |
| Computers, Engineering & Science | 18 (100.0%) | 0 (0.0%) |
| Computers & Mathematics | 0 (0.0%) | 0 (0.0%) |
| Architecture & Engineering | 18 (100.0%) | 0 (0.0%) |
| Life, Physical & Social Science | 0 (0.0%) | 0 (0.0%) |
| Community & Social Service | 0 (0.0%) | 10 (100.0%) |
| Education, Arts & Media | 0 (0.0%) | 0 (0.0%) |
| Legal Services & Support | 0 (0.0%) | 0 (0.0%) |
| Education Instruction & Library | 0 (0.0%) | 0 (0.0%) |
| Arts, Media & Entertainment | 0 (0.0%) | 10 (100.0%) |
| Health Diagnosing & Treating | 0 (0.0%) | 94 (100.0%) |
| Health Technologists | 0 (0.0%) | 94 (100.0%) |
| Total (Category) | 18 (14.7%) | 104 (85.3%) |
| Total (Overall) | 70 (38.0%) | 114 (62.0%) |
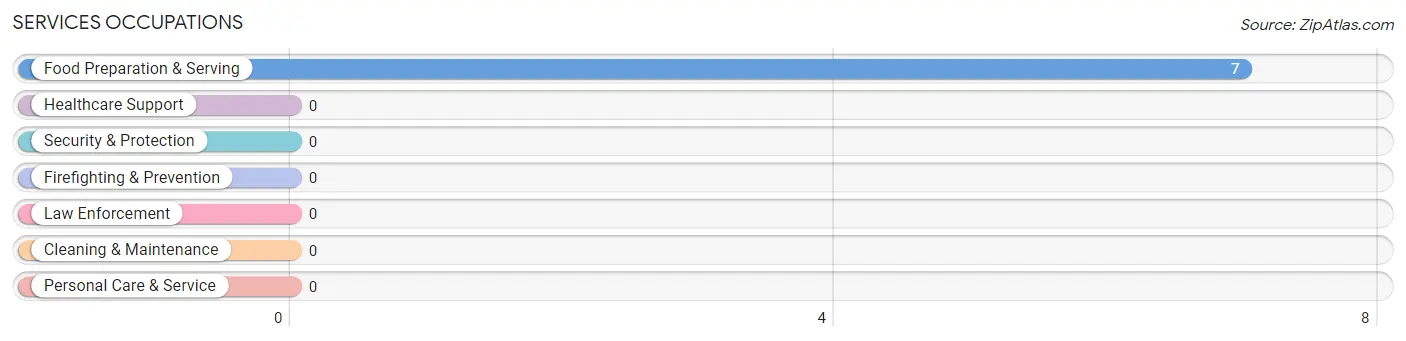
Services Occupations
The most common Services occupations in Brooks are , and Food Preparation & Serving (7 | 3.8%).
Services Occupations by Sex
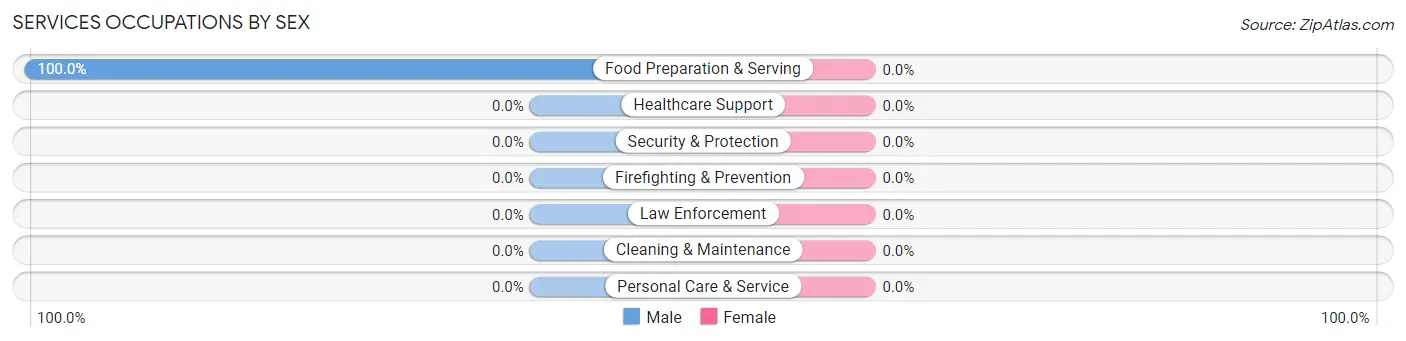
| Occupation | Male | Female |
| Healthcare Support | 0 (0.0%) | 0 (0.0%) |
| Security & Protection | 0 (0.0%) | 0 (0.0%) |
| Firefighting & Prevention | 0 (0.0%) | 0 (0.0%) |
| Law Enforcement | 0 (0.0%) | 0 (0.0%) |
| Food Preparation & Serving | 7 (100.0%) | 0 (0.0%) |
| Cleaning & Maintenance | 0 (0.0%) | 0 (0.0%) |
| Personal Care & Service | 0 (0.0%) | 0 (0.0%) |
| Total (Category) | 7 (100.0%) | 0 (0.0%) |
| Total (Overall) | 70 (38.0%) | 114 (62.0%) |
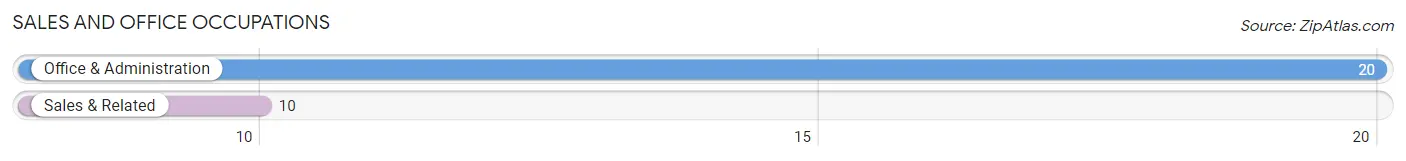
Sales and Office Occupations
The most common Sales and Office occupations in Brooks are Office & Administration (20 | 10.9%), and Sales & Related (10 | 5.4%).
Sales and Office Occupations by Sex
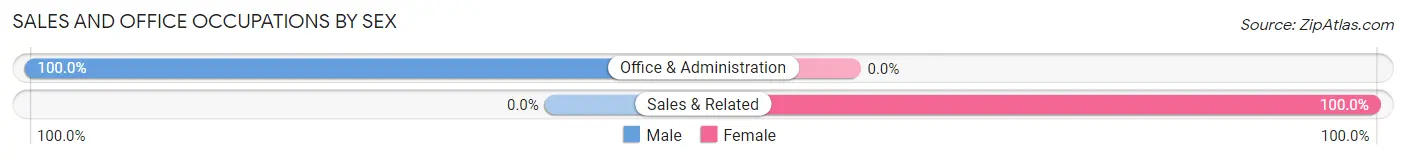
| Occupation | Male | Female |
| Sales & Related | 0 (0.0%) | 10 (100.0%) |
| Office & Administration | 20 (100.0%) | 0 (0.0%) |
| Total (Category) | 20 (66.7%) | 10 (33.3%) |
| Total (Overall) | 70 (38.0%) | 114 (62.0%) |
Natural Resources, Construction and Maintenance Occupations
The most common Natural Resources, Construction and Maintenance occupations in Brooks are , and Construction & Extraction (6 | 3.3%).
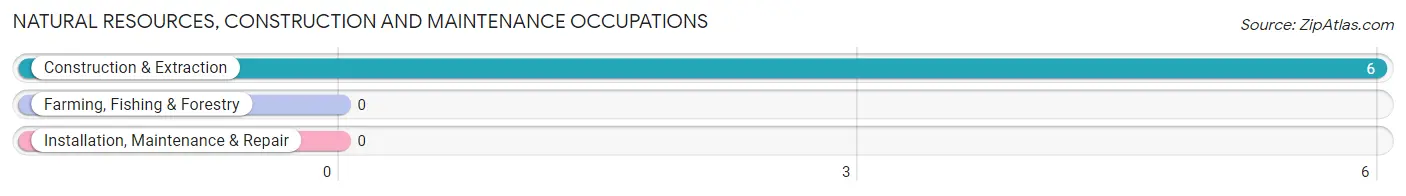
Natural Resources, Construction and Maintenance Occupations by Sex
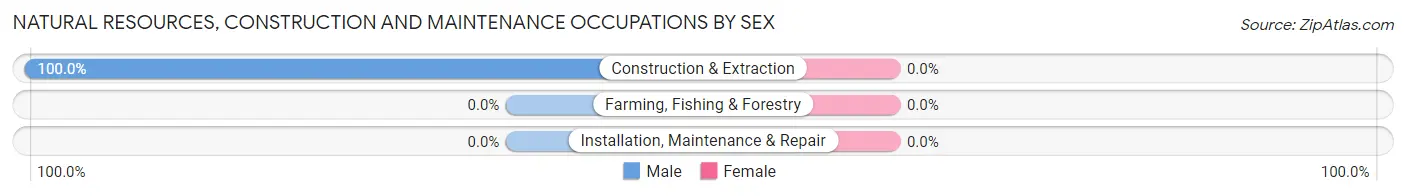
| Occupation | Male | Female |
| Farming, Fishing & Forestry | 0 (0.0%) | 0 (0.0%) |
| Construction & Extraction | 6 (100.0%) | 0 (0.0%) |
| Installation, Maintenance & Repair | 0 (0.0%) | 0 (0.0%) |
| Total (Category) | 6 (100.0%) | 0 (0.0%) |
| Total (Overall) | 70 (38.0%) | 114 (62.0%) |
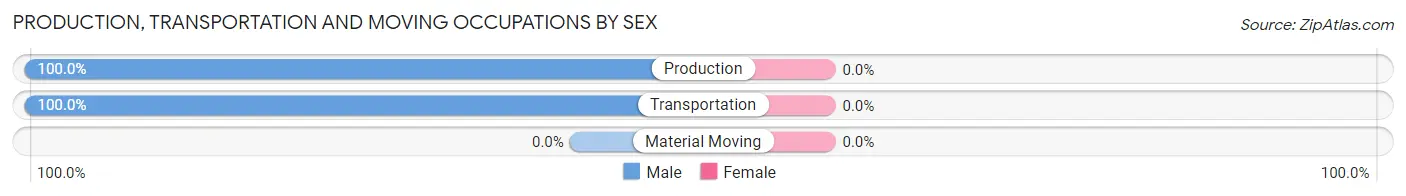
Production, Transportation and Moving Occupations
The most common Production, Transportation and Moving occupations in Brooks are Transportation (13 | 7.1%), and Production (6 | 3.3%).
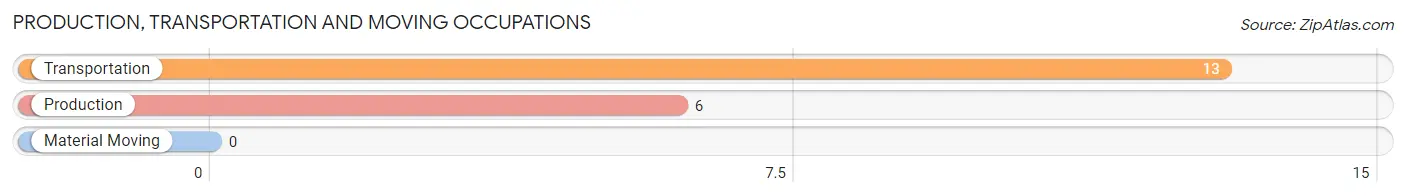
Production, Transportation and Moving Occupations by Sex
| Occupation | Male | Female |
| Production | 6 (100.0%) | 0 (0.0%) |
| Transportation | 13 (100.0%) | 0 (0.0%) |
| Material Moving | 0 (0.0%) | 0 (0.0%) |
| Total (Category) | 19 (100.0%) | 0 (0.0%) |
| Total (Overall) | 70 (38.0%) | 114 (62.0%) |
Employment Industries by Sex in Brooks
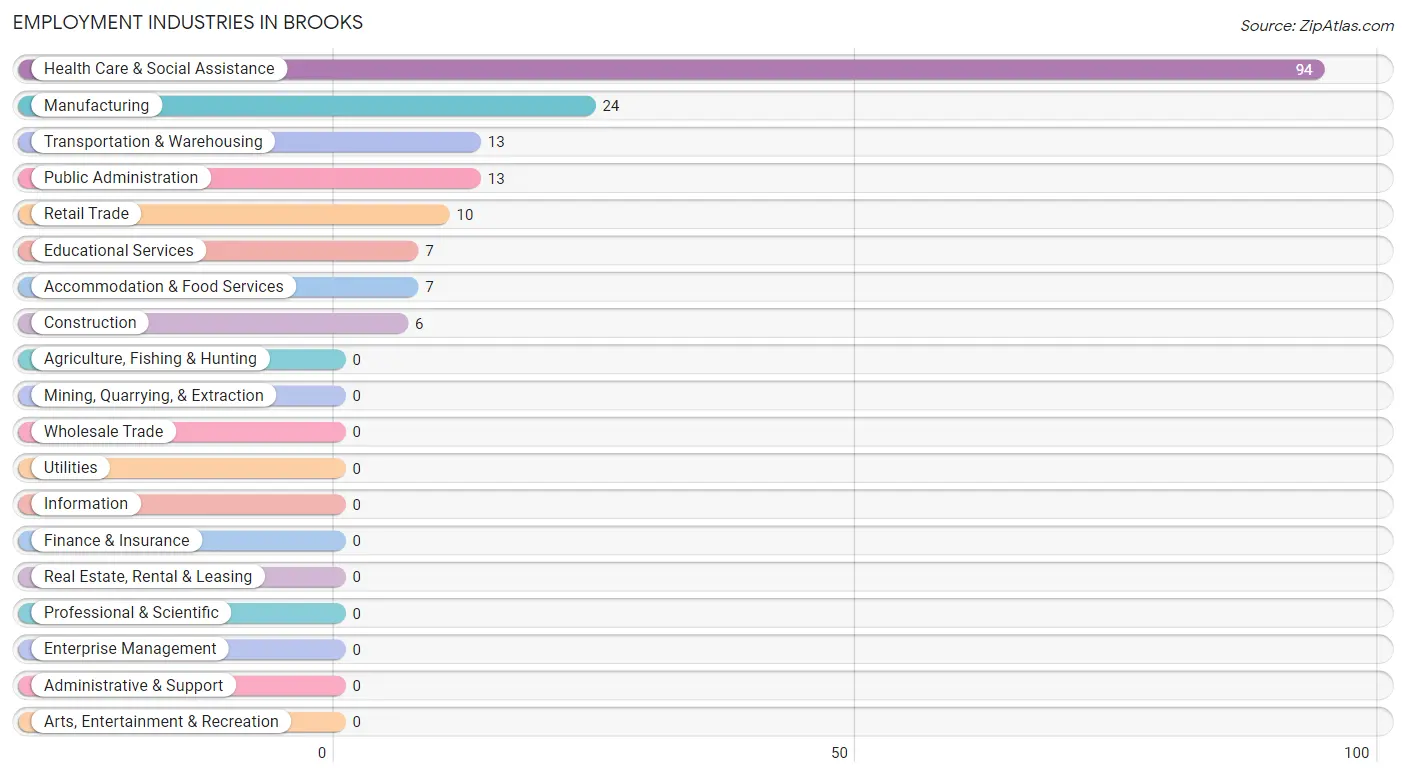
Employment Industries in Brooks
The major employment industries in Brooks include Health Care & Social Assistance (94 | 51.1%), Manufacturing (24 | 13.0%), Transportation & Warehousing (13 | 7.1%), Public Administration (13 | 7.1%), and Retail Trade (10 | 5.4%).
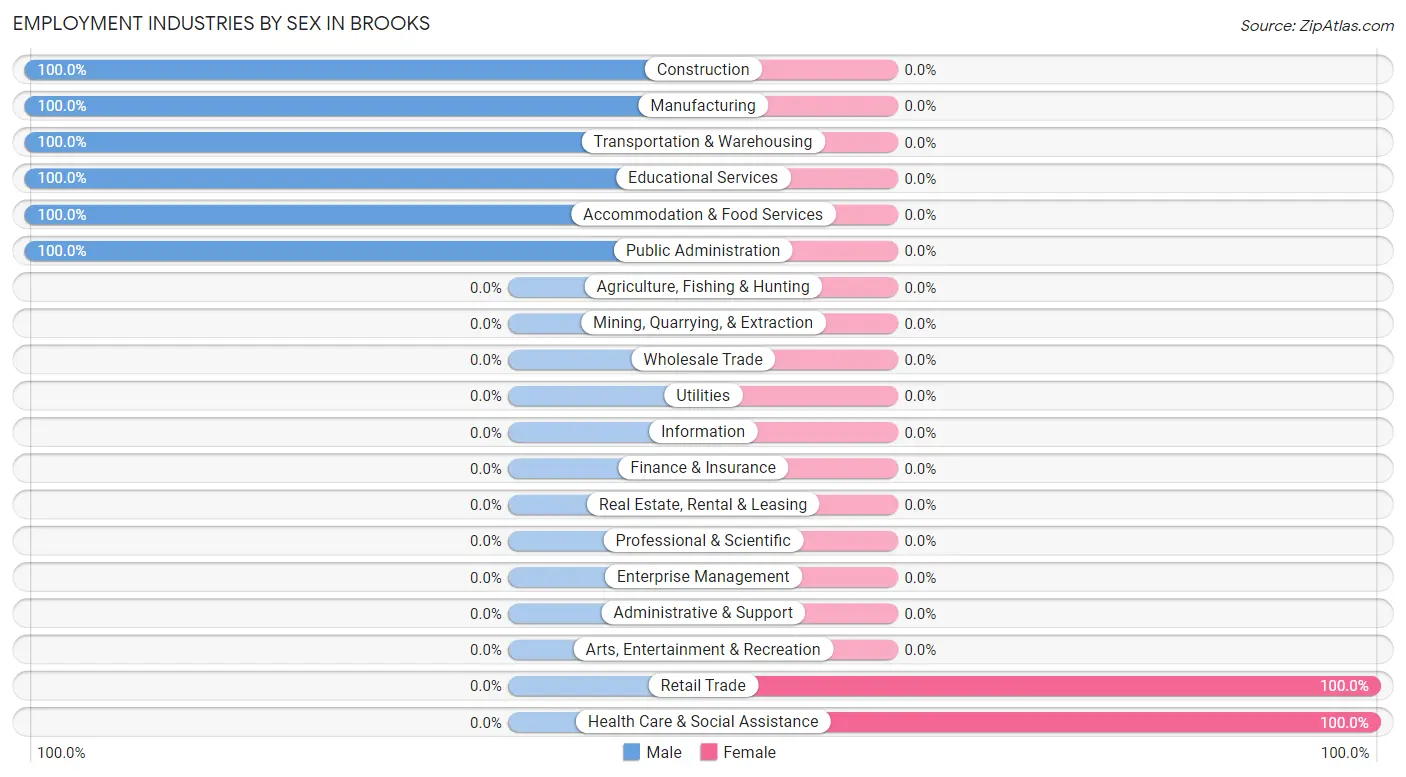
Employment Industries by Sex in Brooks
The Brooks industries that see more men than women are Construction (100.0%), Manufacturing (100.0%), and Transportation & Warehousing (100.0%), whereas the industries that tend to have a higher number of women are Retail Trade (100.0%), and Health Care & Social Assistance (100.0%).
| Industry | Male | Female |
| Agriculture, Fishing & Hunting | 0 (0.0%) | 0 (0.0%) |
| Mining, Quarrying, & Extraction | 0 (0.0%) | 0 (0.0%) |
| Construction | 6 (100.0%) | 0 (0.0%) |
| Manufacturing | 24 (100.0%) | 0 (0.0%) |
| Wholesale Trade | 0 (0.0%) | 0 (0.0%) |
| Retail Trade | 0 (0.0%) | 10 (100.0%) |
| Transportation & Warehousing | 13 (100.0%) | 0 (0.0%) |
| Utilities | 0 (0.0%) | 0 (0.0%) |
| Information | 0 (0.0%) | 0 (0.0%) |
| Finance & Insurance | 0 (0.0%) | 0 (0.0%) |
| Real Estate, Rental & Leasing | 0 (0.0%) | 0 (0.0%) |
| Professional & Scientific | 0 (0.0%) | 0 (0.0%) |
| Enterprise Management | 0 (0.0%) | 0 (0.0%) |
| Administrative & Support | 0 (0.0%) | 0 (0.0%) |
| Educational Services | 7 (100.0%) | 0 (0.0%) |
| Health Care & Social Assistance | 0 (0.0%) | 94 (100.0%) |
| Arts, Entertainment & Recreation | 0 (0.0%) | 0 (0.0%) |
| Accommodation & Food Services | 7 (100.0%) | 0 (0.0%) |
| Public Administration | 13 (100.0%) | 0 (0.0%) |
| Total | 70 (38.0%) | 114 (62.0%) |
Education in Brooks
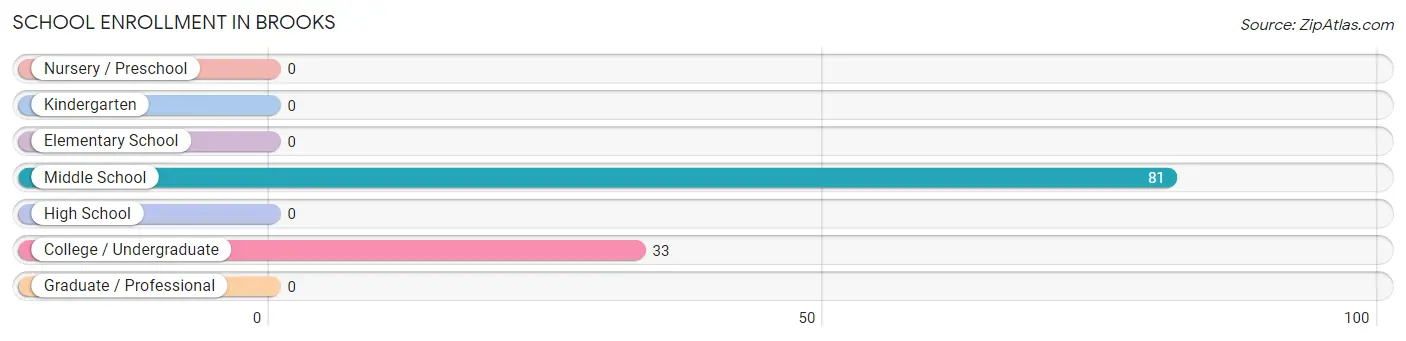
School Enrollment in Brooks
The most common levels of schooling among the 114 students in Brooks are middle school (81 | 71.1%), and college / undergraduate (33 | 28.9%).
| School Level | # Students | % Students |
| Nursery / Preschool | 0 | 0.0% |
| Kindergarten | 0 | 0.0% |
| Elementary School | 0 | 0.0% |
| Middle School | 81 | 71.1% |
| High School | 0 | 0.0% |
| College / Undergraduate | 33 | 28.9% |
| Graduate / Professional | 0 | 0.0% |
| Total | 114 | 100.0% |
School Enrollment by Age by Funding Source in Brooks
Out of a total of 114 students who are enrolled in schools in Brooks, 93 (81.6%) attend a private institution, while the remaining 21 (18.4%) are enrolled in public schools. The age group of 10 to 14 year olds has the highest likelihood of being enrolled in private schools, with 74 (100.0% in the age bracket) enrolled. Conversely, the age group of 15 to 17 year olds has the lowest likelihood of being enrolled in a private school, with 7 (100.0% in the age bracket) attending a public institution.
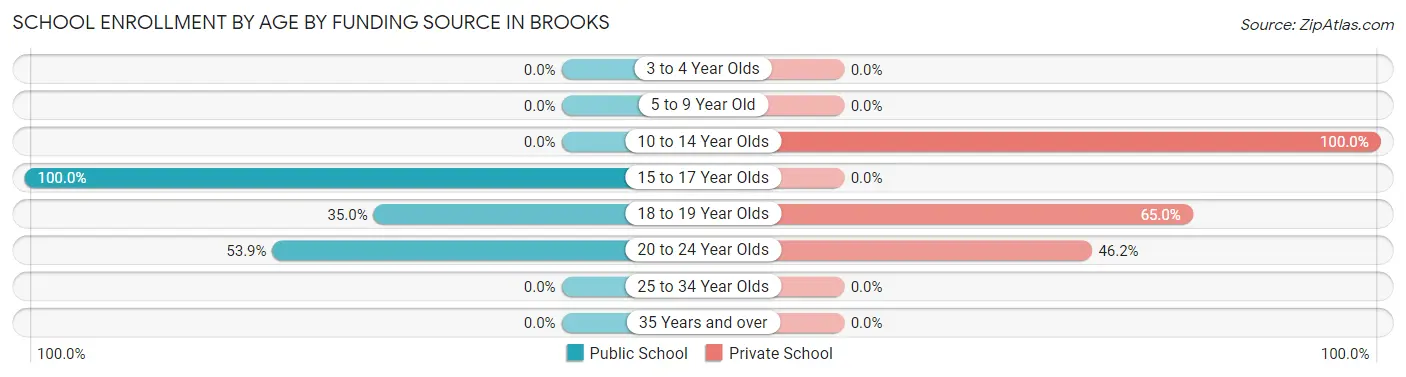
| Age Bracket | Public School | Private School |
| 3 to 4 Year Olds | 0 (0.0%) | 0 (0.0%) |
| 5 to 9 Year Old | 0 (0.0%) | 0 (0.0%) |
| 10 to 14 Year Olds | 0 (0.0%) | 74 (100.0%) |
| 15 to 17 Year Olds | 7 (100.0%) | 0 (0.0%) |
| 18 to 19 Year Olds | 7 (35.0%) | 13 (65.0%) |
| 20 to 24 Year Olds | 7 (53.8%) | 6 (46.2%) |
| 25 to 34 Year Olds | 0 (0.0%) | 0 (0.0%) |
| 35 Years and over | 0 (0.0%) | 0 (0.0%) |
| Total | 21 (18.4%) | 93 (81.6%) |
Educational Attainment by Field of Study in Brooks
Education (41 | 56.9%), business (13 | 18.1%), bio, nature & agricultural (9 | 12.5%), and science & technology (9 | 12.5%) are the most common fields of study among 72 individuals in Brooks who have obtained a bachelor's degree or higher.
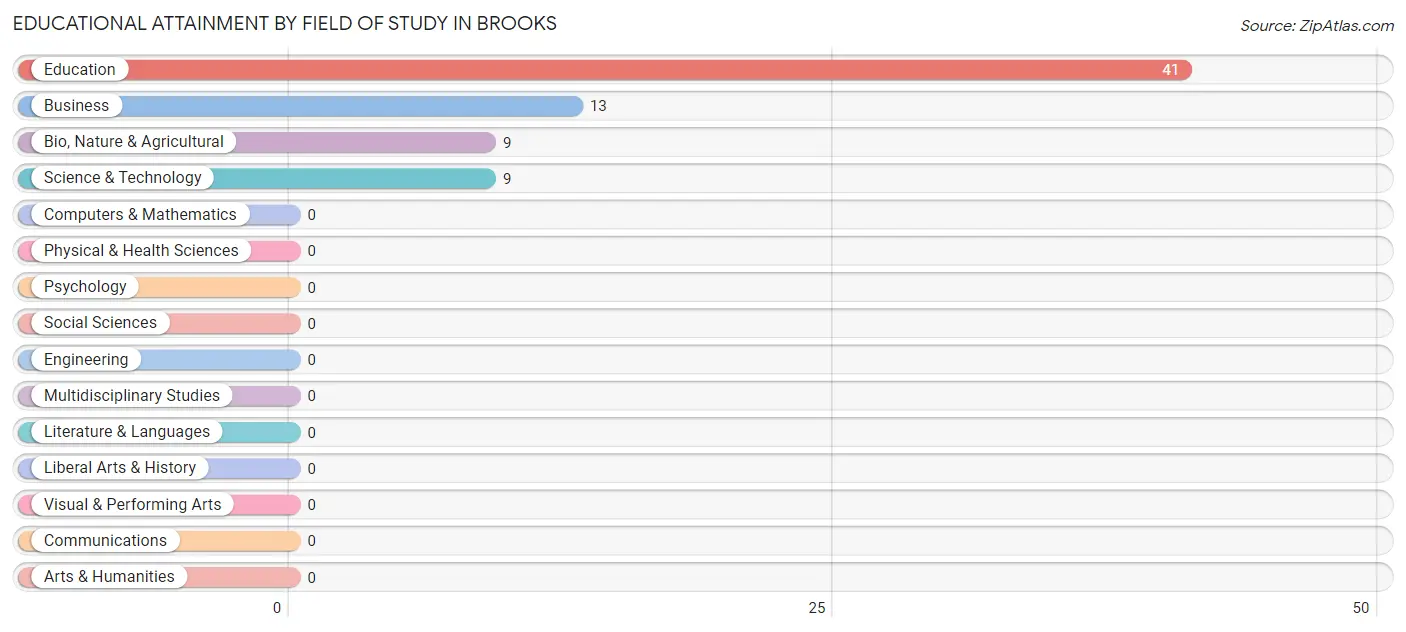
| Field of Study | # Graduates | % Graduates |
| Computers & Mathematics | 0 | 0.0% |
| Bio, Nature & Agricultural | 9 | 12.5% |
| Physical & Health Sciences | 0 | 0.0% |
| Psychology | 0 | 0.0% |
| Social Sciences | 0 | 0.0% |
| Engineering | 0 | 0.0% |
| Multidisciplinary Studies | 0 | 0.0% |
| Science & Technology | 9 | 12.5% |
| Business | 13 | 18.1% |
| Education | 41 | 56.9% |
| Literature & Languages | 0 | 0.0% |
| Liberal Arts & History | 0 | 0.0% |
| Visual & Performing Arts | 0 | 0.0% |
| Communications | 0 | 0.0% |
| Arts & Humanities | 0 | 0.0% |
| Total | 72 | 100.0% |
Transportation & Commute in Brooks
Vehicle Availability by Sex in Brooks
The most prevalent vehicle ownership categories in Brooks are males with 1 vehicle (26, accounting for 40.6%) and females with 1 vehicle (10, making up 22.8%).
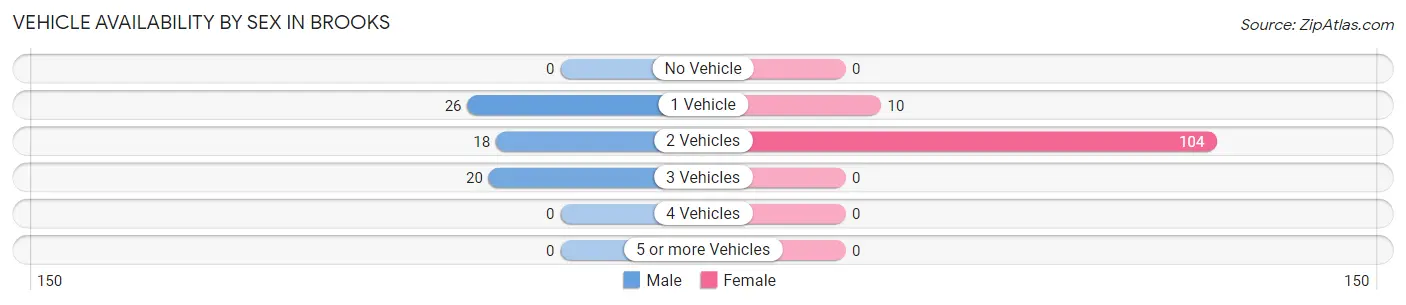
| Vehicles Available | Male | Female |
| No Vehicle | 0 (0.0%) | 0 (0.0%) |
| 1 Vehicle | 26 (40.6%) | 10 (8.8%) |
| 2 Vehicles | 18 (28.1%) | 104 (91.2%) |
| 3 Vehicles | 20 (31.2%) | 0 (0.0%) |
| 4 Vehicles | 0 (0.0%) | 0 (0.0%) |
| 5 or more Vehicles | 0 (0.0%) | 0 (0.0%) |
| Total | 64 (100.0%) | 114 (100.0%) |
Commute Time in Brooks
The most frequently occuring commute durations in Brooks are 35 to 39 minutes (94 commuters, 55.9%), 60 to 89 minutes (31 commuters, 18.4%), and 20 to 24 minutes (23 commuters, 13.7%).
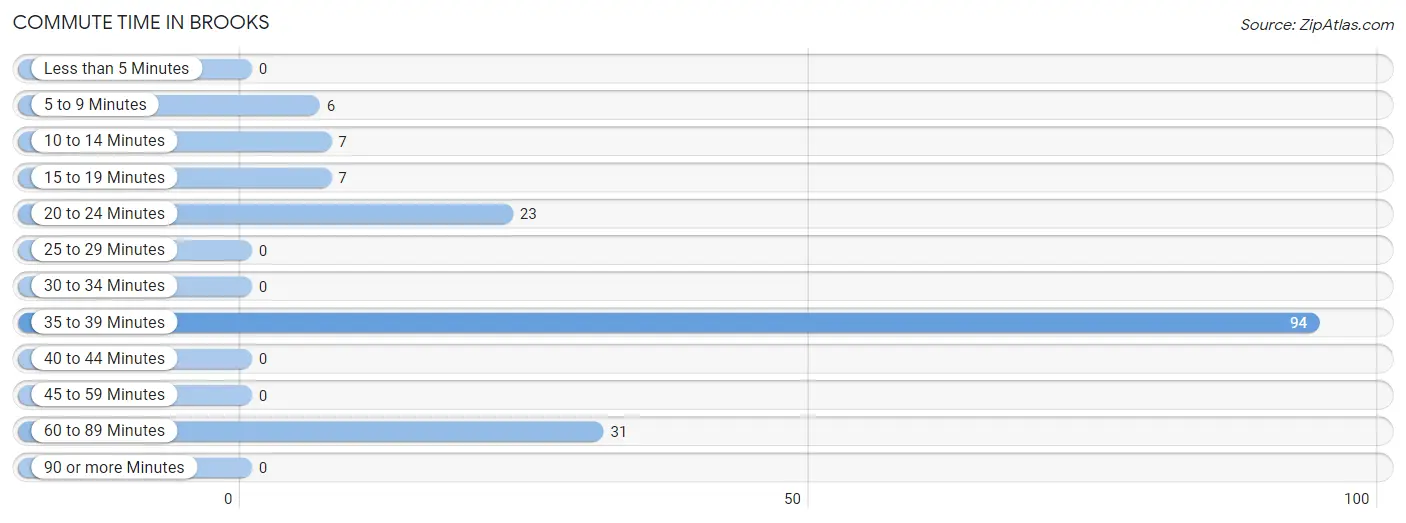
| Commute Time | # Commuters | % Commuters |
| Less than 5 Minutes | 0 | 0.0% |
| 5 to 9 Minutes | 6 | 3.6% |
| 10 to 14 Minutes | 7 | 4.2% |
| 15 to 19 Minutes | 7 | 4.2% |
| 20 to 24 Minutes | 23 | 13.7% |
| 25 to 29 Minutes | 0 | 0.0% |
| 30 to 34 Minutes | 0 | 0.0% |
| 35 to 39 Minutes | 94 | 55.9% |
| 40 to 44 Minutes | 0 | 0.0% |
| 45 to 59 Minutes | 0 | 0.0% |
| 60 to 89 Minutes | 31 | 18.4% |
| 90 or more Minutes | 0 | 0.0% |
Commute Time by Sex in Brooks
The most common commute times in Brooks are 60 to 89 minutes (31 commuters, 48.4%) for males and 35 to 39 minutes (94 commuters, 90.4%) for females.
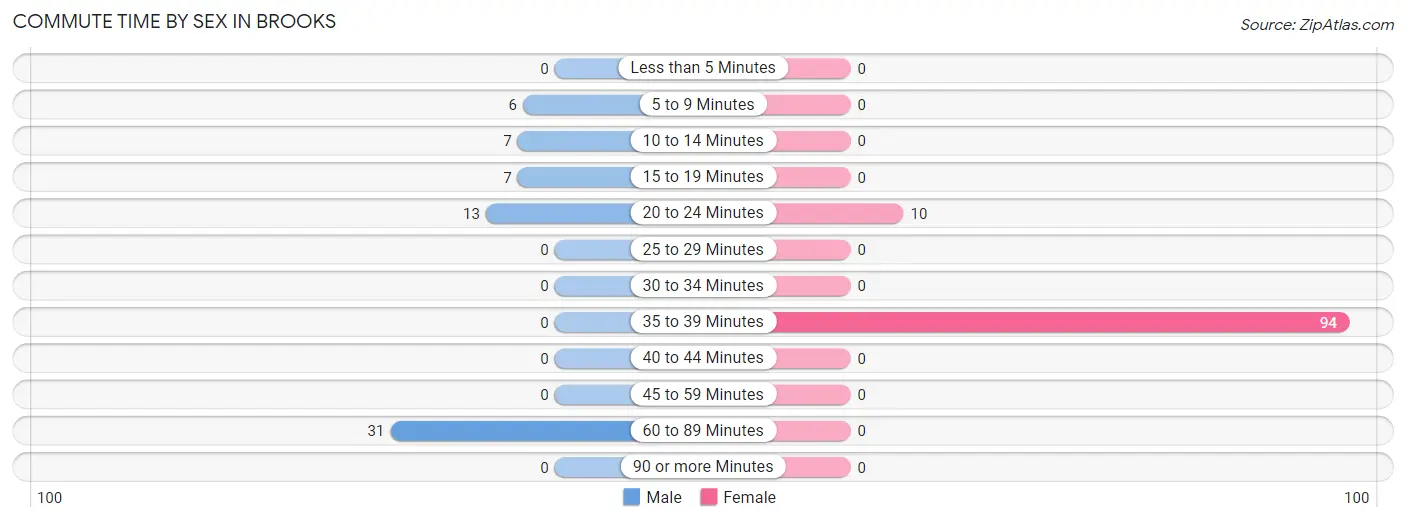
| Commute Time | Male | Female |
| Less than 5 Minutes | 0 (0.0%) | 0 (0.0%) |
| 5 to 9 Minutes | 6 (9.4%) | 0 (0.0%) |
| 10 to 14 Minutes | 7 (10.9%) | 0 (0.0%) |
| 15 to 19 Minutes | 7 (10.9%) | 0 (0.0%) |
| 20 to 24 Minutes | 13 (20.3%) | 10 (9.6%) |
| 25 to 29 Minutes | 0 (0.0%) | 0 (0.0%) |
| 30 to 34 Minutes | 0 (0.0%) | 0 (0.0%) |
| 35 to 39 Minutes | 0 (0.0%) | 94 (90.4%) |
| 40 to 44 Minutes | 0 (0.0%) | 0 (0.0%) |
| 45 to 59 Minutes | 0 (0.0%) | 0 (0.0%) |
| 60 to 89 Minutes | 31 (48.4%) | 0 (0.0%) |
| 90 or more Minutes | 0 (0.0%) | 0 (0.0%) |
Time of Departure to Work by Sex in Brooks
The most frequent times of departure to work in Brooks are 12:00 AM to 4:59 AM (24, 37.5%) for males and 8:00 AM to 8:29 AM (94, 90.4%) for females.
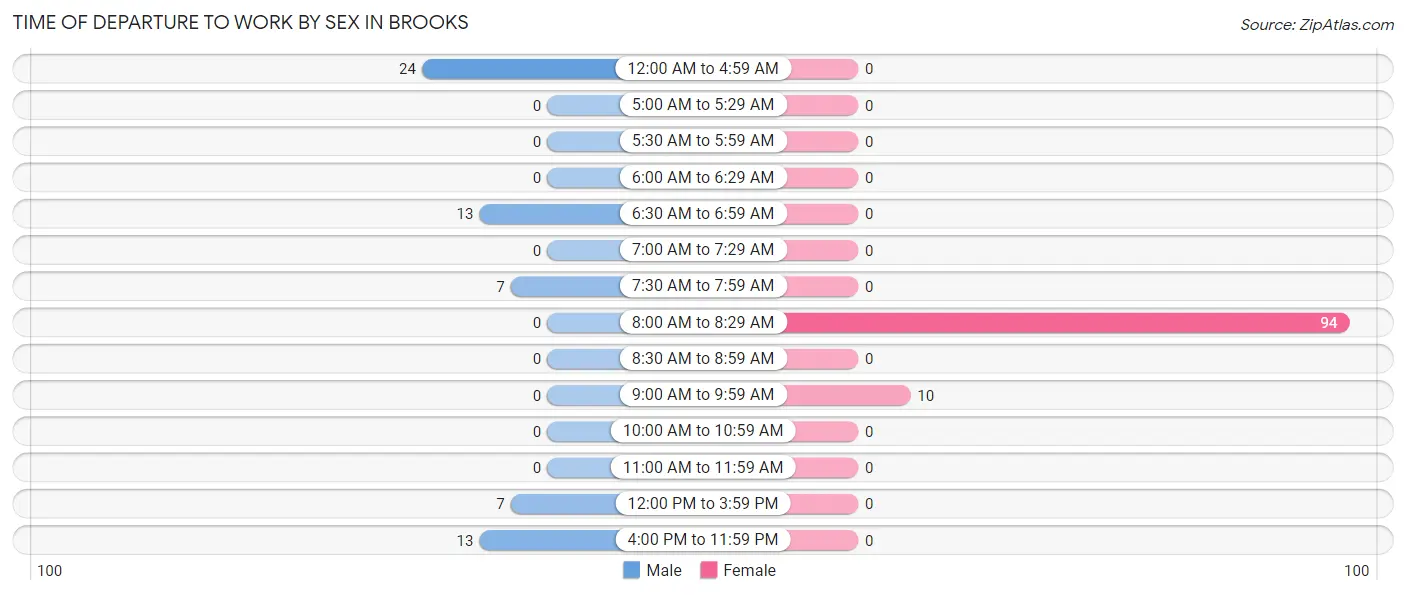
| Time of Departure | Male | Female |
| 12:00 AM to 4:59 AM | 24 (37.5%) | 0 (0.0%) |
| 5:00 AM to 5:29 AM | 0 (0.0%) | 0 (0.0%) |
| 5:30 AM to 5:59 AM | 0 (0.0%) | 0 (0.0%) |
| 6:00 AM to 6:29 AM | 0 (0.0%) | 0 (0.0%) |
| 6:30 AM to 6:59 AM | 13 (20.3%) | 0 (0.0%) |
| 7:00 AM to 7:29 AM | 0 (0.0%) | 0 (0.0%) |
| 7:30 AM to 7:59 AM | 7 (10.9%) | 0 (0.0%) |
| 8:00 AM to 8:29 AM | 0 (0.0%) | 94 (90.4%) |
| 8:30 AM to 8:59 AM | 0 (0.0%) | 0 (0.0%) |
| 9:00 AM to 9:59 AM | 0 (0.0%) | 10 (9.6%) |
| 10:00 AM to 10:59 AM | 0 (0.0%) | 0 (0.0%) |
| 11:00 AM to 11:59 AM | 0 (0.0%) | 0 (0.0%) |
| 12:00 PM to 3:59 PM | 7 (10.9%) | 0 (0.0%) |
| 4:00 PM to 11:59 PM | 13 (20.3%) | 0 (0.0%) |
| Total | 64 (100.0%) | 104 (100.0%) |
Housing Occupancy in Brooks
Occupancy by Ownership in Brooks
Of the total 66 dwellings in Brooks, owner-occupied units account for 56 (84.9%), while renter-occupied units make up 10 (15.1%).
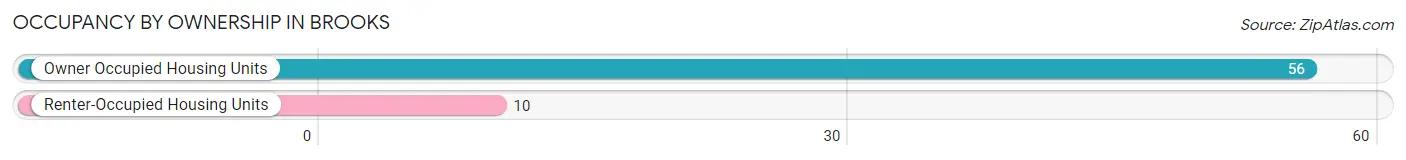
| Occupancy | # Housing Units | % Housing Units |
| Owner Occupied Housing Units | 56 | 84.9% |
| Renter-Occupied Housing Units | 10 | 15.1% |
| Total Occupied Housing Units | 66 | 100.0% |
Occupancy by Household Size in Brooks
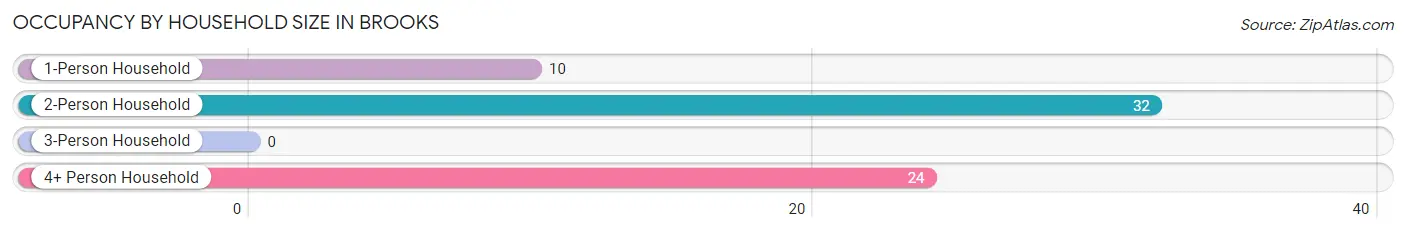
| Household Size | # Housing Units | % Housing Units |
| 1-Person Household | 10 | 15.1% |
| 2-Person Household | 32 | 48.5% |
| 3-Person Household | 0 | 0.0% |
| 4+ Person Household | 24 | 36.4% |
| Total Housing Units | 66 | 100.0% |
Occupancy by Ownership by Household Size in Brooks
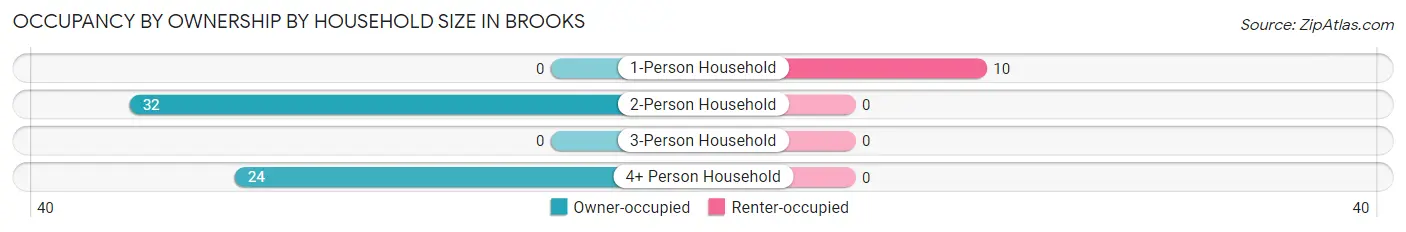
| Household Size | Owner-occupied | Renter-occupied |
| 1-Person Household | 0 (0.0%) | 10 (100.0%) |
| 2-Person Household | 32 (100.0%) | 0 (0.0%) |
| 3-Person Household | 0 (0.0%) | 0 (0.0%) |
| 4+ Person Household | 24 (100.0%) | 0 (0.0%) |
| Total Housing Units | 56 (84.9%) | 10 (15.1%) |
Occupancy by Educational Attainment in Brooks
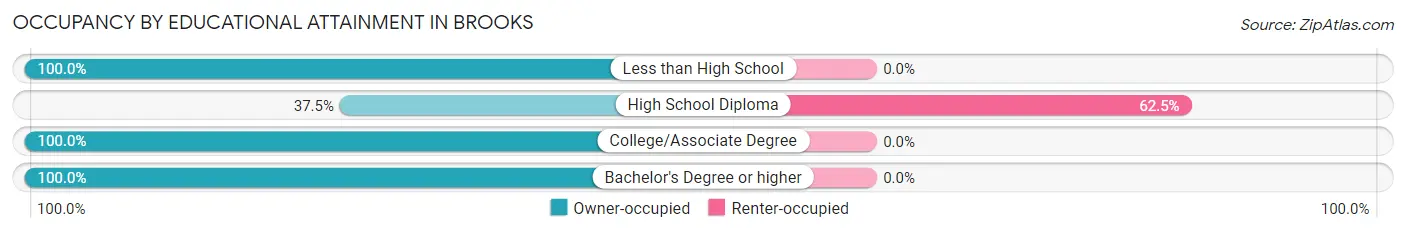
| Household Size | Owner-occupied | Renter-occupied |
| Less than High School | 9 (100.0%) | 0 (0.0%) |
| High School Diploma | 6 (37.5%) | 10 (62.5%) |
| College/Associate Degree | 13 (100.0%) | 0 (0.0%) |
| Bachelor's Degree or higher | 28 (100.0%) | 0 (0.0%) |
Occupancy by Age of Householder in Brooks
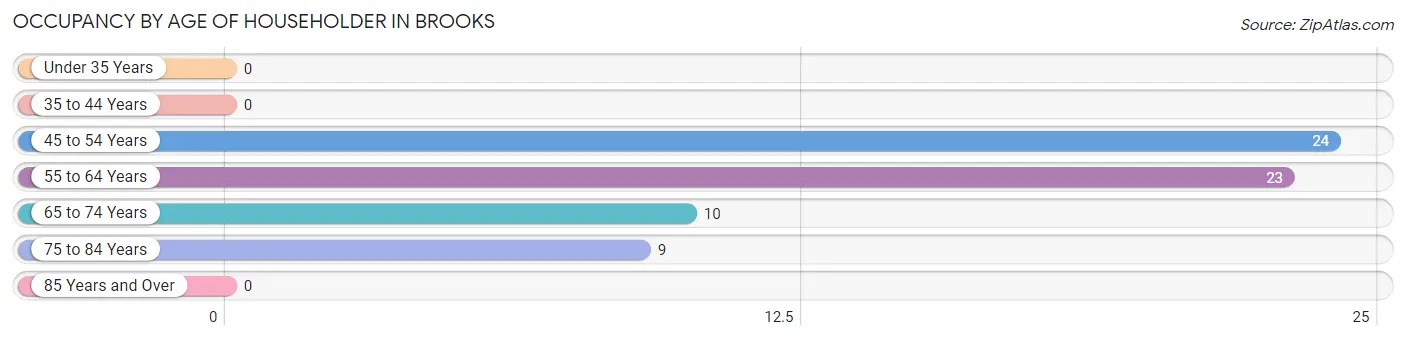
| Age Bracket | # Households | % Households |
| Under 35 Years | 0 | 0.0% |
| 35 to 44 Years | 0 | 0.0% |
| 45 to 54 Years | 24 | 36.4% |
| 55 to 64 Years | 23 | 34.8% |
| 65 to 74 Years | 10 | 15.1% |
| 75 to 84 Years | 9 | 13.6% |
| 85 Years and Over | 0 | 0.0% |
| Total | 66 | 100.0% |
Housing Finances in Brooks
Median Income by Occupancy in Brooks
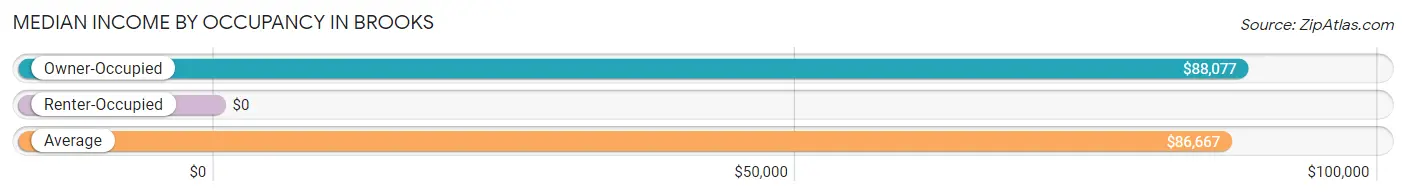
| Occupancy Type | # Households | Median Income |
| Owner-Occupied | 56 (84.9%) | $88,077 |
| Renter-Occupied | 10 (15.1%) | $0 |
| Average | 66 (100.0%) | $86,667 |
Occupancy by Householder Income Bracket in Brooks
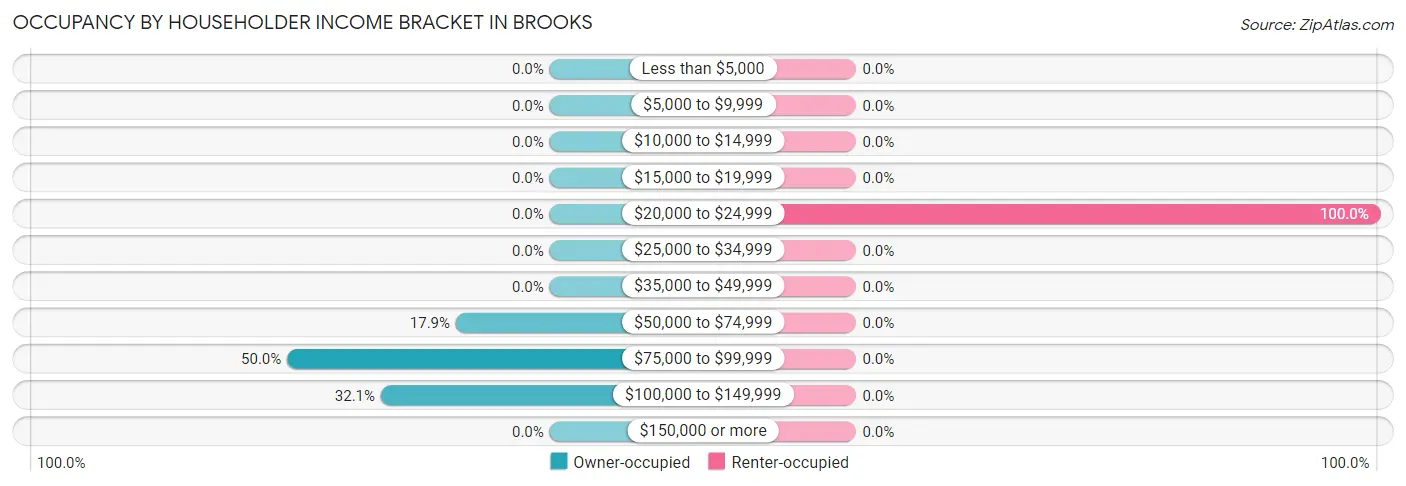
| Income Bracket | Owner-occupied | Renter-occupied |
| Less than $5,000 | 0 (0.0%) | 0 (0.0%) |
| $5,000 to $9,999 | 0 (0.0%) | 0 (0.0%) |
| $10,000 to $14,999 | 0 (0.0%) | 0 (0.0%) |
| $15,000 to $19,999 | 0 (0.0%) | 0 (0.0%) |
| $20,000 to $24,999 | 0 (0.0%) | 10 (100.0%) |
| $25,000 to $34,999 | 0 (0.0%) | 0 (0.0%) |
| $35,000 to $49,999 | 0 (0.0%) | 0 (0.0%) |
| $50,000 to $74,999 | 10 (17.9%) | 0 (0.0%) |
| $75,000 to $99,999 | 28 (50.0%) | 0 (0.0%) |
| $100,000 to $149,999 | 18 (32.1%) | 0 (0.0%) |
| $150,000 or more | 0 (0.0%) | 0 (0.0%) |
| Total | 56 (100.0%) | 10 (100.0%) |
Monthly Housing Cost Tiers in Brooks
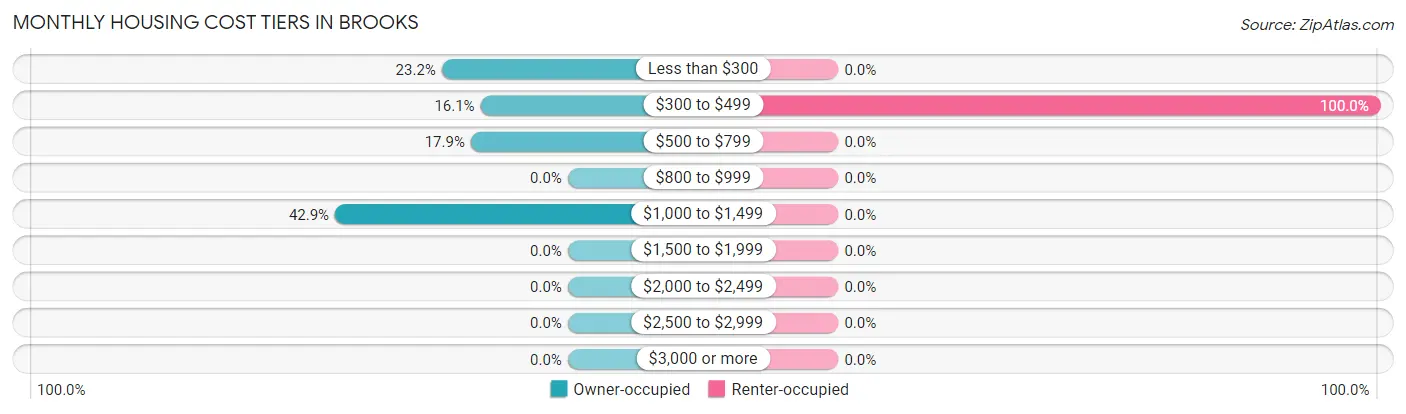
| Monthly Cost | Owner-occupied | Renter-occupied |
| Less than $300 | 13 (23.2%) | 0 (0.0%) |
| $300 to $499 | 9 (16.1%) | 10 (100.0%) |
| $500 to $799 | 10 (17.9%) | 0 (0.0%) |
| $800 to $999 | 0 (0.0%) | 0 (0.0%) |
| $1,000 to $1,499 | 24 (42.9%) | 0 (0.0%) |
| $1,500 to $1,999 | 0 (0.0%) | 0 (0.0%) |
| $2,000 to $2,499 | 0 (0.0%) | 0 (0.0%) |
| $2,500 to $2,999 | 0 (0.0%) | 0 (0.0%) |
| $3,000 or more | 0 (0.0%) | 0 (0.0%) |
| Total | 56 (100.0%) | 10 (100.0%) |
Physical Housing Characteristics in Brooks
Housing Structures in Brooks
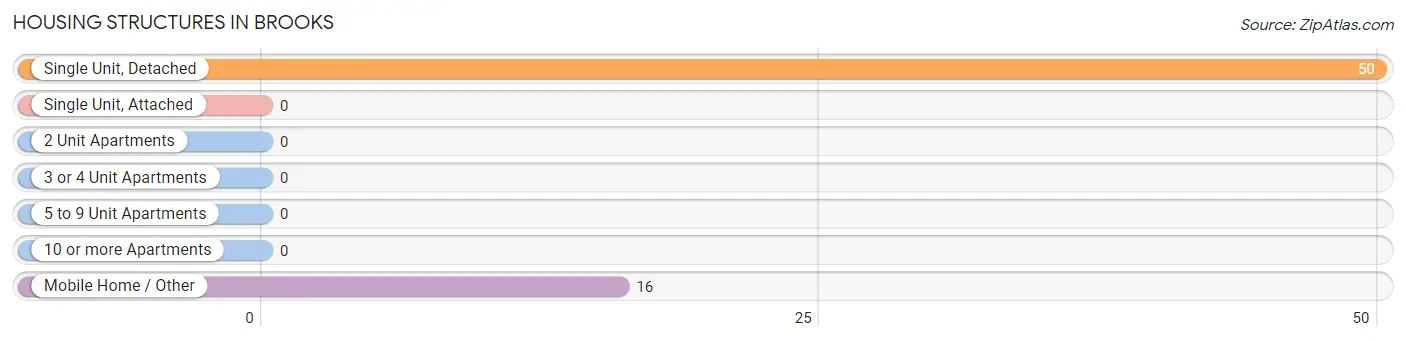
| Structure Type | # Housing Units | % Housing Units |
| Single Unit, Detached | 50 | 75.8% |
| Single Unit, Attached | 0 | 0.0% |
| 2 Unit Apartments | 0 | 0.0% |
| 3 or 4 Unit Apartments | 0 | 0.0% |
| 5 to 9 Unit Apartments | 0 | 0.0% |
| 10 or more Apartments | 0 | 0.0% |
| Mobile Home / Other | 16 | 24.2% |
| Total | 66 | 100.0% |
Housing Structures by Occupancy in Brooks
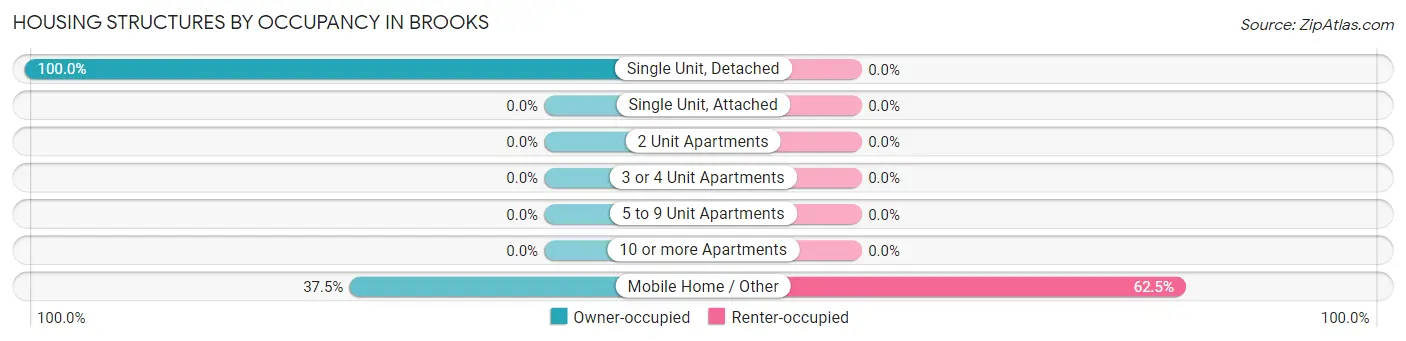
| Structure Type | Owner-occupied | Renter-occupied |
| Single Unit, Detached | 50 (100.0%) | 0 (0.0%) |
| Single Unit, Attached | 0 (0.0%) | 0 (0.0%) |
| 2 Unit Apartments | 0 (0.0%) | 0 (0.0%) |
| 3 or 4 Unit Apartments | 0 (0.0%) | 0 (0.0%) |
| 5 to 9 Unit Apartments | 0 (0.0%) | 0 (0.0%) |
| 10 or more Apartments | 0 (0.0%) | 0 (0.0%) |
| Mobile Home / Other | 6 (37.5%) | 10 (62.5%) |
| Total | 56 (84.9%) | 10 (15.1%) |
Housing Structures by Number of Rooms in Brooks
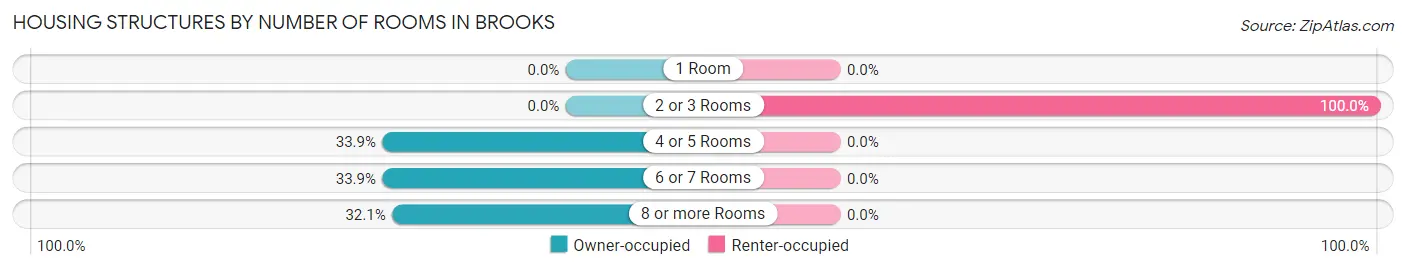
| Number of Rooms | Owner-occupied | Renter-occupied |
| 1 Room | 0 (0.0%) | 0 (0.0%) |
| 2 or 3 Rooms | 0 (0.0%) | 10 (100.0%) |
| 4 or 5 Rooms | 19 (33.9%) | 0 (0.0%) |
| 6 or 7 Rooms | 19 (33.9%) | 0 (0.0%) |
| 8 or more Rooms | 18 (32.1%) | 0 (0.0%) |
| Total | 56 (100.0%) | 10 (100.0%) |
Housing Structure by Heating Type in Brooks
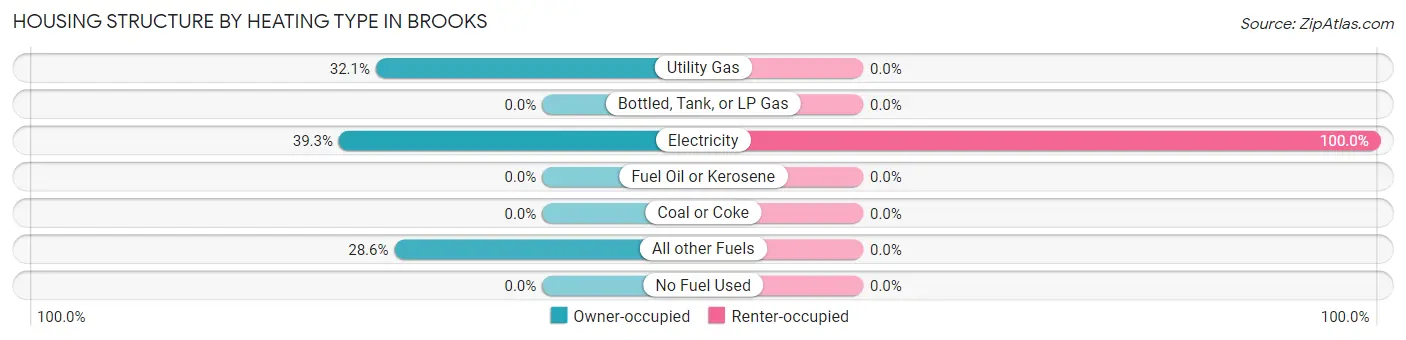
| Heating Type | Owner-occupied | Renter-occupied |
| Utility Gas | 18 (32.1%) | 0 (0.0%) |
| Bottled, Tank, or LP Gas | 0 (0.0%) | 0 (0.0%) |
| Electricity | 22 (39.3%) | 10 (100.0%) |
| Fuel Oil or Kerosene | 0 (0.0%) | 0 (0.0%) |
| Coal or Coke | 0 (0.0%) | 0 (0.0%) |
| All other Fuels | 16 (28.6%) | 0 (0.0%) |
| No Fuel Used | 0 (0.0%) | 0 (0.0%) |
| Total | 56 (100.0%) | 10 (100.0%) |
Household Vehicle Usage in Brooks
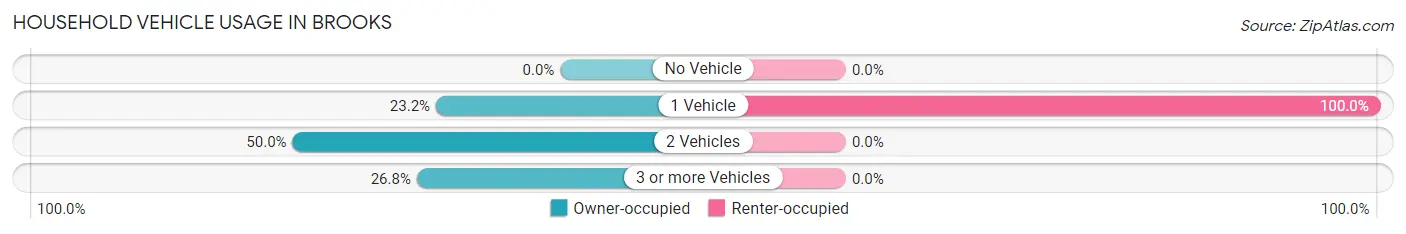
| Vehicles per Household | Owner-occupied | Renter-occupied |
| No Vehicle | 0 (0.0%) | 0 (0.0%) |
| 1 Vehicle | 13 (23.2%) | 10 (100.0%) |
| 2 Vehicles | 28 (50.0%) | 0 (0.0%) |
| 3 or more Vehicles | 15 (26.8%) | 0 (0.0%) |
| Total | 56 (100.0%) | 10 (100.0%) |
Real Estate & Mortgages in Brooks
Real Estate and Mortgage Overview in Brooks
| Characteristic | Without Mortgage | With Mortgage |
| Housing Units | 22 | 34 |
| Median Property Value | - | - |
| Median Household Income | - | - |
| Monthly Housing Costs | - | - |
| Real Estate Taxes | - | - |
Property Value by Mortgage Status in Brooks
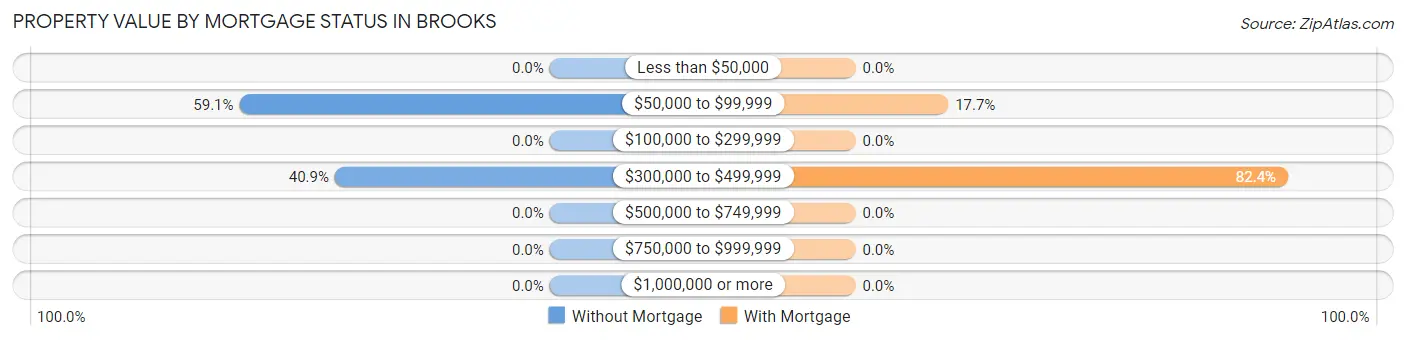
| Property Value | Without Mortgage | With Mortgage |
| Less than $50,000 | 0 (0.0%) | 0 (0.0%) |
| $50,000 to $99,999 | 13 (59.1%) | 6 (17.6%) |
| $100,000 to $299,999 | 0 (0.0%) | 0 (0.0%) |
| $300,000 to $499,999 | 9 (40.9%) | 28 (82.4%) |
| $500,000 to $749,999 | 0 (0.0%) | 0 (0.0%) |
| $750,000 to $999,999 | 0 (0.0%) | 0 (0.0%) |
| $1,000,000 or more | 0 (0.0%) | 0 (0.0%) |
| Total | 22 (100.0%) | 34 (100.0%) |
Household Income by Mortgage Status in Brooks
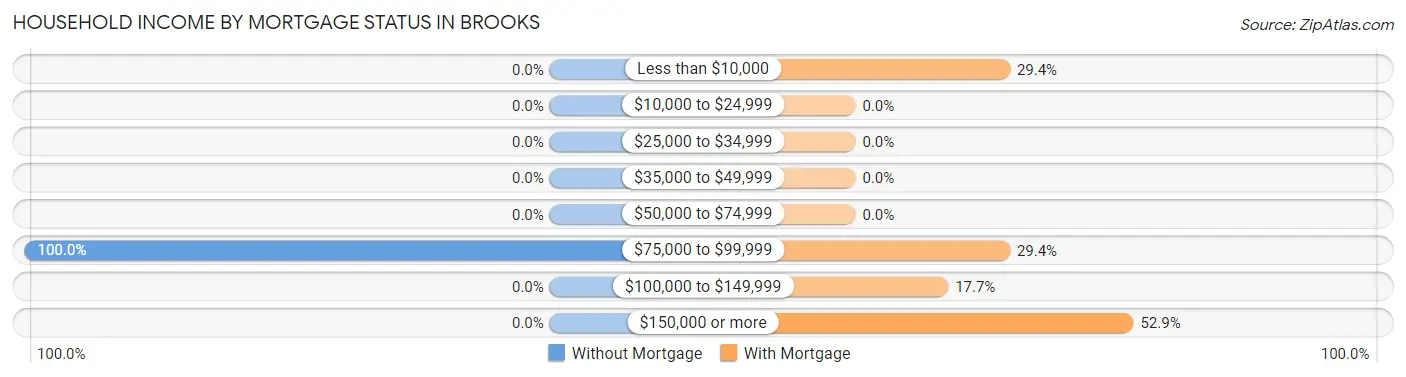
| Household Income | Without Mortgage | With Mortgage |
| Less than $10,000 | 0 (0.0%) | 10 (29.4%) |
| $10,000 to $24,999 | 0 (0.0%) | 0 (0.0%) |
| $25,000 to $34,999 | 0 (0.0%) | 0 (0.0%) |
| $35,000 to $49,999 | 0 (0.0%) | 0 (0.0%) |
| $50,000 to $74,999 | 0 (0.0%) | 0 (0.0%) |
| $75,000 to $99,999 | 22 (100.0%) | 10 (29.4%) |
| $100,000 to $149,999 | 0 (0.0%) | 6 (17.6%) |
| $150,000 or more | 0 (0.0%) | 18 (52.9%) |
| Total | 22 (100.0%) | 34 (100.0%) |
Property Value to Household Income Ratio in Brooks
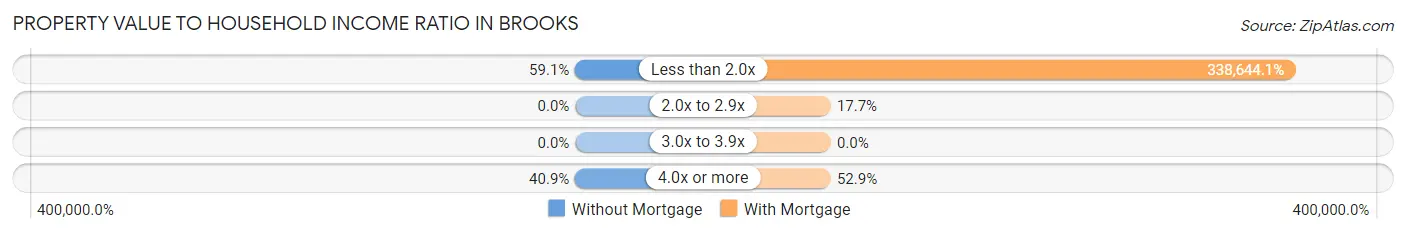
| Value-to-Income Ratio | Without Mortgage | With Mortgage |
| Less than 2.0x | 13 (59.1%) | 115,139 (338,644.1%) |
| 2.0x to 2.9x | 0 (0.0%) | 6 (17.6%) |
| 3.0x to 3.9x | 0 (0.0%) | 0 (0.0%) |
| 4.0x or more | 9 (40.9%) | 18 (52.9%) |
| Total | 22 (100.0%) | 34 (100.0%) |
Real Estate Taxes by Mortgage Status in Brooks
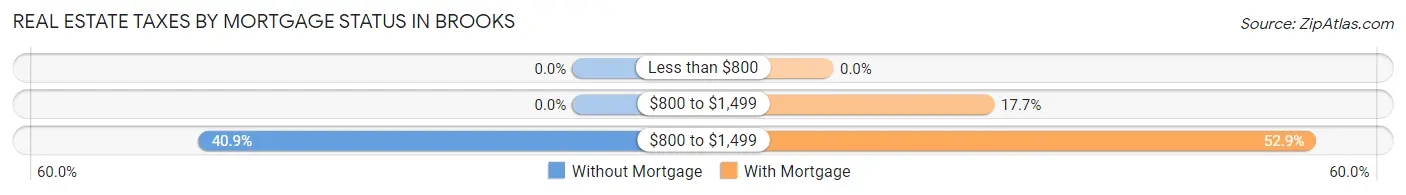
| Property Taxes | Without Mortgage | With Mortgage |
| Less than $800 | 0 (0.0%) | 0 (0.0%) |
| $800 to $1,499 | 0 (0.0%) | 6 (17.6%) |
| $800 to $1,499 | 9 (40.9%) | 18 (52.9%) |
| Total | 22 (100.0%) | 34 (100.0%) |
Health & Disability in Brooks
Health Insurance Coverage by Age in Brooks
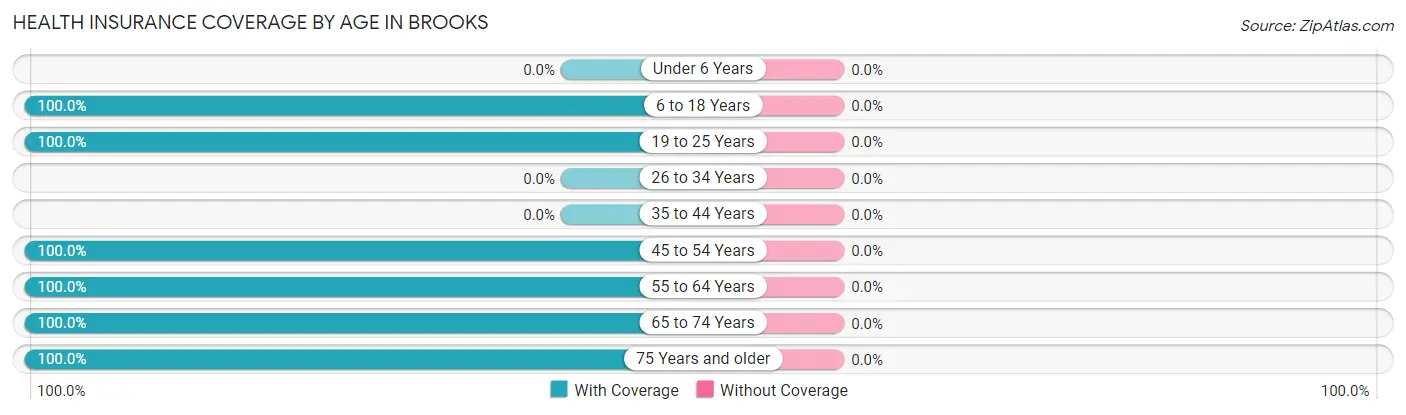
| Age Bracket | With Coverage | Without Coverage |
| Under 6 Years | 0 (0.0%) | 0 (0.0%) |
| 6 to 18 Years | 94 (100.0%) | 0 (0.0%) |
| 19 to 25 Years | 20 (100.0%) | 0 (0.0%) |
| 26 to 34 Years | 0 (0.0%) | 0 (0.0%) |
| 35 to 44 Years | 0 (0.0%) | 0 (0.0%) |
| 45 to 54 Years | 118 (100.0%) | 0 (0.0%) |
| 55 to 64 Years | 42 (100.0%) | 0 (0.0%) |
| 65 to 74 Years | 19 (100.0%) | 0 (0.0%) |
| 75 Years and older | 18 (100.0%) | 0 (0.0%) |
| Total | 311 (100.0%) | 0 (0.0%) |
Health Insurance Coverage by Citizenship Status in Brooks
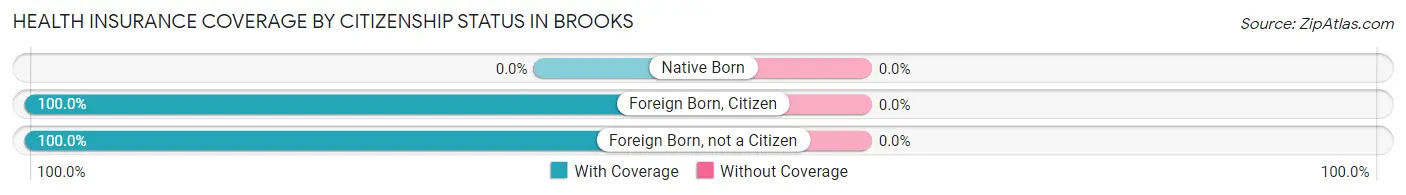
| Citizenship Status | With Coverage | Without Coverage |
| Native Born | 0 (0.0%) | 0 (0.0%) |
| Foreign Born, Citizen | 94 (100.0%) | 0 (0.0%) |
| Foreign Born, not a Citizen | 20 (100.0%) | 0 (0.0%) |
Health Insurance Coverage by Household Income in Brooks
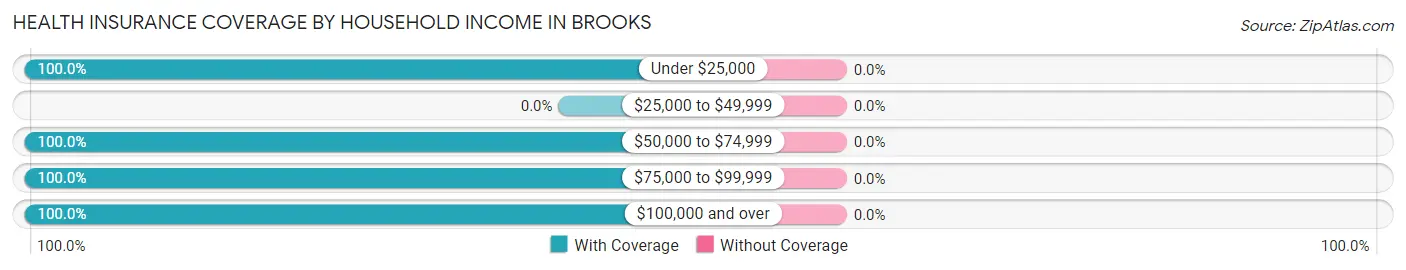
| Household Income | With Coverage | Without Coverage |
| Under $25,000 | 10 (100.0%) | 0 (0.0%) |
| $25,000 to $49,999 | 0 (0.0%) | 0 (0.0%) |
| $50,000 to $74,999 | 19 (100.0%) | 0 (0.0%) |
| $75,000 to $99,999 | 77 (100.0%) | 0 (0.0%) |
| $100,000 and over | 186 (100.0%) | 0 (0.0%) |
Public vs Private Health Insurance Coverage by Age in Brooks
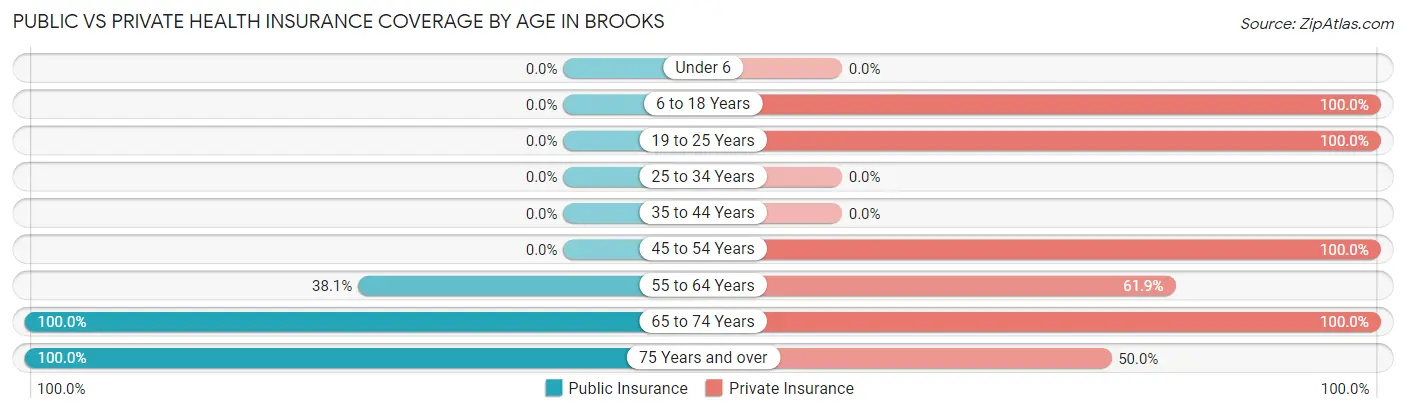
| Age Bracket | Public Insurance | Private Insurance |
| Under 6 | 0 (0.0%) | 0 (0.0%) |
| 6 to 18 Years | 0 (0.0%) | 94 (100.0%) |
| 19 to 25 Years | 0 (0.0%) | 20 (100.0%) |
| 25 to 34 Years | 0 (0.0%) | 0 (0.0%) |
| 35 to 44 Years | 0 (0.0%) | 0 (0.0%) |
| 45 to 54 Years | 0 (0.0%) | 118 (100.0%) |
| 55 to 64 Years | 16 (38.1%) | 26 (61.9%) |
| 65 to 74 Years | 19 (100.0%) | 19 (100.0%) |
| 75 Years and over | 18 (100.0%) | 9 (50.0%) |
| Total | 53 (17.0%) | 286 (92.0%) |
Disability Status by Sex by Age in Brooks
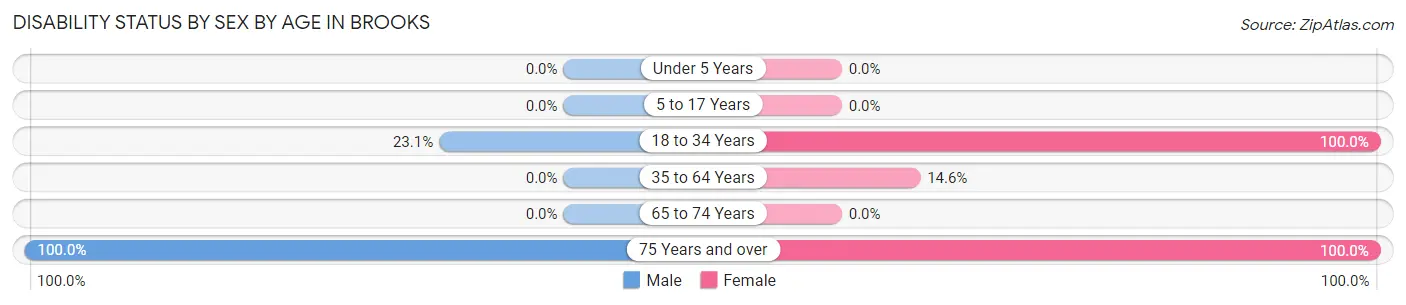
| Age Bracket | Male | Female |
| Under 5 Years | 0 (0.0%) | 0 (0.0%) |
| 5 to 17 Years | 0 (0.0%) | 0 (0.0%) |
| 18 to 34 Years | 6 (23.1%) | 7 (100.0%) |
| 35 to 64 Years | 0 (0.0%) | 16 (14.5%) |
| 65 to 74 Years | 0 (0.0%) | 0 (0.0%) |
| 75 Years and over | 9 (100.0%) | 9 (100.0%) |
Disability Class by Sex by Age in Brooks
Disability Class: Hearing Difficulty
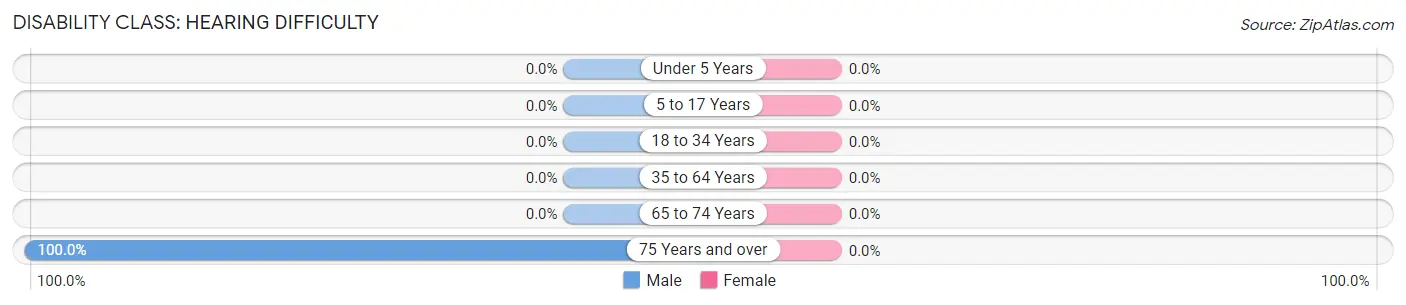
| Age Bracket | Male | Female |
| Under 5 Years | 0 (0.0%) | 0 (0.0%) |
| 5 to 17 Years | 0 (0.0%) | 0 (0.0%) |
| 18 to 34 Years | 0 (0.0%) | 0 (0.0%) |
| 35 to 64 Years | 0 (0.0%) | 0 (0.0%) |
| 65 to 74 Years | 0 (0.0%) | 0 (0.0%) |
| 75 Years and over | 9 (100.0%) | 0 (0.0%) |
Disability Class: Vision Difficulty
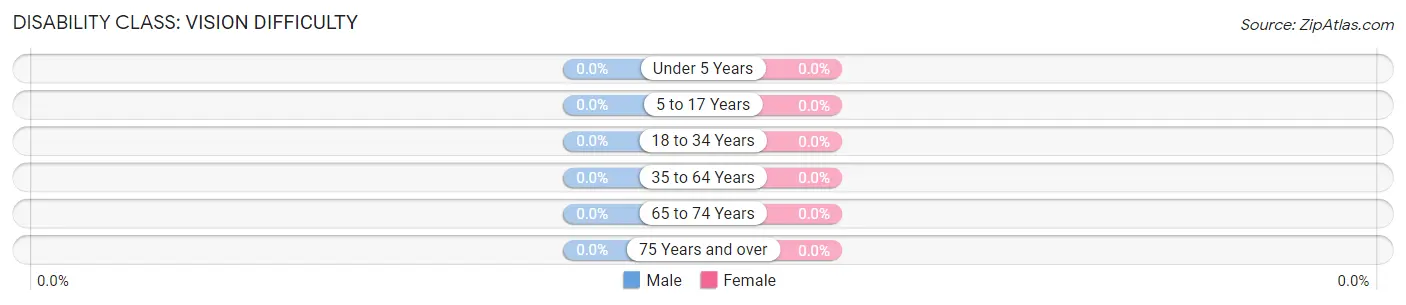
| Age Bracket | Male | Female |
| Under 5 Years | 0 (0.0%) | 0 (0.0%) |
| 5 to 17 Years | 0 (0.0%) | 0 (0.0%) |
| 18 to 34 Years | 0 (0.0%) | 0 (0.0%) |
| 35 to 64 Years | 0 (0.0%) | 0 (0.0%) |
| 65 to 74 Years | 0 (0.0%) | 0 (0.0%) |
| 75 Years and over | 0 (0.0%) | 0 (0.0%) |
Disability Class: Cognitive Difficulty
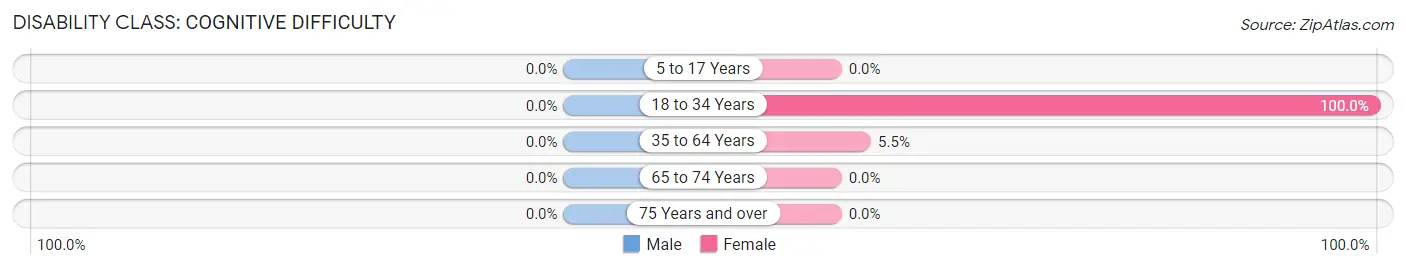
| Age Bracket | Male | Female |
| 5 to 17 Years | 0 (0.0%) | 0 (0.0%) |
| 18 to 34 Years | 0 (0.0%) | 7 (100.0%) |
| 35 to 64 Years | 0 (0.0%) | 6 (5.4%) |
| 65 to 74 Years | 0 (0.0%) | 0 (0.0%) |
| 75 Years and over | 0 (0.0%) | 0 (0.0%) |
Disability Class: Ambulatory Difficulty
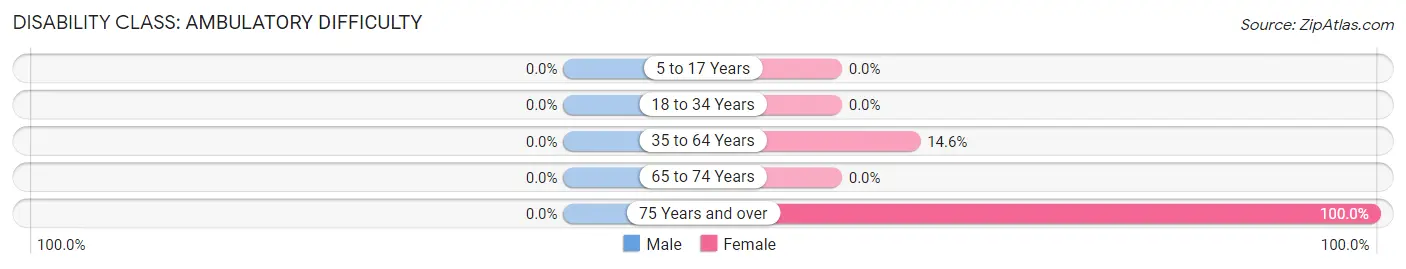
| Age Bracket | Male | Female |
| 5 to 17 Years | 0 (0.0%) | 0 (0.0%) |
| 18 to 34 Years | 0 (0.0%) | 0 (0.0%) |
| 35 to 64 Years | 0 (0.0%) | 16 (14.5%) |
| 65 to 74 Years | 0 (0.0%) | 0 (0.0%) |
| 75 Years and over | 0 (0.0%) | 9 (100.0%) |
Disability Class: Self-Care Difficulty
| Age Bracket | Male | Female |
| 5 to 17 Years | 0 (0.0%) | 0 (0.0%) |
| 18 to 34 Years | 0 (0.0%) | 0 (0.0%) |
| 35 to 64 Years | 0 (0.0%) | 0 (0.0%) |
| 65 to 74 Years | 0 (0.0%) | 0 (0.0%) |
| 75 Years and over | 0 (0.0%) | 0 (0.0%) |
Technology Access in Brooks
Computing Device Access in Brooks
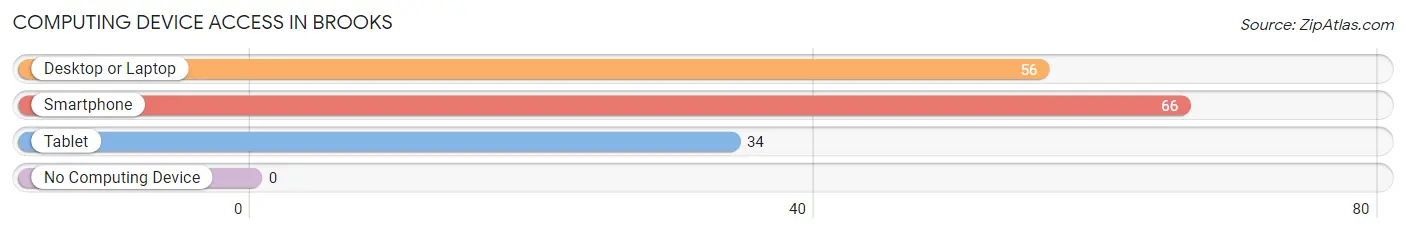
| Device Type | # Households | % Households |
| Desktop or Laptop | 56 | 84.9% |
| Smartphone | 66 | 100.0% |
| Tablet | 34 | 51.5% |
| No Computing Device | 0 | 0.0% |
| Total | 66 | 100.0% |
Internet Access in Brooks
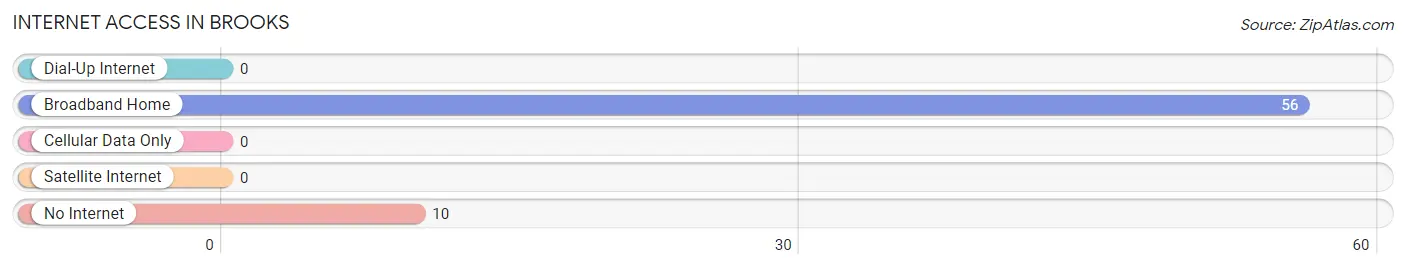
| Internet Type | # Households | % Households |
| Dial-Up Internet | 0 | 0.0% |
| Broadband Home | 56 | 84.9% |
| Cellular Data Only | 0 | 0.0% |
| Satellite Internet | 0 | 0.0% |
| No Internet | 10 | 15.1% |
| Total | 66 | 100.0% |
Brooks Summary
Brooks, Oregon is a small city located in Marion County, Oregon, United States. It is situated on the banks of the Willamette River, approximately 10 miles south of Salem, the state capital. The city was founded in 1876 and incorporated in 1910. As of the 2010 census, the population of Brooks was 1,719.
History
The area that is now Brooks was originally inhabited by the Kalapuya Native American tribe. The first white settlers arrived in the area in the early 1840s. The first post office in the area was established in 1851 and was named Brooks Station. The name was changed to Brooks in 1876.
In 1876, the Oregon and California Railroad was built through the area, connecting it to the rest of the state. This allowed for the development of the city and the growth of the local economy.
In 1910, the city of Brooks was officially incorporated. The city was named after the Brooks family, who were some of the earliest settlers in the area.
Geography
Brooks is located in Marion County, Oregon, approximately 10 miles south of Salem, the state capital. The city is situated on the banks of the Willamette River. The city has a total area of 1.2 square miles, all of which is land.
The climate in Brooks is mild and temperate. Summers are warm and dry, while winters are cool and wet. The average annual temperature is around 50 degrees Fahrenheit.
Economy
The economy of Brooks is largely based on agriculture. The city is home to several farms and ranches, which produce a variety of crops and livestock. The city is also home to several small businesses, including restaurants, retail stores, and service providers.
The city is also home to several manufacturing companies, including a paper mill and a wood products plant. The city is also home to a number of technology companies, including a software development firm and a data center.
Demographics
As of the 2010 census, the population of Brooks was 1,719. The racial makeup of the city was 87.3% White, 0.7% African American, 0.7% Native American, 0.7% Asian, 0.2% Pacific Islander, 8.2% from other races, and 2.1% from two or more races. Hispanic or Latino of any race were 11.2% of the population.
The median income for a household in the city was $41,250, and the median income for a family was $50,000. The per capita income for the city was $20,845. About 11.2% of families and 14.2% of the population were below the poverty line, including 18.2% of those under age 18 and 8.2% of those age 65 or over.
Conclusion
Brooks, Oregon is a small city located in Marion County, Oregon, United States. It is situated on the banks of the Willamette River, approximately 10 miles south of Salem, the state capital. The city was founded in 1876 and incorporated in 1910. As of the 2010 census, the population of Brooks was 1,719. The economy of Brooks is largely based on agriculture, with several farms and ranches in the area. The city is also home to several small businesses, manufacturing companies, and technology companies. The racial makeup of the city was 87.3% White, 0.7% African American, 0.7% Native American, 0.7% Asian, 0.2% Pacific Islander, 8.2% from other races, and 2.1% from two or more races. The median income for a household in the city was $41,250, and the median income for a family was $50,000.
Common Questions
What is Per Capita Income in Brooks?
Per Capita income in Brooks is $25,844.
What is the Median Family Income in Brooks?
Median Family Income in Brooks is $86,042.
What is the Median Household income in Brooks?
Median Household Income in Brooks is $86,667.
What is Inequality or Gini Index in Brooks?
Inequality or Gini Index in Brooks is 0.21.
What is the Total Population of Brooks?
Total Population of Brooks is 311.
What is the Total Male Population of Brooks?
Total Male Population of Brooks is 175.
What is the Total Female Population of Brooks?
Total Female Population of Brooks is 136.
What is the Ratio of Males per 100 Females in Brooks?
There are 128.68 Males per 100 Females in Brooks.
What is the Ratio of Females per 100 Males in Brooks?
There are 77.71 Females per 100 Males in Brooks.
What is the Median Population Age in Brooks?
Median Population Age in Brooks is 45.4 Years.
What is the Average Family Size in Brooks
Average Family Size in Brooks is 6.0 People.
What is the Average Household Size in Brooks
Average Household Size in Brooks is 4.4 People.
How Large is the Labor Force in Brooks?
There are 184 People in the Labor Forcein in Brooks.
What is the Percentage of People in the Labor Force in Brooks?
80.0% of People are in the Labor Force in Brooks.